Lenovo ThinkPad P52s (i7-8650U, Quadro P500, 4K) Laptop Review
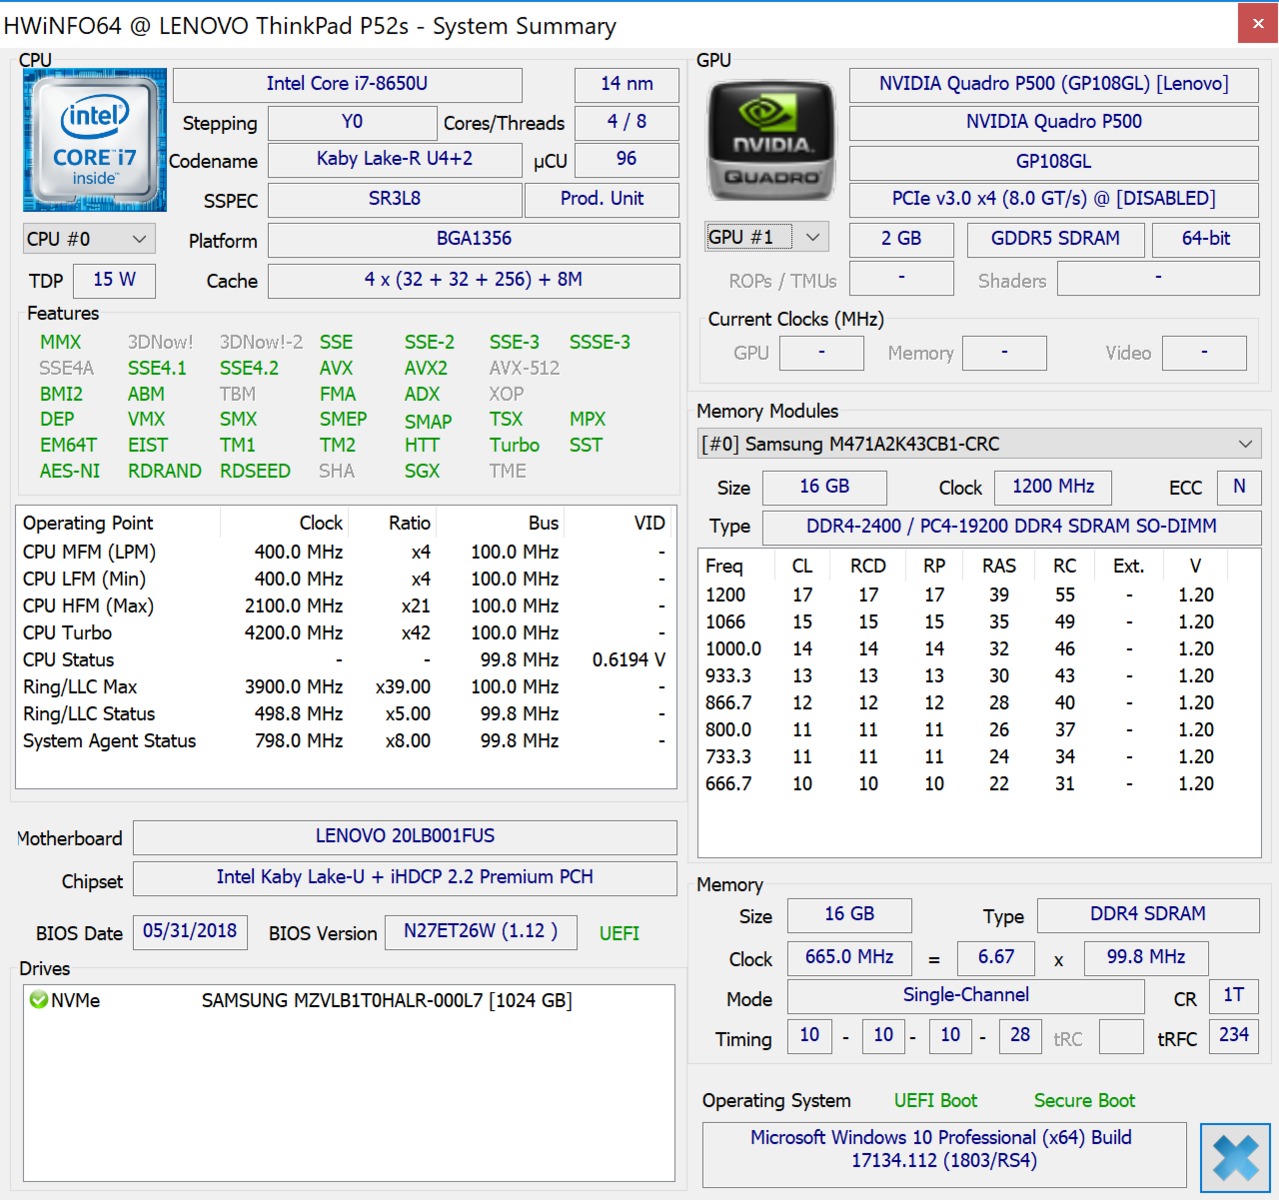
Our recent review of Lenovo's P52s left us a bit disappointed, primarily with the weak Nvidia Quadro P500. The device is back under our scope today, this time with a better CPU (Intel Core i7-8650U) and a 4K screen. In addition to these changes, our review device today doubles the RAM to 16 GB and quadruples the storage via a 1 TB Samsung PM970 NVMe SSD. All of these options raise the price from USD $1375 to $2125 (via Lenovo's U.S. site). On paper, these specs look to be a substantive improvement over our prior review. We will see what how the improved internals impact overall performance.
The P52s sits in a niche category of "ultrabook workstations." Typically, machines designed for engineering and CAD work use powerful mobile CPUs (TDP typically 45 W or higher) and GPUs which are housed in thicker cases for better airflow and expandability. Due to its unique design, the choice of competition is rather thin. Lenovo's own ThinkPad T580 and P51s are perhaps the closest alternatives. HP's ZBook 15u G5 is another machine to be considered, as are Dell's Precision 5520 and Precision 3520. MSI's WS63VR is also an option.
As this review covers an updated version of the P52s, we will skip analysis of the external features (e.g., case, keyboard, weight) and will instead focus on actual software performance. For more information, please refer to our first review of the Lenovo P52s and the ThinkPad T580, as these machines use the same case as our review device today. Let's dive in.
| SD Card Reader | |
| average JPG Copy Test (av. of 3 runs) | |
| Dell Precision 3520 (Toshiba Exceria Pro SDXC 64 GB UHS-II) | |
| Dell Precision 5520 UHD (Toshiba Exceria Pro SDXC 64 GB UHS-II) | |
| MSI WS63VR 7RL-023US | |
| Average of class Workstation (49.6 - 681, n=14, last 2 years) | |
| Lenovo ThinkPad P52S-20LB001FUS (Toshiba Exceria Pro SDXC 64 GB UHS-II) | |
| Lenovo ThinkPad P51s 20HB000SGE (Toshiba Exceria Pro SDXC 64 GB UHS-II) | |
| maximum AS SSD Seq Read Test (1GB) | |
| Dell Precision 5520 UHD (Toshiba Exceria Pro SDXC 64 GB UHS-II) | |
| Average of class Workstation (87.6 - 1455, n=14, last 2 years) | |
| MSI WS63VR 7RL-023US | |
| Dell Precision 3520 (Toshiba Exceria Pro SDXC 64 GB UHS-II) | |
| Lenovo ThinkPad P51s 20HB000SGE (Toshiba Exceria Pro SDXC 64 GB UHS-II) | |
| Lenovo ThinkPad P52S-20LB001FUS (Toshiba Exceria Pro SDXC 64 GB UHS-II) | |
Communication
A quick note on the wireless solution for our particular device: while receive speeds are good, transmit speeds are inconsistent. After an initial strong showing, speeds rapidly drop down to about 150 MBit/s. This issue could affect only this specific device, but it is something consumers should be aware of.
Display
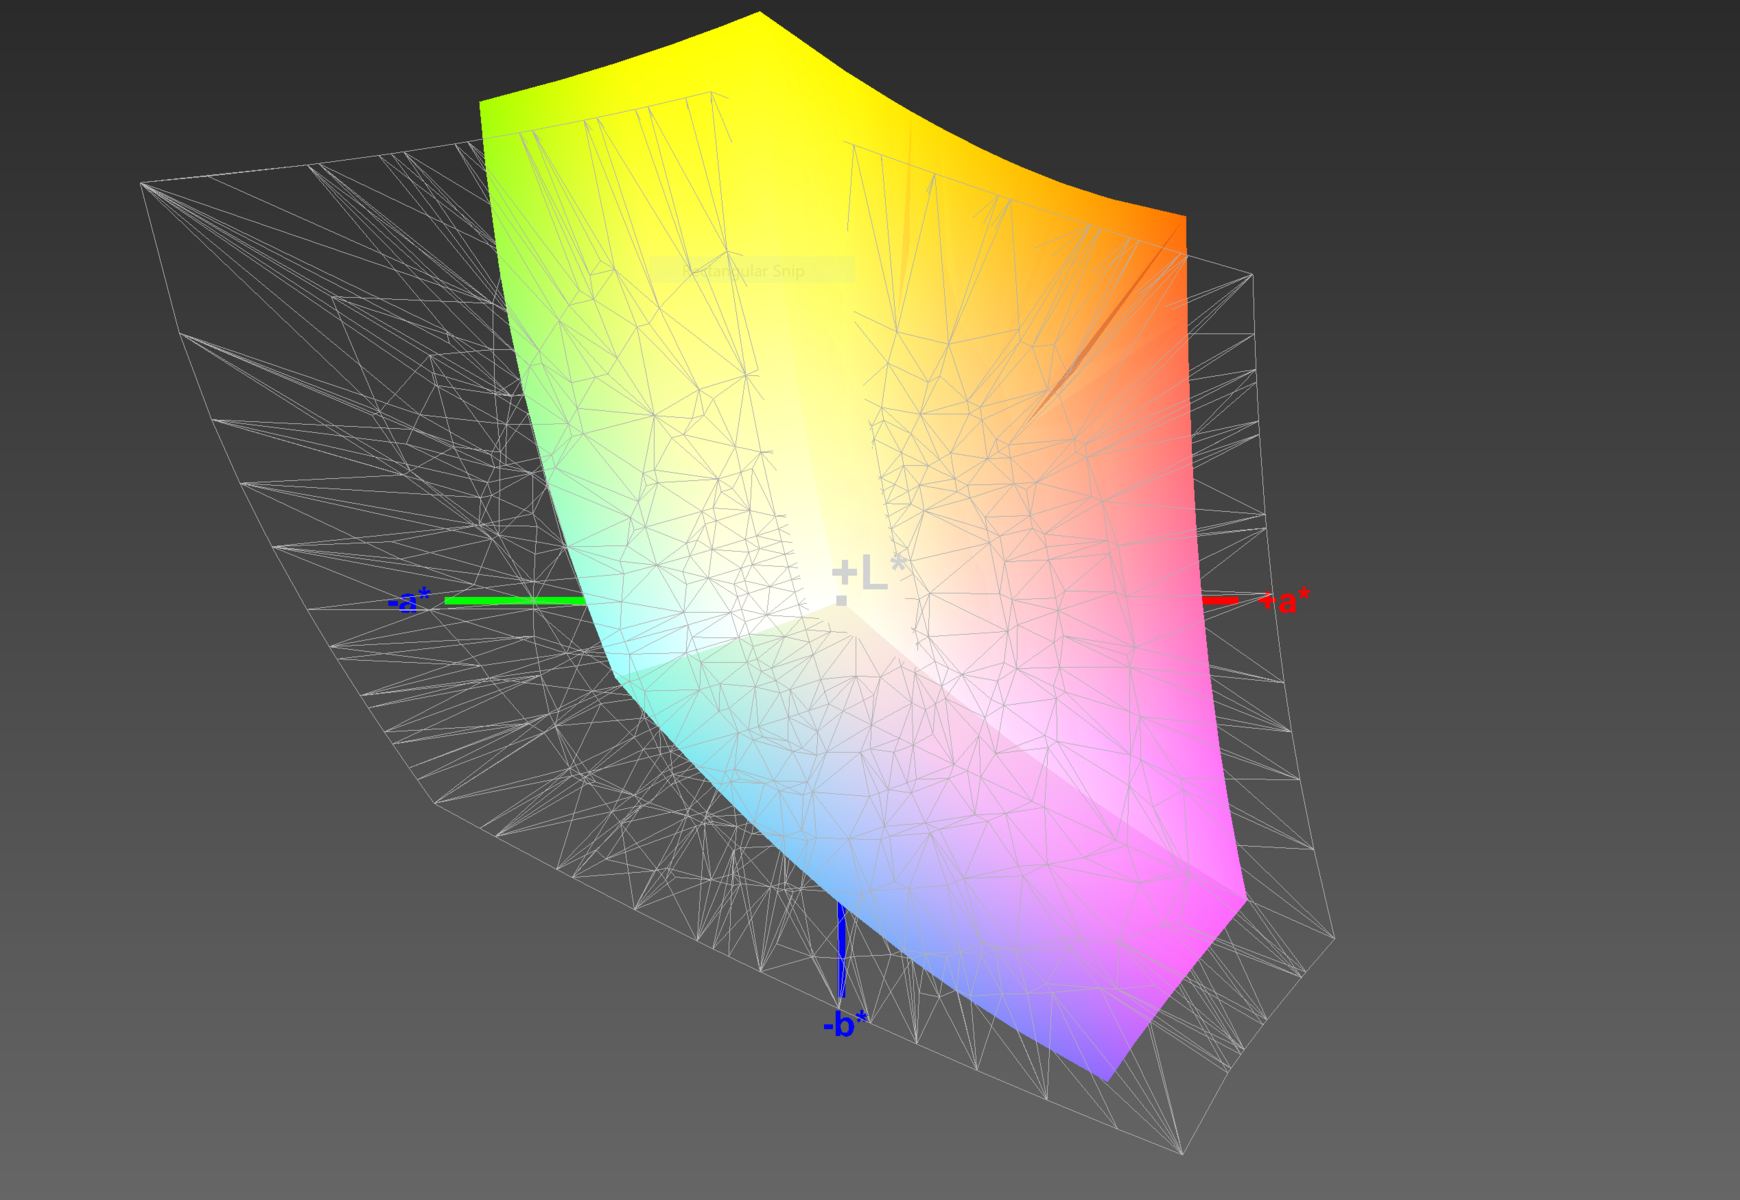
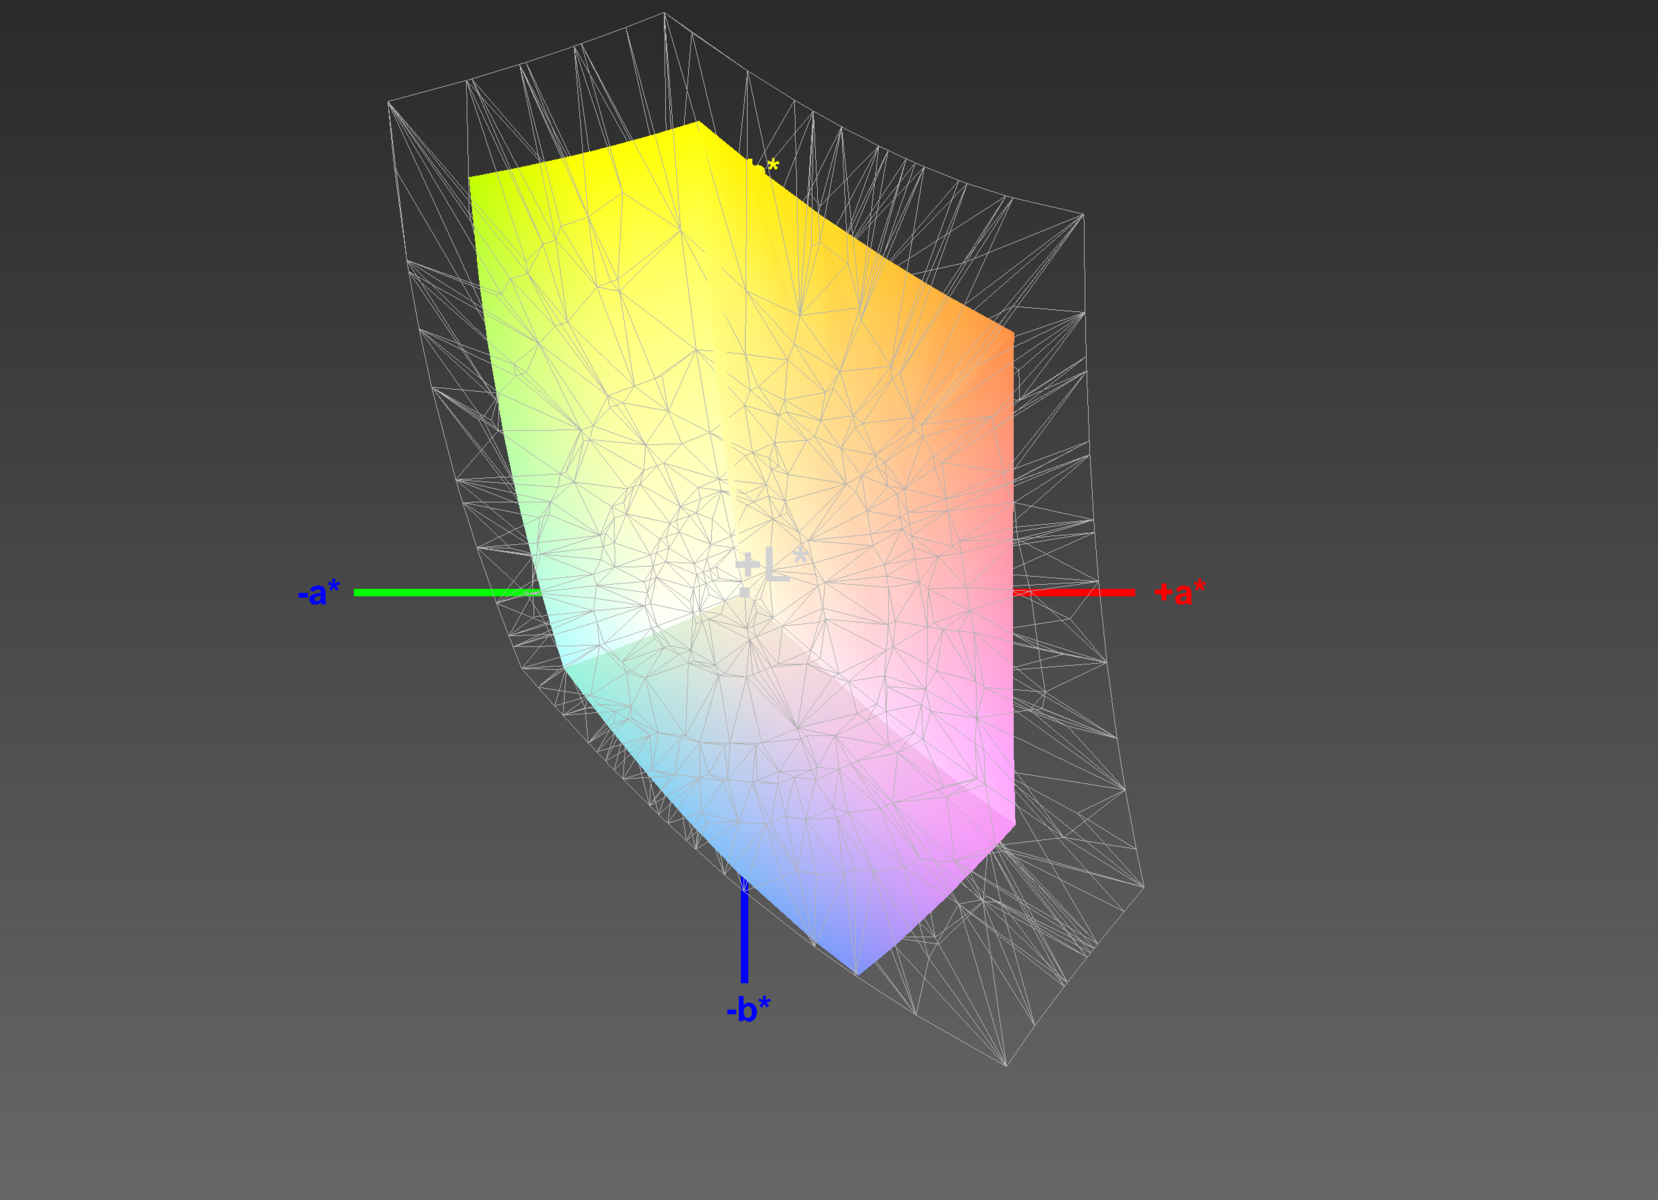
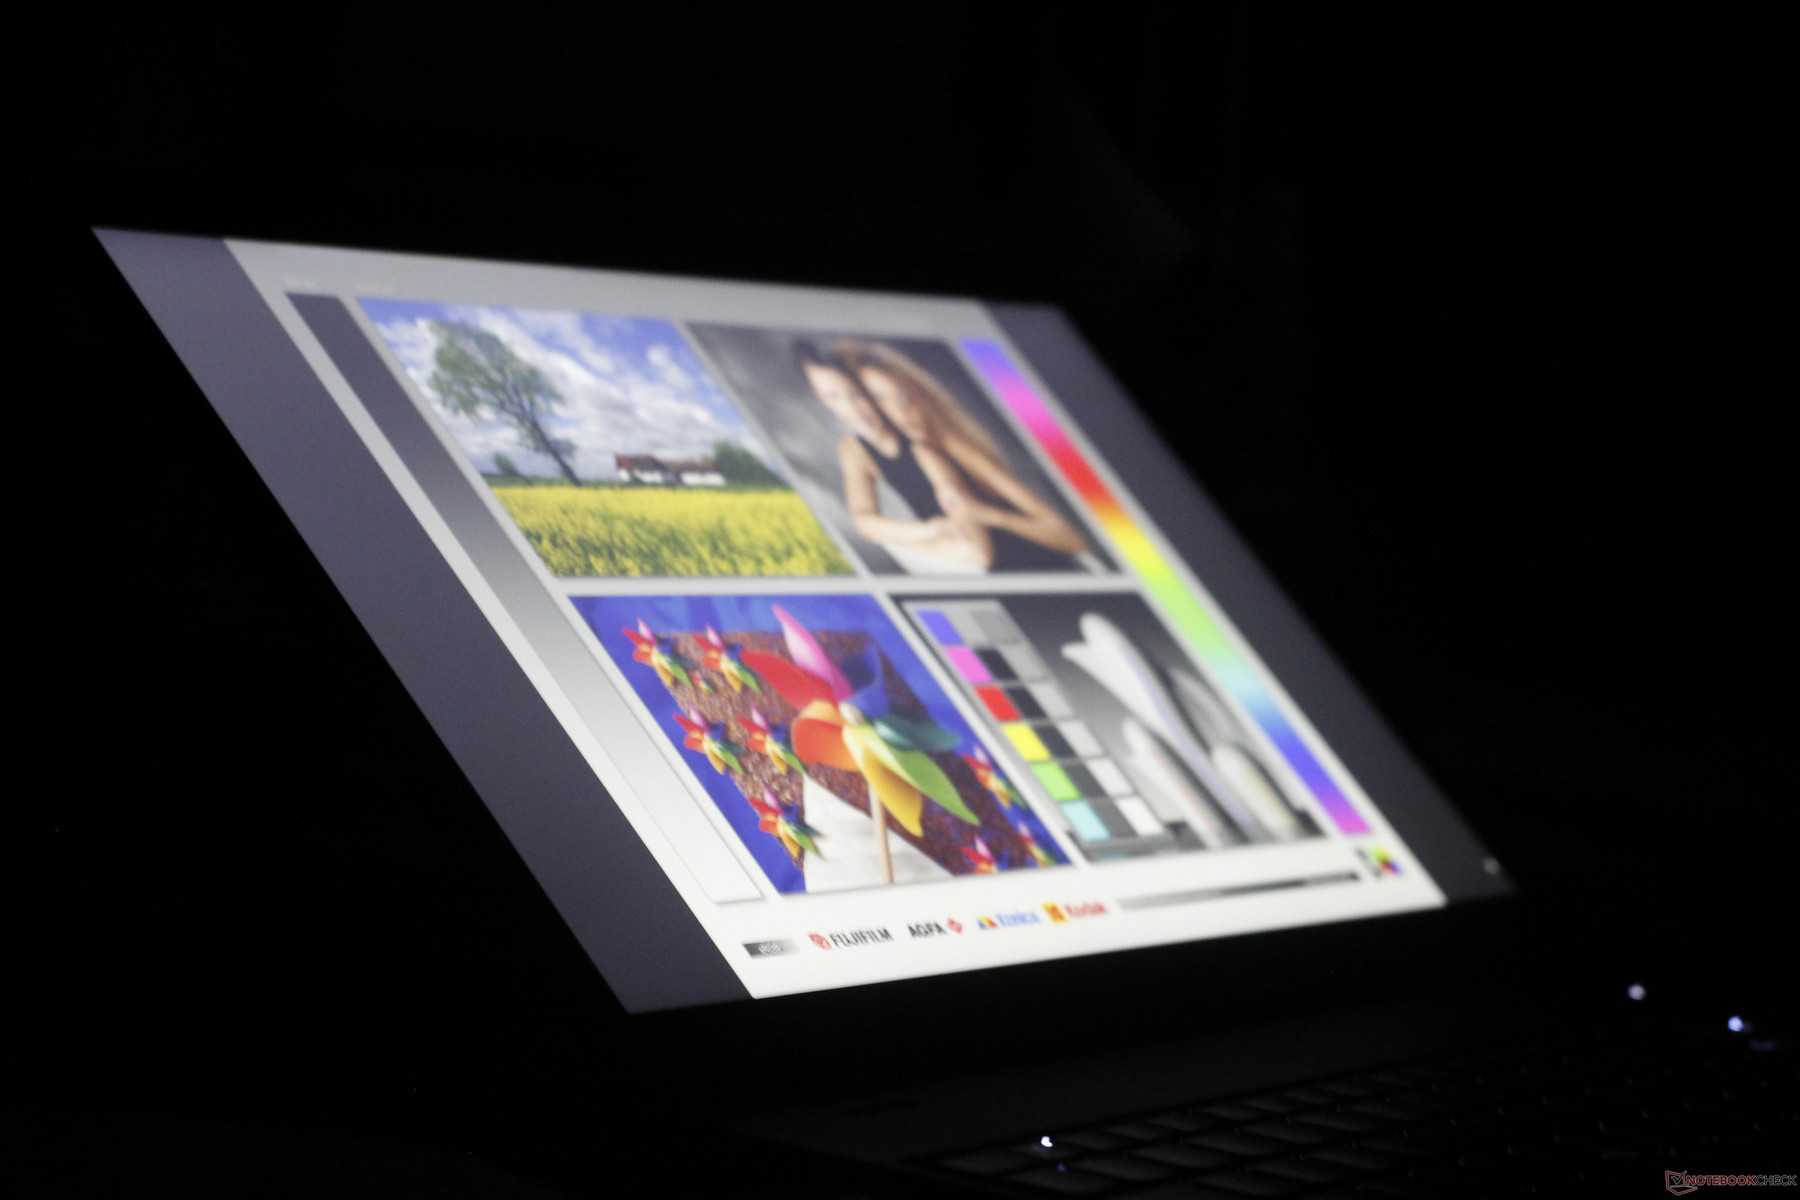
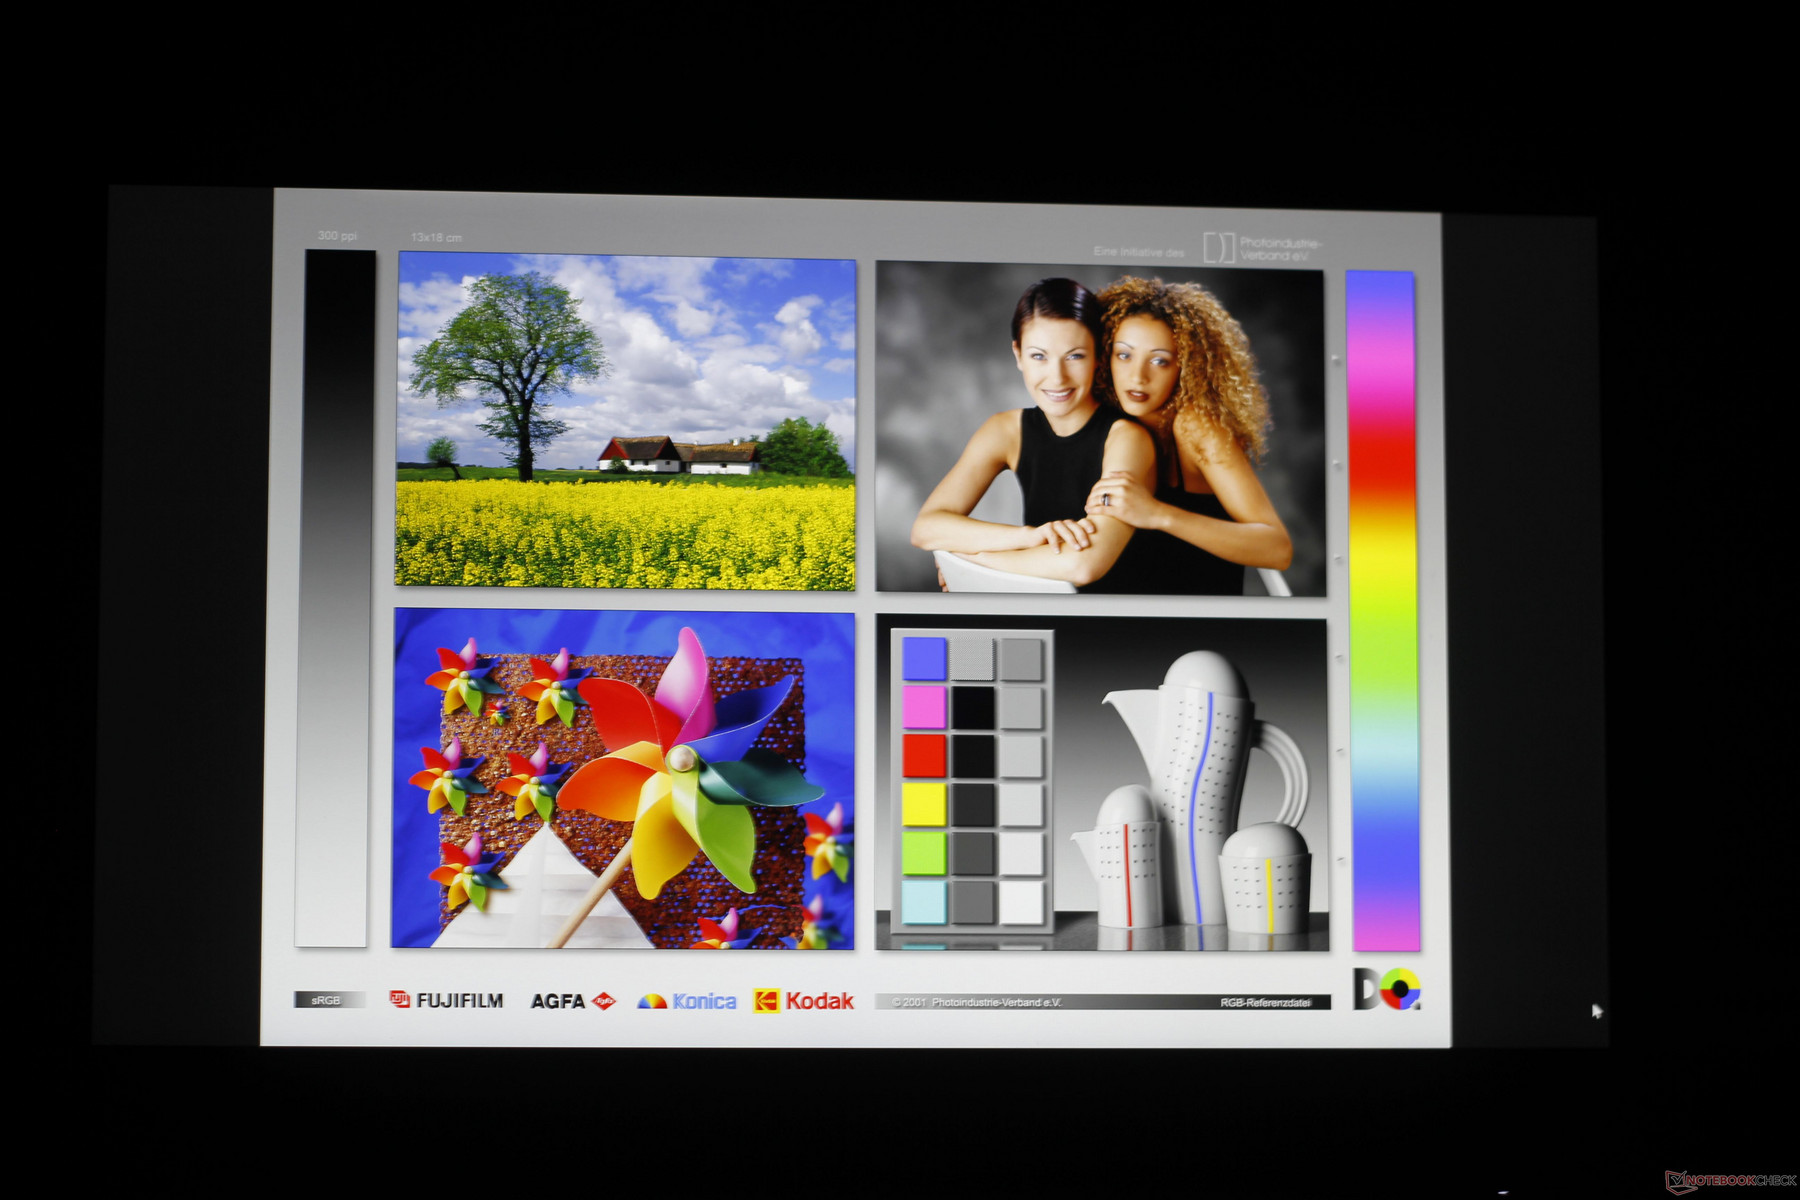
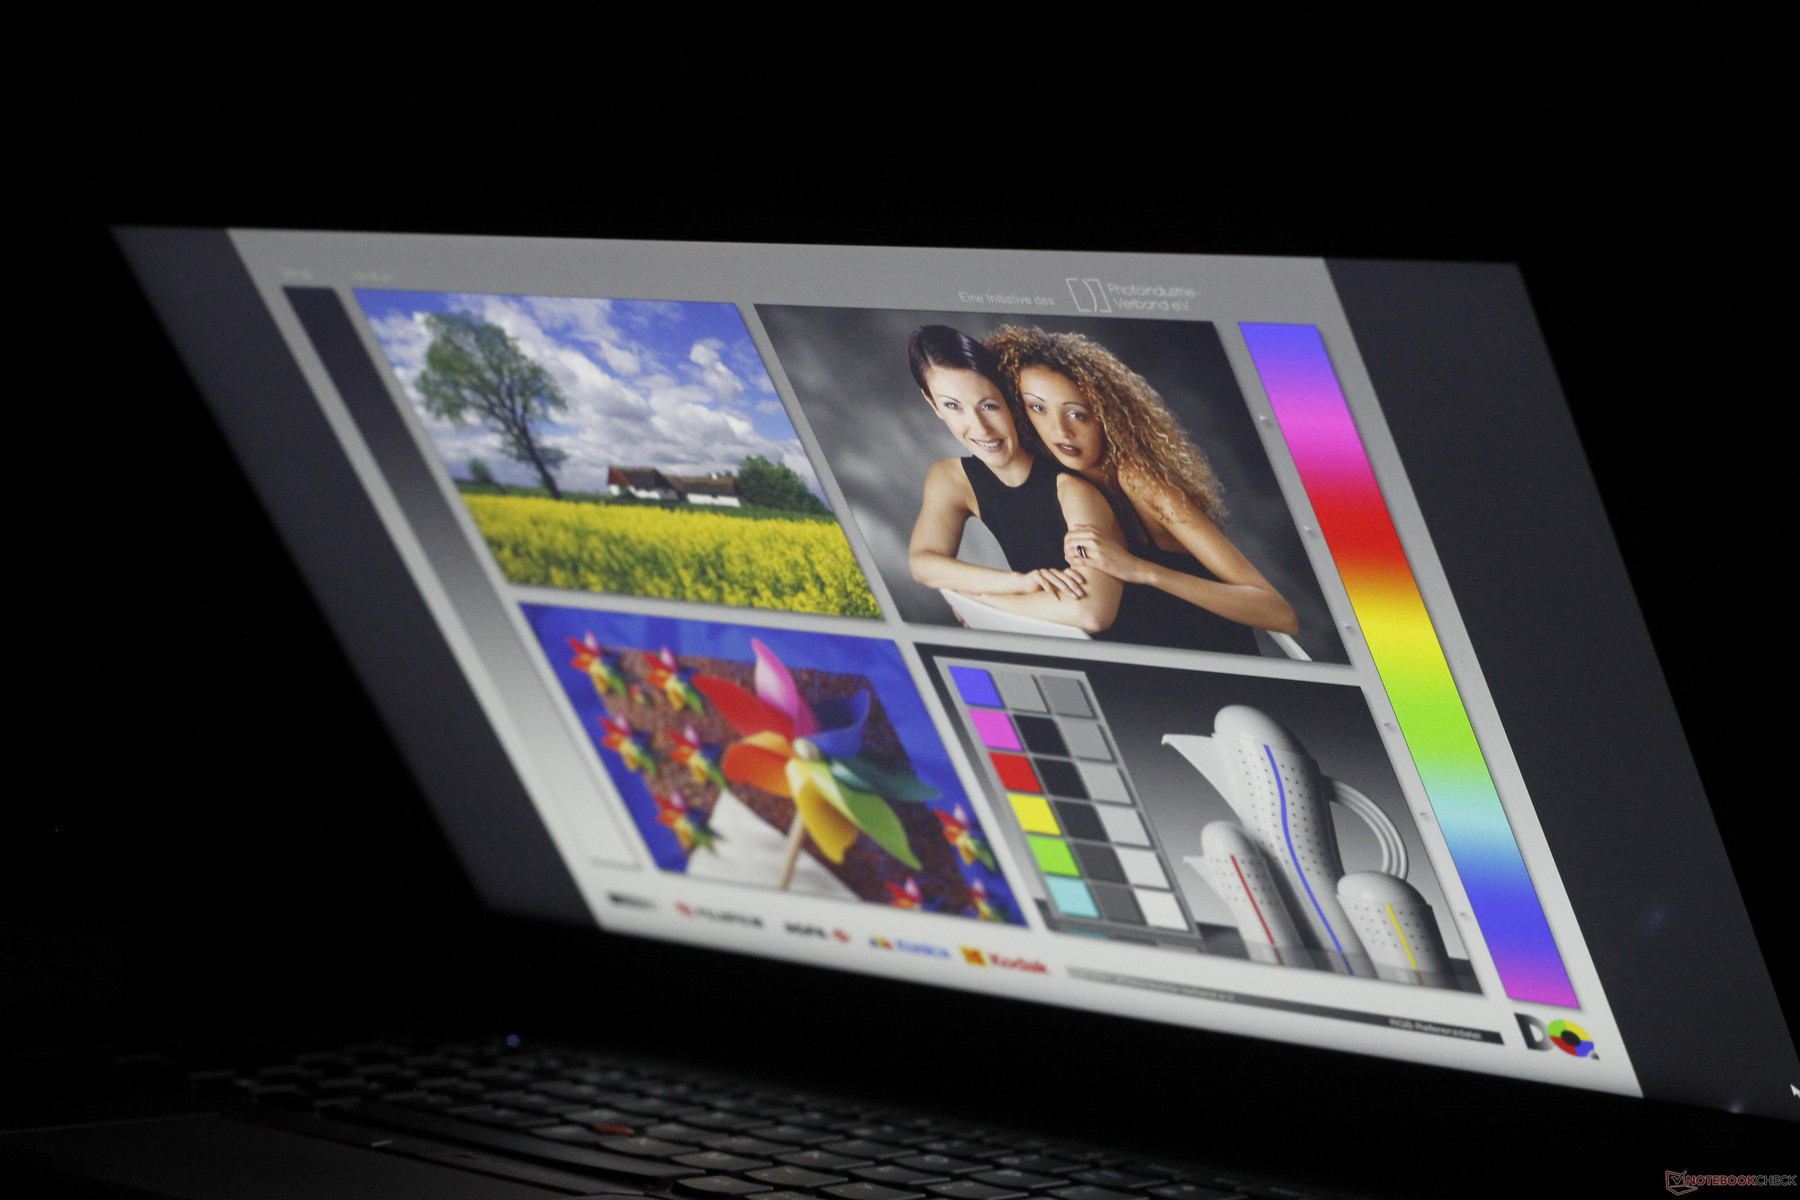
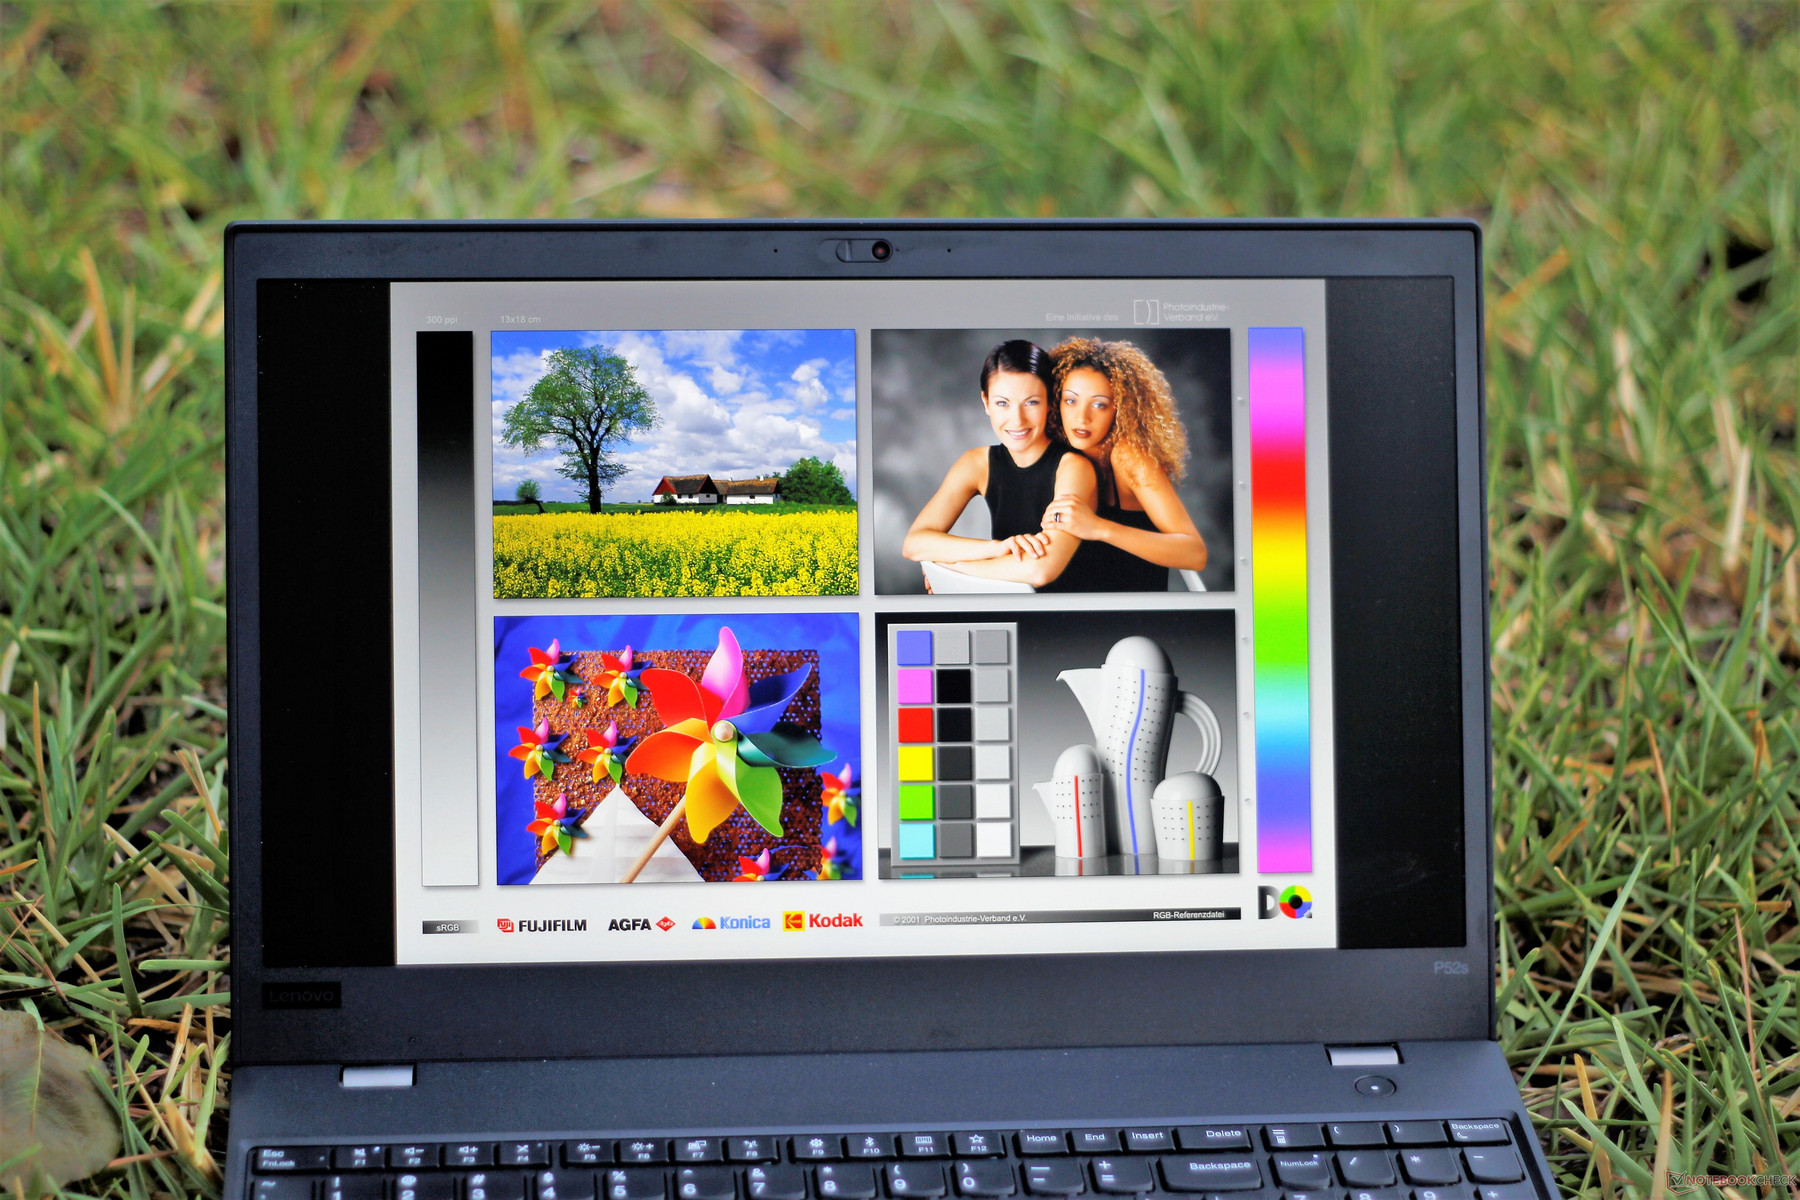
Perhaps the biggest change in our upgraded unit is the optional 4K screen. The most obvious plus is the doubled pixel density. It should be noted that the panel used has an RGB matrix instead of a cheaper RGBW array. The benefit is a crisper picture overall.
Aside from razor-sharp images and text, the IPS panel is unremarkable. Brightness distribution leaves room for improvement at 78%. In practice, the differences in brightness aren't distracting. Contrast is good, but not as good as that of the Full HD P52s. Response times are adequate. PWM is much lower than the FHD P52s and may affect sensitive users. Overall, the 4K panel looks sharp but has some flaws. Unless you absolutely need the increased resolution, the upgrade likely isn't worth it. It should be noted that if the resolution is dropped (i.e., set to 1920x1080 in Windows' display settings), the resulting image looks blurry and smeared.
| |||||||||||||||||||||||||
Brightness Distribution: 78 %
Center on Battery: 305.5 cd/m²
Contrast: 1273:1 (Black: 0.24 cd/m²)
ΔE ColorChecker Calman: 3.51 | ∀{0.5-29.43 Ø4.71}
calibrated: 3.15
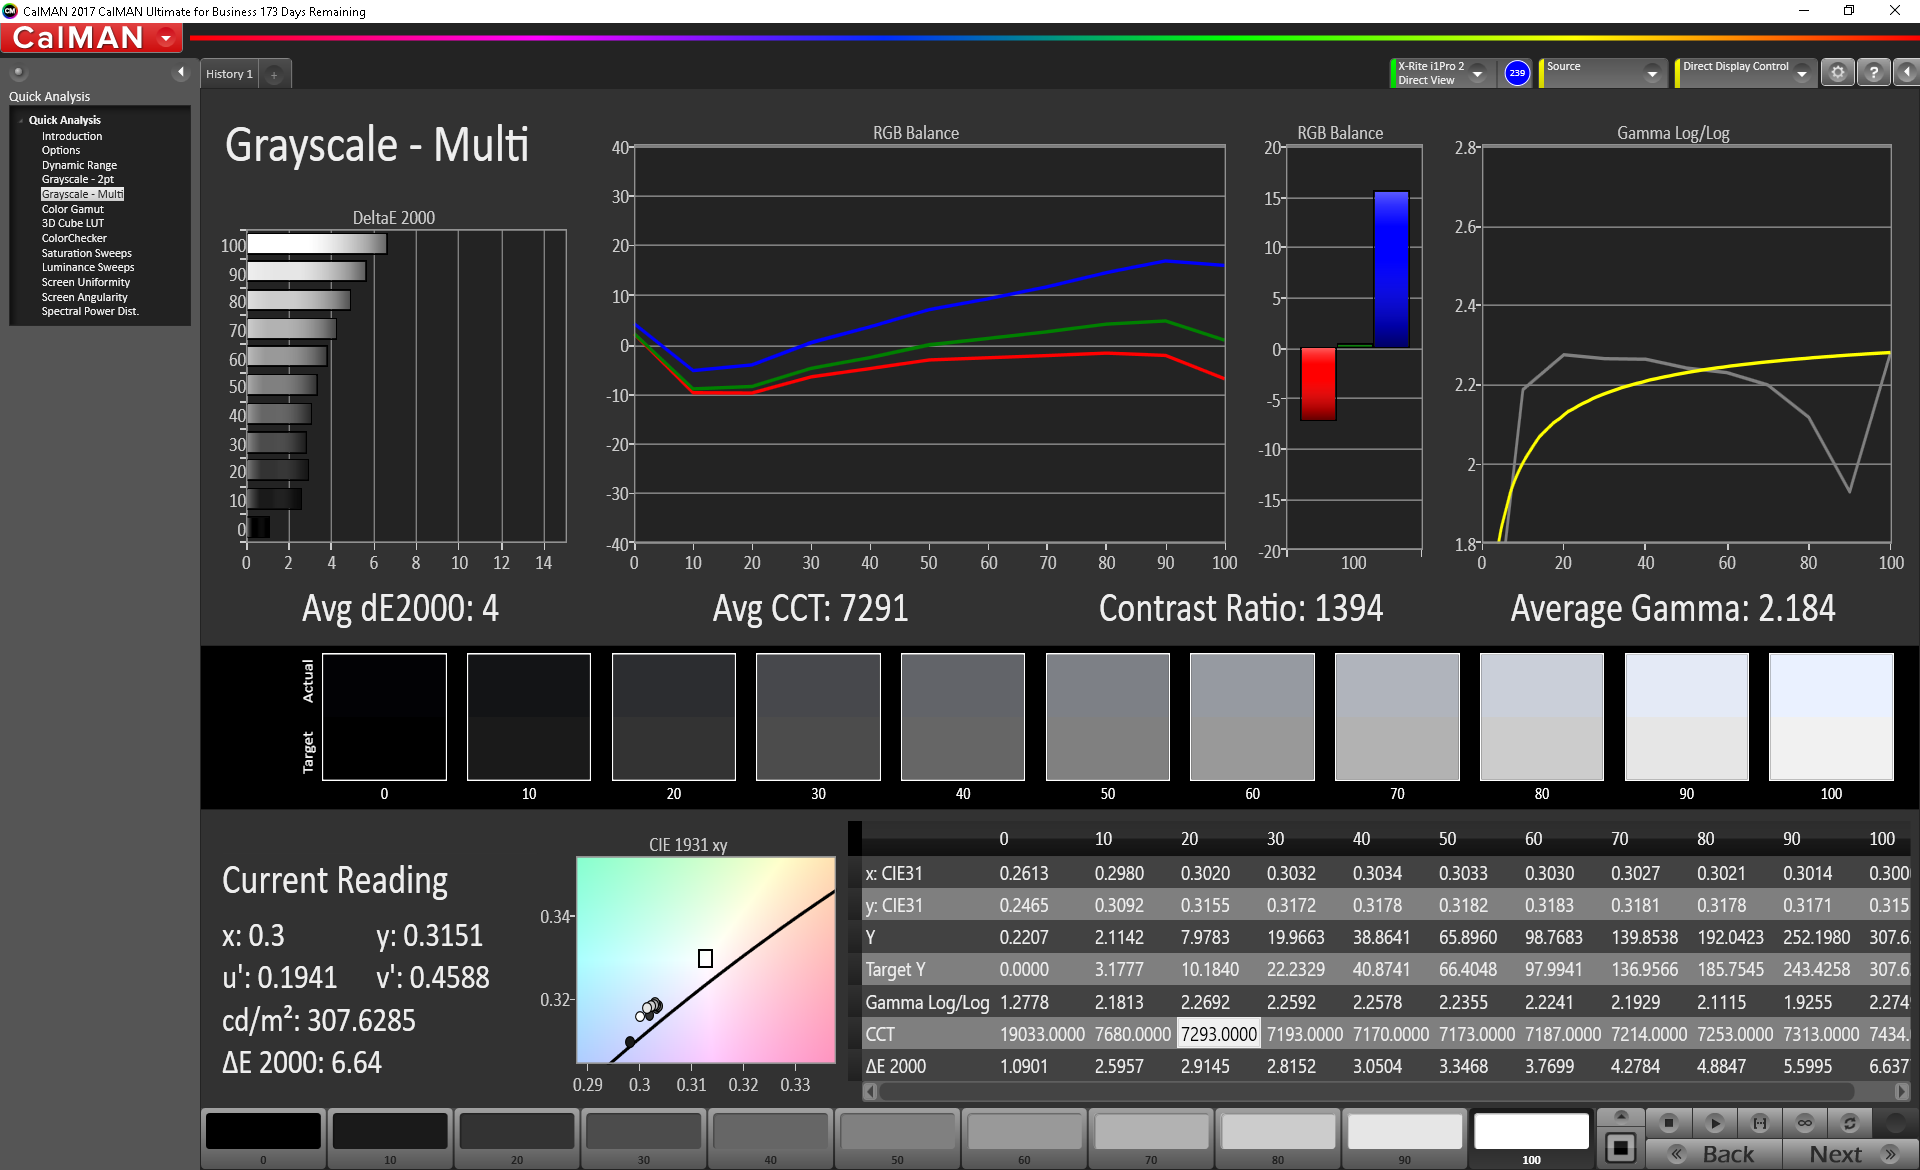
ΔE Greyscale Calman: 4 | ∀{0.09-98 Ø4.96}
89% sRGB (Argyll 1.6.3 3D)
58% AdobeRGB 1998 (Argyll 1.6.3 3D)
65.4% AdobeRGB 1998 (Argyll 3D)
89.4% sRGB (Argyll 3D)
67.3% Display P3 (Argyll 3D)
Gamma: 2.18
CCT: 7291 K
| Lenovo ThinkPad P52S-20LB001FUS Lenovo LEN40BD, IPS, 15.6", 3840x2160 | HP ZBook 15u G5 2ZC05EA CMN15E7, IPS LED, 15.6", 1920x1080 | Lenovo ThinkPad P51s 20HB000SGE BOE NV156QUM-N44, IPS, 15.6", 3840x2160 | Lenovo ThinkPad P52s-20LB000HGE NV156FHM-N47, IPS LED, 15.6", 1920x1080 | Dell Precision 3520 IPS LED, 15.6", 1920x1080 | Dell Precision 5520 UHD SHP1476, IPS, 15.6", 3840x2160 | MSI WS63VR 7RL-023US SAMSUNG LƒFL156FL02-101 , IPS, 15.6", 3840x2160 | |
|---|---|---|---|---|---|---|---|
| Display | -32% | 3% | -34% | 7% | 5% | -25% | |
| Display P3 Coverage (%) | 67.3 | 43.05 -36% | 69.7 4% | 41.83 -38% | 72.7 8% | 67.4 0% | 47.43 -30% |
| sRGB Coverage (%) | 89.4 | 64.7 -28% | 91.2 2% | 62.1 -31% | 94.8 6% | 98.5 10% | 71.4 -20% |
| AdobeRGB 1998 Coverage (%) | 65.4 | 44.5 -32% | 66.8 2% | 43.22 -34% | 69.3 6% | 68.9 5% | 49 -25% |
| Response Times | -28% | -14% | -61% | -51% | -84% | -22% | |
| Response Time Grey 50% / Grey 80% * (ms) | 43.2 ? | 41.6 ? 4% | 38.4 ? 11% | 47.2 ? -9% | 48 ? -11% | 59.2 ? -37% | 36.8 ? 15% |
| Response Time Black / White * (ms) | 18 ? | 28.8 ? -60% | 24.8 ? -38% | 38.4 ? -113% | 34.4 ? -91% | 41.6 ? -131% | 28.4 ? -58% |
| PWM Frequency (Hz) | 980 | 25770 ? | 980 ? | 21550 ? | 1064 ? | 1351 ? | |
| Screen | -24% | -3% | -19% | -13% | 0% | -31% | |
| Brightness middle (cd/m²) | 305.5 | 229 -25% | 317 4% | 291 -5% | 345 13% | 372.4 22% | 259.4 -15% |
| Brightness (cd/m²) | 282 | 212 -25% | 290 3% | 284 1% | 329 17% | 368 30% | 247 -12% |
| Brightness Distribution (%) | 78 | 88 13% | 85 9% | 91 17% | 88 13% | 90 15% | 85 9% |
| Black Level * (cd/m²) | 0.24 | 0.23 4% | 0.32 -33% | 0.11 54% | 0.37 -54% | 0.48 -100% | 0.43 -79% |
| Contrast (:1) | 1273 | 996 -22% | 991 -22% | 2645 108% | 932 -27% | 776 -39% | 603 -53% |
| Colorchecker dE 2000 * | 3.51 | 4.2 -20% | 3.6 -3% | 6.7 -91% | 5 -42% | 2.6 26% | 5.5 -57% |
| Colorchecker dE 2000 max. * | 7.28 | 18 -147% | 6.6 9% | 20.2 -177% | 8 -10% | 5.6 23% | 12.7 -74% |
| Colorchecker dE 2000 calibrated * | 3.15 | 4.2 -33% | 4.5 -43% | ||||
| Greyscale dE 2000 * | 4 | 2 50% | 4.2 -5% | 4.5 -13% | 6.2 -55% | 3.7 7% | 3.6 10% |
| Gamma | 2.18 101% | 2.23 99% | 2.24 98% | 2.28 96% | 2.35 94% | 2.14 103% | 2.24 98% |
| CCT | 7291 89% | 6292 103% | 6740 96% | 7503 87% | 6702 97% | 7096 92% | 7163 91% |
| Color Space (Percent of AdobeRGB 1998) (%) | 58 | 41 -29% | 59.5 3% | 39.6 -32% | 61.8 7% | 63 9% | 45 -22% |
| Color Space (Percent of sRGB) (%) | 89 | 64.5 -28% | 91.1 2% | 61.7 -31% | 94.7 6% | 99 11% | 71 -20% |
| Total Average (Program / Settings) | -28% /
-26% | -5% /
-3% | -38% /
-27% | -19% /
-14% | -26% /
-10% | -26% /
-29% |
* ... smaller is better
Color accuracy is good. The DeltaE 2000 scores for colors and gray sit at 3.5 and 4, respectively, which are fairly respectable measurements. In general, a DeltaE 2000 of 3 or less is considered acceptable for professional color work, and the 4K panel comes close to this threshold. The tight variance in color accuracy (maximum DeltaE 2000 of 7.28) is also praiseworthy. Color temperature is a bit off-center at 7291 (6500 is ideal) when uncalibrated. White backgrounds are cooler and have a subtle blue shift to them, but this isn't distracting in everyday use. All said, colors look vibrant on the 4K screen, but there are better options (like Dell's Precision 5520) for professionals on the hunt for a color accurate screen.
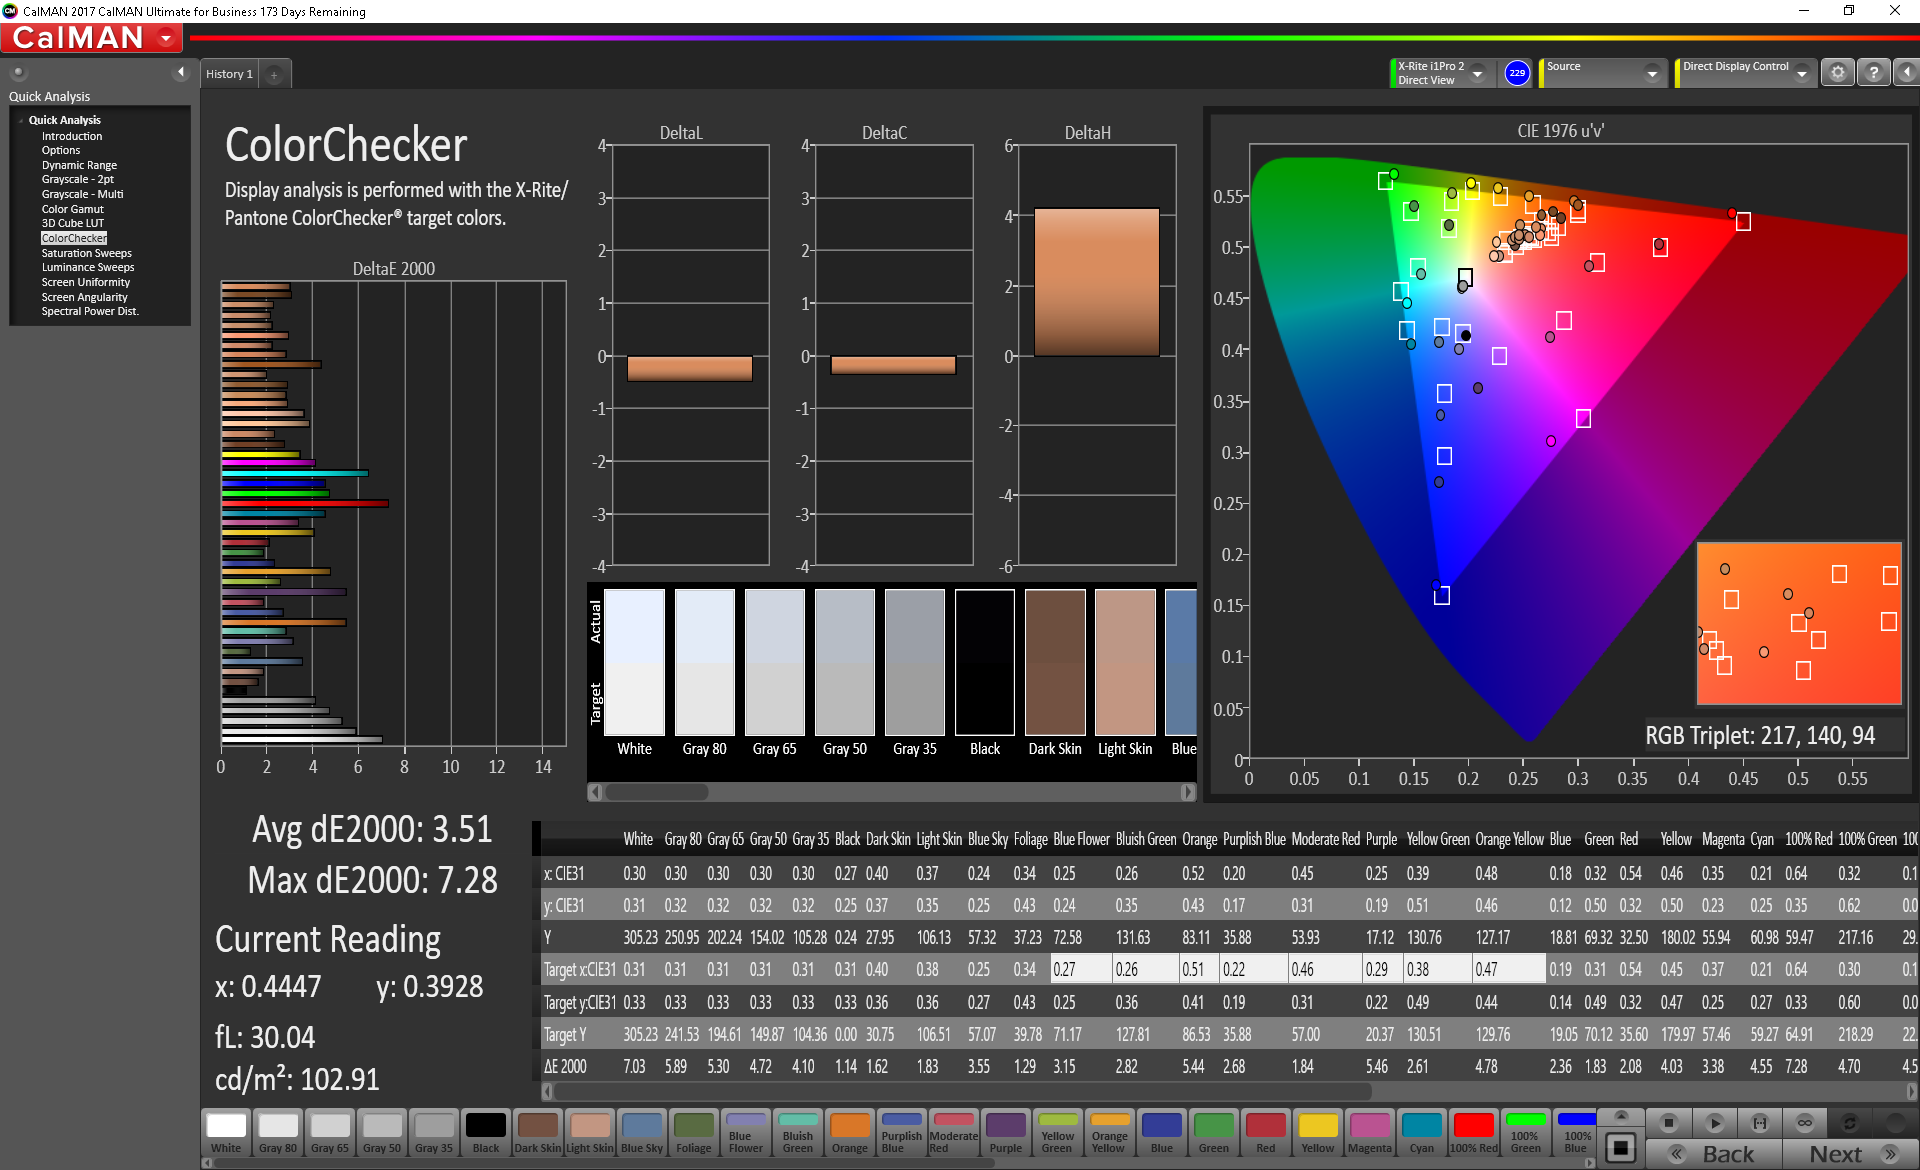
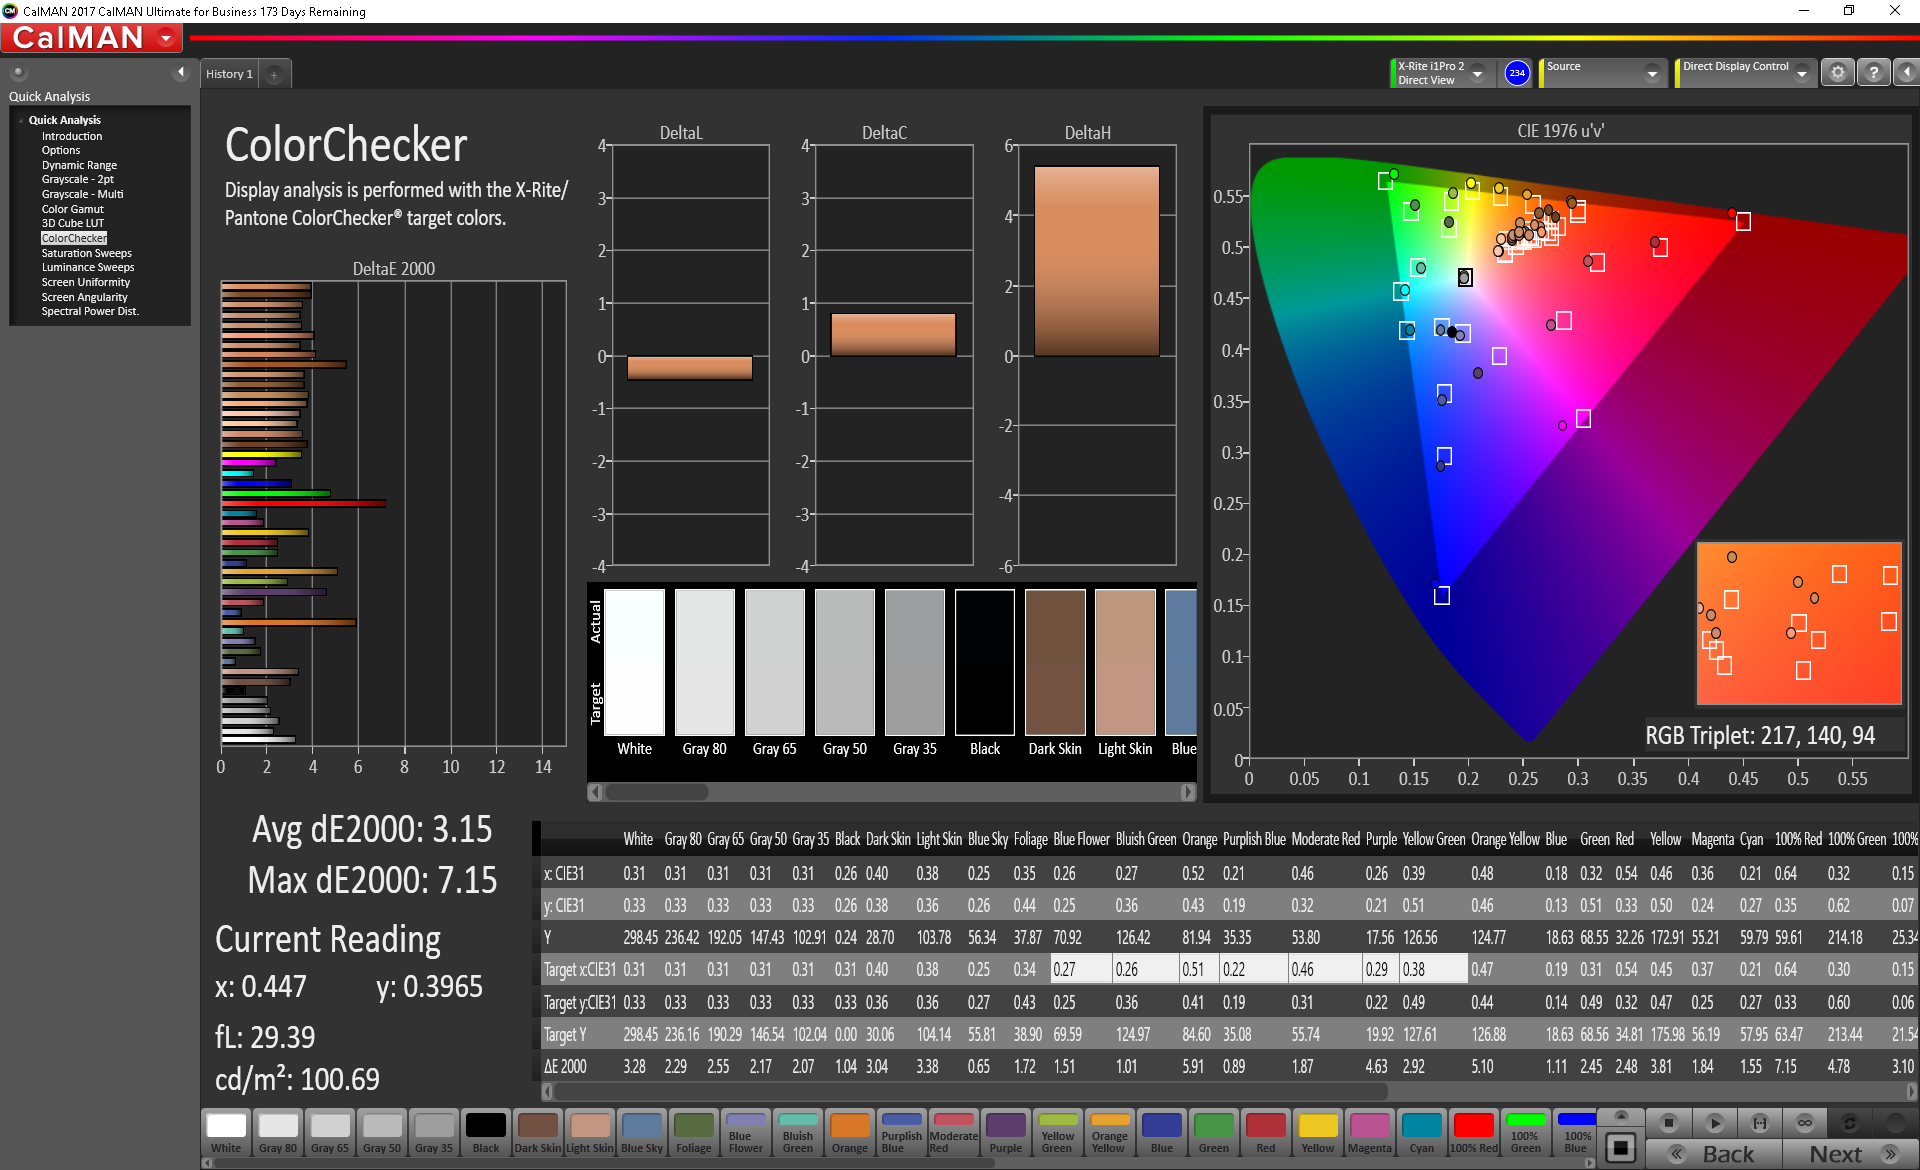
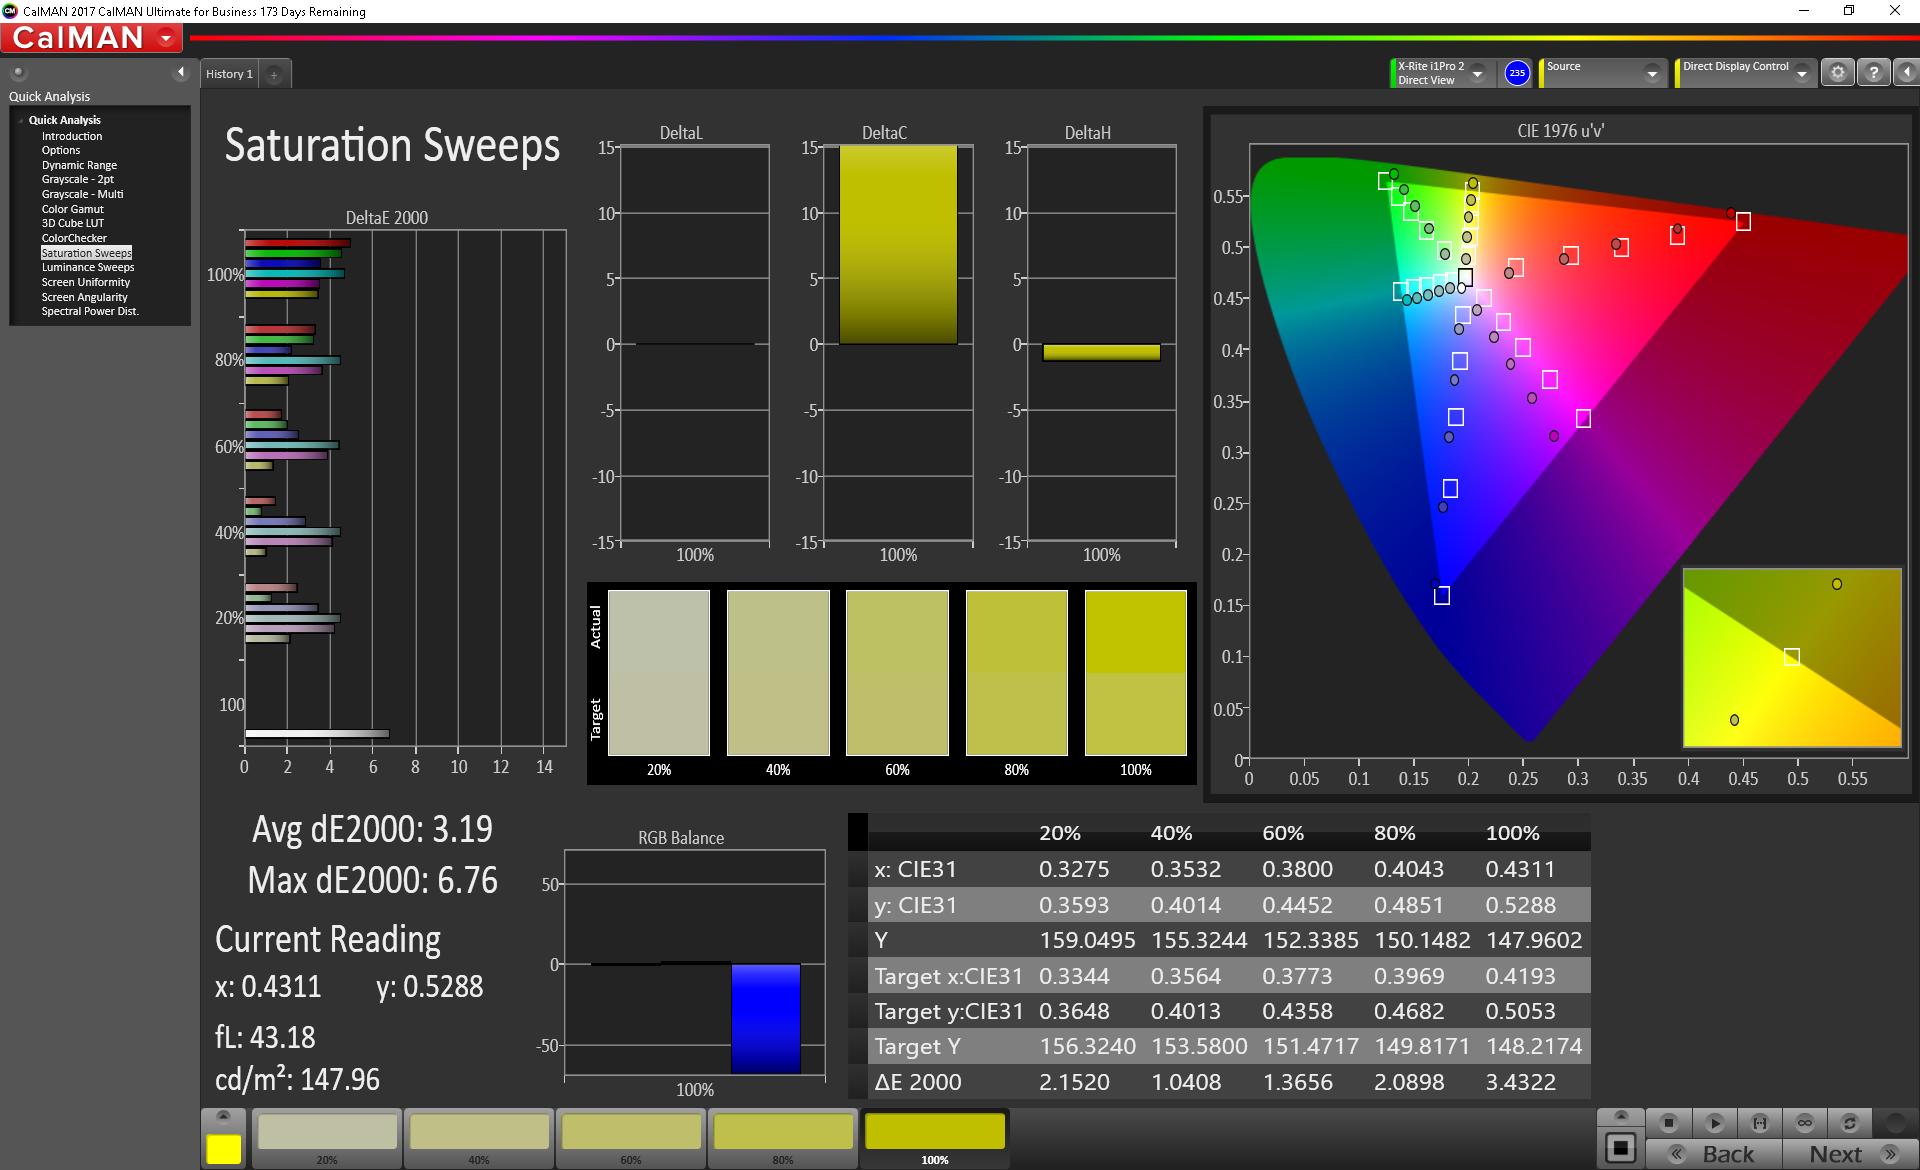

Color space coverage is also good but falls short of excellence. The P52s's 4K display covers 89% of the sRGB gamut and 58% of the AdobeRGB color space. Again, these are good, but there are better displays out there. Once again, Dell's options prove to be a bit better in this regard. Still, the P52s should offer enough colors for most users (save professional color workers).
Display Response Times
| ↔ Response Time Black to White | ||
|---|---|---|
| 18 ms ... rise ↗ and fall ↘ combined | ↗ 13.2 ms rise | 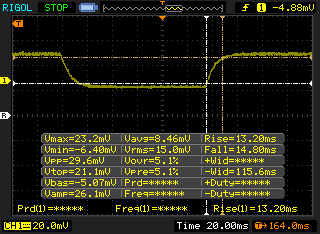 |
| ↘ 14.8 ms fall | ||
| The screen shows good response rates in our tests, but may be too slow for competitive gamers. In comparison, all tested devices range from 0.1 (minimum) to 240 (maximum) ms. » 40 % of all devices are better. This means that the measured response time is similar to the average of all tested devices (19.8 ms). | ||
| ↔ Response Time 50% Grey to 80% Grey | ||
| 43.2 ms ... rise ↗ and fall ↘ combined | ↗ 24.4 ms rise | 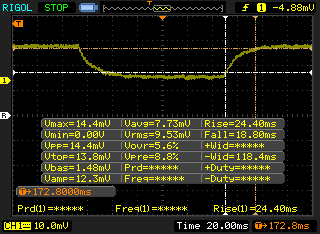 |
| ↘ 18.8 ms fall | ||
| The screen shows slow response rates in our tests and will be unsatisfactory for gamers. In comparison, all tested devices range from 0.165 (minimum) to 636 (maximum) ms. » 72 % of all devices are better. This means that the measured response time is worse than the average of all tested devices (31 ms). | ||
Screen Flickering / PWM (Pulse-Width Modulation)
| Screen flickering / PWM detected | 980 Hz | 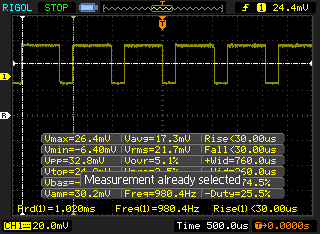 | |
The display backlight flickers at 980 Hz (worst case, e.g., utilizing PWM) . The frequency of 980 Hz is quite high, so most users sensitive to PWM should not notice any flickering. In comparison: 52 % of all tested devices do not use PWM to dim the display. If PWM was detected, an average of 7754 (minimum: 5 - maximum: 343500) Hz was measured. | |||
Owing to its IPS panel, viewing angles are excellent. Images remain clear and color accurate when viewed at an angle. There is a bit of wash-out if the screen is viewed from the bottom (see the first picture below). The matte finish across the display helps to cut reflections, and the screen is usable under bright light or outdoors. There is some very slight grain visible on lighter backgrounds, but this can only be seen when viewing the screen closely (6 inches or less). Backlight bleed is minimal, present only along the bottom edge and barely noticeable to the unaided eye.

Performance
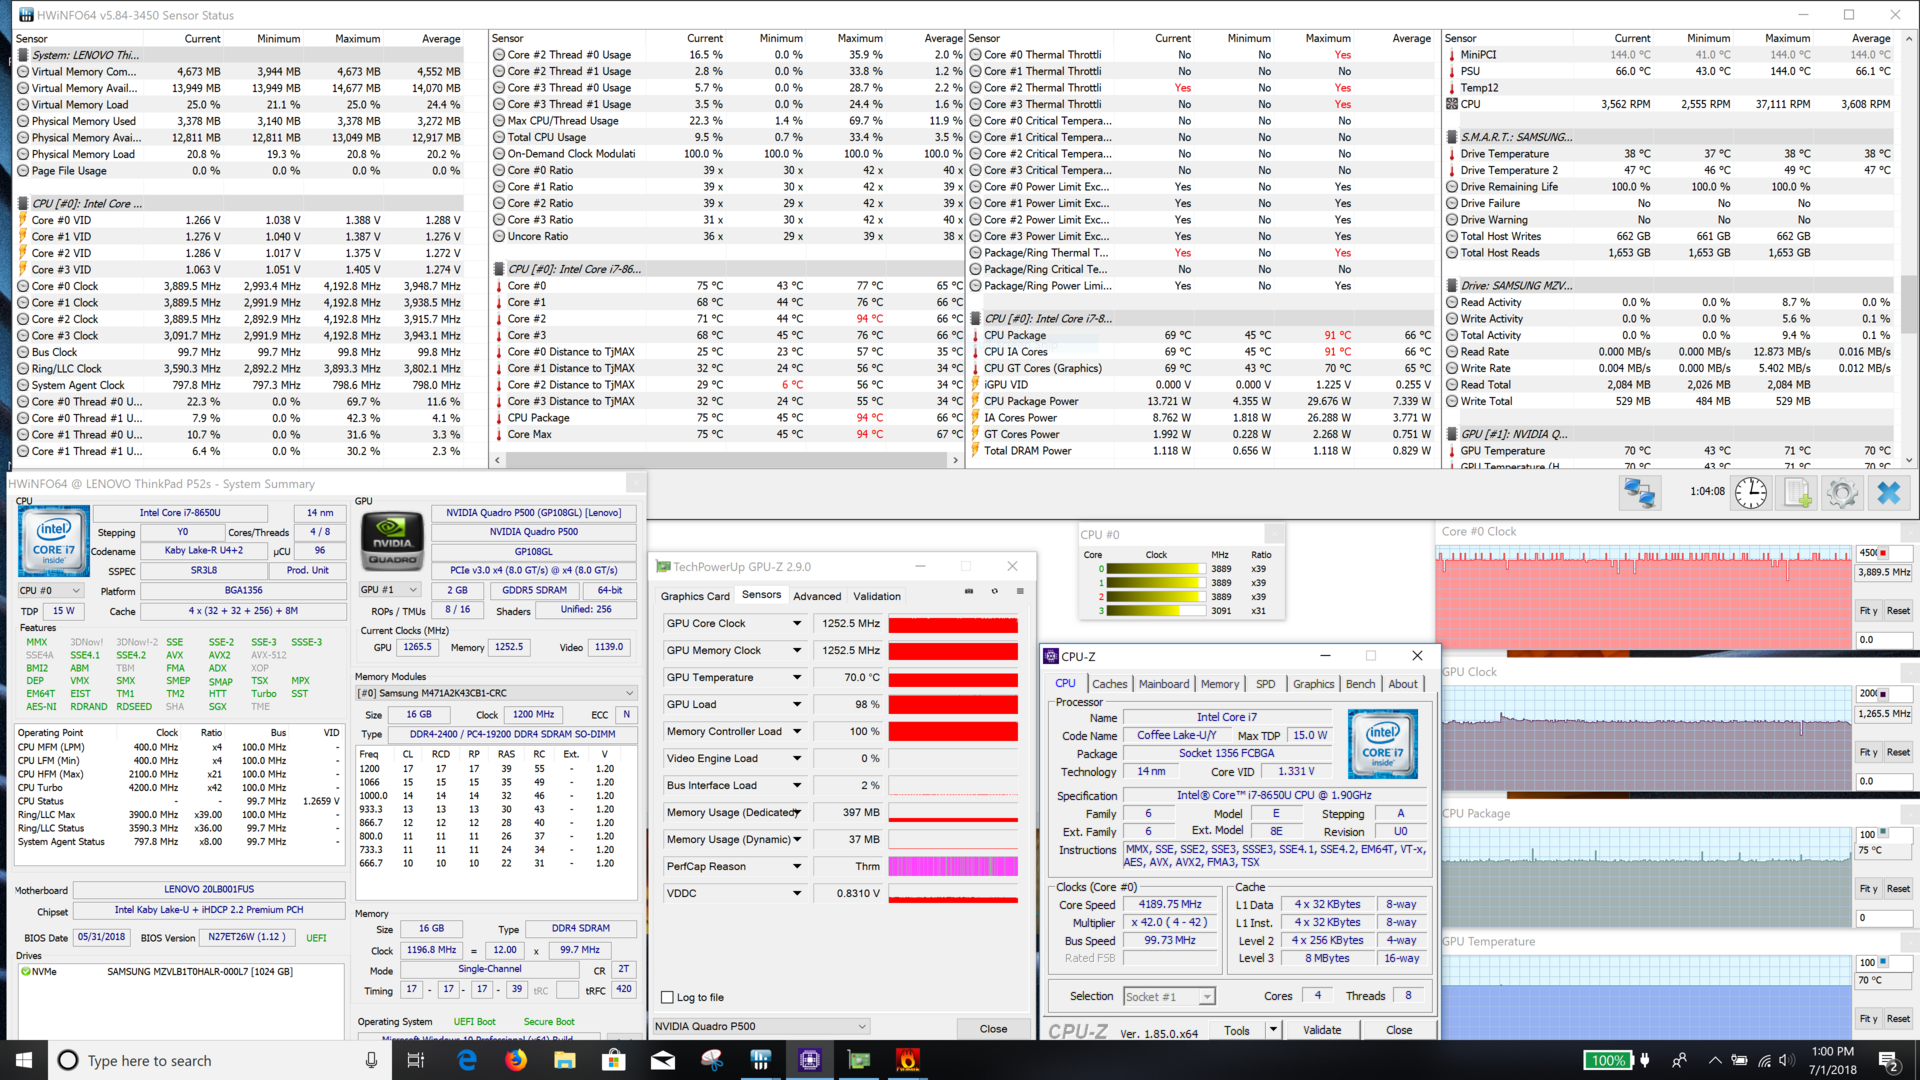
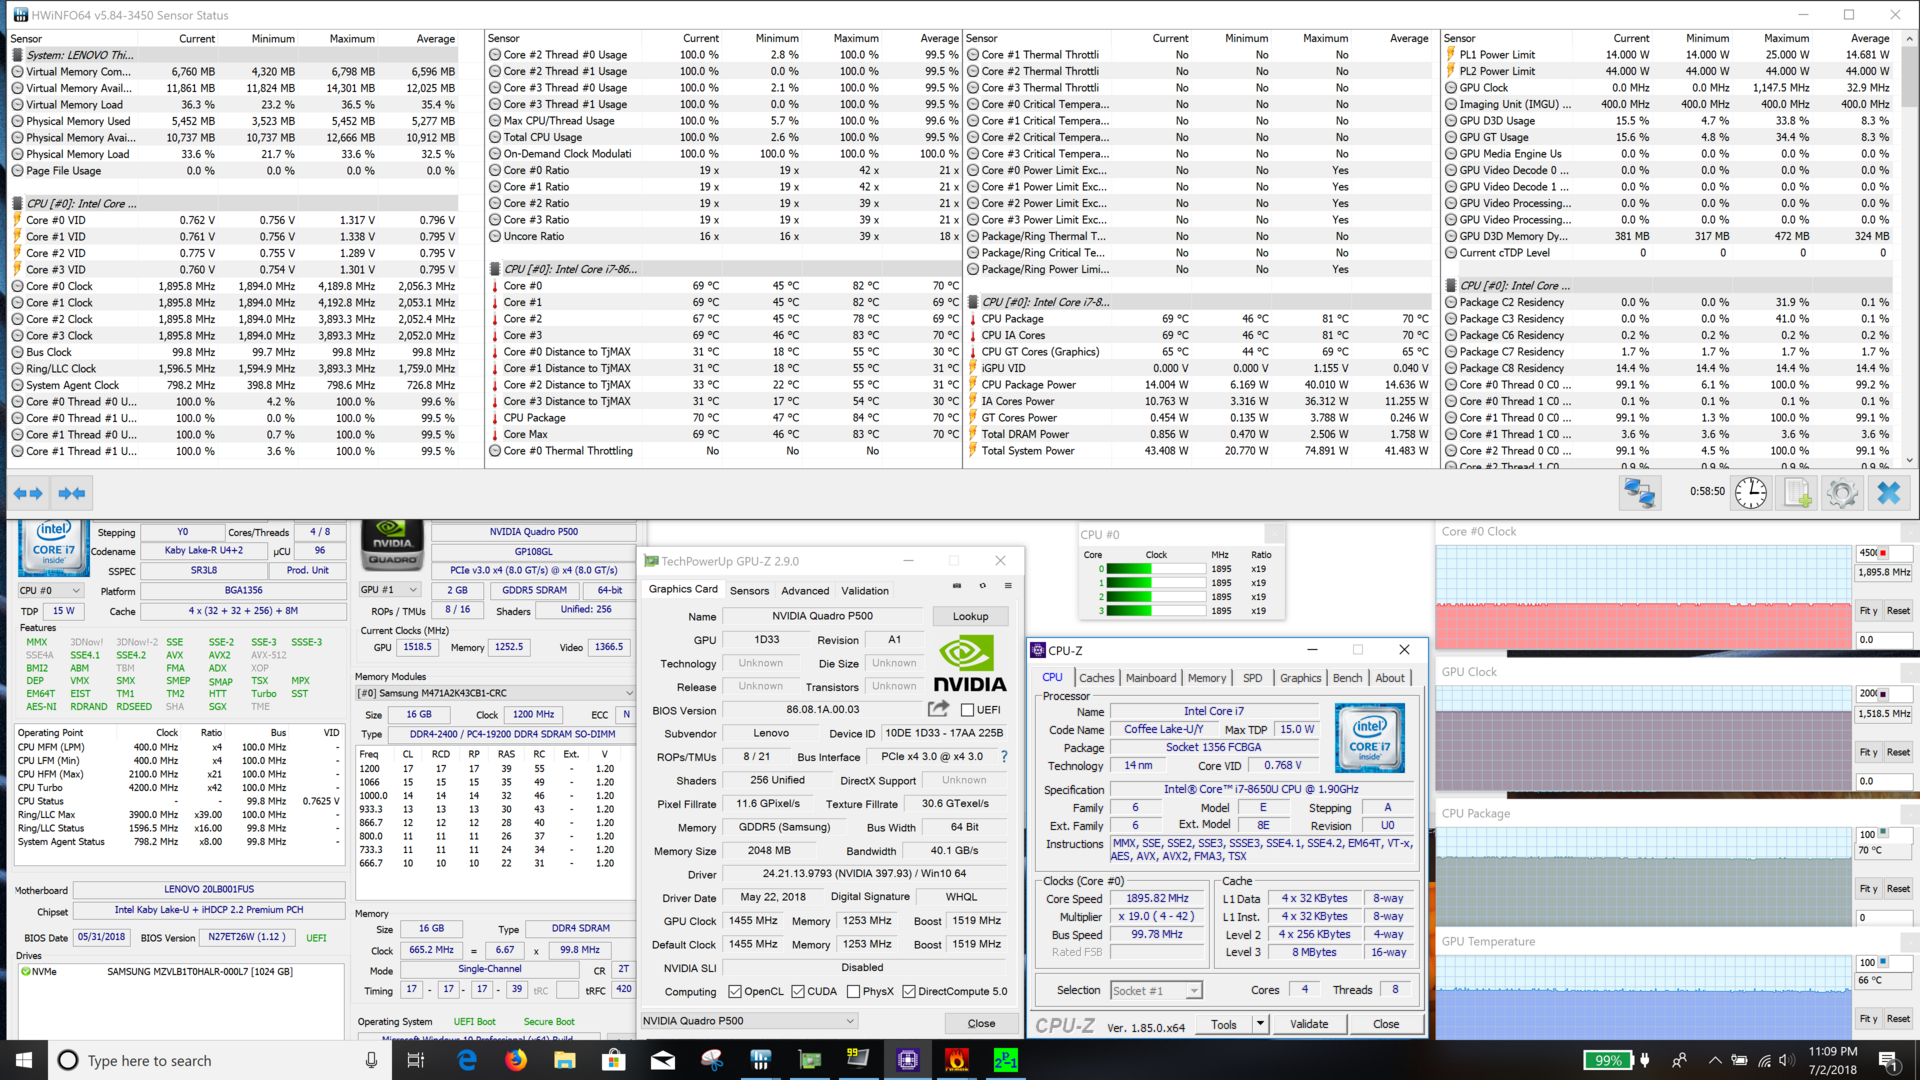
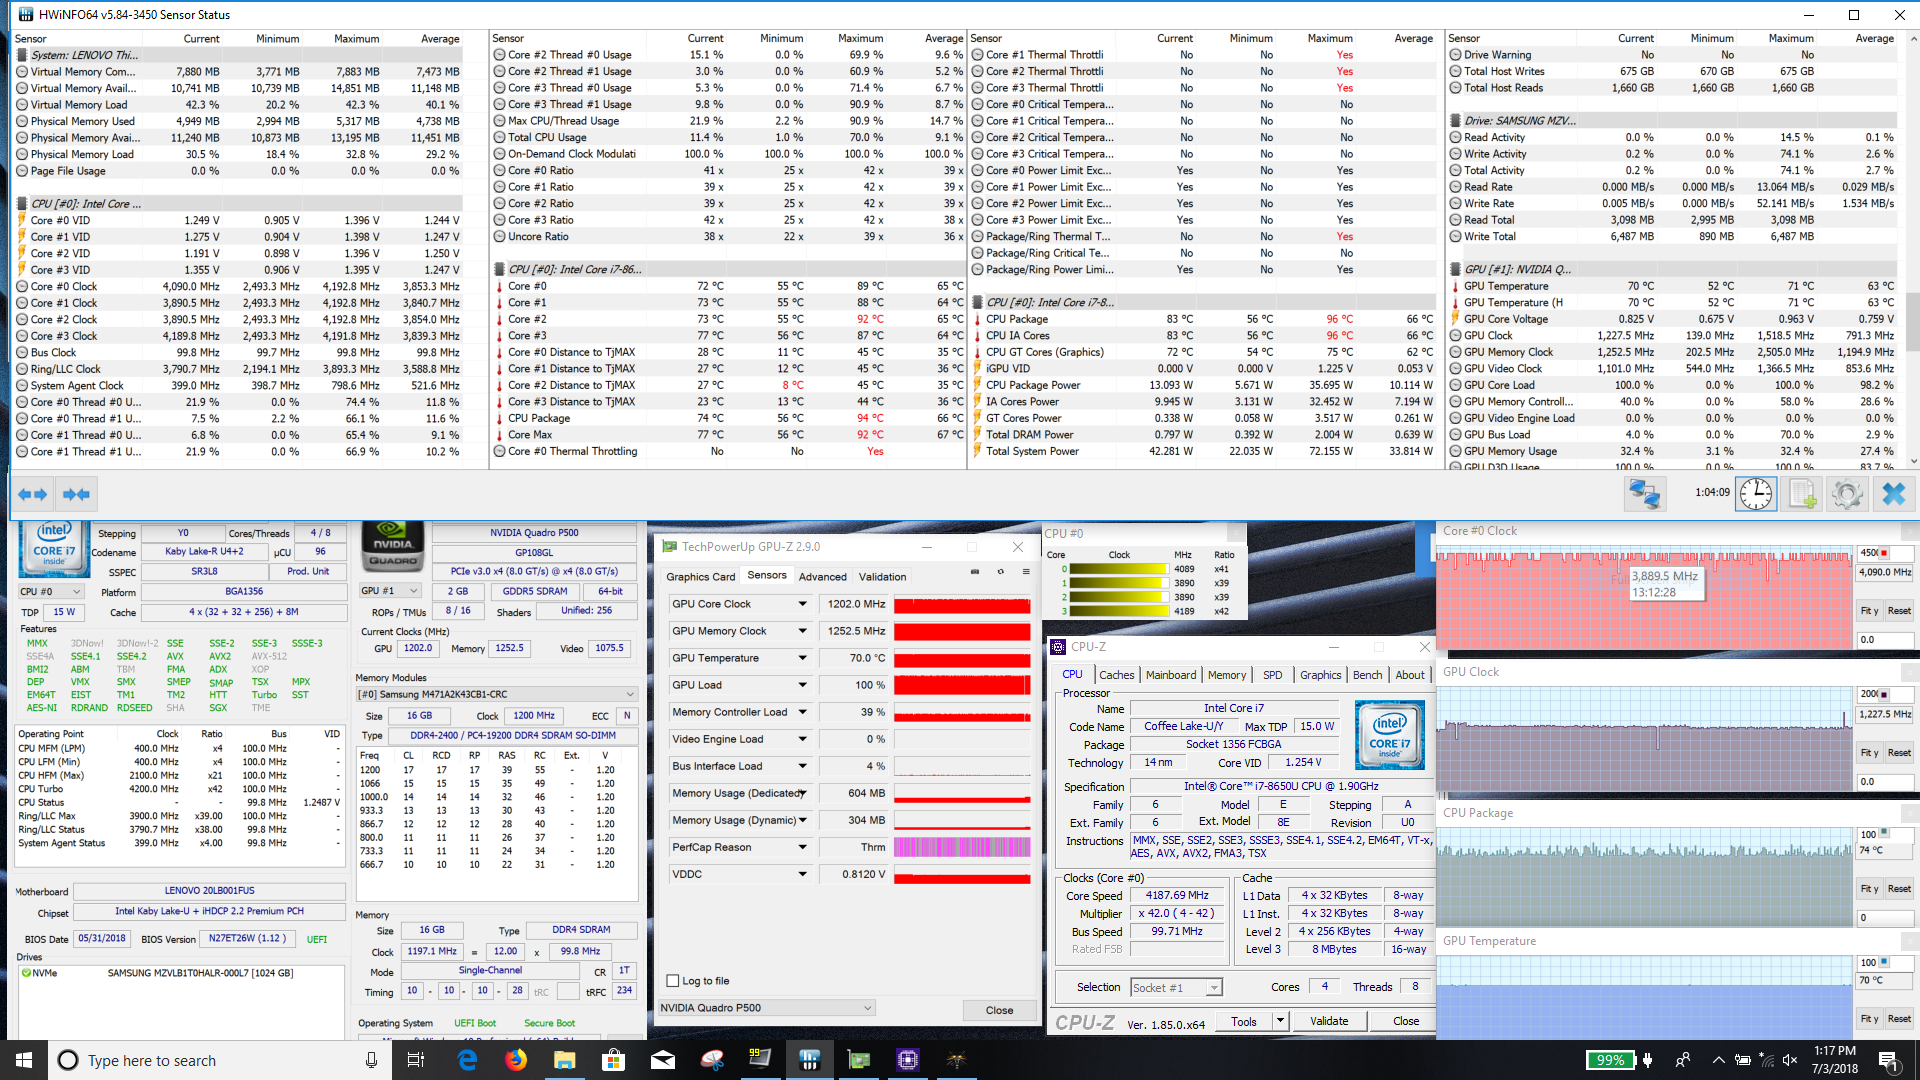
Performance can be summed up in one word: inconsistent. While the internals look good on paper (Core i7-8650U, Nvidia Quadro P500), there is a wide variance in performance over long tasks. In particular, the CPU holds back over lengthy workloads. The GPU, in particular, is problematic, as we will see below. Whether it is a driver issue or something specific to our unit, the Quadro P500 leaves a lot to be desired.
Processor
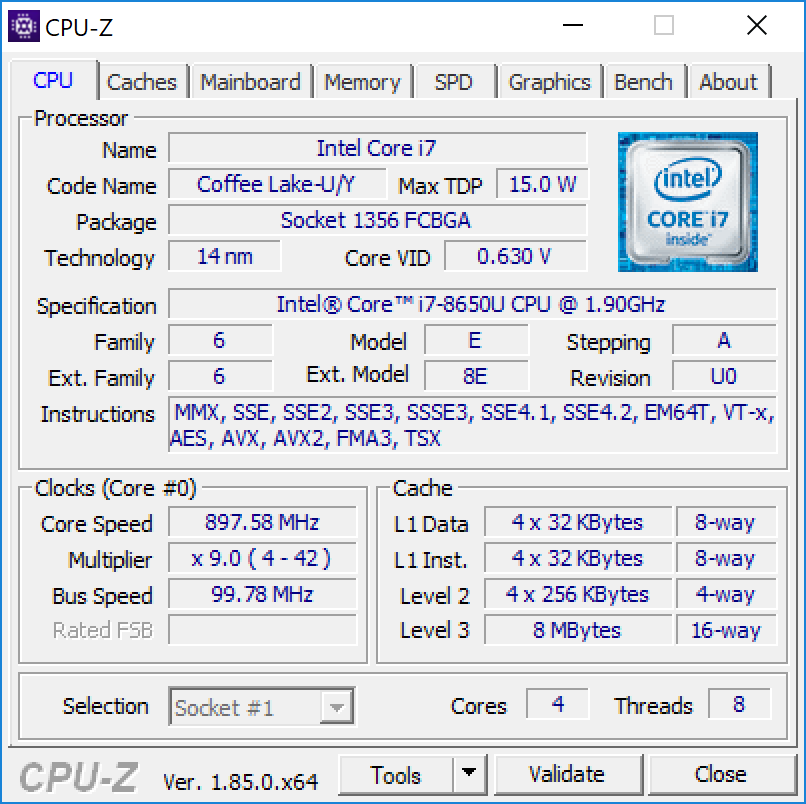
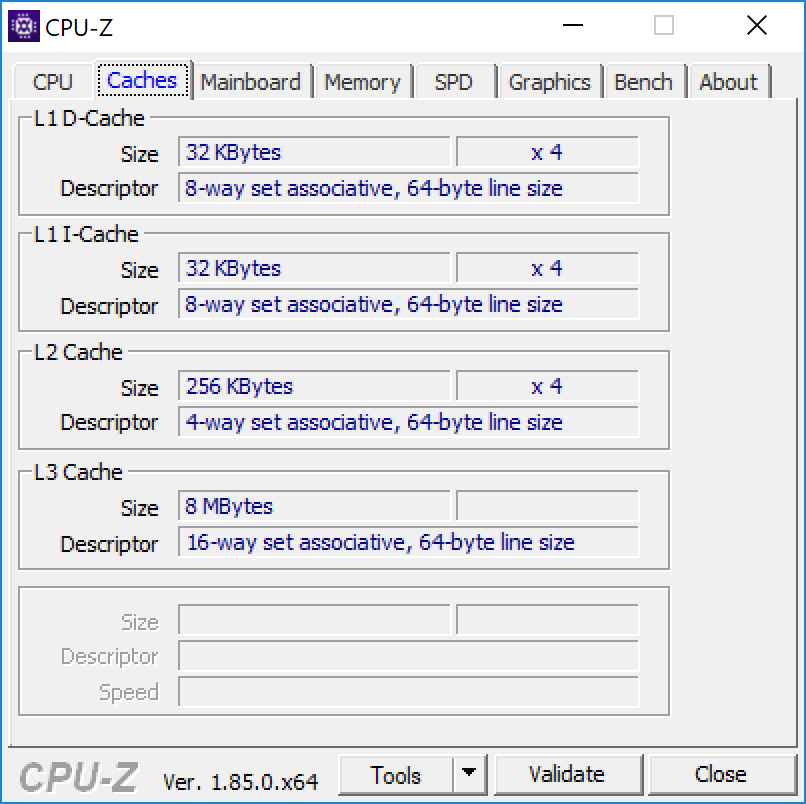
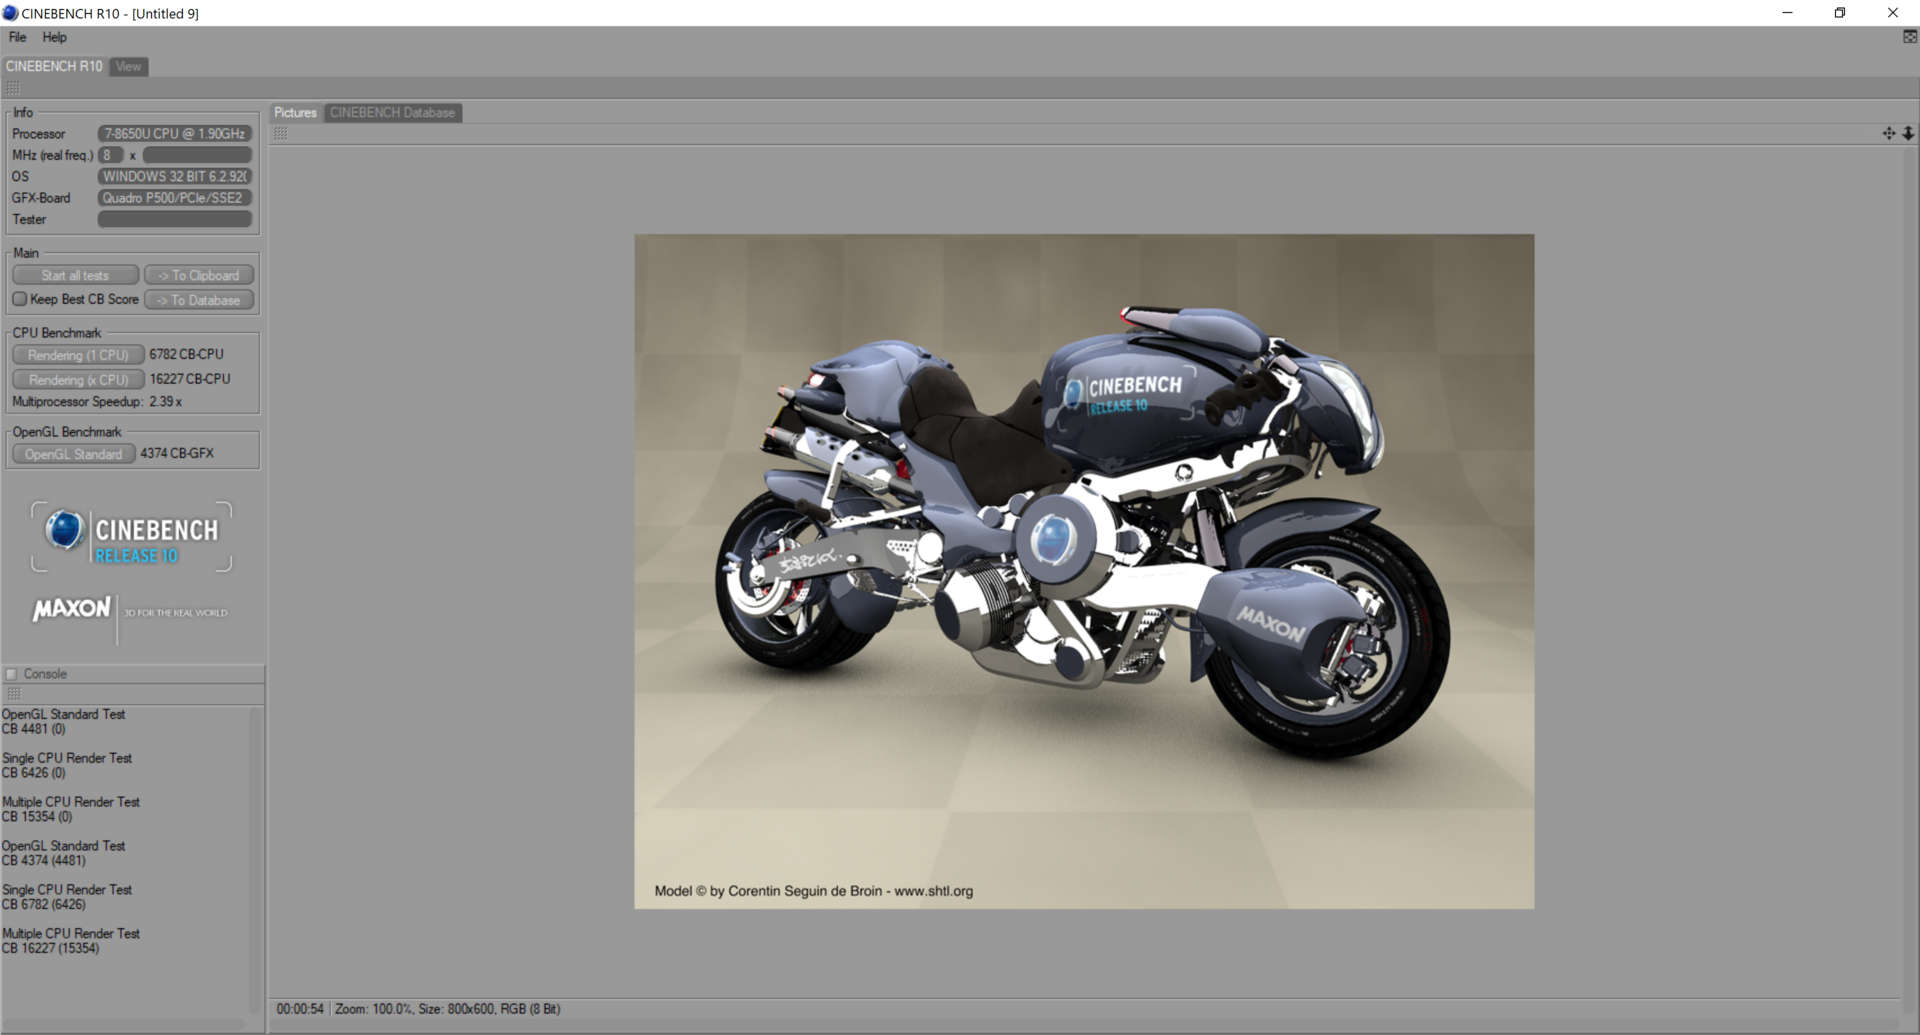
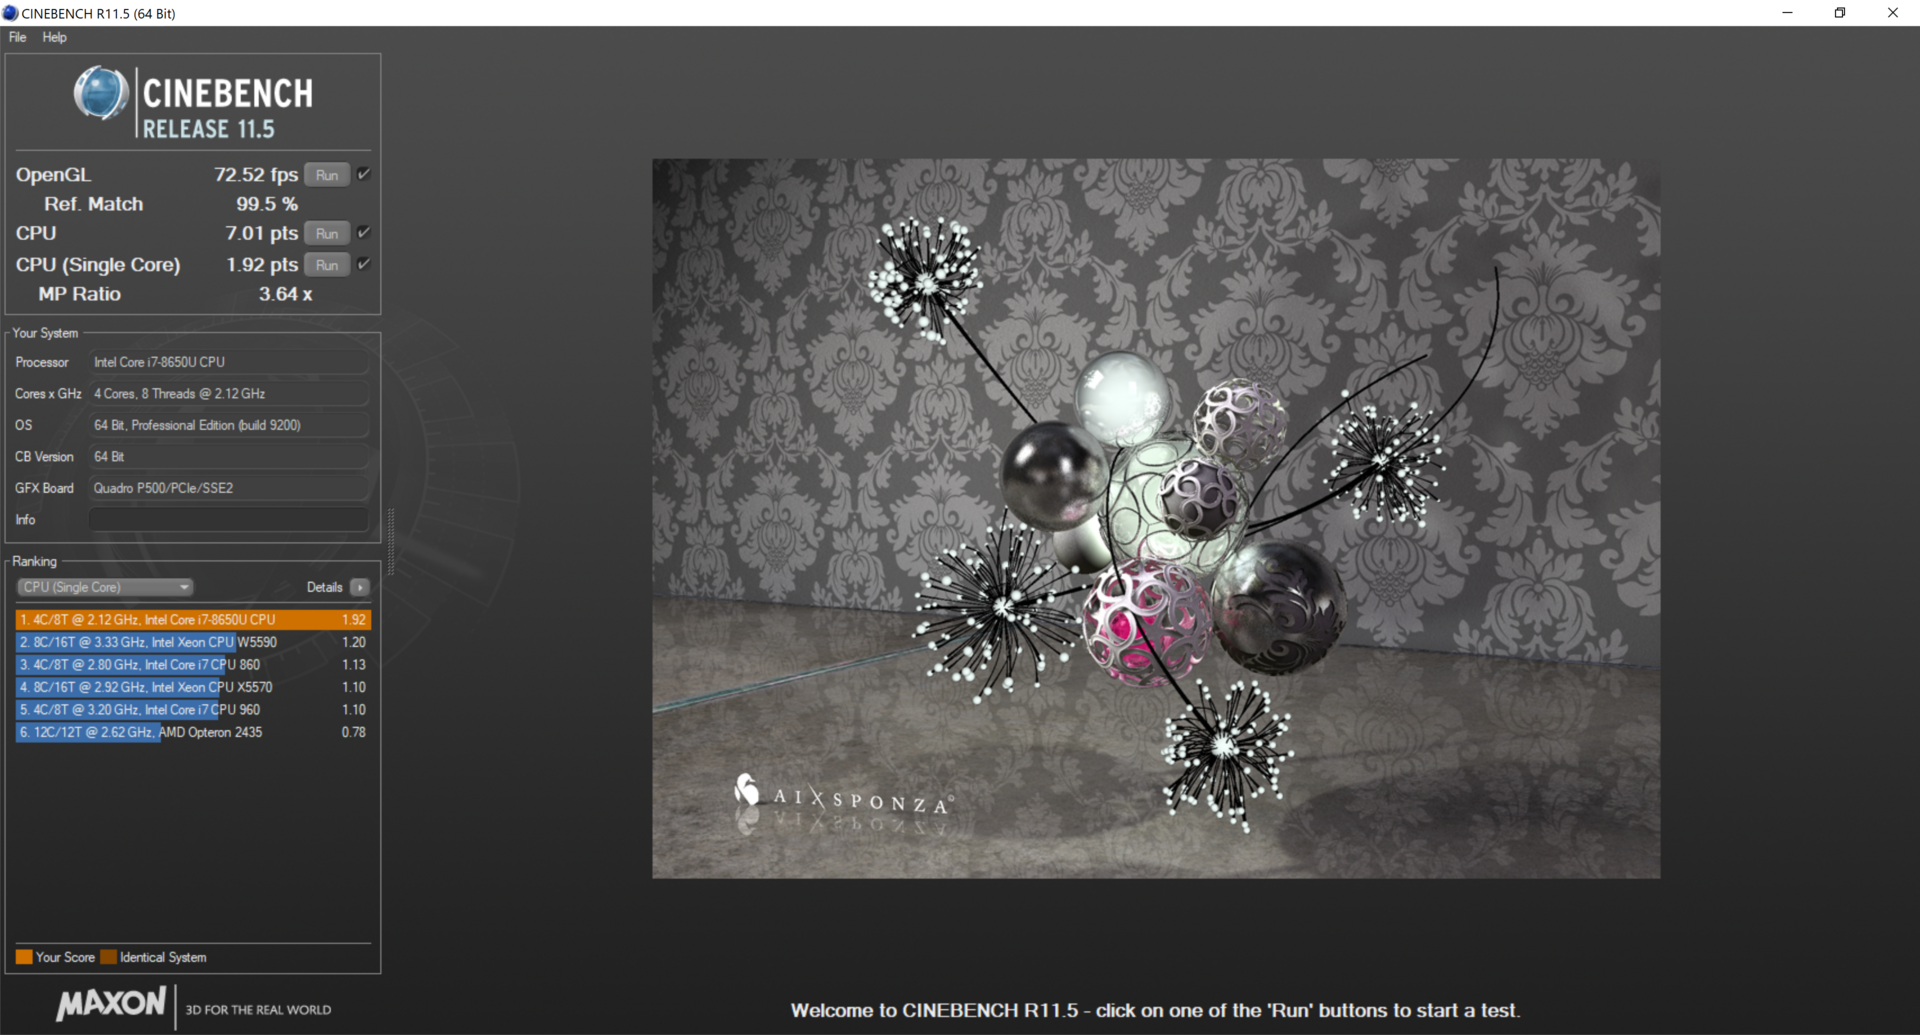
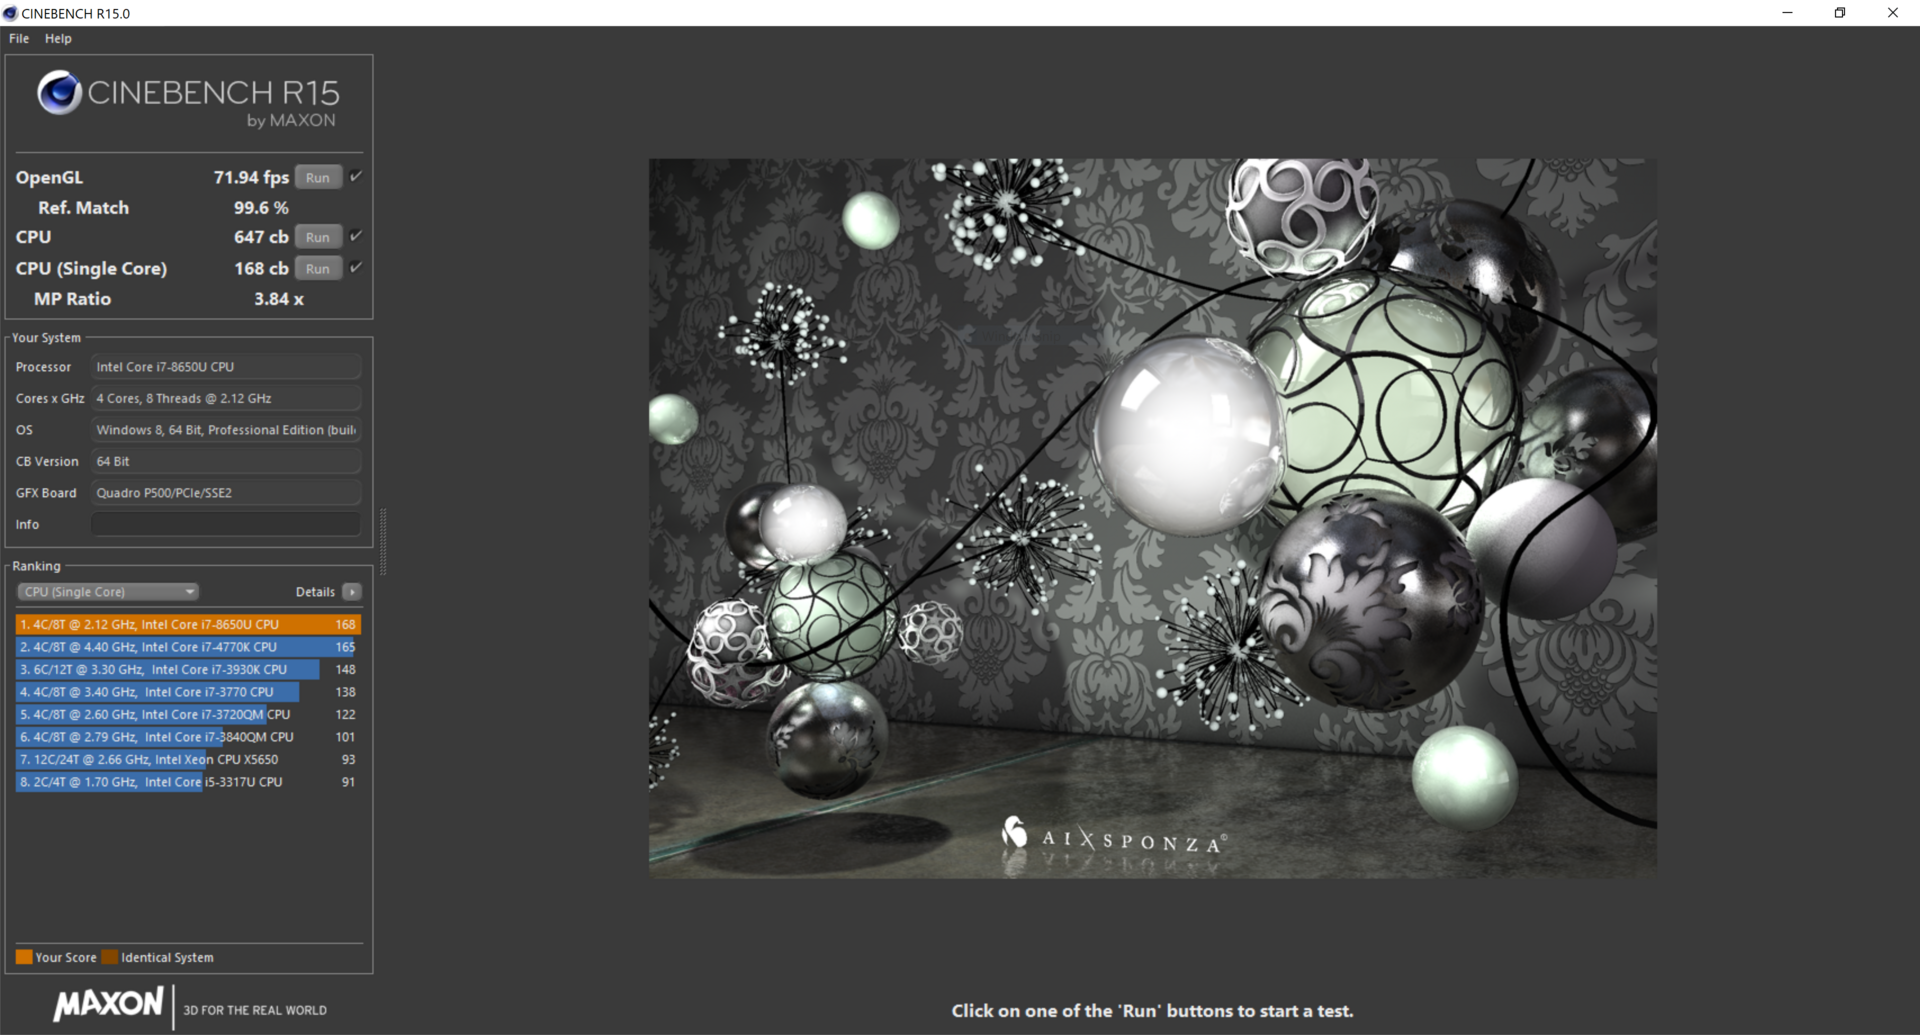
We've seen the Intel Core i7-8650U in several machines, and the ULV processor typically performs well. The 15 W processor ushers in a big change to Intel's ultrabook-class CPUs, doubling the core count without raising the TDP. Unfortunately, the P52s is not the best showing for the 8650U. In Cinebench R15's multicore test, the P52s surprisingly came in about 10% behind the Core i7-8550U; while similar, the 8550U has a slightly lower boost clock.
In long-term workloads, the limits of the P52s become evident. After its first pass in our Cinebench R15 loop, the P52s sees about a 20% reduction in performance during its second run. Subsequent runs see further degradation, coming in about 30% lower than the initial test. While the cause for this throttling is not readily discernible (see the Stress Test section below), it is nonetheless disconcerting and may be a point of frustration for those that tax the CPU with lengthy projects. As a workstation, this result is particularly disappointing.
For more information on the Intel Core i7-8650U, please see our dedicated CPU page here.
| wPrime 2.10 - 1024m | |
| Dell Precision 5520 UHD | |
| Average Intel Core i7-8650U (268 - 335, n=3) | |
| Average of class Workstation (n=1last 2 years) | |
| MSI WS63VR 7RL-023US | |
* ... smaller is better
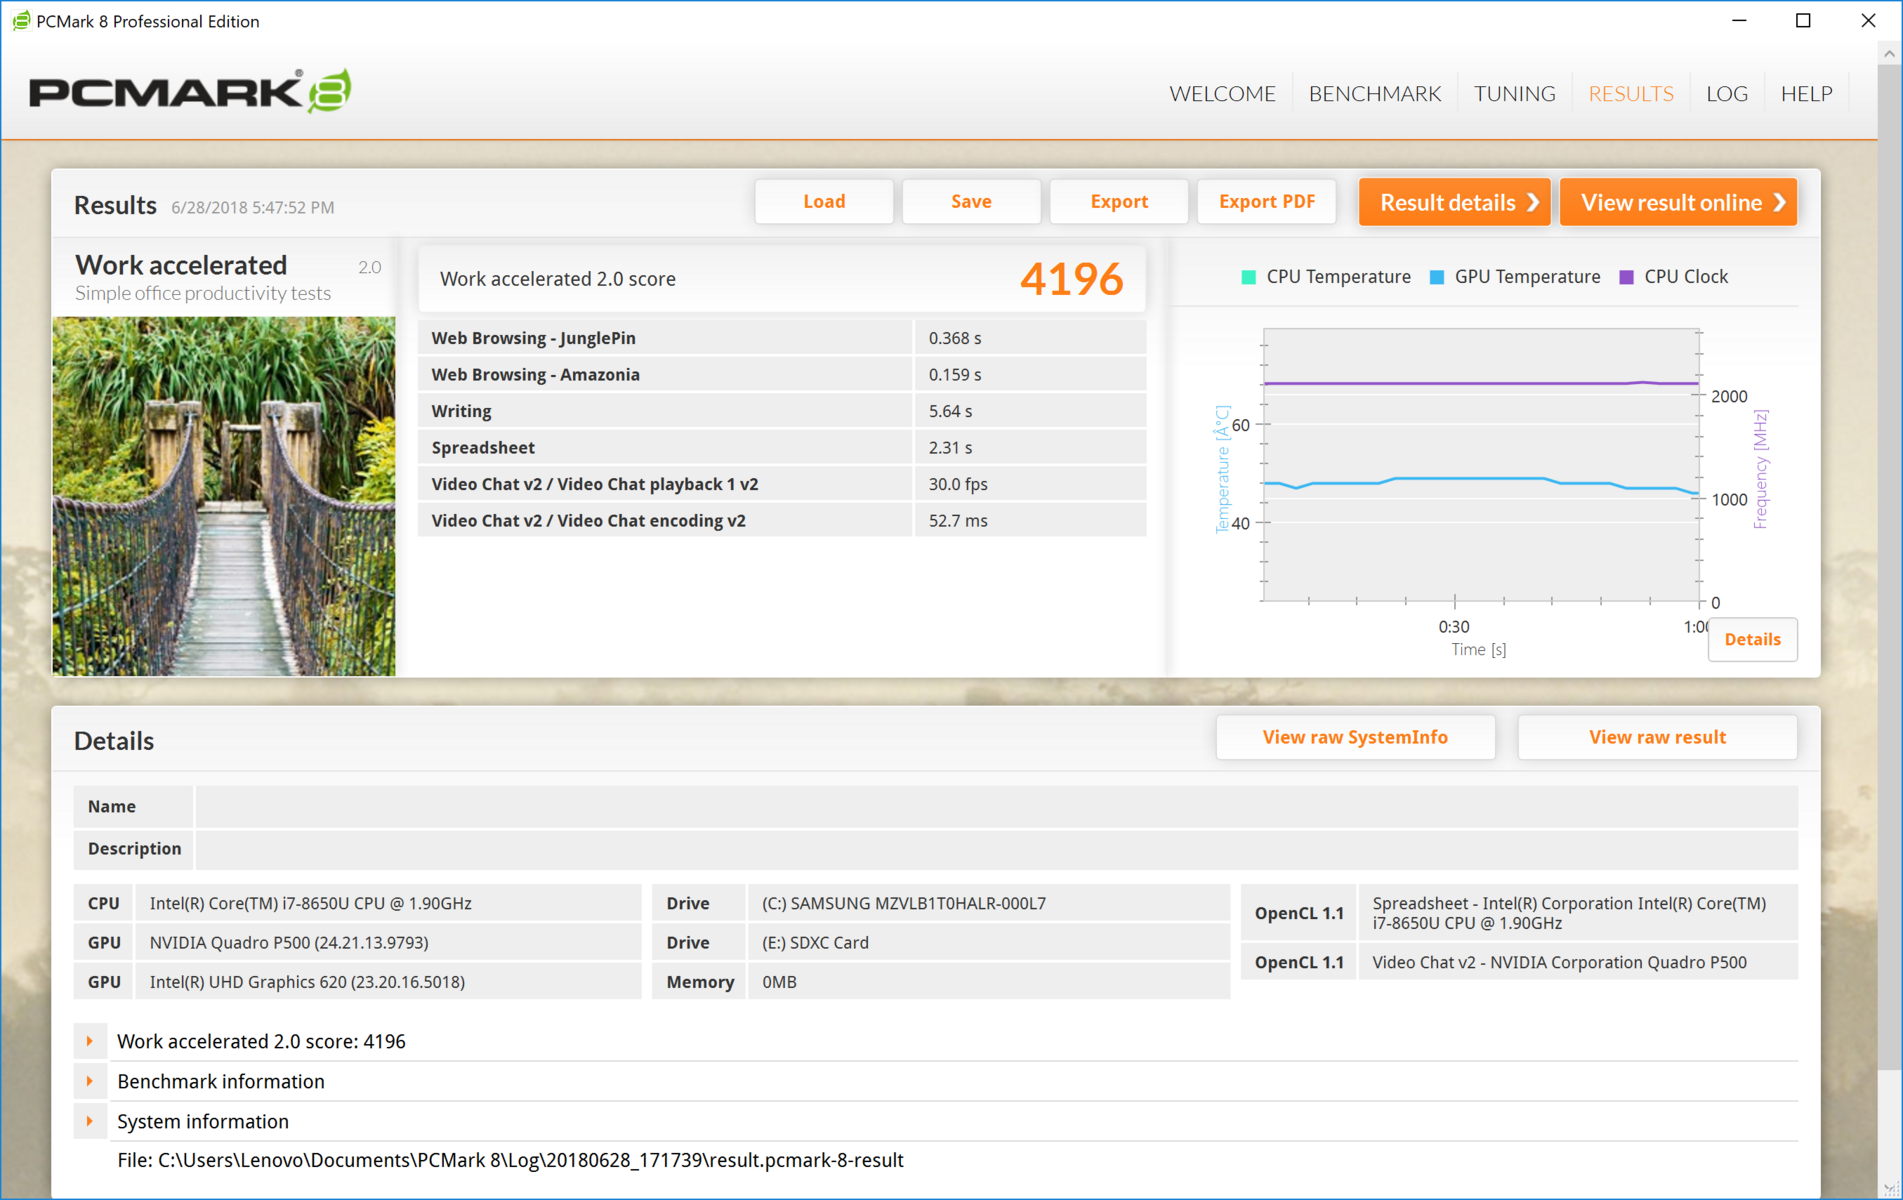
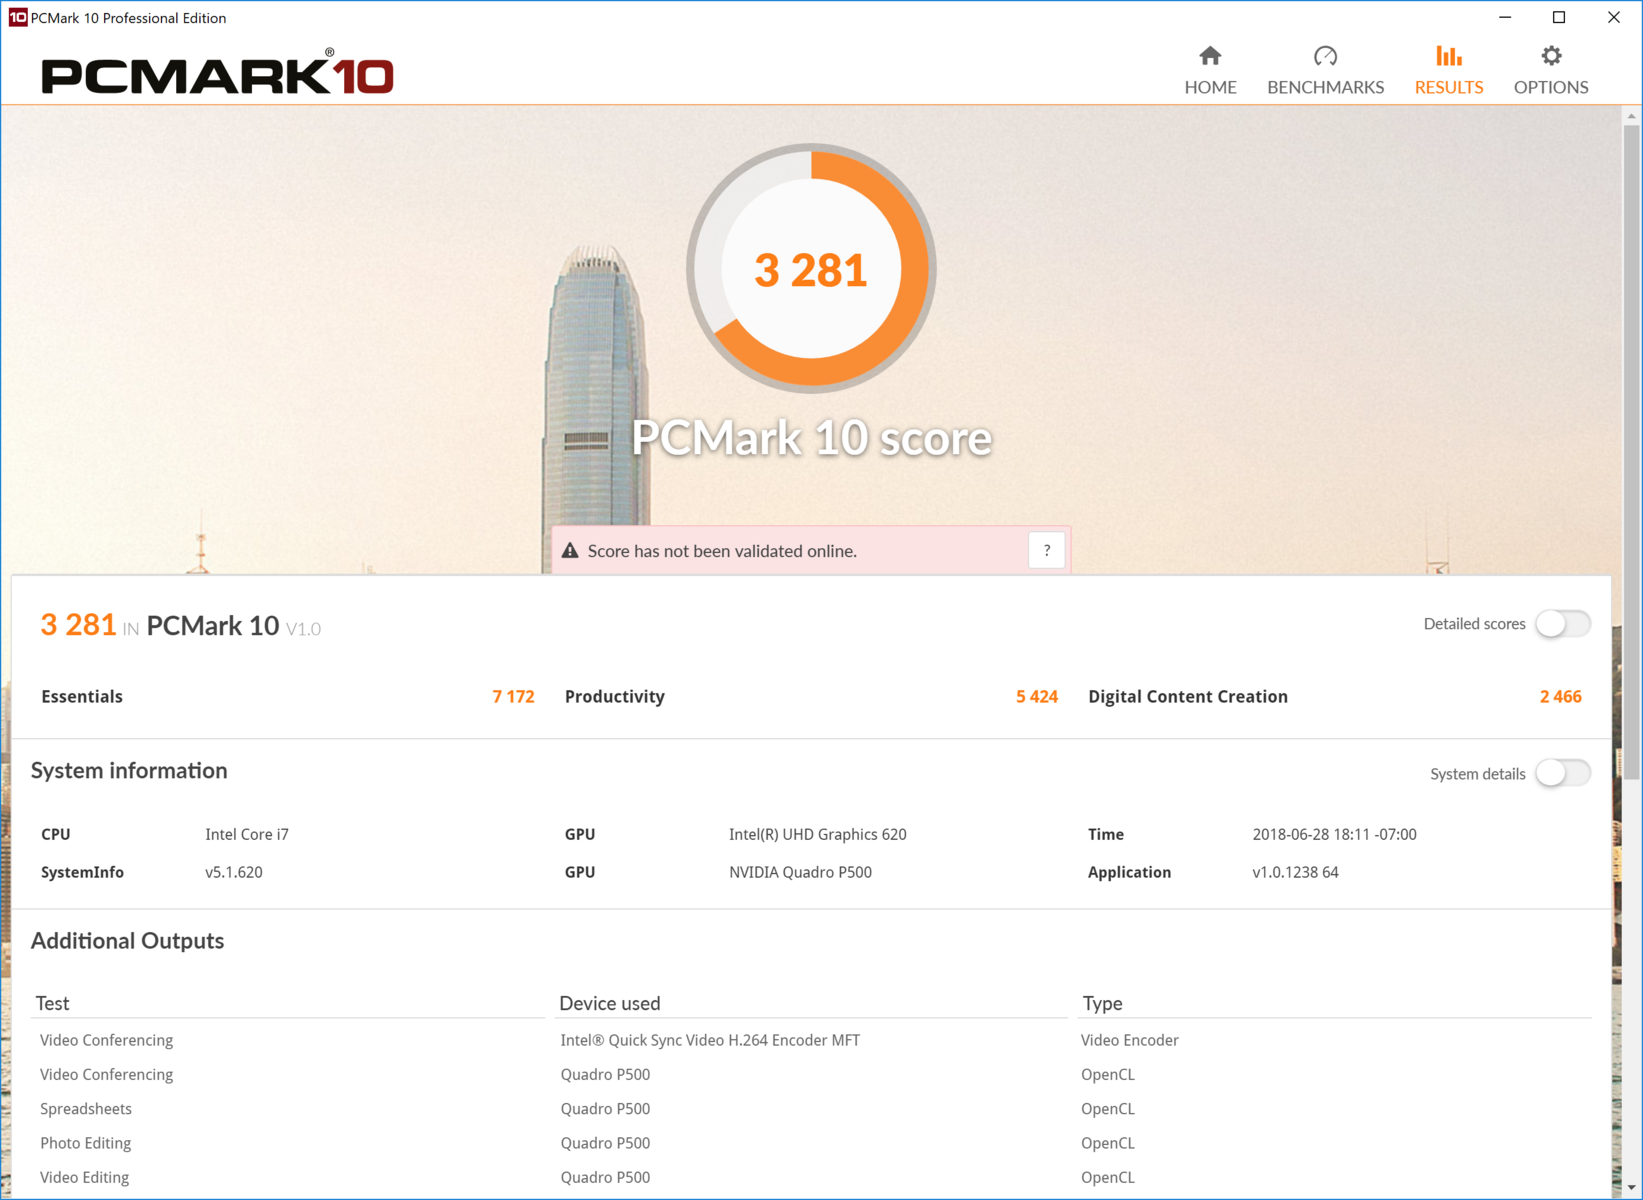
System Performance
Despite the disappointing CPU performance, overall system speed is good. The snappy NVMe SSD makes for a highly responsive system; apps open immediately and never seem to hang. Standard office tasks (web browsing, word processing) are fluid, and more demanding workloads (video rendering, 4K video streaming) leave little room for complaint. As a standard office machine, the P52s is excellent. However, heavy projects like CAD design are better handled by more robust machines (e.g., Dell's Precision 3520 and MSI's WS63VR).
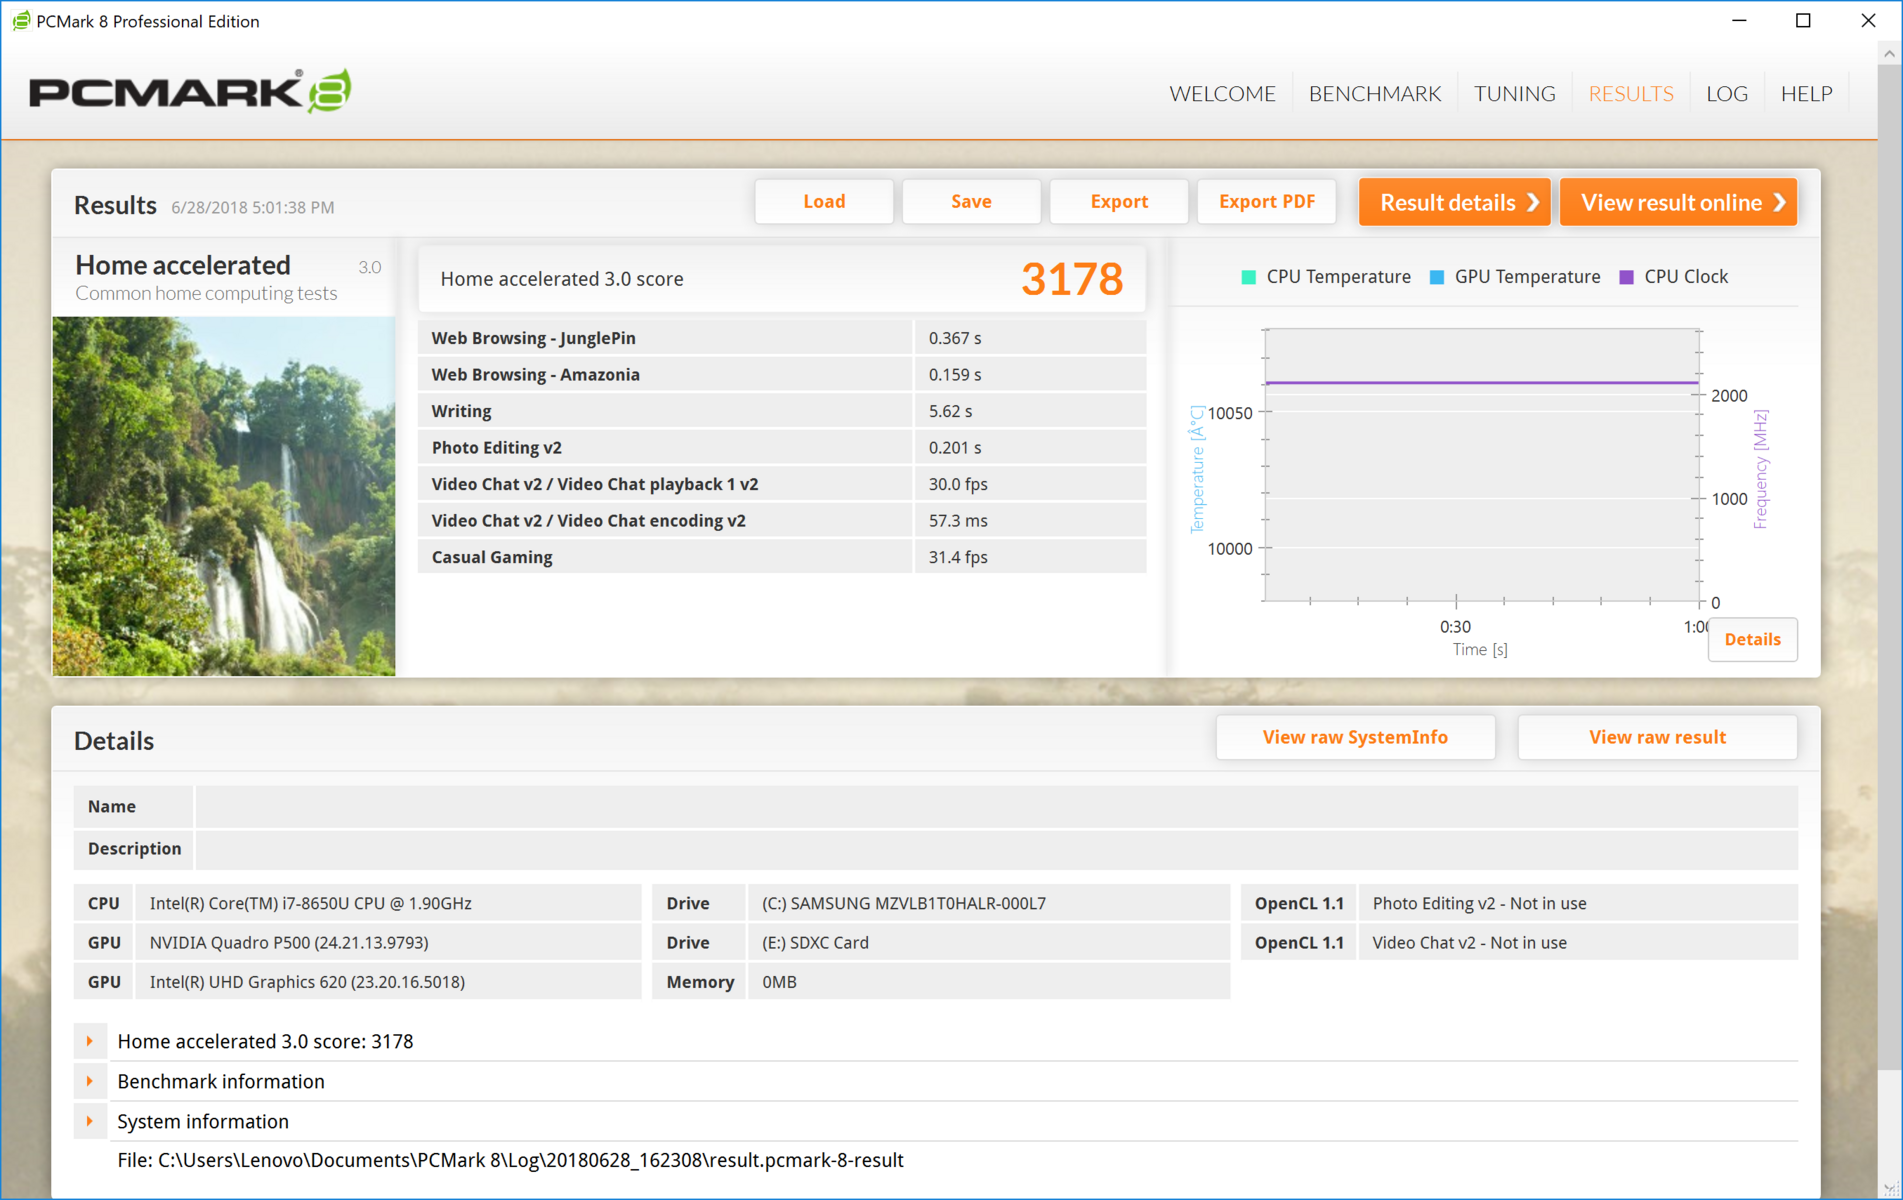
| PCMark 8 Home Score Accelerated v2 | 3178 points | |
| PCMark 8 Work Score Accelerated v2 | 4196 points | |
| PCMark 10 Score | 3281 points | |
Help | ||
Storage Devices
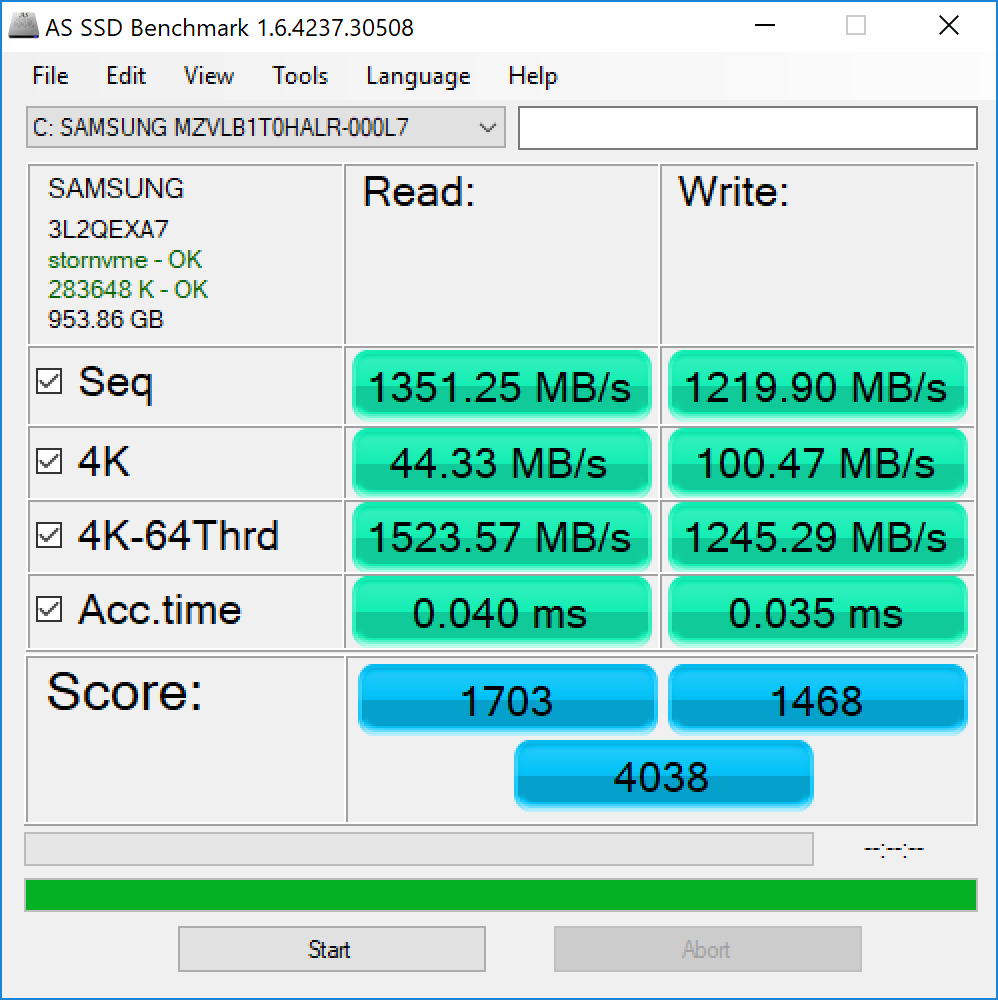
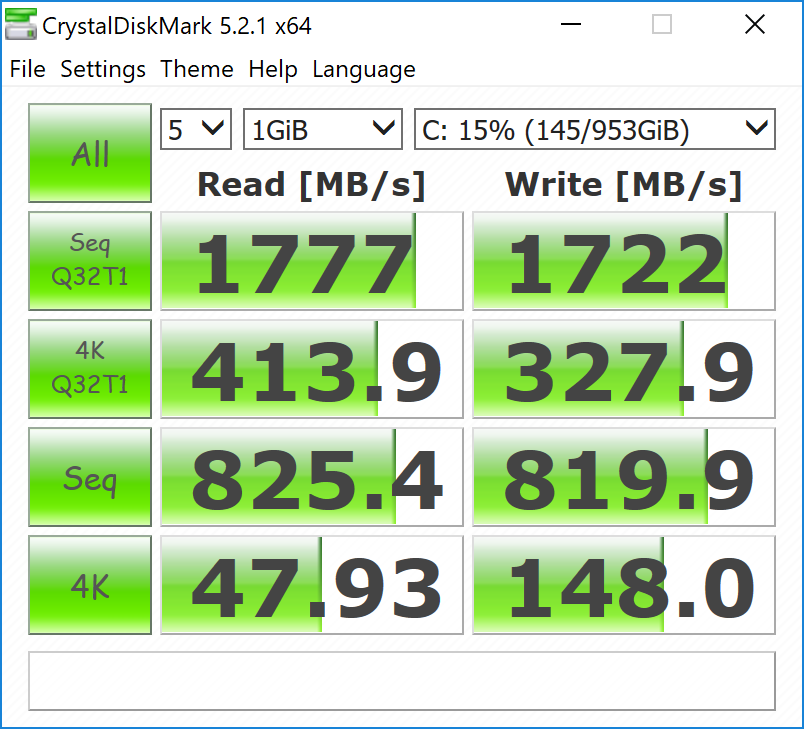
The Samsung PM981 in our P52s is currently one of the fastest NVMe SSDs available, and the 1 TB of storage space is very generous. As with most SSDs, the higher the storage capacity, the better the performance (relative to lower capacity drives of the same line). That is indeed the case; the P52s bests most competitors, save the Dell Precision 5520, in AS SSD.
There is an important note to make: despite the impressive performance in these benchmarks, the P52s's storage solution is locked down by the PCIe x2 interface. As such, the PM981 is held back from its full potential. That said, most users won't notice the difference, but large file transfers will be affected by the lower throughput. There is a second M.2 2242 slot compatible with WWAN cards and SATA III SSDs. Unfortunately, RAID configurations using an NVMe SSD are not possible as a result.
| Lenovo ThinkPad P52S-20LB001FUS Samsung SSD PM981 MZVLB1T0HALR | Lenovo ThinkPad P52s-20LB000HGE Samsung PM961 MZVLW256HEHP | Lenovo ThinkPad P51s 20HB000SGE Samsung SSD PM961 1TB M.2 PCIe 3.0 x4 NVMe (MZVLW1T0) | HP ZBook 15u G5 2ZC05EA Toshiba XG5 KXG50ZNV256G | Dell Precision 3520 Toshiba XG4 NVMe (THNSN5512GPUK) | Dell Precision 5520 UHD Samsung SM961 MZVKW512HMJP m.2 PCI-e | MSI WS63VR 7RL-023US Toshiba NVMe THNSN5512GPU7 | Average Samsung SSD PM981 MZVLB1T0HALR | |
|---|---|---|---|---|---|---|---|---|
| AS SSD | -11% | -15% | -49% | -57% | 19% | -38% | 13% | |
| Copy Game MB/s (MB/s) | 721 | 742 | 747 | 921 | 1302 ? | |||
| Copy Program MB/s (MB/s) | 411.5 | 324.8 | 340.4 | 372.8 | 558 ? | |||
| Copy ISO MB/s (MB/s) | 1200 | 1146 | 1053 | 1659 | 2280 ? | |||
| Score Total (Points) | 4038 | 3131 -22% | 2771 -31% | 1697 -58% | 1646 -59% | 3681 -9% | 1979 -51% | 4588 ? 14% |
| Score Write (Points) | 1468 | 868 -41% | 1271 -13% | 710 -52% | 248 -83% | 1379 -6% | 557 -62% | 1942 ? 32% |
| Score Read (Points) | 1703 | 1504 -12% | 990 -42% | 689 -60% | 961 -44% | 1554 -9% | 962 -44% | 1747 ? 3% |
| Access Time Write * (ms) | 0.04 | 0.026 35% | 0.027 32% | 0.051 -27% | 0.034 15% | 0.023 43% | 0.033 17% | 0.05581 ? -40% |
| Access Time Read * (ms) | 0.04 | 0.065 -63% | 0.082 -105% | 0.103 -158% | 0.123 -208% | 0.038 5% | 0.128 -220% | 0.05158 ? -29% |
| 4K-64 Write (MB/s) | 1245 | 612 -51% | 1018 -18% | 564 -55% | 134.5 -89% | 1055 -15% | 314 -75% | 1625 ? 31% |
| 4K-64 Read (MB/s) | 1524 | 1312 -14% | 792 -48% | 488.4 -68% | 788 -48% | 1223 -20% | 710 -53% | 1502 ? -1% |
| 4K Write (MB/s) | 100.5 | 140 39% | 130.8 30% | 101.5 1% | 93.8 -7% | 155.3 55% | 114.6 14% | 109.7 ? 9% |
| 4K Read (MB/s) | 44.33 | 44.98 1% | 52.8 19% | 31.28 -29% | 32.58 -27% | 51.5 16% | 40.2 -9% | 46.4 ? 5% |
| Seq Write (MB/s) | 1220 | 1164 -5% | 1217 0% | 441 -64% | 201.9 -83% | 1694 39% | 1287 5% | 2036 ? 67% |
| Seq Read (MB/s) | 1351 | 1463 8% | 1450 7% | 1696 26% | 1406 4% | 2799 107% | 2133 58% | 1993 ? 48% |
* ... smaller is better

GPU Performance
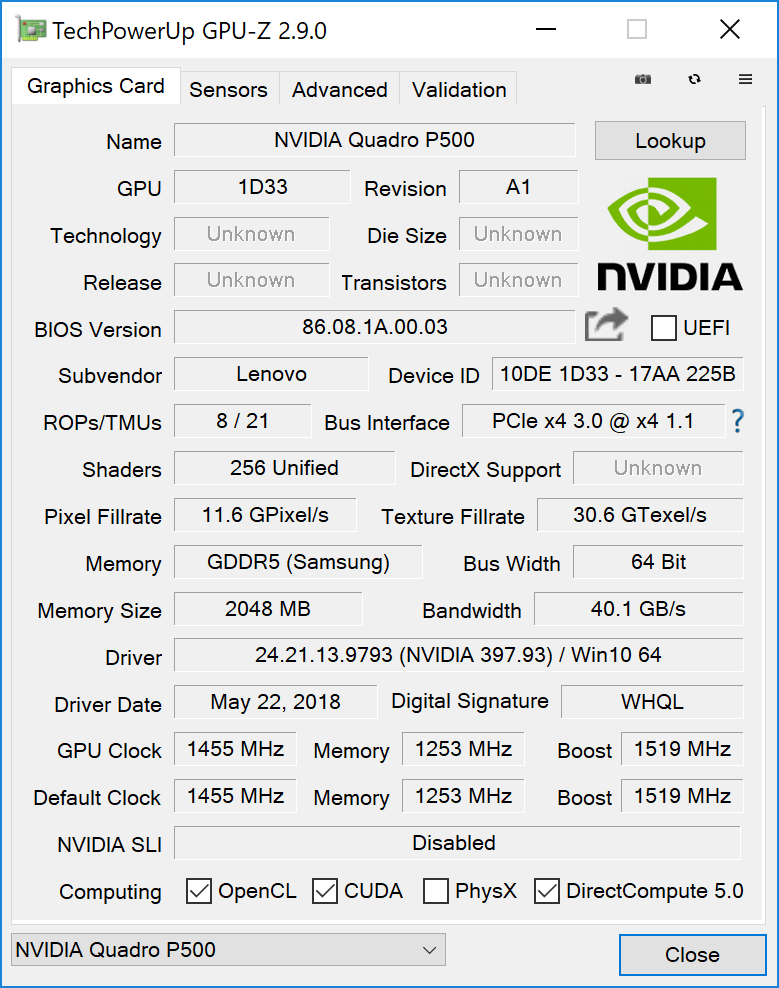
As we mentioned in our review of the FHD P52s, the Nvidia Quadro P500 is a weak point in the machine. The P500 roughly sits between Nvidia's MX130 and MX150, both of which are low-powered GPUs designed for office machines. It's curious, then, why Lenovo chose this GPU for what they advertise as a workstation. While performance is a fair bit better than Intel's UHD Graphics 620, it's a far cry from what is to be expected of a workstation class machine. The P52s falls 4% behind last generation's ThinkPad P51s in both Fire Strike and Cloud Gate, raising questions as to whether or not an upgrade is worth the price. Other compact workstations, such as Dell's Precision 5520, are better positioned for professional design and engineering work. The P500 requires less power than these beefier GPUs, but with workstations, power efficiency commonly comes second to raw performance.
The biggest problem with the GPU is its inconsistency. As seen in the Stress Test below, frame drops are common and performance can vary wildly in some situations. This may be due to the Quadro P500 drivers from Nvidia; at the time of this review, the only driver listed for the P500 is still in beta.
For more information on the Nvidia Quadro P500, please see our dedicated GPU page here.
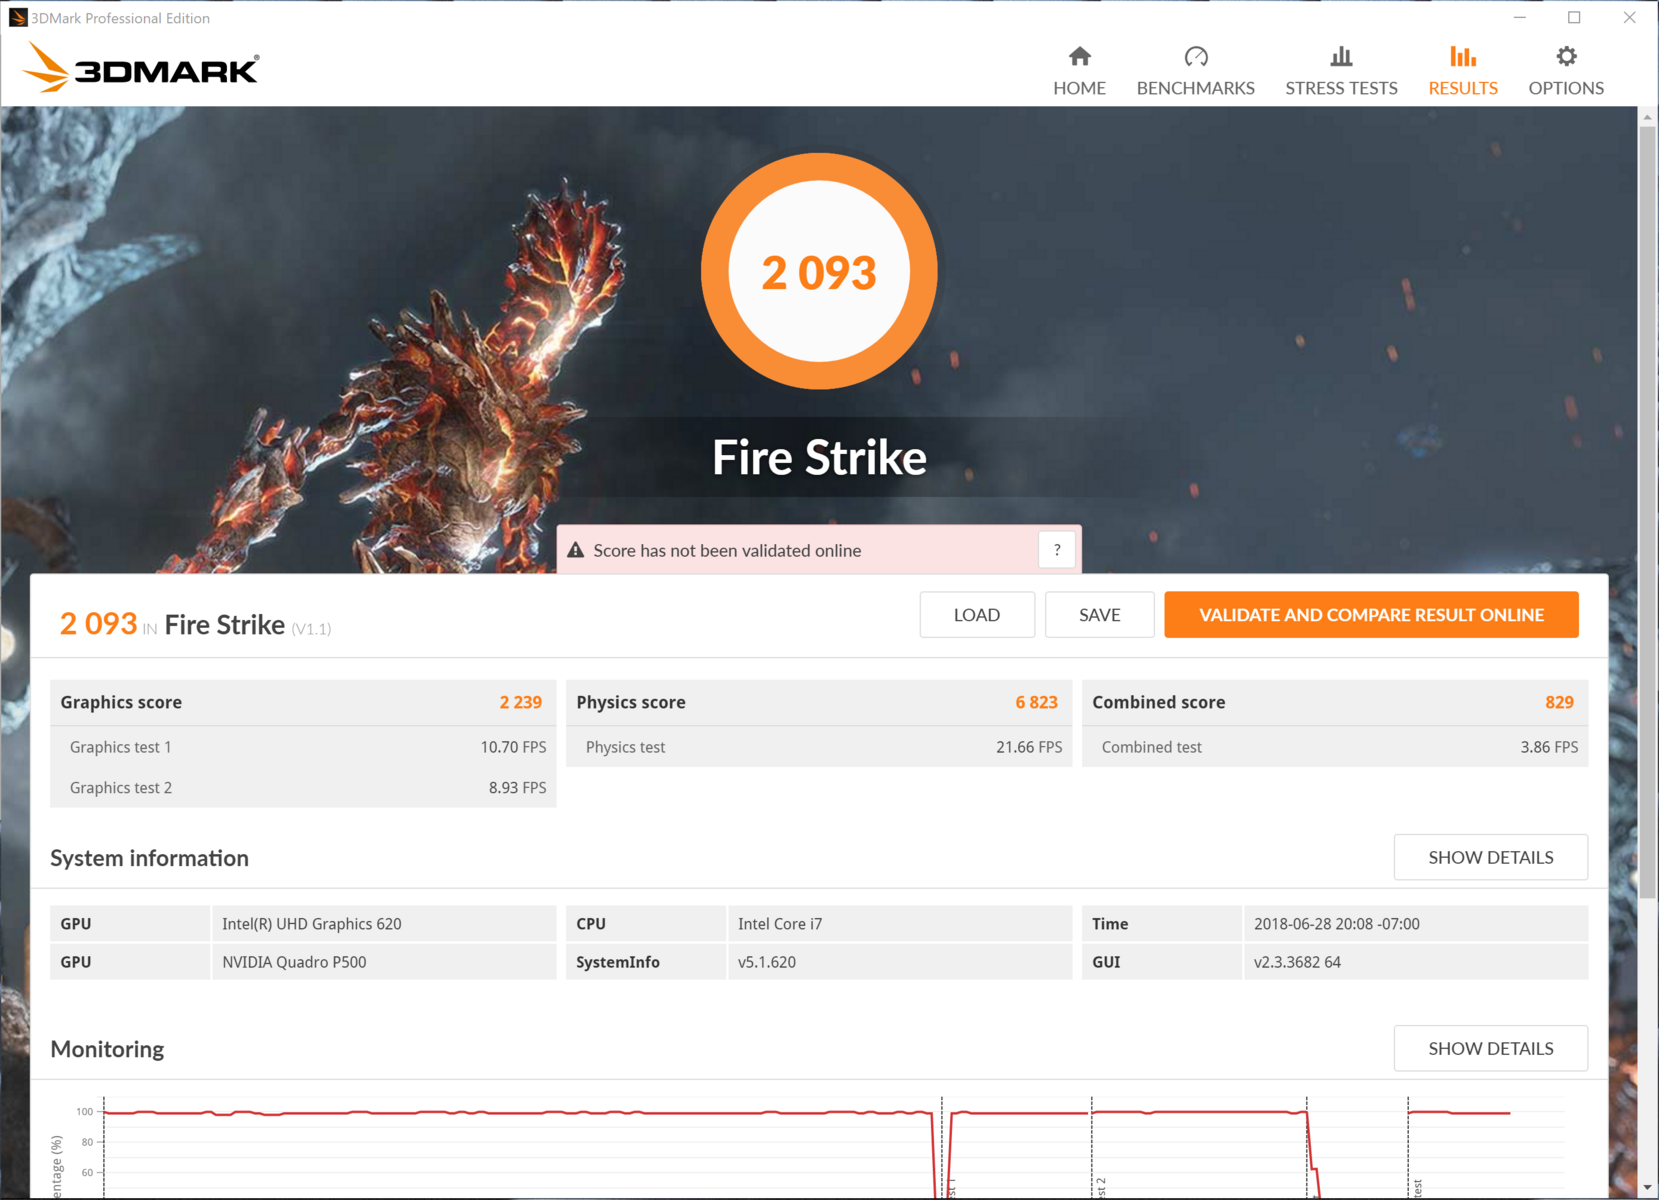
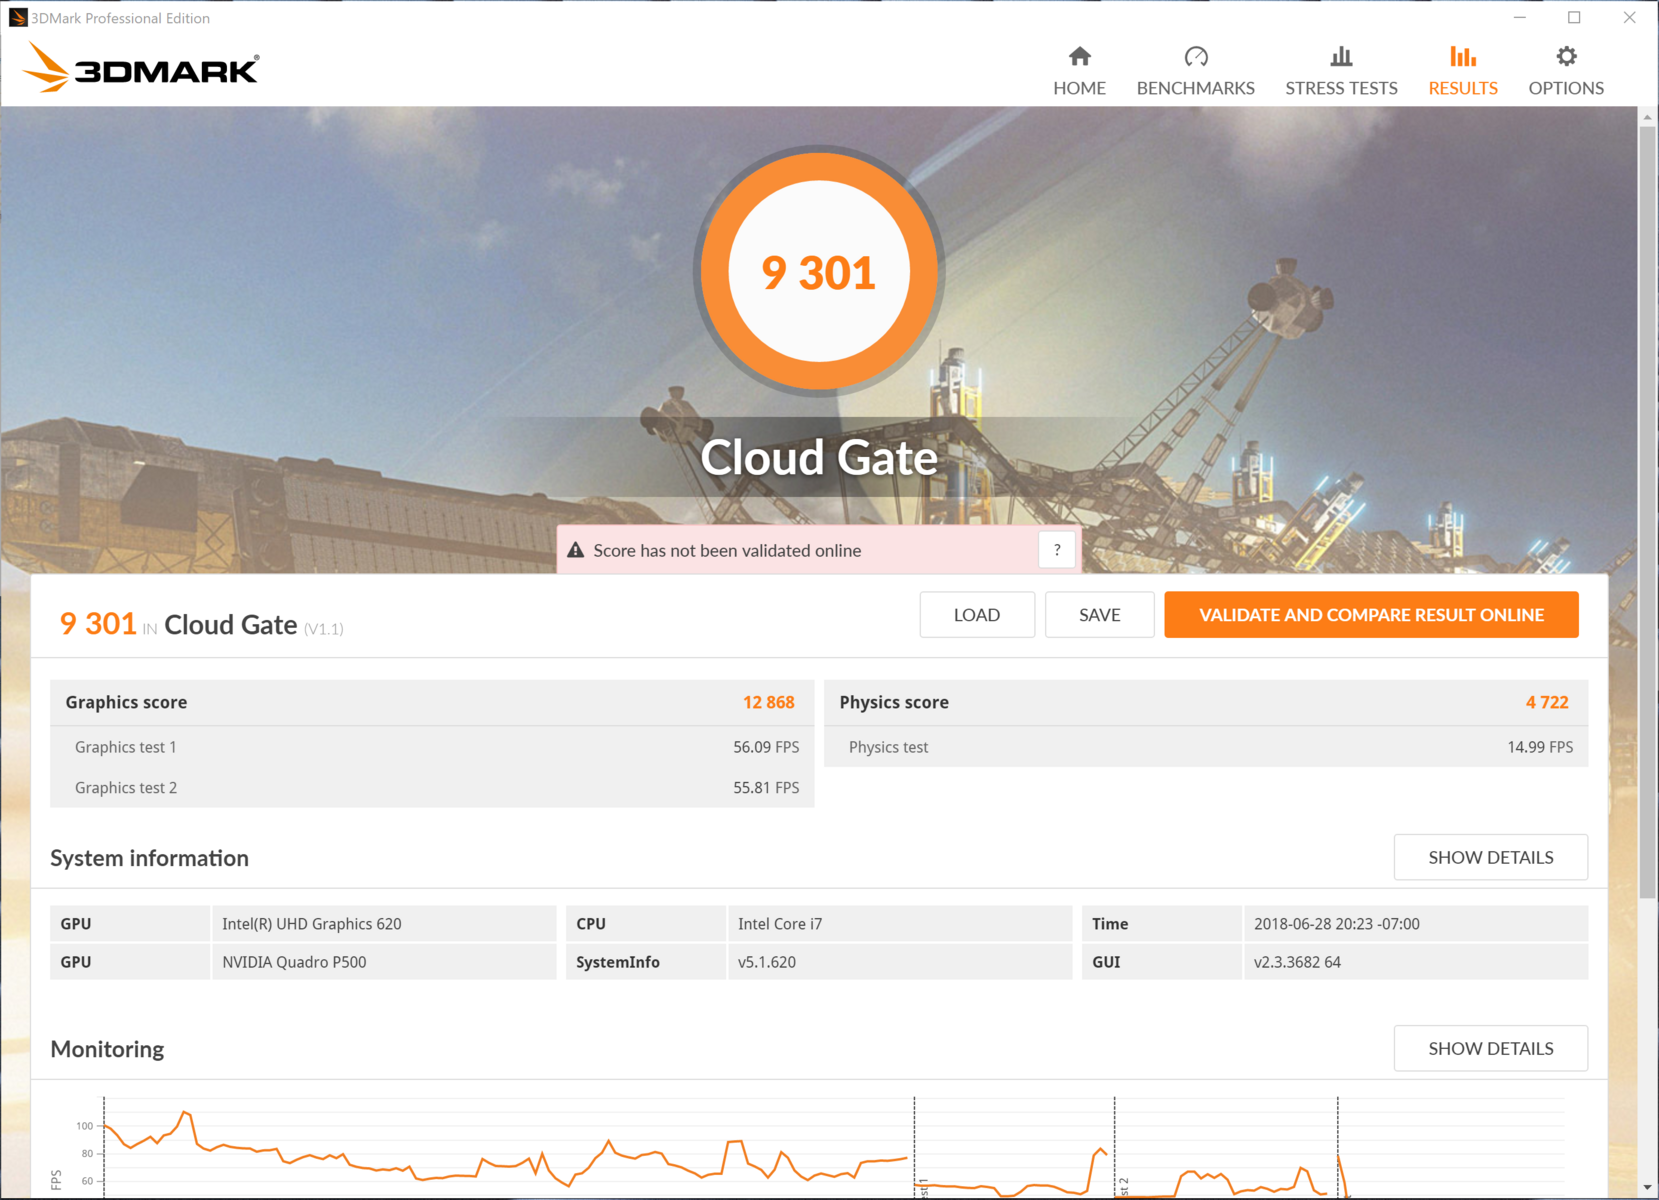
| 3DMark Cloud Gate Standard Score | 9301 points | |
| 3DMark Fire Strike Score | 2093 points | |
Help | ||
Gaming Performance
As with general GPU performance, gaming is a weak point in the P52s. With a GPU slightly weaker than Nvidia's MX150, most titles are only playable at HD resolutions (1366x768) and lower, and even then only at lower settings. Gaming at the display's native 4K resolution is completely out of reach for most games.
| Far Cry 5 | |
| 1280x720 Low Preset AA:T | |
| Average of class Workstation (75 - 168, n=7, last 2 years) | |
| Average NVIDIA Quadro P500 (30 - 32, n=2) | |
| Lenovo ThinkPad P52S-20LB001FUS | |
| 1920x1080 Medium Preset AA:T | |
| Average of class Workstation (42 - 148, n=9, last 2 years) | |
| Average NVIDIA Quadro P500 (12 - 15, n=2) | |
| Lenovo ThinkPad P52S-20LB001FUS | |
| Kingdom Come: Deliverance | |
| 1280x720 Low Preset | |
| Lenovo ThinkPad P52S-20LB001FUS | |
| Average NVIDIA Quadro P500 (n=1) | |
| 1920x1080 Medium Preset | |
| Lenovo ThinkPad P52S-20LB001FUS | |
| Average NVIDIA Quadro P500 (n=1) | |
| low | med. | high | ultra | |
|---|---|---|---|---|
| The Witcher 3 (2015) | 38 | 23 | 13 | 8 |
| Rise of the Tomb Raider (2016) | 42 | 26 | 12 | 11 |
| Kingdom Come: Deliverance (2018) | 39 | 15 | 14 | 8 |
| Far Cry 5 (2018) | 30 | 12 | 10 | 8 |
Stress Test
Stress shows how unstable the P52s can be in certain workloads. Running Prime95 presents no major problems, although the CPU does seem restrained. After boosting to 3.9-4.2 GHz at the beginning of the test, the processor sits near its base clock at 2.0 GHz for the majority of the hour-long run. FurMark is also well-handled by the GPU, which never sees temperatures higher than about 70° C. Even running Prime95 and FurMark together cannot make the P52s break a sweat, although there is some headroom for increased performance.
It's in real-world testing that the P52s falls apart. During an hour-long session of The Witcher 3 (1366x768, Medium settings), frame drops were rampant after about 15 minutes of gameplay. Even when holding the same scene for an hour with no changes outside of the game's day/night cycle, the frame rate drastically dropped for about 30 minutes before correcting itself (see the chart below). Again, this is likely due to a lack of optimization on the part of the GPU. As a Quadro card, the P500 is designed for professional use rather than gaming, and the drivers are so new they haven't yet left beta testing. This inconsistency is present in a select few applications and is mostly present in workloads demanding real-time rendering (such as games).
| CPU Clock (GHz) | GPU Clock (MHz) | Average CPU Temperature (°C) | Average GPU Temperature (°C) | |
| Prime95 Stress | 2.0 | - | 60 | - |
| FurMark Stress | 3.9 | 1260 | 70 | 70 |
| Prime95 + FurMark Stress | 1.9 | 1518 | 70 | 66 |
| Witcher 3 Stress | 3.9 | 1227 | 75 | 70 |
Emissions
System Noise
Fan noise is fairly quiet. Under lighter workloads like simple office tasks, the P52s is relatively silent. The fan almost never kicks on, and when it does, it remains a low hum. Under load, the fan ramps up smoothly to an audible 40 dB(A). It should be noted that under load, the fan pulses between 36 and 40 dB(A), which may be distracting for some. However, its low pitch is more akin to a whir than a squeal. There is no noticeable coil whine.
Noise level
| Idle |
| 28.3 / 28.3 / 29.8 dB(A) |
| Load |
| 40.6 / 40.6 dB(A) |
 | ||
30 dB silent 40 dB(A) audible 50 dB(A) loud |
||
min: | ||
| Lenovo ThinkPad P52S-20LB001FUS Quadro P500, i7-8650U, Samsung SSD PM981 MZVLB1T0HALR | Lenovo ThinkPad P52s-20LB000HGE Quadro P500, i5-8550U, Samsung PM961 MZVLW256HEHP | Lenovo ThinkPad P51s 20HB000SGE Quadro M520, i7-7600U, Samsung SSD PM961 1TB M.2 PCIe 3.0 x4 NVMe (MZVLW1T0) | HP ZBook 15u G5 2ZC05EA Radeon Pro WX 3100, i5-8550U, Toshiba XG5 KXG50ZNV256G | Dell Precision 3520 Quadro M620, i7-7820HQ, Toshiba XG4 NVMe (THNSN5512GPUK) | Dell Precision 5520 UHD Quadro M1200, E3-1505M v6, Samsung SM961 MZVKW512HMJP m.2 PCI-e | MSI WS63VR 7RL-023US Quadro P4000 Max-Q, i7-7700HQ, Toshiba NVMe THNSN5512GPU7 | |
|---|---|---|---|---|---|---|---|
| Noise | 5% | 0% | 3% | -7% | -7% | -7% | |
| off / environment * (dB) | 28.3 | 29 -2% | 29.2 -3% | 29.8 -5% | 29.6 -5% | 28.7 -1% | 28 1% |
| Idle Minimum * (dB) | 28.3 | 29 -2% | 29.2 -3% | 29.8 -5% | 29.6 -5% | 28.7 -1% | 33.2 -17% |
| Idle Average * (dB) | 28.3 | 29 -2% | 29.2 -3% | 29.8 -5% | 29.6 -5% | 32.1 -13% | 33.2 -17% |
| Idle Maximum * (dB) | 29.8 | 31.2 -5% | 31.1 -4% | 30.8 -3% | 31.2 -5% | 32.1 -8% | 33.2 -11% |
| Load Average * (dB) | 40.6 | 32.5 20% | 36.7 10% | 32.9 19% | 43 -6% | 41.3 -2% | 41.4 -2% |
| Witcher 3 ultra * (dB) | 40.6 | 32.5 20% | 36.5 10% | 45.5 -12% | 38.4 5% | ||
| Load Maximum * (dB) | 40.6 | 37.5 8% | 39.4 3% | 36.5 10% | 46.9 -16% | 45.5 -12% | 43.5 -7% |
* ... smaller is better
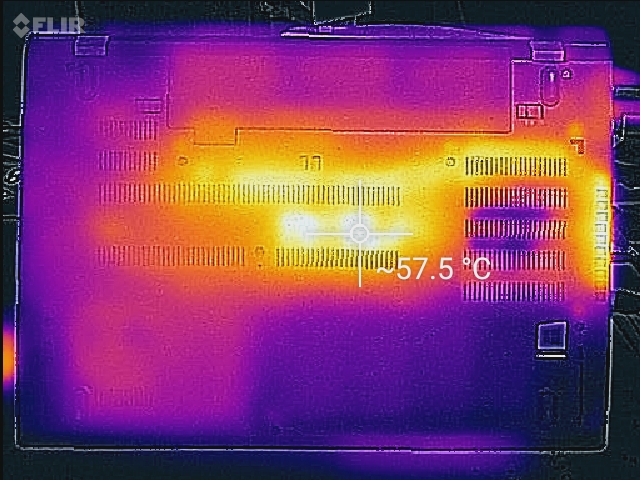
Temperature
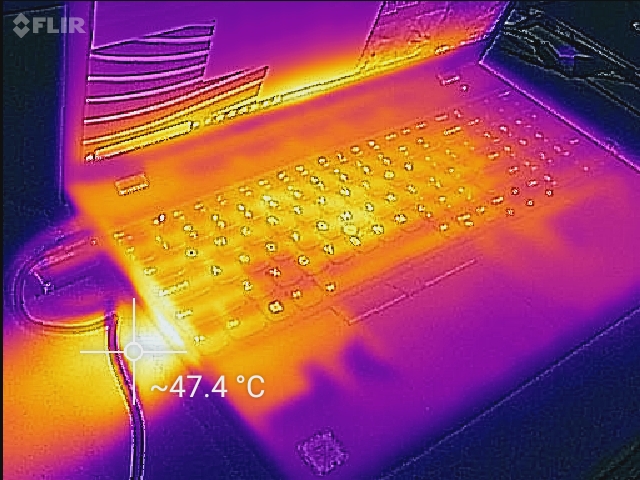
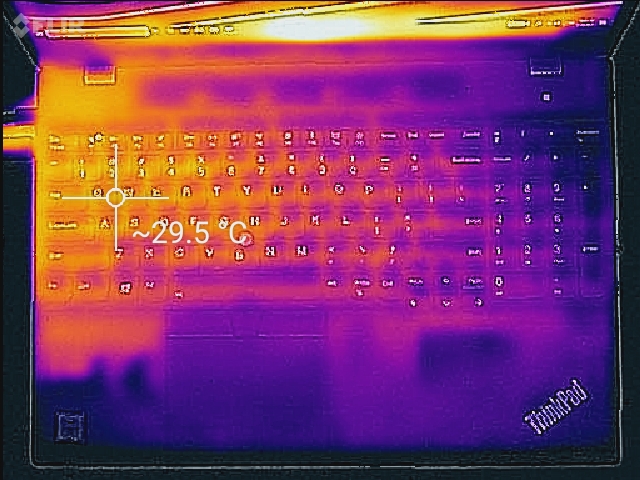
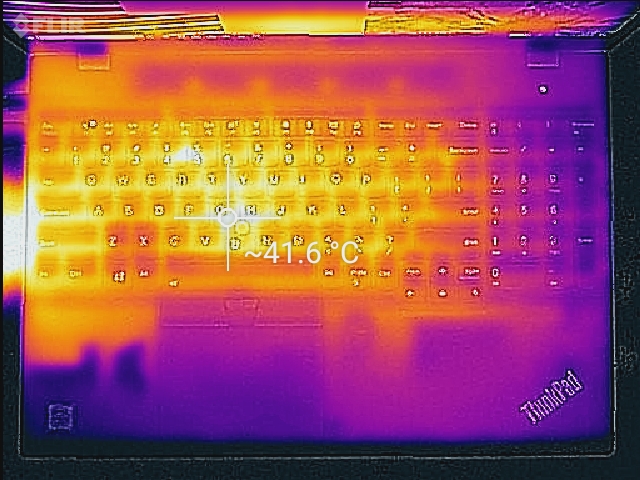
External temperatures present an interesting dichotomy. When idle or during light work, the case remains at or below room temperature, save for the areas on the bottom panel directly covering the cooling array. This path gets mildly warmer than the surrounding temperature but is in no way uncomfortable, making the P52s suitable for users' lap when performing lighter tasks like word processing or light web browsing.
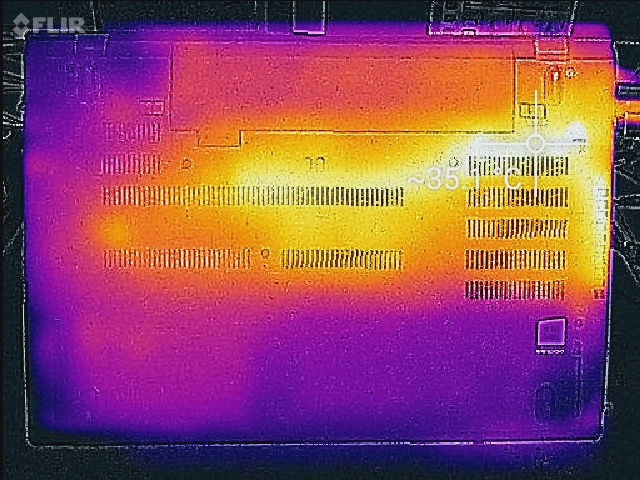
Under load, the chassis gets warm directly over the CPU, GPU, and cooling system. In particular, the center and upper-left of the keyboard feel warm when the CPU and GPU are placed under full load, and the bottom panel becomes uncomfortable. As such, heavy work should be done at a desk. Keep in mind that all heat is exhausted out the middle of the left side; keep this area unobstructed for proper ventilation.
(±) The maximum temperature on the upper side is 41.4 °C / 107 F, compared to the average of 38.2 °C / 101 F, ranging from 22.2 to 69.8 °C for the class Workstation.
(-) The bottom heats up to a maximum of 57 °C / 135 F, compared to the average of 41.1 °C / 106 F
(+) In idle usage, the average temperature for the upper side is 26.6 °C / 80 F, compared to the device average of 32 °C / 90 F.
(+) The palmrests and touchpad are reaching skin temperature as a maximum (34 °C / 93.2 F) and are therefore not hot.
(-) The average temperature of the palmrest area of similar devices was 27.8 °C / 82 F (-6.2 °C / -11.2 F).
Speakers

The speakers are decent enough for the laptop's intended use case. While the sound profile is poorly suited to music and media, highs and mids are clear, and the speakers are well-tuned for conference calling and voice. At maximum volume, there is no chassis rattle and the speakers remain clear. Overall, the speakers are good for business but not so much for pleasure.
Lenovo ThinkPad P52S-20LB001FUS audio analysis
(±) | speaker loudness is average but good (74.3 dB)
Bass 100 - 315 Hz
(-) | nearly no bass - on average 17.7% lower than median
(-) | bass is not linear (15.4% delta to prev. frequency)
Mids 400 - 2000 Hz
(+) | balanced mids - only 2.9% away from median
(+) | mids are linear (5.6% delta to prev. frequency)
Highs 2 - 16 kHz
(+) | balanced highs - only 1.8% away from median
(+) | highs are linear (6.7% delta to prev. frequency)
Overall 100 - 16.000 Hz
(±) | linearity of overall sound is average (17.4% difference to median)
Compared to same class
» 53% of all tested devices in this class were better, 10% similar, 37% worse
» The best had a delta of 7%, average was 17%, worst was 35%
Compared to all devices tested
» 33% of all tested devices were better, 8% similar, 58% worse
» The best had a delta of 4%, average was 23%, worst was 134%
Dell Precision 5520 UHD audio analysis
(±) | speaker loudness is average but good (79.6 dB)
Bass 100 - 315 Hz
(±) | reduced bass - on average 12.8% lower than median
(±) | linearity of bass is average (14.2% delta to prev. frequency)
Mids 400 - 2000 Hz
(+) | balanced mids - only 4% away from median
(±) | linearity of mids is average (9.9% delta to prev. frequency)
Highs 2 - 16 kHz
(+) | balanced highs - only 3.3% away from median
(±) | linearity of highs is average (12% delta to prev. frequency)
Overall 100 - 16.000 Hz
(±) | linearity of overall sound is average (16.7% difference to median)
Compared to same class
» 46% of all tested devices in this class were better, 9% similar, 45% worse
» The best had a delta of 7%, average was 17%, worst was 35%
Compared to all devices tested
» 29% of all tested devices were better, 7% similar, 64% worse
» The best had a delta of 4%, average was 23%, worst was 134%
Energy Management
Power Consumption
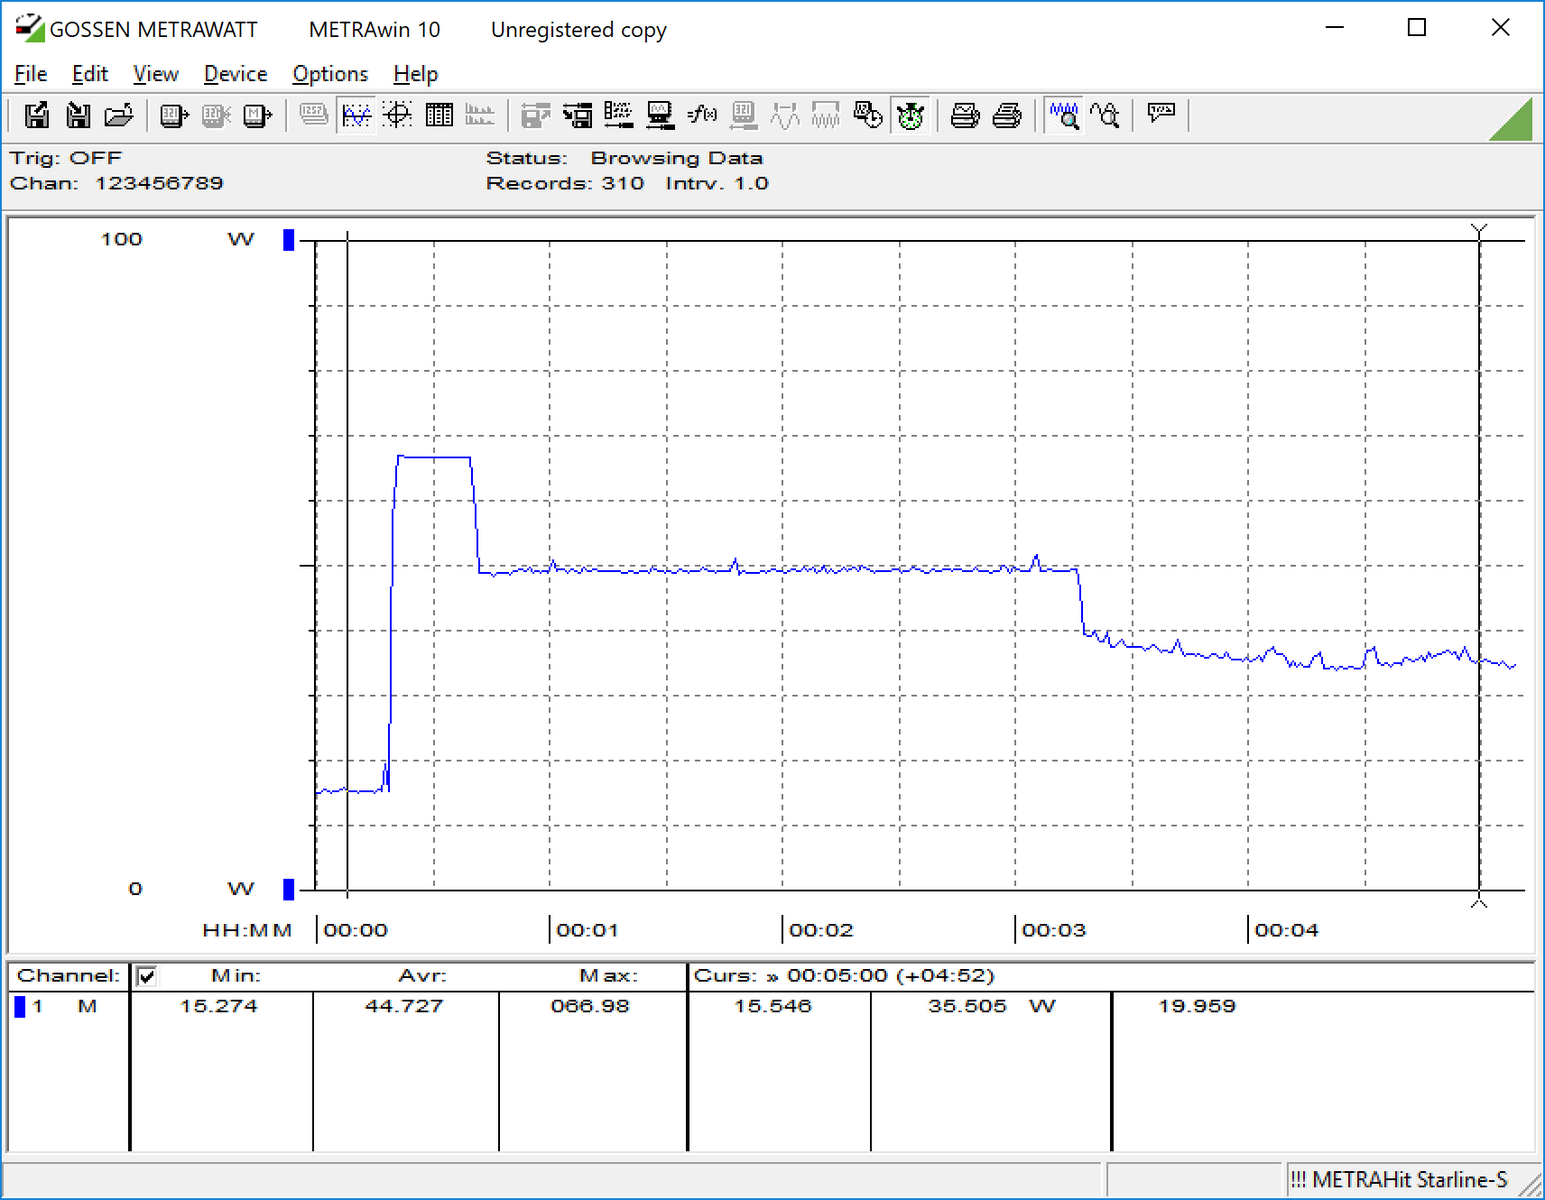
Thanks to its ULV CPU and low-powered GPU, the P52s is relatively energy efficient. While performance is not up to snuff compared to competitors like the more powerful Precision 5520 and MSI WS63VR, power draw is significantly lower; under load, the P52s only pulls 63 Watts from the wall, about half that of the Precision 5520. Compared to the FHD P52s, power draw is about 18% more on average. The P52s is packaged with a 65 Watt power adapter, which may explain some of the performance throttling and inconsistencies we have observed thus far; a more powerful adapter could help performance. The P52s charges via a USB Type-C port on the right side and may benefit from supported higher-wattage adapters.
| Off / Standby | |
| Idle | |
| Load |
|
Key:
min: | |
| Lenovo ThinkPad P52S-20LB001FUS i7-8650U, Quadro P500, Samsung SSD PM981 MZVLB1T0HALR, IPS, 3840x2160, 15.6" | Lenovo ThinkPad P52s-20LB000HGE i5-8550U, Quadro P500, Samsung PM961 MZVLW256HEHP, IPS LED, 1920x1080, 15.6" | Lenovo ThinkPad P51s 20HB000SGE i7-7600U, Quadro M520, Samsung SSD PM961 1TB M.2 PCIe 3.0 x4 NVMe (MZVLW1T0), IPS, 3840x2160, 15.6" | HP ZBook 15u G5 2ZC05EA i5-8550U, Radeon Pro WX 3100, Toshiba XG5 KXG50ZNV256G, IPS LED, 1920x1080, 15.6" | Dell Precision 3520 i7-7820HQ, Quadro M620, Toshiba XG4 NVMe (THNSN5512GPUK), IPS LED, 1920x1080, 15.6" | Dell Precision 5520 UHD E3-1505M v6, Quadro M1200, Samsung SM961 MZVKW512HMJP m.2 PCI-e, IPS, 3840x2160, 15.6" | MSI WS63VR 7RL-023US i7-7700HQ, Quadro P4000 Max-Q, Toshiba NVMe THNSN5512GPU7, IPS, 3840x2160, 15.6" | |
|---|---|---|---|---|---|---|---|
| Power Consumption | 22% | 2% | 20% | -17% | -54% | -69% | |
| Idle Minimum * (Watt) | 5.9 | 4.1 31% | 5.8 2% | 3.2 46% | 5.8 2% | 8.9 -51% | 13.3 -125% |
| Idle Average * (Watt) | 11.7 | 7.7 34% | 10.4 11% | 6.1 48% | 10.7 9% | 13.6 -16% | 17.2 -47% |
| Idle Maximum * (Watt) | 15.6 | 10.7 31% | 13.5 13% | 9.7 38% | 13.3 15% | 14.1 10% | 17.9 -15% |
| Load Average * (Watt) | 63 | 52 17% | 62.4 1% | 62 2% | 78.2 -24% | 100.3 -59% | 83.7 -33% |
| Witcher 3 ultra * (Watt) | 48.4 | 38.8 20% | 48 1% | 58.8 -21% | 100.2 -107% | 101.9 -111% | |
| Load Maximum * (Watt) | 63.1 | 65 -3% | 73.1 -16% | 71 -13% | 116 -84% | 126.3 -100% | 114.3 -81% |
* ... smaller is better
Battery Life
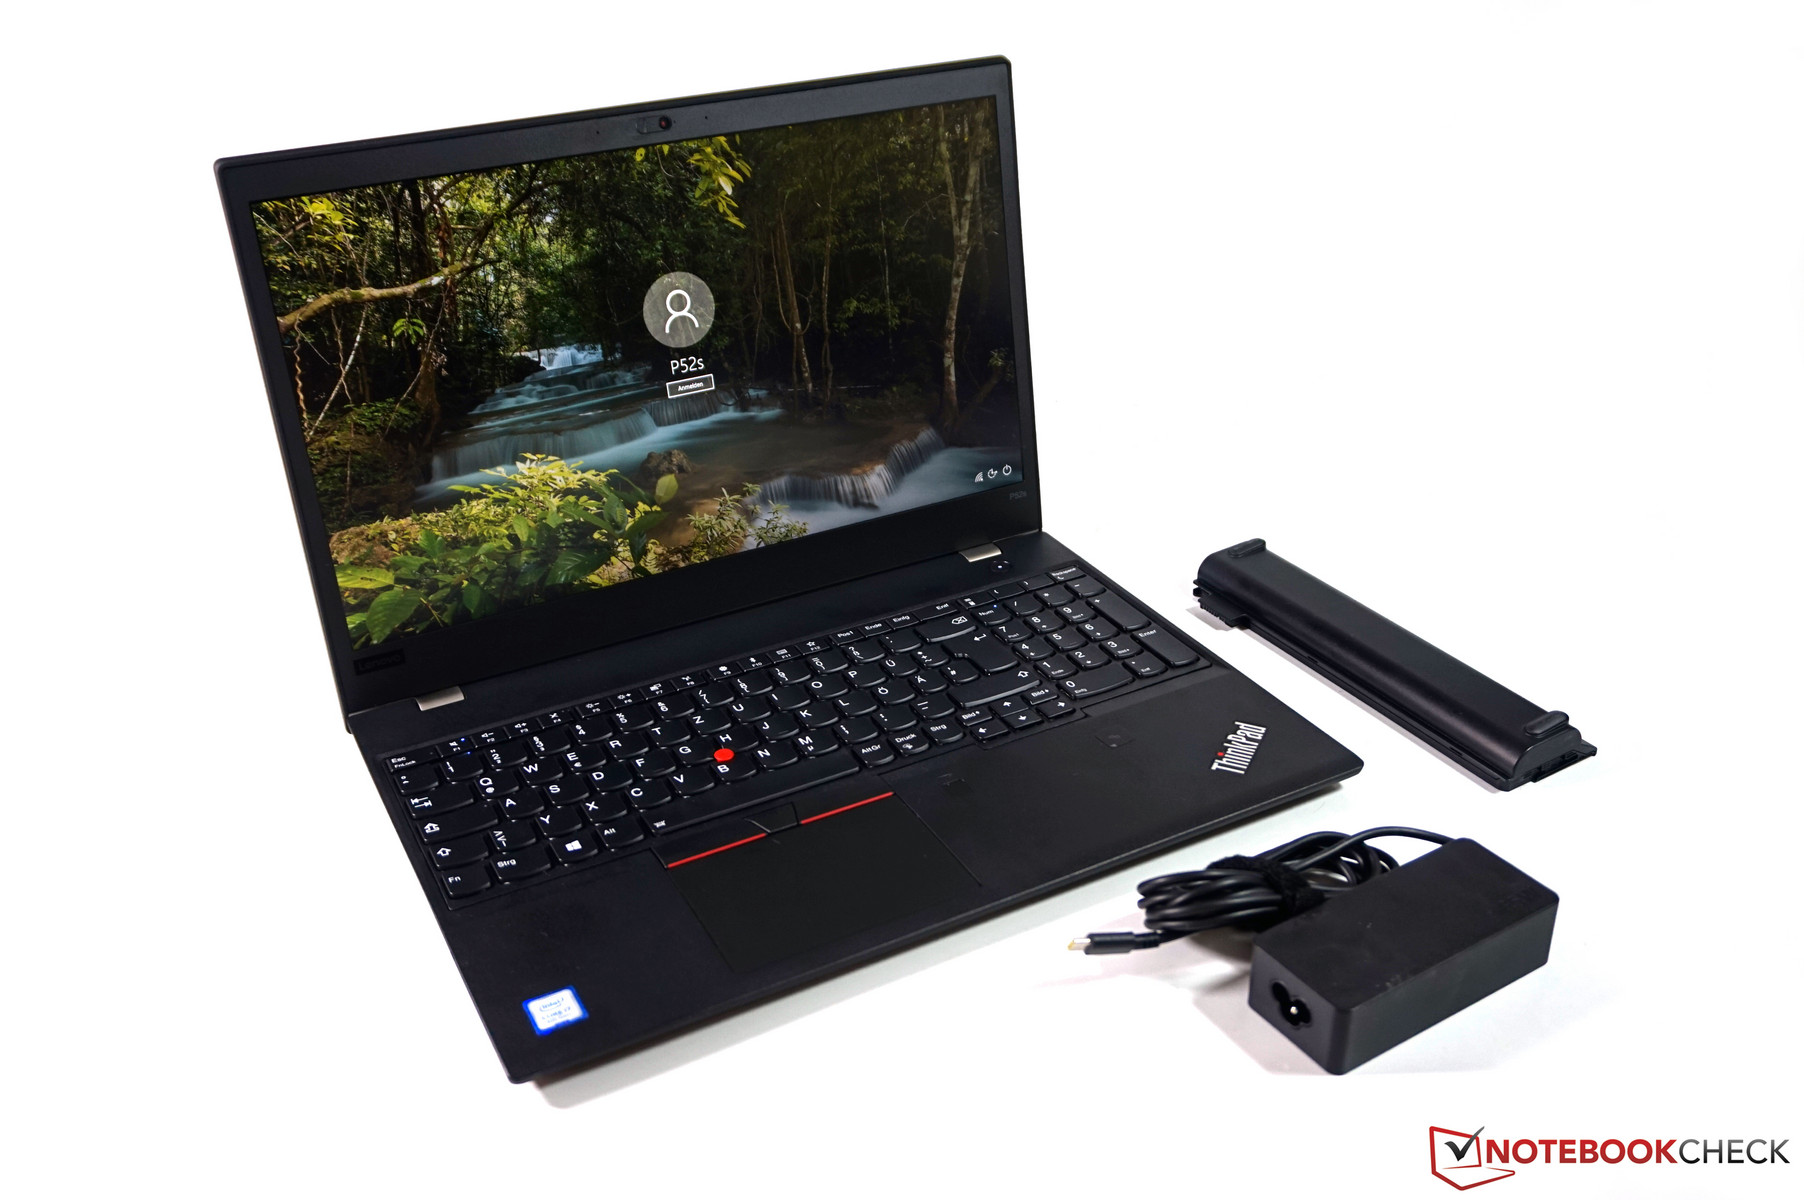
In typical ThinkPad fashion, there are several battery options available to consumers. In addition to the integrated 32 Wh front battery, our review unit was packaged with a single 3-cell 24 Wh "flat" and two 6-cell 48 Wh rear batteries. Lenovo also offers a 6-cell 72 Wh cylindrical rear battery. All the rear batteries are hot-swappable thanks to Lenovo's Power Bridge technology; this can theoretically extend battery life indefinitely.
In practice, the 48 Wh rear battery (80 Wh total) grants some impressive runtimes. In our Wifi v1.3 battery test, the P52s lasted just over 11 hours, which is a far cry better than the more powerful competitors from Dell (Precision 3520 and Precision 5520) and the MSI WS63VR. With the default 24 Wh rear battery, the P52s powered off after 6 hours 41 minutes in the same test. Road warriors in need of an all-day battery should consider the 72 Wh option as it lasted over 16 hours in our WiFi test.
| Lenovo ThinkPad P52S-20LB001FUS i7-8650U, Quadro P500, 80 Wh | Lenovo ThinkPad P52s-20LB000HGE i5-8550U, Quadro P500, 104 Wh | Lenovo ThinkPad P51s 20HB000SGE i7-7600U, Quadro M520, 104 Wh | HP ZBook 15u G5 2ZC05EA i5-8550U, Radeon Pro WX 3100, 56 Wh | Dell Precision 3520 i7-7820HQ, Quadro M620, 68 Wh | Dell Precision 5520 UHD E3-1505M v6, Quadro M1200, 97 Wh | MSI WS63VR 7RL-023US i7-7700HQ, Quadro P4000 Max-Q, 48 Wh | |
|---|---|---|---|---|---|---|---|
| Battery runtime | 76% | 62% | 14% | -27% | -50% | -71% | |
| Reader / Idle (h) | 17.2 | 39.3 128% | 26.4 53% | 21.7 26% | 16.6 -3% | 12.1 -30% | 3.9 -77% |
| WiFi v1.3 (h) | 11.1 | 16.2 46% | 11.9 7% | 8.6 -23% | 7.6 -32% | 4.2 -62% | 2.9 -74% |
| Load (h) | 2.4 | 3.7 54% | 5.4 125% | 3.3 38% | 1.3 -46% | 1 -58% | 0.9 -62% |
Pros
Cons
Verdict
The Lenovo P52s sits in a peculiar spot. Lenovo's attempt at marrying energy-efficient components with a workstation-class device is a story of compromises. While the goal of a ULV-powered workstation is closer than ever thanks to Intel's Kaby Lake R series of CPUs, there is still plenty of room for improvement.
The weakest point lies in graphical power. Considering the P52s is posited as a portable workstation, the poor graphics performance is disheartening. Most professionals would do better to purchase an office-grade laptop with an Nvidia MX150 or GTX 1050 as these would offer better graphical performance without much sacrifice to energy efficiency or battery life. Compared to other thin-and-light workstations, the P52s lacks power but makes up for this shortcoming with far superior battery life.
What about this particular variant? Is the 4K display worth the extra cost? Considering the weak Quadro P500, the upgrade is not worth it. Most applications will be forced to run at Full HD due to the lack of graphical horsepower anyway, negating the benefit of a higher resolution panel. In addition, some applications experience glitches or rendering problems at the screen's native 4K resolution.
All said, the 4K variant of the P52s maintains the same disappointments from the Full HD model. Worse, some of the complaints we had about that machine are magnified here due to the weak GPU, buggy drivers, and overall weak workstation performance.
Those in need of a compact workstation should look to Dell or MSI for their offerings. Everyone else should stomach the slight increase in thickness and purchase a full-fledged workstation like the ThinkPad P51.
Lenovo ThinkPad P52S-20LB001FUS
- 07/07/2018 v6 (old)
Sam Medley
Price comparison
