Dell Precision 5520 (E3-1505M, UHD) Workstation Review
Dell's Precision workstations have long been represented the pinnacle of performance and reliability in professional applications. But up until just recently, the term workstation was synonymous with hulking, cumbersome devices which were built purely for performance without any regard to style or portability and luxury. In step with the trends of the rest of the business market, that all began to change a few years ago with the M3800, which melded consumer-grade amenities and case design with the power of a mobile workstation.
Then, a little over a year ago, we reviewed Dell’s Precision 5510: a professional-grade version of their already wildly popular XPS 15. Like the XPS, the Precision’s goal would be to maintain strong performance in spite of its extremely slim case and attractive form factor. While the XPS appealed to the tech enthusiast and gamer crowd, the Precision (like always) was meant for professional and engineering purposes. And so the biggest differences between the two would be the CPU and GPU selection: XPS users received Intel Core i5/i7 and NVIDIA GeForce options, whereas Precision users were given additional choices of Xeon CPUs and NVIDIA Quadro GPUs on top of the lower-cost consumer-grade options.
Apart from some related software perks, that’s essentially all that separates the XPS from the Precision. And the latest revision to this clever bridging of the consumer and professional segments—the Precision 5520—sees very little change in the way of design or connectivity; most of the upgrades today are a result of chipset refreshes and enhanced components. Our review unit includes an Intel Core Xeon E3-1505M v6 quad-core CPU, an NVIDIA Quadro M1200 GPU, a UHD touchscreen display panel, a 512 GB PCIe SSD, and 32 GB of RAM. Predictably, the price is high: $2,867 as configured. Can the Precision 5520 justify its high cost with an award-winning performance? As usual, our enormous array of tests and scientific measurements will tell the story.
Please Note: As you will read in our full review, we ran into a couple of strange idiosyncrasies with our review unit, one of which relates to display color coverage being measured as lower than quoted, and the other which affected CPU performance as a result of unsustainably high core temperatures during real-world stress testing scenarios. We've reached out to Dell regarding both of these issues and will be sure to update our article if anything changes.
Case
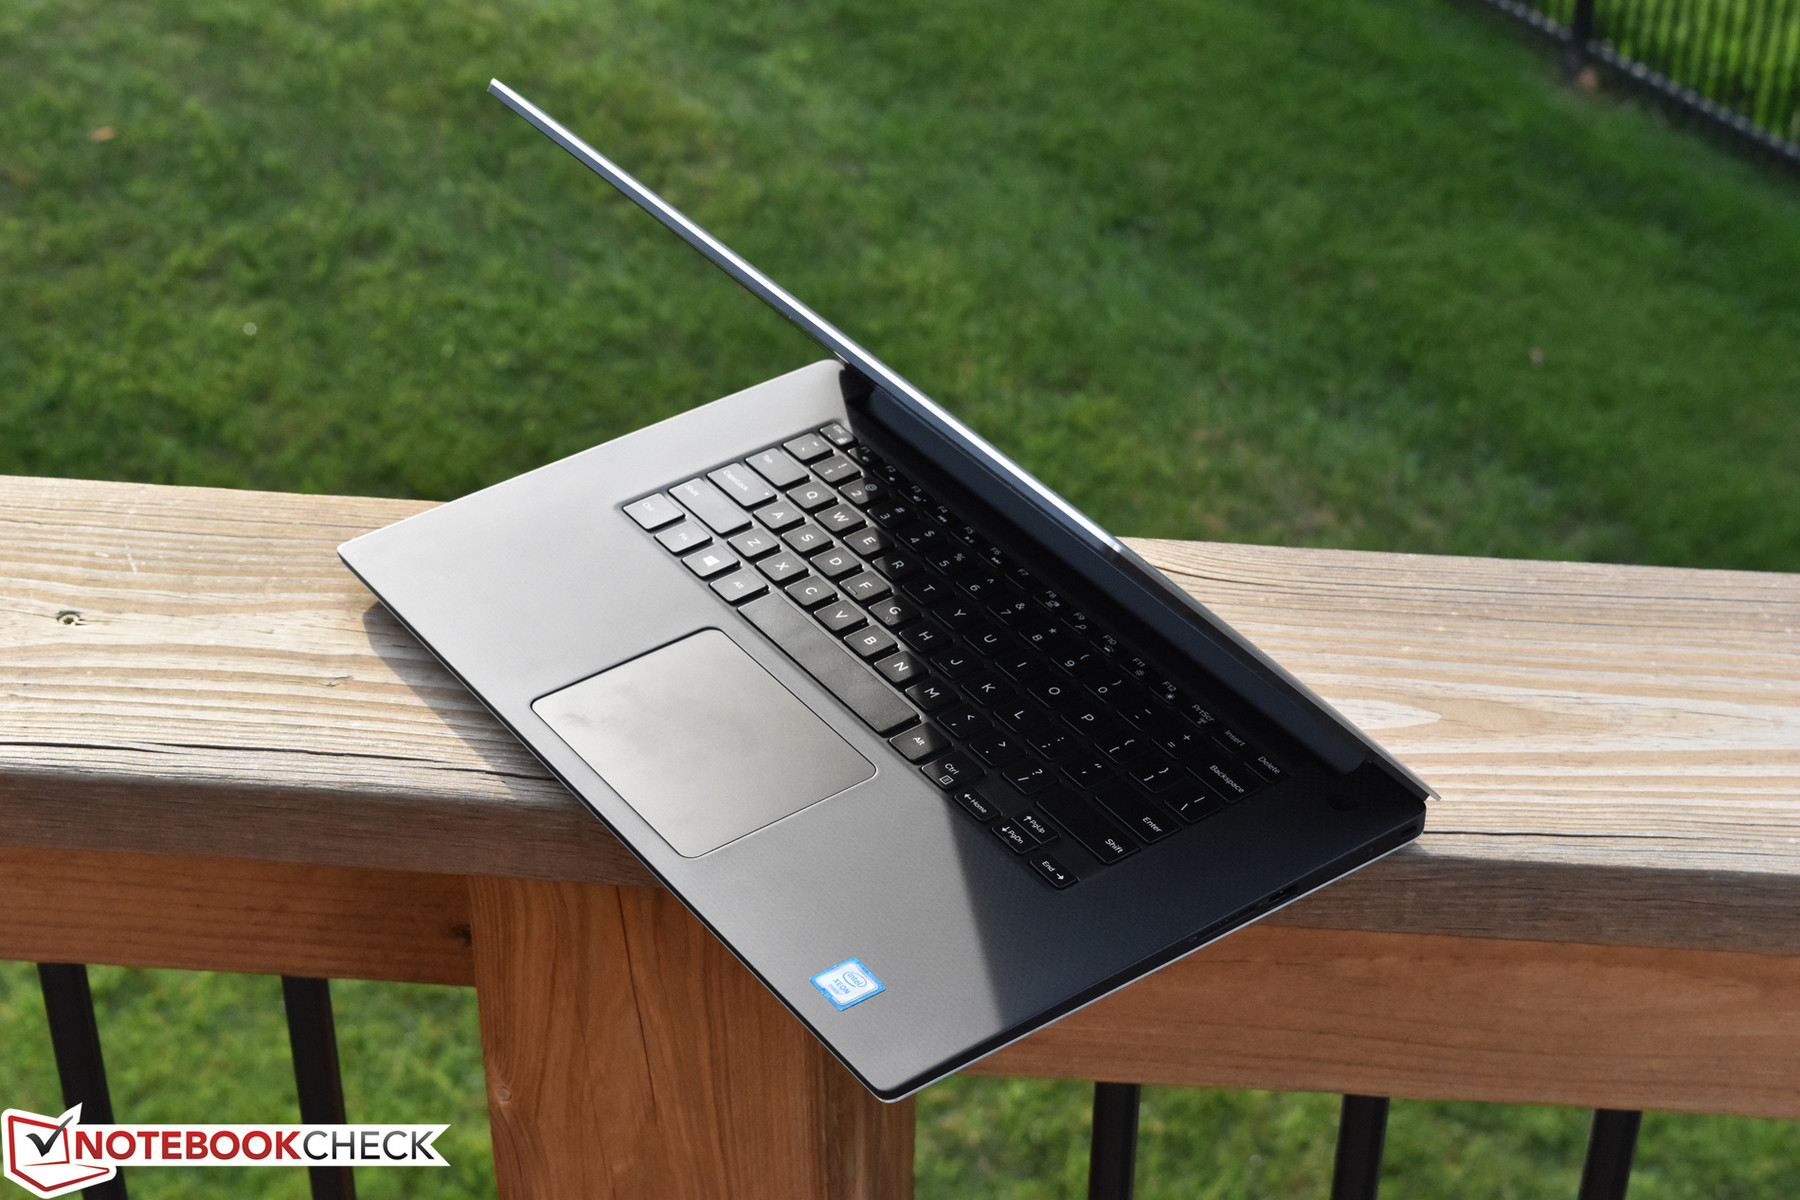
Much like XPS machines in recent years, not much has changed in the basic design of the Precision 5520 since its predecessor. We should emphasize that this isn’t a bad thing, however, as the most recent XPS/Precision 5000 series designs have been widely praised—for not only their portability, but also their construction quality. In terms of the former, the Precision 5520 preserves the ultra-thin bezels of the 5510 (referred to by Dell as the InfinityEdge display) to effectively fit a 15.6-inch display into the body of a typical 14-inch machine. By the same token, the weight is quite a bit lower than any of the competing models in today’s comparison field: at 2.078 kg, it’s over 500 grams lighter than even the ThinkPad P50 Workstation.
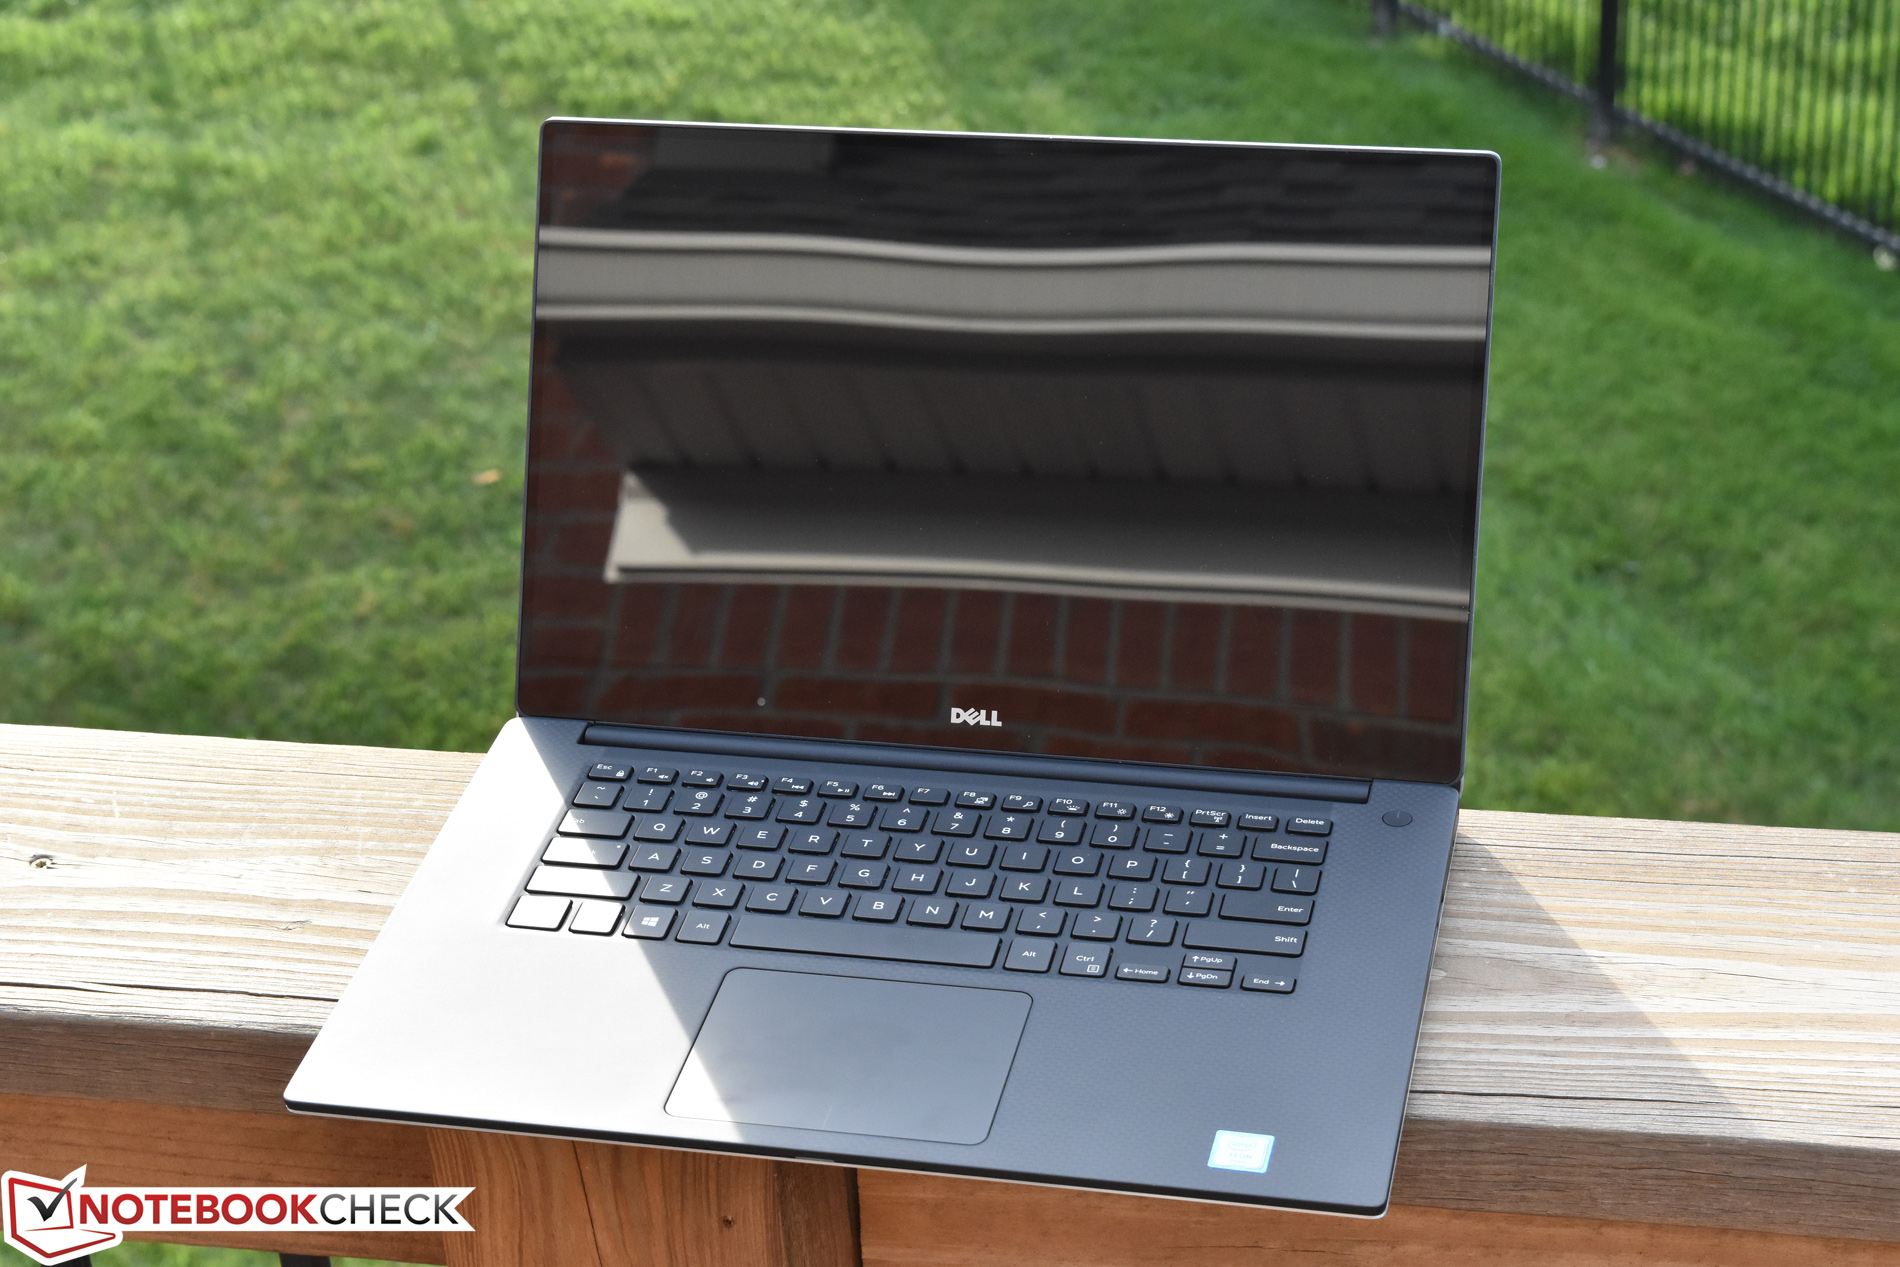
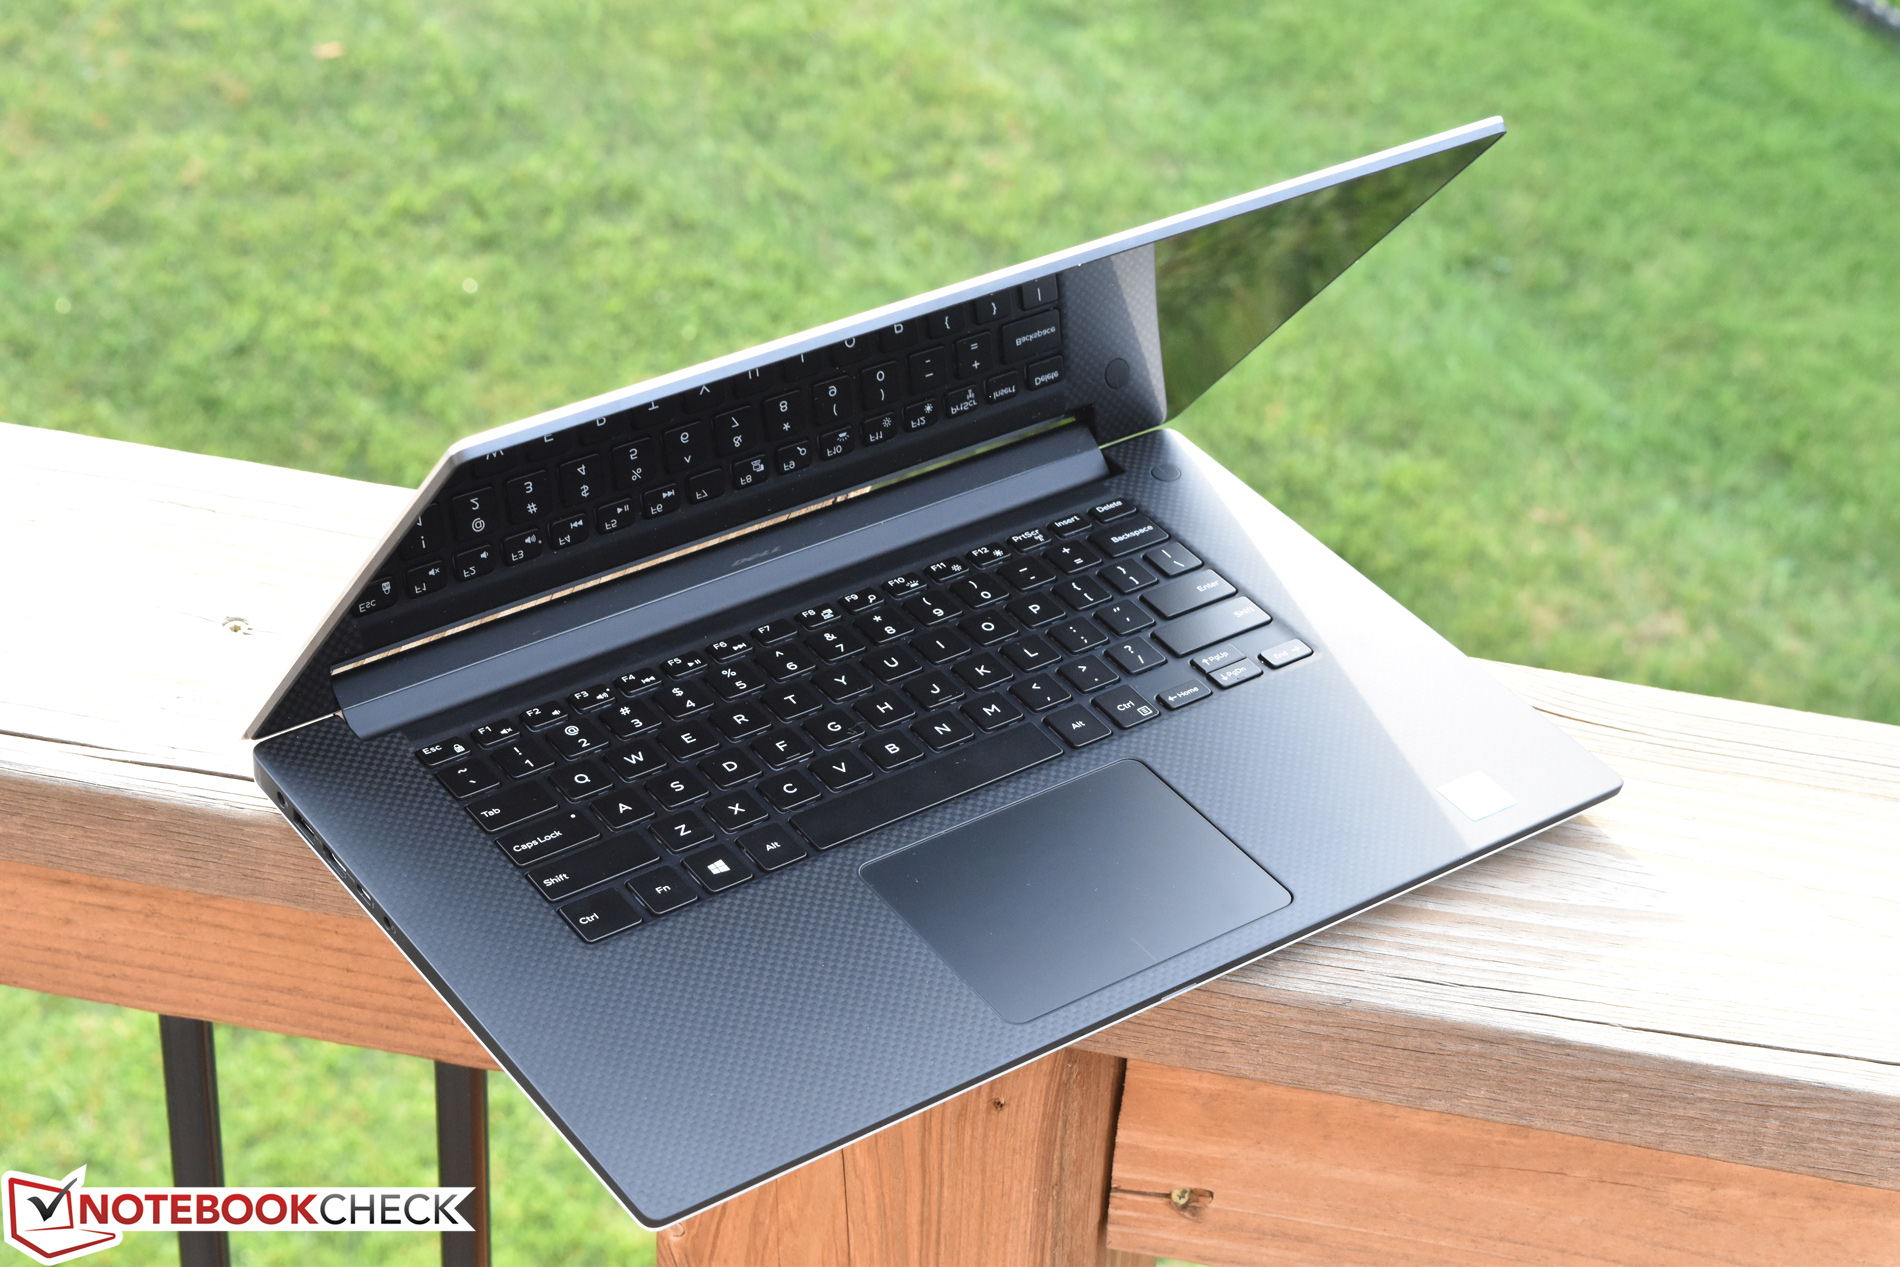
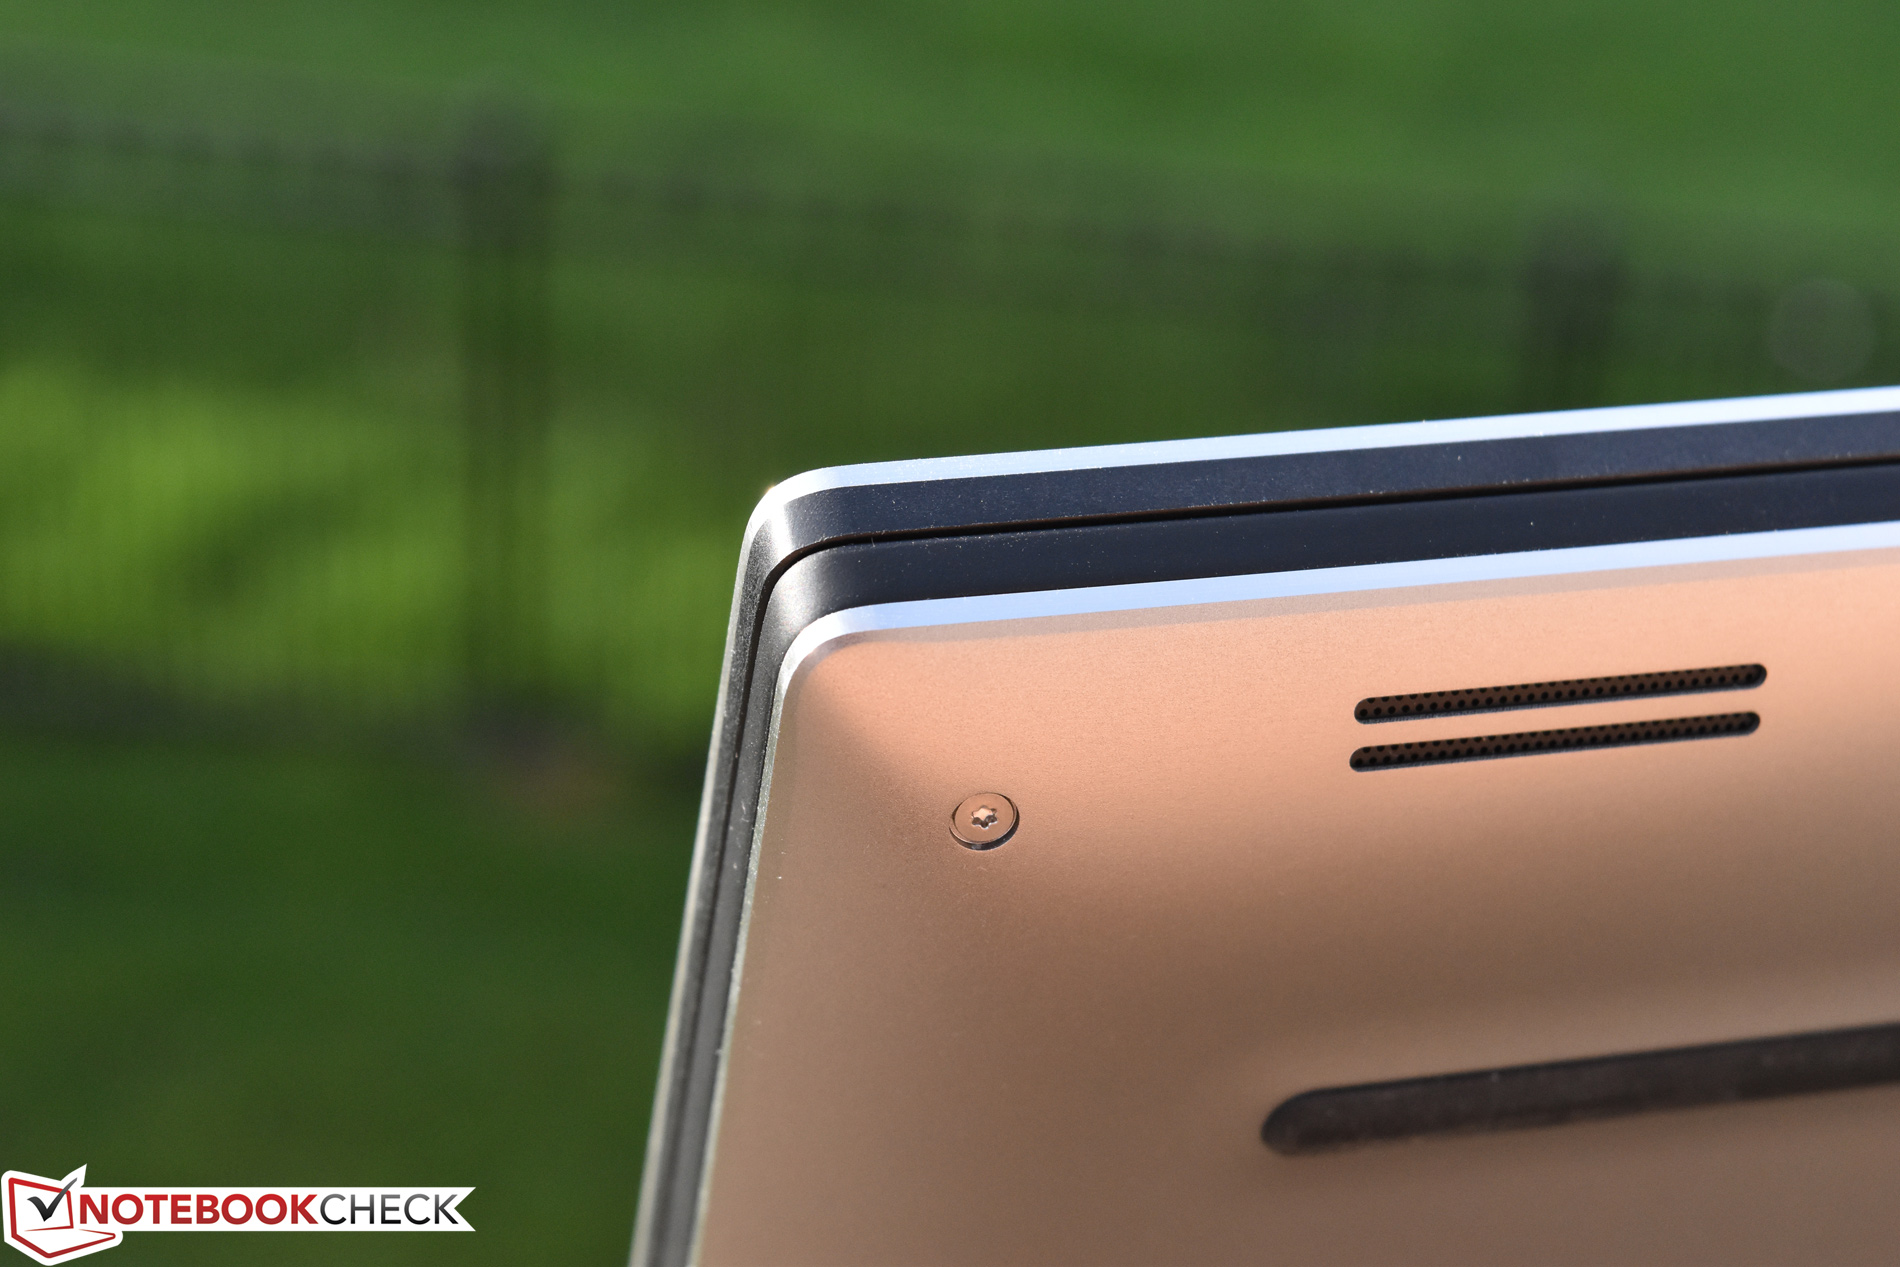
Stability is also excellent thanks to the angled aluminum case design; pressure on the base unit produces hardly any flex, and even the display lid (also aluminum) resists torsion better than expected. It isn’t the most durable build around, but taking into account the size of the machine, it is impressive (Dell points out that the machine has undergone MIL-SPEC testing). Large, horizontal rubber feet (now familiar to any XPS users) line the bottom of the machine and ensure a firm grip on the surface below.
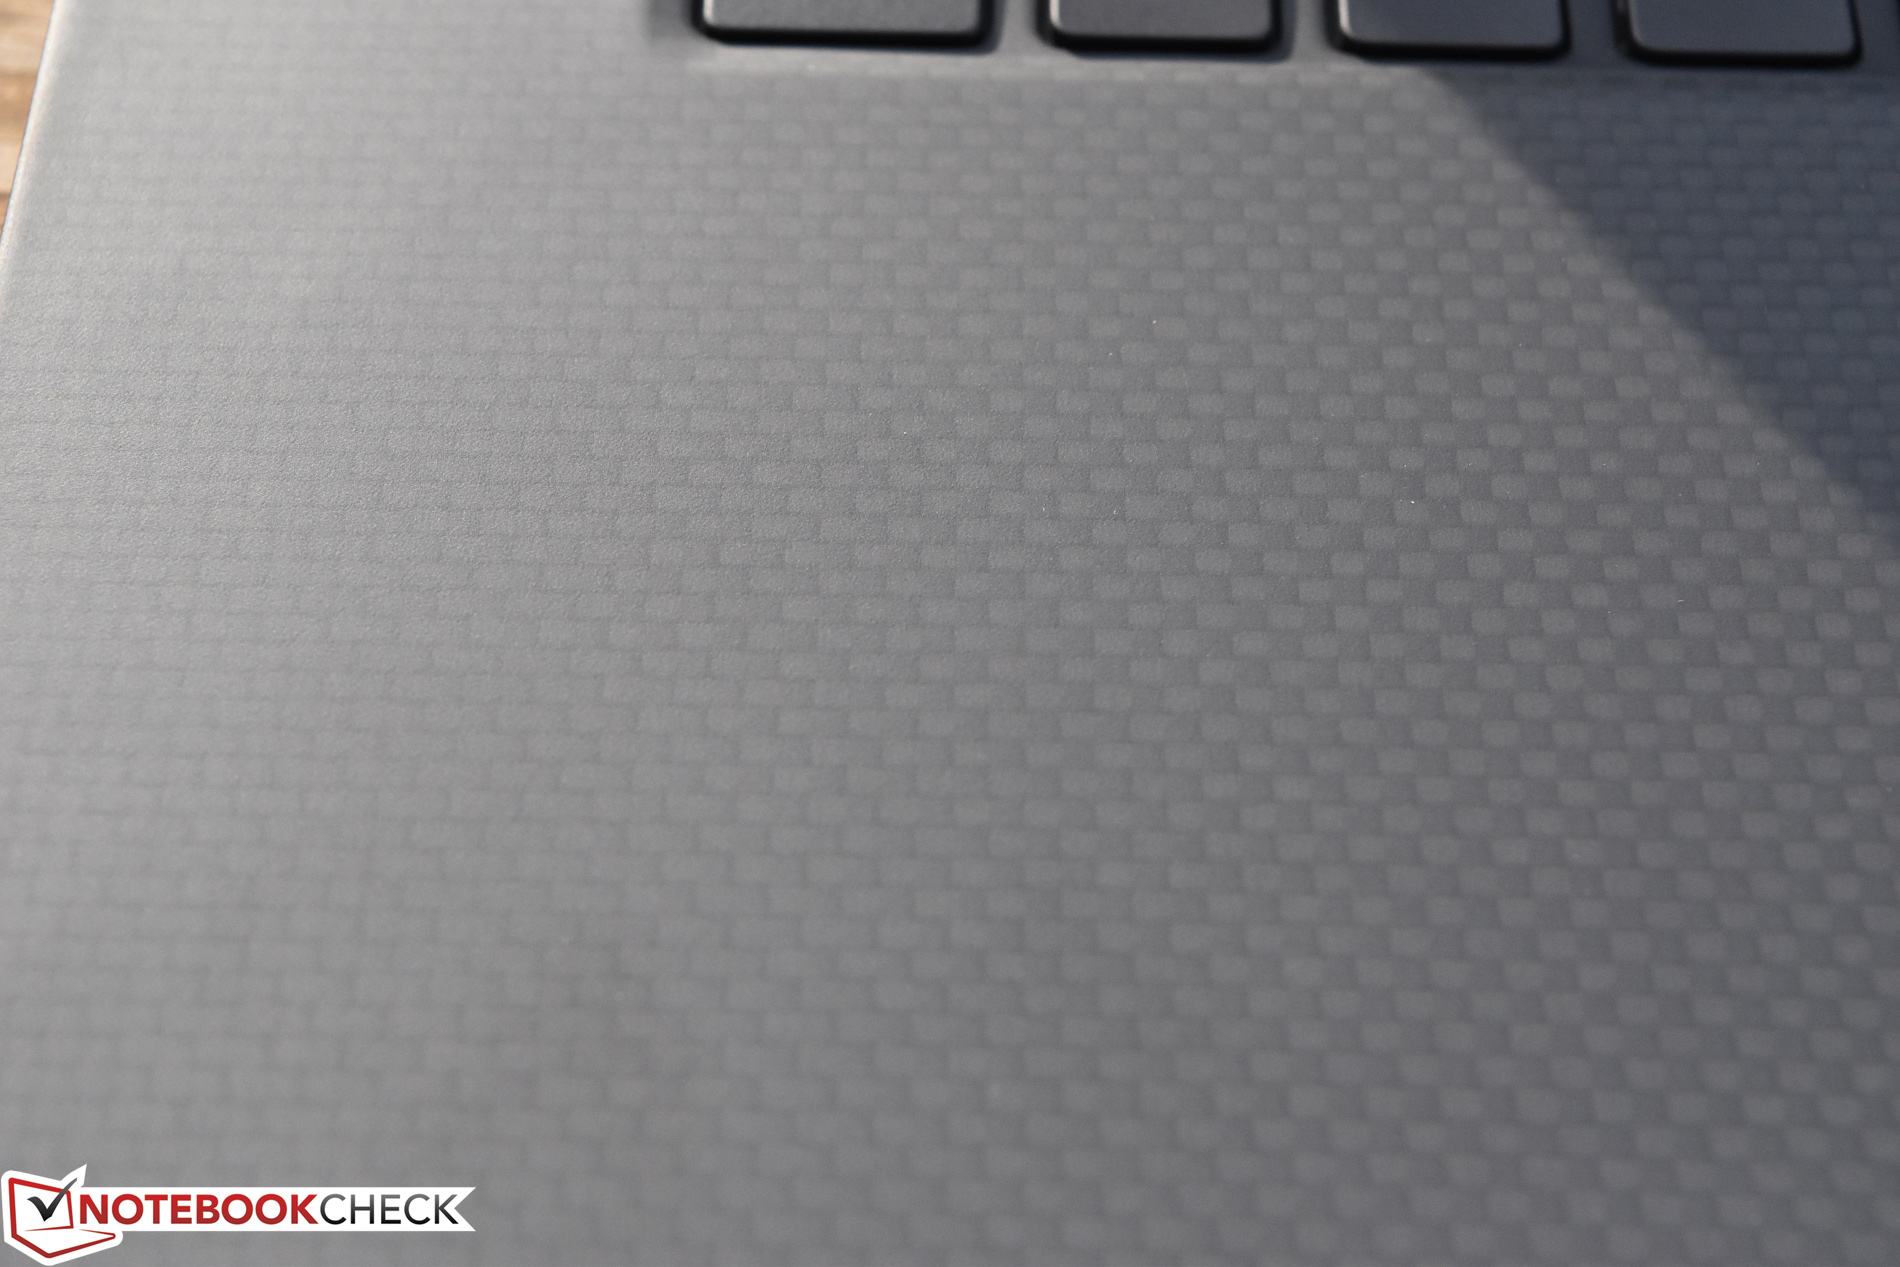
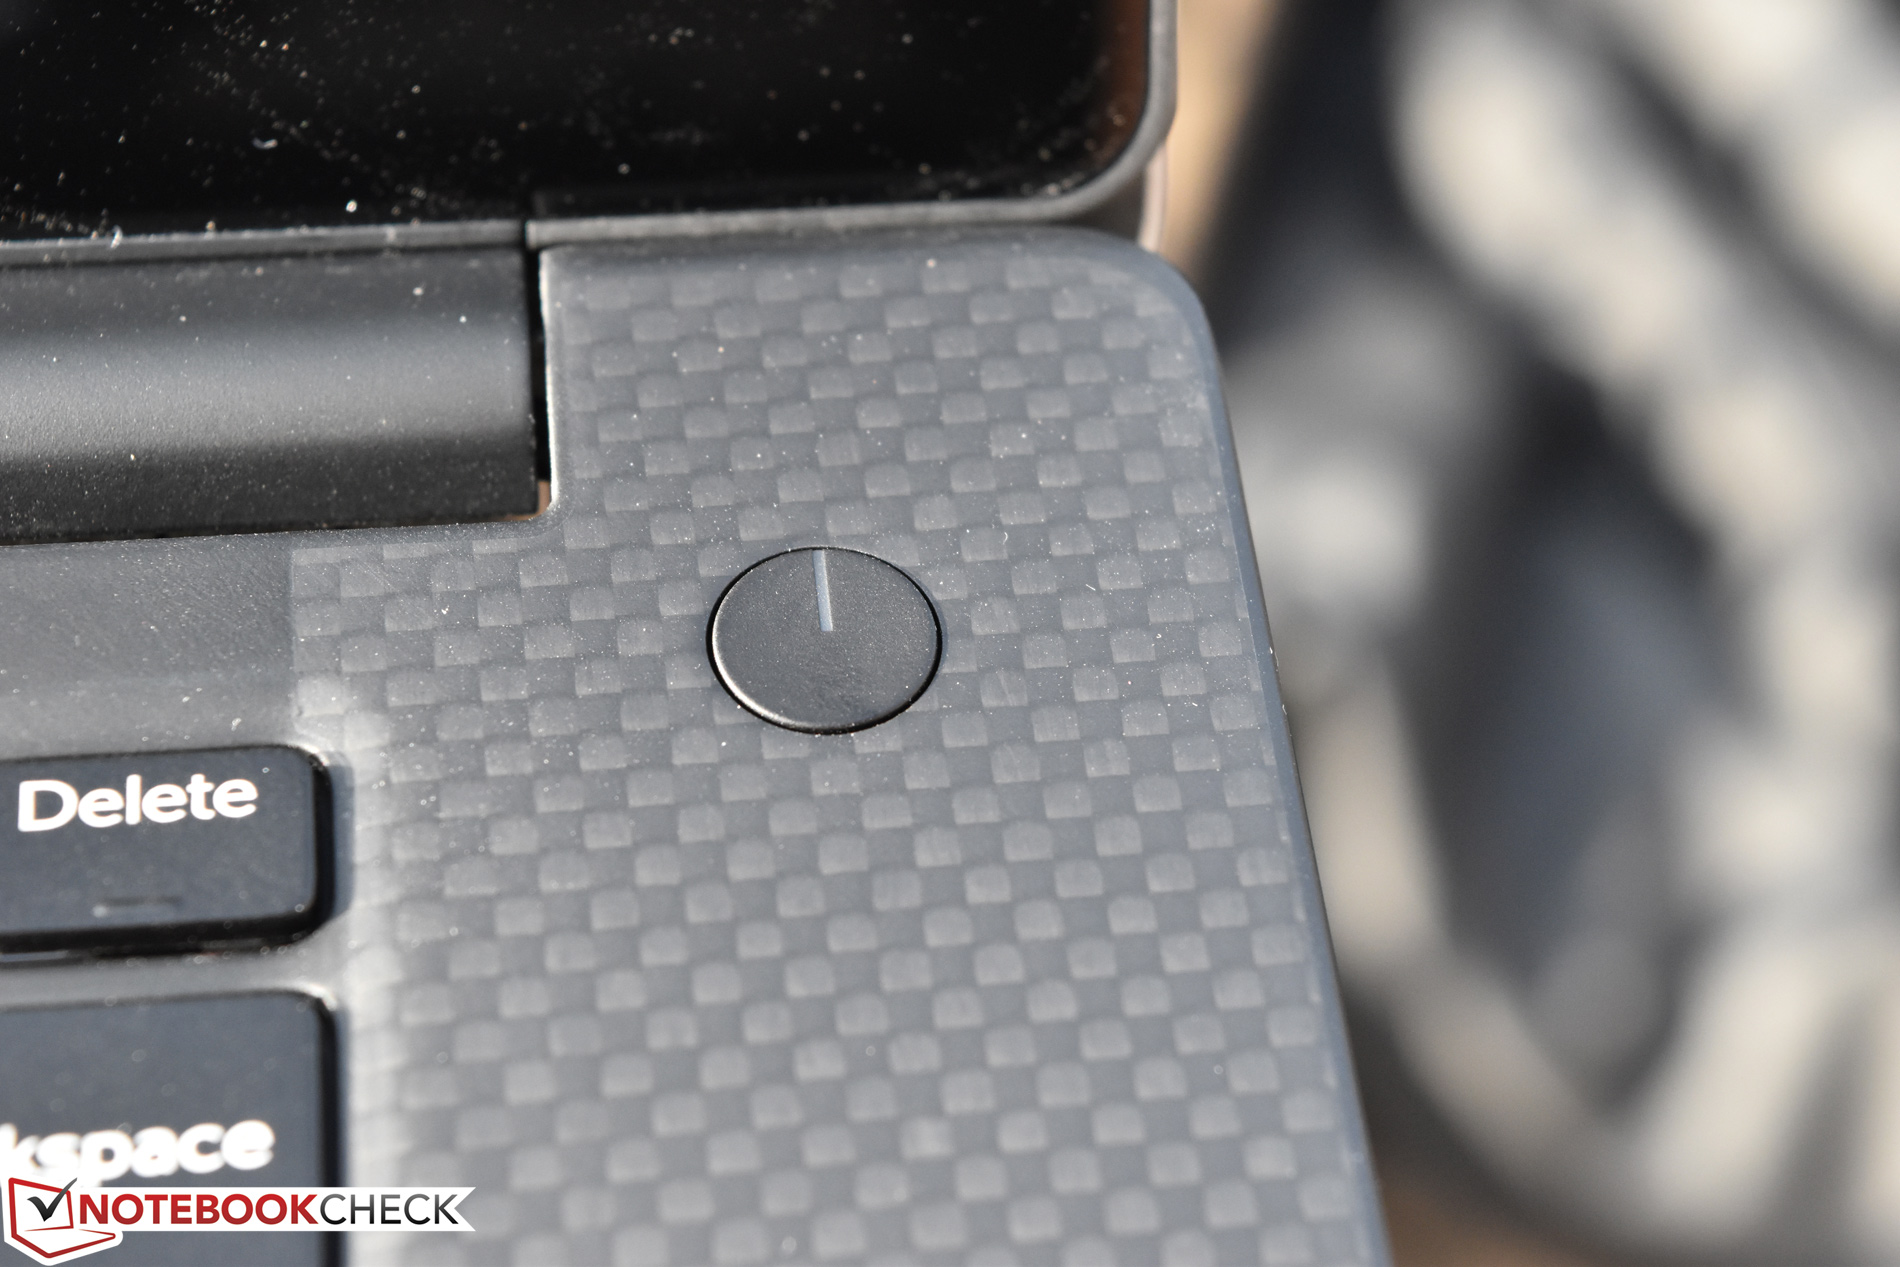
Fingerprints are still a bit of an issue on the carbon fiber-lined palm rests and keyboard surface, but the visible pattern works well to obscure them. The hinges do a fine job of supporting the display, yielding very little in the way of vibrations in the face of motion or heavy typing. As a result, it isn’t possible to open the machine with one hand, however.
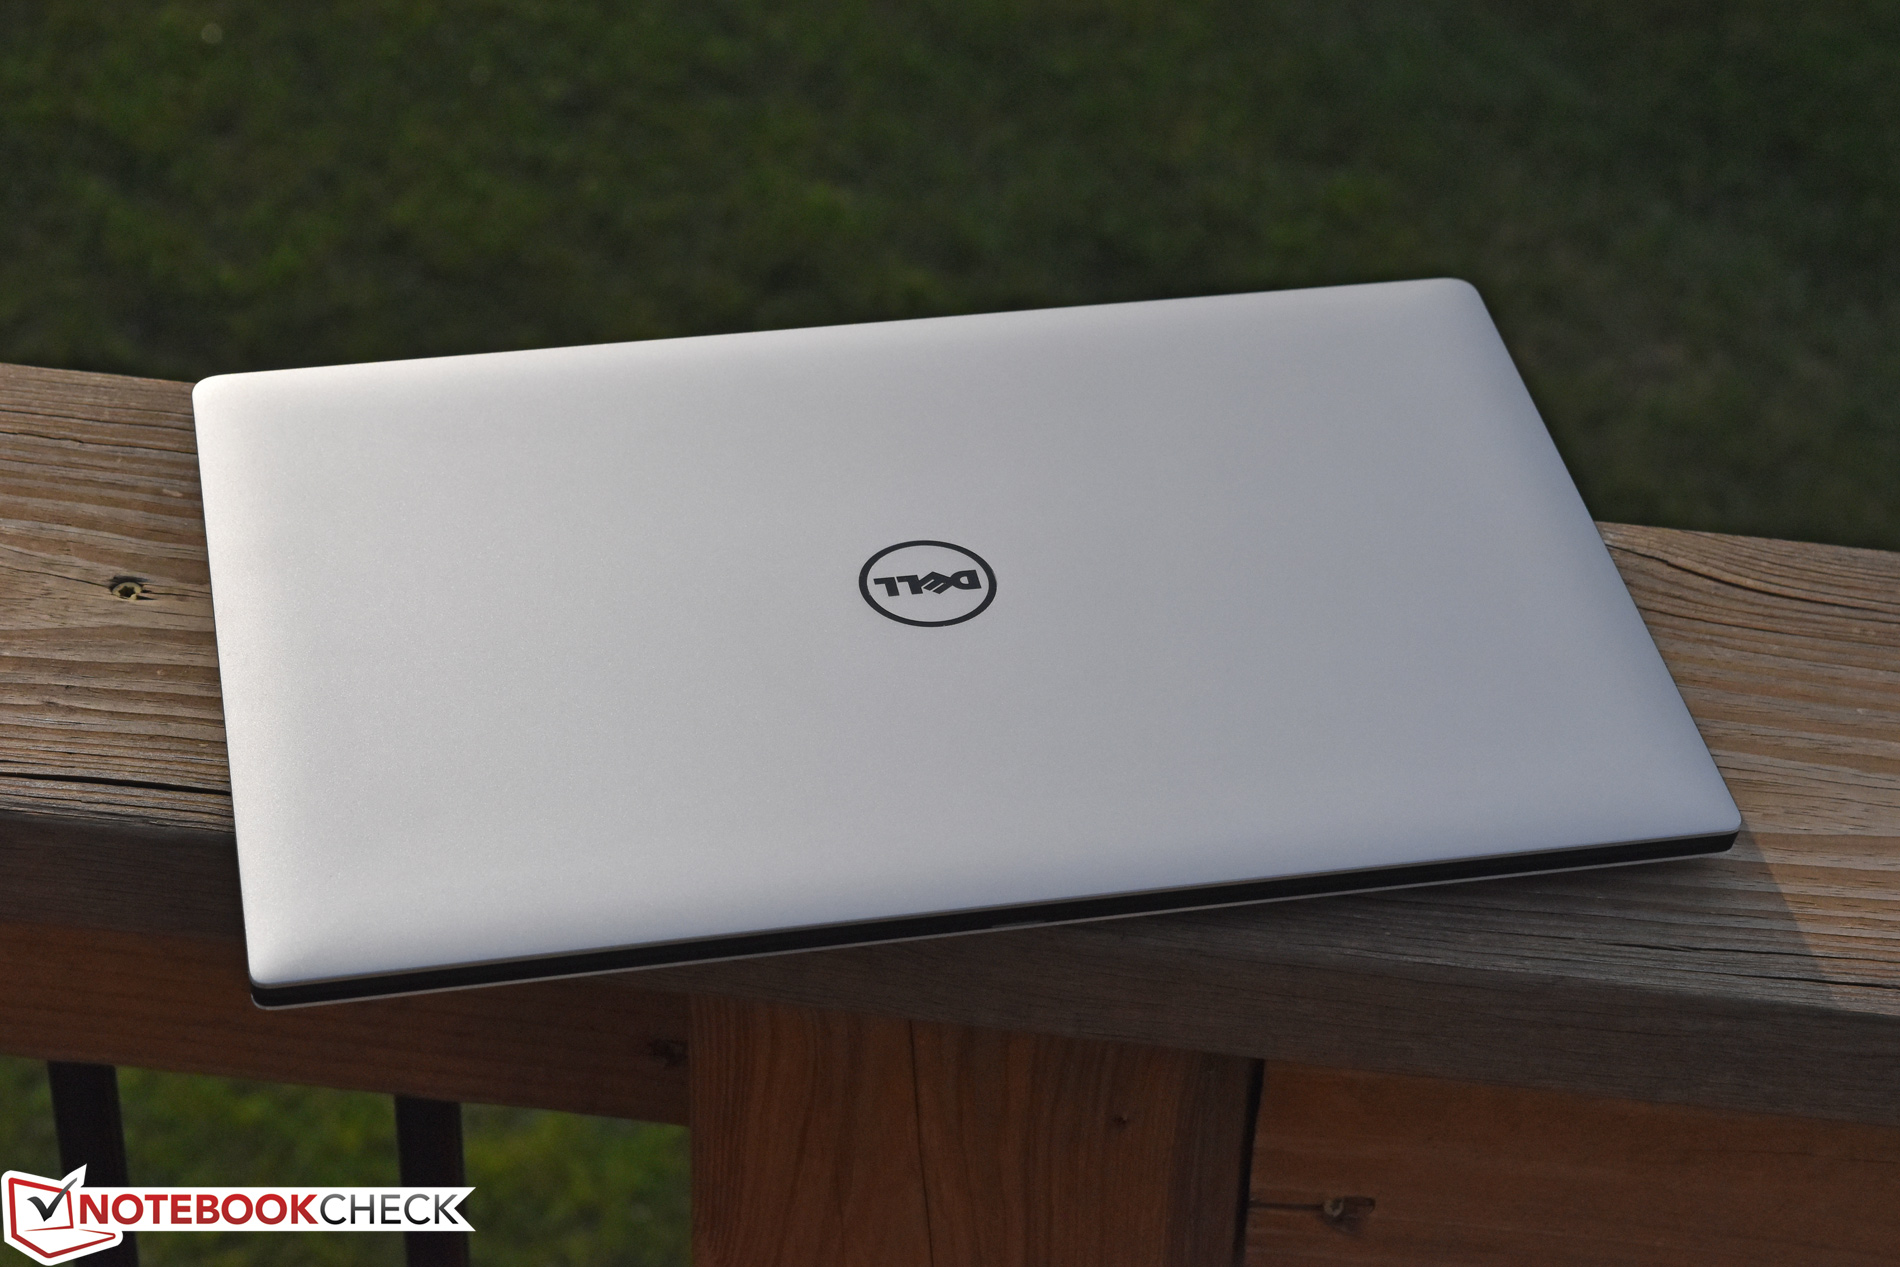
Overall, the Precision 5520 arguably remains the most attractive workstation on the market, and certainly one of the most portable.
Connectivity
Once again, the port selection of the Precision 5520 is essentially identical to that of the 5510. We’re supplied with two USB 3.0 ports alongside a single Thunderbolt 3 port (USB 3.1 Type-C Gen 2), as well as one additional option for video output (HDMI). This is perhaps a bit thin in the workstation realm, but again, this is a thin machine! It should be pointed out that at least the ports are well-spaced to the point where even larger connectors are welcomed alongside adjacent cables and devices.


SD Card Reader
The SD card reader performance surprised us with extremely fast transfer rates exceeding those of any of the other machines in our comparison field. Its sister model, the Dell XPS 15 9560, provided comparably speedy results.
The card reader only accepts around two-thirds of an SD card; the rest of the card protrudes from the port while in use, so leaving a card inserted permanently is not a sustainable strategy.
| SD Card Reader | |
| average JPG Copy Test (av. of 3 runs) | |
| Dell Precision 5520 UHD | |
| Dell Precision 3510 | |
| Dell Precision 7510 (4K IGZO) | |
| Lenovo ThinkPad P50 | |
| Fujitsu Celsius H760 | |
| maximum AS SSD Seq Read Test (1GB) | |
| Dell Precision 5520 UHD | |
| Dell Precision 3510 | |
| Lenovo ThinkPad P50 | |
| Fujitsu Celsius H760 | |
Communication
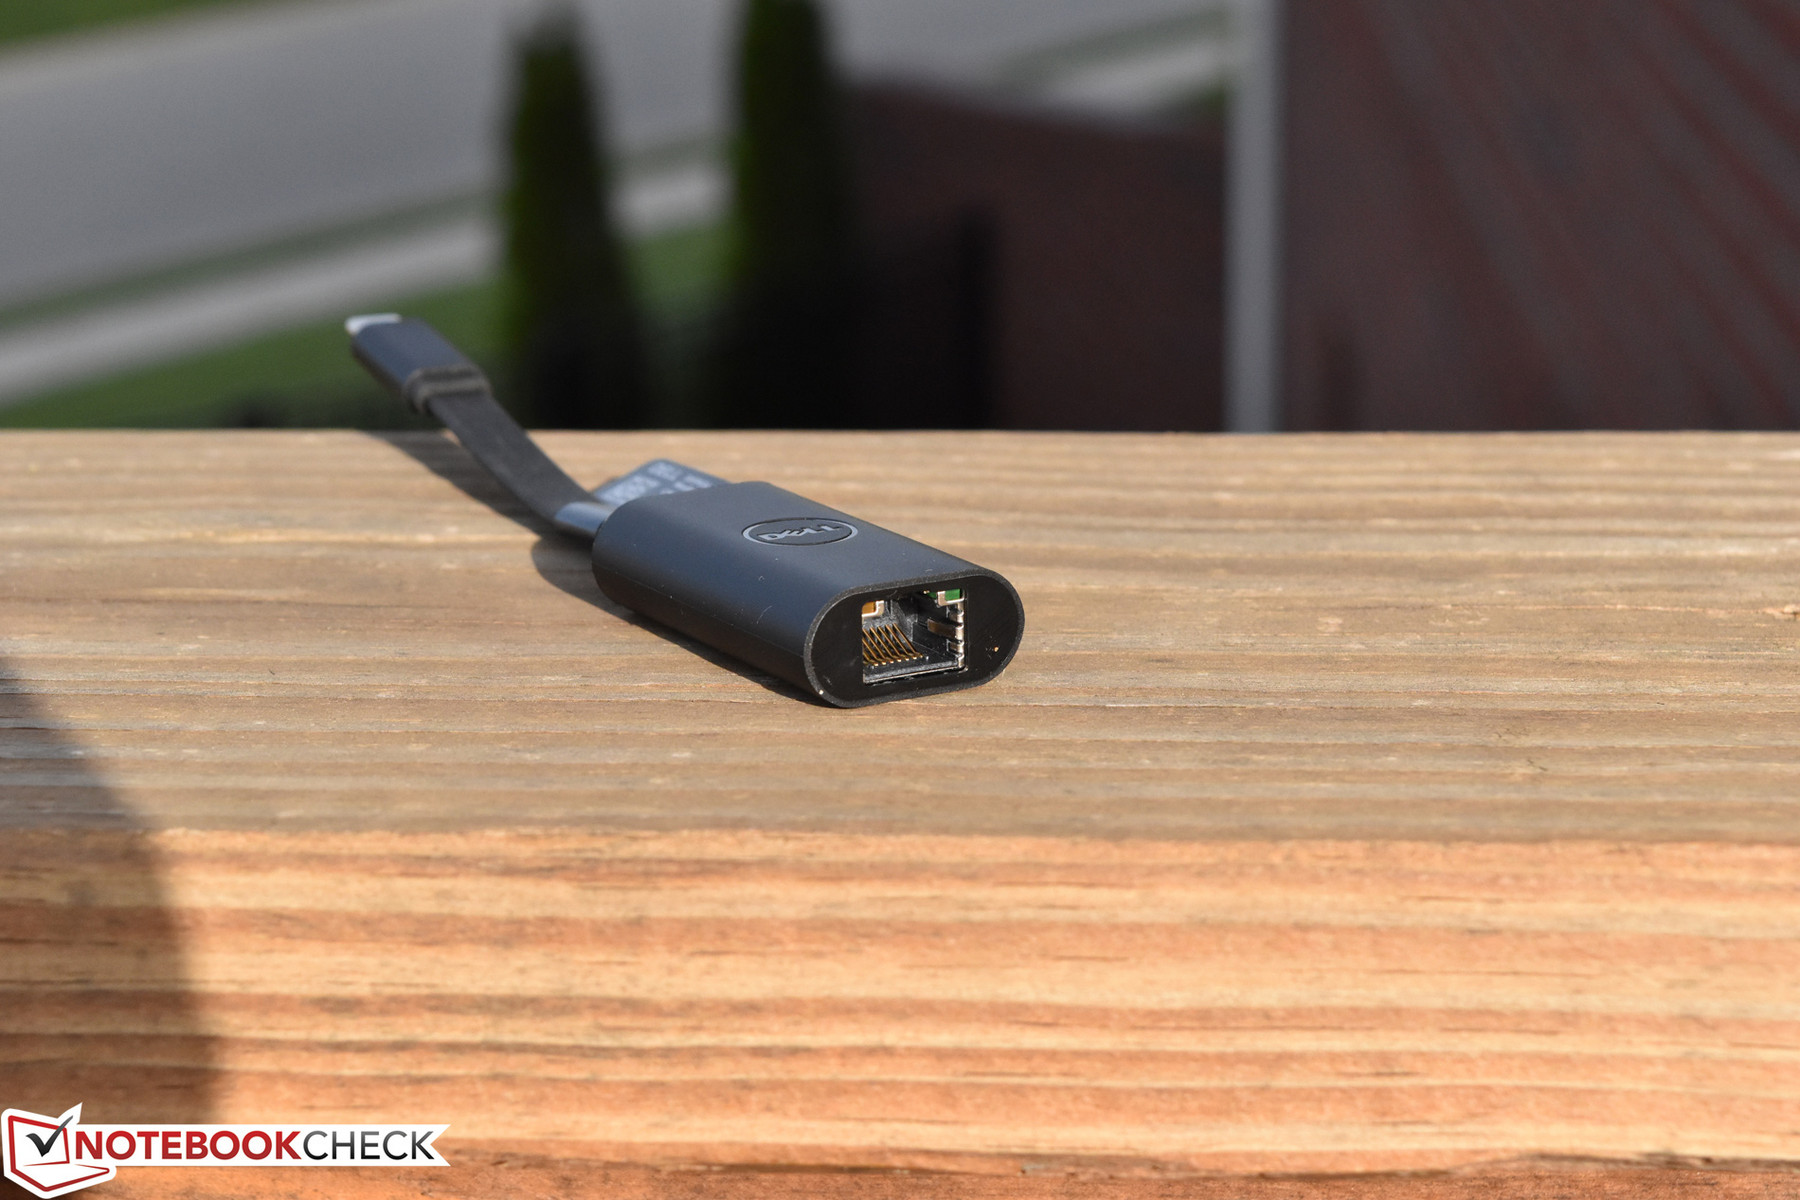
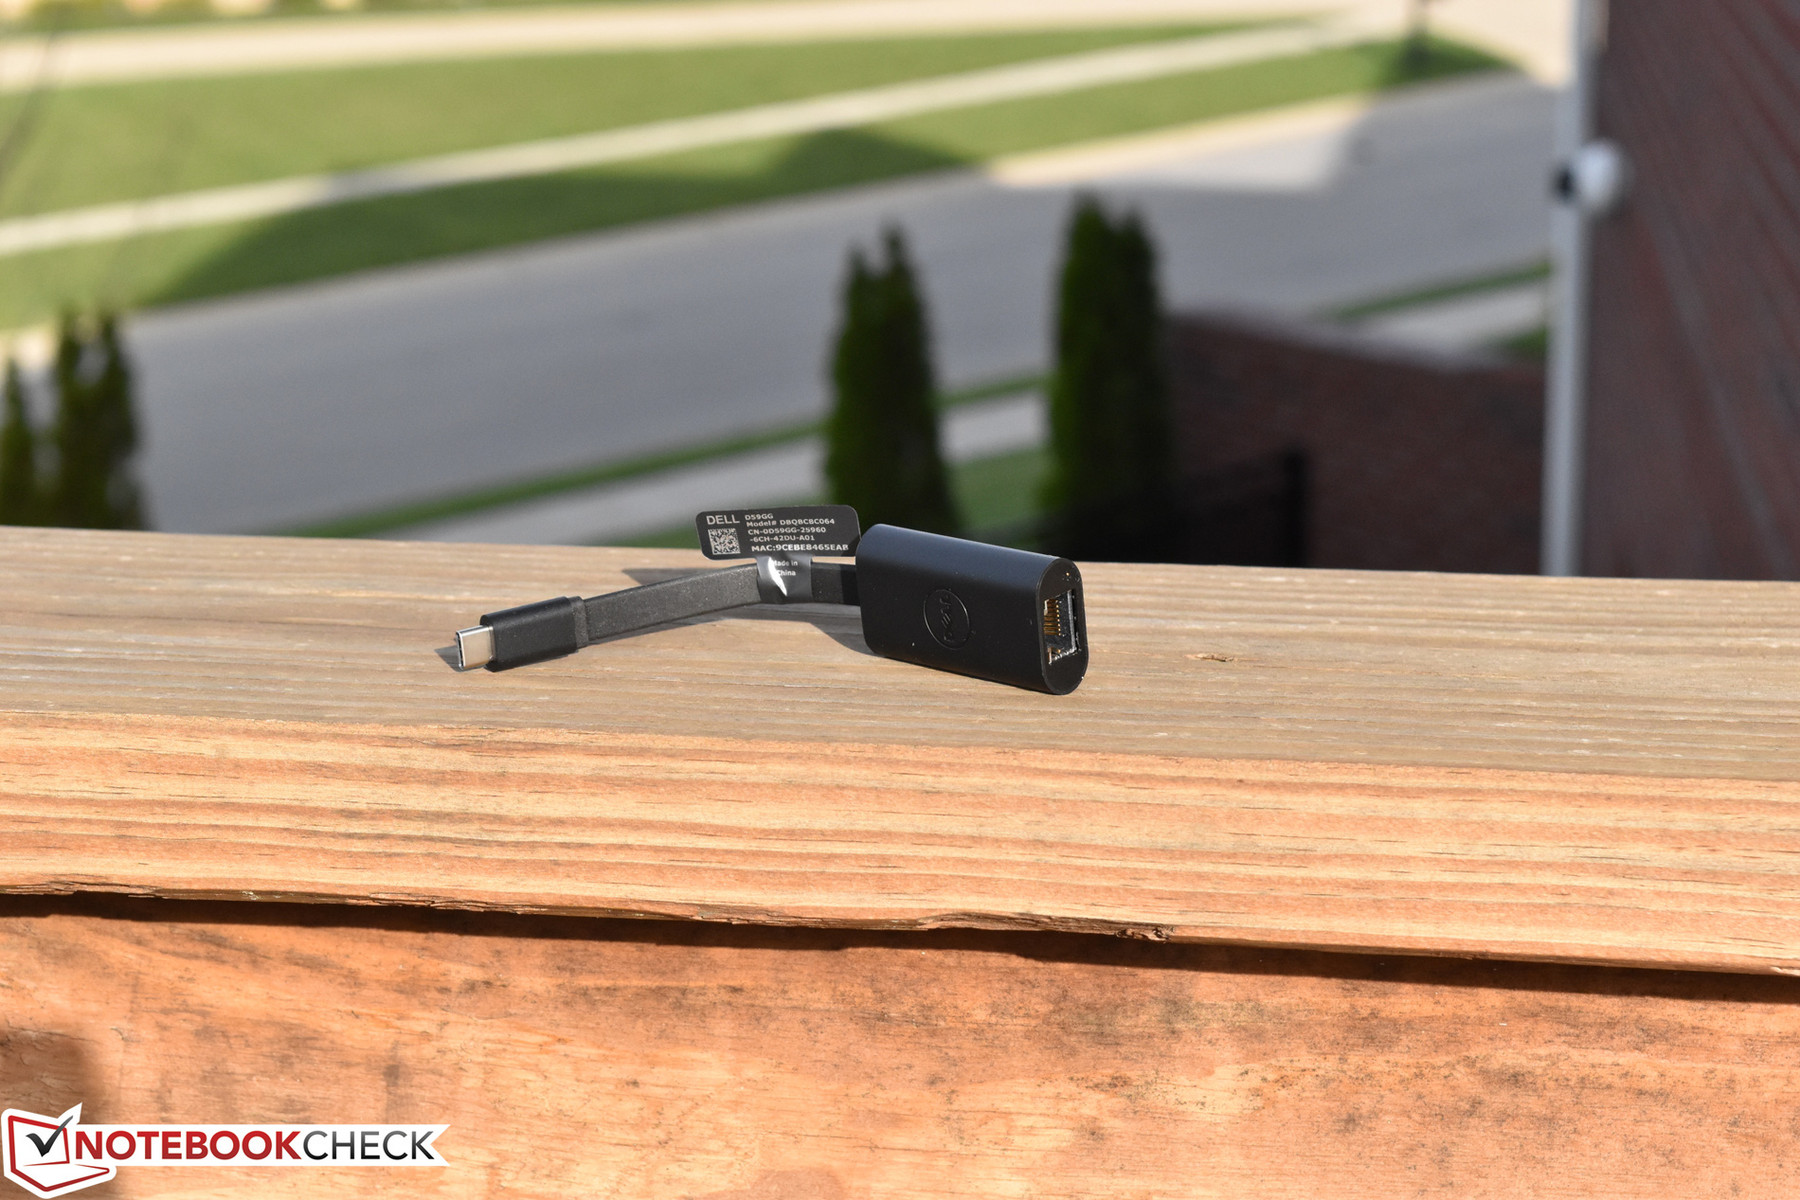
Wireless connectivity on the 5520 is handled by an Intel Dual-Band Wireless-AC 8265 with 2x2 antenna, a slight improvement over the 8260 on the 5510. This adapter includes Bluetooth 4.2 (versus 4.0 on the 5510). Ethernet connections, meanwhile, are facilitated by way of the included USB Type-C to Ethernet adapter. Although the adapter became rather warm during our usage, it worked just fine and provided good transfer speeds.
| Networking | |
| iperf3 transmit AX12 | |
| Dell Precision 5520 UHD | |
| iperf3 receive AX12 | |
| Dell Precision 5520 UHD | |
Security and Software
The Precision 5520 is offered with optional security features (some for a small premium), such as integrated TPM, vPro management technology, and the typical suite of (free) administrative software, readily available from the Dell Support website.
Dell’s Precision workstations also include the Dell Precision Optimizer software package, which rebalances system resources to optimize configurations for the use of specific applications (such as AutoCAD, video editing software, and so on). Numerous other optional utilities also exist for download from the Dell Support site, including Dell Update (for driver/BIOS updates) and Dell Command Power Manager (which provides more granular control over power profiles and charging conditions).
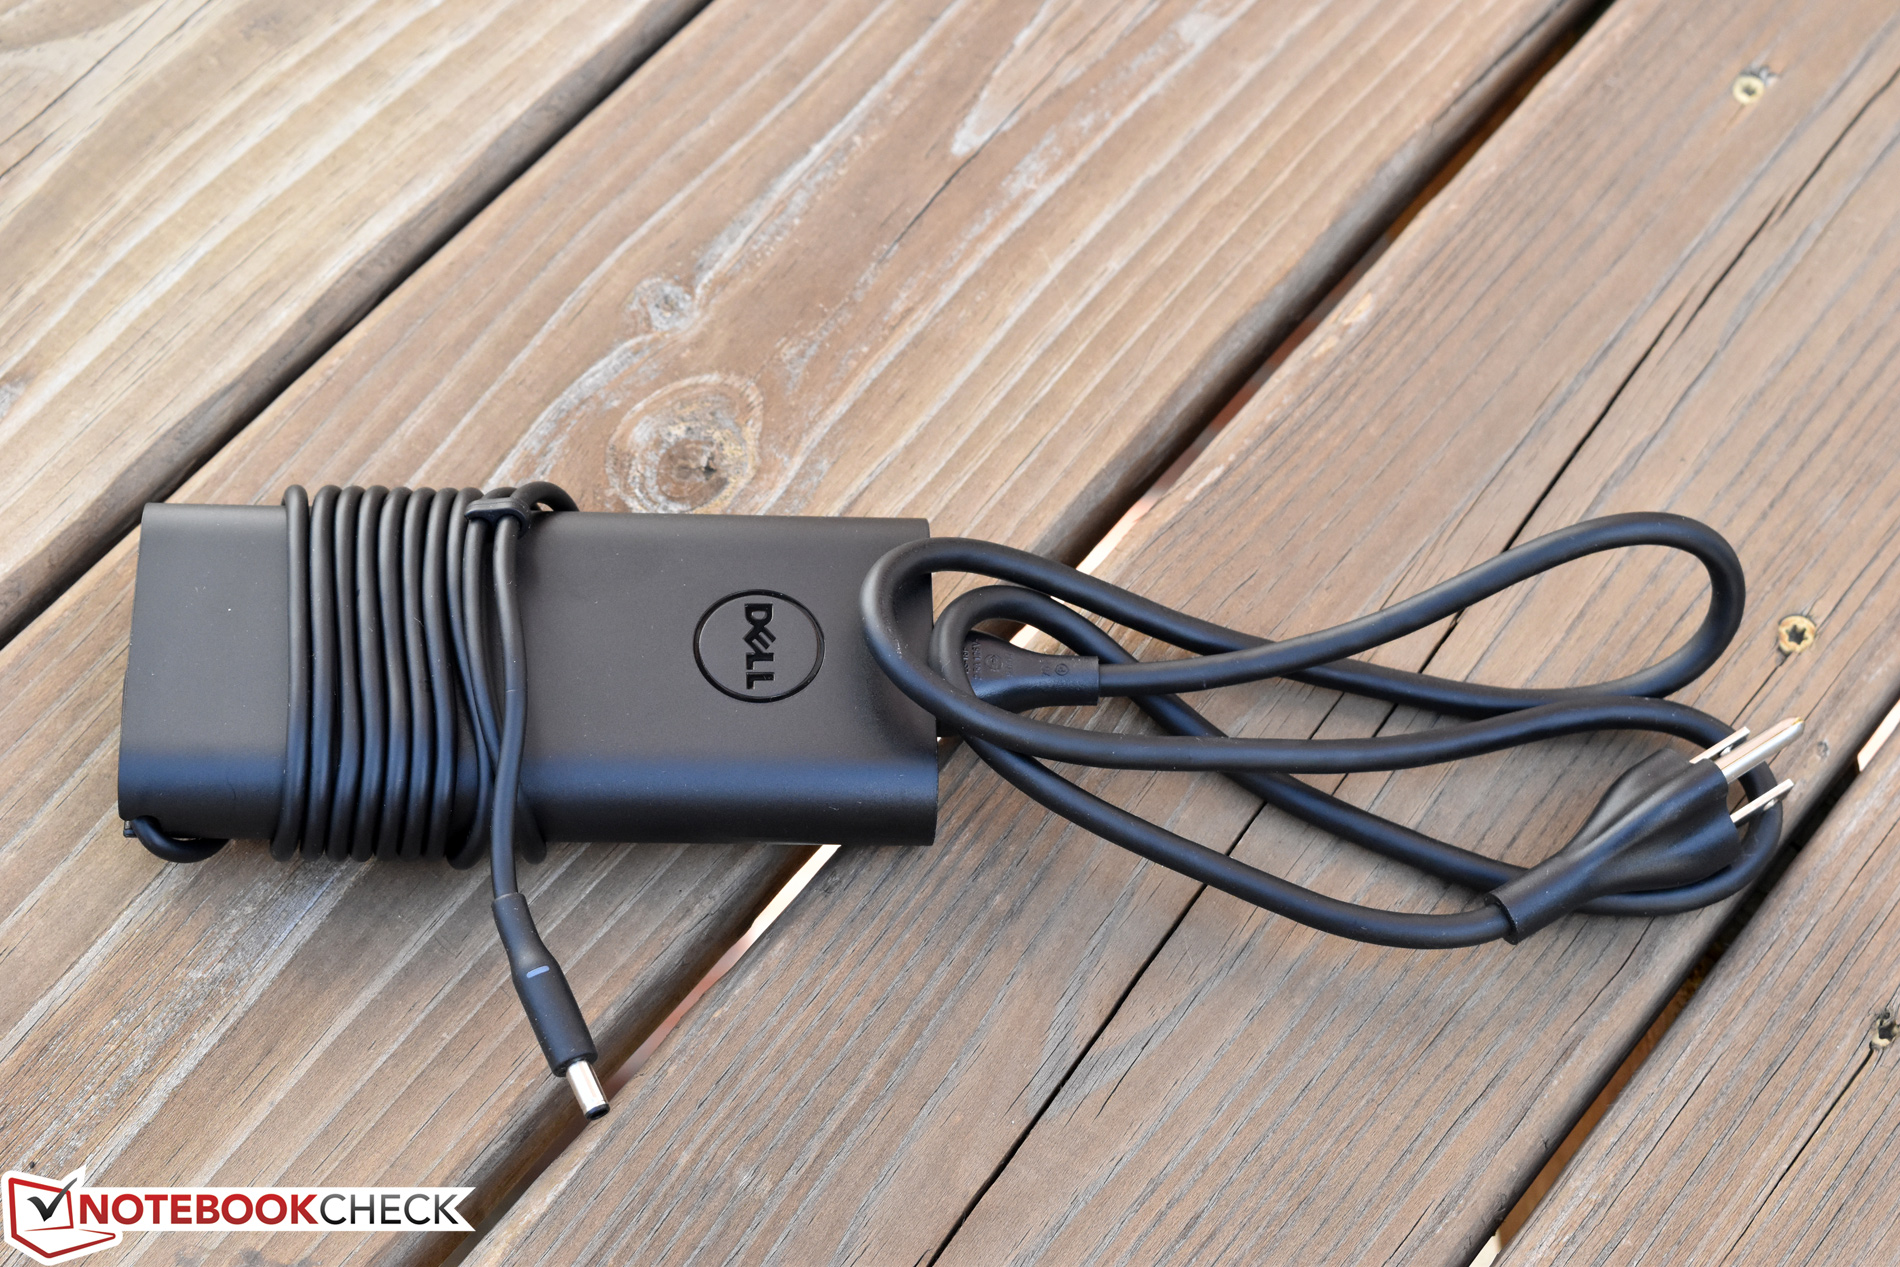
Accessories
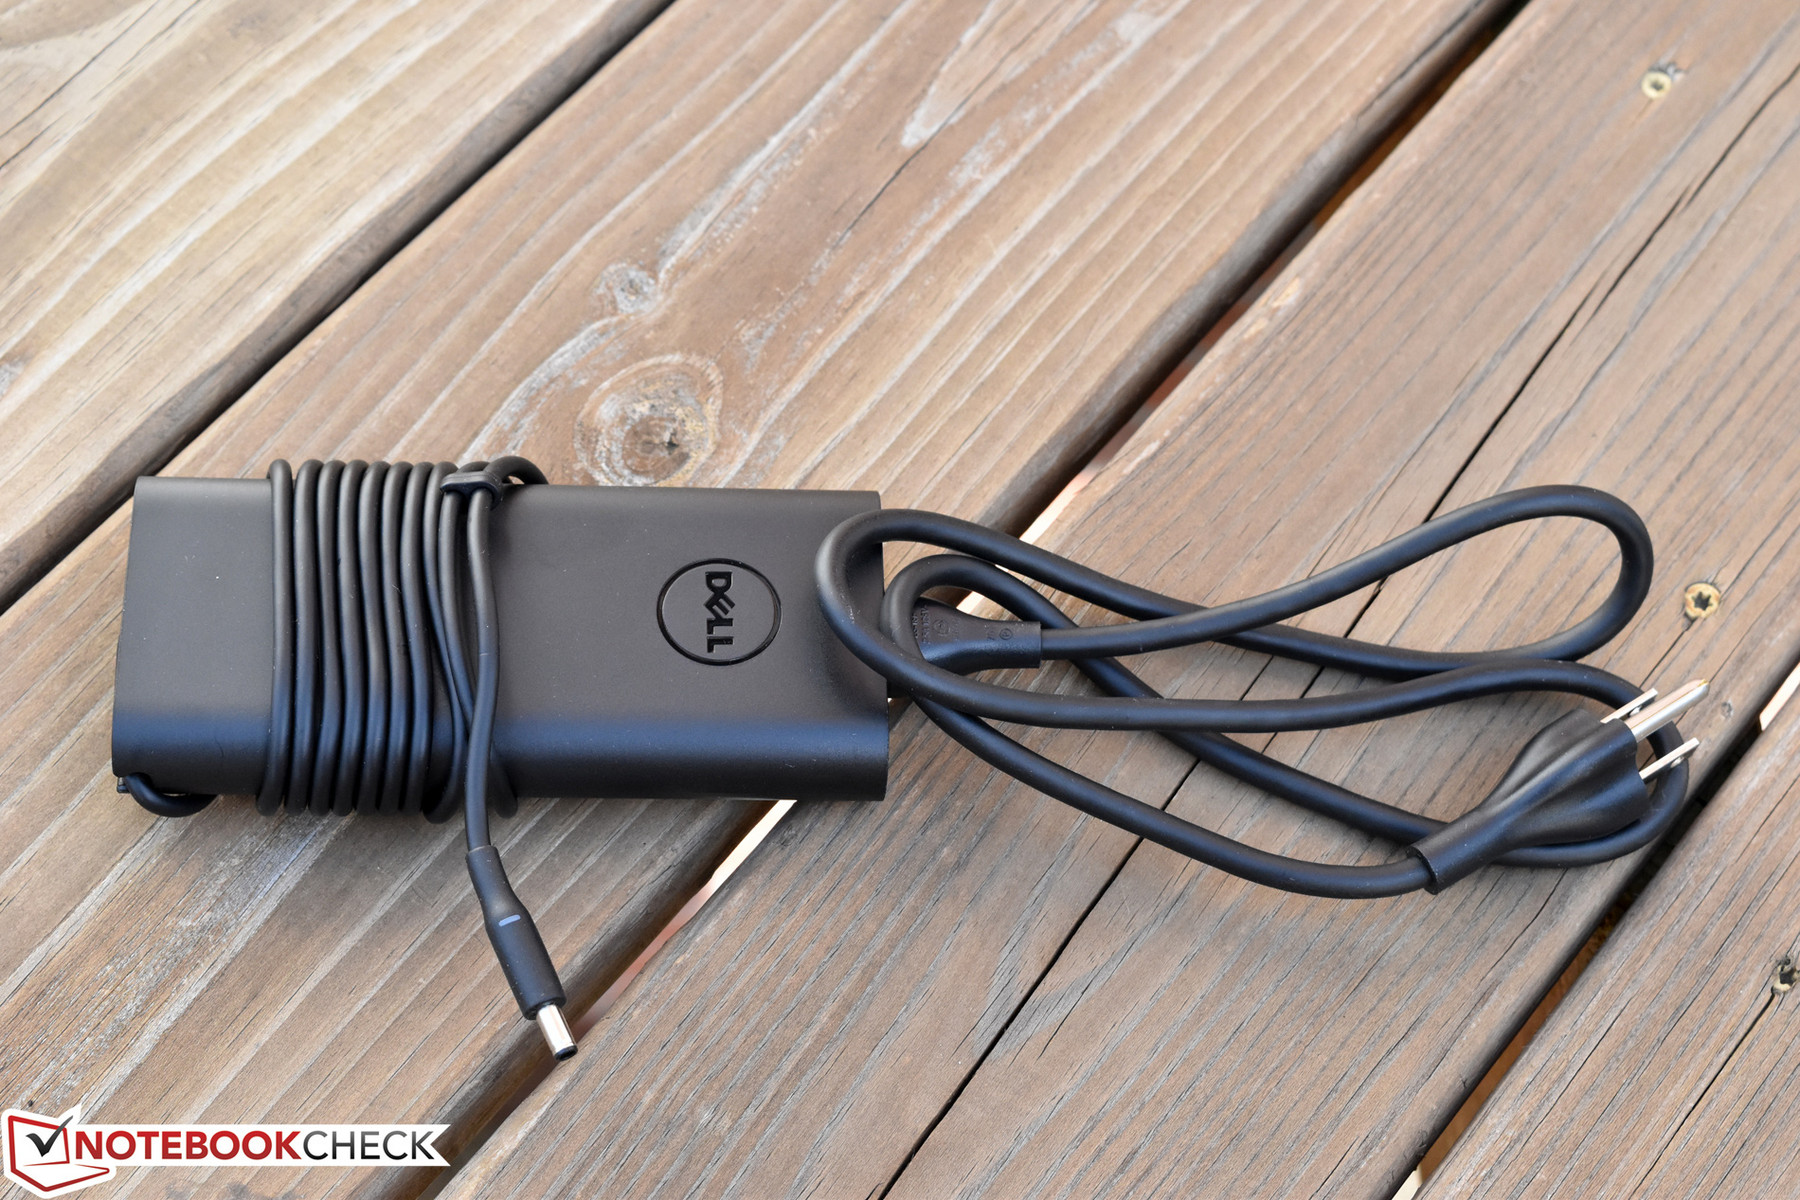
A 130 W Dell Ultrabook-style AC Adapter (the newer variety with the smaller tip) is included with the machine; it’s large, but still on the small side for a mobile workstation. Apart from that, users receive the aforementioned USB Type-C to Ethernet adapter.
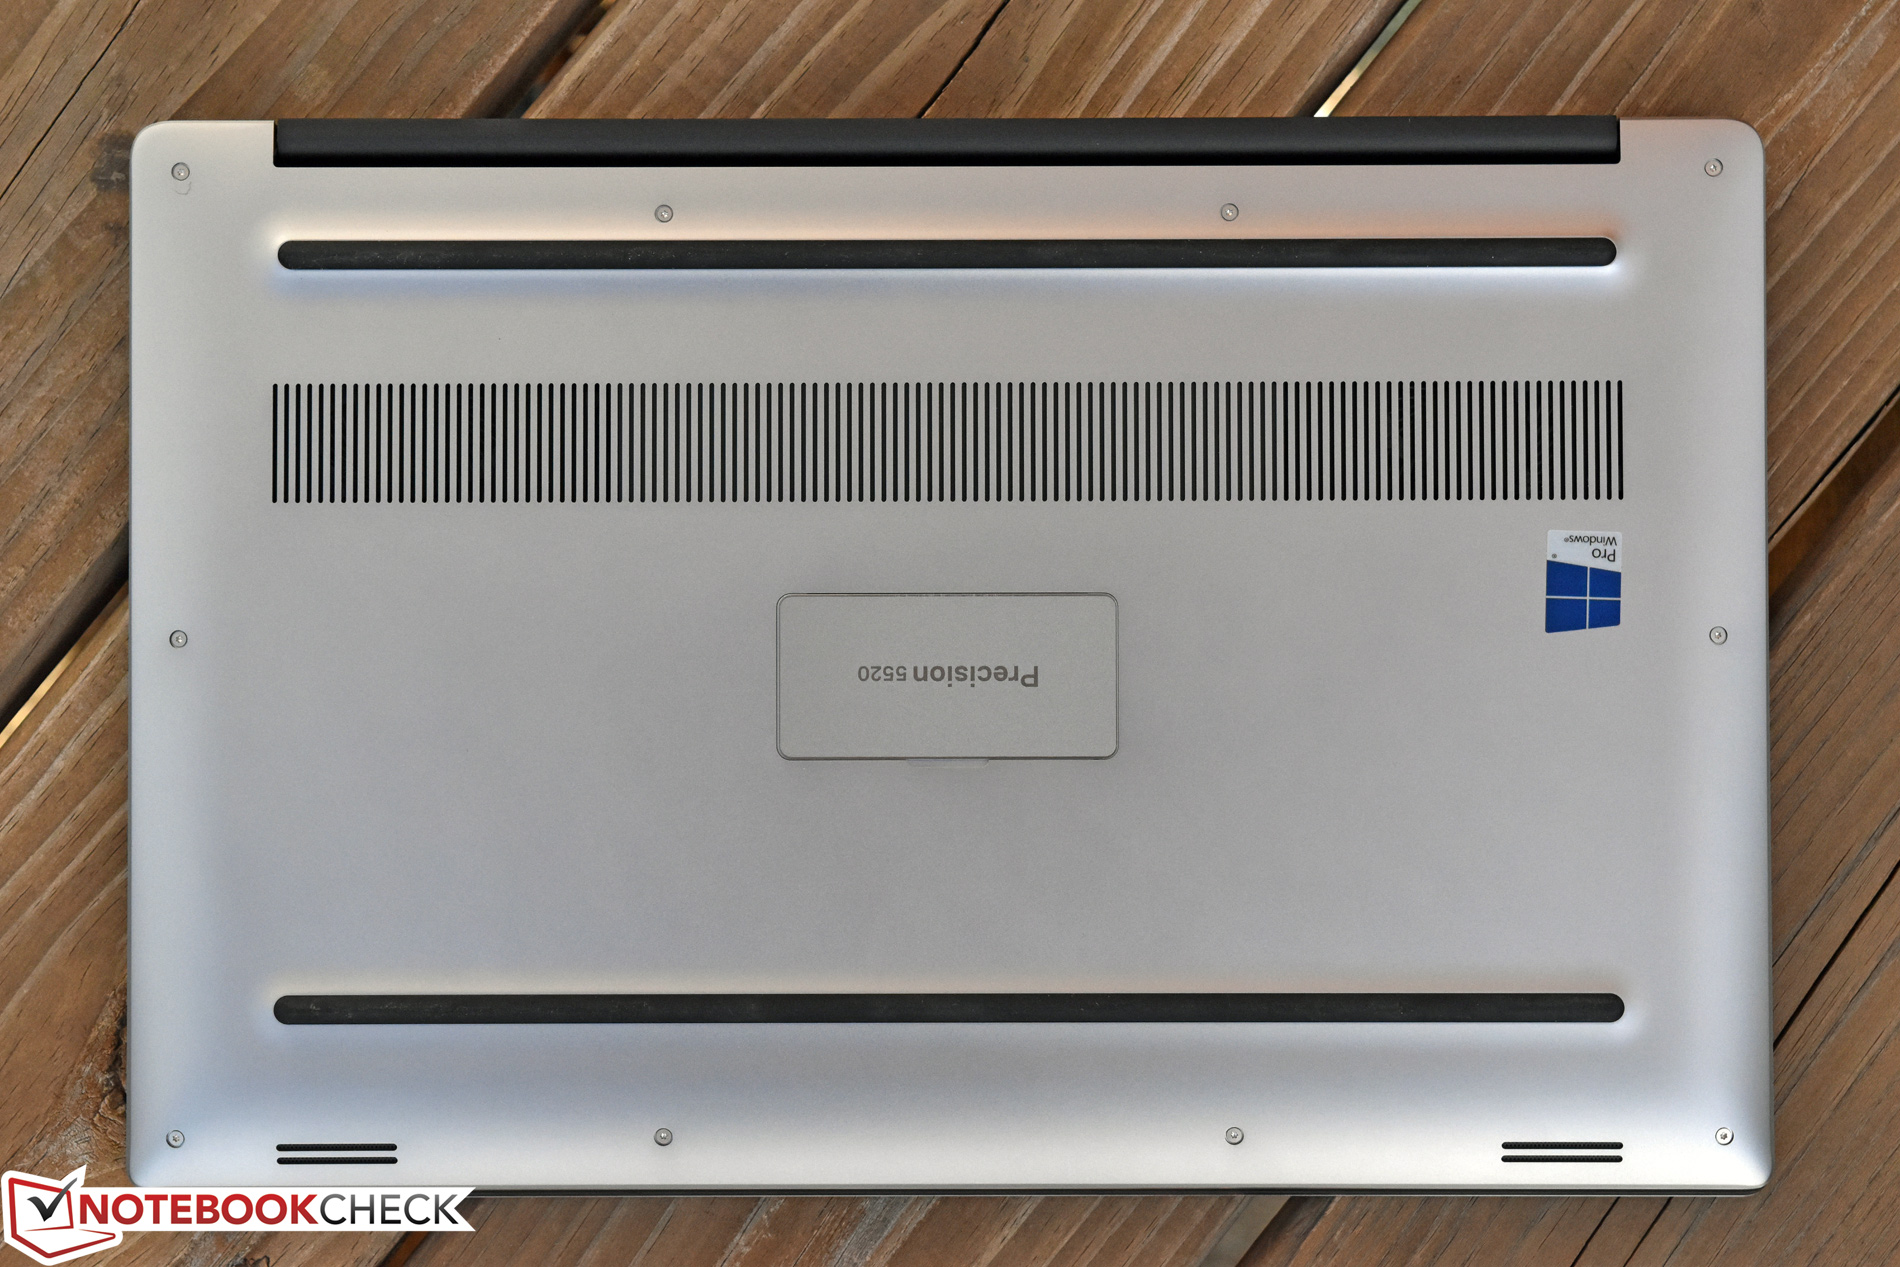
Maintenance
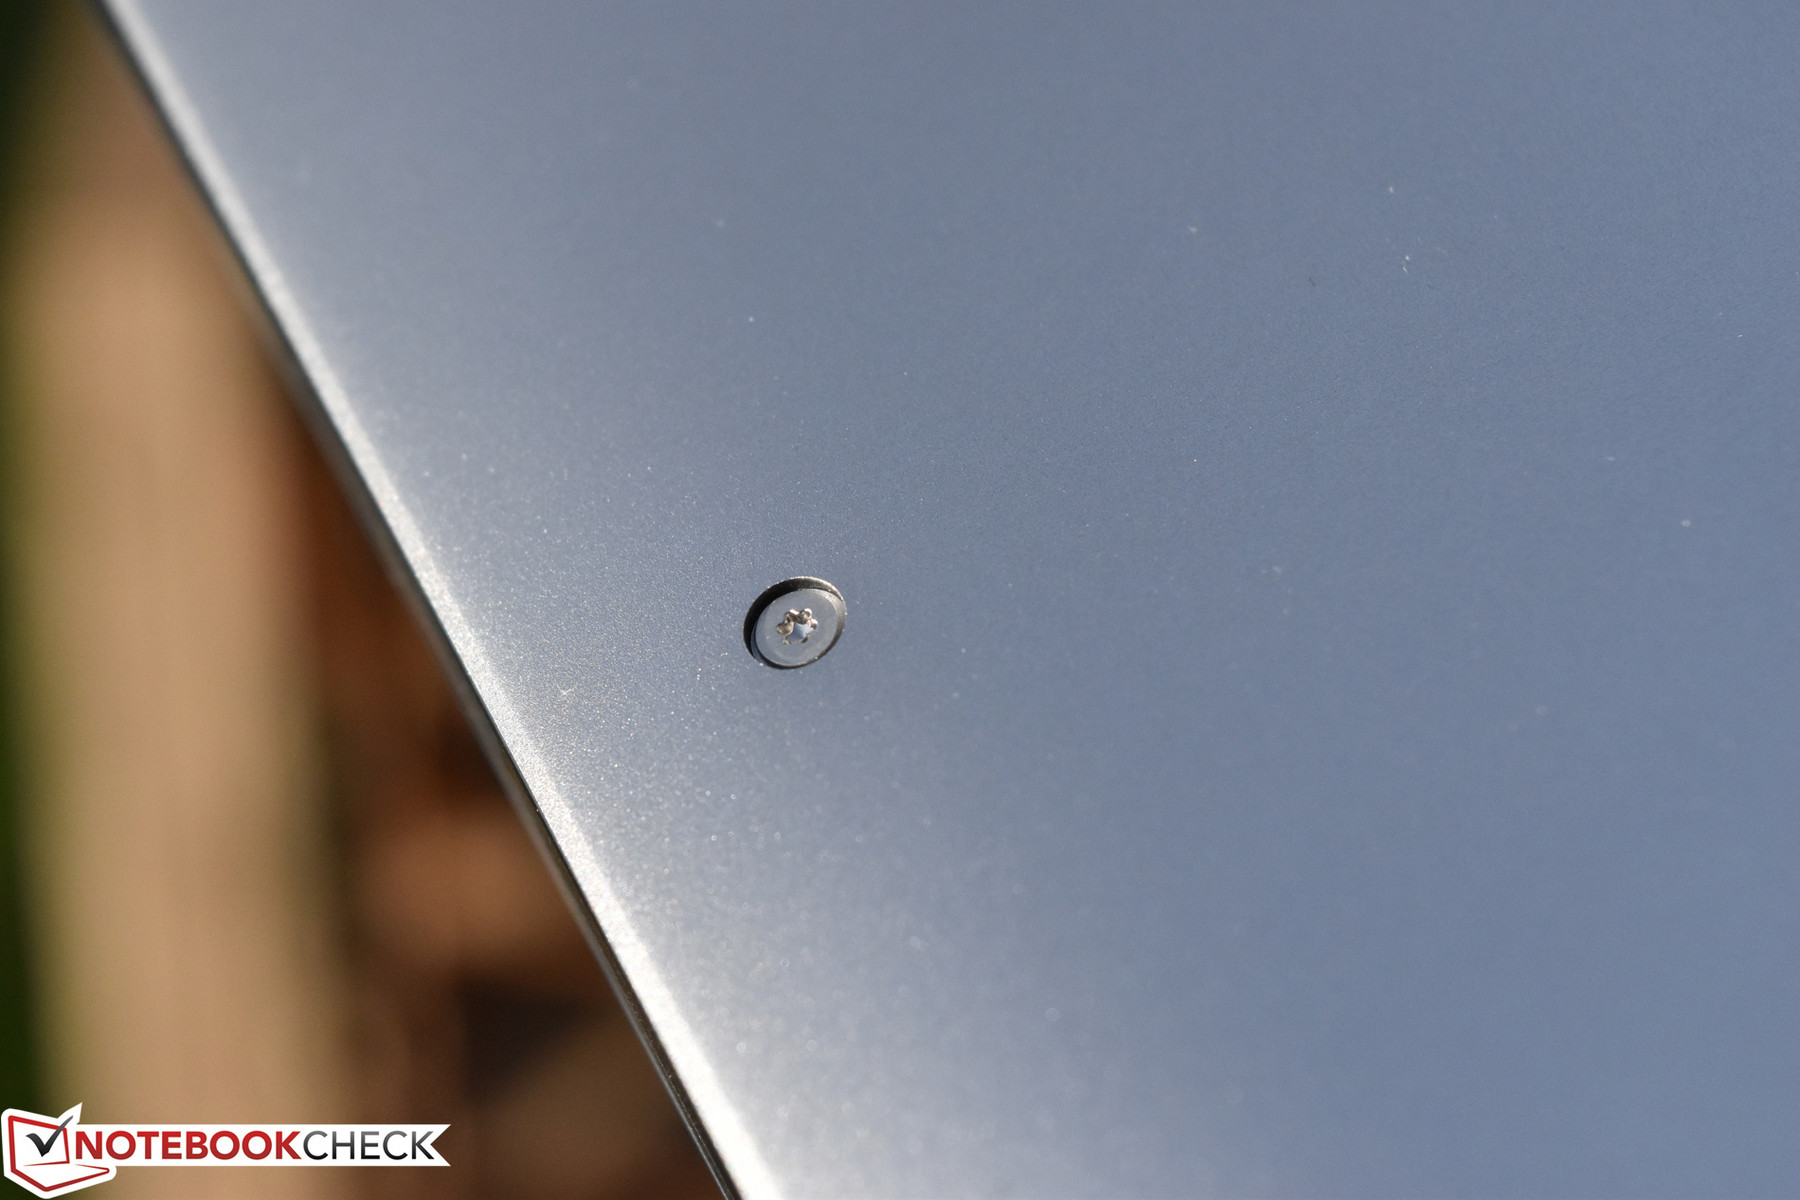
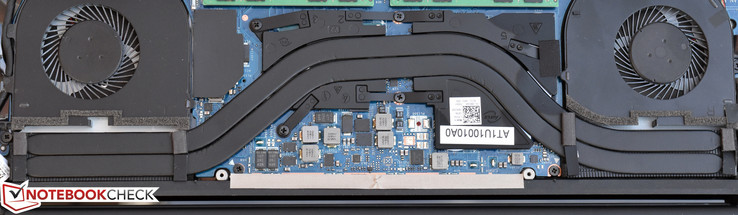
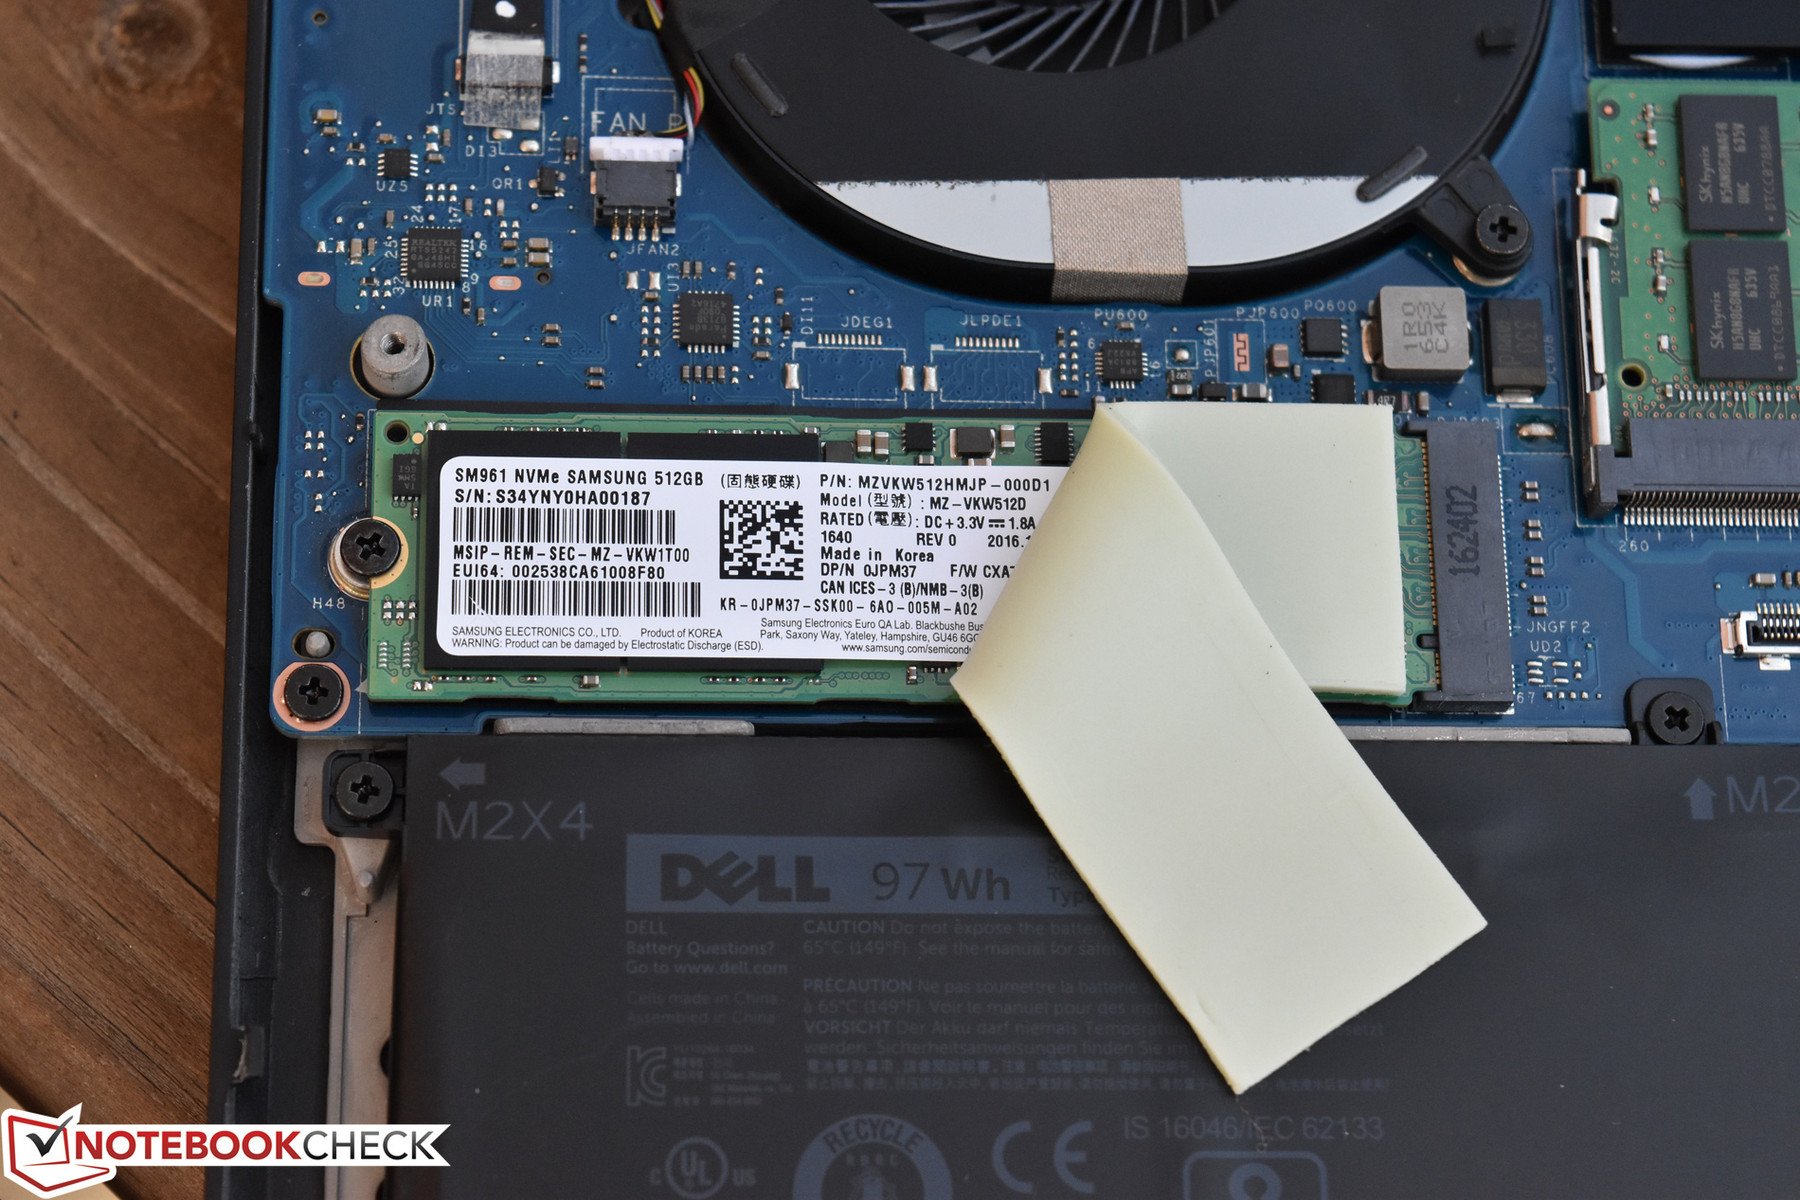
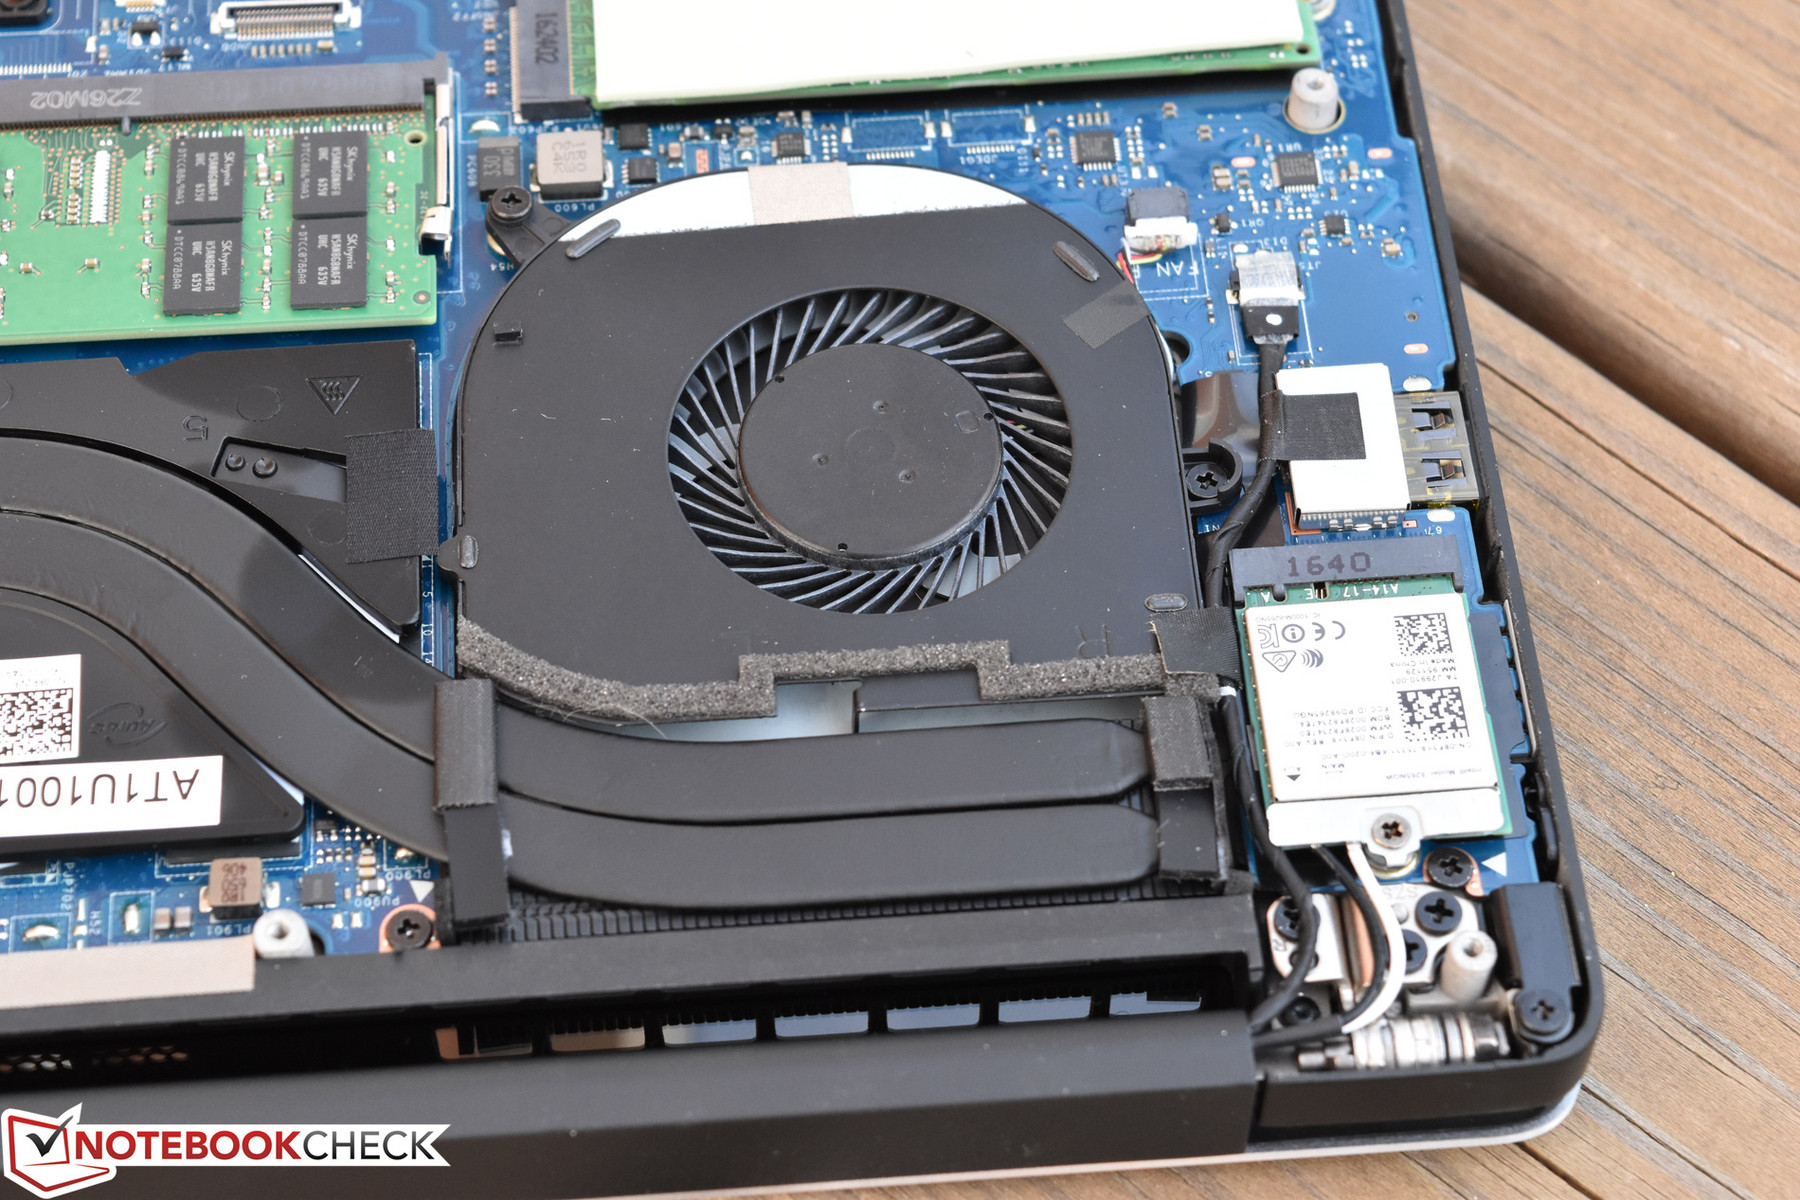
Maintenance on the Precision 5520 is relatively straightforward, though most of the screws involved are of the Torx variety. There are twelve screws in all securing the bottom panel which must first be removed (including two hidden beneath the nameplate), after which point the entire panel is removable and the internal replaceable parts—battery, RAM (both slots), WLAN adapter, M.2/NVMe SSD, and heatsink/fan—are easily accessible.
Warranty
The warranty included with our Precision review unit was 1-year on-site (after remote diagnosis). Other options exist, such as longer warranty periods and Dell’s well-reviewed ProSupport, which is in-region (North American based in this case). Please see our Guarantees, Return policies and Warranties FAQ for country-specific information.
Input Devices
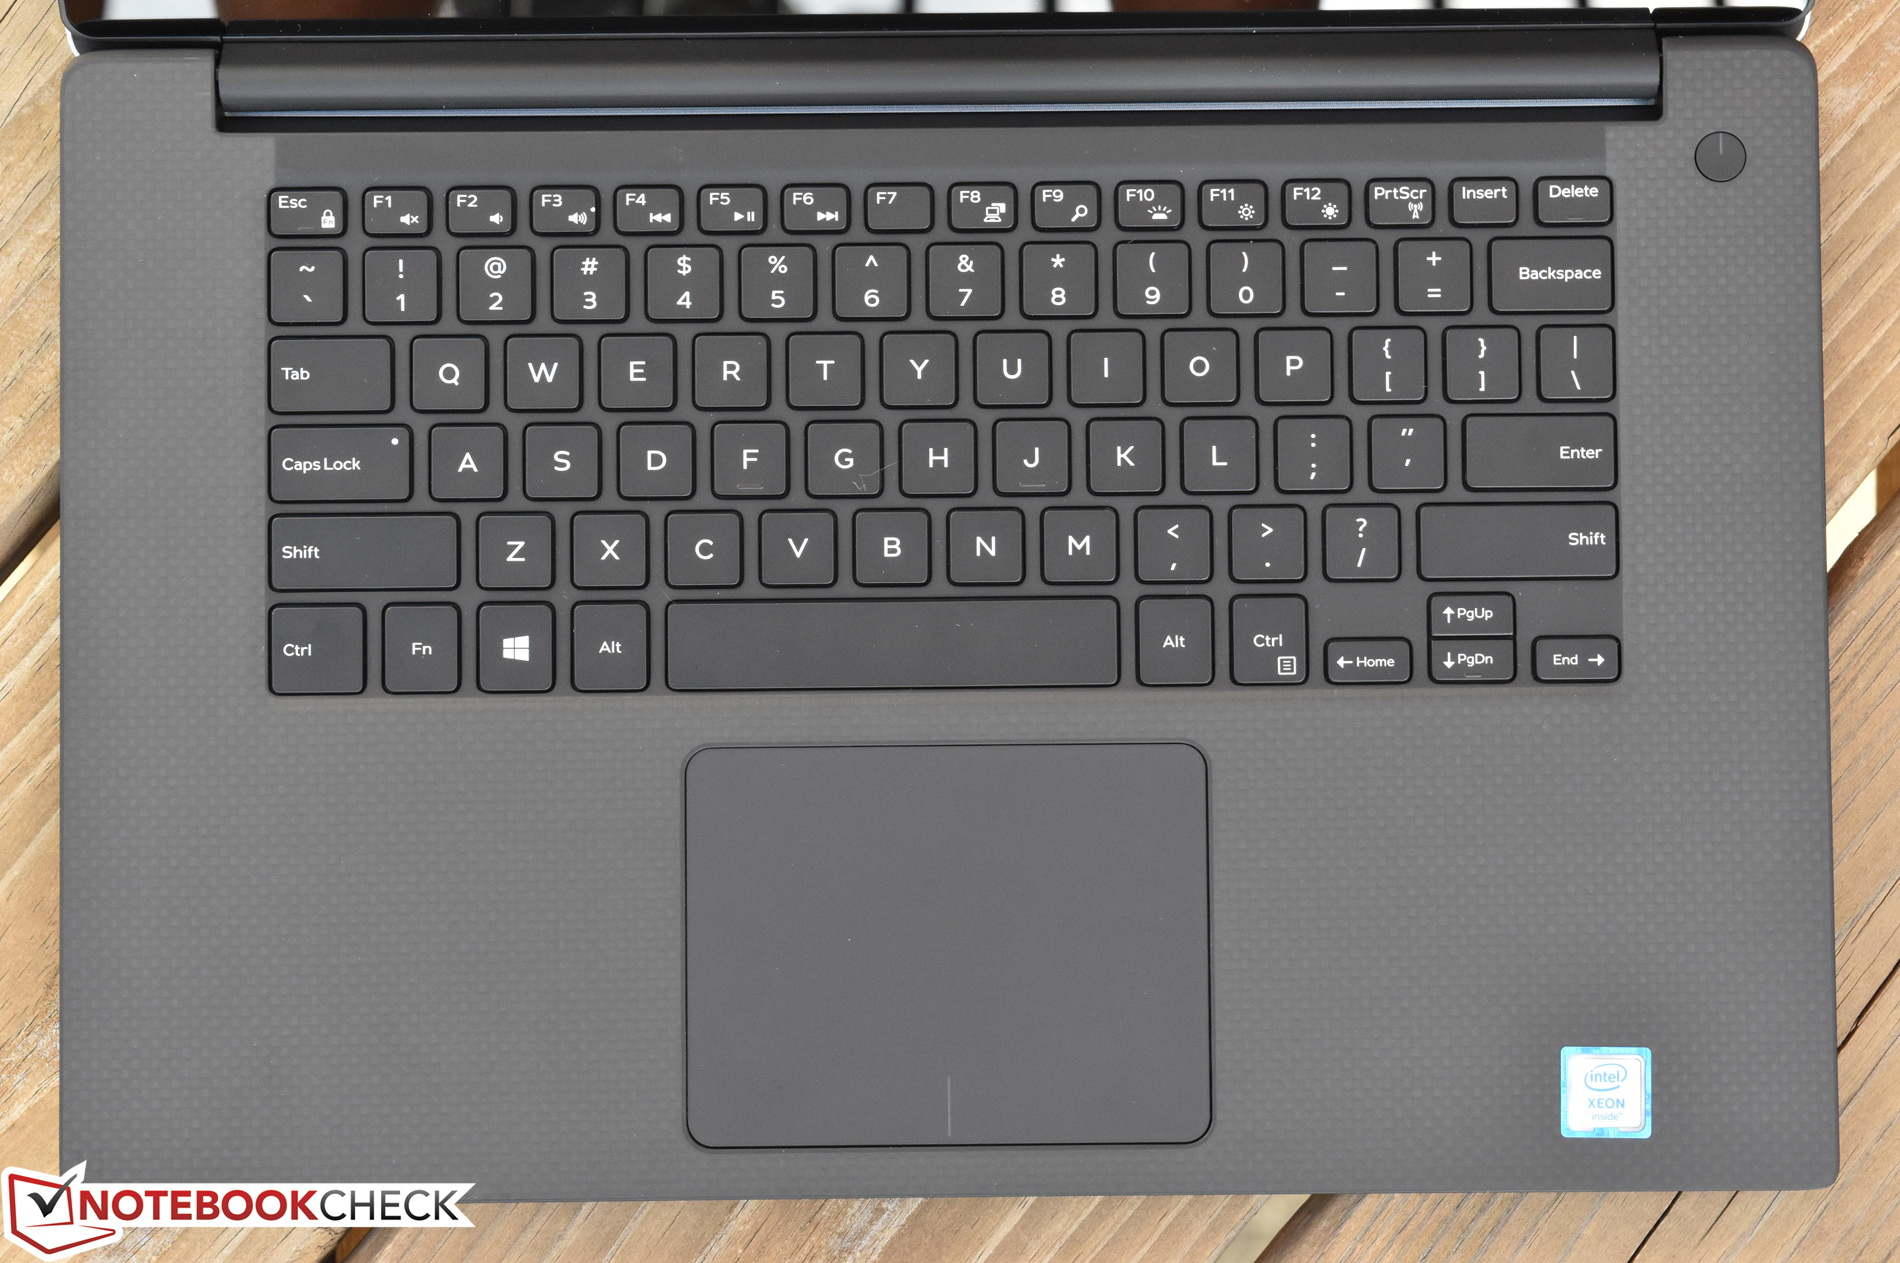
Keyboard
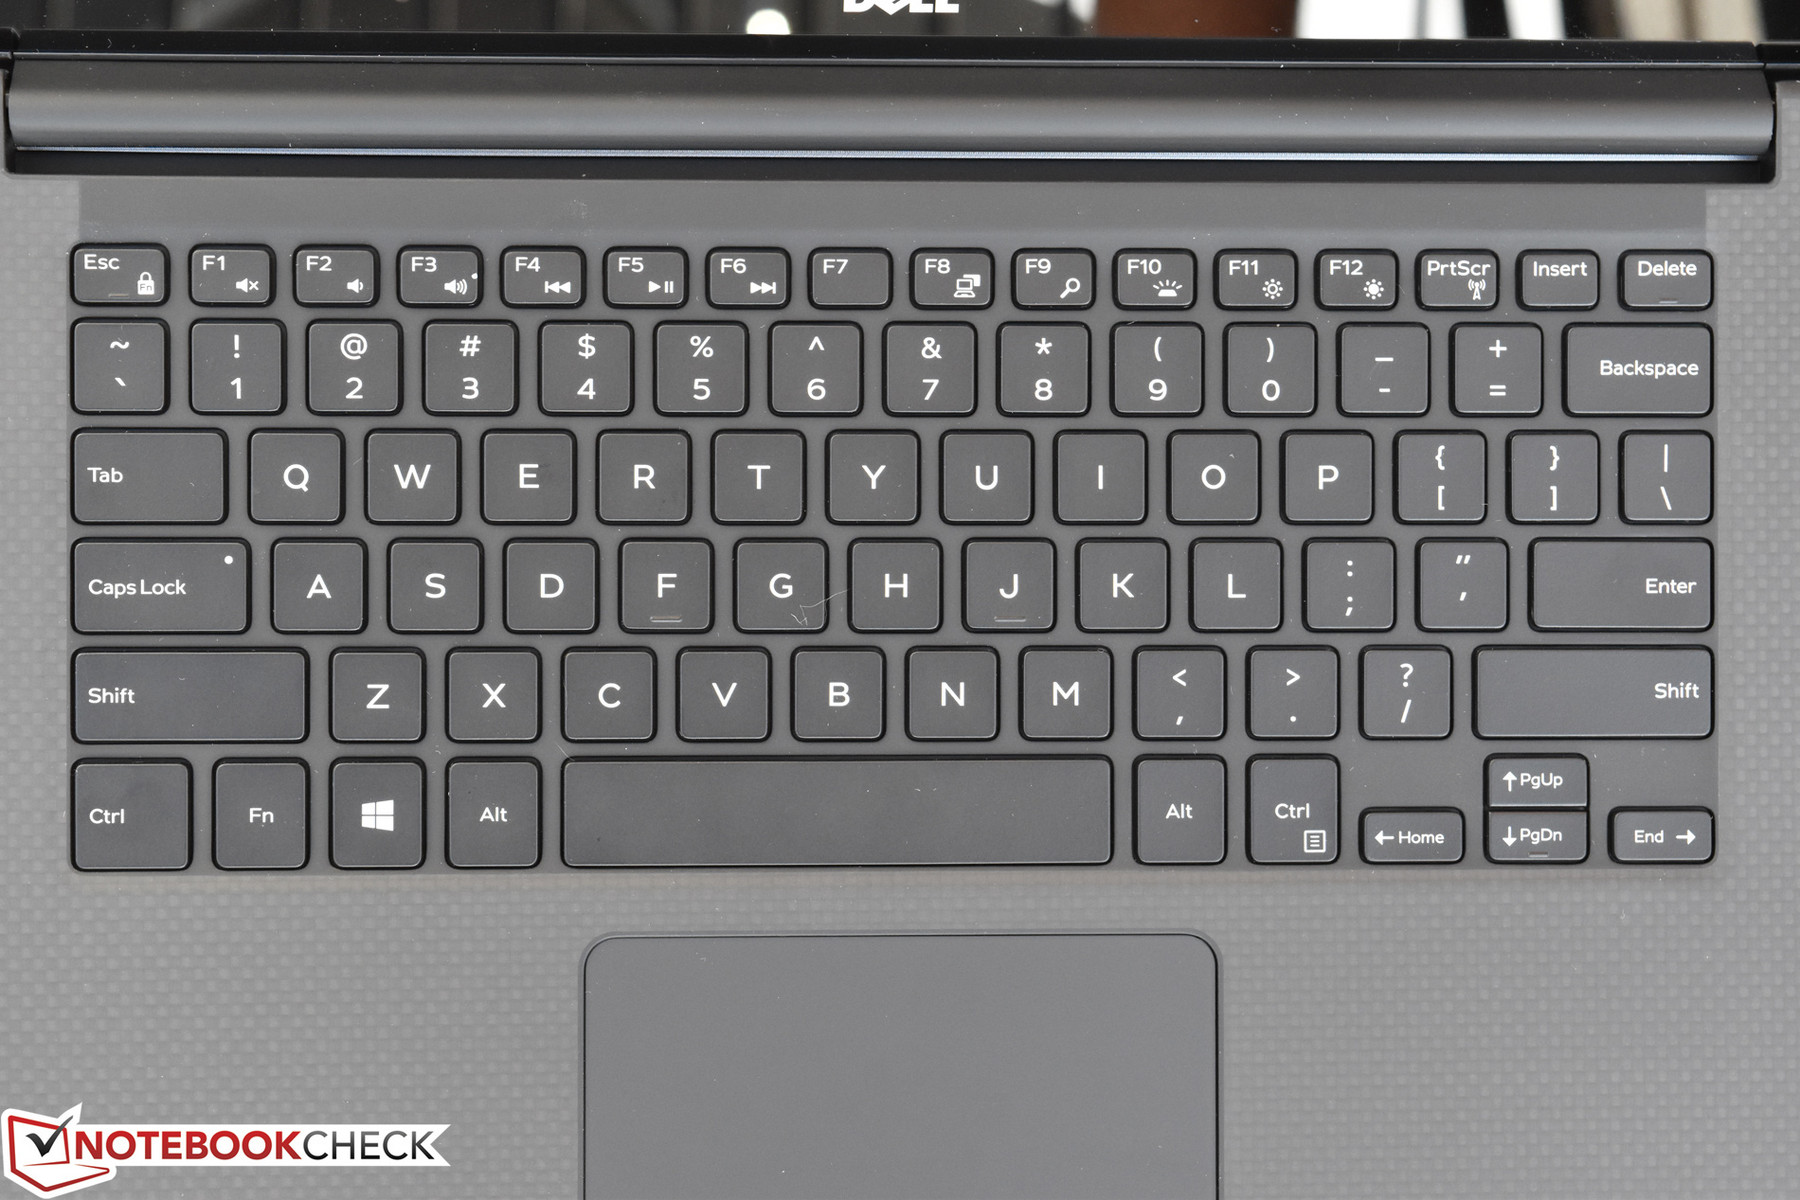
The Precision 5520 keyboard and touchpad are unchanged from those of the previous version, and both remain very good overall. Despite the short key travel, feedback is good and operation is quiet and unobtrusive. The backlighting also looks nice and is easily visible in darker environments. Some users will regret the omission of a number pad, which is an amenity typically afforded to most 15.6-inch business machines.
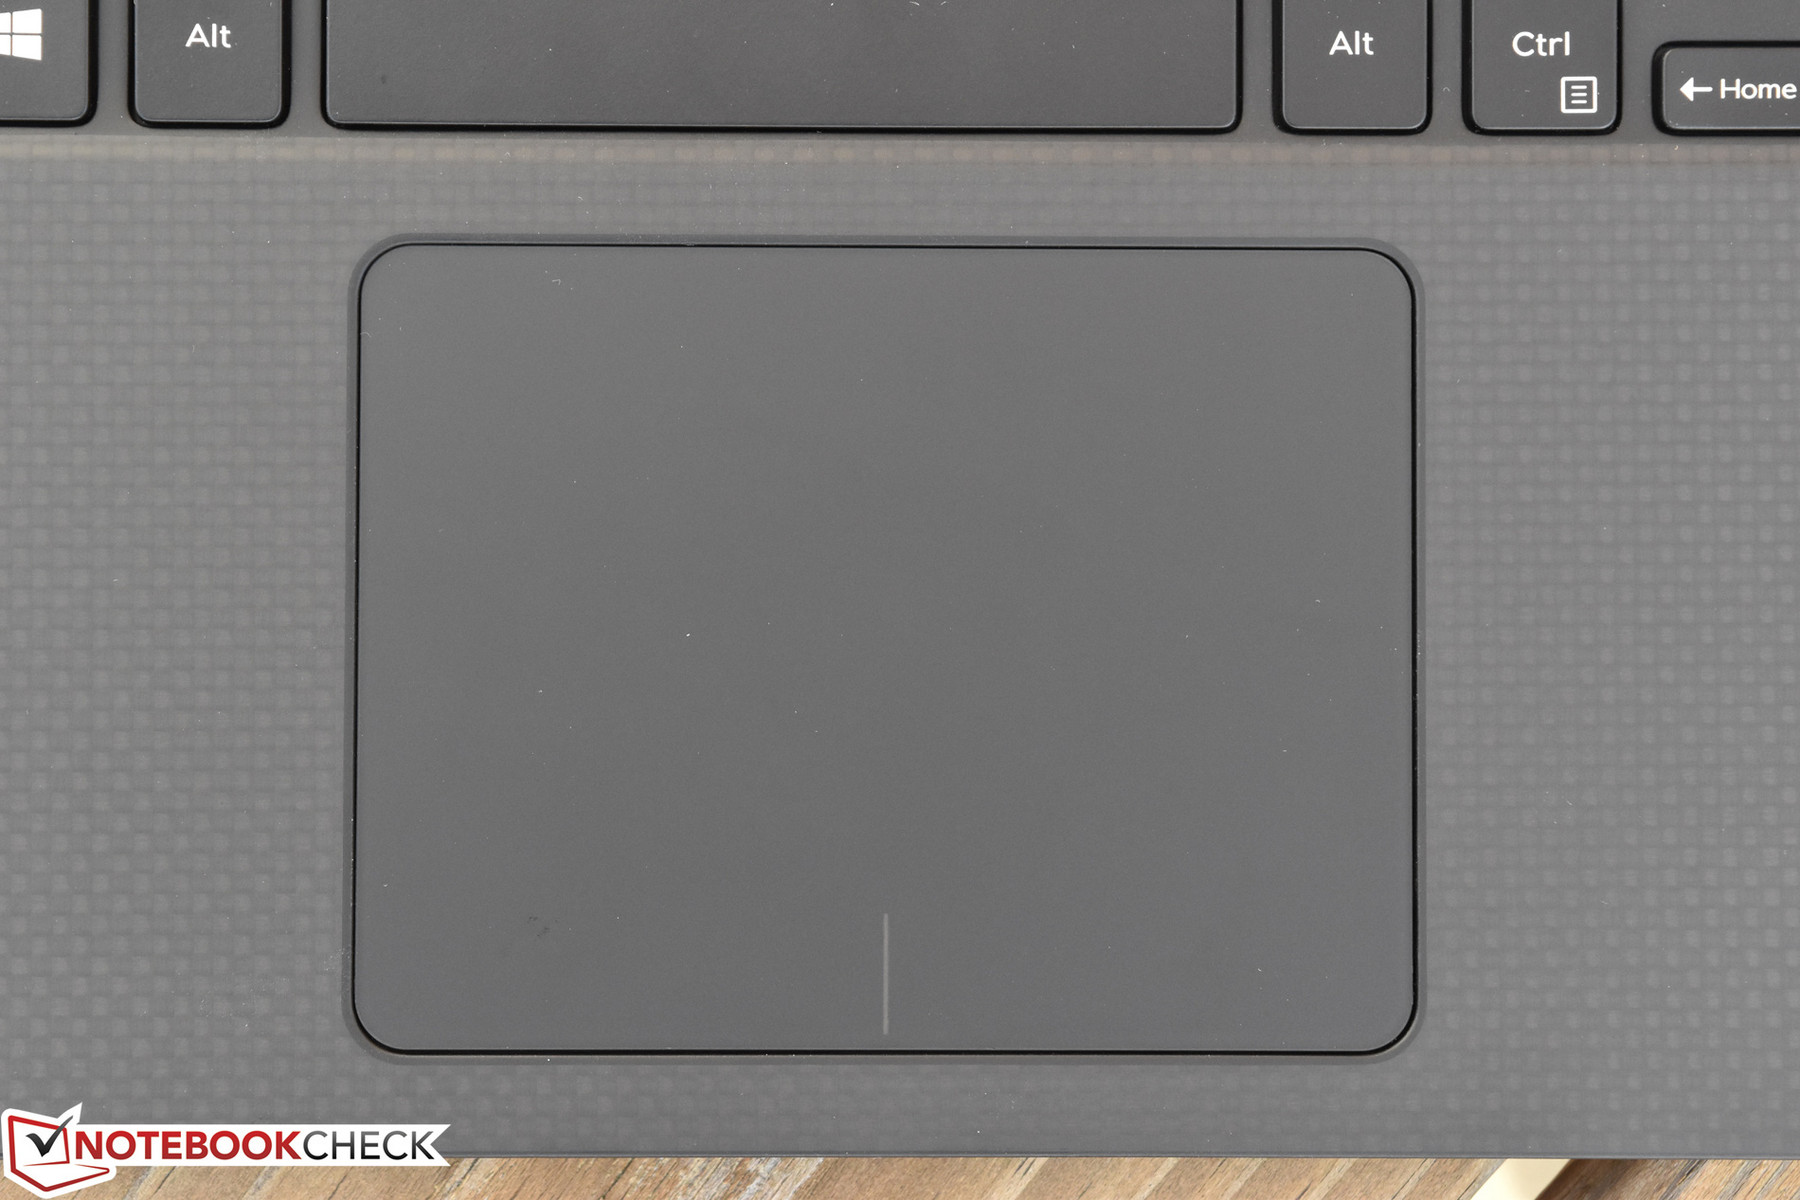
Touchpad
The large touchpad is also still excellent. The smooth glass surface provides for comfortable gliding, and gestures are interpreted quickly and accurately. Integrated buttons are rarely welcomed by professional workstation users, but at least the Precision’s clickpad is decisive in its feedback.
Touchscreen
The previous Precision 5510 we reviewed also included the same touchscreen, but it was hamstrung by an aging Windows 7 operating system which did little to capitalize on its inclusion. With Windows 10, the Precision 5520’s touchscreen is as versatile and comfortable as any, and although the glossy edge-to-edge finish does inherently mean obstructive reflections, it’s a convenient addition while working indoors.

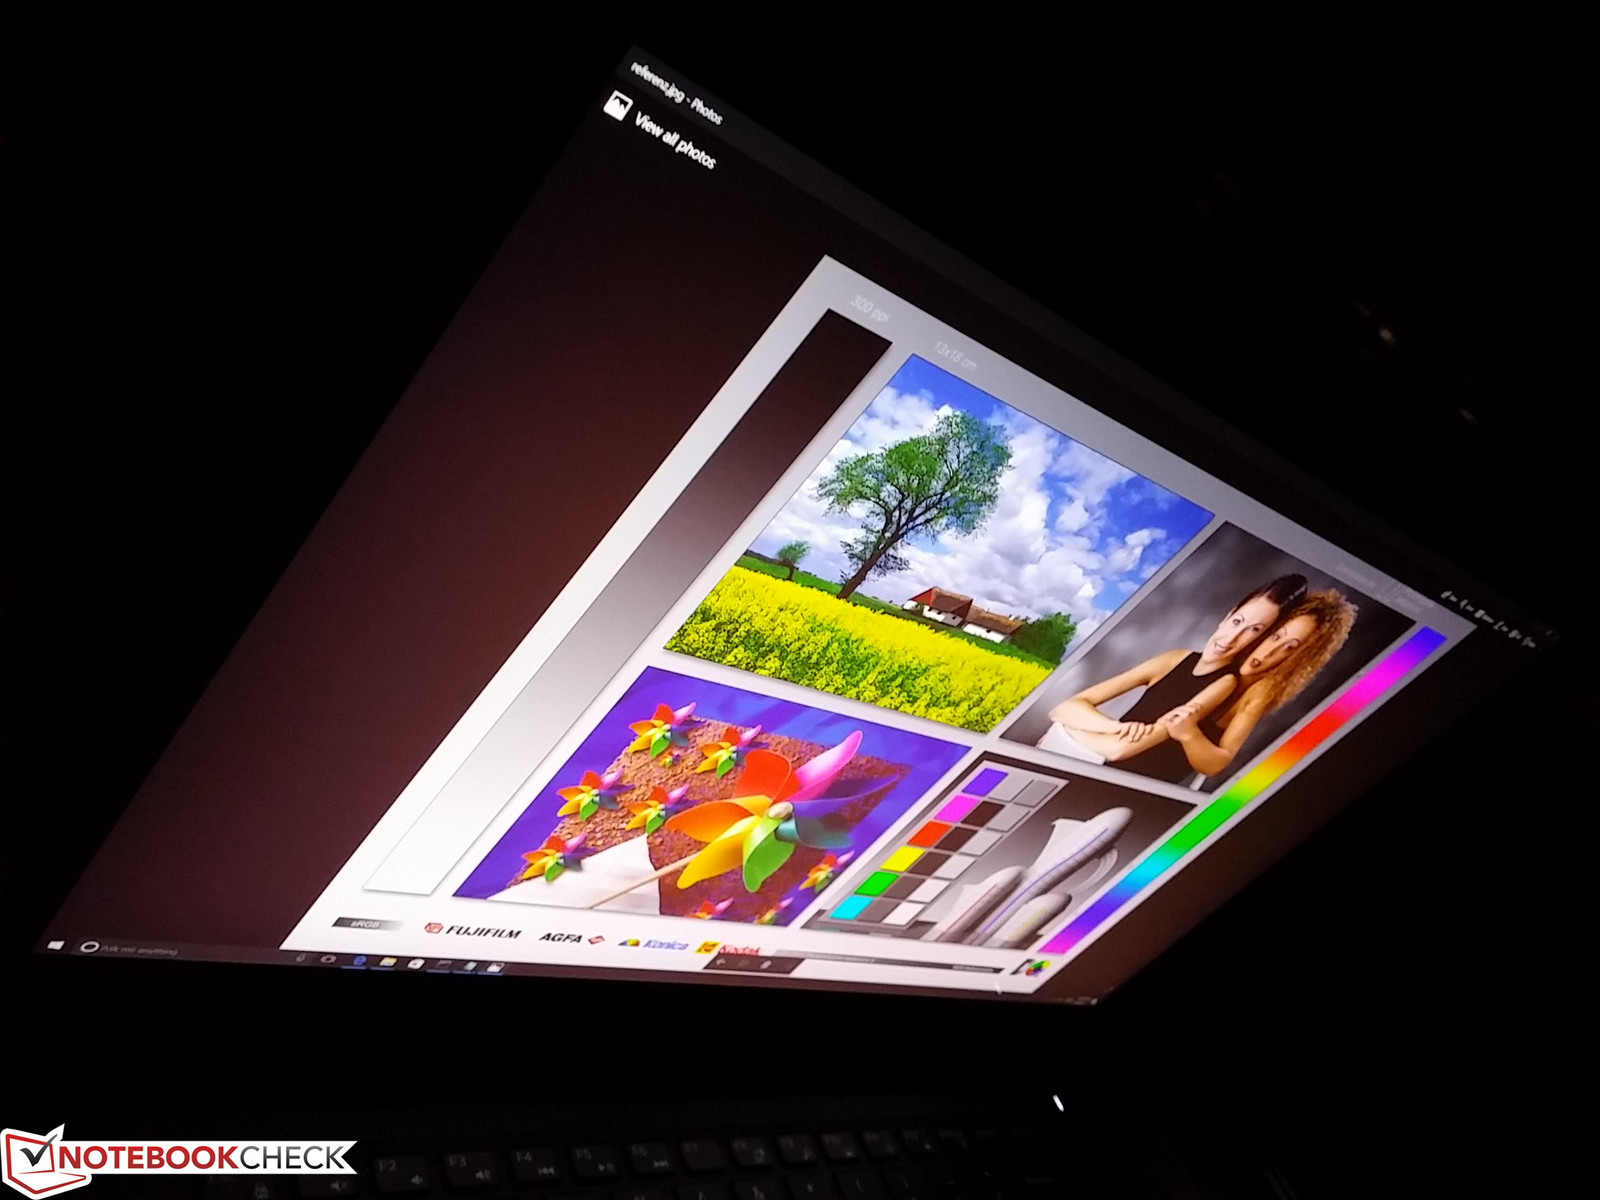
Display
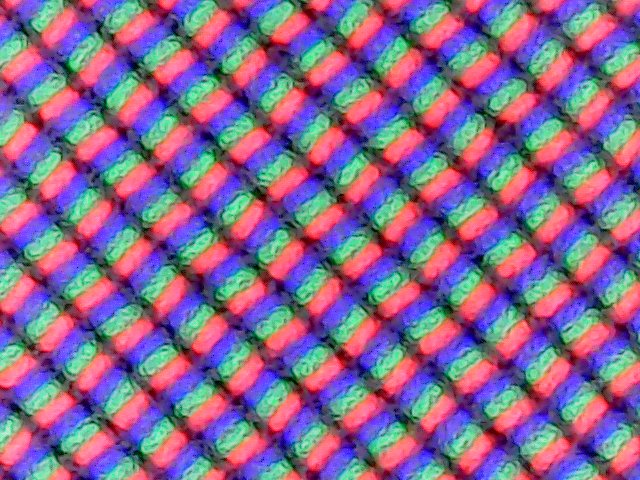
The Precision 5520 includes either a FHD (1920x1080) matte display panel or UHD (3840x2160) glossy touchscreen. Our review unit included the latter, which features edge-to-edge glass (partially to its detriment) and an ultra-thin bezel. Dell backs these panels by what they call a Premium Panel Guarantee, which ensures 100% minimum Adobe color gamut by their measurements. Subjectively, the display is bright, vivid, and imbued with that enduring futuristic quality made possible by the InfinityEdge bezels.
| |||||||||||||||||||||||||
Brightness Distribution: 90 %
Center on Battery: 372.4 cd/m²
Contrast: 776:1 (Black: 0.48 cd/m²)
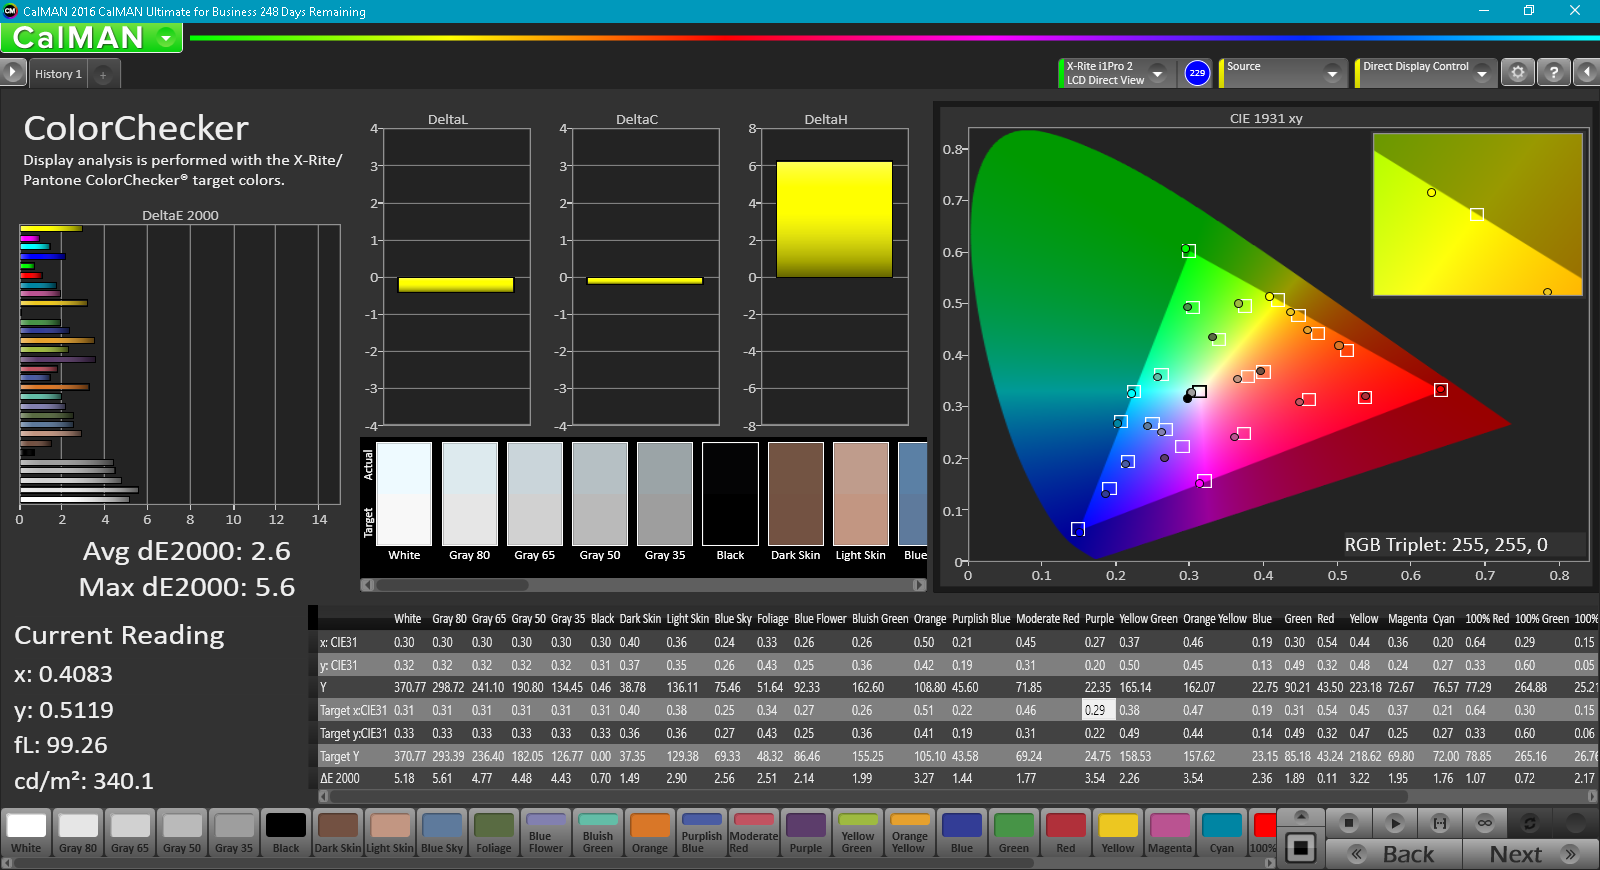
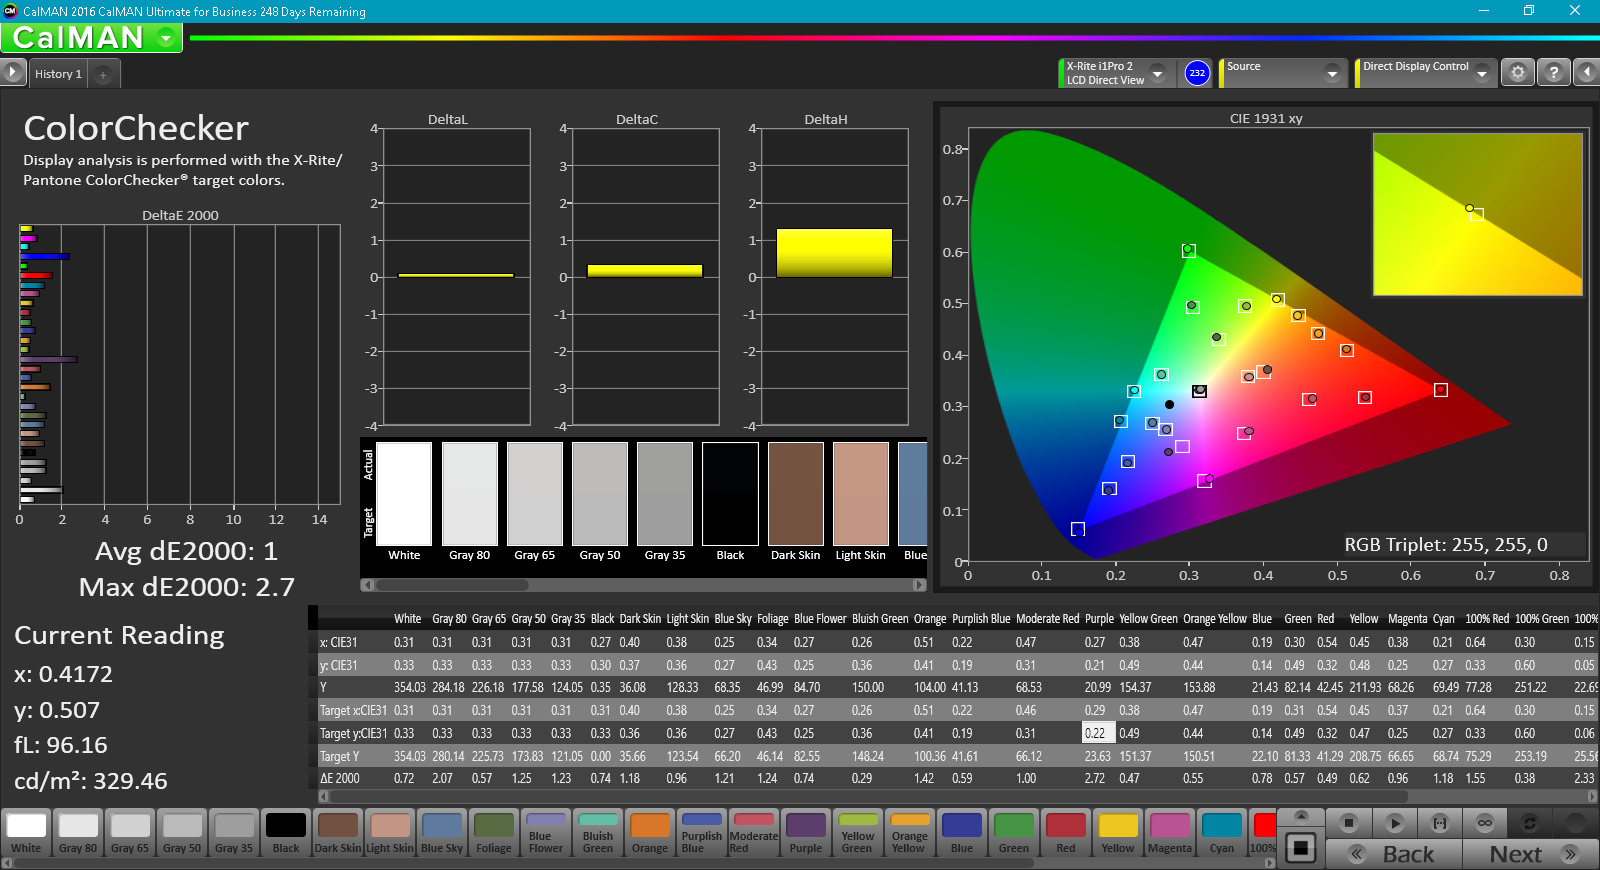
ΔE ColorChecker Calman: 2.6 | ∀{0.5-29.43 Ø4.72}
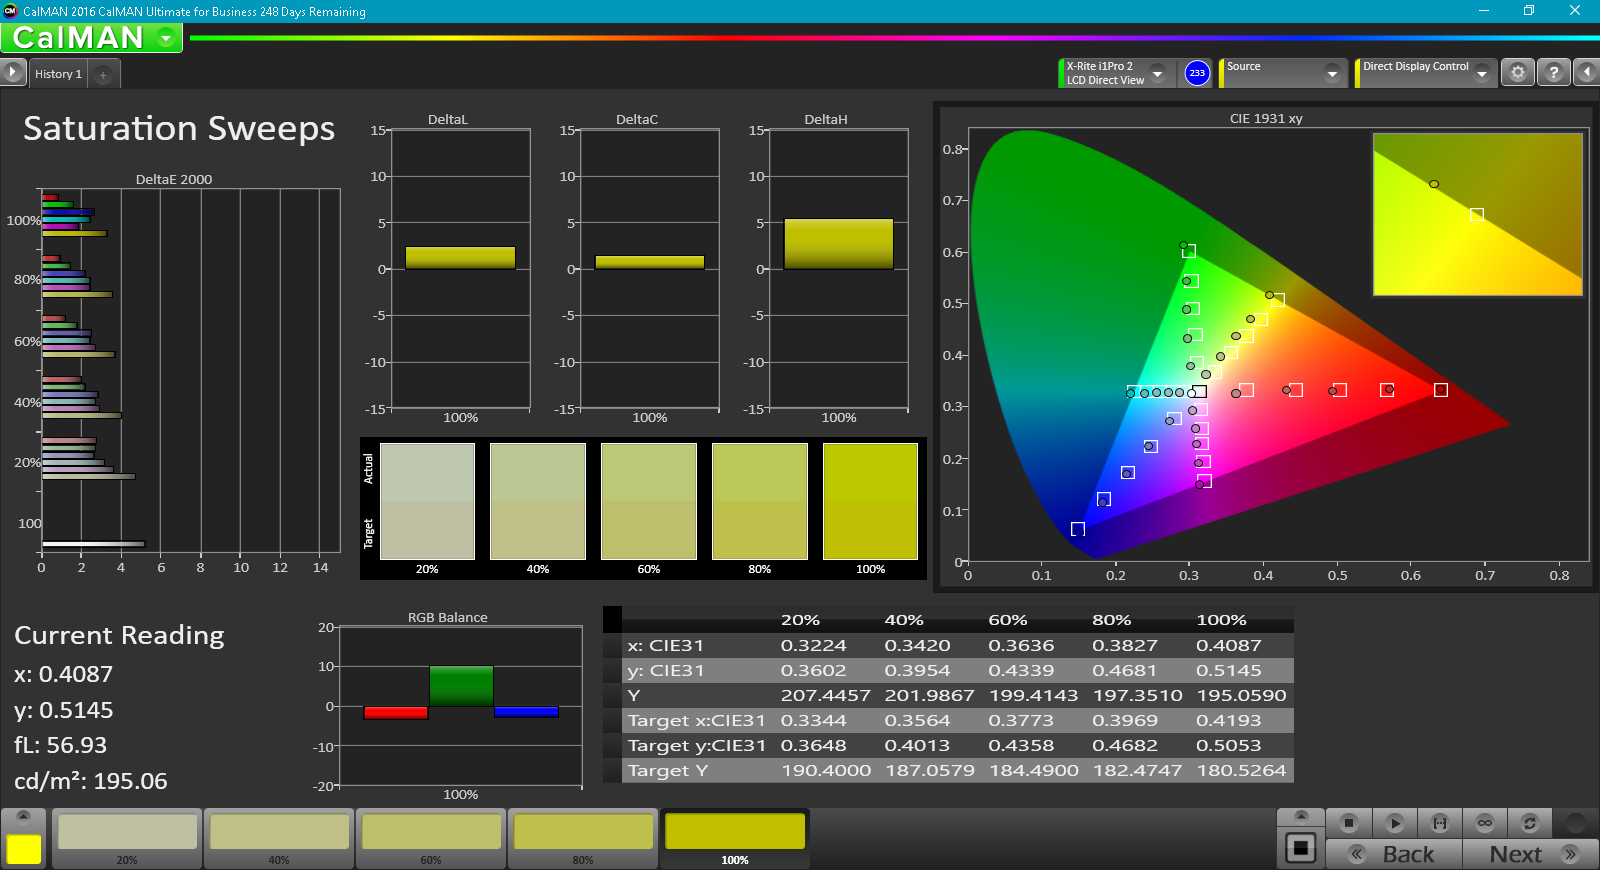
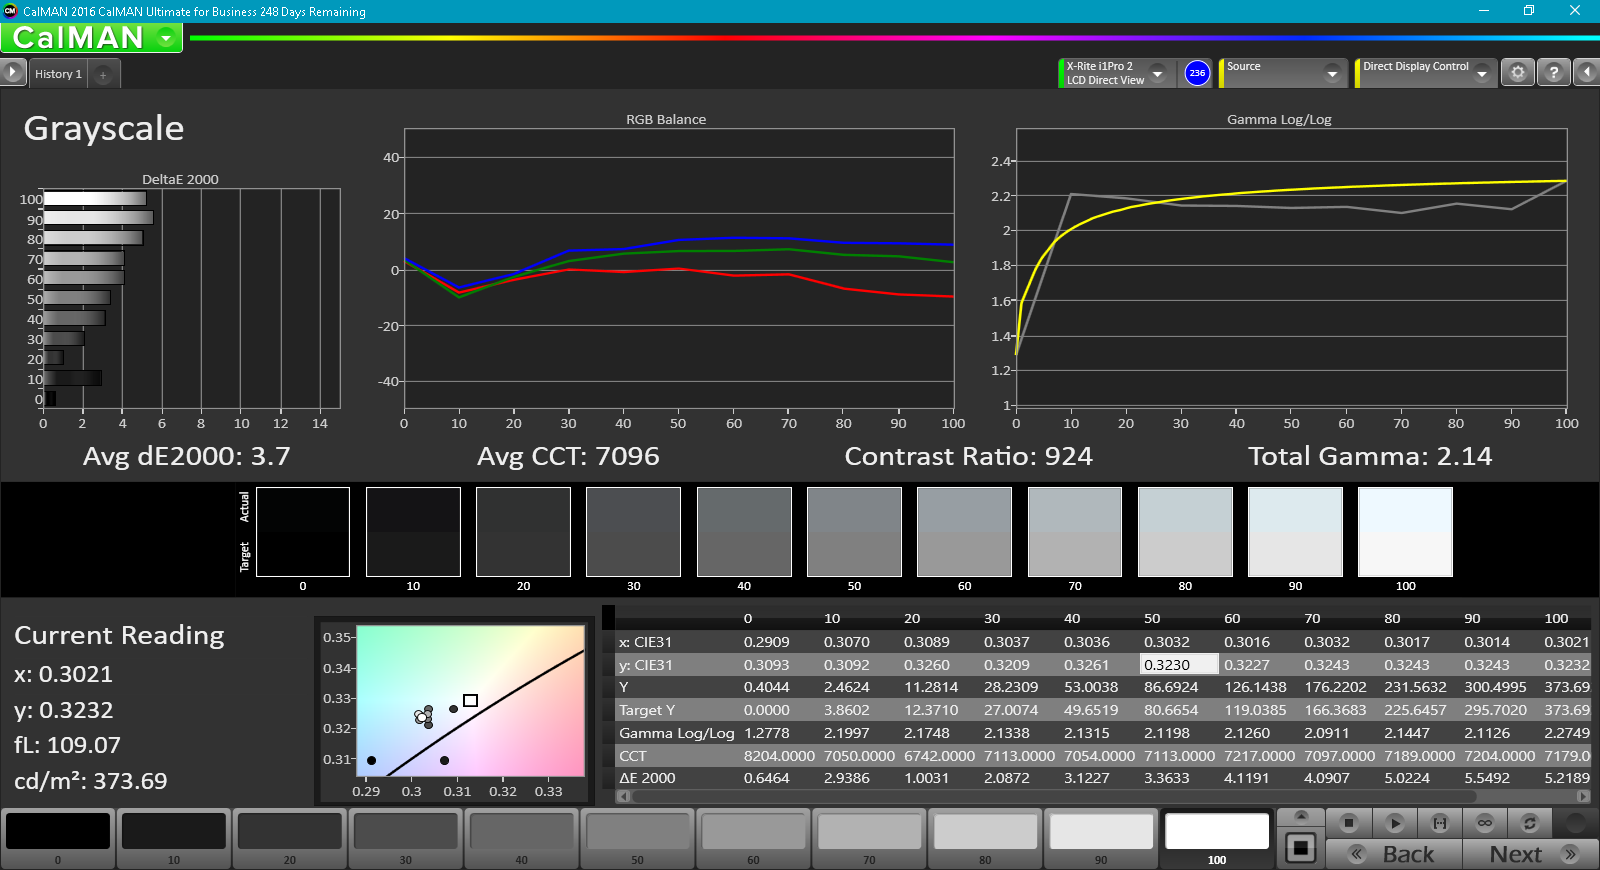
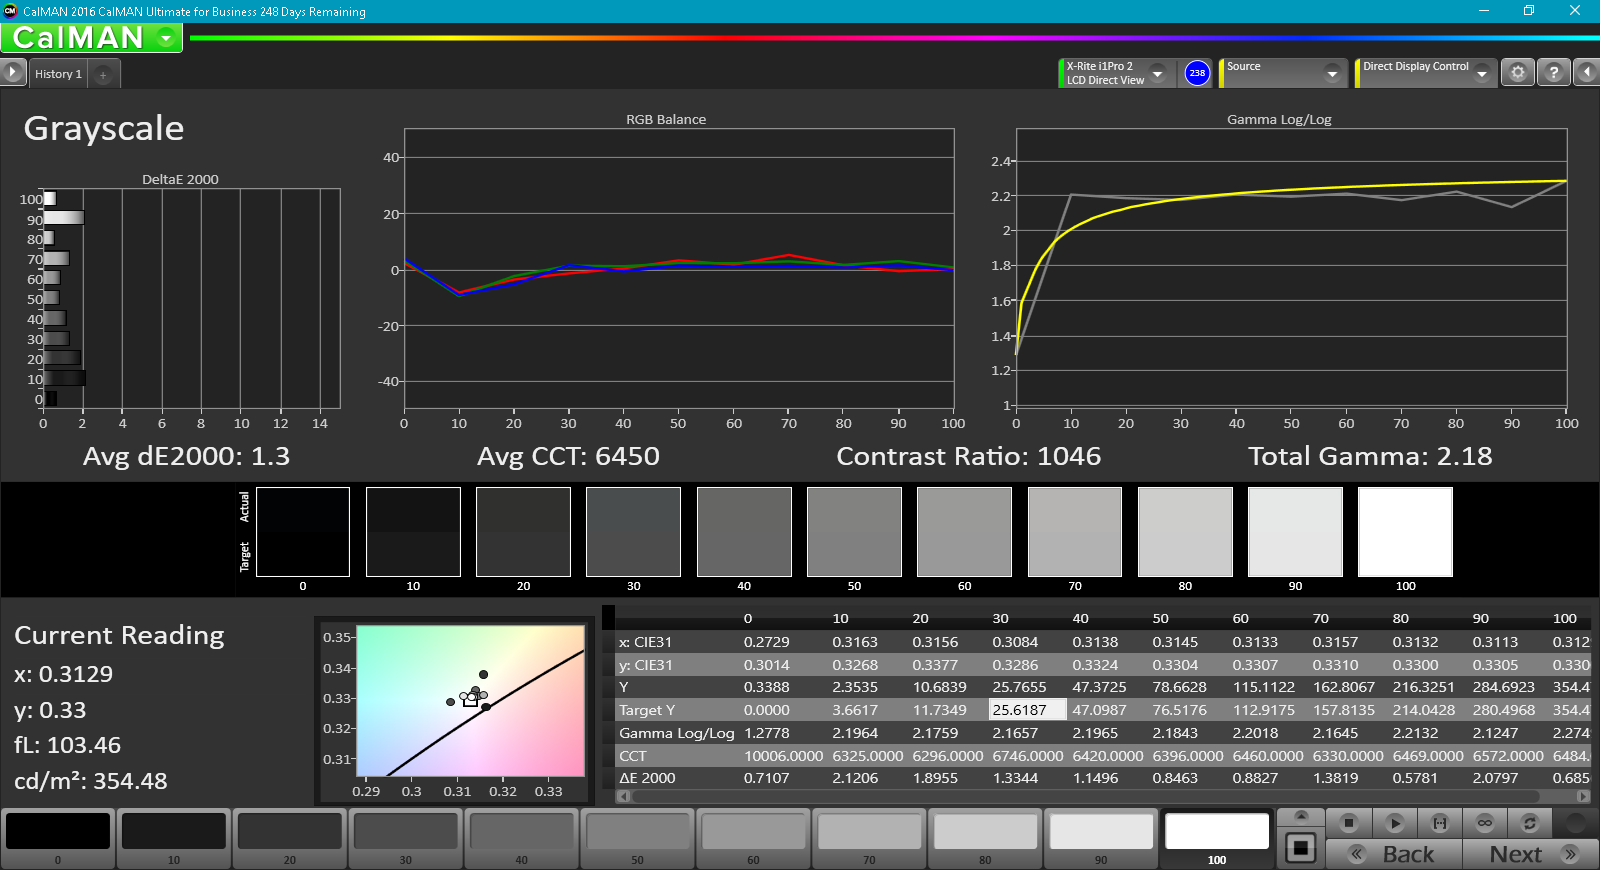
ΔE Greyscale Calman: 3.7 | ∀{0.09-98 Ø4.97}
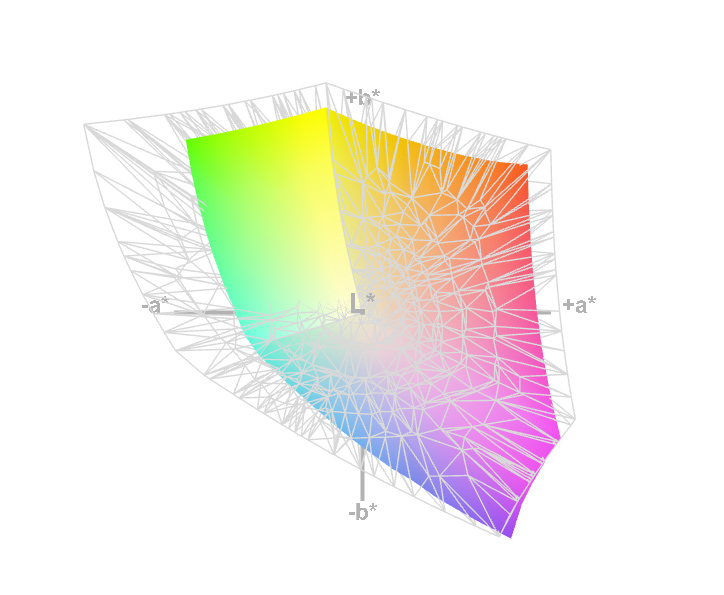
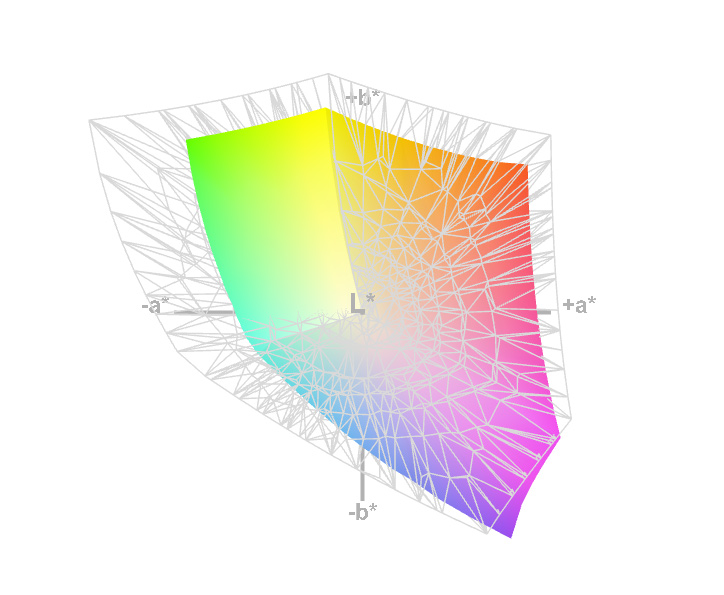
99% sRGB (Argyll 1.6.3 3D)
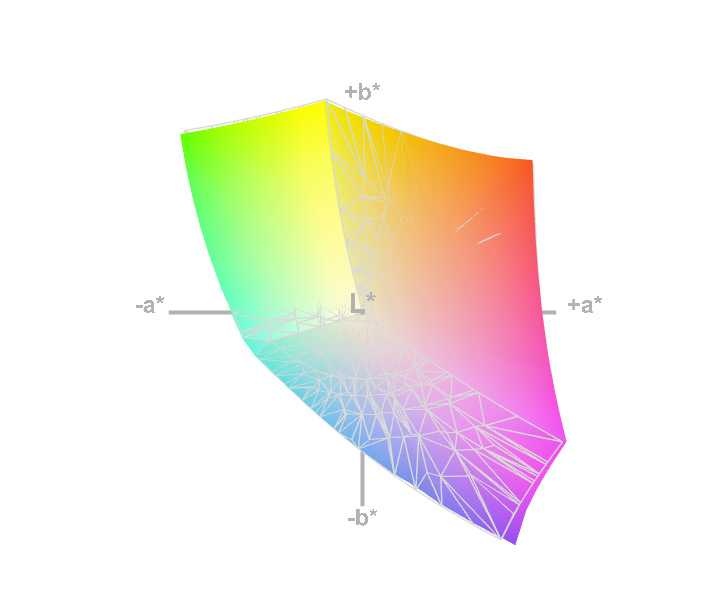
63% AdobeRGB 1998 (Argyll 1.6.3 3D)
68.9% AdobeRGB 1998 (Argyll 3D)
98.5% sRGB (Argyll 3D)
67.4% Display P3 (Argyll 3D)
Gamma: 2.14
CCT: 7096 K
| Dell Precision 5520 UHD SHP1476, IPS, 15.6", 3840x2160 | Dell Precision 5510 SHP143E, 7PHPT_LQ156D1, IGZO LED, 15.6", 3840x2160 | Fujitsu Celsius H760 LGD046F LP156WF6-SPP1, IPS LED, 15.6", 1920x1080 | Dell Precision 7510 (4K IGZO) Sharp LQ156D1, IGZO IPS, 15.6", 3840x2160 | Lenovo ThinkPad P50 LQ156D1JW05, IPS, 15.6", 3840x2160 | |
|---|---|---|---|---|---|
| Display | 26% | -11% | 24% | 23% | |
| Display P3 Coverage (%) | 67.4 | 88.4 31% | 63.9 -5% | 86.2 28% | 85.8 27% |
| sRGB Coverage (%) | 98.5 | 100 2% | 82.4 -16% | 99.7 1% | 98.6 0% |
| AdobeRGB 1998 Coverage (%) | 68.9 | 99.5 44% | 60.3 -12% | 99 44% | 98.2 43% |
| Response Times | 12% | 37% | 33% | 41% | |
| Response Time Grey 50% / Grey 80% * (ms) | 59.2 ? | 56.4 ? 5% | 38 ? 36% | 40.4 ? 32% | 39.2 ? 34% |
| Response Time Black / White * (ms) | 41.6 ? | 34 ? 18% | 26 ? 37% | 27.6 ? 34% | 22 ? 47% |
| PWM Frequency (Hz) | 198.4 ? | 217 | |||
| Screen | 0% | -10% | -1% | -23% | |
| Brightness middle (cd/m²) | 372.4 | 391 5% | 341 -8% | 279.2 -25% | 250 -33% |
| Brightness (cd/m²) | 368 | 361 -2% | 310 -16% | 271 -26% | 250 -32% |
| Brightness Distribution (%) | 90 | 87 -3% | 82 -9% | 83 -8% | 86 -4% |
| Black Level * (cd/m²) | 0.48 | 0.4 17% | 0.34 29% | 0.266 45% | 0.31 35% |
| Contrast (:1) | 776 | 978 26% | 1003 29% | 1050 35% | 806 4% |
| Colorchecker dE 2000 * | 2.6 | 4.85 -87% | 3.8 -46% | 4.14 -59% | 4.5 -73% |
| Colorchecker dE 2000 max. * | 5.6 | 10.8 -93% | 6.56 -17% | 9.3 -66% | |
| Greyscale dE 2000 * | 3.7 | 4.01 -8% | 2 46% | 3.26 12% | 7.2 -95% |
| Gamma | 2.14 103% | 2.18 101% | 2.17 101% | 2.19 100% | 2.31 95% |
| CCT | 7096 92% | 7340 89% | 6581 99% | 6375 102% | 6399 102% |
| Color Space (Percent of AdobeRGB 1998) (%) | 63 | 96 52% | 54 -14% | 85.68 36% | 85 35% |
| Color Space (Percent of sRGB) (%) | 99 | 100 1% | 82.2 -17% | 99.72 1% | 98.6 0% |
| Total Average (Program / Settings) | 13% /
7% | 5% /
-4% | 19% /
9% | 14% /
-5% |
* ... smaller is better
We measured an average brightness of 368 cd/m² with a very good distribution of 90%; that’s bright enough for any indoor environment, which is fortunate, since the high reflectivity of the panel is a bit of an obstacle in some situations. The contrast of 776:1 is slightly less impressive, driven lower by a rather high black value of 0.48 cd/m².
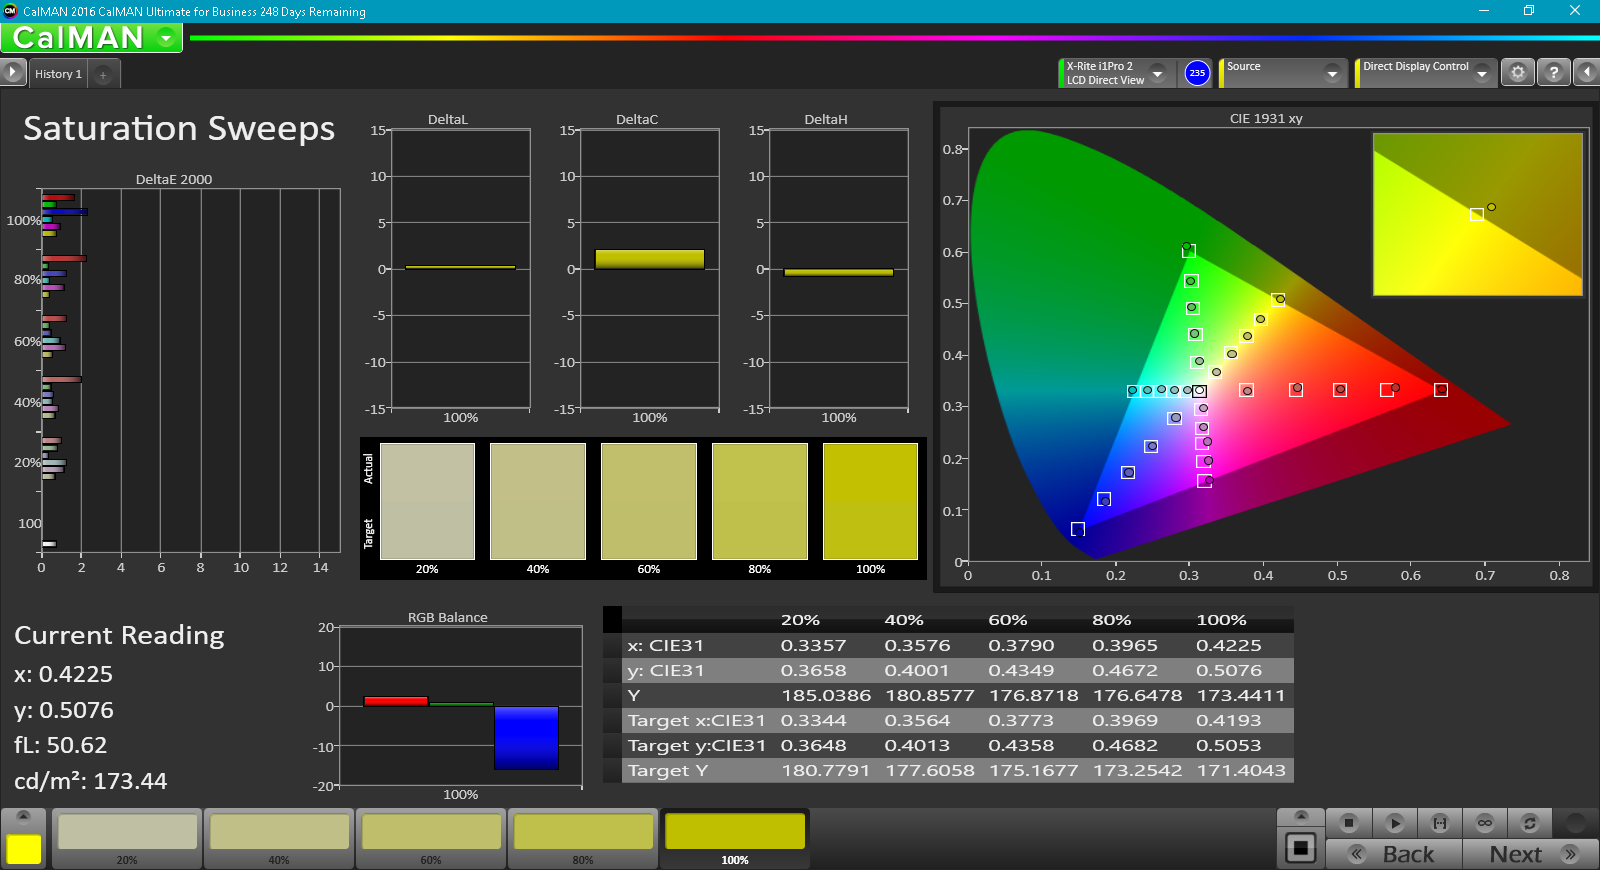
According to our measurements, 99% of sRGB and 63% of the AdobeRGB gamut are covered by the display panel. These values are lower than quoted by the manufacturer (100% AdobeRGB); the previous Precision 5510 managed 95% AdobeRGB, so this is a bit of a disappointment. This is all the more puzzling considering that the display panel model is practically identical to that of the 7510 and ThinkPad P50. We reached out to Dell to inquire about settings that might be adjustable to improve these numbers, as we’ll update our review if we receive any helpful advice to that effect.
Update: Dell informs us post-review that by activating PremierColor, the full AdobeRGB gamut coverage is unlocked.

CalMAN 5 measurements yielded a Total Gamma value of 2.14, which isn’t far from the ideal value of 2.4. The CCT Average of 7096 is also closer to 6500K than the 5510 was, but not as close as that of the other competitors in today’s comparison. Fortunately, color accuracy is very good, with pre-calibration values of 2.6 and 3.7 in Colorchecker and Greyscale DeltaE2000, respectively.
Display Response Times
| ↔ Response Time Black to White | ||
|---|---|---|
| 41.6 ms ... rise ↗ and fall ↘ combined | ↗ 26.8 ms rise | 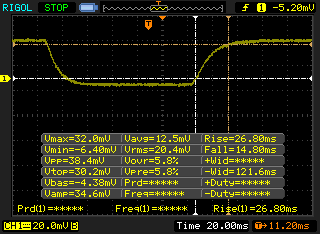 |
| ↘ 14.8 ms fall | ||
| The screen shows slow response rates in our tests and will be unsatisfactory for gamers. In comparison, all tested devices range from 0.1 (minimum) to 240 (maximum) ms. » 98 % of all devices are better. This means that the measured response time is worse than the average of all tested devices (19.8 ms). | ||
| ↔ Response Time 50% Grey to 80% Grey | ||
| 59.2 ms ... rise ↗ and fall ↘ combined | ↗ 27.6 ms rise | 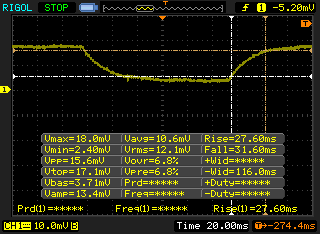 |
| ↘ 31.6 ms fall | ||
| The screen shows slow response rates in our tests and will be unsatisfactory for gamers. In comparison, all tested devices range from 0.165 (minimum) to 636 (maximum) ms. » 95 % of all devices are better. This means that the measured response time is worse than the average of all tested devices (31 ms). | ||
Screen Flickering / PWM (Pulse-Width Modulation)
| Screen flickering / PWM not detected | 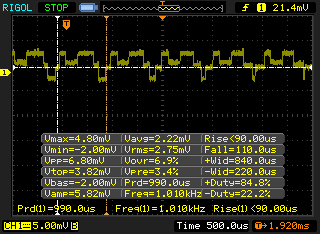 | ||
In comparison: 52 % of all tested devices do not use PWM to dim the display. If PWM was detected, an average of 7747 (minimum: 5 - maximum: 343500) Hz was measured. | |||
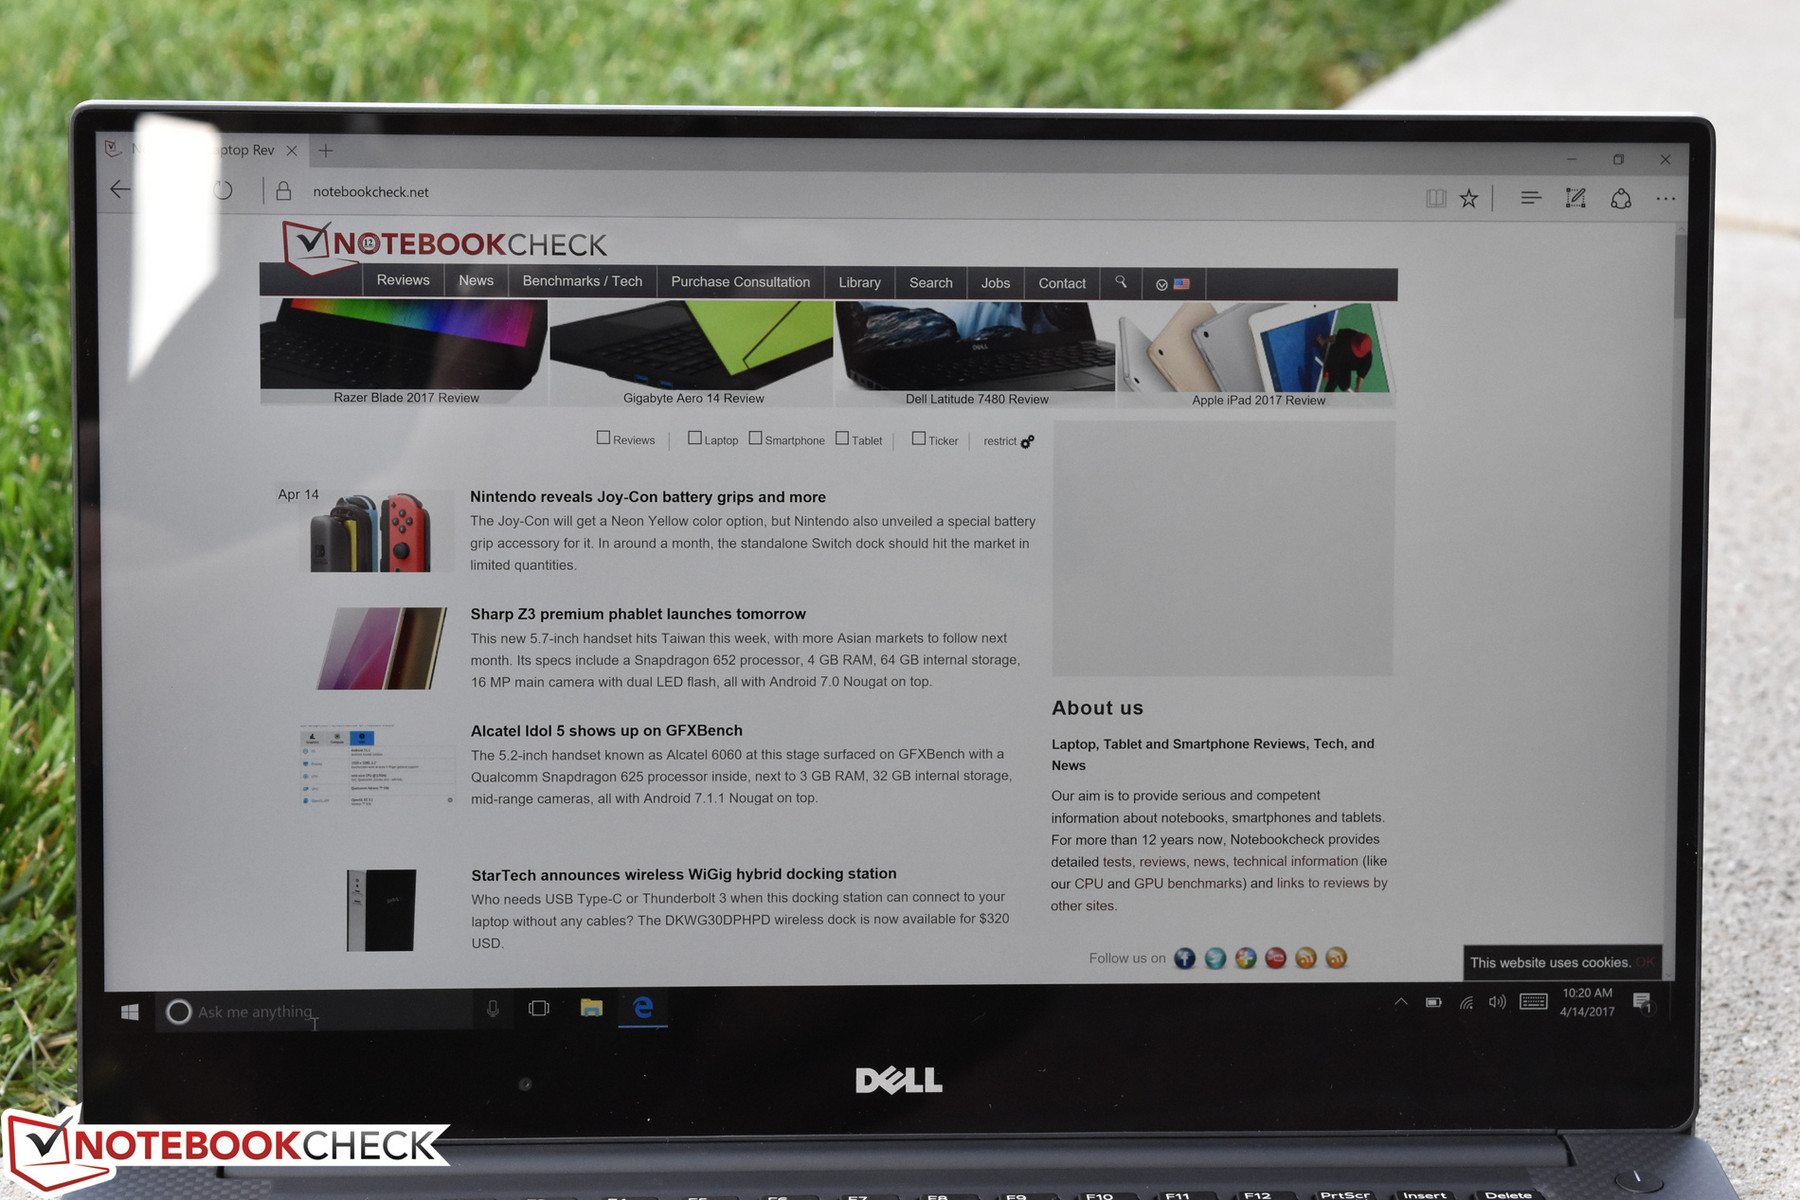
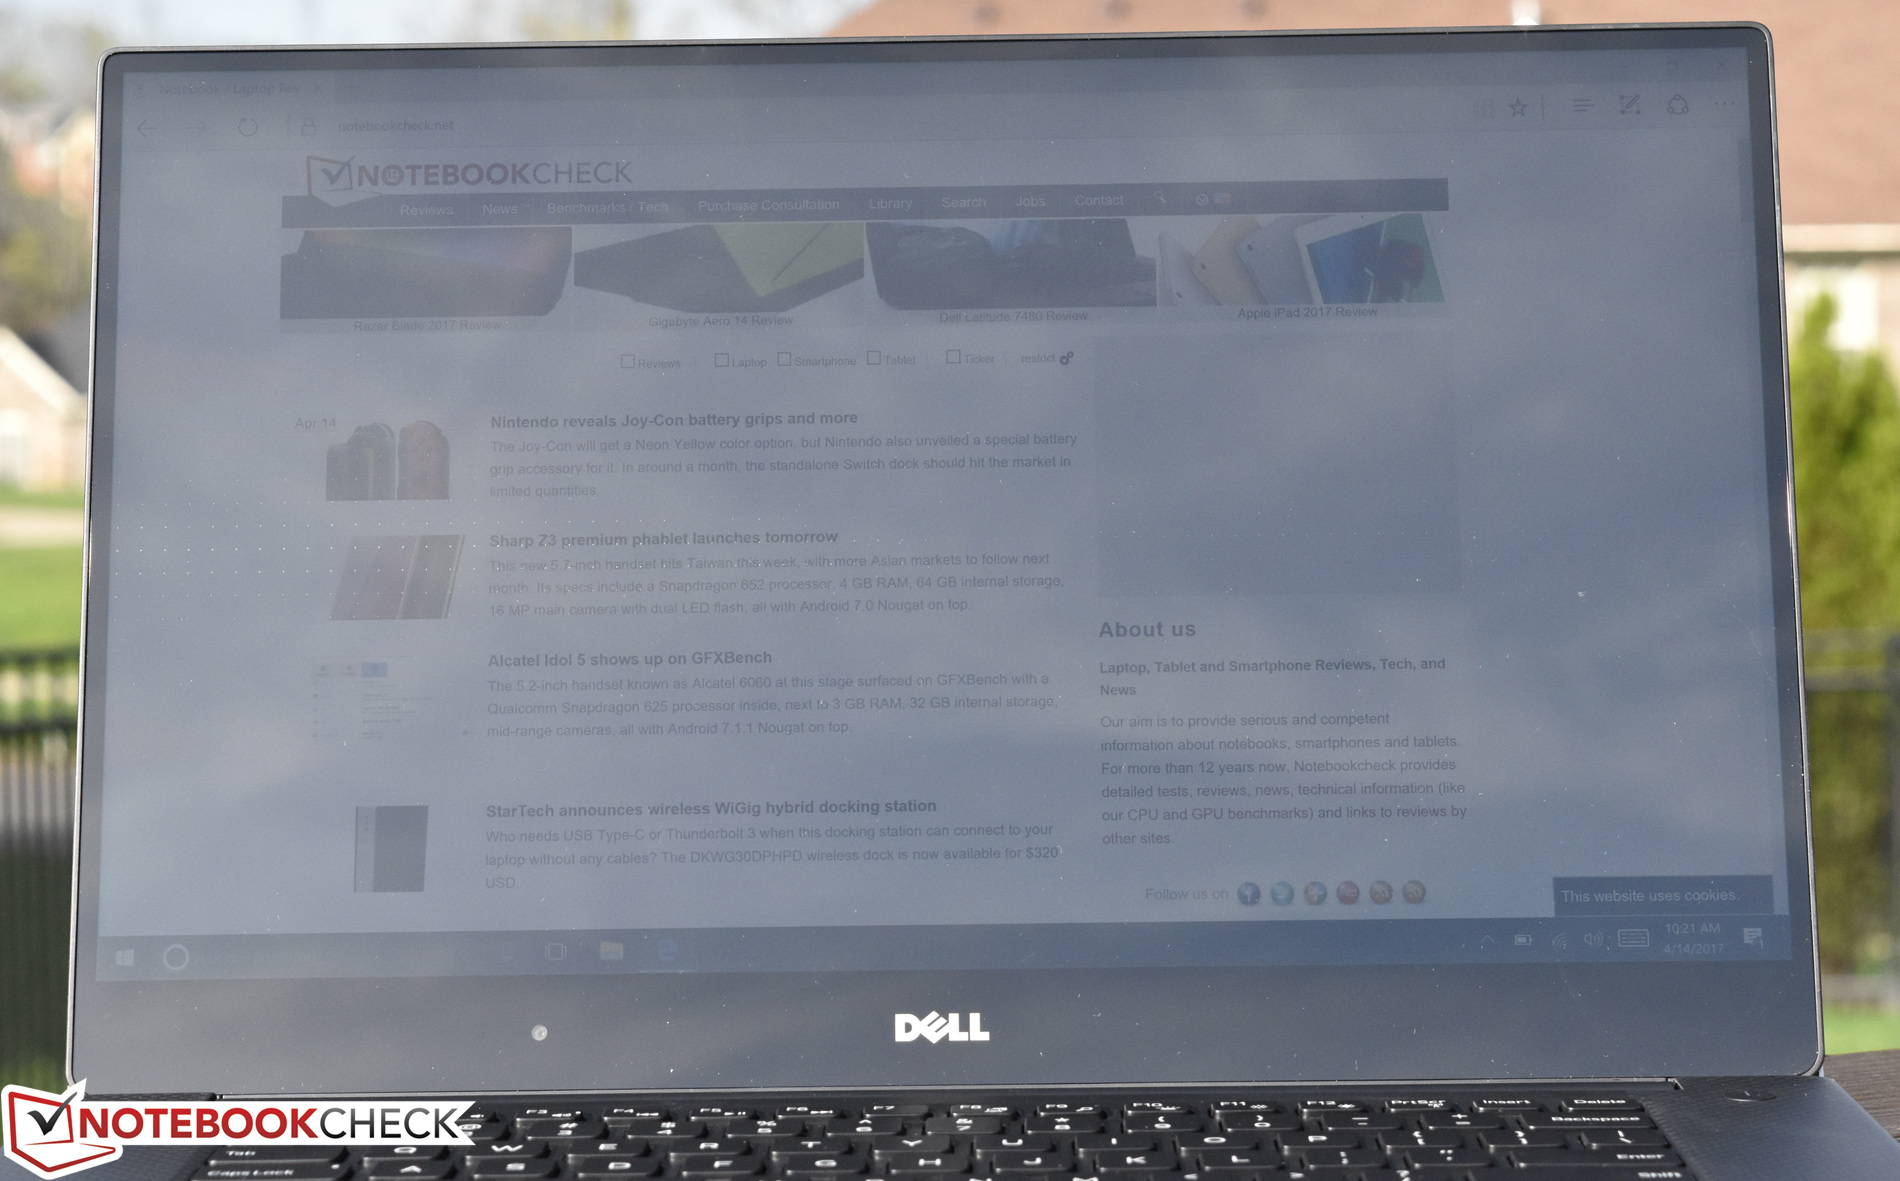
Outdoors, the display struggles due to the highly reflective finish, though it is usable in shaded areas (after some strategic positioning) thanks to the relatively high brightness and good contrast. Viewing angles of the IPS panel are excellent.
Performance
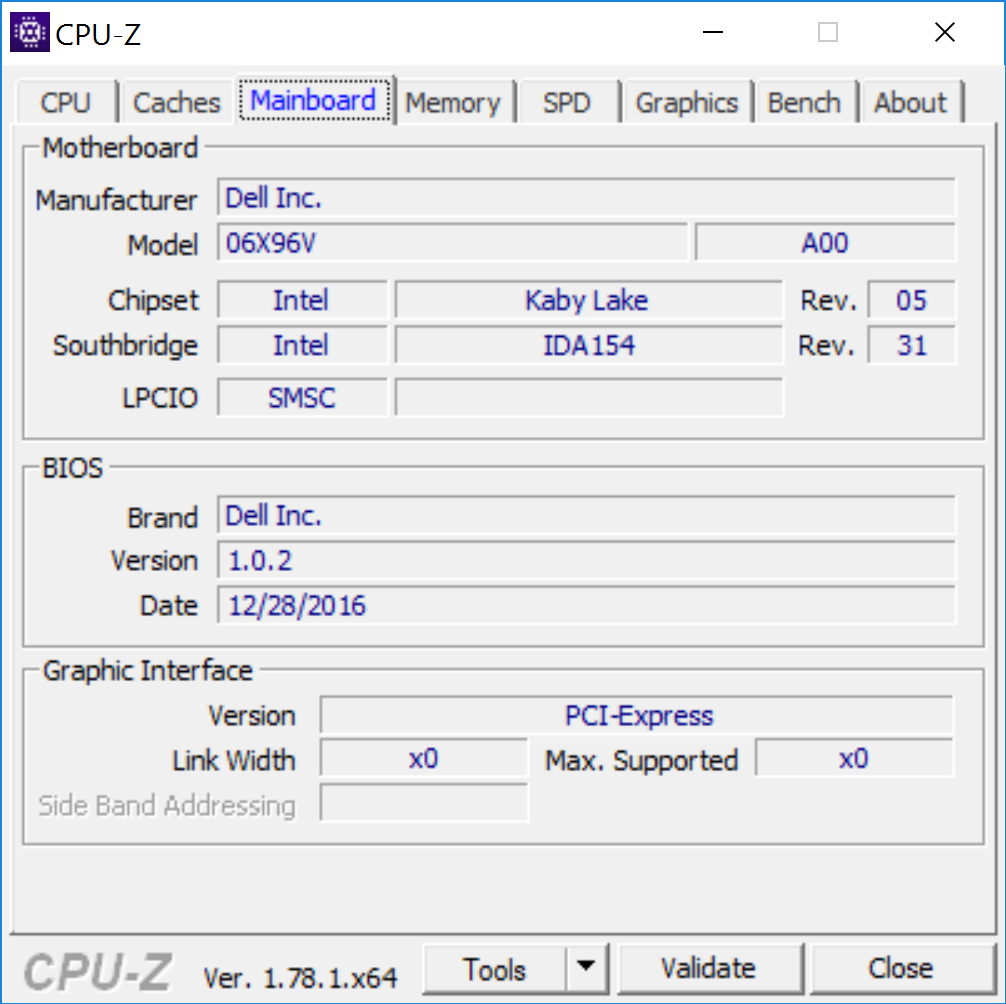
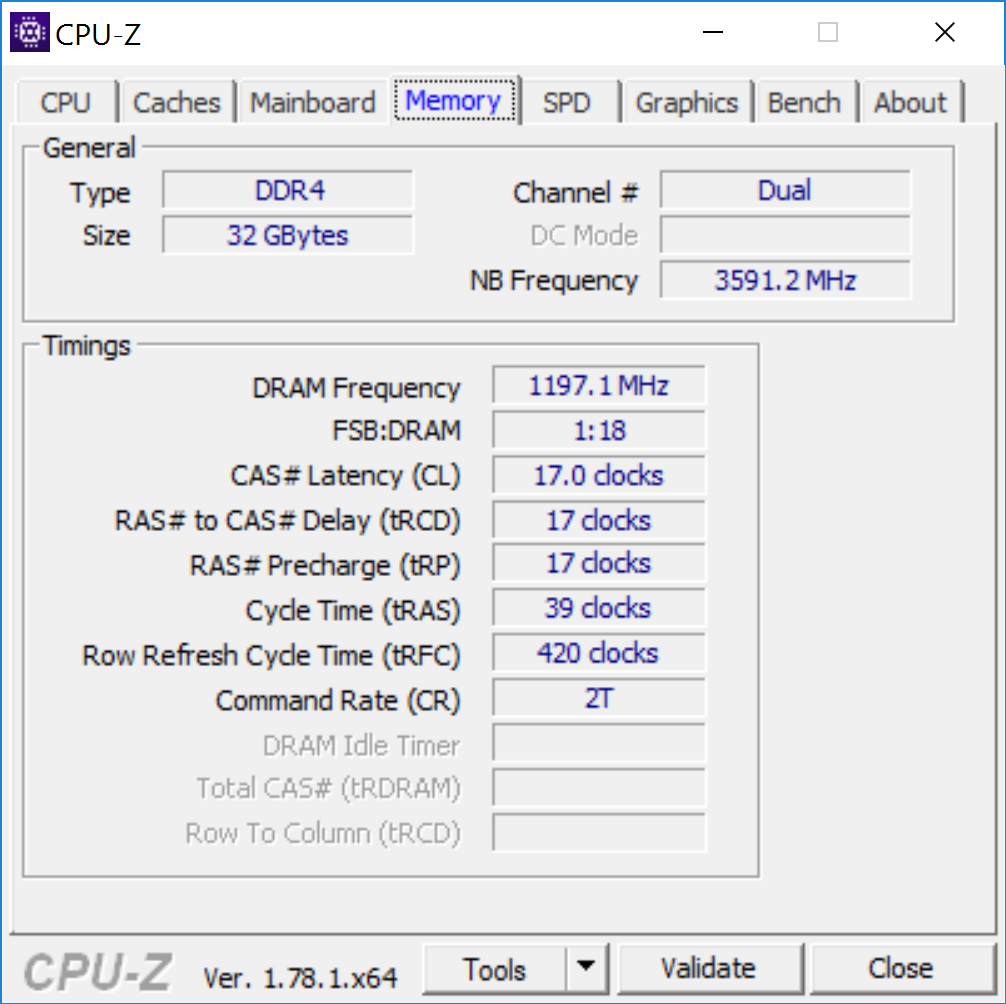
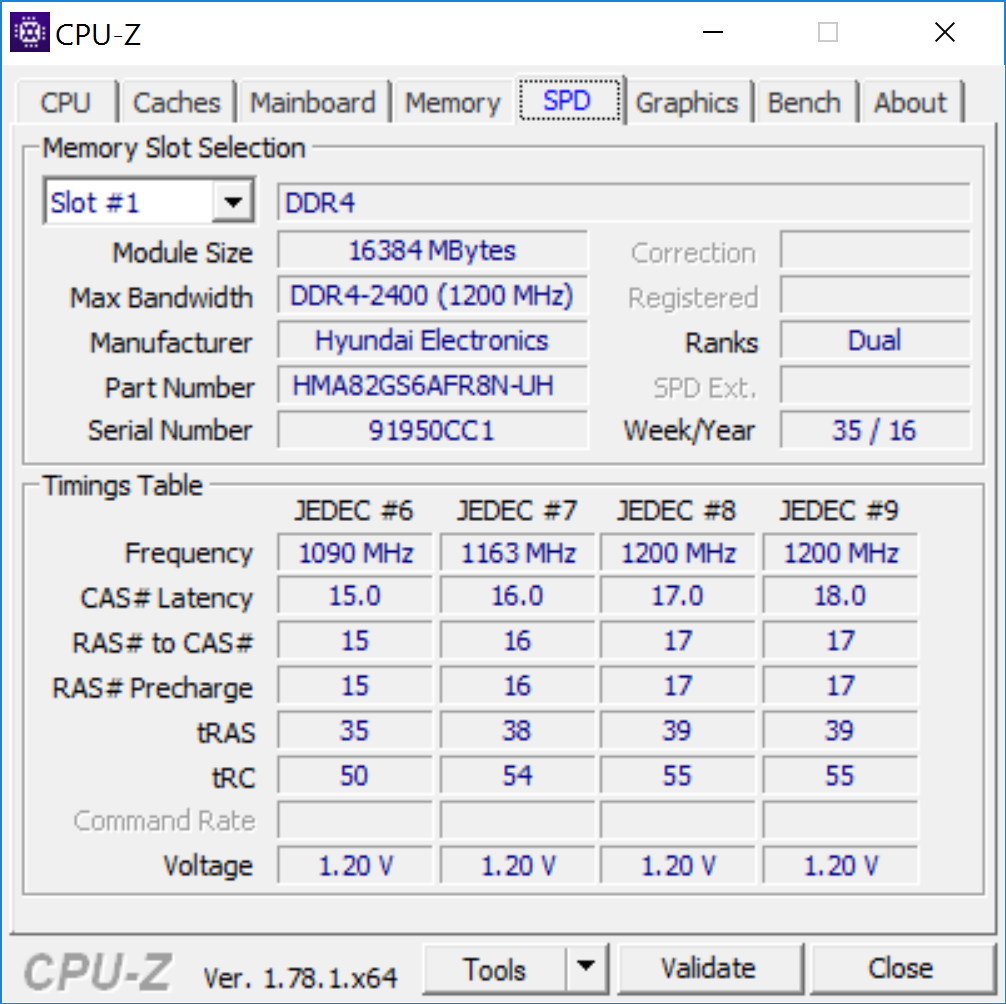
Of course, performance is of principal concern when evaluating mobile workstations, and to that end, Dell provides a wide range of configuration options. On the CPU front, options range from an Intel Core i5-7300HQ all the way up to an Intel Core Xeon E3-1505M v6 (all options are quad-core). Our review unit included the latter, which is the priciest of all processor selections ($392 more than the Core i5 option as of this writing). The machine supports up to 32 GB of DDR4 memory—which, again, is what our machine was supplied with. Storage options range from mechanical drives up to a 1 TB M.2 PCIe NVMe SSD.
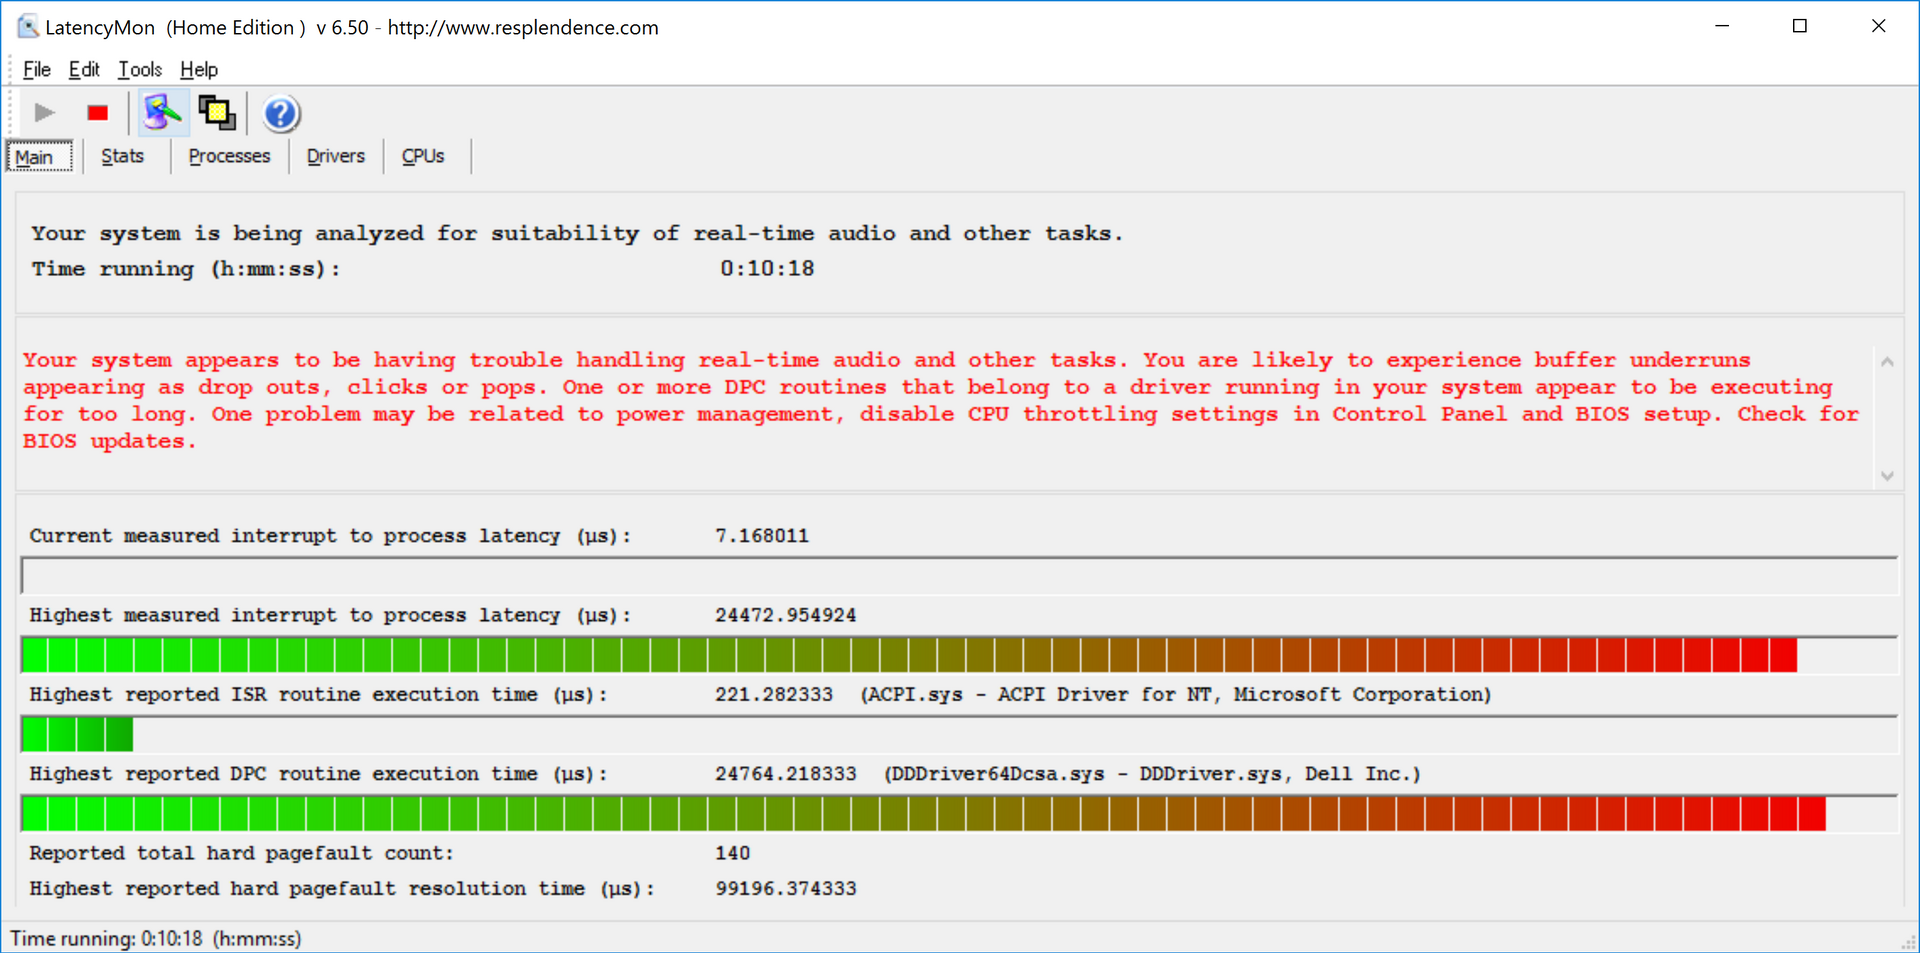
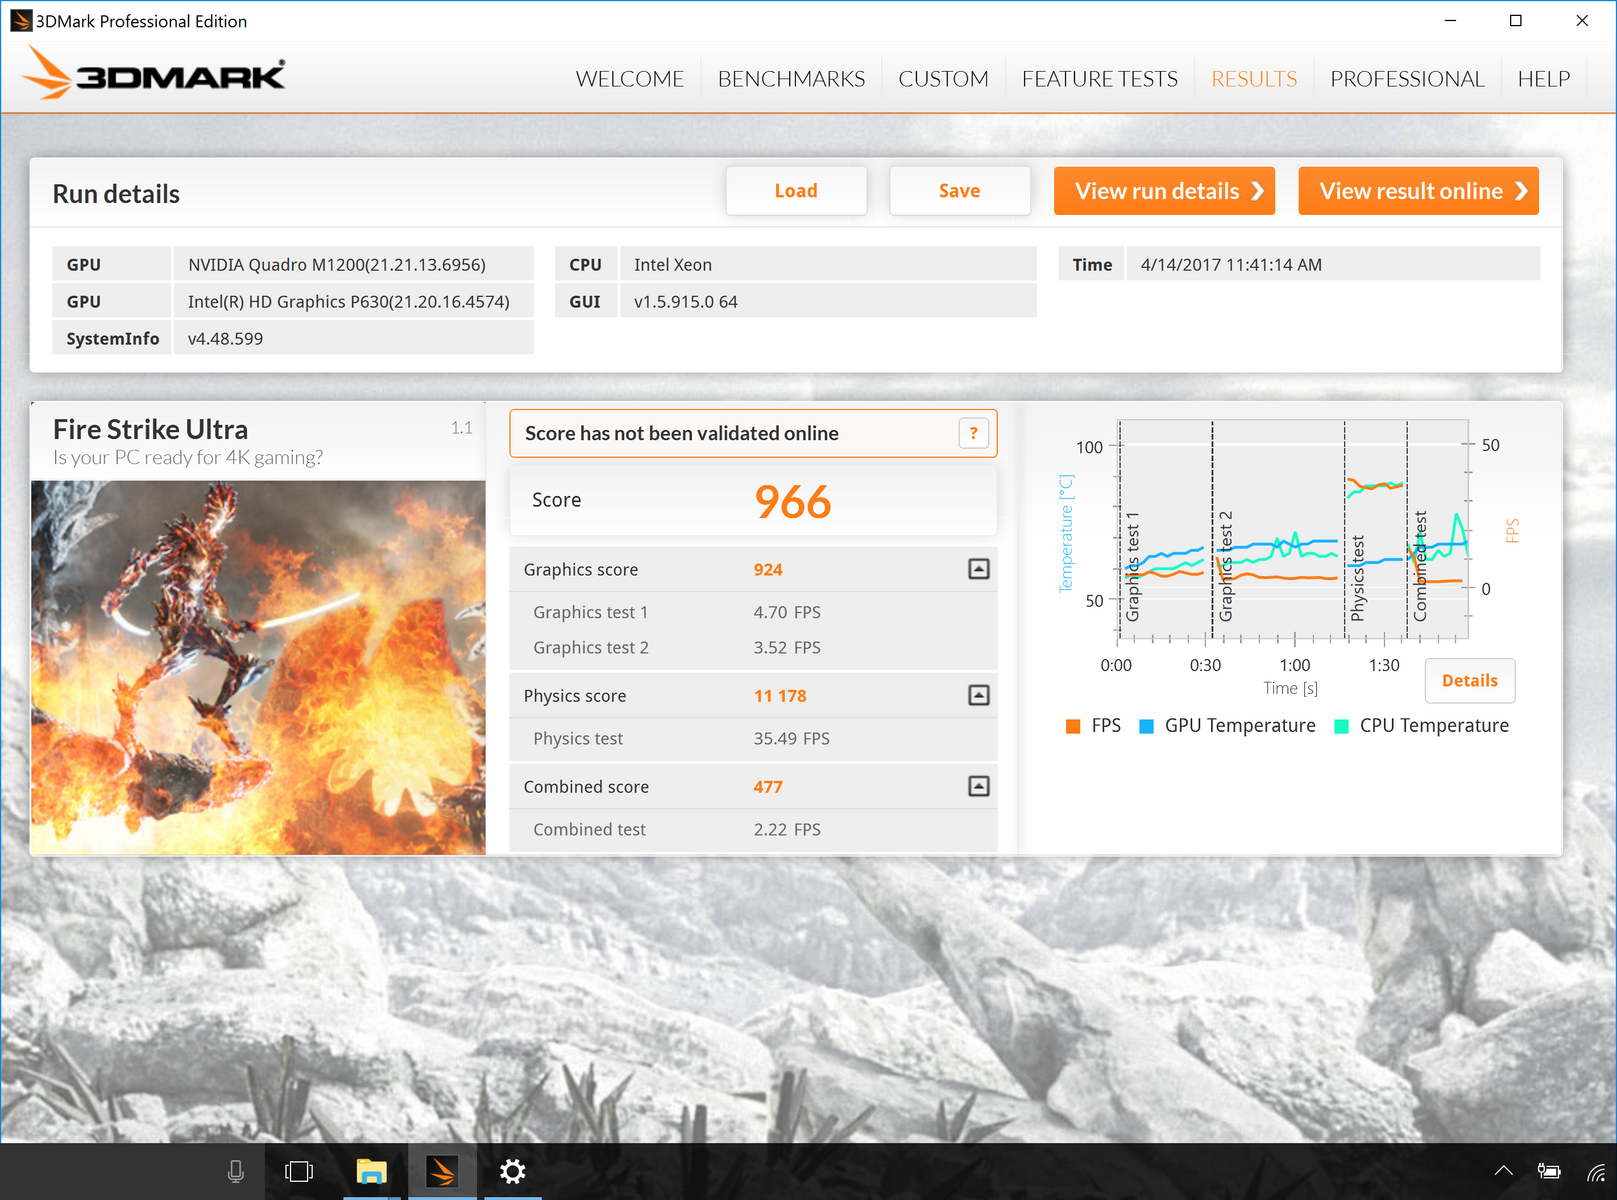
Oddly enough, we had trouble completing 3DMark benchmarks while running unplugged. We tried both 3DMark 06 and 3DMark 11 to no avail (both resulted in an error part of the way through). Elsewhere, LatencyMon reported occasional spikes in latency likely related to driver or power management. A later attempt to update drivers did not completely resolve these hiccups, but eventually disabling Wi-Fi did; in the machine’s defense, the spikes were relatively infrequent anyway.
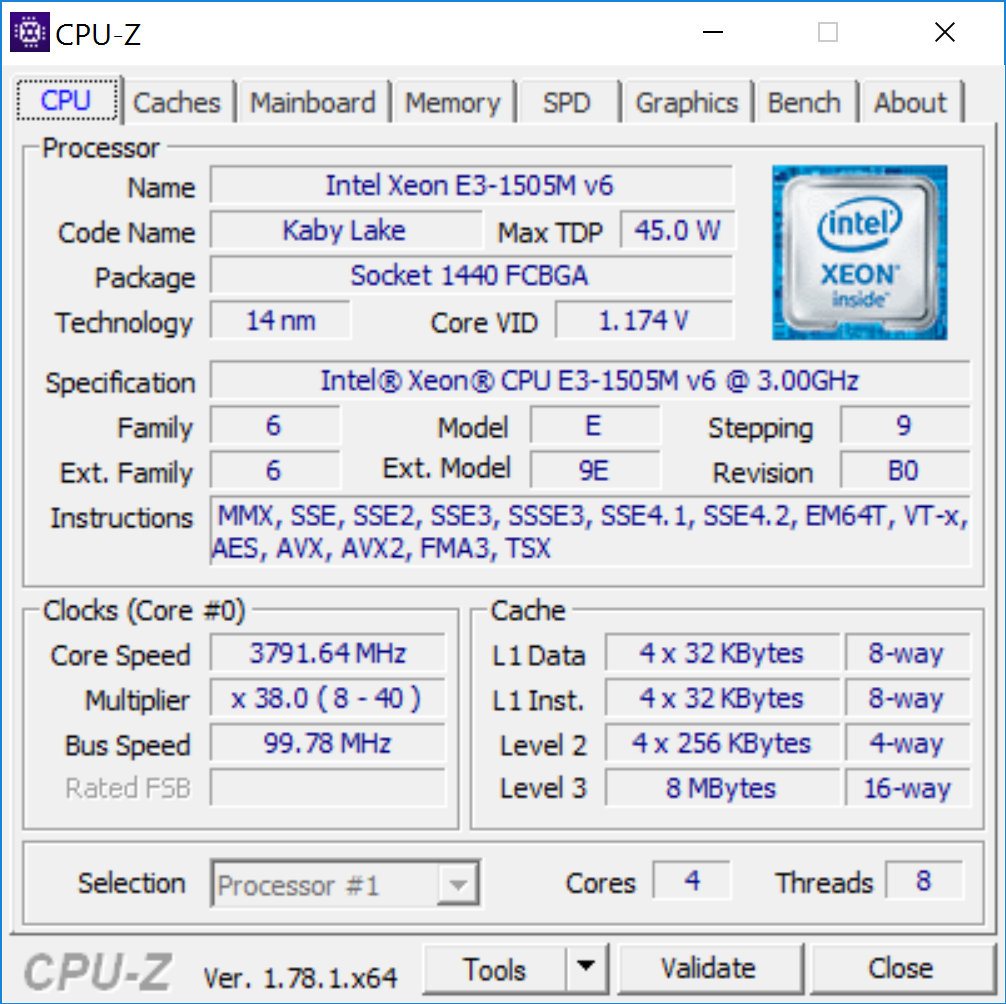
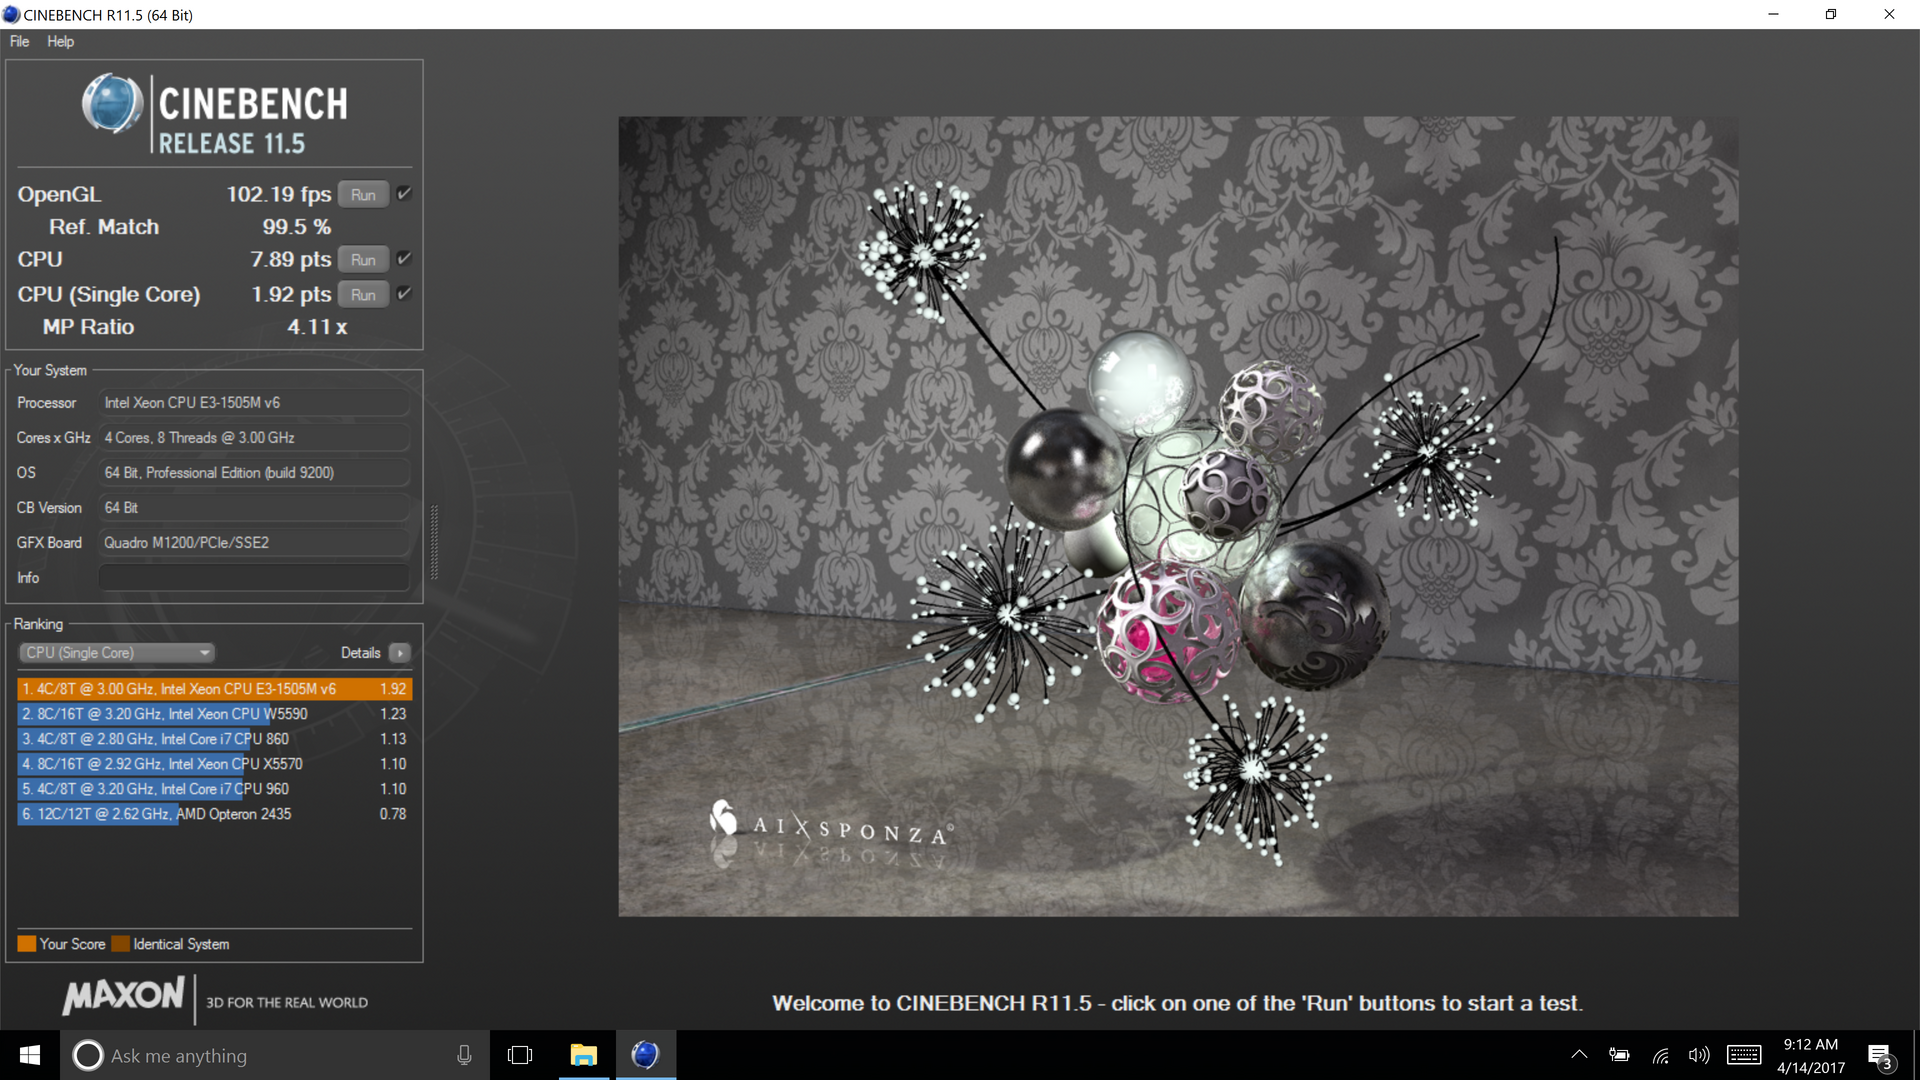
Processor
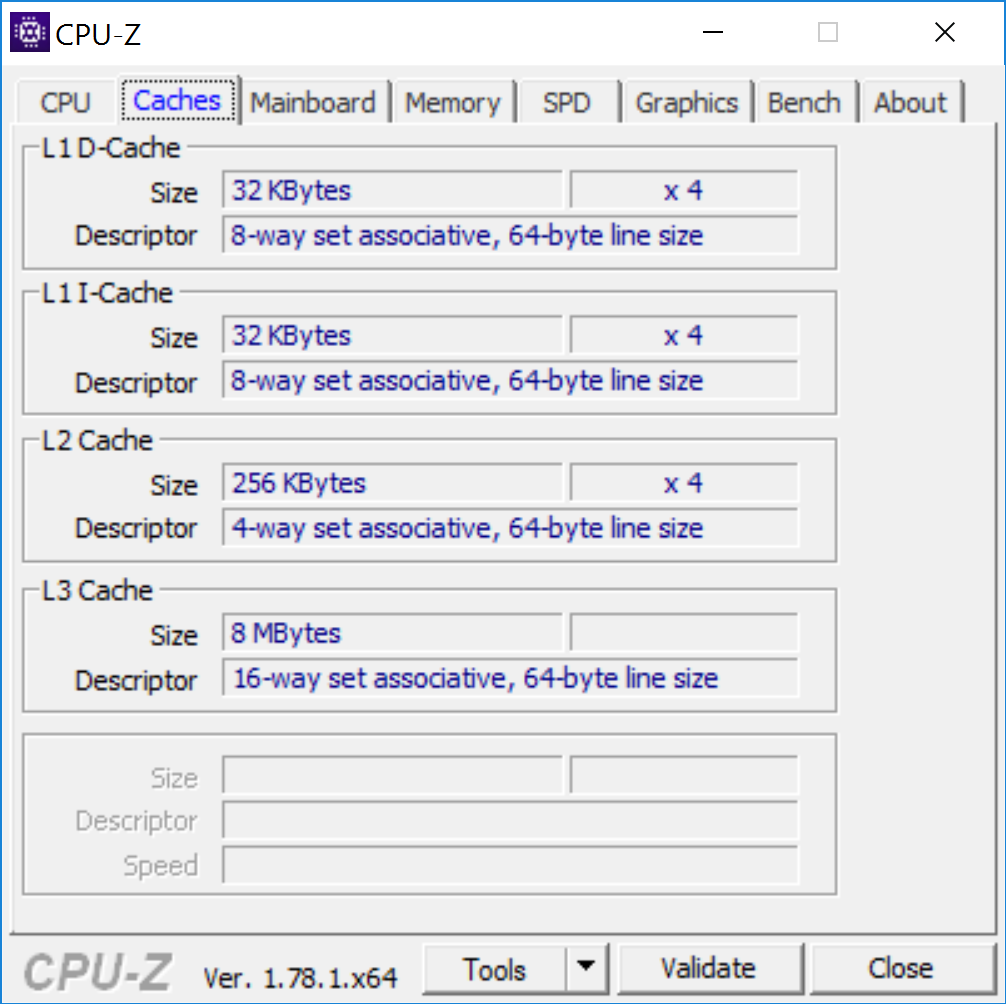
The Intel Xeon E3-1505M v6 included in our review unit is a quad-core CPU (based on the Kaby Lake 14 nm architecture) with a base clock rate of 3.0 GHz and a turbo clock rate up to 4.0 GHz (2 cores: 3.8 GHz, 4 cores: 3.6 GHz). The Precision 5520 is the first machine we have evaluated with this CPU, but on paper at least, it certainly looks promising. This is not to be confused, by the way, with the Xeon E3-1505M v5 which was included in our Prevision 5510 review unit; that CPU (from the Skylake lineup) features a lower clock rate of 2.8 to 3.7 GHz.
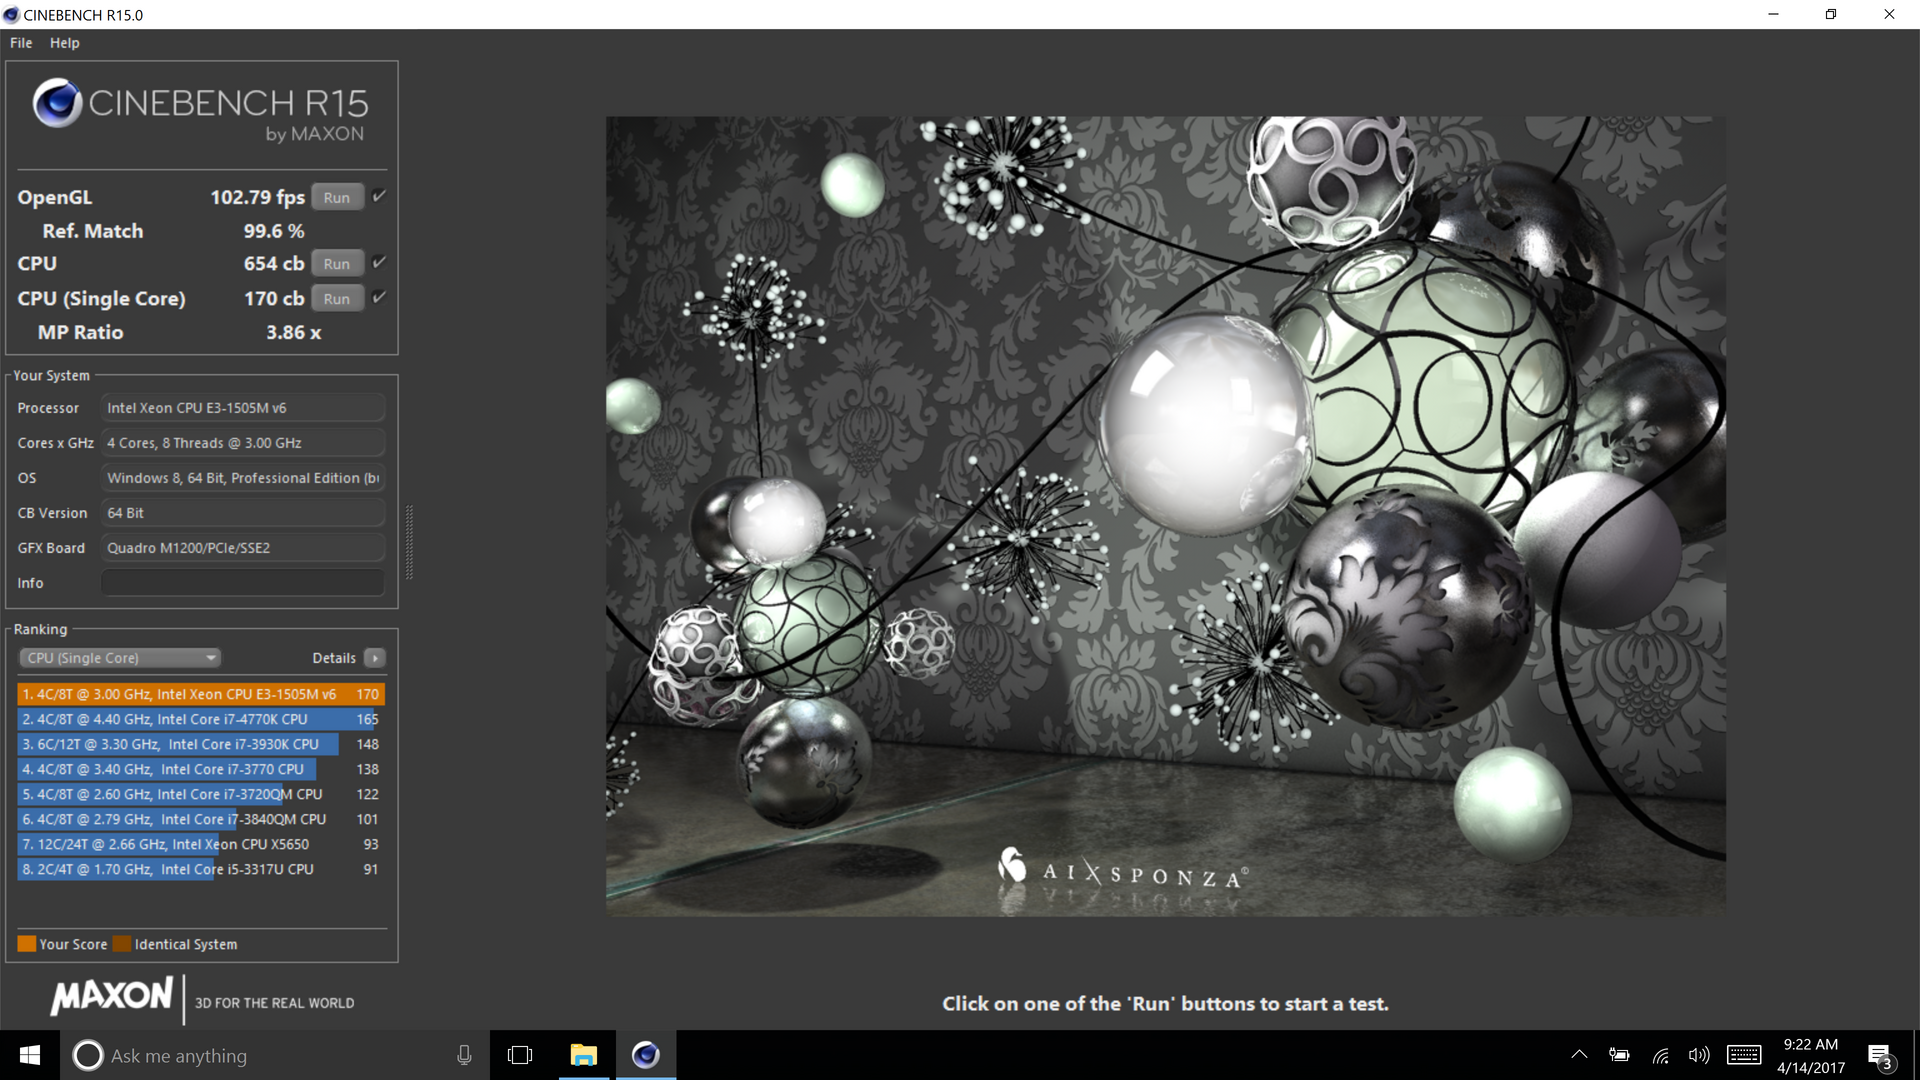
Our CPU performance benchmarks from the Precision 5520 are unfortunately a mixed bag. Whereas single-threaded benchmarks consistently place the 5520 at the front of the race (by a margin of roughly 5 to 6% ahead of the Precision 7510’s Xeon E3-1535M v5), multi-threaded benchmarks provide the polar opposite. Here, instead, the 5520 is always near the bottom of the list.
However, as opposed to a referendum on the performance of the Xeon CPU, this is likely due to performance throttling at the machine level—thermal, specifically. During our new Cinebench R15 loop stress test, we noted CPU temperatures quickly and frequently spiking above the 90 °C mark—at which point the machine would reduce its clock speed to around 3.0 GHz, or even sometimes throttle it below that (~2.6 GHz). This is the reason for the erratic results we recorded in sustained Cinebench R15 multi-CPU performance—and unfortunately, it means that the machine will be subject to these same constraints in real-world scenarios involving heavy CPU usage. Be advised that the Precision 5520 (as equipped), as beautiful as it is, cannot maintain turbo clock rates long enough to justify the difference in cost associated with the higher-end CPU options. Please see our graph below for much more detail on this constraint.
| wPrime 2.10 - 1024m | |
| Dell Precision 7510 (4K IGZO) | |
| Dell Precision 5520 UHD | |
| Dell Precision 5510 | |
| Dell XPS 15 9560 (i7-7700HQ, UHD) | |
* ... smaller is better
System Performance
The Precision 5520 handles everyday tasks with ease, but it’s the heavier activities for which it’s designed. In our PCMark 8 synthetic benchmarks, the machine mostly scores nearby other UHD-equipped models, excepting PCMark 8 Home, where it’s roughly 12 to 15% below the other two Precision machines and the ThinkPad P50.
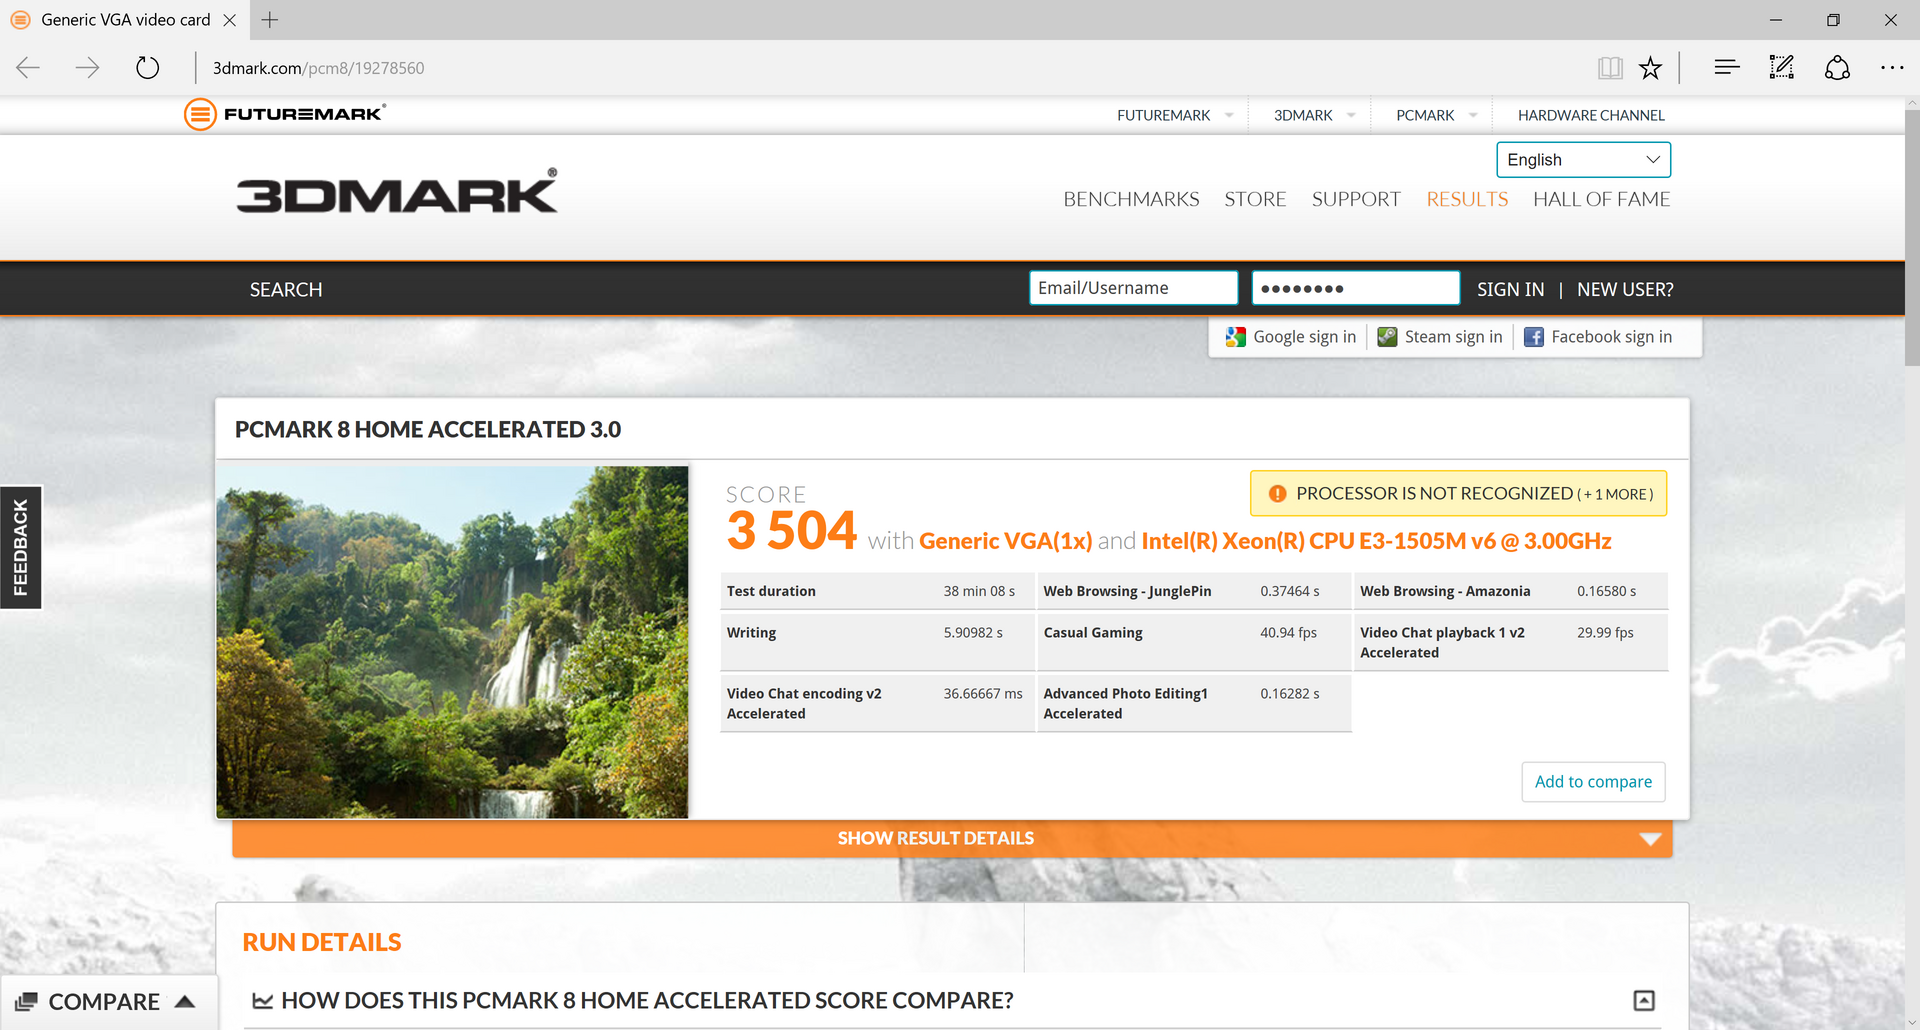
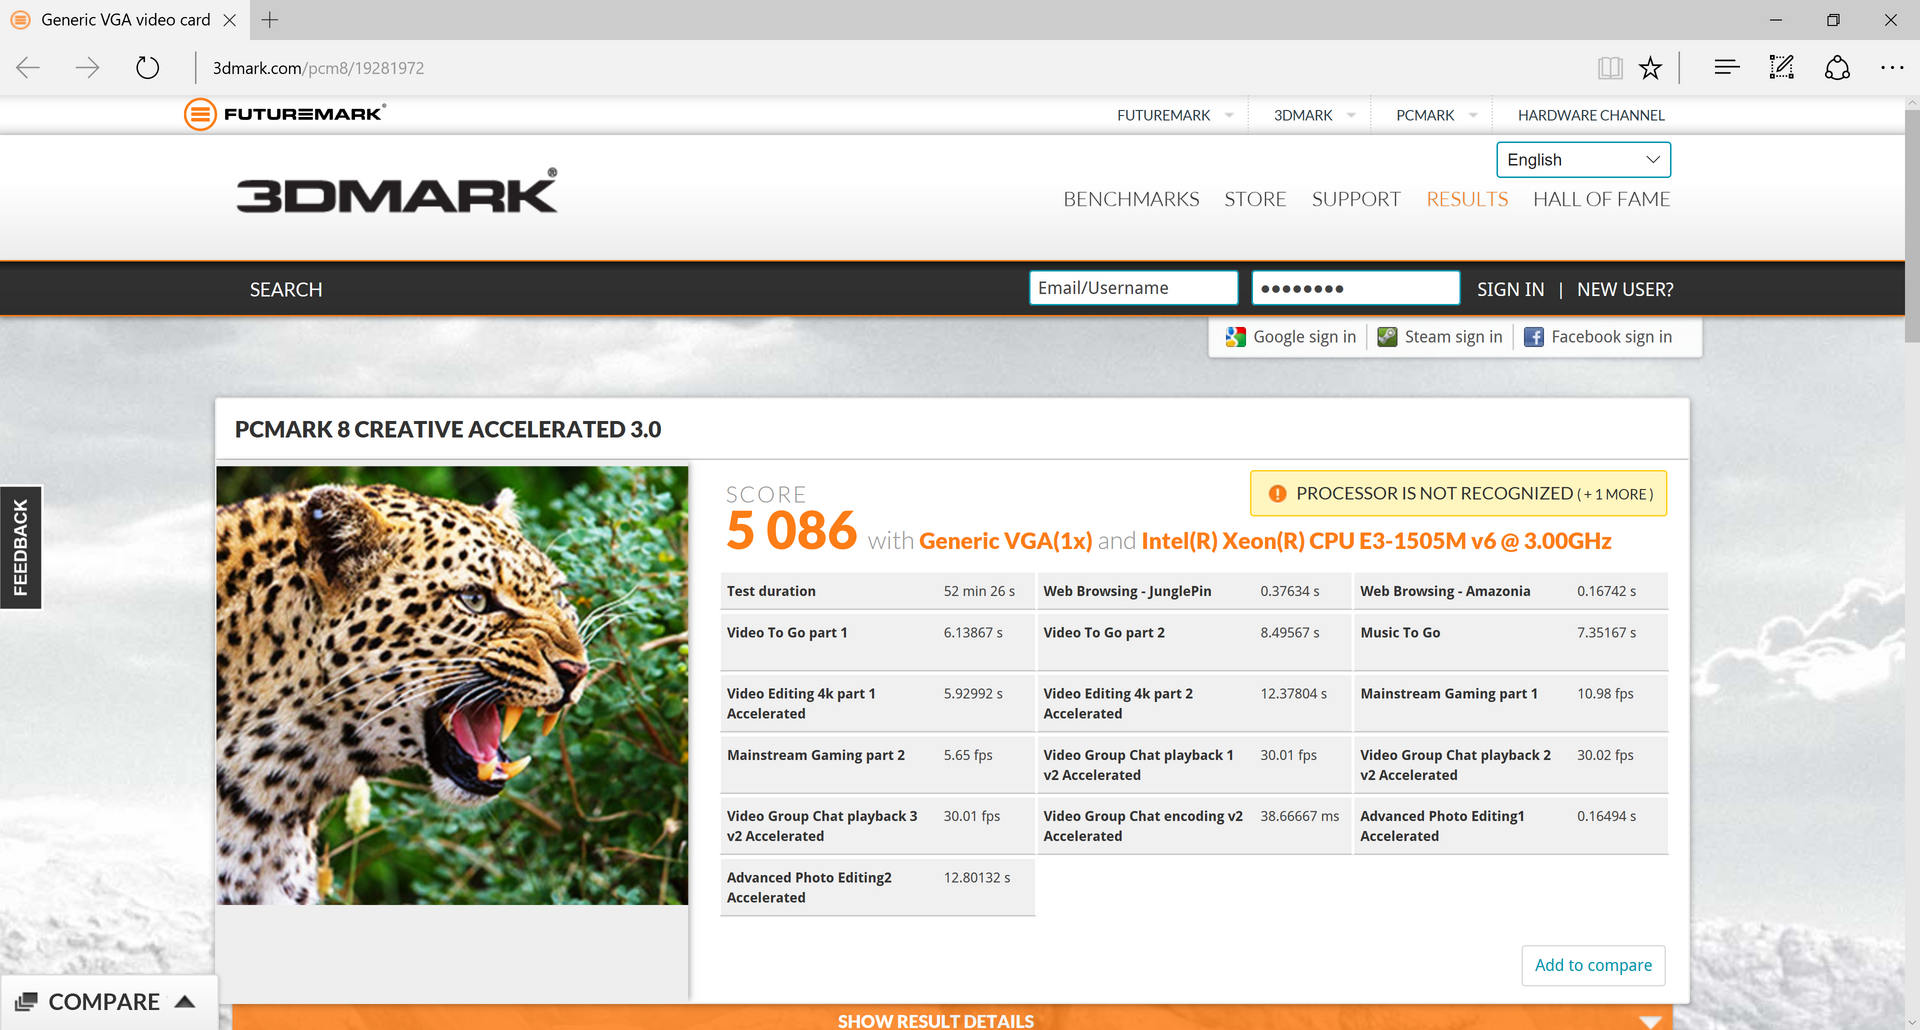
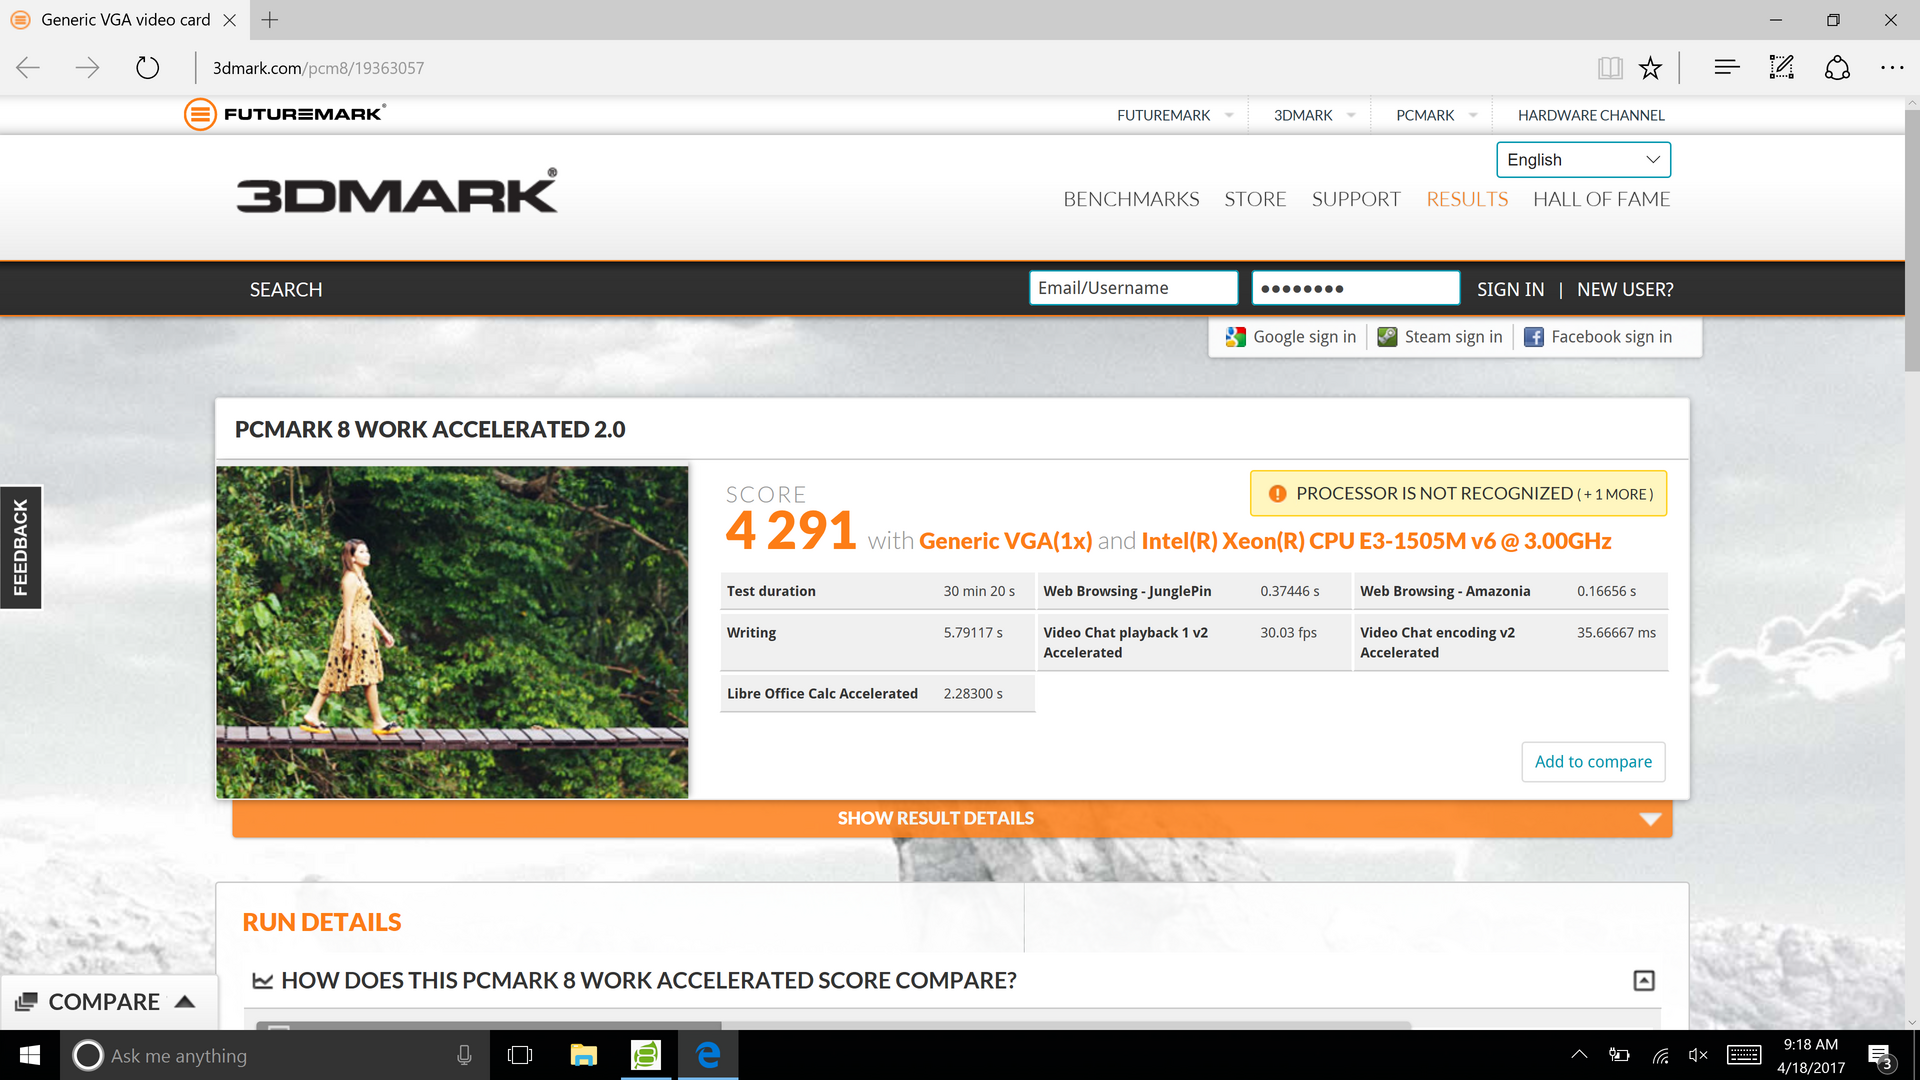
| PCMark 8 Home Score Accelerated v2 | 3504 points | |
| PCMark 8 Creative Score Accelerated v2 | 5086 points | |
| PCMark 8 Work Score Accelerated v2 | 4291 points | |
Help | ||
Storage Devices
The Precision 5520 supports storage devices ranging all the way up to 1 TB M.2 PCIe NVMe SSDs. 2.5-inch drives are actually still supported as well, but only in conjunction with the smaller 56 Wh battery—a sacrifice which we do not view as reasonable in most cases. However, if a user planned on remaining plugged in most of the time, this makes dual storage configurations an option.
As with some previous Dell units, the machine is configured for RAID SATA interface by default. While fine for most users, to maximize performance (and supplemental application/driver-level control) of the NVMe SSD, it’s possible to switch to AHCI and ditch the Intel Rapid Storage Technology framework entirely. For an easy-to-follow procedure on how to accomplish this, check out this web page.
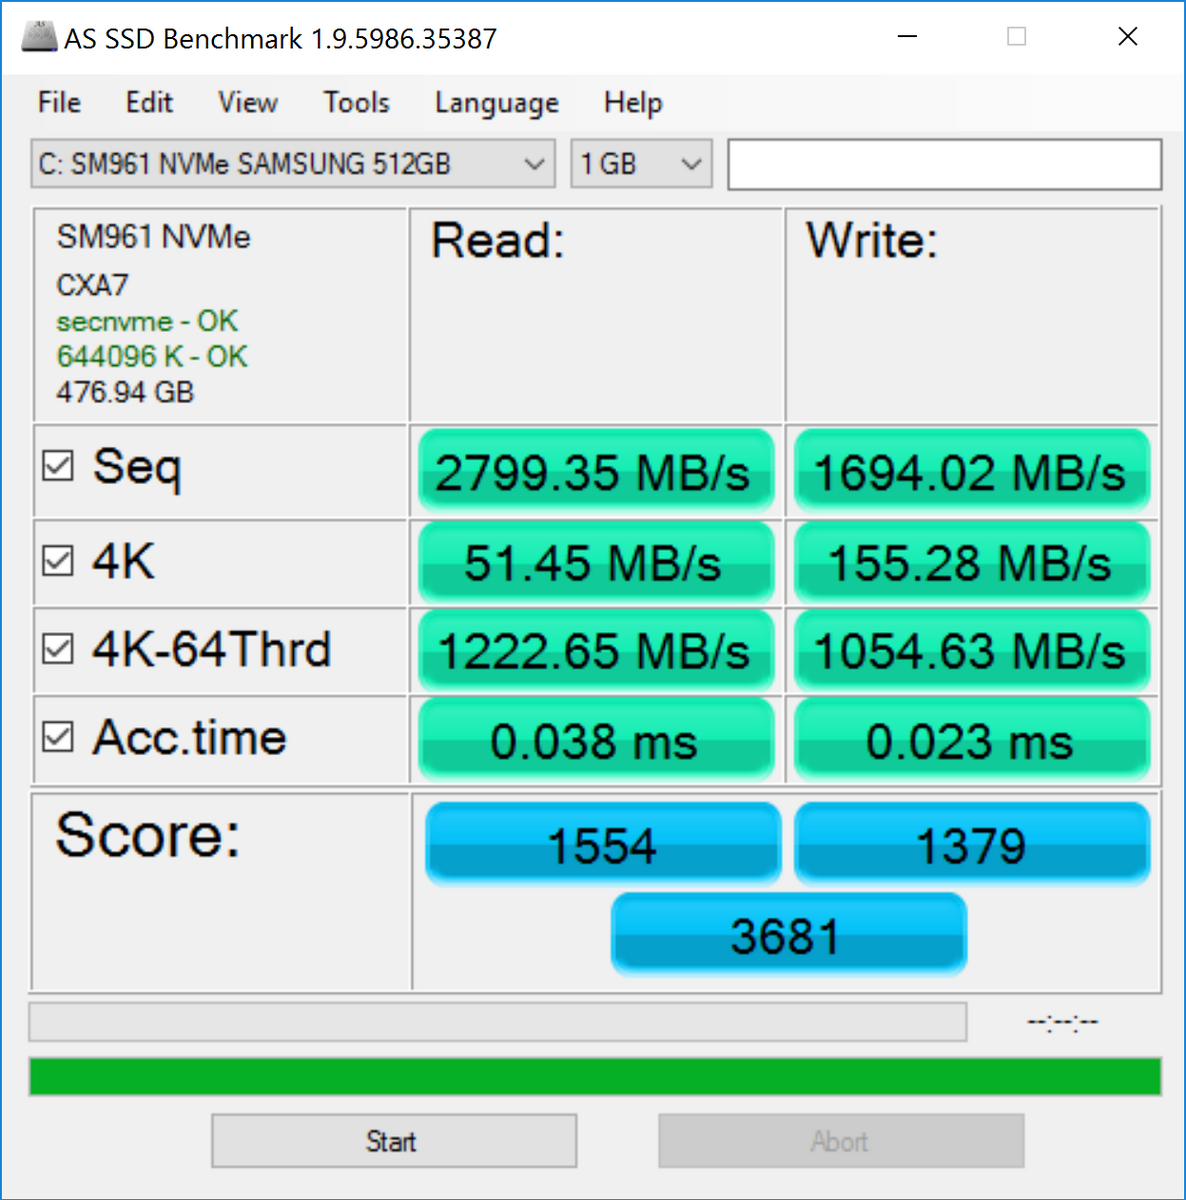
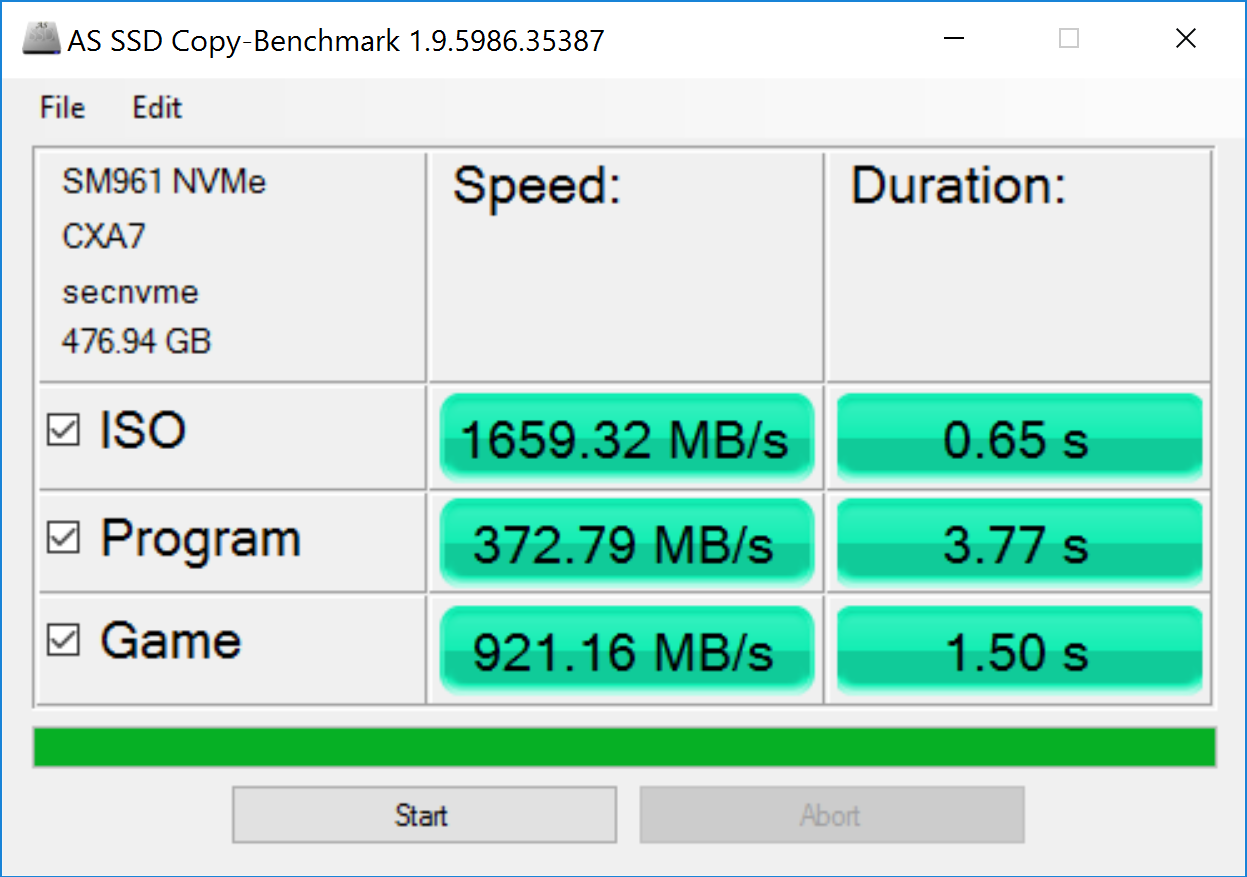
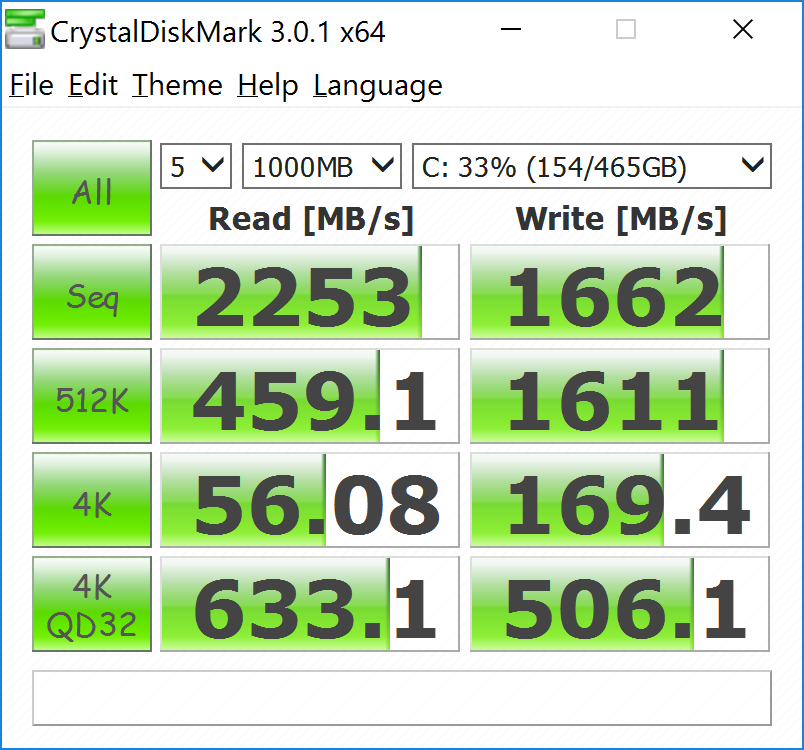
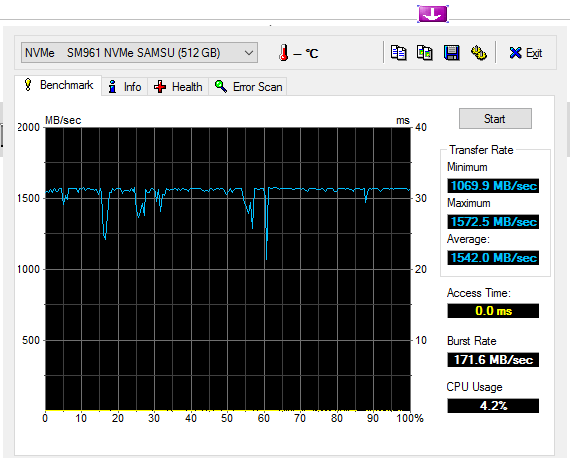
Performance of the SSD was excellent overall.
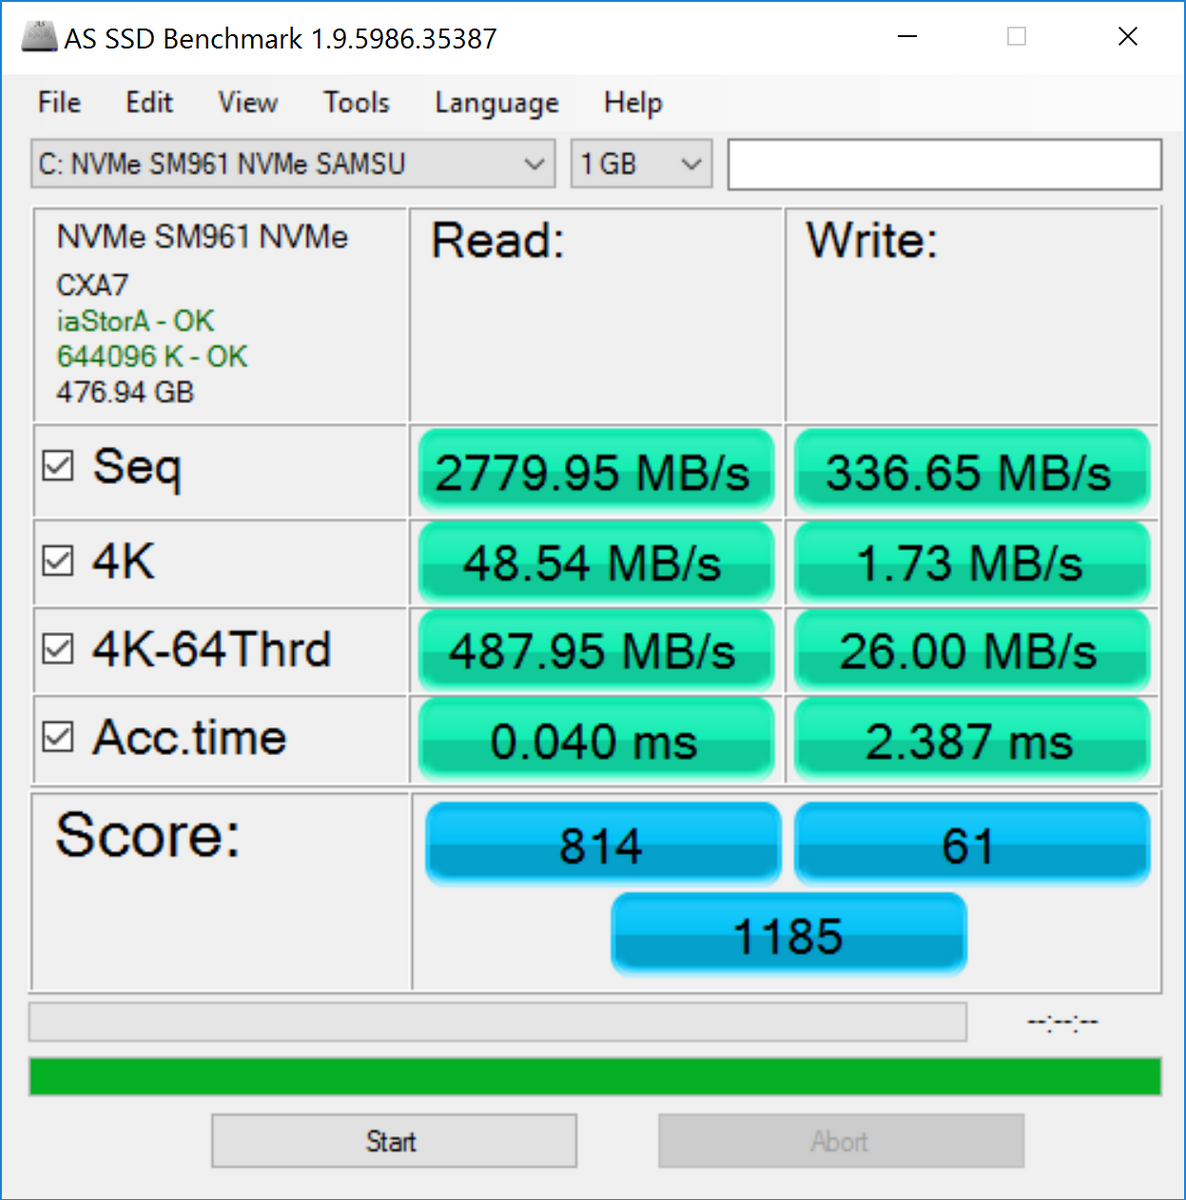
| Dell Precision 5520 UHD Samsung SM961 MZVKW512HMJP m.2 PCI-e | Dell Precision 7510 (4K IGZO) Samsung SSD SM951a 512GB M.2 PCIe 3.0 x4 NVMe (MZVKV512) | Lenovo ThinkPad P50 Samsung SM951 MZVPV256HDGL m.2 PCI-e | HP ZBook Studio G3 Samsung SM951 MZVPV512HDGL m.2 PCI-e | Dell XPS 15 9560 (i7-7700HQ, UHD) Lite-On CX2-8B512-Q11 | |
|---|---|---|---|---|---|
| CrystalDiskMark 3.0 | 11% | 28% | 22% | -7% | |
| Read Seq (MB/s) | 2253 | 1648 -27% | 1771 -21% | 1578 -30% | 1684 -25% |
| Write Seq (MB/s) | 1662 | 1575 -5% | 1304 -22% | 1557 -6% | 1106 -33% |
| Read 512 (MB/s) | 459.1 | 1155 152% | 1364 197% | 1234 169% | 977 113% |
| Write 512 (MB/s) | 1611 | 1561 -3% | 1291 -20% | 1391 -14% | 1119 -31% |
| Read 4k (MB/s) | 56.1 | 53 -6% | 60.2 7% | 59.9 7% | 45.14 -20% |
| Write 4k (MB/s) | 169.4 | 158.9 -6% | 256.7 52% | 225.6 33% | 134.1 -21% |
| Read 4k QD32 (MB/s) | 633 | 623 -2% | 953 51% | 946 49% | 509 -20% |
| Write 4k QD32 (MB/s) | 506 | 423 -16% | 389.6 -23% | 359 -29% | 398.1 -21% |

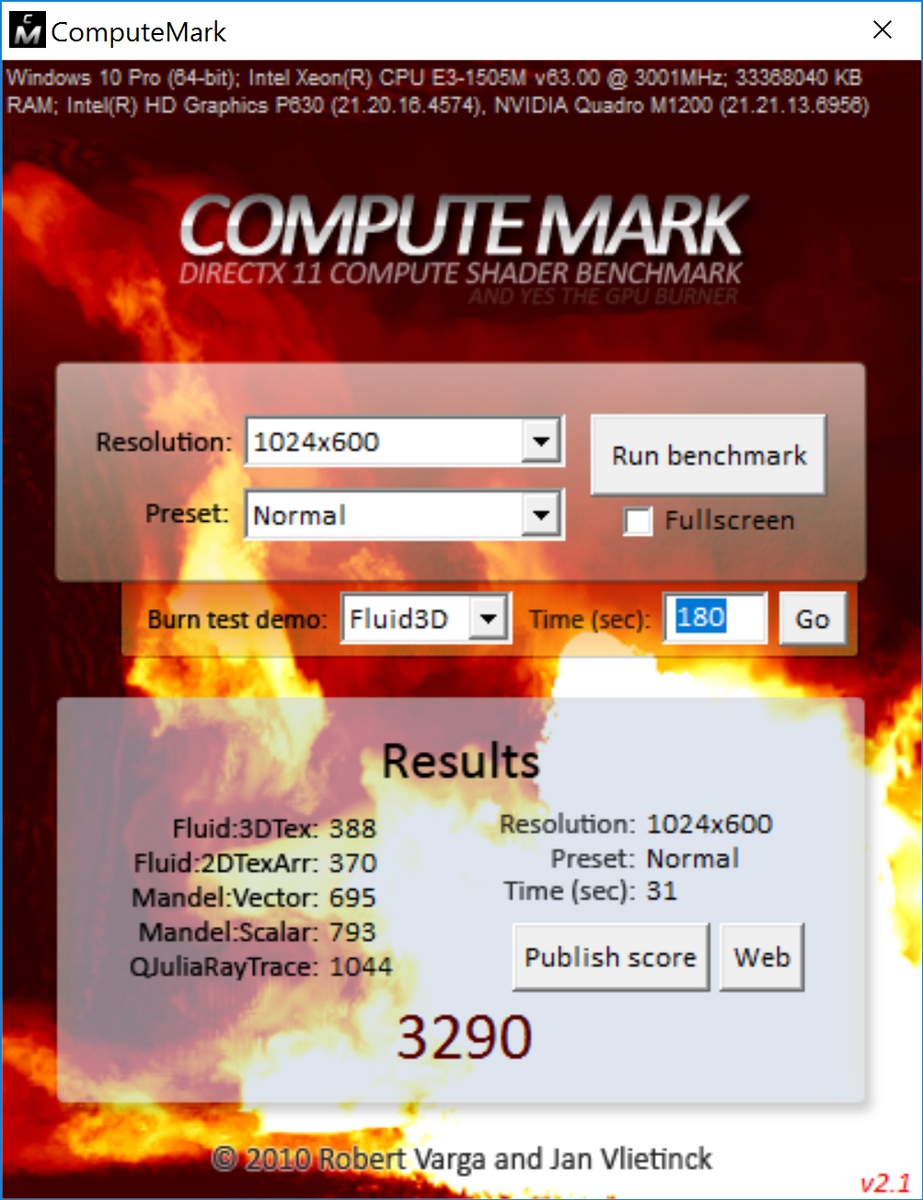
GPU Performance
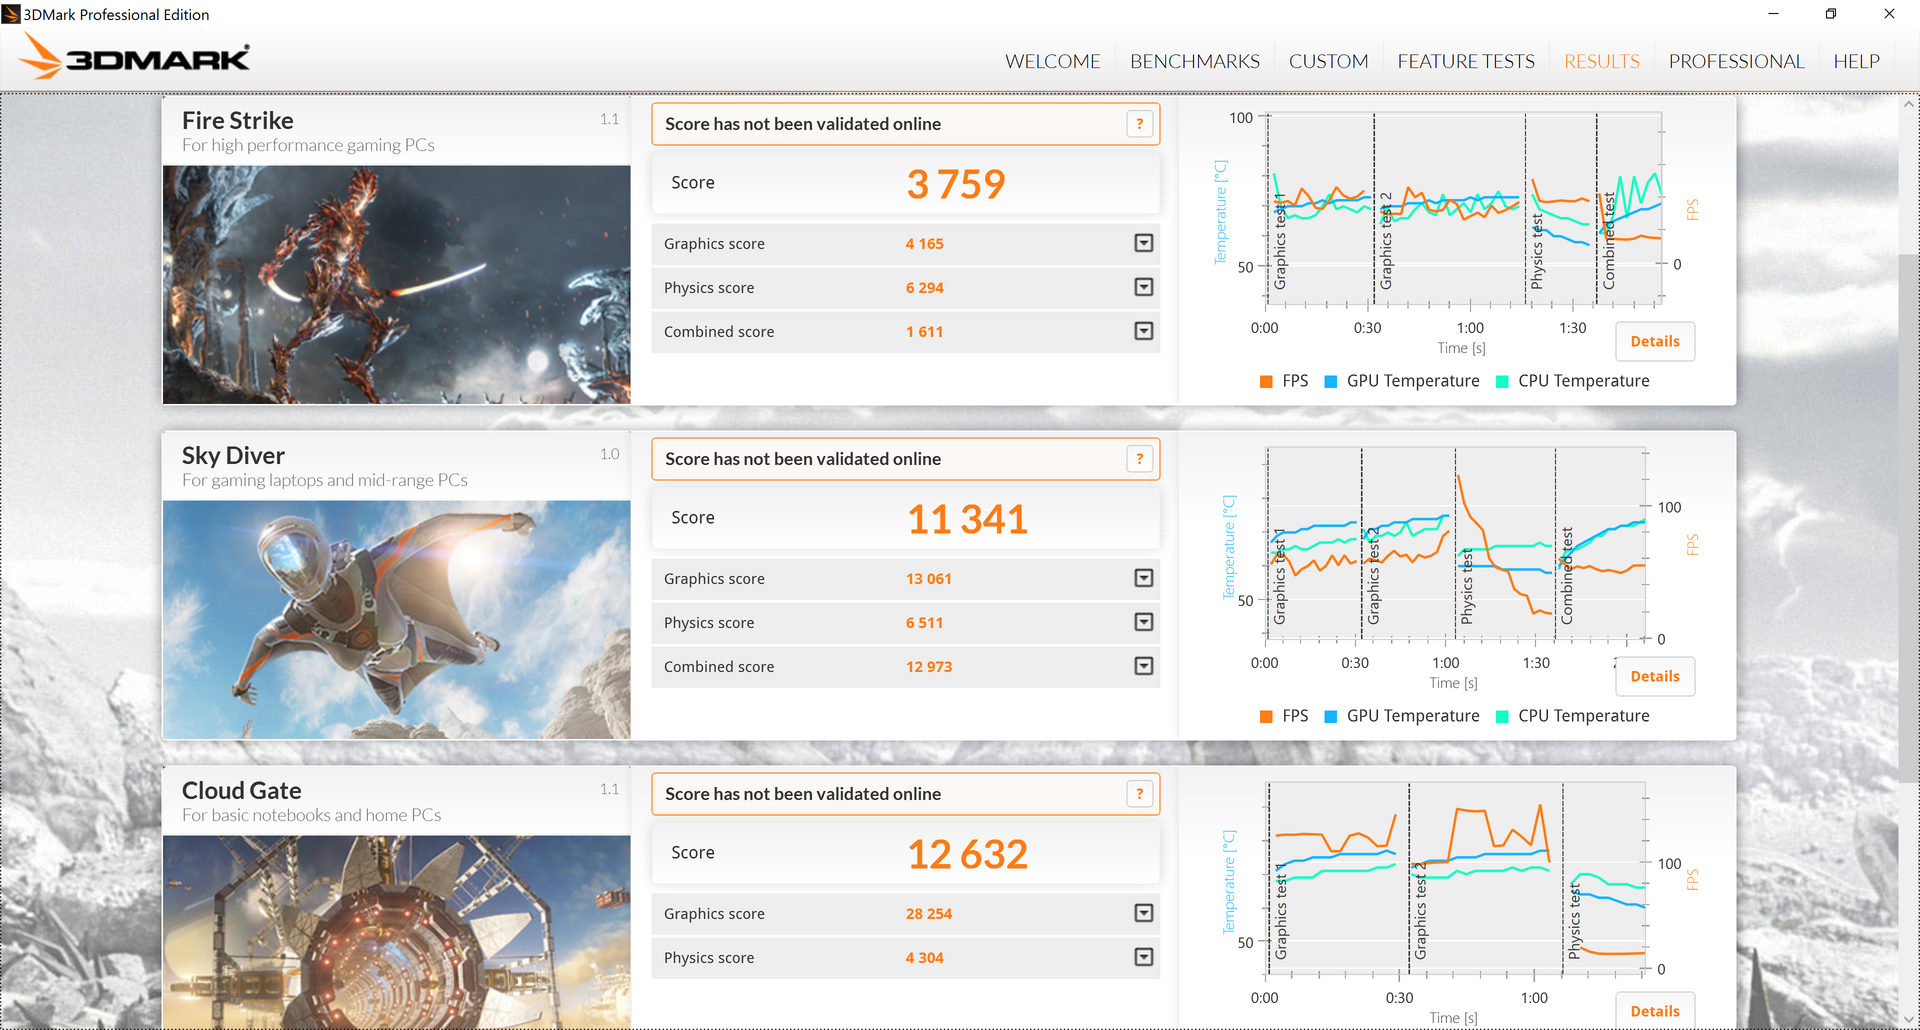
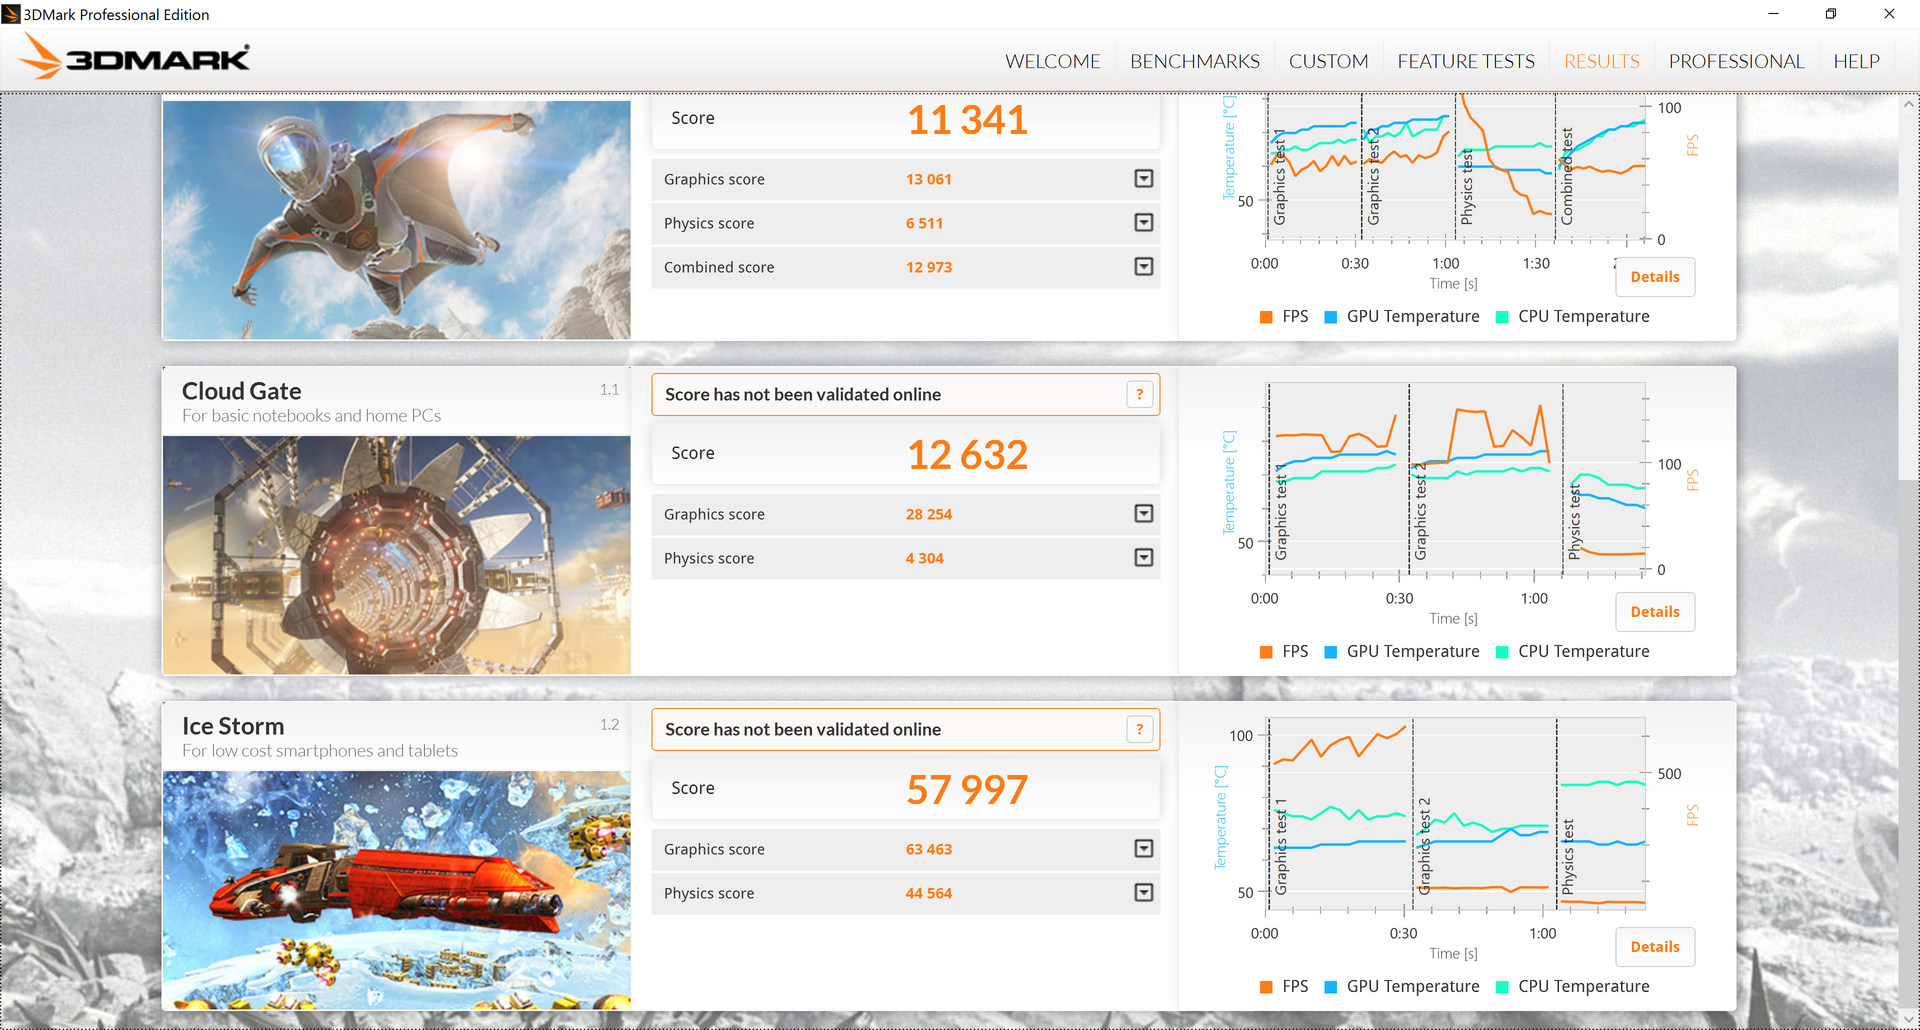
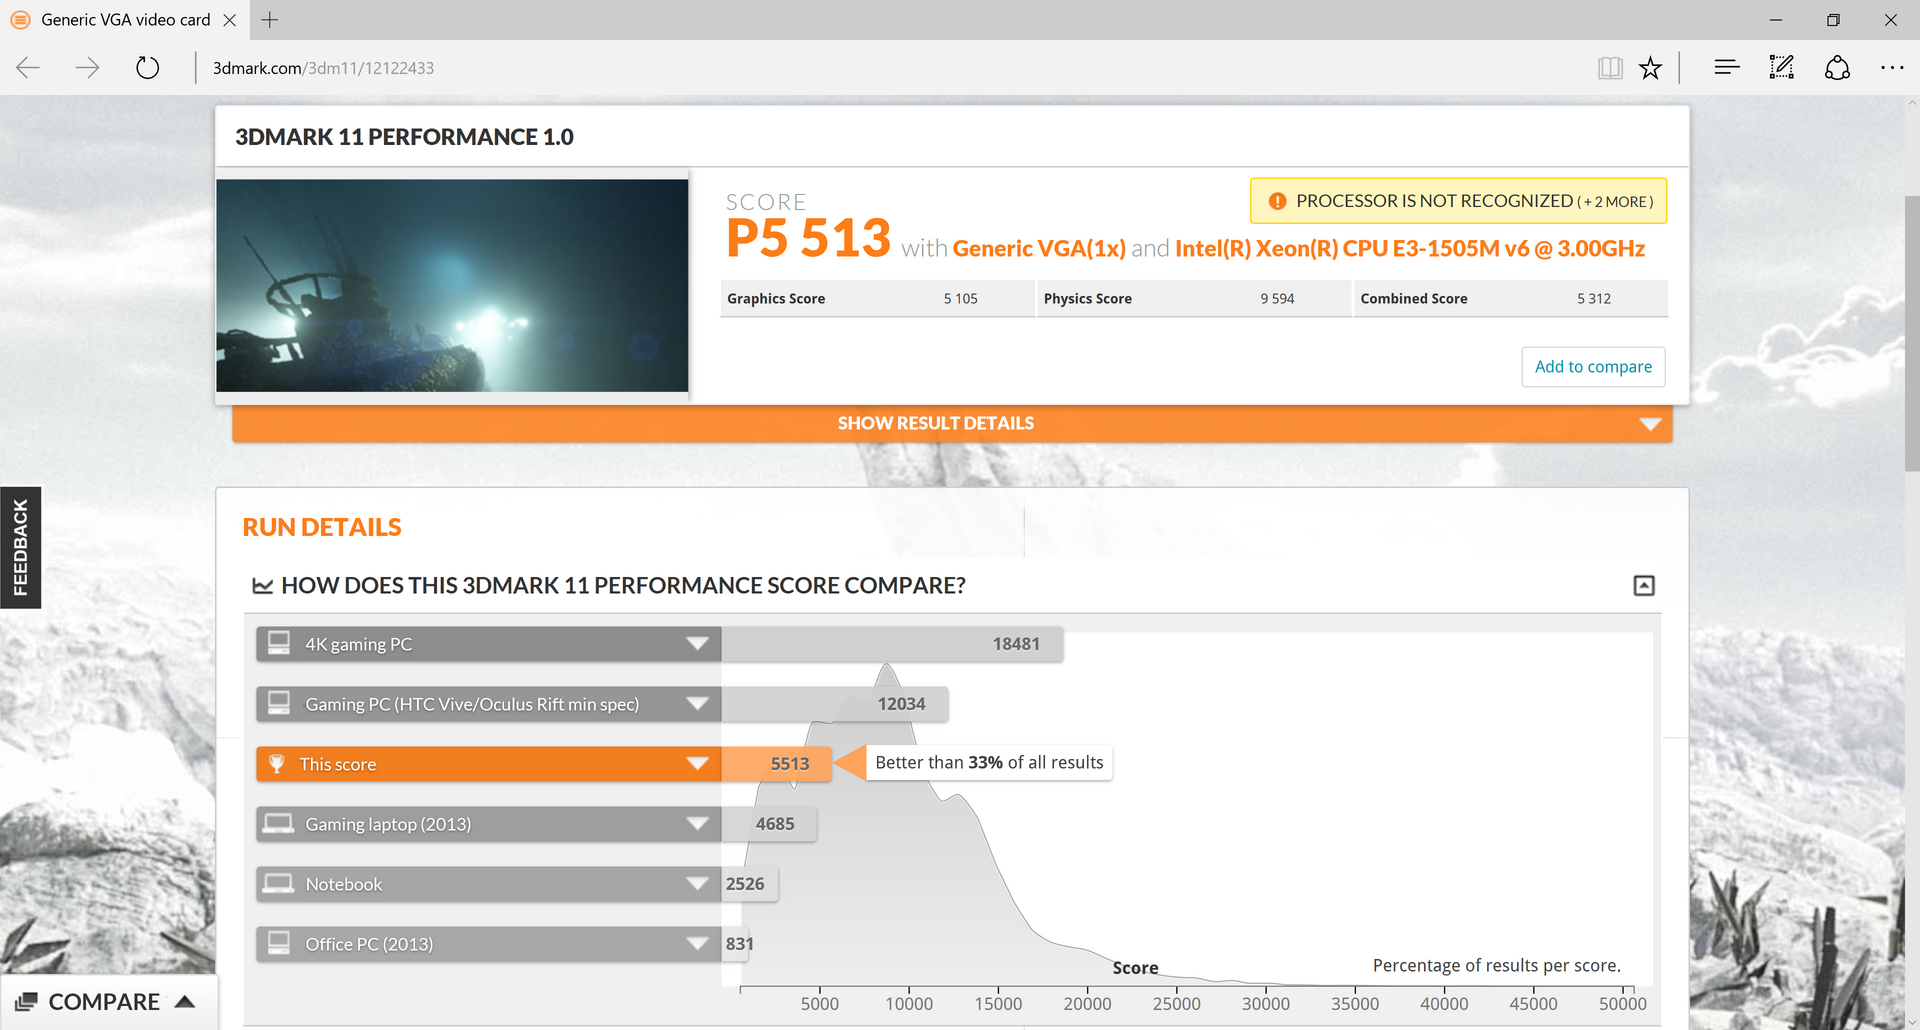
GPU proficiency is, of course, central to the capabilities of a workstation. Although the Precision 5520 clearly isn’t gunning for the top spot in the GPU race, it does post perfectly respectable scores with the help of its NVIDIA Quadro M1200 in our conventional GPU benchmarks. With a 4165 in 3DMark Fire Strike Graphics and 5105 in 3DMark 11 GPU, it’s at or near the top of the stack of Quadro-equipped machines in our comparison field.
| 3DMark 11 | |
| 1280x720 Performance GPU | |
| Lenovo ThinkPad P50 | |
| Dell Precision 5520 UHD | |
| Dell Precision 7510 (4K IGZO) | |
| Dell Precision 5510 | |
| 1280x720 Performance Combined | |
| Dell Precision 5520 UHD | |
| Lenovo ThinkPad P50 | |
| Dell Precision 7510 (4K IGZO) | |
| Dell Precision 5510 | |
| 3DMark | |
| 1280x720 Cloud Gate Standard Graphics | |
| Dell XPS 15 9560 (i7-7700HQ, UHD) | |
| Fujitsu Celsius H760 | |
| Dell Precision 5520 UHD | |
| Dell Precision 7510 (4K IGZO) | |
| Lenovo ThinkPad P50 | |
| Dell Precision 5510 | |
| Dell Precision 3510 | |
| 1920x1080 Fire Strike Graphics | |
| Dell XPS 15 9560 (i7-7700HQ, UHD) | |
| Dell Precision 7510 (4K IGZO) | |
| Dell Precision 5520 UHD | |
| Lenovo ThinkPad P50 | |
| Fujitsu Celsius H760 | |
| Dell Precision 5510 | |
| Dell Precision 3510 | |
| 1920x1080 Ice Storm Extreme Graphics | |
| Dell XPS 15 9560 (i7-7700HQ, UHD) | |
| Dell Precision 5520 UHD | |
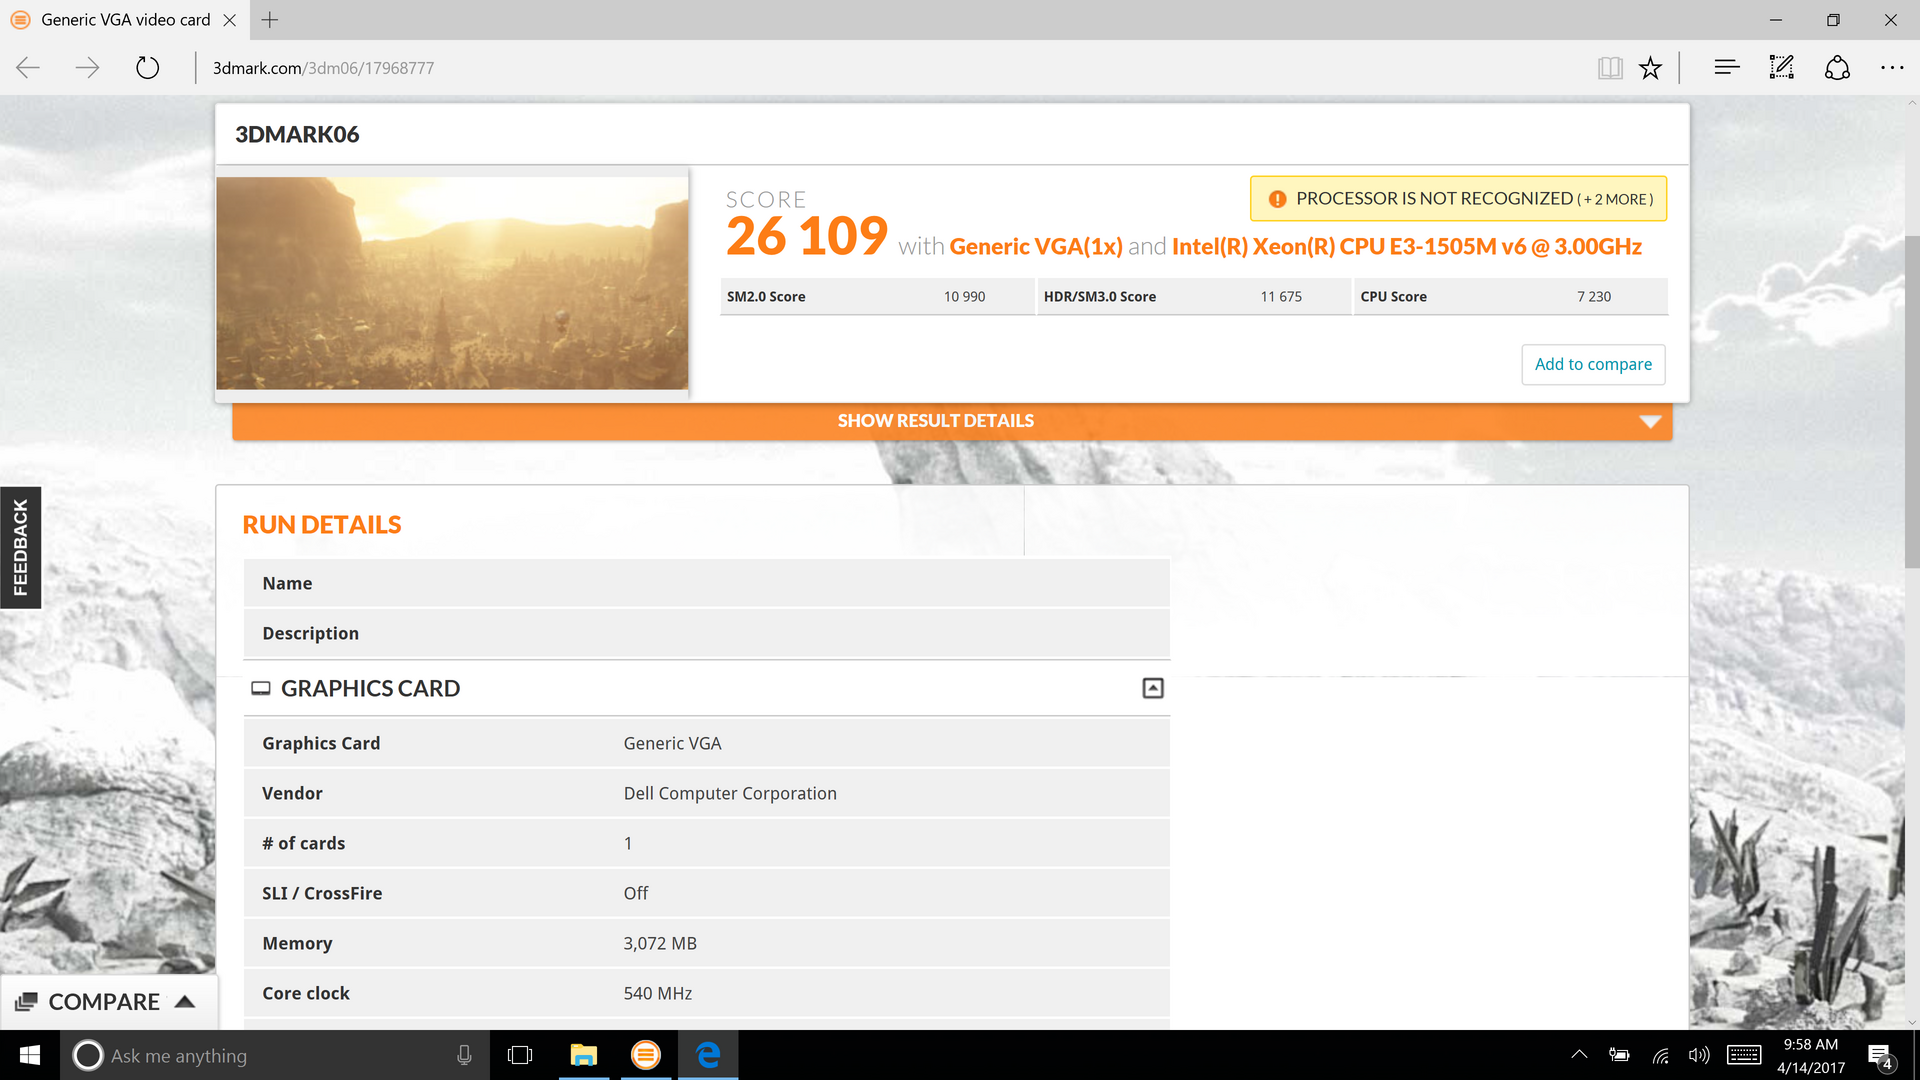
| 3DMark 06 Standard Score | 26109 points | |
| 3DMark 11 Performance | 5513 points | |
| 3DMark Ice Storm Standard Score | 57997 points | |
| 3DMark Cloud Gate Standard Score | 12632 points | |
| 3DMark Fire Strike Score | 3759 points | |
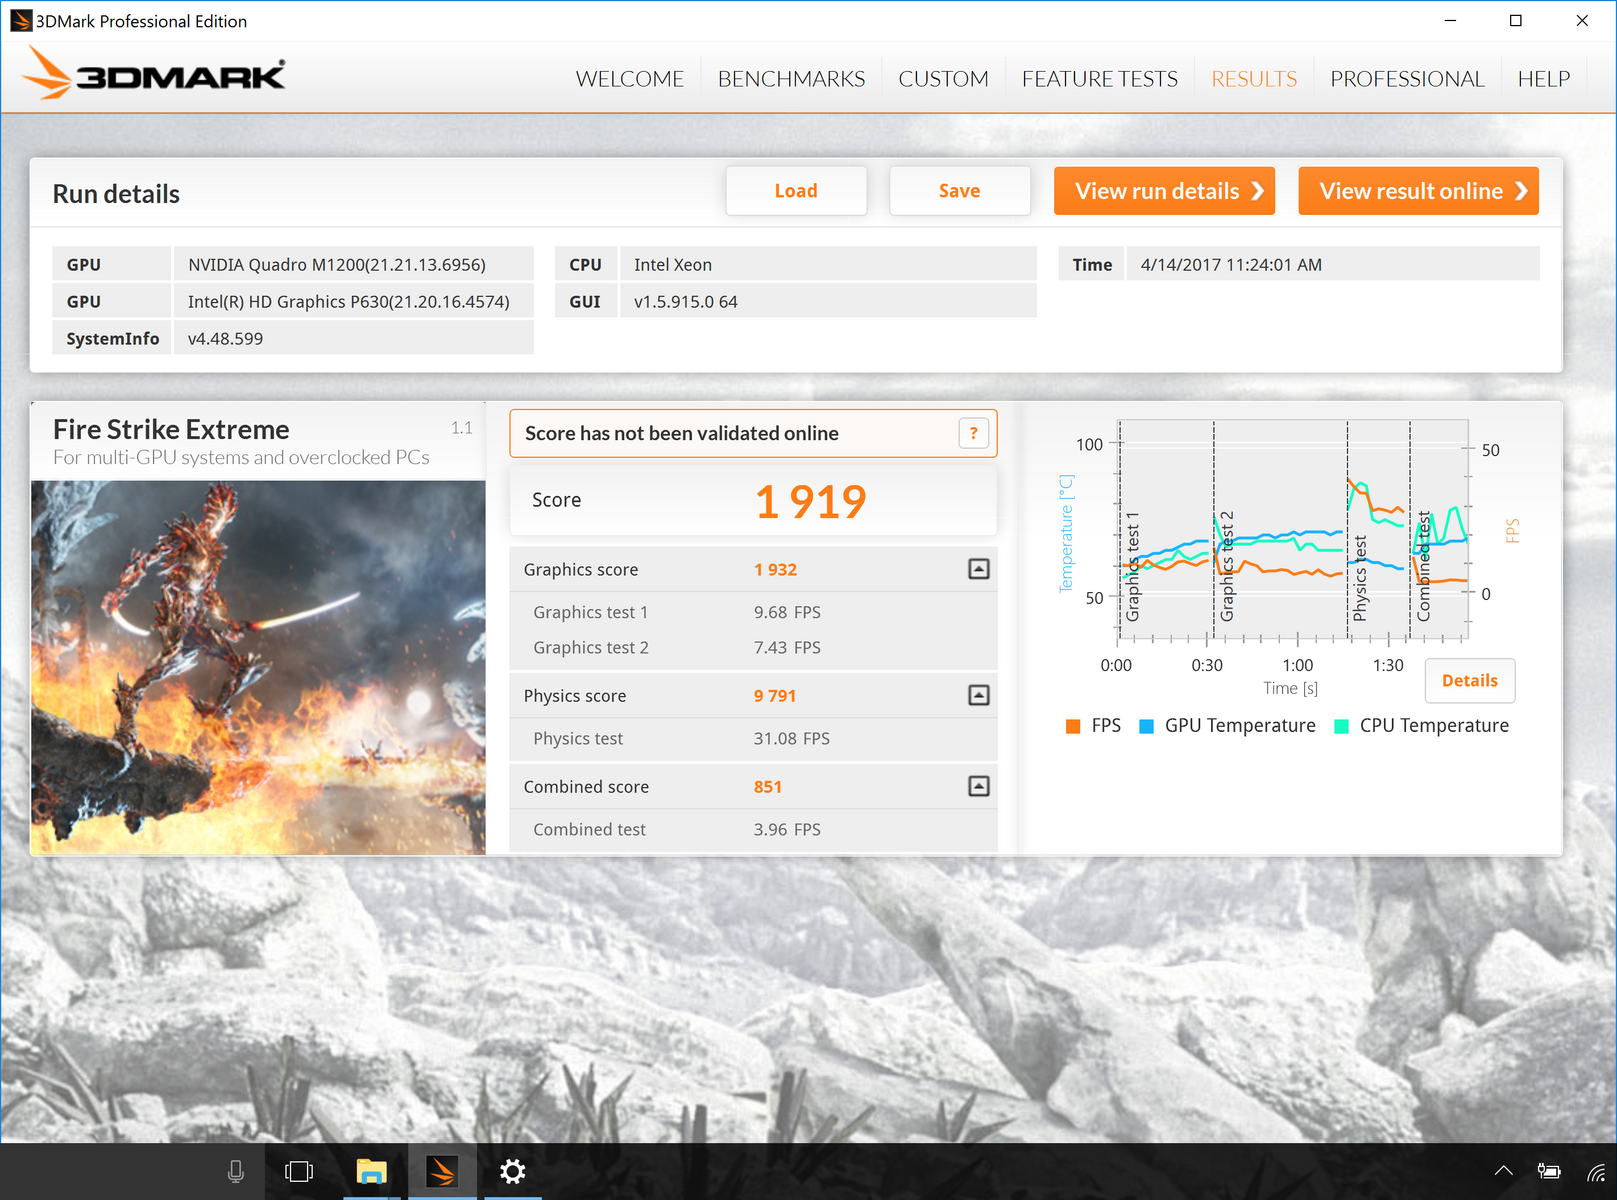
| 3DMark Fire Strike Extreme Score | 1919 points | |
Help | ||
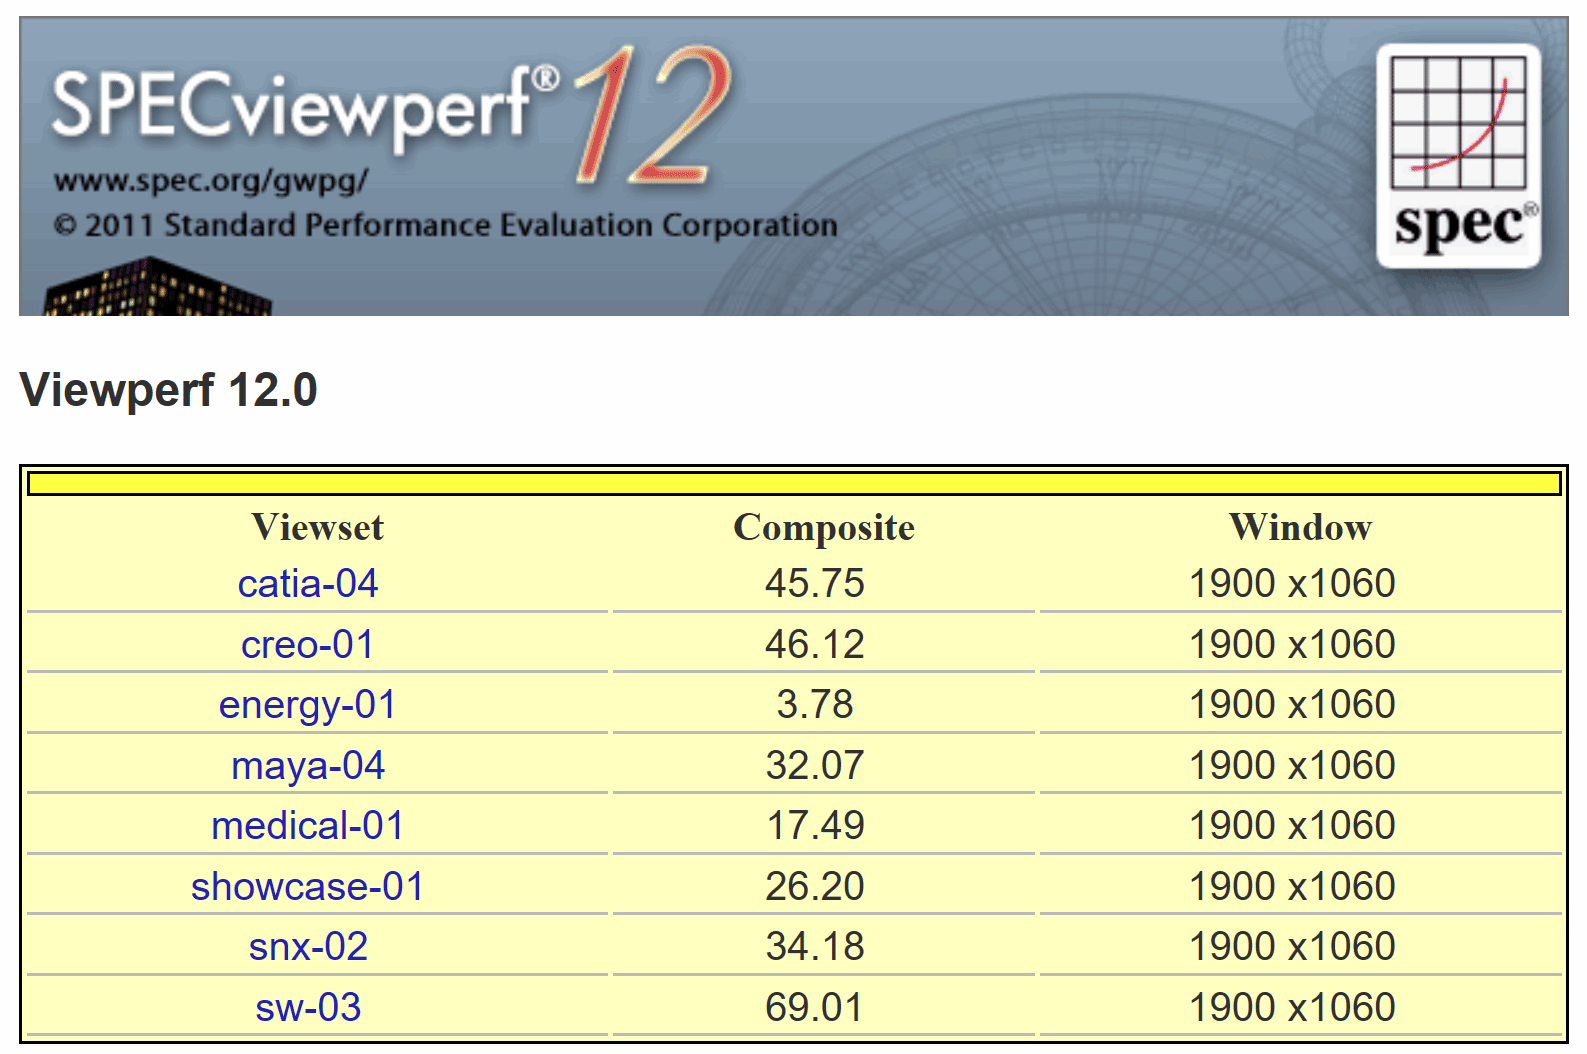
Workstation Performance
When we turn our attention to SPECviewperf, the Precision 5520 performs well for its size and class. With scores nearing the top of the charts in almost every benchmark (neck-and-neck with the much larger Precision 7510), GPU performance appears to be one area in which the 5520 is not hamstrung by significant thermal issues. This conclusion is further reinforced by our Witcher 3 stress test, in which the Precision maintained stable frame rates for the duration of the test, with temperatures stable at around 74 °C.
Gaming Performance
Naturally, although it isn’t exactly optimized for it, the Precision 5520 can also be used for a bit of gaming (between work sessions, of course). The device managed all of the titles we tested on Ultra settings at 1080p resolution—however, as we should expect, none of the games were playable at 4K resolution. This is not much of a surprise, as the M1200 is but a fraction as powerful as the GTX 1050 in gaming benchmarks, and not even the 1050 can come close to managing reliable 4K gaming.
| Doom | |
| 3840x2160 High Preset AA:FX (sort by value) | |
| Dell Precision 5520 UHD | |
| Dell XPS 15 9560 (i7-7700HQ, UHD) | |
| 1920x1080 Ultra Preset AA:SM (sort by value) | |
| Dell Precision 5520 UHD | |
| Dell XPS 15 9560 (i7-7700HQ, UHD) | |
| 1920x1080 High Preset AA:FX (sort by value) | |
| Dell Precision 5520 UHD | |
| Dell XPS 15 9560 (i7-7700HQ, UHD) | |
| 1366x768 Medium Preset (sort by value) | |
| Dell Precision 5520 UHD | |
| 1280x720 Low Preset (sort by value) | |
| Dell Precision 5520 UHD | |
| Batman: Arkham Knight | |
| 3840x2160 High / On (Interactive Smoke & Paper Debris Off) AA:SM AF:8x (sort by value) | |
| Dell Precision 5520 UHD | |
| Dell XPS 15 9560 (i7-7700HQ, UHD) | |
| 1920x1080 High / On AA:SM AF:16x (sort by value) | |
| Dell Precision 5520 UHD | |
| Dell XPS 15 9560 (i7-7700HQ, UHD) | |
| 1920x1080 High / On (Interactive Smoke & Paper Debris Off) AA:SM AF:8x (sort by value) | |
| Dell Precision 5520 UHD | |
| Dell XPS 15 9560 (i7-7700HQ, UHD) | |
| 1366x768 Normal / Off AF:4x (sort by value) | |
| Dell Precision 5520 UHD | |
| Dell XPS 15 9560 (i7-7700HQ, UHD) | |
| 1280x720 Low / Off AF:Trilinear (sort by value) | |
| Dell Precision 5520 UHD | |
| low | med. | high | ultra | 4K | |
|---|---|---|---|---|---|
| BioShock Infinite (2013) | 189 | 137 | 125 | 47 | |
| The Witcher 3 (2015) | 29 | ||||
| Batman: Arkham Knight (2015) | 74 | 63 | 35 | 29 | 11 |
| Doom (2016) | 79 | 66 | 37 | 34 | 12 |
Stress Test
Under CPU stress, the Precision 5520 quickly reports CPU temperatures reaching above 90 °C, which results in reduced clock rates back to around 3.0 GHz in short order. The frequency will also occasionally dip below this level (to around 2.6 GHz) in an effort to keep temperatures in check—which technically qualifies as throttling. That we witnessed this reduced performance both in our synthetic stress testing and during the more realistic Cinebench R15 multi-CPU loop test (detailed above in the Processor section) suggests that the Precision 5520, as equipped, cannot make full (or even significant) use of its Xeon E3-1505 v6 CPU. For that reason, it might be wiser to go with a lower-priced option, as performance may not be greatly affected.
GPU performance is considerably stabler. Our Witcher 3 stress test (detailed in the GPU Performance section) saw no appreciable drop in frame rates over the course of a full hour, which gives us confidence that the Precision 5520 can more easily handle heavy GPU loads. Temperatures during this test were a bit on the high side, but they remained stable around 74 °C, so there wasn’t any reason for major concern. Moreover, our synthetic tests and actual gaming benchmarks are right in line with what we’d expect from the hardware. So for those planning on heavy GPU loads with less CPU involvement, the Precision 5520 should get the job done.
It should be noted that even with the Dell Command | Power management software thermal profile set to Ultra Performance, these results do not change. The bottom line is that the 5520 is a very thin workstation to be packing these components, so some degree of sacrifice is to be expected. At least that sacrifice only seems to manifest itself in the realm of CPU proficiency, leaving GPU capabilities untouched (which is what many workstation users require most).
| CPU Clock (GHz) | GPU Clock (MHz) | Average CPU Temperature (°C) | Average GPU Temperature (°C) | |
| Prime95 Stress | 2.6 - 4.0 | - | 90 | |
| FurMark Stress | - | 1110 - 1124 | - | 74 |
| Prime95 + FurMark Stress | 2.6 | 500 - 991 | 90 | 76 |
Emissions
System Noise
While idling, the Precision 5520 is noticeable, but not very much so: we recorded an average of just 32.1 dB(A). As you might expect, things change under load—and the Precision 5520 heats up rather quickly (faster than most other workstations, undoubtedly thanks to its much smaller case). Here, we measured 41.3 dB(A) average and 45.5 dB(A) maximum—not terribly noisy, but right in line with what we see from other mobile workstations.
Noise level
| Idle |
| 28.7 / 32.1 / 32.1 dB(A) |
| Load |
| 41.3 / 45.5 dB(A) |
 | ||
30 dB silent 40 dB(A) audible 50 dB(A) loud |
||
min: | ||
| Dell Precision 5520 UHD Quadro M1200, E3-1505M v6, Samsung SM961 MZVKW512HMJP m.2 PCI-e | Fujitsu Celsius H760 Quadro M2000M, E3-1505M v5, Samsung SM951 MZVPV512 m.2 PCI-e | Dell Precision 7510 (4K IGZO) Quadro M2000M, E3-1535M v5, Samsung SSD SM951a 512GB M.2 PCIe 3.0 x4 NVMe (MZVKV512) | Dell Precision 3510 FirePro W5130M, 6700HQ, Samsung SM951 MZVPV256HDGL m.2 PCI-e | Lenovo ThinkPad P50 Quadro M2000M, E3-1505M v5, Samsung SM951 MZVPV256HDGL m.2 PCI-e | Dell Precision 5510 Quadro M1000M, E3-1505M v5, SK hynix SC920 512 GB | |
|---|---|---|---|---|---|---|
| Noise | 1% | 2% | 2% | 2% | 1% | |
| off / environment * (dB) | 28.7 | 29 -1% | 28.2 2% | 30 -5% | 30 -5% | |
| Idle Minimum * (dB) | 28.7 | 29 -1% | 29.8 -4% | 30 -5% | 30 -5% | 30 -5% |
| Idle Average * (dB) | 32.1 | 29 10% | 29.8 7% | 30 7% | 30 7% | 30 7% |
| Idle Maximum * (dB) | 32.1 | 29 10% | 31.2 3% | 30 7% | 30 7% | 30 7% |
| Load Average * (dB) | 41.3 | 43.1 -4% | 37.2 10% | 38.1 8% | 42.1 -2% | 42.08 -2% |
| Witcher 3 ultra * (dB) | 45.5 | |||||
| Load Maximum * (dB) | 45.5 | 49.2 -8% | 49.4 -9% | 44.4 2% | 42.1 7% | 46.78 -3% |
* ... smaller is better
Temperature
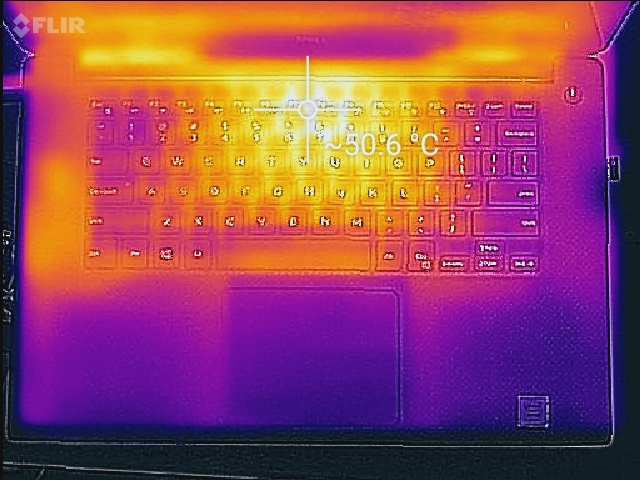
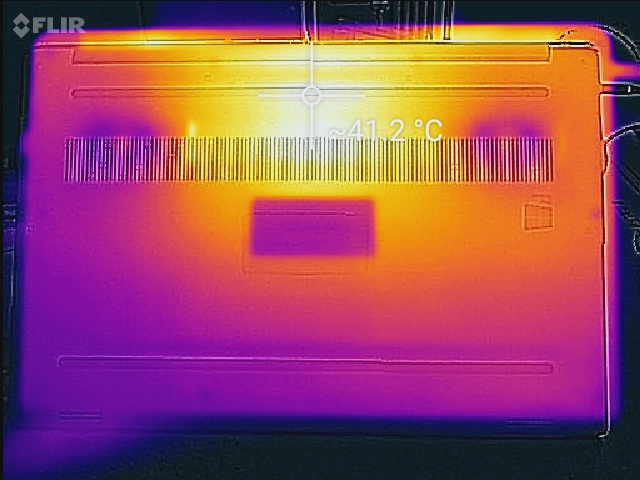
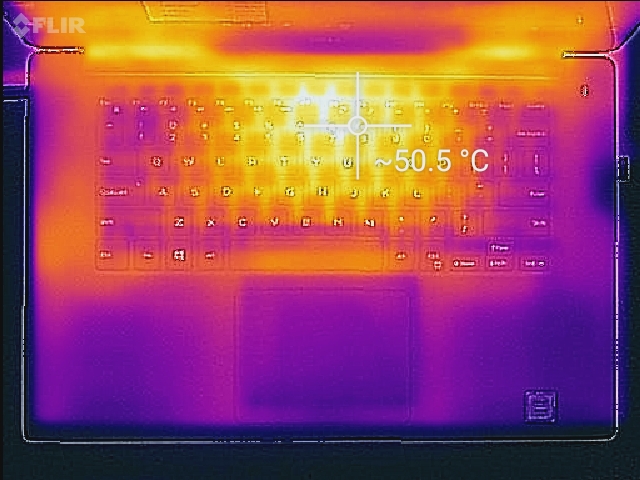
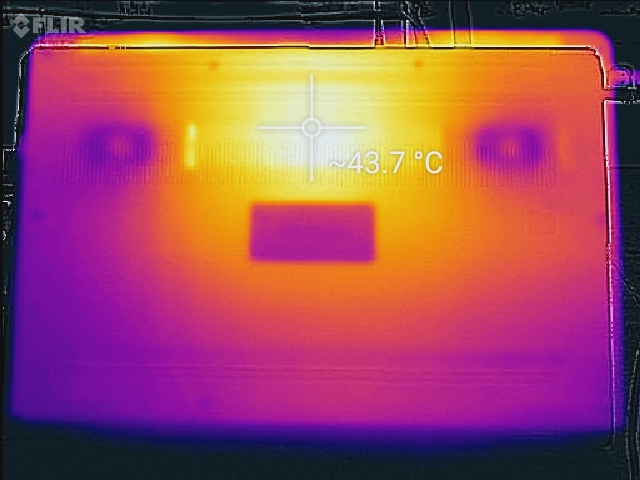
The Precision 5520 manages to heat up fairly quickly under load, though the most significant temperature development is primarily concentrated in a few specific quadrants. While idle, nothing out of the ordinary applies. Under synthetic stress, however, we measured hot spots in the top center quadrants of both top and bottom of the base unit with readings of 51.6 °C and 43.6 °C, respectively. The former is certainly uncomfortable to the touch—but by the same token, the 43.6 °C hot spot on the underside really isn’t all that bad, especially considering that it’s located in the center of the machine (and so it should not likely contact the user’s legs while in use on the lap). And besides, average temperatures still only reach 35.5 °C / 34.5 °C, which really isn’t anything uncommon.
A slightly more realistic scenario for real-world stress effects is represented by our Witcher 3 temperature measurements; here, the averages subside to 34.6 °C / 33.6 °C, respectively.
(-) The maximum temperature on the upper side is 51.6 °C / 125 F, compared to the average of 38.2 °C / 101 F, ranging from 22.2 to 69.8 °C for the class Workstation.
(±) The bottom heats up to a maximum of 43.6 °C / 110 F, compared to the average of 41.1 °C / 106 F
(+) In idle usage, the average temperature for the upper side is 25.3 °C / 78 F, compared to the device average of 32 °C / 90 F.
(±) Playing The Witcher 3, the average temperature for the upper side is 34.6 °C / 94 F, compared to the device average of 32 °C / 90 F.
(+) The palmrests and touchpad are cooler than skin temperature with a maximum of 28.4 °C / 83.1 F and are therefore cool to the touch.
(±) The average temperature of the palmrest area of similar devices was 27.8 °C / 82 F (-0.6 °C / -1.1 F).
Speakers

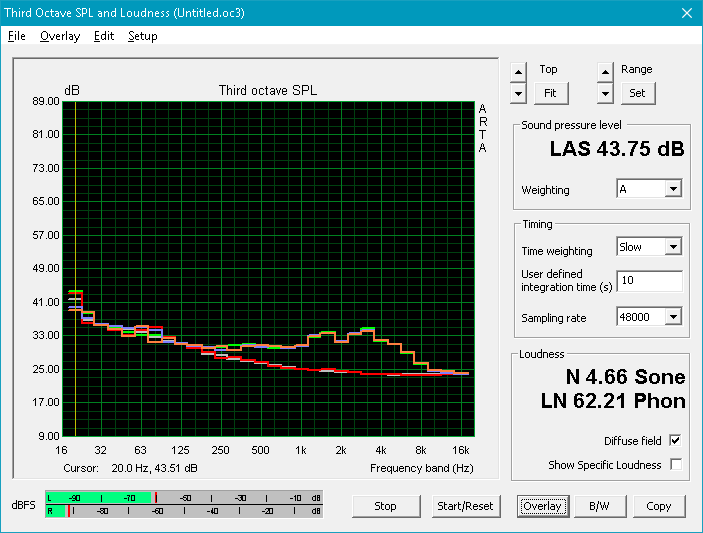
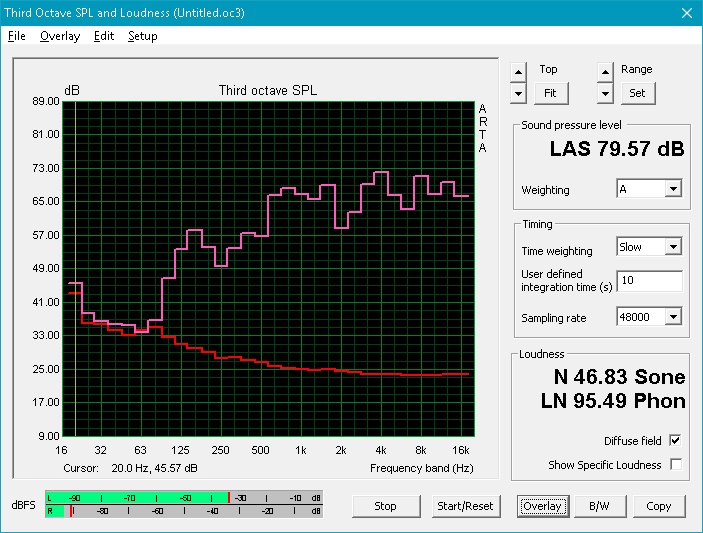
Although they’re small, the Precision 5520’s speakers are better than average. With a maximum loudness of 79.57 dB and fairly balanced mid- and high-frequencies, the shape of the sound really only lacks bass—which is hardly a surprise, considering the machine lacks a subwoofer. Workstations aren’t really made with multimedia consumption first in mind, but between its attractive display and enjoyable audio, the Precision 5520 does a pretty good job.
Dell Precision 5520 UHD audio analysis
(±) | speaker loudness is average but good (79.6 dB)
Bass 100 - 315 Hz
(±) | reduced bass - on average 12.8% lower than median
(±) | linearity of bass is average (14.2% delta to prev. frequency)
Mids 400 - 2000 Hz
(+) | balanced mids - only 4% away from median
(±) | linearity of mids is average (9.9% delta to prev. frequency)
Highs 2 - 16 kHz
(+) | balanced highs - only 3.3% away from median
(±) | linearity of highs is average (12% delta to prev. frequency)
Overall 100 - 16.000 Hz
(±) | linearity of overall sound is average (16.7% difference to median)
Compared to same class
» 46% of all tested devices in this class were better, 9% similar, 45% worse
» The best had a delta of 7%, average was 17%, worst was 35%
Compared to all devices tested
» 29% of all tested devices were better, 7% similar, 64% worse
» The best had a delta of 4%, average was 23%, worst was 134%
Apple MacBook 12 (Early 2016) 1.1 GHz audio analysis
(+) | speakers can play relatively loud (83.6 dB)
Bass 100 - 315 Hz
(±) | reduced bass - on average 11.3% lower than median
(±) | linearity of bass is average (14.2% delta to prev. frequency)
Mids 400 - 2000 Hz
(+) | balanced mids - only 2.4% away from median
(+) | mids are linear (5.5% delta to prev. frequency)
Highs 2 - 16 kHz
(+) | balanced highs - only 2% away from median
(+) | highs are linear (4.5% delta to prev. frequency)
Overall 100 - 16.000 Hz
(+) | overall sound is linear (10.2% difference to median)
Compared to same class
» 7% of all tested devices in this class were better, 2% similar, 90% worse
» The best had a delta of 5%, average was 18%, worst was 53%
Compared to all devices tested
» 5% of all tested devices were better, 1% similar, 94% worse
» The best had a delta of 4%, average was 23%, worst was 134%
Frequency Comparison (Checkbox selectable!)
Graph 1: Pink Noise 100% Vol.; Graph 2: Audio off
Energy Management
Power Consumption
While idle, the Precision 5520’s low power consumption is only topped by the Precision 3510—the latter of which only has to power a 1366x768 (rather dim) display. We measured an average of 13.6 W, which is quite good for a workstation sporting a bright UHD display. Under load, things change a bit: we observed 100.3 W consumption on average here, with a peak of 126.3 W—very close to the maximum of the included 130 W power adapter. Still, this is down from the previous Precision 5510, which recorded a maximum reading of 131.8 W.
| Off / Standby | |
| Idle | |
| Load |
|
Key:
min: | |
| Dell Precision 5520 UHD E3-1505M v6, Quadro M1200, Samsung SM961 MZVKW512HMJP m.2 PCI-e, IPS, 3840x2160, 15.6" | Fujitsu Celsius H760 E3-1505M v5, Quadro M2000M, Samsung SM951 MZVPV512 m.2 PCI-e, IPS LED, 1920x1080, 15.6" | Dell Precision 7510 (4K IGZO) E3-1535M v5, Quadro M2000M, Samsung SSD SM951a 512GB M.2 PCIe 3.0 x4 NVMe (MZVKV512), IGZO IPS, 3840x2160, 15.6" | Dell Precision 3510 6700HQ, FirePro W5130M, Samsung SM951 MZVPV256HDGL m.2 PCI-e, TN LED, 1366x768, 15.6" | Lenovo ThinkPad P50 E3-1505M v5, Quadro M2000M, Samsung SM951 MZVPV256HDGL m.2 PCI-e, IPS, 3840x2160, 15.6" | Dell Precision 5510 E3-1505M v5, Quadro M1000M, SK hynix SC920 512 GB, IGZO LED, 3840x2160, 15.6" | |
|---|---|---|---|---|---|---|
| Power Consumption | 8% | -83% | 42% | -10% | -4% | |
| Idle Minimum * (Watt) | 8.9 | 7.7 13% | 23.9 -169% | 4.2 53% | 10.2 -15% | 8.6 3% |
| Idle Average * (Watt) | 13.6 | 11.8 13% | 28.9 -113% | 6.5 52% | 17.8 -31% | 16.2 -19% |
| Idle Maximum * (Watt) | 14.1 | 12.9 9% | 30 -113% | 7.1 50% | 18.3 -30% | 16.7 -18% |
| Load Average * (Watt) | 100.3 | 90.2 10% | 95.2 5% | 74.6 26% | 76.9 23% | 82.6 18% |
| Witcher 3 ultra * (Watt) | 100.2 | |||||
| Load Maximum * (Watt) | 126.3 | 130.8 -4% | 157.1 -24% | 92.2 27% | 123.5 2% | 131.8 -4% |
* ... smaller is better
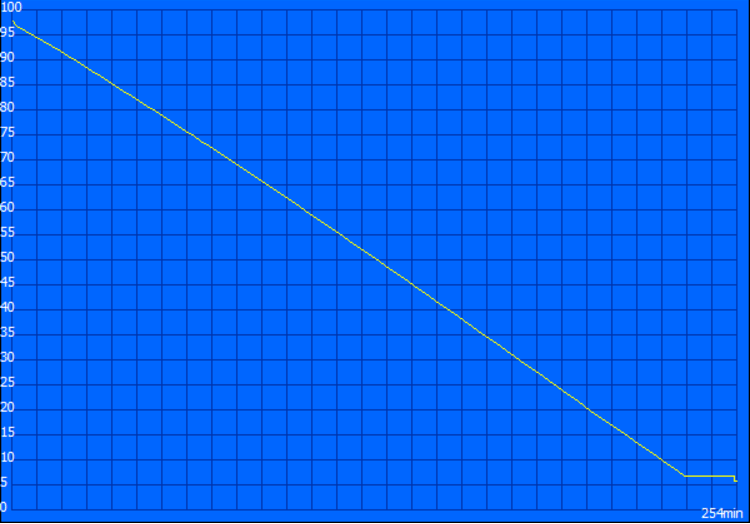
Battery Life
Battery life normally isn’t something which is of great concern for a workstation; most of the work is done while plugged in, which is when the machine is able to take full advantage of its components. However, this topic might be somewhat more interesting to prospective buyers of the Precision 5520, thanks to the fact that it is essentially an ultraportable workstation—so unlike most, it could easily double as a general purpose machine on the go. Unfortunately, the battery runtimes are (predictably) more workstation than Ultrabook; with just 4 hours and 14 minutes of runtime in our Wi-Fi Surfing benchmark, the Precision 5520 isn’t going to satisfy any workaholics without an outlet nearby. For considerably longer runtimes, users might consider the FHD configuration instead (the same is true of the related XPS 15).


| Dell Precision 5520 UHD E3-1505M v6, Quadro M1200, 97 Wh | Fujitsu Celsius H760 E3-1505M v5, Quadro M2000M, 72 Wh | Dell Precision 7510 (4K IGZO) E3-1535M v5, Quadro M2000M, 91 Wh | Dell Precision 3510 6700HQ, FirePro W5130M, 84 Wh | Lenovo ThinkPad P50 E3-1505M v5, Quadro M2000M, 90 Wh | Dell XPS 15 9560 (i7-7700HQ, UHD) i7-7700HQ, GeForce GTX 1050 Mobile, 97 Wh | Dell Precision 5510 E3-1505M v5, Quadro M1000M, 56 Wh | |
|---|---|---|---|---|---|---|---|
| Battery runtime | 30% | -16% | 96% | 16% | 52% | 18% | |
| Reader / Idle (h) | 12.1 | 9.3 -23% | 4.5 -63% | 19.5 61% | 9 -26% | 13.9 15% | 7.1 -41% |
| WiFi v1.3 (h) | 4.2 | 5.6 33% | 4 -5% | 9.9 136% | 4.8 14% | 7.2 71% | 4.8 14% |
| Load (h) | 1 | 1.8 80% | 1.2 20% | 1.9 90% | 1.6 60% | 1.7 70% | 1.8 80% |
| WiFi (h) | 5 |
Pros
Cons
Verdict
Although not much has changed in terms of basic design since the Precision 5510 over a year ago, the Dell Precision 5520 still remains one of the most portable and attractive workstations around. The move to Kaby Lake sees mixed results, with CPU performance limitations under sustained load preventing the machine from reaching its full potential in multi-core performance, even under realistic stress testing conditions. But the upgrade to NVMe storage and the adoption of the newer NVIDIA Quadro M1200 yields tangible benefits for the device’s workstation performance: we recorded respectable results across the board in our SPECviewperf tests, and generally well above those from the 5510, to boot. GPU performance also seems quite stable under our Witcher 3 stress test.
Some sacrifices are to be expected when dealing with a workstation of this size; after all, the 5520 weighs barely over 2 kg and carries a footprint closer to that of a 14-inch machine. Apart from the CPU constraints, the Precision also becomes quite warm under load, and battery life is absolutely nothing special (at least, with the UHD screen we received in our test unit). So while the dream of a hybrid Ultrabook/workstation may still yet remain unrealized, for those who can get by with good GPU/workstation performance but don’t mind disappointing multi-core CPU capabilities, the Precision 5520 is an attractive compromise in exchange for greater portability and nicer aesthetics.
For others, a larger workstation is probably the only answer—though there’s always other ultraportable (consumer-grade) options like the XPS 15 and Razer Blade if those happen to qualify. For instance, although our XPS 15 review unit didn’t have quite the CPU horsepower as our Precision, clock rates and performance were stable in the Cinebench loop test—and overall, sustained performance is better.
Some sacrifices are to be expected when dealing with a workstation of this size; for those whose needs it happens to meet, the Precision 5520 is an attractive compromise in exchange for greater portability and nicer aesthetics.
There is absolutely room for improvement with the next revision, but for what it is, the Precision 5520 is still an impressive device with solid professional GPU performance for its size. At $2,867 (as configured), it’s no small investment—but it’s also (still today) one-of-a-kind.
Dell Precision 5520 UHD
- 04/28/2017 v6 (old)
Steve Schardein
Price comparison
