Dell Precision 3520 (i7-7820HQ, M620M) Workstation Review

For the original German review, see here.
An inexpensive mobile workstation - isn't that a contradiction in terms? Not according to Dell, who promises that the review notebook - the Precision 3520 - is exactly that. Of course, we might have to define what "inexpensive" means here in the first place. Well-equipped mobile workstations cost easily above 2000 (~$2250) and sometimes up to 3000 Euro (~$3360). By these standards, the Precision 3520 is almost a bargain: the entry-level configuration as sold by Dell can be purchased for 1400 Euro (~$1570). Our review workstation with the fastest i7 processor, Full HD display, 32 GB of RAM and 512 GB SSD is the top-of-the-line model and sells for 2500 Euro (~$2800).
At a first glance, the Precision 3520 looks like the Precision 3510, but there are differences as far as the chassis and the feature set are concerned. Since the 3520 is a fairly minor update, we are omitting the sections dealing with the input devices, maintenance and security features and will focus on the display and the inner merits instead.
Particularly interesting here is the Quadro M620 GPU, which we haven't been able to review thus far. For comparison purposes, we are going to look at alternative workstation offerings like the ThinkPad P50, ZBook 15 G3 or the Precision 5520. For a direct comparison, we are also going to check out the predecessor-GPU Quadro M600M in the ThinkPad P70.
The original review was conducted by our German colleagues. An identically-equipped version of the workstation we configured on Dell's US site cost $2170 at the time of writing.
What's new
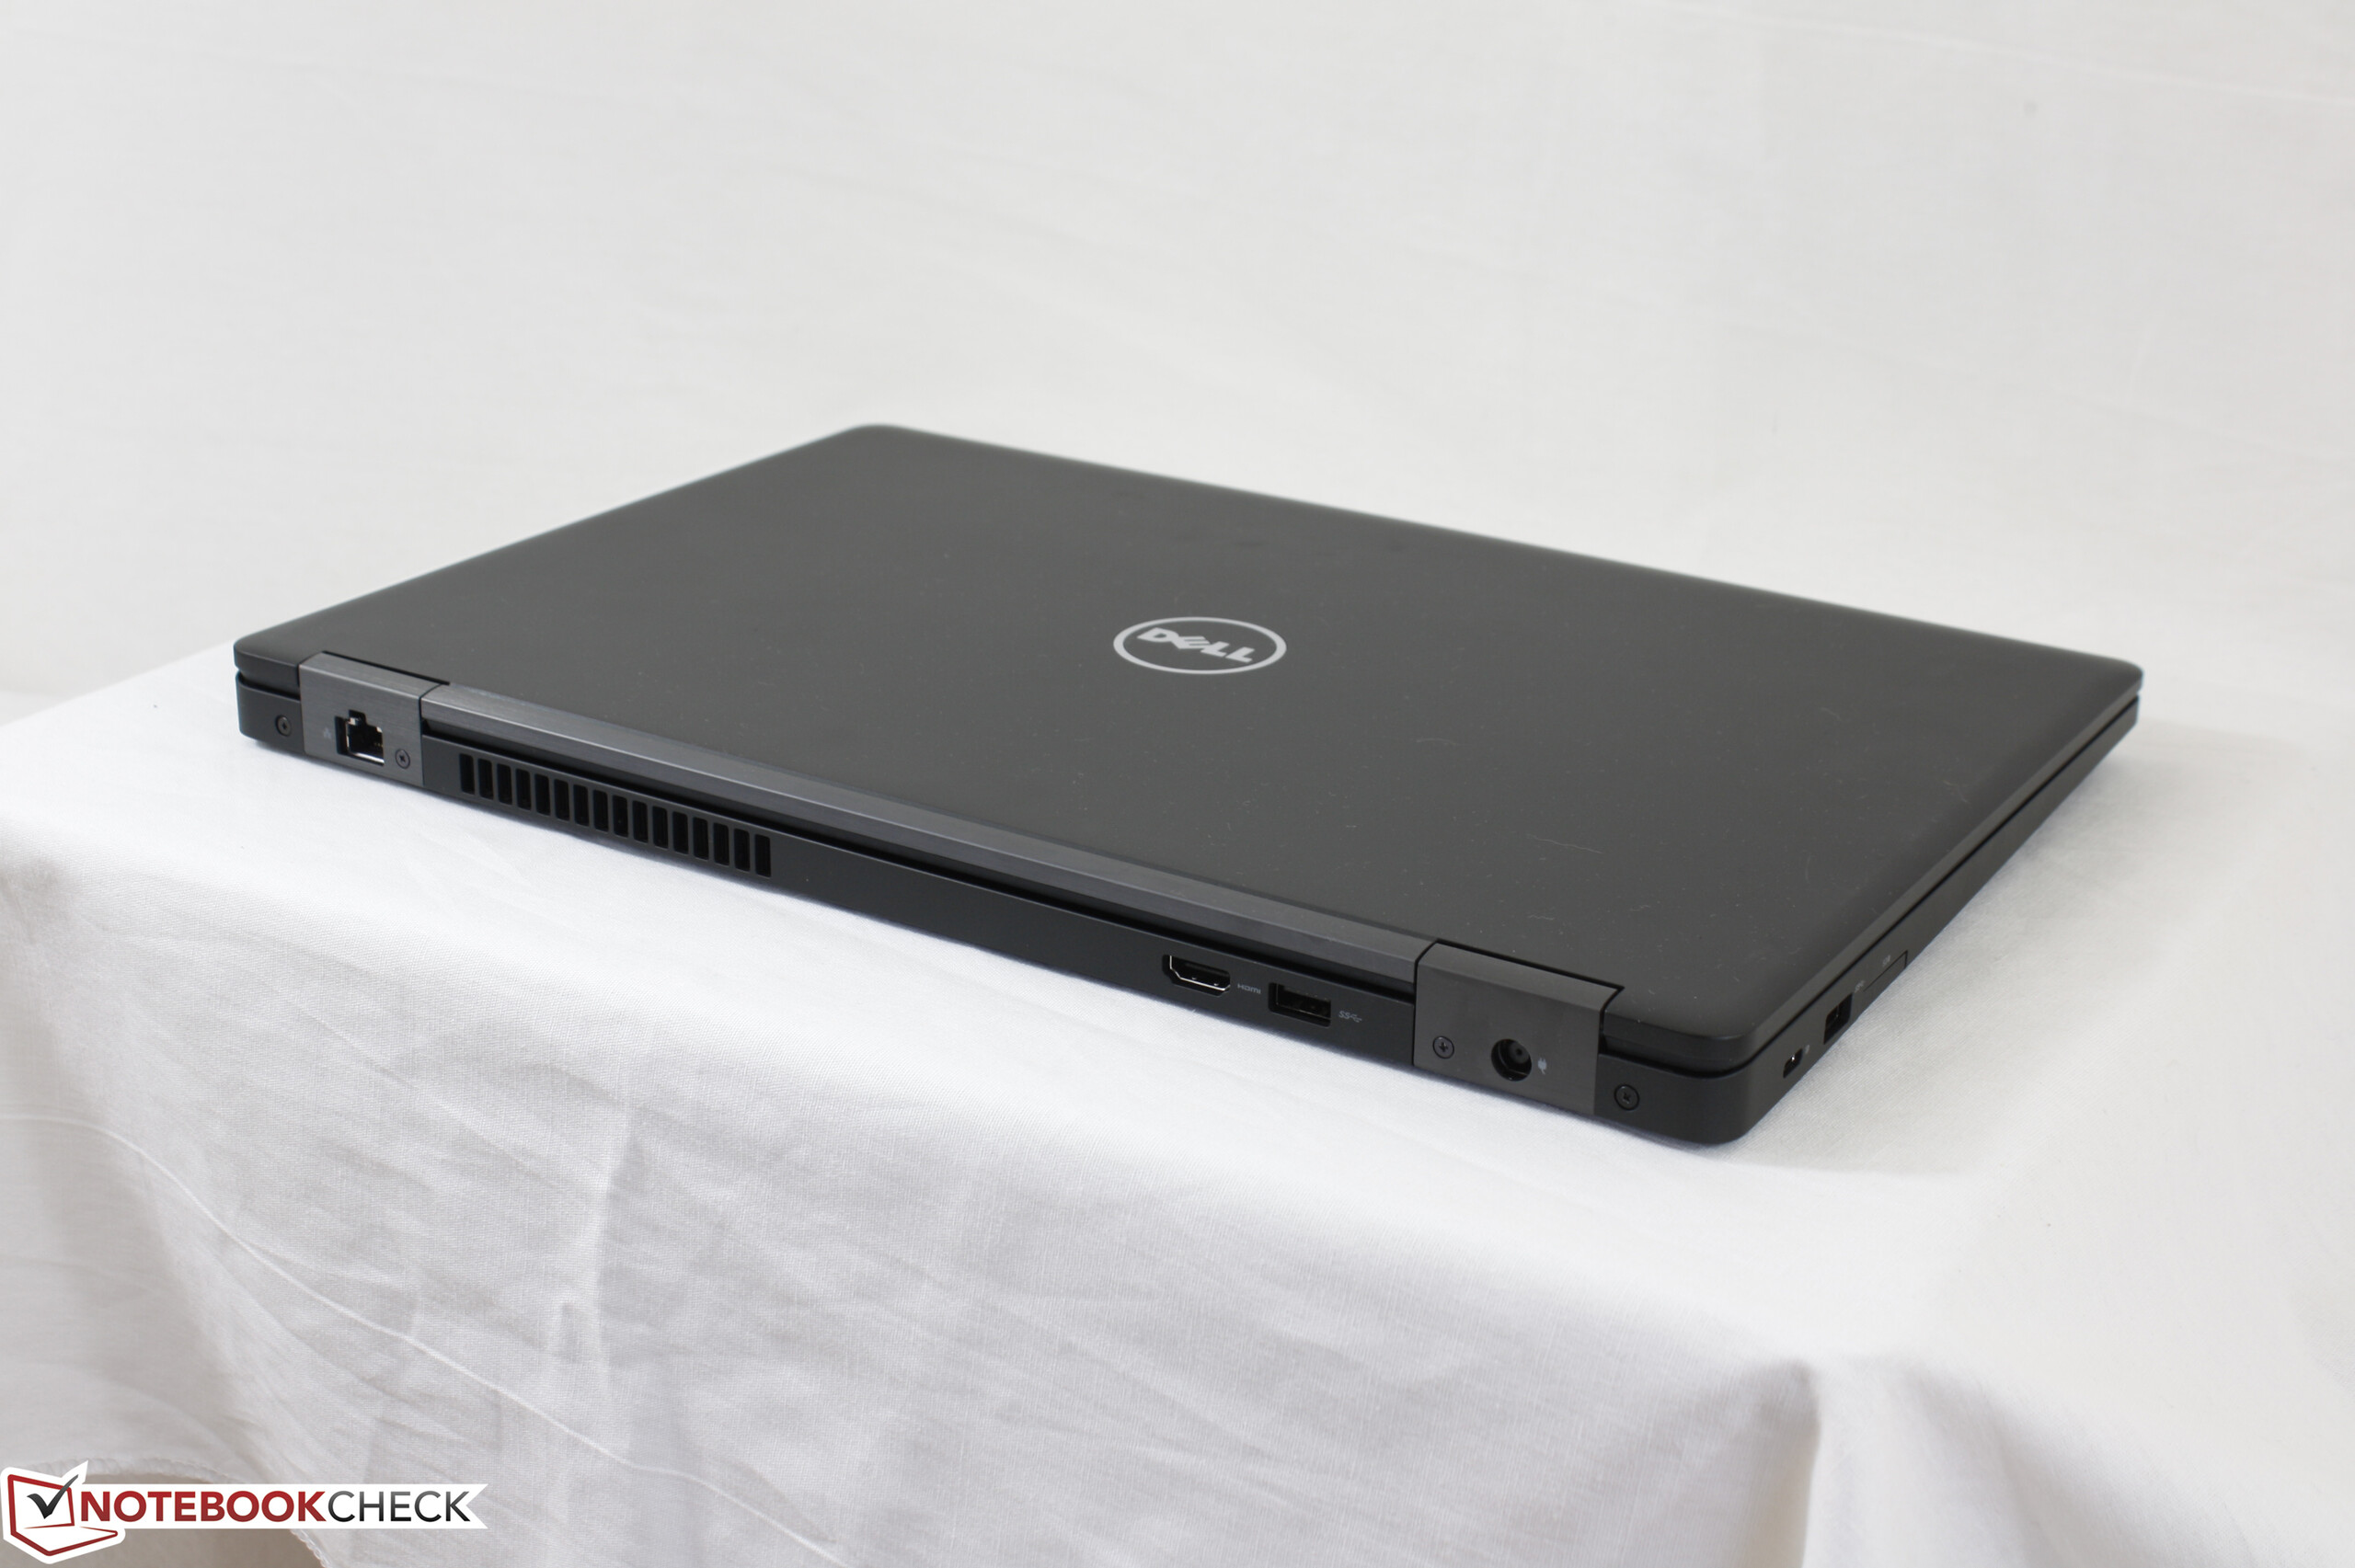
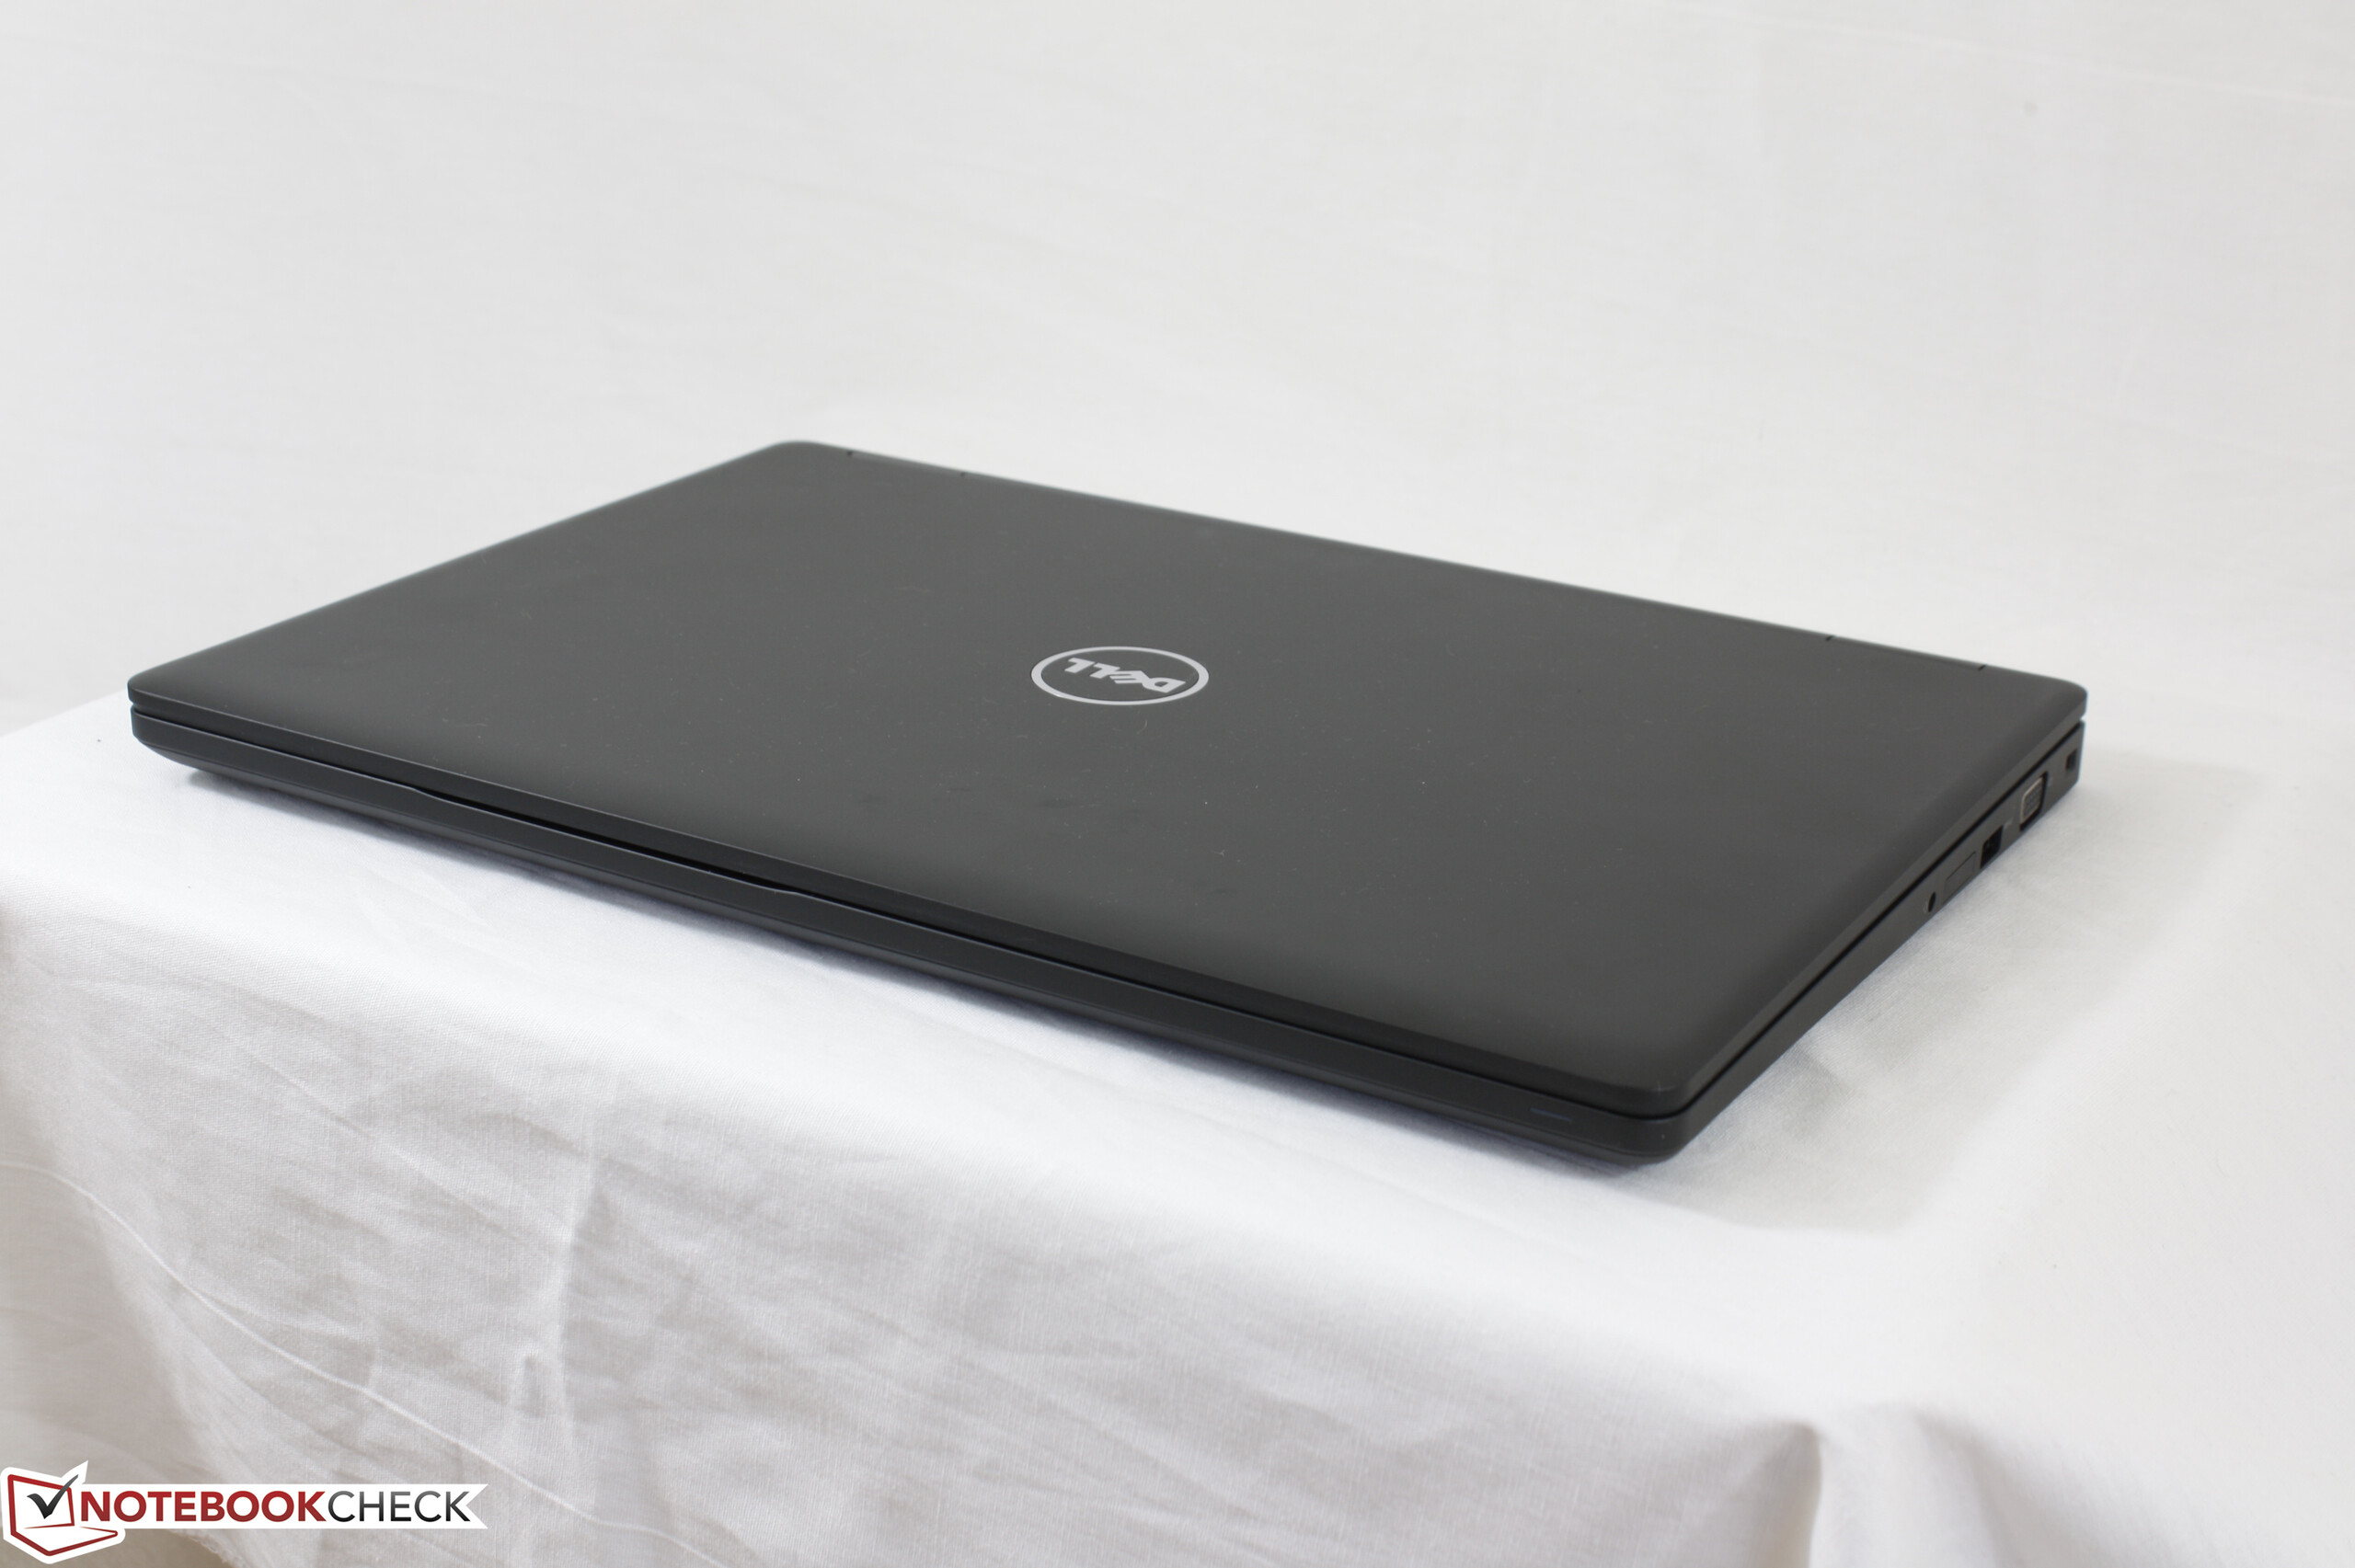
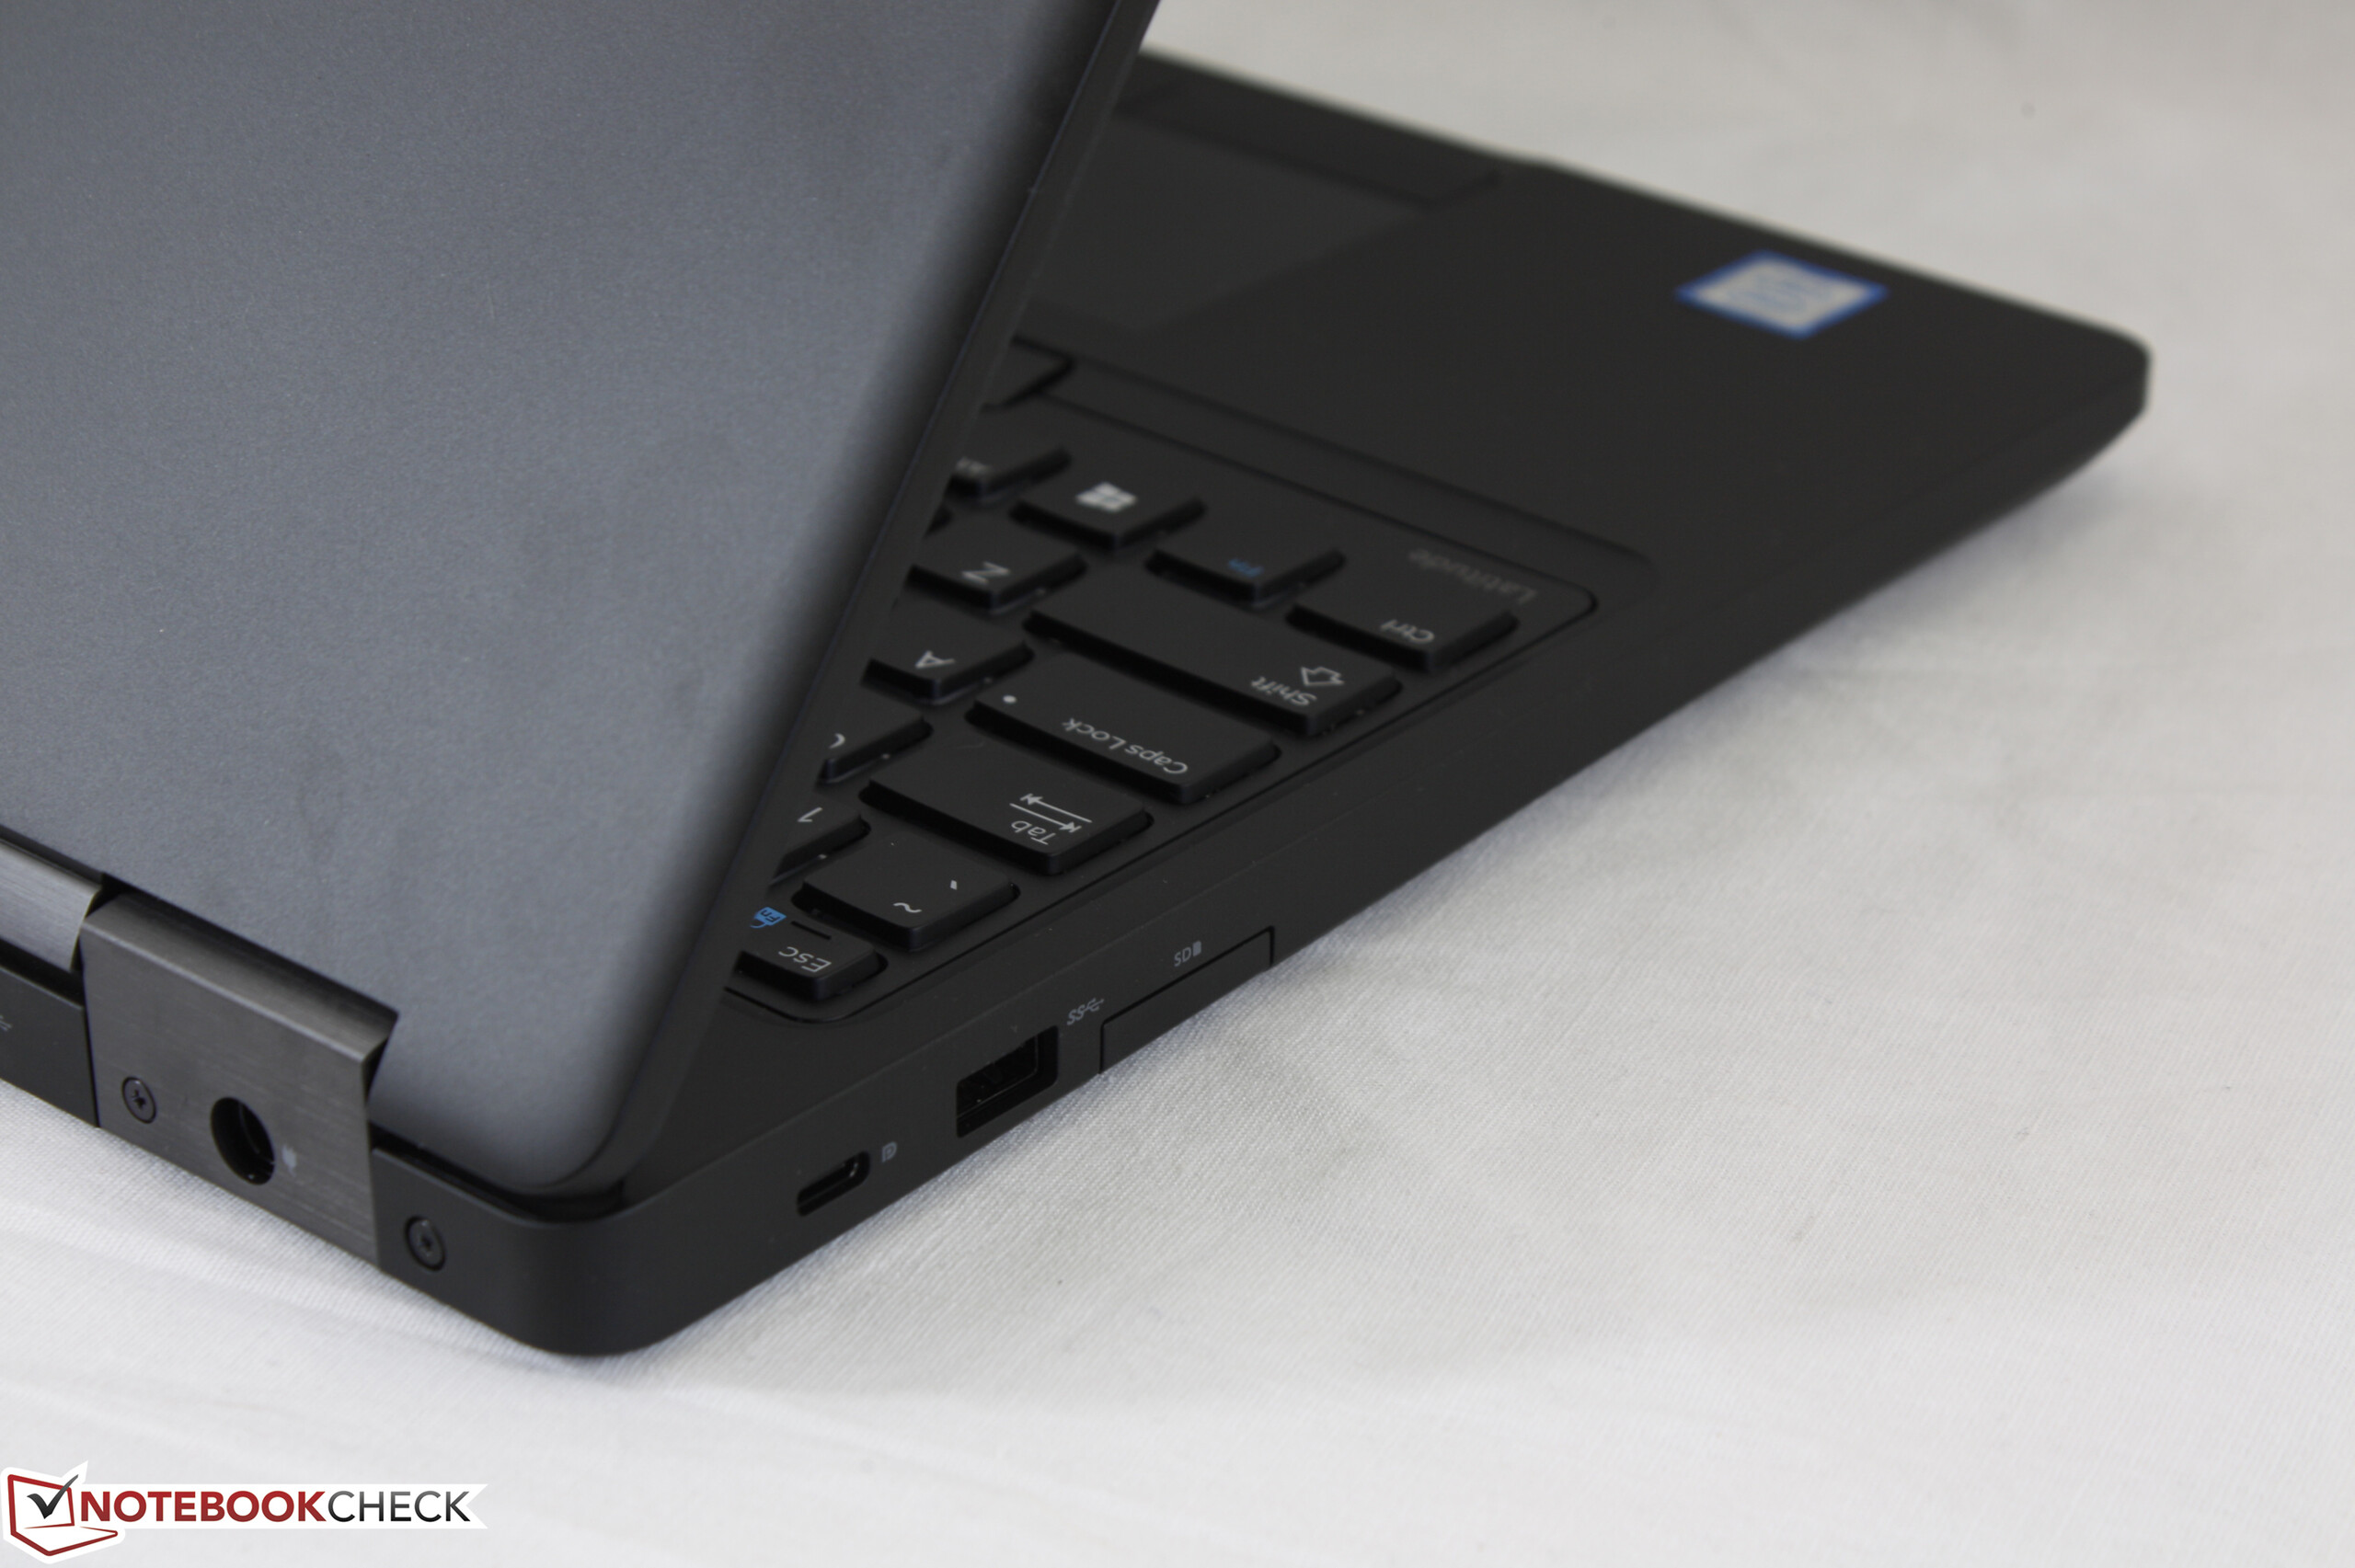
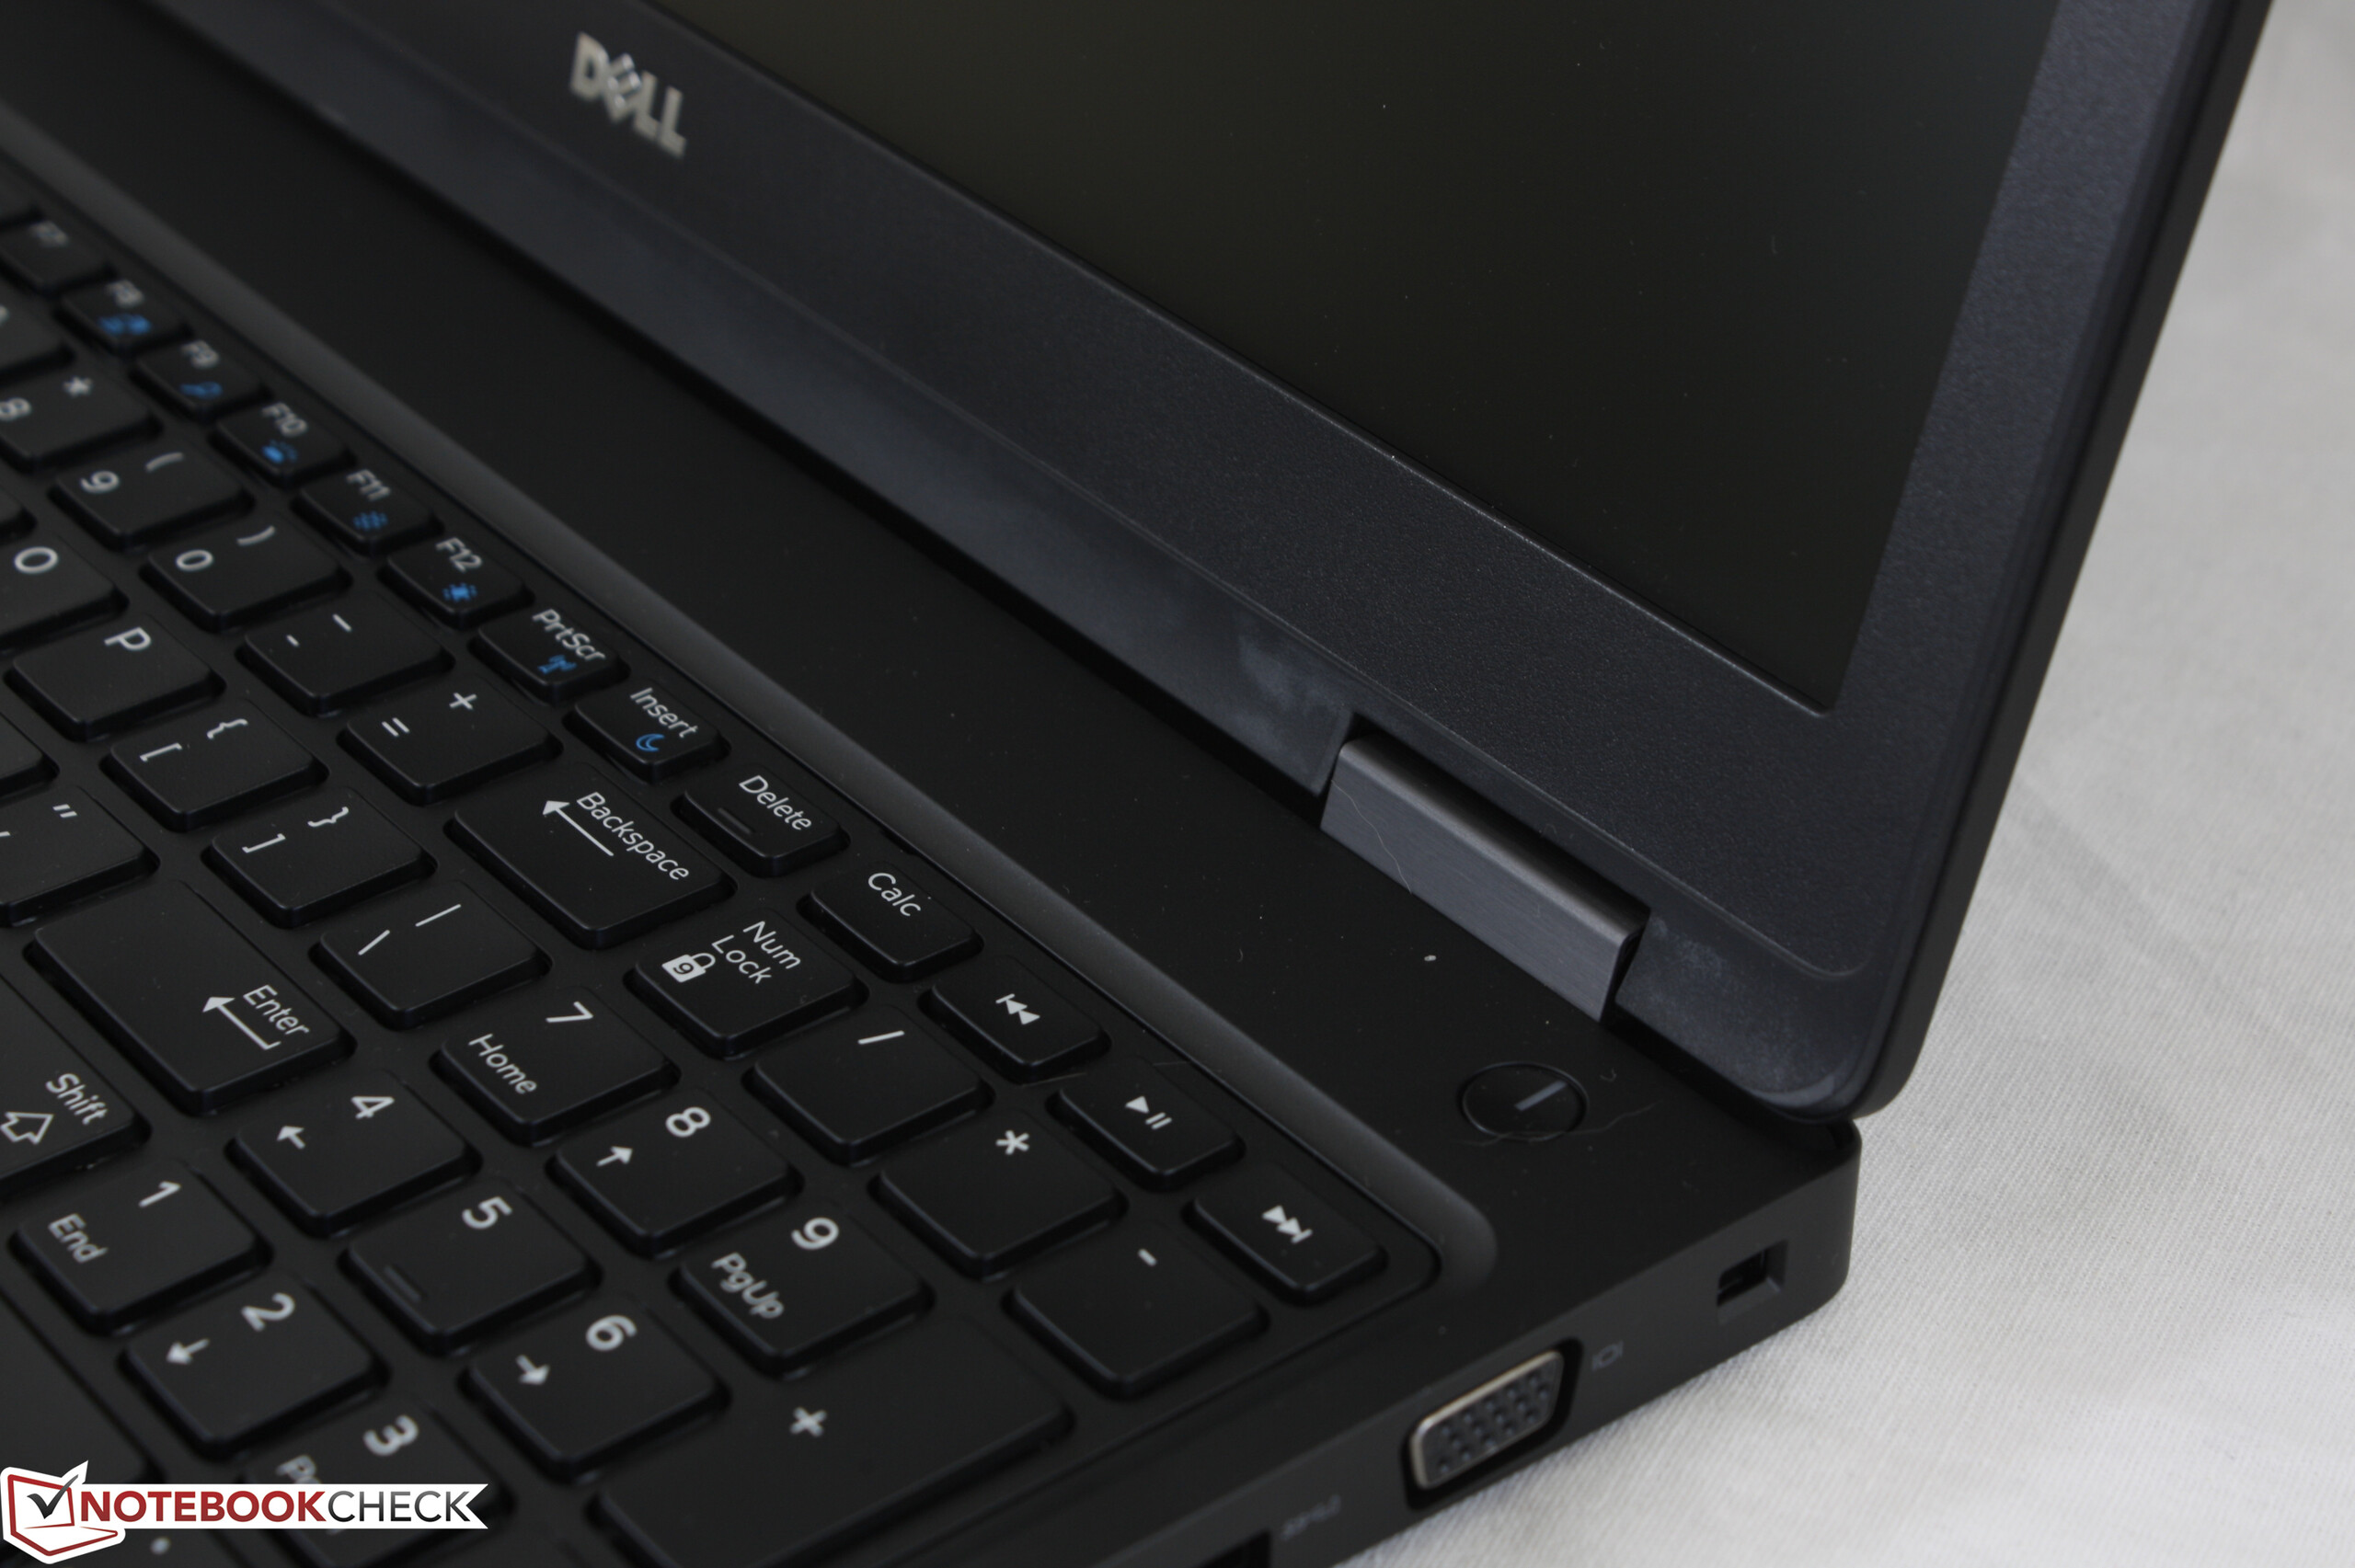
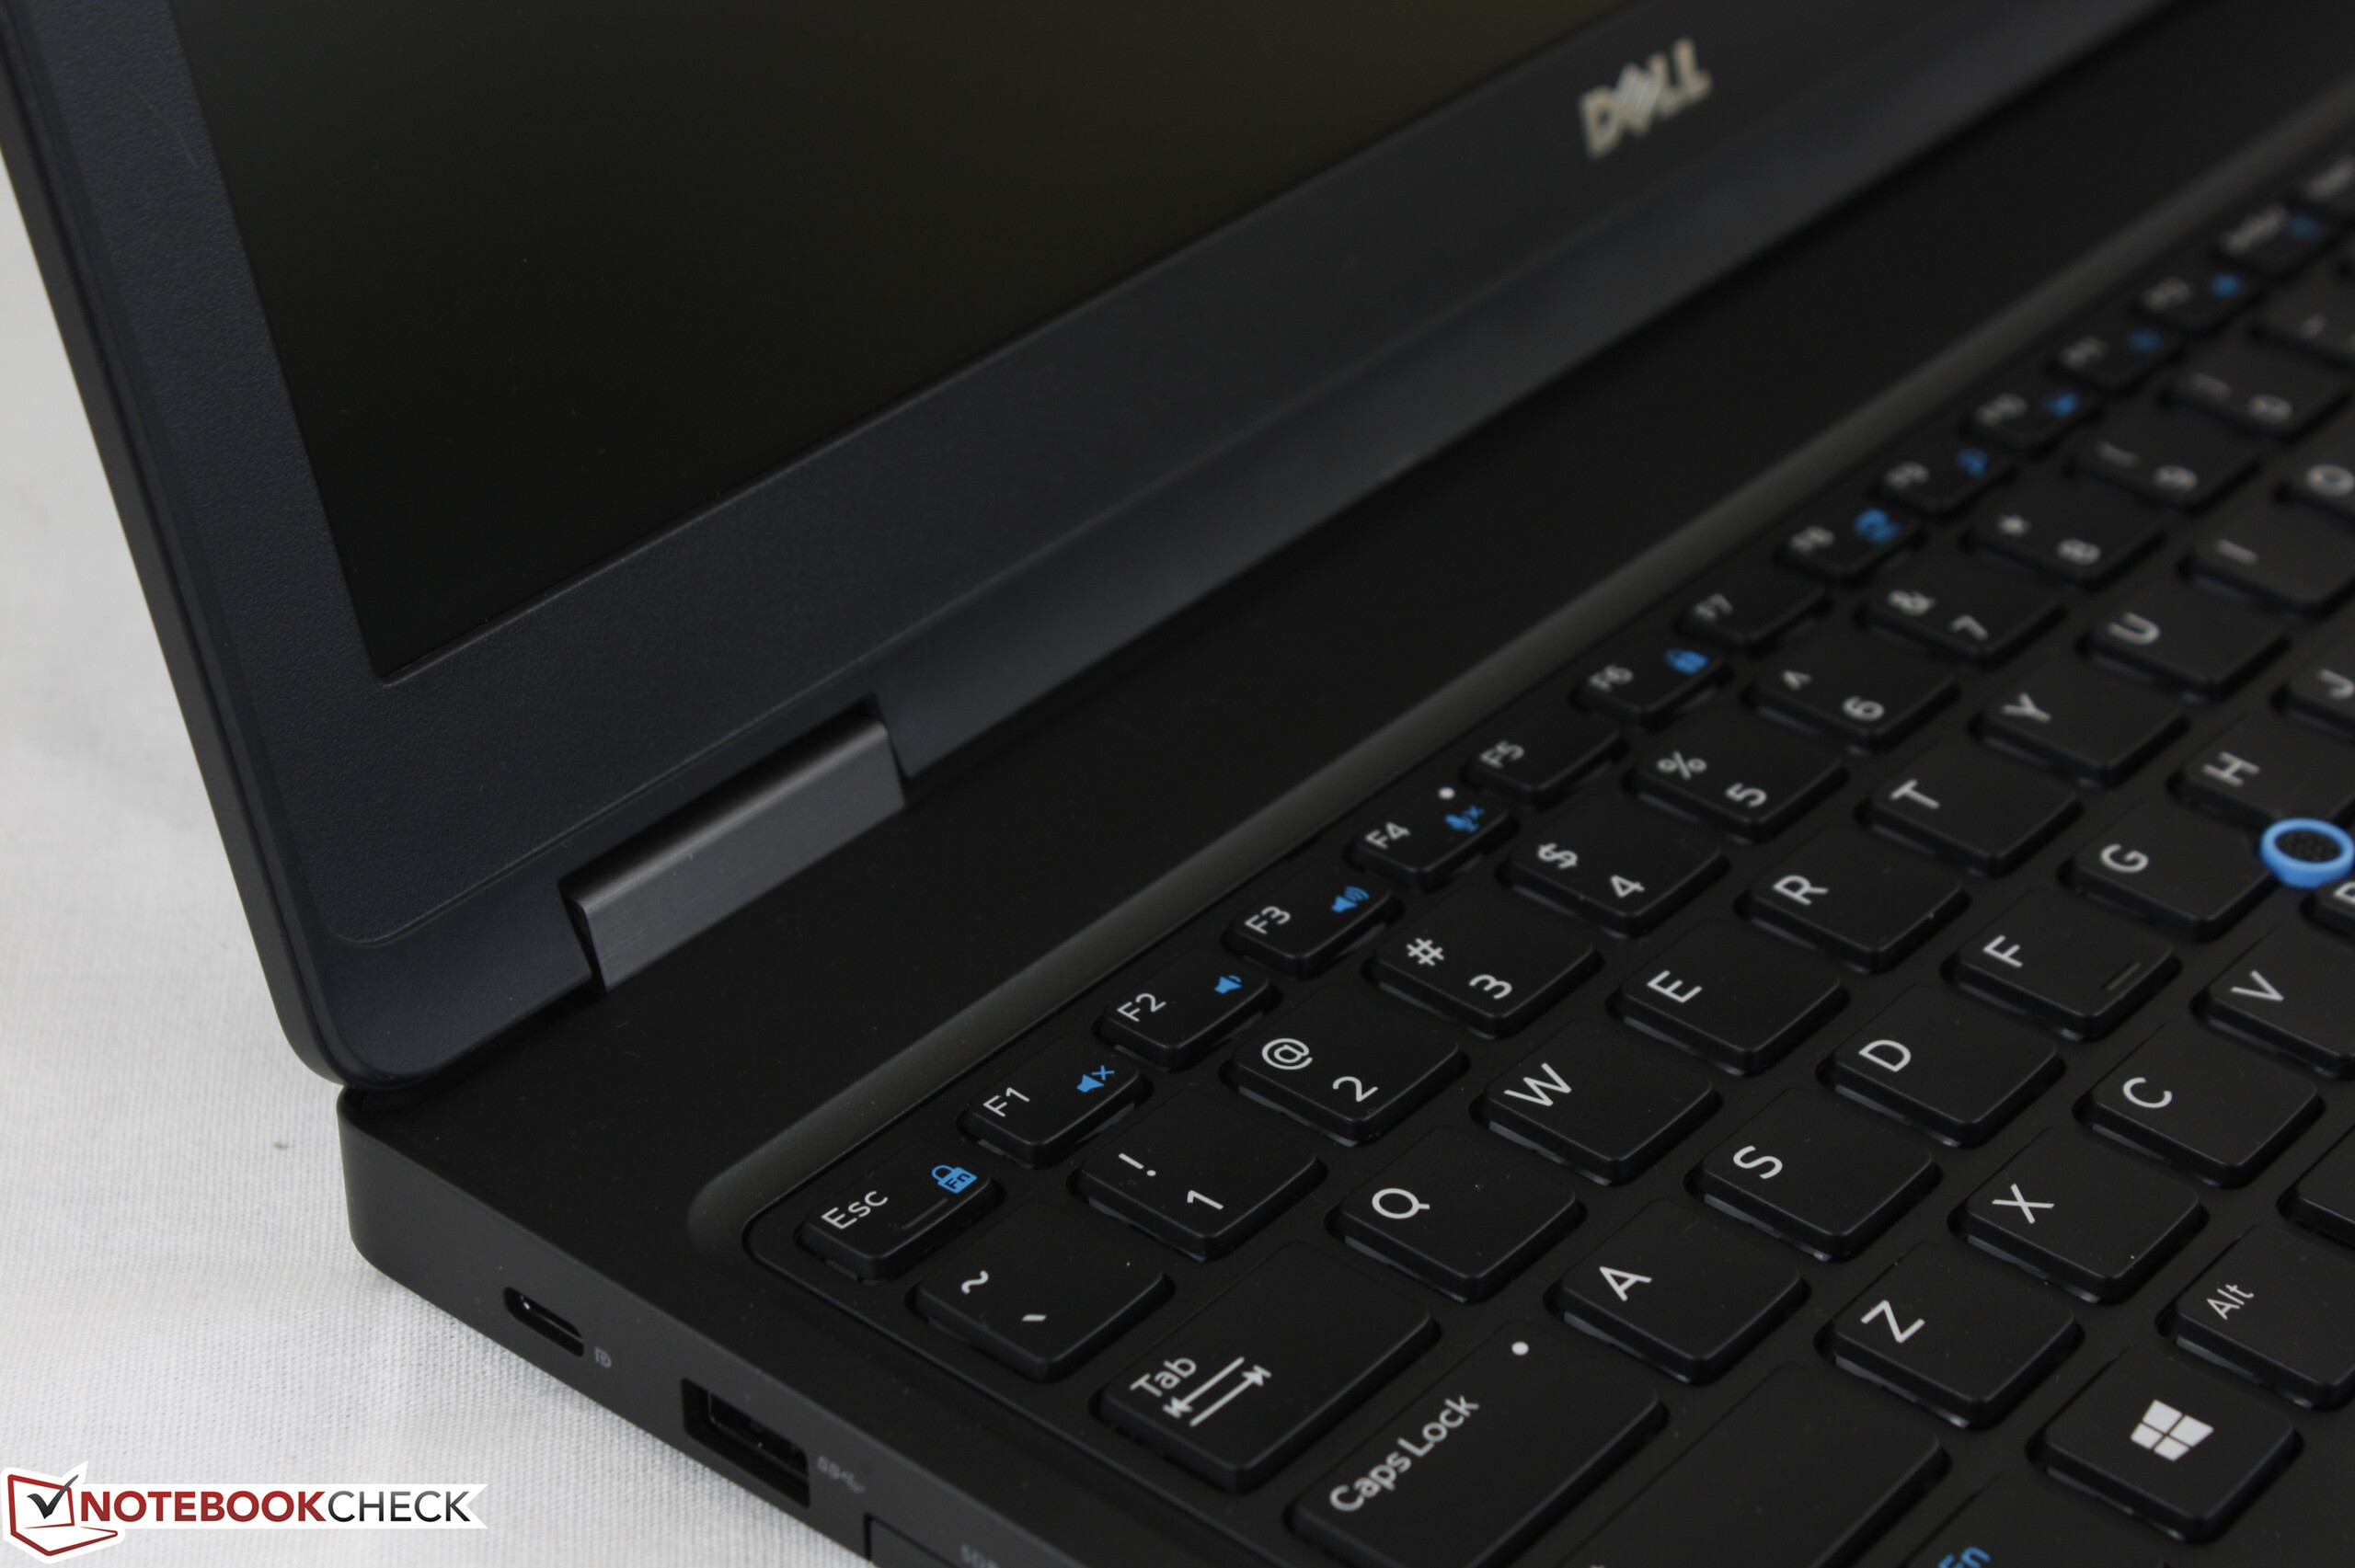
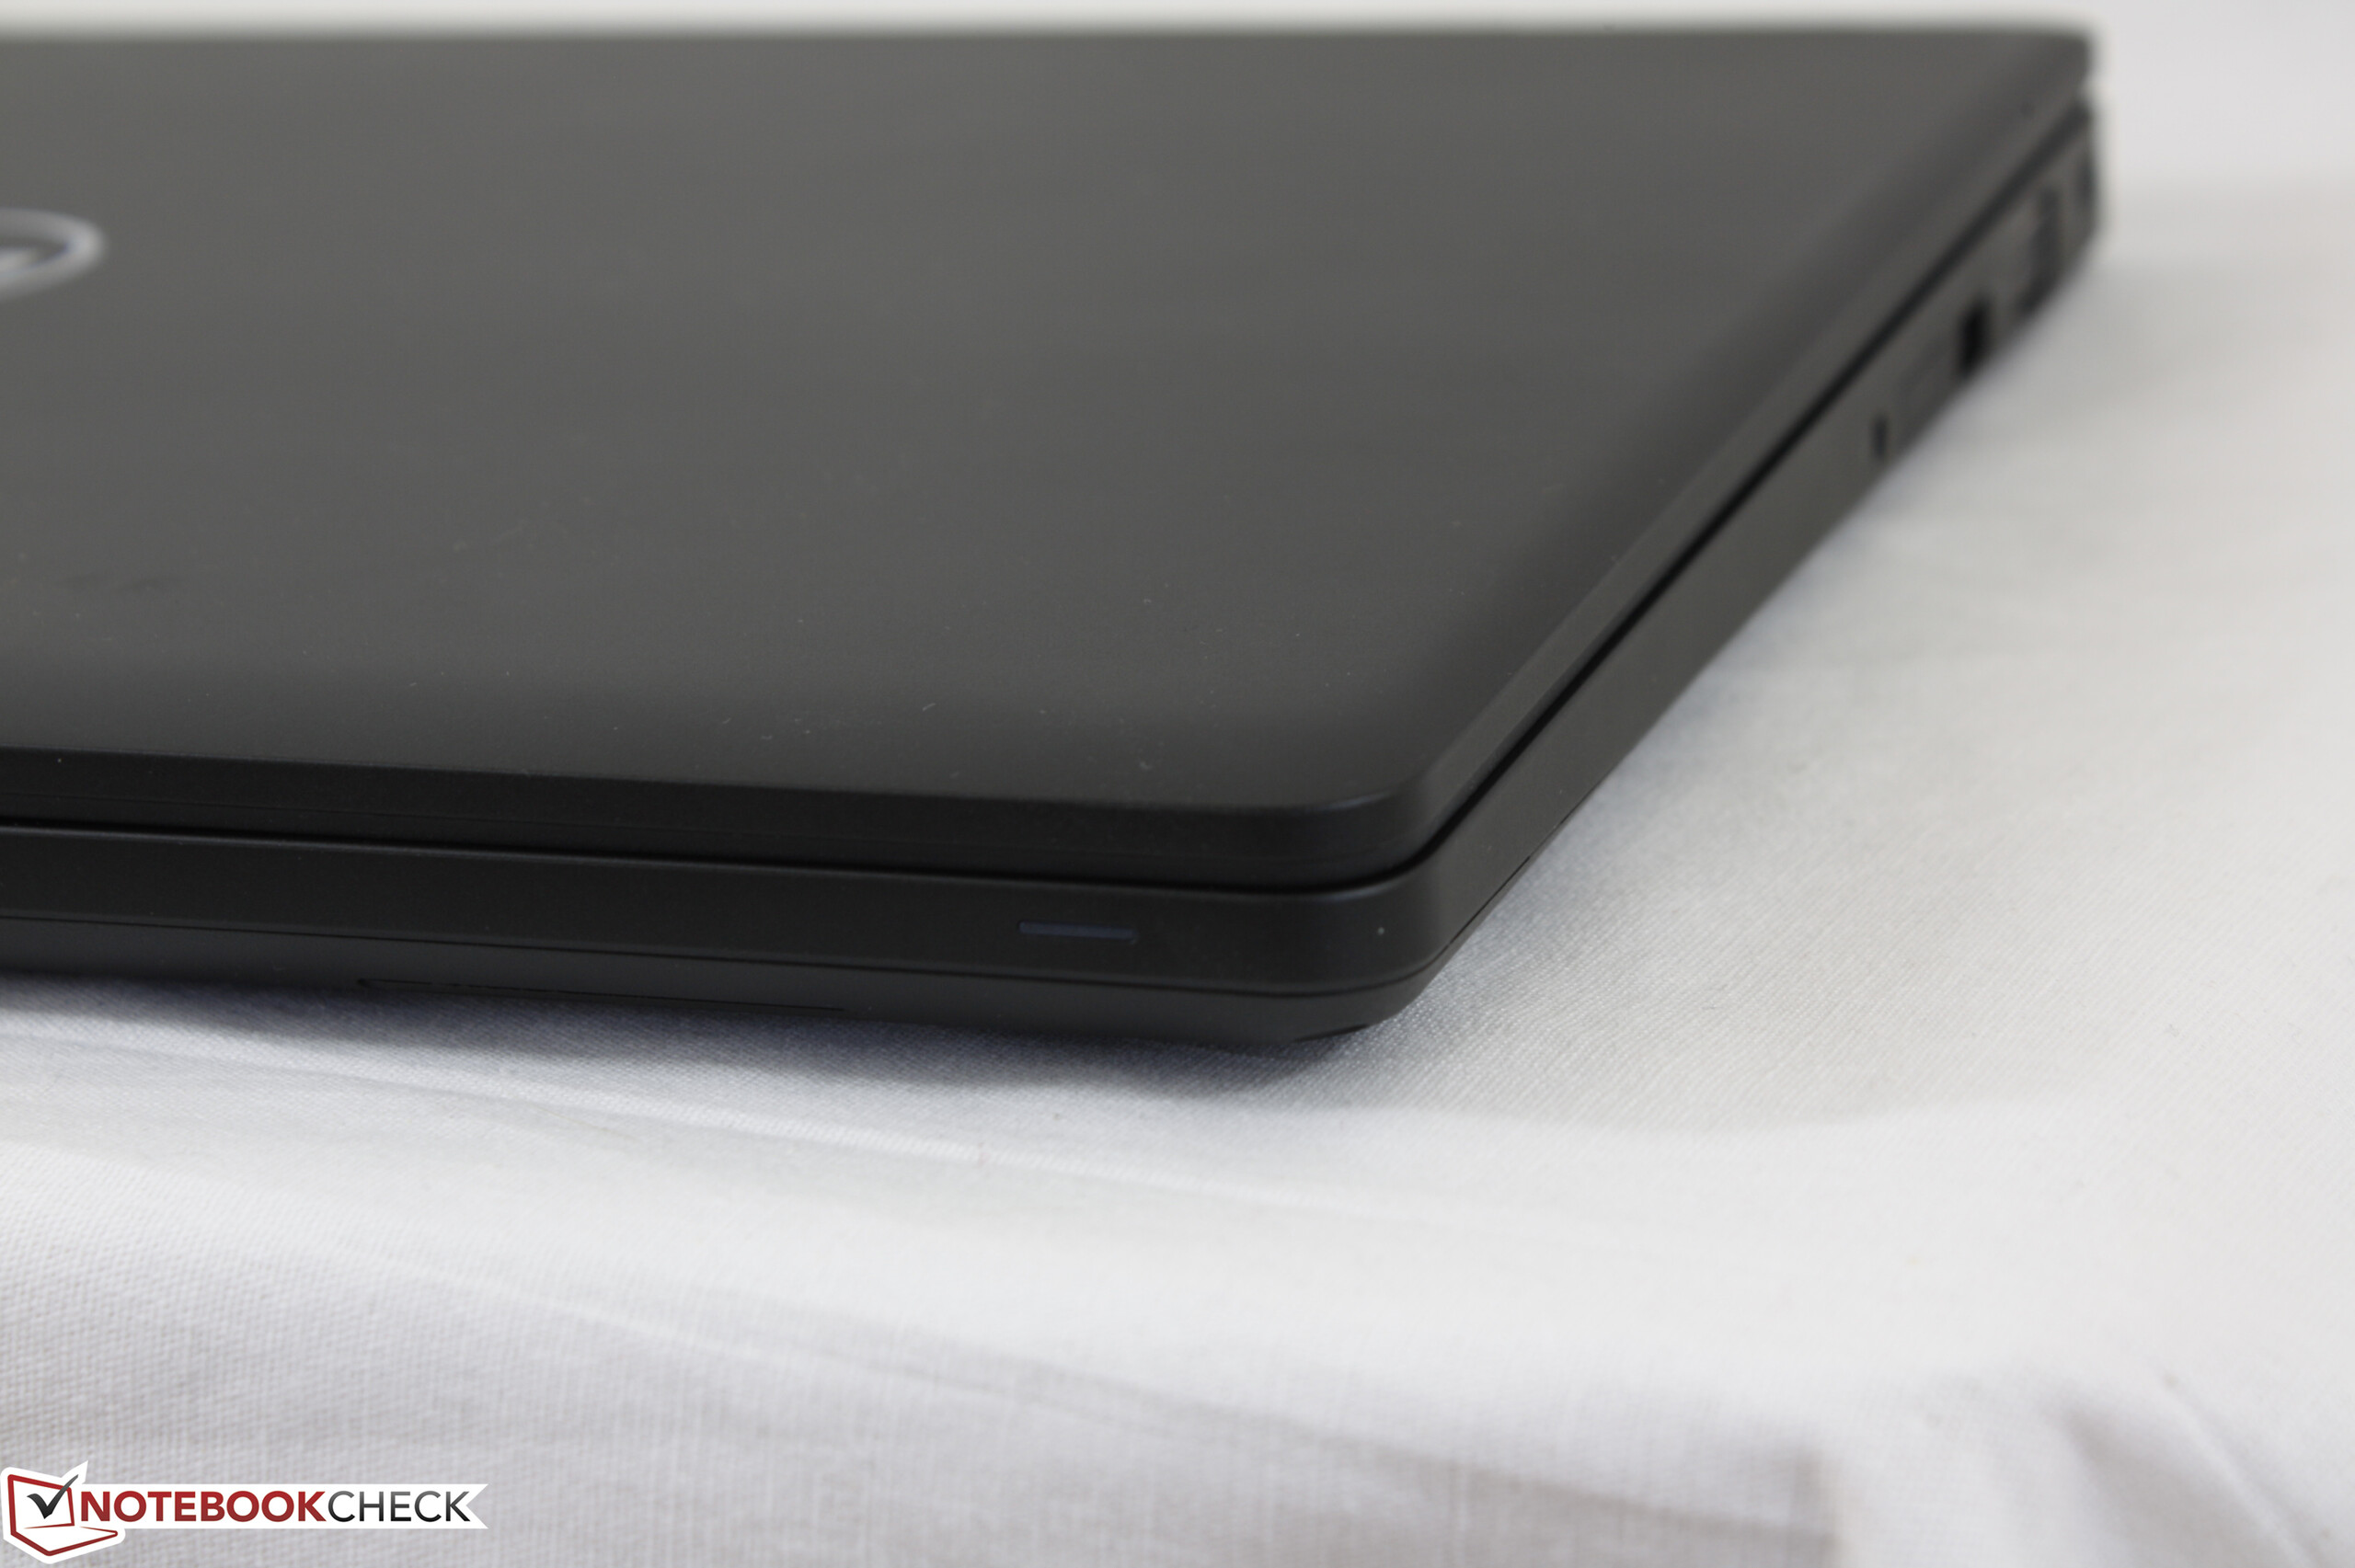
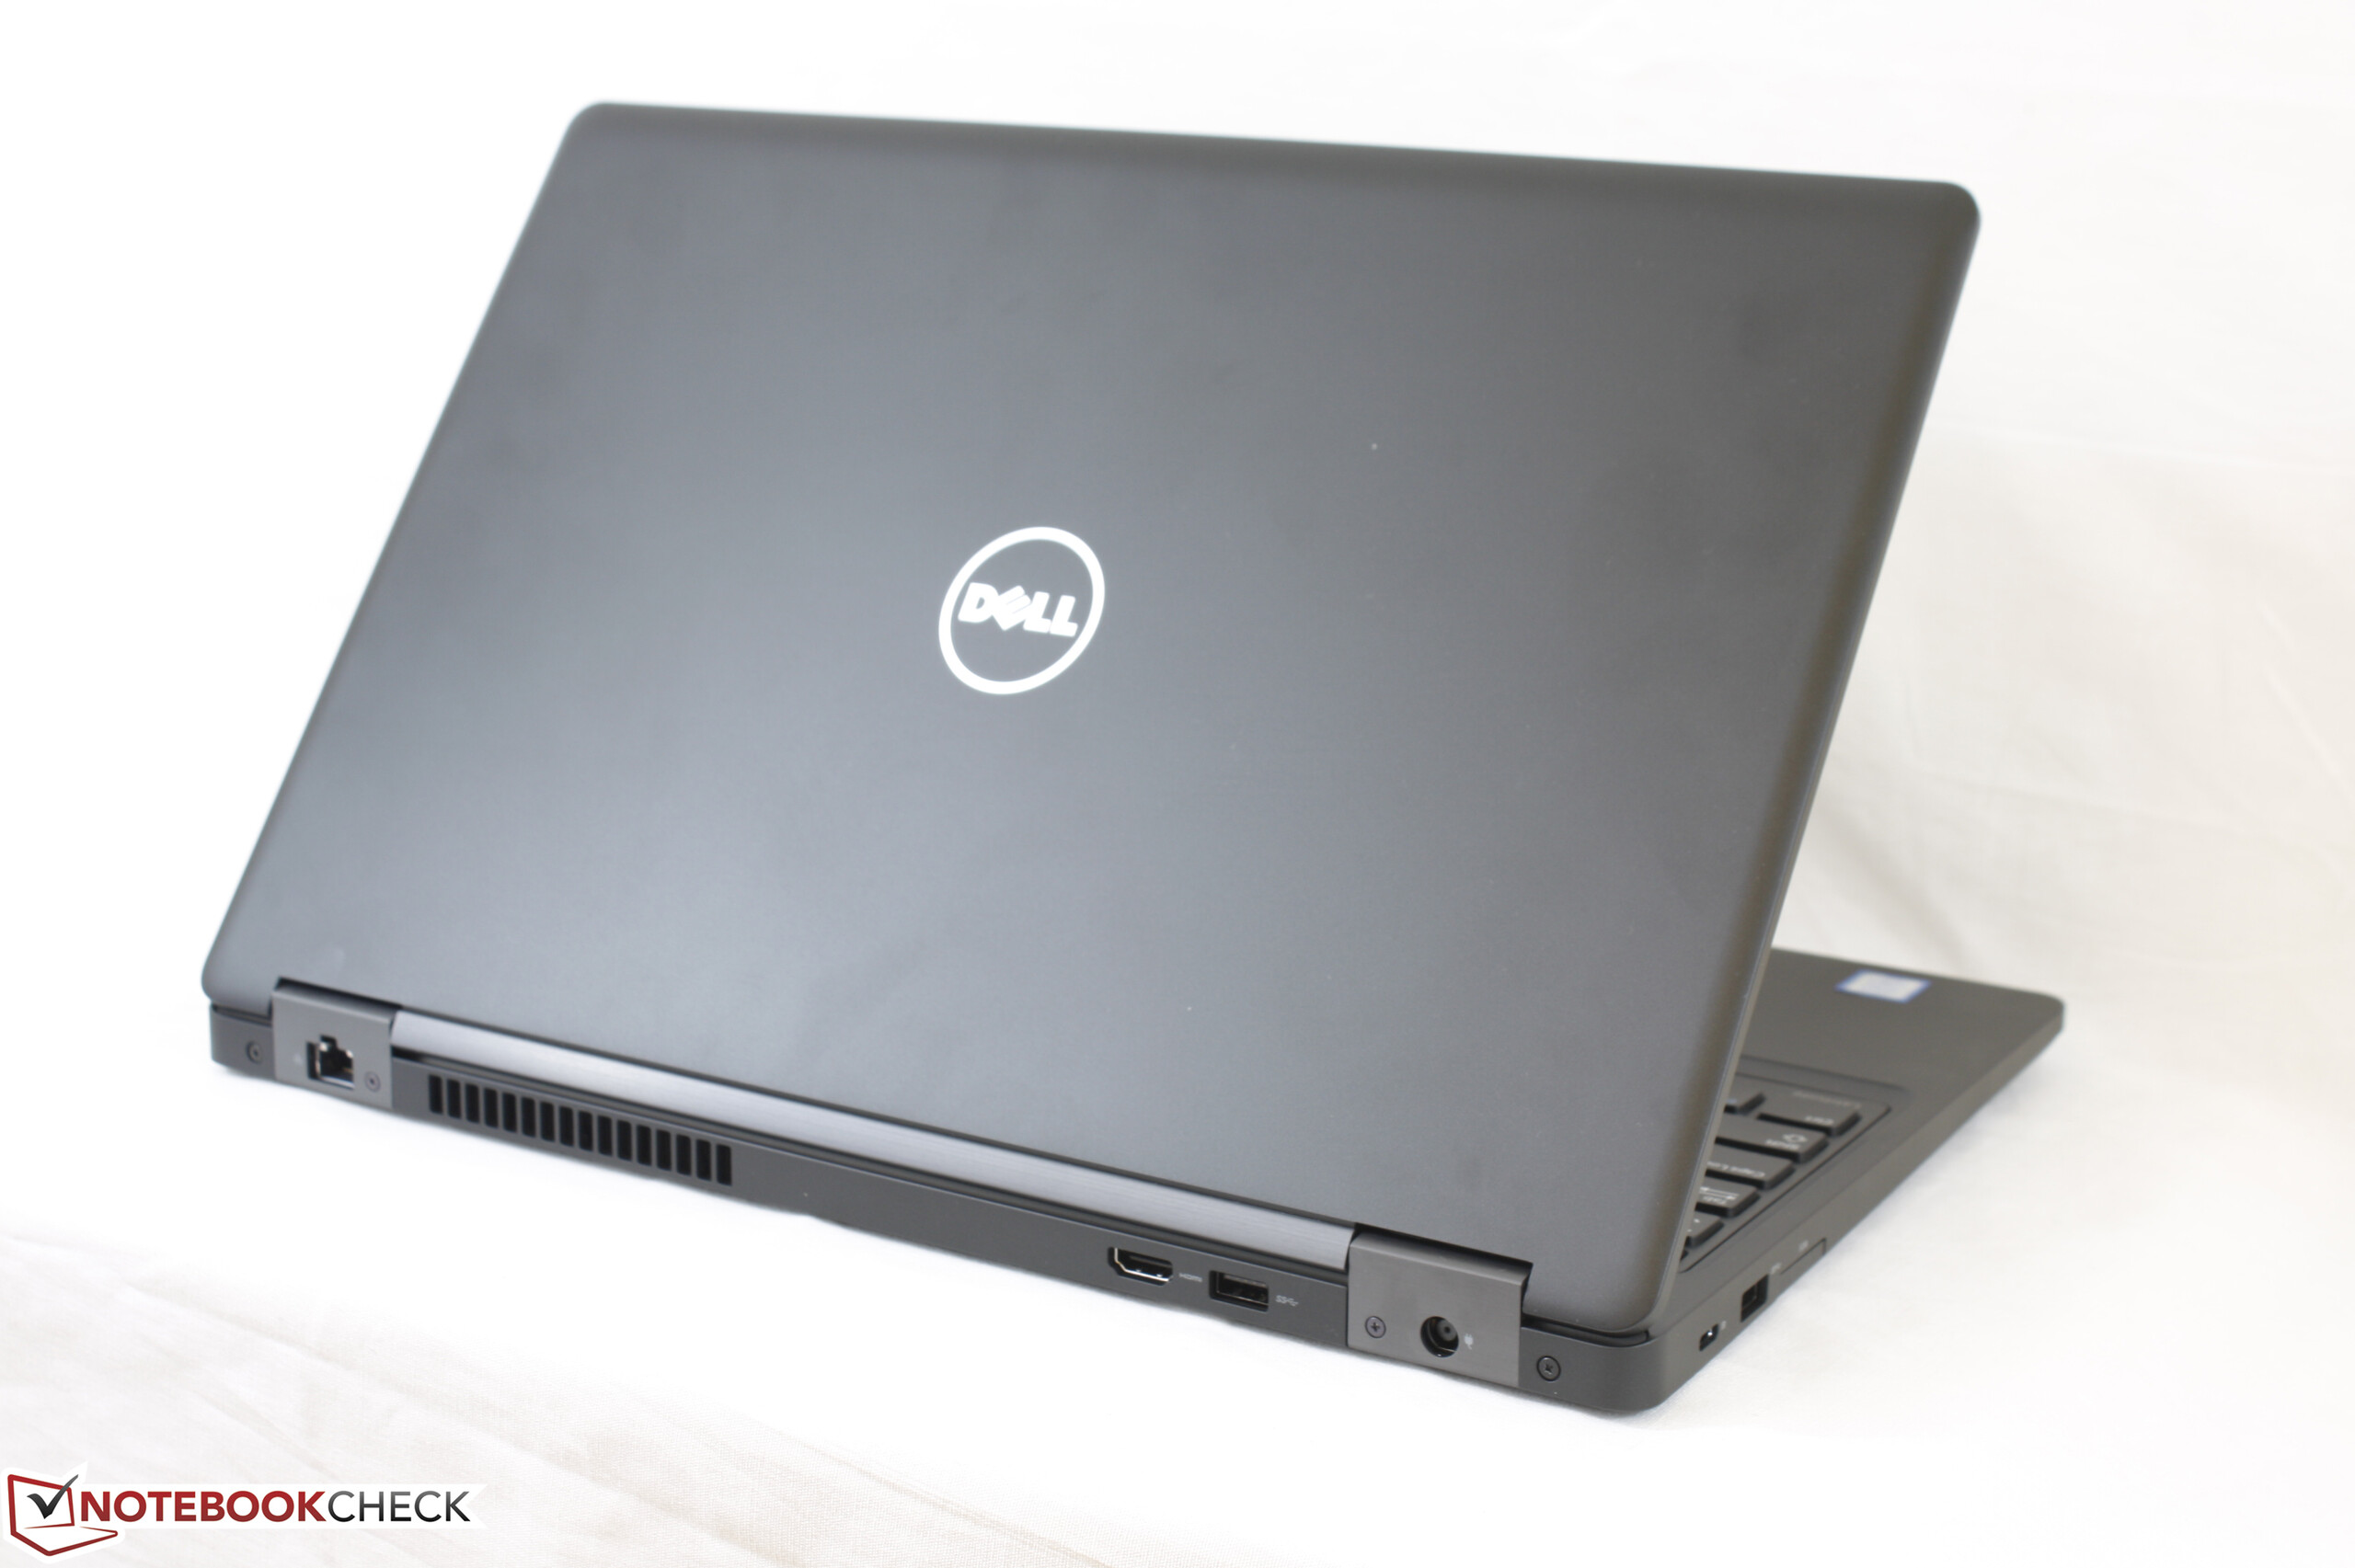
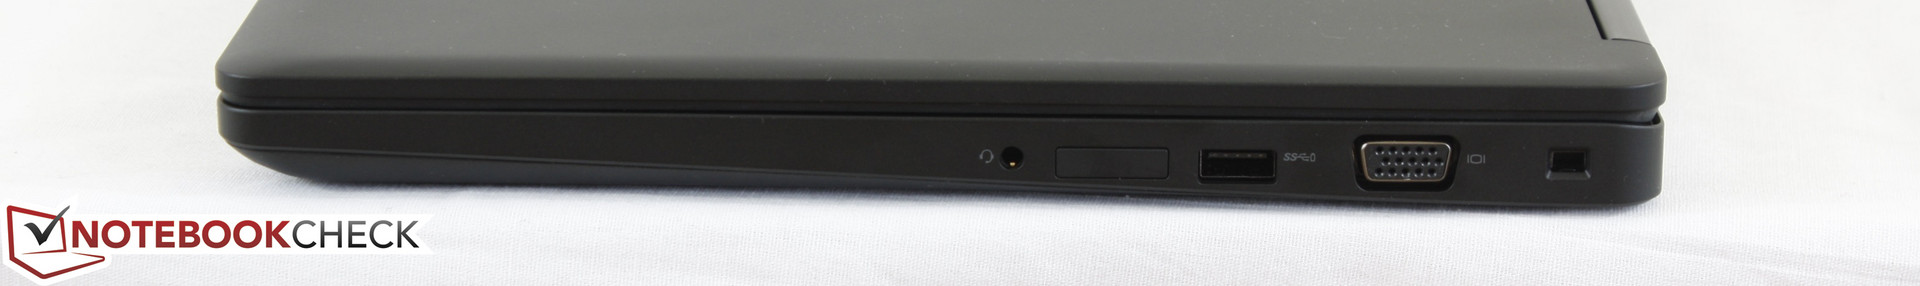
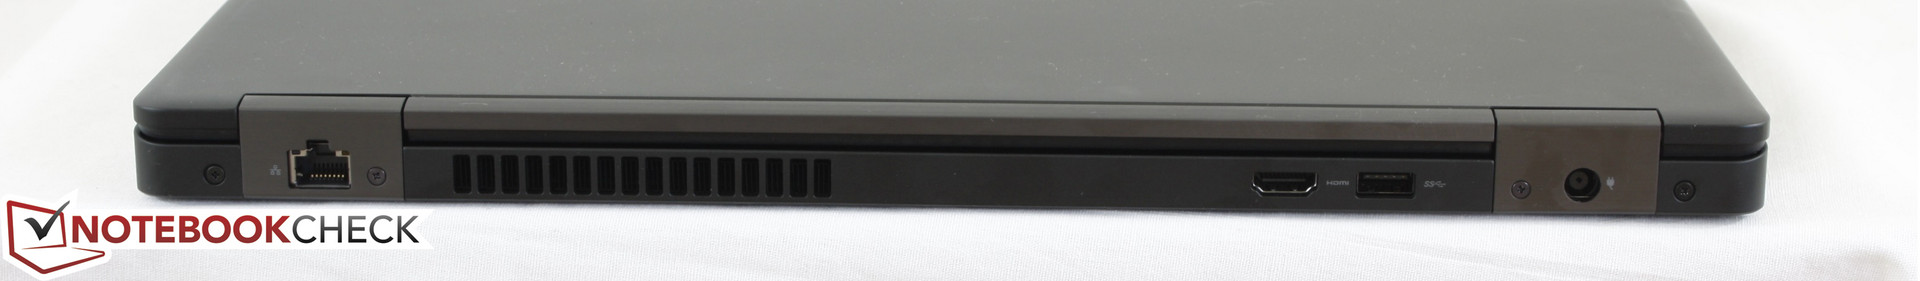
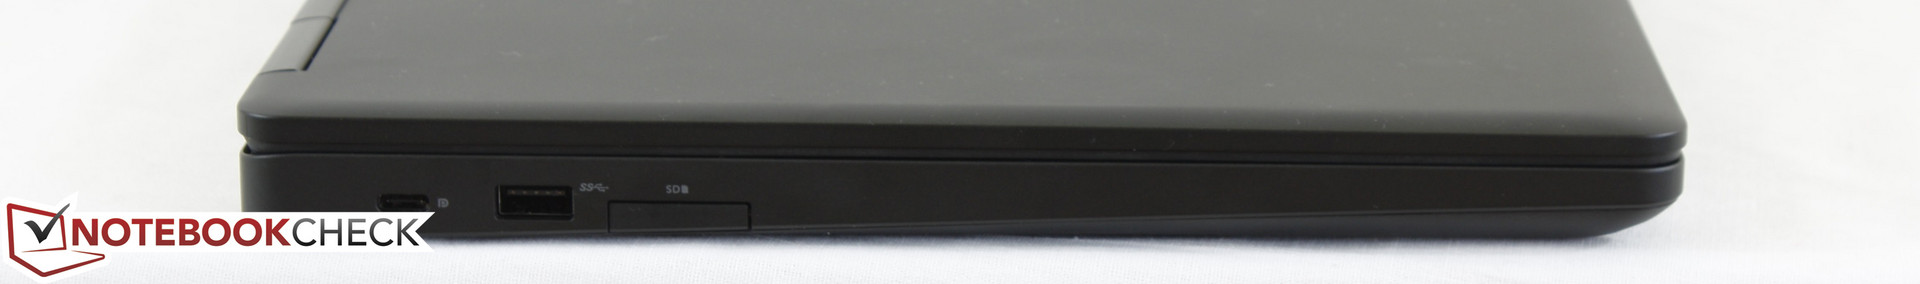
The chassis looks identical to that of the predecessor, but it's a little lighter. The biggest difference is the location of the physical ports, which Dell revamped completely. The predecessor had the SIM card slot and the VGA port on the back - the new version features them on the right side. The SD card reader and one USB port moved from the right side to the left side; the fan exhaust is now on the back.
The port types haven't really changed, although there is one major difference: the physical docking port on the bottom is now missing, which leaves Thunderbolt 3 or USB Type-C connected docks as the only expansion option.
The WLAN module has changed slightly as well and the Precision 3520 now features the updated Kaby Lake Intel Wireless AC 8265 instead of the older AC 8260. The 2x2 module works as well as the predecessor did in the Precision 3510 and both the synthetic benchmark results as well as the real-world experience are quite decent. The sibling Precision 5520 ranks slightly better though especially as far as the uploads are concerned.
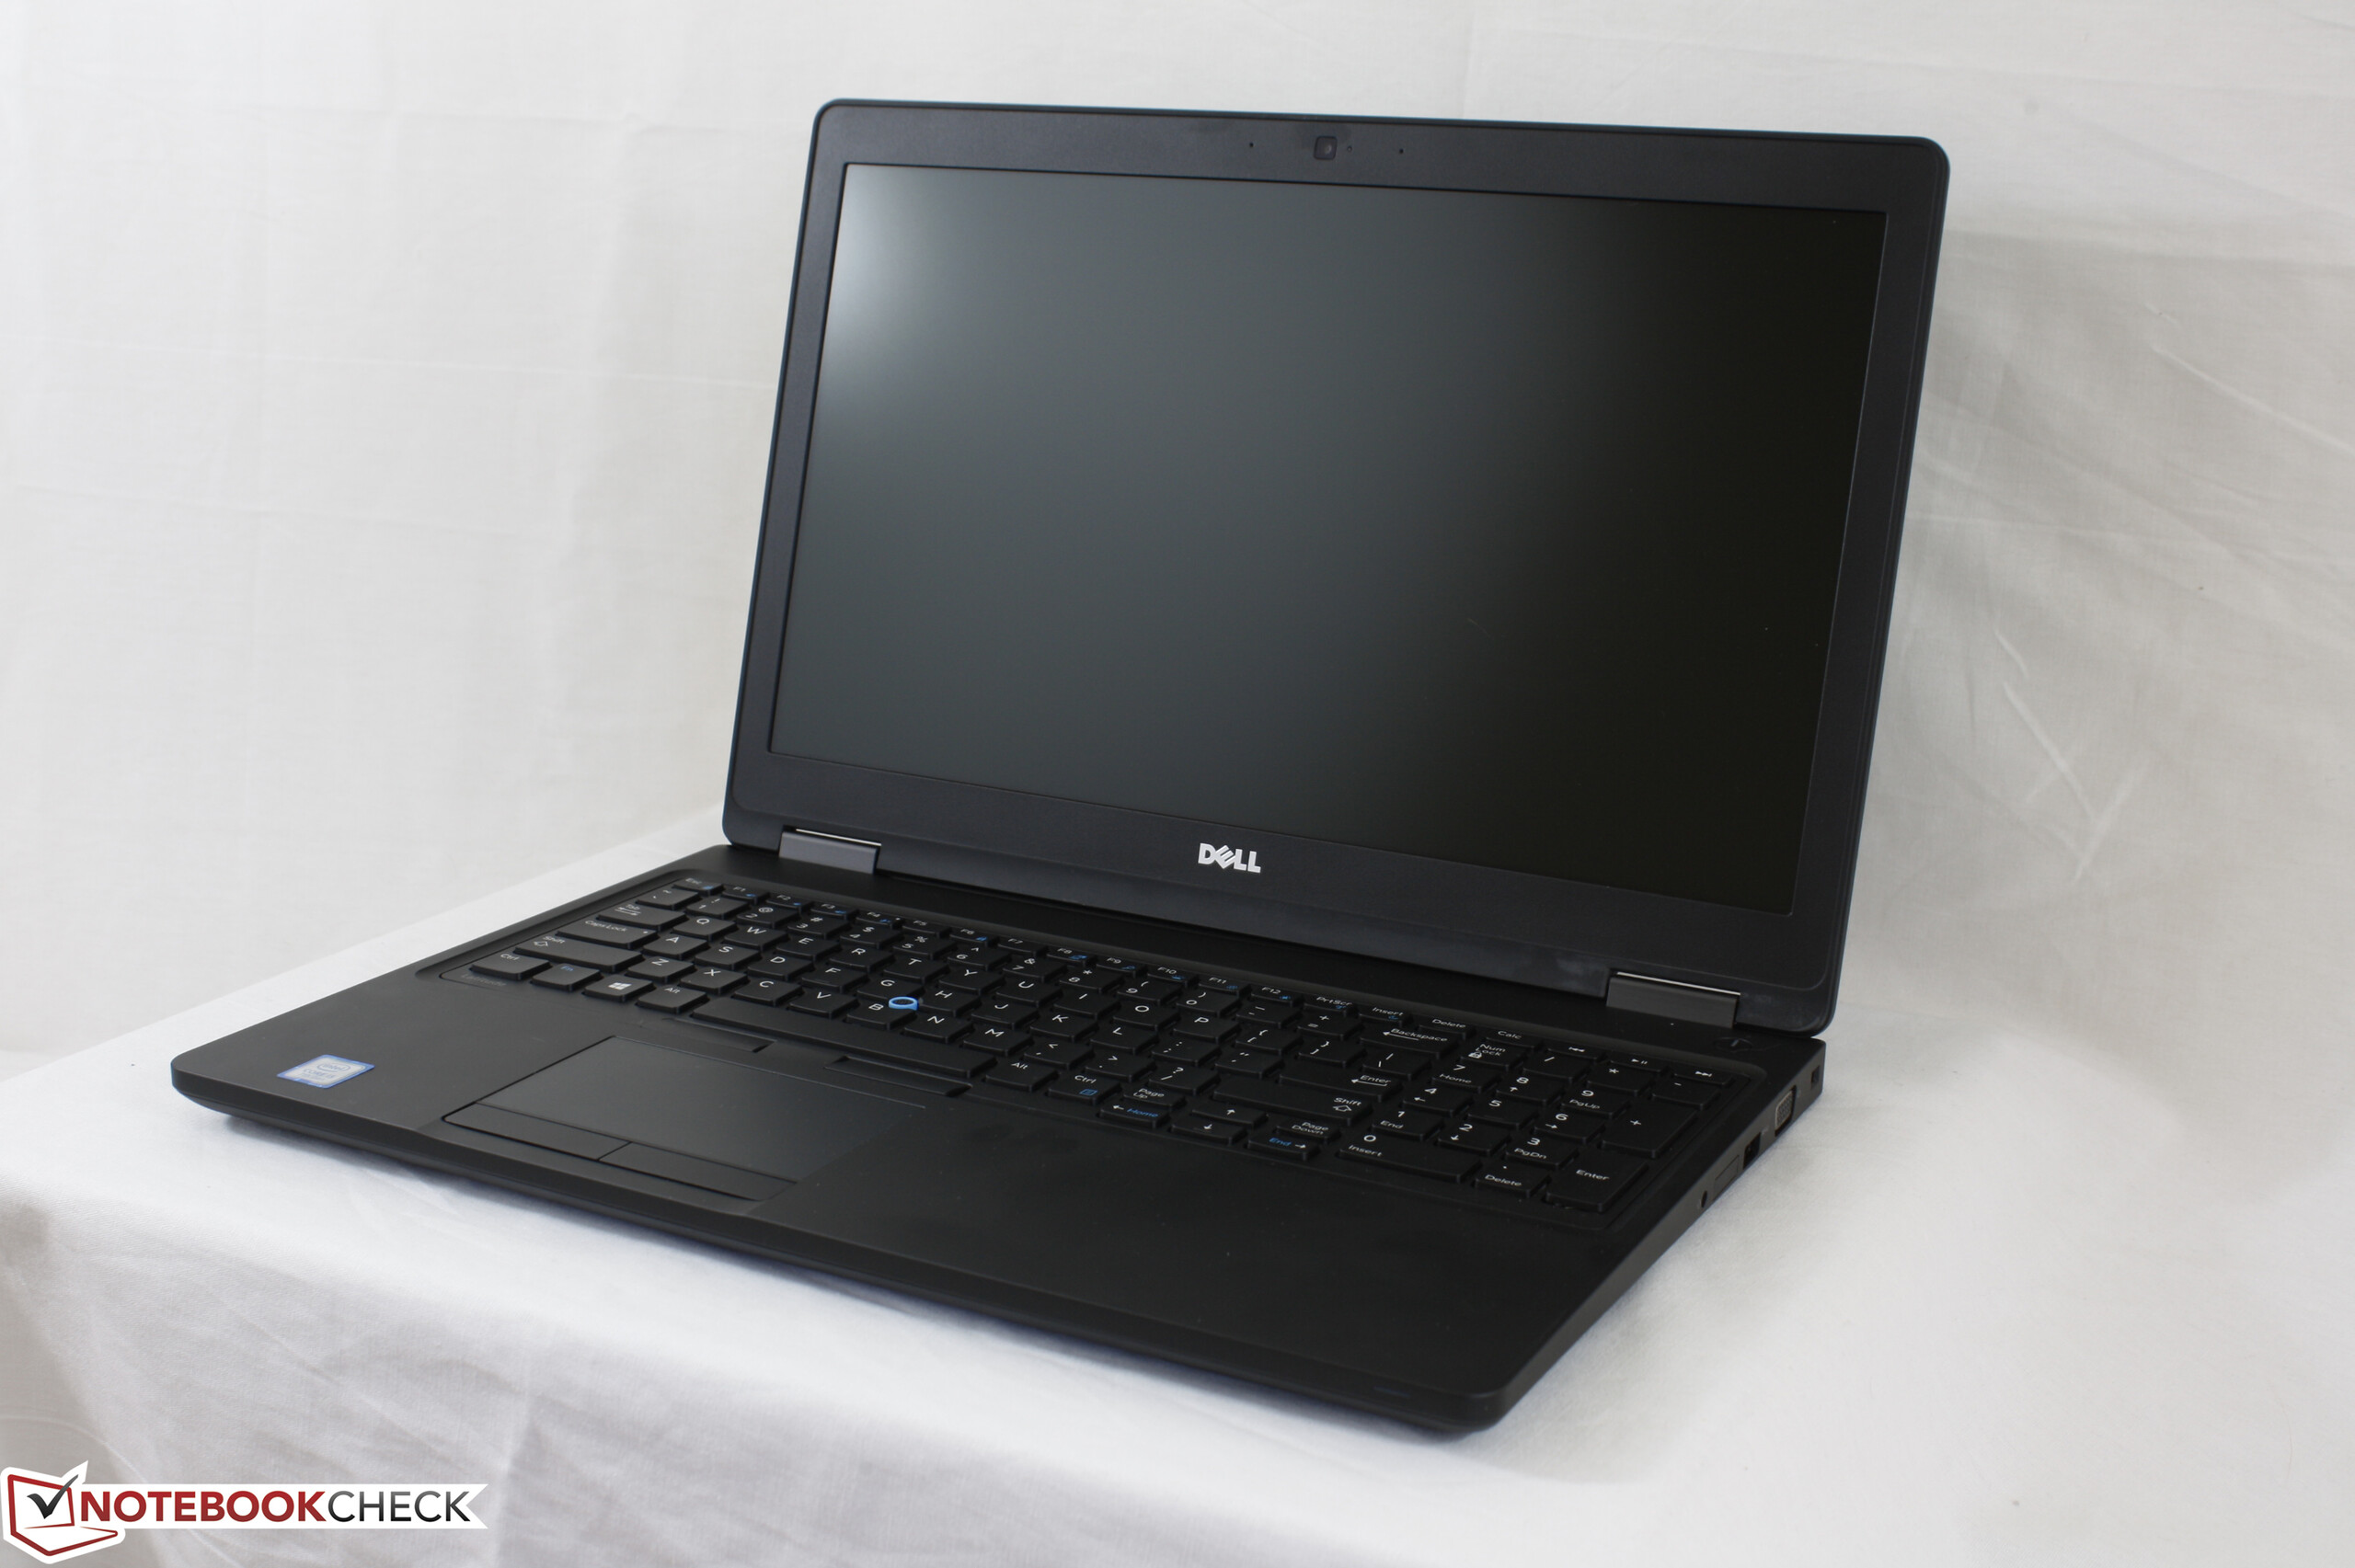
Note: the pictures in this review are from the (identically constructed) Dell Latitude 5580.
Connectivity
| SD Card Reader | |
| average JPG Copy Test (av. of 3 runs) | |
| Dell Precision 3520 | |
| Dell Precision 5520 UHD | |
| Dell Precision 3510 | |
| maximum AS SSD Seq Read Test (1GB) | |
| Dell Precision 5520 UHD | |
| Dell Precision 3510 | |
| Dell Precision 3520 | |
| Networking | |
| iperf3 transmit AX12 | |
| Dell Precision 5520 UHD | |
| Dell Precision 3520 | |
| iperf3 receive AX12 | |
| Dell Precision 3520 | |
| Dell Precision 5520 UHD | |
Display
Potential buyers can chose from three different displays. Dell offers two different resolutions - HD (1366 x 768) and Full HD (1920 x 1080) - with the latter offered in both touch as well as non-touch versions. The HD display, which the Latitude 5580 was equipped with, is based on TN technology and is - at least in our opinion - best avoided. Both versions of the Full HD display utilize IPS technology. Our review notebook is equipped with a non-touch panel from BOE. All Precision 3520 displays are matte.
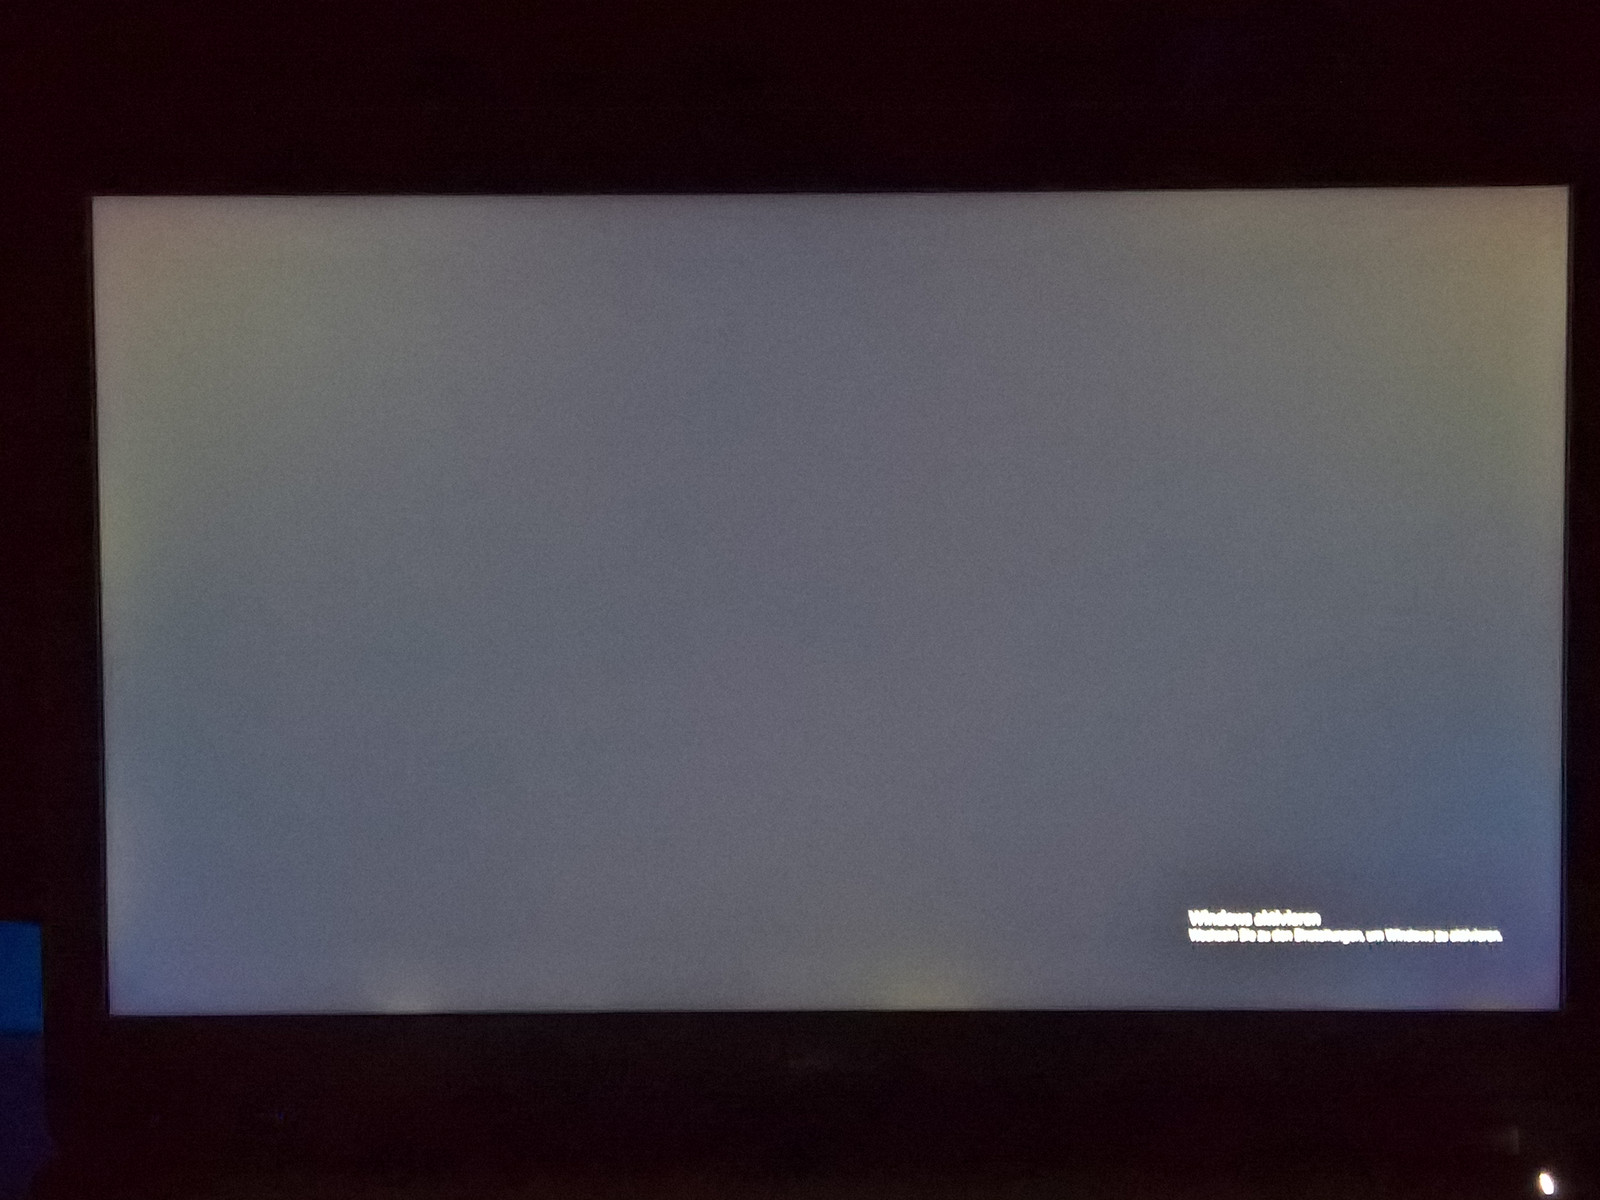
Dell promises a brightness of 300 cd/m² for the Full HD display. At 328 cd/m², the panel exceeds the promised value by a substantial margin and outperforms the Full HD IPS displays Lenovo uses for their much dimmer ThinkPads. The display of the HP ZBook 15 G3 isn't quite as bright either, although the difference isn't that great. The display of the ZBook uses PWM at a particularly low frequency to adjust the brightness. The BOE panel in the Precision 3520 utilizes PWM as well, but the frequency is much higher here at 1000 Hz and thus much less likely to pose a problem. IPS panels frequently suffer from backlight bleeding, but the Precision is hardly affected at all. Backlight bleeding is simply never that noticeable even when darker screen content is displayed.
| |||||||||||||||||||||||||
Brightness Distribution: 88 %
Center on Battery: 346 cd/m²
Contrast: 932:1 (Black: 0.37 cd/m²)
ΔE ColorChecker Calman: 5 | ∀{0.5-29.43 Ø4.71}
ΔE Greyscale Calman: 6.2 | ∀{0.09-98 Ø4.96}
94.7% sRGB (Argyll 1.6.3 3D)
61.8% AdobeRGB 1998 (Argyll 1.6.3 3D)
69.3% AdobeRGB 1998 (Argyll 3D)
94.8% sRGB (Argyll 3D)
72.7% Display P3 (Argyll 3D)
Gamma: 2.35
CCT: 6702 K
| Dell Precision 3520 1920x1080, 15.6" | Dell Precision 3510 LGD04AF, K96D2_156WHU, , 1366x768, 15.6" | Dell Precision 5520 UHD SHP1476, , 3840x2160, 15.6" | Lenovo ThinkPad P50 LP156WF6-SPK1, , 1920x1080, 15.6" | HP ZBook 15 G3 Samsung SDC5344, , 1920x1080, 15.6" | Lenovo ThinkPad T570-20HAS01E00 BOE NV156QUM-N44, , 3840x2160, 15.6" | |
|---|---|---|---|---|---|---|
| Display | -38% | -1% | -42% | -2% | -4% | |
| Display P3 Coverage (%) | 72.7 | 41.48 -43% | 67.4 -7% | 39.13 -46% | 66.8 -8% | 70 -4% |
| sRGB Coverage (%) | 94.8 | 62.4 -34% | 98.5 4% | 58.5 -38% | 95.5 1% | 91.1 -4% |
| AdobeRGB 1998 Coverage (%) | 69.3 | 42.86 -38% | 68.9 -1% | 40.45 -42% | 69 0% | 66.7 -4% |
| Response Times | 1% | -22% | 14% | -8% | 35% | |
| Response Time Grey 50% / Grey 80% * (ms) | 48 ? | 56 ? -17% | 59.2 ? -23% | 46 ? 4% | 54 ? -13% | 41.6 ? 13% |
| Response Time Black / White * (ms) | 34.4 ? | 28 ? 19% | 41.6 ? -21% | 26 ? 24% | 35.6 ? -3% | 15.2 ? 56% |
| PWM Frequency (Hz) | 1064 ? | 198 ? | 926 ? | |||
| Screen | -41% | 10% | -6% | -6% | 3% | |
| Brightness middle (cd/m²) | 345 | 199 -42% | 372.4 8% | 263 -24% | 306 -11% | 339 -2% |
| Brightness (cd/m²) | 329 | 201 -39% | 368 12% | 236 -28% | 289 -12% | 314 -5% |
| Brightness Distribution (%) | 88 | 83 -6% | 90 2% | 78 -11% | 85 -3% | 89 1% |
| Black Level * (cd/m²) | 0.37 | 0.4 -8% | 0.48 -30% | 0.34 8% | 0.34 8% | 0.36 3% |
| Contrast (:1) | 932 | 498 -47% | 776 -17% | 774 -17% | 900 -3% | 942 1% |
| Colorchecker dE 2000 * | 5 | 9 -80% | 2.6 48% | 2.35 53% | 5.1 -2% | 4.2 16% |
| Colorchecker dE 2000 max. * | 8 | 13.3 -66% | 5.6 30% | 9.9 -24% | 7.8 2% | |
| Greyscale dE 2000 * | 6.2 | 9.6 -55% | 3.7 40% | 3.33 46% | 7.4 -19% | 5.1 18% |
| Gamma | 2.35 94% | 2.41 91% | 2.14 103% | 2.38 92% | 2.37 93% | 2.16 102% |
| CCT | 6702 97% | 10695 61% | 7096 92% | 6917 94% | 7263 89% | 6569 99% |
| Color Space (Percent of AdobeRGB 1998) (%) | 61.8 | 39.6 -36% | 63 2% | 37 -40% | 63 2% | 59.4 -4% |
| Color Space (Percent of sRGB) (%) | 94.7 | 62.4 -34% | 99 5% | 58 -39% | 95 0% | 91 -4% |
| Total Average (Program / Settings) | -26% /
-35% | -4% /
3% | -11% /
-11% | -5% /
-6% | 11% /
6% |
* ... smaller is better
Screen Flickering / PWM (Pulse-Width Modulation)
| Screen flickering / PWM detected | 1064 Hz | ≤ 90 % brightness setting | 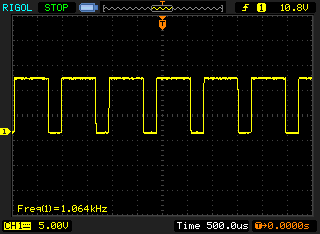 |
The display backlight flickers at 1064 Hz (worst case, e.g., utilizing PWM) Flickering detected at a brightness setting of 90 % and below. There should be no flickering or PWM above this brightness setting. The frequency of 1064 Hz is quite high, so most users sensitive to PWM should not notice any flickering. In comparison: 52 % of all tested devices do not use PWM to dim the display. If PWM was detected, an average of 7757 (minimum: 5 - maximum: 343500) Hz was measured. | |||
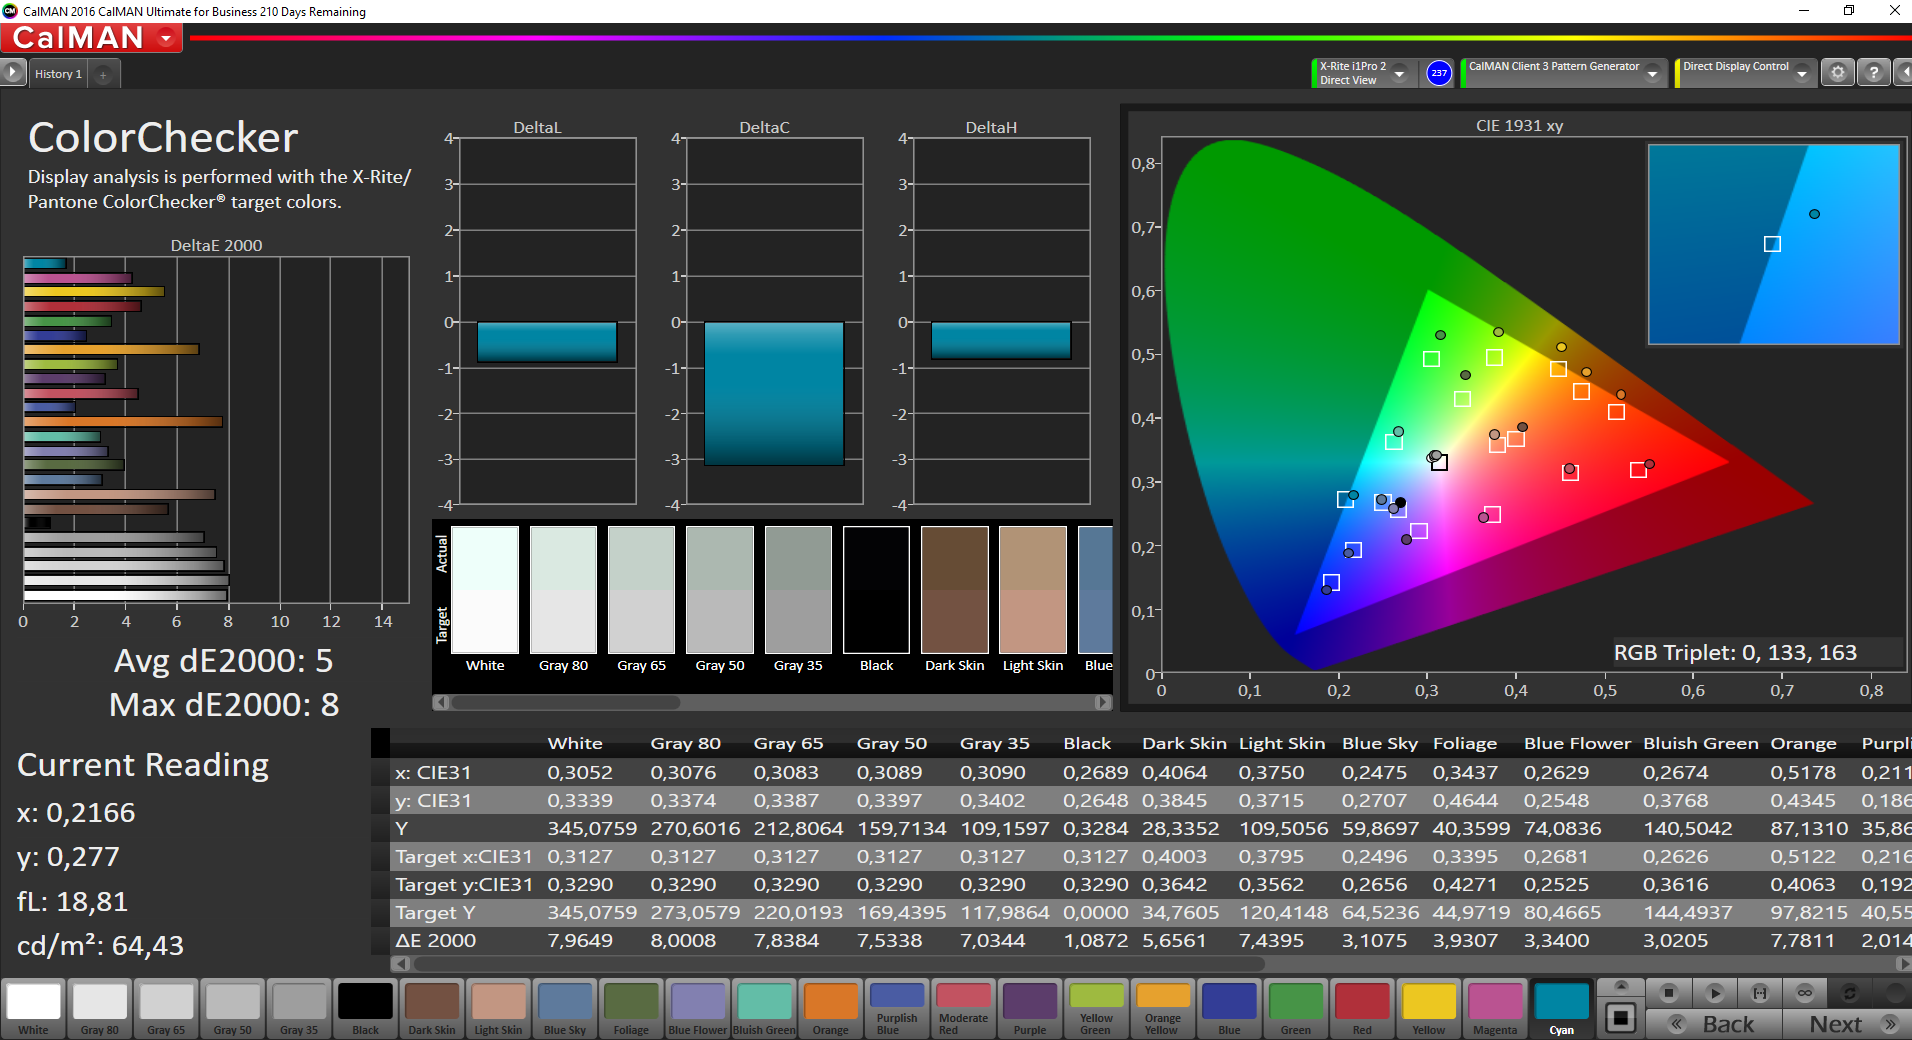

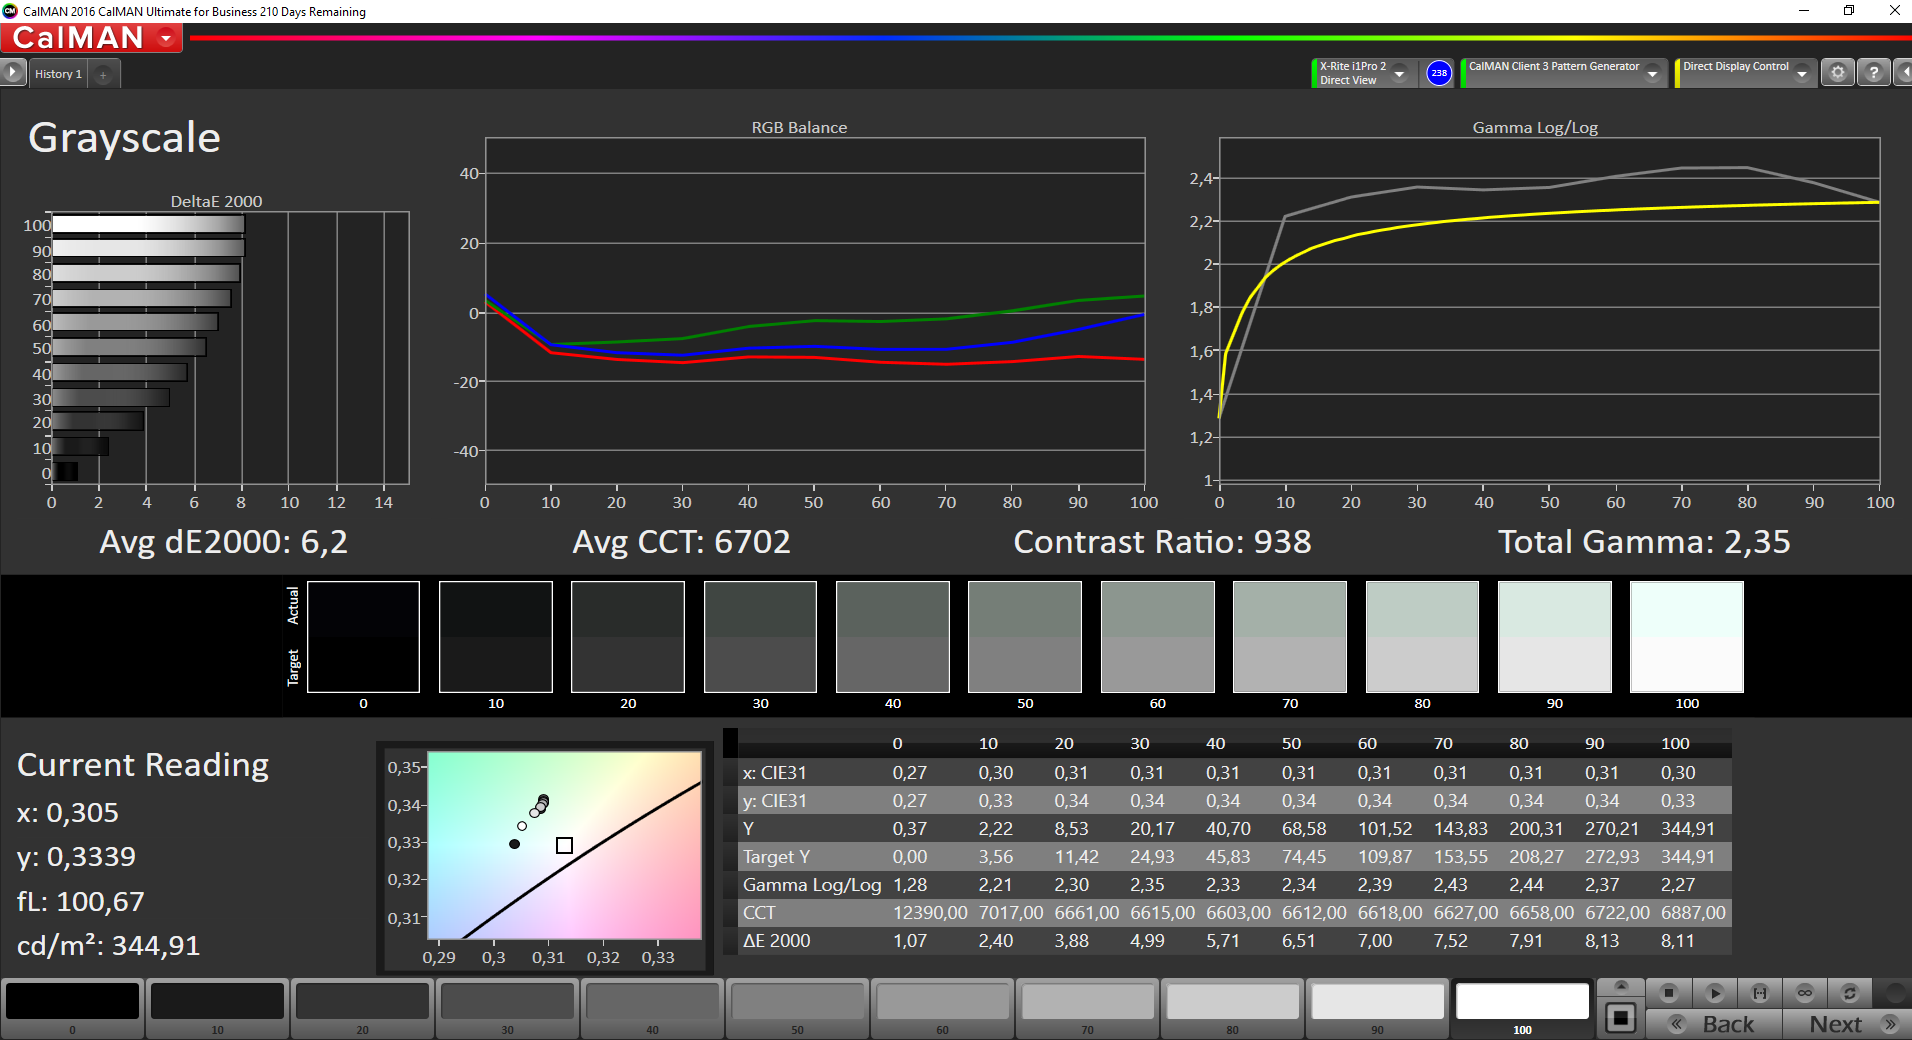

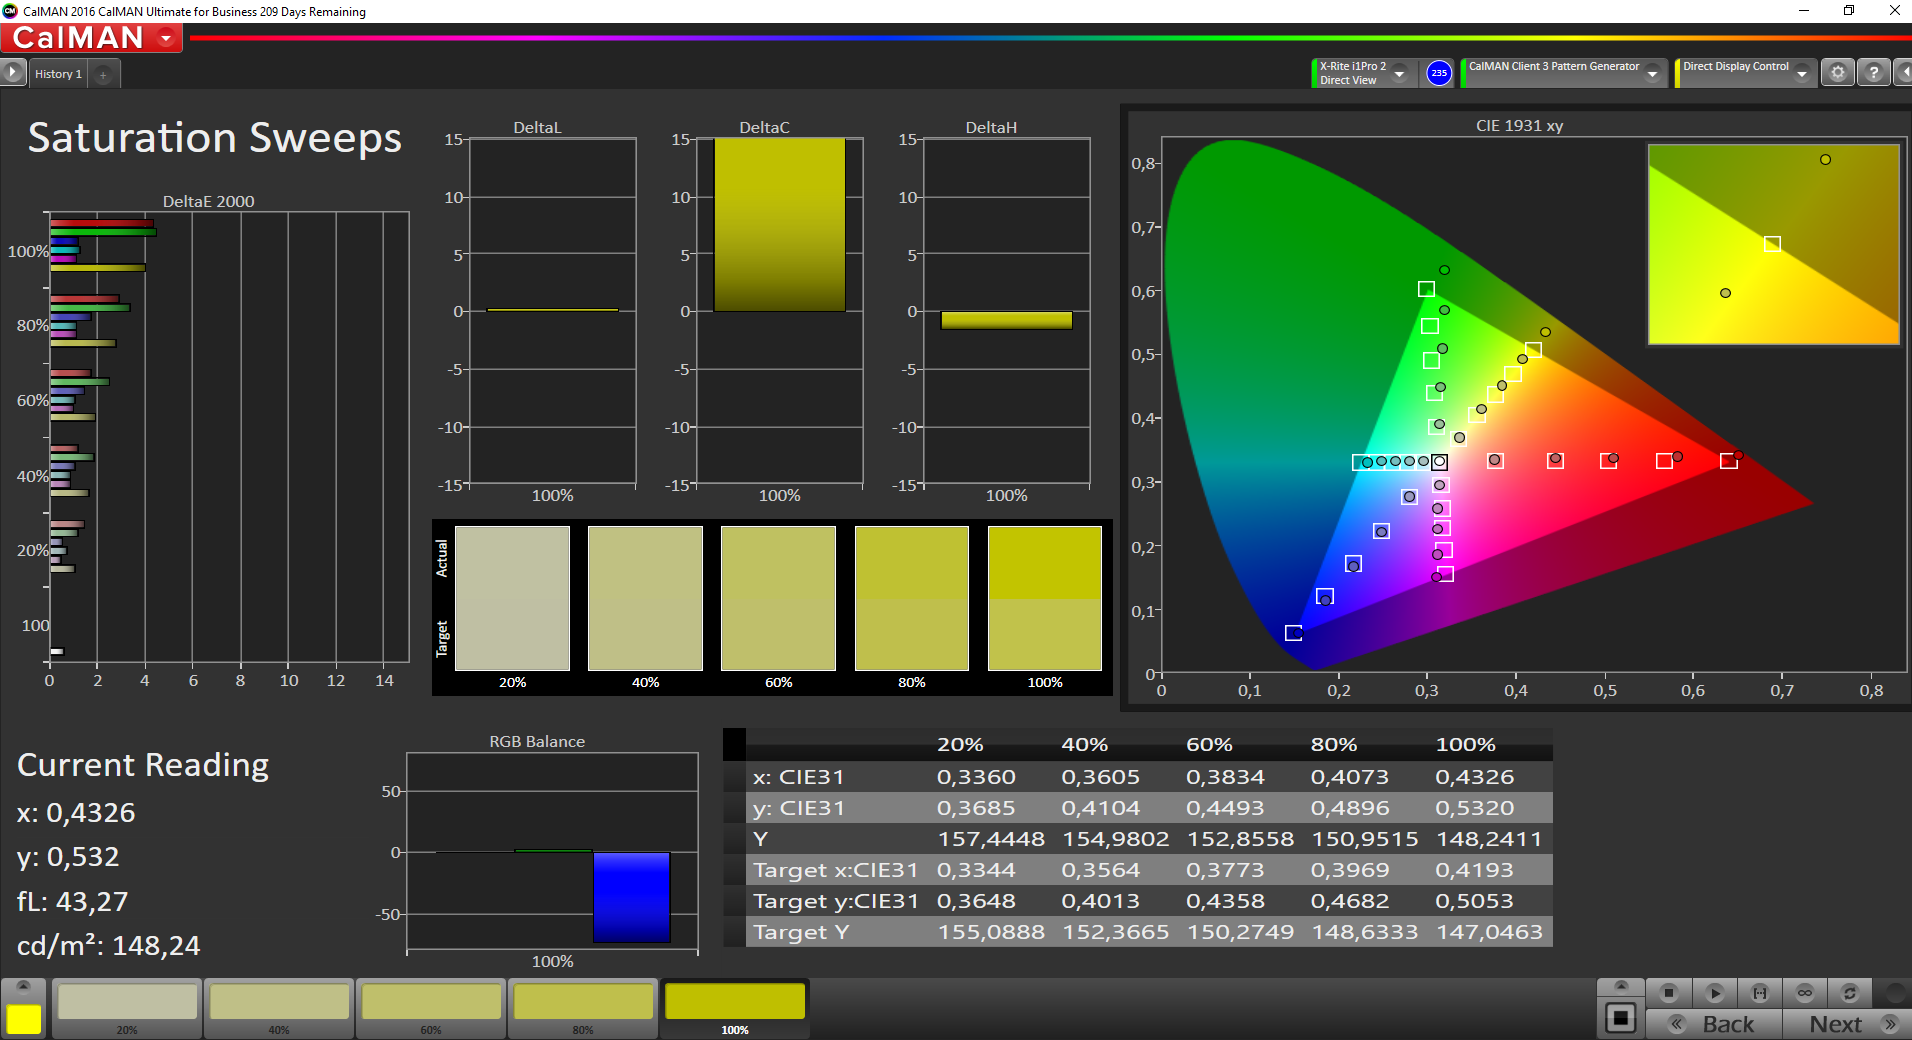
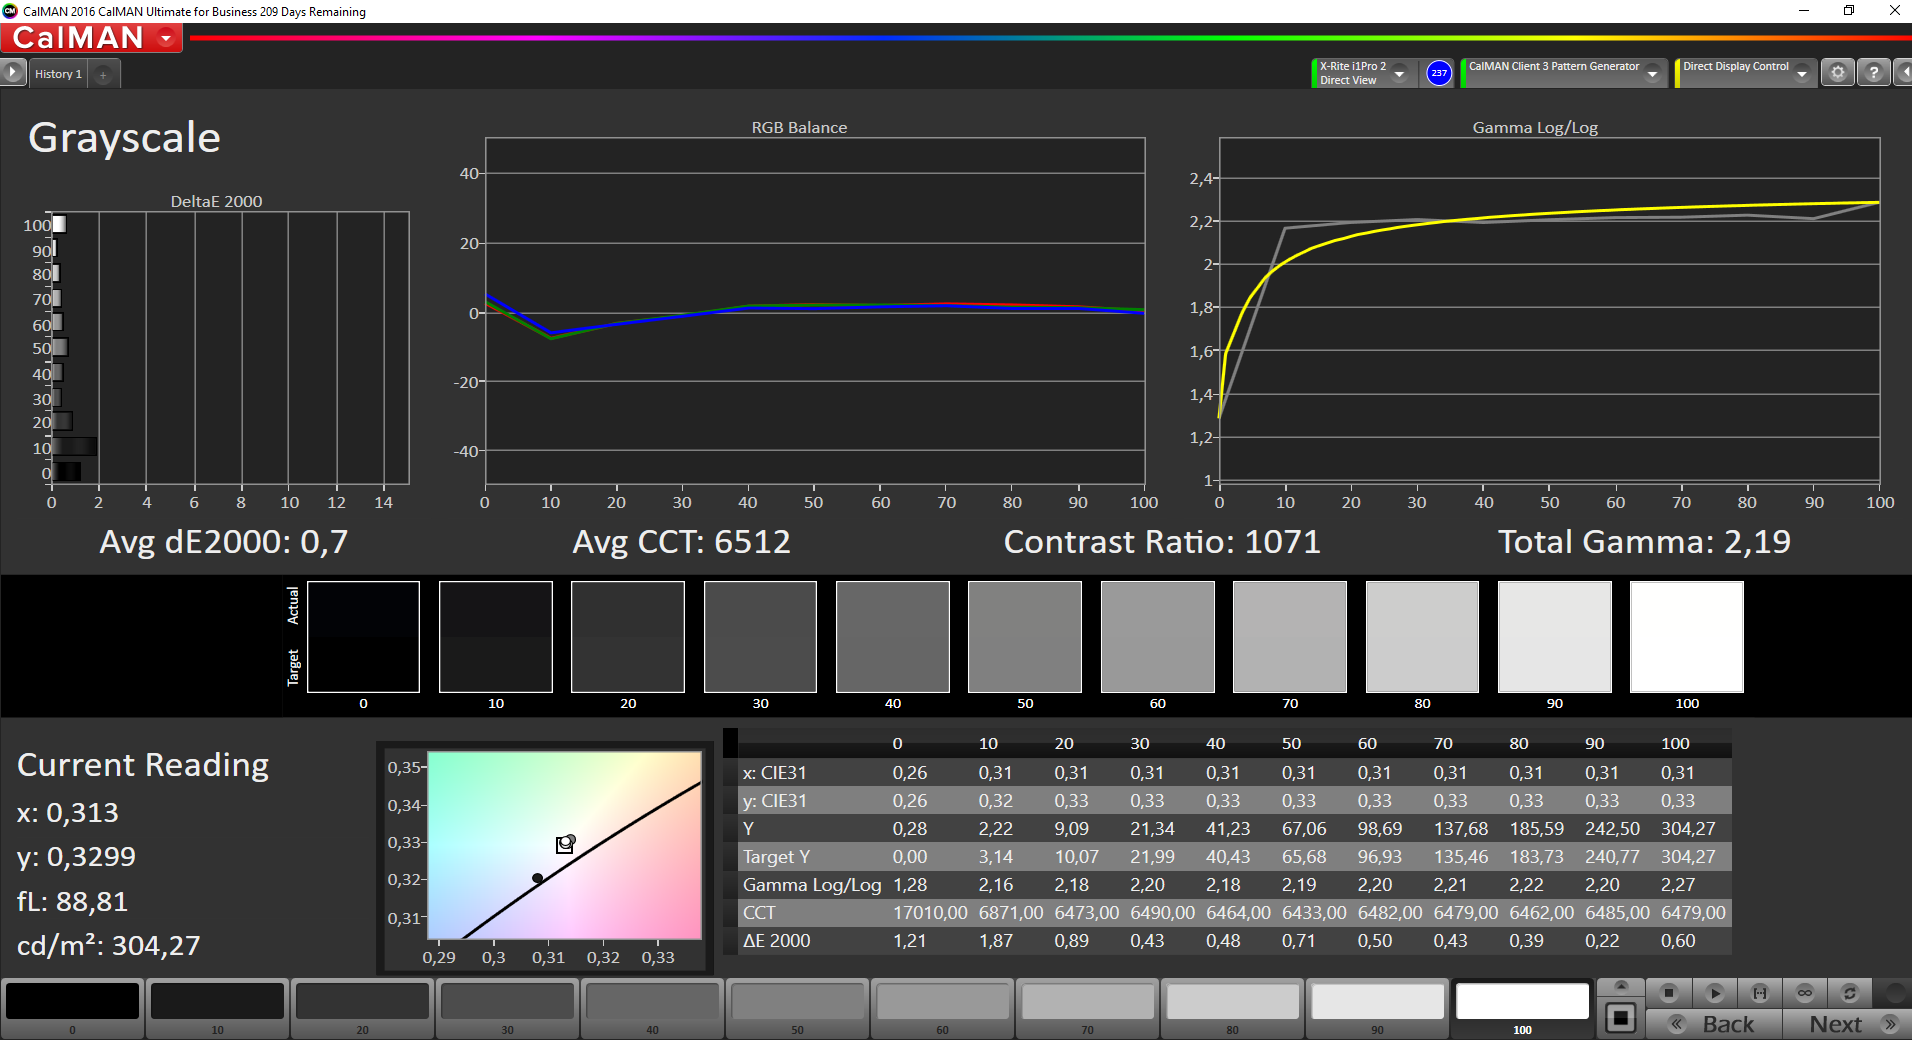
With a black value of 0.37 cd/m², blacks aren't truly black, but still reasonably dark. The contrast ratio of 932:1 isn't quite up to the standard set by the best IPS displays - but we are being nitpicky here. The sharpness is also more than adequate. As shipped, the display features a greenish hue, which is a peculiarity IPS displays frequently exhibit. A quick calibration eliminates the tint. Users without a calibration device can use the embedded color profile, which we always include in our reviews free of charge.
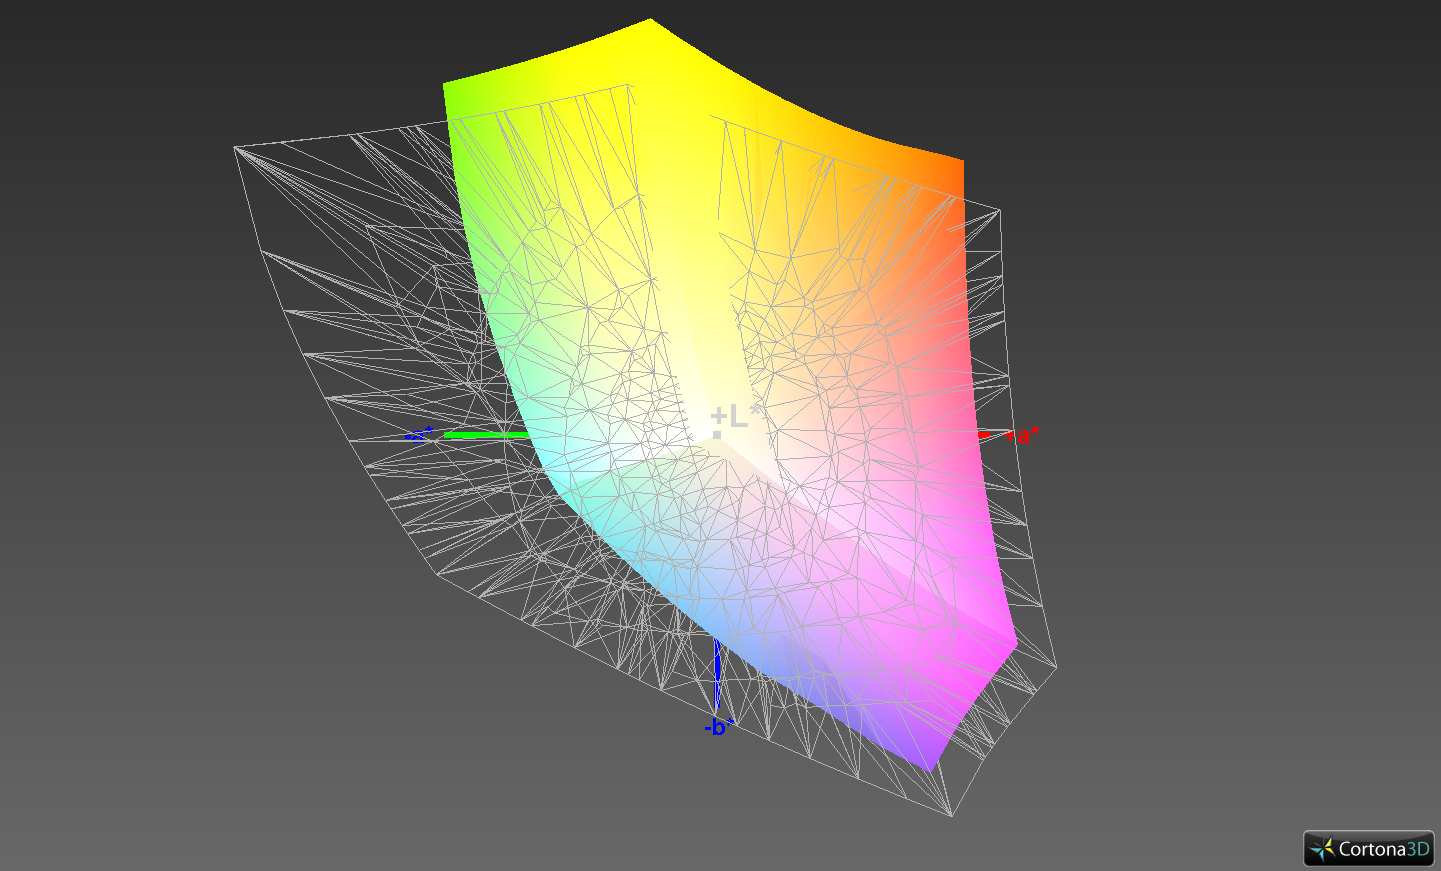
High-end IPS display usually offer near-complete coverage of the professional colors spaces - and the display of the Precision 3520 falls into this category. With 95 % of sRGB covered, even semi-professional photo editing isn't out of the question.

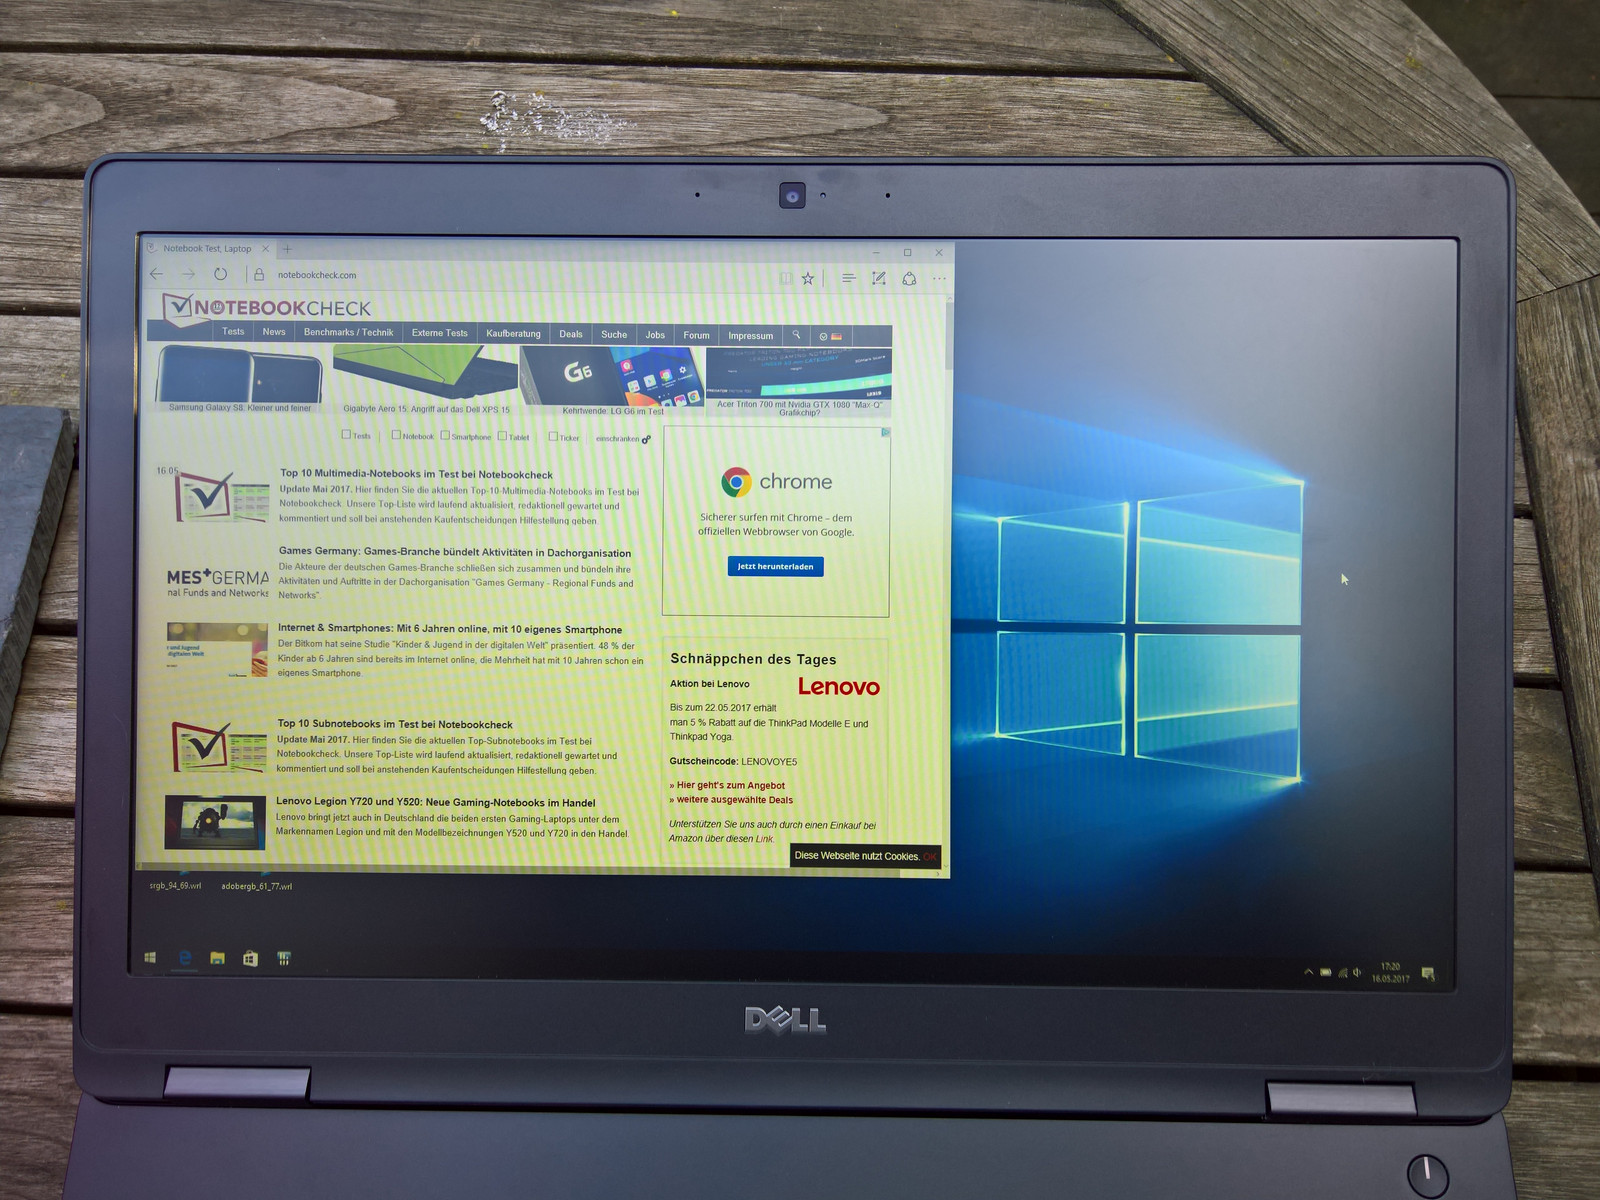
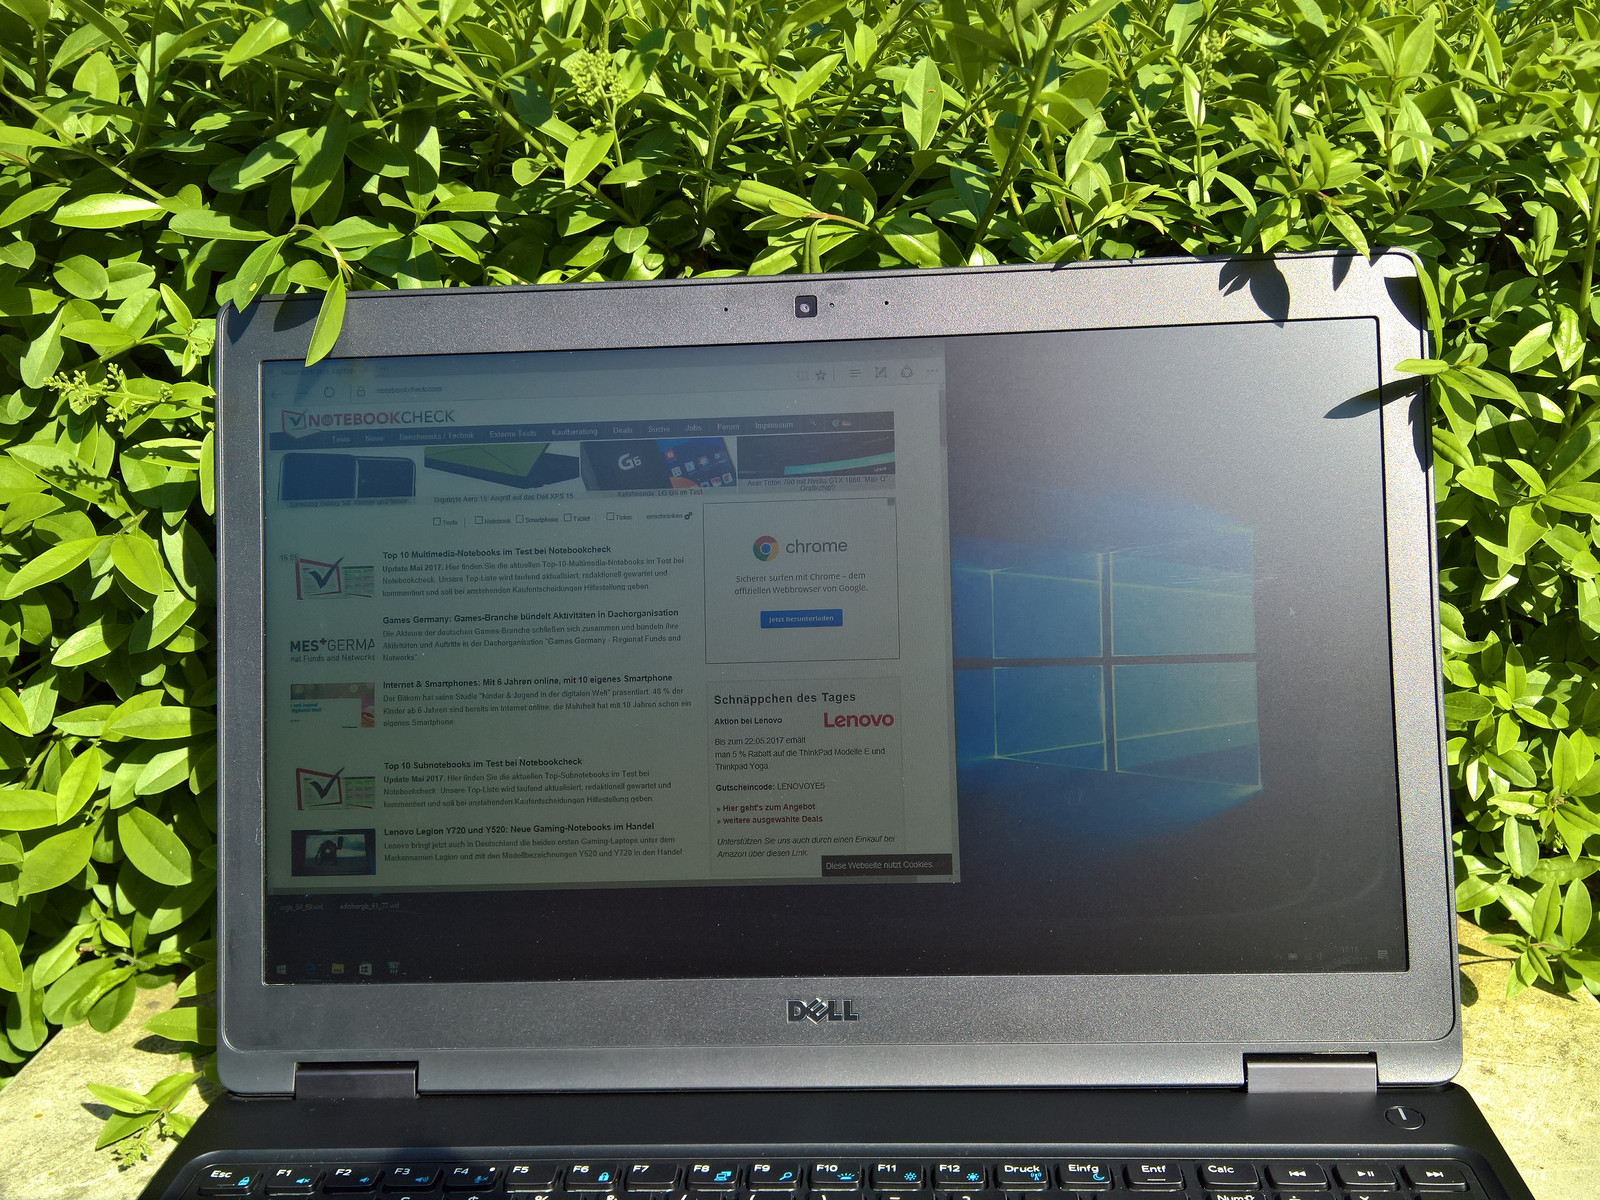
The combination of a matte display surface with high brightness does wonders for the outdoor usability. Even in the sun, the display content remains visible, although working in the shade is a lot easier on the eyes.
Display Response Times
| ↔ Response Time Black to White | ||
|---|---|---|
| 34.4 ms ... rise ↗ and fall ↘ combined | ↗ 17.2 ms rise | 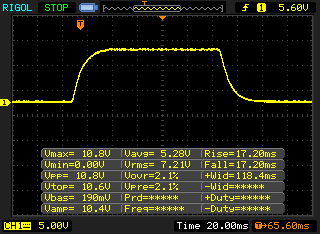 |
| ↘ 17.2 ms fall | ||
| The screen shows slow response rates in our tests and will be unsatisfactory for gamers. In comparison, all tested devices range from 0.1 (minimum) to 240 (maximum) ms. » 92 % of all devices are better. This means that the measured response time is worse than the average of all tested devices (19.8 ms). | ||
| ↔ Response Time 50% Grey to 80% Grey | ||
| 48 ms ... rise ↗ and fall ↘ combined | ↗ 24.4 ms rise | 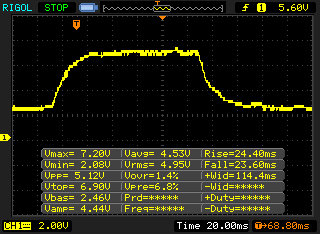 |
| ↘ 23.6 ms fall | ||
| The screen shows slow response rates in our tests and will be unsatisfactory for gamers. In comparison, all tested devices range from 0.165 (minimum) to 636 (maximum) ms. » 82 % of all devices are better. This means that the measured response time is worse than the average of all tested devices (31 ms). | ||
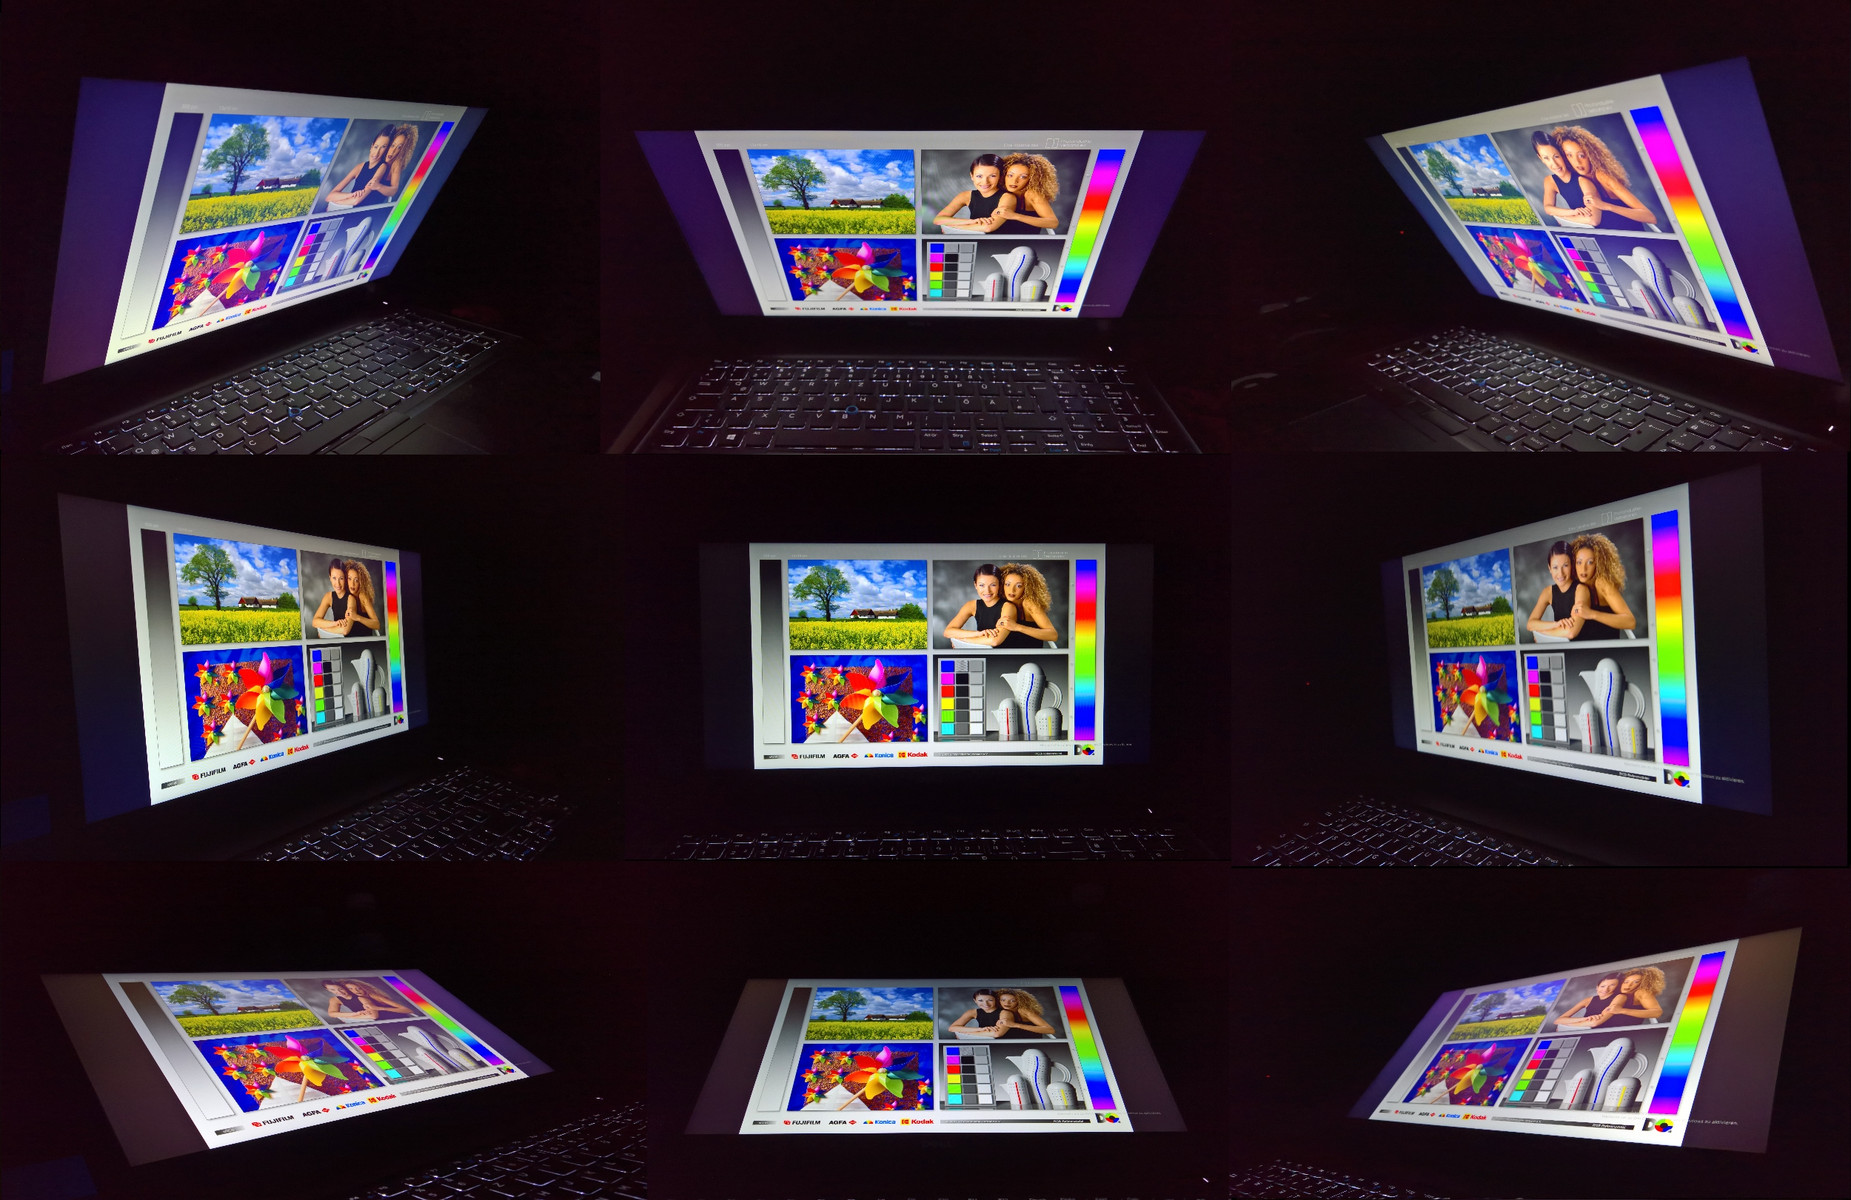
IPS displays are generally characterized by a superior viewing angle stability - and the Precision 3520 is no different. The brightness remains nearly constant as well. Less expensive IPS displays frequently suffer from a more noticeable decrease at shallow angles.
It didn't matter to which of the three video outs (Thunderbolt 3, HDMI, VGA) we connected a display to: the resulting picture was always clear and sharp.
Performance
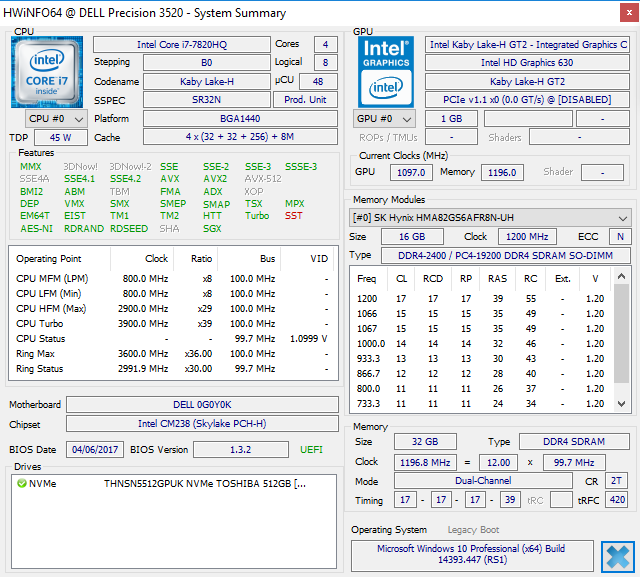
Dell prefers to sell their notebooks direct instead of using retail channels, even though our particular review notebook was sourced from a retailer. Dell's online shop allows the user to configure the Precision 3520 to their heart's content. The user can pick from different quad-core processors ranging from the Intel Core i5-7300HQ to the Core i7-7820HQ - our review notebook is equipped with the latter - to the very expensive Xeon E3-1505M v6. Skylake CPUs are available as well - at least as long as Windows 7 is the OS of choice. The GPU isn't configurable though and all versions of the Precision 3520 feature the Quadro M620 GPU as the only choice.
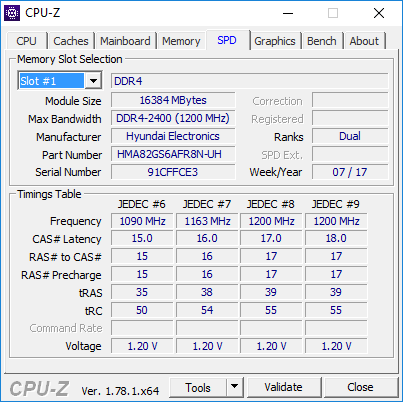
There are many RAM and hard drive options as well. The base version comes with only 4 GB DDR4 2400 RAM and a 500 GB, 7200 RPM HDD. The top-of-the-line configuration includes 32 GB of RAM (both slots occupied) and a 1 TB PCIe SSD.

Processor
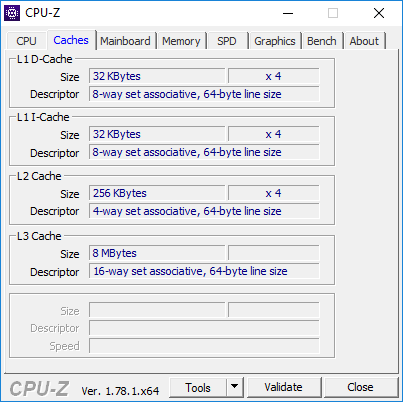
The Core i7-7820HQ is the second-fastest Core-i7 CPU in the Kaby Lake lineup - only the (relatively rare) Core i7-7920HQ is faster. The quad-core i7 CPU has four cores and can address eight threads thanks to Hyper-Threading. The four cores run at a maximum of 3.9 GHz; the base frequency is 2.9 GHz. We should mention here that these values - in particular the Turbo frequency - are only valid for the Intel-designed TDP maximum of 45 W.
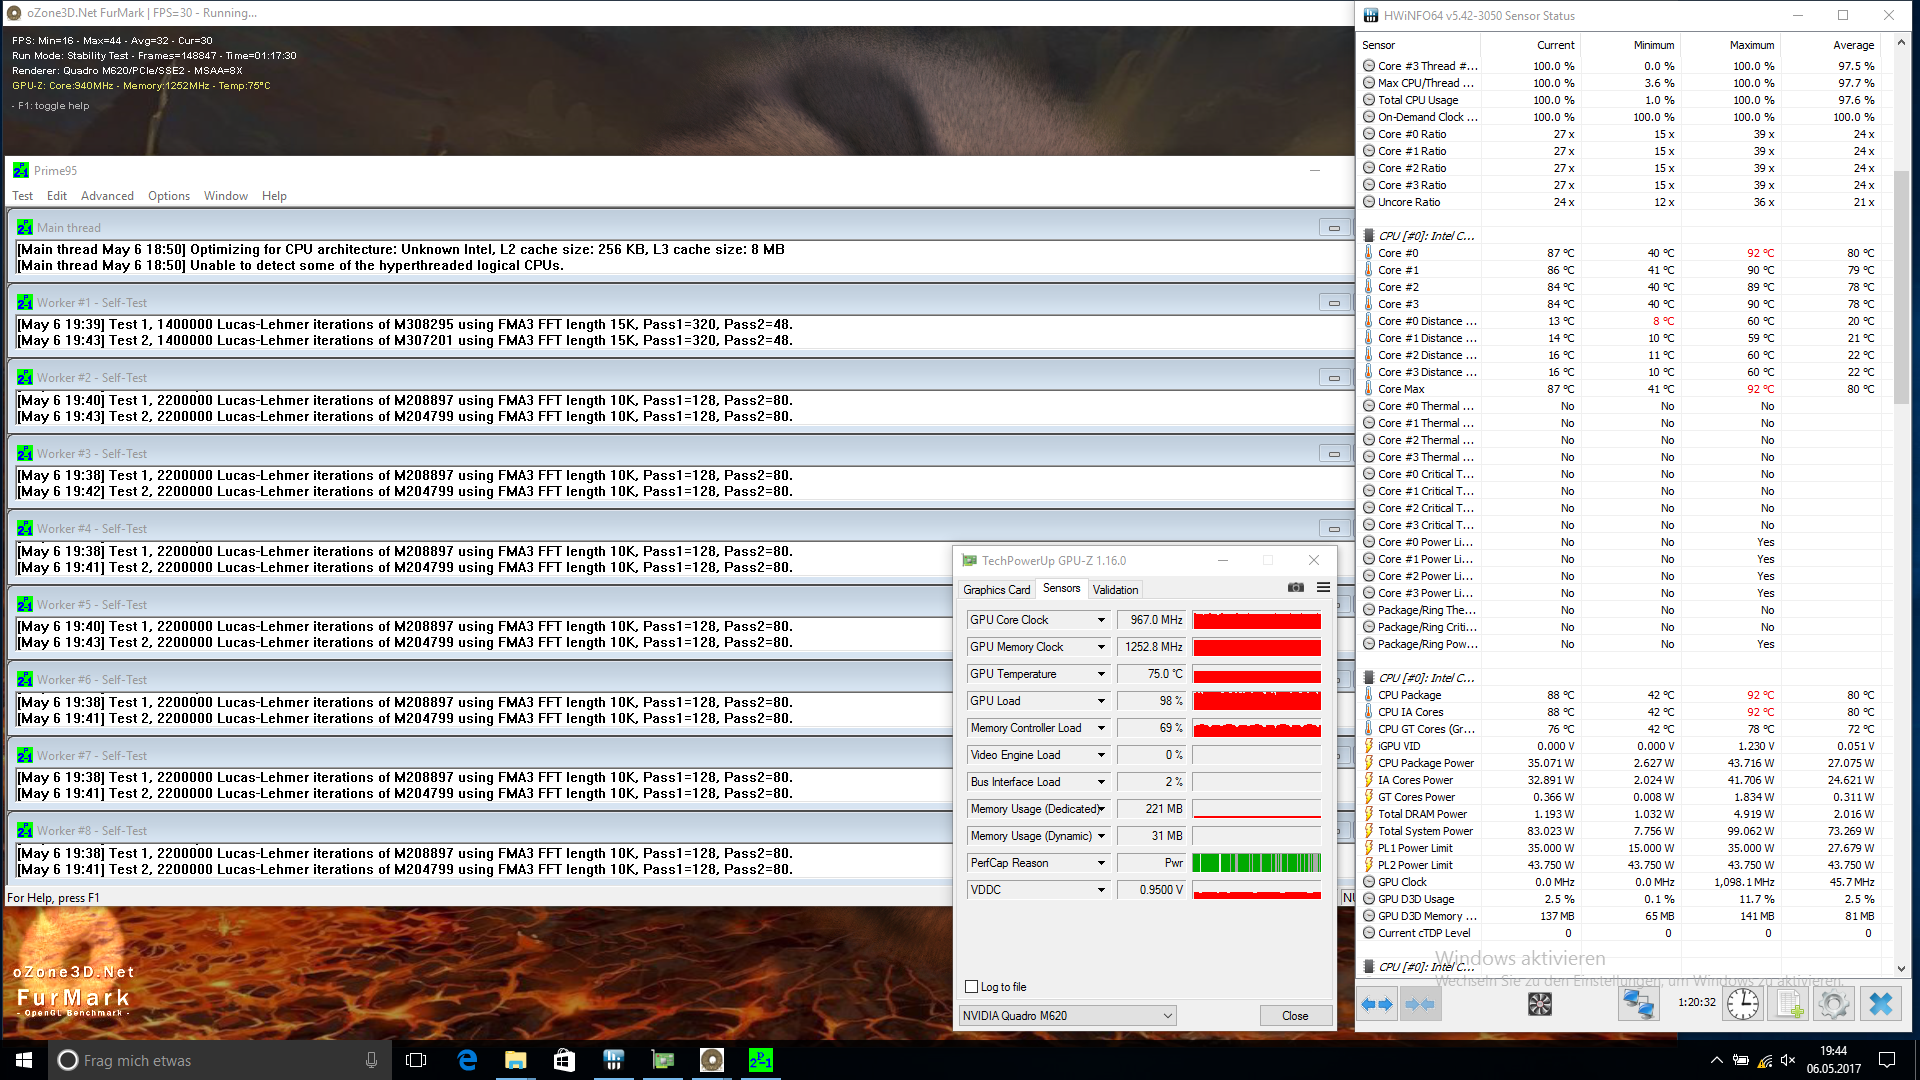
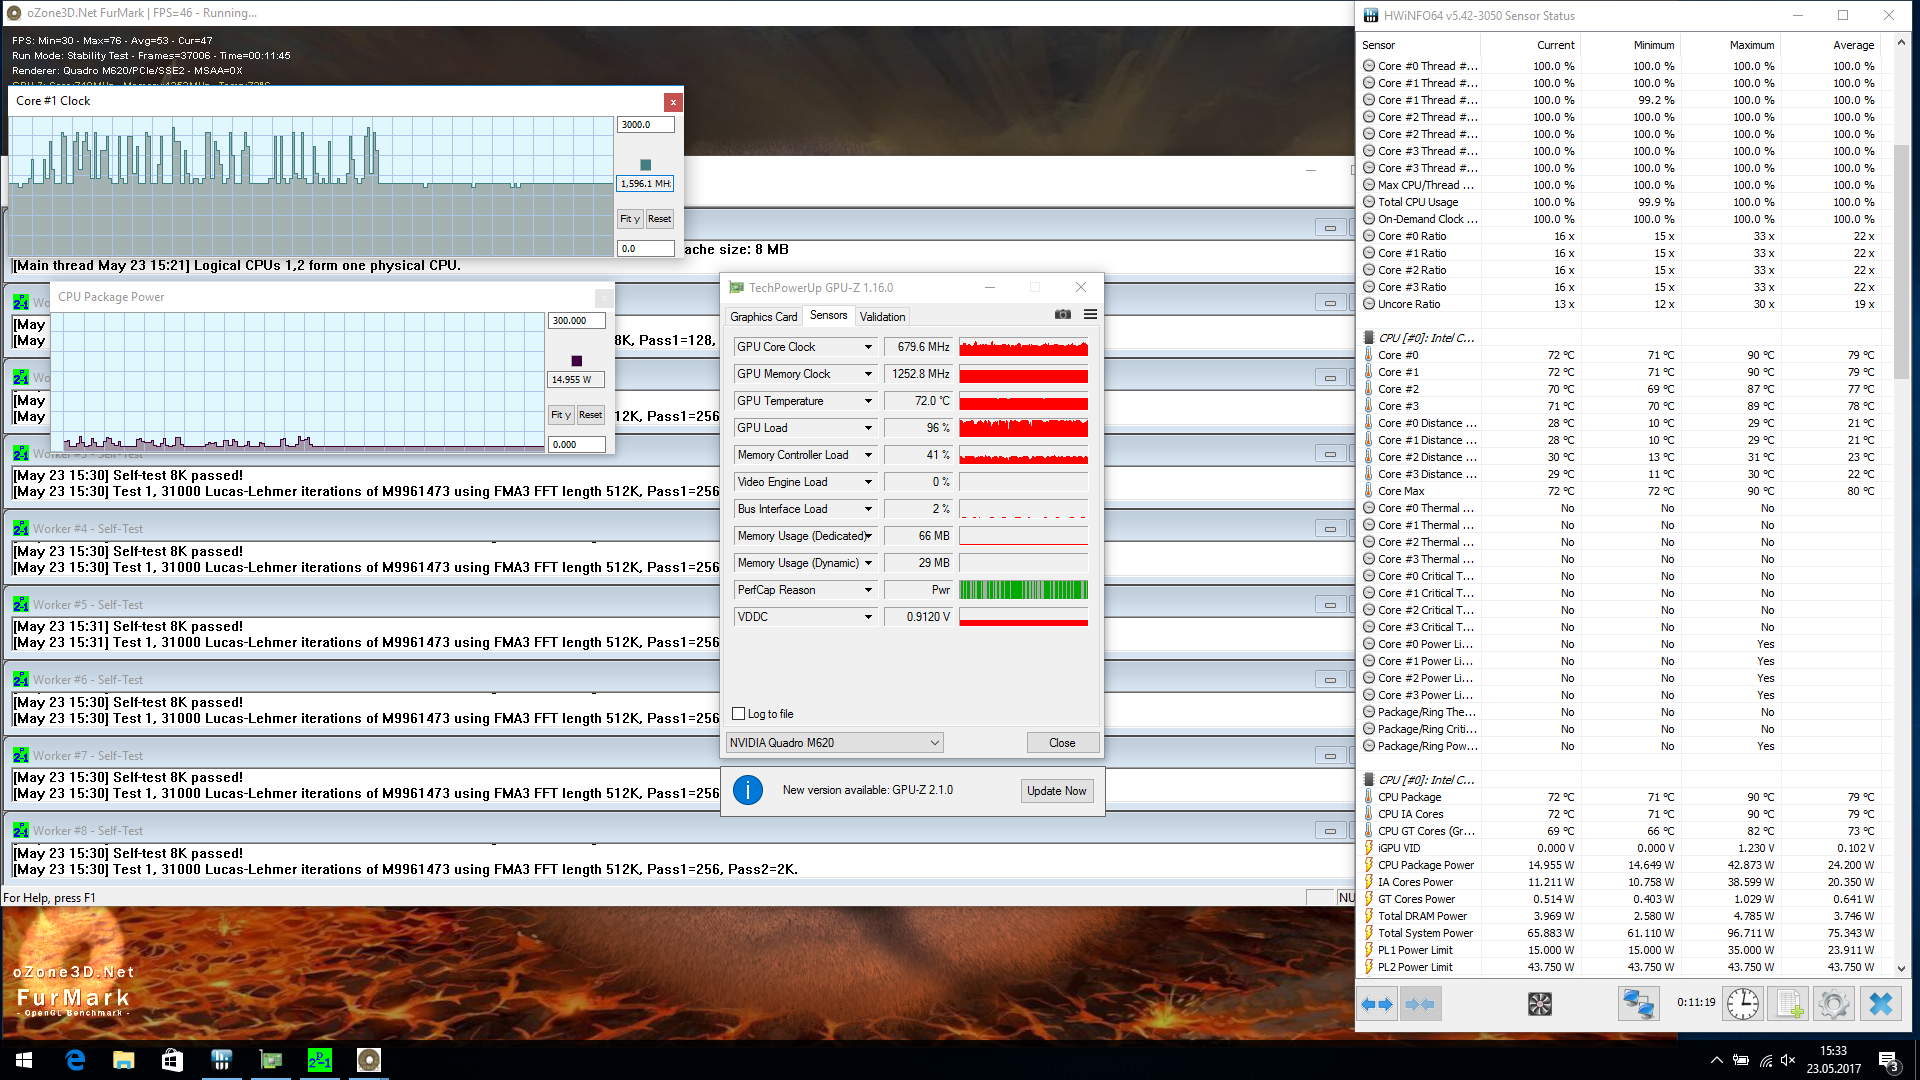
The reason why the above is important: for their Precision 3520, Dell uses cTDP down and specifies a maximum TDP of 35 W - likely to not overtax the cooling system. For that reason, the CPU can't reach its maximum potential during the Cinebench multicore test. For just 30 seconds, the CPU can draw more than 35 W - 42 W in this particular case - and runs at 3.5 GHz, which isn't the Turbo maximum. After half a minute, the TDP threshold of 35 W becomes effective and the CPU cores drop to 3 GHz. For this very reason, the performance of the Precision workstation drops off after only the first iteration of the Cinebench Multicore loop test, which runs for a total of 30 minutes.
Because of the TDP limit, the i7-7820HQ doesn't quite deliver the performance of its Xeon counterpart E3-1505M v6, which we took a look at when we reviewed the ThinkPad P51Test Lenovo ThinkPad P51 (Xeon, 4K) Workstation. At least on paper, the Xeon CPU should only be a smidgen faster than the i7-7820HQ. Compared to the i7-6700HQ in the predecessor Precision 3510, the new CPU is faster though even when running the multicore-portion of the benchmark test. Although maximum performance is only available for a short time because of the TDP limit, the Precision 3520 is noticeably faster than the Precision 3510. For additional benchmark results, please take a look at our CPU comparison.
The notebook performs the same no matter if it is plugged in or running on battery.
System Performance
As one would expect from a notebook equipped with such powerful components, the Precision is quite quick during normal operation and delays or lags are never an issue. Its scores place the system right in the middle of the field of its competitors.
| PCMark 8 | |
| Home Score Accelerated v2 | |
| Dell Precision 3510 | |
| Lenovo ThinkPad P50 | |
| Dell Precision 3520 | |
| HP ZBook 15 G3 | |
| Dell Precision 5520 UHD | |
| Work Score Accelerated v2 | |
| Dell Precision 3510 | |
| HP ZBook 15 G3 | |
| Dell Precision 3520 | |
| Lenovo ThinkPad P50 | |
| Dell Precision 5520 UHD | |
| PCMark 8 Home Score Accelerated v2 | 4183 points | |
| PCMark 8 Work Score Accelerated v2 | 5194 points | |
Help | ||
Mass Storage
Dell doesn't hold back when it comes to mass storage and incorporates a generously-sized 512 GB Toshiba XG4 NVMe PCIe SSD. Our benchmark table clearly shows that there are much faster drives out there - particularly the PM961 and PM951 SSDs from Samsung used by the competitors. During daily use, the difference is not going to be noticeable at all - unless the user should decide to copy large amounts of data.
Our SSD/HDD benchmark tool makes it possible to compare the XG4 to other Solid State Drives.
| Dell Precision 3520 Toshiba XG4 NVMe (THNSN5512GPUK) | Dell Precision 5520 UHD Samsung SM961 MZVKW512HMJP m.2 PCI-e | HP ZBook 15 G3 Samsung SM951 MZVPV512HDGL m.2 PCI-e | Lenovo ThinkPad T570-20HAS01E00 Samsung PM961 NVMe MZVLW512HMJP | Lenovo ThinkPad P51 20HH0016GE Samsung PM961 NVMe MZVLW512HMJP | |
|---|---|---|---|---|---|
| CrystalDiskMark 3.0 | 87% | 86% | 43% | 79% | |
| Read Seq (MB/s) | 1096 | 2253 106% | 1502 37% | 1210 10% | 1705 56% |
| Write Seq (MB/s) | 476.3 | 1662 249% | 1538 223% | 1134 138% | 1541 224% |
| Read 512 (MB/s) | 829 | 459.1 -45% | 1164 40% | 789 -5% | 1038 25% |
| Write 512 (MB/s) | 456.1 | 1611 253% | 1432 214% | 903 98% | 1157 154% |
| Read 4k (MB/s) | 35.2 | 56.1 59% | 59.1 68% | 58.4 66% | 61.3 74% |
| Write 4k (MB/s) | 128 | 169.4 32% | 207.3 62% | 144.1 13% | 176 38% |
| Read 4k QD32 (MB/s) | 552 | 633 15% | 798 45% | 559 1% | 664 20% |
| Write 4k QD32 (MB/s) | 396.1 | 506 28% | 393.8 -1% | 474.4 20% | 560 41% |

GPU Performance
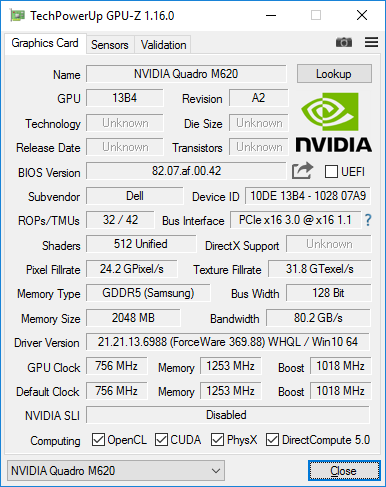
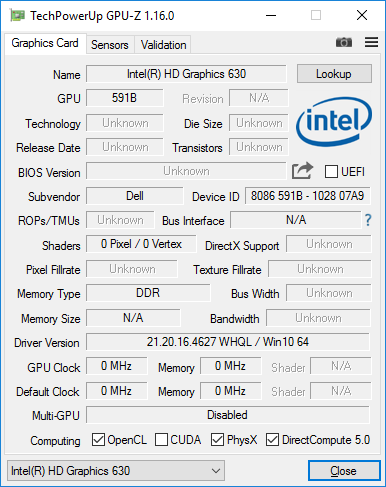
The Quadro M620 is a low-end Nvidia GPU for mobile workstations. The graphics card was released in 2017, but is still based on the Maxwell-chip, which the letter "M" in the model number indicates as well. Compared to last year's version - the also Maxwell-based Quadro M600M - Nvidia increased the performance mostly by upping the number of shader. The M620 is based on the GM107-version of the GeForce GTX 950M and is remarkably similar to the older Quadro M1000M, although the GPU only comes with 2 GB of RAM. For more information and benchmark comparisons between various GPUs, please take a look at our GPU benchmark comparison.
Compared to the predecessor M600M, the M620 is about 20 to 30 % faster according to most synthetic benchmark tests. The predecessor of the 3520, the Precision 3510, came with an AMD GPU - a FirePro W5130M. The M620 is vastly superior to the older AMD offering and between 50 to 60 % faster.
The GPU always reaches its performance potential even when the notebook is running on battery.
| LuxMark v2.0 64Bit | |
| Room GPUs-only | |
| Dell Precision 5520 UHD | |
| HP ZBook 15 G3 | |
| Dell Precision 3520 | |
| Lenovo ThinkPad P50 | |
| Lenovo ThinkPad P70-20ER000BMS | |
| Dell Precision 3510 | |
| Sala GPUs-only | |
| Dell Precision 5520 UHD | |
| HP ZBook 15 G3 | |
| Dell Precision 3520 | |
| Lenovo ThinkPad P50 | |
| Lenovo ThinkPad P70-20ER000BMS | |
| Dell Precision 3510 | |
| SiSoft Sandra 2016 | |
| Image Processing | |
| HP ZBook 15 G3 | |
| Lenovo ThinkPad P50 | |
| Dell Precision 3520 | |
| GP Cryptography (Higher Security AES256+SHA2-512) | |
| Lenovo ThinkPad P50 | |
| HP ZBook 15 G3 | |
| Dell Precision 3520 | |
| GP Financial Analysis (FP High/Double Precision) | |
| HP ZBook 15 G3 | |
| Lenovo ThinkPad P50 | |
| Dell Precision 3520 | |
| SPECviewperf 11 | |
| 1920x1080 Siemens NX | |
| Lenovo ThinkPad P50 | |
| HP ZBook 15 G3 | |
| Dell Precision 3520 | |
| Lenovo ThinkPad P70-20ER000BMS | |
| Dell Precision 3510 | |
| 1920x1080 Tcvis | |
| HP ZBook 15 G3 | |
| Lenovo ThinkPad P50 | |
| Dell Precision 3520 | |
| Lenovo ThinkPad P70-20ER000BMS | |
| Dell Precision 3510 | |
| 1920x1080 SolidWorks | |
| Dell Precision 3520 | |
| HP ZBook 15 G3 | |
| Lenovo ThinkPad P70-20ER000BMS | |
| Lenovo ThinkPad P50 | |
| Dell Precision 3510 | |
| 1920x1080 Pro/ENGINEER | |
| HP ZBook 15 G3 | |
| Dell Precision 3520 | |
| Lenovo ThinkPad P50 | |
| Lenovo ThinkPad P70-20ER000BMS | |
| Dell Precision 3510 | |
| 1920x1080 Maya | |
| HP ZBook 15 G3 | |
| Lenovo ThinkPad P50 | |
| Dell Precision 3520 | |
| Lenovo ThinkPad P70-20ER000BMS | |
| Dell Precision 3510 | |
| 1920x1080 Lightwave | |
| Dell Precision 3520 | |
| Lenovo ThinkPad P70-20ER000BMS | |
| HP ZBook 15 G3 | |
| Lenovo ThinkPad P50 | |
| Dell Precision 3510 | |
| 1920x1080 Ensight | |
| HP ZBook 15 G3 | |
| Lenovo ThinkPad P50 | |
| Dell Precision 3520 | |
| Lenovo ThinkPad P70-20ER000BMS | |
| Dell Precision 3510 | |
| 1920x1080 Catia | |
| Lenovo ThinkPad P50 | |
| HP ZBook 15 G3 | |
| Dell Precision 3520 | |
| Lenovo ThinkPad P70-20ER000BMS | |
| Dell Precision 3510 | |
| Unigine Heaven 2.1 - 1280x1024 high, Tesselation (normal), DirectX11 AA:off AF:1x | |
| Lenovo ThinkPad P50 | |
| HP ZBook 15 G3 | |
| Dell Precision 3520 | |
| Dell Precision 3510 | |
| Unigine Valley 1.0 | |
| 1920x1080 Extreme HD DirectX AA:x8 | |
| Lenovo ThinkPad P50 | |
| HP ZBook 15 G3 | |
| Dell Precision 3520 | |
| 1920x1080 Extreme HD Preset OpenGL AA:x8 | |
| HP ZBook 15 G3 | |
| Dell Precision 3520 | |
| Lenovo ThinkPad P50 | |
| 3DMark 11 - 1280x720 Performance GPU | |
| Lenovo ThinkPad P50 | |
| Dell Precision 5520 UHD | |
| HP ZBook 15 G3 | |
| Dell Precision 3520 | |
| Lenovo ThinkPad P70-20ER000BMS | |
| 3DMark | |
| 1280x720 Cloud Gate Standard Graphics | |
| Lenovo ThinkPad P50 | |
| HP ZBook 15 G3 | |
| Dell Precision 5520 UHD | |
| Dell Precision 3520 | |
| Lenovo ThinkPad P70-20ER000BMS | |
| Dell Precision 3510 | |
| 1920x1080 Fire Strike Graphics | |
| Dell Precision 5520 UHD | |
| Lenovo ThinkPad P50 | |
| HP ZBook 15 G3 | |
| Dell Precision 3520 | |
| Lenovo ThinkPad P70-20ER000BMS | |
| Dell Precision 3510 | |
| 1280x720 Ice Storm Standard Graphics | |
| Dell Precision 3520 | |
| HP ZBook 15 G3 | |
| Lenovo ThinkPad P50 | |
| Lenovo ThinkPad P70-20ER000BMS | |
| Dell Precision 5520 UHD | |
| Unigine Heaven 4.0 | |
| Extreme Preset OpenGL | |
| Lenovo ThinkPad P70-20ER000BMS | |
| Dell Precision 3520 | |
| Extreme Preset DX11 | |
| Lenovo ThinkPad P70-20ER000BMS | |
| Dell Precision 3520 | |
| 3DMark 06 Standard Score | 24751 points | |
| 3DMark Vantage P Result | 17237 points | |
| 3DMark 11 Performance | 4200 points | |
| 3DMark Ice Storm Standard Score | 103599 points | |
| 3DMark Cloud Gate Standard Score | 15759 points | |
| 3DMark Fire Strike Score | 3059 points | |
Help | ||
Gaming Performance
Professional GPUs aren't all that suitable for gaming, since their drivers are designed for stability and top-notch CAD performance. Nonetheless: for our evaluation, gaming benchmarks are important as well.
Just like CPUs, we subject powerful dedicated GPUs to an extended stress test. For this purpose, we run the game Witcher 3 at the ultra preset and 1080p. The GPU had no issues with consistently high loads and maintained the frame rate of 10 fps with only minor fluctuations.
The Quadro M620 can handle games quite well, which isn't a surprise, given that it's based on the 950M. Of course, the chip is showing its age, so some titles can only be played halfway fluently at medium and low details. Occasional gamers who prefer a professional workstation design to a gaming rig, might still enjoy the Precision 3520 in this regard.
| BioShock Infinite - 1366x768 High Preset | |
| Dell Precision 5520 UHD | |
| HP ZBook 15 G3 | |
| Lenovo ThinkPad P50 | |
| Dell Precision 3520 | |
| Lenovo ThinkPad P70-20ER000BMS | |
| Lenovo ThinkPad T570-20HAS01E00 | |
| Rise of the Tomb Raider - 1920x1080 High Preset AA:FX AF:4x | |
| HP ZBook 15 G3 | |
| Dell Precision 3520 | |
| Lenovo ThinkPad P70-20ER000BMS | |
| Star Wars Battlefront - 1920x1080 Ultra Preset AA:FX | |
| Lenovo ThinkPad P50 | |
| Dell Precision 3520 | |
| Lenovo ThinkPad P70-20ER000BMS | |
| low | med. | high | ultra | |
|---|---|---|---|---|
| BioShock Infinite (2013) | 176.4 | 105.6 | 92.3 | 35.6 |
| GRID 2 (2013) | 192.8 | 147.4 | 126 | 39.1 |
| Company of Heroes 2 (2013) | 51.7 | 44.4 | 27.1 | 11.7 |
| Total War: Rome II (2013) | 190.5 | 139.6 | 114.4 | 17.8 |
| Dirt Rally (2015) | 249 | 118.5 | 62 | 28.2 |
| The Witcher 3 (2015) | 53.9 | 32.83 | 18.62 | 10 |
| Star Wars Battlefront (2015) | 110.6 | 64.3 | 28.92 | 24.37 |
| Rise of the Tomb Raider (2016) | 62.2 | 36.6 | 20.4 | |
| Doom (2016) | 60.4 | 46.3 | 25.2 | 19.5 |
| Warhammer 40.000: Dawn of War III (2017) | 70.3 | 18.7 |
Emissions
Noise Level
Unfortunately, the Precision 3520 isn't exactly a quiet notebook. Although the fan system frequently stops spinning during idle, it also spools up randomly when no CPU load is present. The fan control of our test unit also appears to be implemented rather poorly: under load, the fan is quite loud, which of course is to be expected. Once the load is reduced, the fan doesn't stop spinning even though the system is at idle and has cool ed down again. It can take 10 minutes before the fan ceases to produce excessive noise.
It's not only the fan that gets on our nerves: we also encountered coil whine, which is quite noticeable at idle at around 30 dB. We also deducted a point here for this behavior.
Noise level
| Idle |
| 29.6 / 29.6 / 31.2 dB(A) |
| Load |
| 43 / 46.9 dB(A) |
 | ||
30 dB silent 40 dB(A) audible 50 dB(A) loud |
||
min: | ||
Temperature
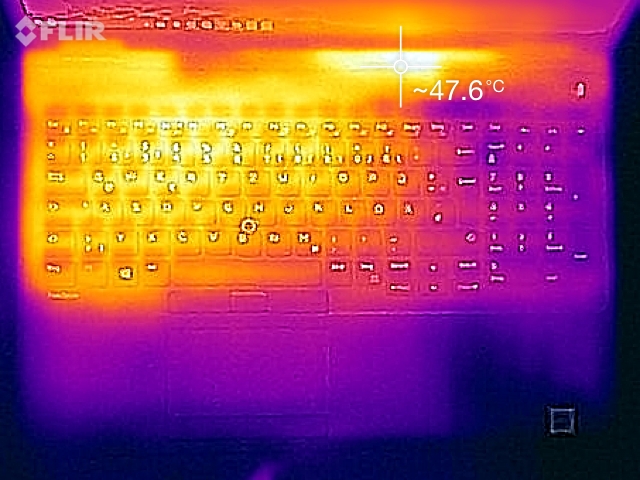
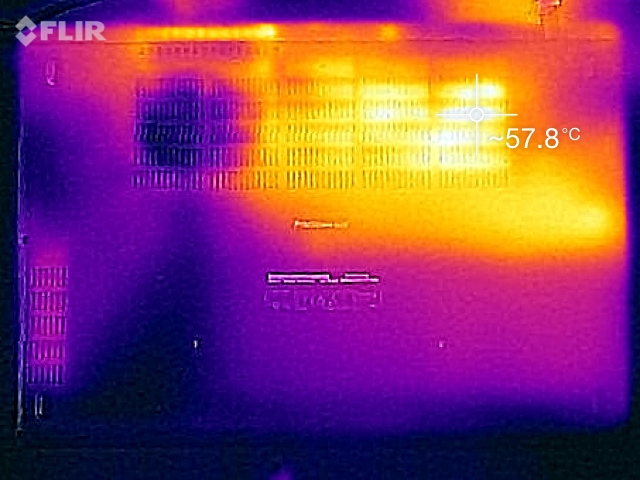
The Precision 3520 doesn't get hot at idle. During our real-world test with the game Witcher 3, the system does get warm, but remains far from critical. At load, it's a different story though and one spot on the bottom reaches 57° C. The palm rests remain fairly cool, however.
The second outcome - which we observed during all subsequent test runs - was vastly different: here, the CPU couldn't maintain a draw of 35 W ad infinitum. Rather, the wattage as well as the frequency started to fluctuate between 35 and 15 W and 3 and 1.5 GHz, respectively. After about 10 minutes, the CPU stabilized at 15 W and 1.5 GHz at a temperature of around 70 degrees C.
Why the system behaved this way, we simply don't know. The temperatures remained unremarkable and thus couldn't have been the cause. In our opinion, the culprit is the Precision's firmware, which doesn't seem to be tuned all that well.
The second stress test outcome doesn't seem to impact the daily use, however. a subsequent run of 3DMark 11 resulted in a quite "normal" test result.
(-) The maximum temperature on the upper side is 45.8 °C / 114 F, compared to the average of 38.2 °C / 101 F, ranging from 22.2 to 69.8 °C for the class Workstation.
(-) The bottom heats up to a maximum of 57.1 °C / 135 F, compared to the average of 41.1 °C / 106 F
(+) In idle usage, the average temperature for the upper side is 23.7 °C / 75 F, compared to the device average of 32 °C / 90 F.
(±) Playing The Witcher 3, the average temperature for the upper side is 32 °C / 90 F, compared to the device average of 32 °C / 90 F.
(+) The palmrests and touchpad are reaching skin temperature as a maximum (34.1 °C / 93.4 F) and are therefore not hot.
(-) The average temperature of the palmrest area of similar devices was 27.8 °C / 82 F (-6.3 °C / -11.4 F).
Speakers
The two stereo speakers are hidden at the front edge and produce a Notebook-typical sound with lackluster lows and distorted highs. At least the speakers are loud enough for a normal-sized room - but the user shouldn't expect too much. For video telephony, the speakers are sufficient.
For a better experience, we recommend the 3.5 mm audio jack, which produces clear sound.
Dell Precision 3520 audio analysis
(+) | speakers can play relatively loud (85.6 dB)
Bass 100 - 315 Hz
(-) | nearly no bass - on average 16.2% lower than median
(±) | linearity of bass is average (7% delta to prev. frequency)
Mids 400 - 2000 Hz
(±) | higher mids - on average 5.2% higher than median
(+) | mids are linear (3.9% delta to prev. frequency)
Highs 2 - 16 kHz
(+) | balanced highs - only 3.7% away from median
(+) | highs are linear (3.5% delta to prev. frequency)
Overall 100 - 16.000 Hz
(±) | linearity of overall sound is average (15.2% difference to median)
Compared to same class
» 33% of all tested devices in this class were better, 10% similar, 57% worse
» The best had a delta of 7%, average was 17%, worst was 35%
Compared to all devices tested
» 22% of all tested devices were better, 4% similar, 74% worse
» The best had a delta of 4%, average was 23%, worst was 134%
Apple MacBook 12 (Early 2016) 1.1 GHz audio analysis
(+) | speakers can play relatively loud (83.6 dB)
Bass 100 - 315 Hz
(±) | reduced bass - on average 11.3% lower than median
(±) | linearity of bass is average (14.2% delta to prev. frequency)
Mids 400 - 2000 Hz
(+) | balanced mids - only 2.4% away from median
(+) | mids are linear (5.5% delta to prev. frequency)
Highs 2 - 16 kHz
(+) | balanced highs - only 2% away from median
(+) | highs are linear (4.5% delta to prev. frequency)
Overall 100 - 16.000 Hz
(+) | overall sound is linear (10.2% difference to median)
Compared to same class
» 7% of all tested devices in this class were better, 2% similar, 90% worse
» The best had a delta of 5%, average was 18%, worst was 53%
Compared to all devices tested
» 5% of all tested devices were better, 1% similar, 94% worse
» The best had a delta of 4%, average was 23%, worst was 134%
Frequency Comparison (Checkbox selectable!)
Energy Management
Power Consumption
Compared to the predecessor, the Precision 3520 does consume slightly more power across all load levels. The 3510 was equipped with an HD display, however, which in turn lowered the power draw a little. The ThinkPad P50 also requires slightly less, but the difference isn't all that great. Same is true for the ZBook 15 G3, which draws just a few more watts than our 3520. Only the Precision 5520 consumes quite a bit more than the review notebook - the 4K display is the likely culprit here.
The 240 W power adapter is sized more than adequately and features a proprietary connector.
| Off / Standby | |
| Idle | |
| Load |
|
Key:
min: | |
| Dell Precision 3520 i7-7820HQ, Quadro M620, Toshiba XG4 NVMe (THNSN5512GPUK), IPS LED, 1920x1080, 15.6" | Dell Precision 3510 6700HQ, FirePro W5130M, Samsung SM951 MZVPV256HDGL m.2 PCI-e, TN LED, 1366x768, 15.6" | Dell Precision 5520 UHD E3-1505M v6, Quadro M1200, Samsung SM961 MZVKW512HMJP m.2 PCI-e, IPS, 3840x2160, 15.6" | Lenovo ThinkPad P50 6820HQ, Quadro M2000M, Samsung SSD PM871 MZNLN256HCHP, IPS, 1920x1080, 15.6" | HP ZBook 15 G3 E3-1505M v5, Quadro M2000M, Samsung SM951 MZVPV512HDGL m.2 PCI-e, UWVA-IPS, 1920x1080, 15.6" | |
|---|---|---|---|---|---|
| Power Consumption | 28% | -32% | 10% | -6% | |
| Idle Minimum * (Watt) | 5.8 | 4.2 28% | 8.9 -53% | 5.6 3% | 5.7 2% |
| Idle Average * (Watt) | 10.7 | 6.5 39% | 13.6 -27% | 8.6 20% | 12.2 -14% |
| Idle Maximum * (Watt) | 13.3 | 7.1 47% | 14.1 -6% | 9.3 30% | 12.6 5% |
| Load Average * (Watt) | 78.2 | 74.6 5% | 100.3 -28% | 89.5 -14% | 83.1 -6% |
| Witcher 3 ultra * (Watt) | 58.8 | 100.2 -70% | |||
| Load Maximum * (Watt) | 116 | 92.2 21% | 126.3 -9% | 105 9% | 138.2 -19% |
* ... smaller is better
Battery Life
Dell offers two different battery sizes - a 4-cell, 68 Wh model and a 6-cell, 92 Wh version. Both batteries are integrated and require opening the chassis for removal.
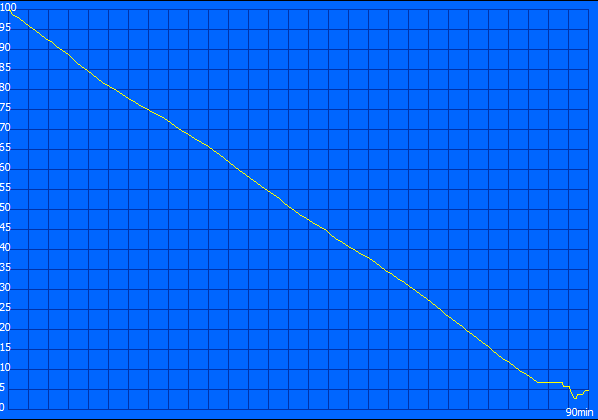
Our workstation shipped with the smaller 4-cell battery. Considering that the battery is comparatively small for a notebook with a quad-core CPU, the Precision does last quite a long time. During our real-life WLAN test, the 3520 easily beat the older ThinkPad P50 with its much larger 90 Wh battery source. Under load, the Precision 3520 doesn't last quite as long, but that's not really important for every-day use. When we subjected the system to the SPECviewperf 12 test - here the benchmark runs in a loop - the 3520 shut down after about 90 minutes, which is comparable to the load-test result.
Charging the battery takes about two hours - provided the user selects the quick-charge mode in the Dell Battery Manager.
| Dell Precision 3520 i7-7820HQ, Quadro M620, 68 Wh | Dell Precision 3510 6700HQ, FirePro W5130M, 84 Wh | Dell Precision 5520 UHD E3-1505M v6, Quadro M1200, 97 Wh | HP ZBook 15 G3 E3-1505M v5, Quadro M2000M, 90 Wh | Lenovo ThinkPad T570-20HAS01E00 i7-7500U, GeForce 940MX, 56 Wh | Lenovo ThinkPad P50 6820HQ, Quadro M2000M, 90 Wh | |
|---|---|---|---|---|---|---|
| Battery runtime | 30% | -32% | -1% | 24% | 13% | |
| Reader / Idle (h) | 16.6 | 19.5 17% | 12.1 -27% | 13.7 -17% | 13.3 -20% | 14.3 -14% |
| H.264 (h) | 8.1 | 10.1 25% | 7.5 -7% | 8.1 0% | 8.9 10% | |
| WiFi v1.3 (h) | 7.6 | 9.9 30% | 4.2 -45% | 6.4 -16% | 6.9 -9% | 8.3 9% |
| Load (h) | 1.3 | 1.9 46% | 1 -23% | 1.8 38% | 2.9 123% | 1.9 46% |
Verdict
Pros
Cons
The Precision 3520 definitely has its plus points. First, there's the display, which is vivid and bright and pleasing to work with. The battery life is also pretty good for a workstation and should be outstanding with the larger 92 Wh battery option. The number of physical ports is sufficient. The chassis and the input devices are decent enough for a business machine, but not quite perfect, either.
Unfortunately, the Precision falters when it comes to the most important criteria for workstations: performance and noise level. The restriction to a TDP of 35 W might raise some eyebrows already - Dell probably would have had to invest in a more sophisticated cooling system, which of course isn't all that realistic, since this is a budget workstation. We have to ask though if a nominally weaker CPU might not be the better choice. Our stress test revealed that the performance can fluctuate hugely under load, likely because the firmware could use some additional tuning. Unfortunately, that's also true for the fan control, because the fan frequently spins even when no load is present. After the benchmarks, it takes a long time for the fan to stop again. In addition, the 3520 suffers from coil whine.
The Precision 3520 is a solid workstation - but it could do with some improvements.
In summary we can say that the Precision 3520 definitely has potential. The notebook is quite powerful and features a comparatively good price-to-performance ratio. After all: workstations can be quite expensive. Dell needs to go back to the drawing board and improve the fan control and optimize the performance, however. As soon as that happens, the 3520 will definitely be a worthy of a recommendation.
Dell Precision 3520
- 05/25/2017 v6 (old)
Benjamin Herzig
Price comparison