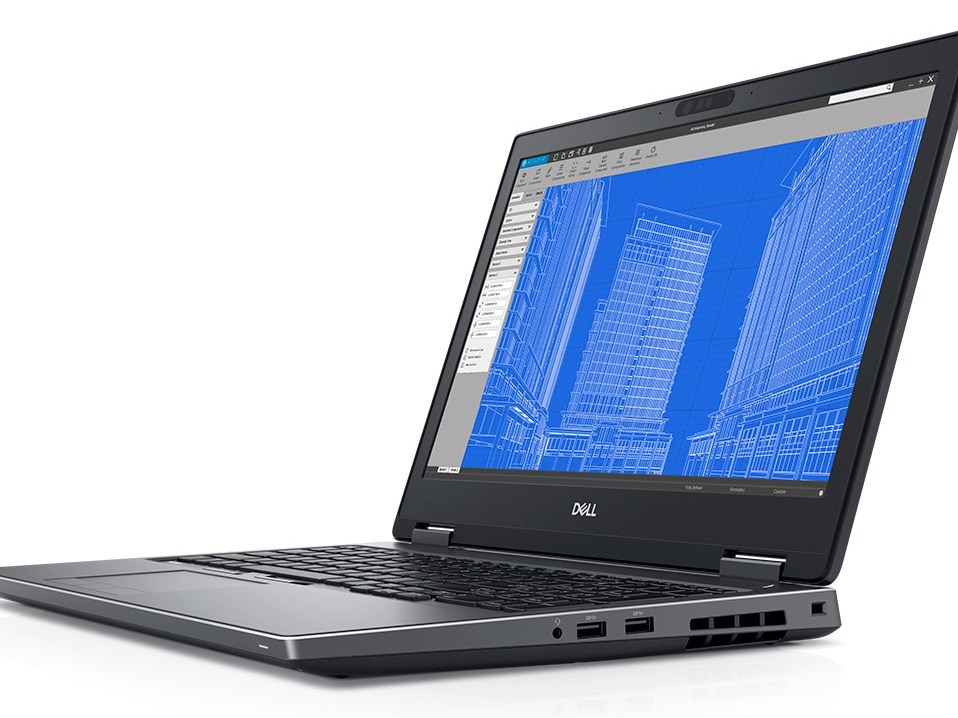
Dell Precision 7530 (i9-8950HK, Quadro P3200) Workstation Review
The Precision lineup consists of the budget 3000 series, mid-range 5000 series, and the high-end 7000 series for professional workstation users. The latest model in the 7000 series is the Precision 7530 that Dell is advertising as "the world's most powerful 15-inch workstation" that also happens to be VR ready. While we find the claim debatable, its specifications are still nothing to scoff at. The system can be configured with up to a Core i9-8950HK CPU, Quadro P3200 GPU, 4K UHD display, three internal storage bays, and a large 97 Wh battery. The lower-end configuration starts with just the Core i5-8300H and integrated UHD Graphics for only $1200 USD. As with most dedicated workstations from Dell, the range of SKUs is much wider than the consumer XPS lineup to cover as many use cases as possible.
Our test unit today is fully configured to represent the best that the Precision 7530 has to offer. We'll be comparing it to direct competitors like the HP ZBook 15 and Lenovo ThinkPad P52 along with the 2016 Precision 7510 that it replaces. Is this latest system a massive improvement over its two-year old predecessor?
More Dell Precision reviews:
Case
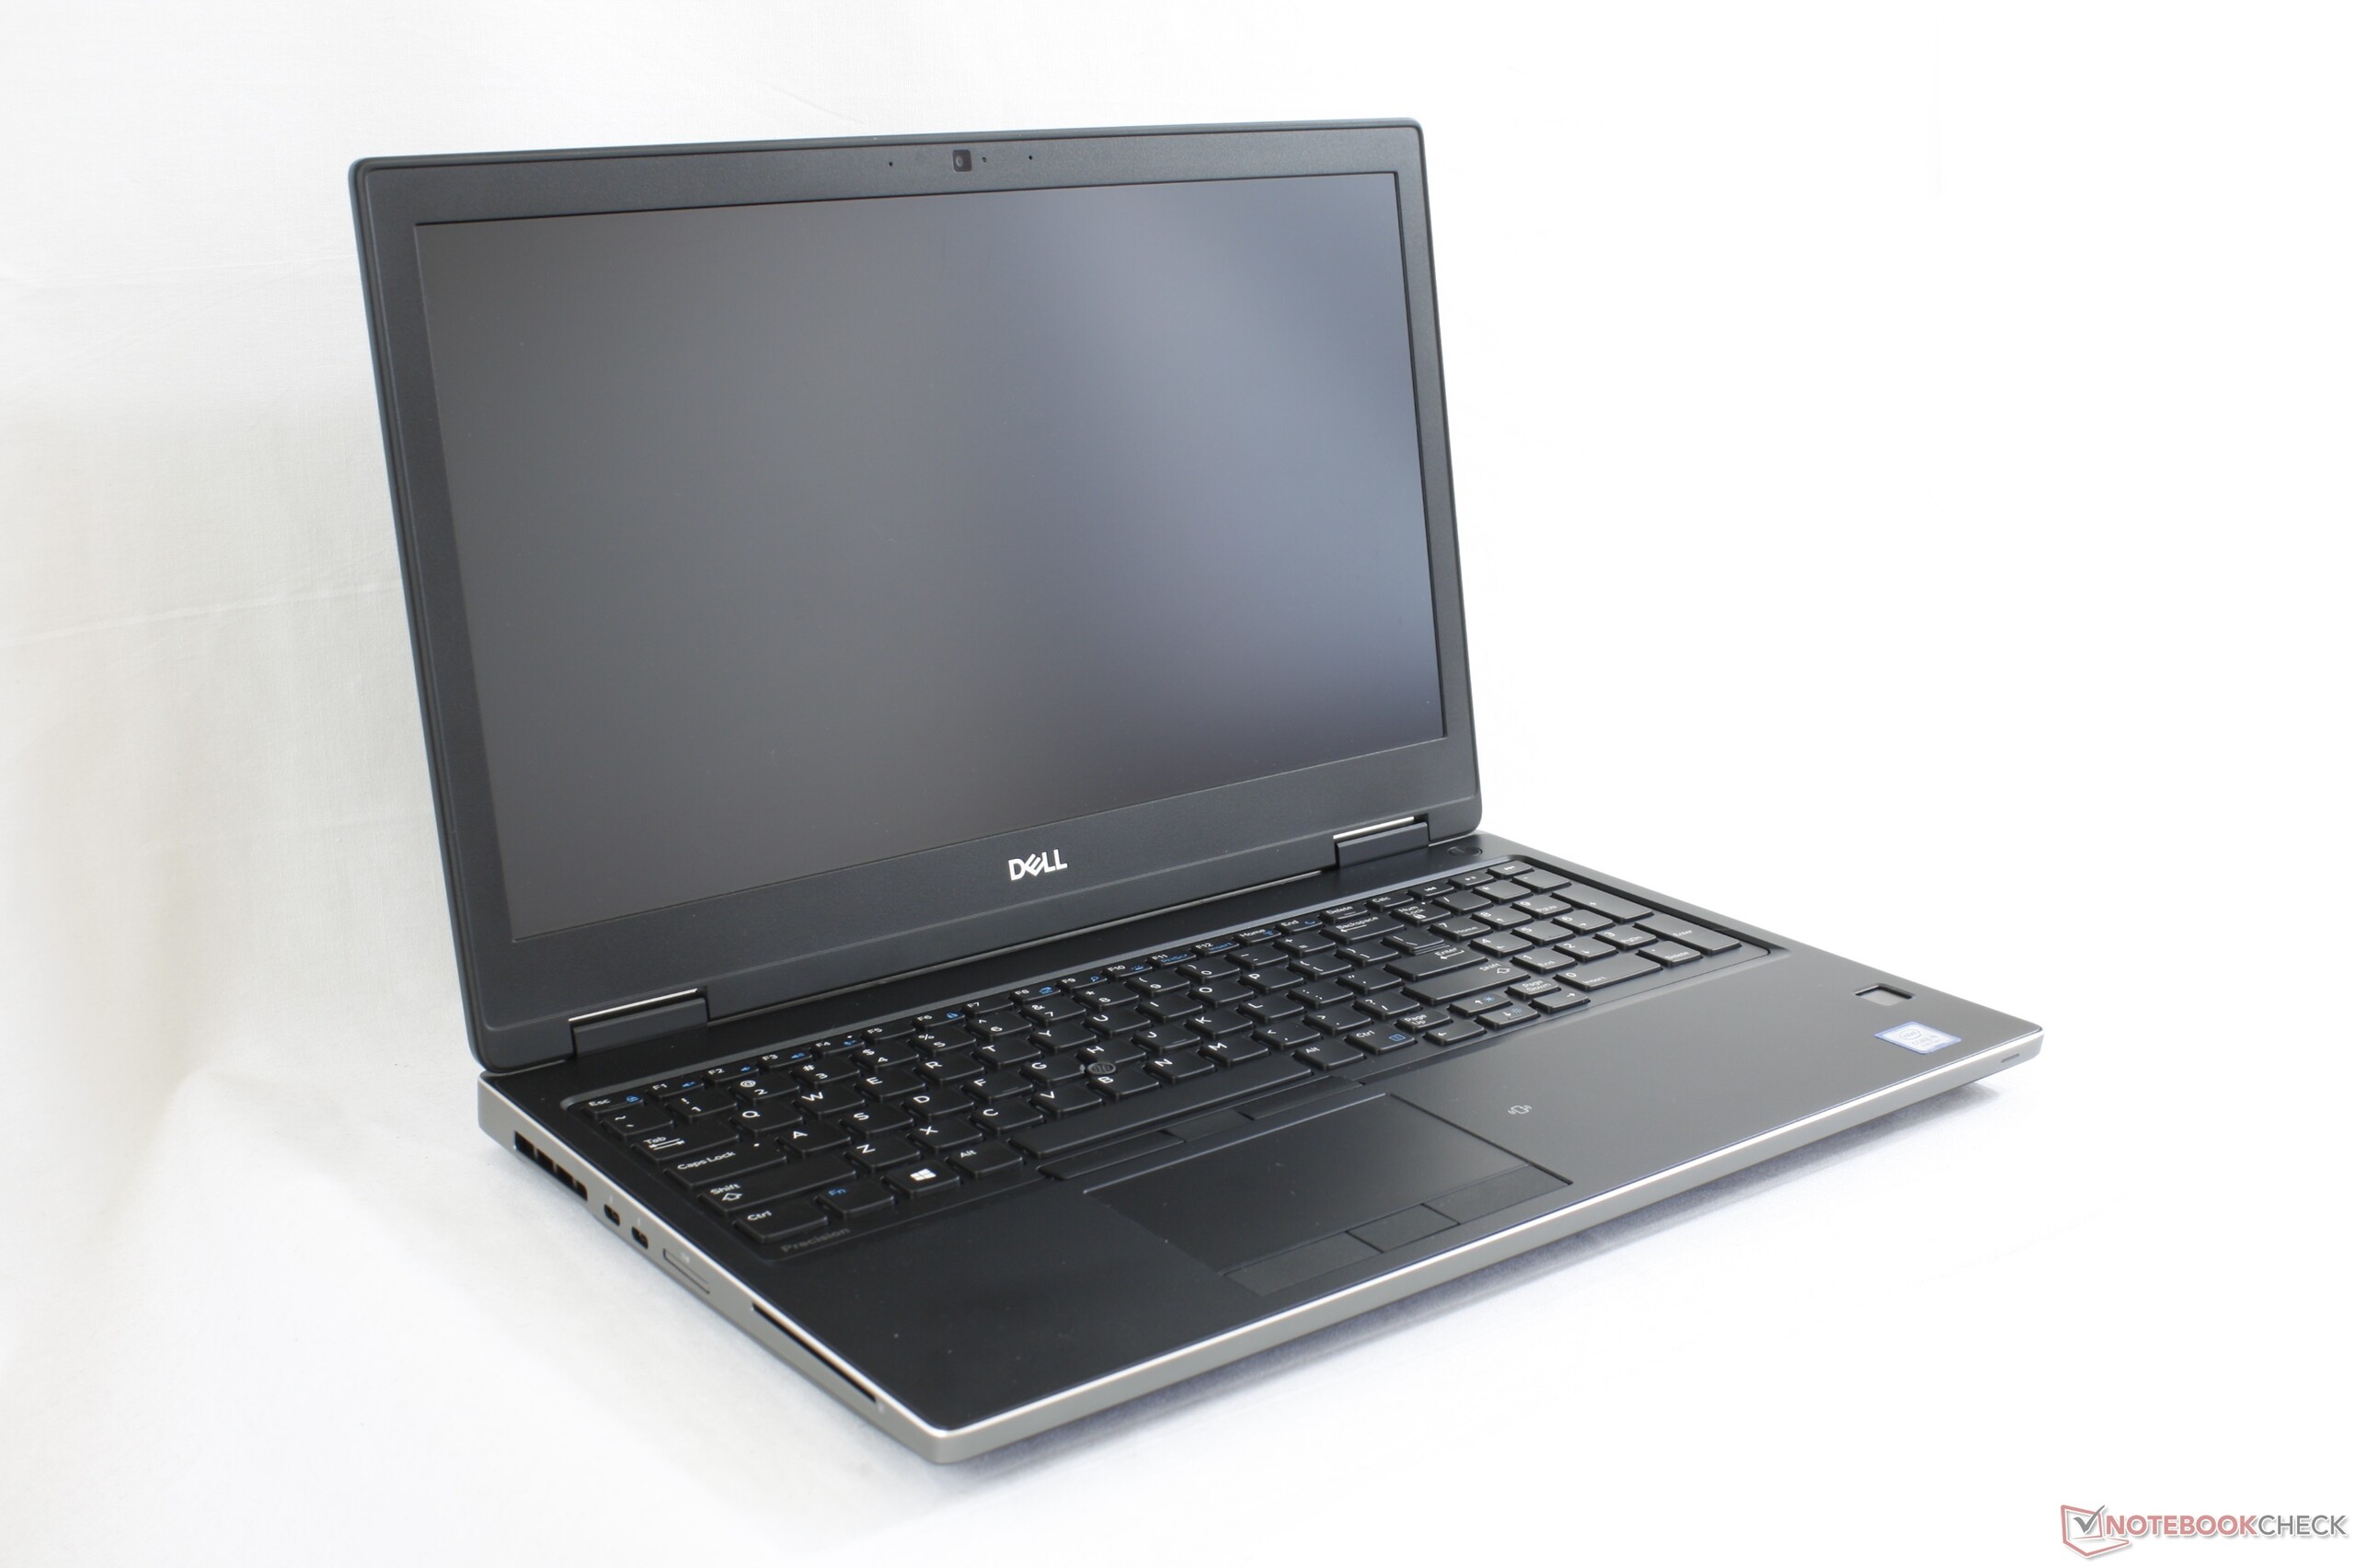
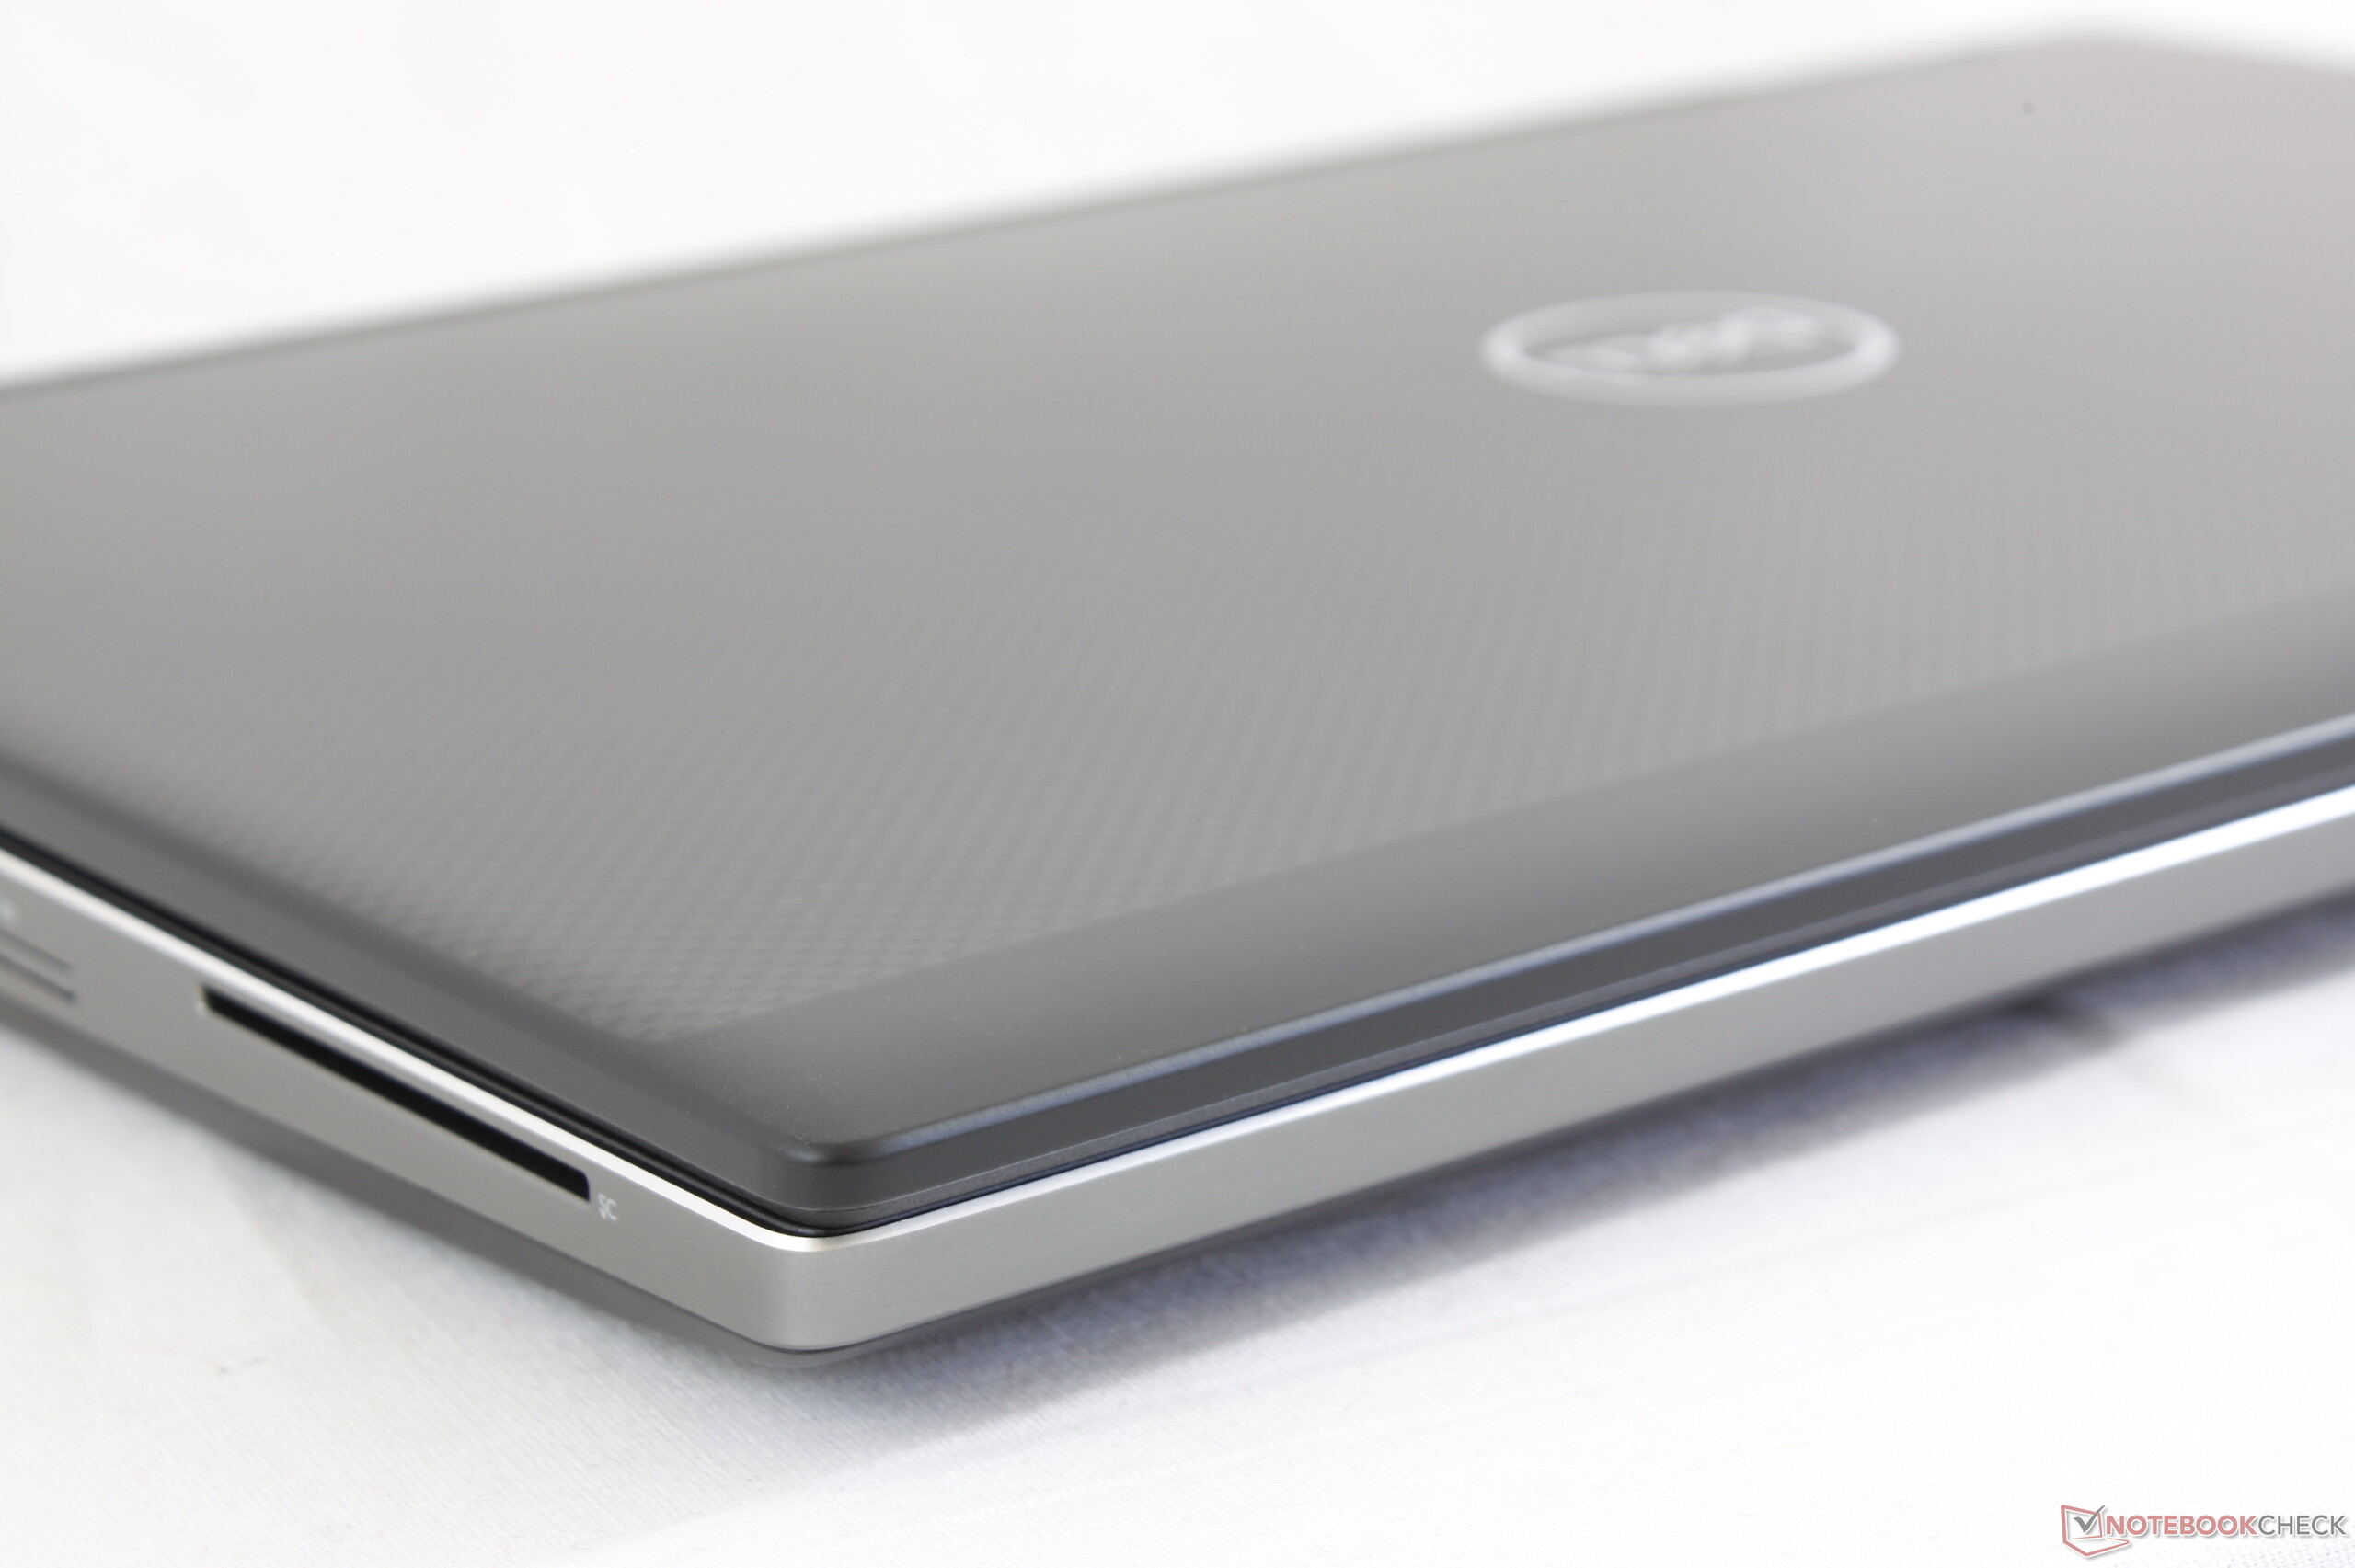
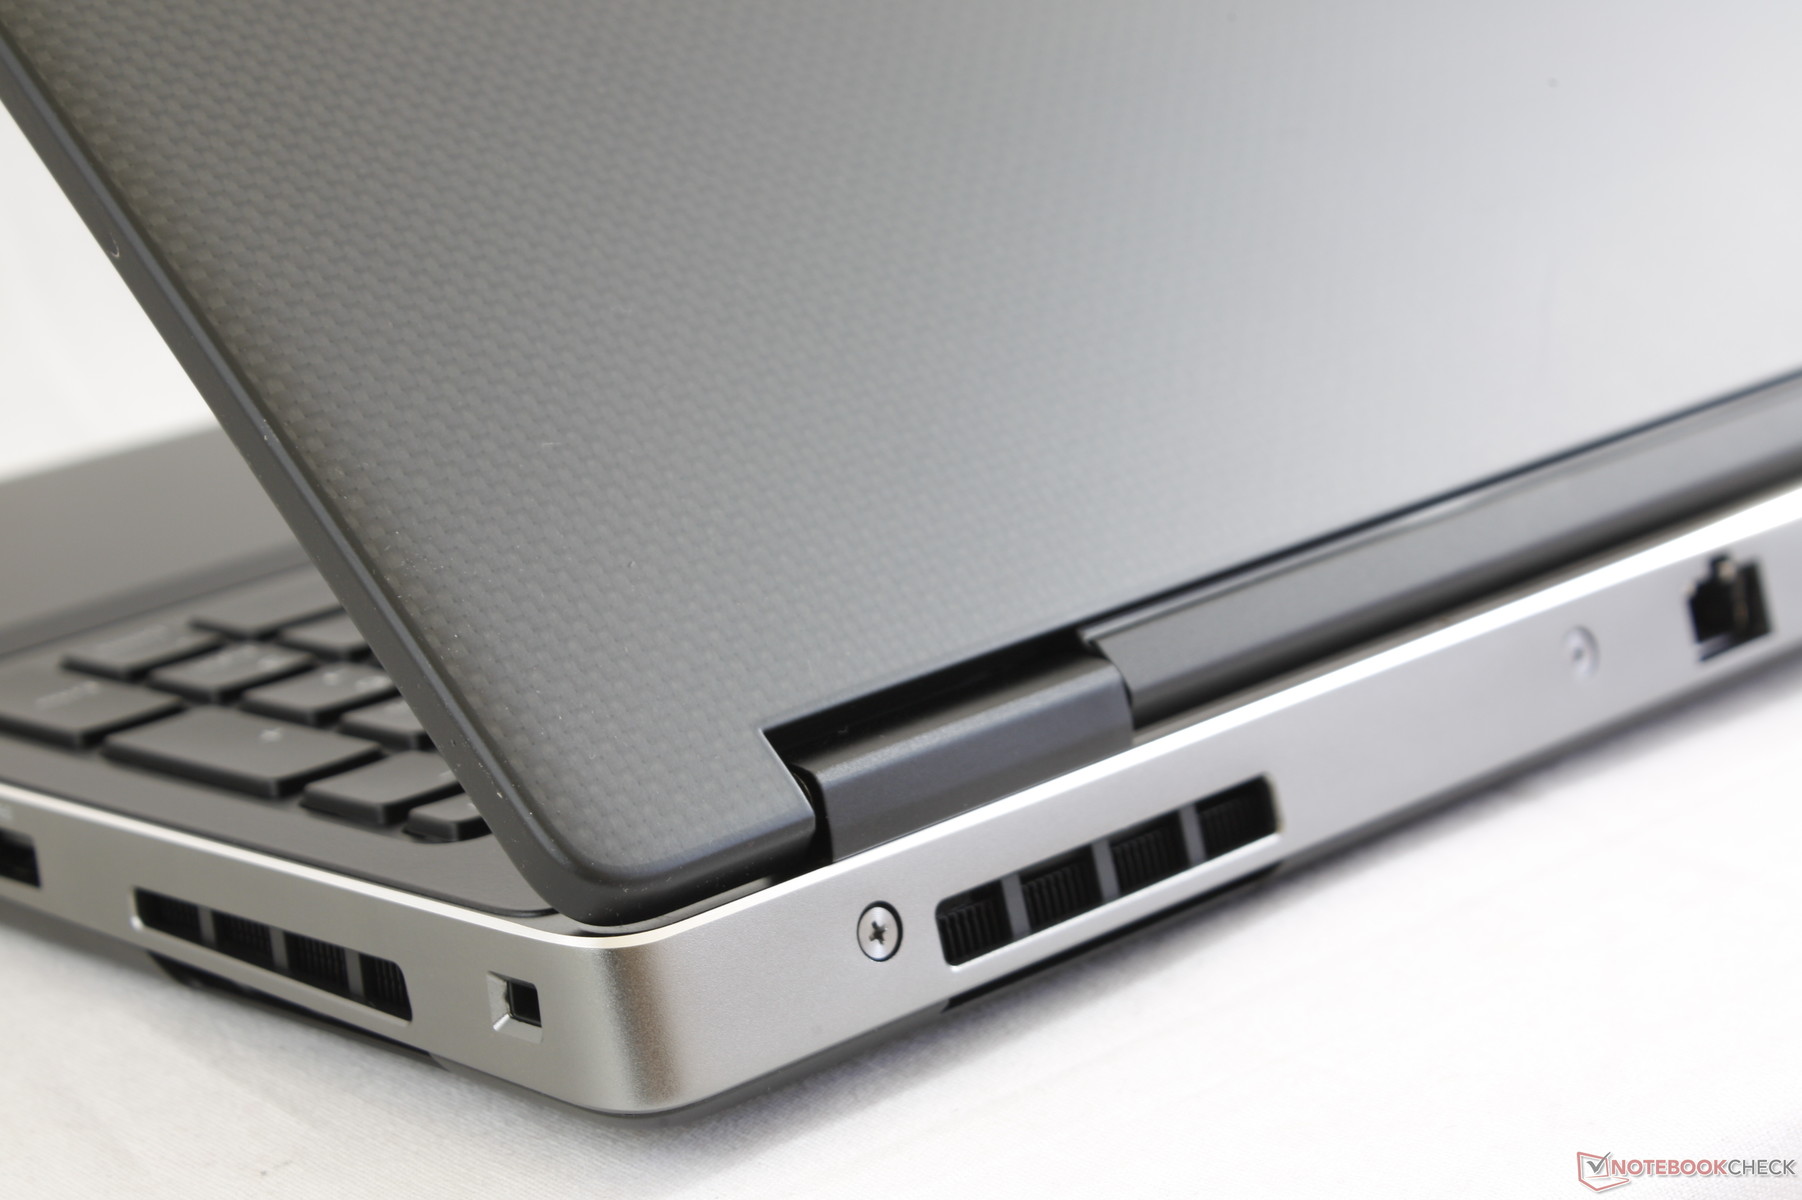
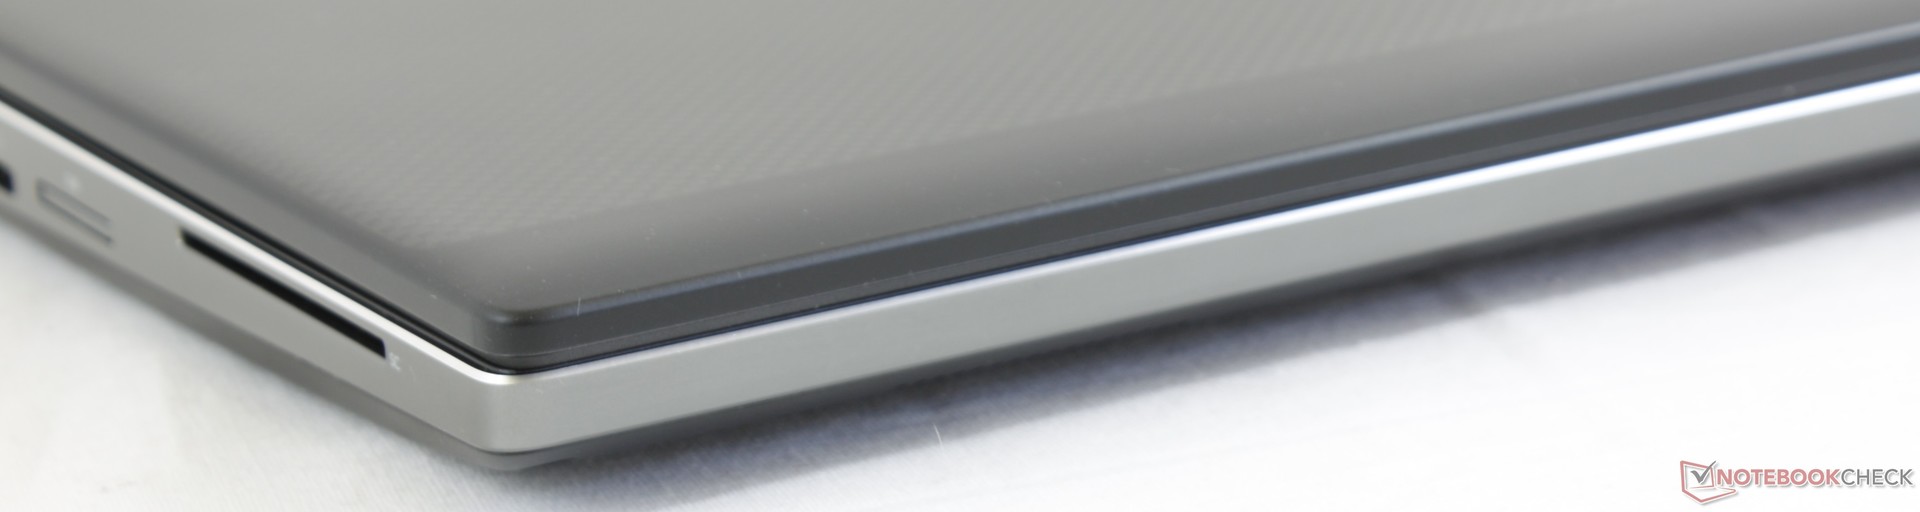
The Precision 7530 retains the MIL-STD 810G certification of the 7510 with a similar magnesium alloy skeleton but in slightly smaller dimensions. The result is a more compact system that serves as an evolutionary step forward for the series while feeling just as tough. Rigidity is excellent from top to bottom especially around the reinforced edges and corners of the base. Attempting to twist the base or flex the keyboard results in no creaking and almost no flexing as one would expect from a flagship Precision model. Aside from the fingerprint-loving carbon fiber and rubberized surfaces, Dell fans will be happy to know that this machine feels sturdier than the ThinkPad P series and is a step above the HP ZBook 15 as far as robustness is concerned.
We're able to notice one weak spot around the keyboard deck on an otherwise firm base. More specifically, the area between the Space key and right Alt key is more flexible than the rest of the keyboard. It's a minor complaint worth mentioning especially for a high-end system that revels in its unblemished build quality.
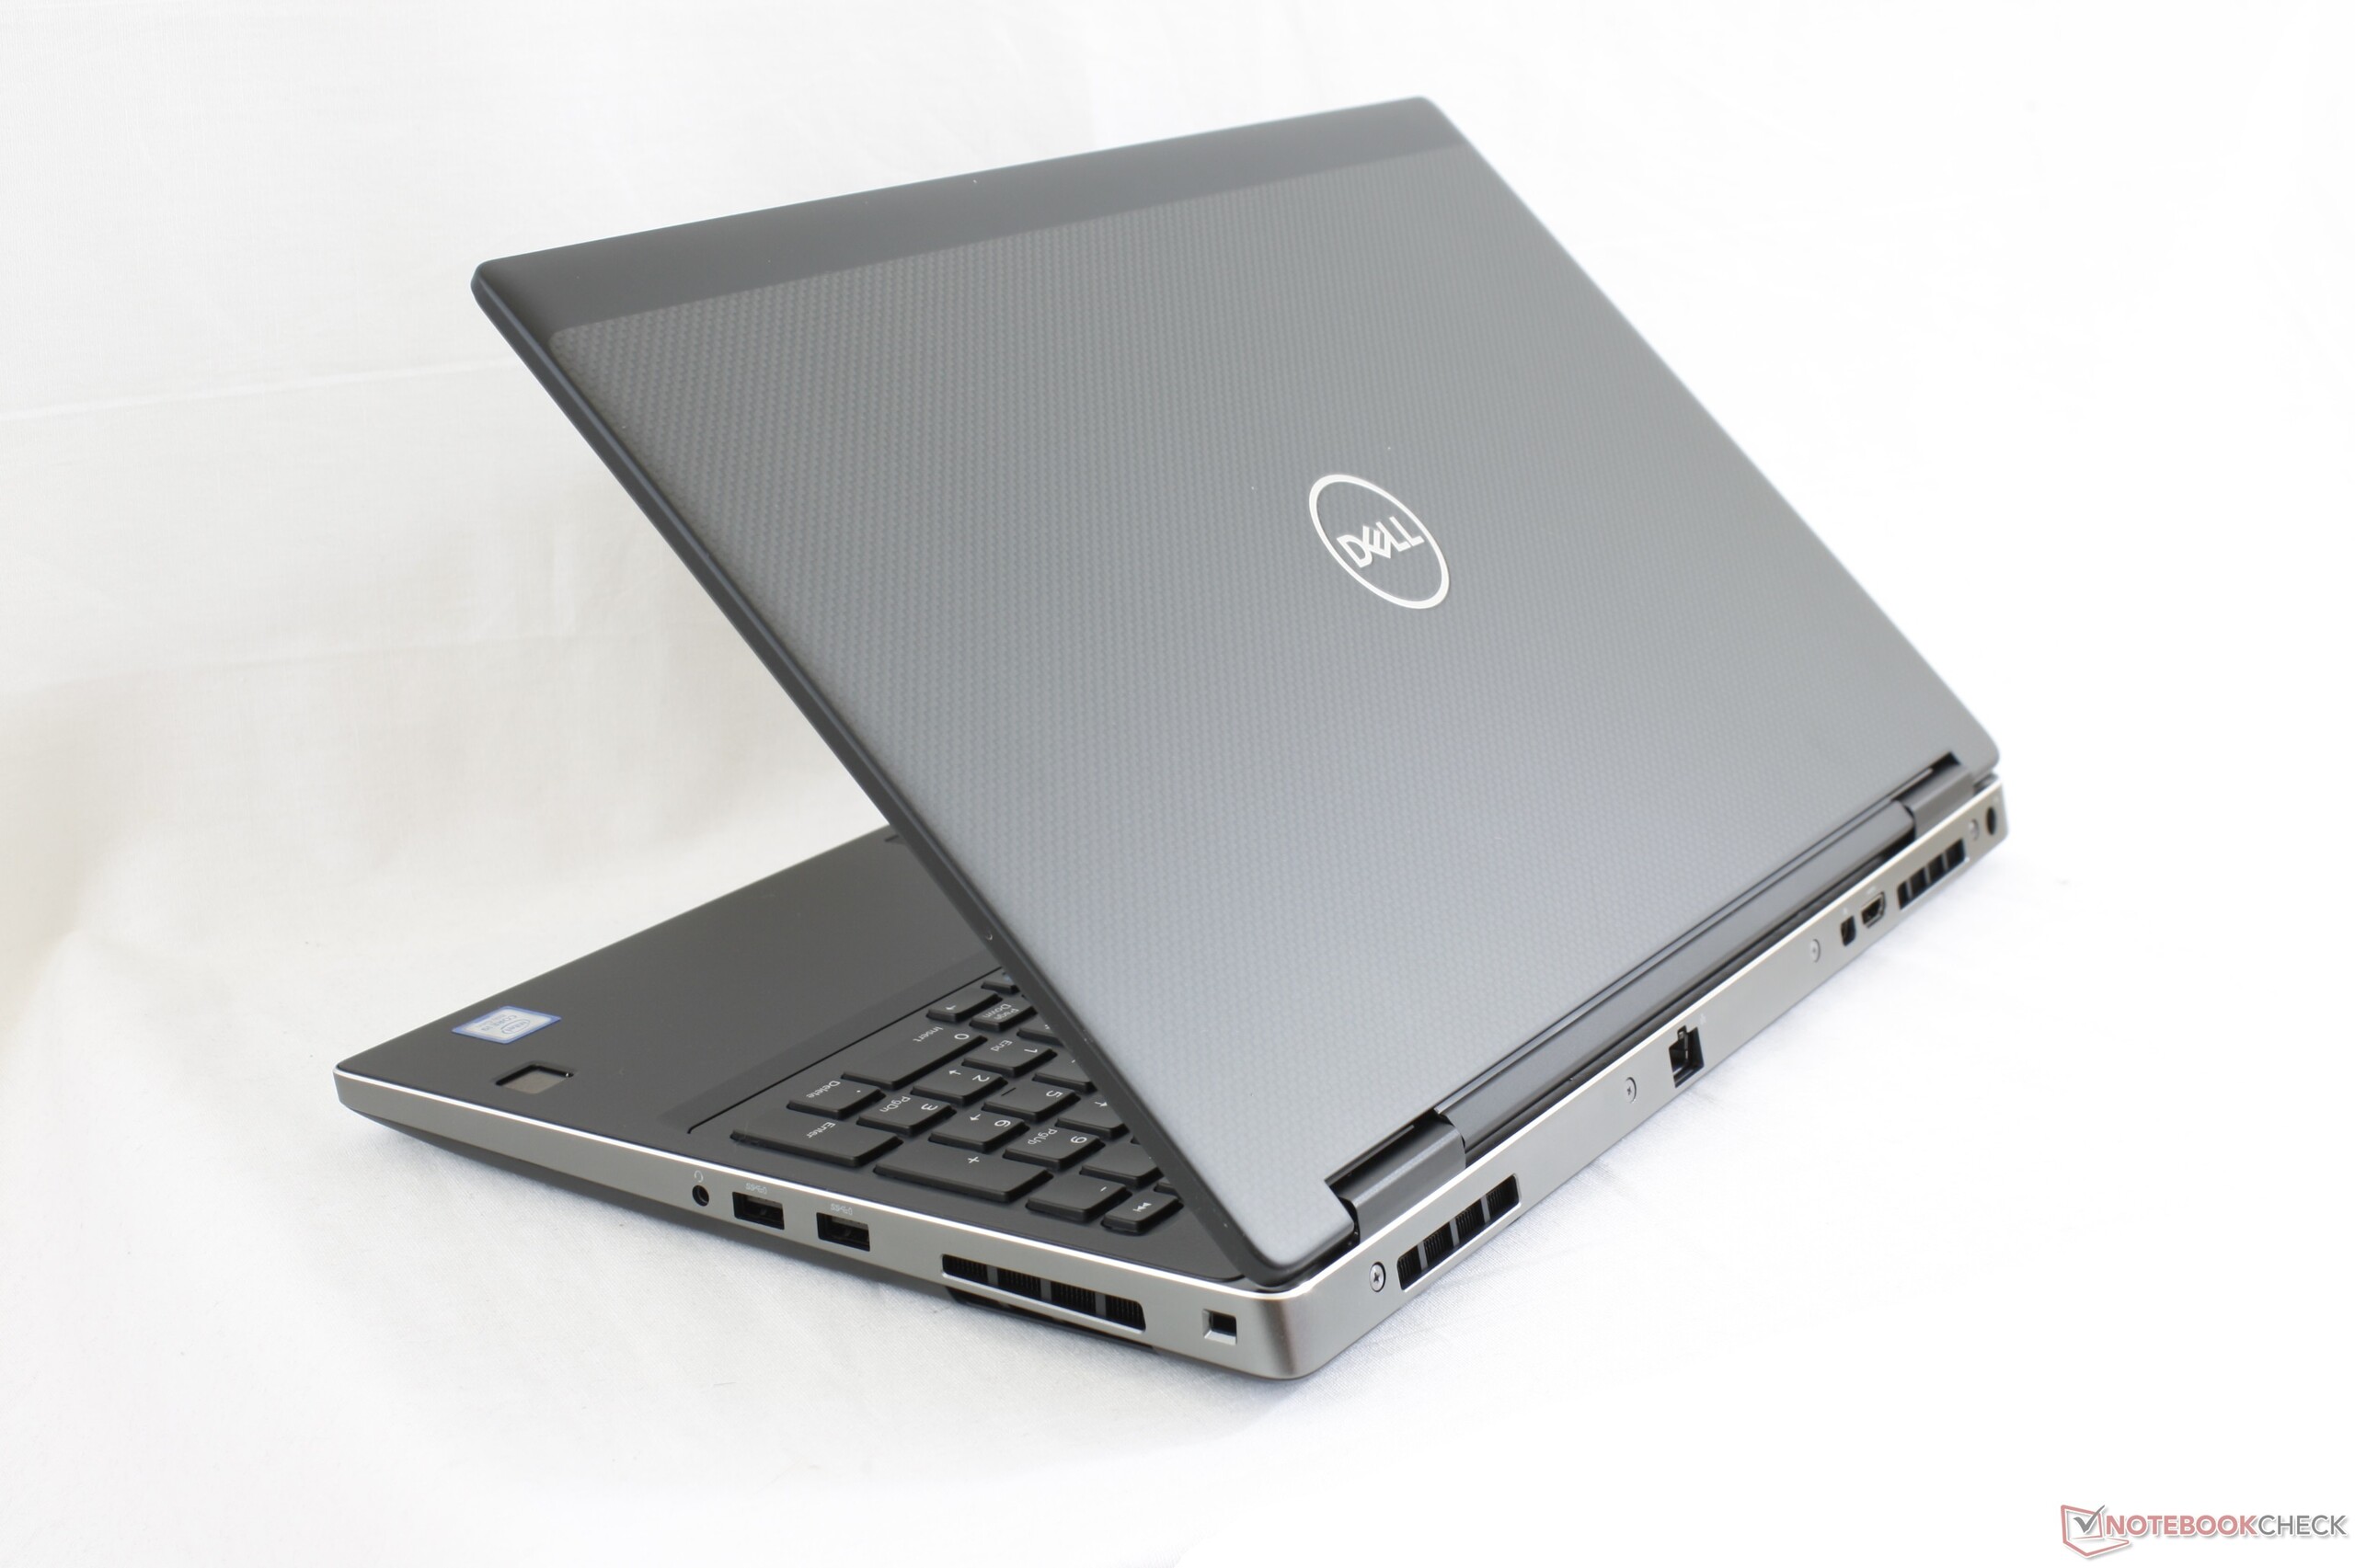
Another area that could use improvement is the lid as it is not nearly as inflexible as the base. It's still stronger than the lid of the ThinkPad P52 and most super-thin Ultrabooks, but it's not any better or worse than the outgoing Precision 7510. On the bright side, the hinges are uniformly firm up to their maximum angle with no teetering when typing or transporting.
Construction quality is perfect on our test unit with no unintended gaps or noticeable defects. The inner display bezel aligns perfectly with the edges of the screen unlike on certain MSI laptops.
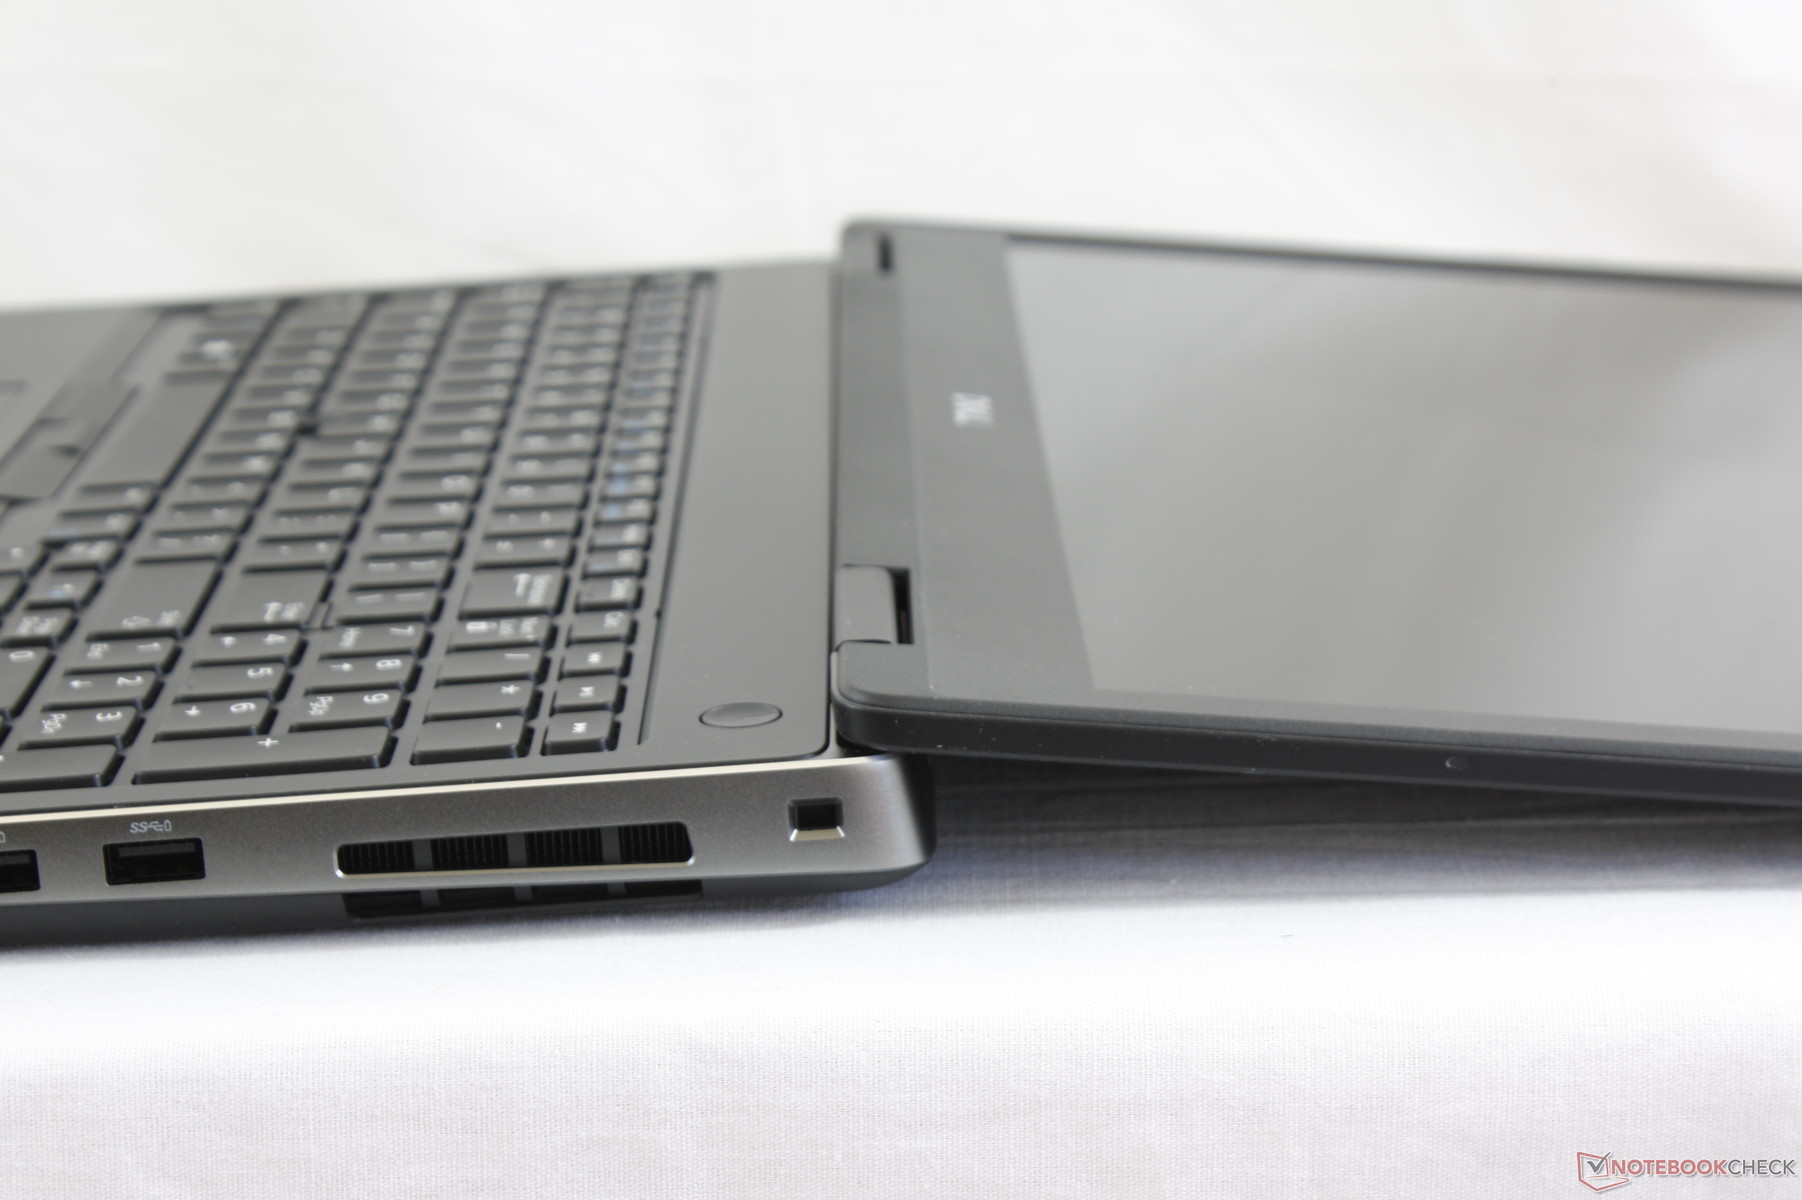
As for size and weight, the Dell is nearly identical to the ThinkPad P52 and so those familiar with the Lenovo will already have a good sense of the Precision 7530 in terms of portability. Users who want a lighter and more travel-friendly 15.6-inch workstation should consider the ThinkPad P1 or Precision 5530 based on the XPS 15 chassis.
Connectivity
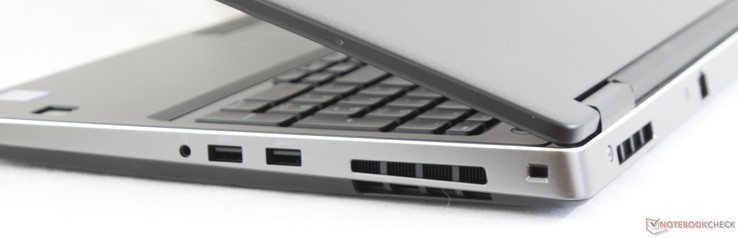
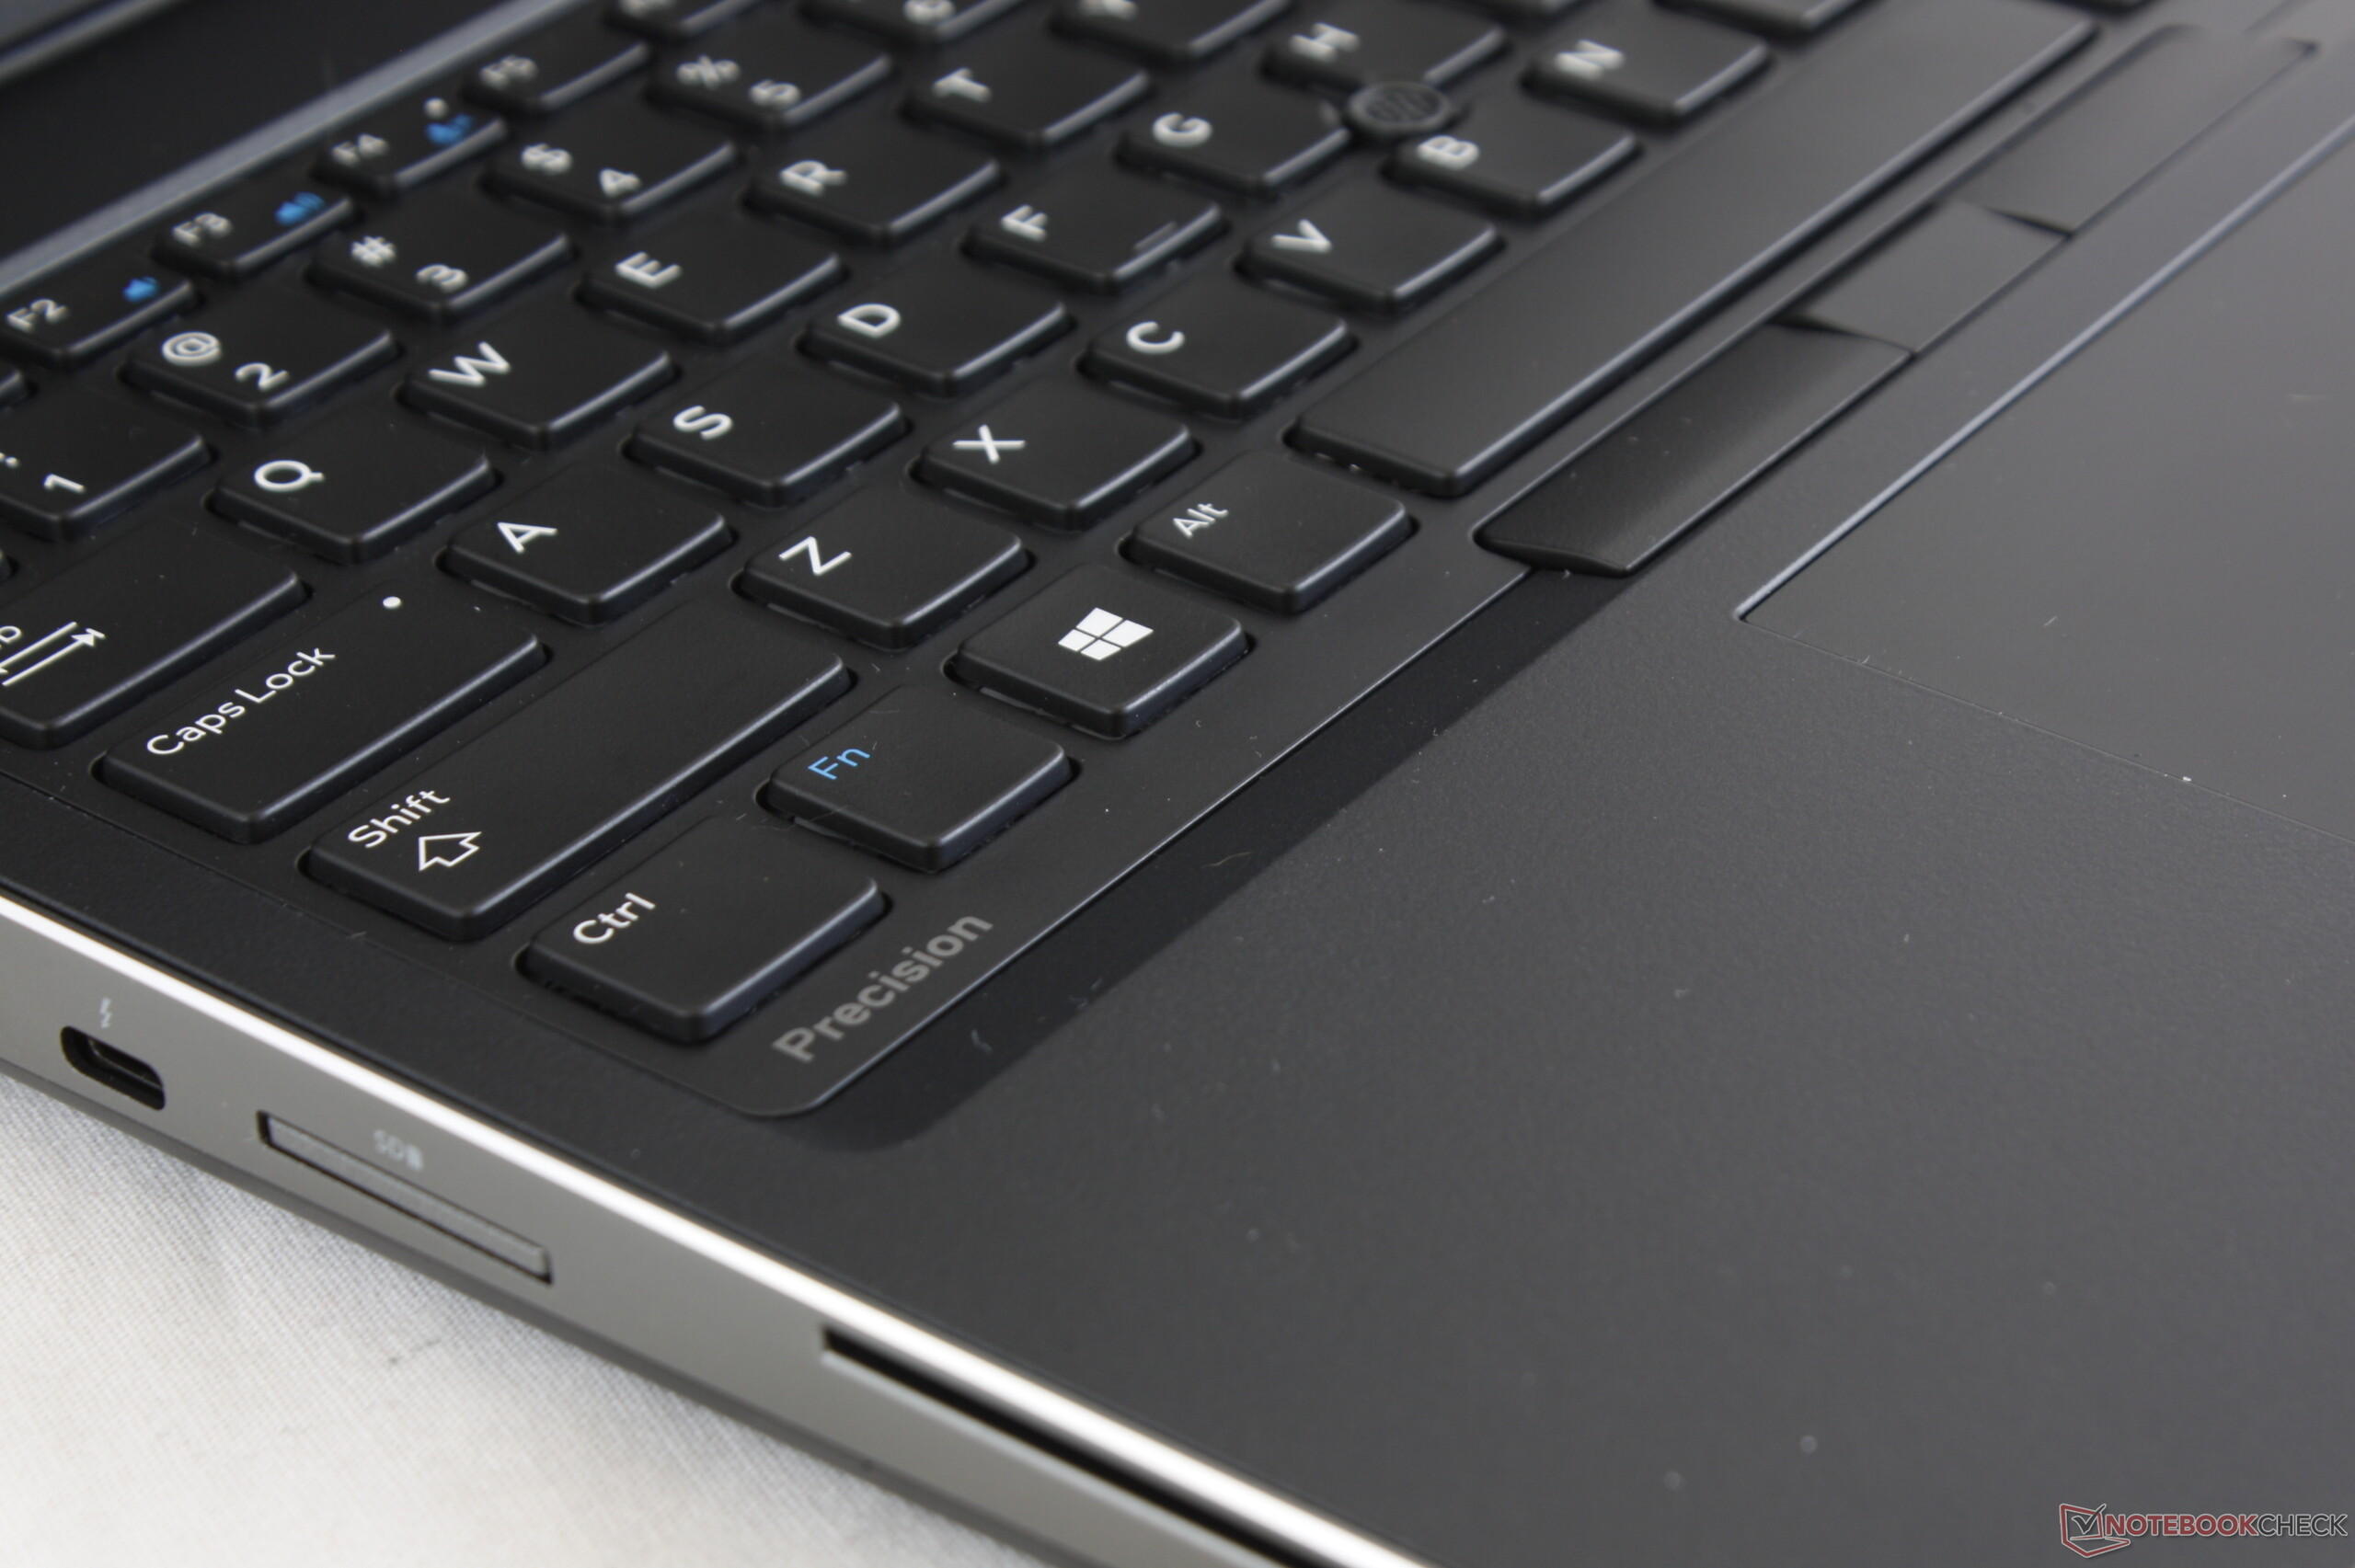
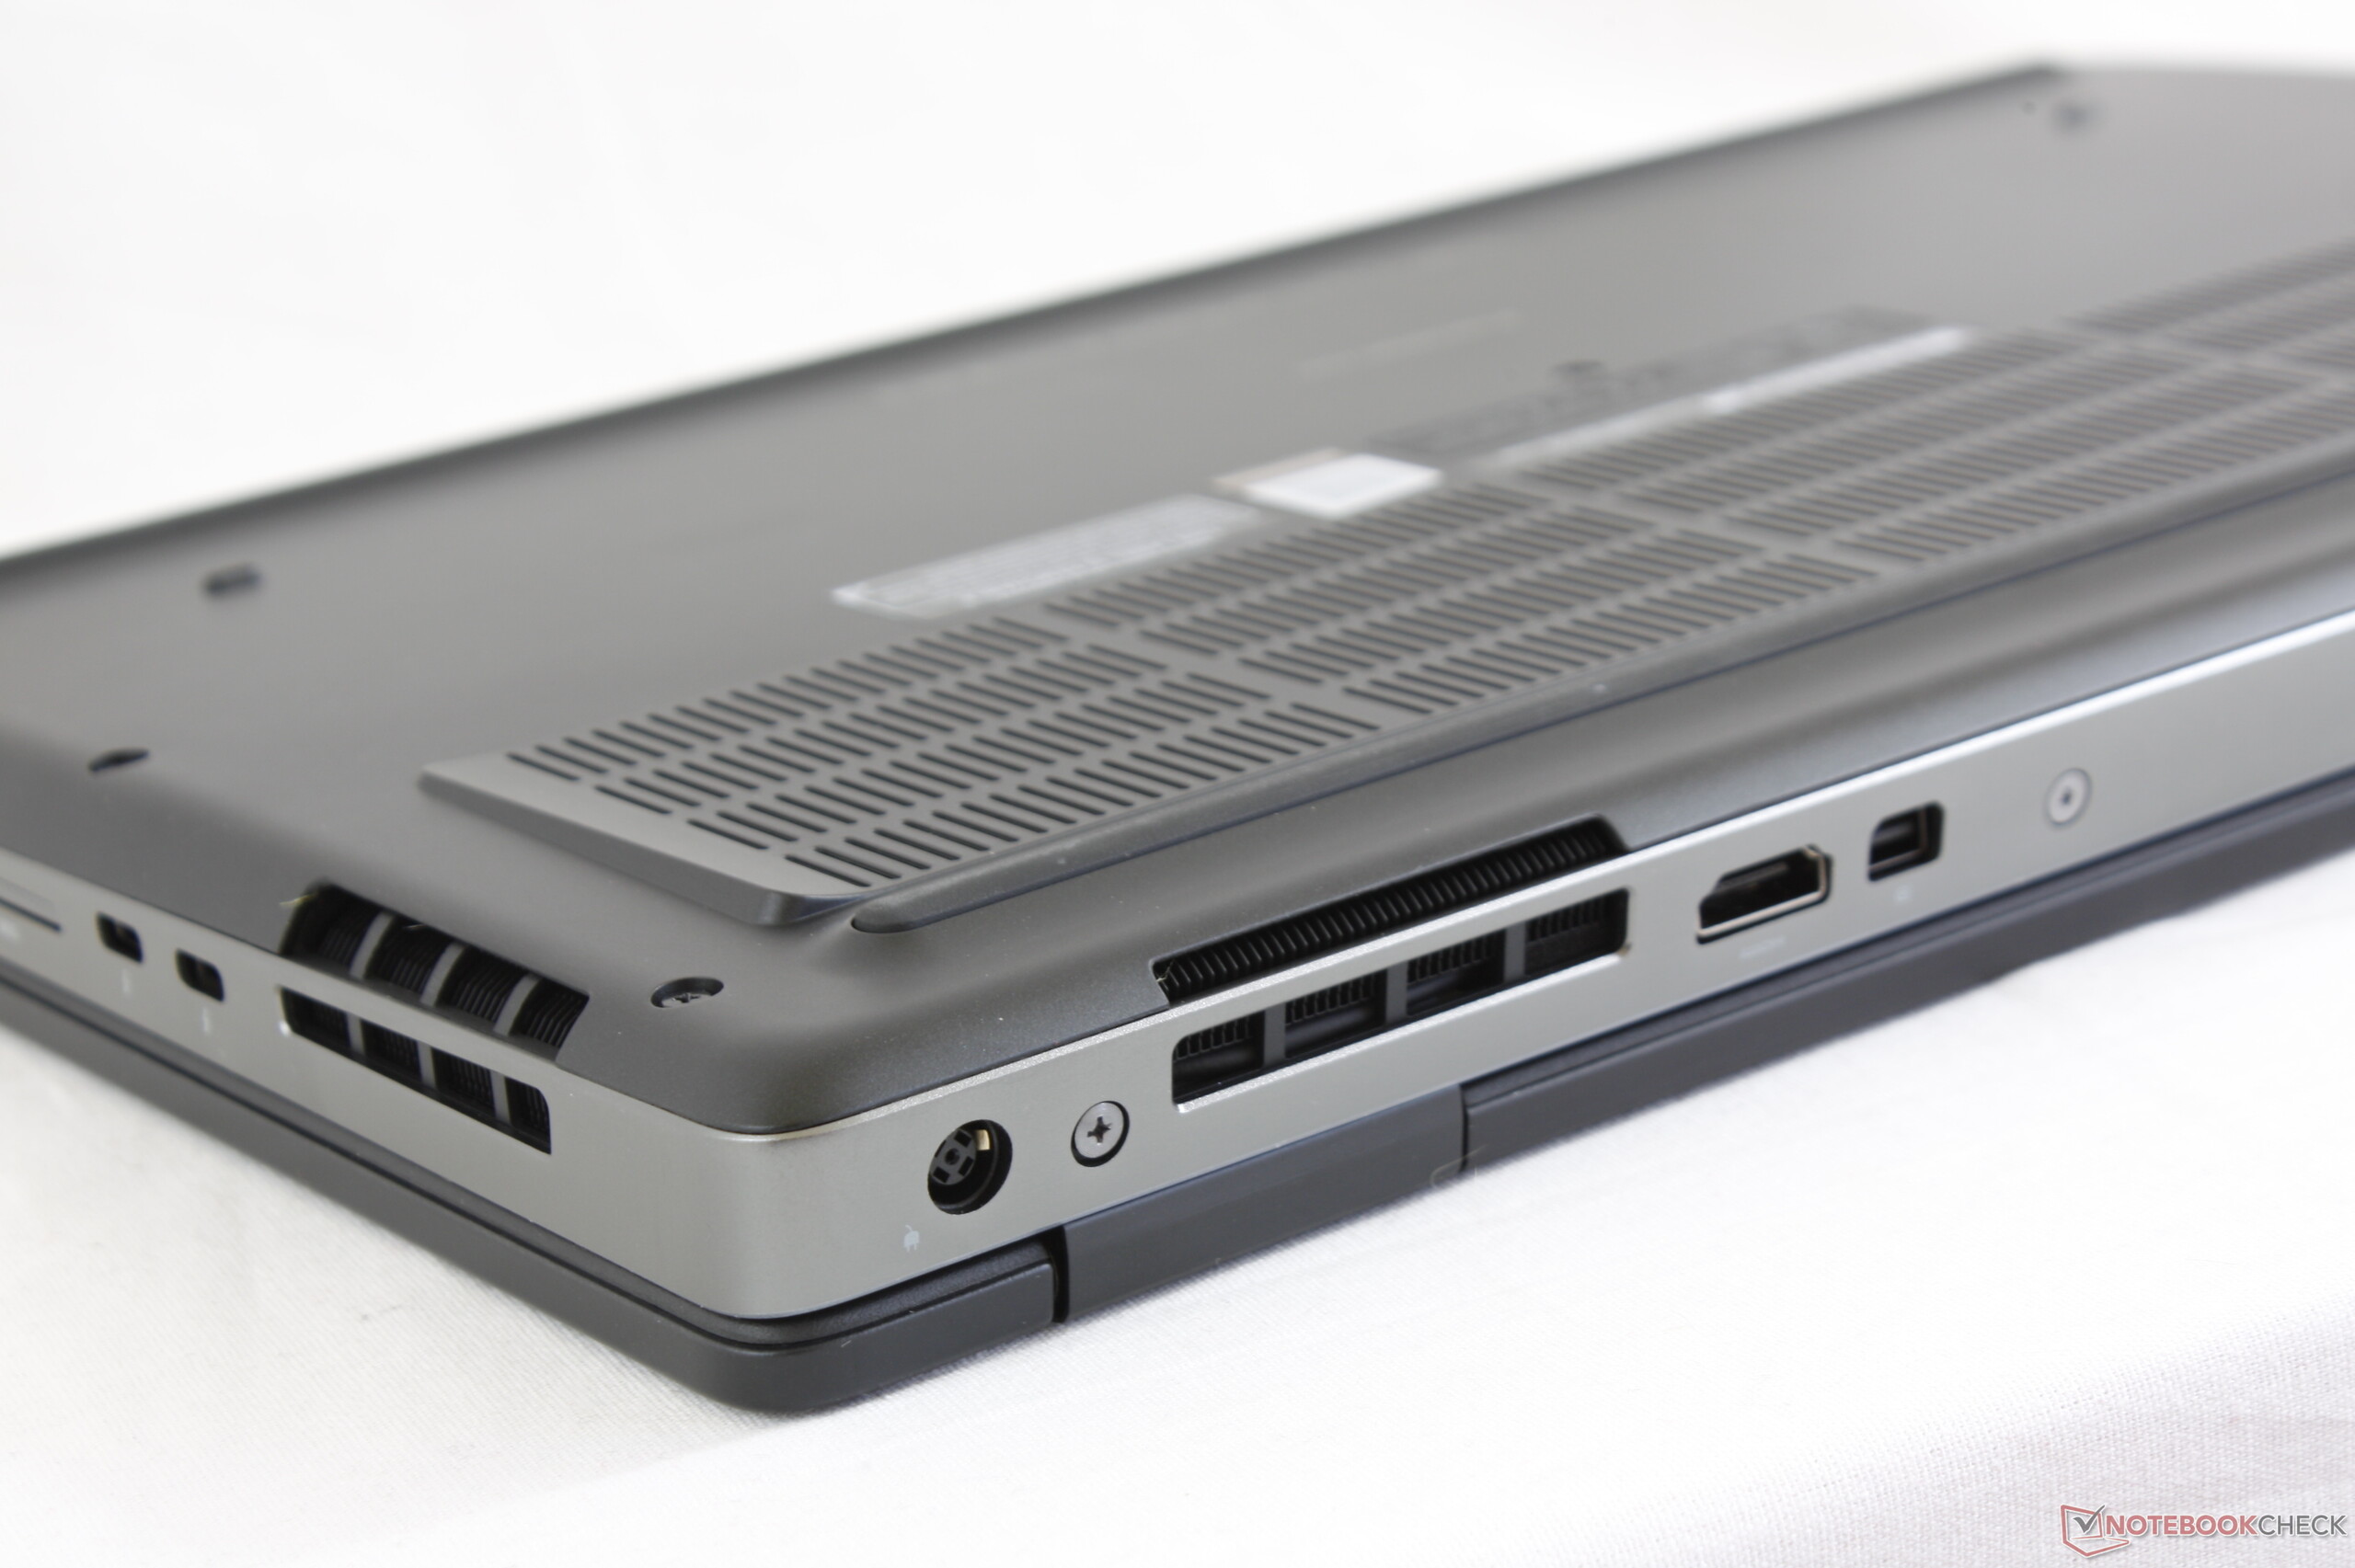
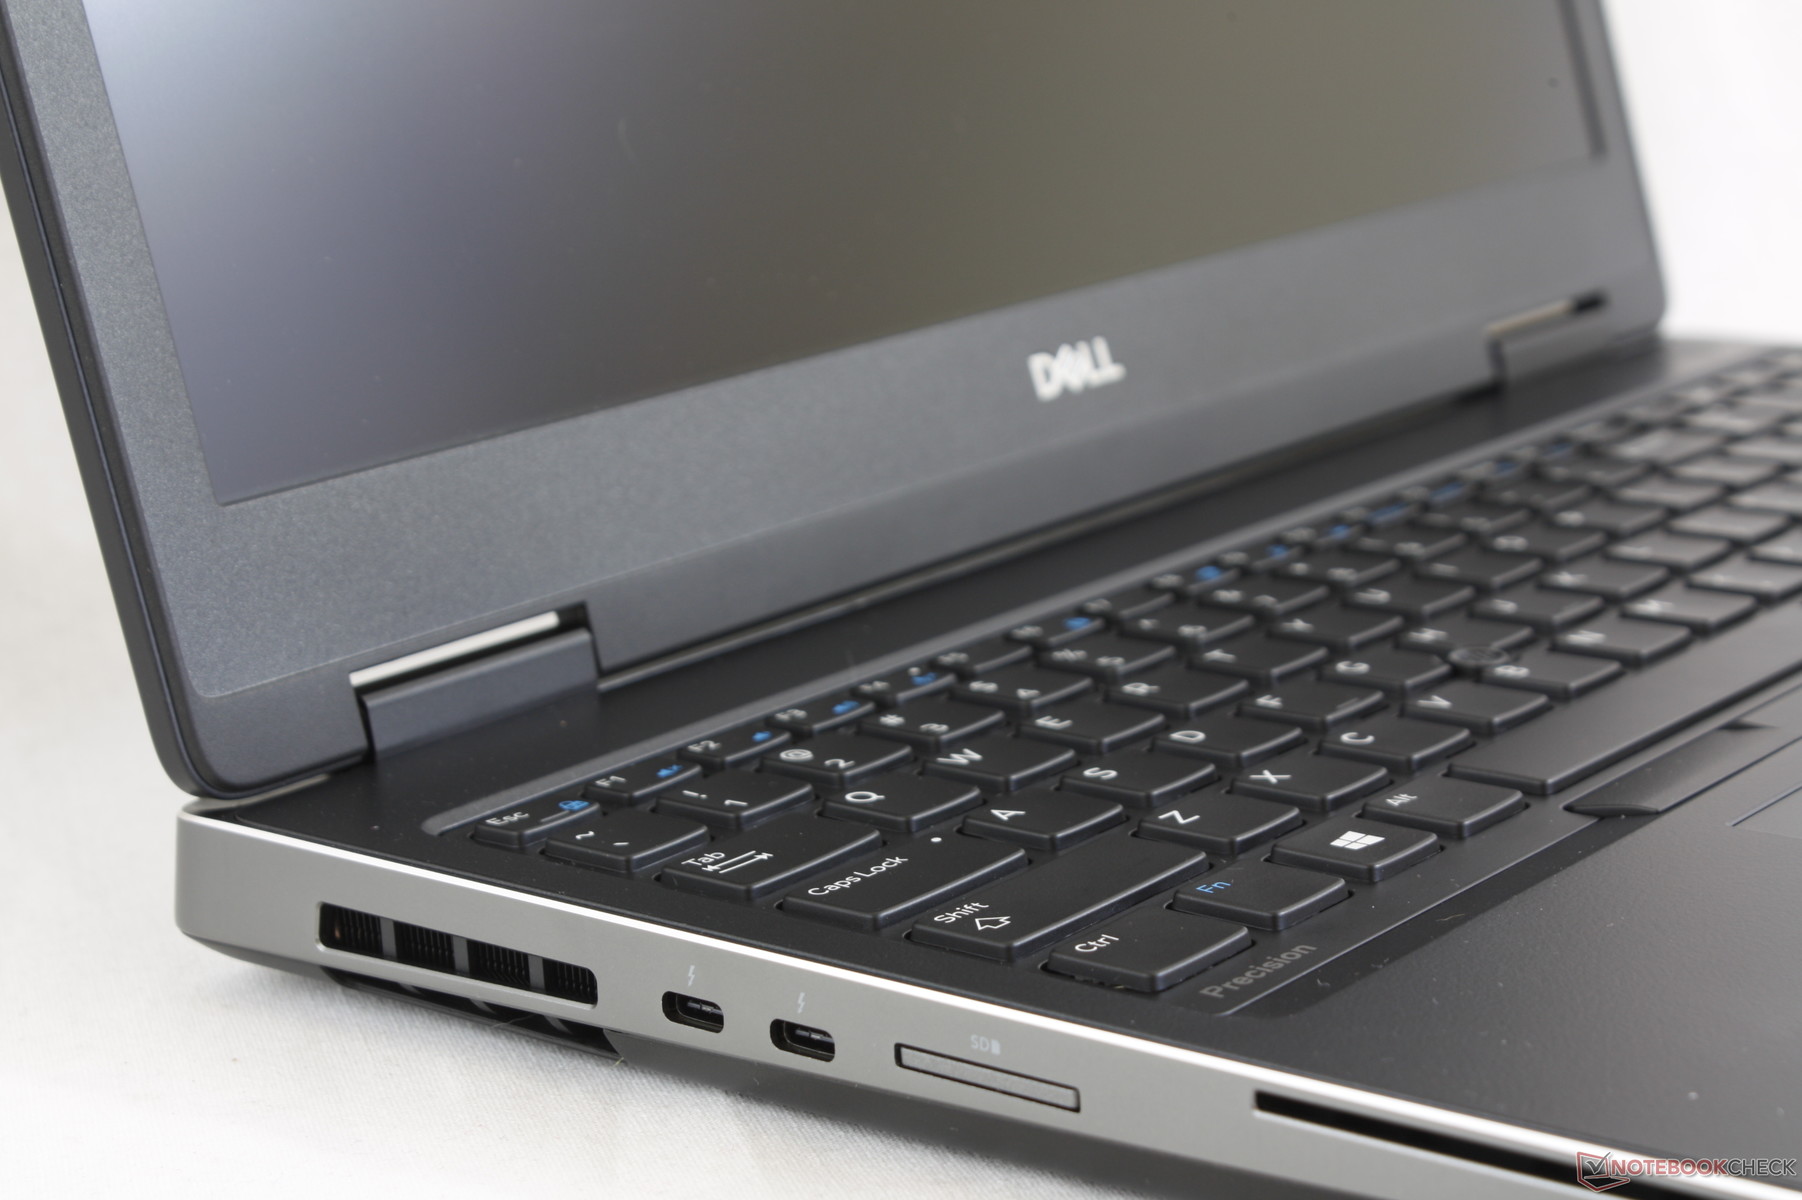
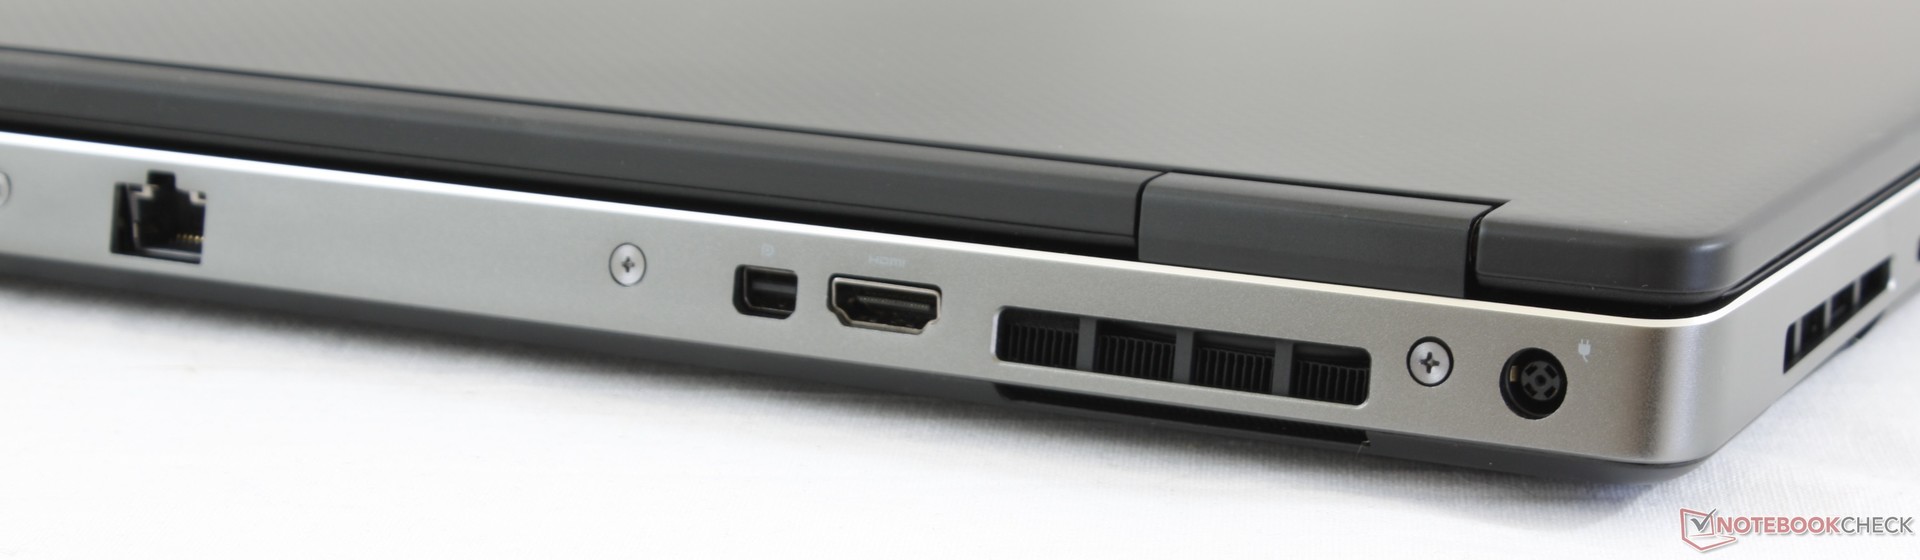
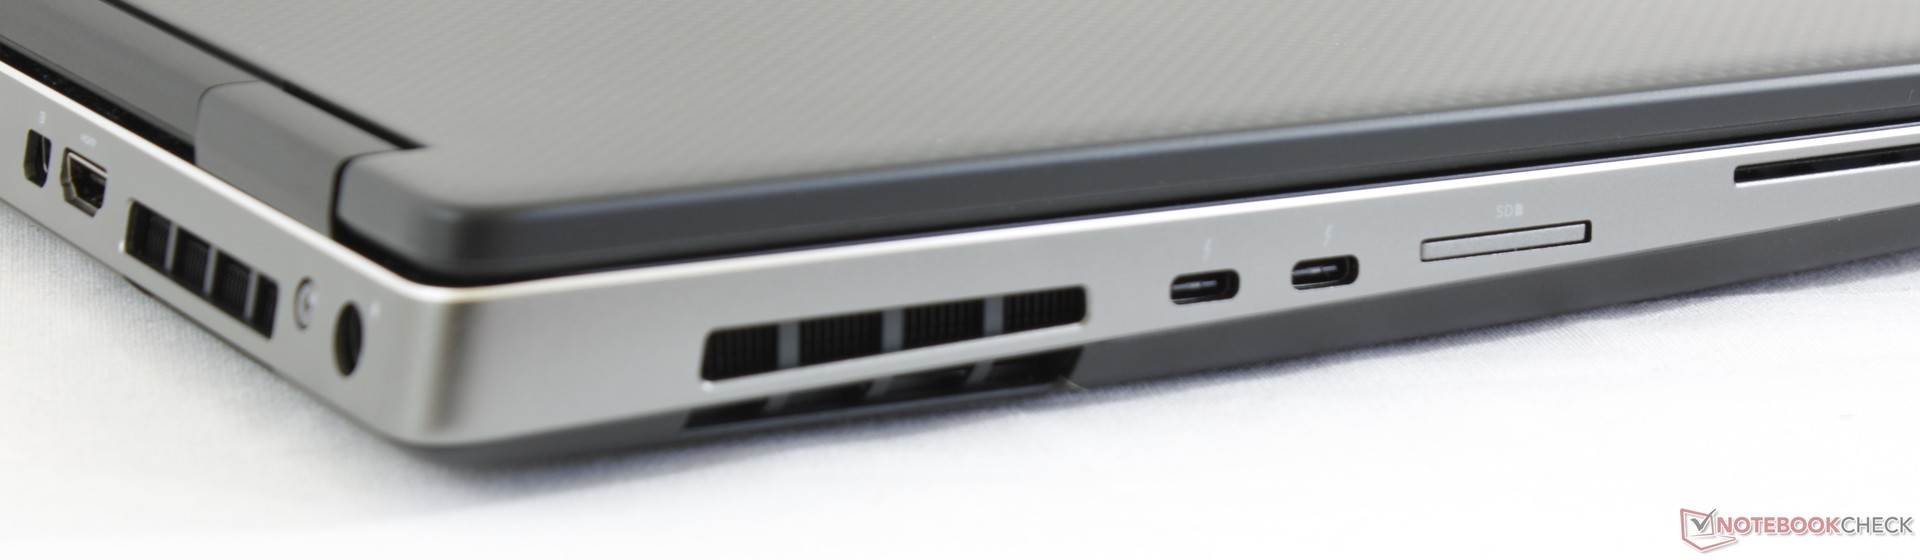
Available ports are a mixed bag. While thinner and lighter workstations like the Precision 5530 or 5530 2-in-1 can get away with fewer ports, thicker and heavier models like our 7530 should carry more options. The 7530 has just two full-size USB ports and both are along the right edge only. The left edge houses dual Thunderbolt 3 ports and so it's clear that Dell is encouraging the use of Thunderbolt 3 docking stations since there is no E-Port or legacy docking pins. We would've preferred additional USB Type-A ports and a more easily accessible SIM slot or even VGA since there is plenty of space along the right and rear edges. The two-year old HP ZBook 15 G3 manages to house three USB Type-A ports and a VGA port in addition to dual Thunderbolt 3.
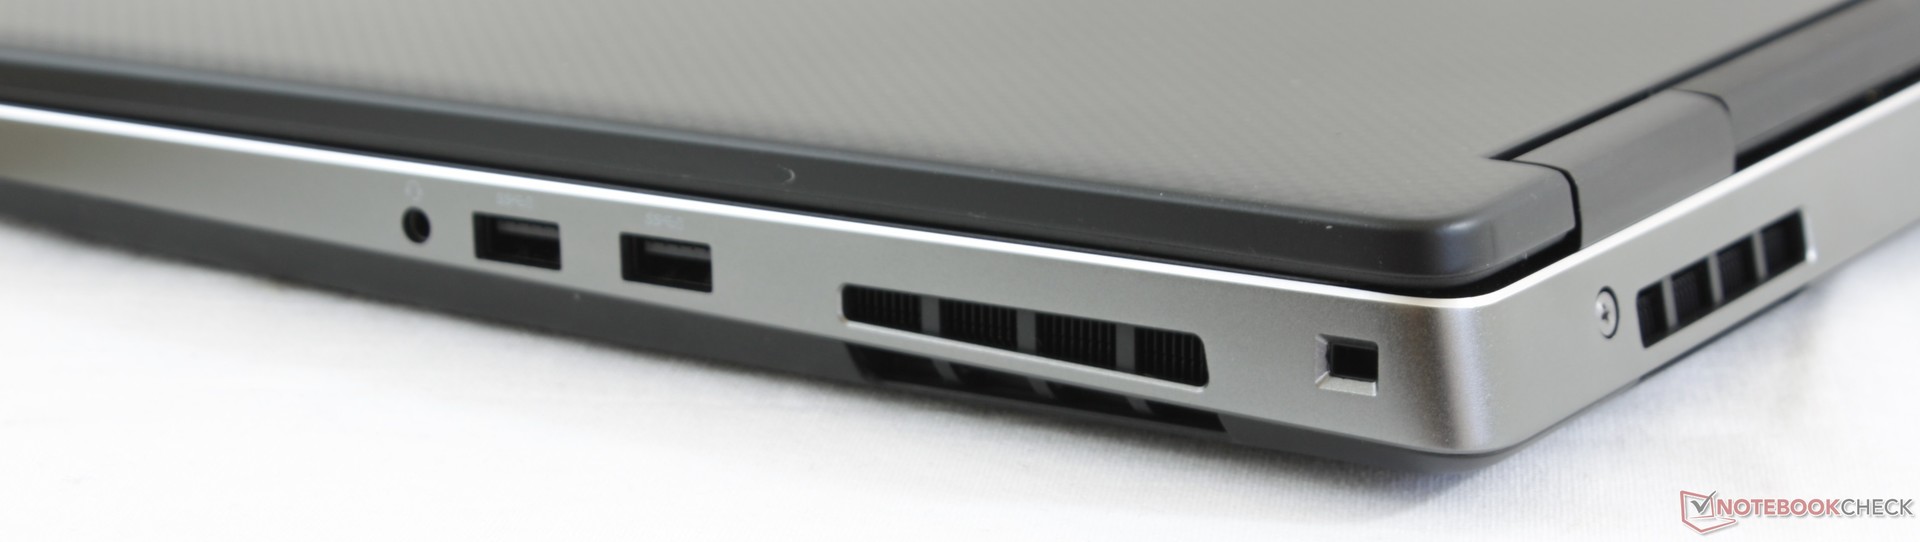
SD Card Reader
The spring-loaded SD card reader is fast with sequential read rates approaching 200 MB/s on our UHS-II test card. It's not quite as fast as the card reader on the Gigabyte Aero 15X, but it's still comparable to other XPS and Precision laptops. Transferring 1 GB worth of images from card to desktop takes about 5.5 seconds.
A fully inserted SD card sits flush against the edge for safe transporting.
| SD Card Reader | |
| average JPG Copy Test (av. of 3 runs) | |
| Dell Precision 7530 (Toshiba Exceria Pro SDXC 64 GB UHS-II) | |
| Gigabyte Aero 15X v8 (Toshiba Exceria Pro SDXC 64 GB UHS-II) | |
| Dell Precision 3530 (Toshiba Exceria Pro SDXC 64 GB UHS-II) | |
| Lenovo ThinkPad P1-20MD002LUS (Toshiba Exceria Pro SDXC 64 GB UHS-II) | |
| Dell Precision 5530 2-in-1 (Toshiba Exceria Pro M501 UHS-II) | |
| maximum AS SSD Seq Read Test (1GB) | |
| Gigabyte Aero 15X v8 (Toshiba Exceria Pro SDXC 64 GB UHS-II) | |
| Lenovo ThinkPad P1-20MD002LUS (Toshiba Exceria Pro SDXC 64 GB UHS-II) | |
| Dell Precision 5530 2-in-1 (Toshiba Exceria Pro M501 UHS-II) | |
| Dell Precision 3530 (Toshiba Exceria Pro SDXC 64 GB UHS-II) | |
| Dell Precision 7530 (Toshiba Exceria Pro SDXC 64 GB UHS-II) | |
Communication
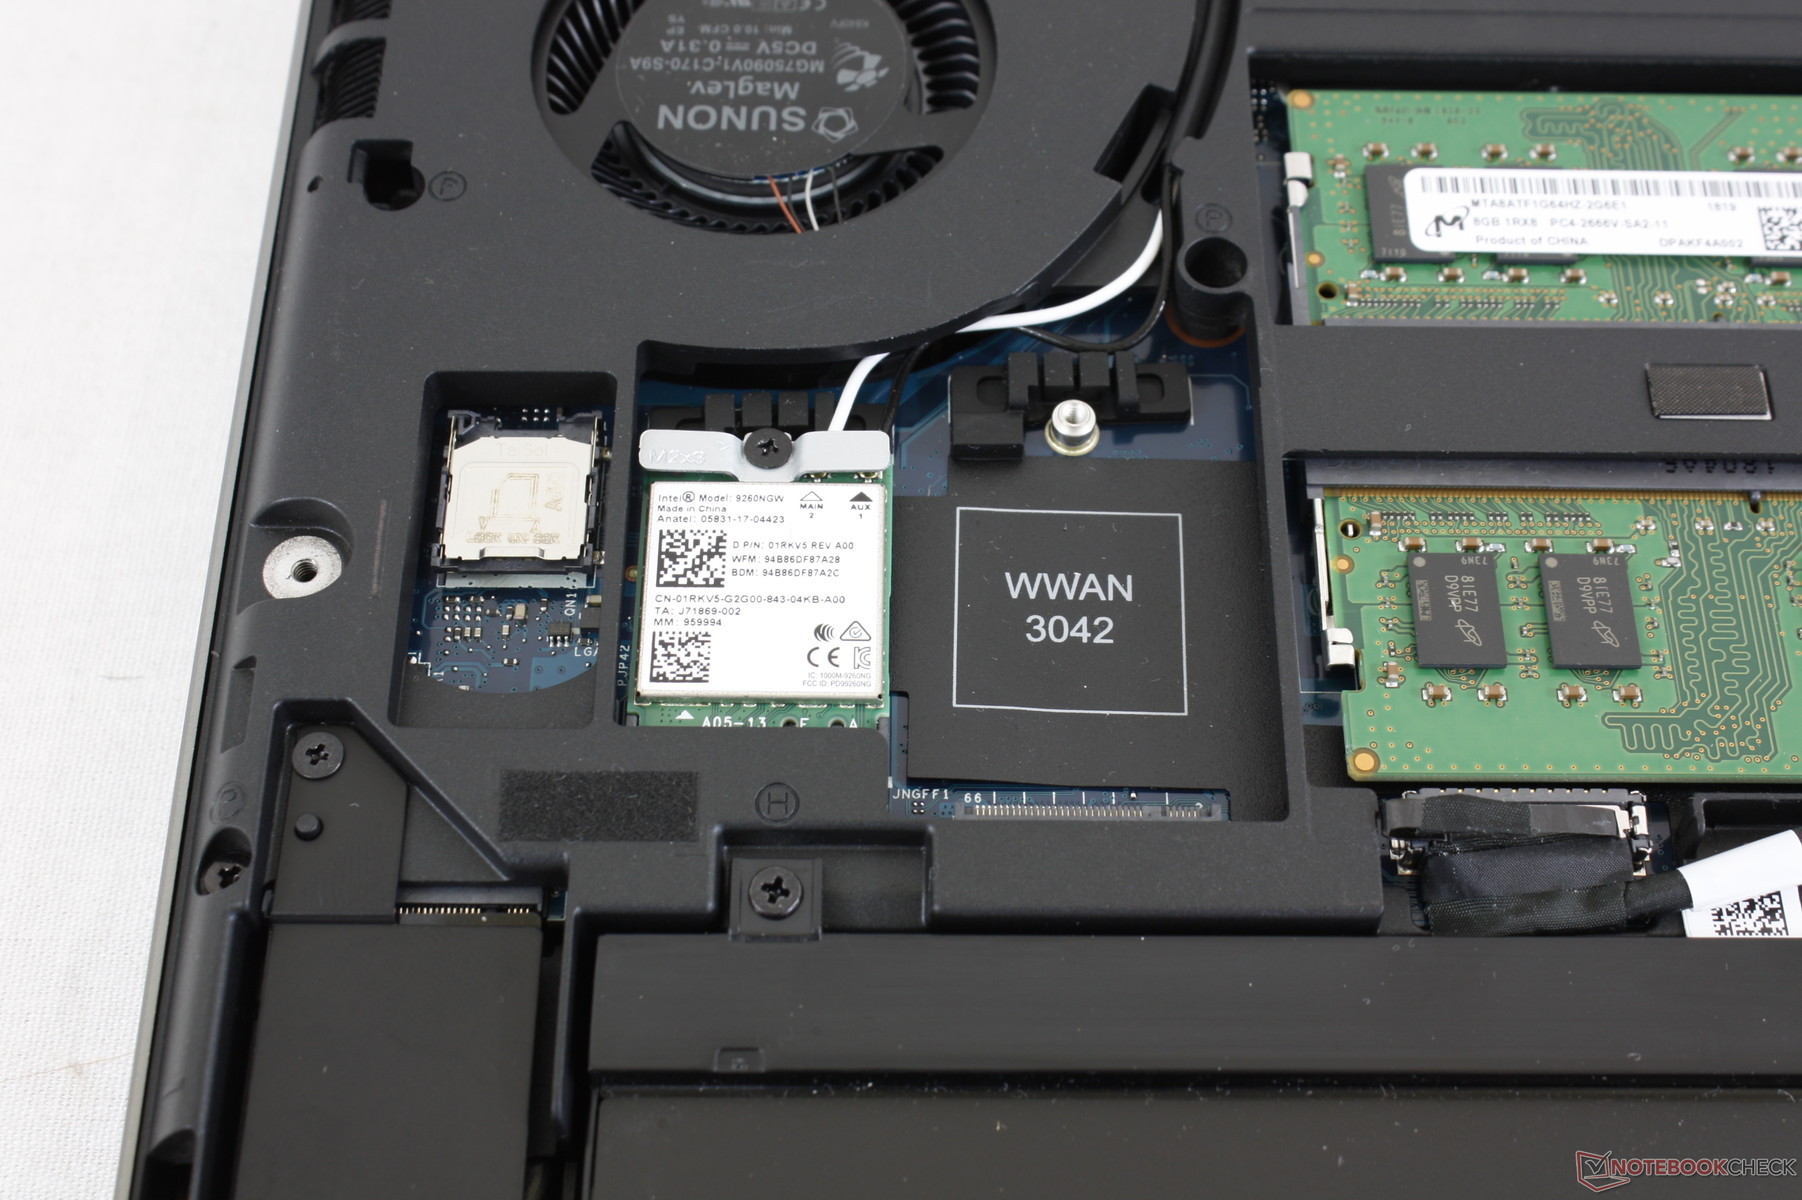
The Intel 9260 comes standard across all SKUs whereas older models shipped with the slower Intel 8260 or 8265. While our test setup is limited by a 1 Gbps line, the wireless module is capable of transfer rates of up to 1.73 Gbps. We experienced no connection issues during our time the unit.
Mobile broadband is available in certain SKUs with the Qualcomm Snapdragon X7 LTE module for Verizon, Sprint, or AT&T connectivity. If configured, the module would sit adjacent to the WLAN card and SIM slot.
Security
The Noble Lock comes standard with optional fingerprint reader and vPro. On the software side, Dell includes Data Guardian, Client Command Suite, and Endpoint Security Suite for protection down to the BIOS level.
Maintenance
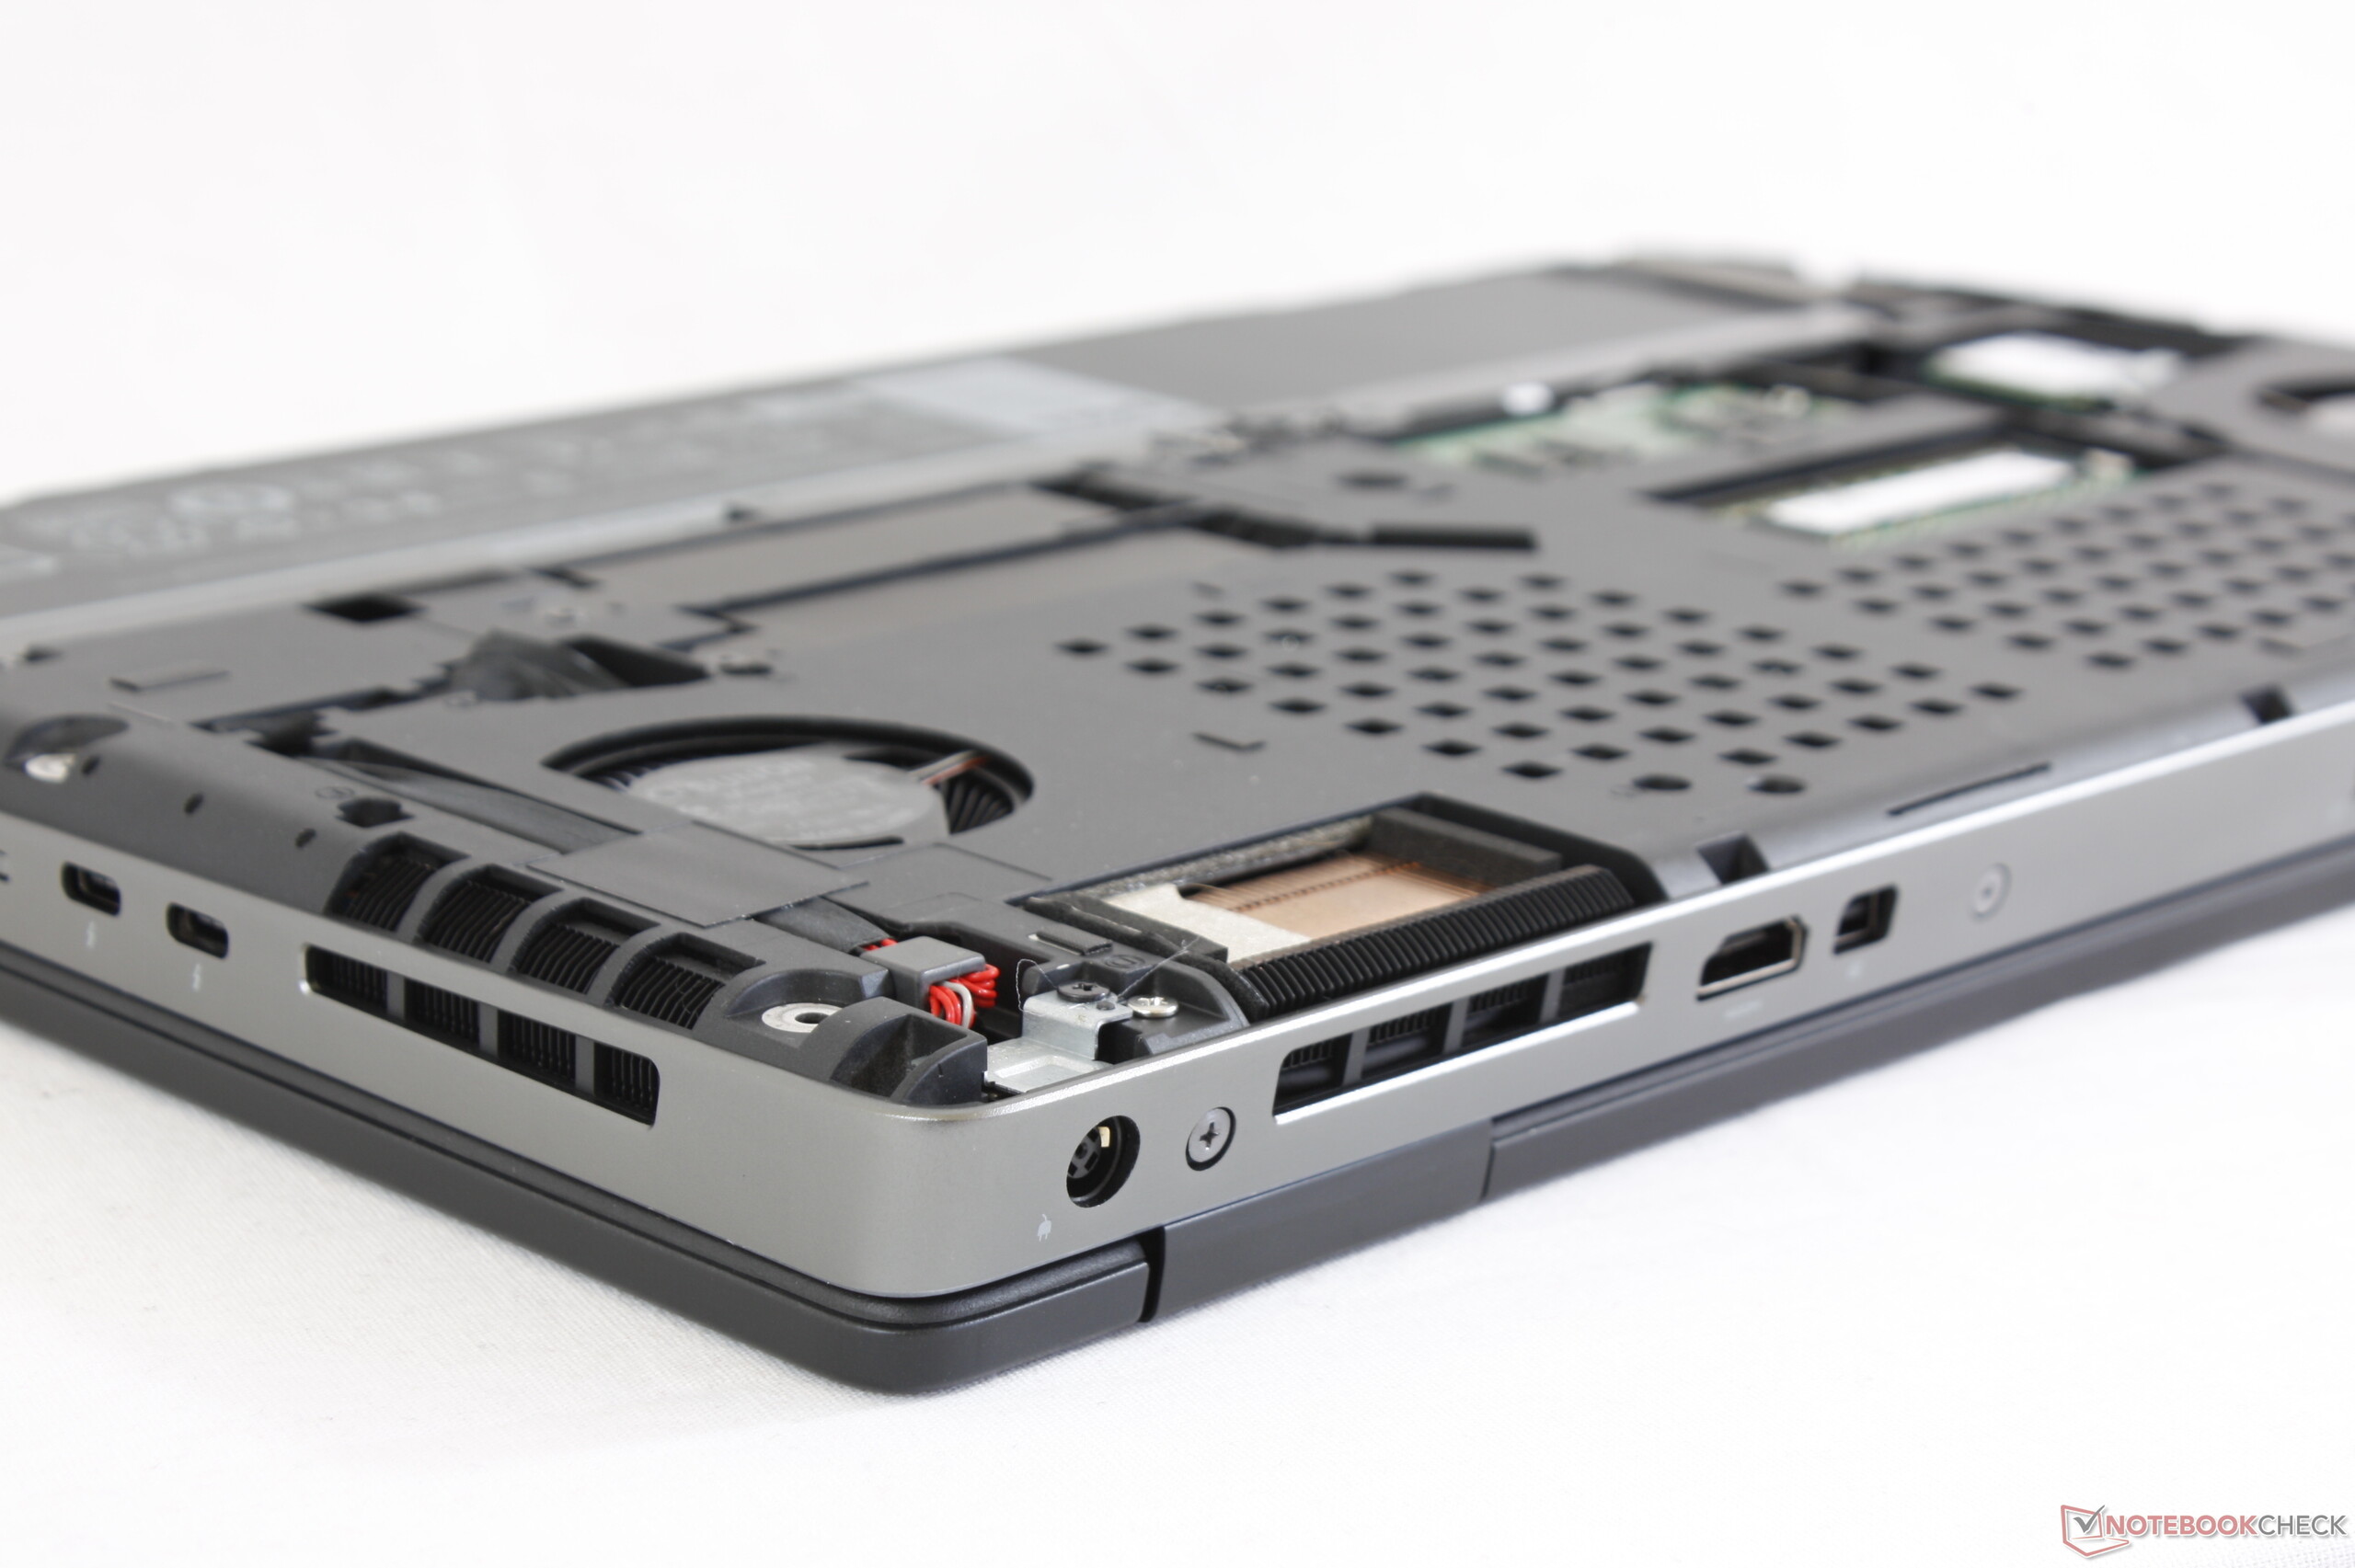
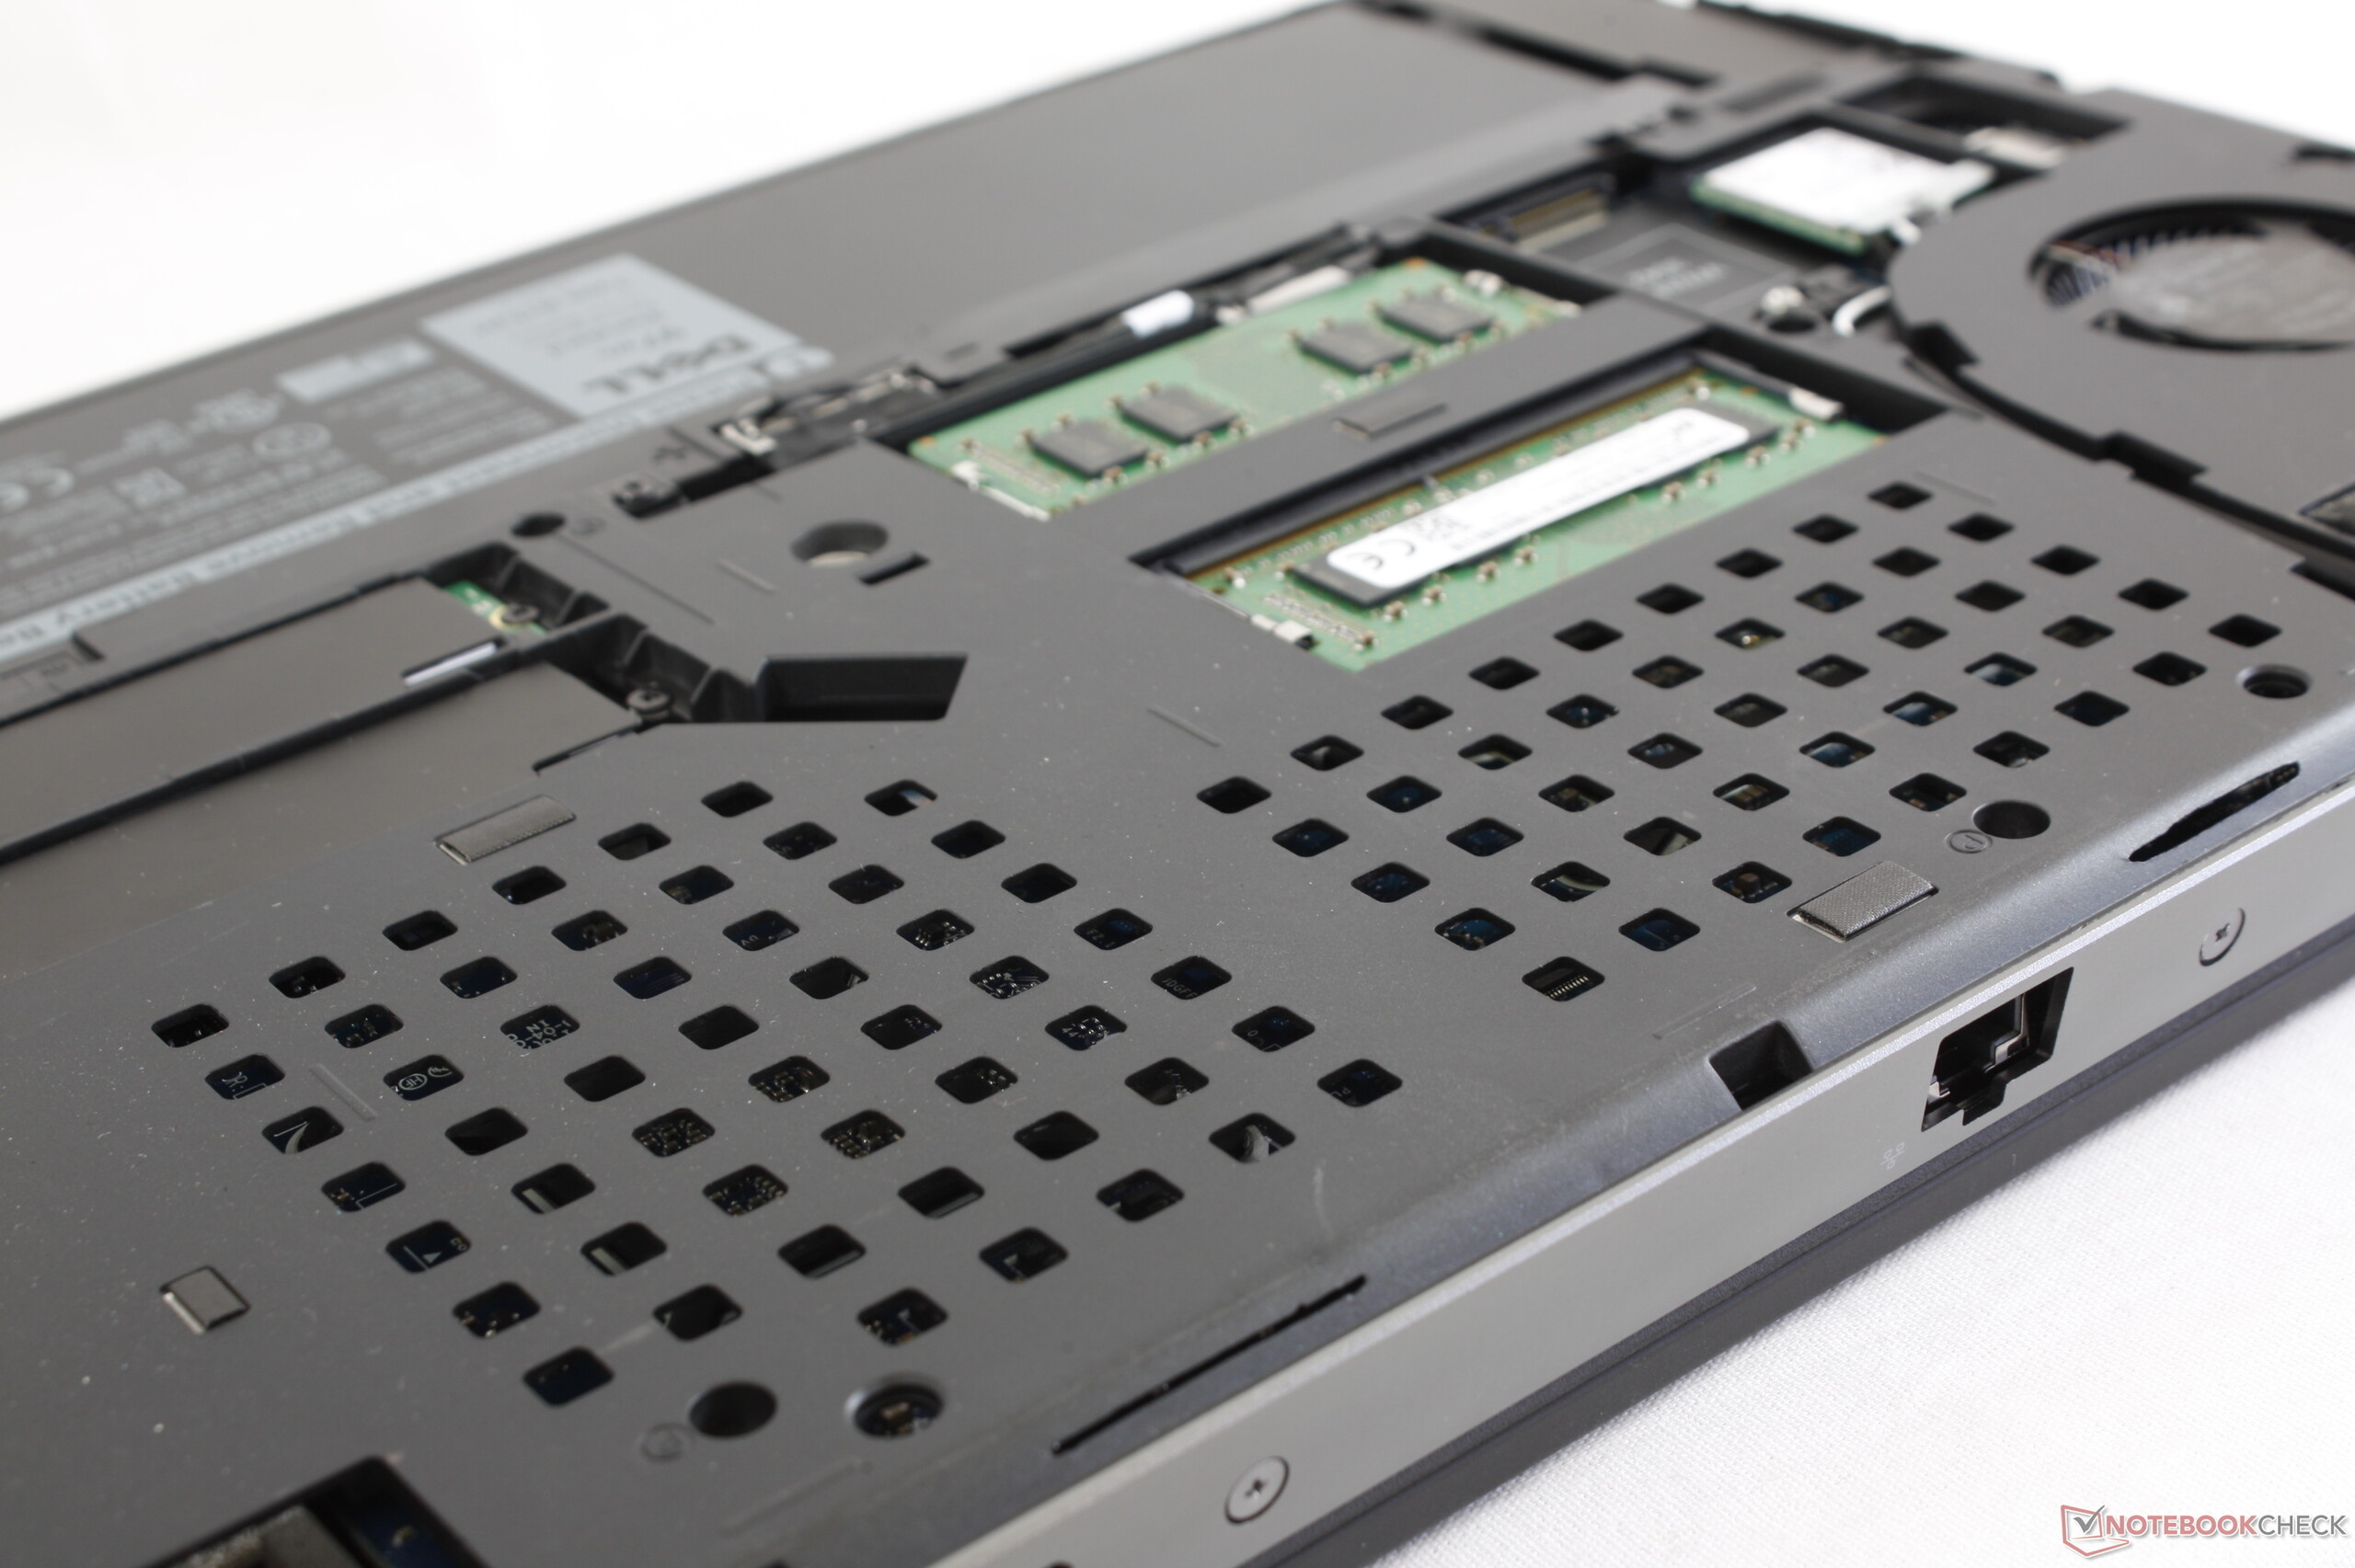
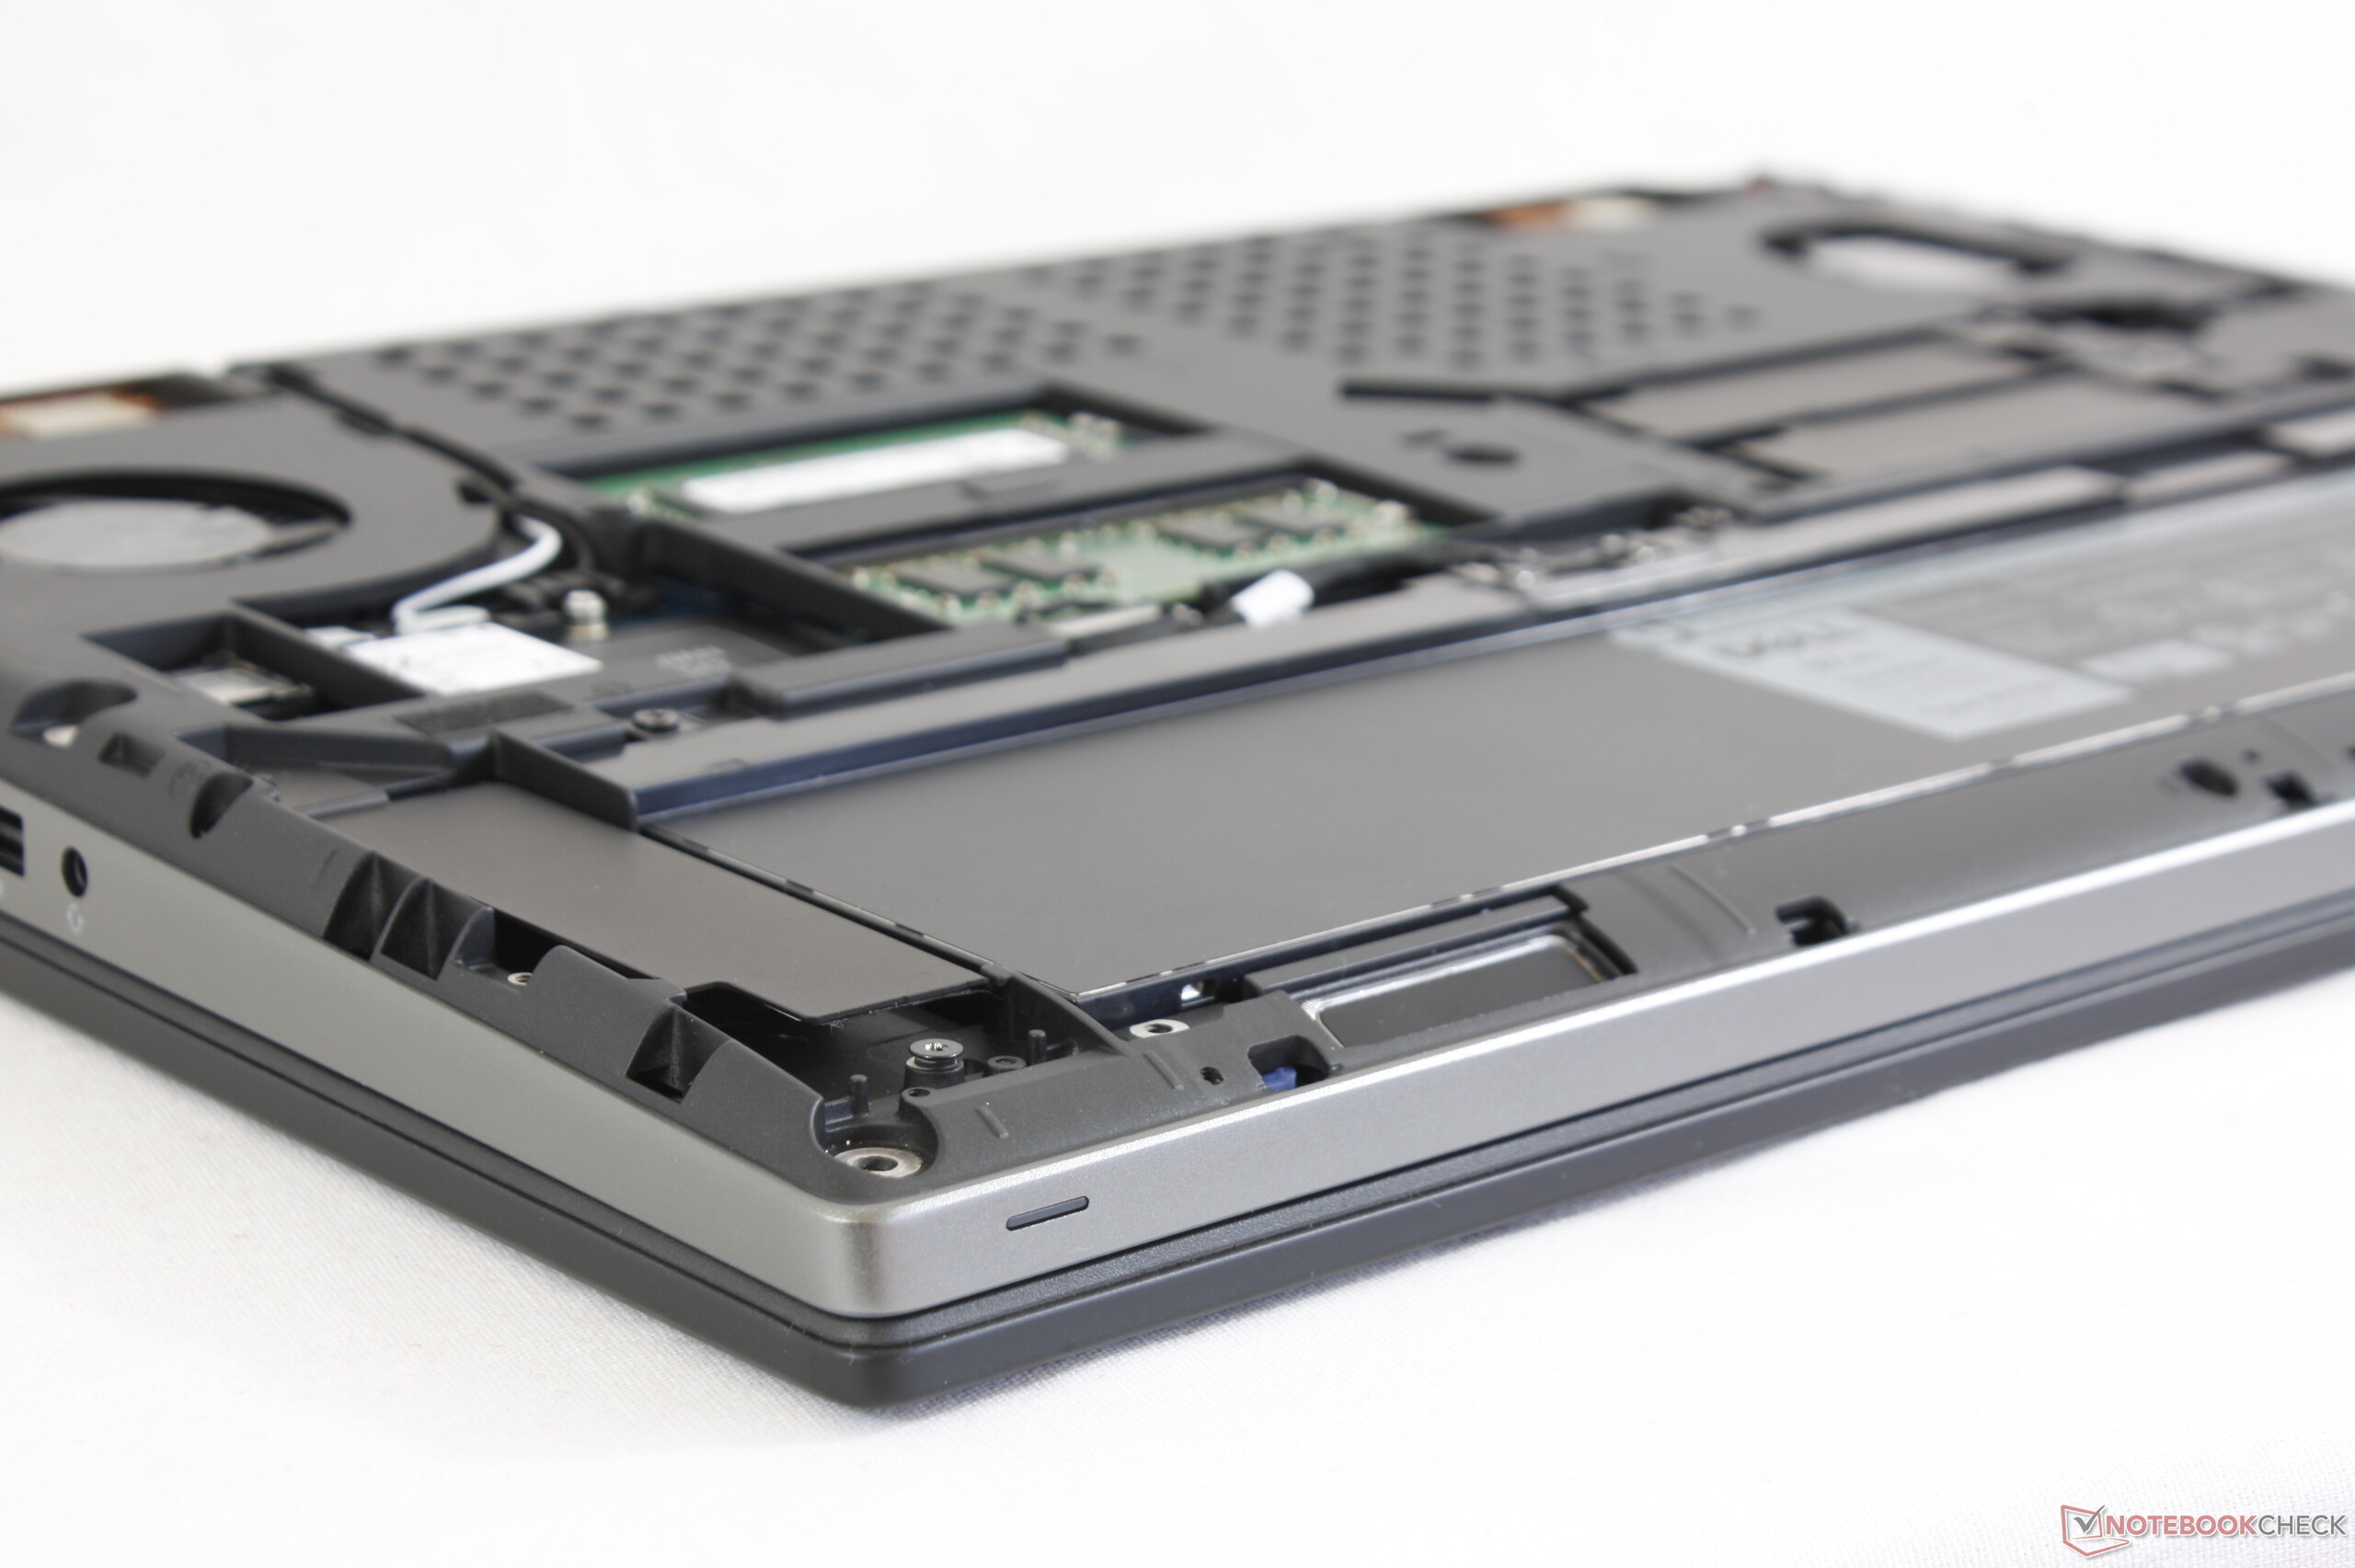
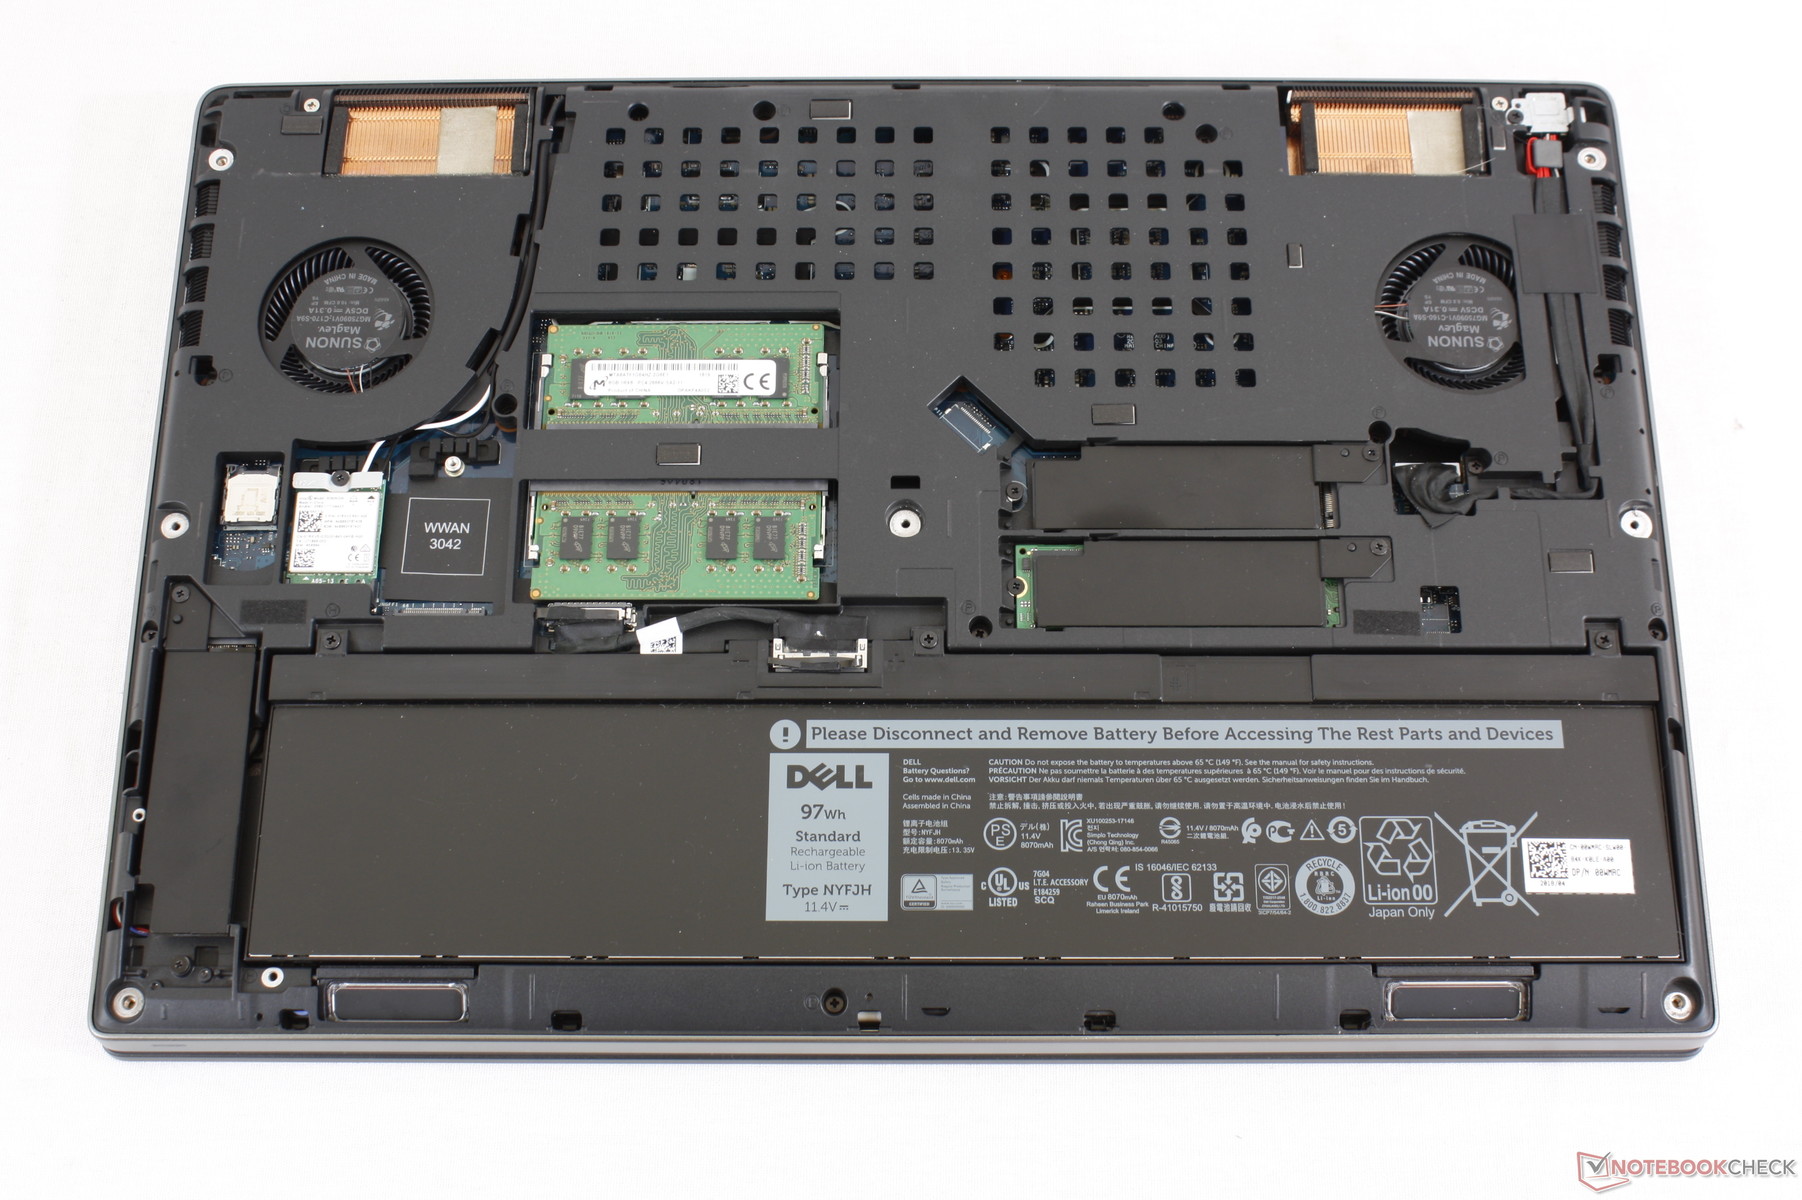
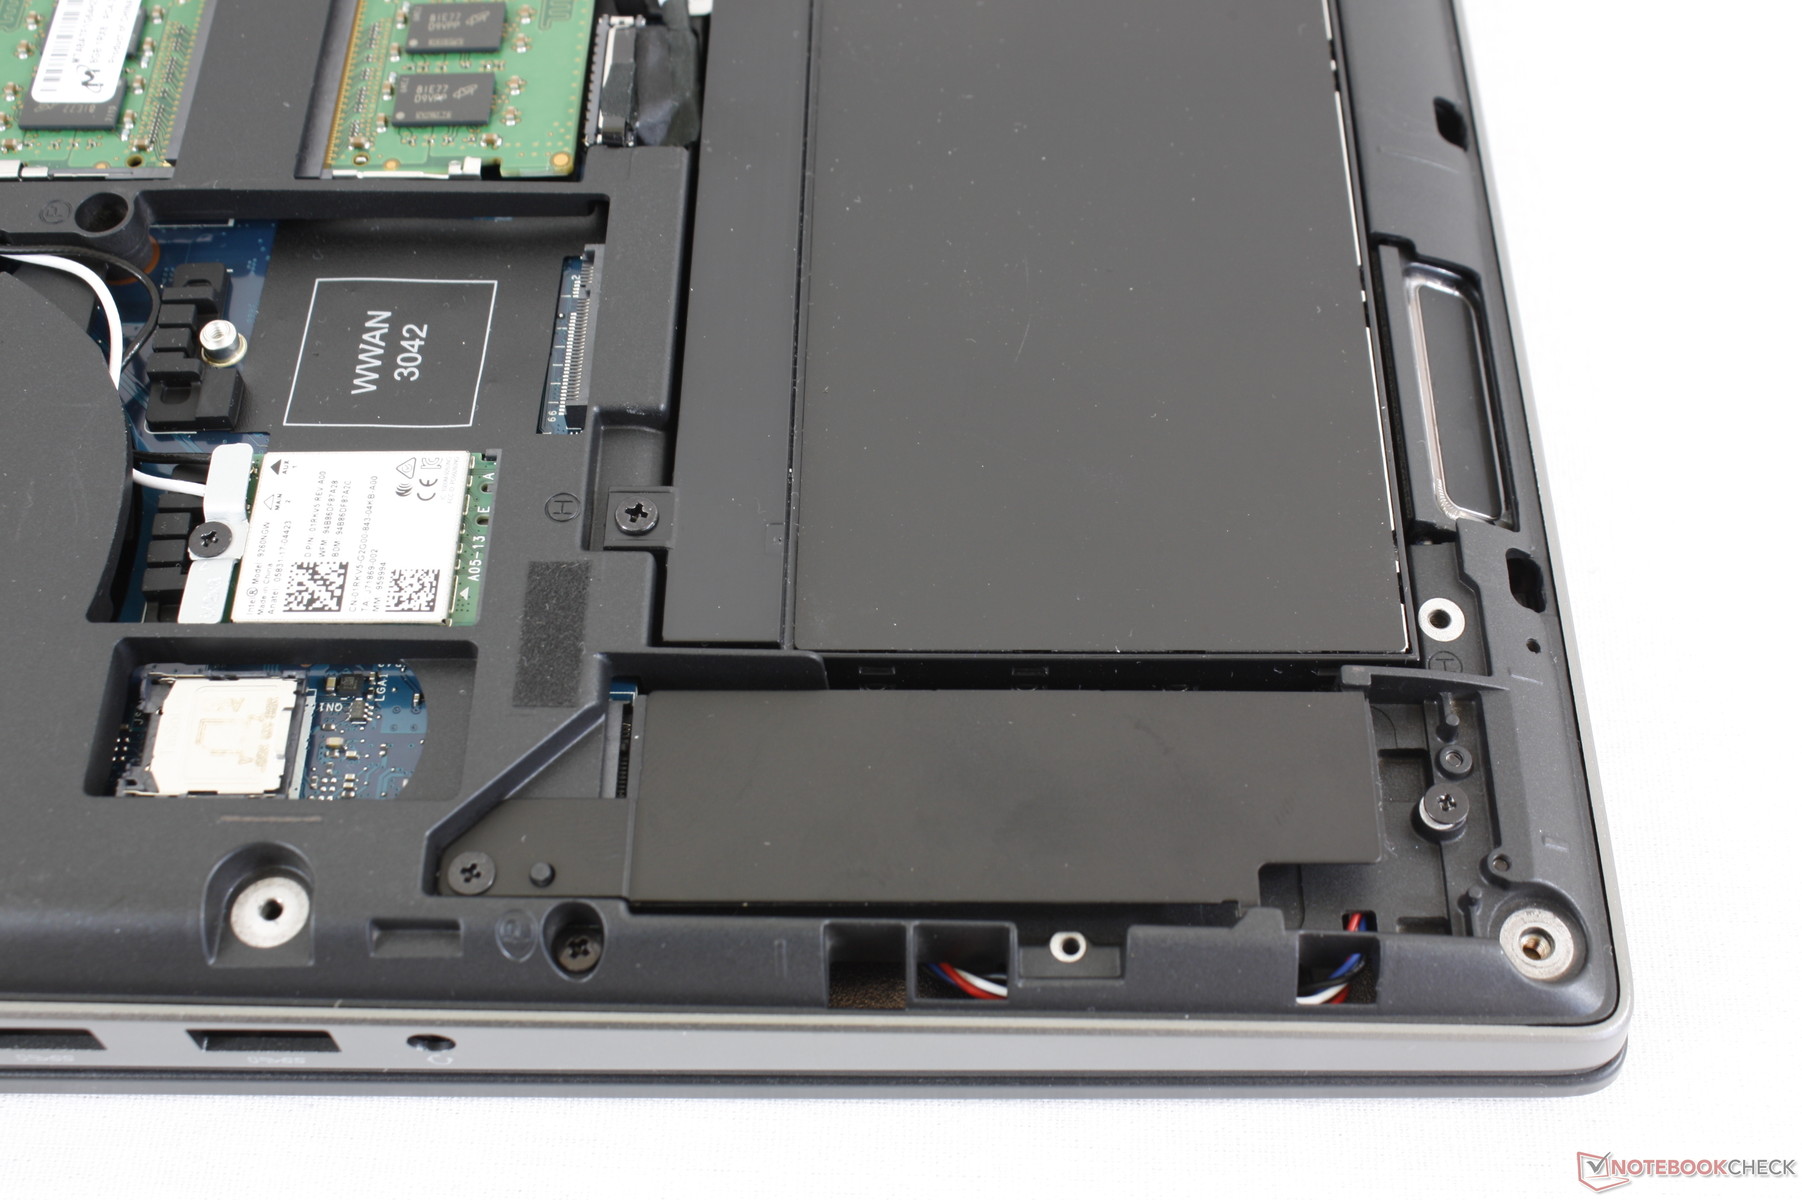
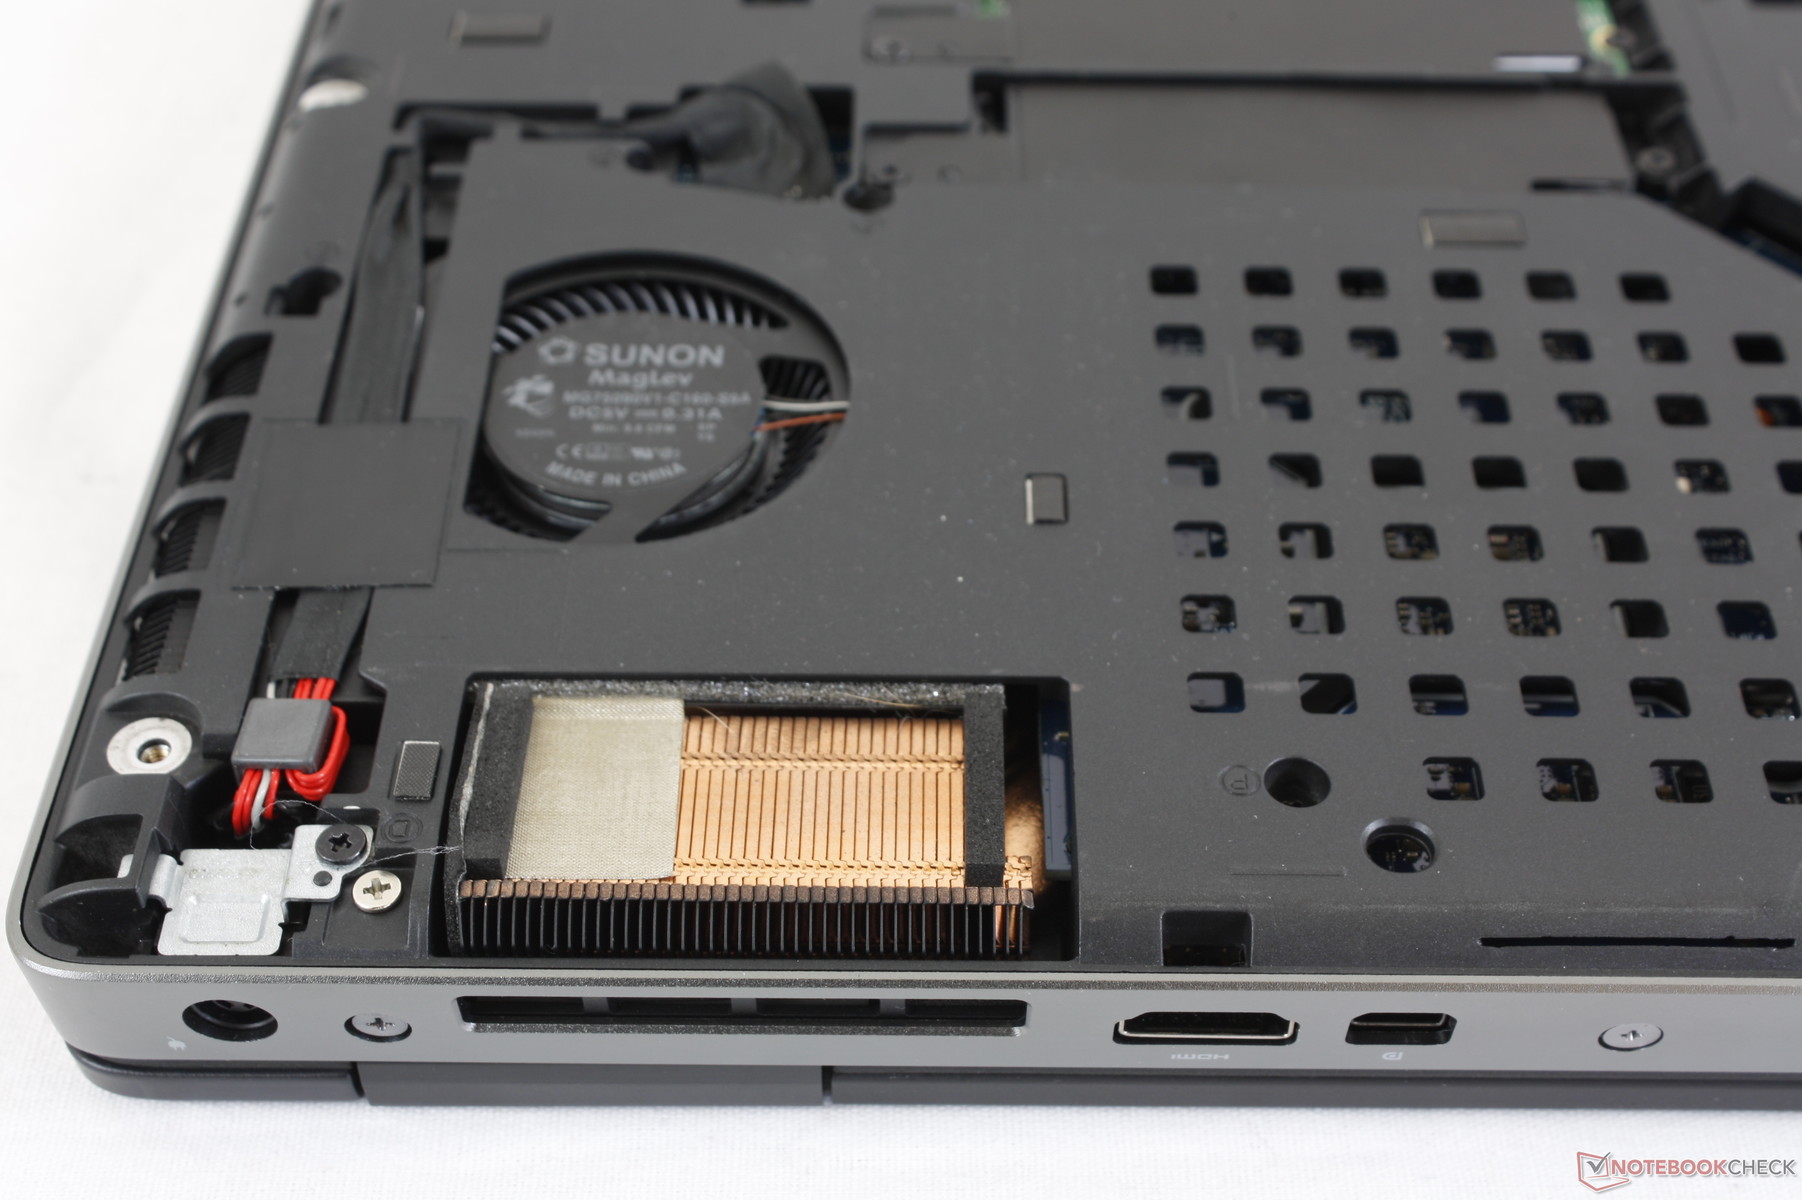
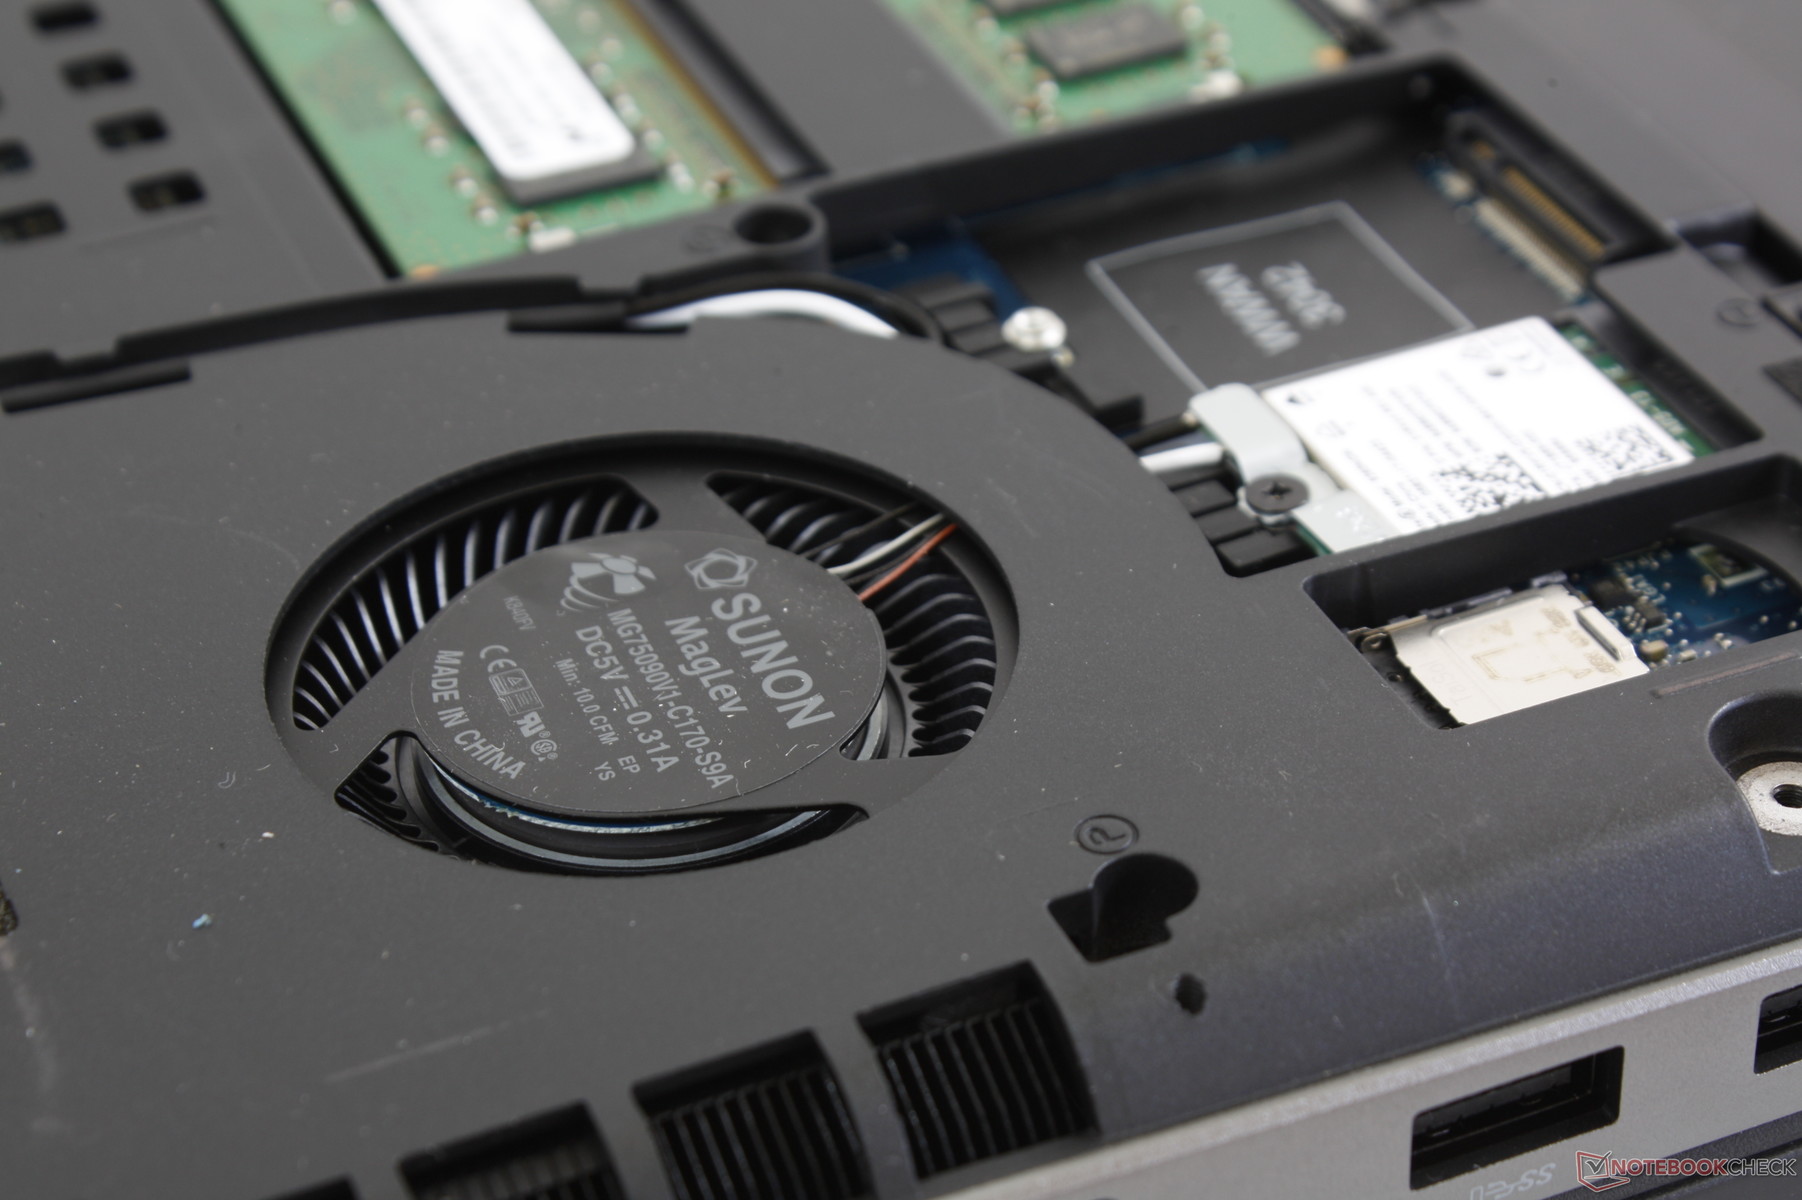
Serviceability requires only a Philips screwdriver. Users get direct access to the system fans, storage bays, SODIMM slots, battery, WWAN slot, WLAN slot, and SIM slot. Our test unit is not compatible with WWAN cards and there are no pre-installed antenna should we want to install one ourselves. The motherboard between the system fans is protected by a firm plate for increased rigidity.
Accessories and Warranty
There are no extras in the box outside of the AC adapter and warranty card. A cleaning cloth or USB-C to VGA adapter would have been nice extras to have.
It's common for businesses to choose Dell for its support and protection services and the Precision 7530 is no different. Dell offers a 36-month limited warranty as standard with extensions of up to five years. Please see our Guarantees, Return policies and Warranties FAQ for country-specific information.
Input Devices
Keyboard
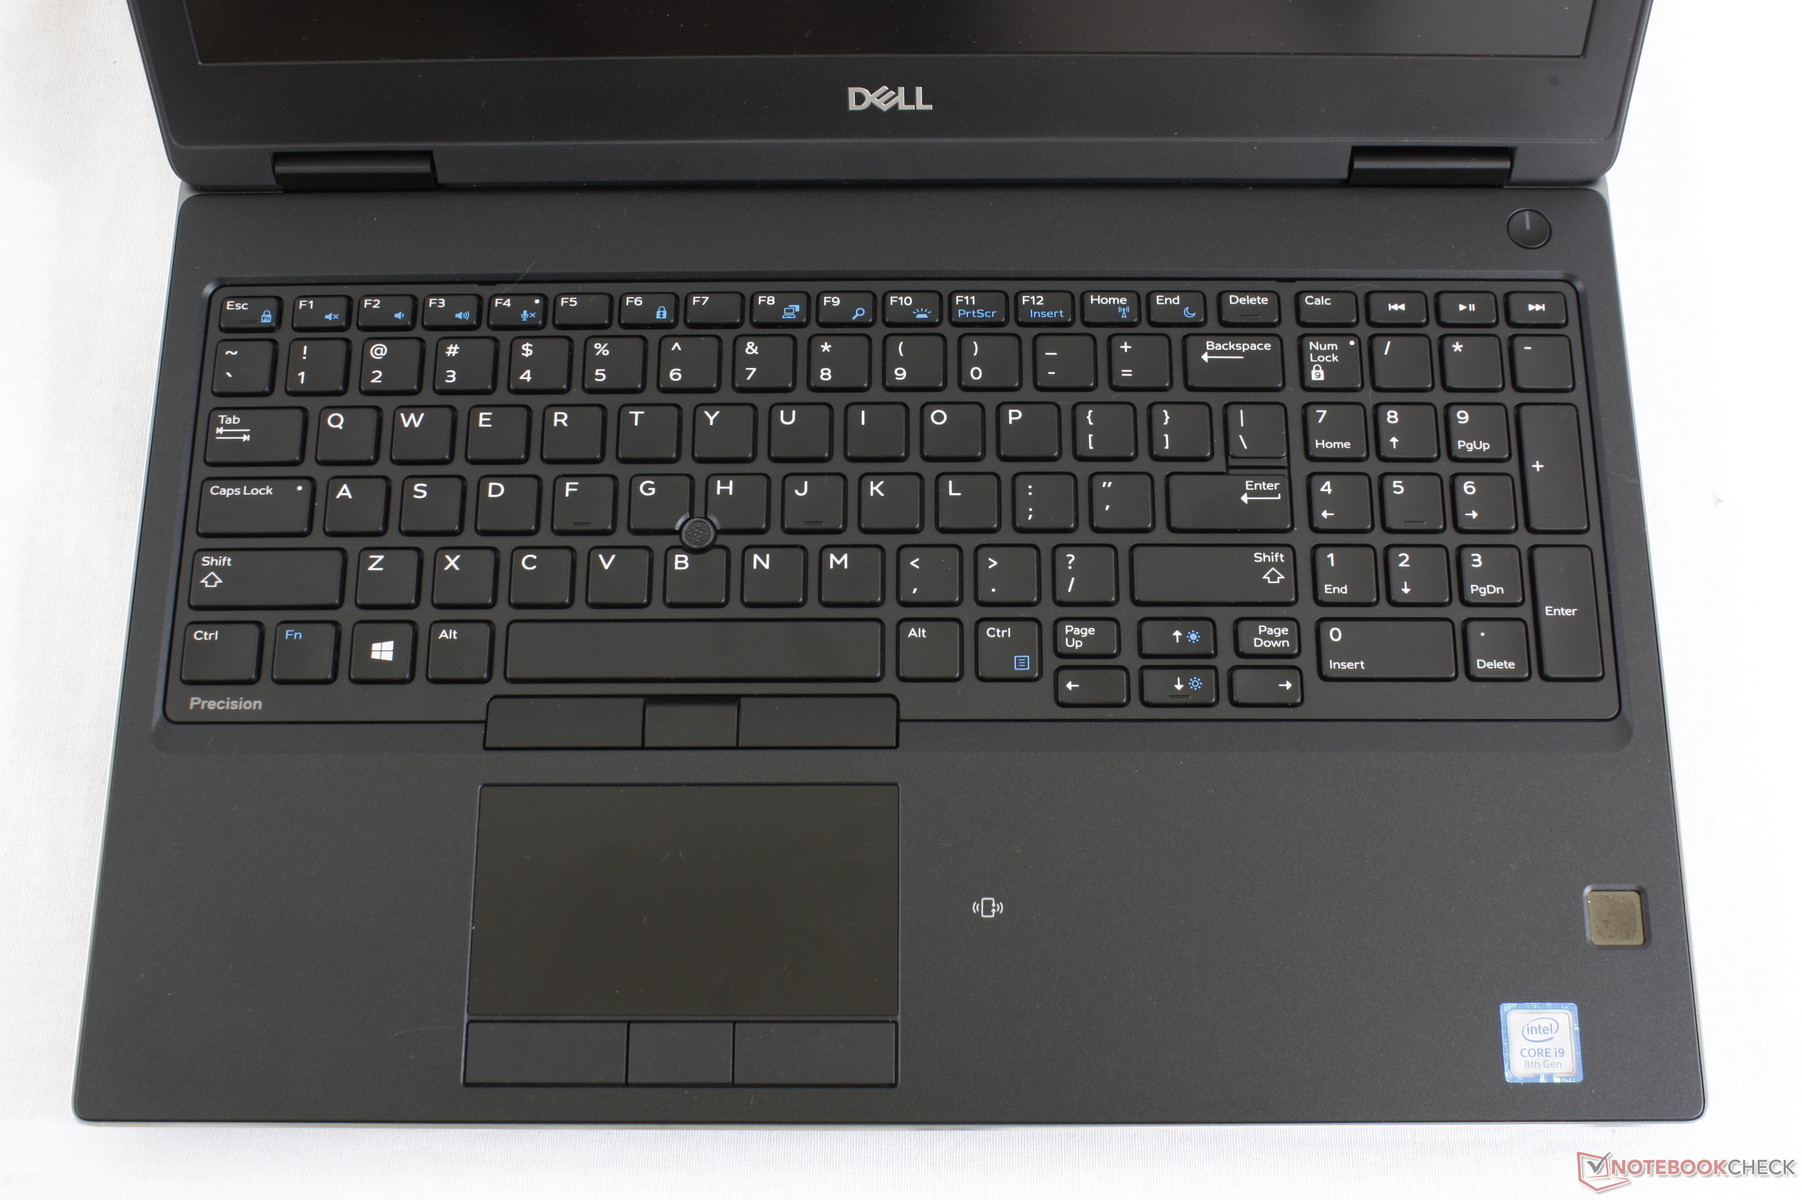
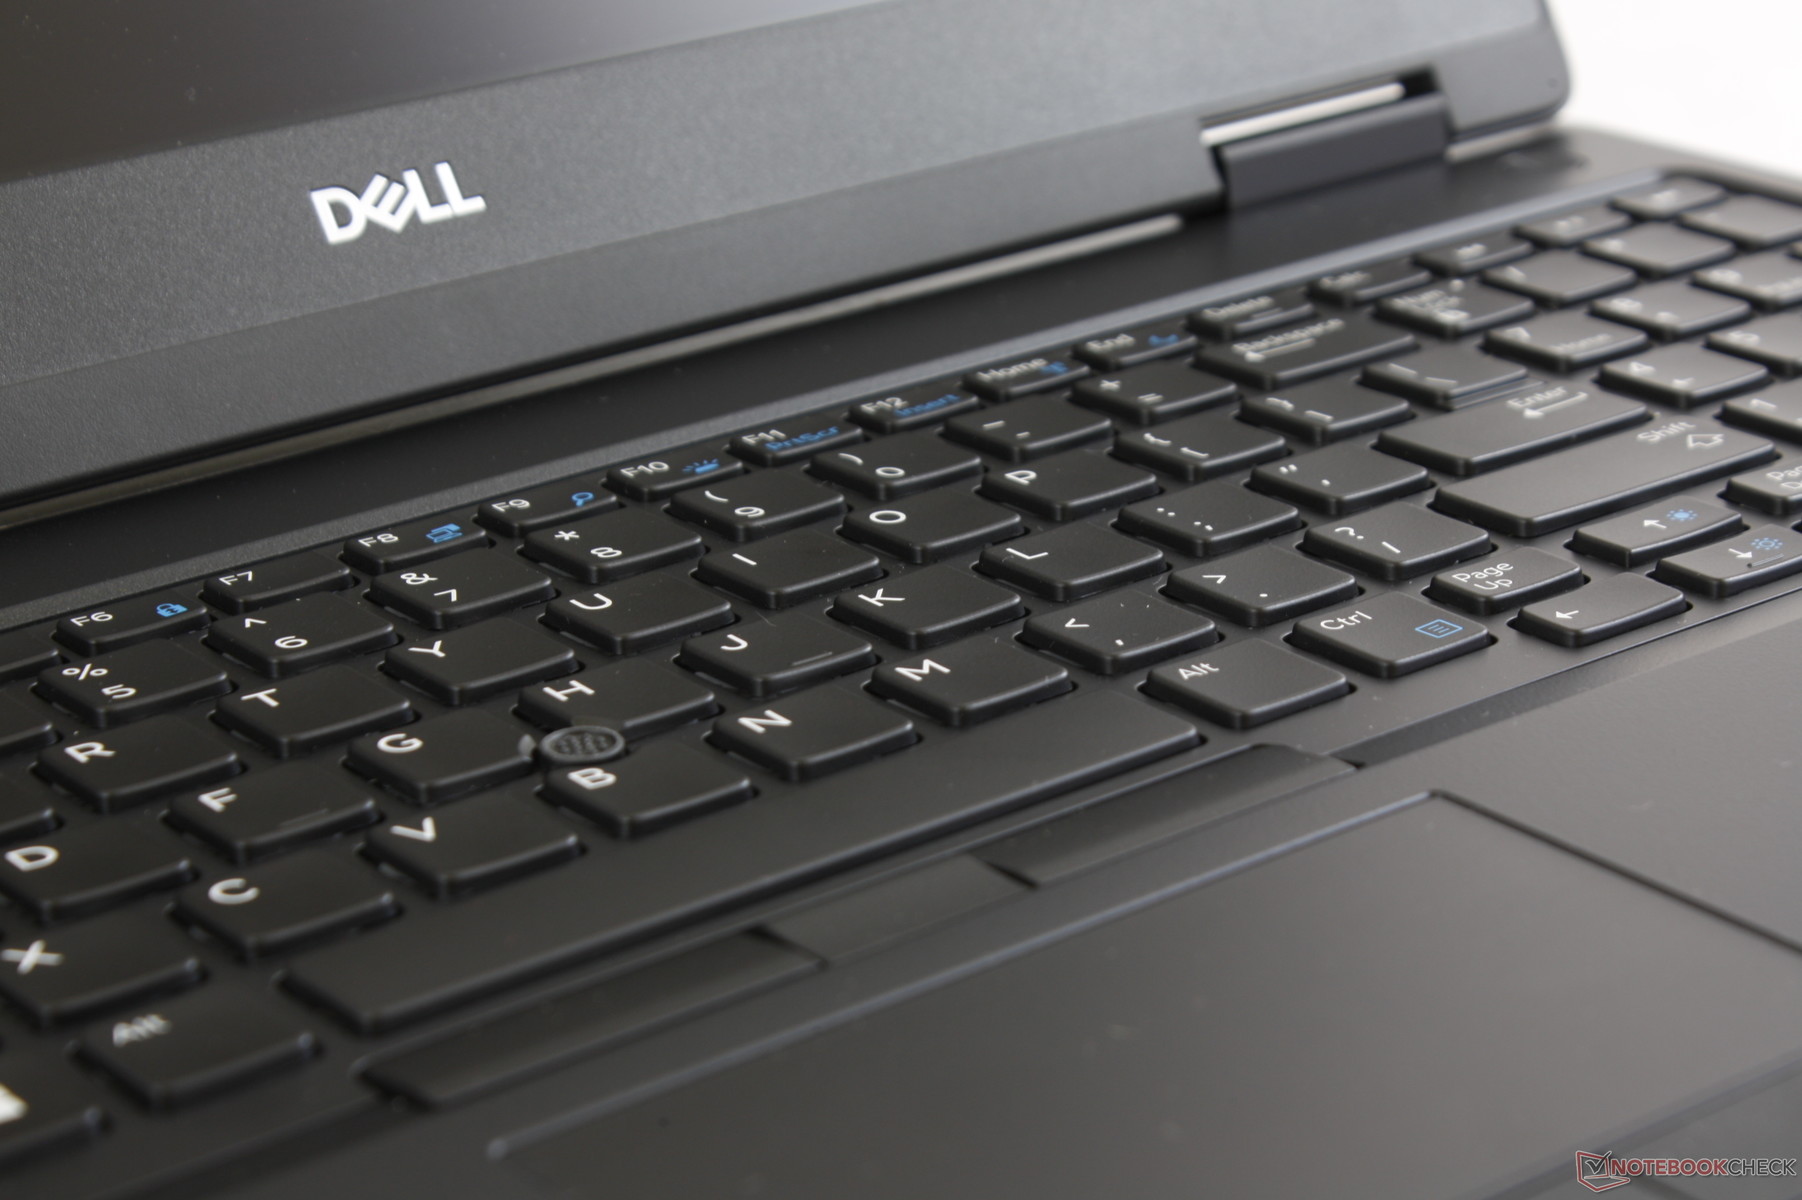
The backlit keyboard (~34.4 x 10.3 cm) remains essentially identical to the keyboard on the Precision 7510. This isn't bad, however, as we found the keyboard on the 7510 to be one of the best for its size. Travel is deeper than on the XPS 15 with firm but relatively quiet clatter. The NumPad keys are not reduced in size in any way unlike on many other 15-inch laptops.
We're hopeful that future iterations will increase the size of the small Arrow keys. Additionally, the dedicated "Calc" key could have been more versatile if it were a generic customizeable launcher key instead.
Touchpad
The trackpad (~10.0 x 5.5 cm) is small in surface area especially when compared to most Ultrabooks, but it makes up for the small size with dedicated mouse keys and a trackpoint. The keys are very quiet when pressed with moderate travel and satisfactory feedback. The bottom row of keys is slightly softer than the top row.
As for the trackpad itself, its slightly roughened surface allows for smooth cursor control. Our only nitpicks are the sticky fingers when moving very slowly and a surface that is slightly more susceptible to warping than the surrounding palm rests. Fortunately, none of these are acute enough to impact day-to-day use.
Display
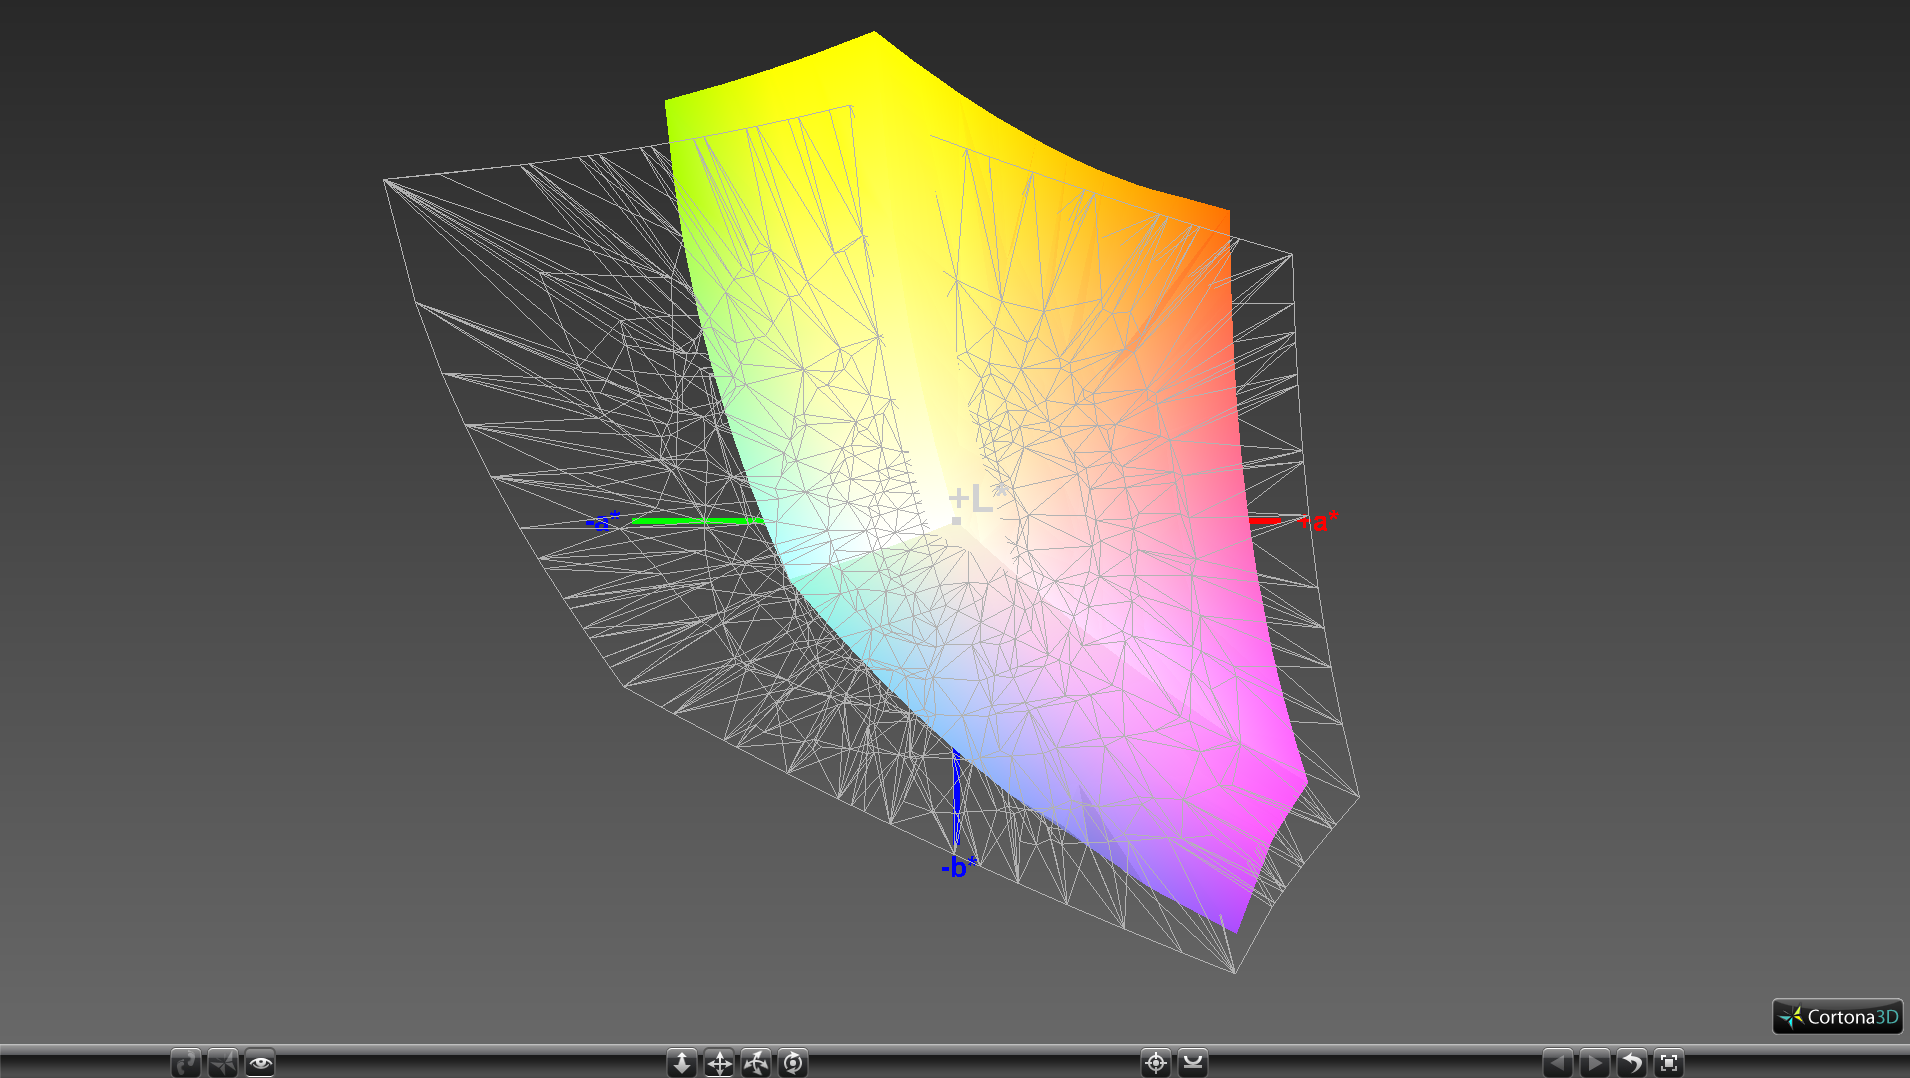
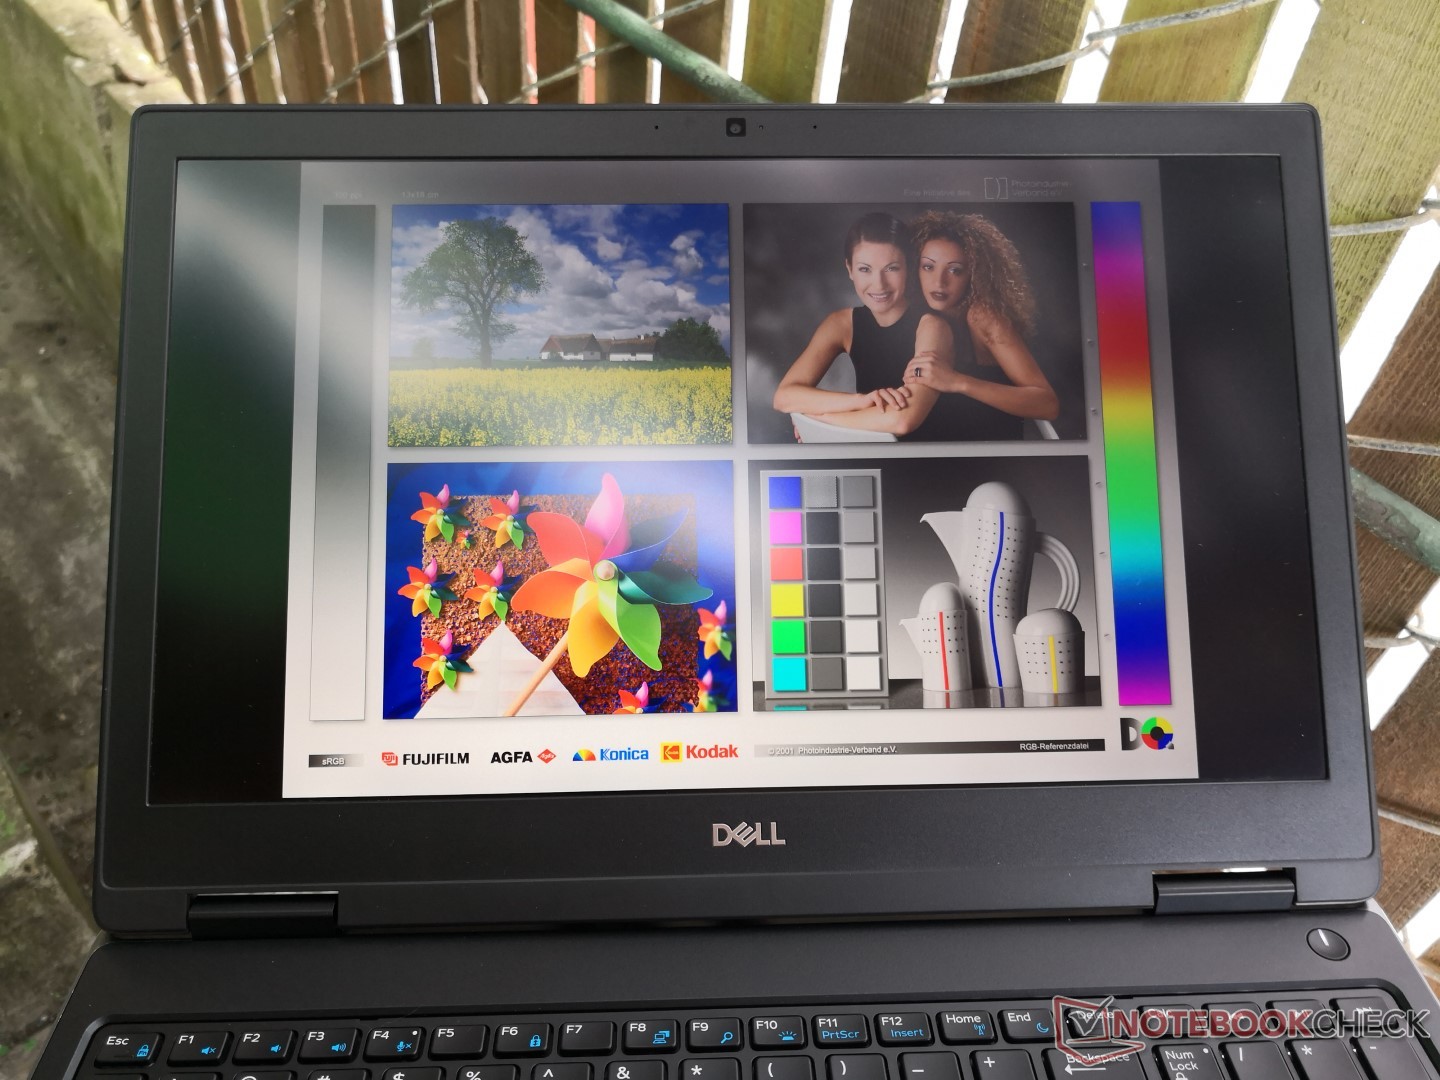
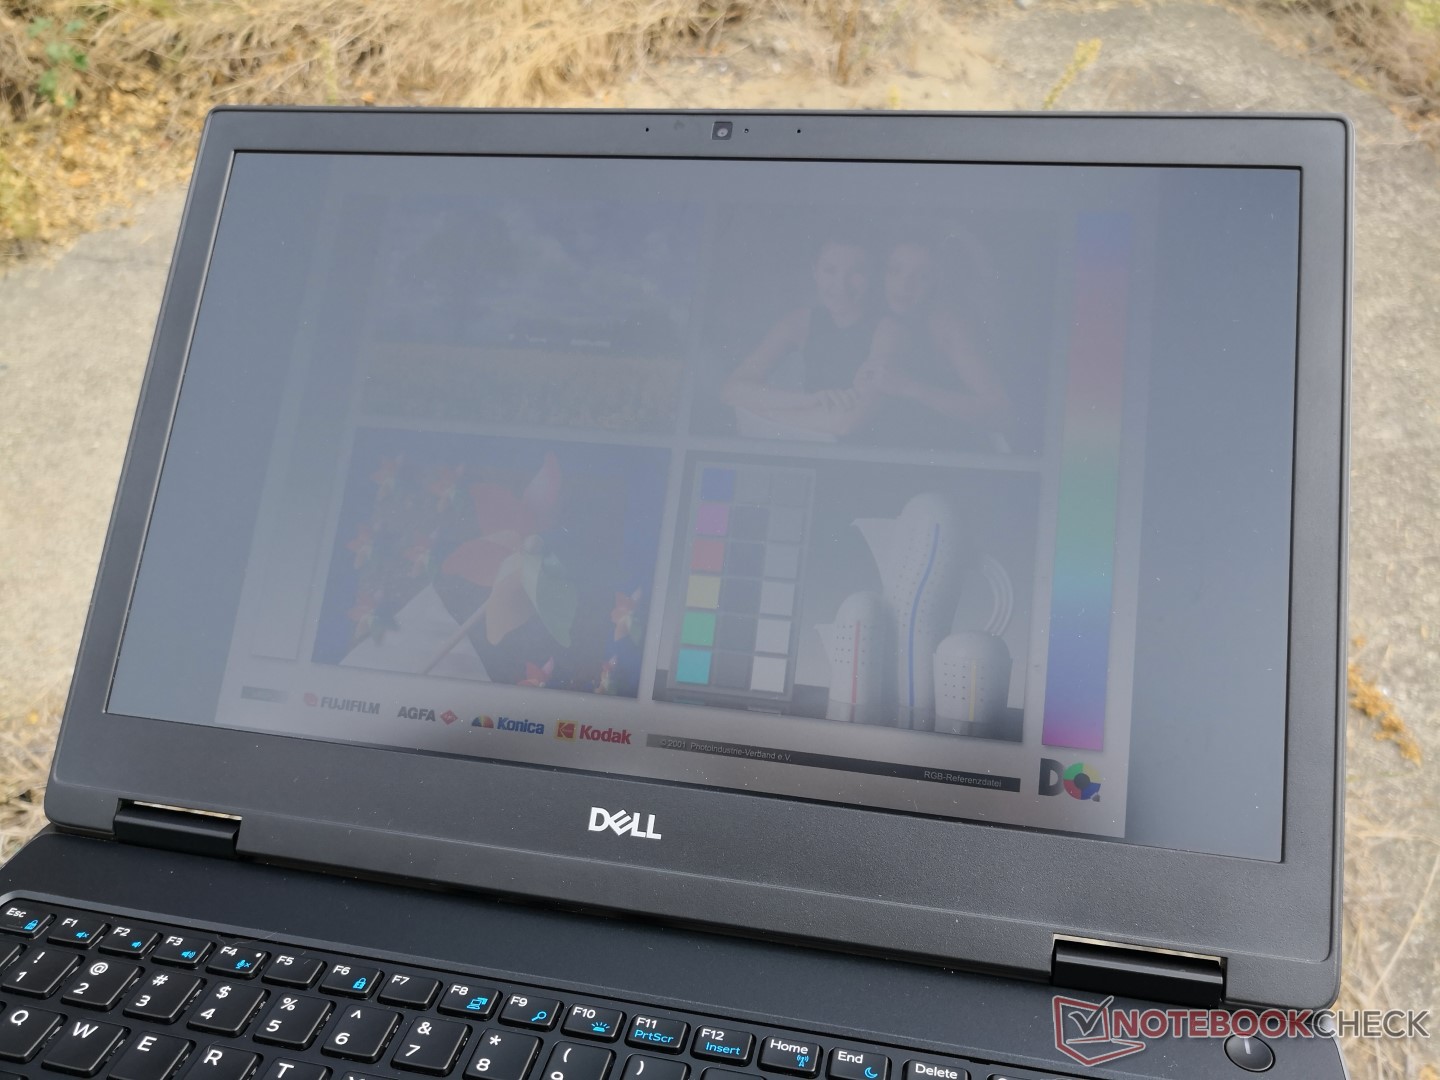
Multiple display options are available that differ in color coverage (45 percent, 72 percent, or 100 percent) and resolution (FHD or 4K UHD). We recommending choosing carefully as some options omit the webcam, microphone, and even WWAN. Note that Dell utilizes the LQ156D1 IGZO panel from Sharp across a wide range of its 15.6-inch 4K laptops including our Precision 7530, XPS 15 9575, Precision 5510, XPS 15, and even the last generation Precision 7510. As a result, the Precision 7530 shares similar color ranges to all of these products.
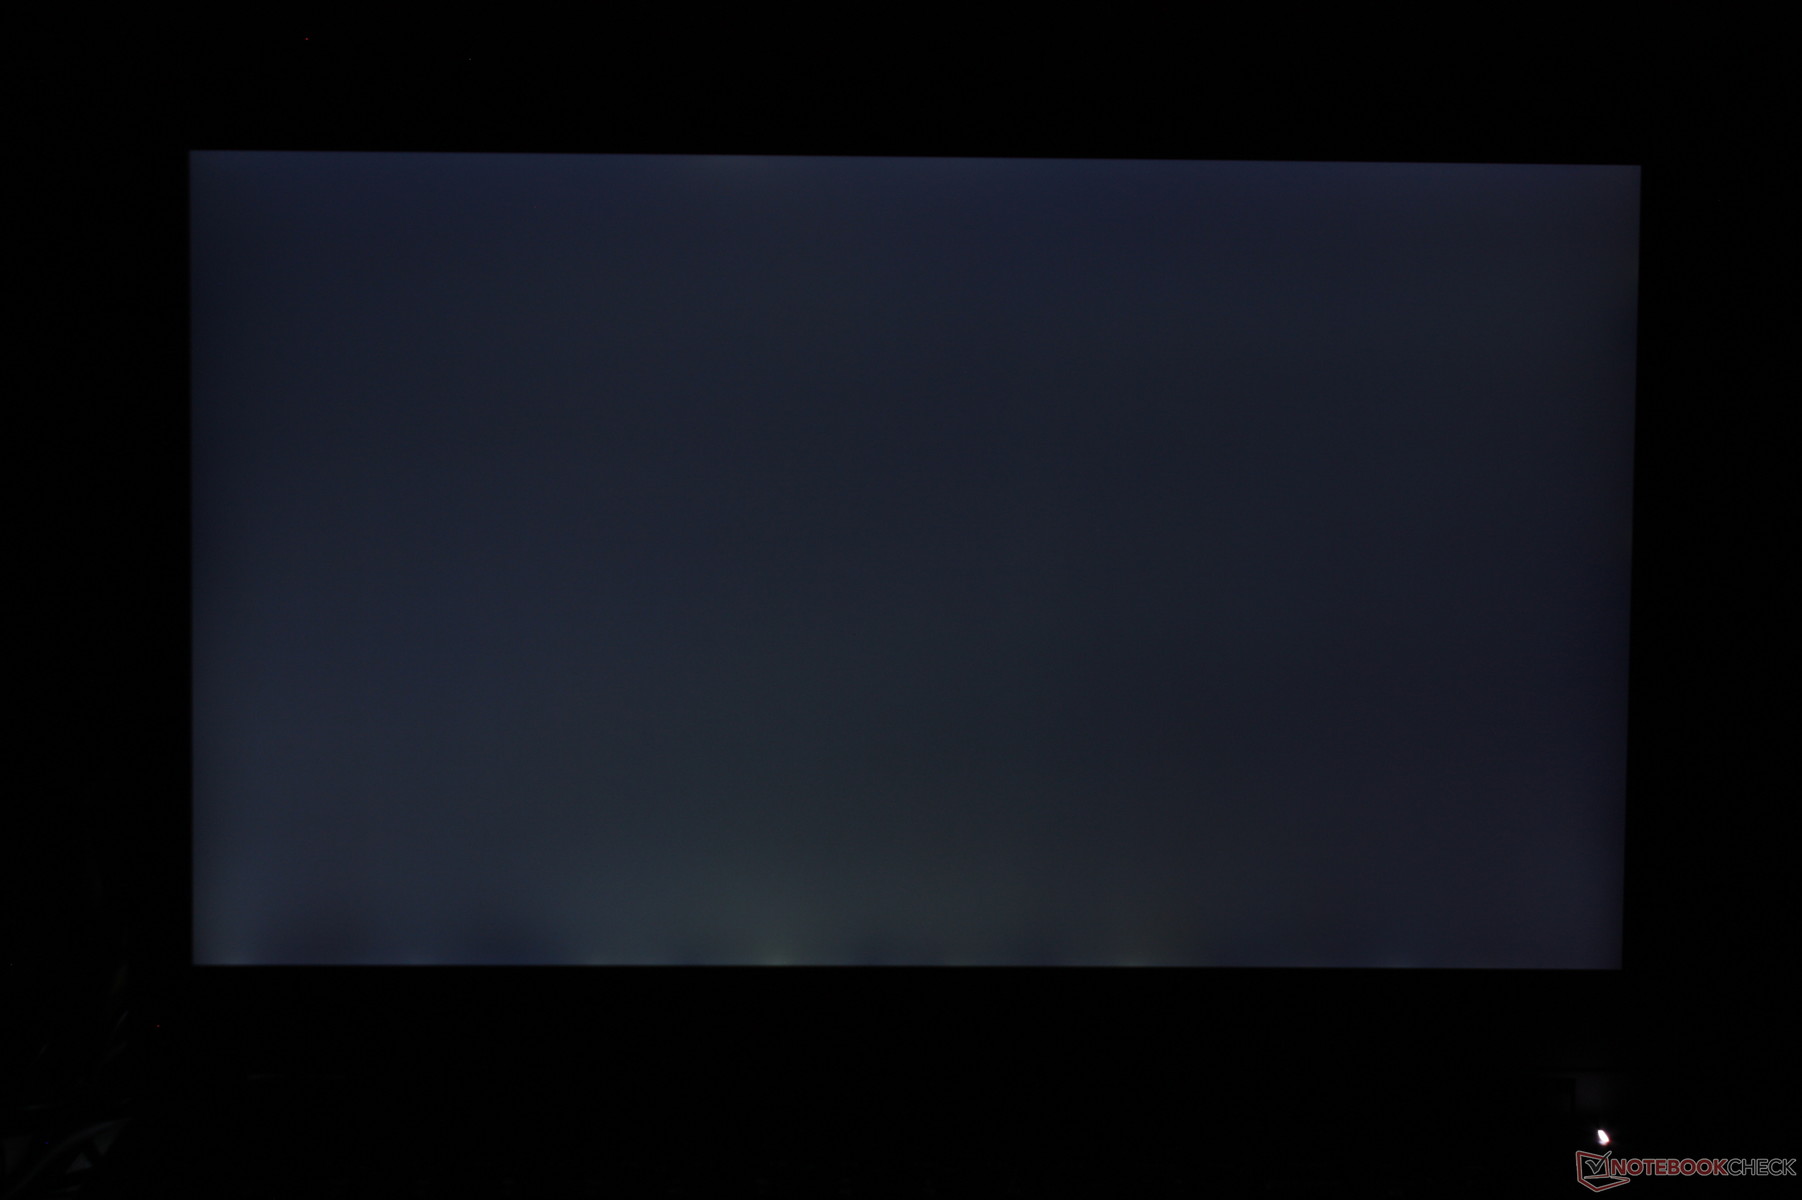
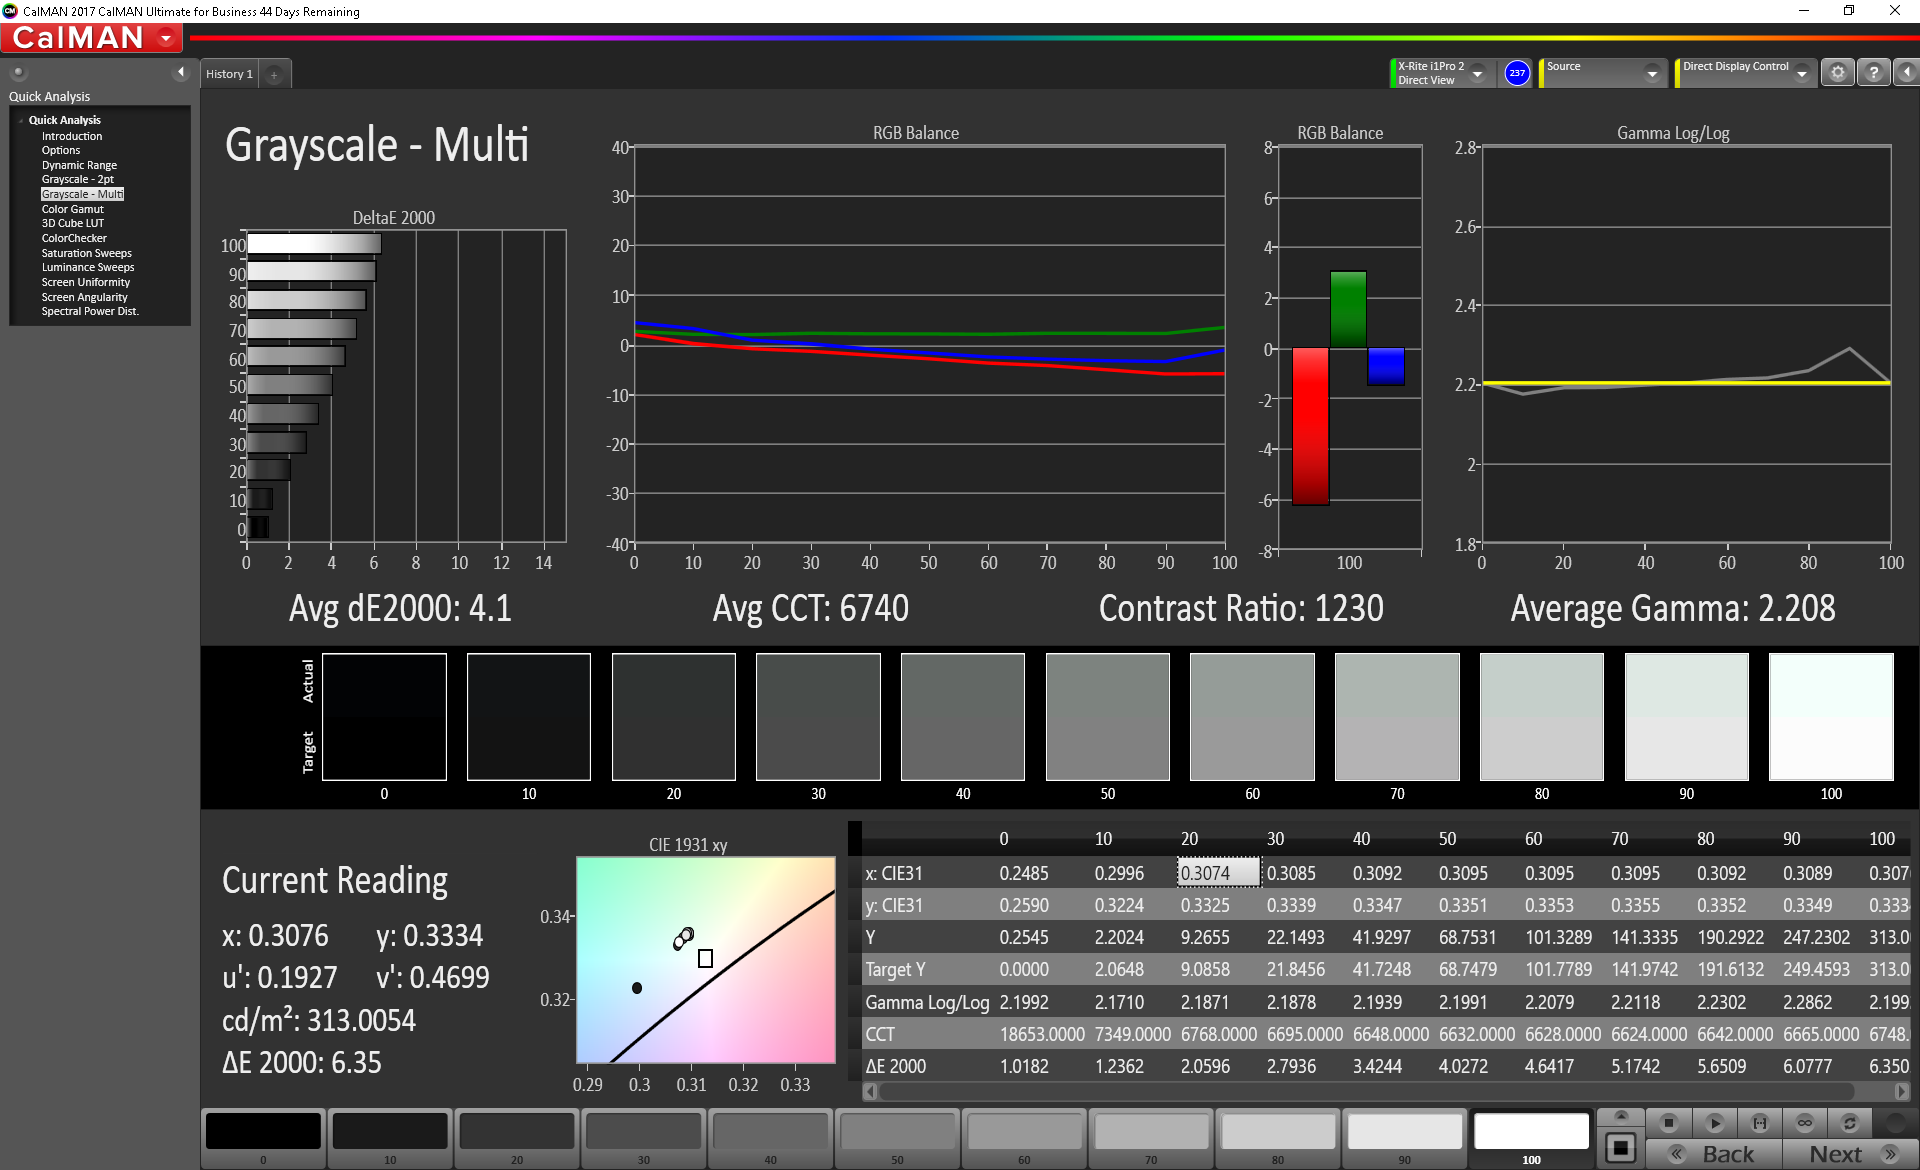
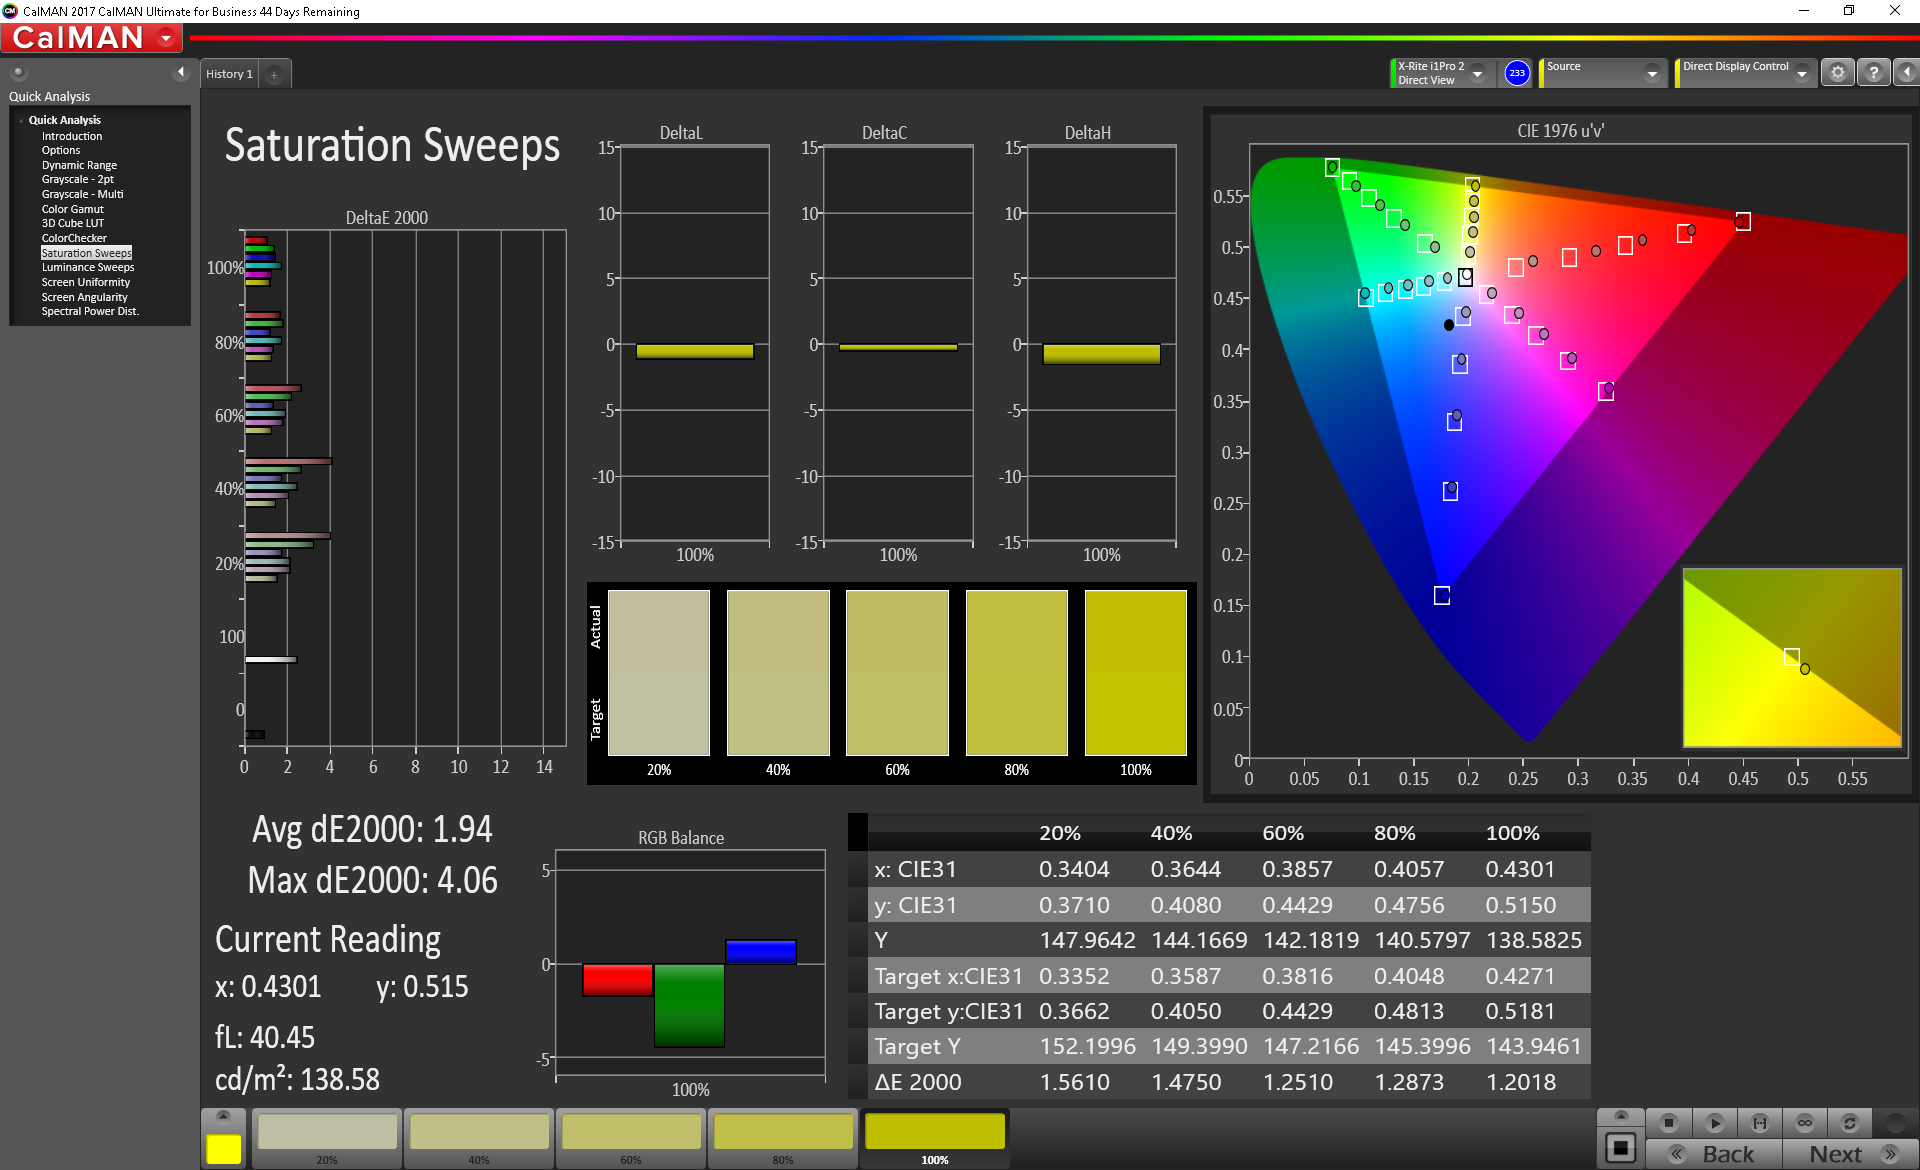
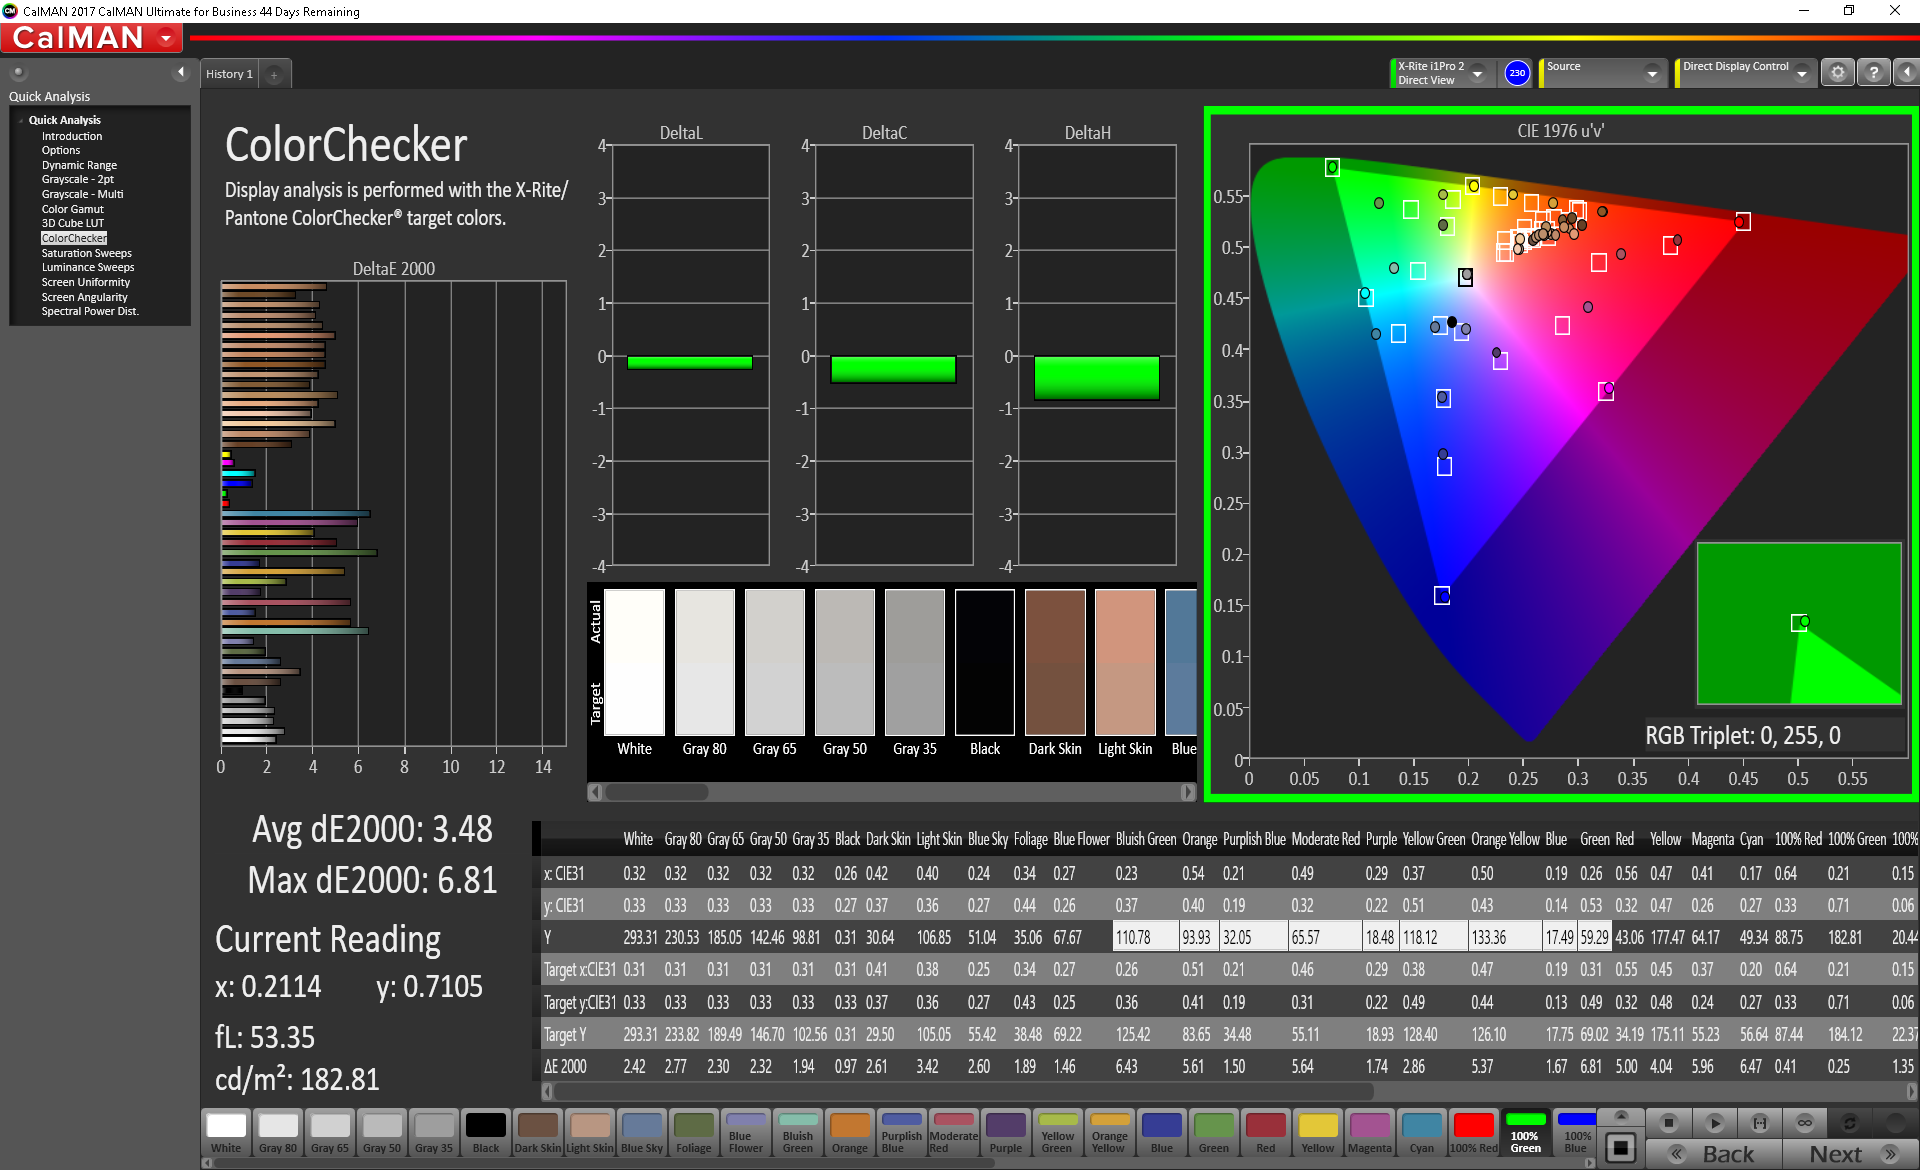
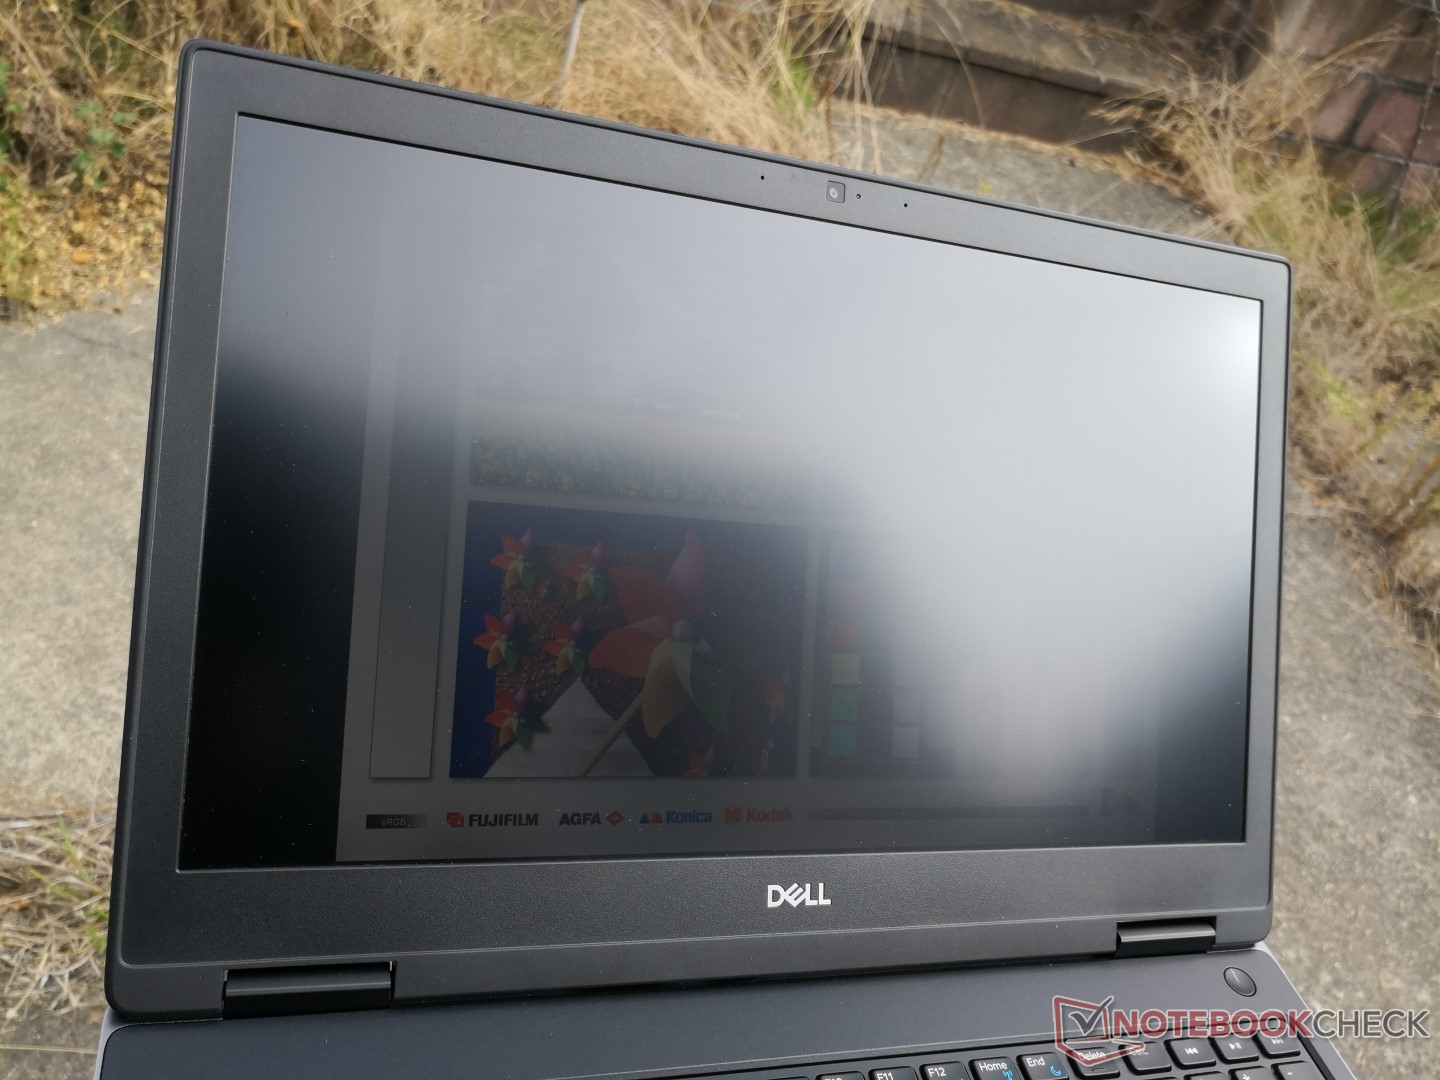
Colors are vibrant on our 4K UHD test unit with good contrast. Beyond that, however, most everything else is average. The display is not as bright as the XPS series or even the ThinkPad P1 and black levels aren't as deep. Furthermore, the matte panel suffers from a grainy overlay that prevents onscreen content from looking as sharp as they do on the glossy XPS 15 9575. Users sensitive to onscreen flickering may want to avoid brightness levels below 25 percent as we are able to detect pulse-width modulation when at these low settings. Lastly, light-moderate backlight bleeding is present on our unit as shown by the image below.

| |||||||||||||||||||||||||
Brightness Distribution: 85 %
Center on Battery: 292.8 cd/m²
Contrast: 813:1 (Black: 0.36 cd/m²)
ΔE ColorChecker Calman: 3.48 | ∀{0.5-29.43 Ø4.71}
calibrated: 3.13
ΔE Greyscale Calman: 4.1 | ∀{0.09-98 Ø4.96}
99.6% sRGB (Argyll 1.6.3 3D)
84.4% AdobeRGB 1998 (Argyll 1.6.3 3D)
96.2% AdobeRGB 1998 (Argyll 3D)
99.4% sRGB (Argyll 3D)
82.5% Display P3 (Argyll 3D)
Gamma: 2.2
CCT: 6740 K
| Dell Precision 7530 Sharp LQ156D1, IPS, 15.6", 3840x2160 | Lenovo ThinkPad P1-20MD002LUS B156ZAN03.2, IPS, 15.6", 3840x2160 | Dell Precision 5530 2-in-1 Sharp SHP148D, IPS, 15.6", 3840x2160 | Dell Precision 3530 BOE BOE06F1, IPS, 15.6", 1920x1080 | HP ZBook 15u G5 2ZC05EA CMN15E7, IPS LED, 15.6", 1920x1080 | Eurocom Tornado F5W AUO52ED B156HTN05.2, TN, 15.6", 1920x1080 | |
|---|---|---|---|---|---|---|
| Display | 3% | 5% | -15% | -46% | -22% | |
| Display P3 Coverage (%) | 82.5 | 86.4 5% | 91.2 11% | 72.8 -12% | 43.05 -48% | 66.1 -20% |
| sRGB Coverage (%) | 99.4 | 99.9 1% | 99.9 1% | 94.6 -5% | 64.7 -35% | 87.7 -12% |
| AdobeRGB 1998 Coverage (%) | 96.2 | 99.1 3% | 99.4 3% | 69.3 -28% | 44.5 -54% | 64.2 -33% |
| Response Times | -38% | -42% | -24% | -14% | 51% | |
| Response Time Grey 50% / Grey 80% * (ms) | 35.2 ? | 55.6 ? -58% | 49.6 ? -41% | 40.4 ? -15% | 41.6 ? -18% | 23.2 ? 34% |
| Response Time Black / White * (ms) | 26.4 ? | 30.8 ? -17% | 37.6 ? -42% | 34.8 ? -32% | 28.8 ? -9% | 8.5 ? 68% |
| PWM Frequency (Hz) | 198.4 ? | 990 ? | 1053 ? | 25770 ? | ||
| Screen | 5% | 14% | -16% | -22% | -53% | |
| Brightness middle (cd/m²) | 292.8 | 397.6 36% | 430.9 47% | 285.7 -2% | 229 -22% | 405.7 39% |
| Brightness (cd/m²) | 295 | 396 34% | 398 35% | 275 -7% | 212 -28% | 397 35% |
| Brightness Distribution (%) | 85 | 85 0% | 79 -7% | 85 0% | 88 4% | 92 8% |
| Black Level * (cd/m²) | 0.36 | 0.25 31% | 0.35 3% | 0.31 14% | 0.23 36% | 0.65 -81% |
| Contrast (:1) | 813 | 1590 96% | 1231 51% | 922 13% | 996 23% | 624 -23% |
| Colorchecker dE 2000 * | 3.48 | 4.95 -42% | 3.29 5% | 5.84 -68% | 4.2 -21% | 8.5 -144% |
| Colorchecker dE 2000 max. * | 6.81 | 10.23 -50% | 7.46 -10% | 8.76 -29% | 18 -164% | 16.2 -138% |
| Colorchecker dE 2000 calibrated * | 3.13 | 4.22 -35% | 3.58 -14% | 3.14 -0% | 4.2 -34% | |
| Greyscale dE 2000 * | 4.1 | 5.1 -24% | 2.6 37% | 6.5 -59% | 2 51% | 11.6 -183% |
| Gamma | 2.2 100% | 2.234 98% | 2.19 100% | 2.383 92% | 2.23 99% | 2.37 93% |
| CCT | 6740 96% | 7543 86% | 6870 95% | 7176 91% | 6292 103% | 10468 62% |
| Color Space (Percent of AdobeRGB 1998) (%) | 84.4 | 87.6 4% | 87.2 3% | 62 -27% | 41 -51% | 57 -32% |
| Color Space (Percent of sRGB) (%) | 99.6 | 100 0% | 100 0% | 94 -6% | 64.5 -35% | 87 -13% |
| Total Average (Program / Settings) | -10% /
-1% | -8% /
5% | -18% /
-16% | -27% /
-25% | -8% /
-33% |
* ... smaller is better
Color space covers sRGB in its entirety and AdobeRGB almost completely. The panel was designed with accurate colors and digital artists in mind.
Colors are accurate out of the box with a color temperature that is slightly on the cool side. Our calibration attempts address the color temperature for a more accurate grayscale. Interestingly, Red and Green remain slightly less accurate than other primary and secondary colors when at lower saturation levels. It's a small nitpick for a panel that is otherwise fit for professional use.
Display Response Times
| ↔ Response Time Black to White | ||
|---|---|---|
| 26.4 ms ... rise ↗ and fall ↘ combined | ↗ 14 ms rise | 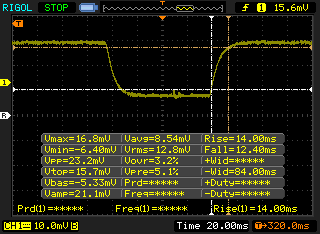 |
| ↘ 12.4 ms fall | ||
| The screen shows relatively slow response rates in our tests and may be too slow for gamers. In comparison, all tested devices range from 0.1 (minimum) to 240 (maximum) ms. » 66 % of all devices are better. This means that the measured response time is worse than the average of all tested devices (19.8 ms). | ||
| ↔ Response Time 50% Grey to 80% Grey | ||
| 35.2 ms ... rise ↗ and fall ↘ combined | ↗ 17.2 ms rise | 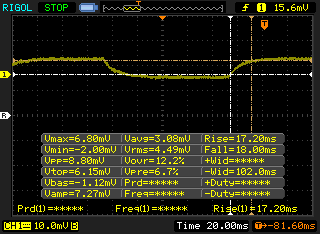 |
| ↘ 18 ms fall | ||
| The screen shows slow response rates in our tests and will be unsatisfactory for gamers. In comparison, all tested devices range from 0.165 (minimum) to 636 (maximum) ms. » 49 % of all devices are better. This means that the measured response time is worse than the average of all tested devices (30.9 ms). | ||
Screen Flickering / PWM (Pulse-Width Modulation)
| Screen flickering / PWM detected | 198.4 Hz | ≤ 25 % brightness setting | 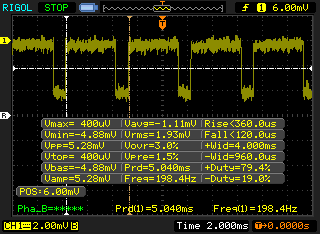 |
The display backlight flickers at 198.4 Hz (worst case, e.g., utilizing PWM) Flickering detected at a brightness setting of 25 % and below. There should be no flickering or PWM above this brightness setting. The frequency of 198.4 Hz is relatively low, so sensitive users will likely notice flickering and experience eyestrain at the stated brightness setting and below. In comparison: 52 % of all tested devices do not use PWM to dim the display. If PWM was detected, an average of 7748 (minimum: 5 - maximum: 343500) Hz was measured. | |||
Outdoor visibility is average when under shade and poor under sunlight. The backlight is not powerful enough to overcome bright ambient lighting and glare becomes noticeable despite the matte panel. Viewing angles are very wide with only minimal degradation in contrast and colors from obtuse angles.
Performance
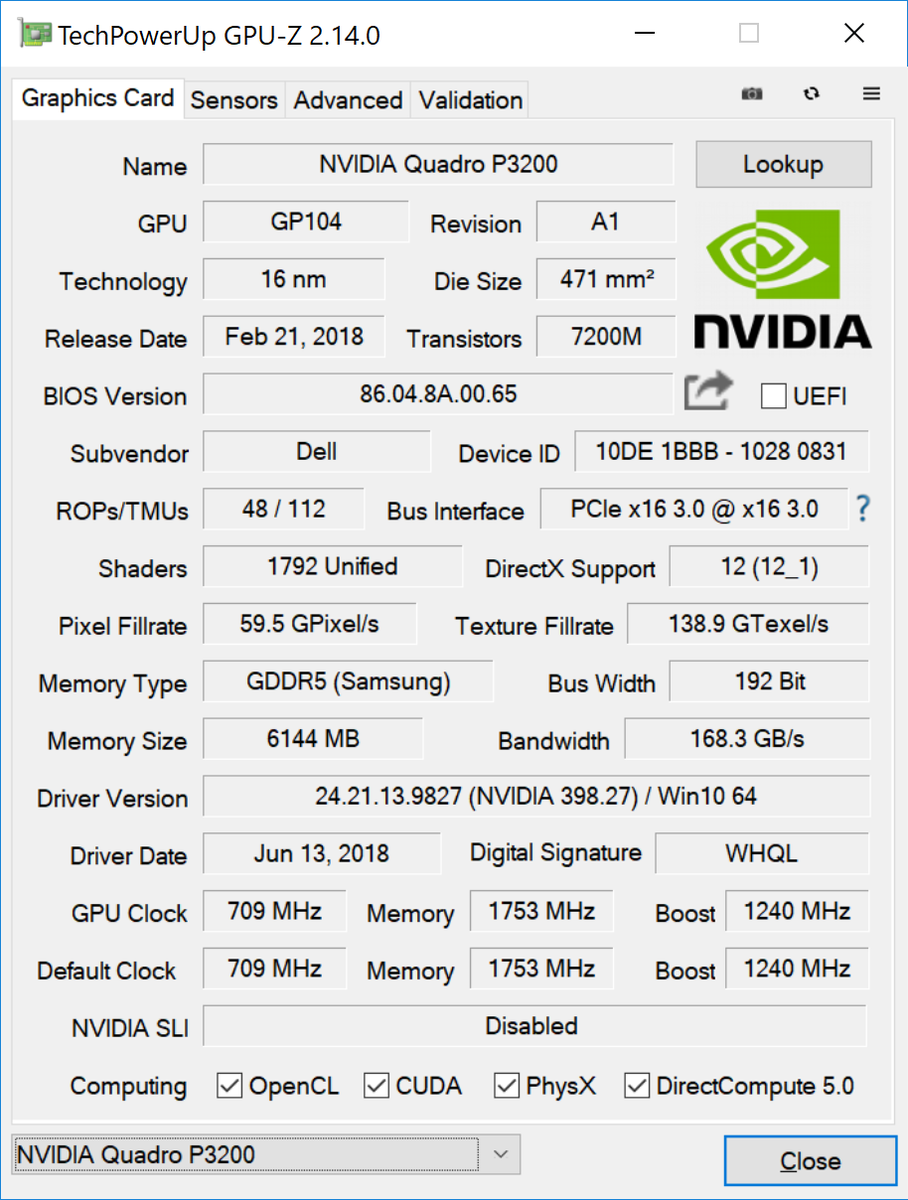
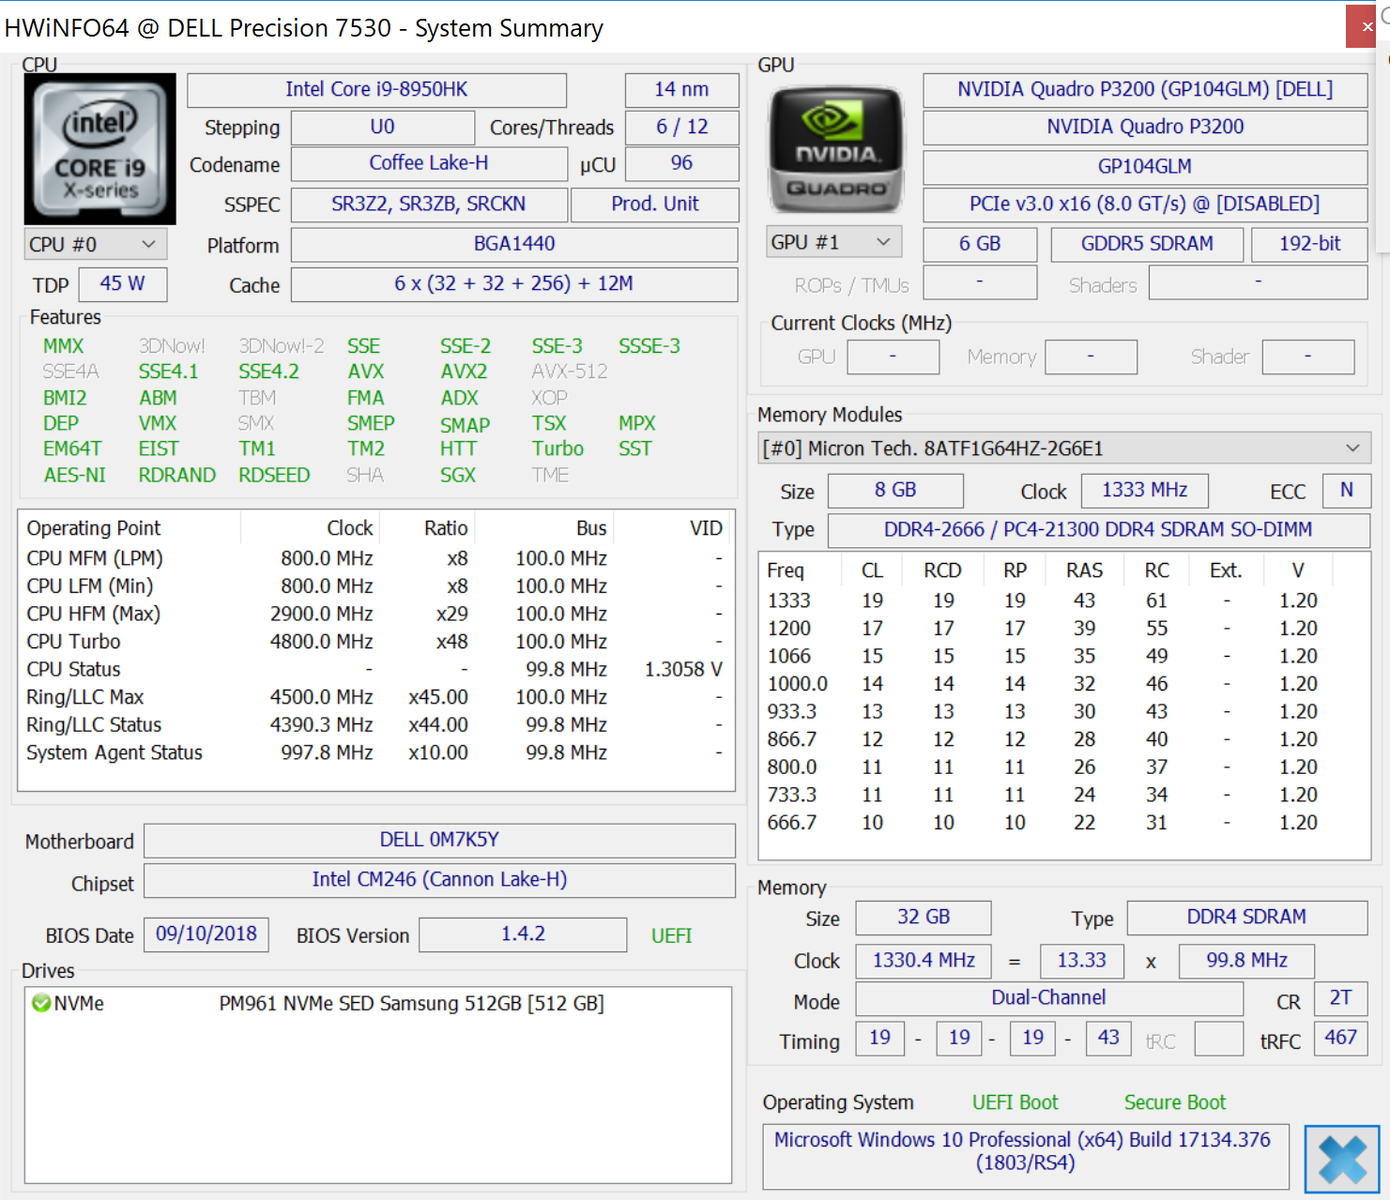
The system targets users in need of high CPU performance whereas the Precision 5530 or 5530 2-in-1 are more mid-range offerings. The Core i9-8950HK is the highlight of the system and so is the uncommon Quadro P3200. This particular GPU sits in between the GTX 1060 and GTX 1070 in terms of the number of ROPs, TMUs, and shaders. The Lenovo ThinkPad P72 carries the same Quadro GPU option but lacks the Core i9 CPU. It's somewhat disappointing to see no Quadro P4000 or P5000 options for the Precision 7530, though our stress tests below reveal that the cooling solution may be the reason why.
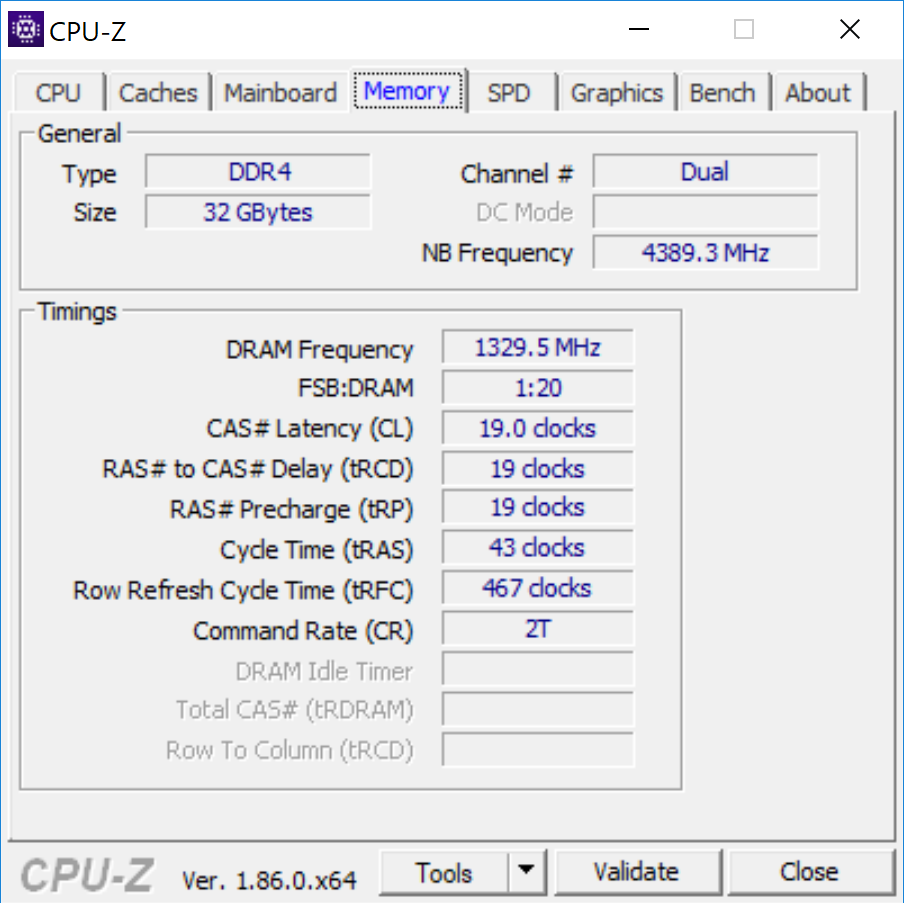
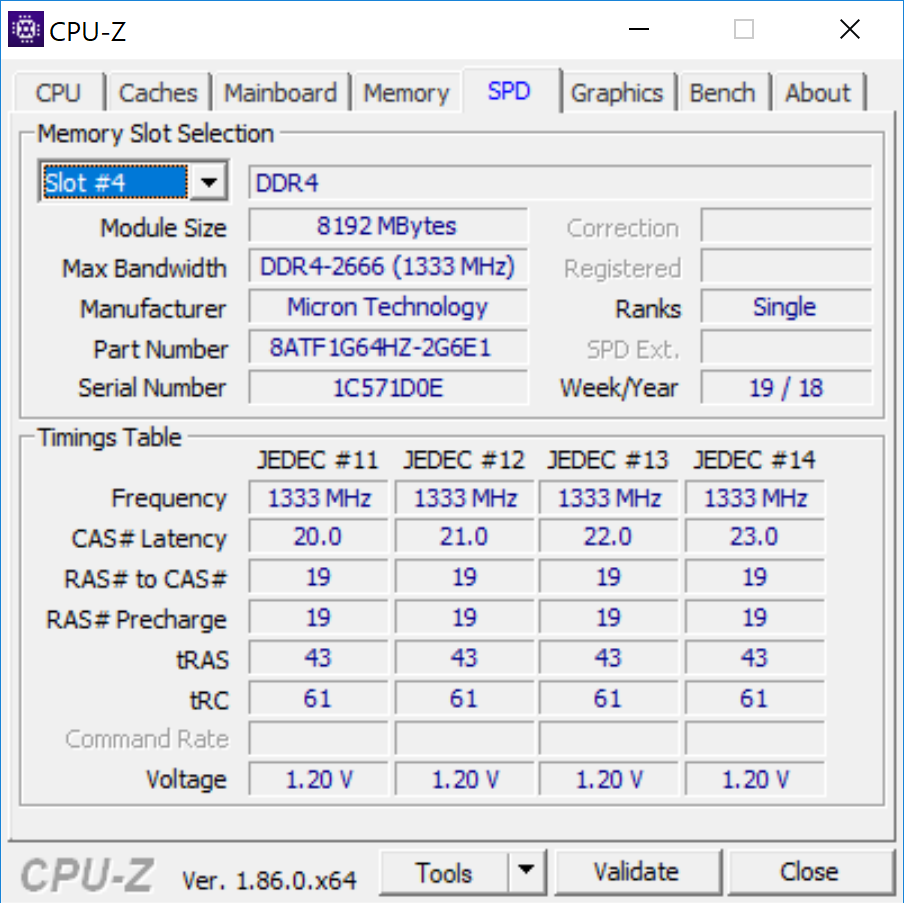
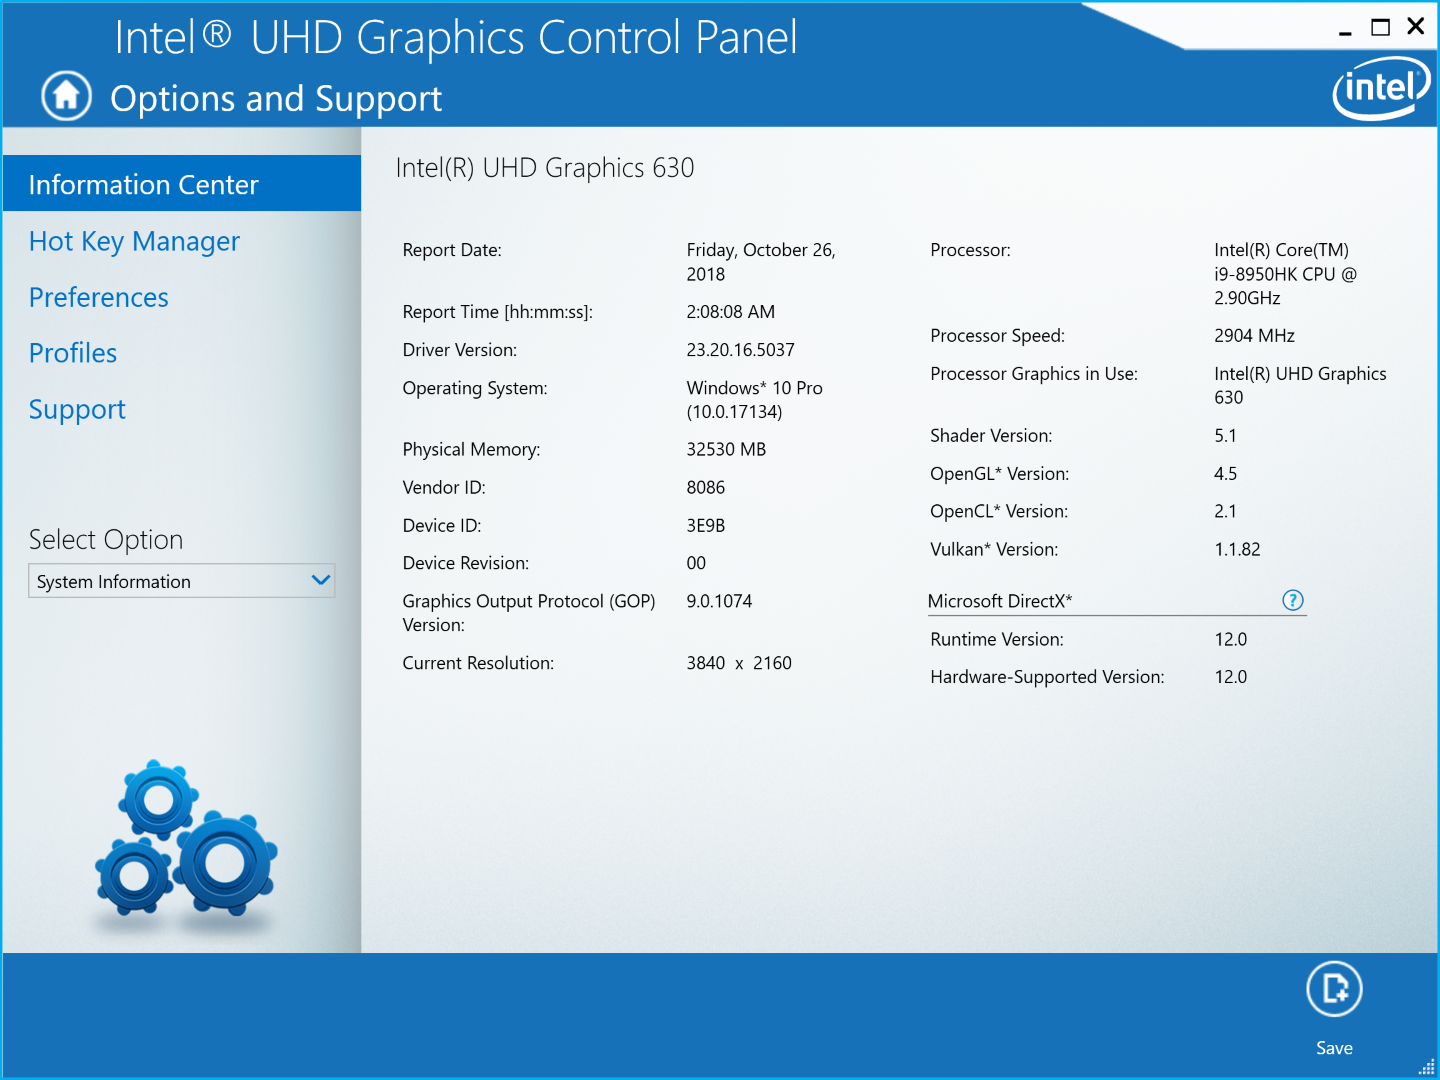
Nvidia Optimus is included for automatic switching to the integrated UHD Graphics 630. ECC RAM is available if configuring with a Xeon CPU. Non-ECC RAM can be configured with 32 GB modules for up to a whopping 128 GB total.
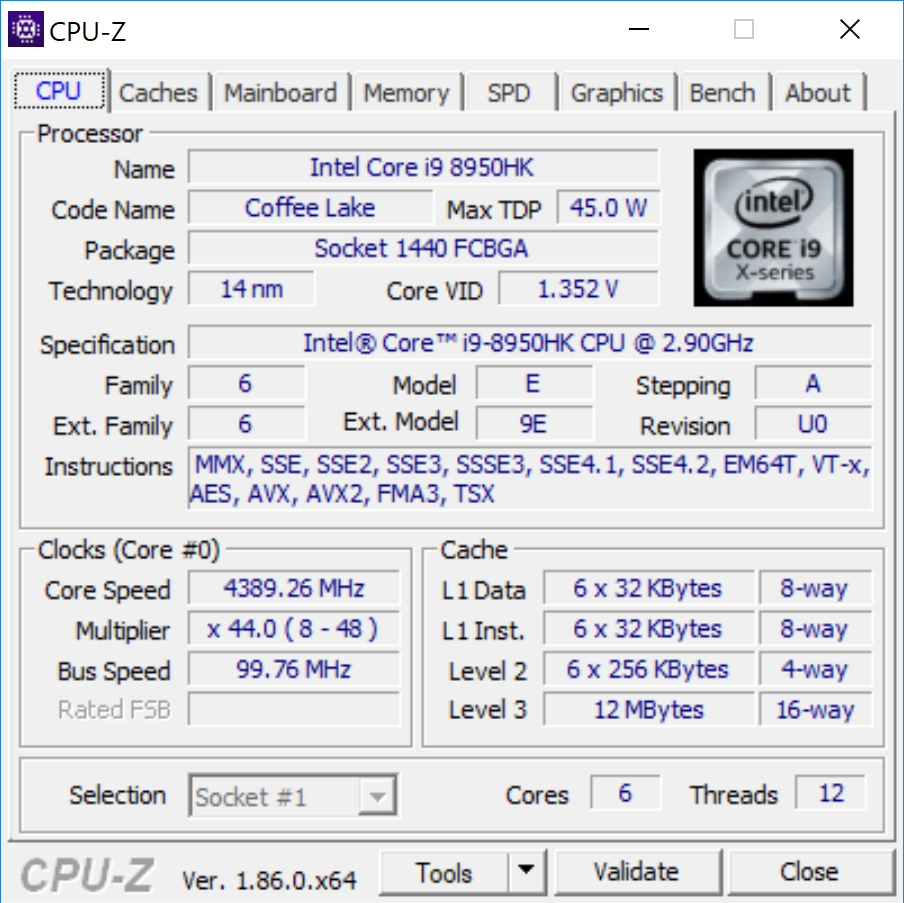
Processor
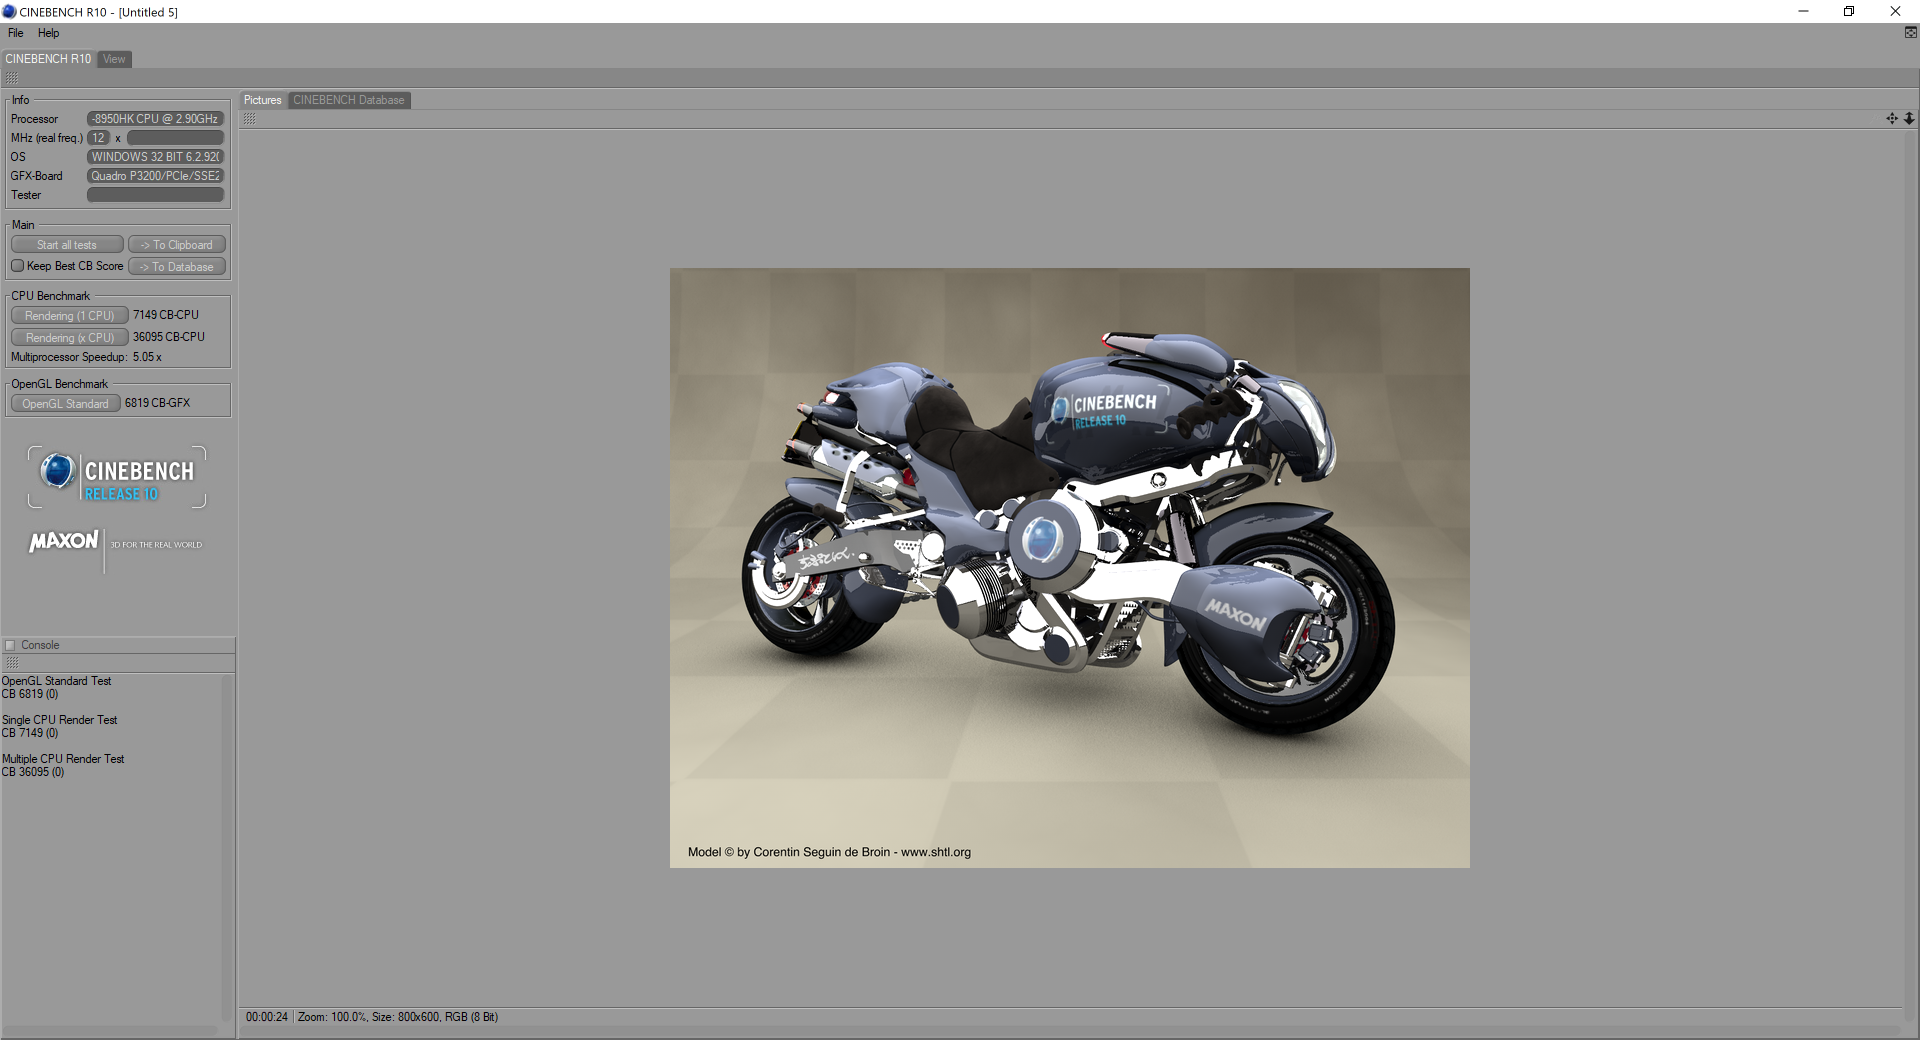
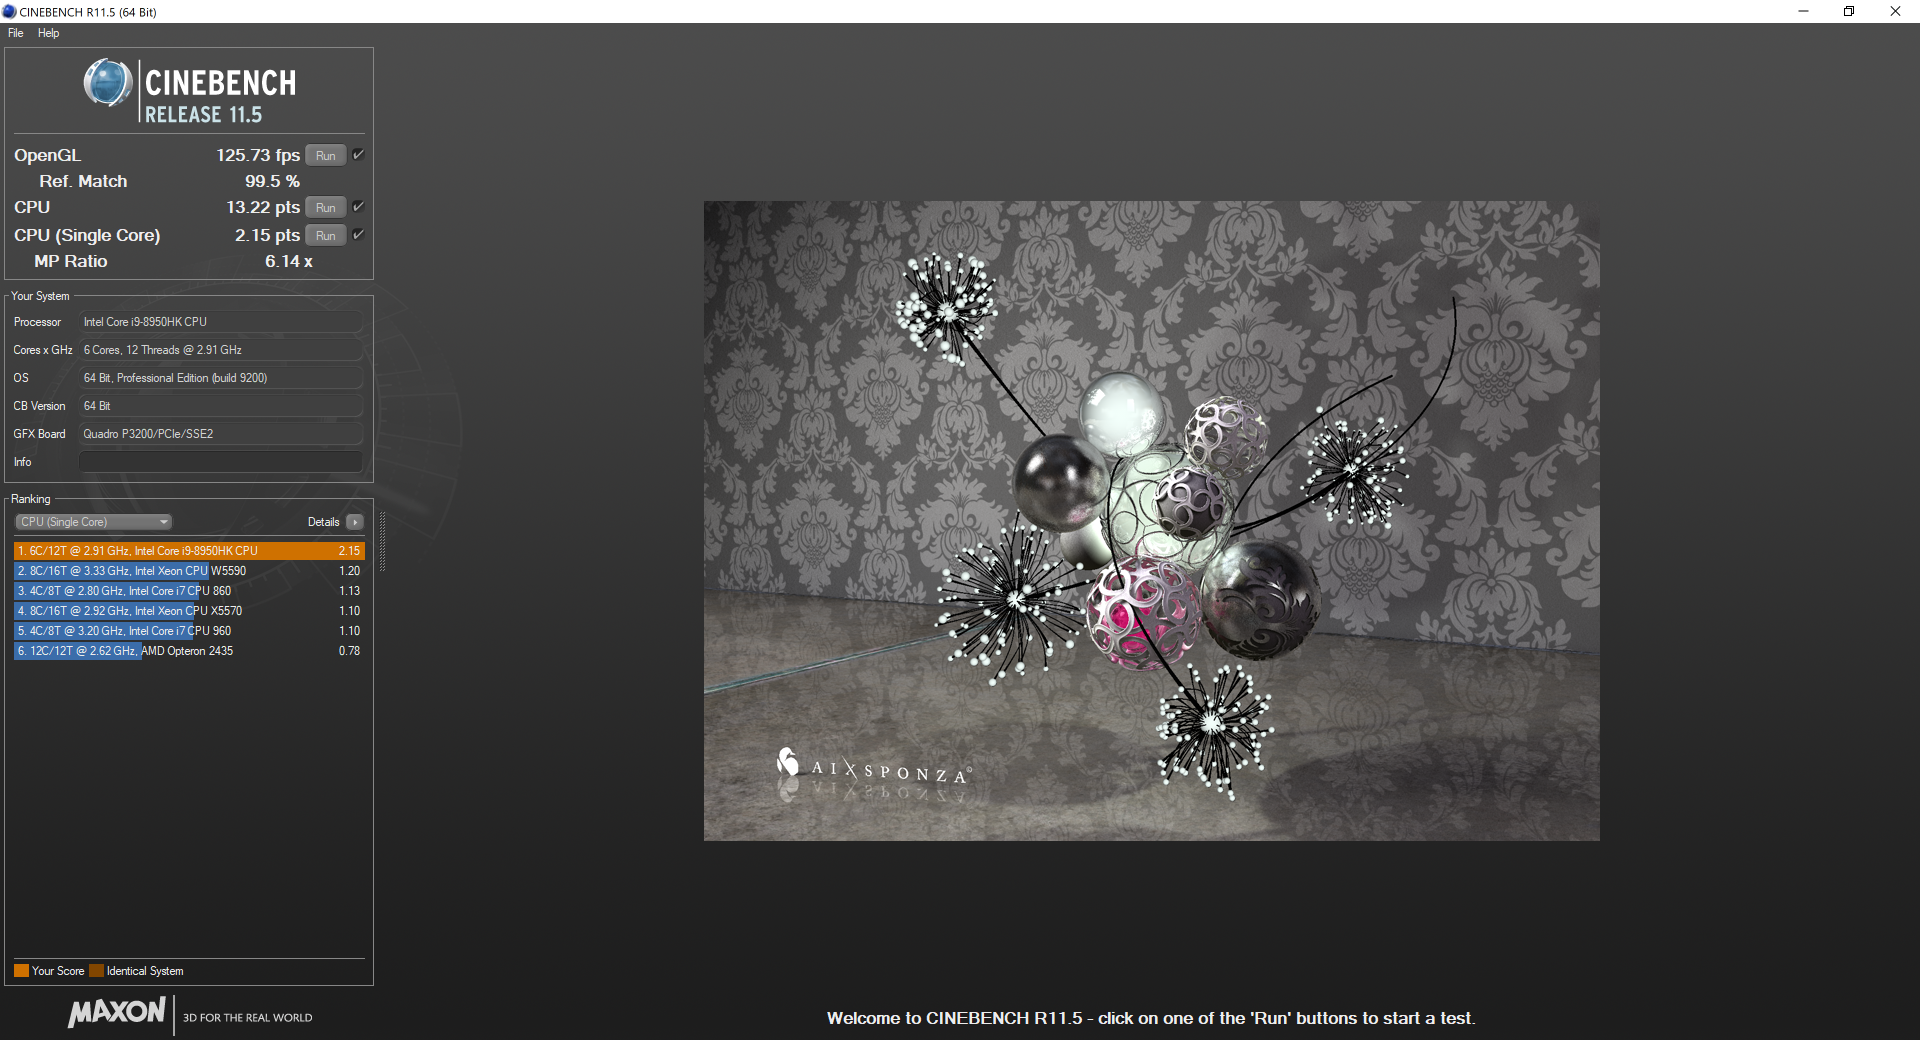
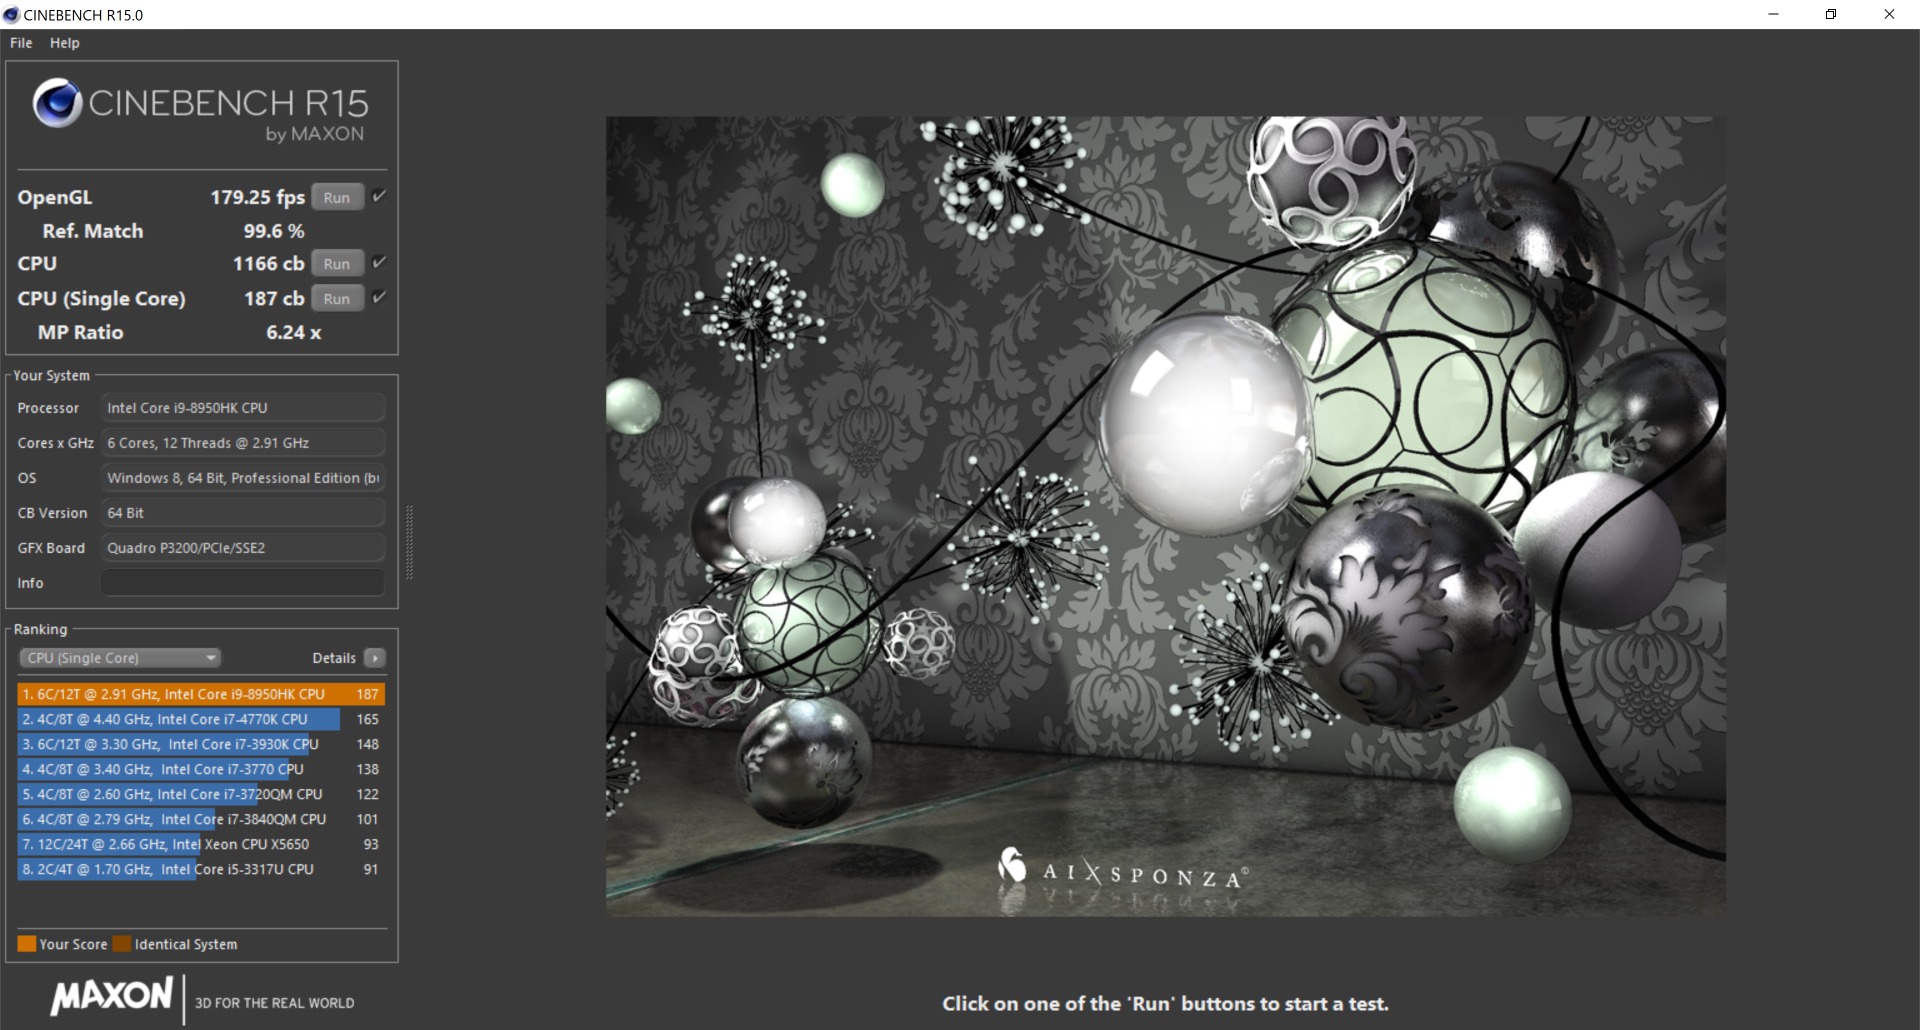
The Core i9-8950HK in our Precision is only 3 percent faster than the i7-8750H and yet it costs $300 more. Its performance benefits are minimal at best due to the very warm CPU temperatures of the i9-8950HK when under load as our Stress Test section below will detail. This isn't to say that the i9-8950HK is slow because it is one of the fastest mobile CPUs available and about 50 percent faster than the i5-8300H, but its performance-per-dollar is quite poor for this particular implementation. The Xeon E-2176M is comparable and anyone upgrading from the last generation Xeon E3-1535M will still see a respectable CPU performance boost of about 40 percent.
Running CineBench R15 Multi-Thread in a loop is a good way to test Turbo Boost sustainability. The initial score of 1192 points drops to 1124 points over time for a performance dip of only about 6 percent. Since the average score of the i9-9850HK in our database is 1227 points, this suggests that the i9-8950HK in our Precision 7530 is poor at maintaining Turbo Boost clock rates. Our Stress Test analysis below back up this observation.
See our dedicated page on the Core i9-8950HK for more technical information and benchmark comparisons.
| wPrime 2.10 - 1024m | |
| Asus ROG Strix GL702ZC-GC204T | |
| Dell Precision 7510 (4K IGZO) | |
| Eurocom Tornado F5W | |
| Average Intel Core i9-8950HK (n=1) | |
| Dell Precision 5530 2-in-1 | |
| Eurocom Sky X4C | |
* ... smaller is better
System Performance
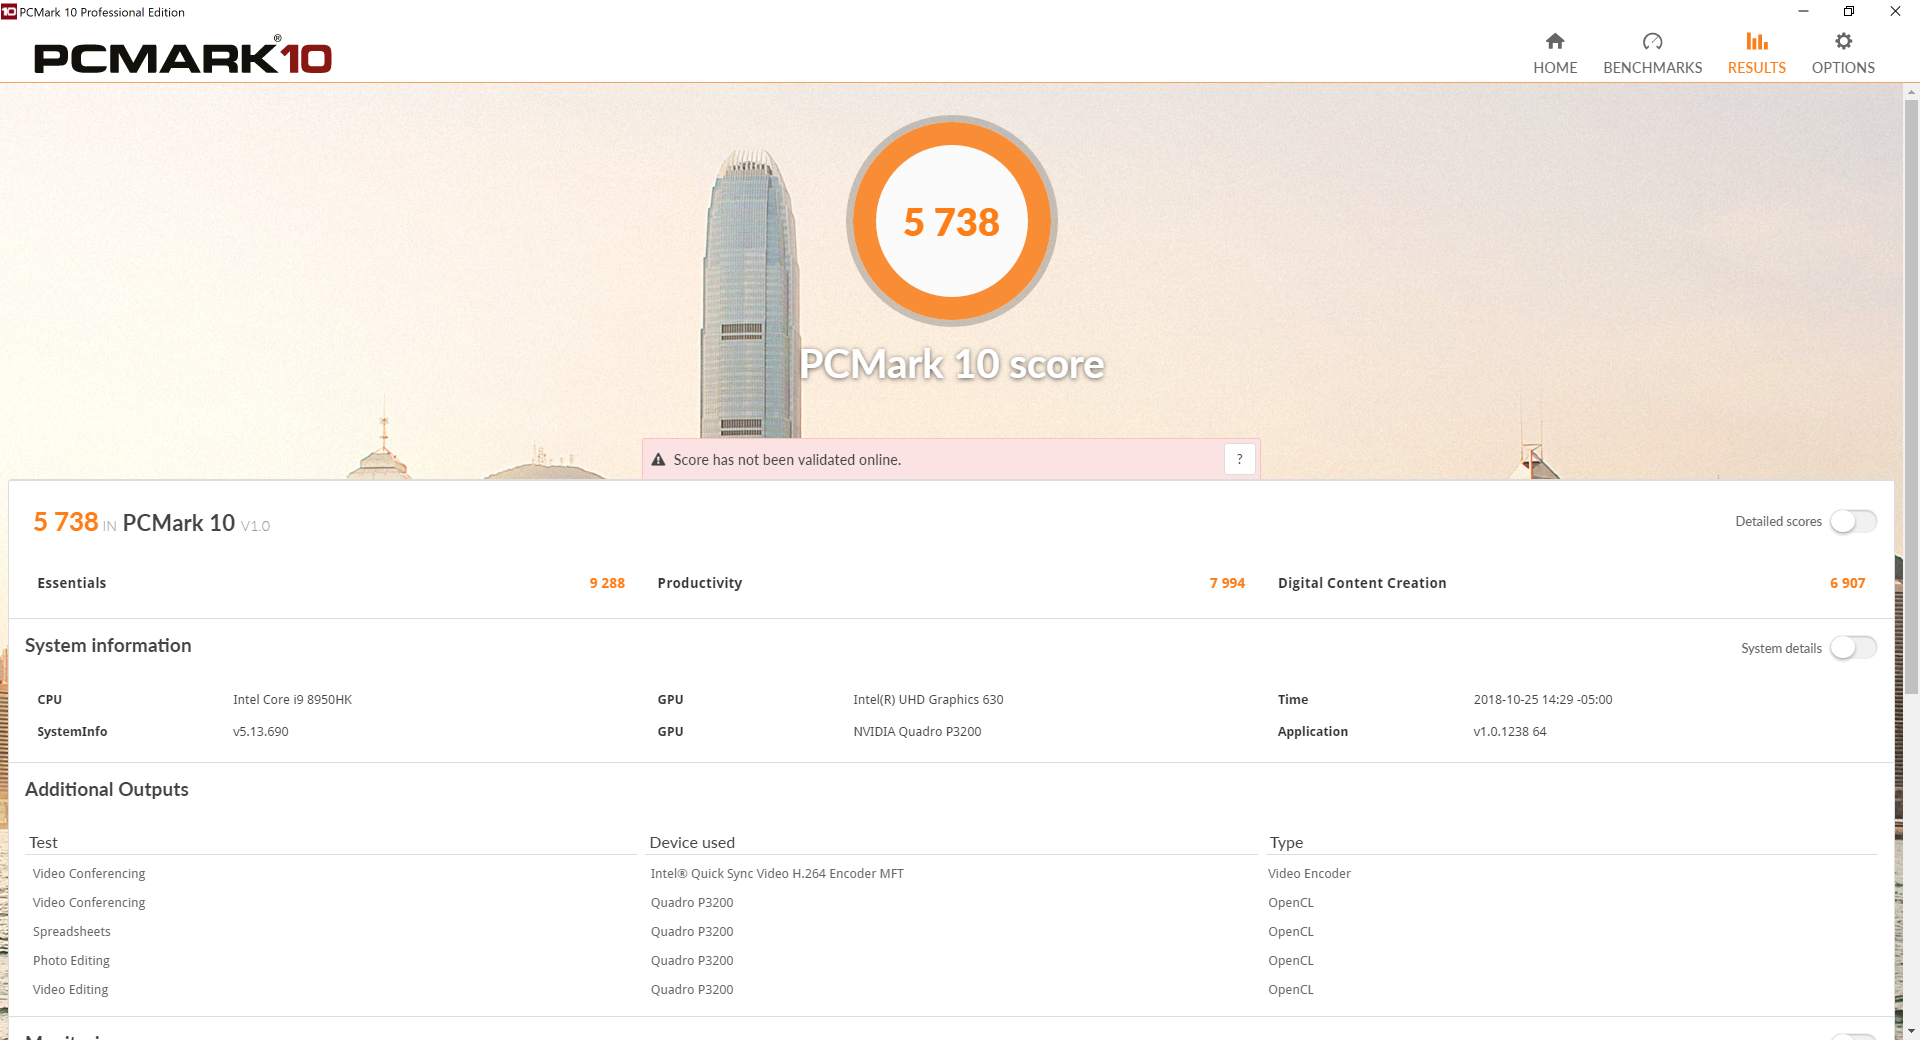
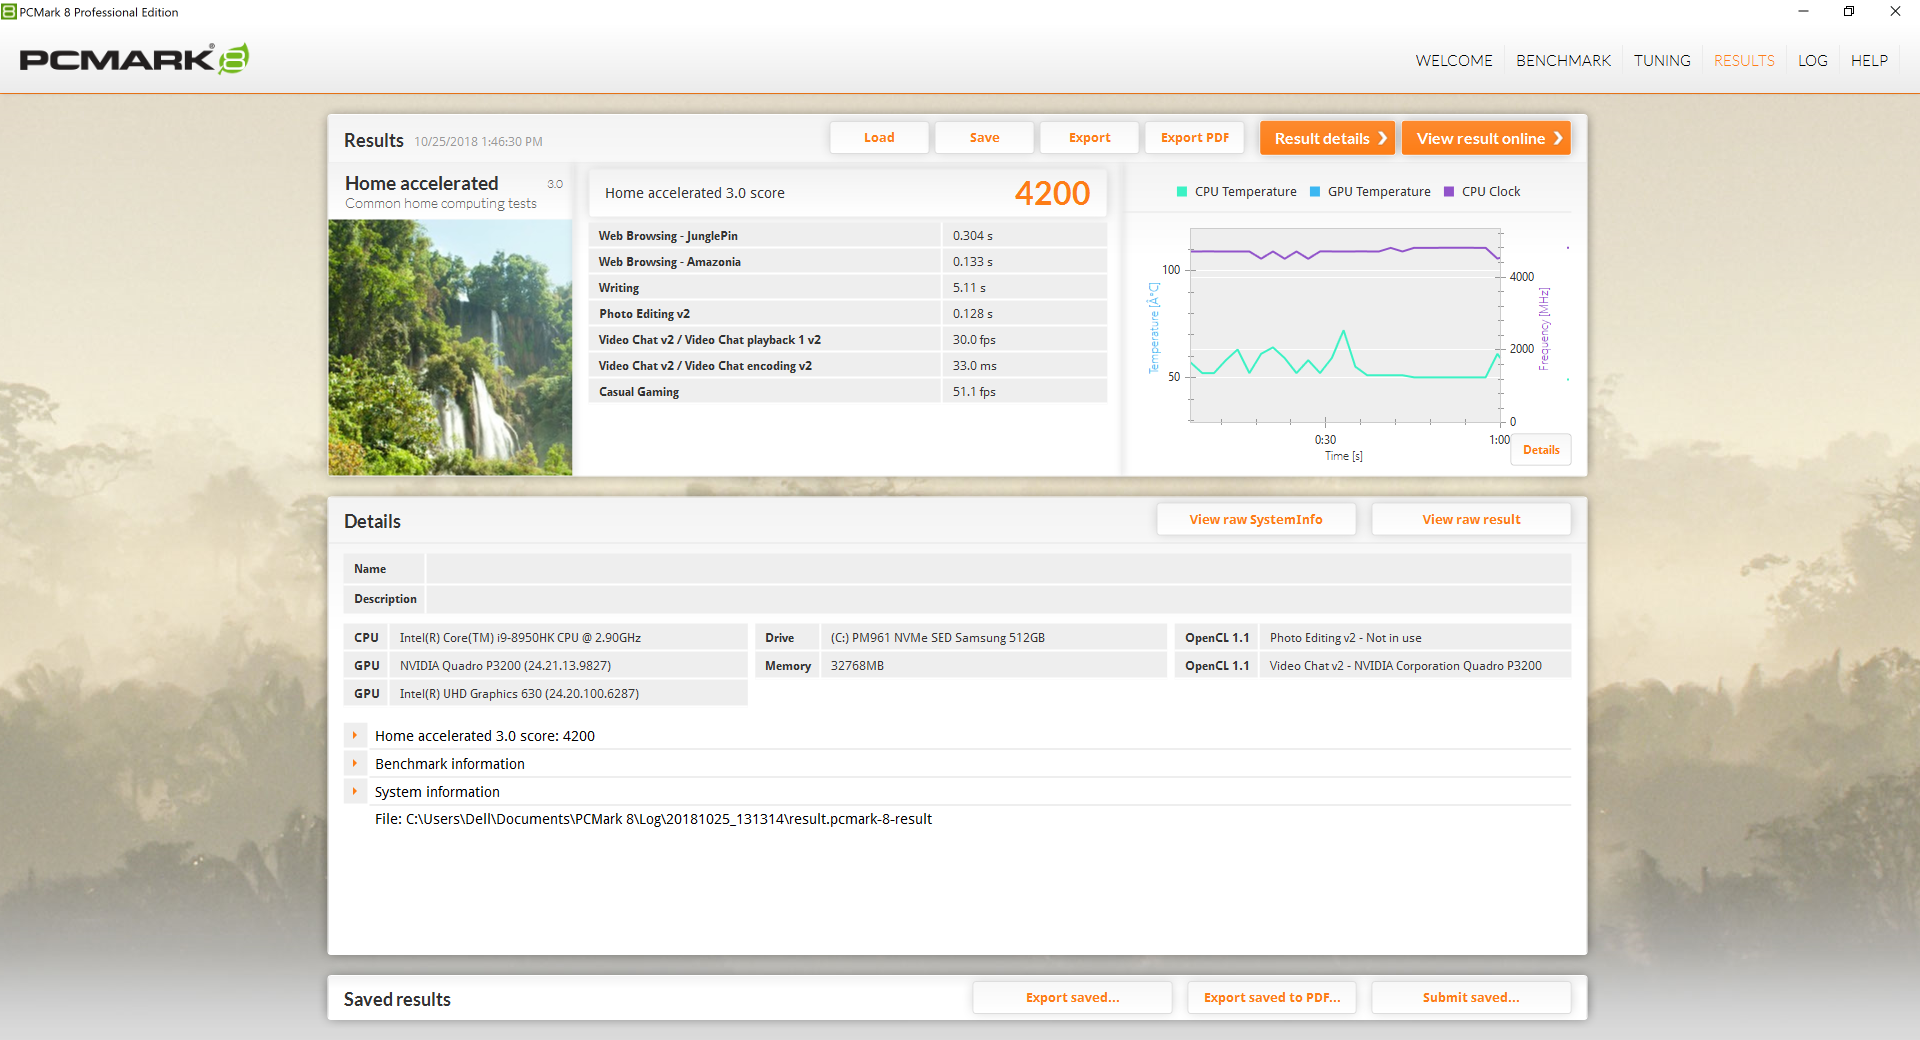
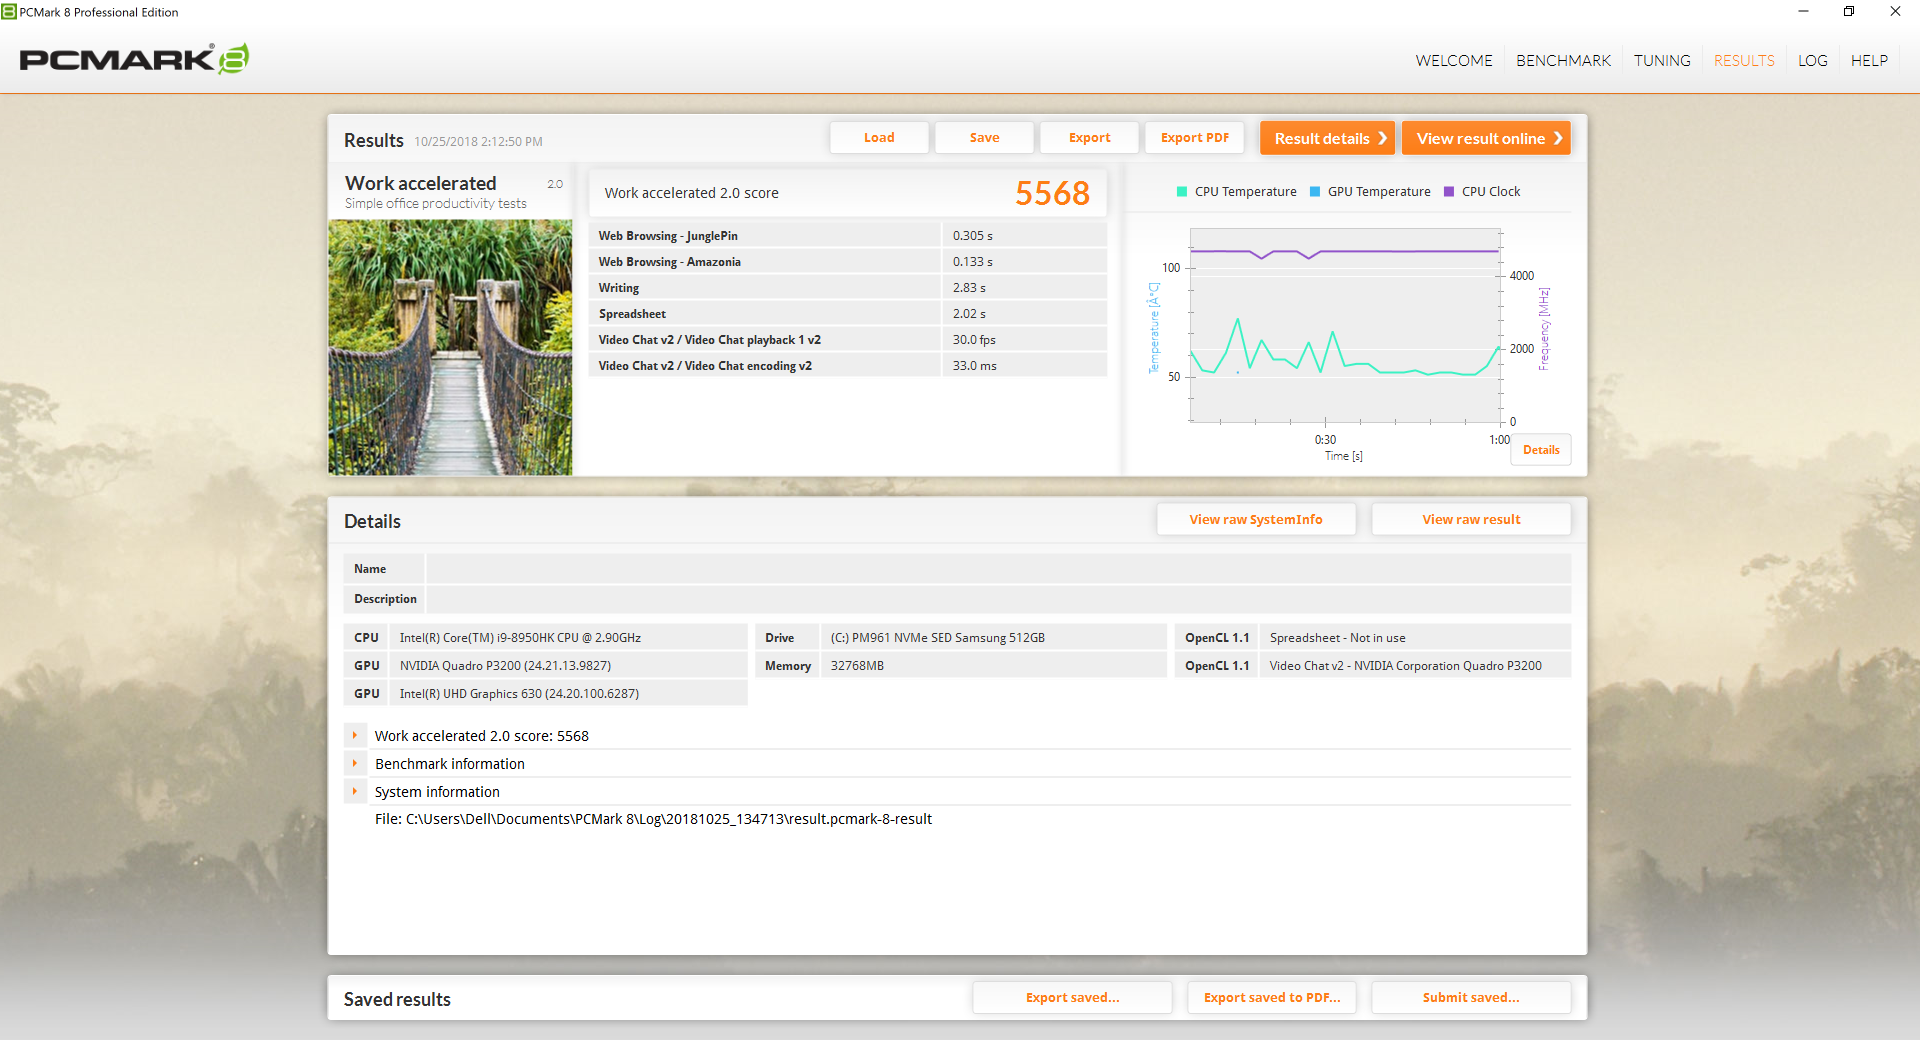
PCMark benchmarks rank our Precision 7530 as one of the fastest notebooks in its class. Its PCMark 10 score is 25 percent higher than the average workstation with results close to the Eurocom Tornado F5W. Even so, differences are not all that large even when compared to the less powerful Precision 5530 2-in-1. Navigation is smooth and near instantaneous as one would expect from a SSD-based PC. We experienced no software or hardware issues during our time with the unit.
| PCMark 8 | |
| Home Score Accelerated v2 | |
| Eurocom Tornado F5W | |
| Dell Precision 3530 | |
| Dell Precision 7530 | |
| Lenovo ThinkPad P1-20MD002LUS | |
| Dell Precision 5530 2-in-1 | |
| Work Score Accelerated v2 | |
| Dell Precision 7530 | |
| Eurocom Tornado F5W | |
| Dell Precision 3530 | |
| Lenovo ThinkPad P1-20MD002LUS | |
| Dell Precision 5530 2-in-1 | |
| Creative Score Accelerated v2 | |
| Eurocom Tornado F5W | |
| Dell Precision 3530 | |
| Lenovo ThinkPad P1-20MD002LUS | |
| PCMark 8 Home Score Accelerated v2 | 4200 points | |
| PCMark 8 Work Score Accelerated v2 | 5568 points | |
| PCMark 10 Score | 5738 points | |
Help | ||
Storage Devices
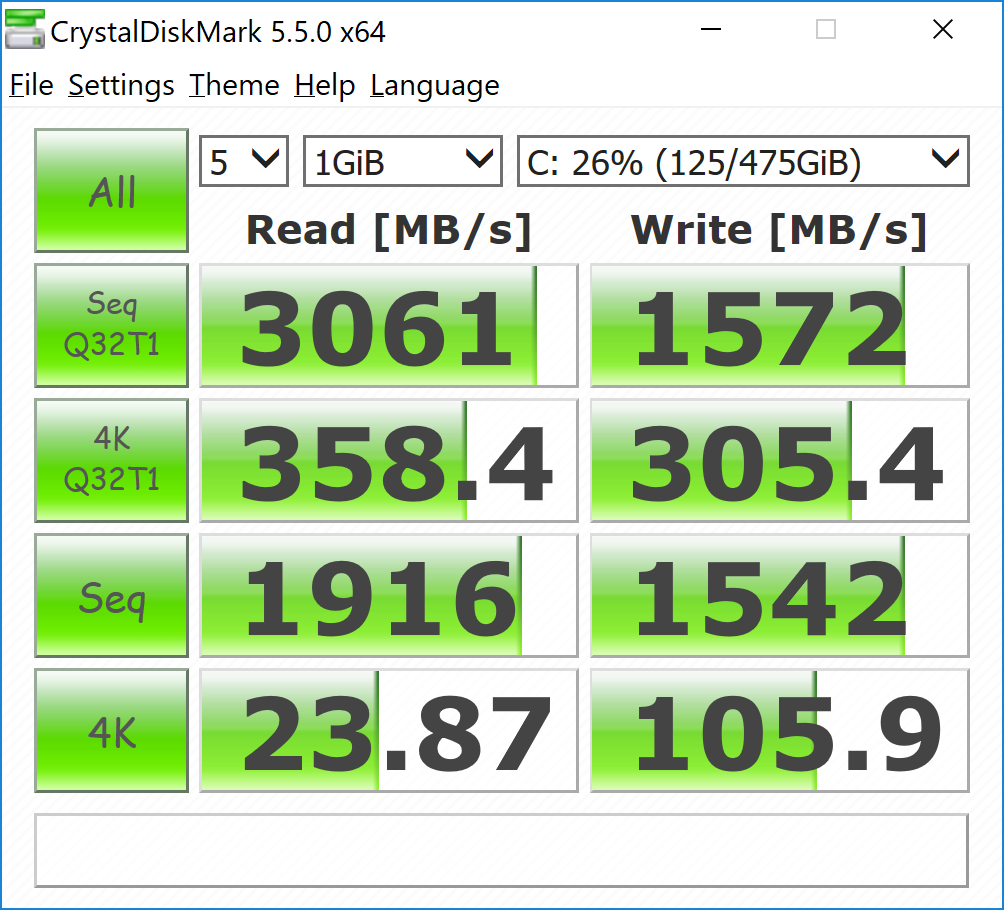
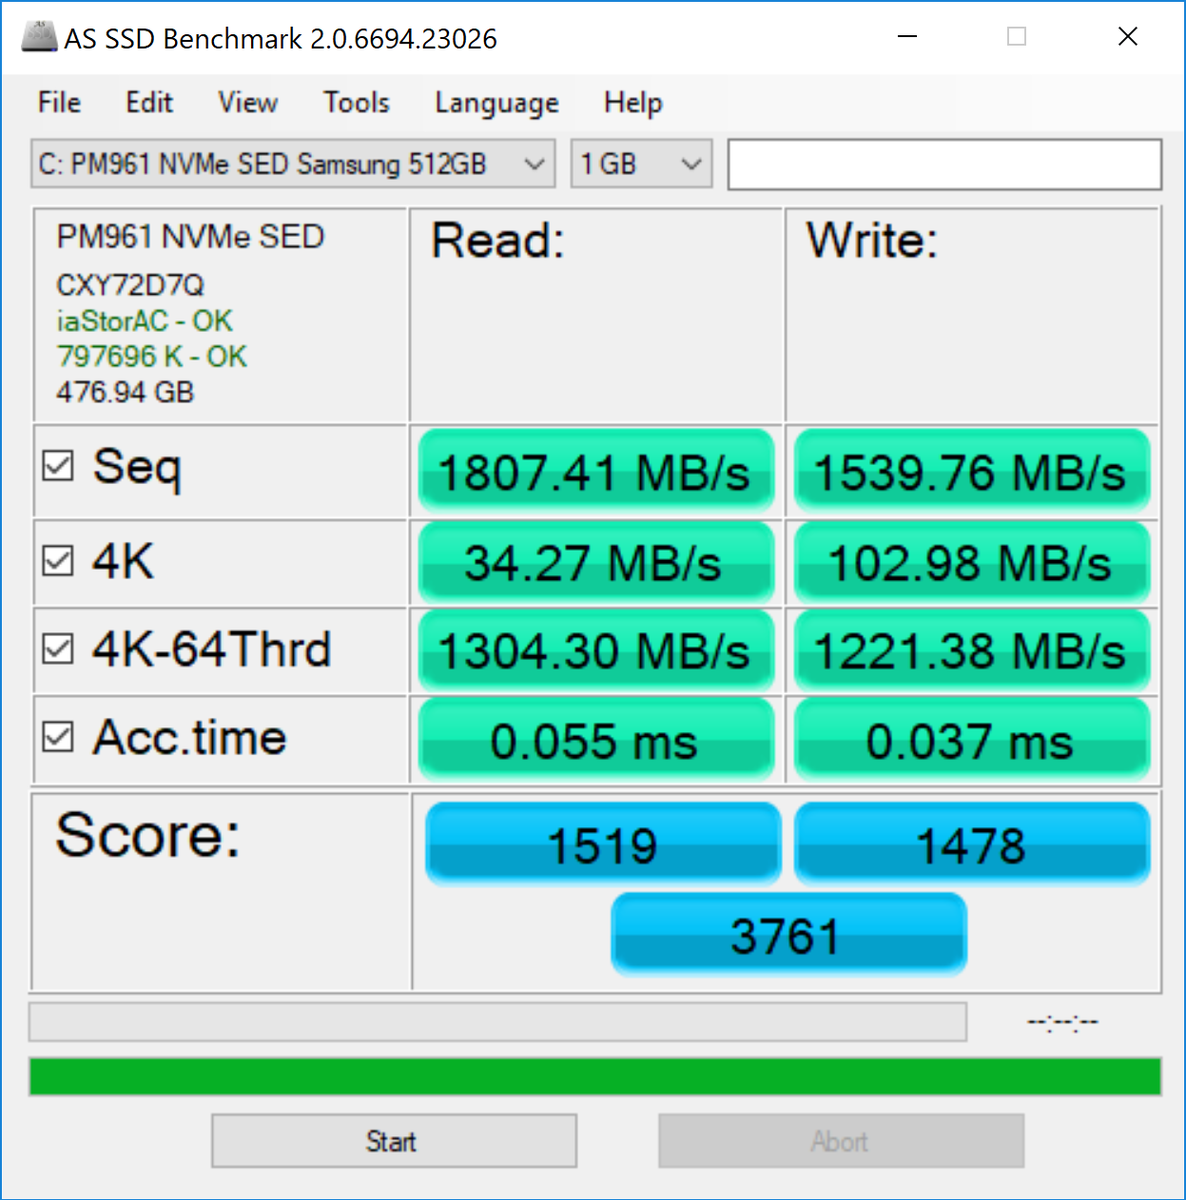
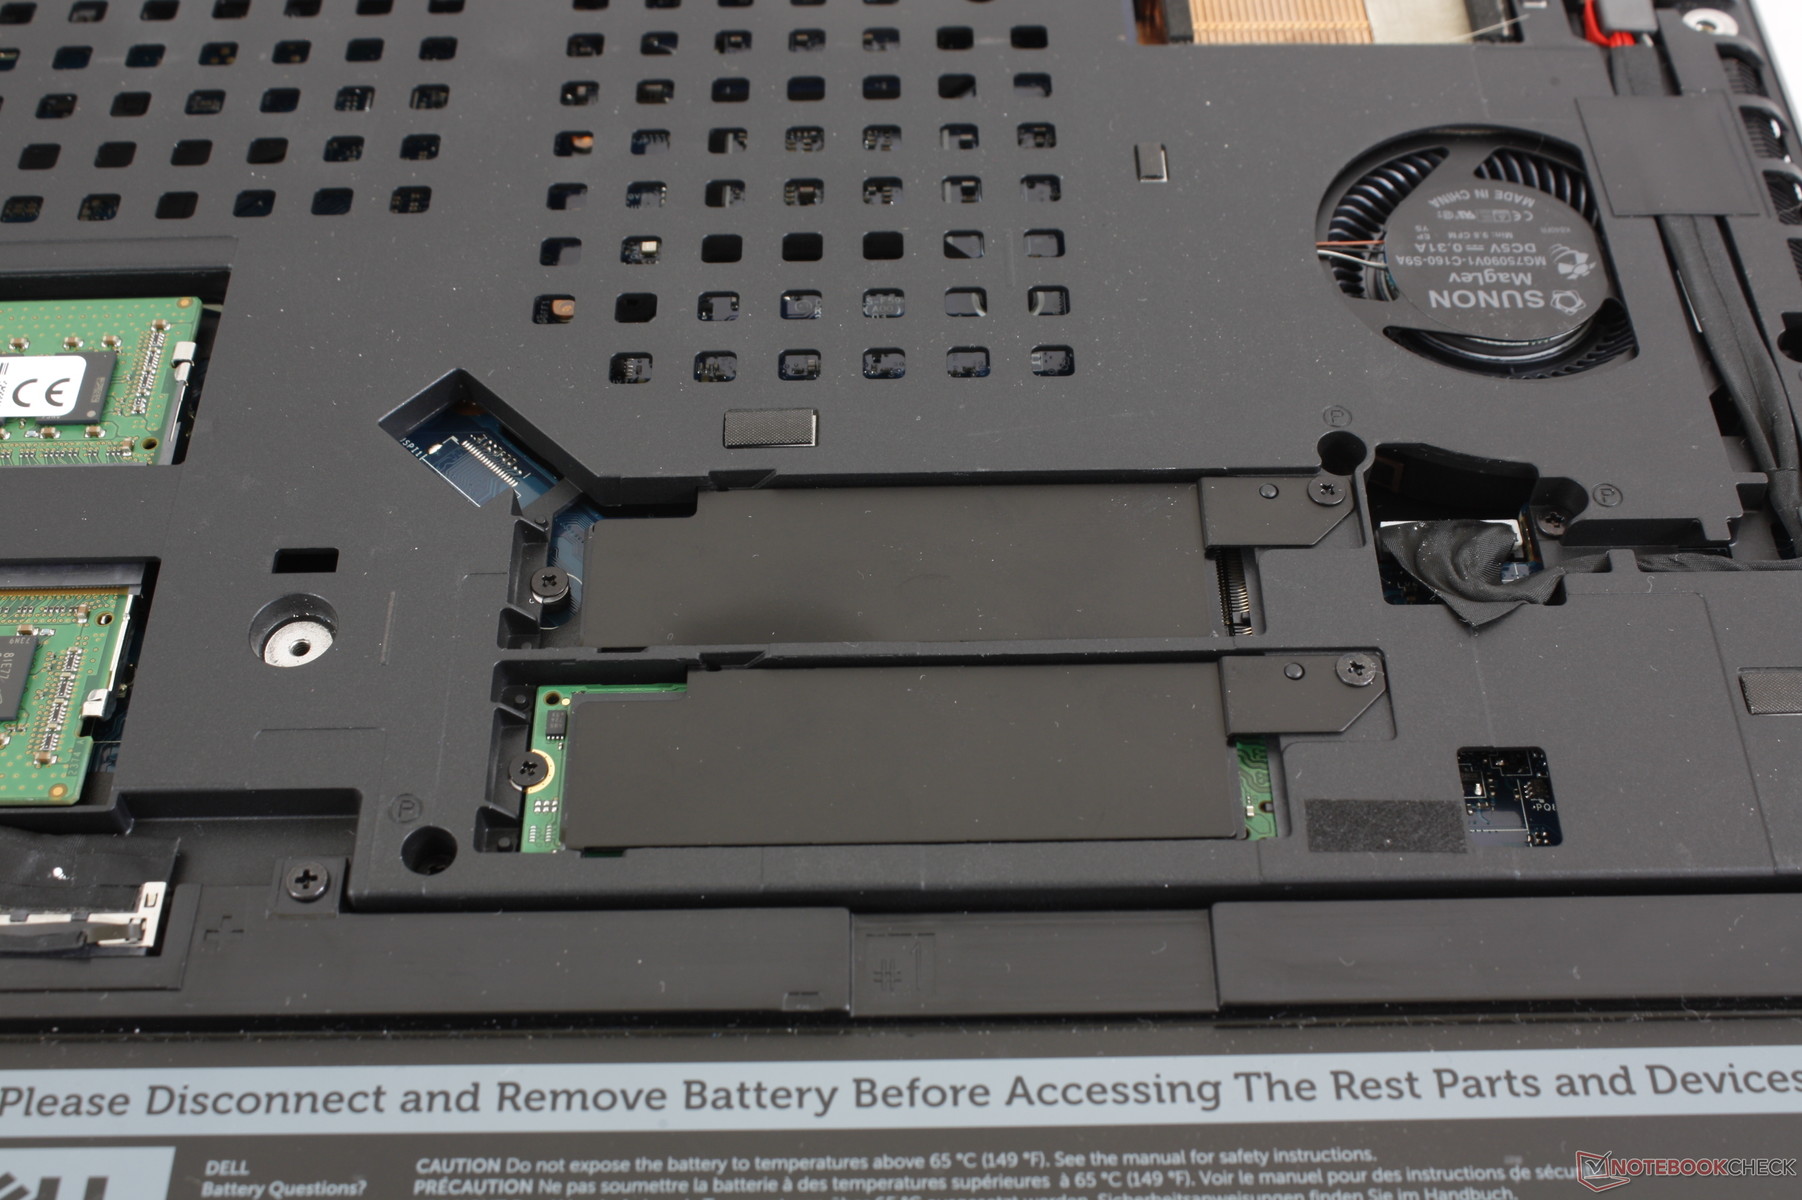
Three RAID-compatible M.2 2280 NVMe storage bays are available by default. Users have the option to replace the third M.2 slot for a 2.5-inch SATA III bay before purchasing, but this is only available in SKUs with the smaller 64 Wh battery. Our test unit is configured with a single 512 GB Samsung PM961 NVMe SSD.
Sequential transfer rates from our Samsung SSD are good at 1807 MB/s read and 1540 MB/s write to be comparable to the SK Hynix 400 in the Precision 3530. The Samsung PM961, however, is rated for a sequential read rate of 3000 MB/s which we are only able to record in the sequential 128KiB block size test. The Samsung SSD 960 Pro in our Eurocom is still the faster SSD overall.
See our table of SSDs and HDDs for more benchmark comparisons.
| Dell Precision 7530 Samsung PM961 NVMe MZVLW512HMJP | Lenovo ThinkPad P1-20MD002LUS Samsung SSD PM981 MZVLB2T0HMLB | Dell Precision 5530 2-in-1 SK Hynix PC401 512GB M.2 (HFS512GD9TNG) | Dell Precision 3530 SK hynix PC400 512 GB | Eurocom Tornado F5W Samsung SSD 960 Pro 512 GB m.2 | HP ZBook 15u G5 2ZC05EA Toshiba XG5 KXG50ZNV256G | |
|---|---|---|---|---|---|---|
| CrystalDiskMark 5.2 / 6 | 12% | 1% | 11% | 64% | -15% | |
| Write 4K (MB/s) | 105.9 | 108 2% | 128.9 22% | 113.6 7% | 211.4 100% | 98.8 -7% |
| Read 4K (MB/s) | 23.87 | 37.24 56% | 45.7 91% | 41.18 73% | 56.7 138% | 33.98 42% |
| Write Seq (MB/s) | 1542 | 1476 -4% | 635 -59% | 1417 -8% | 1983 29% | 395.7 -74% |
| Read Seq (MB/s) | 1916 | 1367 -29% | 2065 8% | 1896 -1% | 2841 48% | 2063 8% |
| Write 4K Q32T1 (MB/s) | 305.4 | 302.4 -1% | 336.6 10% | 355 16% | 571 87% | 352.3 15% |
| Read 4K Q32T1 (MB/s) | 358.4 | 375 5% | 393.6 10% | 404.3 13% | 606 69% | 281.8 -21% |
| Write Seq Q32T1 (MB/s) | 1572 | 2433 55% | 662 -58% | 1411 -10% | 1986 26% | 355 -77% |
| Read Seq Q32T1 (MB/s) | 3061 | 3493 14% | 2664 -13% | 3095 1% | 3467 13% | 2775 -9% |
| Write 4K Q8T8 (MB/s) | 361 | |||||
| Read 4K Q8T8 (MB/s) | 447.3 |

GPU Performance
The Quadro P3200 is most similar to the GTX 1060 according to 3DMark benchmarks. Users can expect a significant performance advantage over the Quadro P2000 and last generation M2000M by 70 percent and 170 percent, respectively. If more power is desired, the Precision 7720 with Quadro P5000 graphics can offer a 30 percent graphics boost. As for workstation performance, SpecViewPerf 12 shows the P3200 consistently outperforming the P2000 by wide margins yet again.
Nvidia Quadro GPUs are more than capable at playing the latest games even if gaming is not their intention. The P3200 has the 1080p prowess of a GTX 1060 but with even better 4K capabilities because of its higher shader count. While not the most efficient way to play games in 4K, it's certainly possible at 30 FPS or higher with settings tuned down. Frame rates are stable with no recurring drops as shown by our Witcher 3 graph below.
Annoyingly, games are locked to 60 FPS by default even when on High Performance mode and with V-Sync disabled. This can be rectified by right-clicking the exe file and checking the box "Disable fullscreen optimizations".
See our dedicated page on the Quadro P3200 for more technical information and benchmark comparisons.

| 3DMark 06 Standard Score | 24576 points | |
| 3DMark Vantage P Result | 45851 points | |
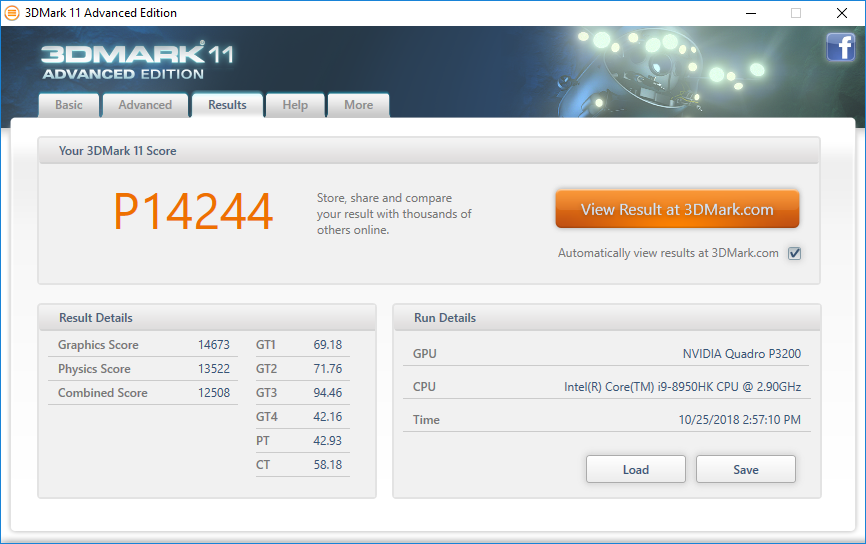
| 3DMark 11 Performance | 14244 points | |
| 3DMark Ice Storm Standard Score | 49190 points | |
| 3DMark Cloud Gate Standard Score | 30100 points | |
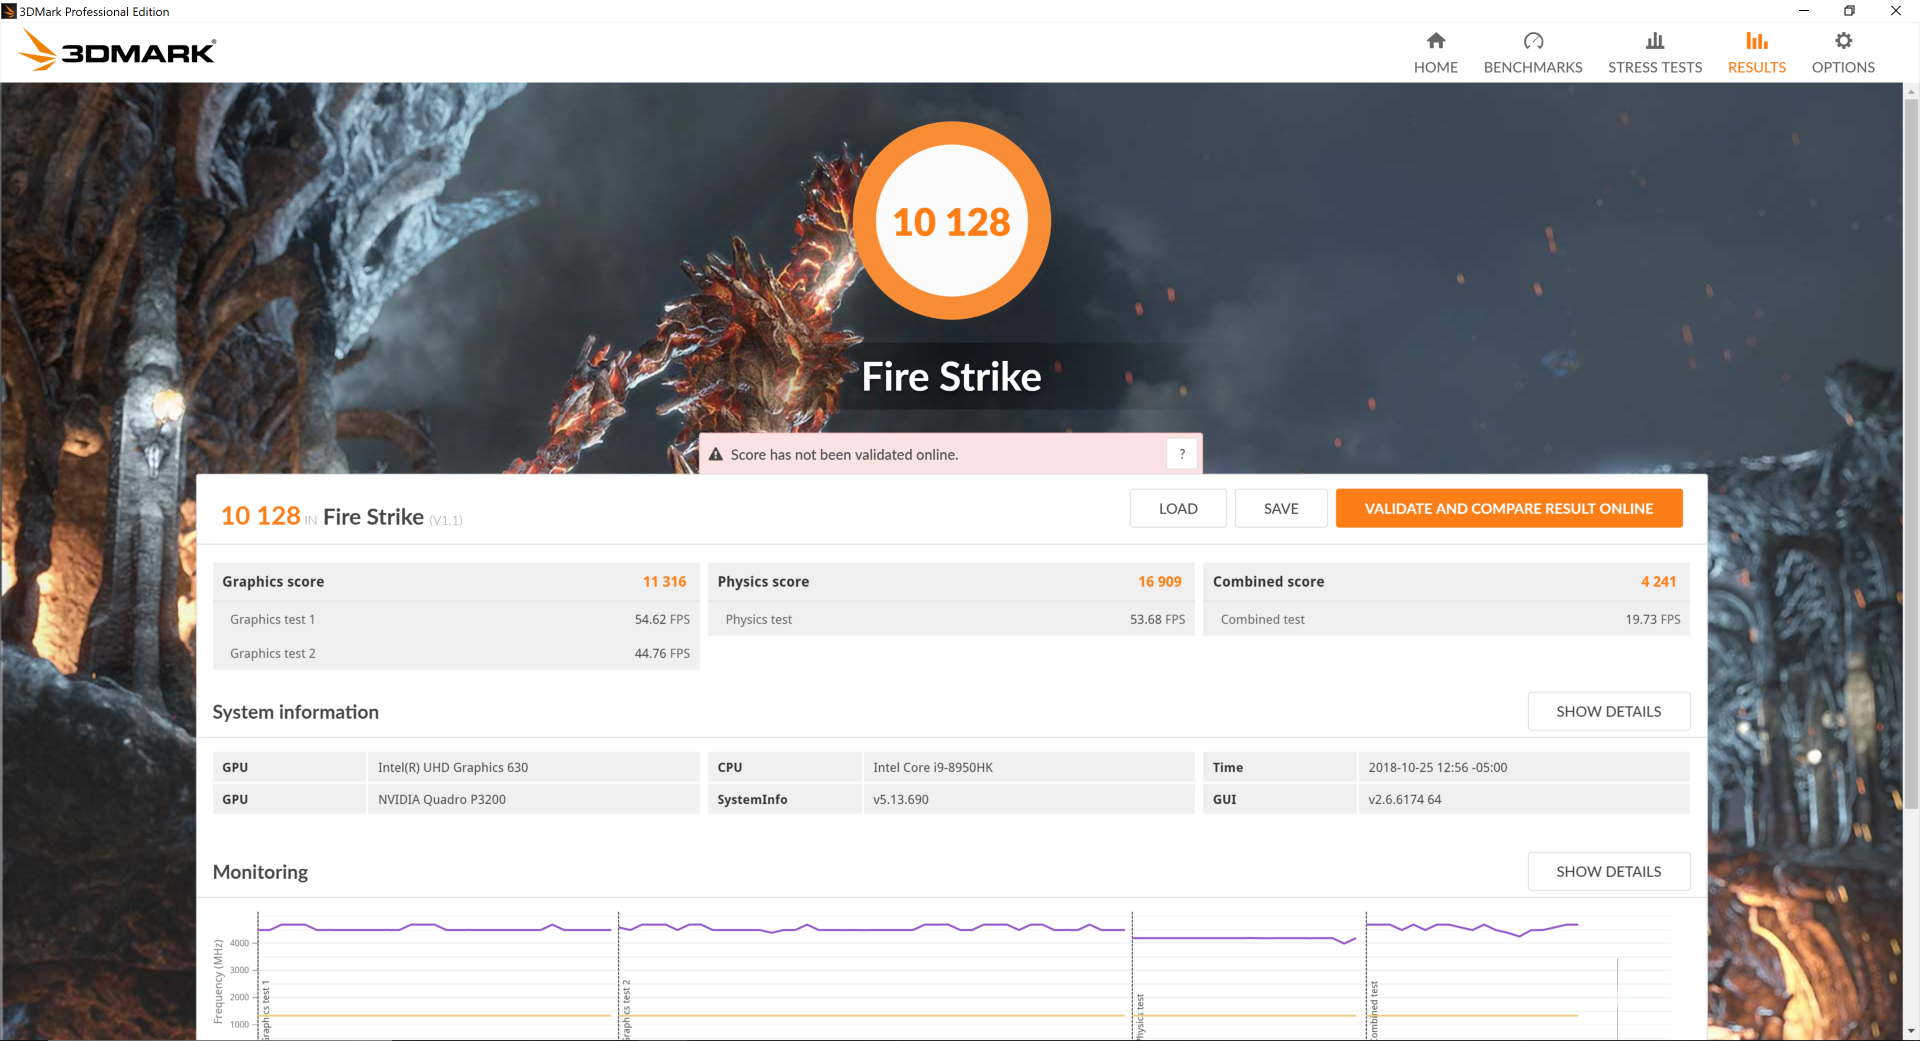
| 3DMark Fire Strike Score | 10128 points | |
| 3DMark Time Spy Score | 3979 points | |
Help | ||
| The Witcher 3 - 1920x1080 Ultra Graphics & Postprocessing (HBAO+) | |
| Eurocom Tornado F5W | |
| Average NVIDIA Quadro P3200 (41.6 - 46.4, n=4) | |
| Nvidia GeForce GTX 1060 Founders Edition 6 GB | |
| Dell Precision 7530 | |
| Dell Precision 5530 Xeon E-2176M | |
| Lenovo ThinkPad P1-20MD002LUS | |
| HP ZBook 15 G4-Y4E80AV | |
| Lenovo ThinkPad P52 20MAS03N00 | |
| Dell Precision 3530 | |
Frame rates are stable when idling on Witcher 3 to show no interrupting background activity.
| low | med. | high | ultra | 4K | |
|---|---|---|---|---|---|
| The Witcher 3 (2015) | 208.9 | 141 | 80.6 | 41.6 | 28.2 |
| Batman: Arkham Knight (2015) | 140 | 127 | 89 | 59 | 29 |
| Rise of the Tomb Raider (2016) | 180.9 | 139.7 | 77.4 | 65.8 | 27.6 |
Emissions
System Noise
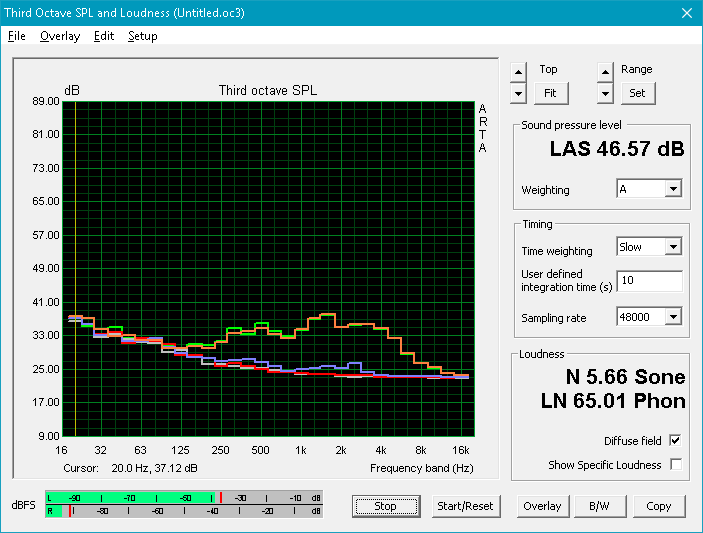
The cooling solution consists of two fans and just three heat pipes between them. Both fans will idle during very low loads like emailing or streaming for a silent experience. After a few minutes, however, fan noise jumps to about 30.3 dB(A) which is still quiet enough to be unnoticeable. We applaud Dell for its excellent fan behavior here during low loads with no pulsing to speak of especially when considering the powerful internals.
Fan noise jumps dramatically when under gaming loads or higher. When under these conditions, the 7530 becomes not all that different from the 7510. Expect a fan noise of almost 50 dB(A) during heavy use to be significantly louder than the its closest competitors including the more powerful Eurocom Tornado F5W.
We can notice some slight electronic noise from our test unit when placing an ear near the keyboard. It's not noticeable during regular use in an office environment, though we were expecting better from a machine in this price range.
| Dell Precision 7530 i9-8950HK, Quadro P3200 | HP ZBook 15 G4-Y4E80AV E3-1535M v6, Quadro M2200 | Dell Precision 7510 (4K IGZO) E3-1535M v5, Quadro M2000M | Lenovo ThinkPad P52 20MAS03N00 i7-8750H, Quadro P1000 | Lenovo ThinkPad P1-20MD002LUS E-2176M, Quadro P2000 Max-Q | Eurocom Tornado F5W E3-1280 v5, Quadro P5000 | |
|---|---|---|---|---|---|---|
| Noise | 3% | -3% | 6% | 3% | 0% | |
| off / environment * (dB) | 28.3 | 29.5 -4% | 28.2 -0% | 29.5 -4% | 28.3 -0% | 29.6 -5% |
| Idle Minimum * (dB) | 28.3 | 29.5 -4% | 29.8 -5% | 29.5 -4% | 28.4 -0% | 31.2 -10% |
| Idle Average * (dB) | 28.3 | 29.5 -4% | 29.8 -5% | 29.5 -4% | 28.4 -0% | 31.2 -10% |
| Idle Maximum * (dB) | 30.5 | 30 2% | 31.2 -2% | 29.5 3% | 29.2 4% | 32.6 -7% |
| Load Average * (dB) | 34.5 | 39.5 -14% | 37.2 -8% | 34.7 -1% | 41.8 -21% | 32.6 6% |
| Witcher 3 ultra * (dB) | 49.5 | 39.5 20% | 33.1 33% | 39.1 21% | 43.1 13% | |
| Load Maximum * (dB) | 49.5 | 36 27% | 49.4 -0% | 39.4 20% | 41.8 16% | 43.3 13% |
* ... smaller is better
Noise level
| Idle |
| 28.3 / 28.3 / 30.5 dB(A) |
| Load |
| 34.5 / 49.5 dB(A) |
 | ||
30 dB silent 40 dB(A) audible 50 dB(A) loud |
||
min: | ||
Temperature
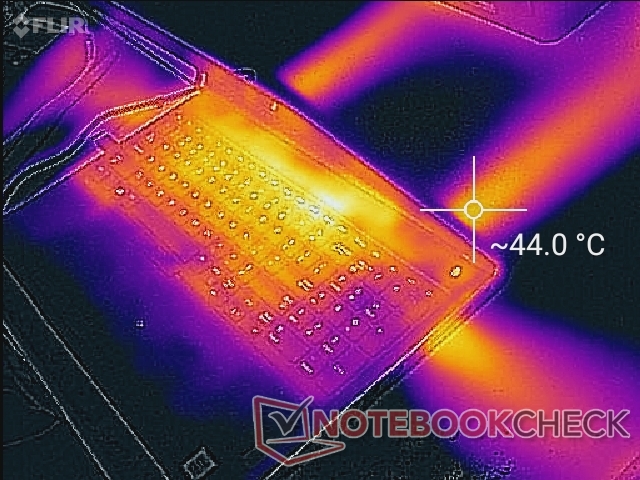
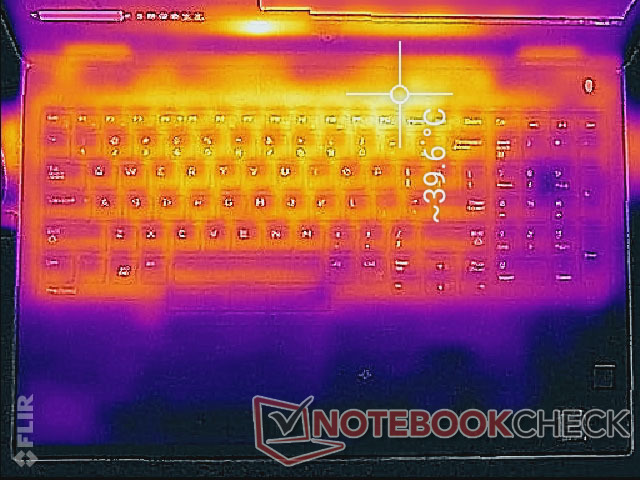
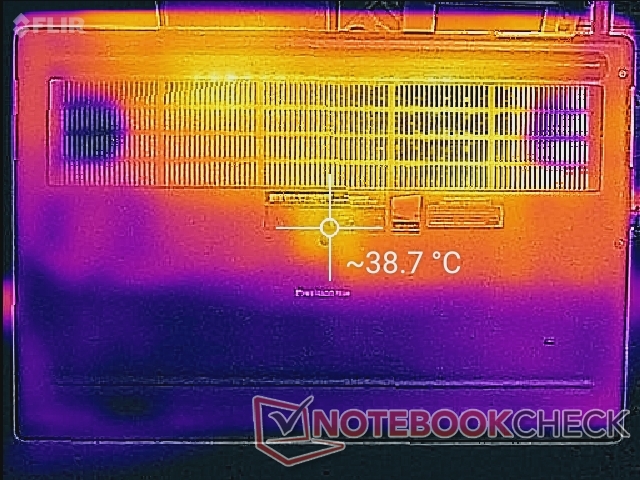
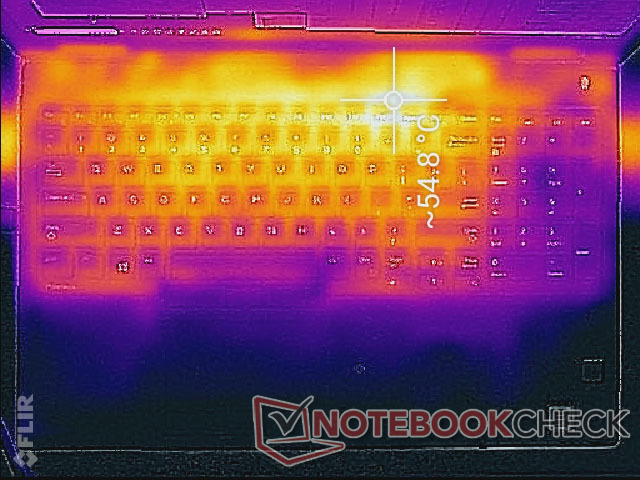
Surface temperatures are warmer than expected at almost 40 C when idling on desktop likely due to the idling fans. Thankfully, this hot spot is above the first row or keyboards keys and away from the palm rests. The warm surface is not distracting during use, though be prepared for warm keys nonetheless. Note that the keyboard side of this particular notebook will always be warmer on average than the bottom of the notebook since the processors are closer to the top surface than to the bottom.
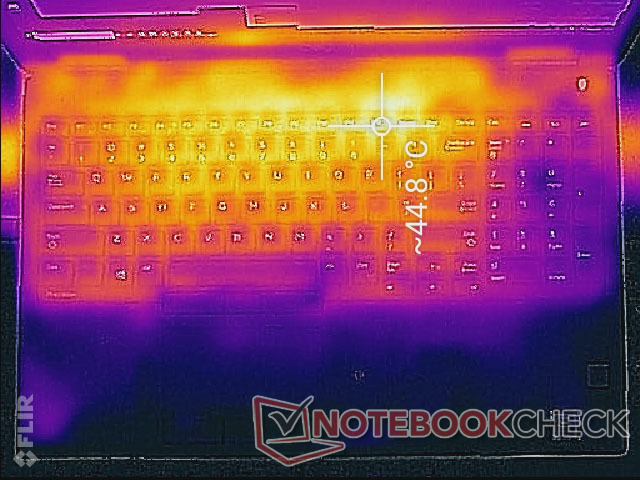
When under more extreme processing loads, the same hot spot on the keyboard can become as warm as 55 C compared to just 43 C on the ThinkPad P1.
The very warm temperatures above can be traced back to warm processors. When idling, we are able to record a high CPU temperature of 66 C. If on the Power Saver profile, core temperature drops to 47 C and so we recommend being in Power Saver mode if the horsepower is not needed.
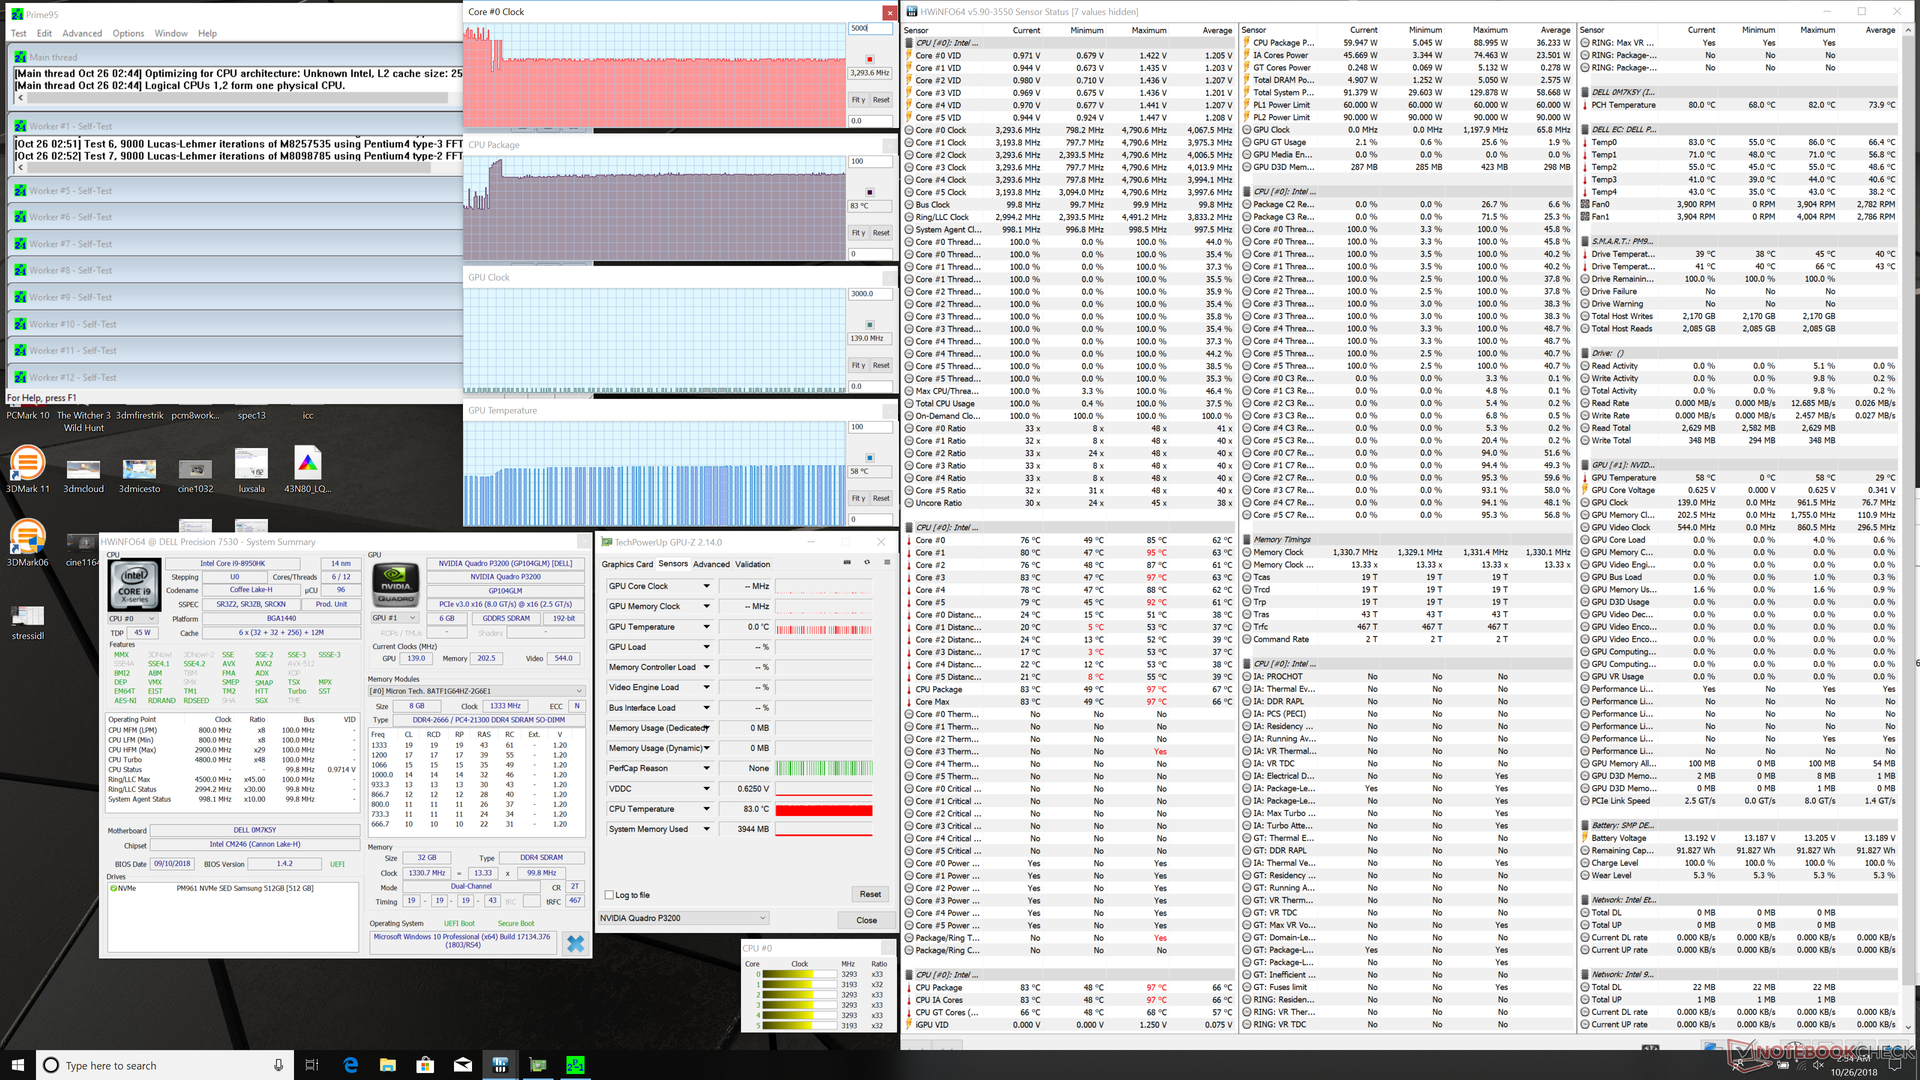
When running Prime95 to stress the CPU, we can observe clock rates of up to 4.2 GHz for the first few seconds before hitting 97 C. Thereafter, clock rates drop to 3.2 GHz to maintain a cooler core temperature of 83 C. With temperatures this high, it's clear that the Core i9 CPU is pushing the cooling solution to its limits. The base clock rate of the i9-8950HK is 2.9 GHz and so the system is only able to sustain a Turbo Boost clock rate of +300 MHz. Running both Prime95 and FurMark simultaneously brings the CPU back up to 96 C without impacting CPU clock rate.
Witcher 3 stress is more representative of real-world demanding load. Both the CPU and GPU are much cooler at 73 C and 62 C, respectively.
Running on batteries will impact CPU and GPU performance even when set to the High Performance profiles on Windows, Nvidia Control Center, and the Dell Power Manager. A 3DMark 11 run on battery power returns Physics and Graphics scores of only 10400 and 5697 points, respectively, compared to 13522 and 14673 points when on mains. This is a disappointing find especially from a high performance workstation.
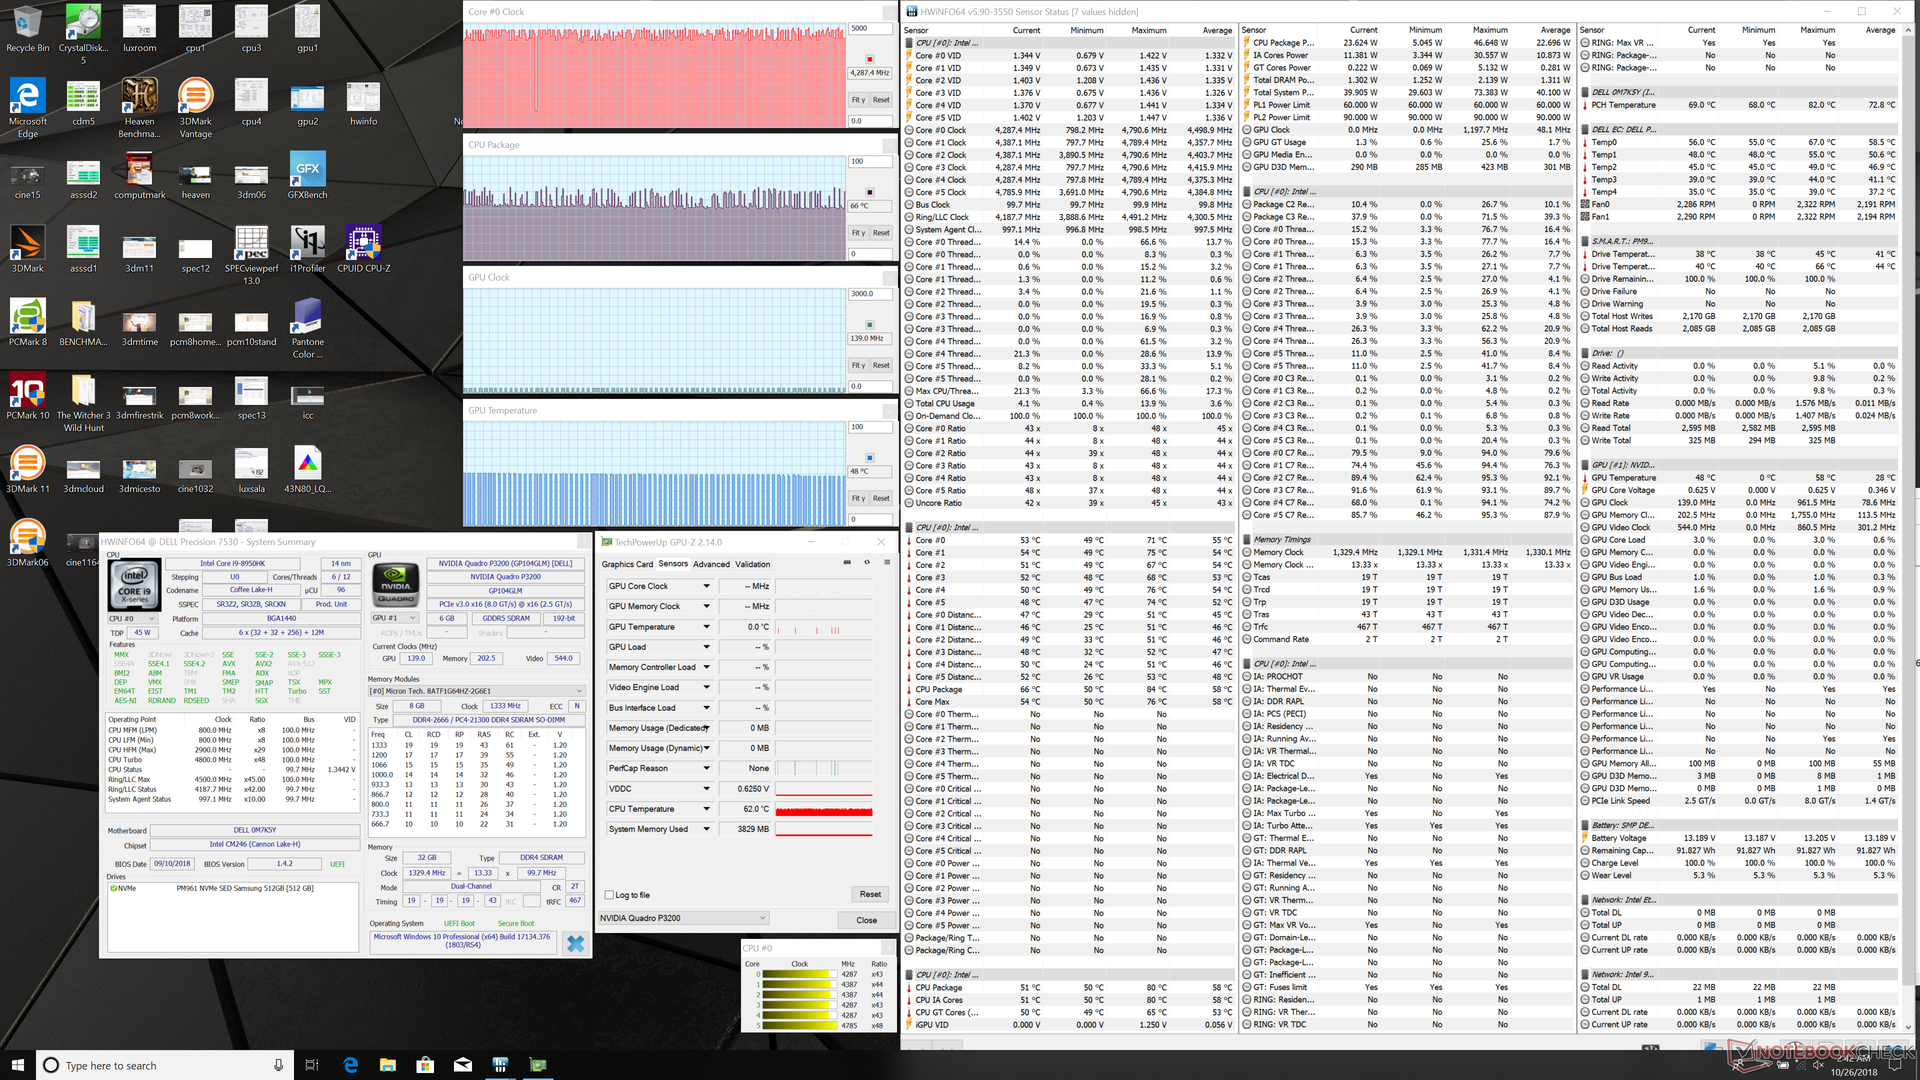
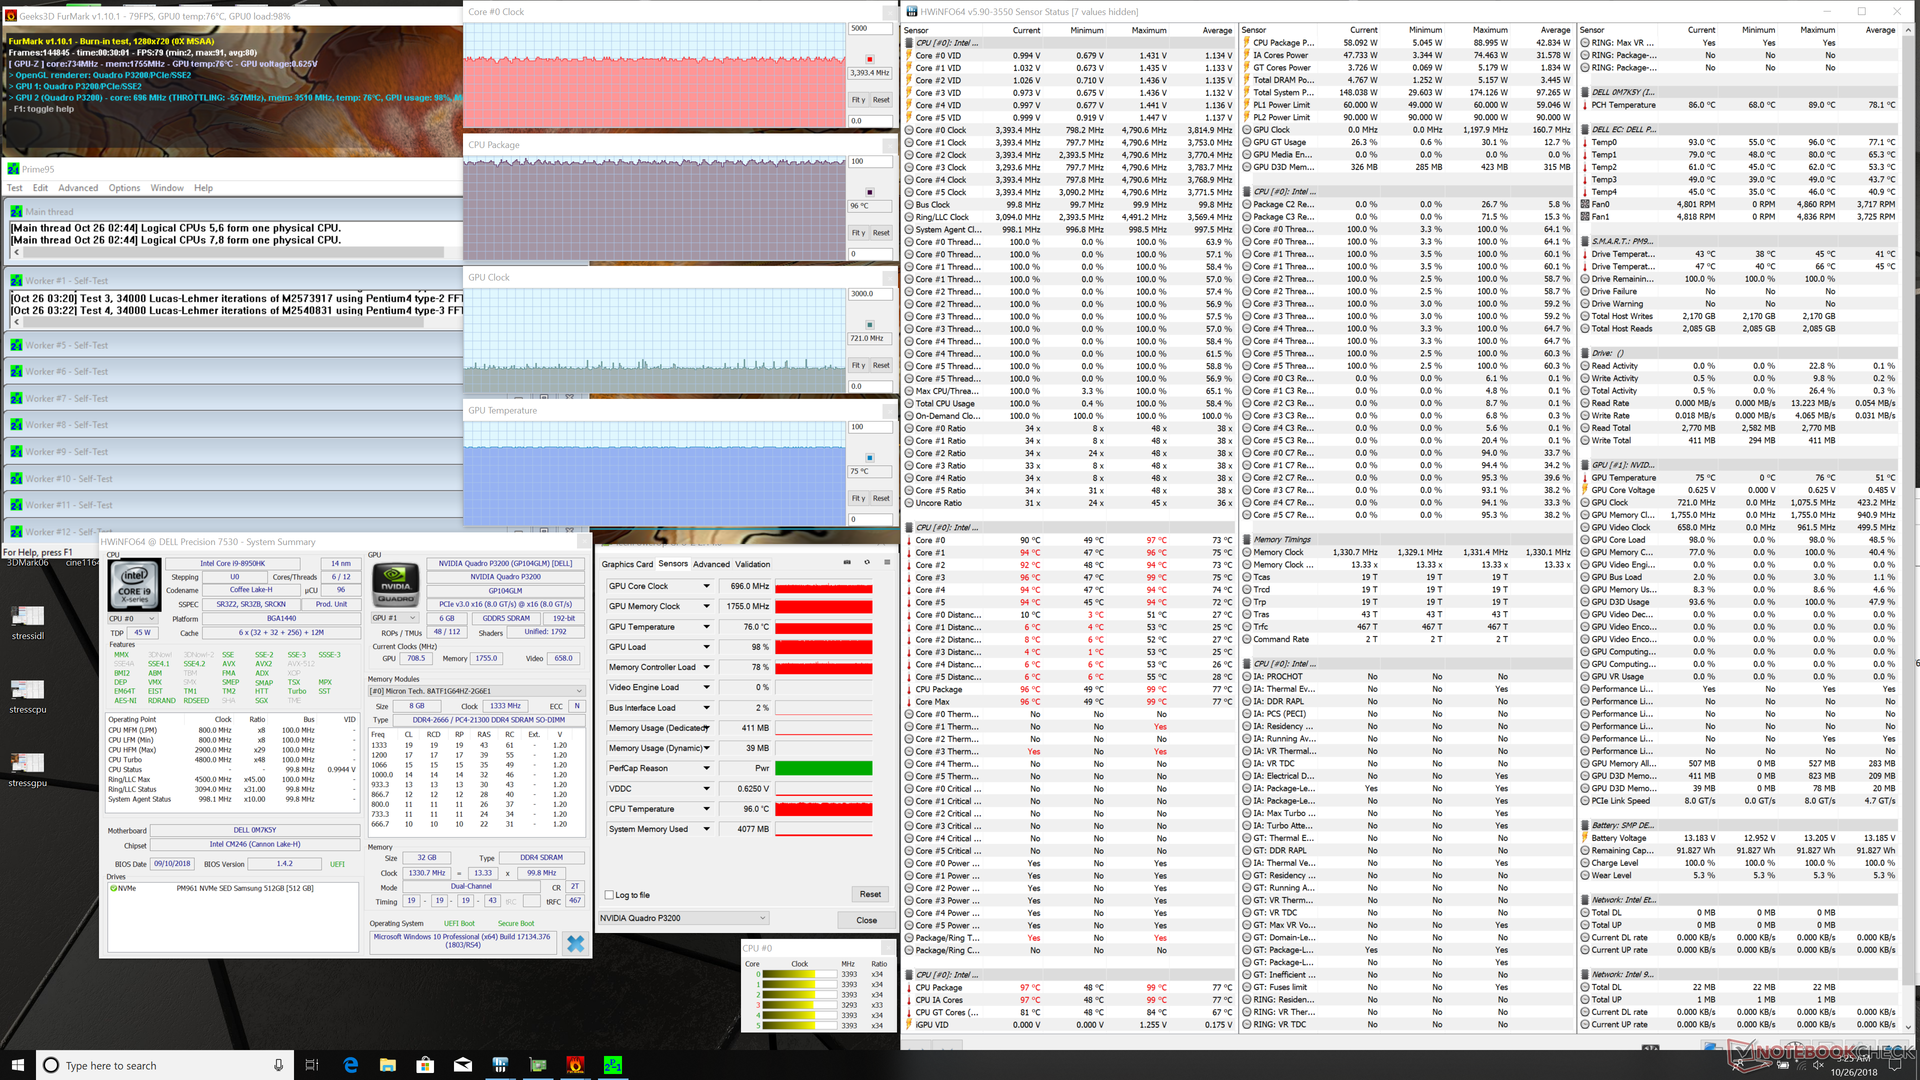
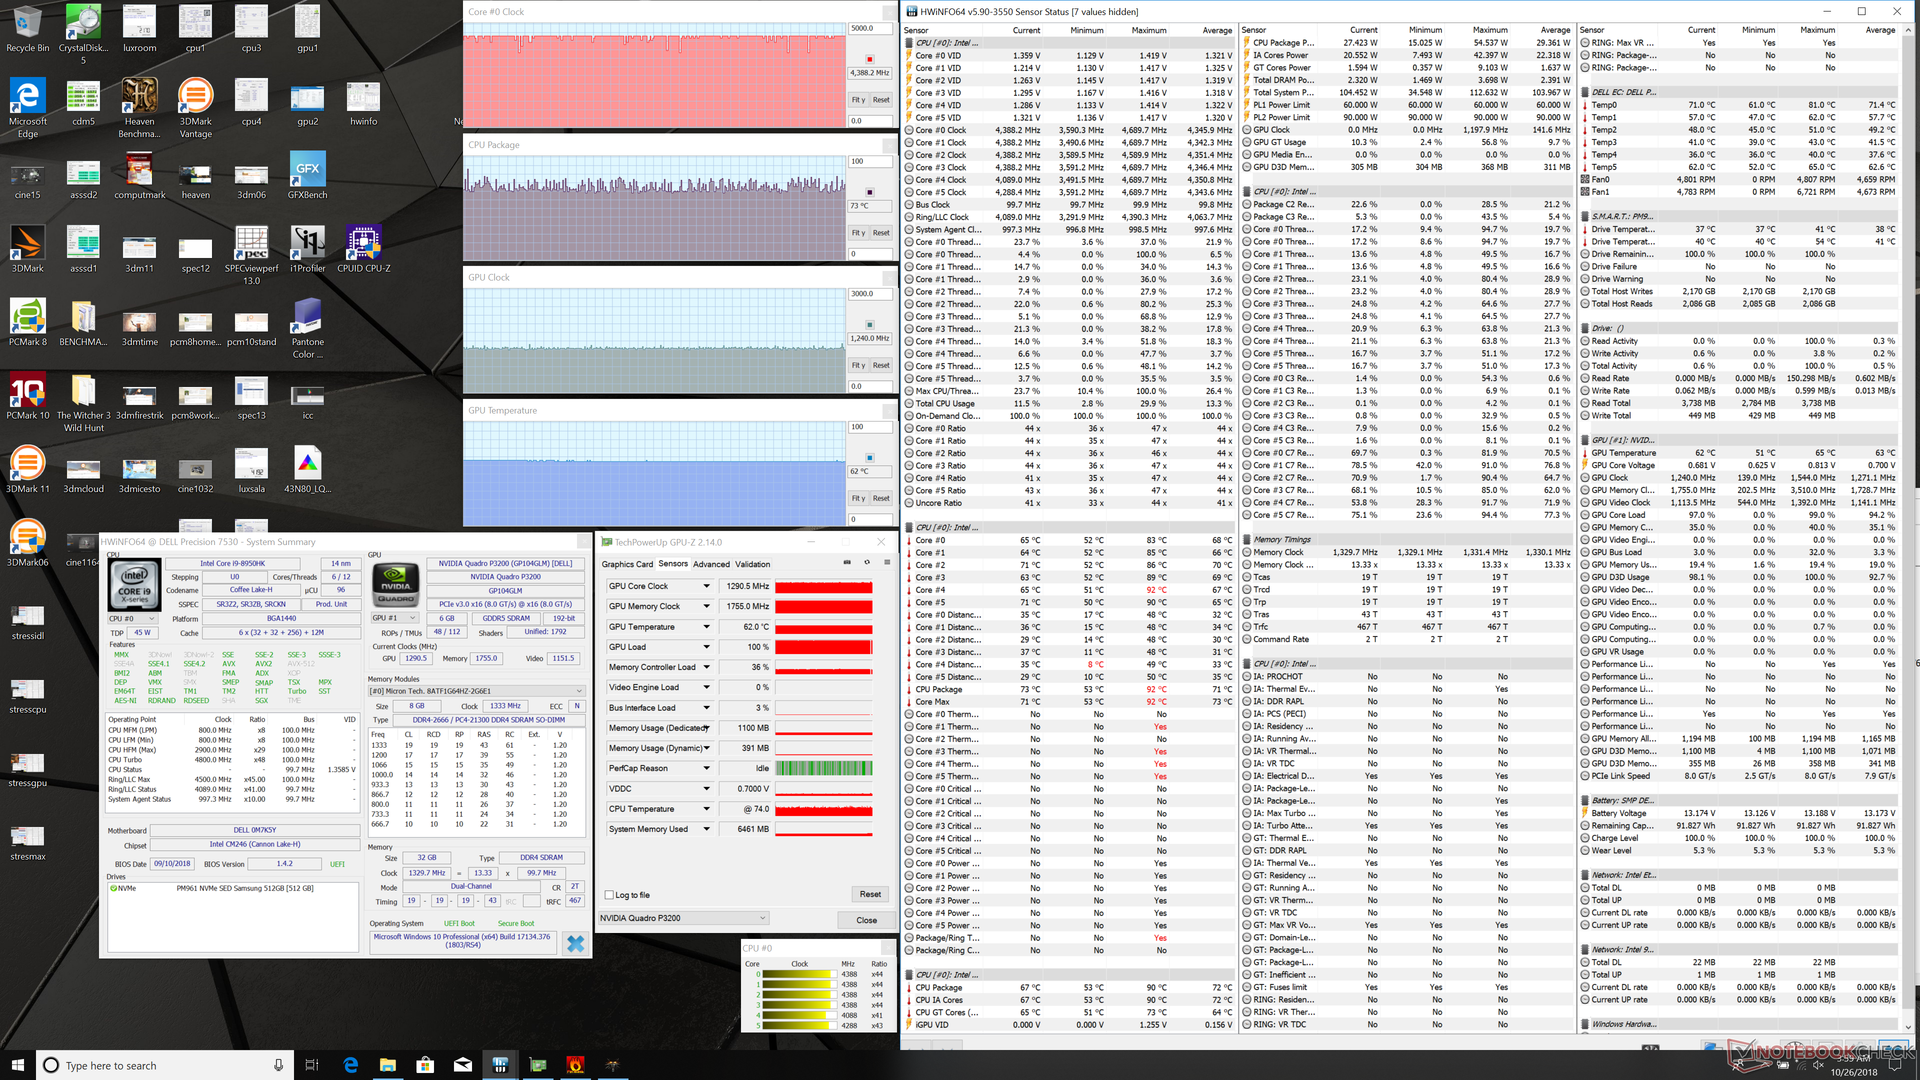
| CPU Clock (GHz) | GPU Clock (MHz) | Average CPU Temperature (°C) | Average GPU Temperature (°C) | |
| System Idle | -- | -- | ~66 | 48 |
| Prime95 Stress | 3.3 | -- | 83 | -- |
| Prime95 + FurMark Stress | 3.3 - 3.4 | 721 | 96 | 75 |
| Witcher 3 Stress | 4.4 | 1240 | ~73 | 62 |
(-) The maximum temperature on the upper side is 54.4 °C / 130 F, compared to the average of 38.2 °C / 101 F, ranging from 22.2 to 69.8 °C for the class Workstation.
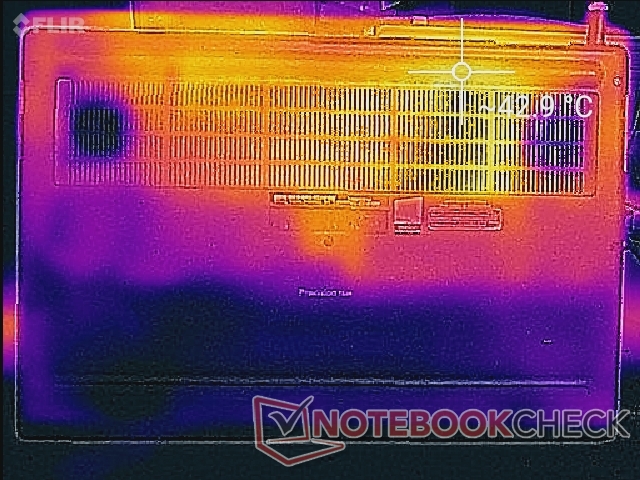
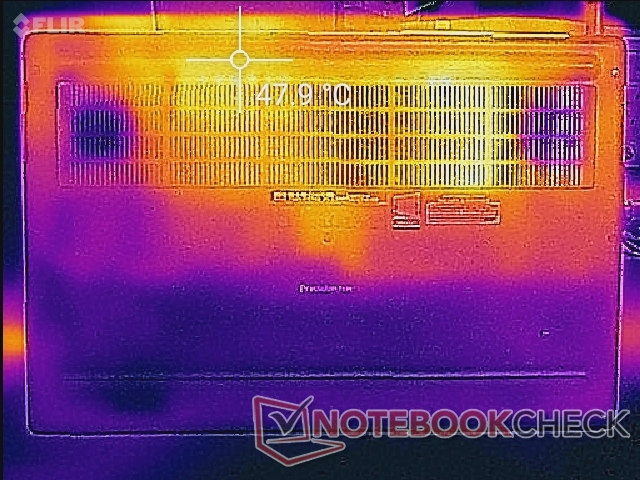
(-) The bottom heats up to a maximum of 49 °C / 120 F, compared to the average of 41.1 °C / 106 F
(±) In idle usage, the average temperature for the upper side is 33 °C / 91 F, compared to the device average of 32 °C / 90 F.
(±) Playing The Witcher 3, the average temperature for the upper side is 34.9 °C / 95 F, compared to the device average of 32 °C / 90 F.
(+) The palmrests and touchpad are cooler than skin temperature with a maximum of 28.8 °C / 83.8 F and are therefore cool to the touch.
(±) The average temperature of the palmrest area of similar devices was 27.8 °C / 82 F (-1 °C / -1.8 F).
Speakers
Sound quality from the speakers is above average. Our pink noise measurements show a relatively even reproduction of mid and high tones with respectable bass. It's certainly better than expected from a workstation.
The chassis will vibrate from the speakers even when set to just 50 percent volume. There's thankfully no rattling, but the vibration is noticeable on the palms and fingers more so than on other laptops.


Dell Precision 7530 audio analysis
(±) | speaker loudness is average but good (74.4 dB)
Bass 100 - 315 Hz
(±) | reduced bass - on average 8% lower than median
(±) | linearity of bass is average (12.3% delta to prev. frequency)
Mids 400 - 2000 Hz
(+) | balanced mids - only 3.3% away from median
(±) | linearity of mids is average (7.8% delta to prev. frequency)
Highs 2 - 16 kHz
(+) | balanced highs - only 2.3% away from median
(+) | highs are linear (5% delta to prev. frequency)
Overall 100 - 16.000 Hz
(+) | overall sound is linear (11.4% difference to median)
Compared to same class
» 13% of all tested devices in this class were better, 4% similar, 83% worse
» The best had a delta of 7%, average was 17%, worst was 35%
Compared to all devices tested
» 7% of all tested devices were better, 2% similar, 90% worse
» The best had a delta of 4%, average was 23%, worst was 134%
Apple MacBook 12 (Early 2016) 1.1 GHz audio analysis
(+) | speakers can play relatively loud (83.6 dB)
Bass 100 - 315 Hz
(±) | reduced bass - on average 11.3% lower than median
(±) | linearity of bass is average (14.2% delta to prev. frequency)
Mids 400 - 2000 Hz
(+) | balanced mids - only 2.4% away from median
(+) | mids are linear (5.5% delta to prev. frequency)
Highs 2 - 16 kHz
(+) | balanced highs - only 2% away from median
(+) | highs are linear (4.5% delta to prev. frequency)
Overall 100 - 16.000 Hz
(+) | overall sound is linear (10.2% difference to median)
Compared to same class
» 7% of all tested devices in this class were better, 2% similar, 90% worse
» The best had a delta of 5%, average was 18%, worst was 53%
Compared to all devices tested
» 5% of all tested devices were better, 1% similar, 94% worse
» The best had a delta of 4%, average was 23%, worst was 134%
Energy Management
Power Consumption
The system is more demanding than expected when idling on desktop as our unit draws anywhere between 15 W and 26 W compared to half that on the Lenovo ThinkPad P1. Power consumption when under higher loads is otherwise similar to a gaming laptop with GTX 1060 graphics like the Asus Strix GL504GM. When compared to the Precision 7510, the 7530 demands about 10 to 20 percent more power when under high loads for a significant 170 percent boost in raw graphics power.
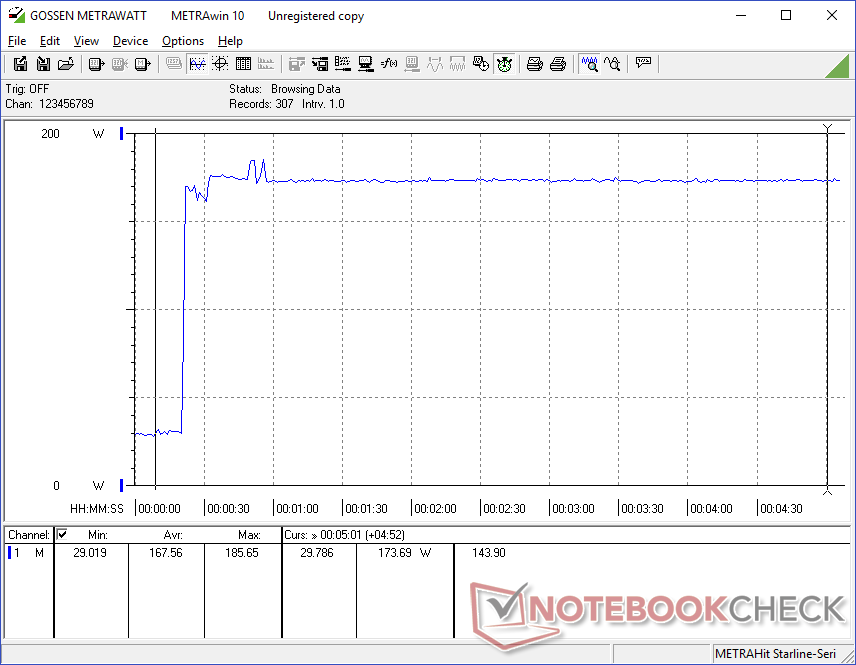
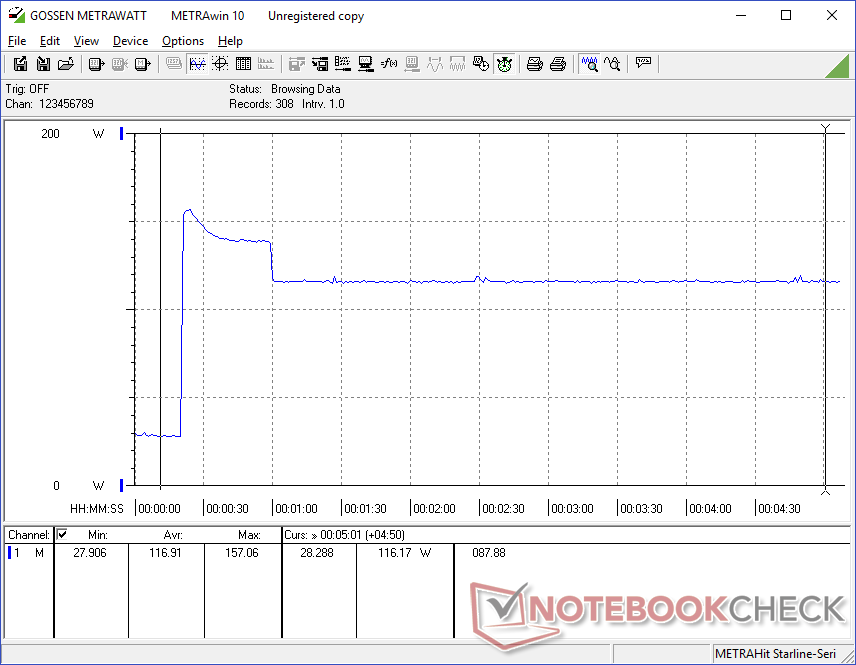
The medium-sized (~15.4 x 7.5 x 2.3 cm) 180 W AC adapter is able to sufficiently power the system if just barely. We are able to measure a maximum power consumption of 174 W to suggest that a more capable 200 W or 220 W AC adapter may have been more appropriate for a higher overhead.
| Off / Standby | |
| Idle | |
| Load |
|
Key:
min: | |
| Dell Precision 7530 i9-8950HK, Quadro P3200, Samsung PM961 NVMe MZVLW512HMJP, IPS, 3840x2160, 15.6" | Lenovo ThinkPad P1-20MD002LUS E-2176M, Quadro P2000 Max-Q, Samsung SSD PM981 MZVLB2T0HMLB, IPS, 3840x2160, 15.6" | Dell Precision 5530 2-in-1 i7-8706G, WX Vega M GL, SK Hynix PC401 512GB M.2 (HFS512GD9TNG), IPS, 3840x2160, 15.6" | Dell Precision 7510 (4K IGZO) E3-1535M v5, Quadro M2000M, Samsung SSD SM951a 512GB M.2 PCIe 3.0 x4 NVMe (MZVKV512), IGZO IPS, 3840x2160, 15.6" | HP ZBook 15u G5 2ZC05EA i5-8550U, Radeon Pro WX 3100, Toshiba XG5 KXG50ZNV256G, IPS LED, 1920x1080, 15.6" | Asus Strix GL504GM i7-8750H, GeForce GTX 1060 Mobile, Toshiba NVMe THNSN5256GPU7, IPS, 1920x1080, 15.6" | |
|---|---|---|---|---|---|---|
| Power Consumption | 40% | 43% | -16% | 64% | 14% | |
| Idle Minimum * (Watt) | 15.7 | 7.1 55% | 7.4 53% | 23.9 -52% | 3.2 80% | 10 36% |
| Idle Average * (Watt) | 20.3 | 14.4 29% | 12.4 39% | 28.9 -42% | 6.1 70% | 16.9 17% |
| Idle Maximum * (Watt) | 25.7 | 14.6 43% | 13.3 48% | 30 -17% | 9.7 62% | 21.1 18% |
| Load Average * (Watt) | 118.9 | 93.9 21% | 79.2 33% | 95.2 20% | 62 48% | 112.4 5% |
| Witcher 3 ultra * (Watt) | 131.2 | 77.9 41% | 82.2 37% | 48 63% | 135.5 -3% | |
| Load Maximum * (Watt) | 174 | 88.3 49% | 96.5 45% | 157.1 10% | 71 59% | 157.3 10% |
* ... smaller is better
Battery Life
Runtimes are fairly short considering the large non-removable 97 Wh battery. Expect about 4.5 hours of real-world WLAN use compared to 8 hours or more on the less powerful Precision 5530. To Dell's credit, battery life is at least an improvement over the last generation Precision 7510.
Charging from near empty to full capacity takes just under 2 hours.
A less expensive 64 Wh battery option is also available as an alternative to the 97 Wh configuration. While we've yet to directly test the 64 Wh configuration, it's safe to assume a 30 percent shorter runtime than what we've recorded with our 97 Wh configuration.
| Dell Precision 7530 i9-8950HK, Quadro P3200, 97 Wh | Lenovo ThinkPad P1-20MD002LUS E-2176M, Quadro P2000 Max-Q, 80 Wh | Dell Precision 7510 (4K IGZO) E3-1535M v5, Quadro M2000M, 91 Wh | Dell Precision 5530 2-in-1 i7-8706G, WX Vega M GL, 75 Wh | HP ZBook 15u G5 2ZC05EA i5-8550U, Radeon Pro WX 3100, 56 Wh | Eurocom Tornado F5W E3-1280 v5, Quadro P5000, 75.24 Wh | |
|---|---|---|---|---|---|---|
| Battery runtime | 15% | -23% | 42% | 144% | -22% | |
| Reader / Idle (h) | 6.4 | 4.5 -30% | 12.3 92% | 21.7 239% | 4.7 -27% | |
| WiFi v1.3 (h) | 4.6 | 5.3 15% | 4 -13% | 7.3 59% | 8.6 87% | 4 -13% |
| Load (h) | 1.6 | 1.2 -25% | 1.2 -25% | 3.3 106% | 1.2 -25% |
Verdict
Pros
Cons
The Precision 7530 is a worthwhile upgrade from the 7510. It's smaller without sacrificing rigidity and it carries significantly faster CPU and GPU options that high performance workstation users will appreciate. It's optional WAN features also give it a leg up against the competition.
There are a fair number of drawbacks related to its processors and connectivity options. Firstly, the Core i9 CPU runs far too warm on the system to properly benefit from high Turbo Boost clock rates. As a result, performance is just marginally better than the less expensive Core i7-8750H at best and we recommend the i7-8750H or lower as a result. We're also disappointed to see reduced performance on batteries and no Quadro P4000 or higher options considering that this is the "world's most powerful and first ready for VR" 15-inch mobile workstation. The somewhat grainy matte 4K panel and loud fans during load further dampen an otherwise solidly built system.
As for connectivity, we certainly think it can do better than just 2x USB Type-A ports when the older Precision 7510 has twice this number. Look pass these downsides and the Precision 7530 is still a step up in both aesthetics and performance from its predecessors.
The Core i9 is a bit too much for the Precision 7530 to handle. For a more balanced machine, users would be better off configuring with the Core i7-8750H or Xeon E-2176M. This is a a well-built powerhouse of a workstation with 128 GB RAM options not found on most other workstations currently in the market.
Dell Precision 7530
- 10/25/2019 v7 (old)
Allen Ngo
Price comparison
