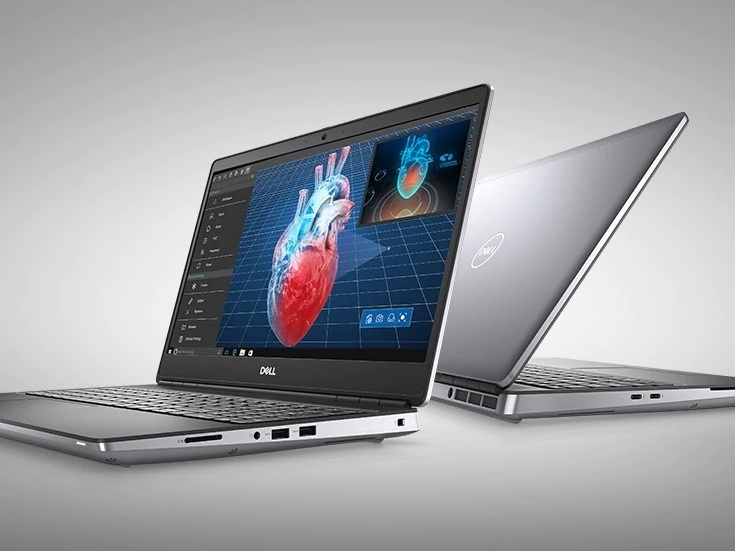
Dell Precision 7550 Mobile Workstation Review: The Antithesis To The Precision 5550
Have you had enough of ultra-thin gaming laptops or Ultrabooks masquerading as mobile workstations? If so, then the 15.6-inch Dell Precision 7550 should tickle your fancy. This chassis design succeeds the last generation Precision 7540 and it was built from the ground up to be a full-size mobile workstation in contrast to the Razer Blade 15 Studio, Precision 5550, or MSI WS66 which are all based on existing ultra-thin consumer designs. The Precision 7550 brings a host of advantages and a few disadvantages as a result that we will go over below.
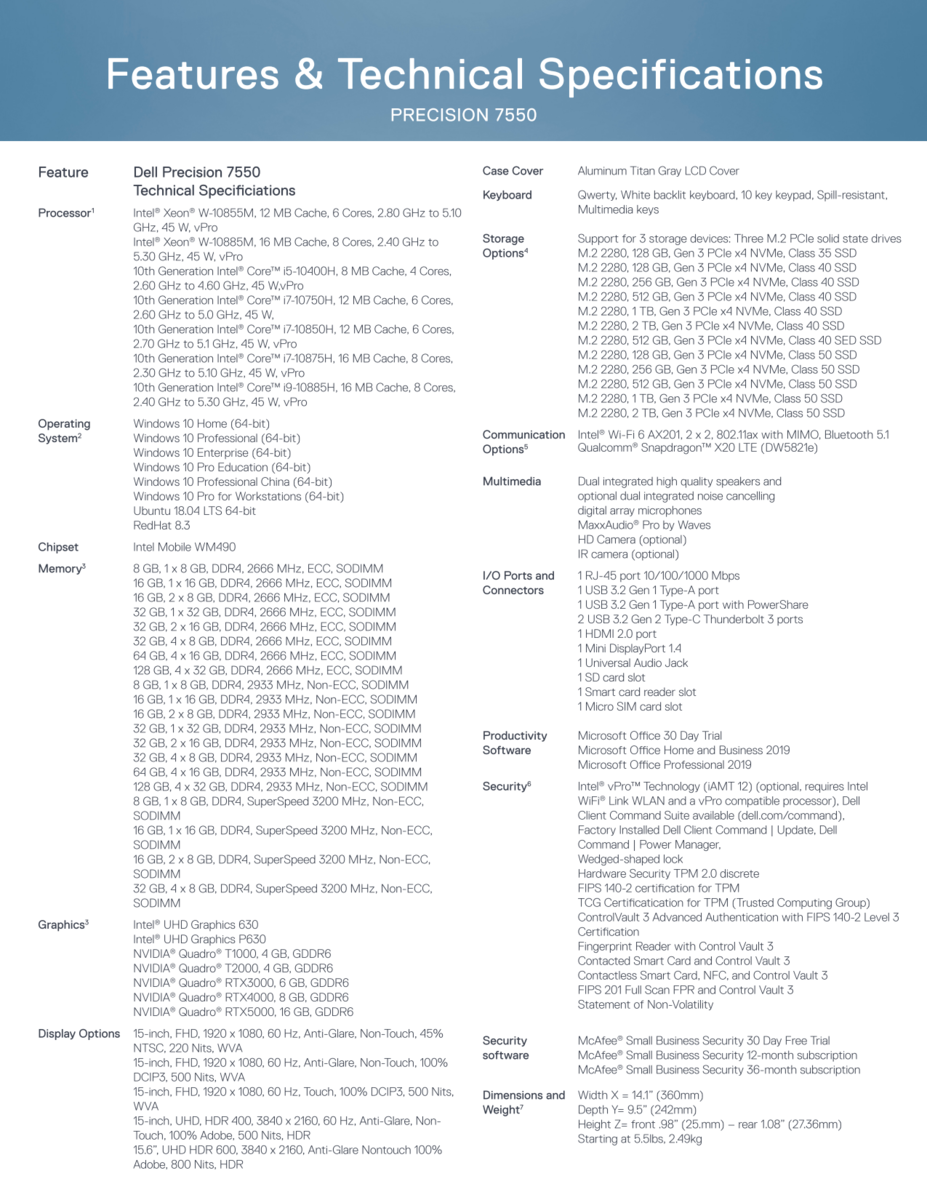
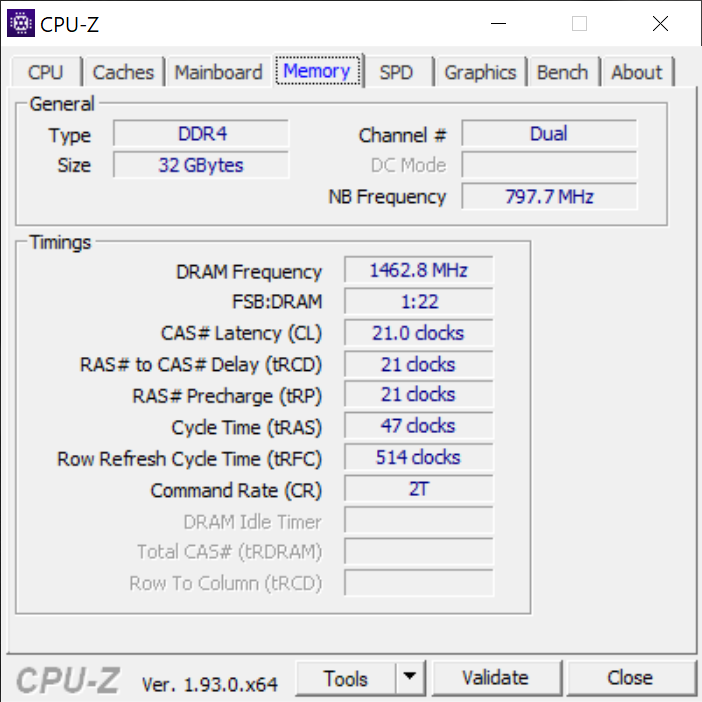
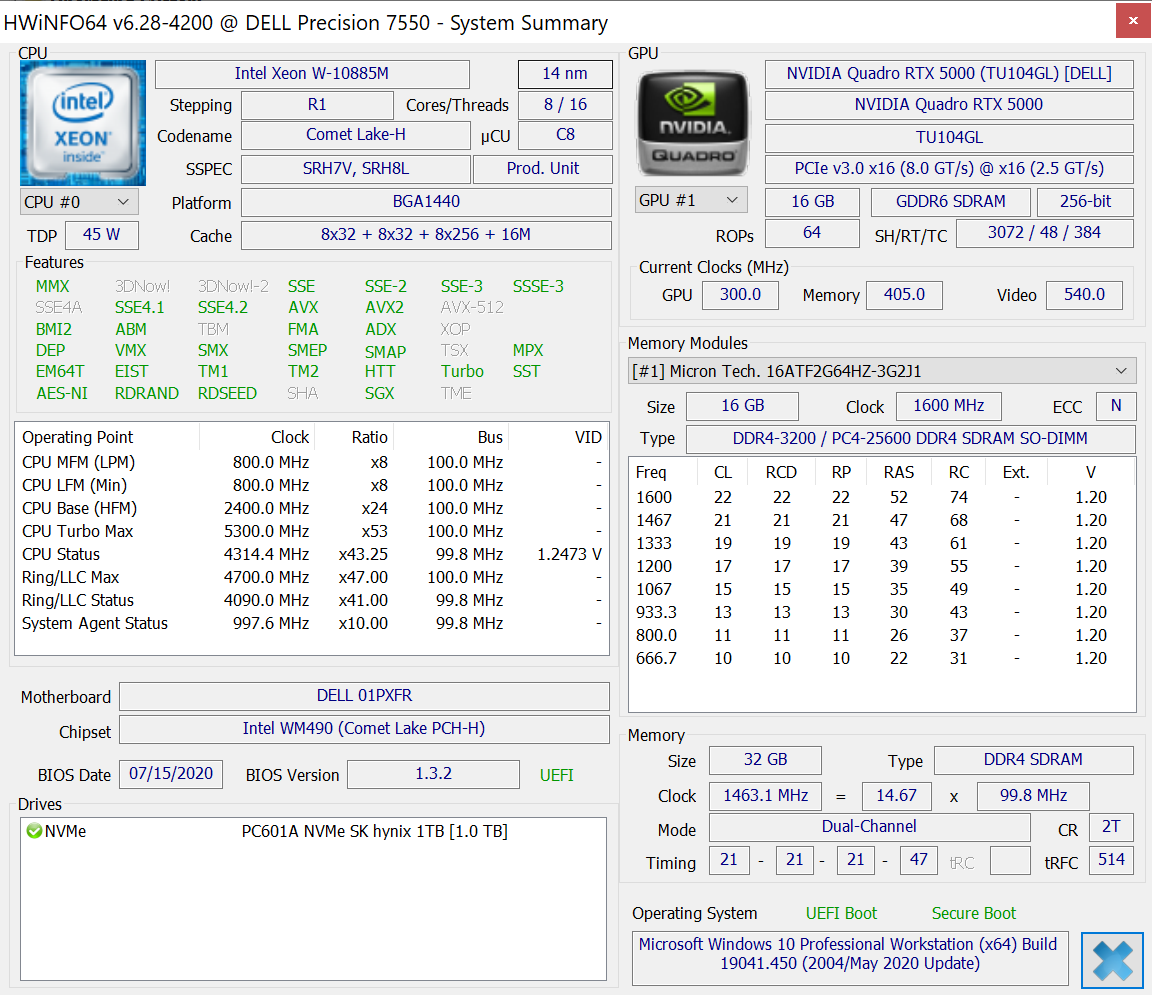
Dell offers a very wide range of configuration options ranging from the Core i5-10400H up to the Xeon W-10885M CPU, UHD Graphics 630 up to the Quadro RTX 5000 Max-Q, FHD up to 4K UHD display, and even up to 128 GB of ECC RAM. Direct competitors include the Lenovo ThinkPad P53, HP ZBook 15, or the Fujitsu Celsius workstation series. A 17.3-inch version is also available called the Precision 7750.
More Dell reviews:
Rating | Date | Model | Weight | Height | Size | Resolution | Price |
|---|---|---|---|---|---|---|---|
| 87.8 % v7 (old) | 08 / 2020 | Dell Precision 7550 W-10885M, Quadro RTX 5000 Max-Q | 2.8 kg | 27.36 mm | 15.60" | 3840x2160 | |
v (old) | Dell Precision 7540 i9-9980HK, Quadro RTX 3000 (Laptop) | 2.8 kg | 25 mm | 15.60" | 3840x2160 | ||
| 86.3 % v7 (old) | 08 / 2020 | Dell Precision 5550 P91F i7-10875H, Quadro T2000 Max-Q | 2 kg | 18 mm | 15.60" | 3840x2400 | |
| 82.1 % v7 (old) | 06 / 2020 | Acer ConceptD 3 Pro CN315-71P-73W1 i7-9750H, Quadro T1000 (Laptop) | 2.4 kg | 23.4 mm | 15.60" | 1920x1080 | |
| 89.8 % v7 (old) | 11 / 2019 | Lenovo ThinkPad P53-20QN000YGE i7-9850H, Quadro RTX 5000 Max-Q | 2.7 kg | 29.4 mm | 15.60" | 1920x1080 | |
| 84.4 % v7 (old) | 11 / 2018 | HP ZBook Studio G5-4QH10EA i7-8750H, Quadro P1000 | 2.1 kg | 18.9 mm | 15.60" | 3840x2160 |
Case
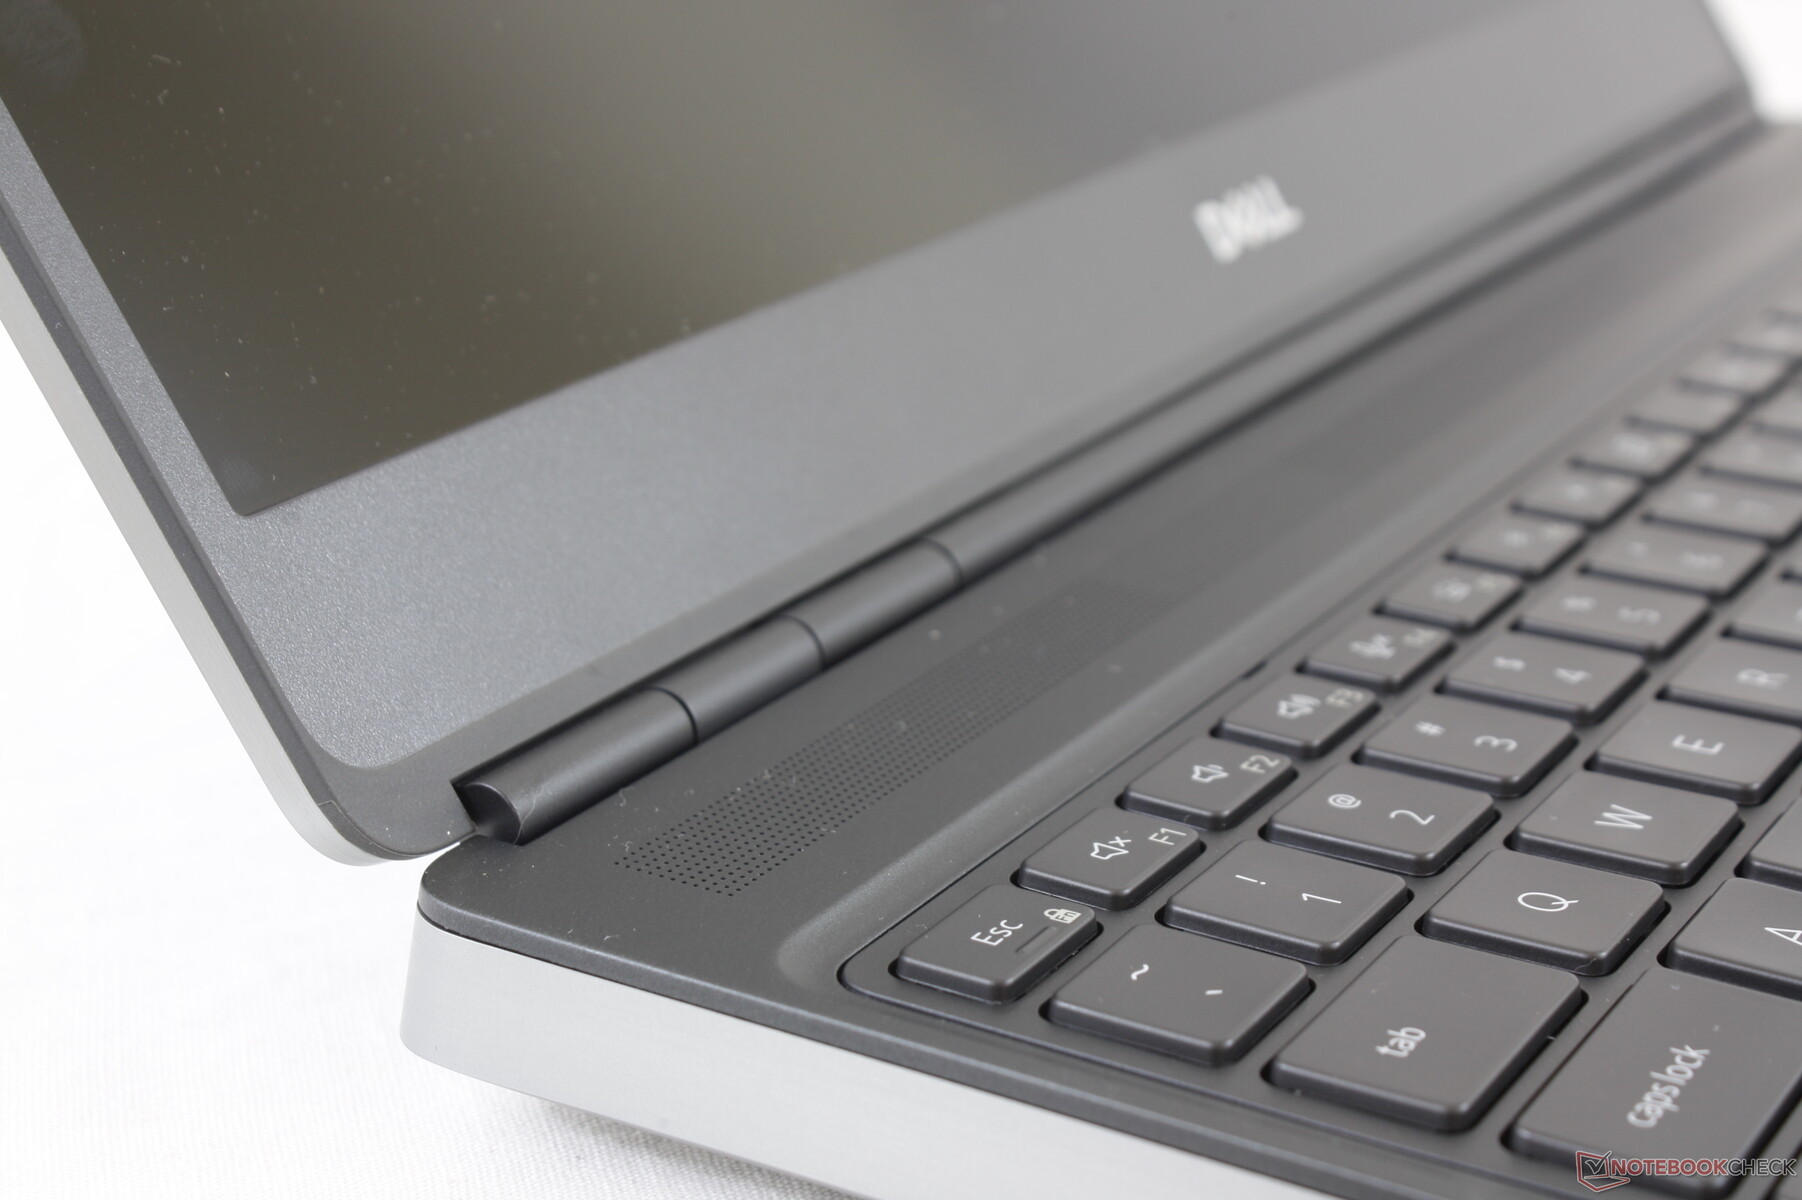
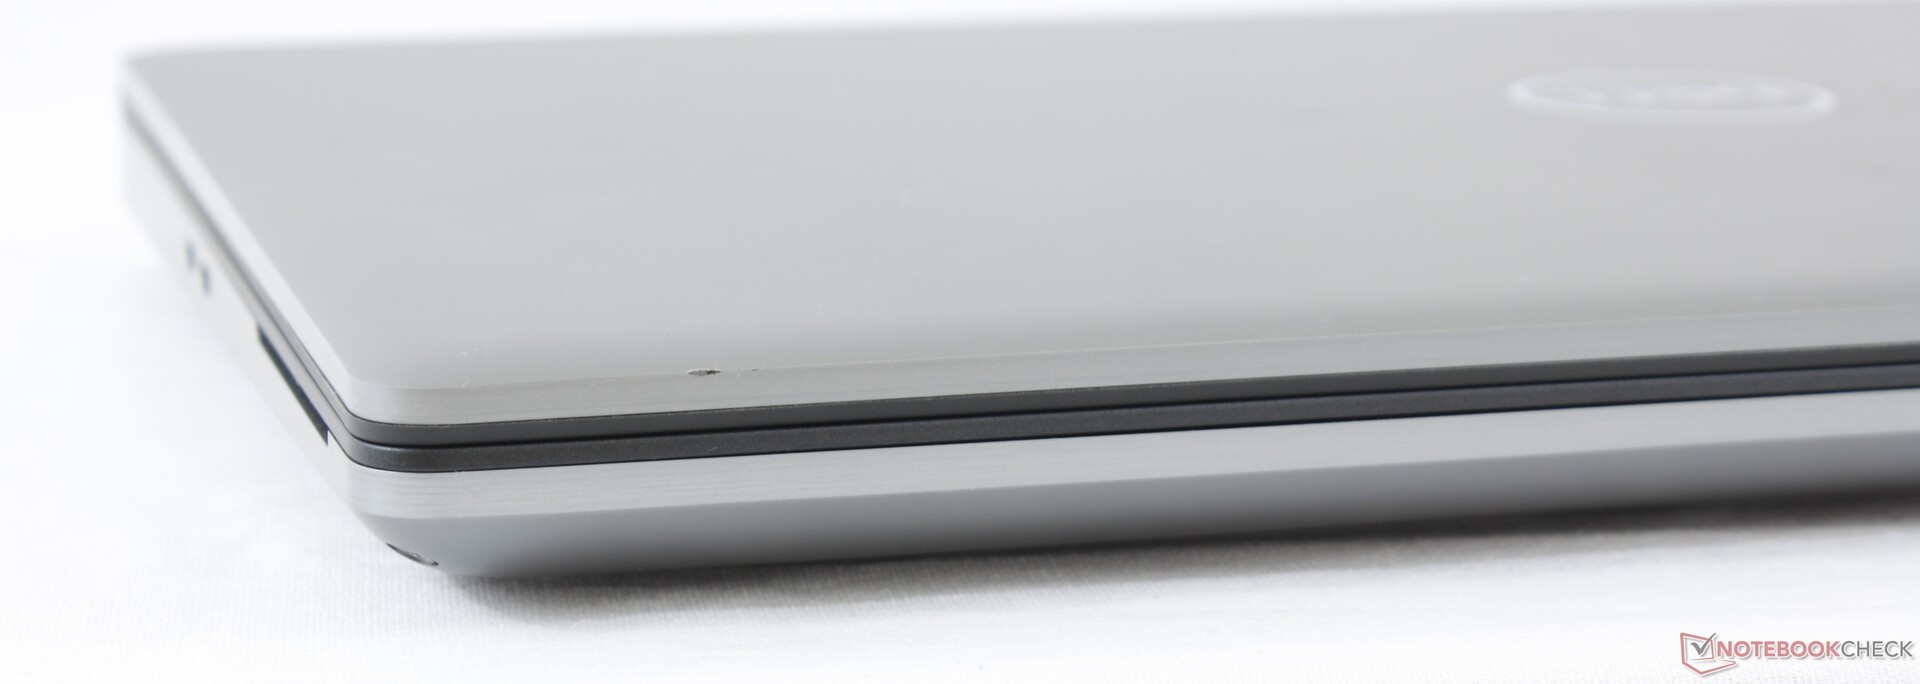
The chassis is MIL-STD 810G certified and mostly metal for tougher first impressions than the carbon fiber-heavy ThinkPad P53. Its skeleton feels thick for a better sense of longevity that you don't otherwise see on many consumer laptops.
As strong as the chassis may be, however, we noticed a few physical defects on our test unit including a nick near the front edge, some bent ventilation grilles along the rear, an uneven gap between the front edge of the bottom plate and palm rests, and another uneven gap along the edge of the keyboard deck since the keyboard is removable. It's likely that these defects may be related to the fact that this is a test unit and not a retail unit, but they're worth double-checking for after purchasing just in case.
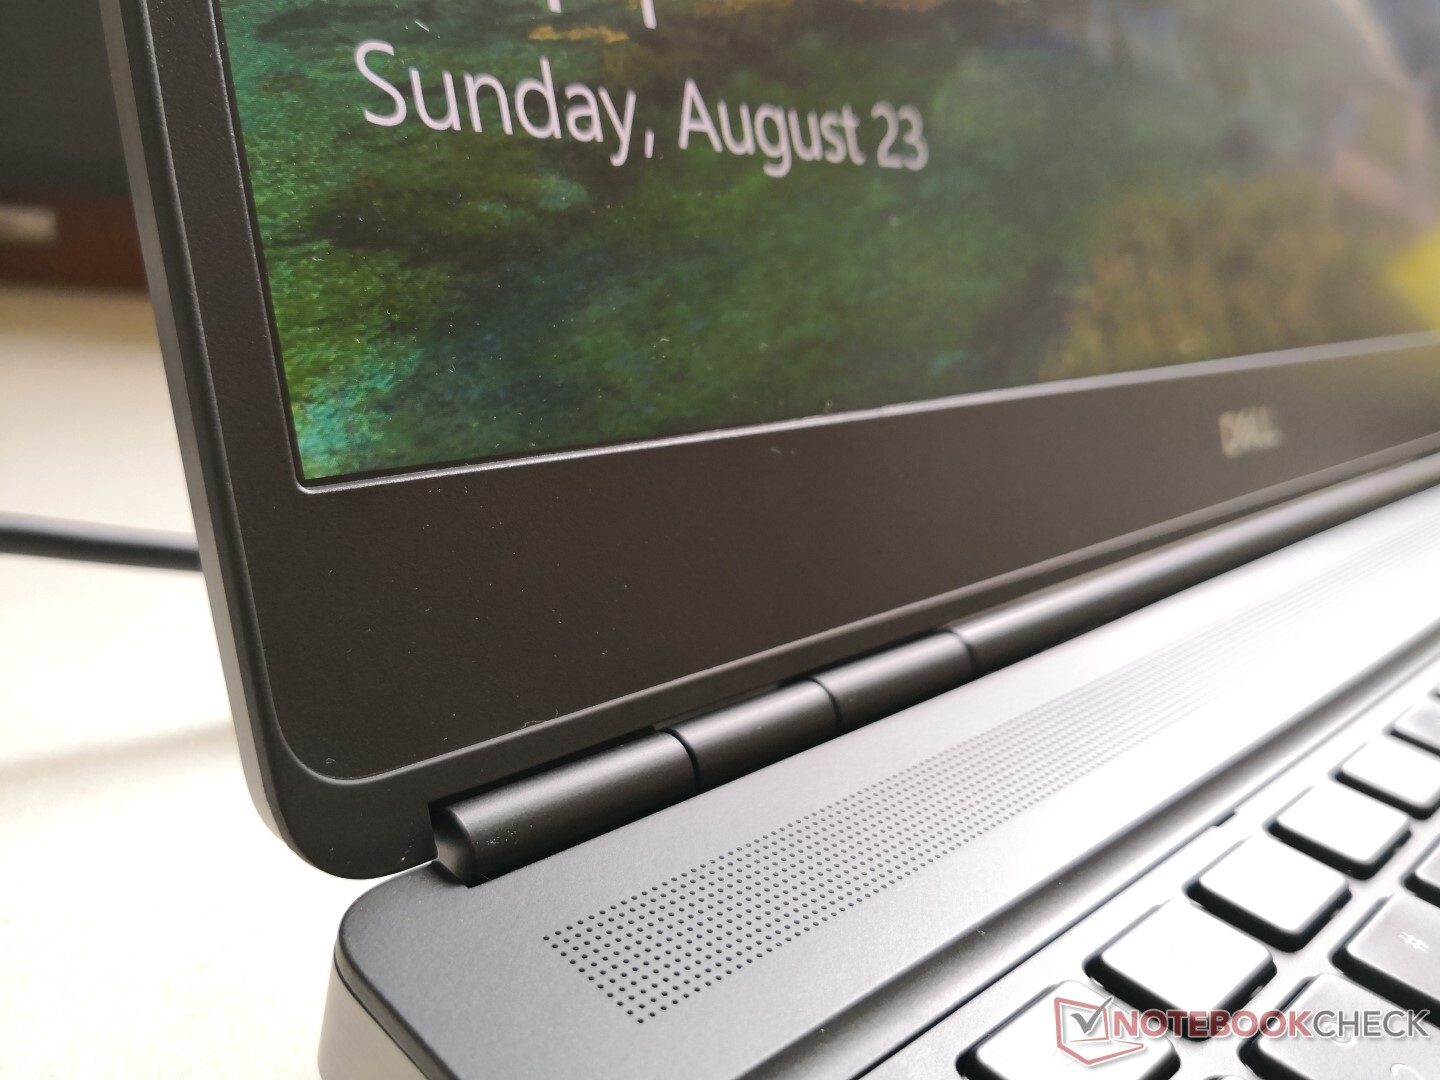
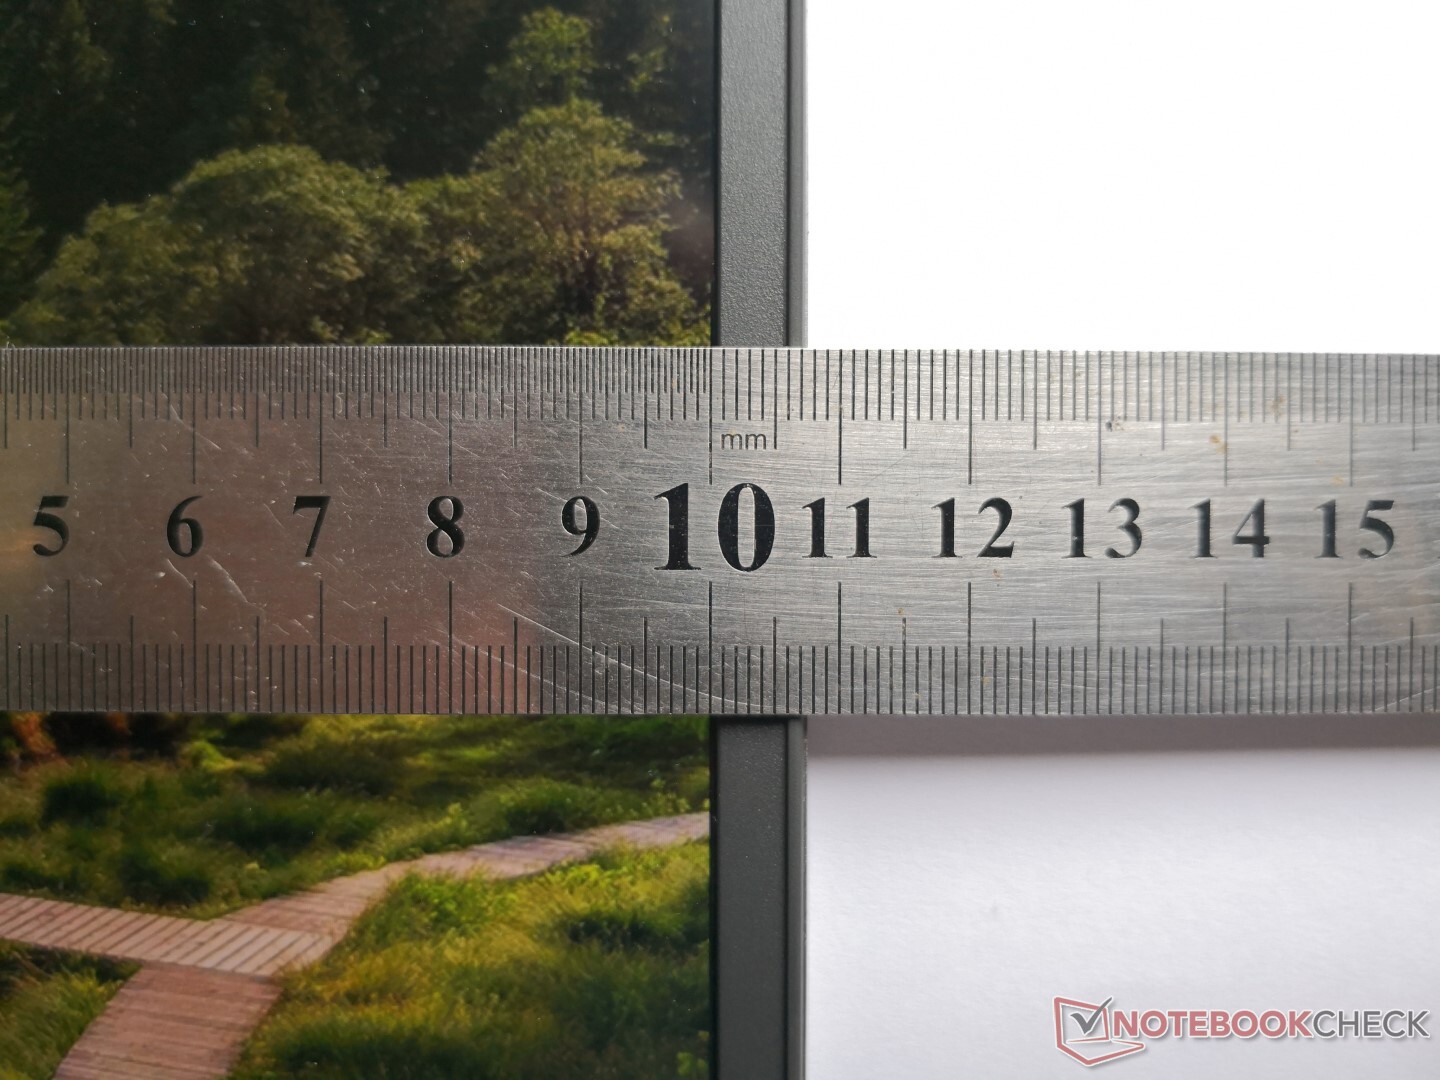
The chassis is actually thicker than last year's Precision 7540 (27.4 mm vs. 25 mm) while being smaller in footprint due to the new narrow bezel design. Weight hasn't really changed, however, and so the Precision 7550 remains one of the heavier 15.6-inch workstations out there at 2.8 kg. As a comparison, the much larger 17.3-inch MSI GE75 gaming laptop comes in at "only" 2.6 kg. The heavy weight is a consequence of the sound chassis and rigid base.
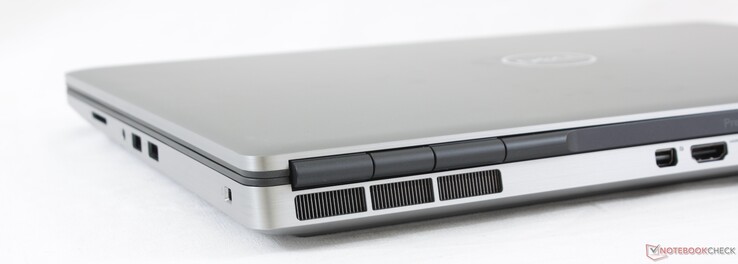
Connectivity
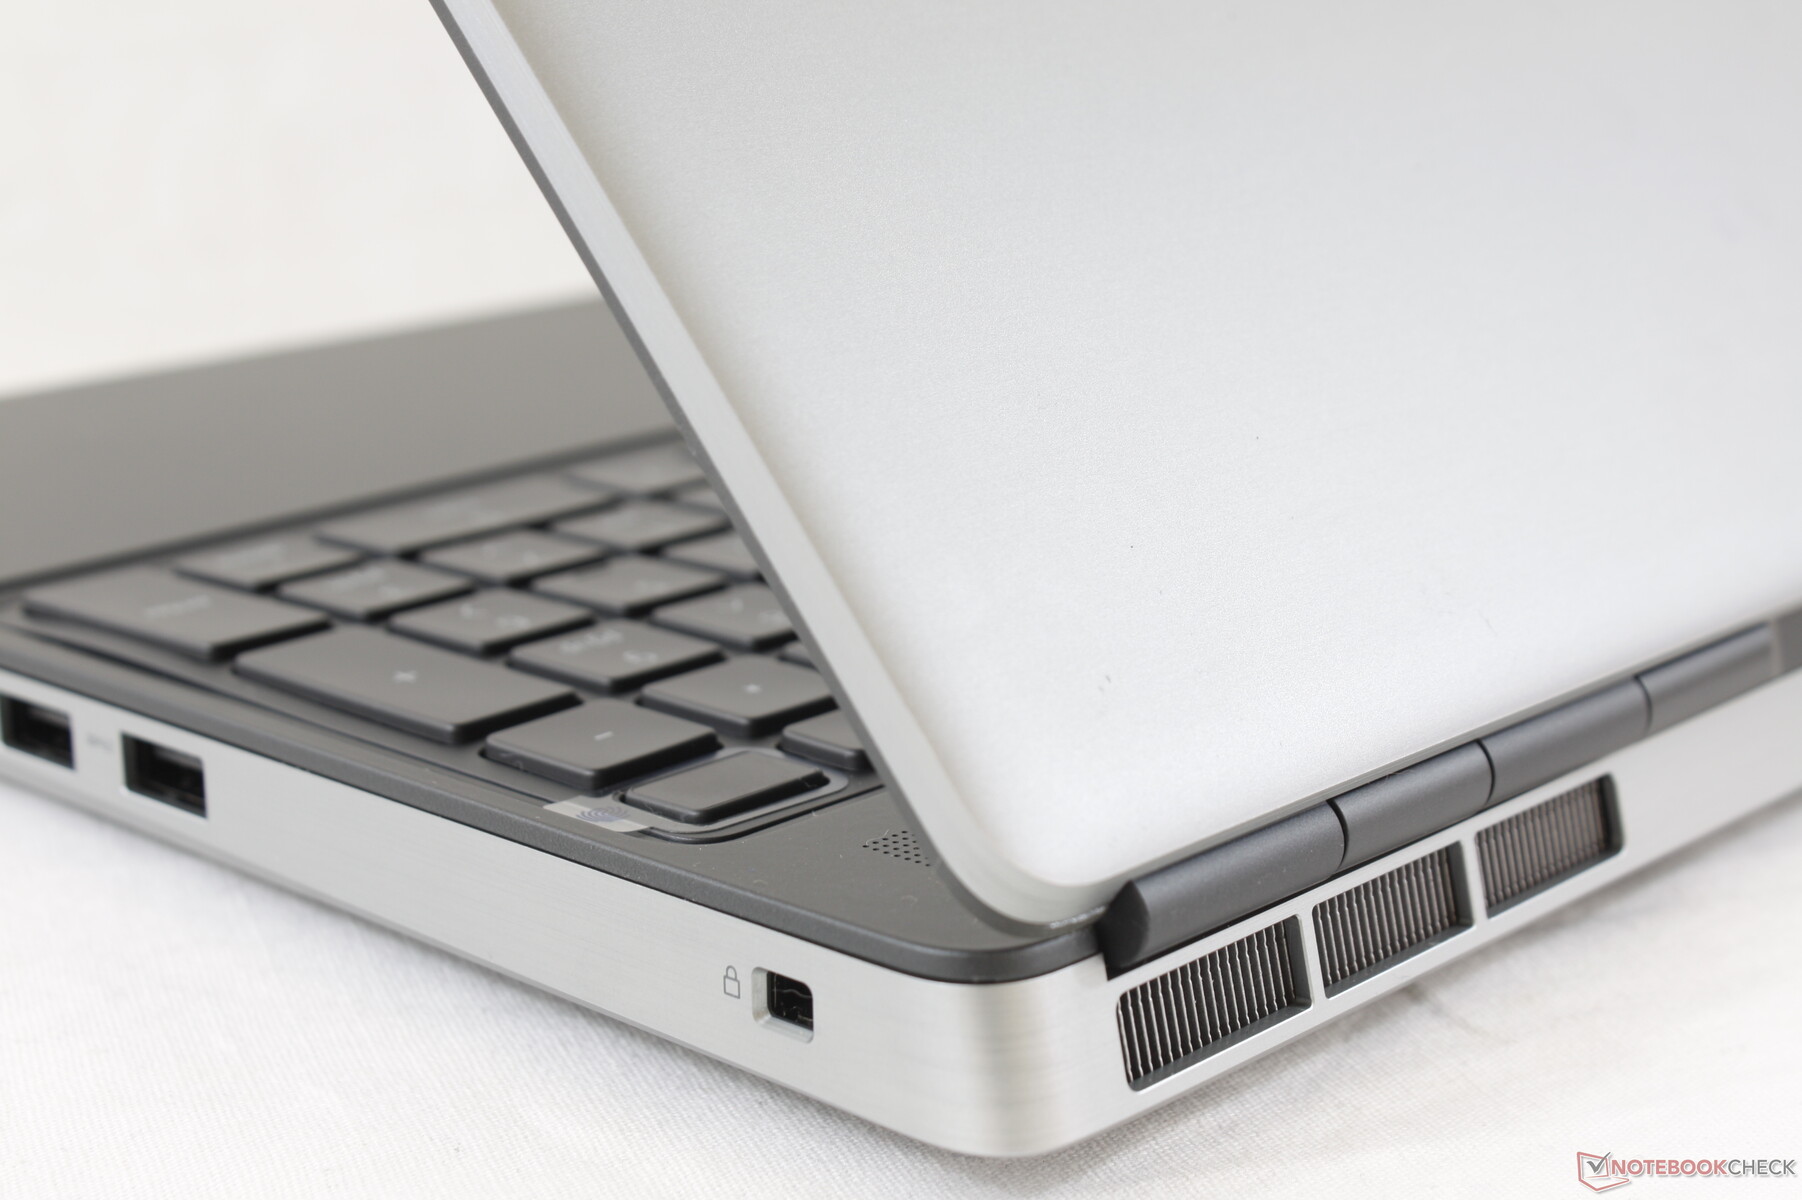
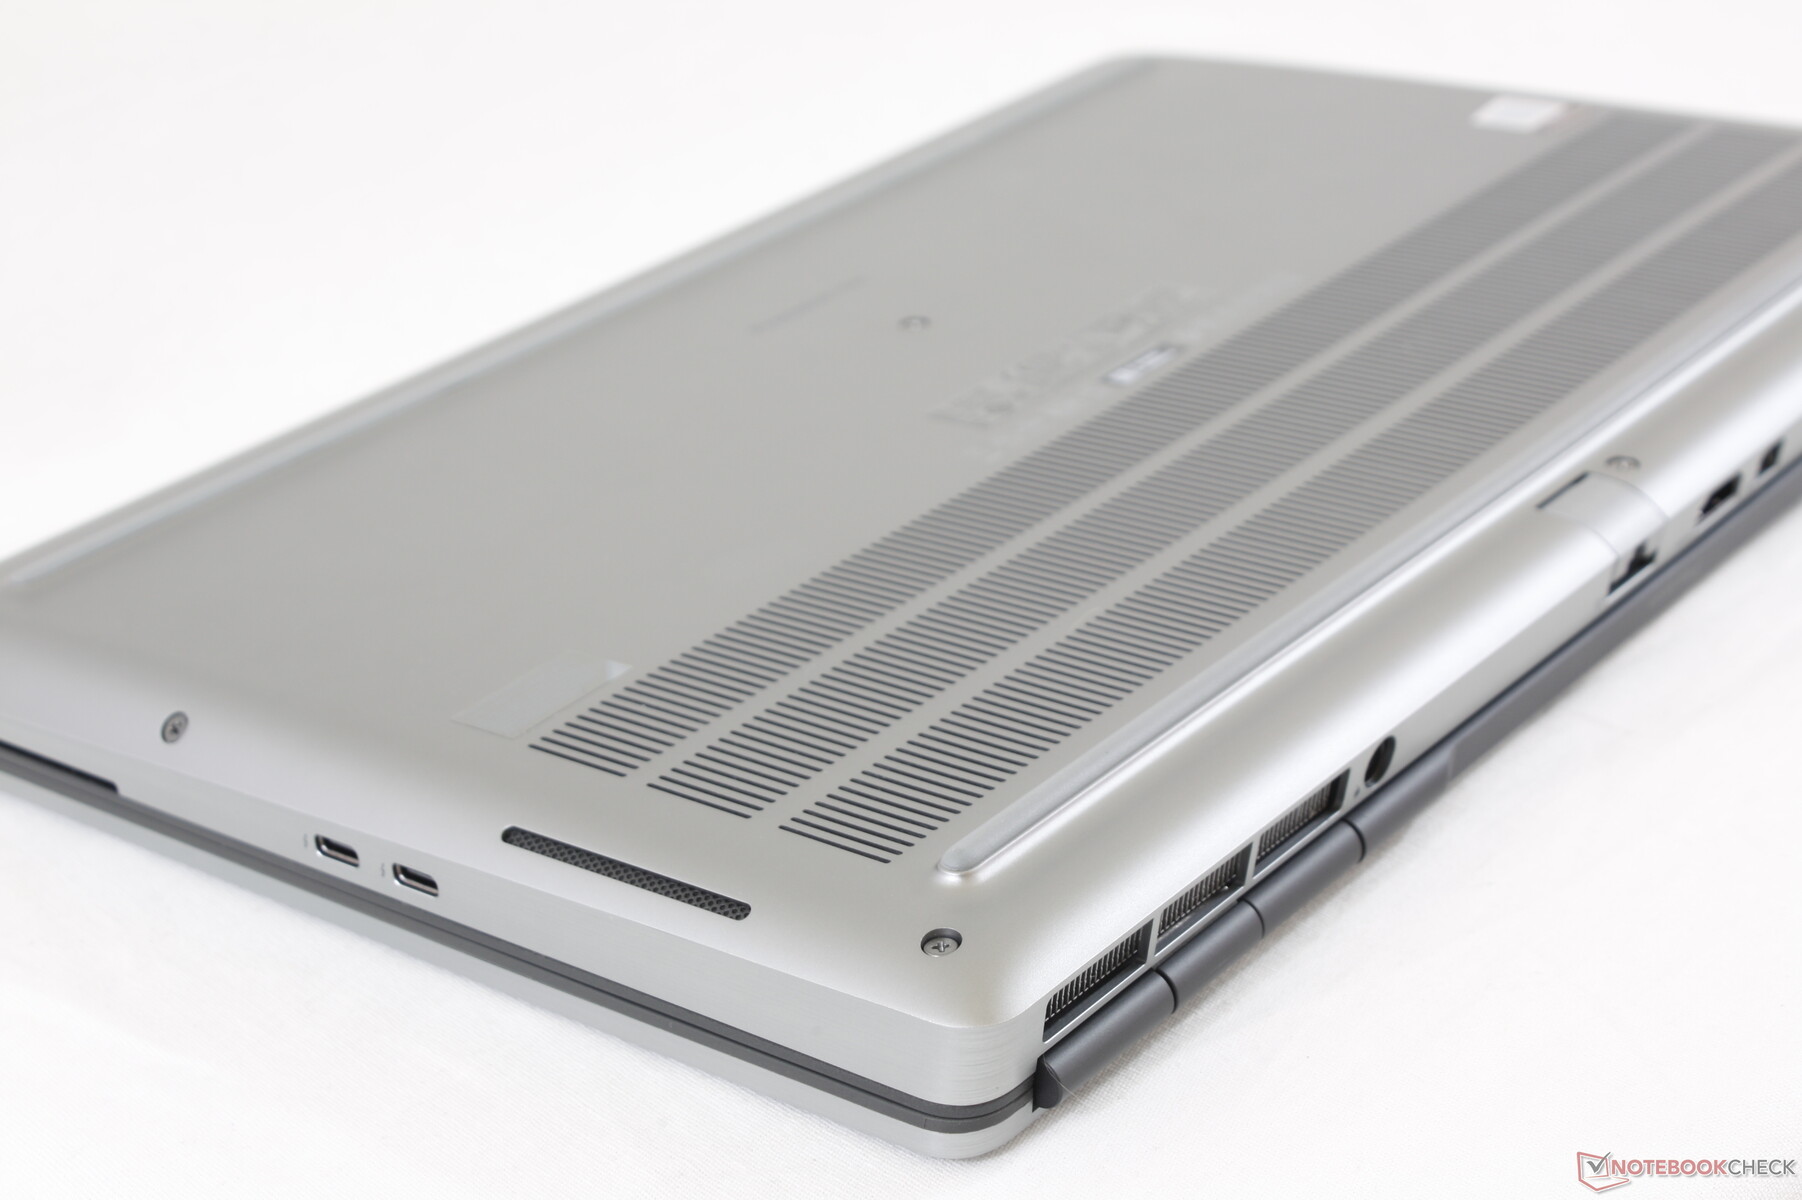
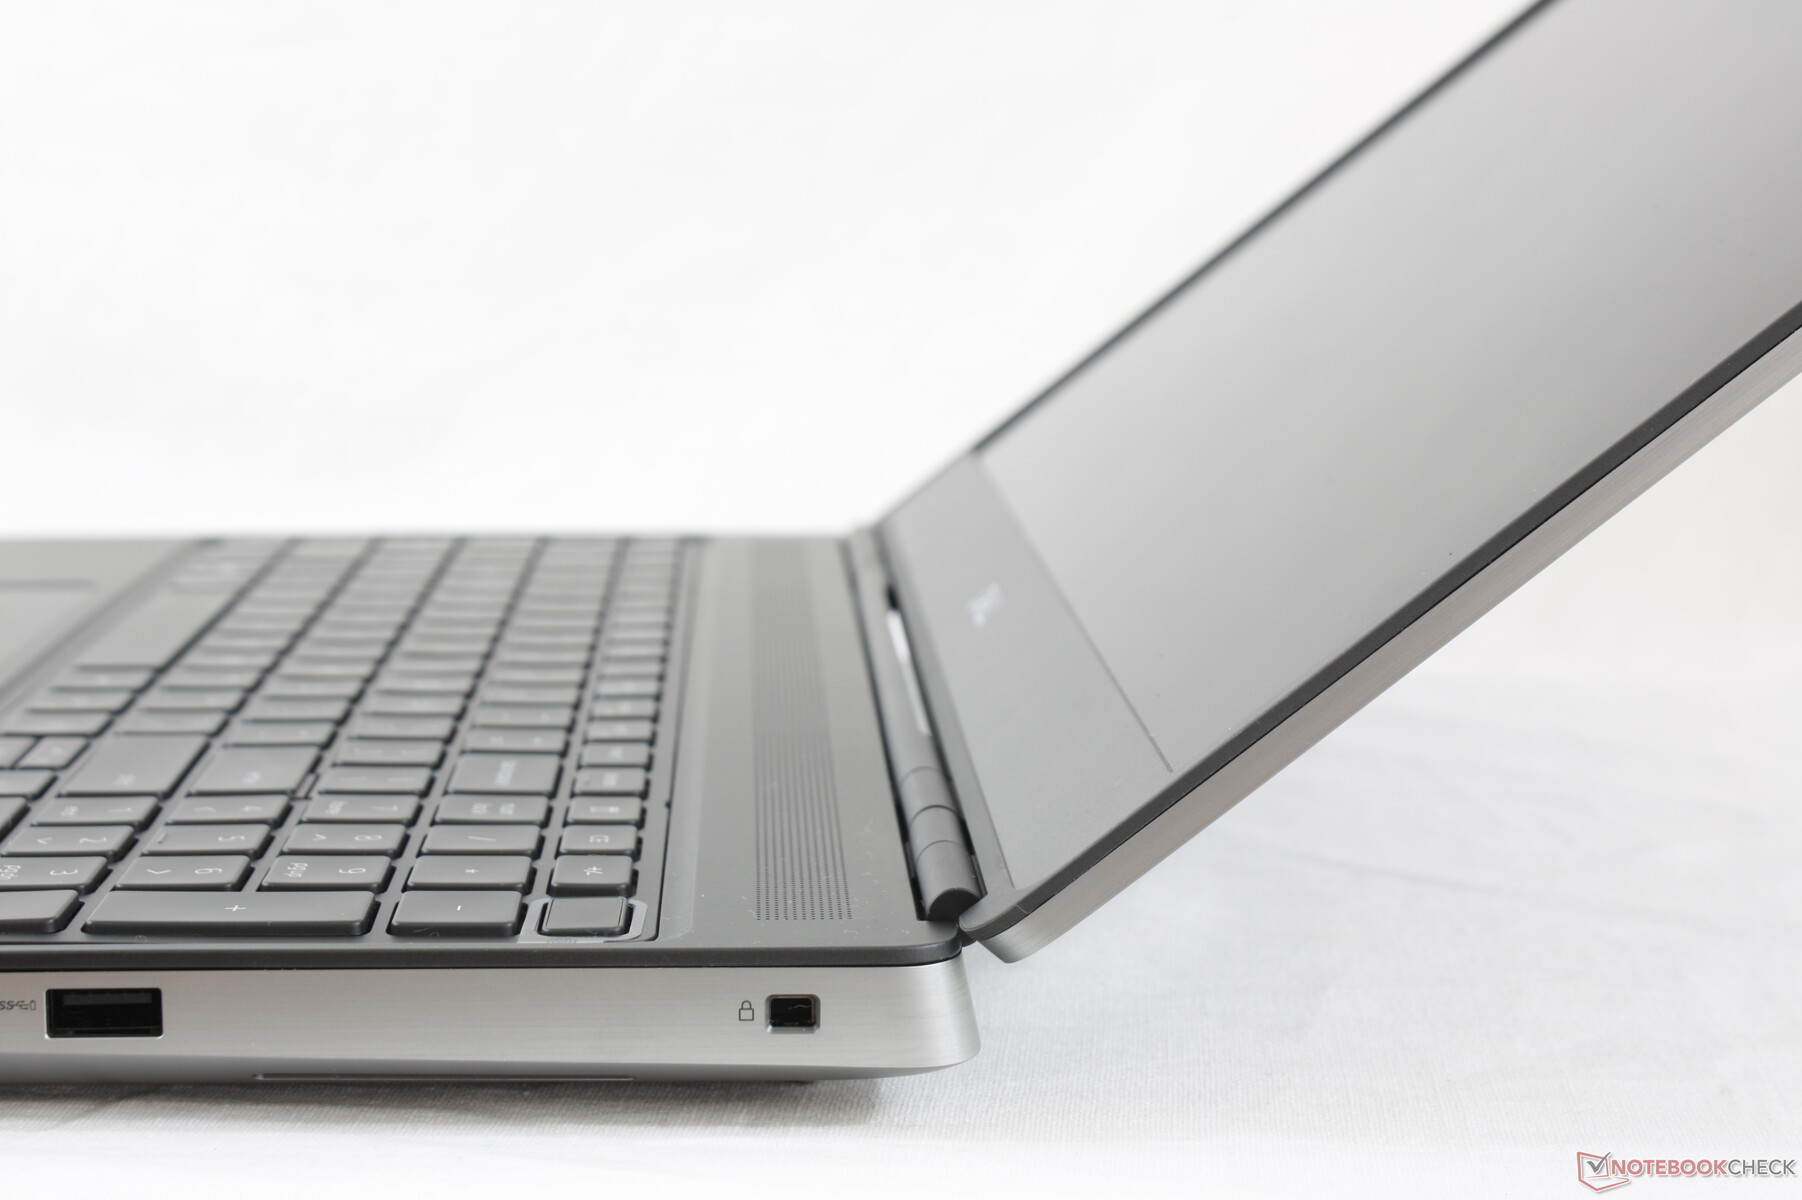
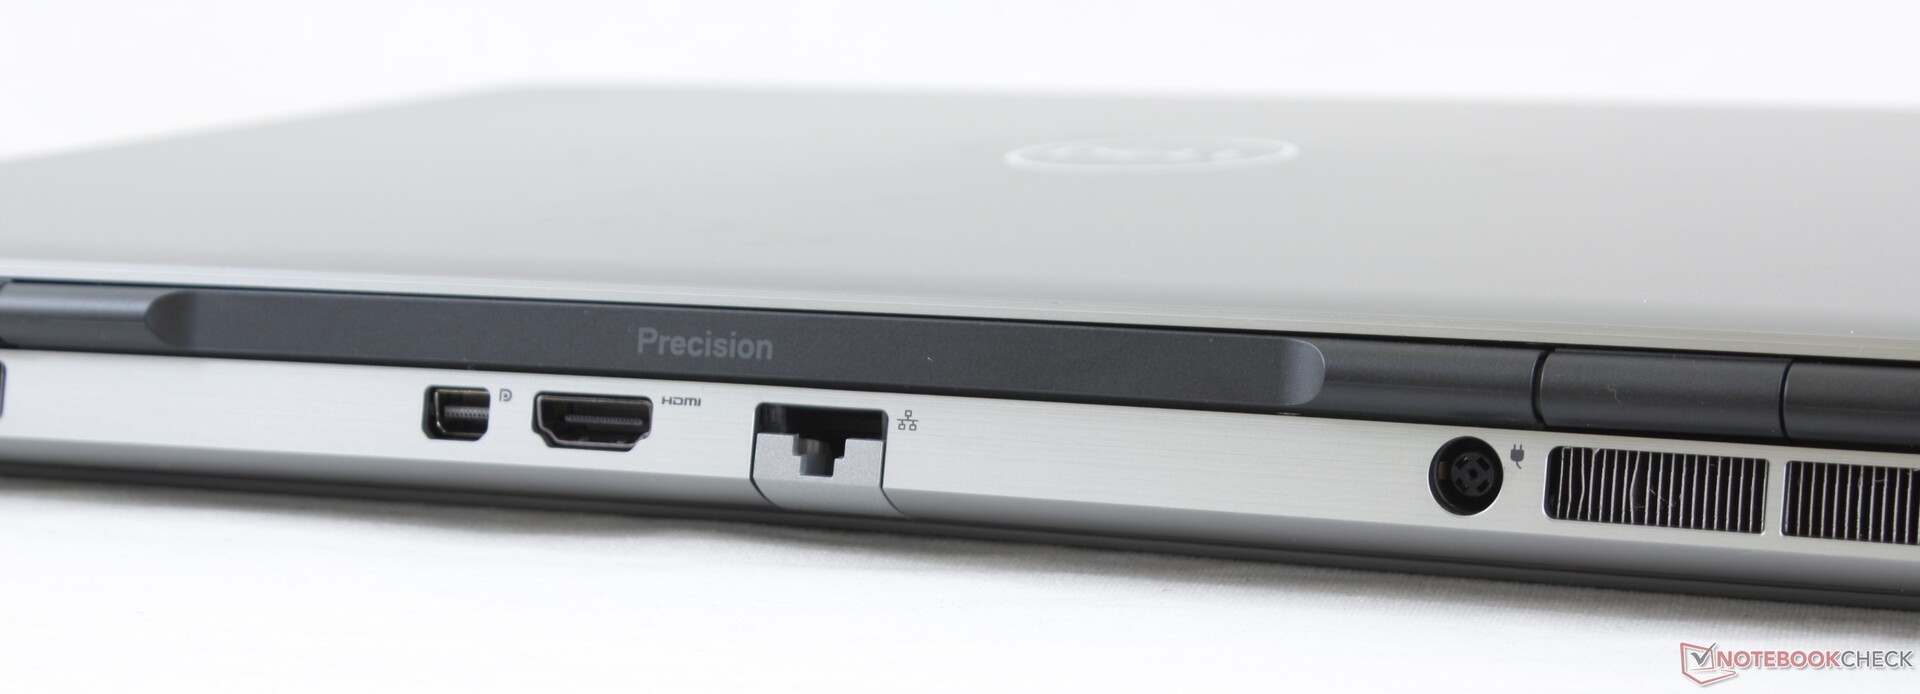
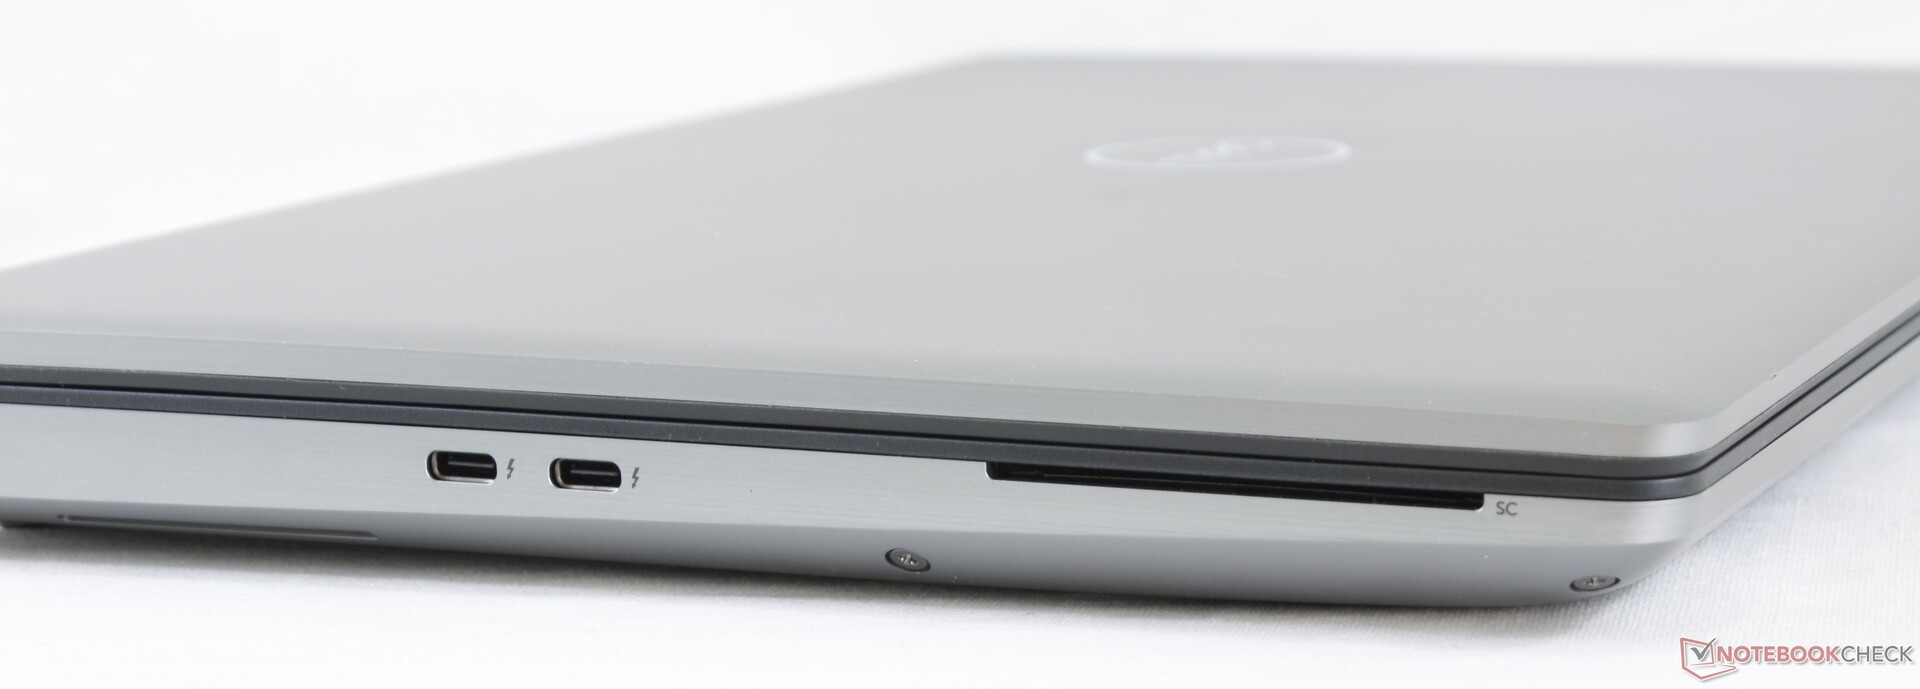
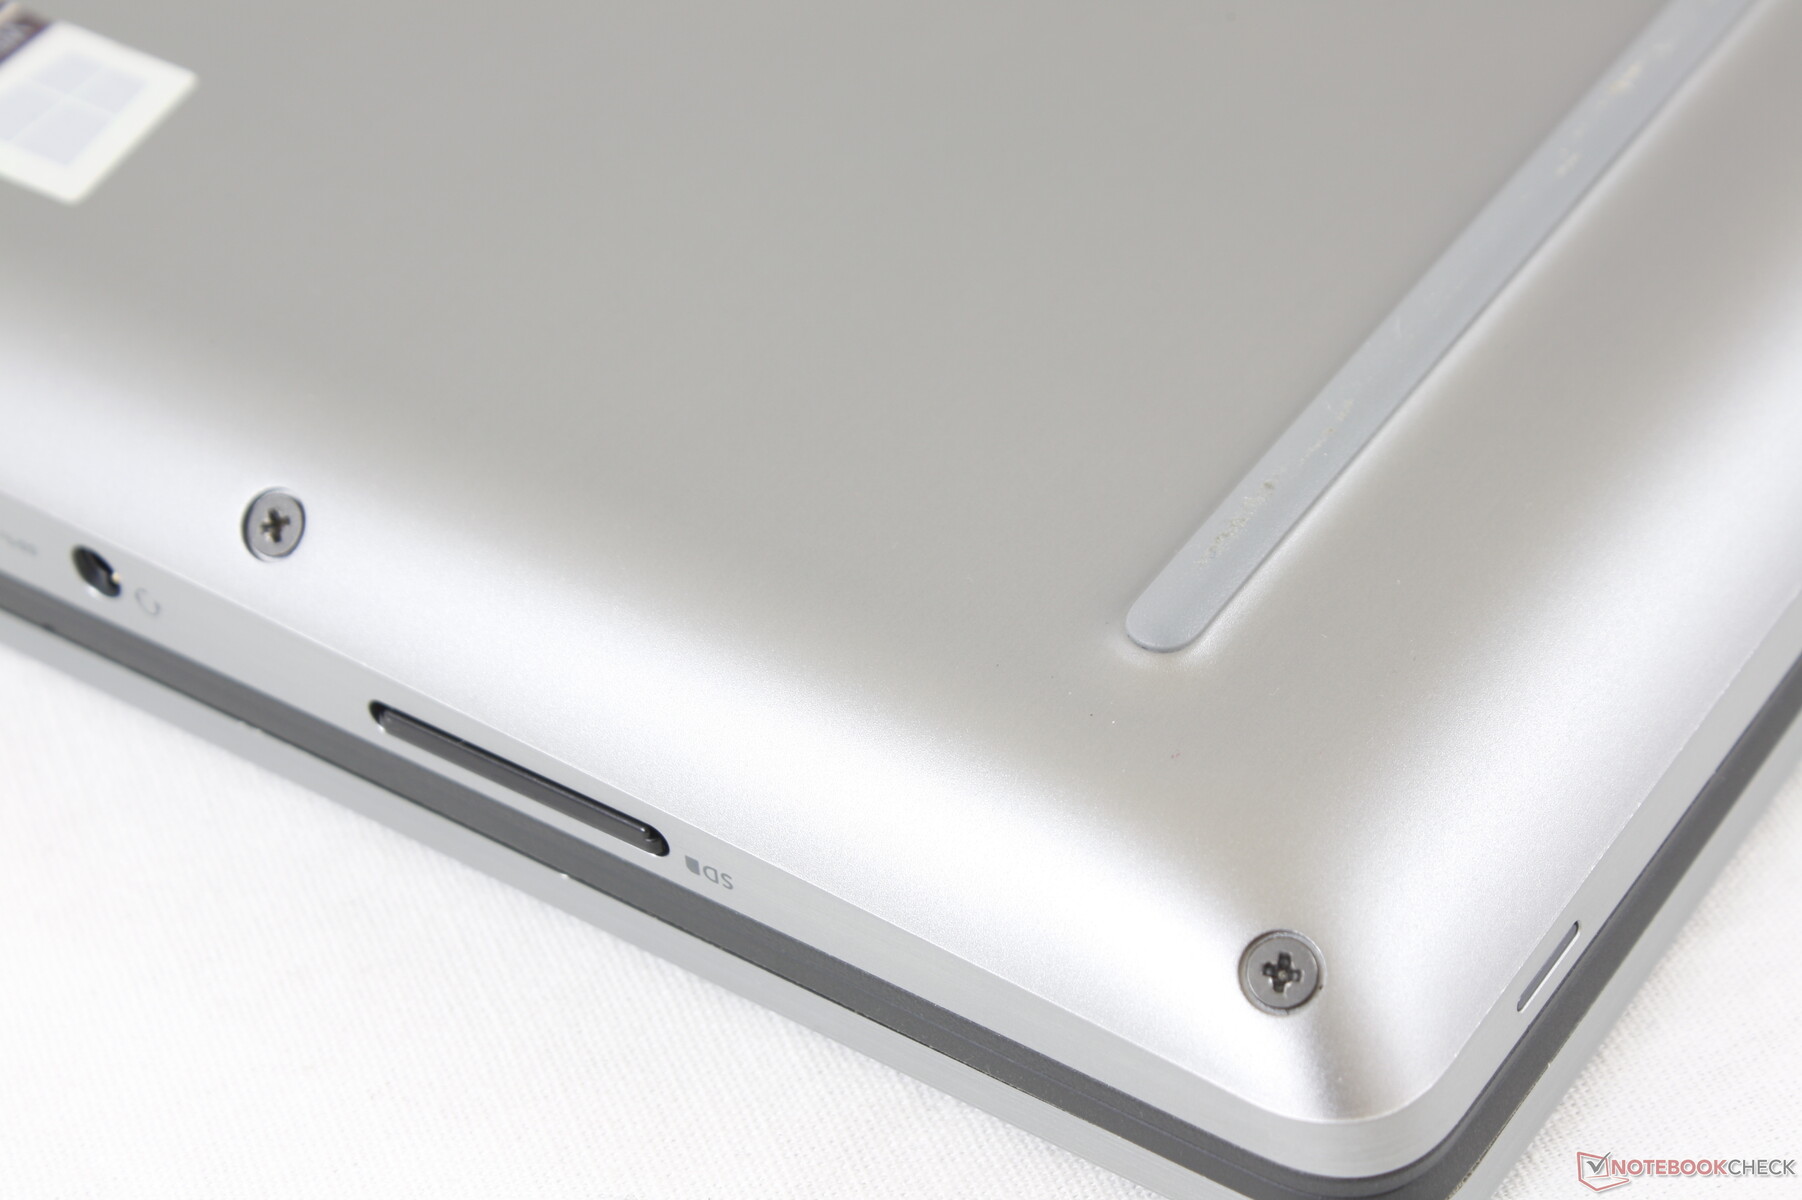
All ports from last year's Precision 7540 have carried over to the Precision 7550 albeit slightly rearranged. The competing ThinkPad P53 carries more USB ports than what Dell is able to offer here.
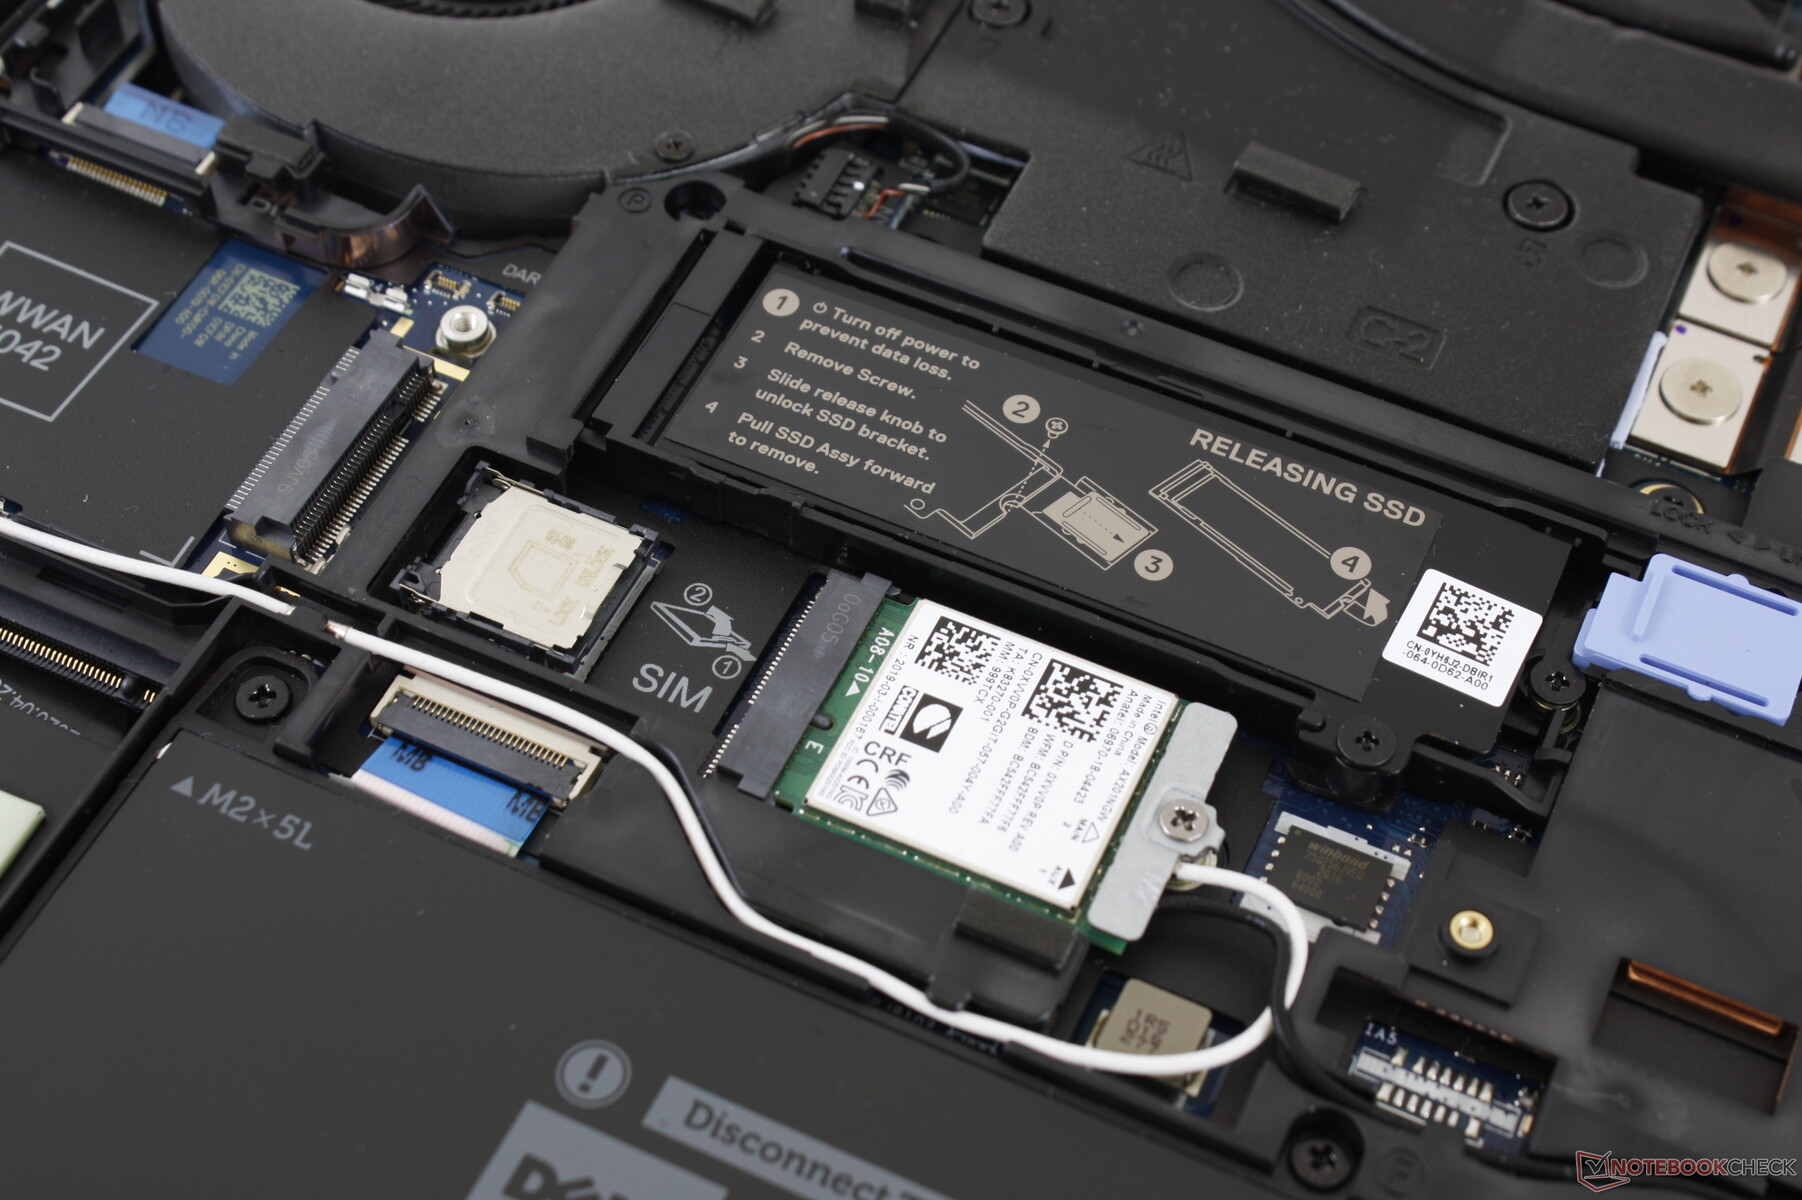
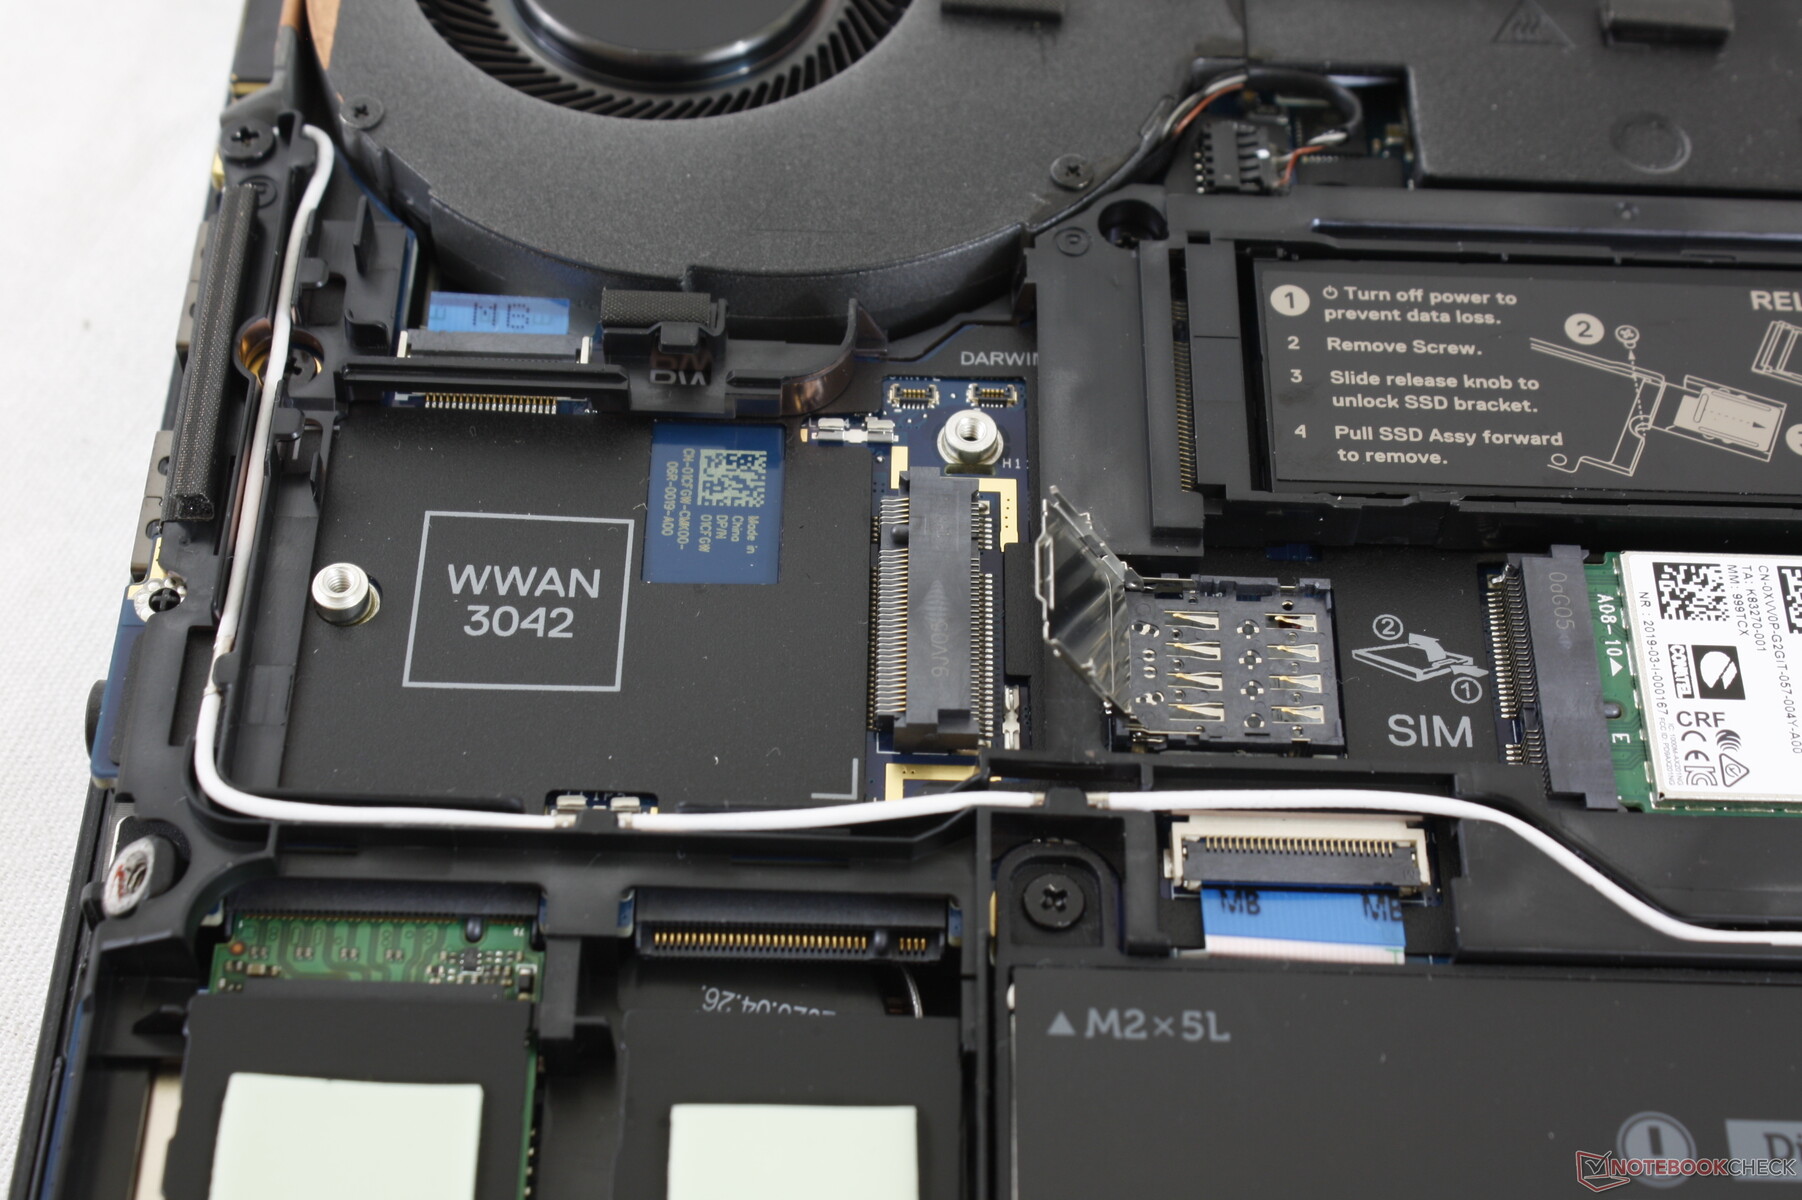
Note that the Nano-SIM slot is internal and cannot be accessed within first removing the bottom panel.
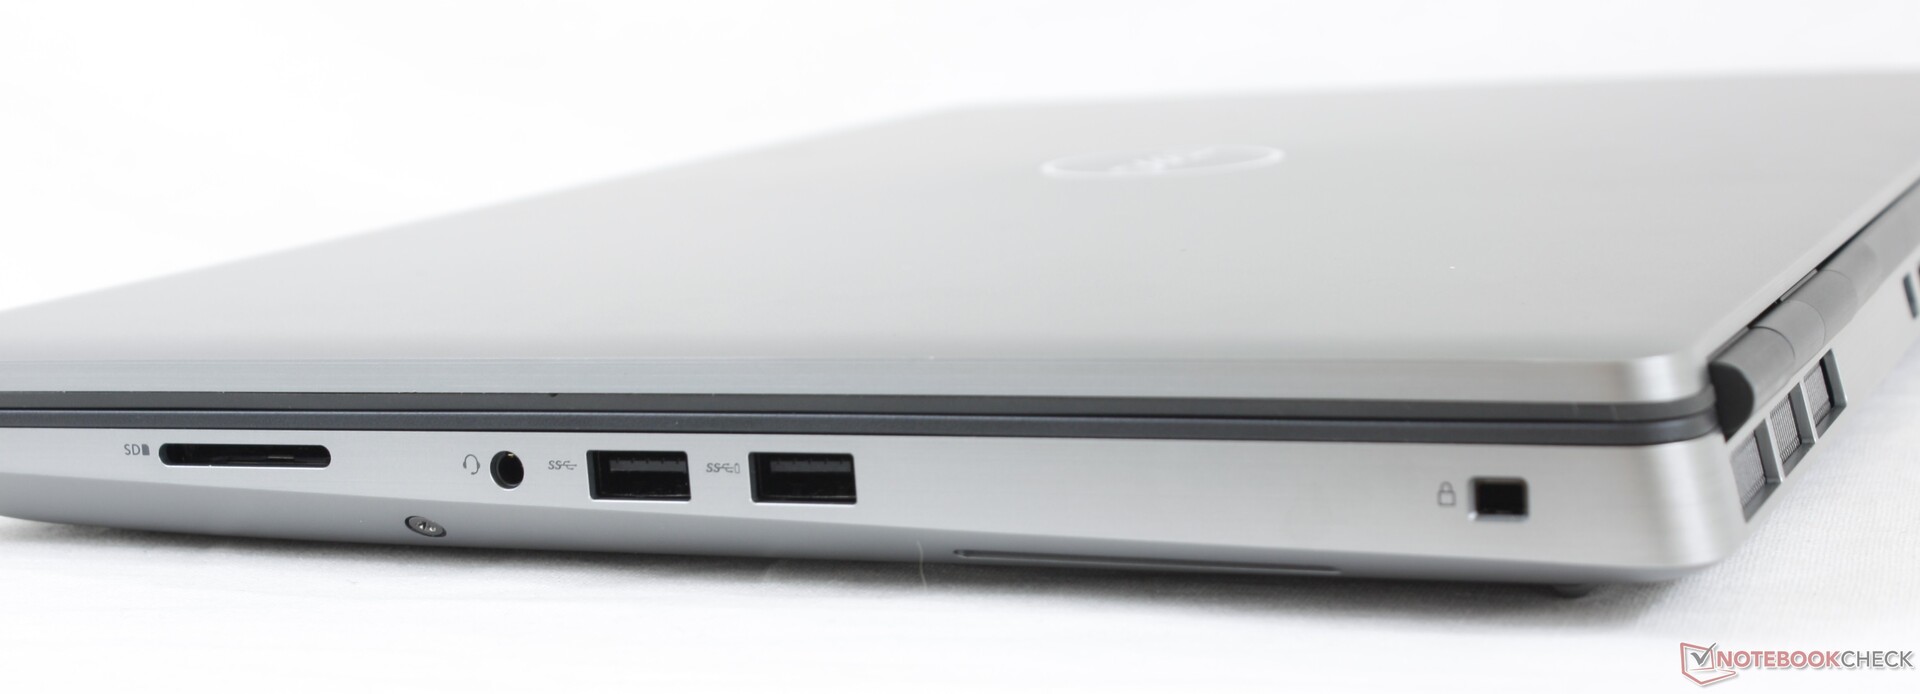
SD Card Reader
The spring-loaded SD card reader offers faster transfer rates than most consumer laptops. Moving 1 GB of pictures from our UHS-II test card to desktop takes only about 5 to 6 seconds.
| SD Card Reader | |
| average JPG Copy Test (av. of 3 runs) | |
| Dell Precision 5550 P91F (Toshiba Exceria Pro SDXC 64 GB UHS-II) | |
| Dell Precision 7540 (Toshiba Exceria Pro SDXC 64 GB UHS-II) | |
| Dell Precision 7550 (Toshiba Exceria Pro SDXC 64 GB UHS-II) | |
| Lenovo ThinkPad P53-20QN000YGE (Toshiba Exceria Pro SDXC 64 GB UHS-II) | |
| HP ZBook Studio G5-4QH10EA (Toshiba Exceria Pro SDXC 64 GB UHS-II) | |
| maximum AS SSD Seq Read Test (1GB) | |
| HP ZBook Studio G5-4QH10EA (Toshiba Exceria Pro SDXC 64 GB UHS-II) | |
| Lenovo ThinkPad P53-20QN000YGE (Toshiba Exceria Pro SDXC 64 GB UHS-II) | |
| Dell Precision 5550 P91F (Toshiba Exceria Pro SDXC 64 GB UHS-II) | |
| Dell Precision 7550 (Toshiba Exceria Pro SDXC 64 GB UHS-II) | |
| Dell Precision 7540 (Toshiba Exceria Pro SDXC 64 GB UHS-II) | |
Communication
The Intel AX201 comes standard for Wi-Fi 6 and Bluetooth 5.1 connectivity. We experienced no connectivity issues when paired to our Netgear RAX200 test router.
| Networking | |
| iperf3 transmit AX12 | |
| Dell Precision 7540 | |
| Dell Precision 5550 P91F | |
| Dell Precision 7550 | |
| Acer ConceptD 9 Pro | |
| Acer ConceptD 3 Pro CN315-71P-73W1 | |
| iperf3 receive AX12 | |
| Dell Precision 7540 | |
| Dell Precision 5550 P91F | |
| Dell Precision 7550 | |
| Acer ConceptD 9 Pro | |
| Acer ConceptD 3 Pro CN315-71P-73W1 | |
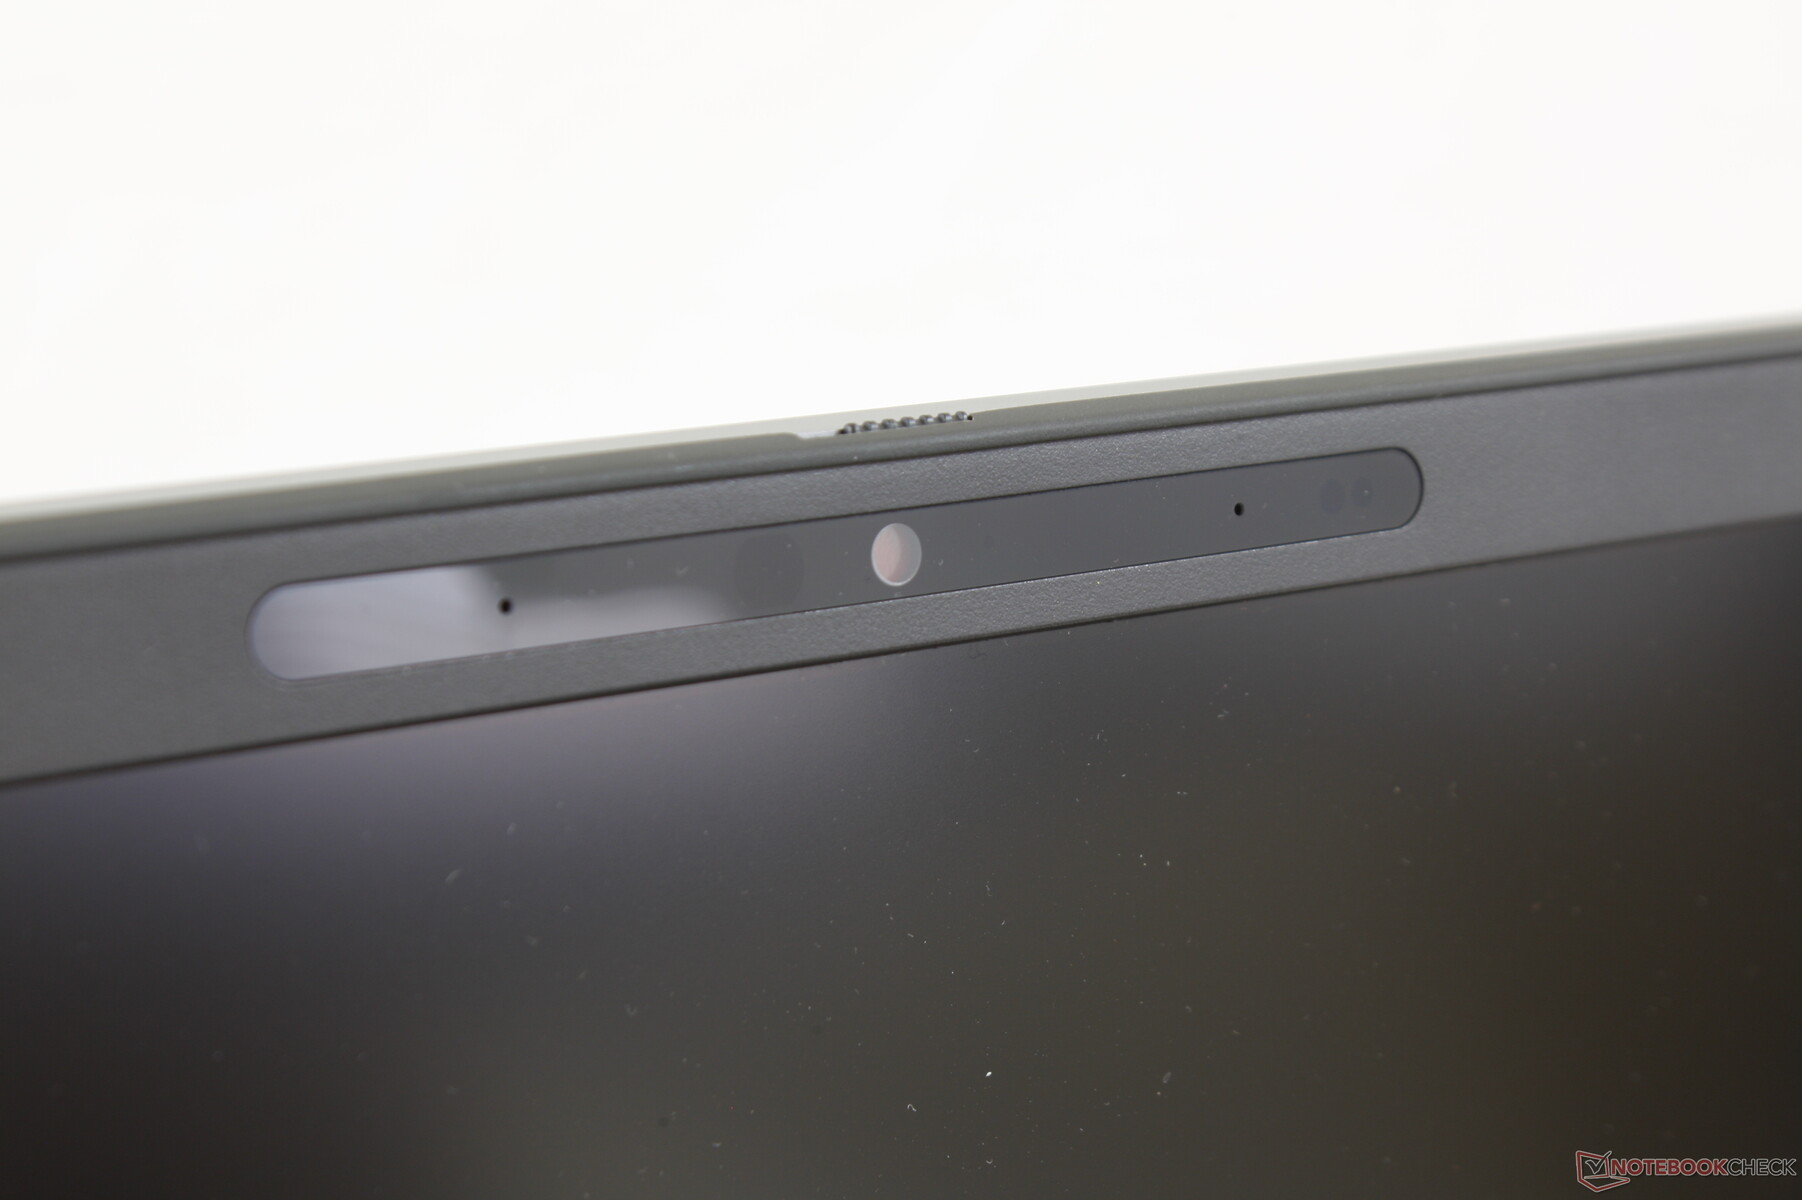
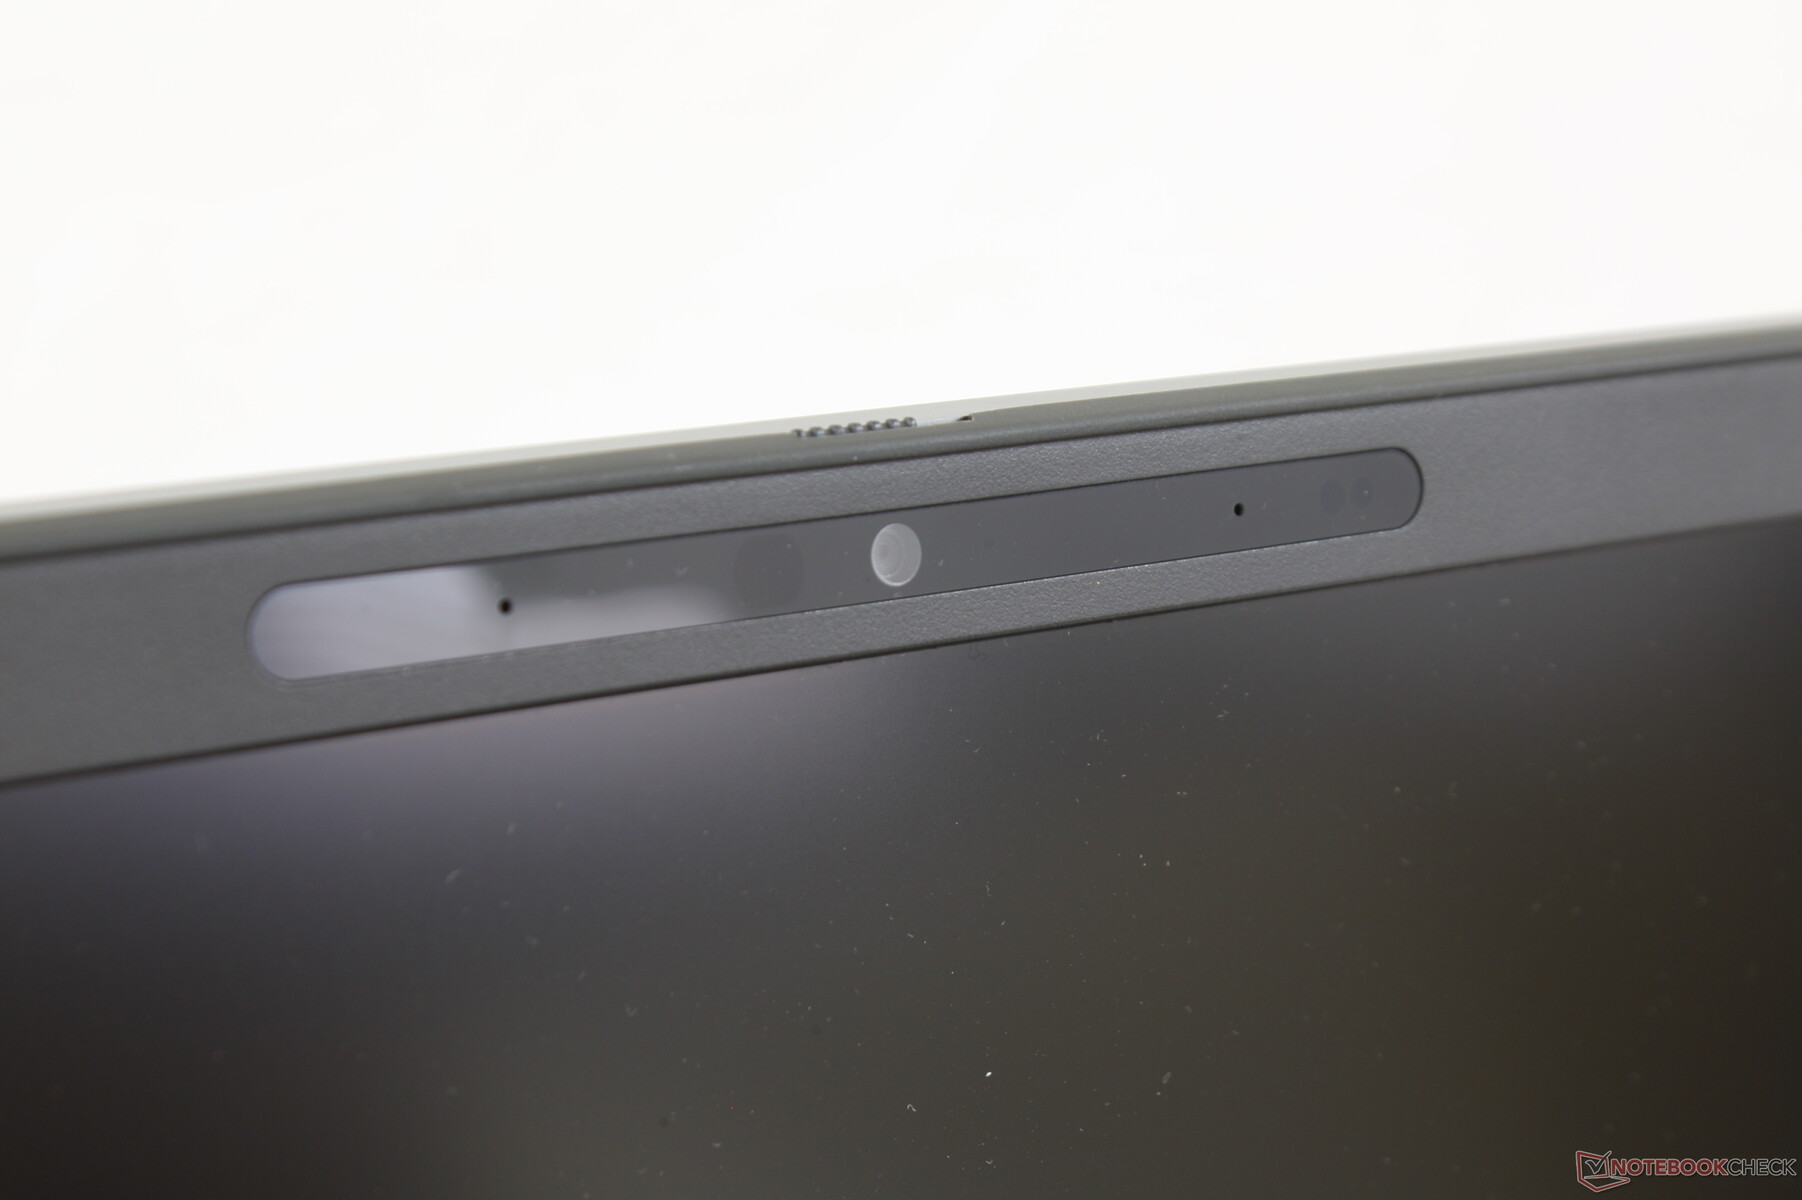
Webcam


Security
Dell Trusted Device, Client Command, fingerprint reader, camera shutter, Noble lock, vPro, TPM, IR camera, and NFC are all supported for added security. Many are optional and will cost extra or be exclusive to certain configurations.
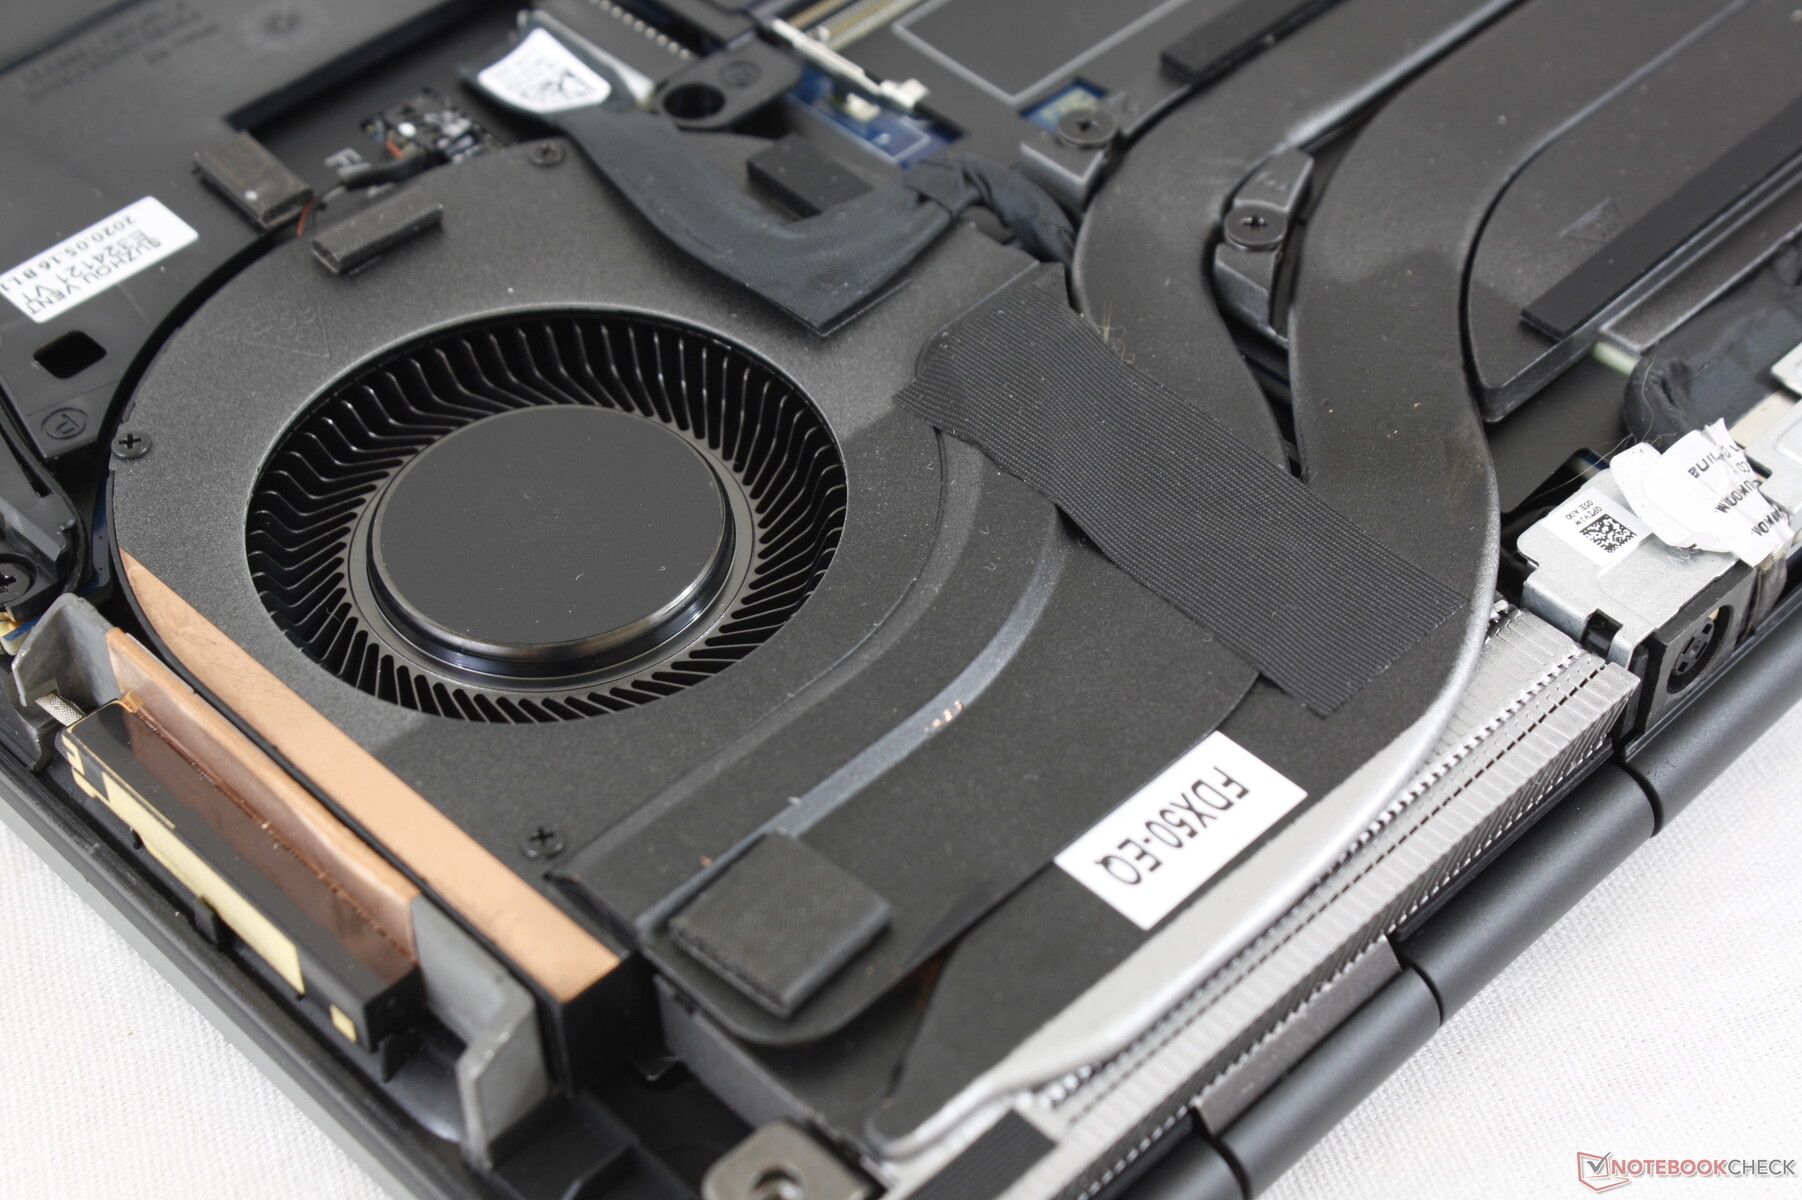
Maintenance
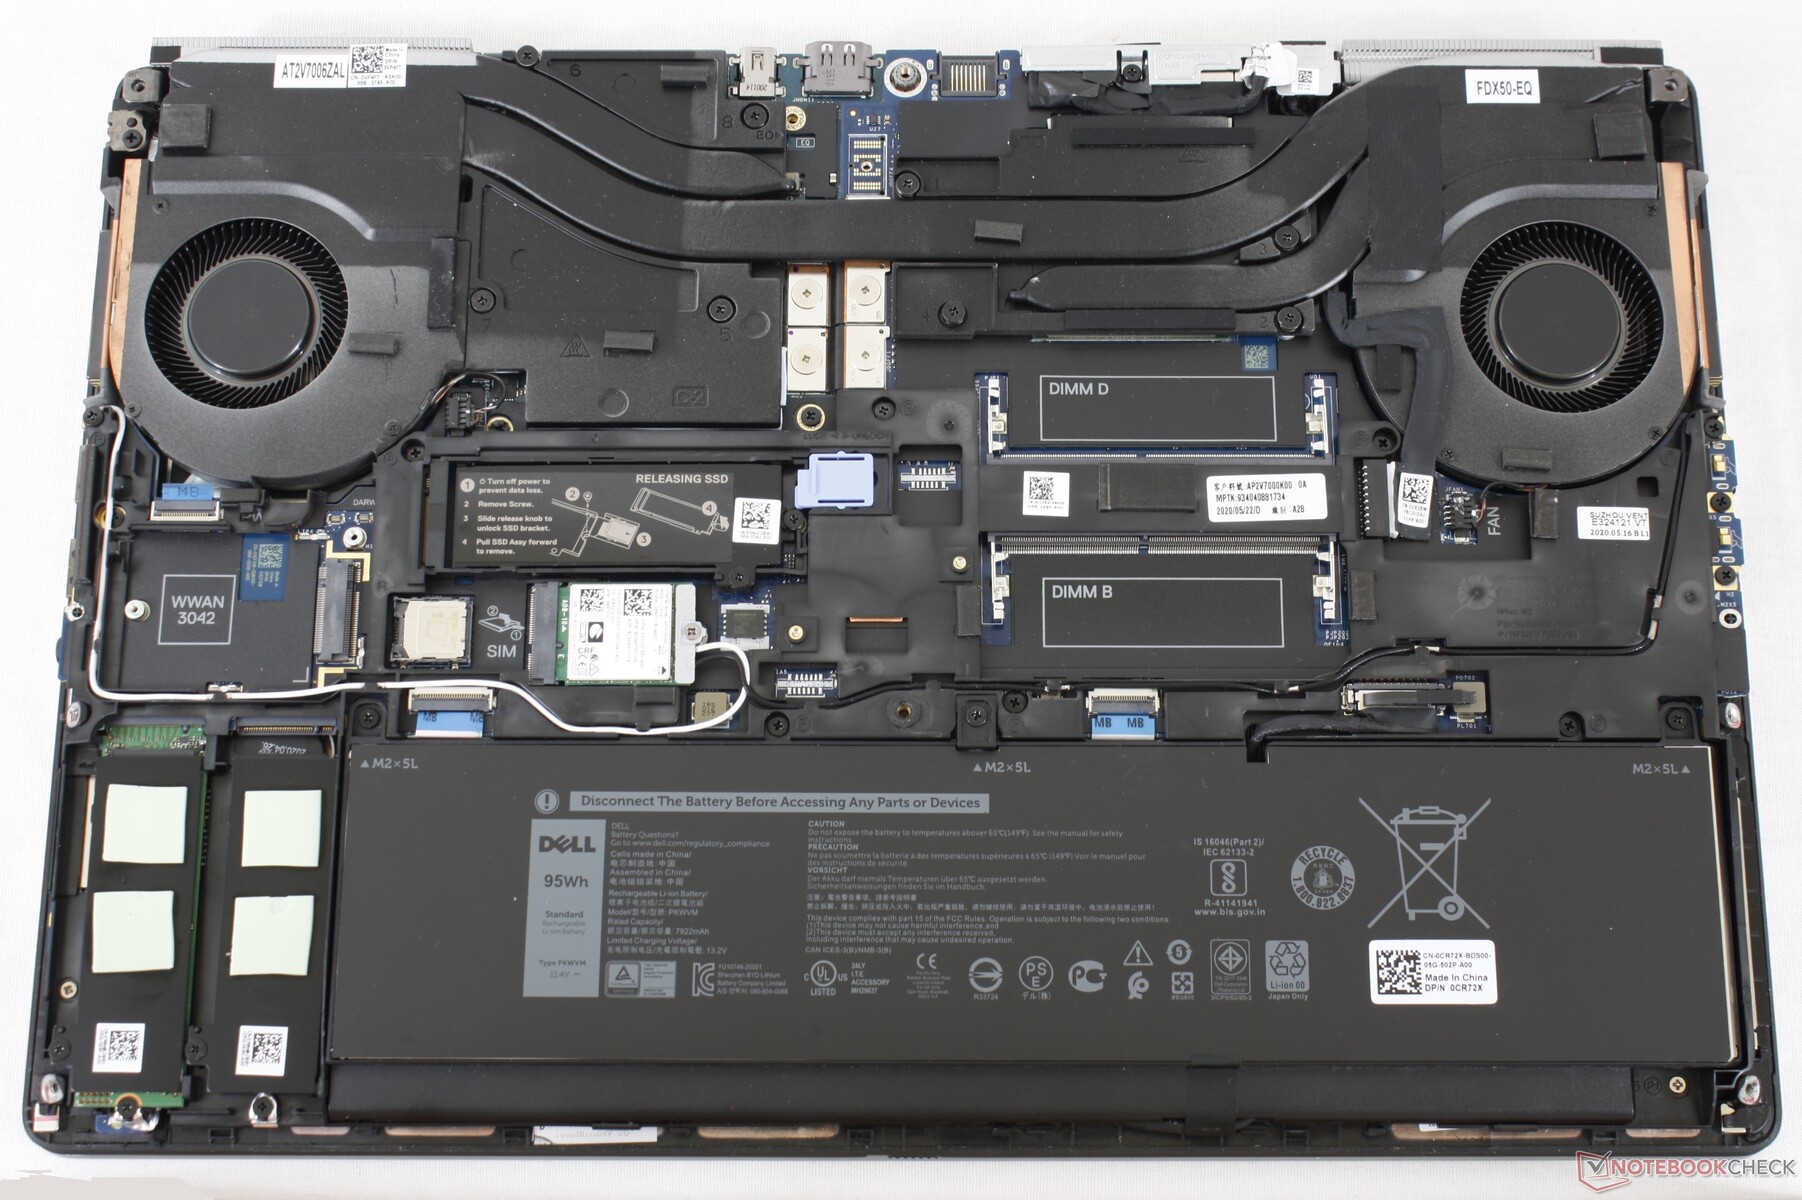
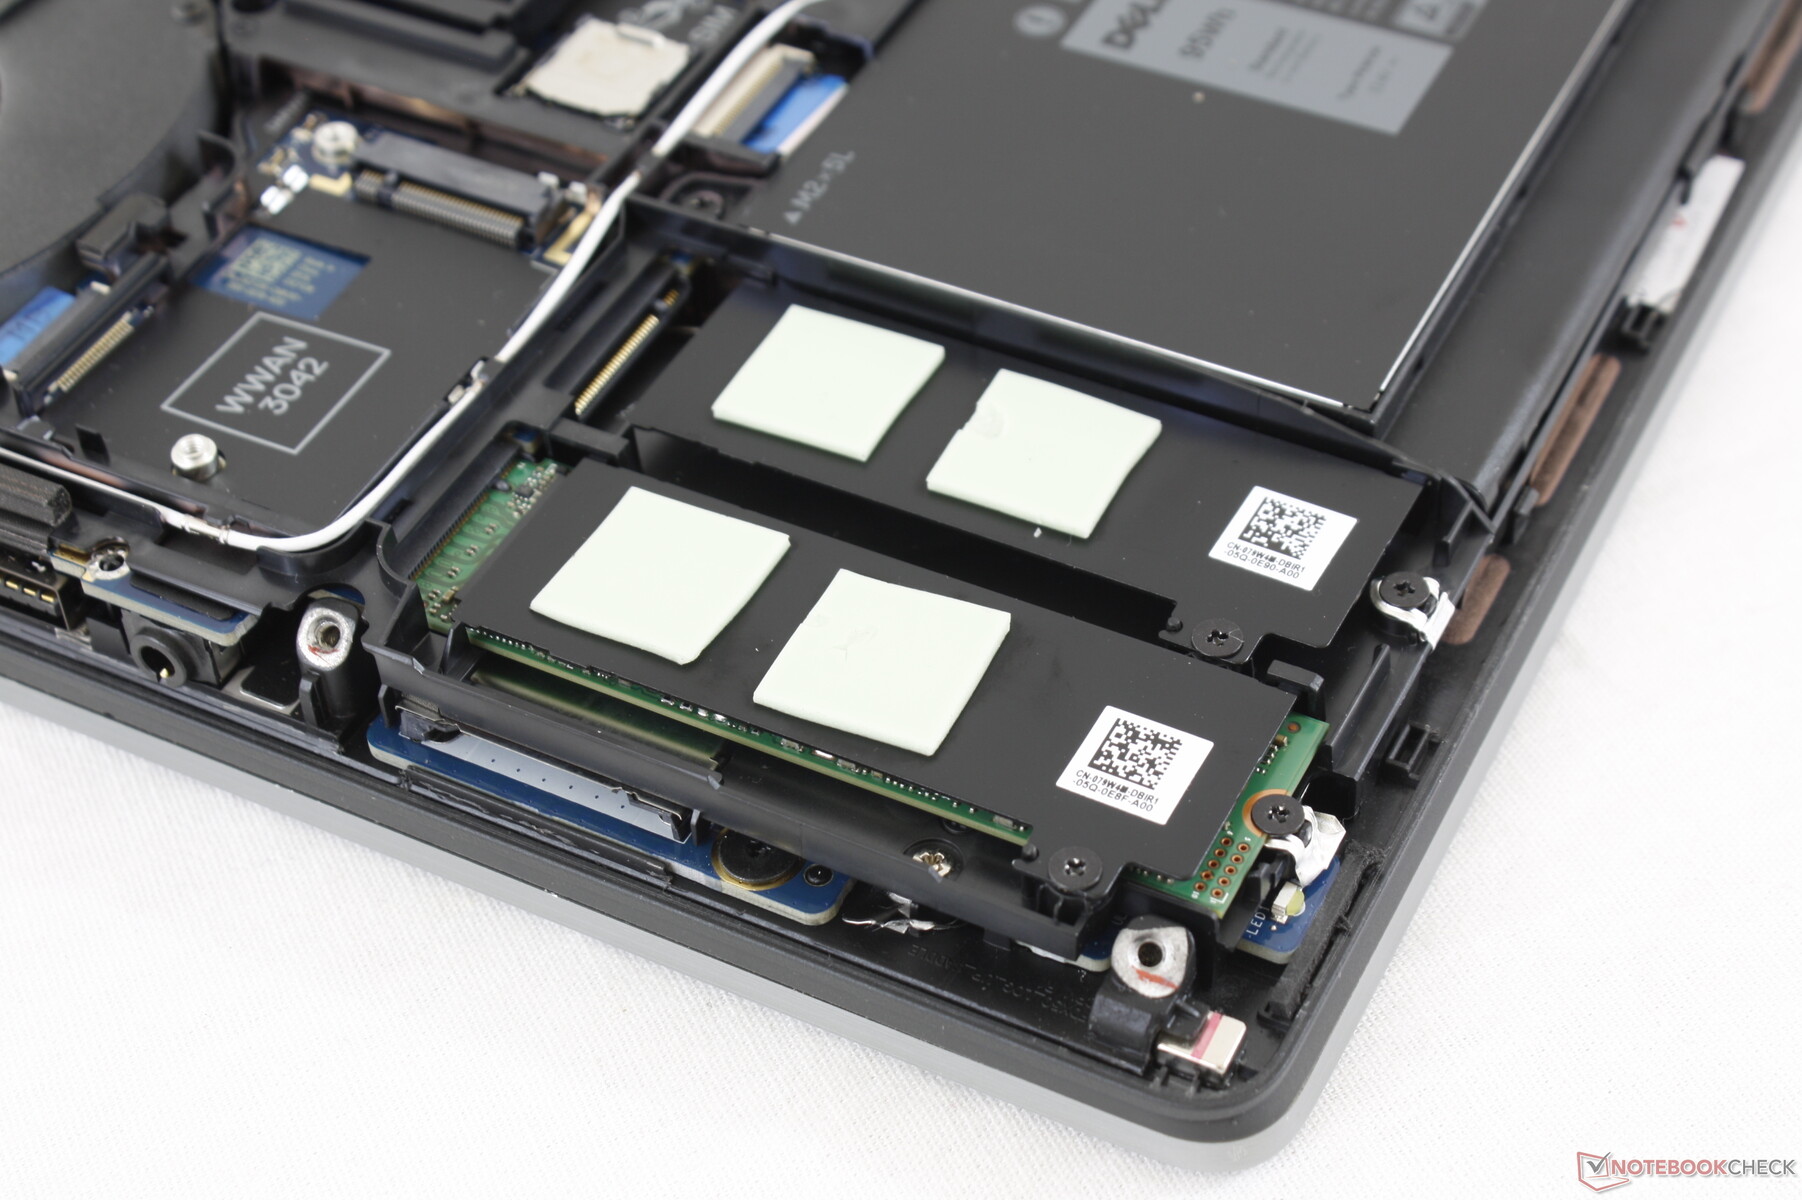
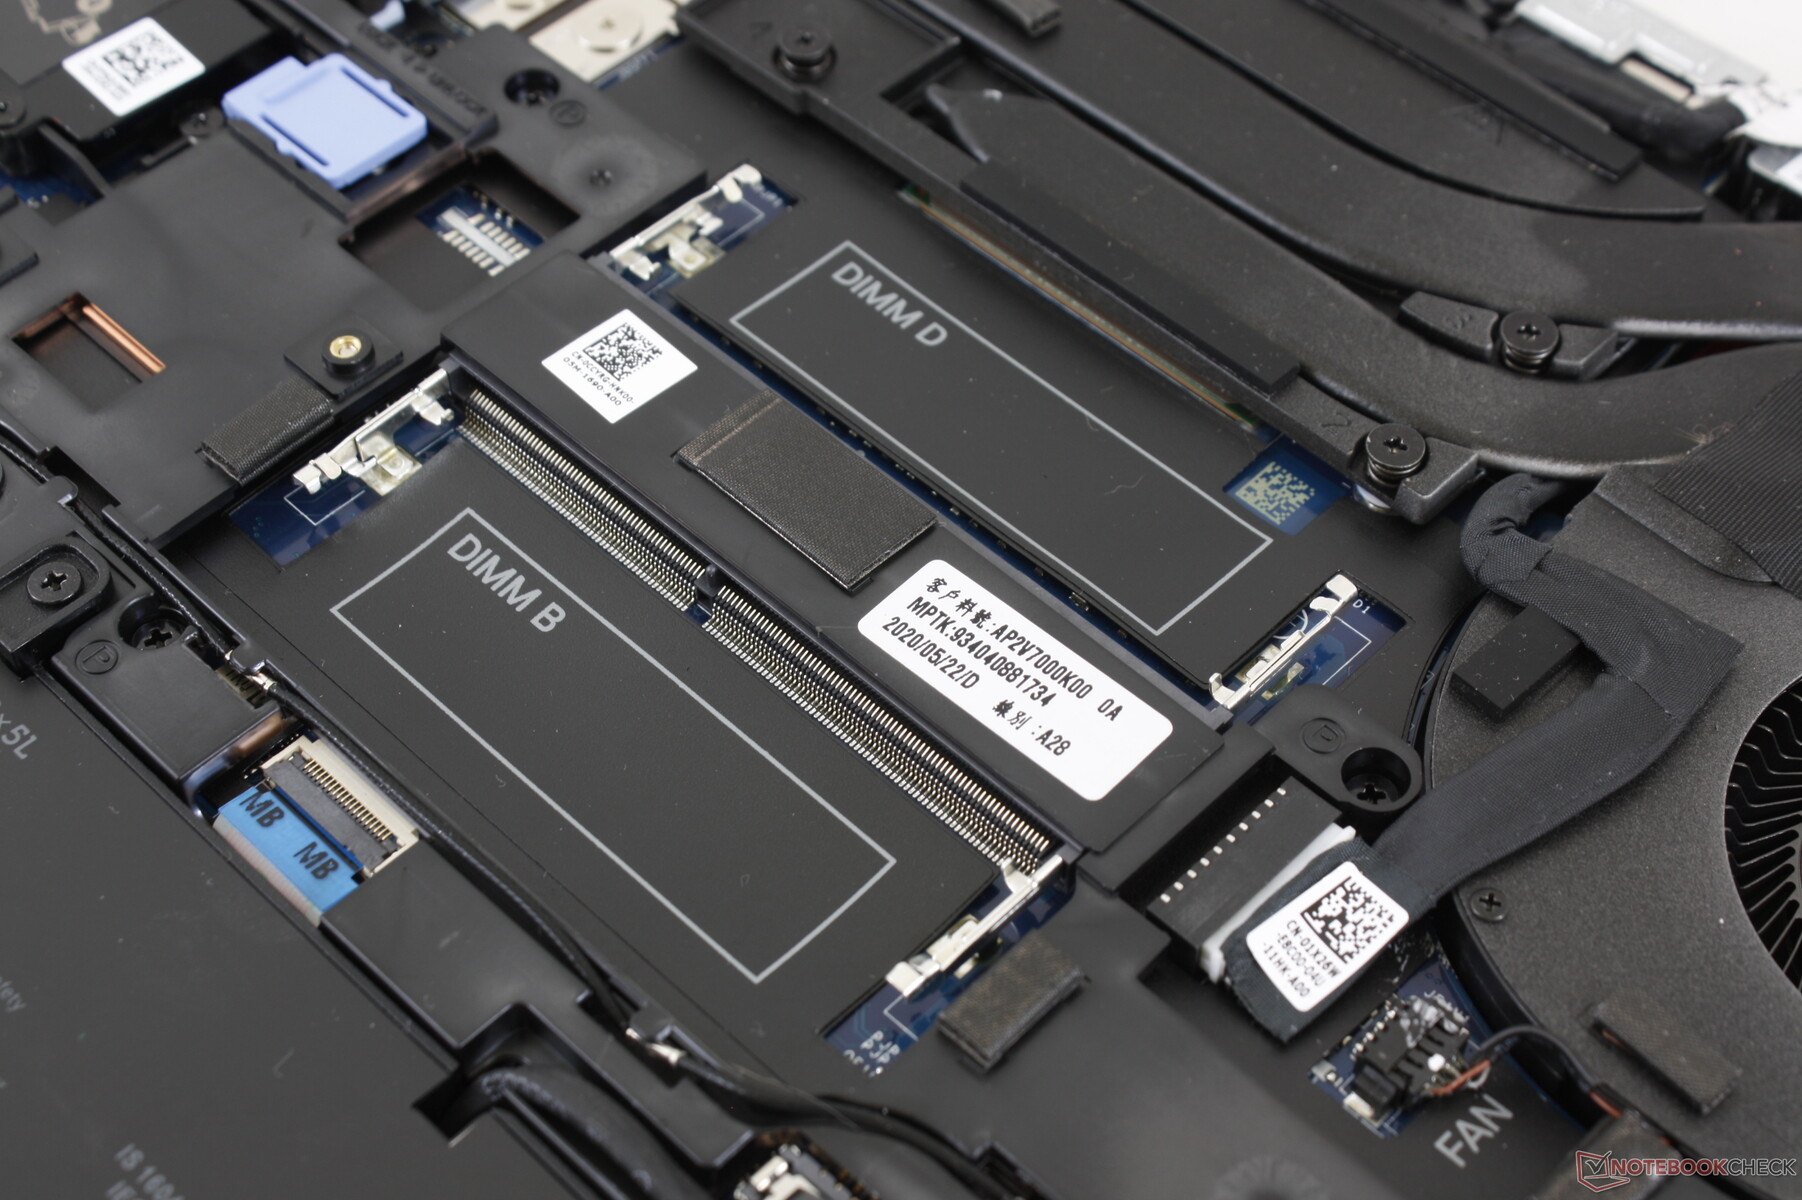
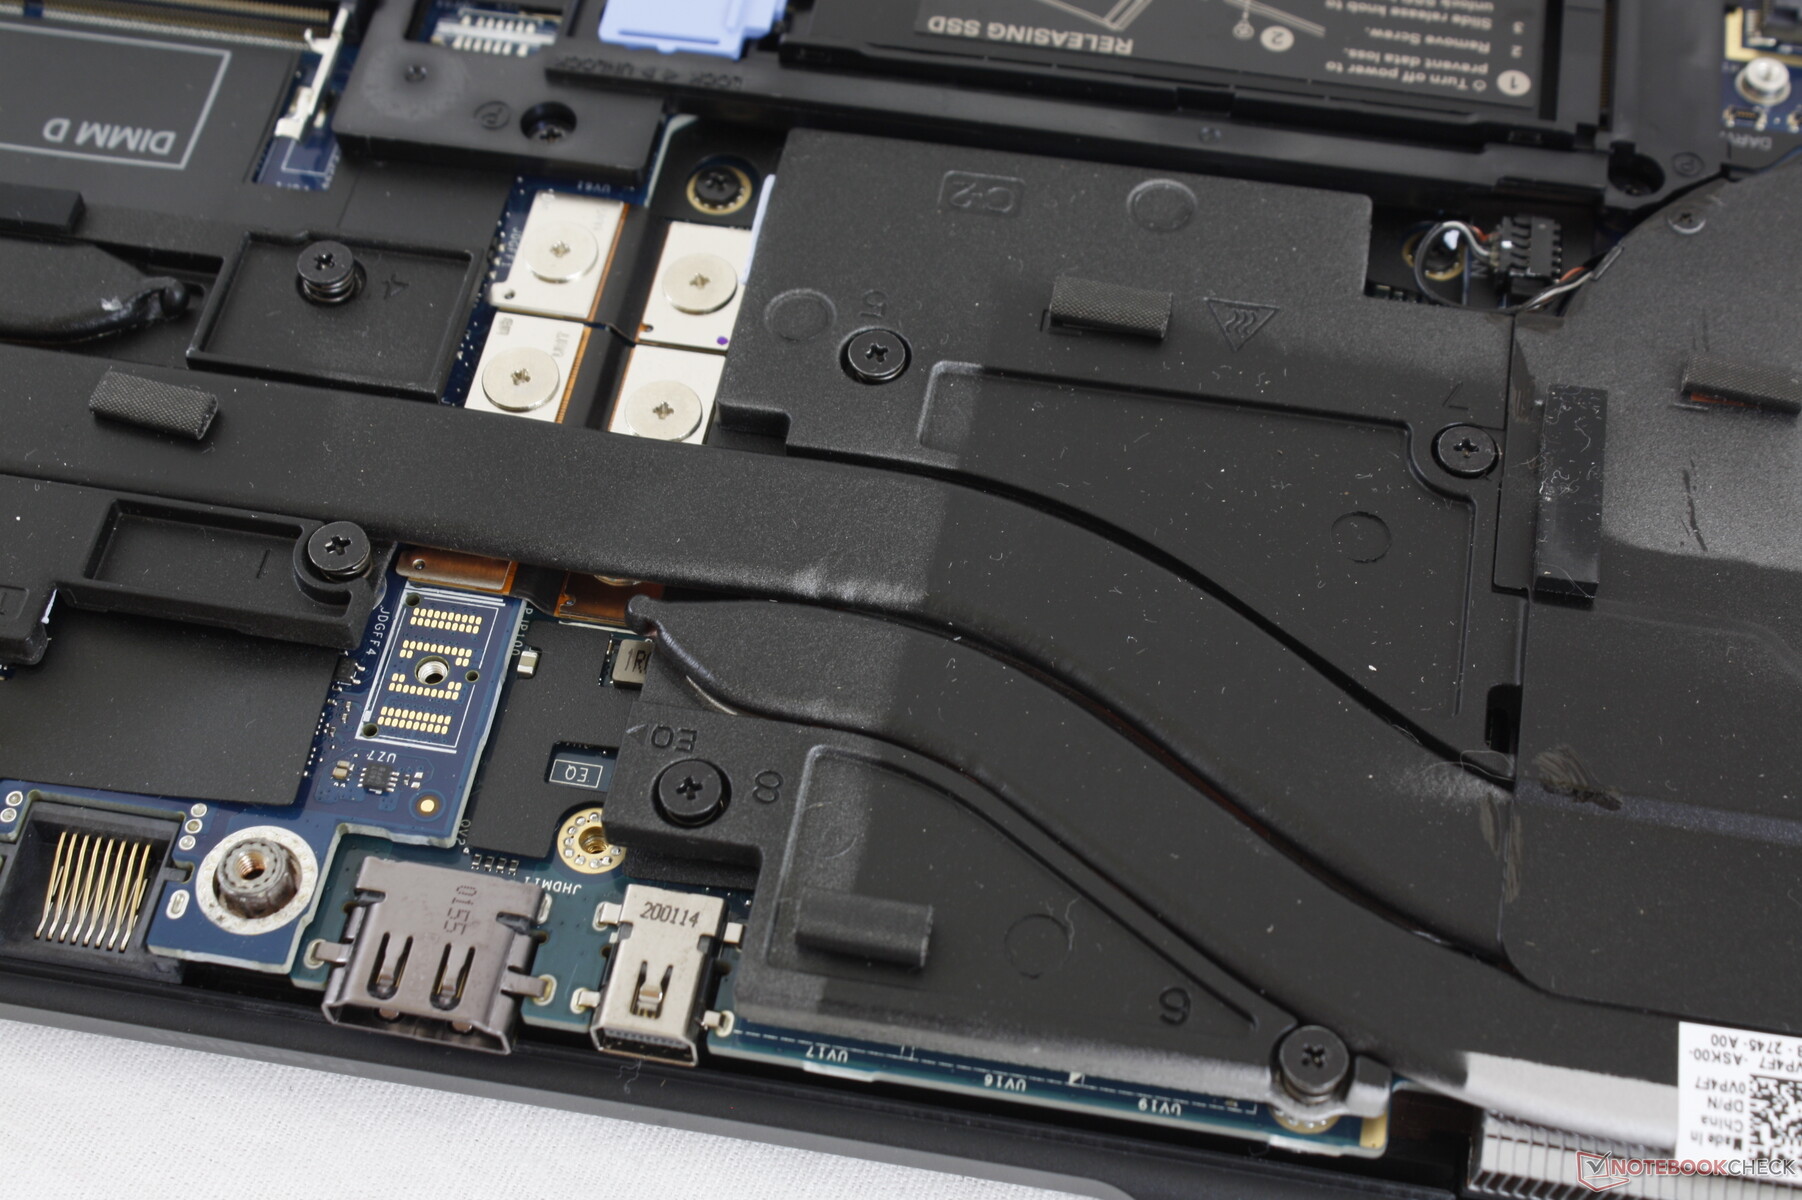
The bottom panel is secured by 8 Philips screws for easy servicing. Users have access to the WAN slot, WLAN module, two of the four SODIMM slots, and all three storage bays. Further disassembly is required for the other two SODIMM slots.
Accessories and Warranty
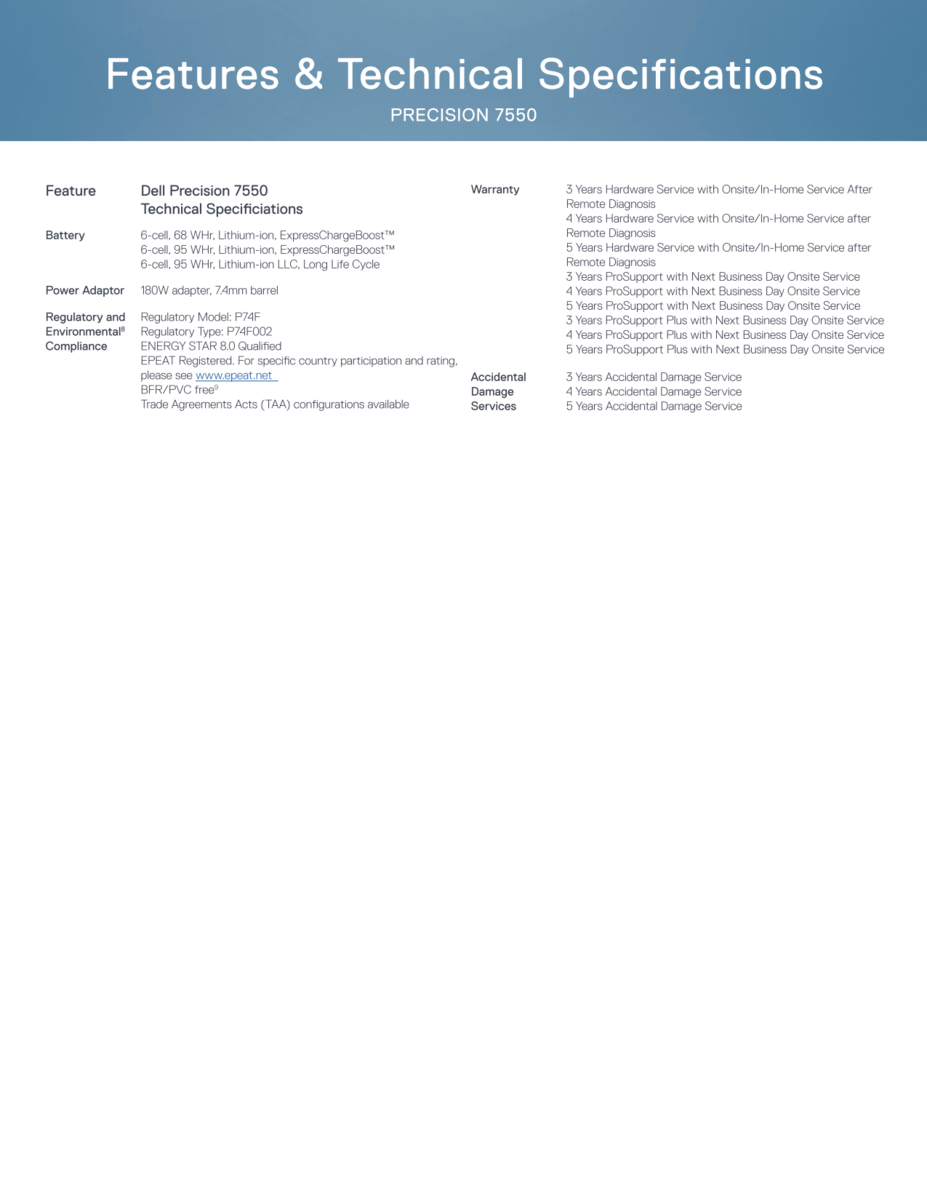
There are no extras in the box outside of the standard AC adapter and paperwork. A three-year limited manufacturer warranty comes standard with ProSupport and extension options.
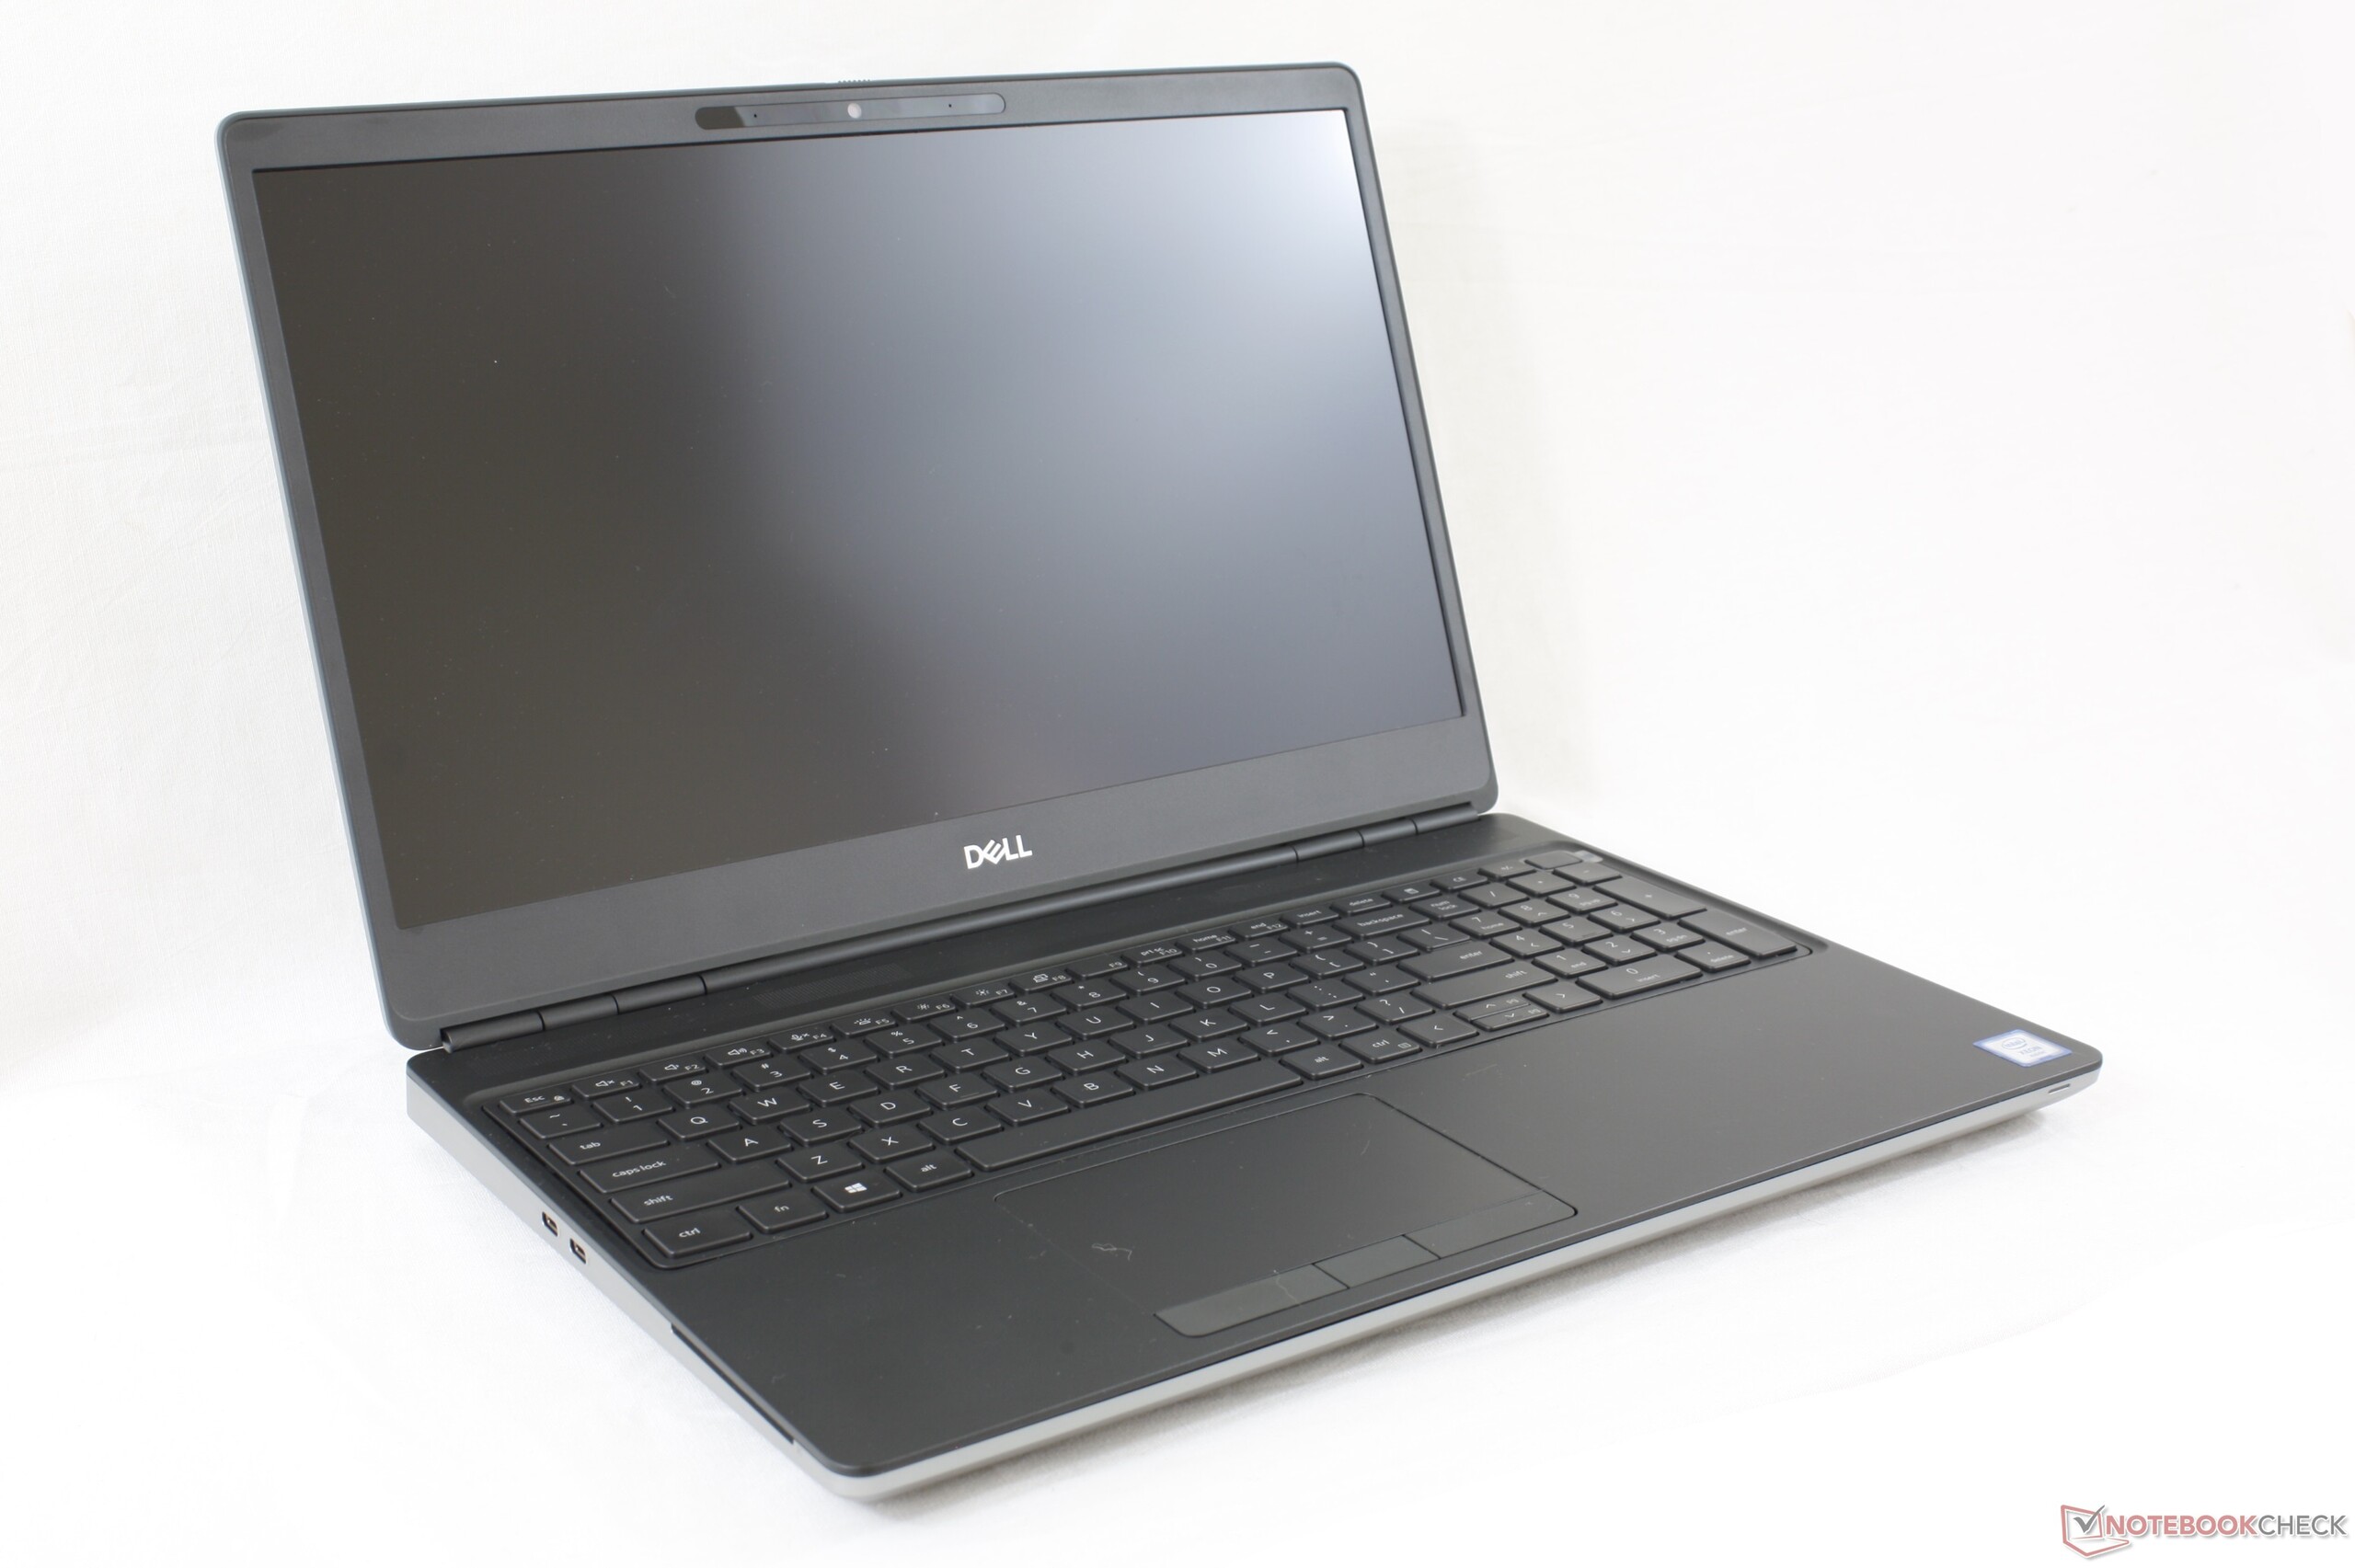
Input Devices
Keyboard
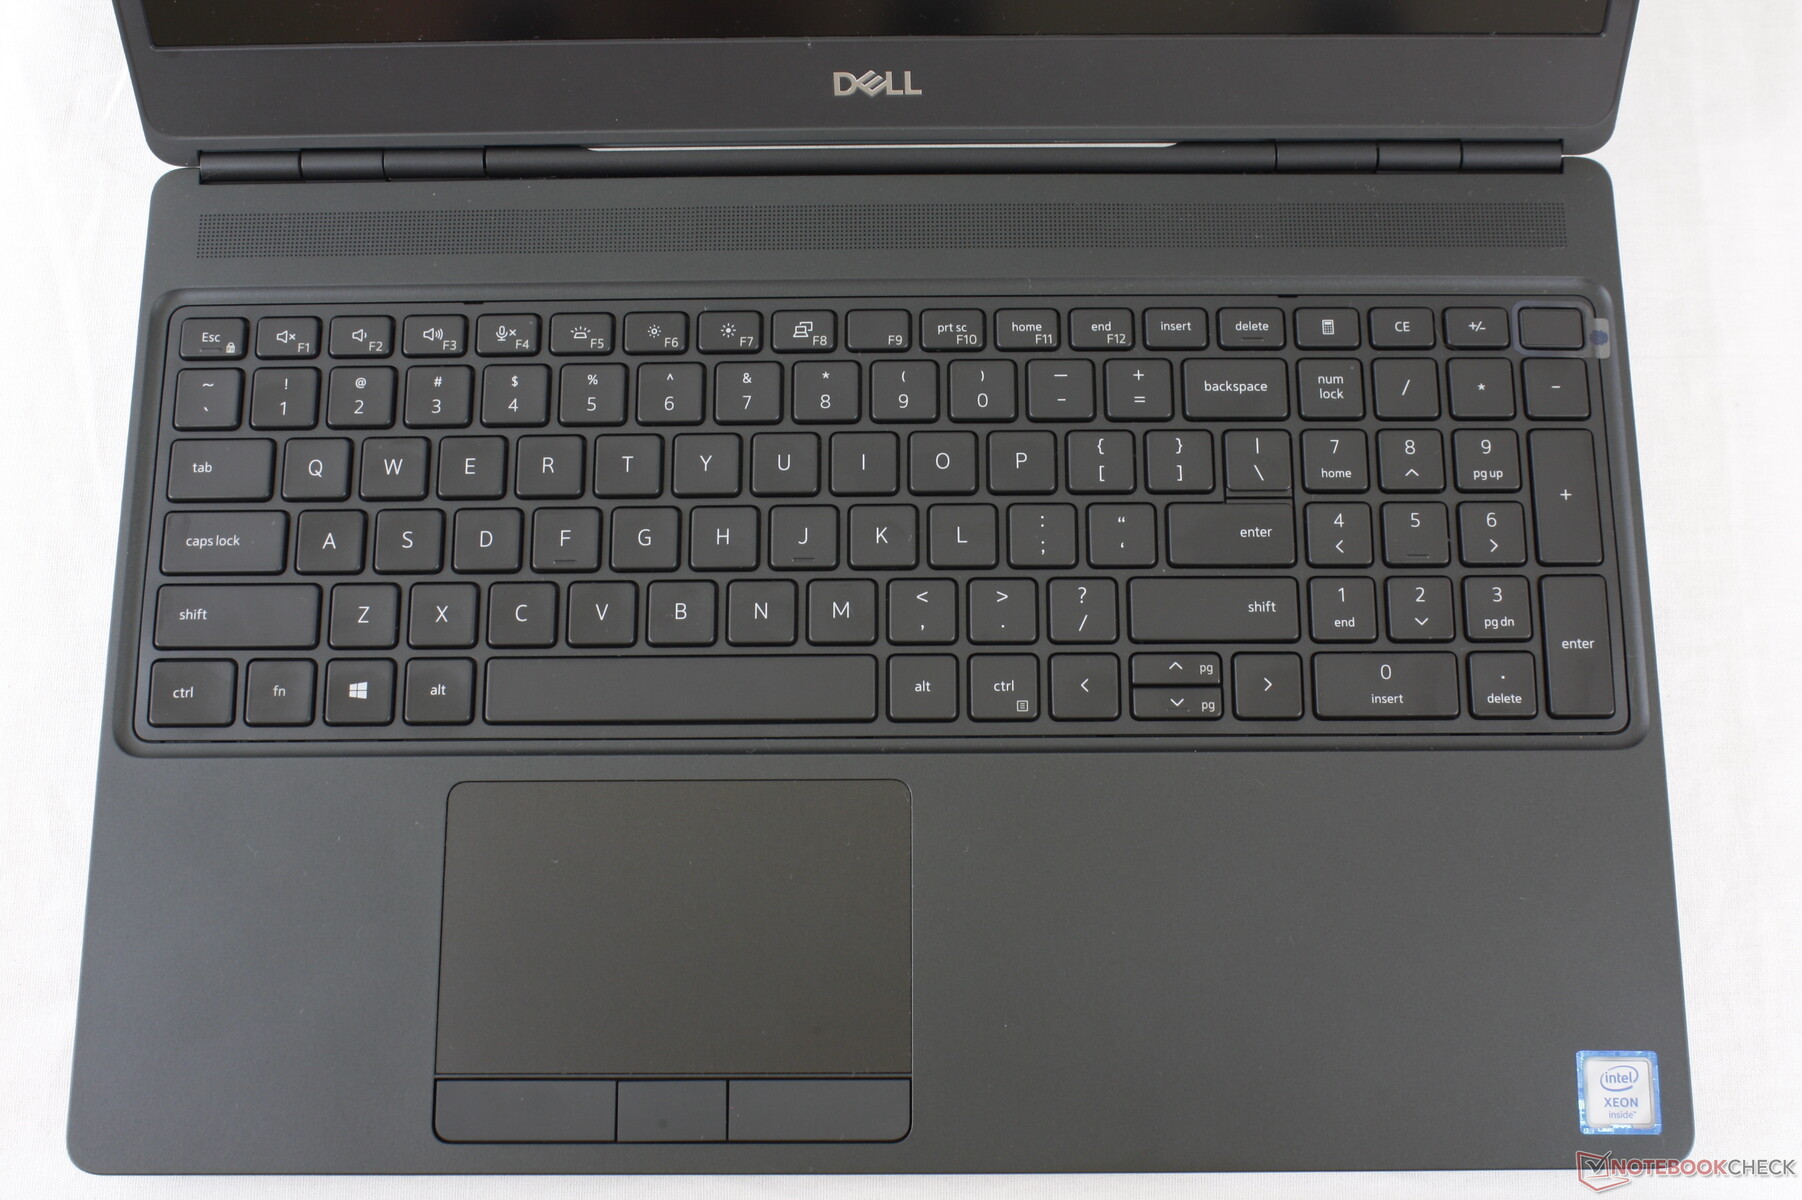
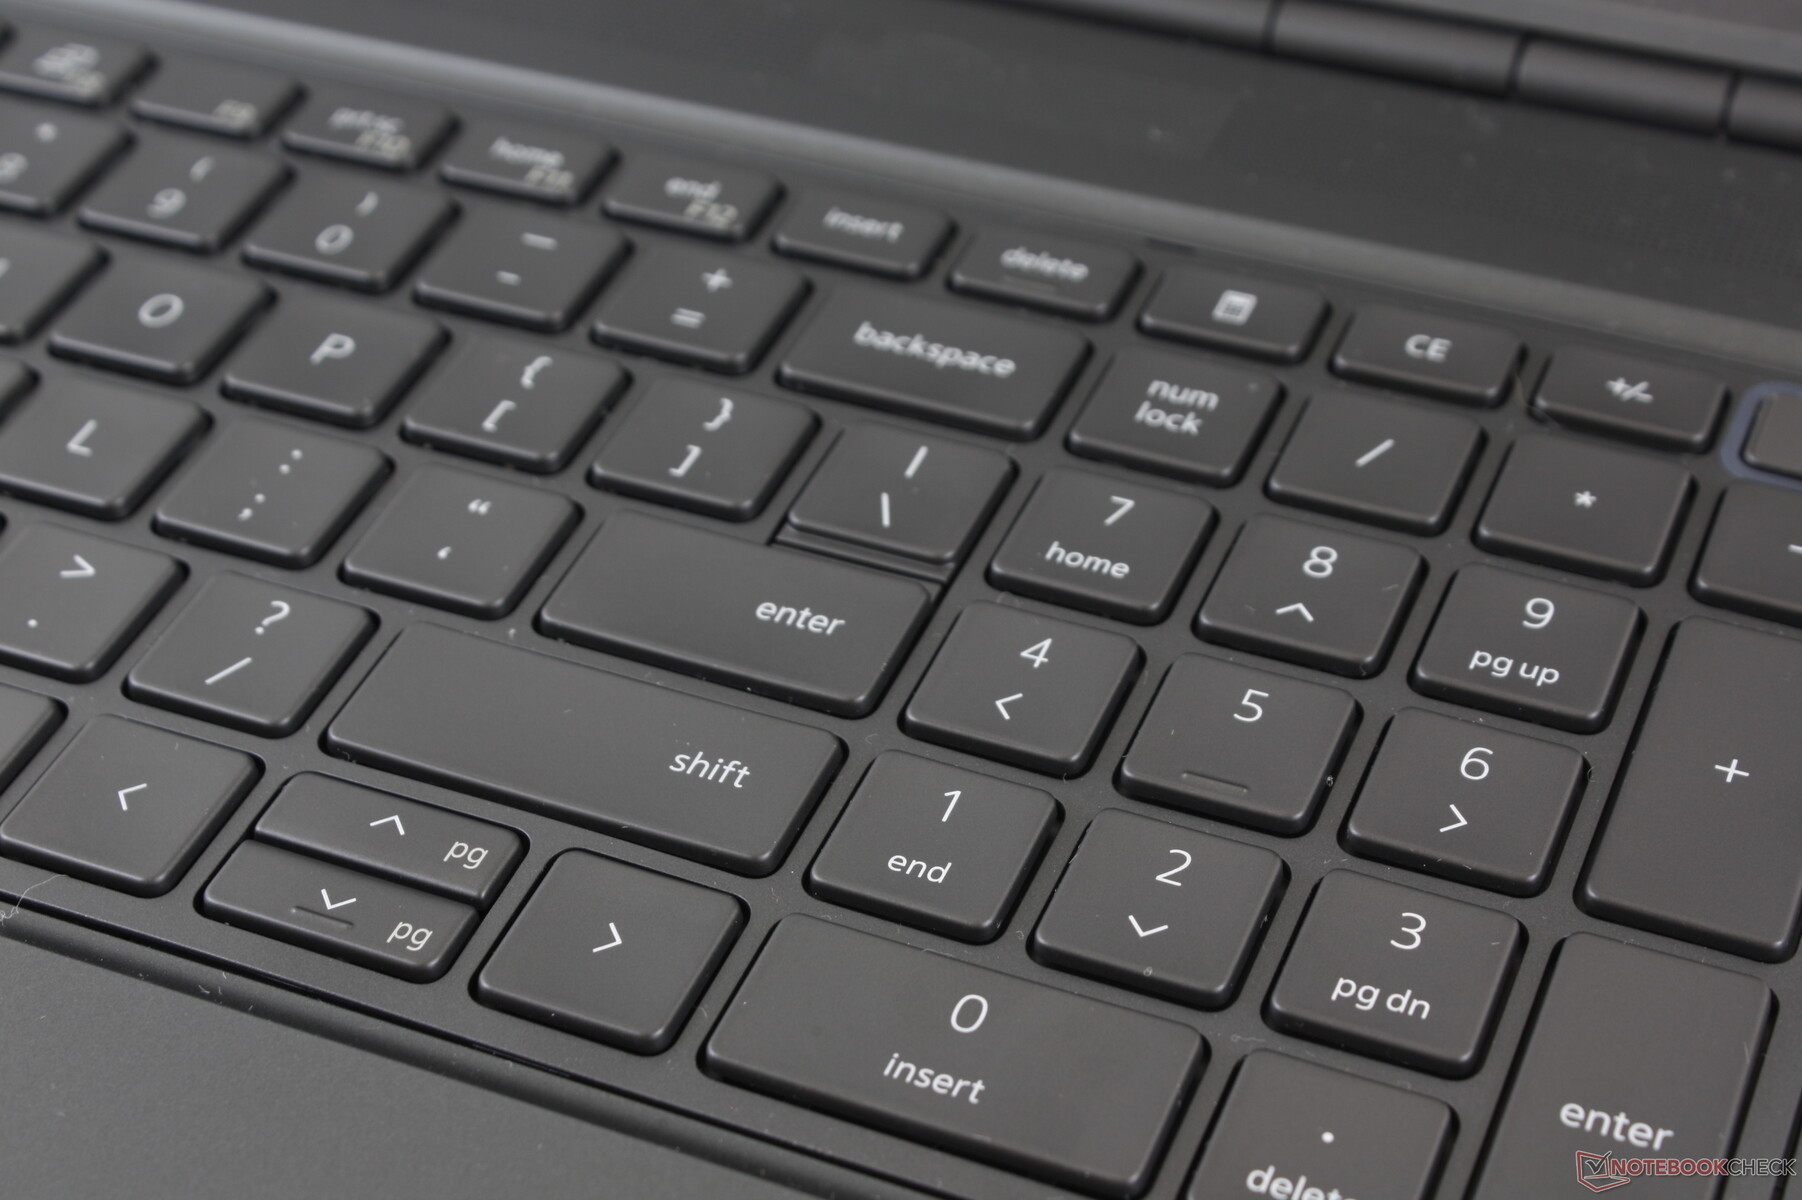
Since the base is so dense, the keyboard keys are relatively quiet in clatter with both firm and uniform feedback. We appreciate that the NumPad keys are the same size as the main QWERTY keys which is not always the case on many laptops. It's a pleasant typing experience that we would like to see recreated on other Dell laptops.
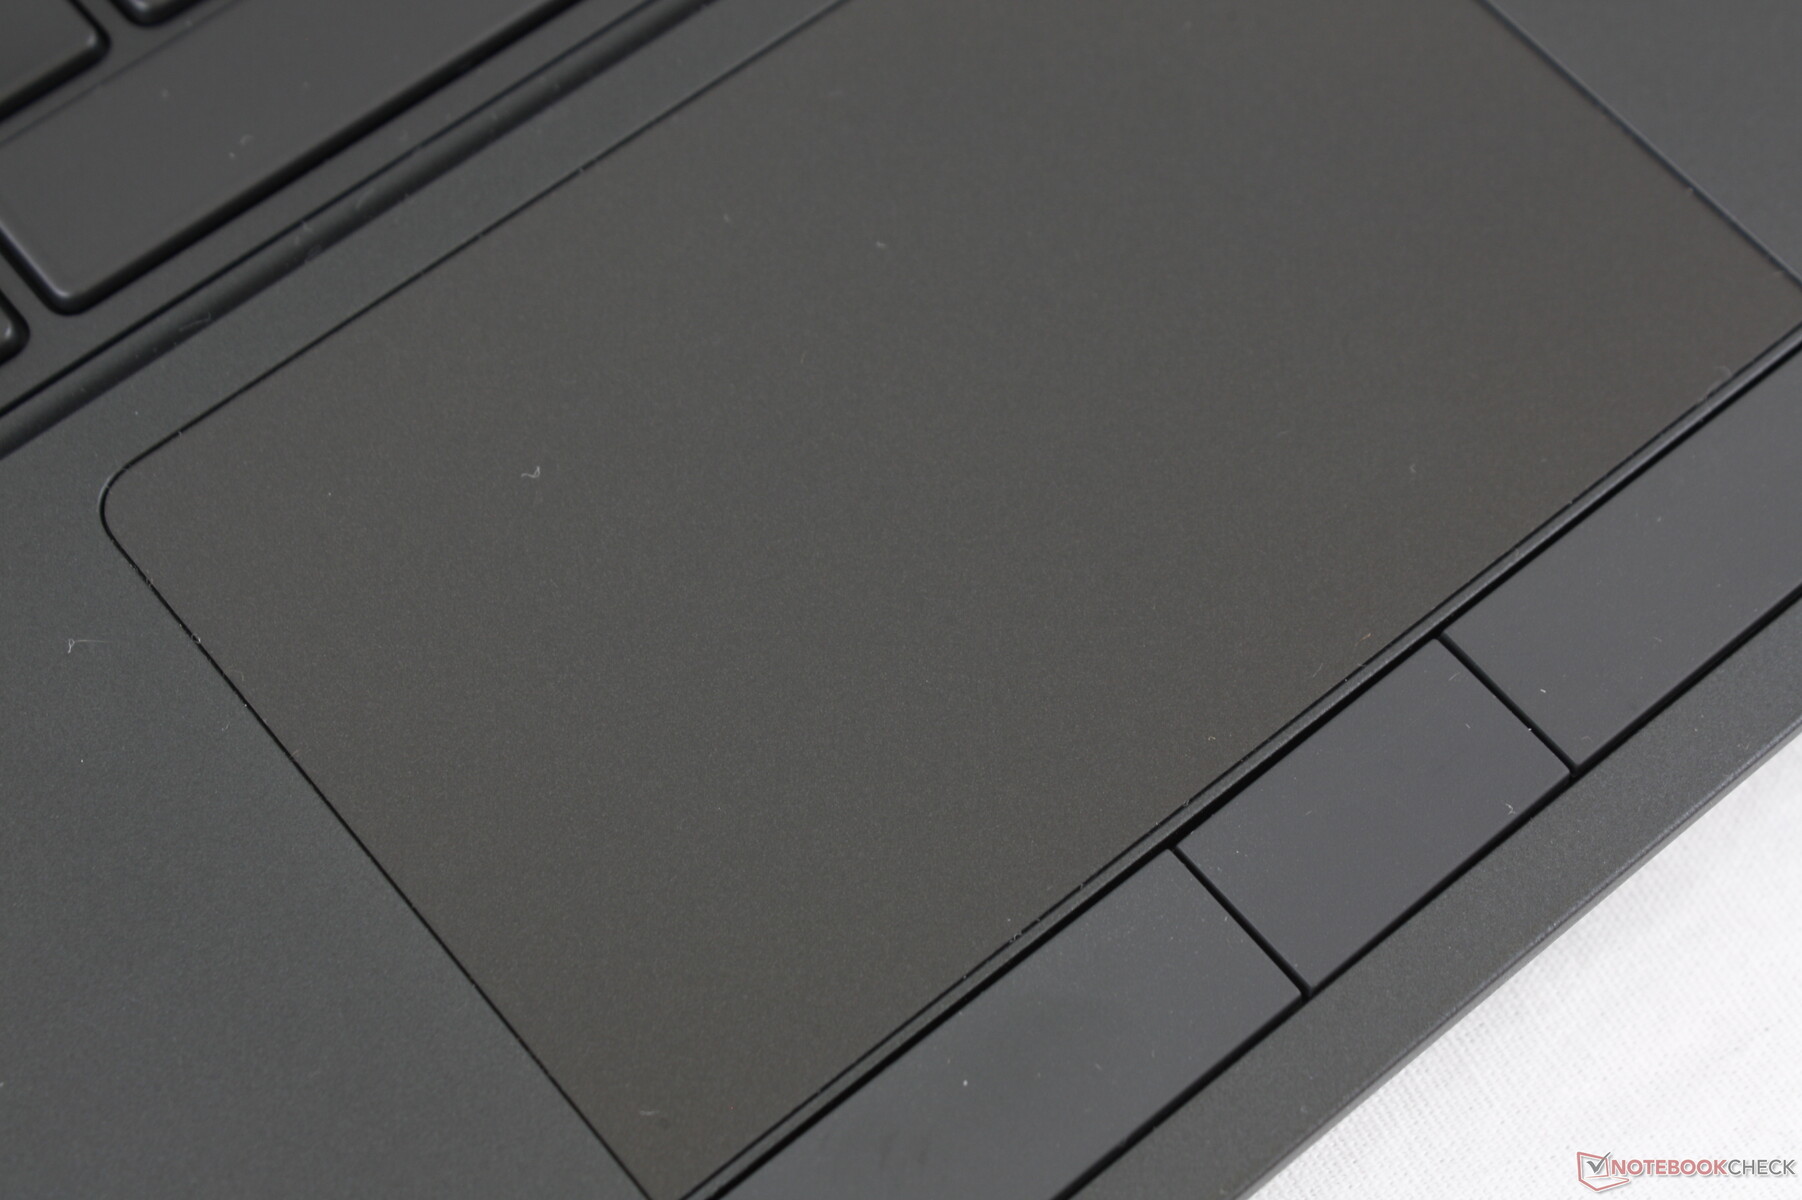
Touchpad
The touchpad is relatively small (10 x 6.5 cm), but it makes up for this with dedicated mouse buttons in contrast to most ultra-thin workstations like the Precision 5550 or WS66. Glide is extremely smooth with almost no sticking even when moving at slow speeds.
Meanwhile, the integrated mouse buttons are quiet in clatter with moderate travel. Feedback is softer and spongier as a result especially when compared to the firmer and louder mouse buttons of the MSI WT75 series.

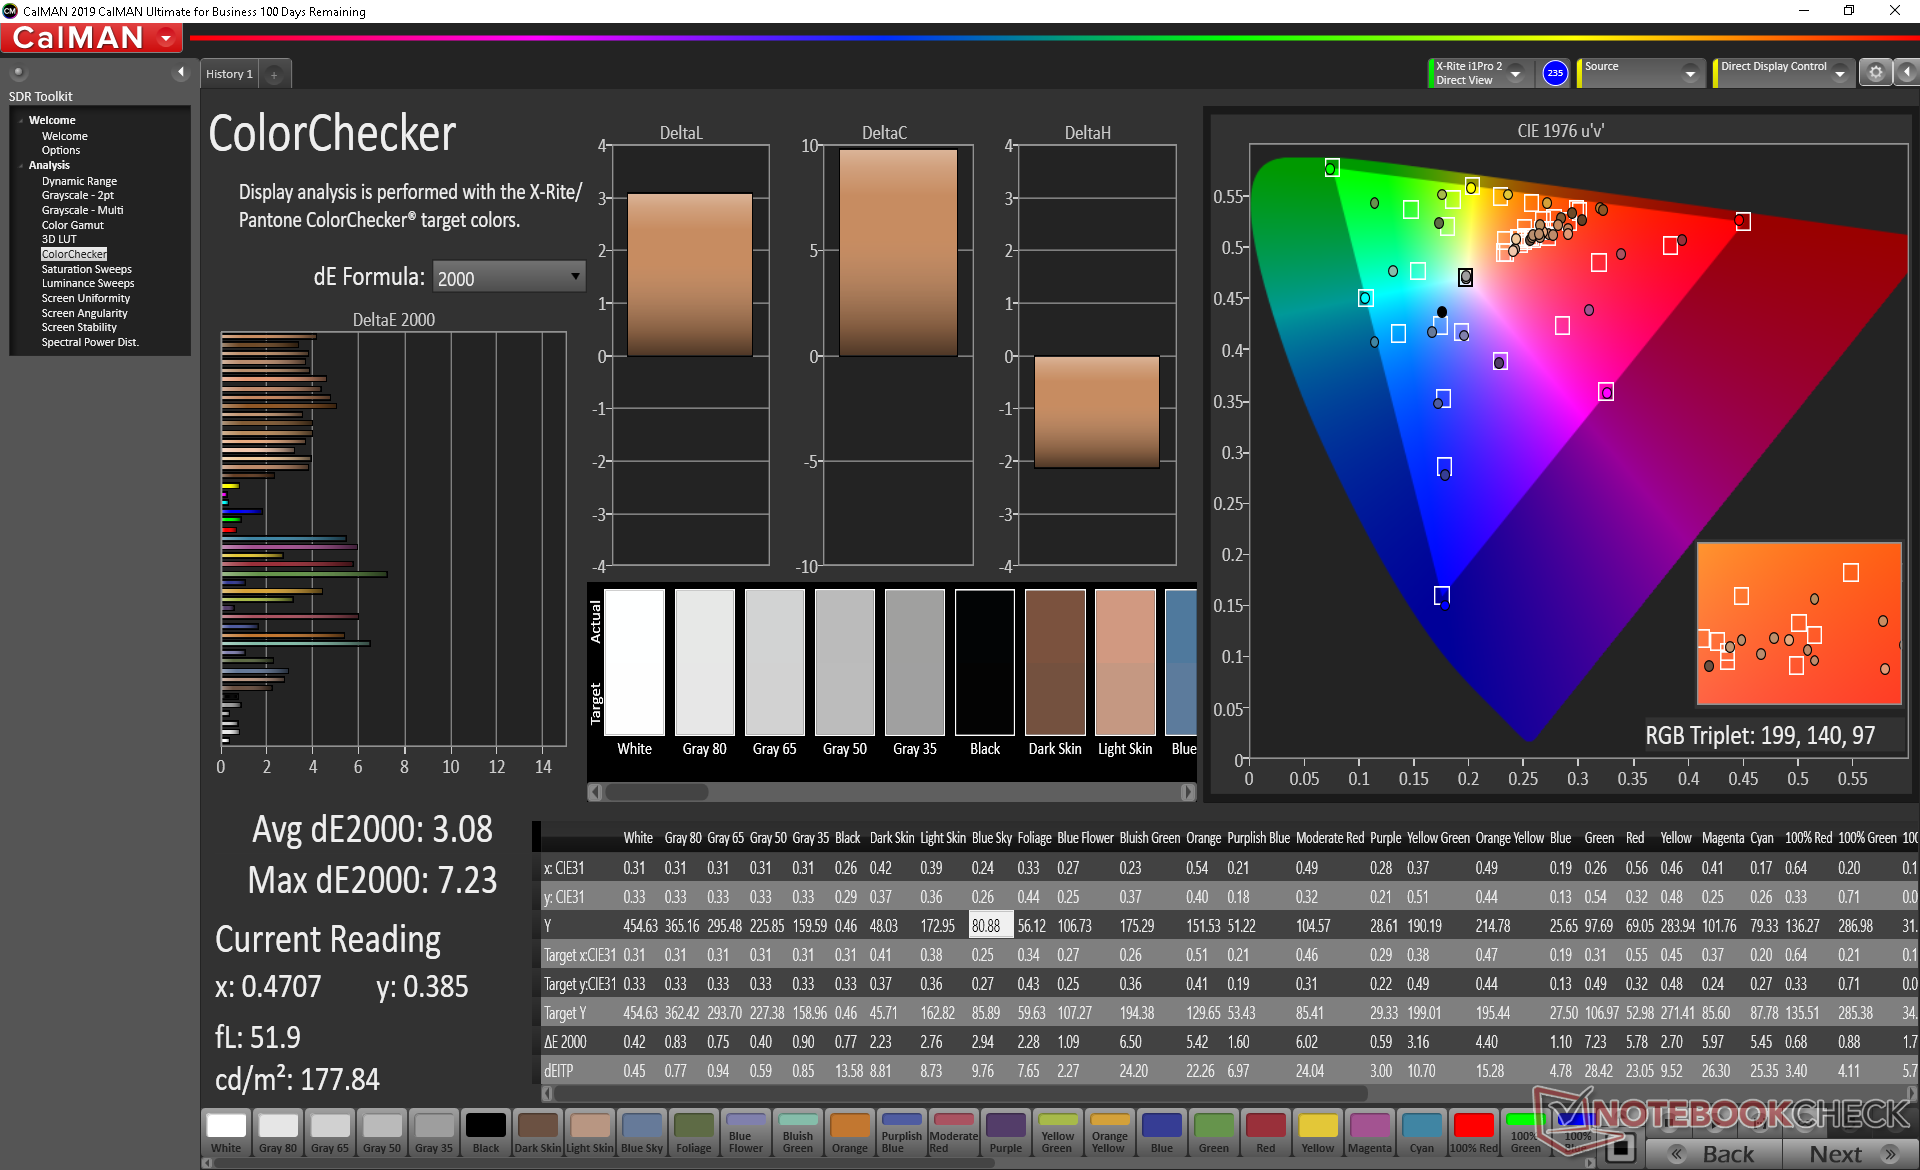
Display
Interestingly, the Precision 7550 uses a similar 4K UHD AU Optronics B156ZAN IPS panel as found on the 2018 Inspiron 15 7577 but with improvements to brightness and color coverage. Response times remain average, however, which shouldn't be a huge issue since this isn't a gaming laptop. Its ~850:1 contrast ratio could be better when compared to the Innolux or Chi Mei panels on the ThinkPad P53 or Acer ConceptD 3, respectively.
We recommend avoiding Dell's cheapest 220-nit option as colors will be much worse and the backlight will be quite dim.
| |||||||||||||||||||||||||
Brightness Distribution: 90 %
Center on Battery: 473.5 cd/m²
Contrast: 861:1 (Black: 0.55 cd/m²)
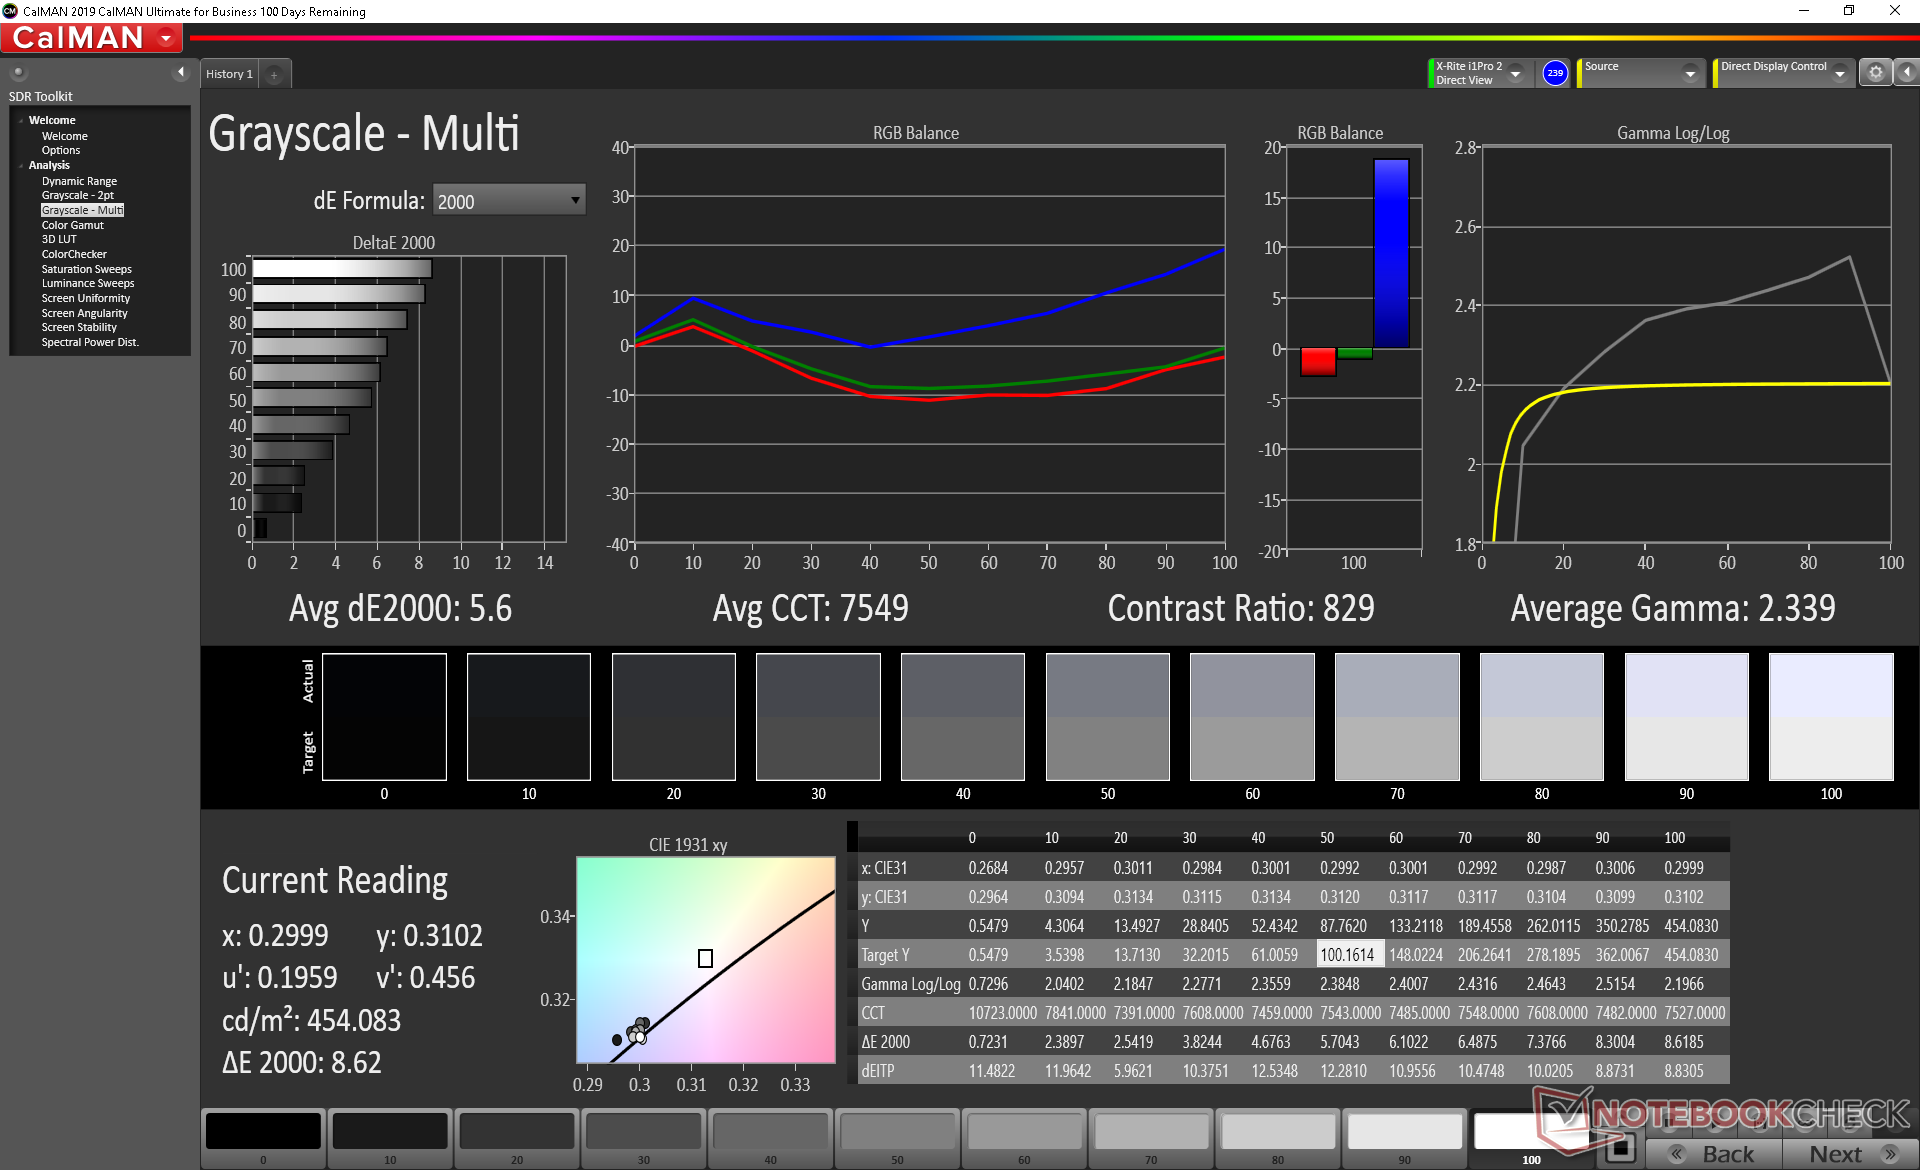
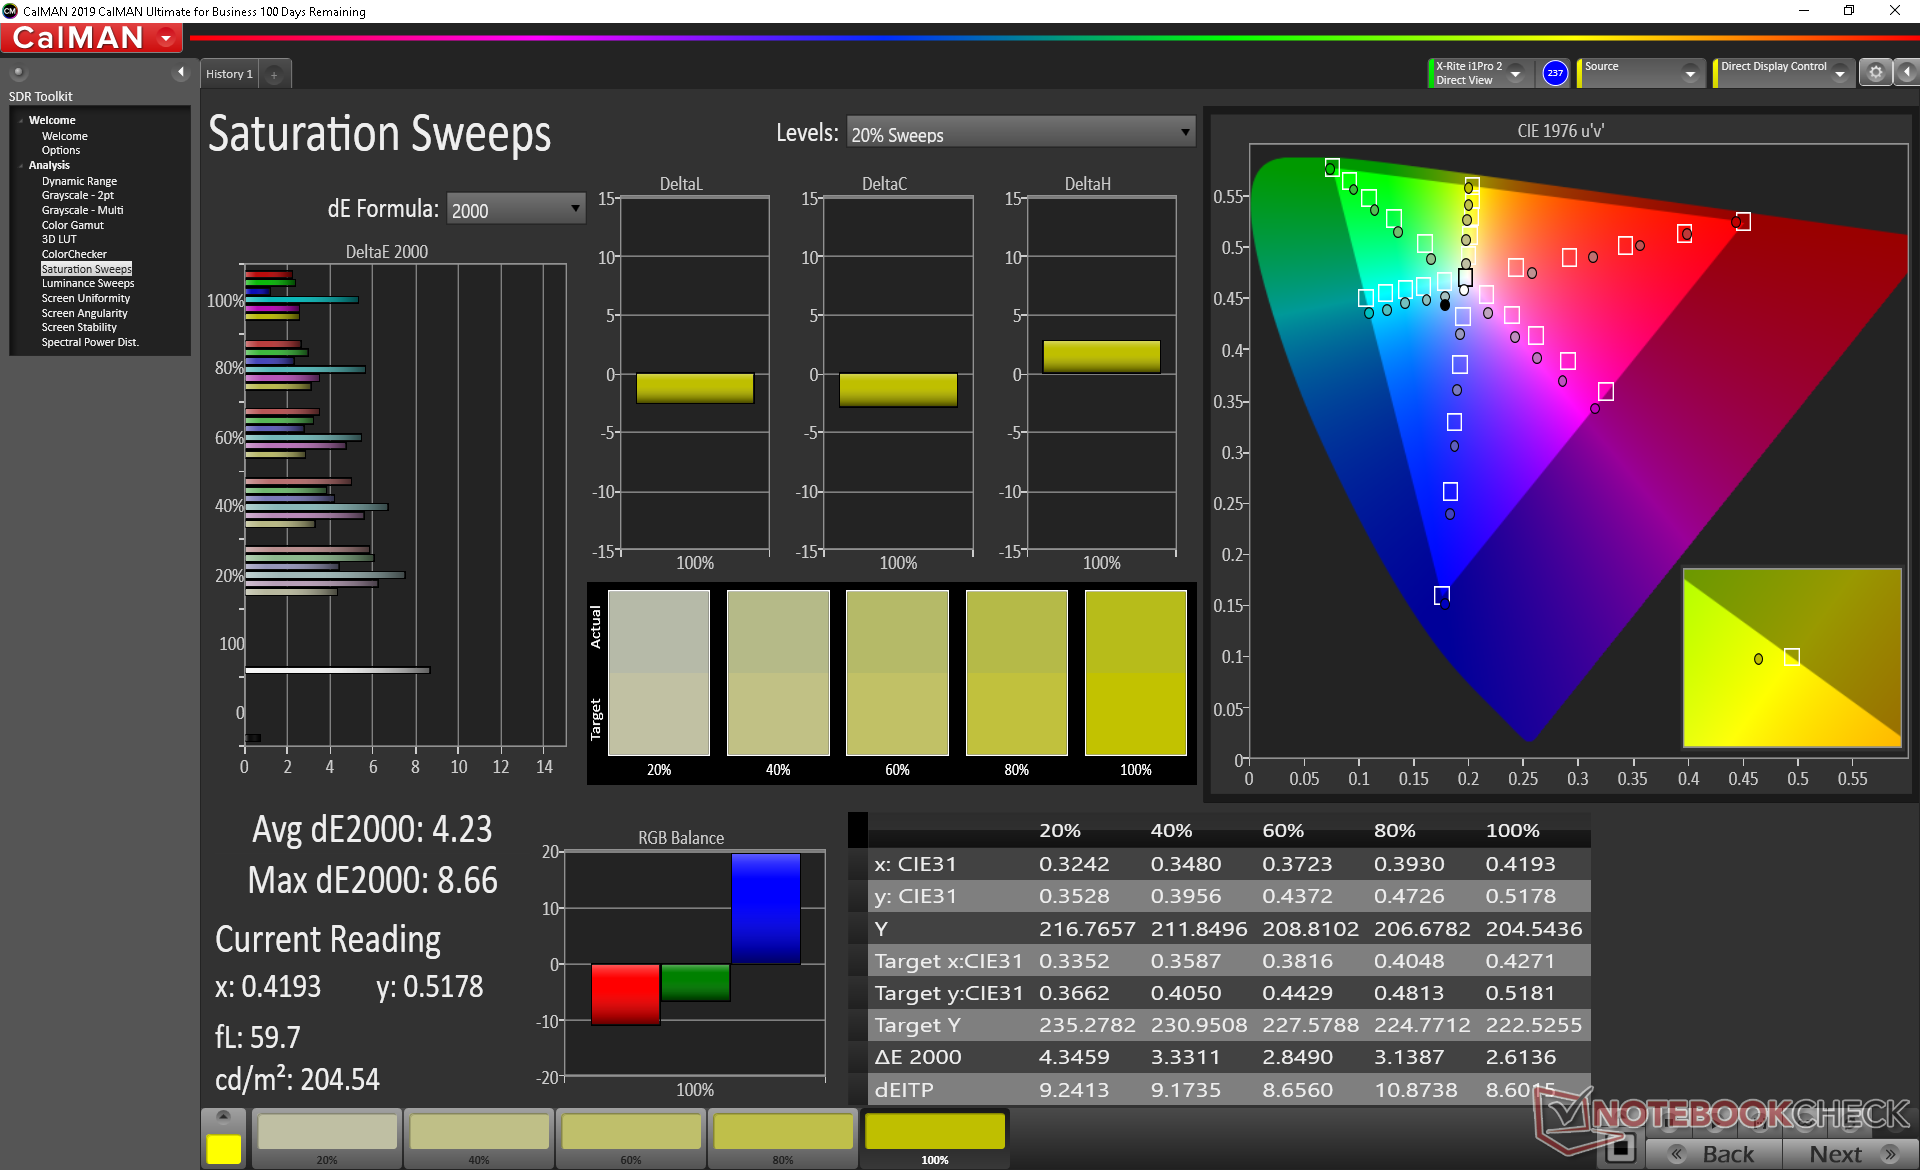
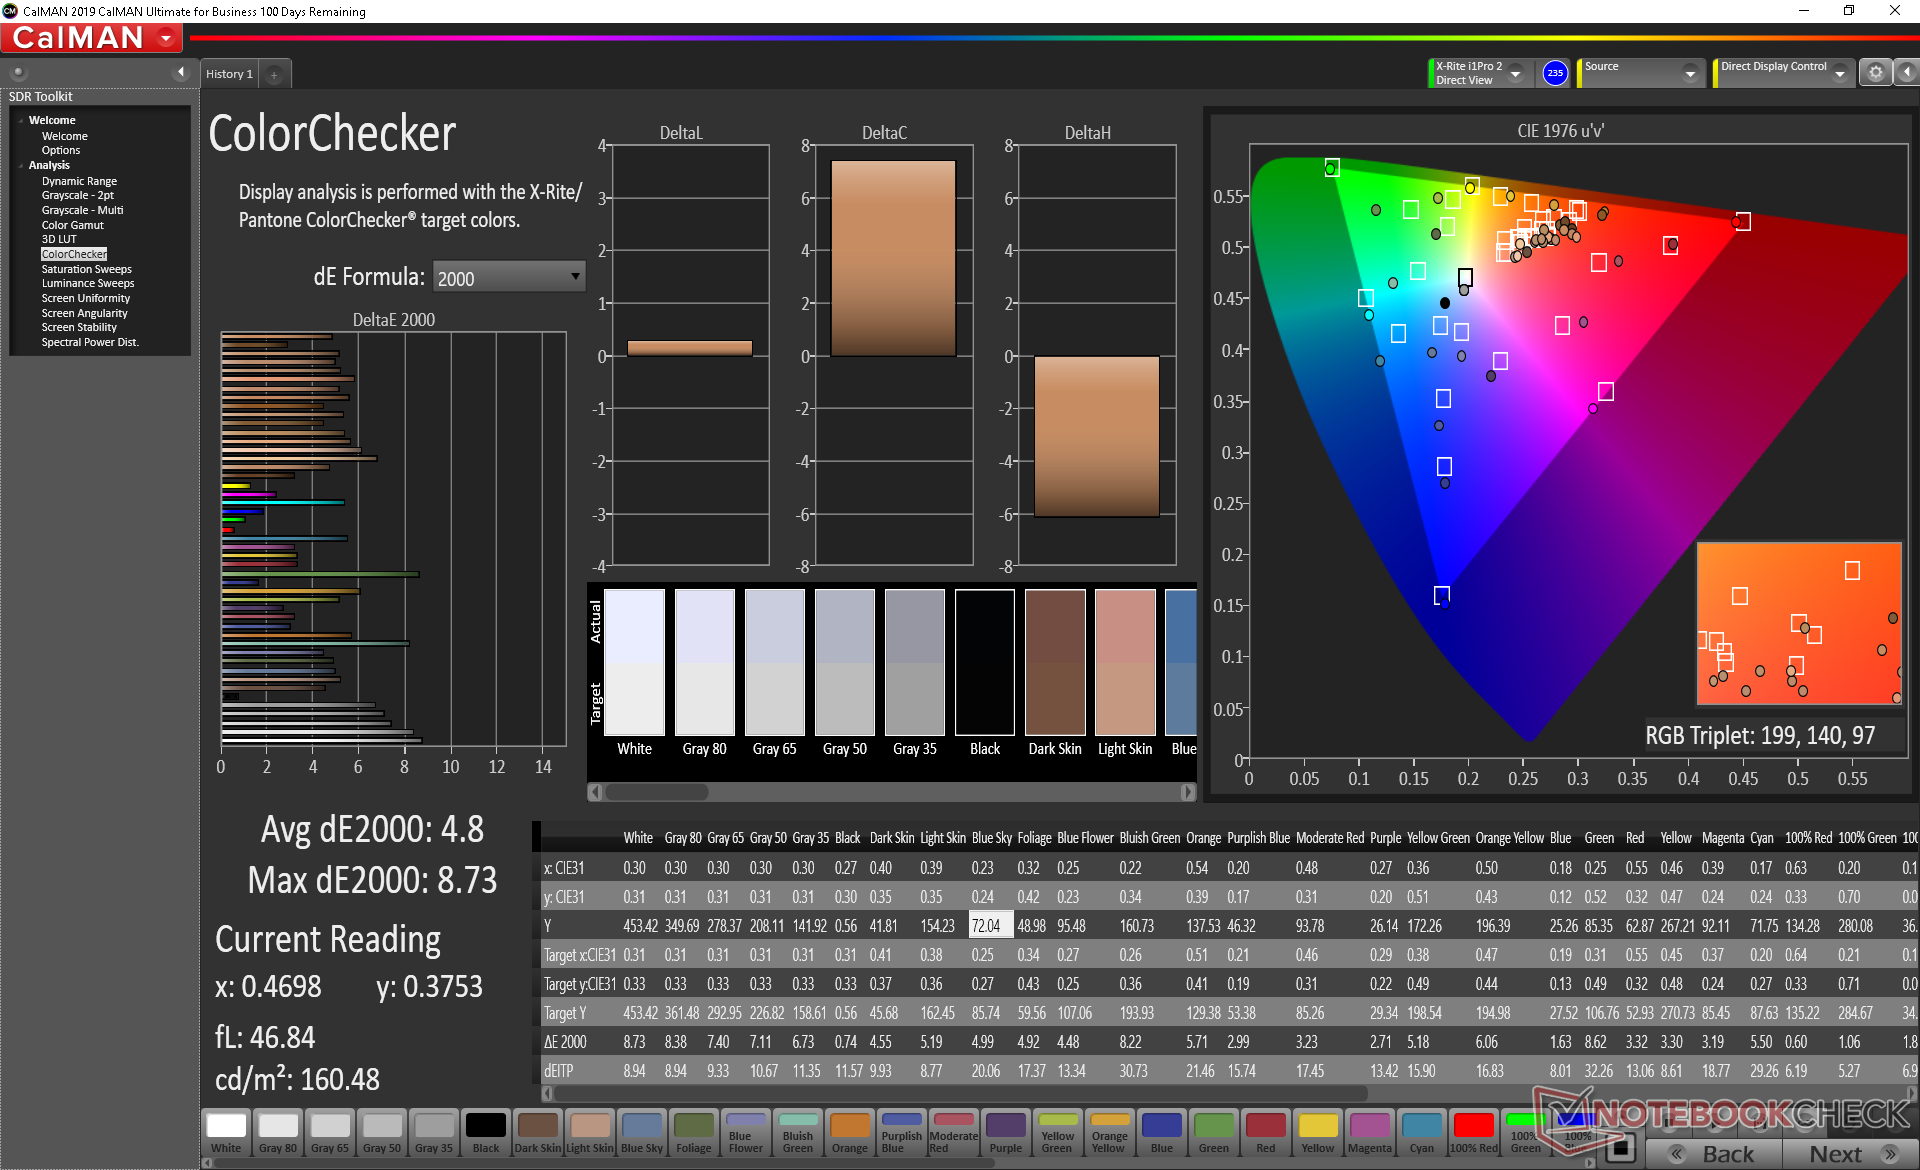
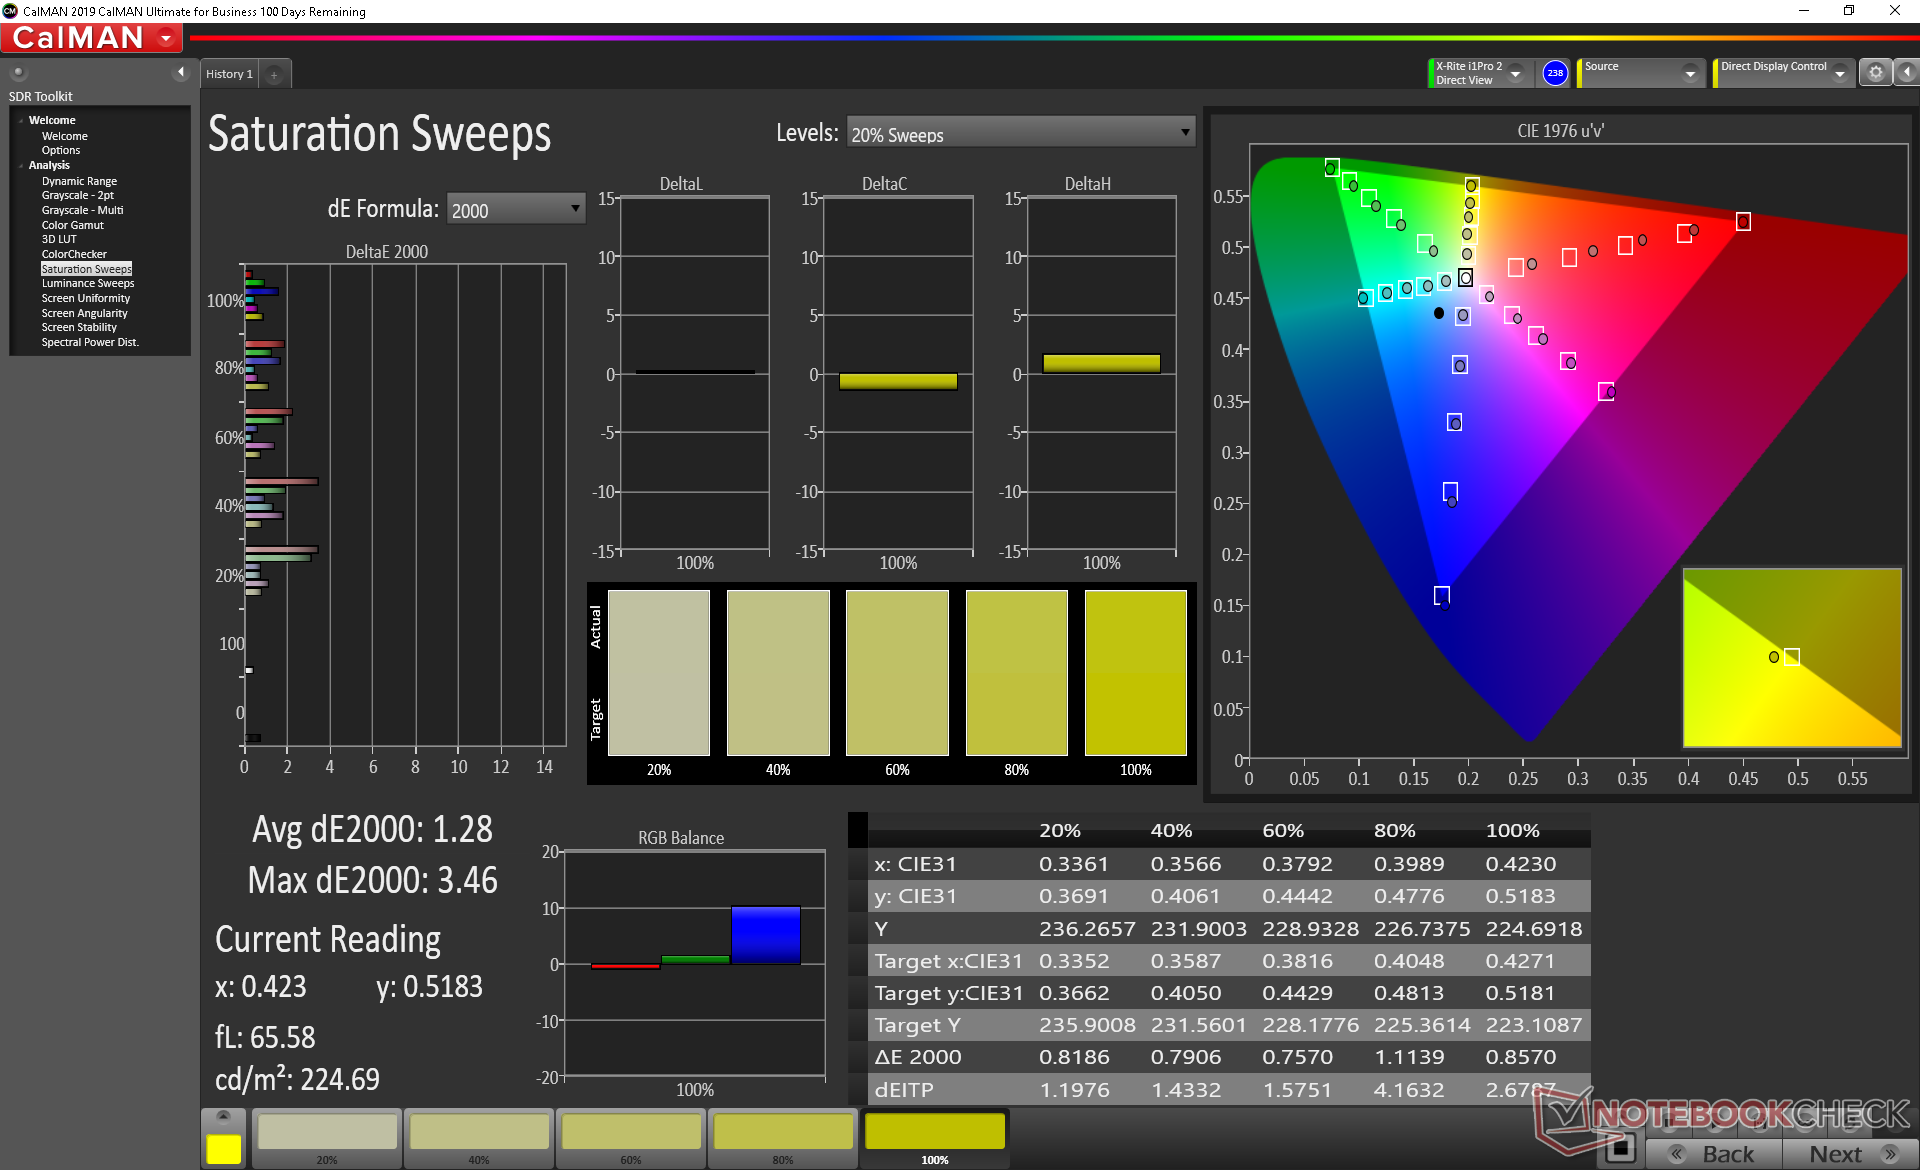
ΔE ColorChecker Calman: 4.8 | ∀{0.5-29.43 Ø4.73}
calibrated: 3.08
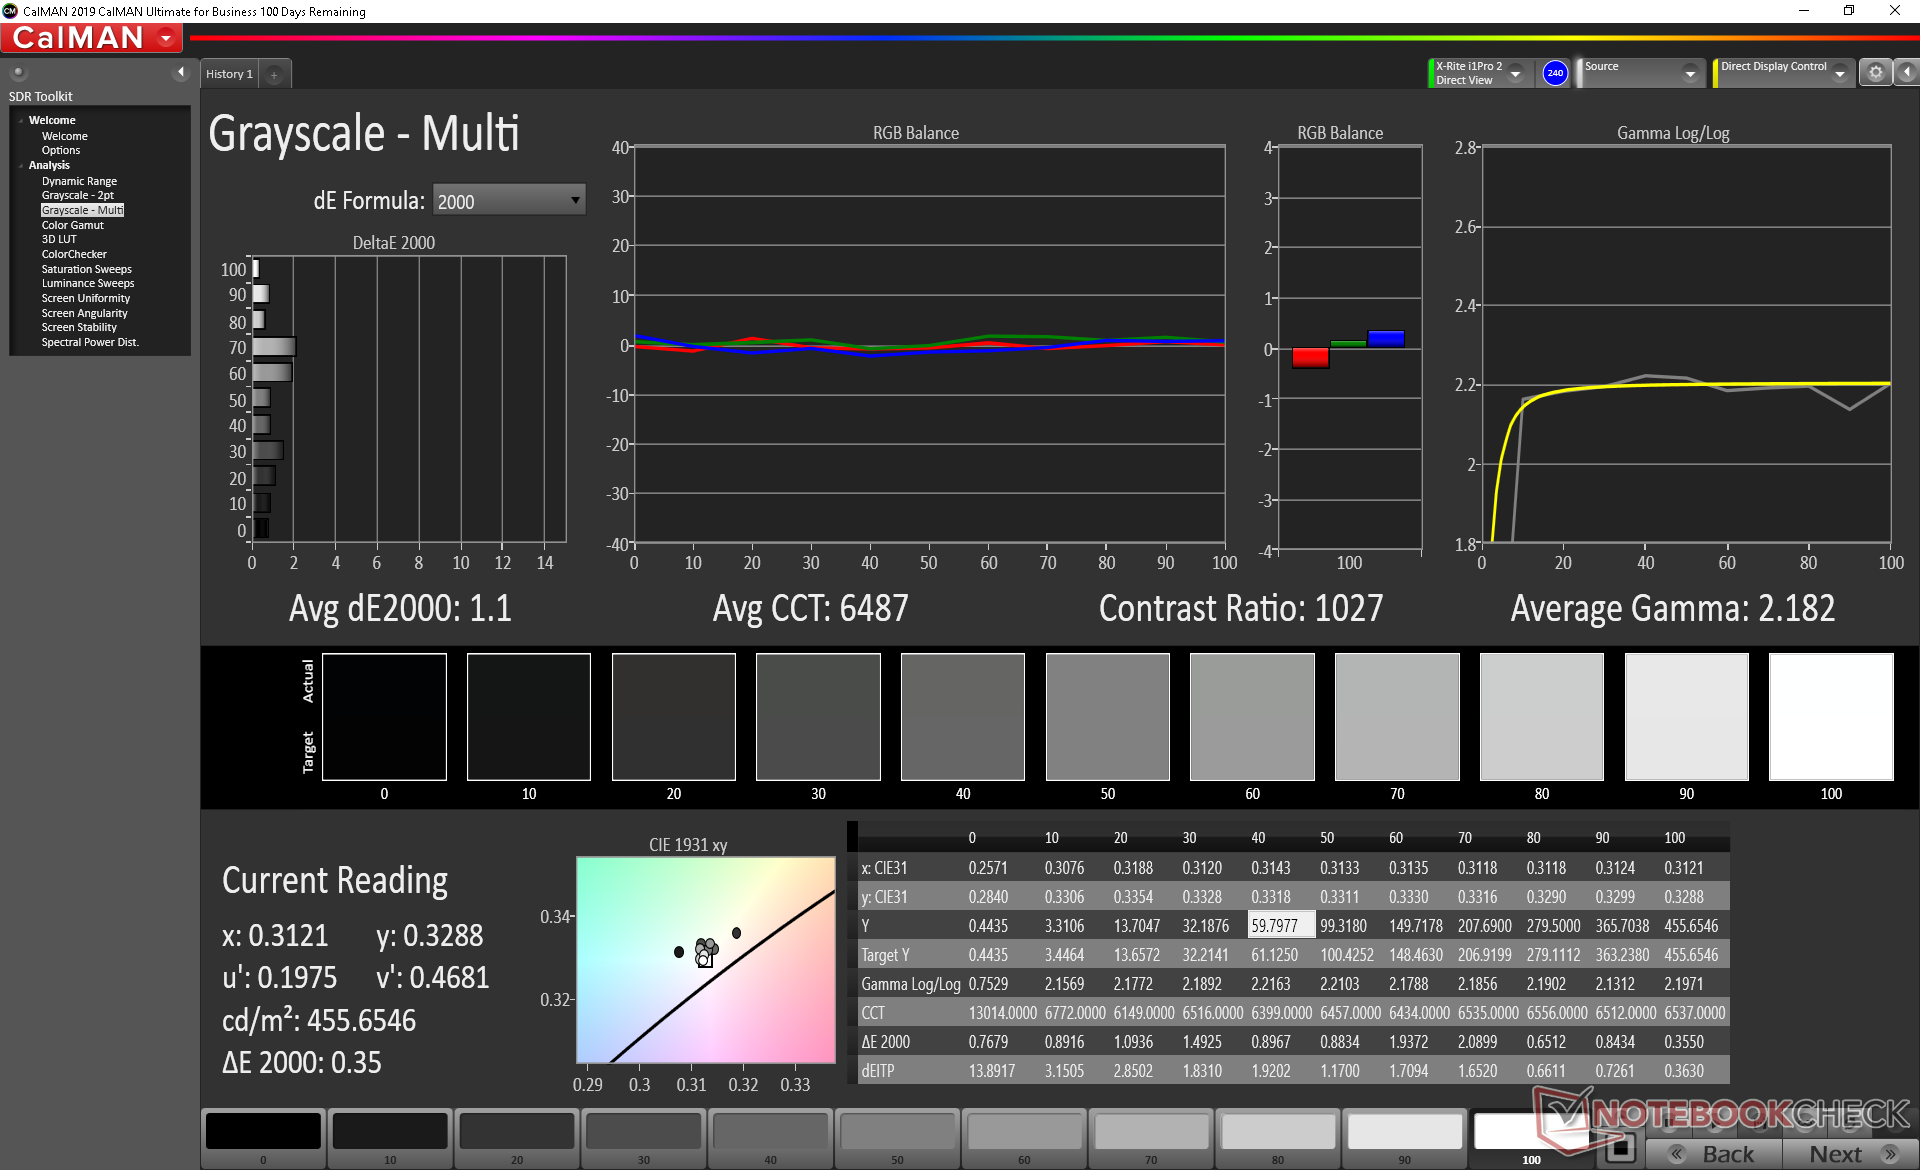
ΔE Greyscale Calman: 5.6 | ∀{0.09-98 Ø4.97}
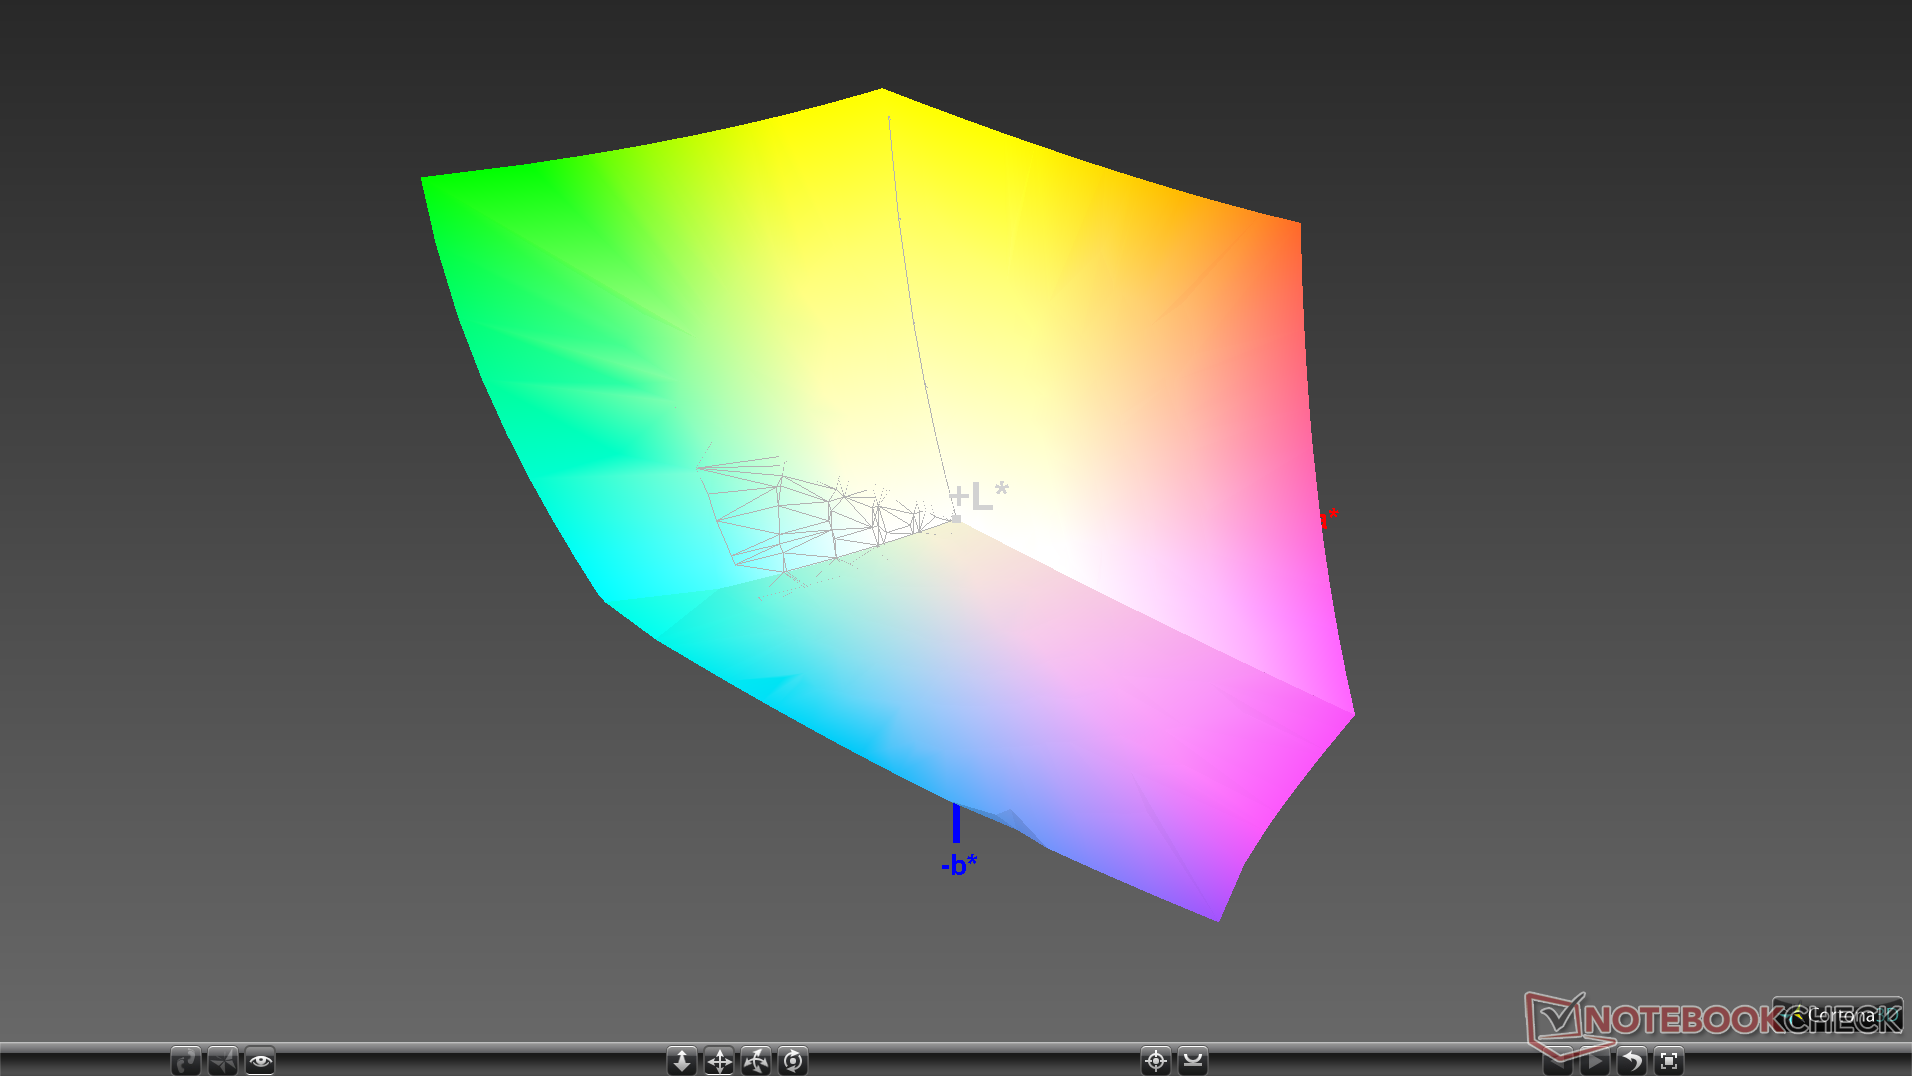
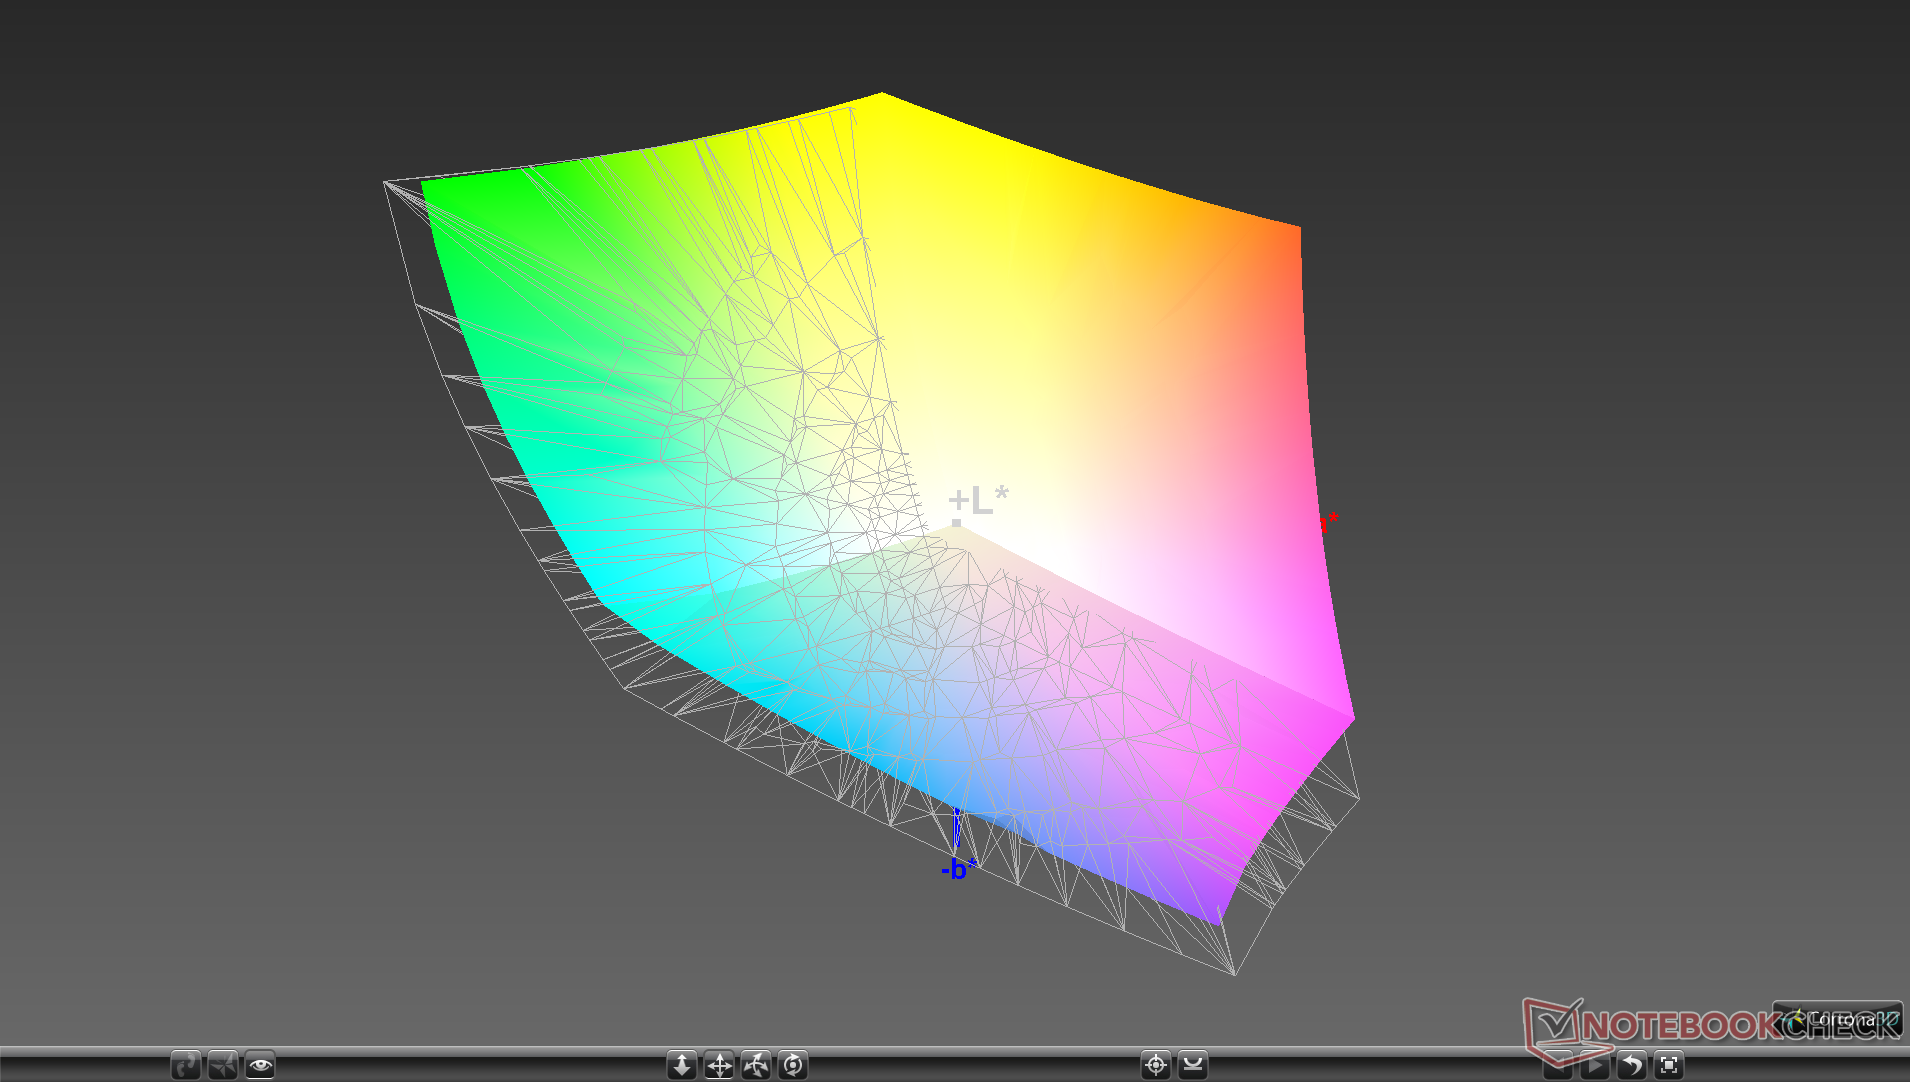
99.7% sRGB (Argyll 1.6.3 3D)
86.4% AdobeRGB 1998 (Argyll 1.6.3 3D)
96.8% AdobeRGB 1998 (Argyll 3D)
99.6% sRGB (Argyll 3D)
82.1% Display P3 (Argyll 3D)
Gamma: 2.34
CCT: 7549 K
| Dell Precision 7550 AU Optronics B156ZAN, IPS, 15.6", 3840x2160 | Dell Precision 7540 AUO41EB, , 15.6", 3840x2160 | Dell Precision 5550 P91F Sharp LQ156R1, IPS, 15.6", 3840x2400 | Acer ConceptD 3 Pro CN315-71P-73W1 Chi Mei N156HCE-EN2, IPS, 15.6", 1920x1080 | Lenovo ThinkPad P53-20QN000YGE N156HCE-GN1, IPS, 15.6", 1920x1080 | HP ZBook Studio G5-4QH10EA AUO30EB, IPS LED, 15.6", 3840x2160 | |
|---|---|---|---|---|---|---|
| Display | 3% | 4% | 3% | -21% | -16% | |
| Display P3 Coverage (%) | 82.1 | 87.1 6% | 89.9 10% | 97.9 19% | 63.2 -23% | 68.2 -17% |
| sRGB Coverage (%) | 99.6 | 100 0% | 100 0% | 99.9 0% | 92.9 -7% | 96.2 -3% |
| AdobeRGB 1998 Coverage (%) | 96.8 | 99.8 3% | 99.9 3% | 87.2 -10% | 64.3 -34% | 68.8 -29% |
| Response Times | -7% | 5% | 36% | 26% | -8% | |
| Response Time Grey 50% / Grey 80% * (ms) | 51.2 ? | 61.6 ? -20% | 46 ? 10% | 33 ? 36% | 38.4 ? 25% | 60.8 ? -19% |
| Response Time Black / White * (ms) | 34 ? | 32 ? 6% | 34 ? -0% | 22 ? 35% | 25.2 ? 26% | 32.8 ? 4% |
| PWM Frequency (Hz) | 26040 ? | |||||
| Screen | 23% | 1% | 17% | 24% | 12% | |
| Brightness middle (cd/m²) | 473.5 | 491 4% | 469.8 -1% | 343 -28% | 510 8% | 417 -12% |
| Brightness (cd/m²) | 461 | 477 3% | 464 1% | 309 -33% | 468 2% | 412 -11% |
| Brightness Distribution (%) | 90 | 92 2% | 85 -6% | 85 -6% | 89 -1% | 85 -6% |
| Black Level * (cd/m²) | 0.55 | 0.37 33% | 0.42 24% | 0.22 60% | 0.36 35% | 0.29 47% |
| Contrast (:1) | 861 | 1327 54% | 1119 30% | 1559 81% | 1417 65% | 1438 67% |
| Colorchecker dE 2000 * | 4.8 | 2.9 40% | 5.16 -8% | 3.73 22% | 2.3 52% | 4.4 8% |
| Colorchecker dE 2000 max. * | 8.73 | 5.8 34% | 9.33 -7% | 6.51 25% | 5.5 37% | 6.7 23% |
| Colorchecker dE 2000 calibrated * | 3.08 | 1.2 61% | 3.75 -22% | 1.43 54% | 1.2 61% | 1.9 38% |
| Greyscale dE 2000 * | 5.6 | 4.4 21% | 5.5 2% | 4.24 24% | 3.2 43% | 5 11% |
| Gamma | 2.34 94% | 2.03 108% | 2 110% | 2.2 100% | 2.34 94% | 2.28 96% |
| CCT | 7549 86% | 6655 98% | 6198 105% | 6329 103% | 7036 92% | 7575 86% |
| Color Space (Percent of AdobeRGB 1998) (%) | 86.4 | 88.2 2% | 89.2 3% | 78 -10% | 59.4 -31% | 62.3 -28% |
| Color Space (Percent of sRGB) (%) | 99.7 | 99.9 0% | 100 0% | 100 0% | 93.1 -7% | 96 -4% |
| Total Average (Program / Settings) | 6% /
16% | 3% /
2% | 19% /
17% | 10% /
16% | -4% /
4% |
* ... smaller is better
Color space covers sRGB entirely and approximately 86 percent of AdobeRGB much like what we recorded on the Precision 5550 and older Precision 7540. Dell offers SKUs with DCI-P3 coverage or even just 45 percent of NTSC if color accuracy is not important.
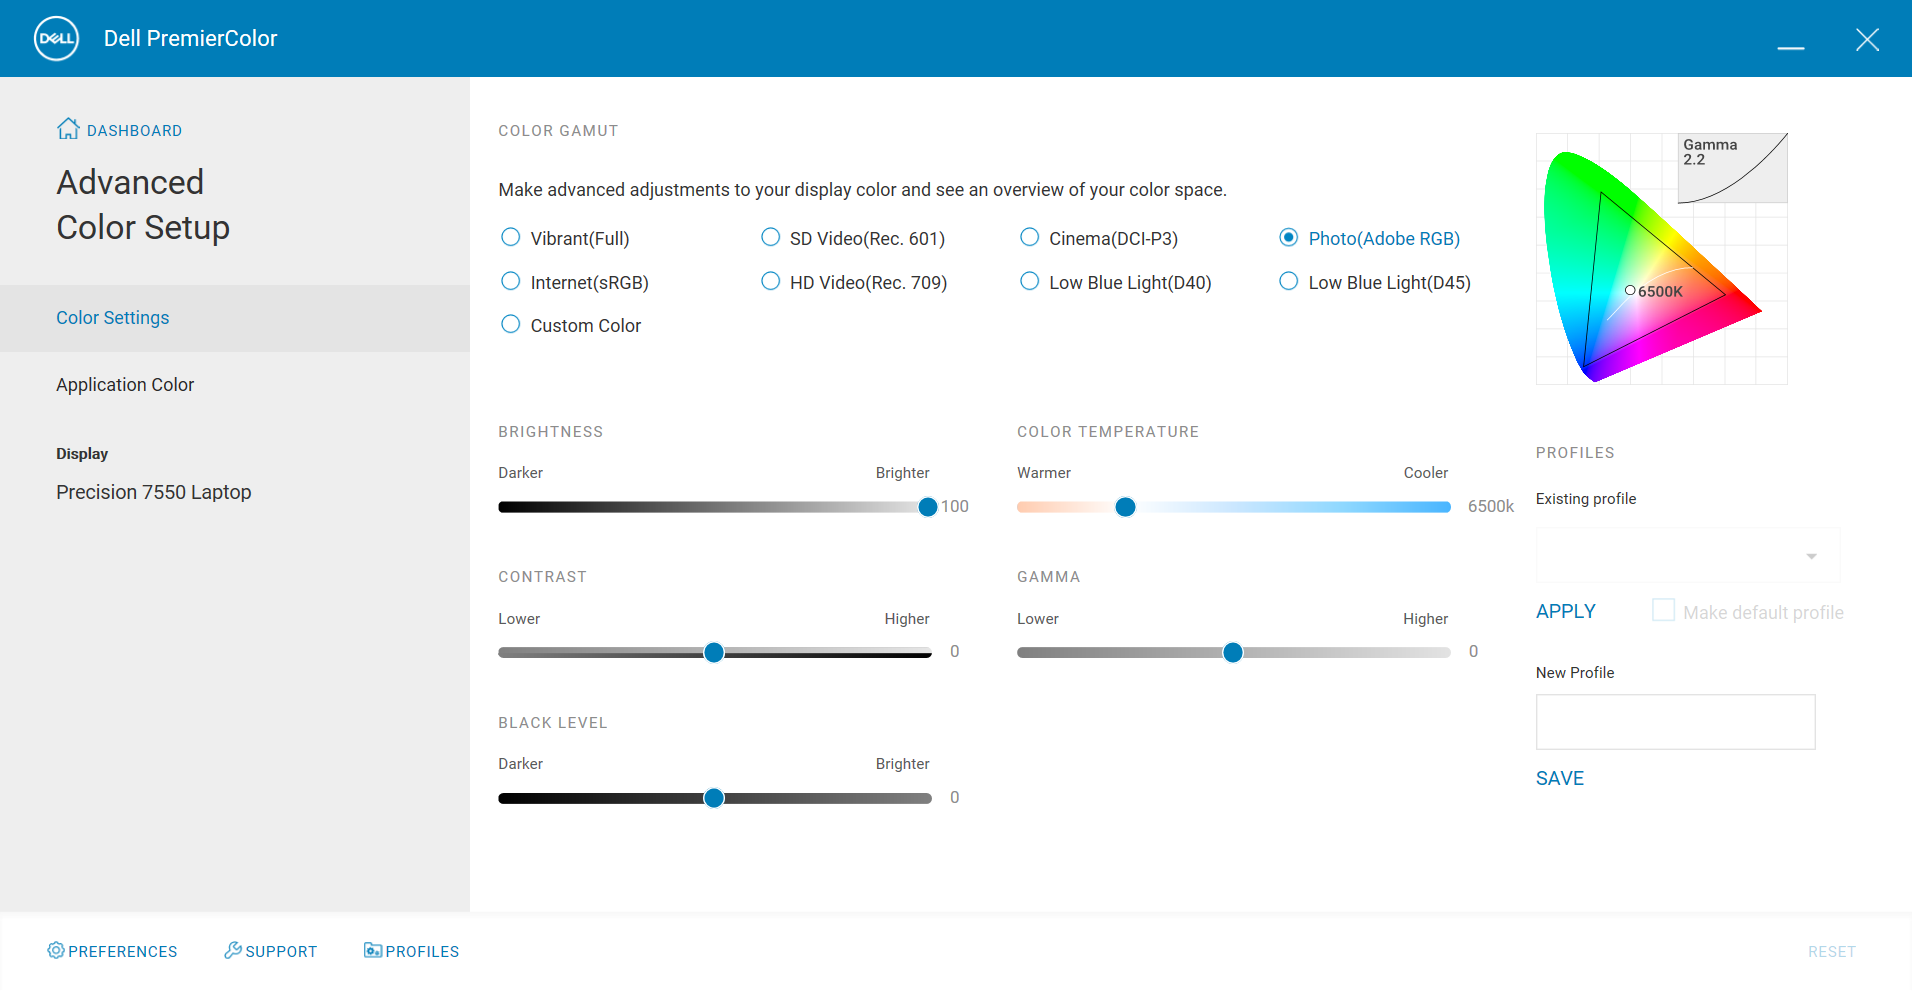
X-Rite colorimeter measurements show an overly cool color temperature out of the box. Calibrating the panel ourselves addresses the issue and improves the average DeltaE grayscale value noticeably from 5.6 to 1.1. We recommend applying our calibrated ICM profile above or playing around with the pre-installed Dell PremierColor software to adjust the colors.
Display Response Times
| ↔ Response Time Black to White | ||
|---|---|---|
| 34 ms ... rise ↗ and fall ↘ combined | ↗ 20 ms rise | 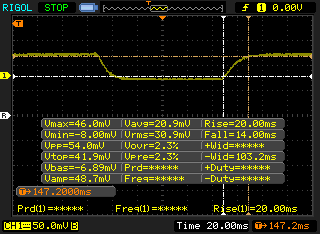 |
| ↘ 14 ms fall | ||
| The screen shows slow response rates in our tests and will be unsatisfactory for gamers. In comparison, all tested devices range from 0.1 (minimum) to 240 (maximum) ms. » 91 % of all devices are better. This means that the measured response time is worse than the average of all tested devices (19.9 ms). | ||
| ↔ Response Time 50% Grey to 80% Grey | ||
| 51.2 ms ... rise ↗ and fall ↘ combined | ↗ 24.4 ms rise | 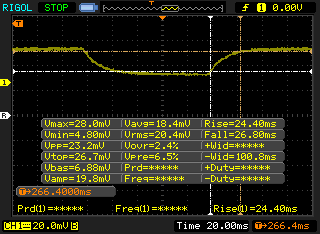 |
| ↘ 26.8 ms fall | ||
| The screen shows slow response rates in our tests and will be unsatisfactory for gamers. In comparison, all tested devices range from 0.165 (minimum) to 636 (maximum) ms. » 88 % of all devices are better. This means that the measured response time is worse than the average of all tested devices (31.1 ms). | ||
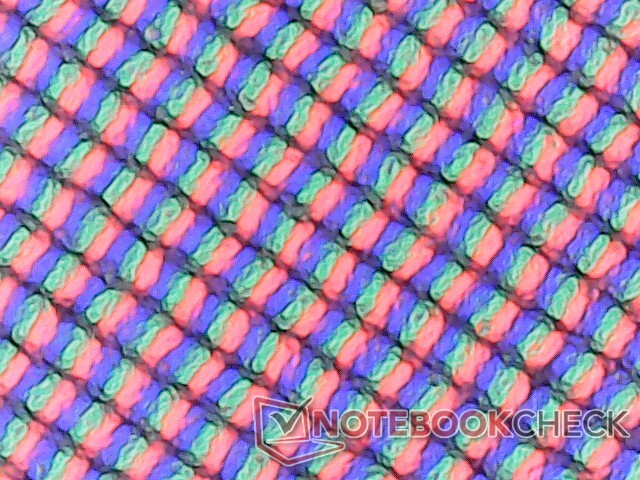
Screen Flickering / PWM (Pulse-Width Modulation)
| Screen flickering / PWM not detected | 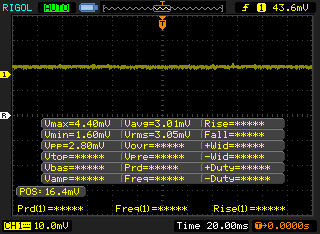 | ||
In comparison: 52 % of all tested devices do not use PWM to dim the display. If PWM was detected, an average of 7810 (minimum: 5 - maximum: 343500) Hz was measured. | |||
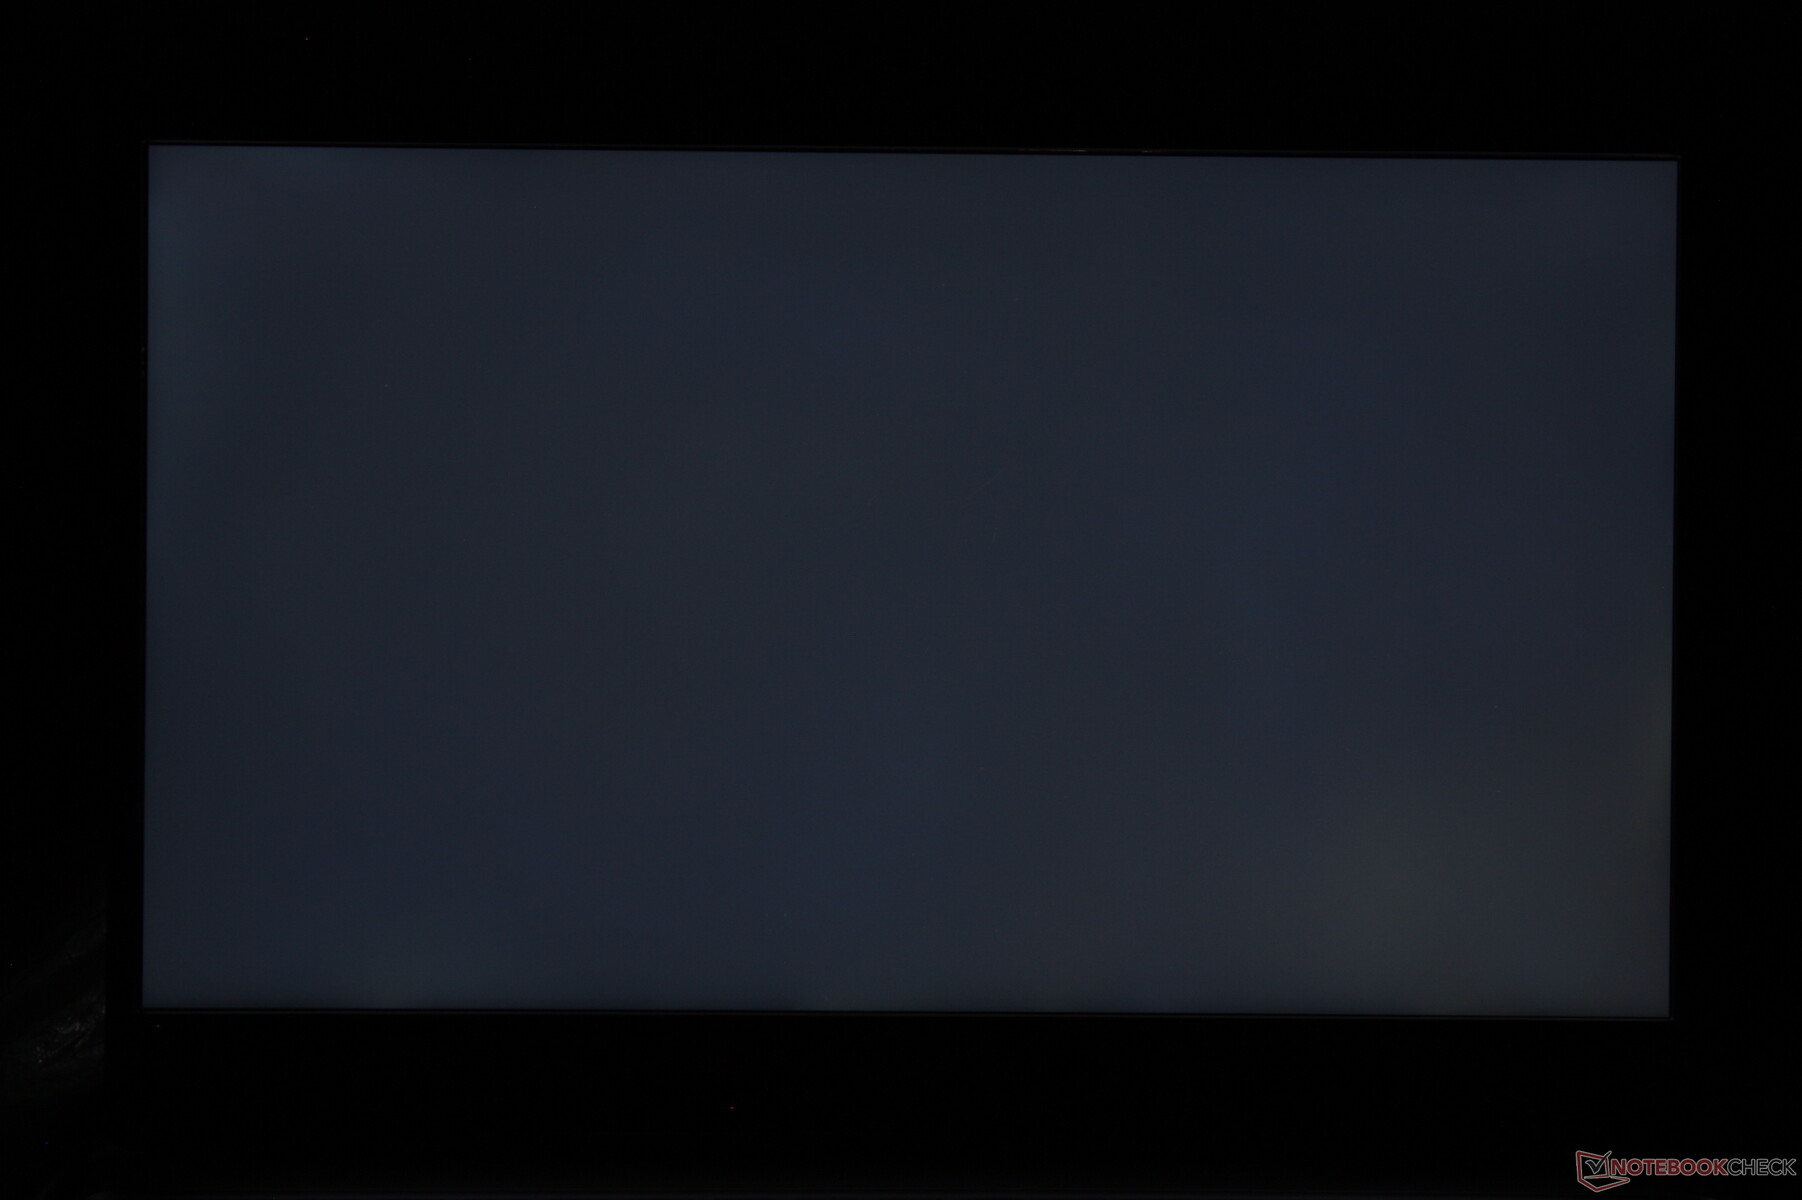
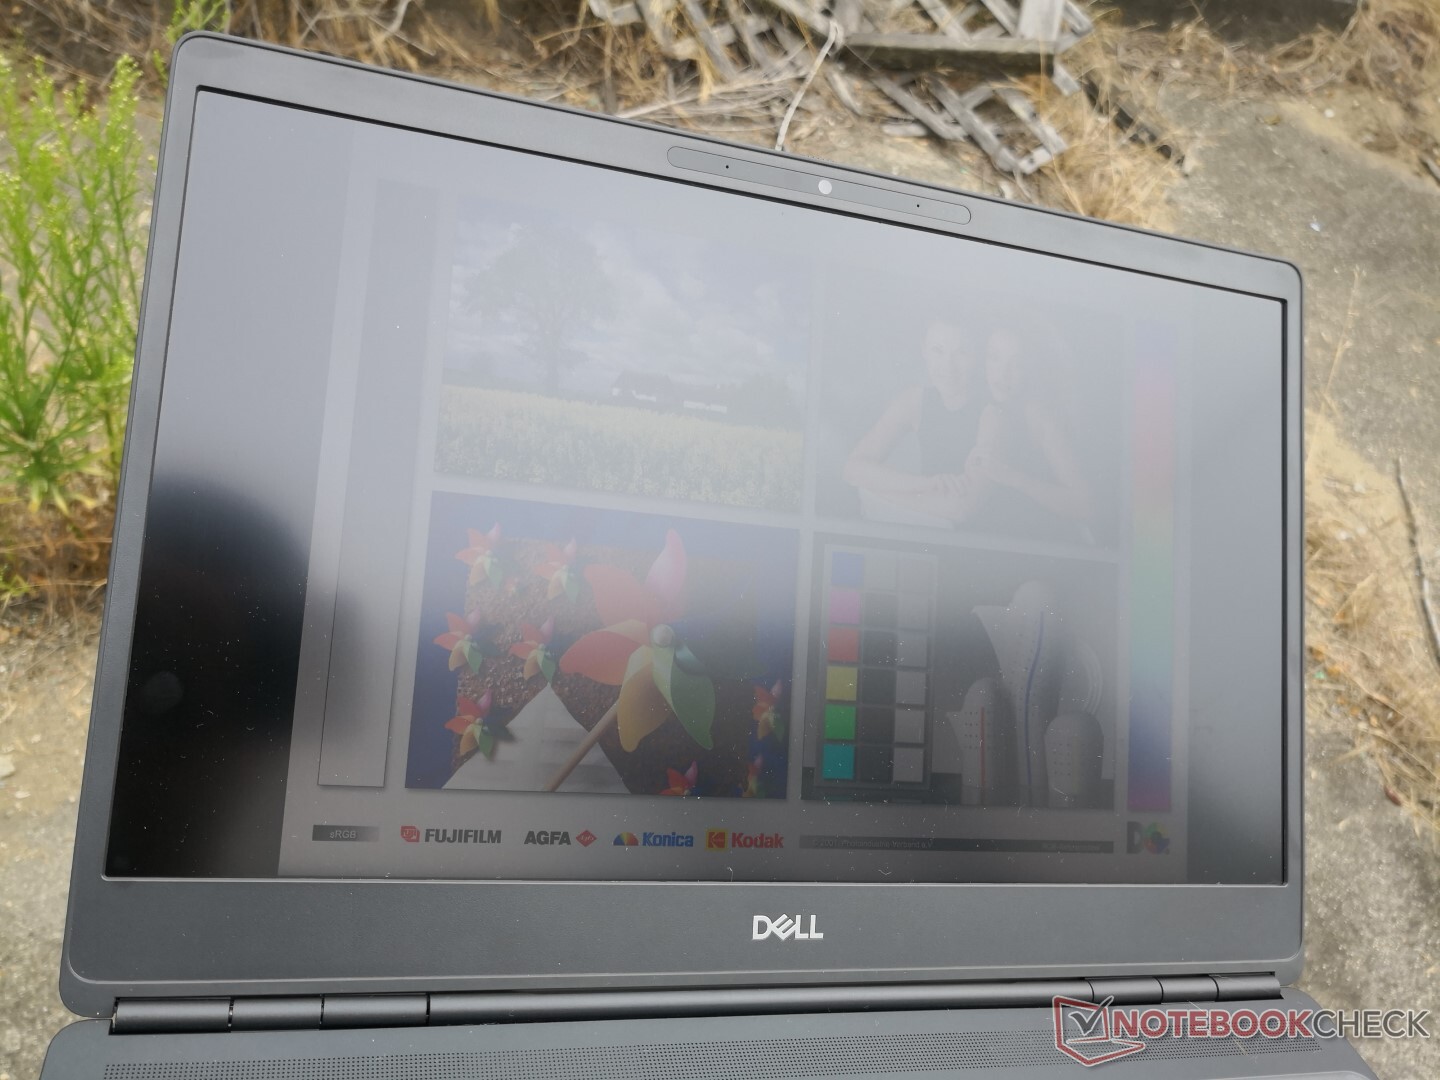
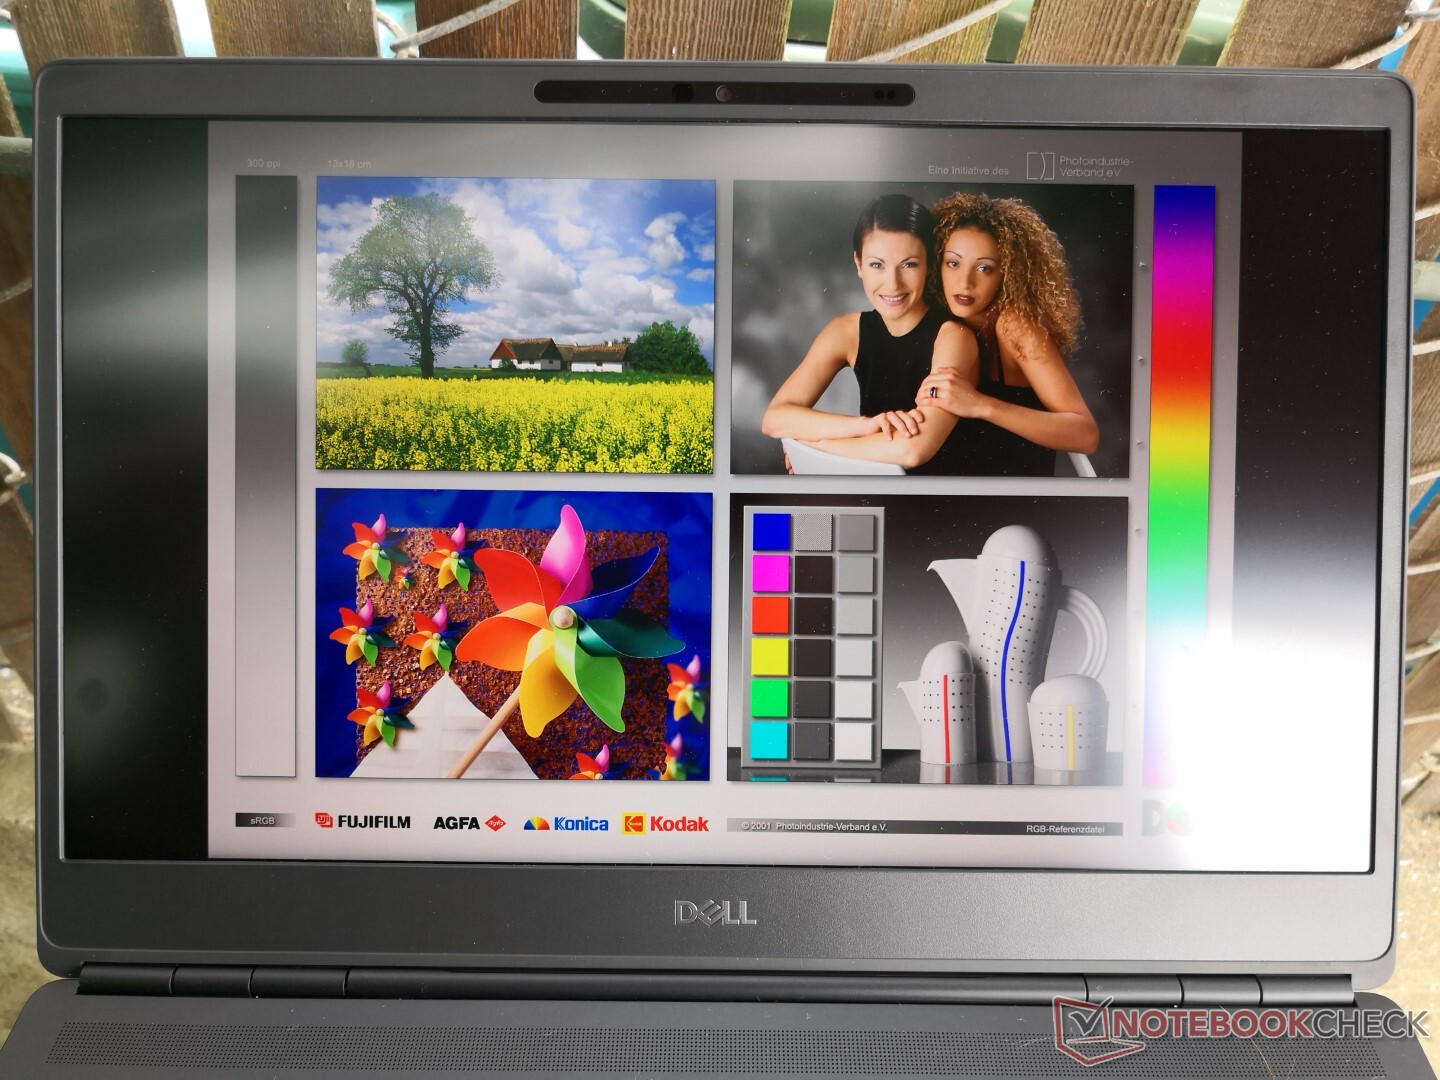
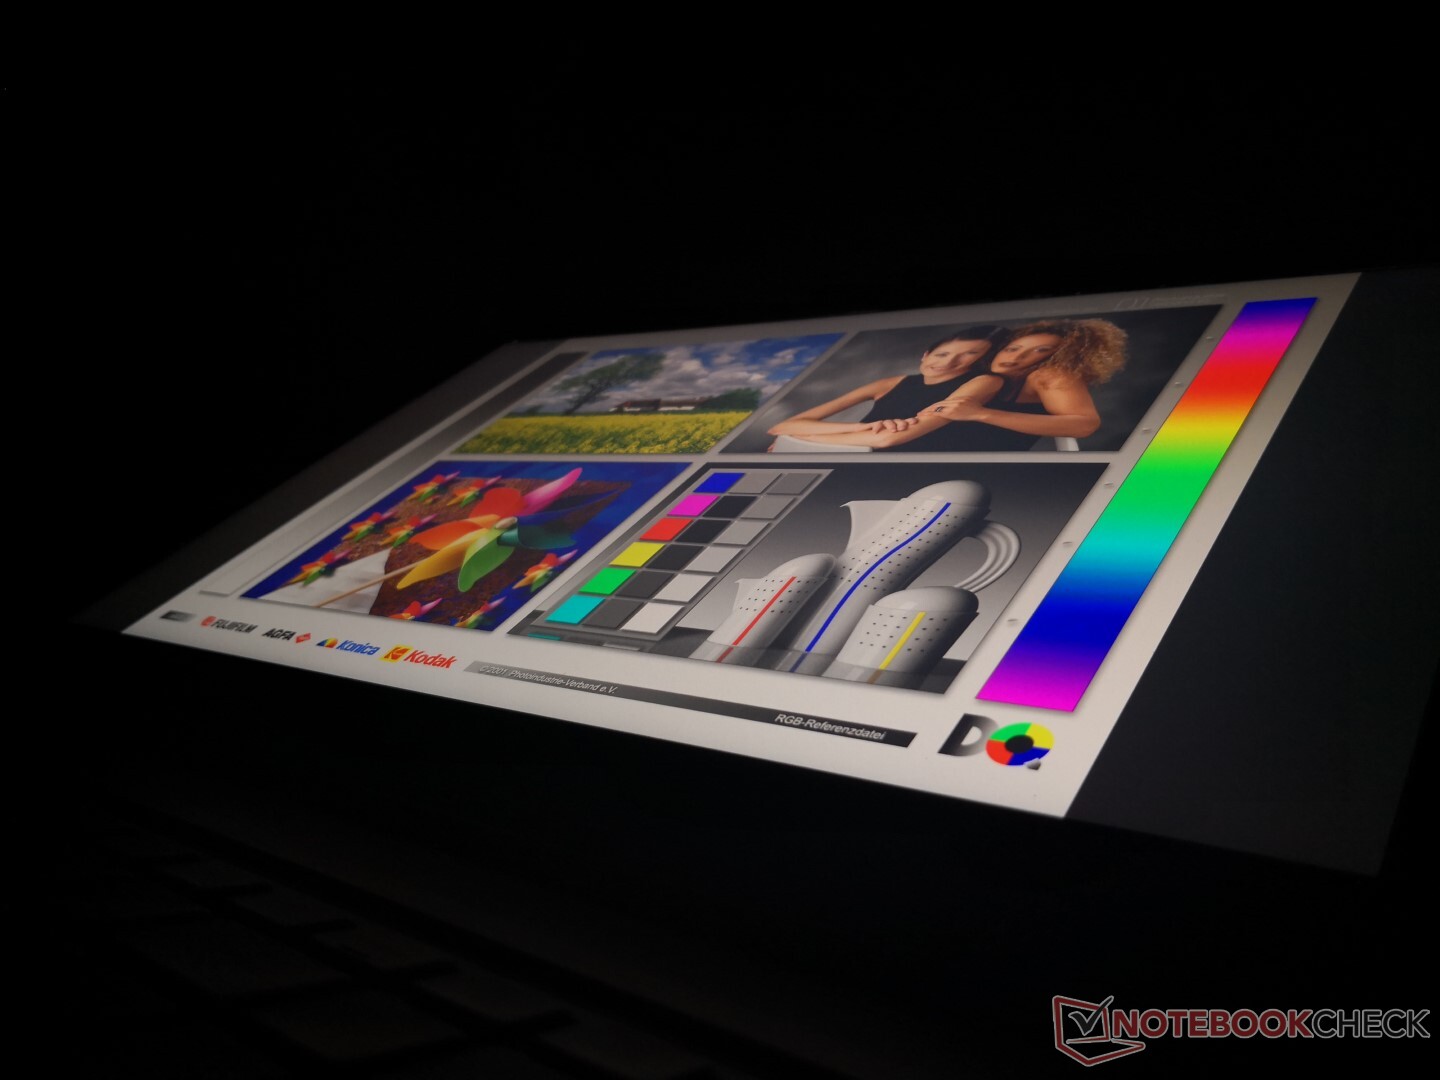
Outdoor visibility is acceptable when under shade, but the display is not bright enough to overcome ambient lighting on an otherwise bright day. Colors become washed out even when on the maximum brightness setting as shown by our pictures below.

Performance
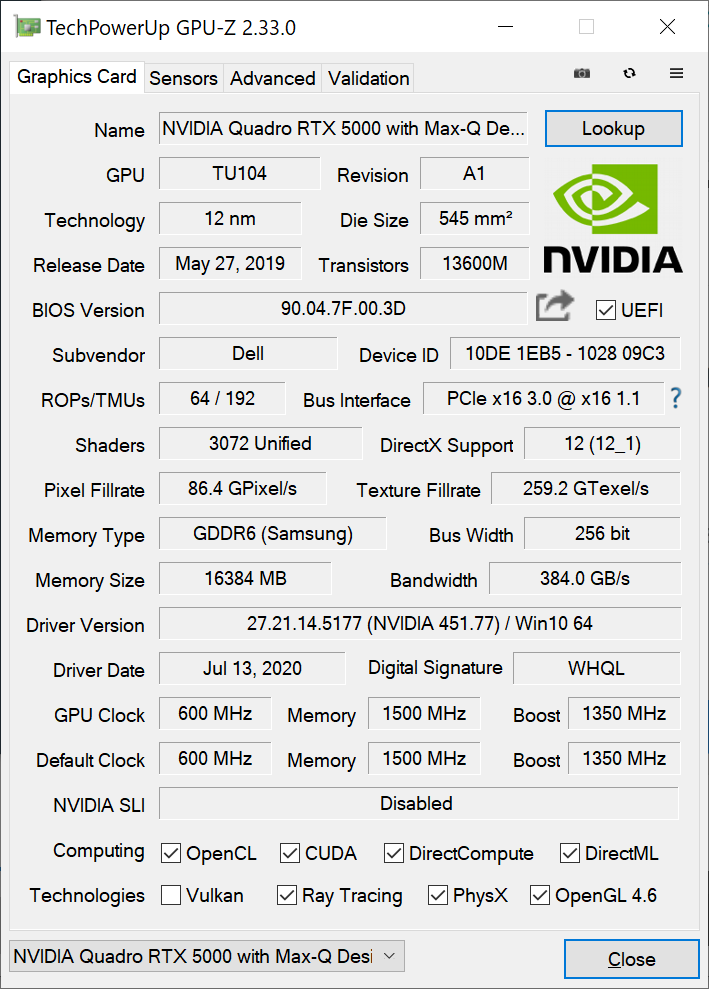
The focus on Comet Lake-H CPUs and Turing Quadro RTX GPUs means that the Precision 7550 is targeting high-performance workstation users whereas the thinner Precision 5550 is limited to the Quadro T2000 Max-Q only. Even so, it's a bit disappointing that the 7550 utilizes Max-Q series GPUs instead of the full-power non-Max-Q variety in spite of its heavy weight and thick design.
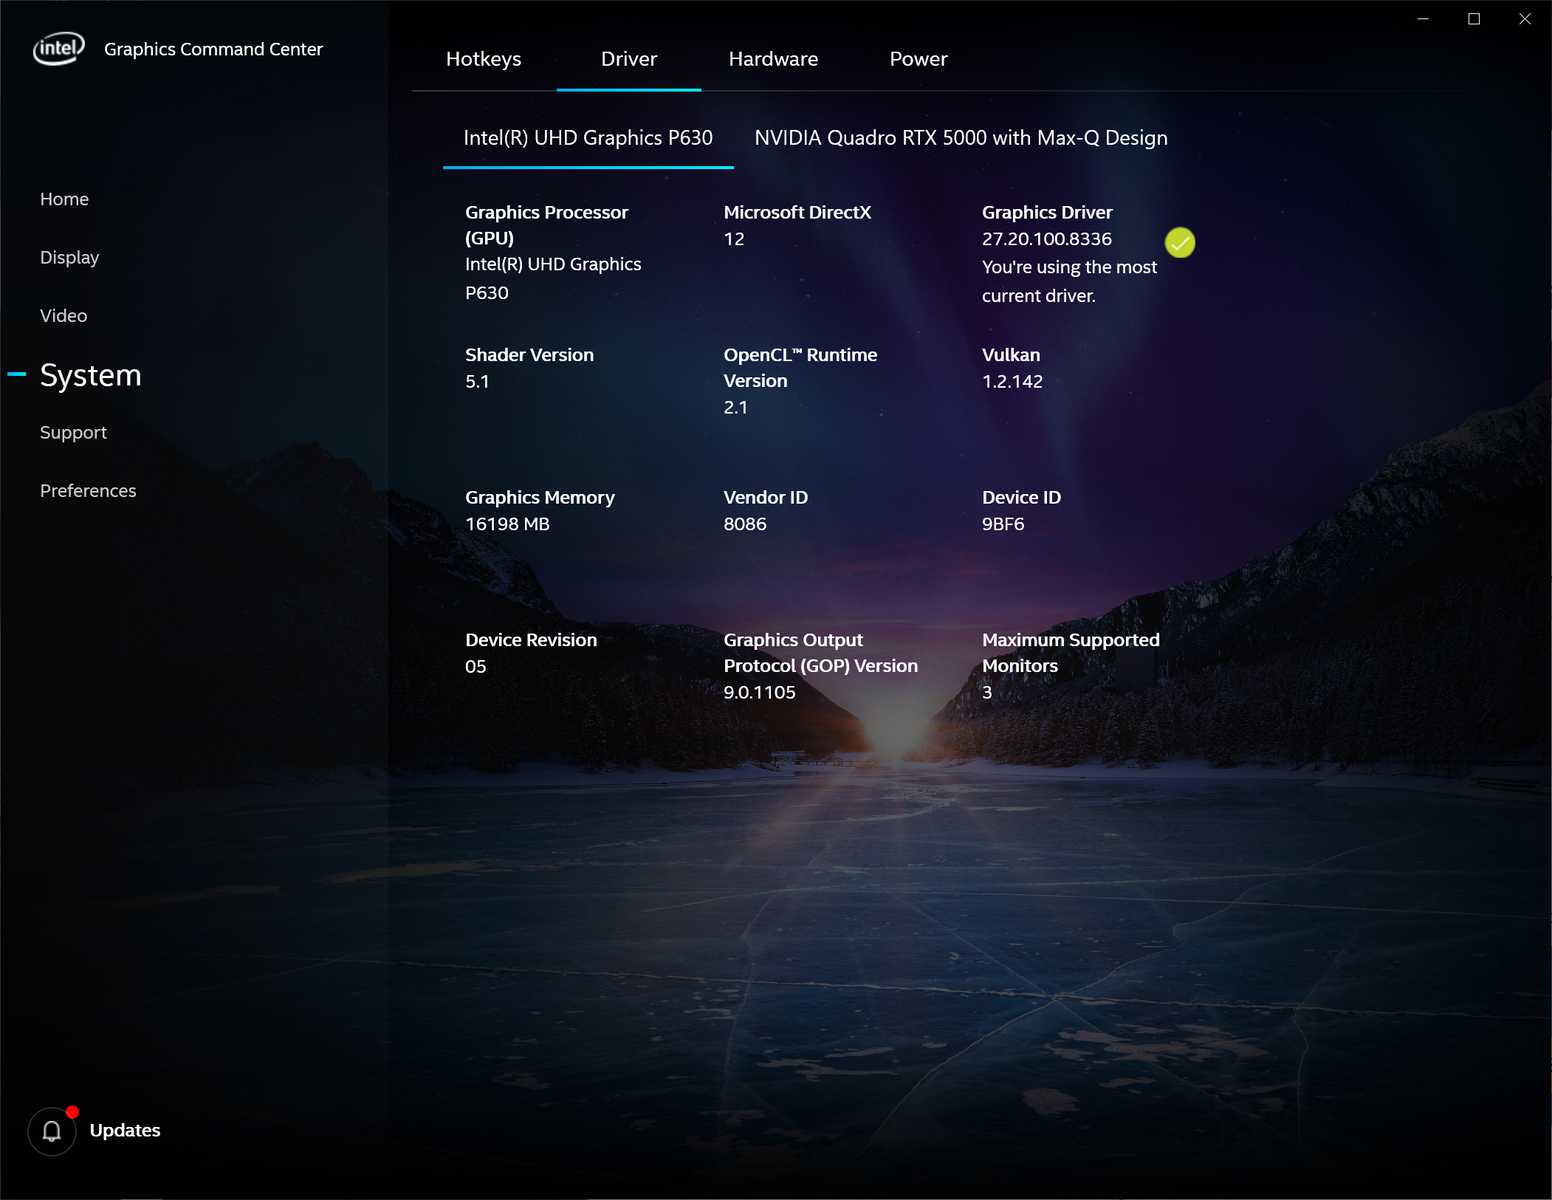
Nvidia Optimus comes standard for automatic graphics switching and Xeon CPUs are optional for those who want ECC RAM support.
We used Dell's Ultra Performance power profile for the benchmarks below to get the best possible scores from the system. This mode can be found in the pre-installed Dell Power Manager software.
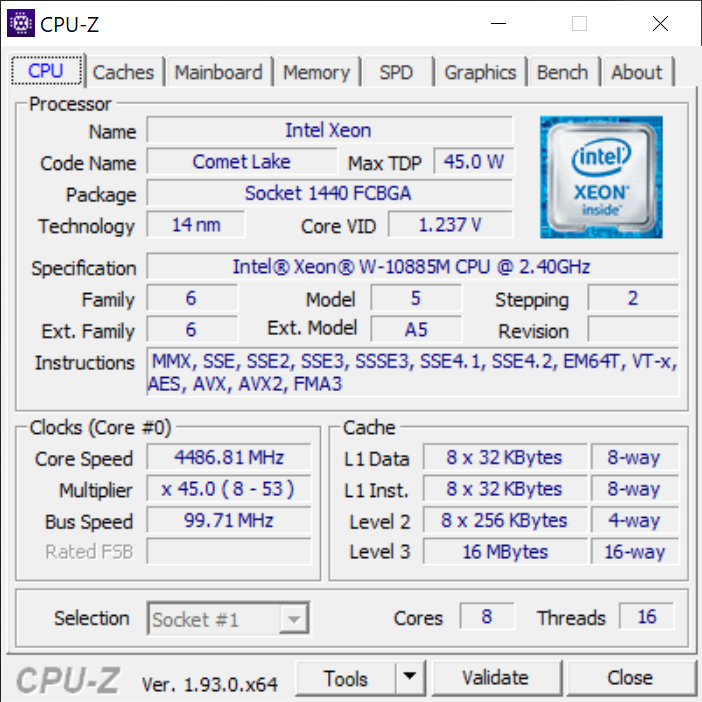
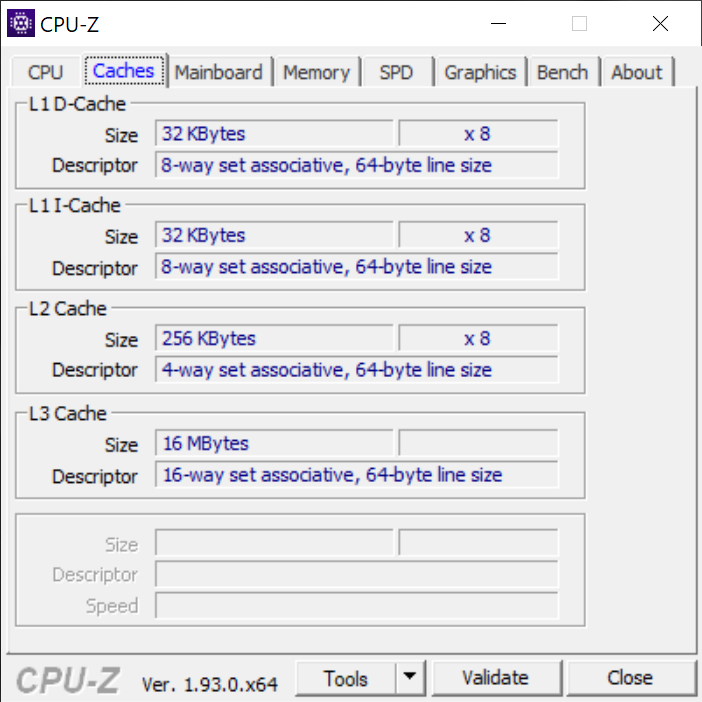
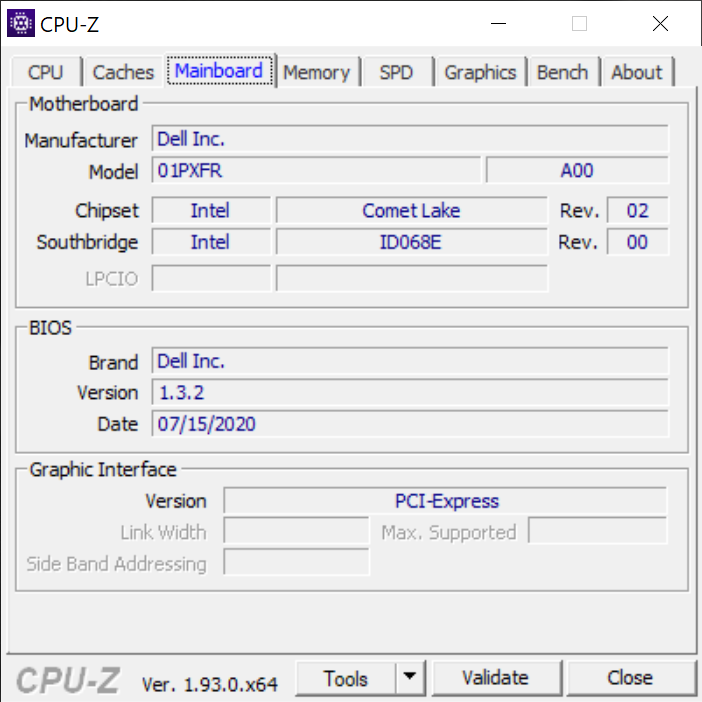

Processor
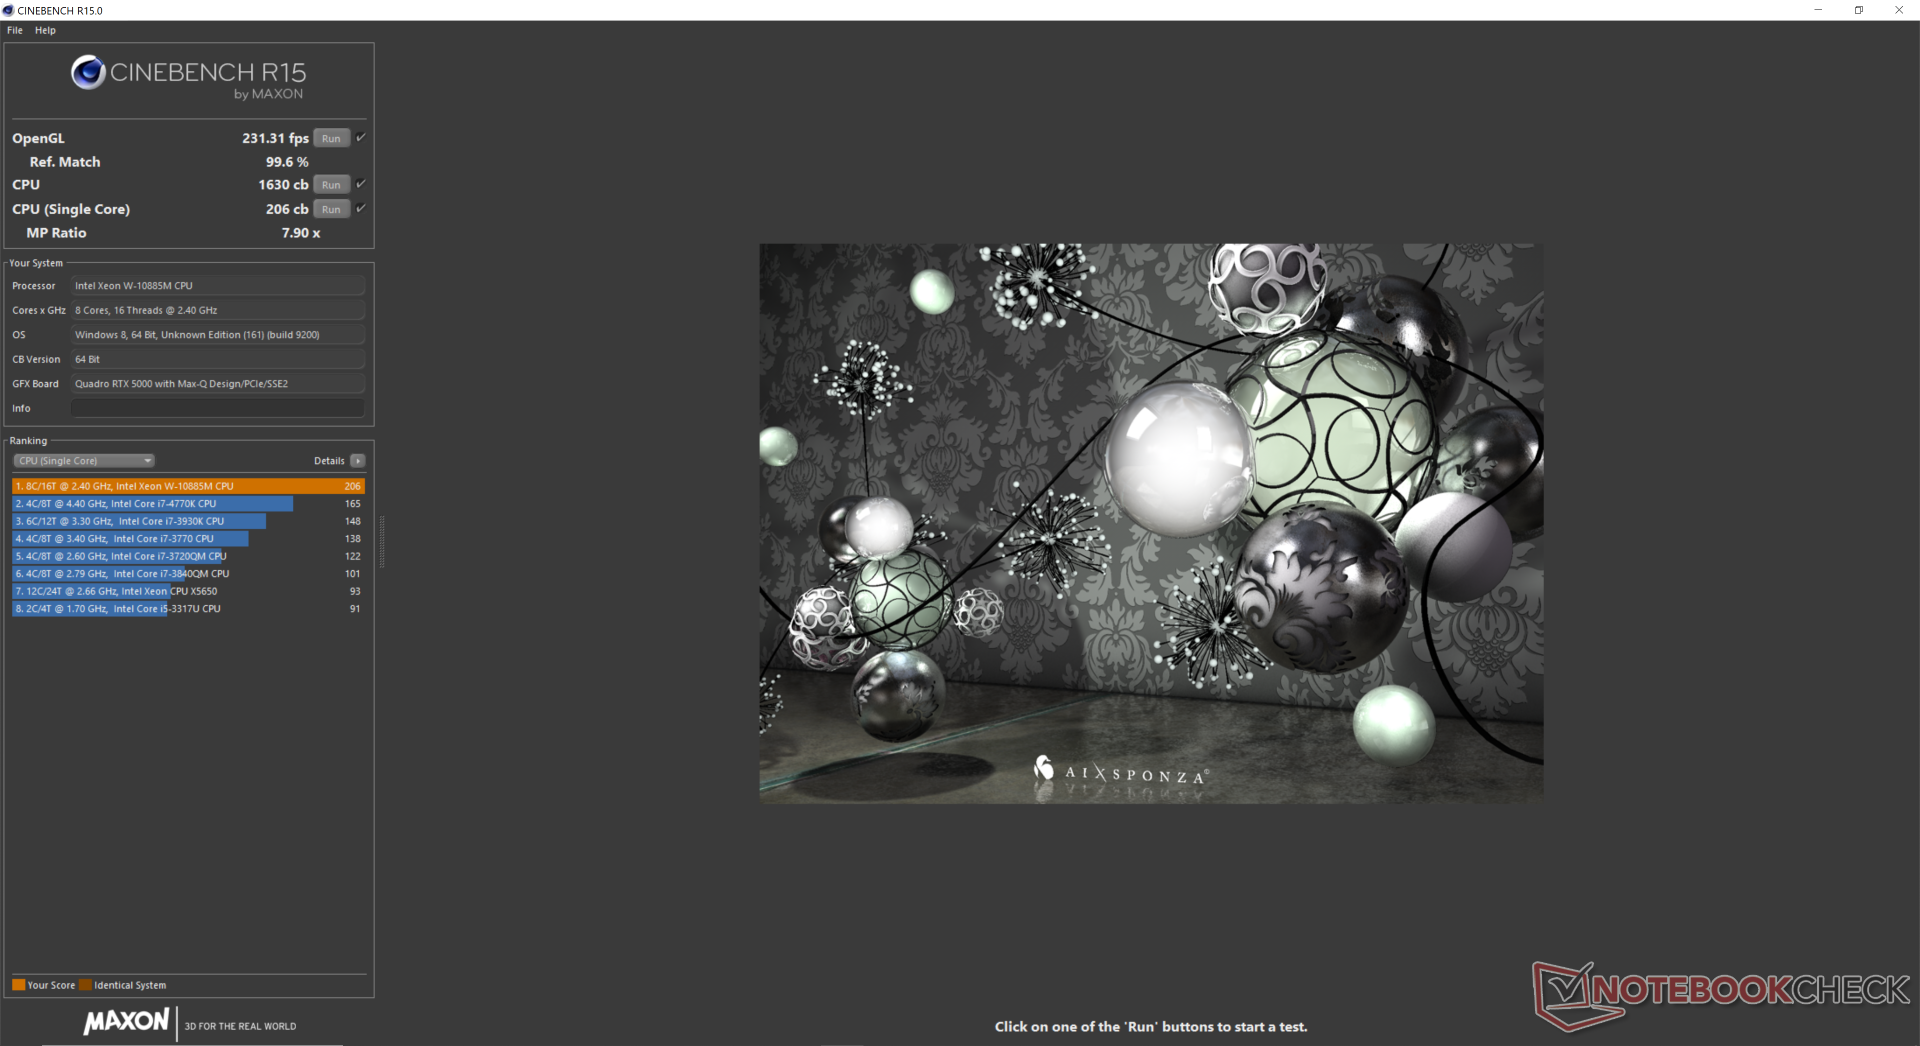
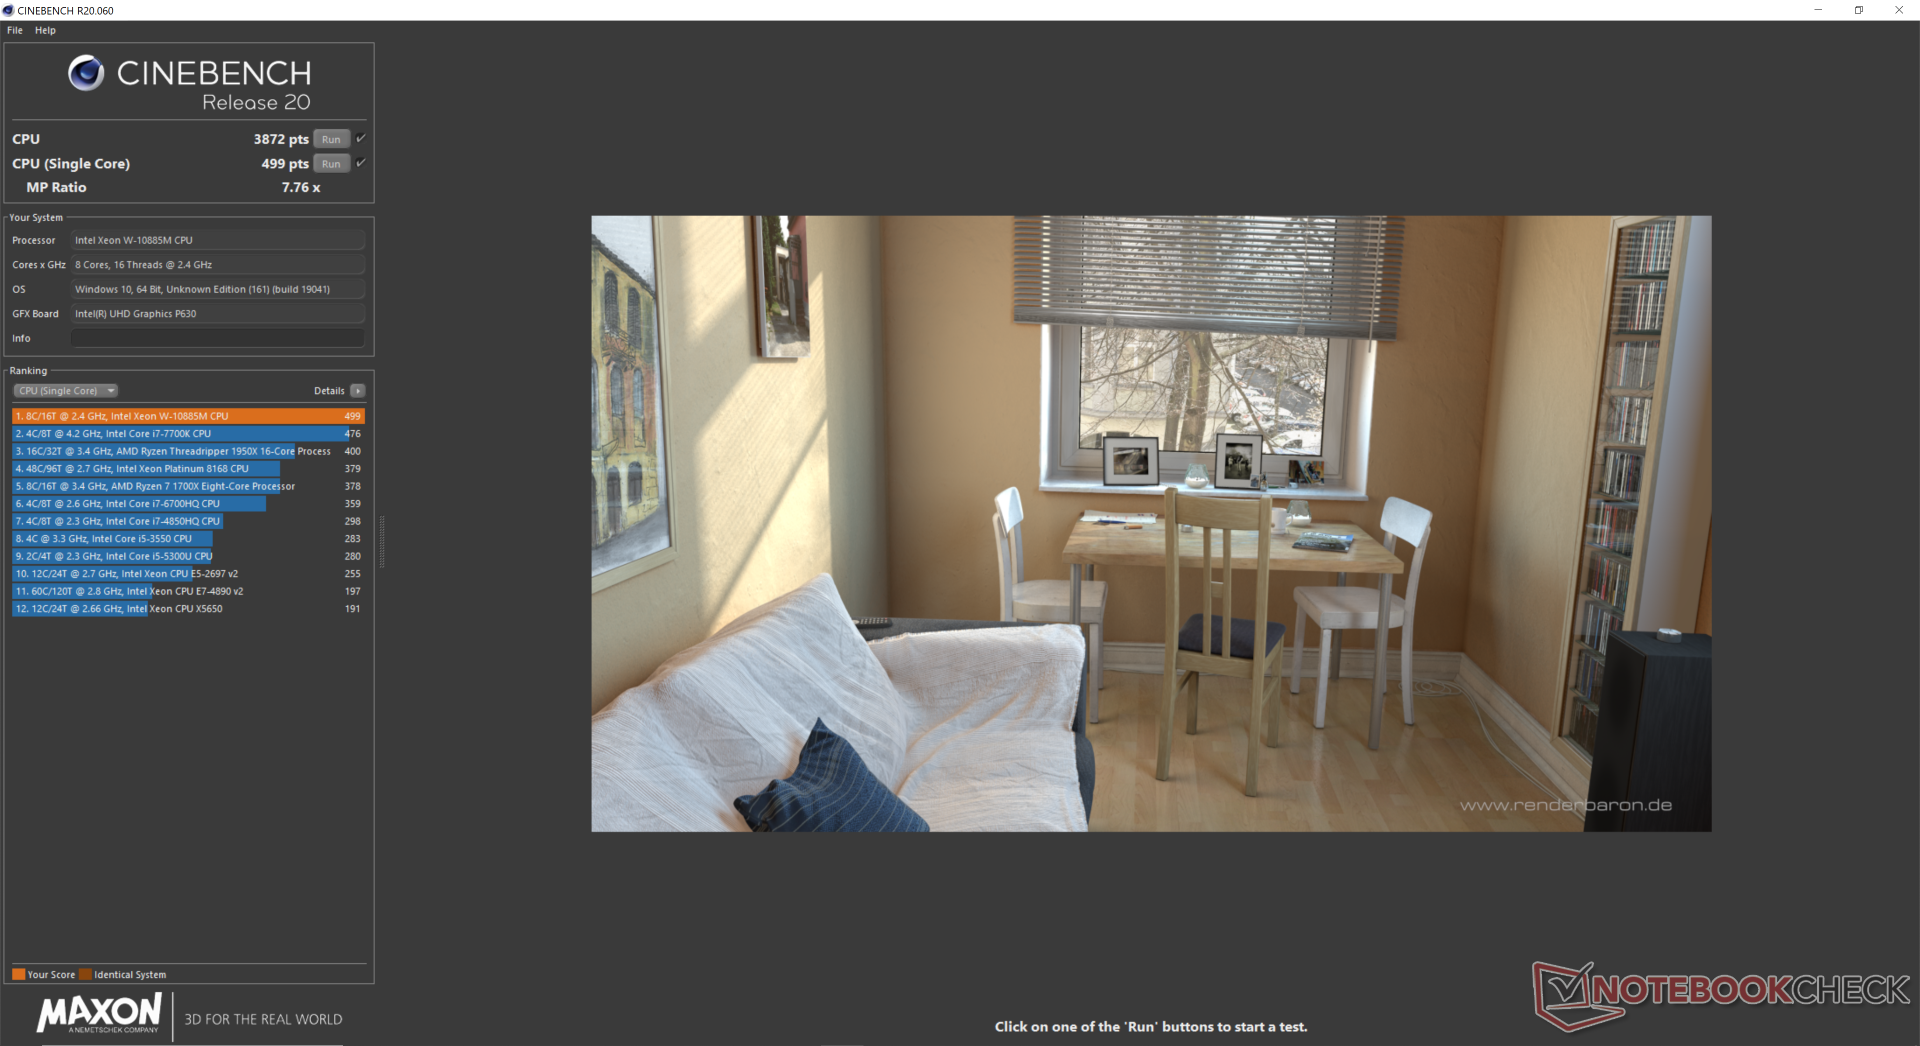
The Xeon W-10885M is comparable to the Core i9-10980HK or i9-10885H in raw CPU performance. Downgrading to the Core i7-10750H or Core i7-10875H SKUs will result in a multi-thread performance deficit of about 10 to 20 percent. Performance stability is excellent as shown by our CineBench R15 xT loop test results below, but this could certainly be better as we will demonstrate below in our Stress Test section.
See our dedicated page on the Xeon W-10885M for more technical information and benchmark comparisons.
Cinebench R15: CPU Multi 64Bit | CPU Single 64Bit
Blender: v2.79 BMW27 CPU
7-Zip 18.03: 7z b 4 -mmt1 | 7z b 4
Geekbench 5.5: Single-Core | Multi-Core
HWBOT x265 Benchmark v2.2: 4k Preset
LibreOffice : 20 Documents To PDF
R Benchmark 2.5: Overall mean
| Blender / v2.79 BMW27 CPU | |
| Acer ConceptD 3 Pro CN315-71P-73W1 | |
| Dell Precision 5550 P91F | |
| Alienware m15 R3 P87F | |
| Dell Precision 7550 | |
| Asus ROG Strix Scar 15 G532LWS | |
| Intel Core i9-10900K | |
| AMD Radeon RX Vega 64 | |
| 7-Zip 18.03 / 7z b 4 -mmt1 | |
| Intel Core i9-10900K | |
| AMD Radeon RX Vega 64 | |
| Asus ROG Strix Scar 15 G532LWS | |
| Dell Precision 7550 | |
| Dell Precision 5550 P91F | |
| Acer ConceptD 3 Pro CN315-71P-73W1 | |
| Alienware m15 R3 P87F | |
| 7-Zip 18.03 / 7z b 4 | |
| AMD Radeon RX Vega 64 | |
| Intel Core i9-10900K | |
| Dell Precision 7550 | |
| Asus ROG Strix Scar 15 G532LWS | |
| Dell Precision 5550 P91F | |
| Alienware m15 R3 P87F | |
| Acer ConceptD 3 Pro CN315-71P-73W1 | |
| Geekbench 5.5 / Single-Core | |
| Intel Core i9-10900K | |
| Asus ROG Strix Scar 15 G532LWS | |
| Dell Precision 7550 | |
| Dell Precision 5550 P91F | |
| Alienware m15 R3 P87F | |
| AMD Radeon RX Vega 64 | |
| Acer ConceptD 3 Pro CN315-71P-73W1 | |
| Geekbench 5.5 / Multi-Core | |
| Intel Core i9-10900K | |
| AMD Radeon RX Vega 64 | |
| Asus ROG Strix Scar 15 G532LWS | |
| Dell Precision 5550 P91F | |
| Dell Precision 7550 | |
| Alienware m15 R3 P87F | |
| Acer ConceptD 3 Pro CN315-71P-73W1 | |
* ... smaller is better
System Performance
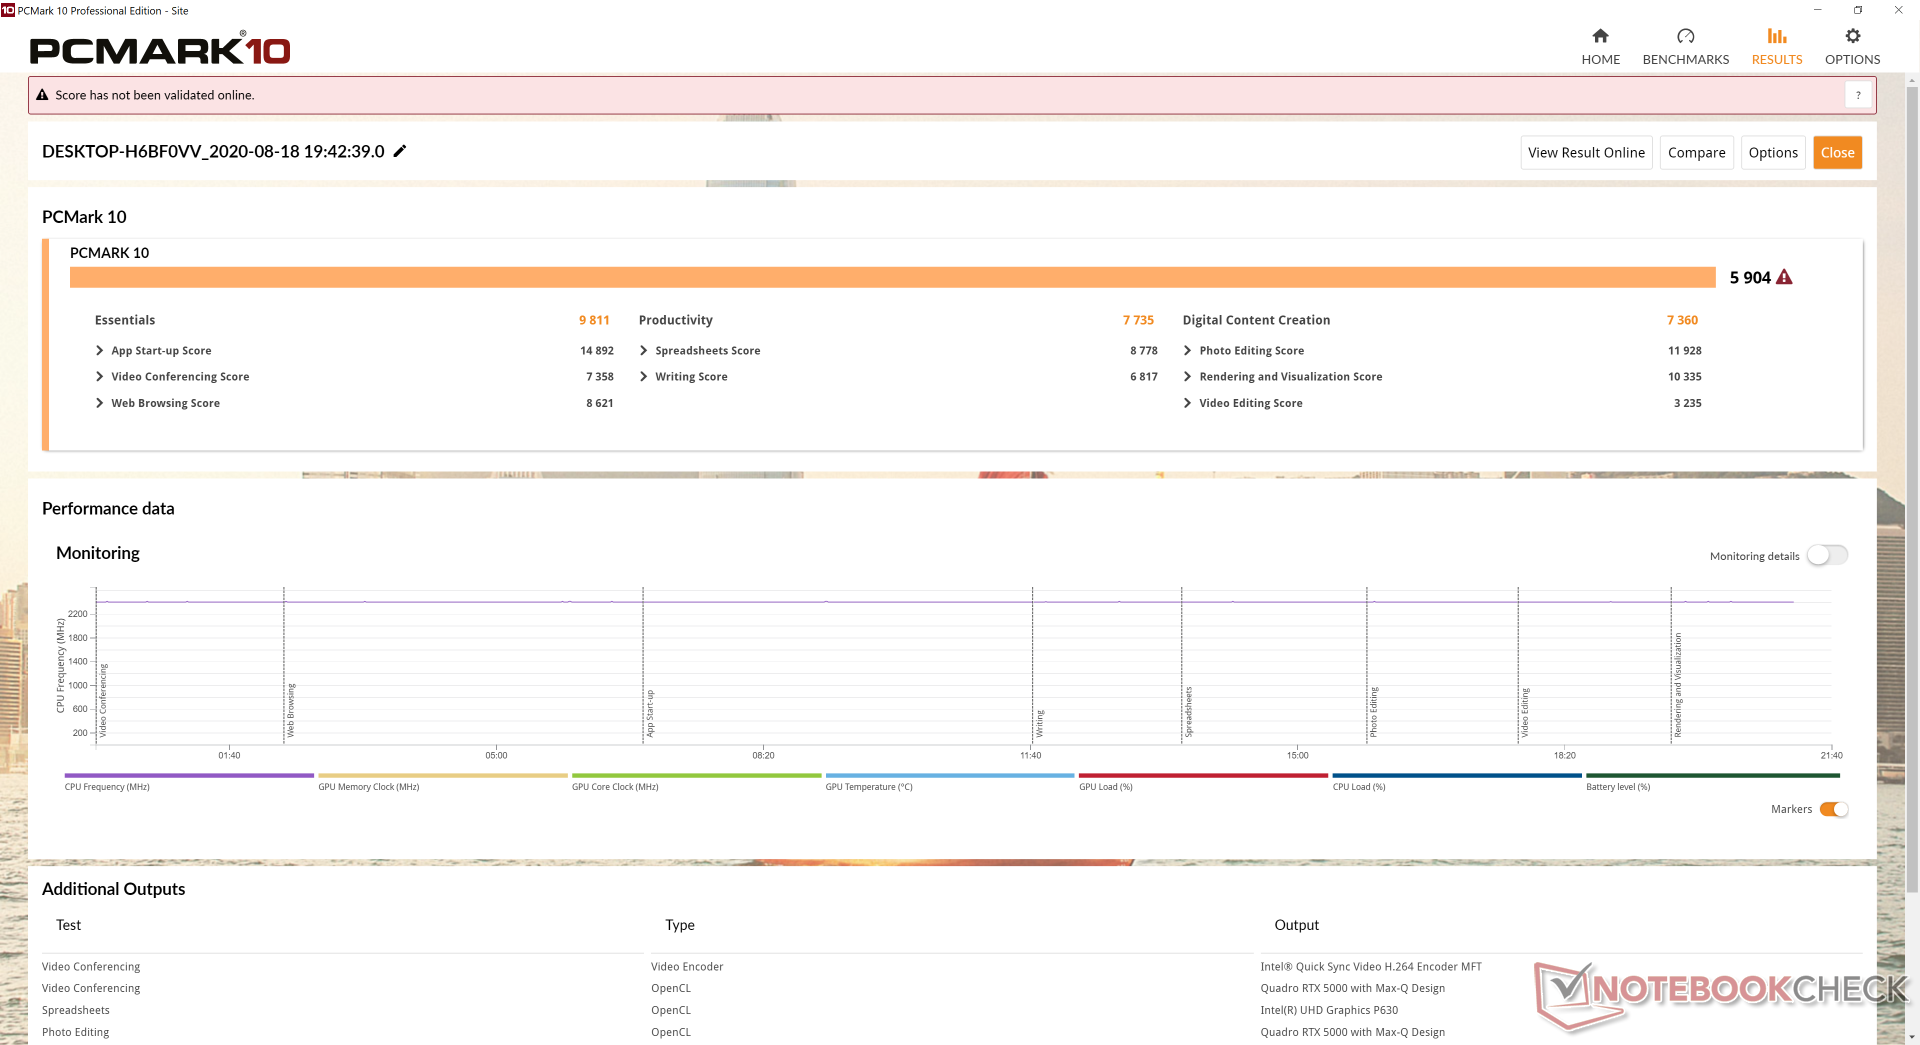
PCMark benchmarks are comparable to the competing Lenovo ThinkPad P53 and even consistently higher by just a few percentage points. We didn't experience any software issues with our test unit.
| PCMark 10 | |
| Score | |
| Dell Precision 7540 | |
| Dell Precision 7550 | |
| Lenovo ThinkPad P53-20QN000YGE | |
| Dell Precision 5550 P91F | |
| Acer ConceptD 3 Pro CN315-71P-73W1 | |
| HP ZBook Studio G5-4QH10EA | |
| Essentials | |
| Dell Precision 5550 P91F | |
| Dell Precision 7550 | |
| Lenovo ThinkPad P53-20QN000YGE | |
| Dell Precision 7540 | |
| Acer ConceptD 3 Pro CN315-71P-73W1 | |
| HP ZBook Studio G5-4QH10EA | |
| Productivity | |
| Dell Precision 7540 | |
| Dell Precision 7550 | |
| Dell Precision 5550 P91F | |
| Lenovo ThinkPad P53-20QN000YGE | |
| Acer ConceptD 3 Pro CN315-71P-73W1 | |
| HP ZBook Studio G5-4QH10EA | |
| Digital Content Creation | |
| Dell Precision 7540 | |
| Dell Precision 7550 | |
| Lenovo ThinkPad P53-20QN000YGE | |
| Dell Precision 5550 P91F | |
| HP ZBook Studio G5-4QH10EA | |
| Acer ConceptD 3 Pro CN315-71P-73W1 | |
| PCMark 8 | |
| Home Score Accelerated v2 | |
| Dell Precision 7540 | |
| Acer ConceptD 3 Pro CN315-71P-73W1 | |
| Dell Precision 7550 | |
| Dell Precision 5550 P91F | |
| HP ZBook Studio G5-4QH10EA | |
| Work Score Accelerated v2 | |
| Acer ConceptD 3 Pro CN315-71P-73W1 | |
| Dell Precision 7550 | |
| Dell Precision 7540 | |
| Dell Precision 5550 P91F | |
| HP ZBook Studio G5-4QH10EA | |
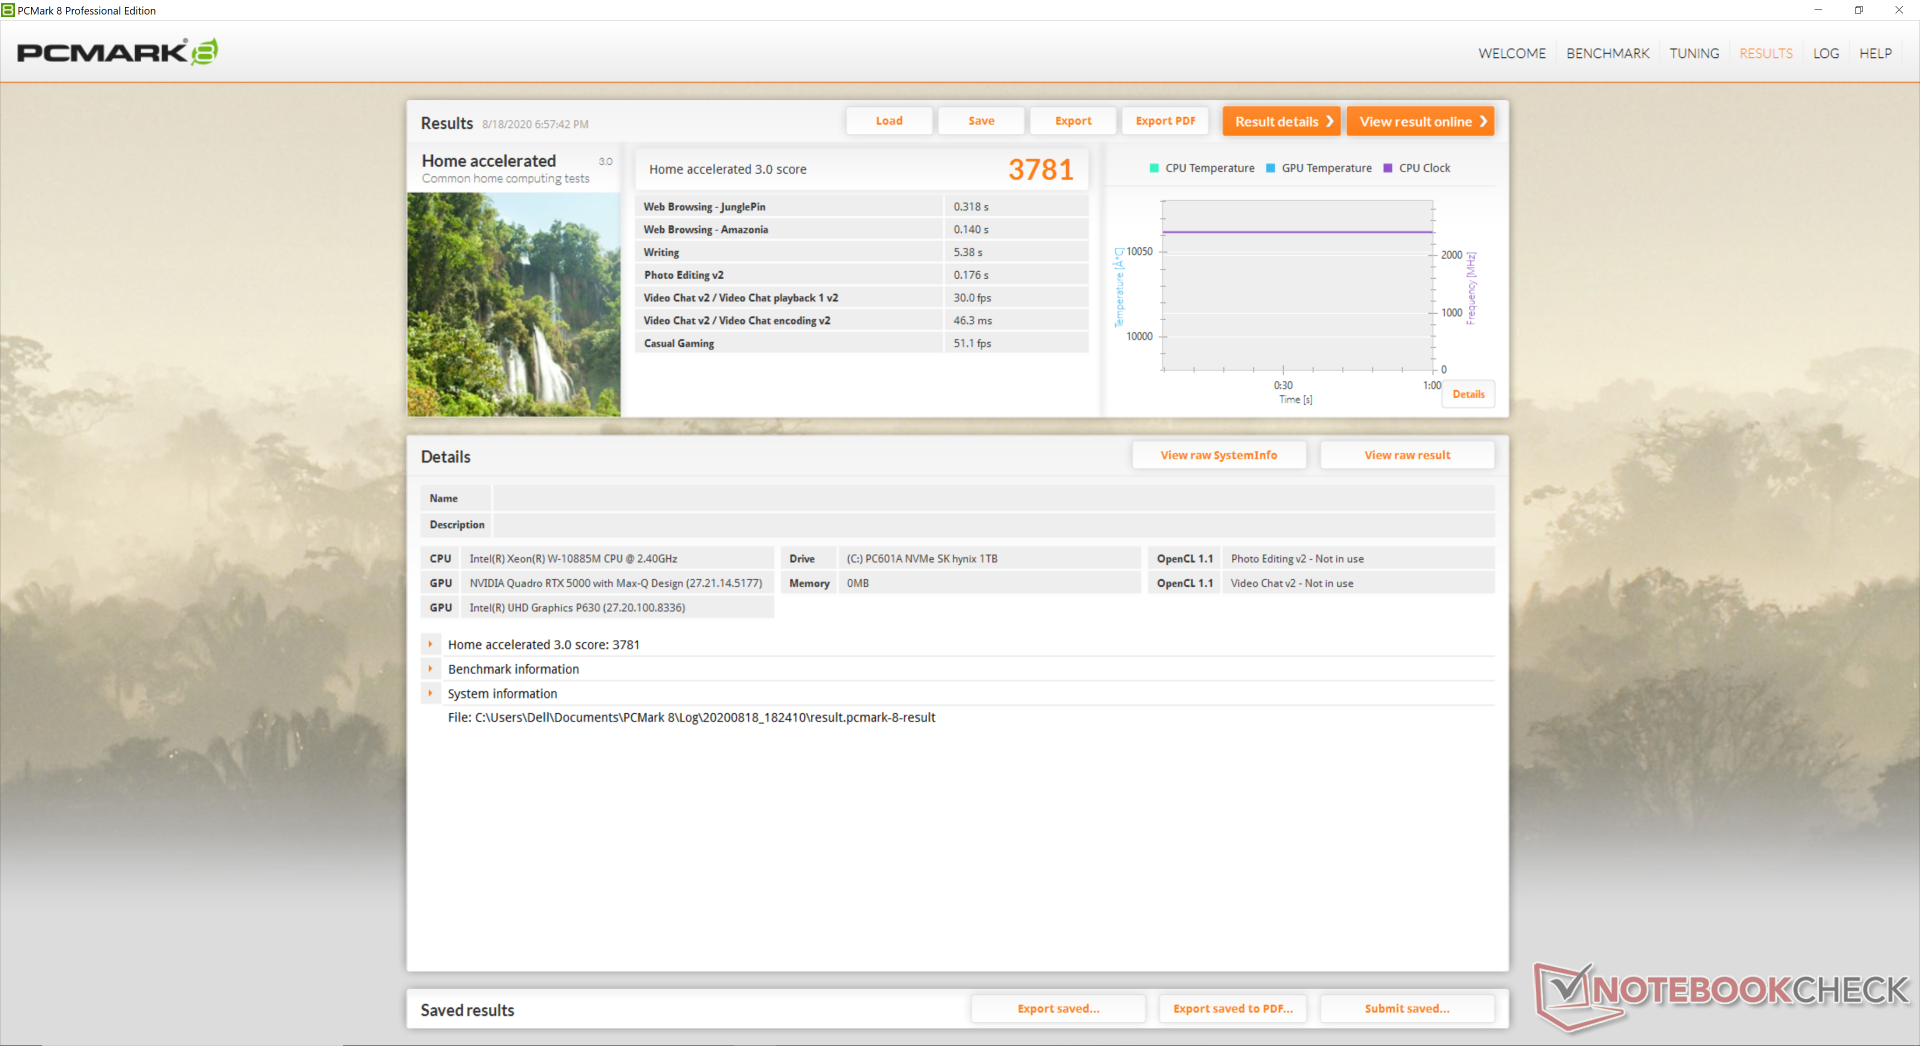
| PCMark 8 Home Score Accelerated v2 | 3781 points | |
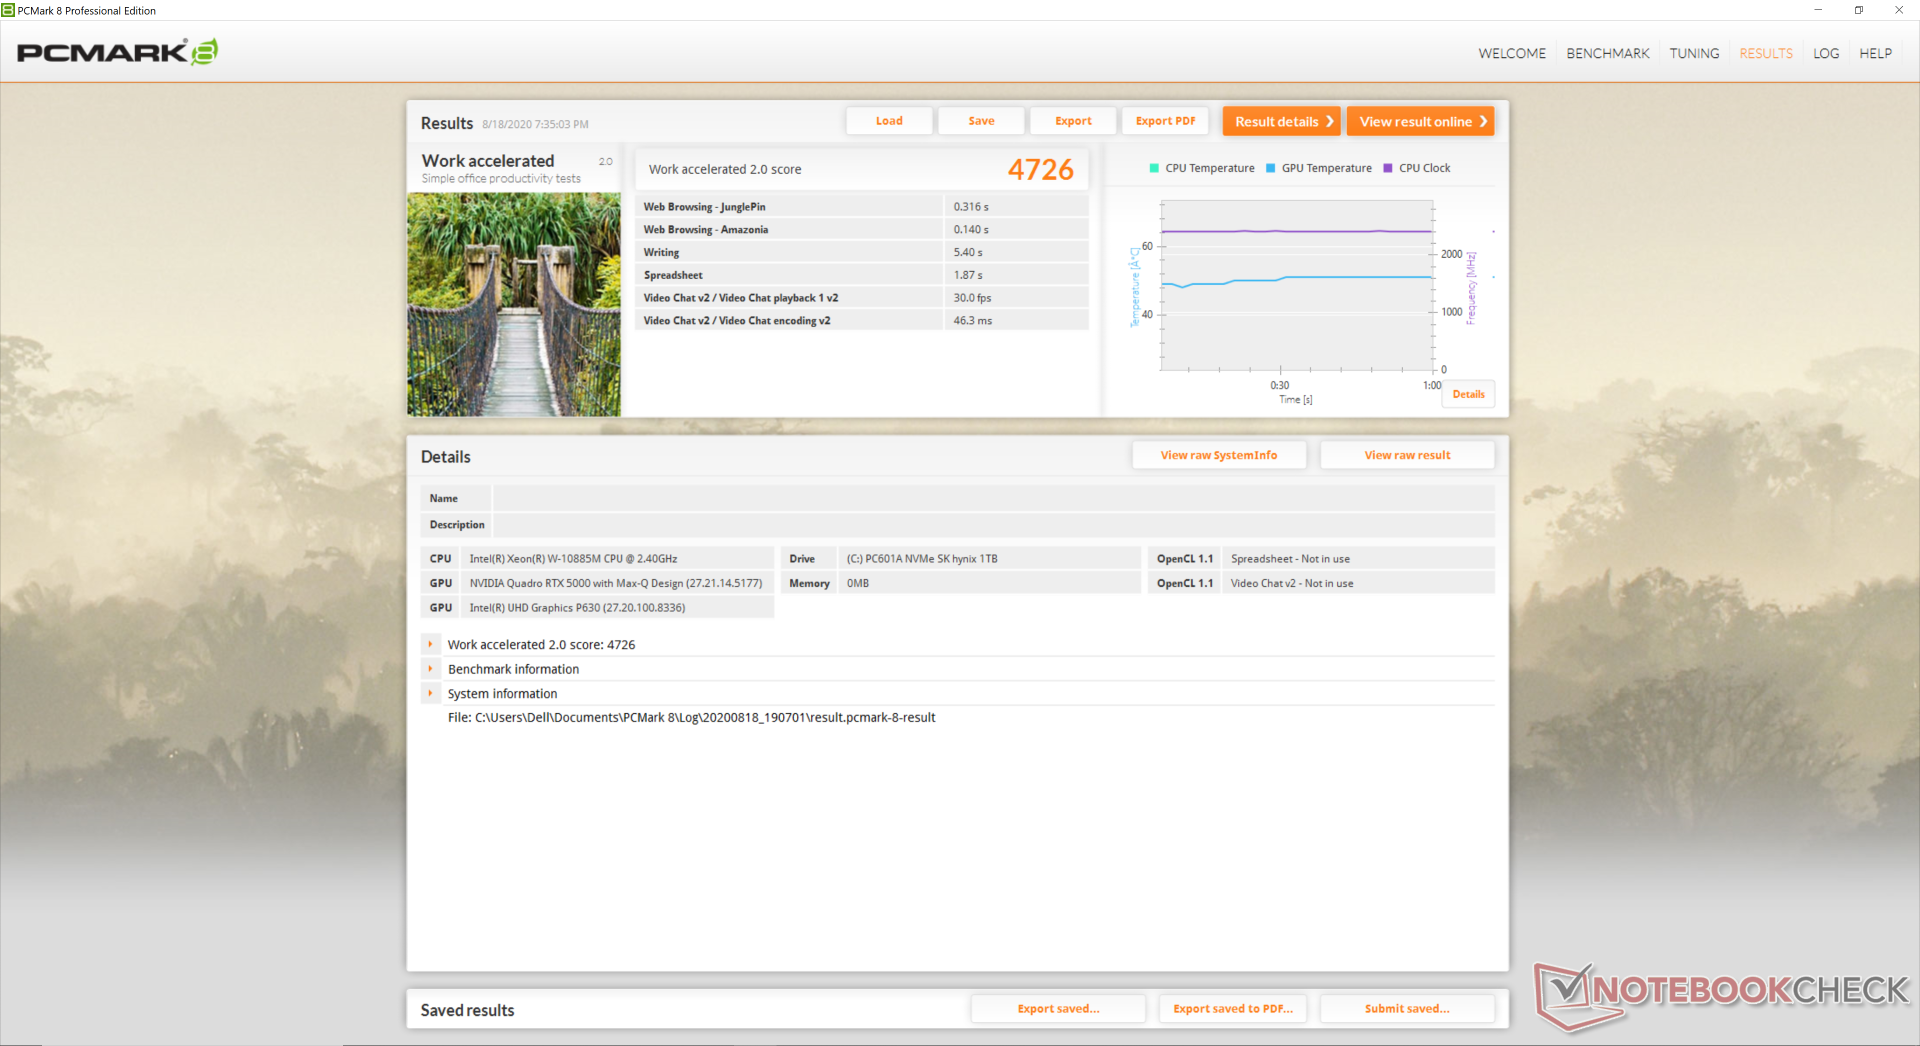
| PCMark 8 Work Score Accelerated v2 | 4726 points | |
| PCMark 10 Score | 5904 points | |
Help | ||
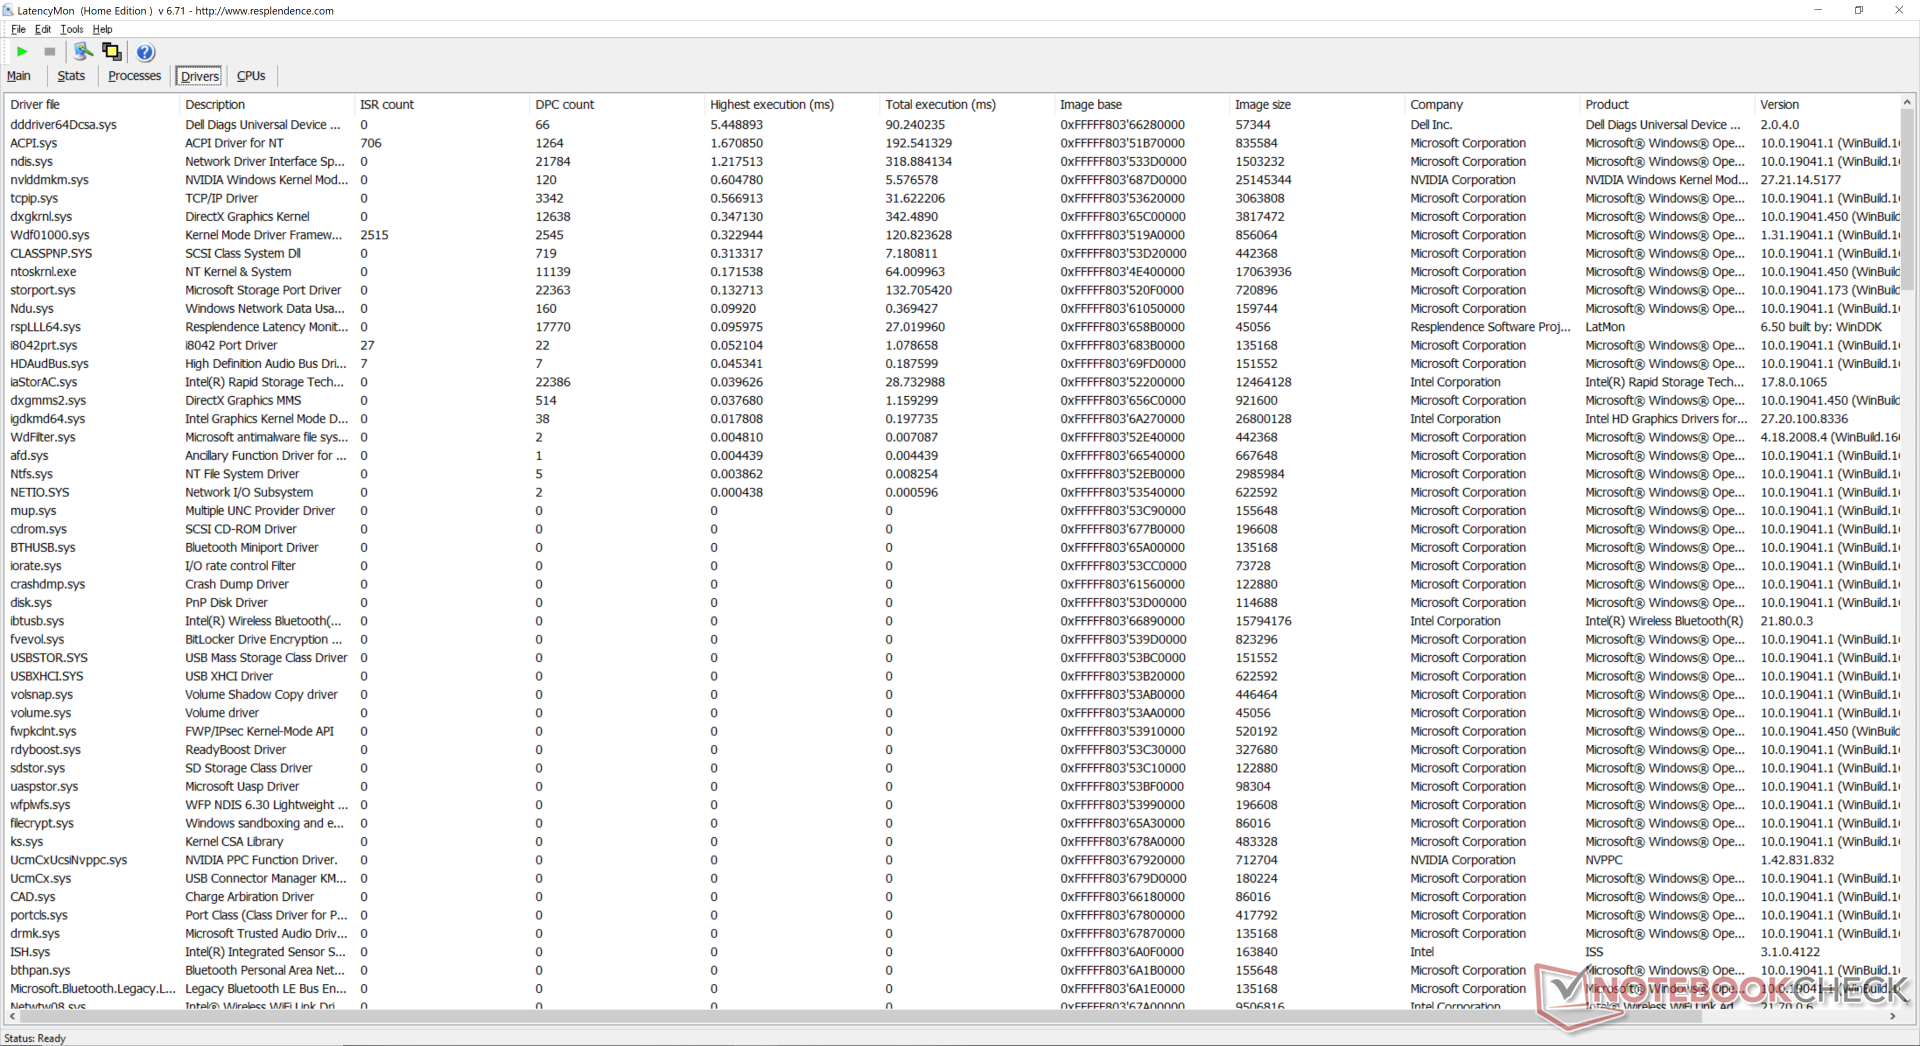
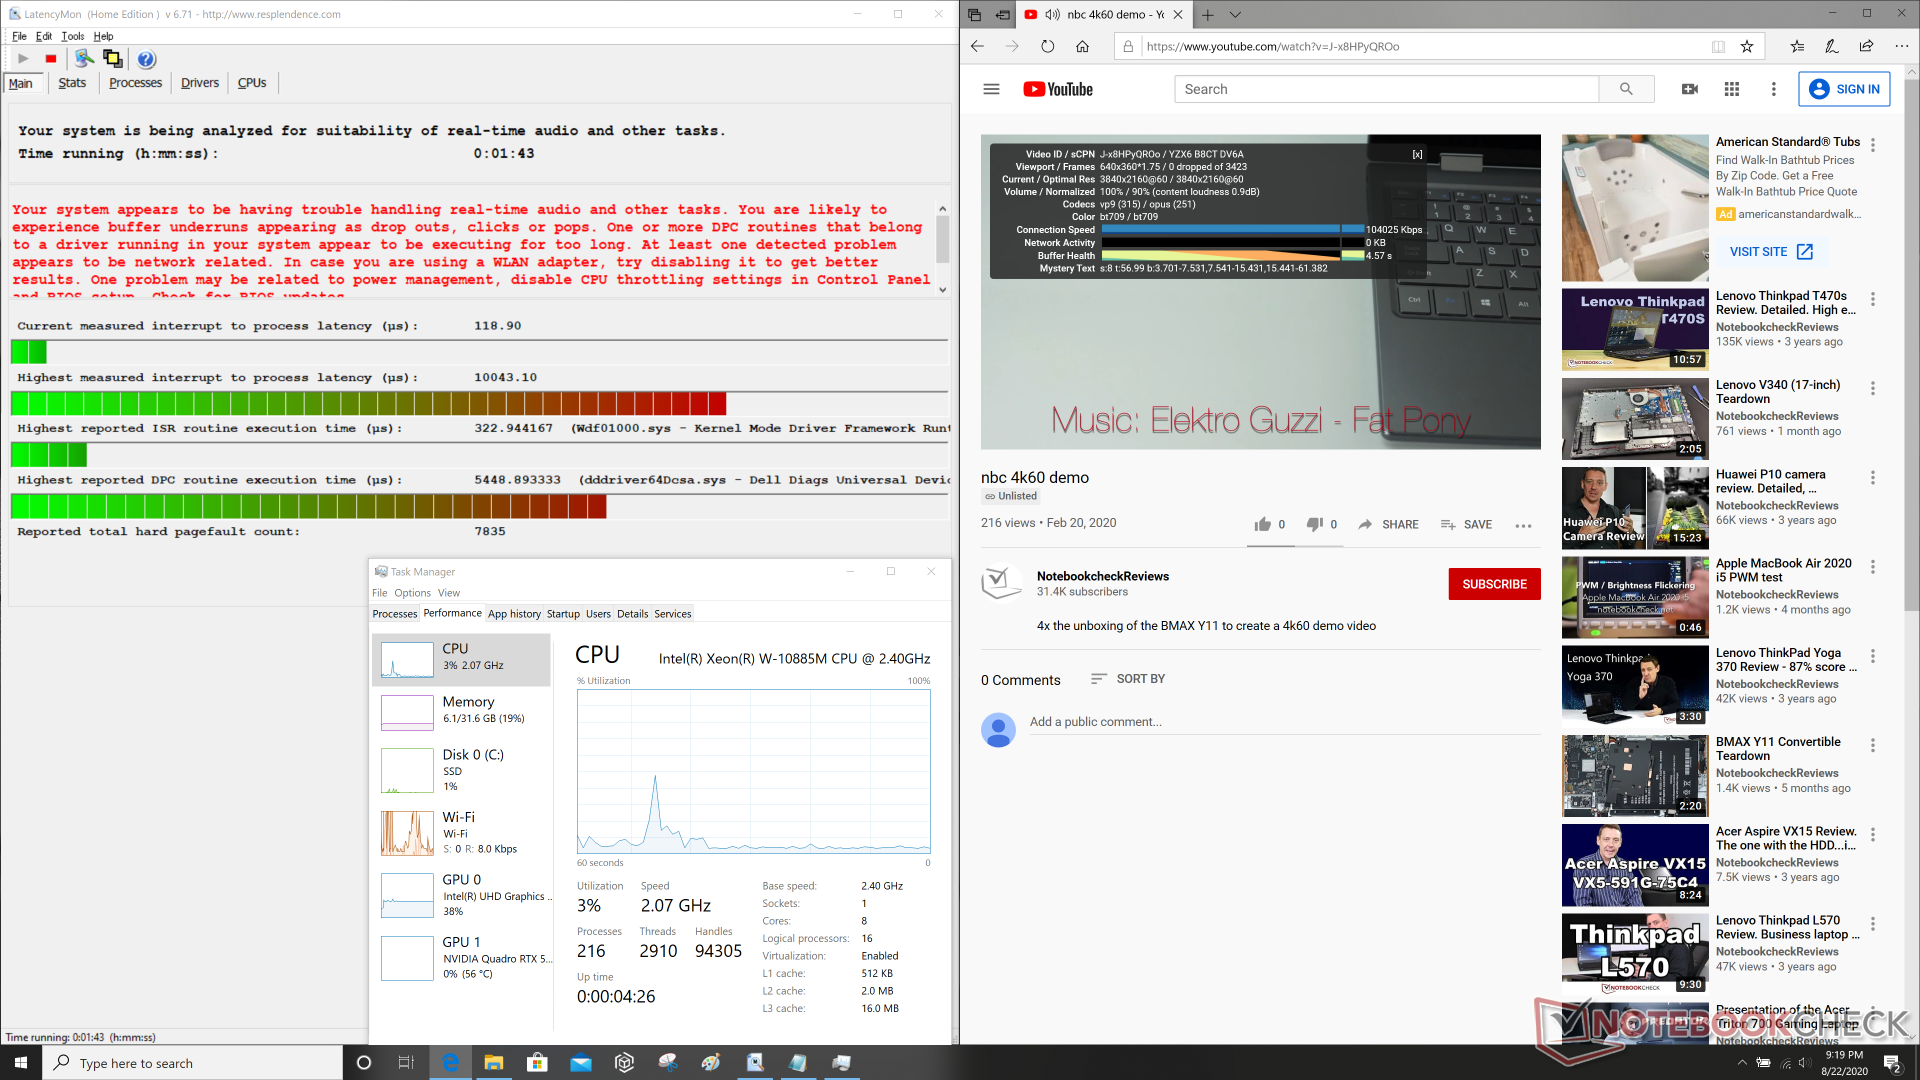
DPC Latency
LatencyMon reveals DPC latency issues related to Wdf01000.sys and dddriver64Dcsa.sys which is disappointing to see on a workstation laptop. 4K UHD video playback is otherwise smooth and with no dropped frames.
| DPC Latencies / LatencyMon - interrupt to process latency (max), Web, Youtube, Prime95 | |
| Dell Precision 7550 | |
| Asus ROG Strix Scar 15 G532LWS | |
| Alienware m15 R3 P87F | |
| MSI GE66 Raider 10SFS | |
| Acer ConceptD 3 Pro CN315-71P-73W1 | |
| Acer ConceptD 9 Pro | |
| Razer Blade 15 Studio Edition 2020 | |
| Dell Precision 5550 P91F | |
* ... smaller is better
Storage Devices
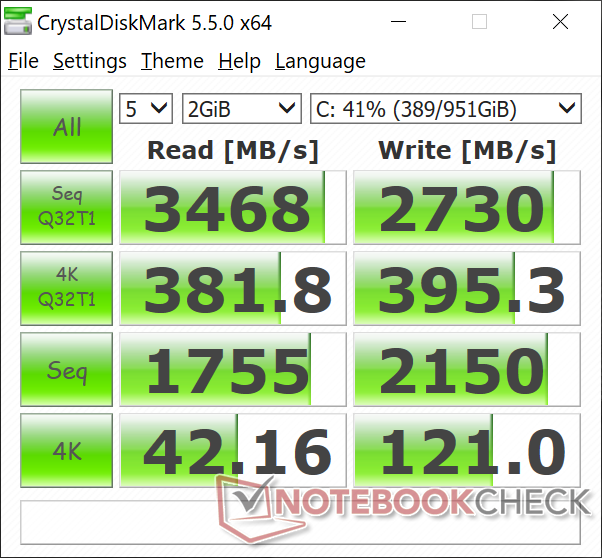
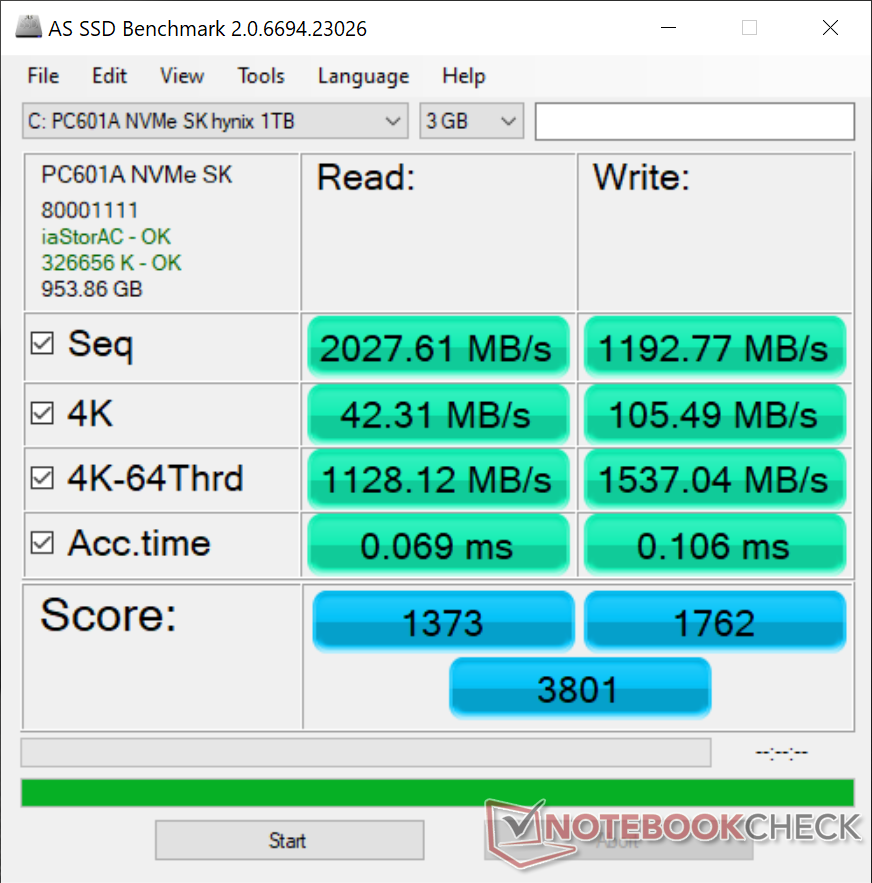
There are a total of three internal M.2 2280 storage bays for a total of 6 TB if desired. Our test unit comes with a 1 TB SK Hynix PC601A for theoretical sequential read and write rates of up to 3400 MB/s and 2500 MB/s, respectively. Transfer rates are roughly comparable to the Samsung PM981 series commonly found on high-end PCs.
See our table of HDDs and SSDs for more benchmark comparisons.
| Dell Precision 7550 SK Hynix PC601A NVMe 1TB | Dell Precision 5550 P91F SK Hynix PC601A NVMe 1TB | Acer ConceptD 3 Pro CN315-71P-73W1 WDC PC SN720 SDAPNTW-512G | Lenovo ThinkPad P53-20QN000YGE Samsung PM981a MZVLB1T0HBLR | HP ZBook Studio G5-4QH10EA Samsung SSD PM981 MZVLB512HAJQ | |
|---|---|---|---|---|---|
| AS SSD | -52% | 8% | 51% | 13% | |
| Seq Read (MB/s) | 2028 | 2039 1% | 2973 47% | 2655 31% | 2379 17% |
| Seq Write (MB/s) | 1193 | 1376 15% | 2429 104% | 2454 106% | 1780 49% |
| 4K Read (MB/s) | 42.31 | 44.11 4% | 24.7 -42% | 59.1 40% | 51 21% |
| 4K Write (MB/s) | 105.5 | 113.3 7% | 115.3 9% | 138.1 31% | 109.5 4% |
| 4K-64 Read (MB/s) | 1128 | 1094 -3% | 1243 10% | 2009 78% | 1184 5% |
| 4K-64 Write (MB/s) | 1537 | 1630 6% | 835 -46% | 1907 24% | 1725 12% |
| Access Time Read * (ms) | 0.069 | 0.059 14% | 0.054 22% | 0.057 17% | |
| Access Time Write * (ms) | 0.106 | 0.99 -834% | 0.034 68% | 0.028 74% | 0.034 68% |
| Score Read (Points) | 1373 | 1342 -2% | 1565 14% | 2333 70% | 1472 7% |
| Score Write (Points) | 1762 | 1881 7% | 1193 -32% | 2291 30% | 2013 14% |
| Score Total (Points) | 3801 | 3883 2% | 3525 -7% | 5810 53% | 4217 11% |
| Copy ISO MB/s (MB/s) | 1768 | 2489 41% | 2136 21% | 1989 13% | |
| Copy Program MB/s (MB/s) | 627 | 682 9% | 489.6 -22% | 457 -27% | |
| Copy Game MB/s (MB/s) | 1477 | 1515 3% | 1163 -21% | 1121 -24% | |
| CrystalDiskMark 5.2 / 6 | -1% | -4% | 9% | -20% | |
| Write 4K (MB/s) | 121 | 122.6 1% | 113.2 -6% | 147 21% | 102.7 -15% |
| Read 4K (MB/s) | 42.16 | 42.4 1% | 31.1 -26% | 48.3 15% | 38.32 -9% |
| Write Seq (MB/s) | 2150 | 2167 1% | 2540 18% | 1402 -35% | 1417 -34% |
| Read Seq (MB/s) | 1755 | 1747 0% | 2005 14% | 1503 -14% | 1289 -27% |
| Write 4K Q32T1 (MB/s) | 395.3 | 388.8 -2% | 331.4 -16% | 475.2 20% | 278.9 -29% |
| Read 4K Q32T1 (MB/s) | 381.8 | 367.3 -4% | 368.3 -4% | 581 52% | 348.8 -9% |
| Write Seq Q32T1 (MB/s) | 2730 | 2629 -4% | 2535 -7% | 2936 8% | 1895 -31% |
| Read Seq Q32T1 (MB/s) | 3468 | 3460 0% | 3427 -1% | 3539 2% | 3352 -3% |
| Write 4K Q8T8 (MB/s) | 1575 | ||||
| Read 4K Q8T8 (MB/s) | 1607 | ||||
| Total Average (Program / Settings) | -27% /
-34% | 2% /
4% | 30% /
33% | -4% /
1% |
* ... smaller is better

Disk Throttling: DiskSpd Read Loop, Queue Depth 8
GPU Performance
Raw graphics performance is most similar to the desktop GeForce RTX 2060 while being roughly 35 to 40 percent slower than the non-Max-Q Quadro RTX 5000. SpecViewPerf results significantly favor our Quadro RTX 5000 Max-Q over the GeForce RTX 2060 as expected. Users upgrading from the last generation P5200 will see more minor performance upgrades save for the new tensor core features of Turing.
See our page on the Quadro RTX 5000 Max-Q for more technical information and benchmark comparisons.
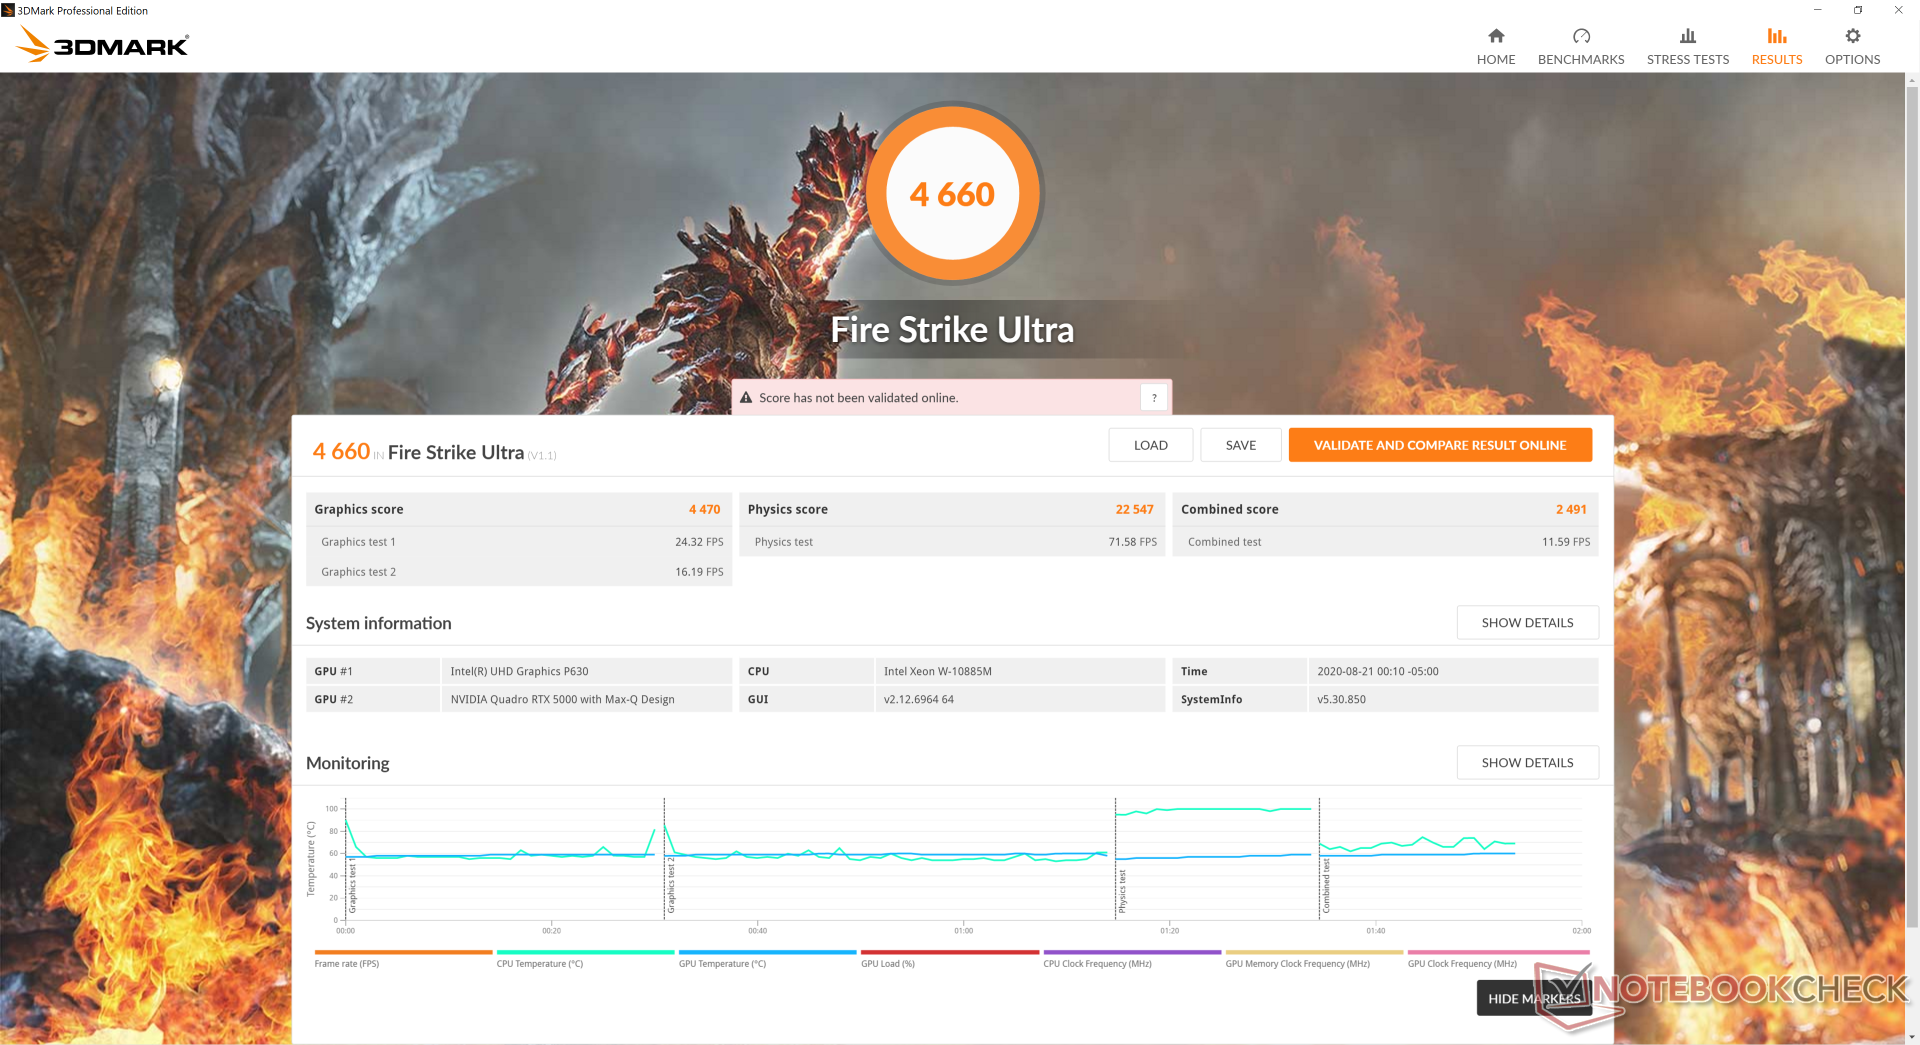
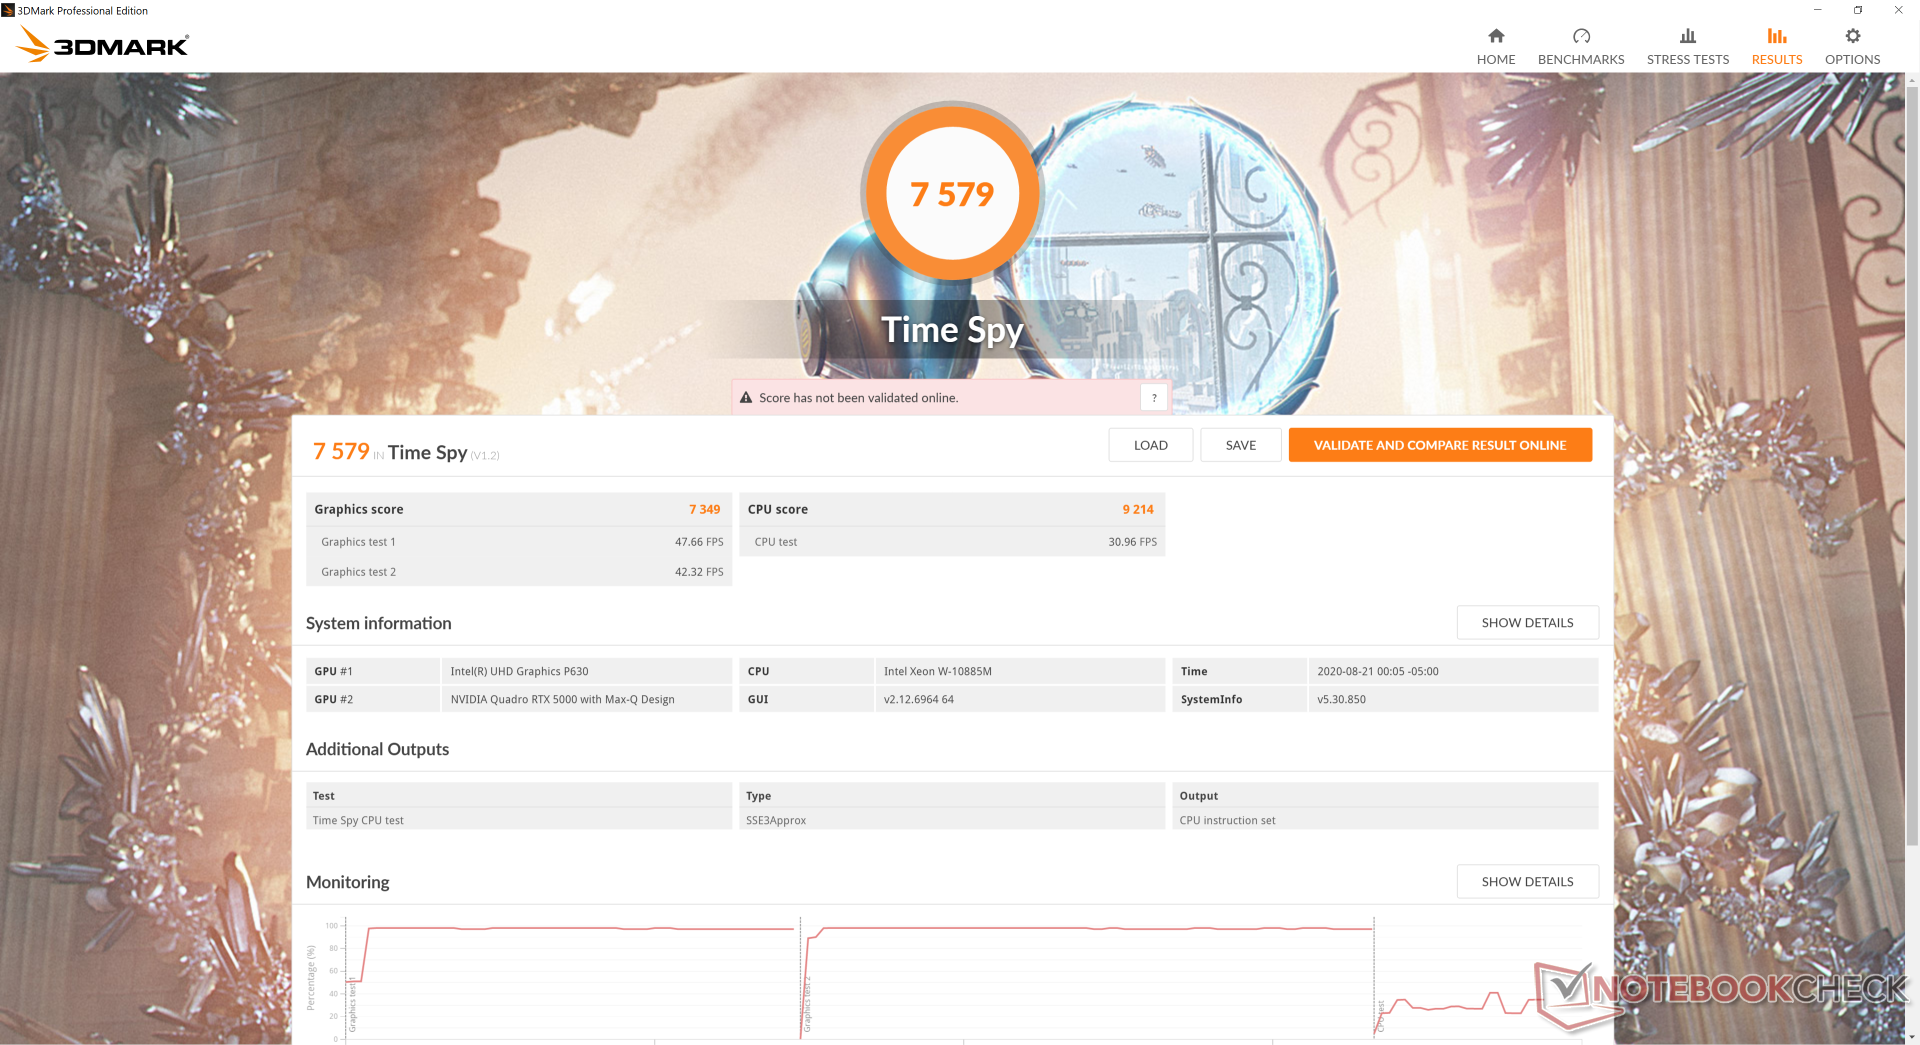
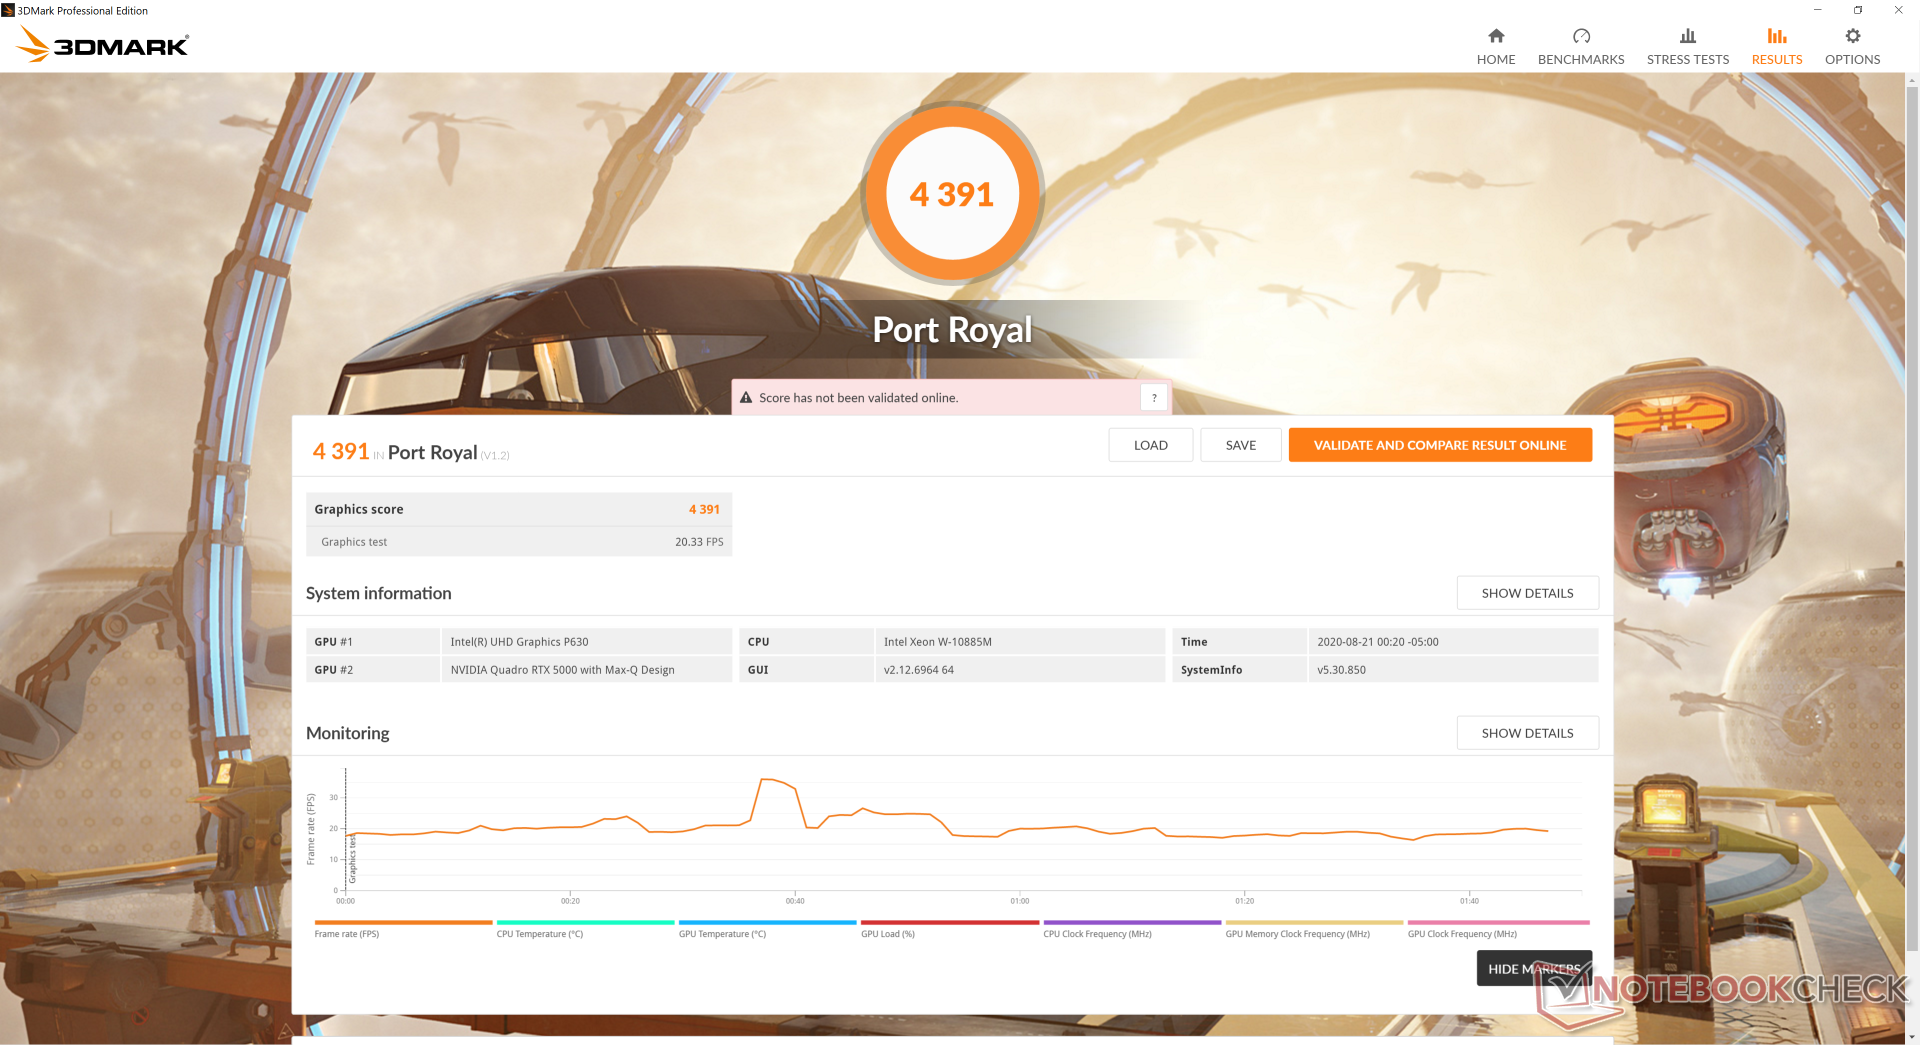
| 3DMark 06 Standard Score | 42280 points | |
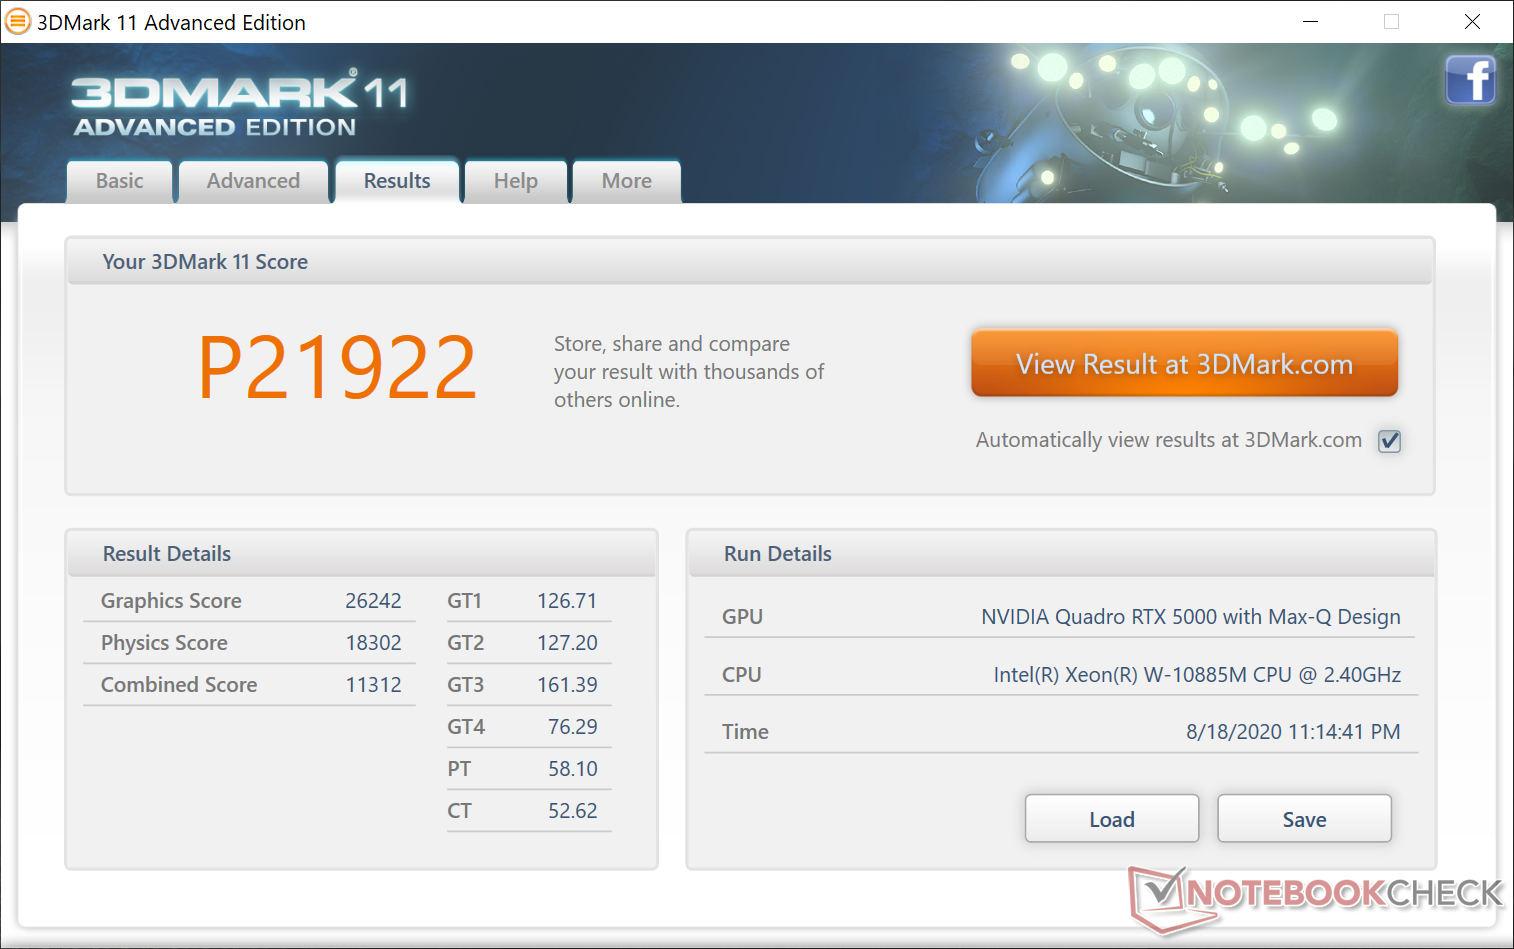
| 3DMark 11 Performance | 21922 points | |
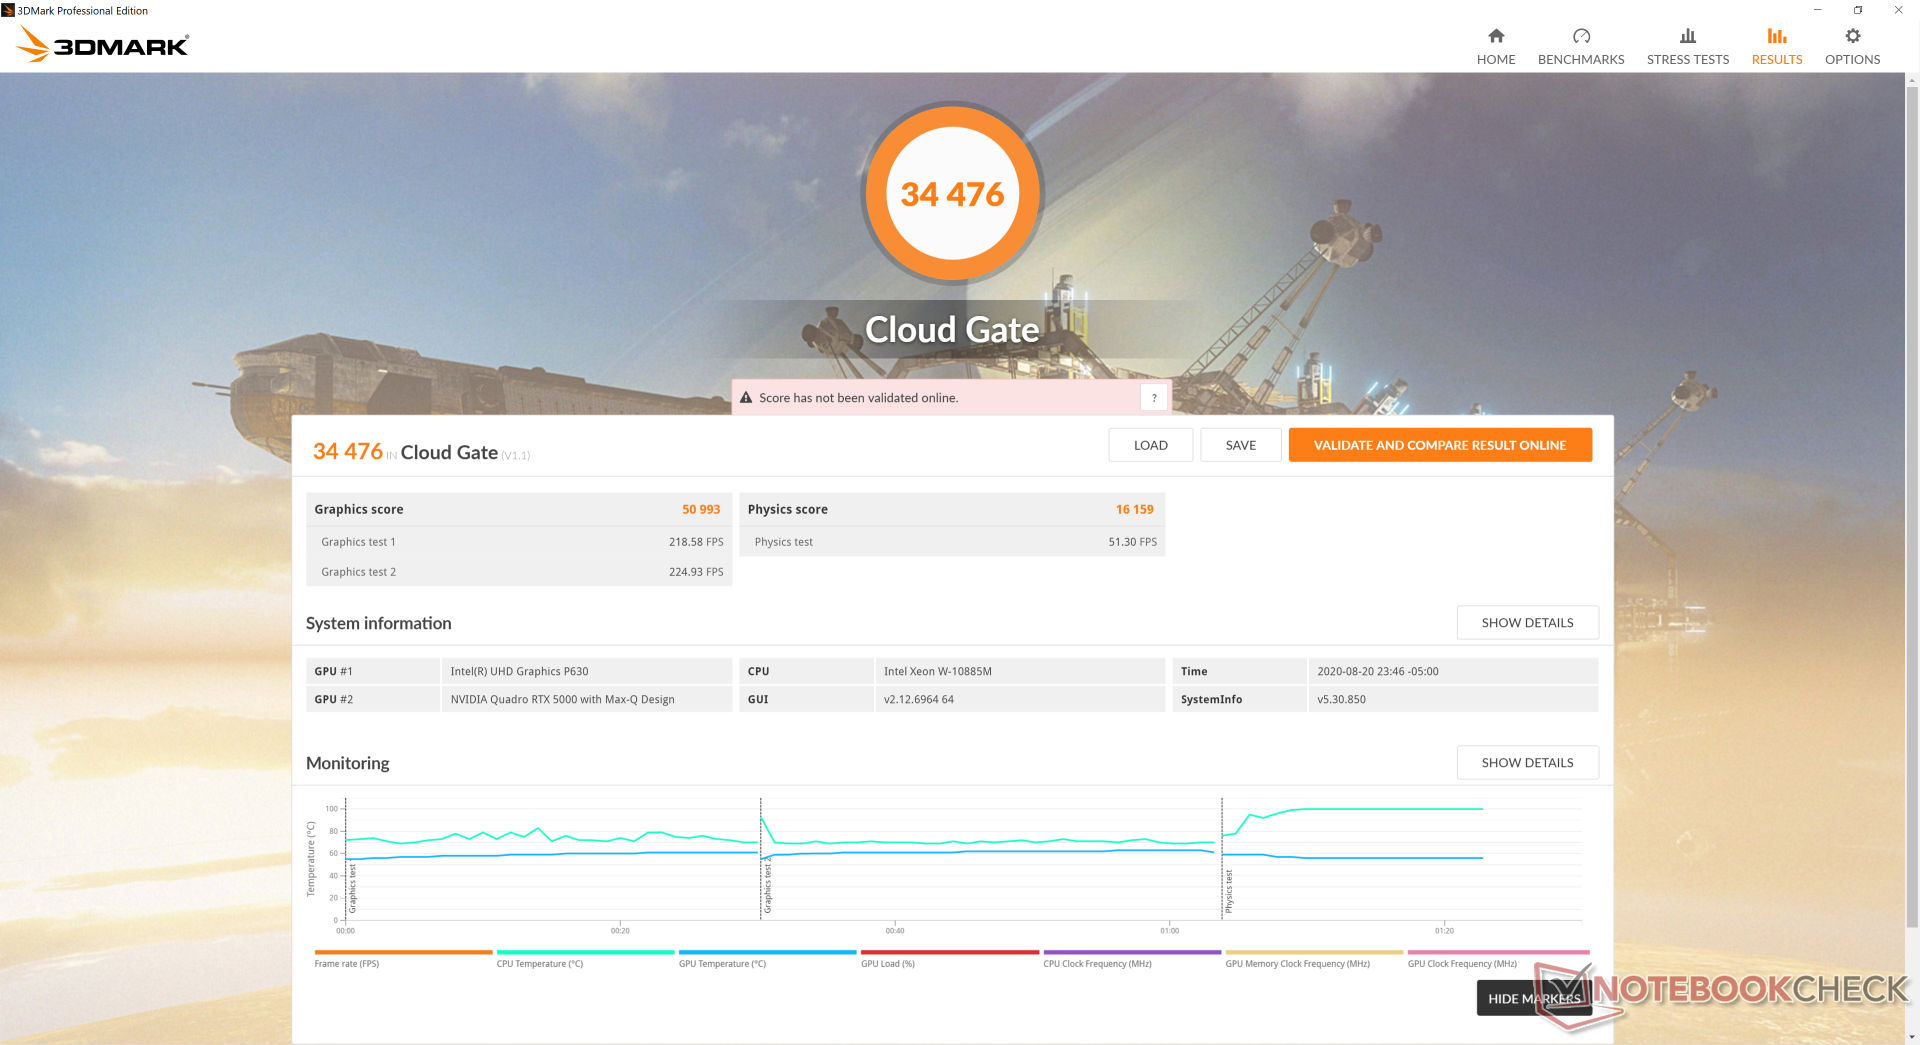
| 3DMark Cloud Gate Standard Score | 34476 points | |
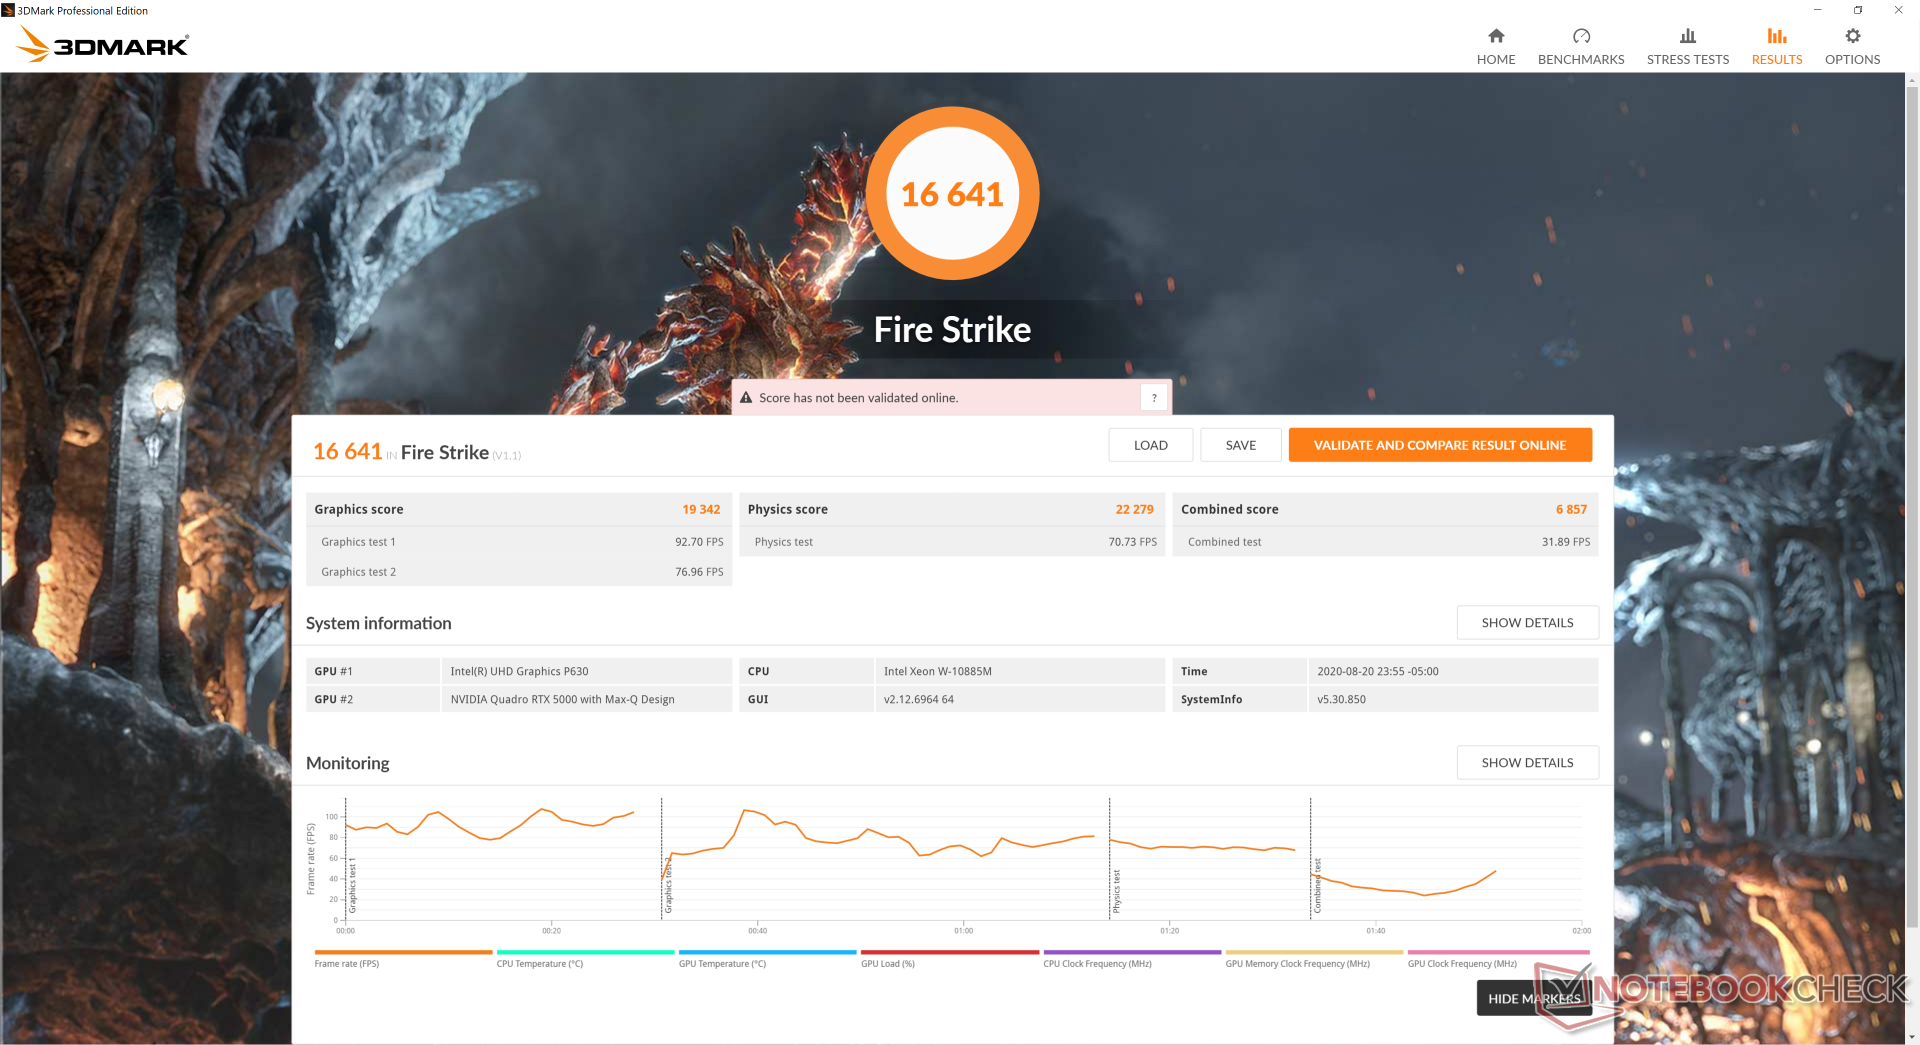
| 3DMark Fire Strike Score | 16641 points | |
| 3DMark Time Spy Score | 7579 points | |
Help | ||
| low | med. | high | ultra | QHD | 4K | |
|---|---|---|---|---|---|---|
| The Witcher 3 (2015) | 299 | 249.4 | 139.1 | 77.3 | 52.5 | |
| Dota 2 Reborn (2015) | 156 | 142 | 117 | 111 | 98.7 | |
| Final Fantasy XV Benchmark (2018) | 154 | 99.7 | 77.3 | 56 | 32.8 | |
| X-Plane 11.11 (2018) | 118 | 102 | 85.7 | 48.8 |
Emissions
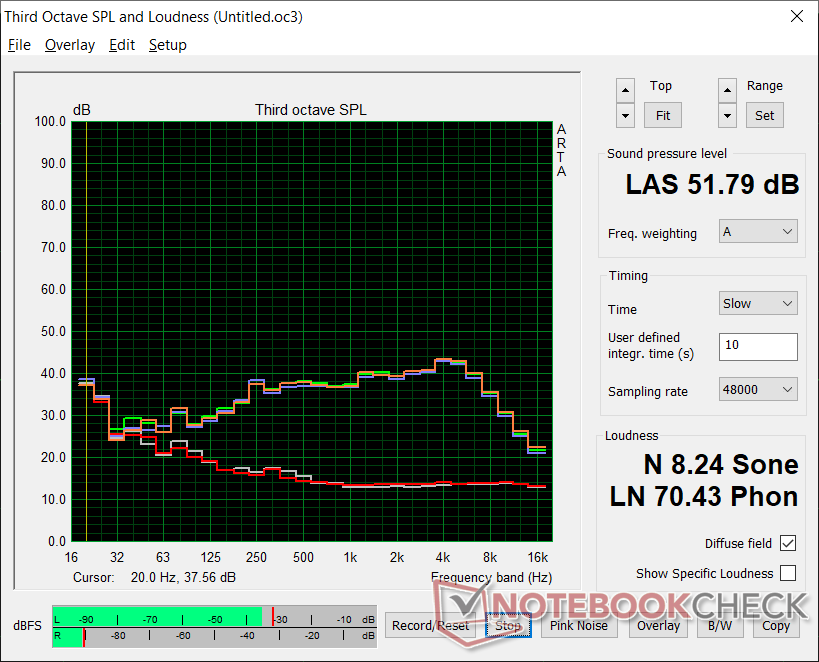
System Noise
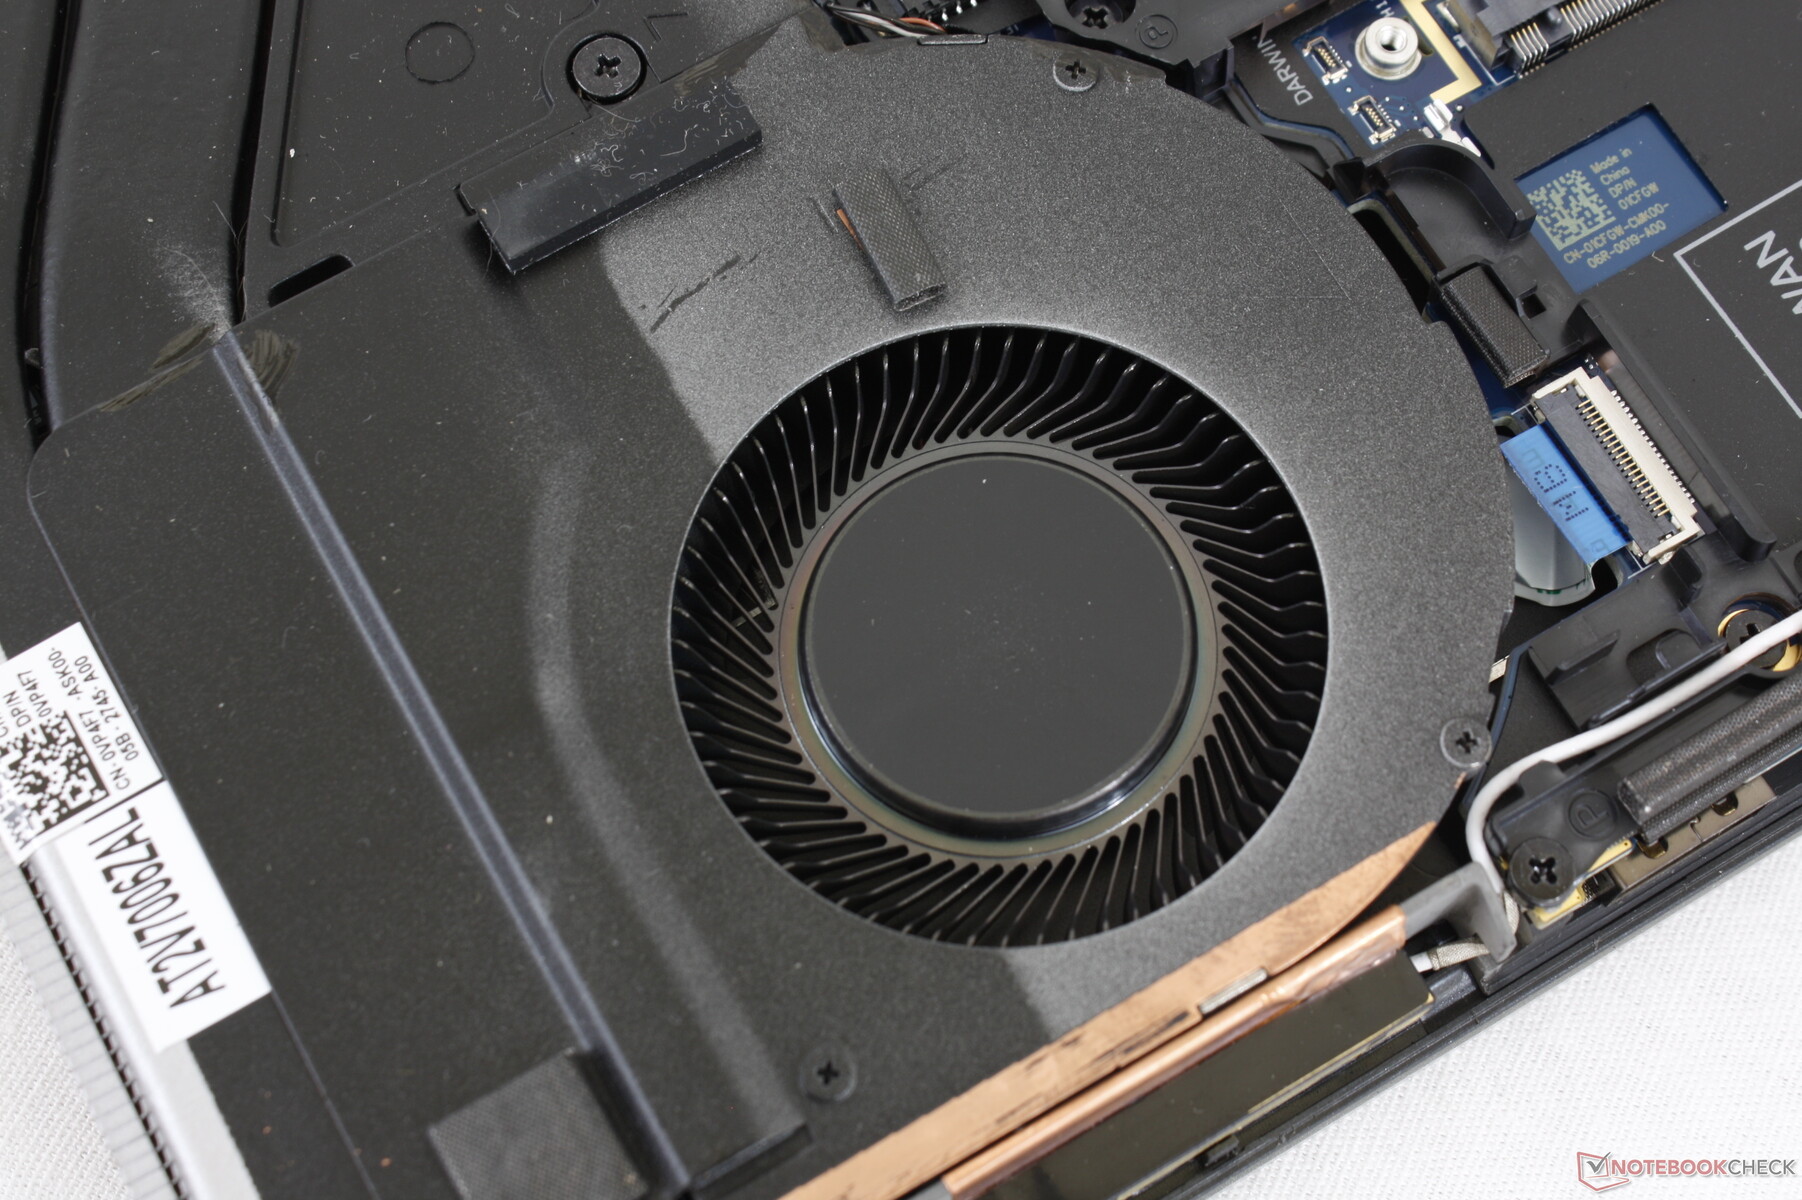
Fan noise is quieter than expected during low loads like web browsing or video streaming when considering the high-power processors inside. It tops out at only 30 dB(A) when there isn't much going on onscreen with no annoying pulsing behavior to speak of.
The fans pick up considerably when running higher loads. Witcher 3, for example, induces a fan noise of 51.9 dB(A) to be as loud as many gaming laptops and last year's Precision 7540. This is a loud machine only when it needs to be loud.
We recommend becoming familiar with Dell Power Manager as fan noise is directly tied to its settings.
| Dell Precision 7550 Quadro RTX 5000 Max-Q, W-10885M, SK Hynix PC601A NVMe 1TB | Dell Precision 7540 Quadro RTX 3000 (Laptop), i9-9980HK, SK hynix PC400 512 GB | Dell Precision 5550 P91F Quadro T2000 Max-Q, i7-10875H, SK Hynix PC601A NVMe 1TB | Acer ConceptD 3 Pro CN315-71P-73W1 Quadro T1000 (Laptop), i7-9750H, WDC PC SN720 SDAPNTW-512G | Lenovo ThinkPad P53-20QN000YGE Quadro RTX 5000 Max-Q, i7-9850H, Samsung PM981a MZVLB1T0HBLR | HP ZBook Studio G5-4QH10EA Quadro P1000, i7-8750H, Samsung SSD PM981 MZVLB512HAJQ | |
|---|---|---|---|---|---|---|
| Noise | 3% | 6% | -1% | 8% | 4% | |
| off / environment * (dB) | 25.8 | 28.7 -11% | 26.2 -2% | 31.2 -21% | 28.3 -10% | 28.6 -11% |
| Idle Minimum * (dB) | 25.8 | 28.8 -12% | 26.2 -2% | 31.2 -21% | 28.3 -10% | 28.6 -11% |
| Idle Average * (dB) | 25.8 | 28.7 -11% | 26.2 -2% | 31.2 -21% | 28.3 -10% | 28.6 -11% |
| Idle Maximum * (dB) | 25.9 | 29.1 -12% | 26.2 -1% | 31.5 -22% | 28.3 -9% | 30 -16% |
| Load Average * (dB) | 51.2 | 37.1 28% | 39.2 23% | 38.4 25% | 29.8 42% | 38.1 26% |
| Witcher 3 ultra * (dB) | 51.9 | 41.2 21% | 39 25% | 36.9 29% | 38.3 26% | 35 33% |
| Load Maximum * (dB) | 51.9 | 41.2 21% | 50.6 3% | 41.2 21% | 38.3 26% | 42.5 18% |
* ... smaller is better
Noise level
| Idle |
| 25.8 / 25.8 / 25.9 dB(A) |
| Load |
| 51.2 / 51.9 dB(A) |
 | ||
30 dB silent 40 dB(A) audible 50 dB(A) loud |
||
min: | ||
Temperature
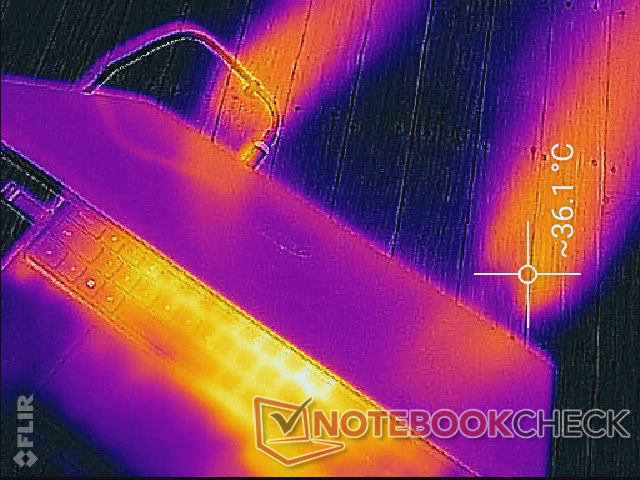
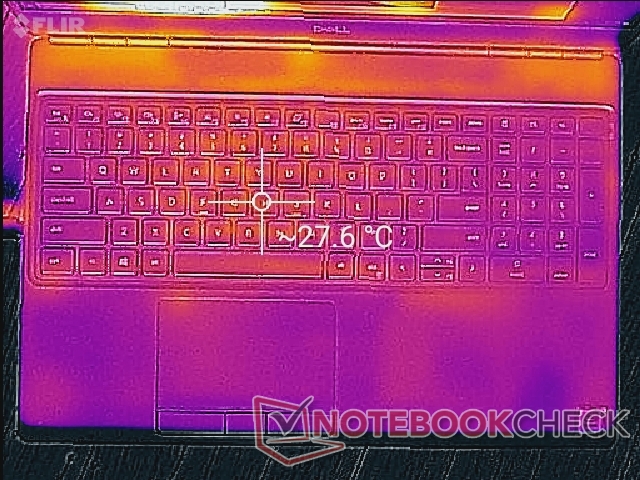
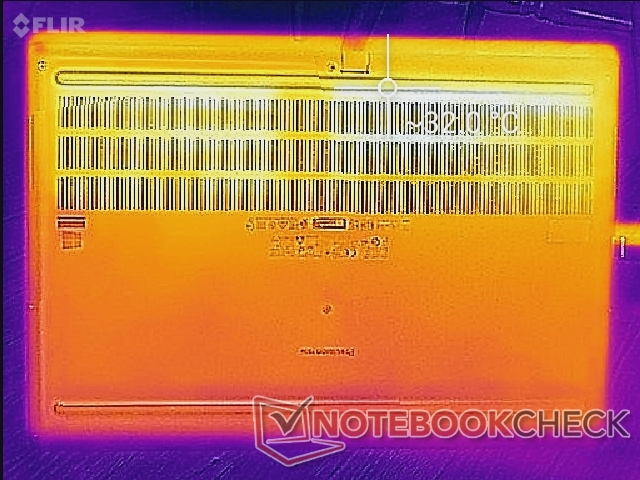
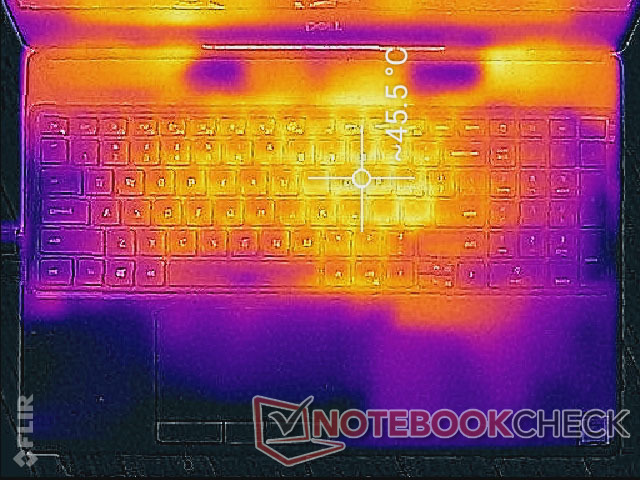
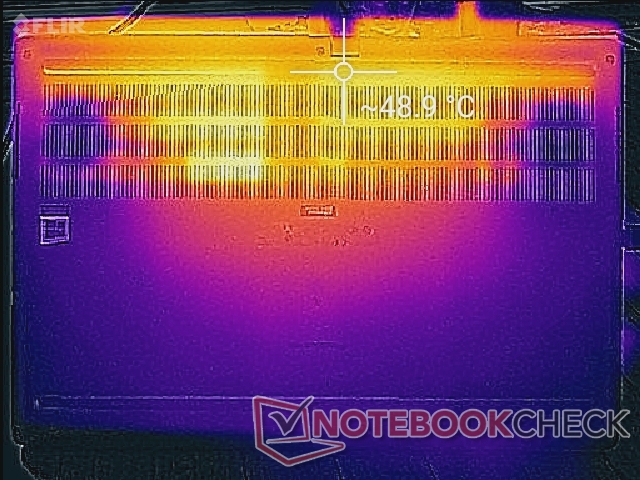
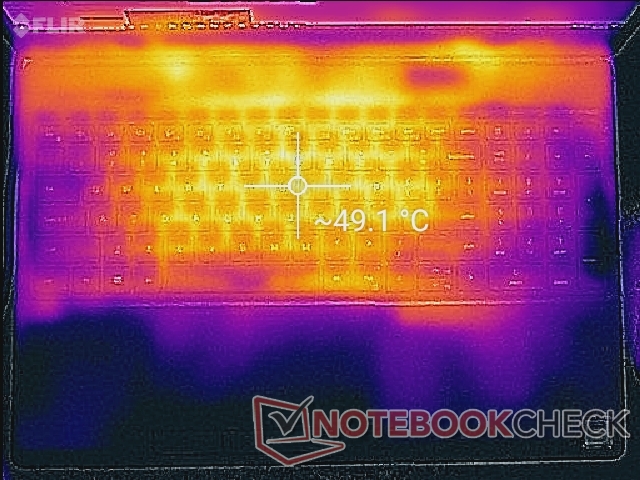
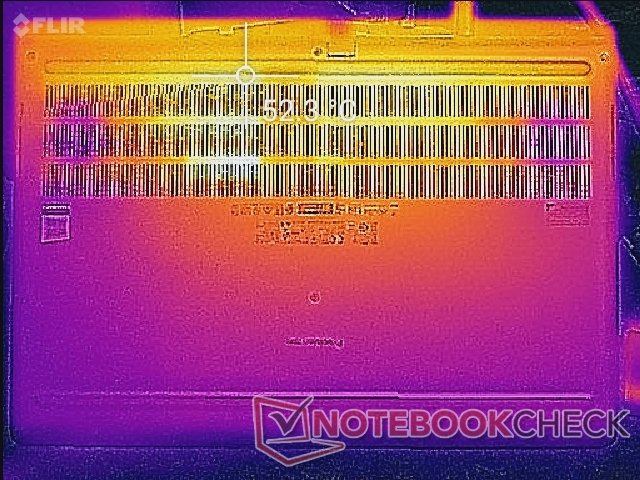
Surface temperature development is mostly symmetrical with hot spots near the center of the chassis. The keyboard center, for example, can become as warm as 49 C when under high loads to be even warmer than what we recorded on the smaller Precision 5550. The palm rests, touchpad, and sides of the keyboard remain much cooler.
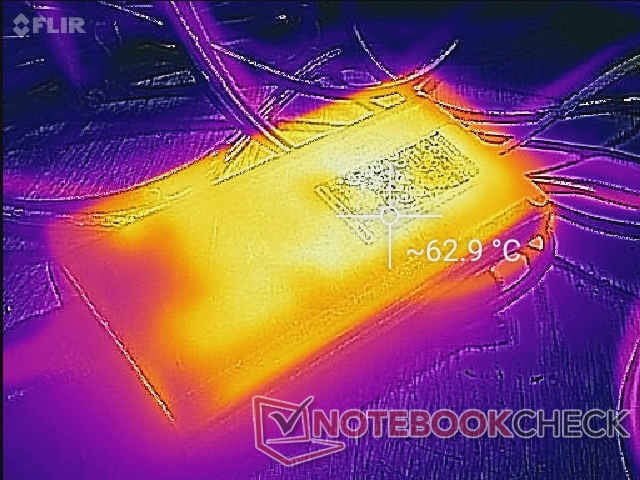
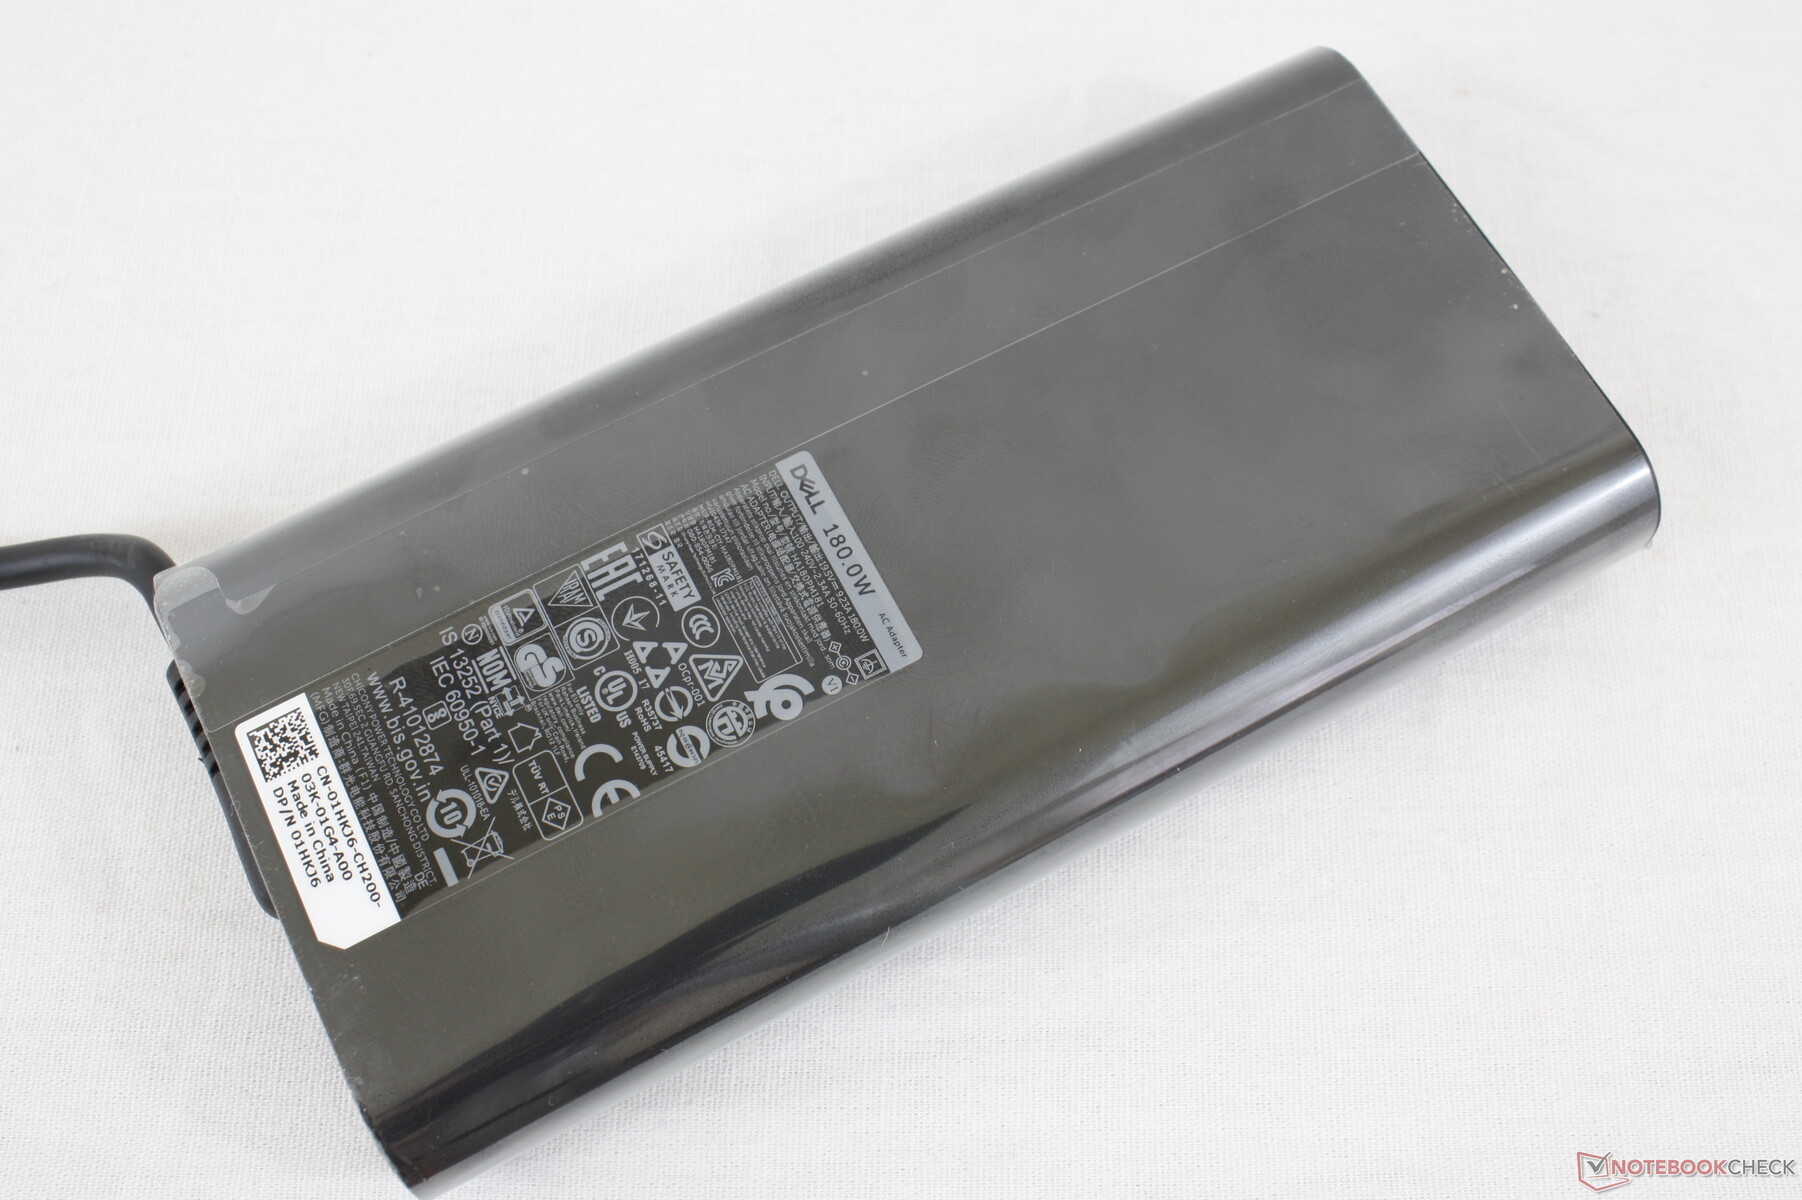
The AC adapter can also become very warm at over 60 C when under high loads due to its compact form factor not unlike the AC adapter for the Razer Blade Studio Edition.
(-) The maximum temperature on the upper side is 49 °C / 120 F, compared to the average of 38.2 °C / 101 F, ranging from 22.2 to 69.8 °C for the class Workstation.
(-) The bottom heats up to a maximum of 51 °C / 124 F, compared to the average of 41.1 °C / 106 F
(+) In idle usage, the average temperature for the upper side is 26.7 °C / 80 F, compared to the device average of 32 °C / 90 F.
(±) Playing The Witcher 3, the average temperature for the upper side is 37.8 °C / 100 F, compared to the device average of 32 °C / 90 F.
(+) The palmrests and touchpad are cooler than skin temperature with a maximum of 31 °C / 87.8 F and are therefore cool to the touch.
(-) The average temperature of the palmrest area of similar devices was 27.8 °C / 82 F (-3.2 °C / -5.8 F).
Stress Test
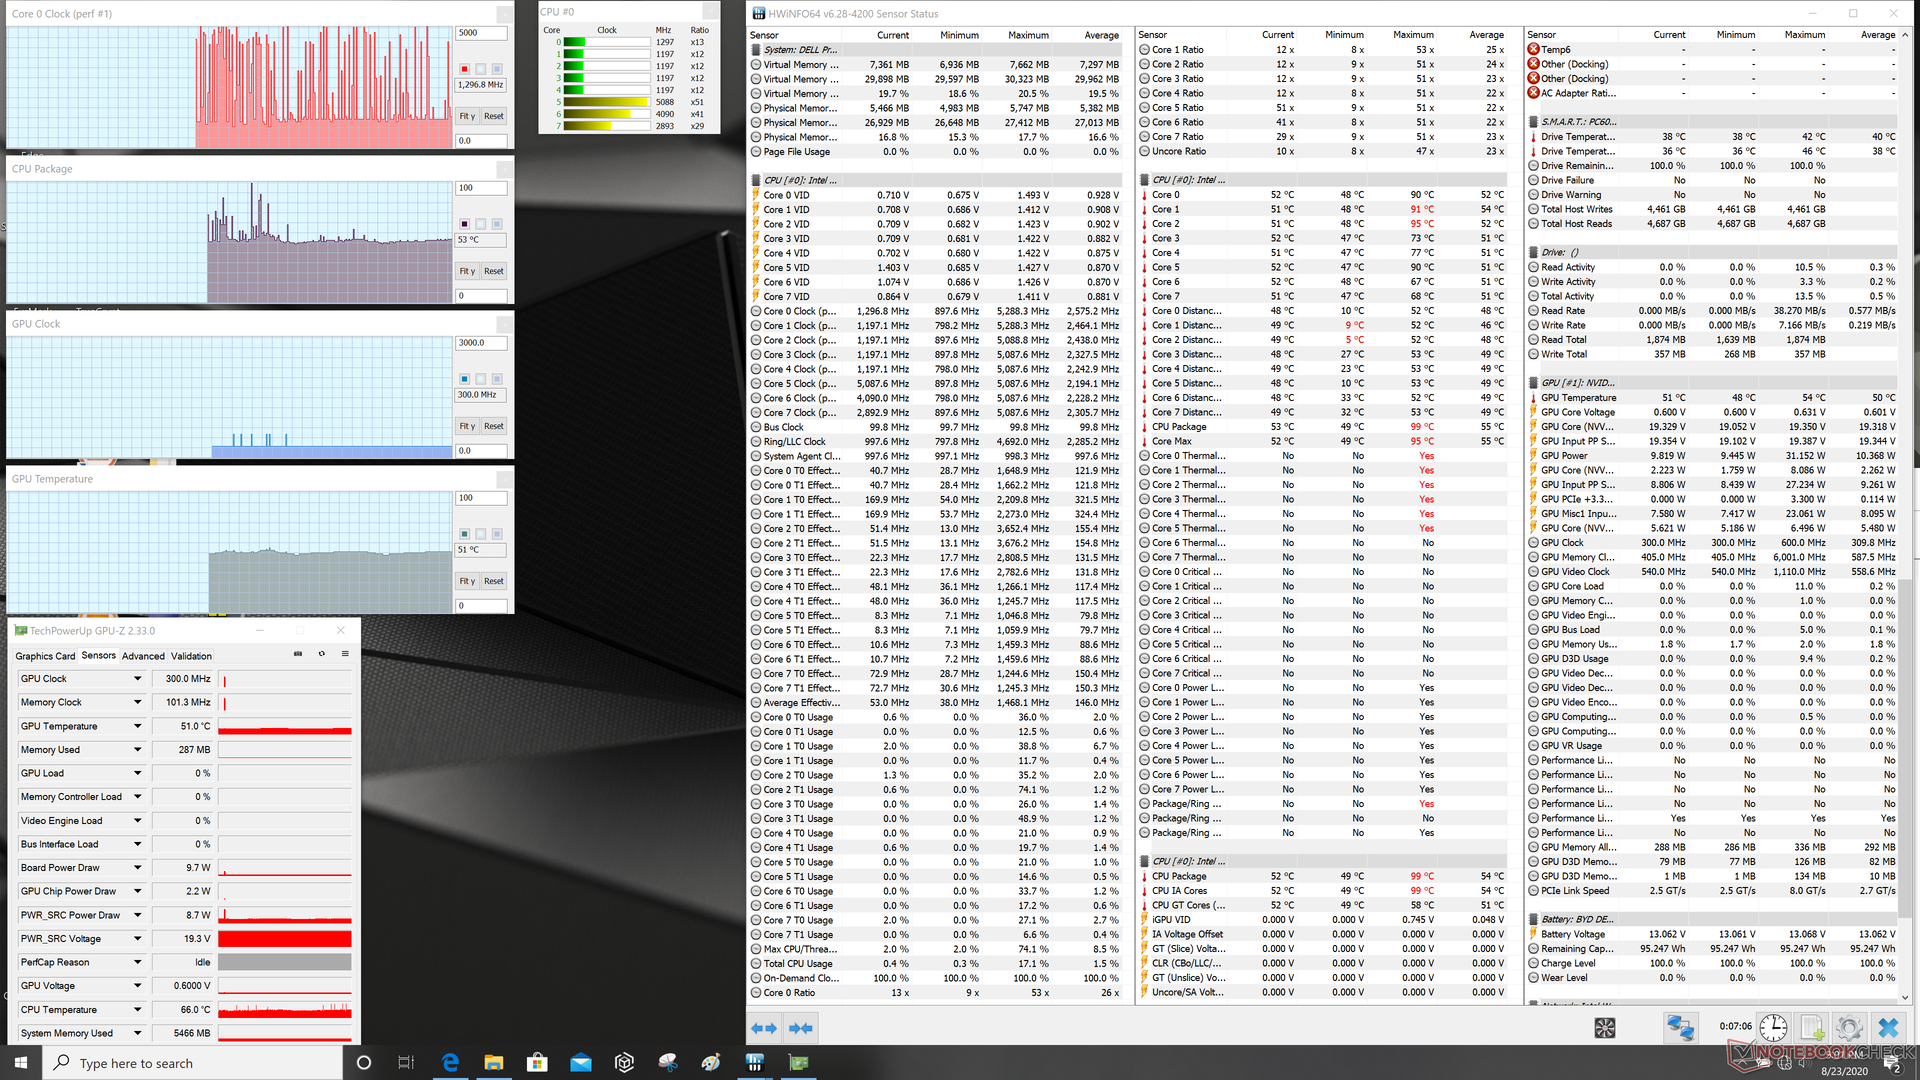
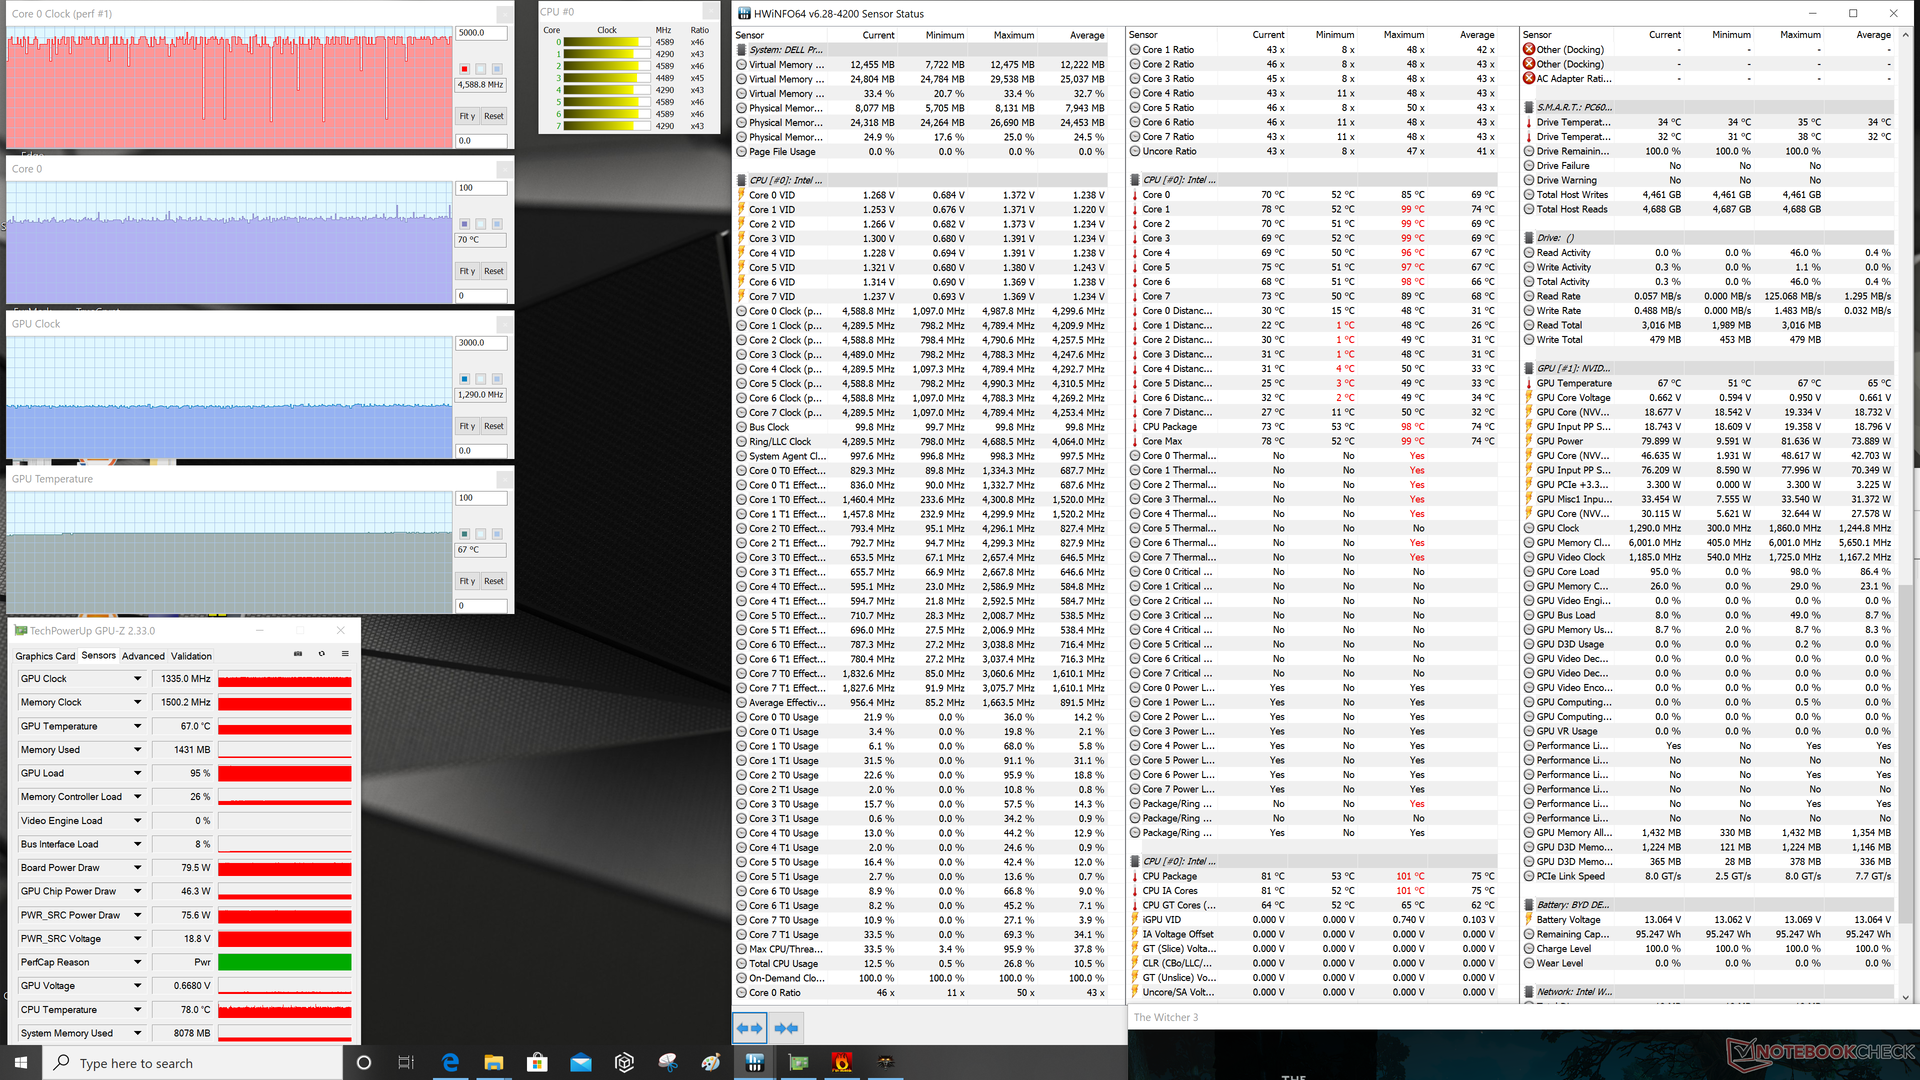
We stress the system with synthetic loads to identify for any potential throttling or stability issues. When running Prime95, the CPU can be observed boosting to 4.3 GHz for just the first couple of seconds until core temperature hits 99 C. Thereafter, clock rates would drop and stabilize at around 3.6 to 3.7 GHz in order to maintain a slightly cooler core temperature of 90 to 95 C. Dell likes to run its processors at higher temperatures than most other laptops based on what we've observed on the XPS and Alienware series and now the Precision series.
Heavy loads like gaming will cause CPU and GPU temperatures to stabilize at around 73 C and 67 C, respectively.
Running on battery power will limit performance. A Fire Strike test on batteries would return Physics and Graphics scores of 15371 and 10249 points, respectively, compared to 22279 and 19342 points when on mains.
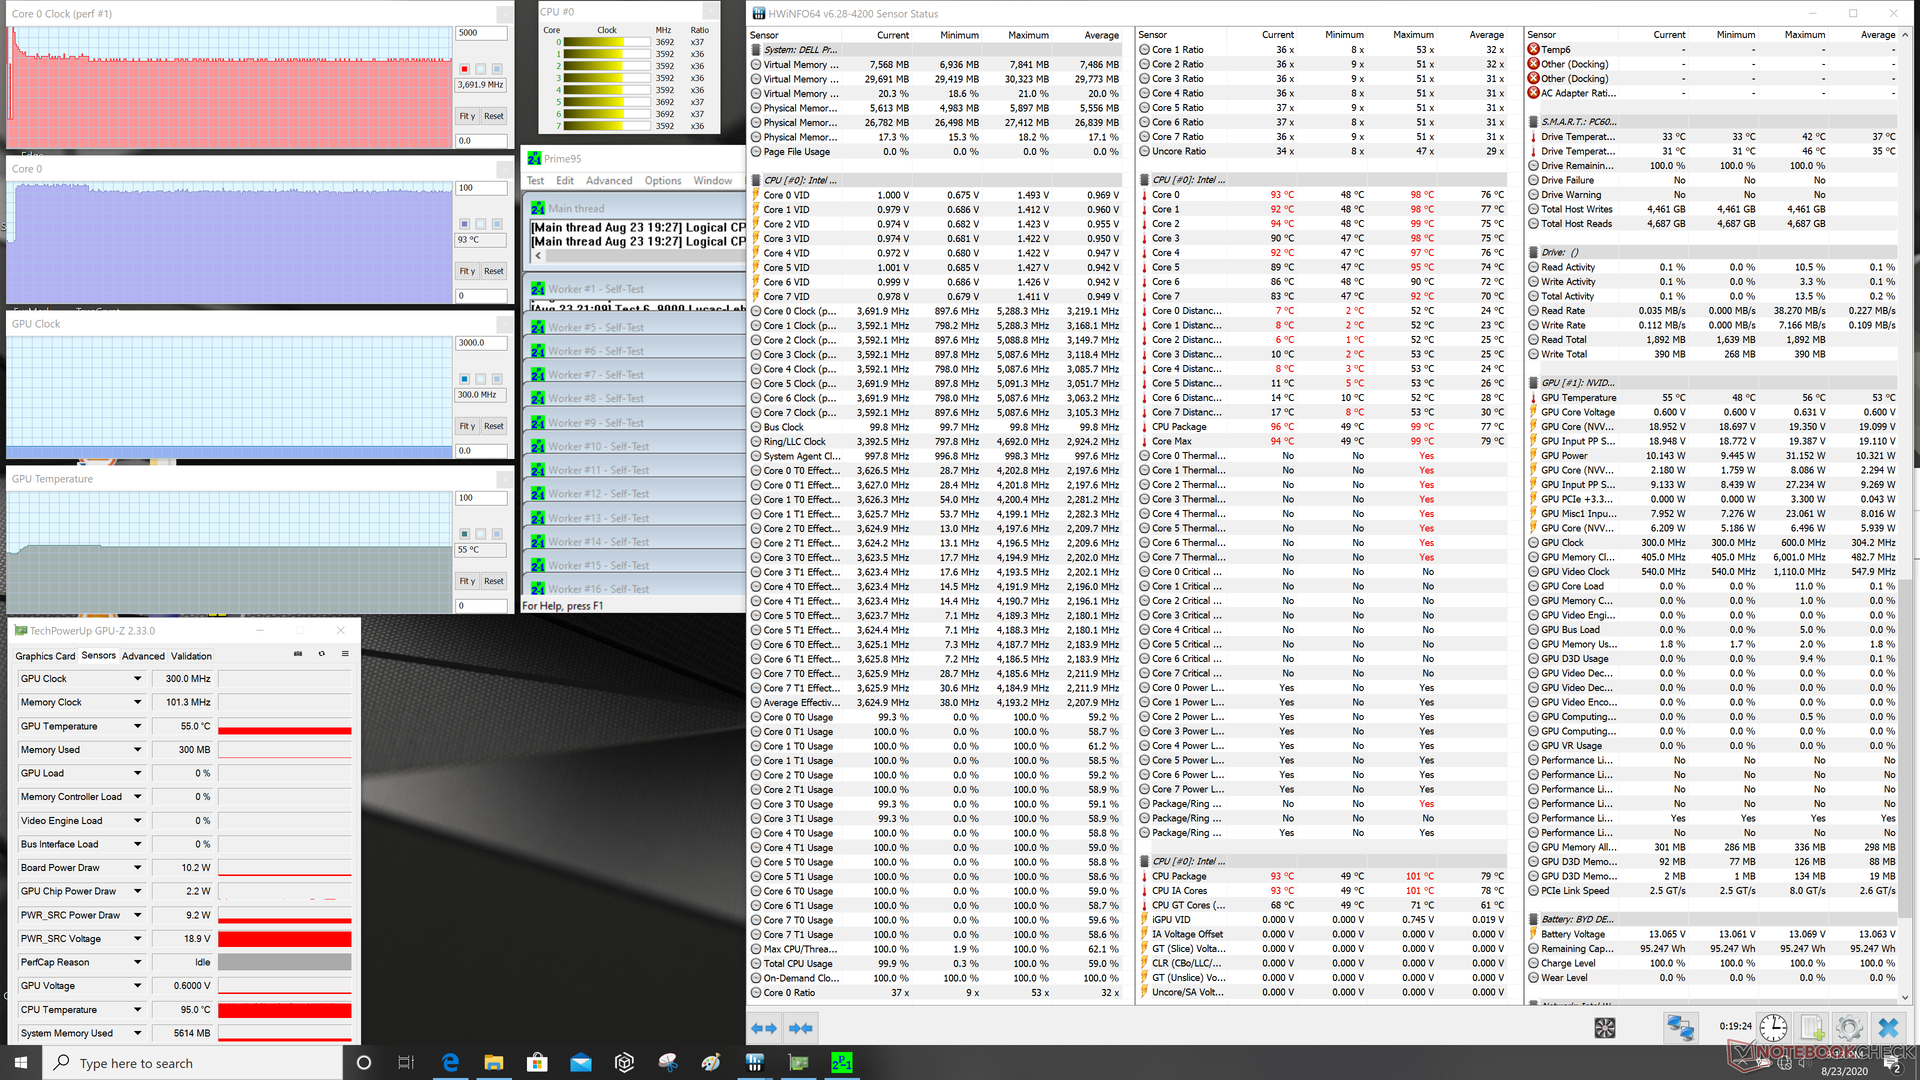
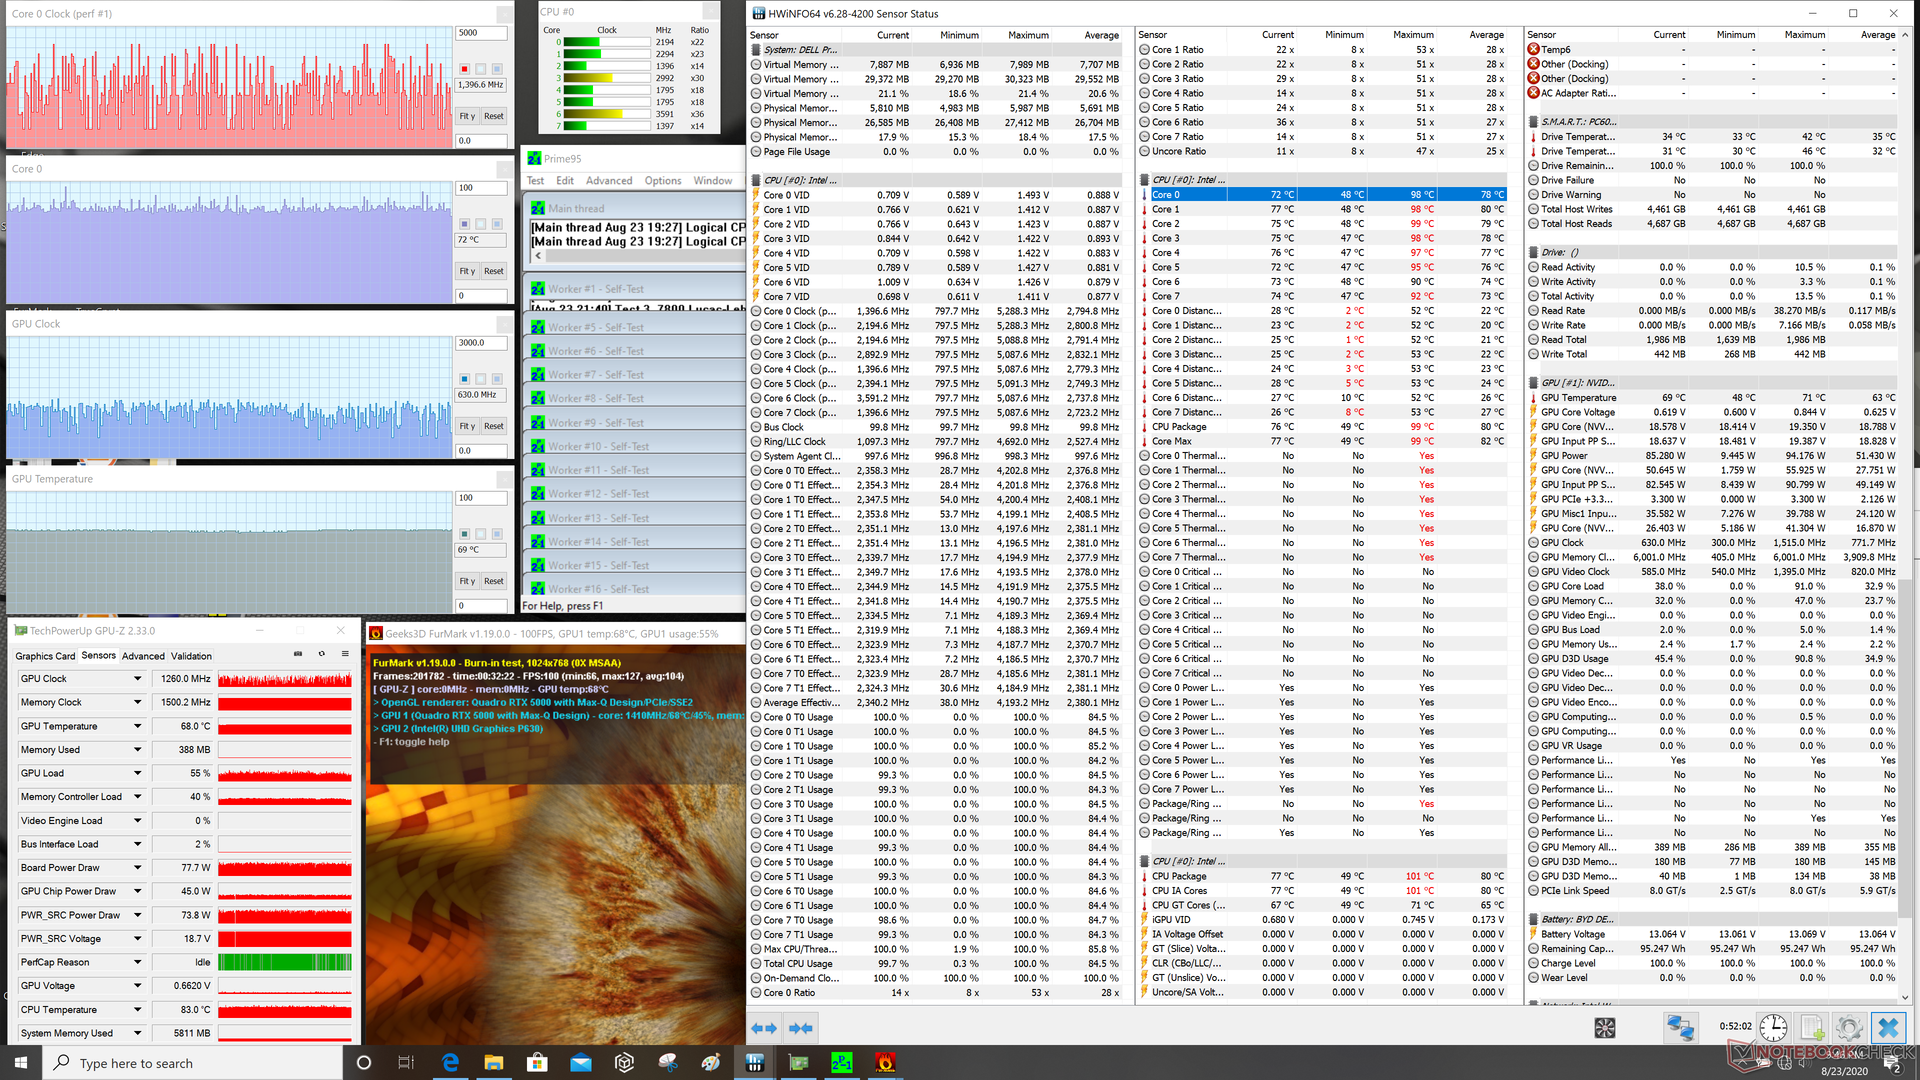
| CPU Clock (GHz) | GPU Clock (MHz) | Average CPU Temperature (°C) | Average GPU Temperature (°C) | |
| System Idle | -- | -- | 53 | 51 |
| Prime95 Stress | 3.6 - 3.7 | -- | 96 | 55 |
| Prime95 + FurMark Stress | 0.8 - 4.3 | ~630 - ~1260 | 76 | 68 |
| Witcher 3 Stress | ~4.4 | 1335 | 73 | 67 |
Speakers

Dell Precision 7550 audio analysis
(+) | speakers can play relatively loud (83.6 dB)
Bass 100 - 315 Hz
(±) | reduced bass - on average 11.5% lower than median
(±) | linearity of bass is average (11.6% delta to prev. frequency)
Mids 400 - 2000 Hz
(±) | higher mids - on average 5.7% higher than median
(+) | mids are linear (4.5% delta to prev. frequency)
Highs 2 - 16 kHz
(+) | balanced highs - only 3.2% away from median
(+) | highs are linear (5.4% delta to prev. frequency)
Overall 100 - 16.000 Hz
(+) | overall sound is linear (12.6% difference to median)
Compared to same class
» 21% of all tested devices in this class were better, 4% similar, 75% worse
» The best had a delta of 7%, average was 17%, worst was 35%
Compared to all devices tested
» 11% of all tested devices were better, 2% similar, 86% worse
» The best had a delta of 4%, average was 24%, worst was 134%
Apple MacBook 12 (Early 2016) 1.1 GHz audio analysis
(+) | speakers can play relatively loud (83.6 dB)
Bass 100 - 315 Hz
(±) | reduced bass - on average 11.3% lower than median
(±) | linearity of bass is average (14.2% delta to prev. frequency)
Mids 400 - 2000 Hz
(+) | balanced mids - only 2.4% away from median
(+) | mids are linear (5.5% delta to prev. frequency)
Highs 2 - 16 kHz
(+) | balanced highs - only 2% away from median
(+) | highs are linear (4.5% delta to prev. frequency)
Overall 100 - 16.000 Hz
(+) | overall sound is linear (10.2% difference to median)
Compared to same class
» 7% of all tested devices in this class were better, 2% similar, 91% worse
» The best had a delta of 5%, average was 18%, worst was 53%
Compared to all devices tested
» 5% of all tested devices were better, 1% similar, 94% worse
» The best had a delta of 4%, average was 24%, worst was 134%
Energy Management
Power Consumption
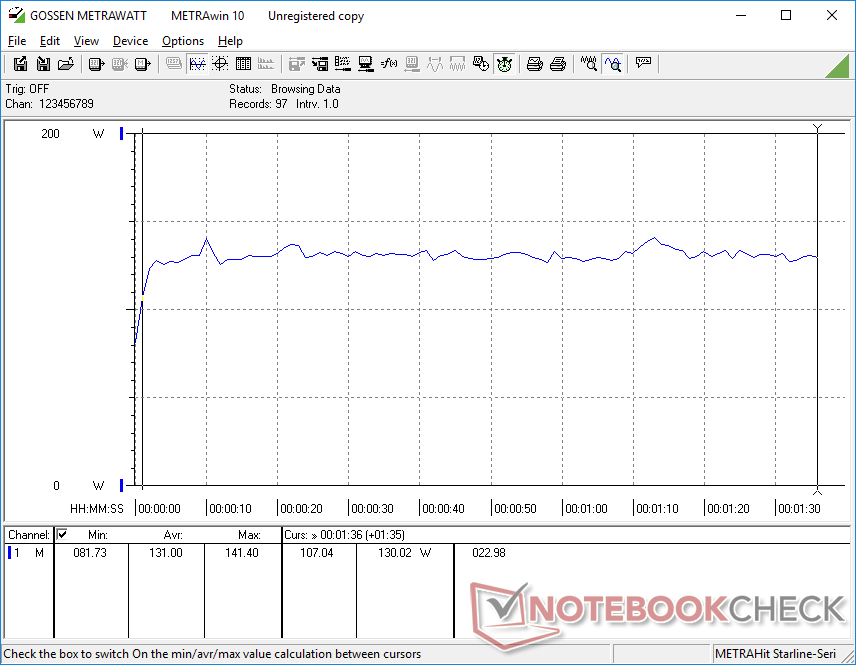
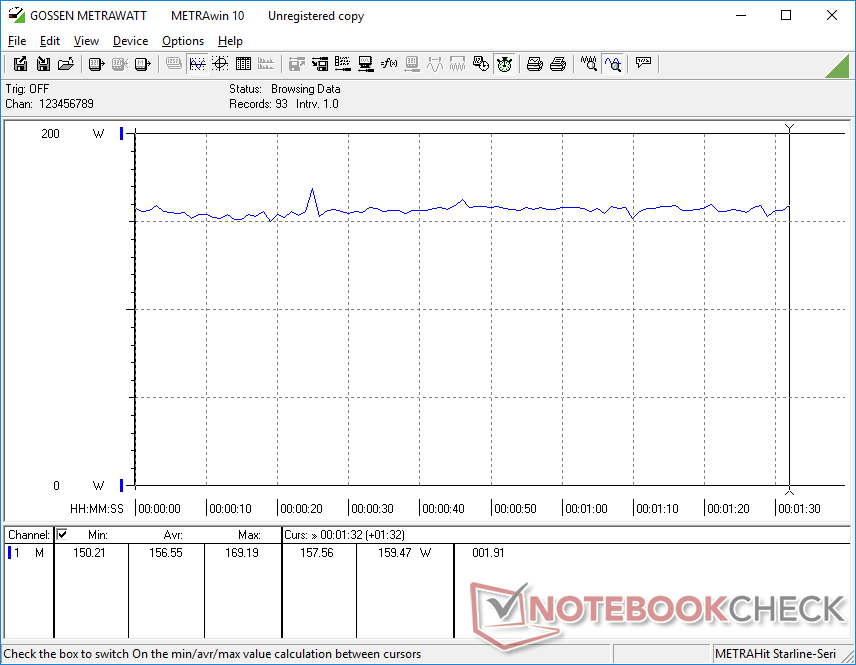
The Precision 7550 is a power-hungry machine. Idling on desktop draws about 8 W or up to 25 W if the dedicated GPU is active. When running high loads like Witcher 3, average power consumption comes out to be 157 W compared to half that on lesser workstations with slower T2000 or P1000 GPUs as shown by the table below.
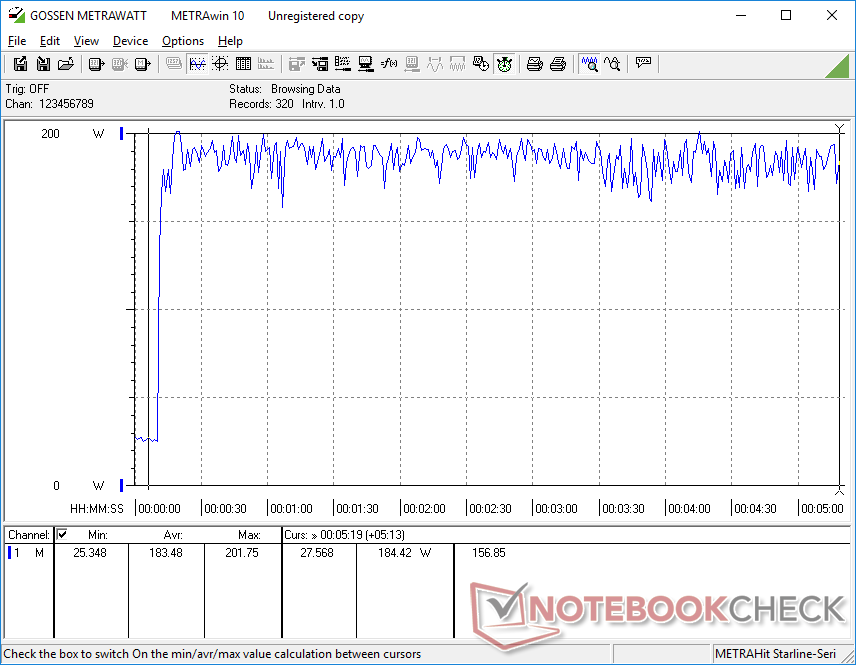
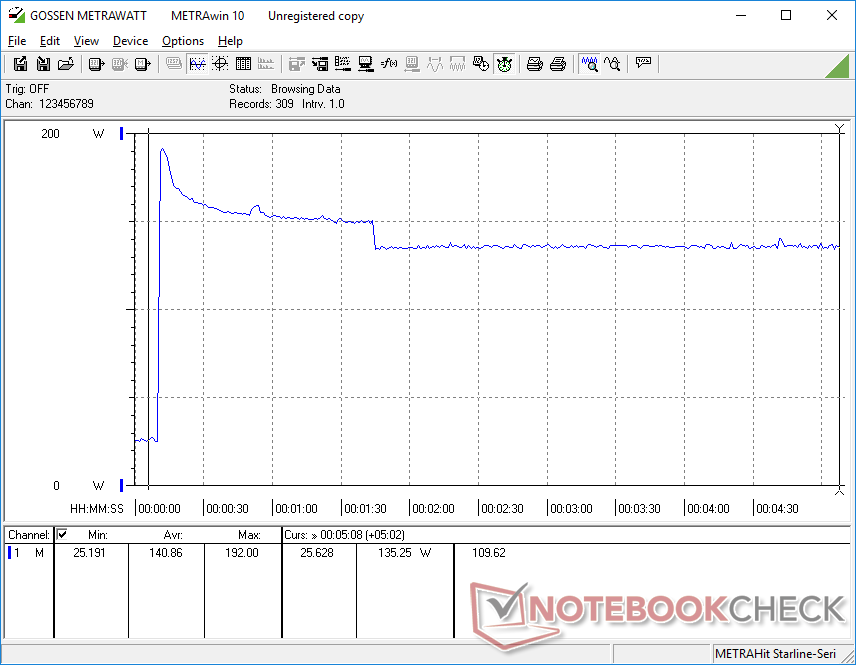
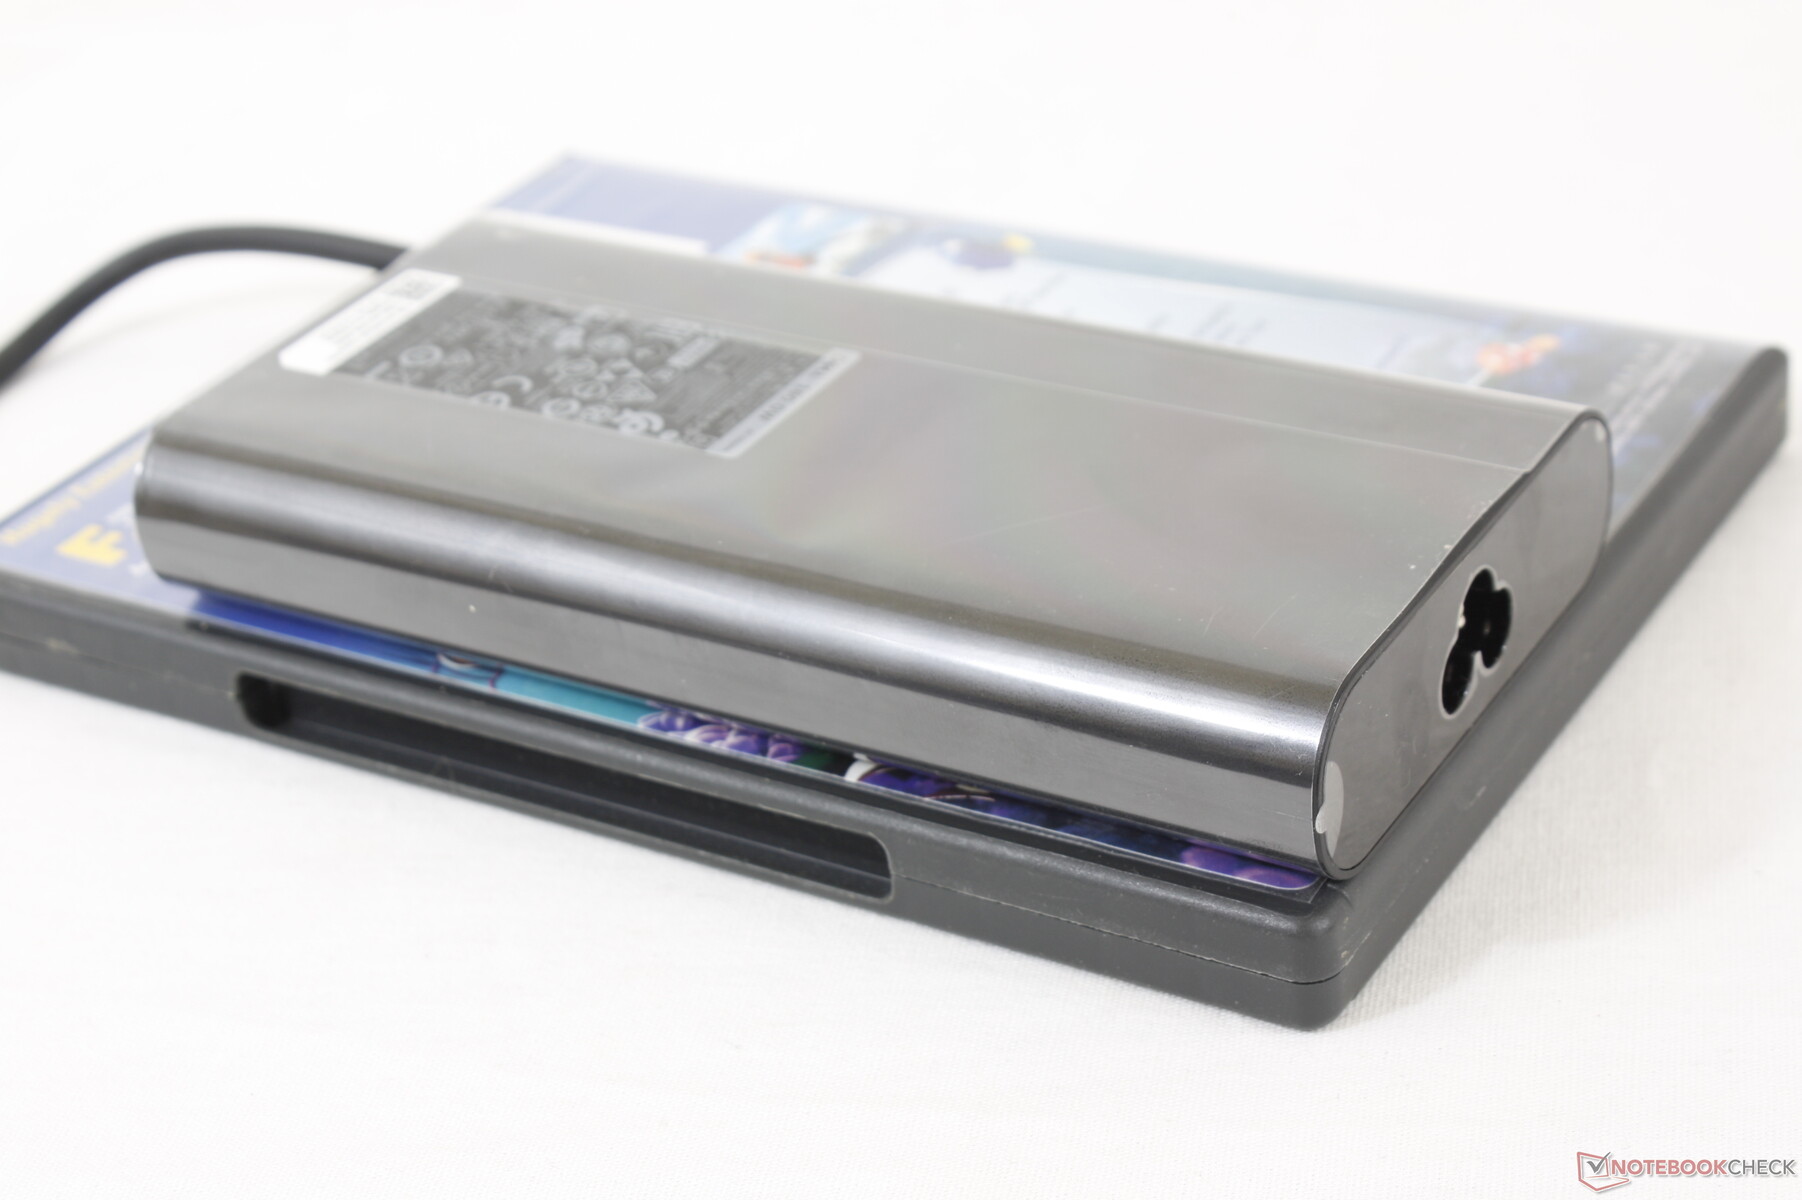
We're able to measure a maximum consumption of 201.8 W from the small-medium (~15 x 7.5 x 2.3 cm) 180 W AC adapter. Consumption remains relatively steady at about 180 W when subjected to extreme processing stress as shown by our graph below meaning that charging rate will slow if running such high loads.
| Off / Standby | |
| Idle | |
| Load |
|
Key:
min: | |
| Dell Precision 7550 W-10885M, Quadro RTX 5000 Max-Q, SK Hynix PC601A NVMe 1TB, IPS, 3840x2160, 15.6" | Dell Precision 7540 i9-9980HK, Quadro RTX 3000 (Laptop), SK hynix PC400 512 GB, , 3840x2160, 15.6" | Dell Precision 5550 P91F i7-10875H, Quadro T2000 Max-Q, SK Hynix PC601A NVMe 1TB, IPS, 3840x2400, 15.6" | Acer ConceptD 3 Pro CN315-71P-73W1 i7-9750H, Quadro T1000 (Laptop), WDC PC SN720 SDAPNTW-512G, IPS, 1920x1080, 15.6" | Lenovo ThinkPad P53-20QN000YGE i7-9850H, Quadro RTX 5000 Max-Q, Samsung PM981a MZVLB1T0HBLR, IPS, 1920x1080, 15.6" | HP ZBook Studio G5-4QH10EA i7-8750H, Quadro P1000, Samsung SSD PM981 MZVLB512HAJQ, IPS LED, 3840x2160, 15.6" | Acer ConceptD 9 Pro i9-9980HK, Quadro RTX 5000 (Laptop), WDC PC SN720 SDAQNTW-1T00, IPS, 3840x2160, 17.3" | |
|---|---|---|---|---|---|---|---|
| Power Consumption | 11% | 31% | 53% | 17% | 38% | -42% | |
| Idle Minimum * (Watt) | 8.2 | 8.4 -2% | 5.6 32% | 2.9 65% | 7.9 4% | 6.8 17% | 18.8 -129% |
| Idle Average * (Watt) | 16.8 | 15.4 8% | 11.2 33% | 5.5 67% | 11.8 30% | 11.3 33% | 25 -49% |
| Idle Maximum * (Watt) | 24.4 | 17.4 29% | 18.4 25% | 10.6 57% | 14.9 39% | 14.3 41% | 30 -23% |
| Load Average * (Watt) | 131 | 126 4% | 114 13% | 86 34% | 96 27% | 78 40% | 116 11% |
| Witcher 3 ultra * (Watt) | 156.6 | 143 9% | 76.7 51% | 83 47% | 149 5% | 64 59% | 221 -41% |
| Load Maximum * (Watt) | 201.8 | 170 16% | 134.2 33% | 100.7 50% | 207.8 -3% | 126 38% | 241 -19% |
* ... smaller is better
Battery Life
Runtimes from the large 95 Wh battery is respectable at almost 9 hours of real-world WLAN use. The catch is that users must run on the integrated Intel GPU or else battery life will plummet. SKUs with smaller 68 Wh batteries are available.
Charging from empty to full capacity takes about 2 hours. The system can also be recharged via USB-C.
| Dell Precision 7550 W-10885M, Quadro RTX 5000 Max-Q, 95 Wh | Dell Precision 7540 i9-9980HK, Quadro RTX 3000 (Laptop), Wh | Dell Precision 5550 P91F i7-10875H, Quadro T2000 Max-Q, 86 Wh | Acer ConceptD 3 Pro CN315-71P-73W1 i7-9750H, Quadro T1000 (Laptop), 58.7 Wh | Lenovo ThinkPad P53-20QN000YGE i7-9850H, Quadro RTX 5000 Max-Q, 90 Wh | HP ZBook Studio G5-4QH10EA i7-8750H, Quadro P1000, 97 Wh | |
|---|---|---|---|---|---|---|
| Battery runtime | -19% | 48% | -9% | 63% | 62% | |
| Reader / Idle (h) | 11.1 | 22.6 104% | 17.3 56% | |||
| WiFi v1.3 (h) | 8.9 | 7.2 -19% | 9 1% | 8.1 -9% | 11.1 25% | 9.7 9% |
| Load (h) | 1 | 1.4 40% | 2 100% | 2.2 120% |
Pros
Cons
Verdict
Unlike a lot of newer workstations these days, the Precision 7550 isn't afraid to be big and bulky in order to carry greater features and hardware that demanding workstation users expect. You're just not going to find useful auxiliary options like WAN, Smart Card reader, 4x SODIMM slots, dedicated mouse buttons, full-size NumPad keys, or triple M.2 storage bays on ultra-thin workstations like the Precision 5550, MSI WS66, Razer Blade 15 Studio, or the Asus StudioBook Pro 15. To some users, these extras may be well worth the gain in girth.
The main drawback to the system is that it utilizes Quadro Max-Q GPUs instead of the full-power non-Max-Q variants despite the thick chassis profile and heavy weight. Competing systems like the Acer ConceptD 9 Pro prove that the full-power RTX Quadro 5000 can offer at least 30 percent faster performance than the Quadro RTX 5000 Max-Q in our Dell. We suspect that there is no full-power Quadro RTX 5000 option here because the 180 W AC adapter would be a limiting factor. Thus, graphics performance is about the same as the aforementioned MSI WS66, Razer Blade 15 Studio, or Asus which are all significantly more compact than the Precision 7550.
The substantial Precision 7550 is an attractive workstation if you value its optional hardware features and expandability. If not, then you can get essentially the same raw performance from newer Nvidia Studio workstations that are a fraction of the size and weight.
Dell Precision 7550
- 08/28/2020 v7 (old)
Allen Ngo
Price comparison
