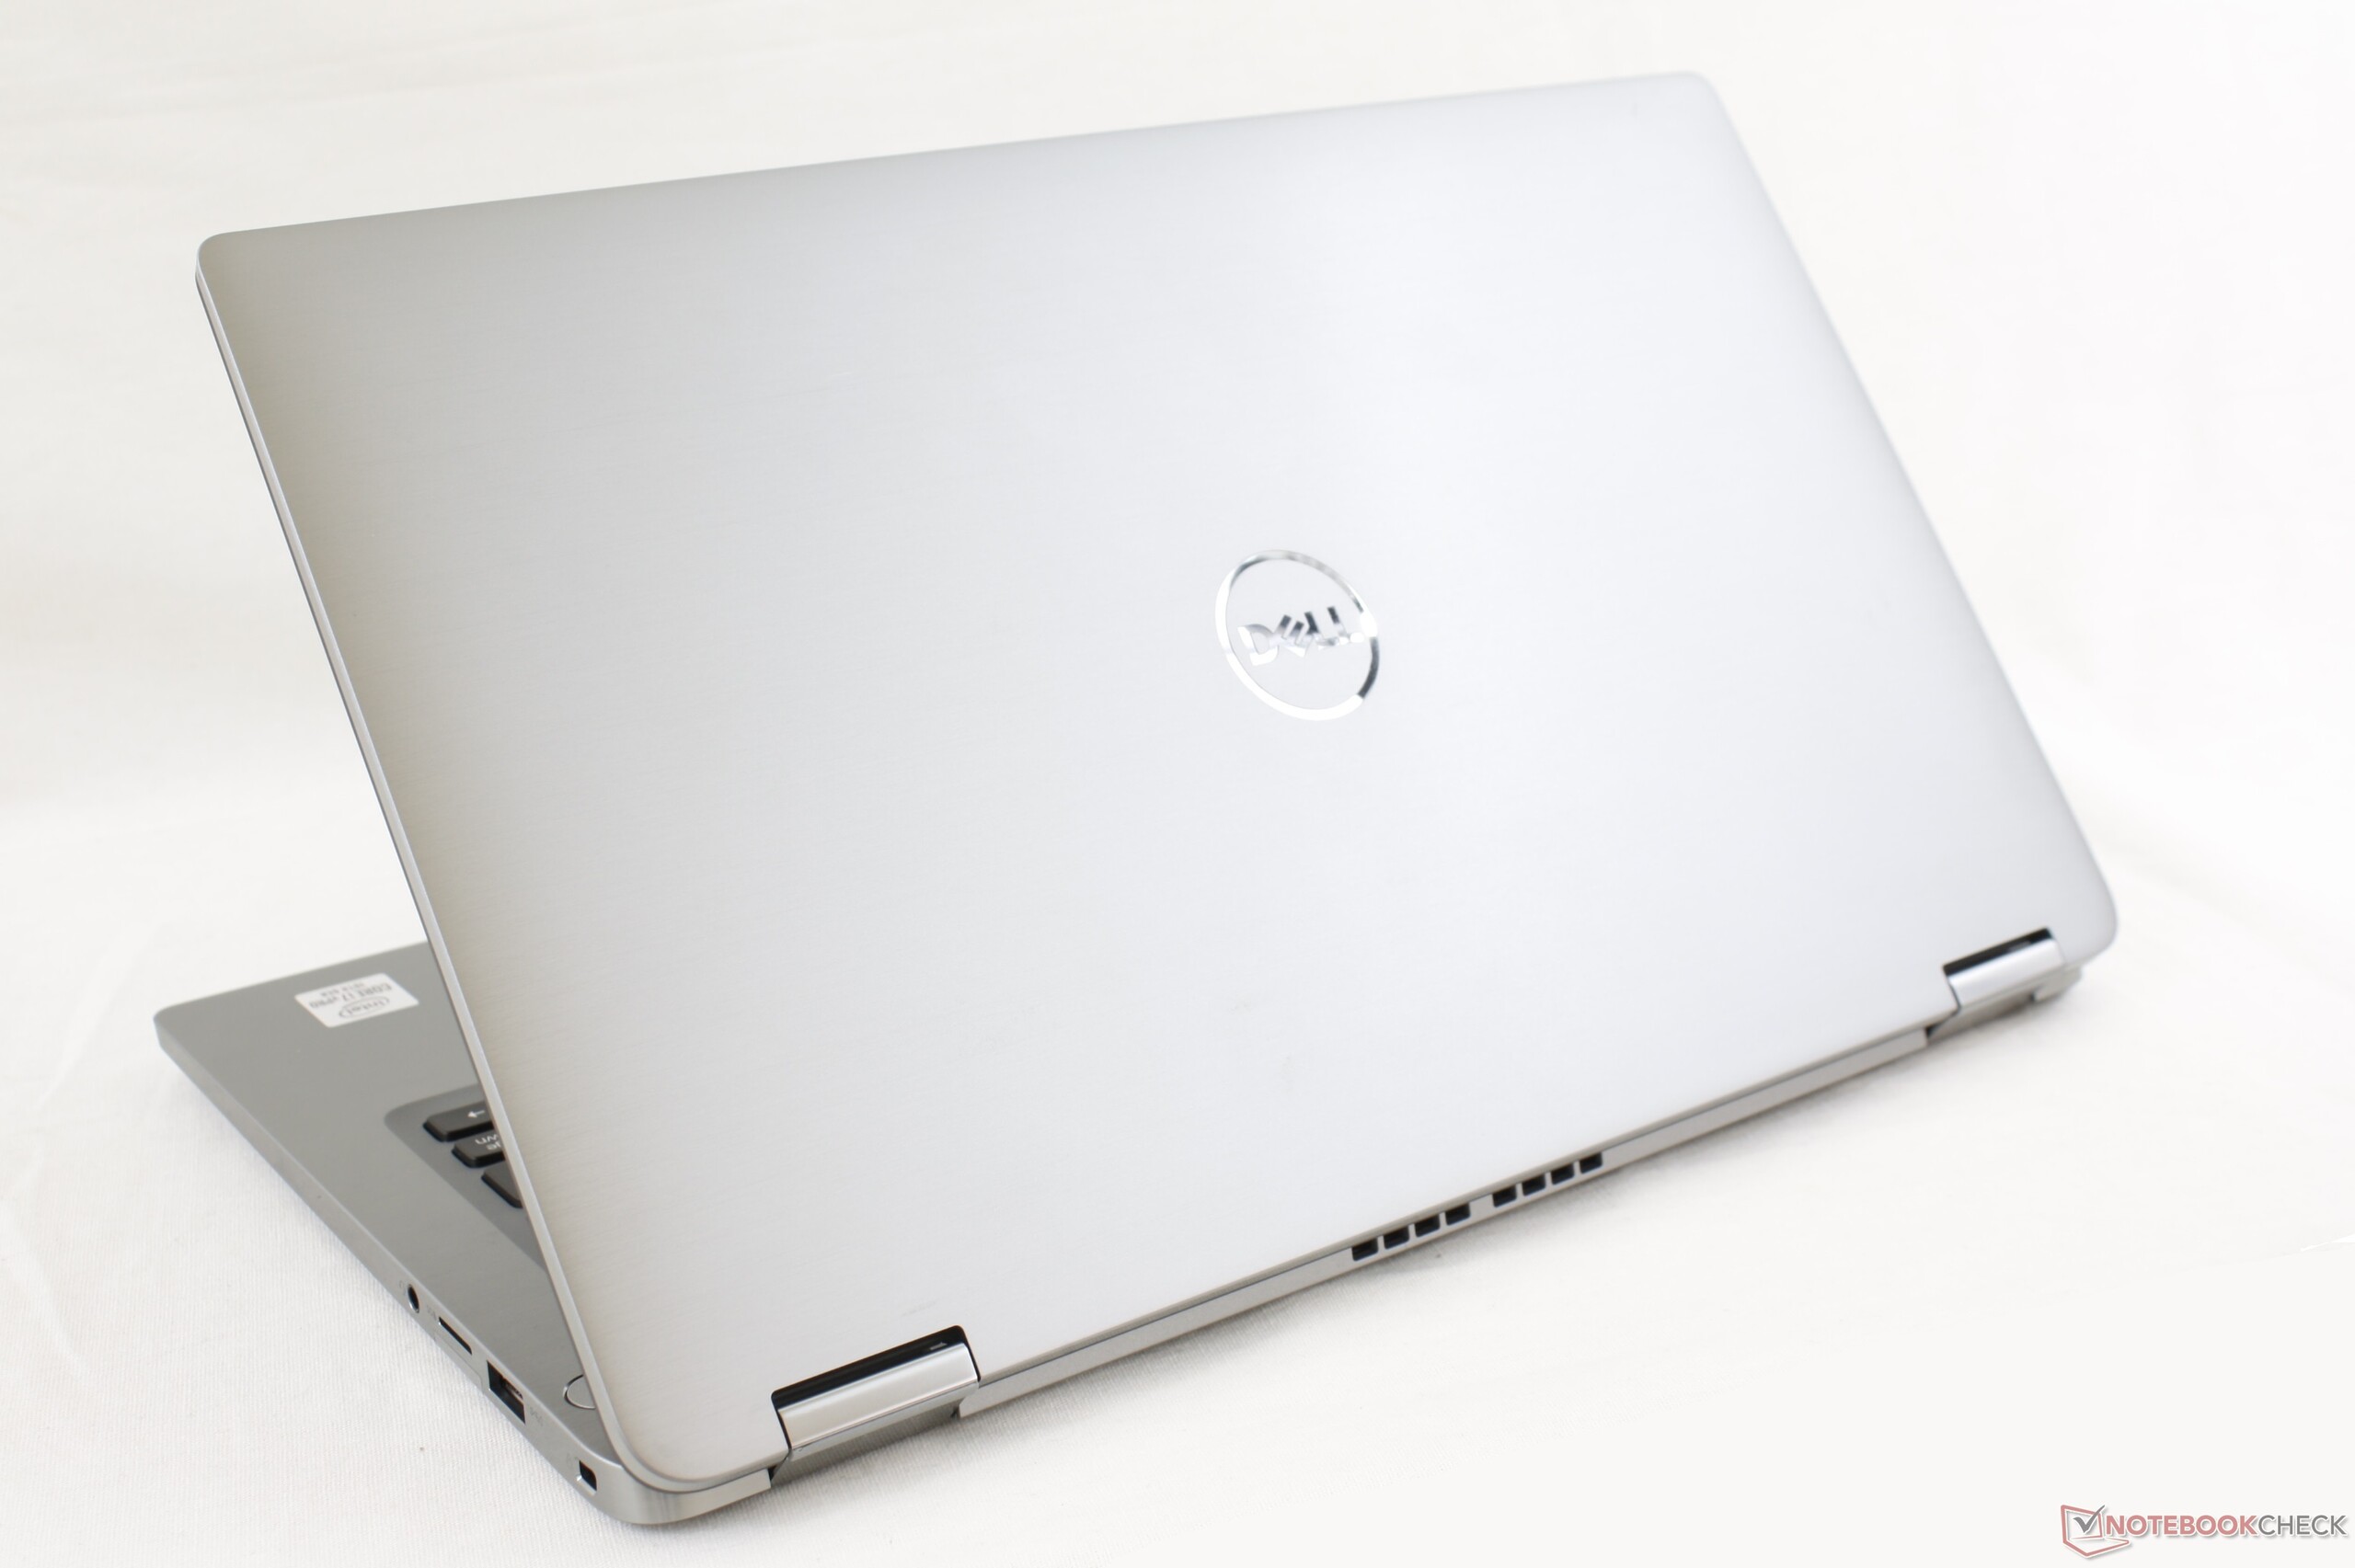
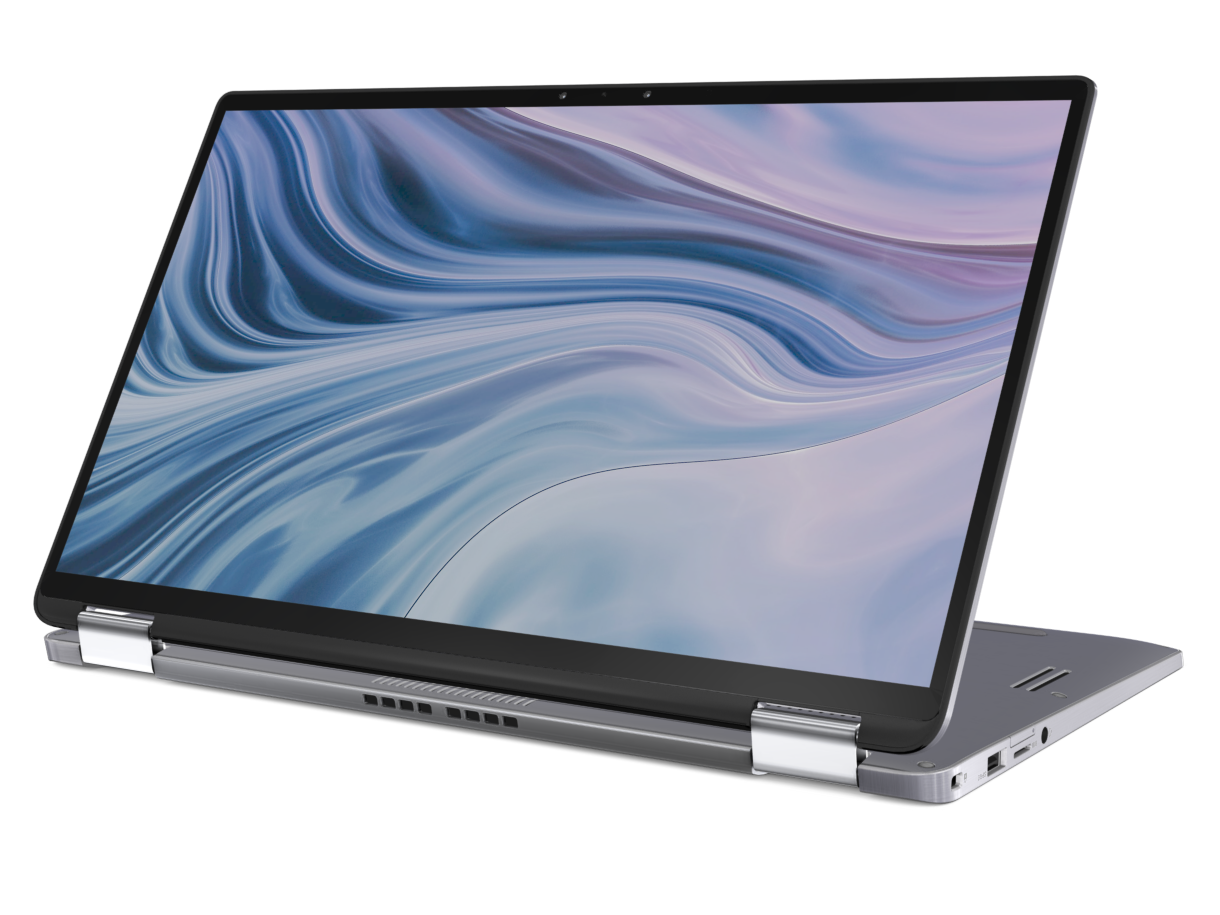
Dell Latitude 14 9410 2-in-1 Convertible Review: A Latitude 7400 At Heart
Earlier this year, Dell introduced its Latitude 9000 series of ultra-thin high-end business laptops that were advertised to be even sleeker and better than the Latitude 7000 series. In reality, however, Dell sort of just renamed the existing Latitude 7400 2-in-1 into the Latitude 9410 2-in-1 and then called it a day because both of these systems share nearly same chassis design and internals. The older Whiskey Lake-U CPUs have been upgraded to Comet Lake-U, but not much else has changed. Thus, the 2020 Latitude 9410 2-in-1 can be viewed as a minor update to the 2019 Latitude 7400 2-in-1.
We recommend checking out our review on the Latitude 7400 2-in-1 for more information on the chassis and its physical features since many of our comments apply here on the Latitude 9410 2-in-1. Direct competitors include other flagship 14-inch subnotebook convertibles like the Lenovo Yoga C940, Asus ZenBook Flip 14 or HP EliteBook x360 1040.
More Dell reviews:
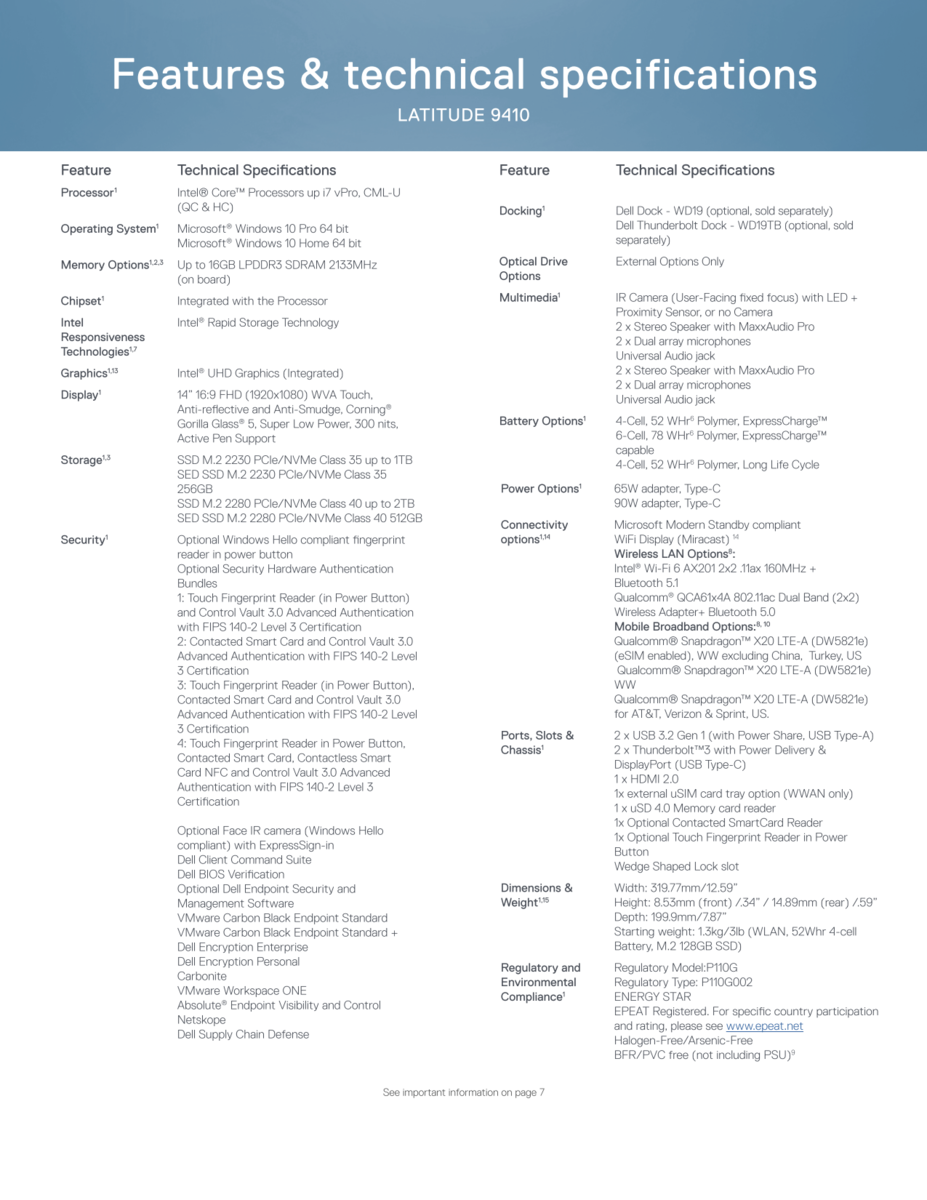
Rating | Date | Model | Weight | Height | Size | Resolution | Price |
|---|---|---|---|---|---|---|---|
| 88.7 % v7 (old) | 08 / 2020 | Dell Latitude 14 9410 2-in-1 P110G i7-10610U, UHD Graphics 620 | 1.5 kg | 14.89 mm | 14.00" | 1920x1080 | |
| 88.2 % v7 (old) | 10 / 2019 | Lenovo Yoga C940-14IIL i7-1065G7, Iris Plus Graphics G7 (Ice Lake 64 EU) | 1.4 kg | 14.95 mm | 14.00" | 1920x1080 | |
| 81.2 % v7 (old) | 04 / 2020 | LG Gram 14T90N i7-10510U, UHD Graphics 620 | 1.2 kg | 18 mm | 14.00" | 1920x1080 | |
| 90.5 % v7 (old) | 02 / 2019 | HP Elitebook x360 1040 G5 i7-8650U, UHD Graphics 620 | 1.4 kg | 16.9 mm | 14.00" | 1920x1080 | |
| 87.8 % v7 (old) | 06 / 2019 | Dell Latitude 7400 2-in-1 i7-8665U, UHD Graphics 620 | 1.5 kg | 15 mm | 14.00" | 1920x1080 | |
| 85 % v7 (old) | 05 / 2020 | Asus ZenBook Flip 14 UX463FA-AI039T i5-10210U, UHD Graphics 620 | 1.4 kg | 18 mm | 14.00" | 1920x1080 |
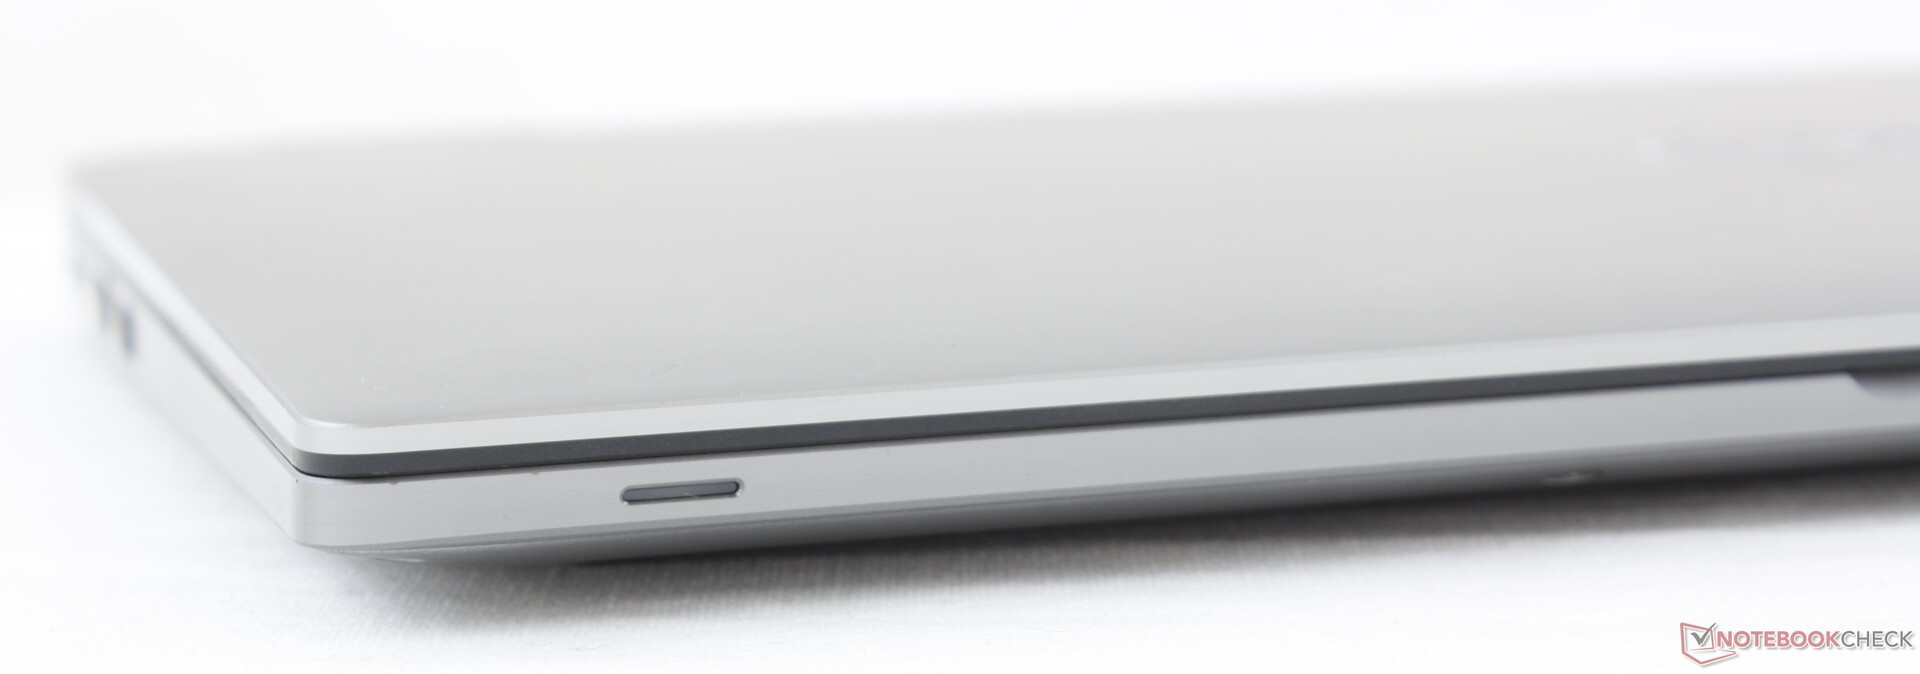
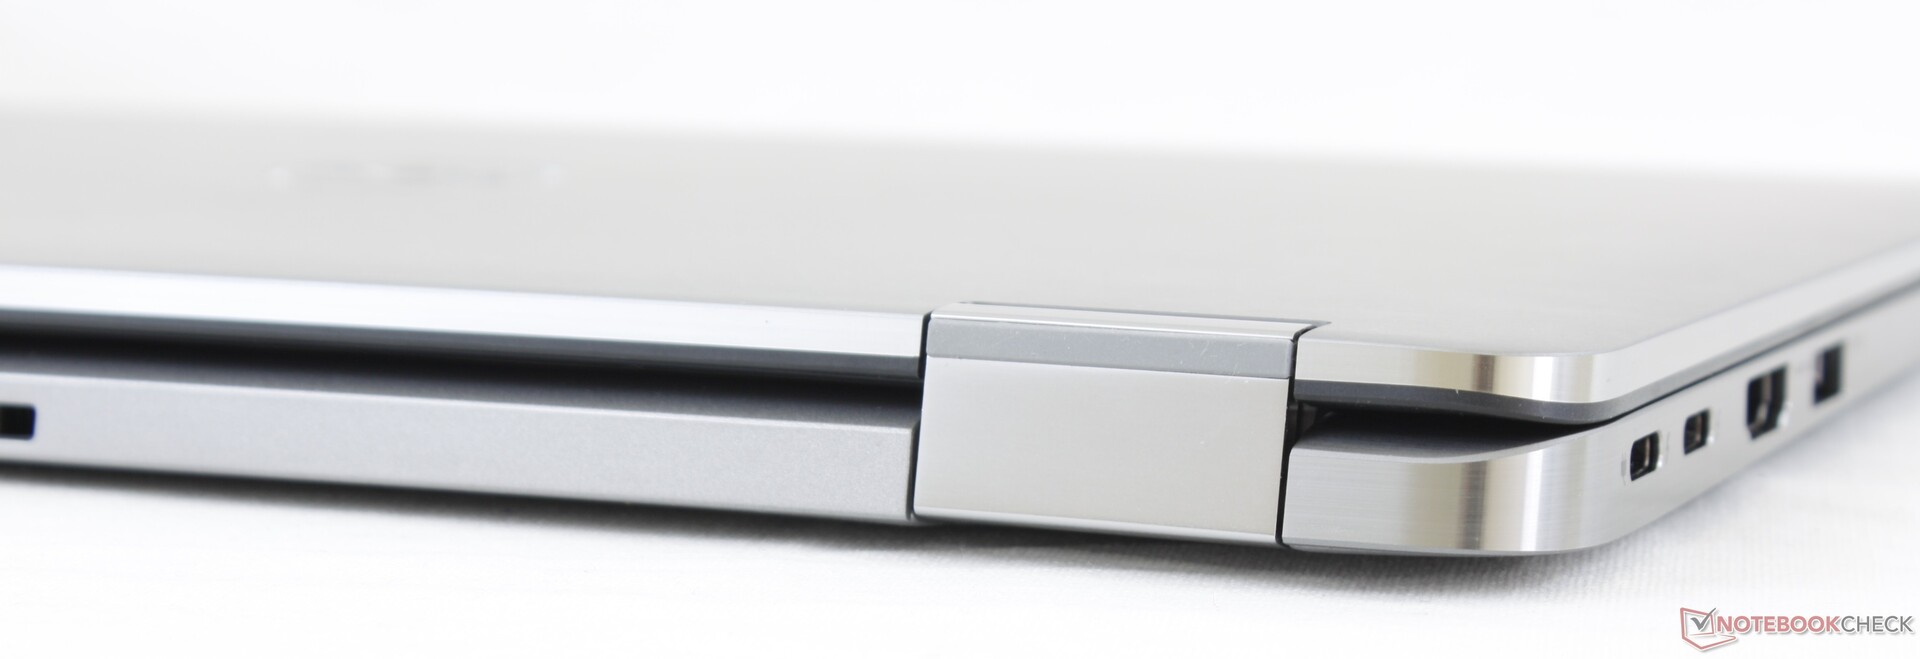
Case
Much like what we observed on the Latitude 7400 2-in-1, the Latitude 9410 2-in-1 remains one of the strongest ultra-thin business laptops in Dell's Latitude lineup in terms of rigidity and design. We can notice no creaking when twisting the metal base or lid and only minimal warping. It may not be a brand new look, but it continues to be marginally smaller than many alternatives including the HP EliteBook x360 1040, Lenovo Yoga C940, or Asus ZenBook Flip 14 while weighing almost the same.
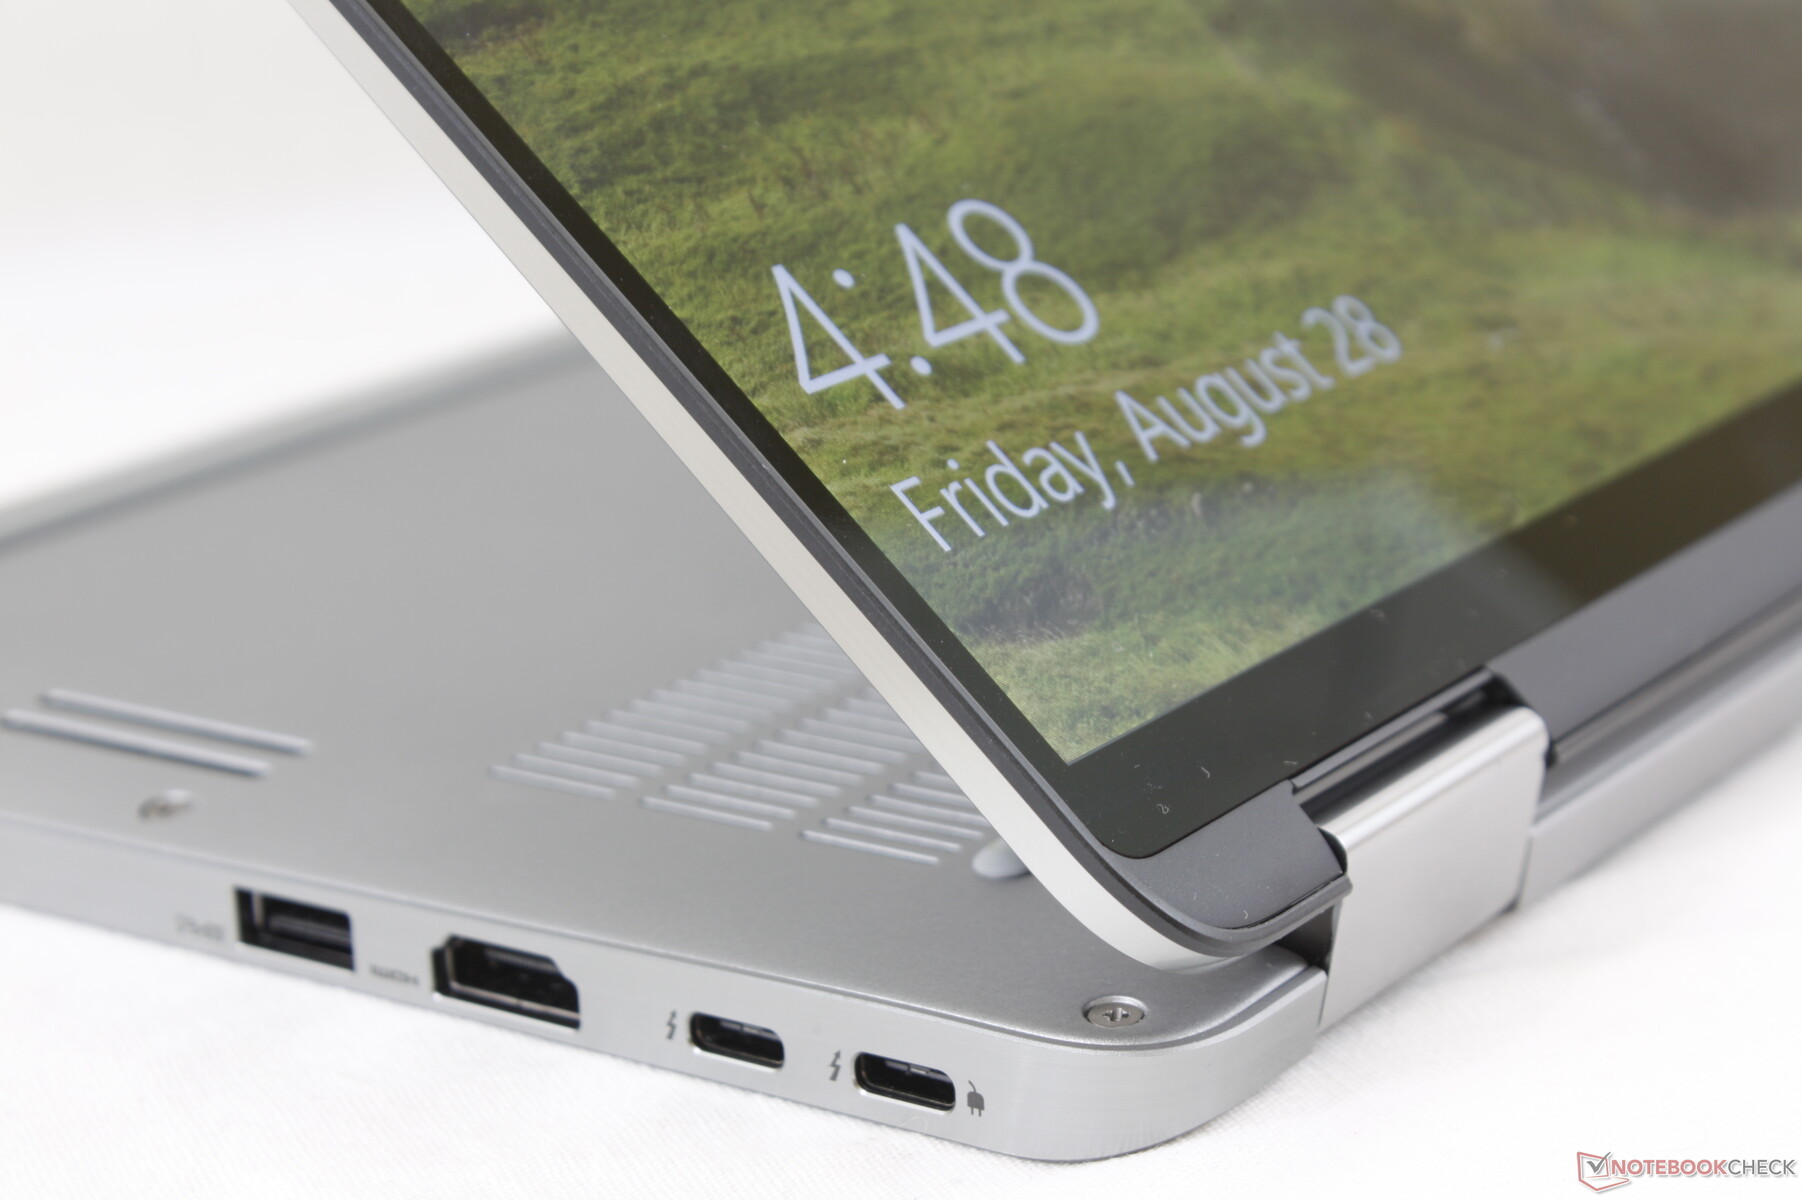
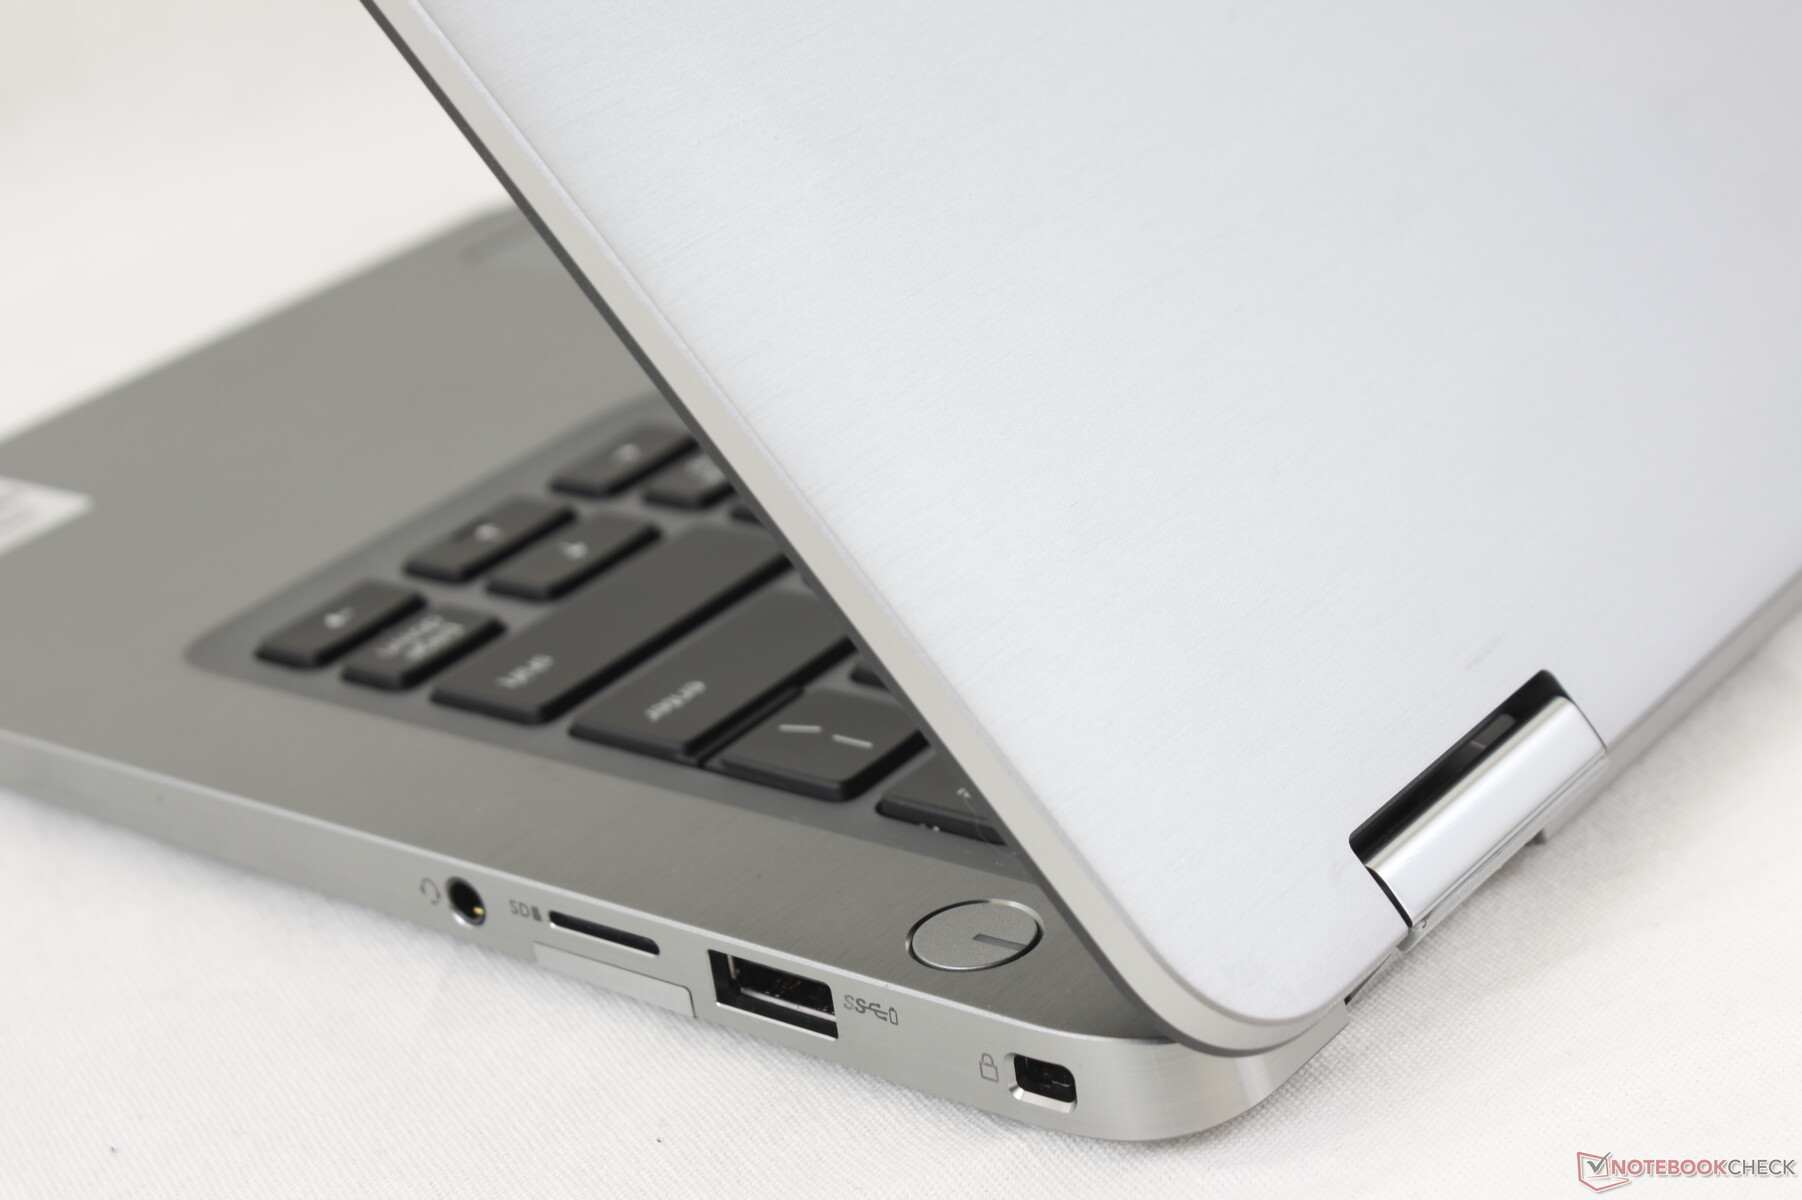
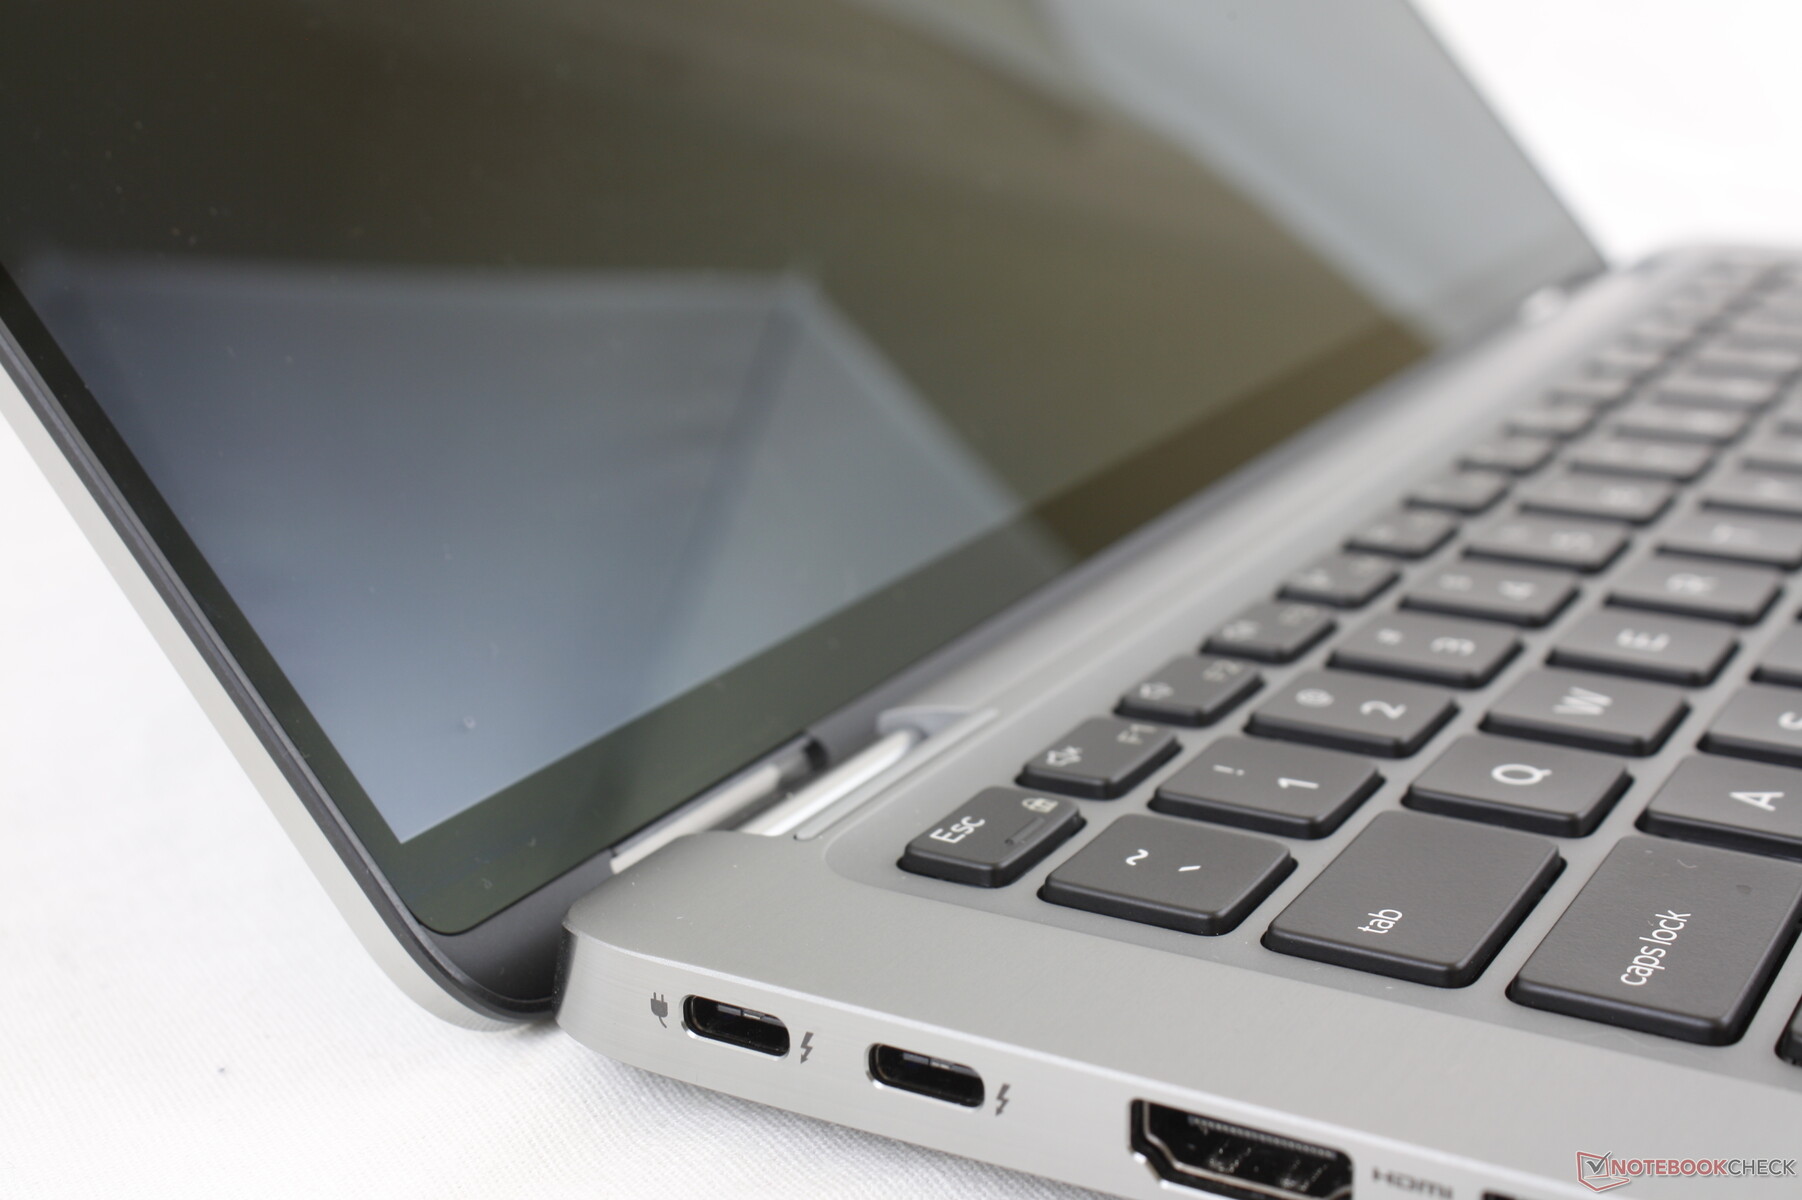
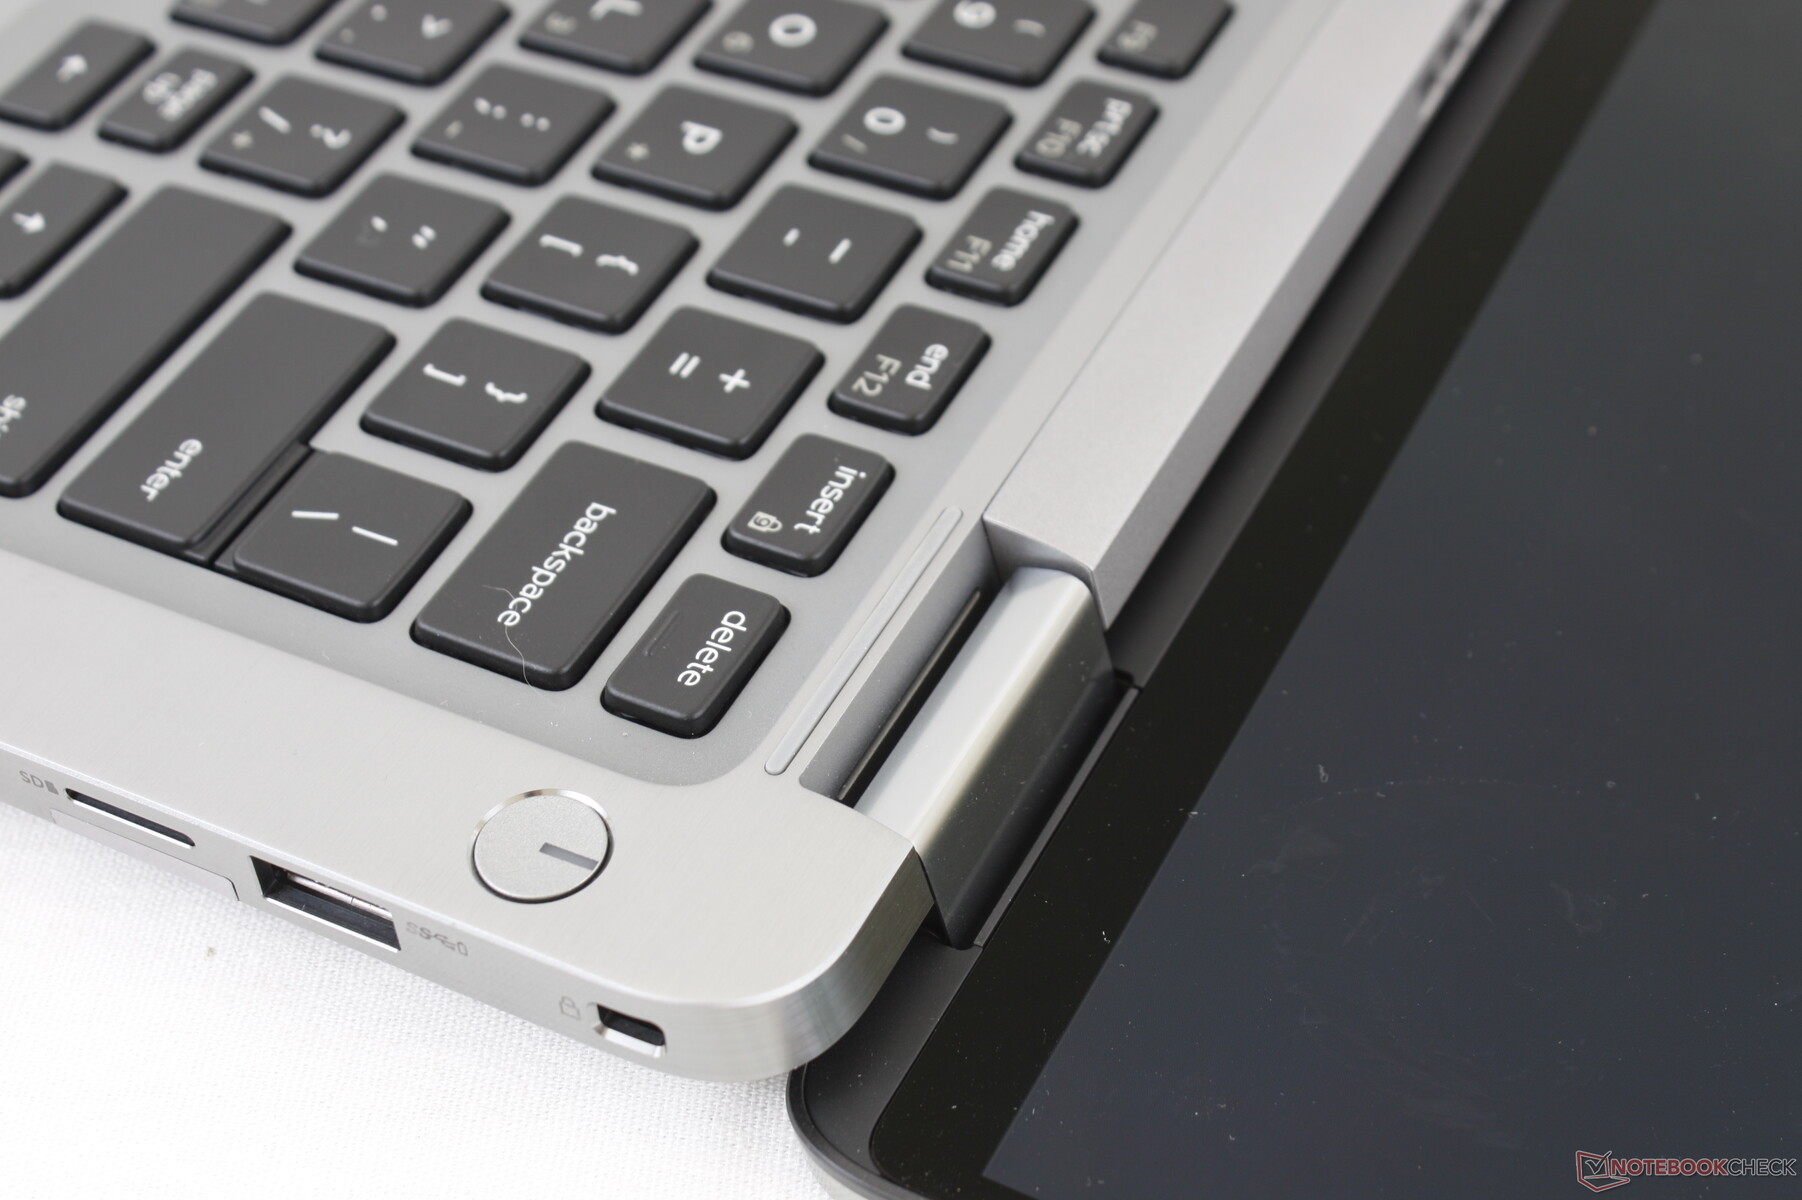
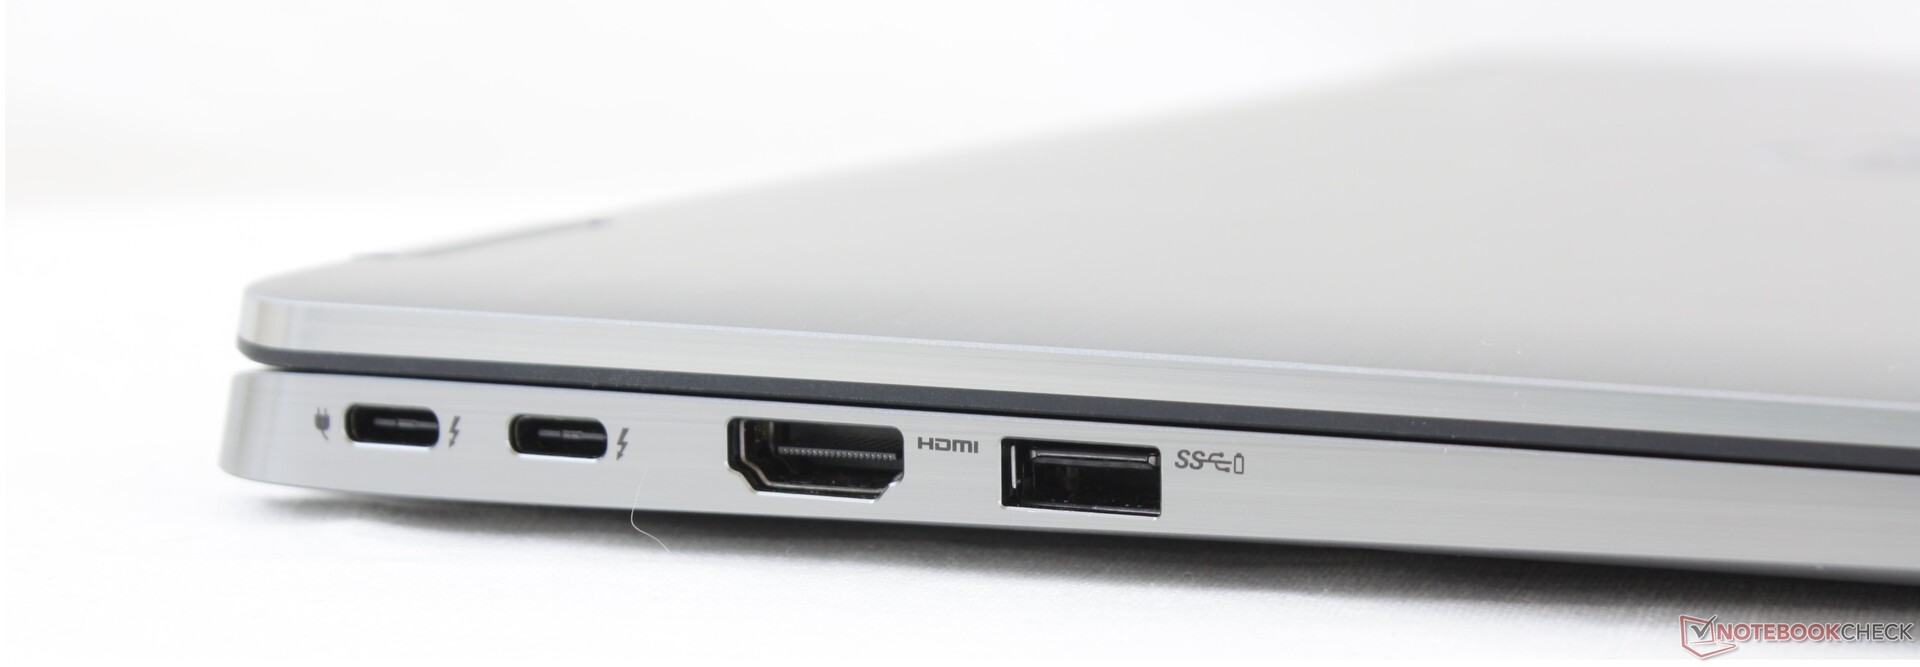
Connectivity
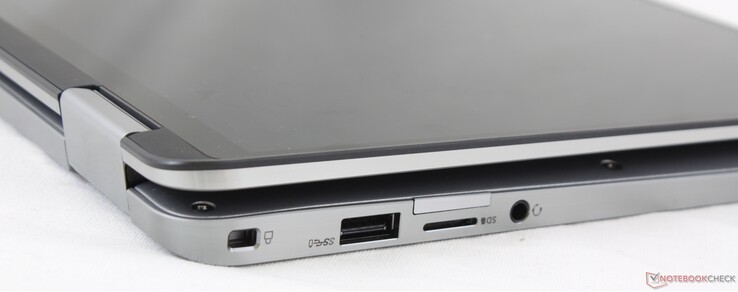
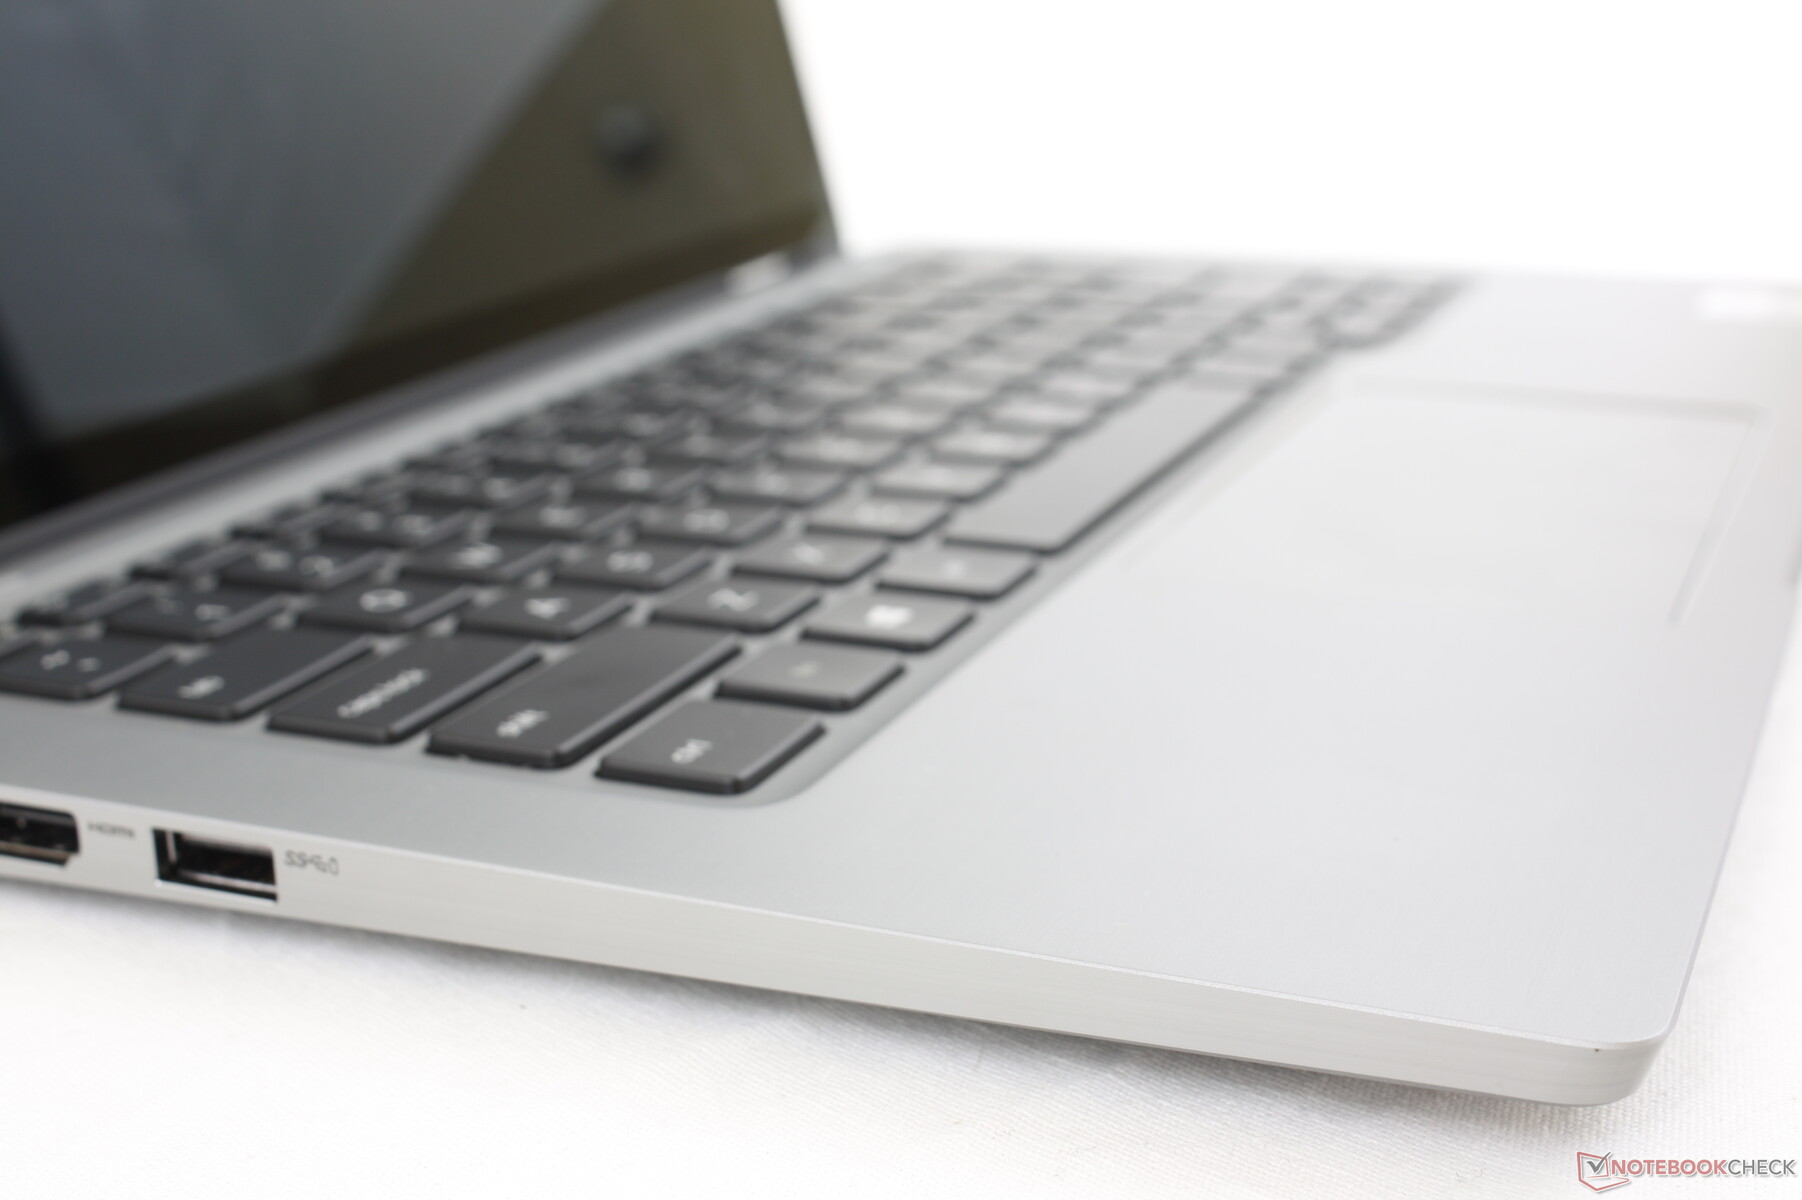
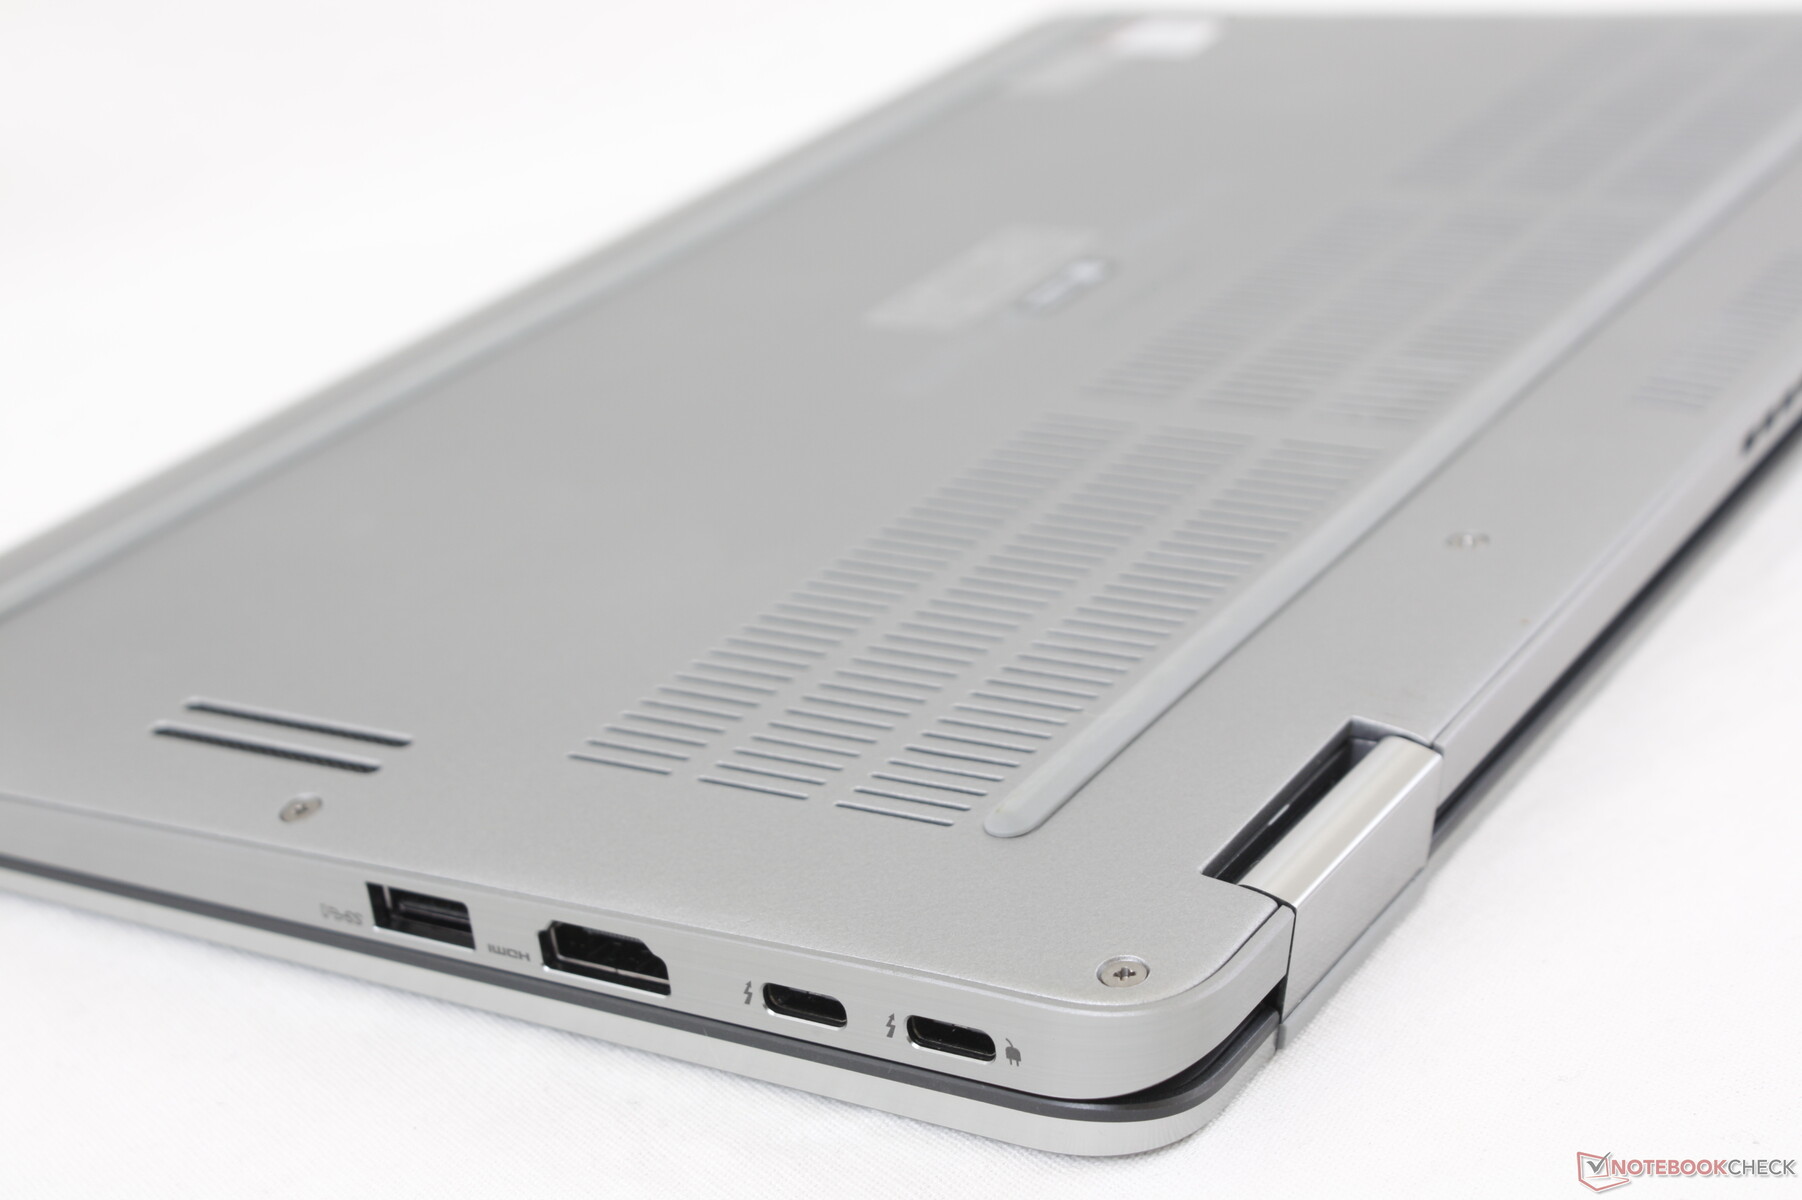
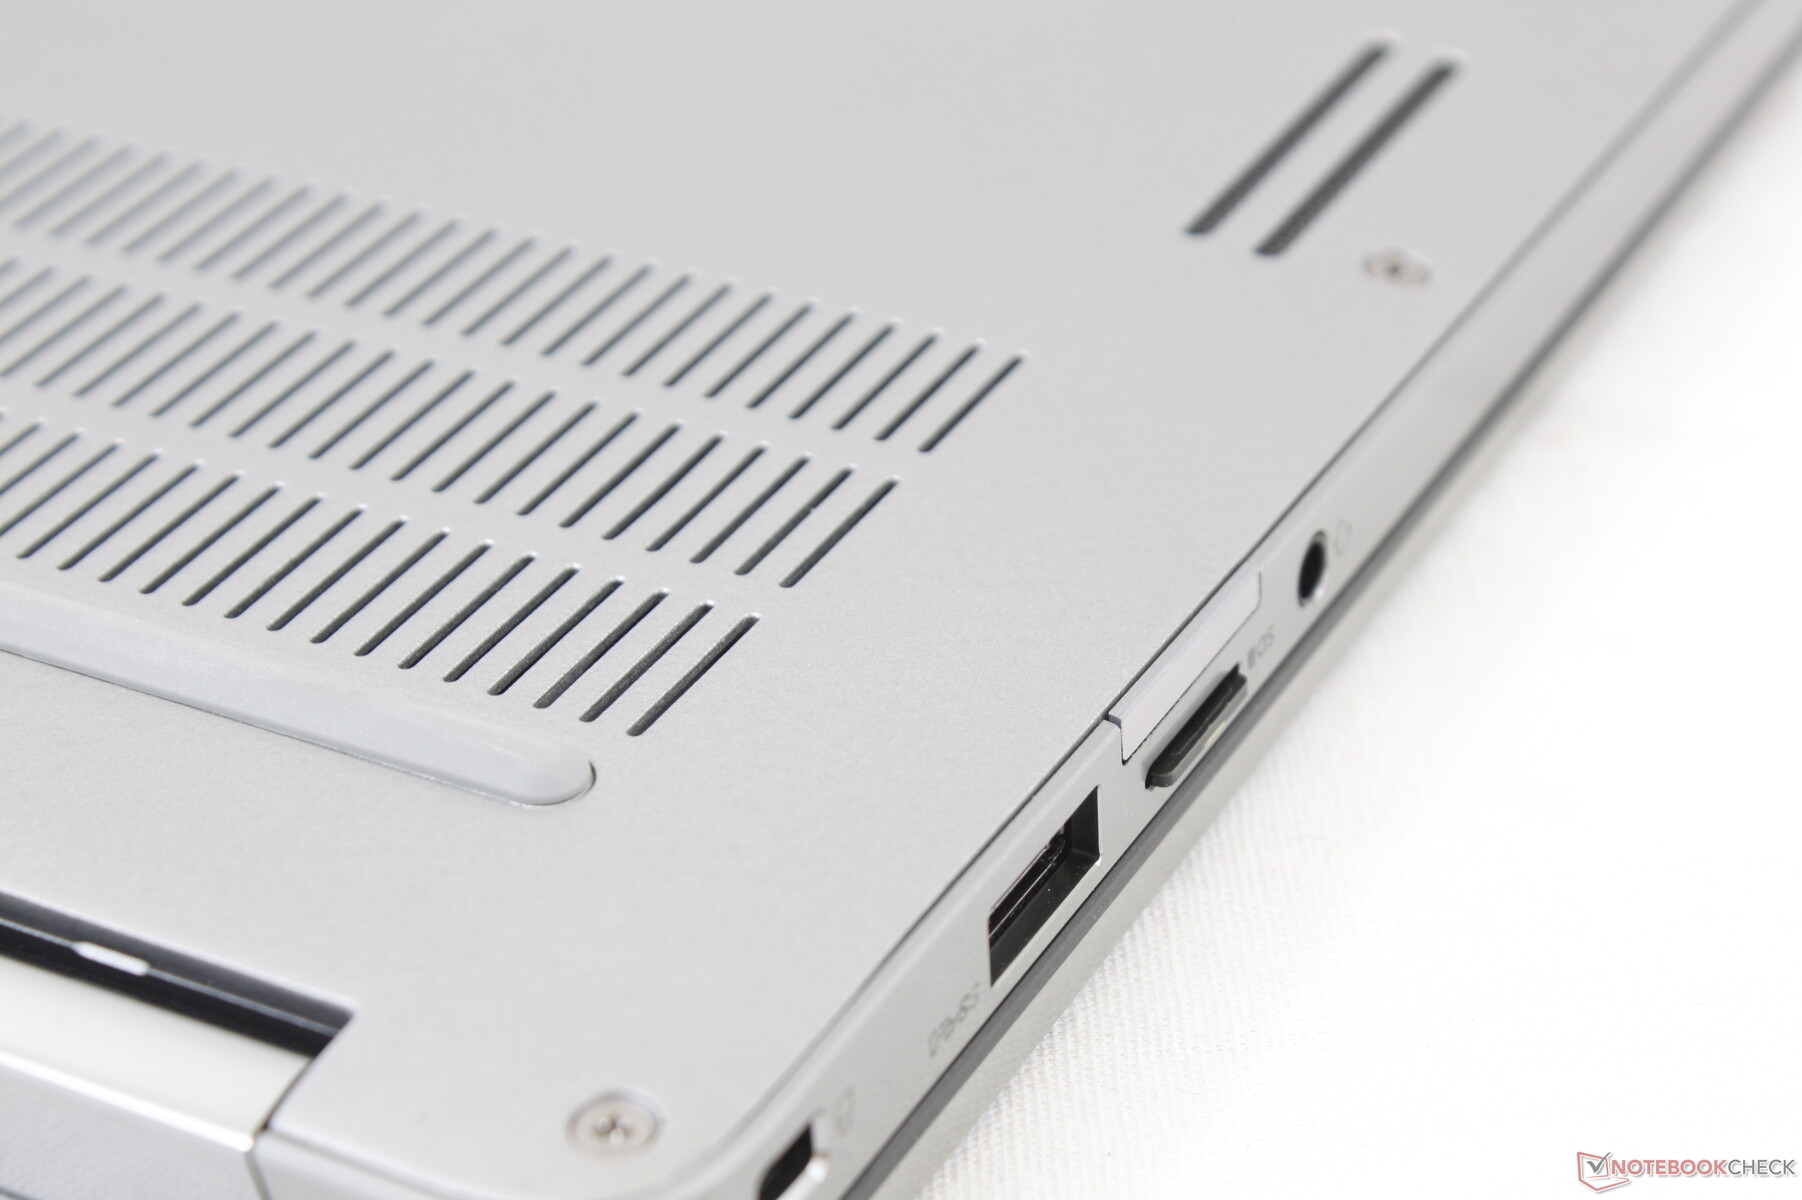
Port options and positioning are identical to the Latitude 7400 2-in-1. We appreciate the variety especially when compared to some consumer-oriented laptops like the HP Spectre x360 13 or Dell XPS 13. However, the ports along the left edge are tightly spaced and thus not as accommodating for thicker cables.
When compared to the HP EliteBook x360 1040 G5, the Dell integrates a MicroSD card reader whereas the HP has a volume rocker.
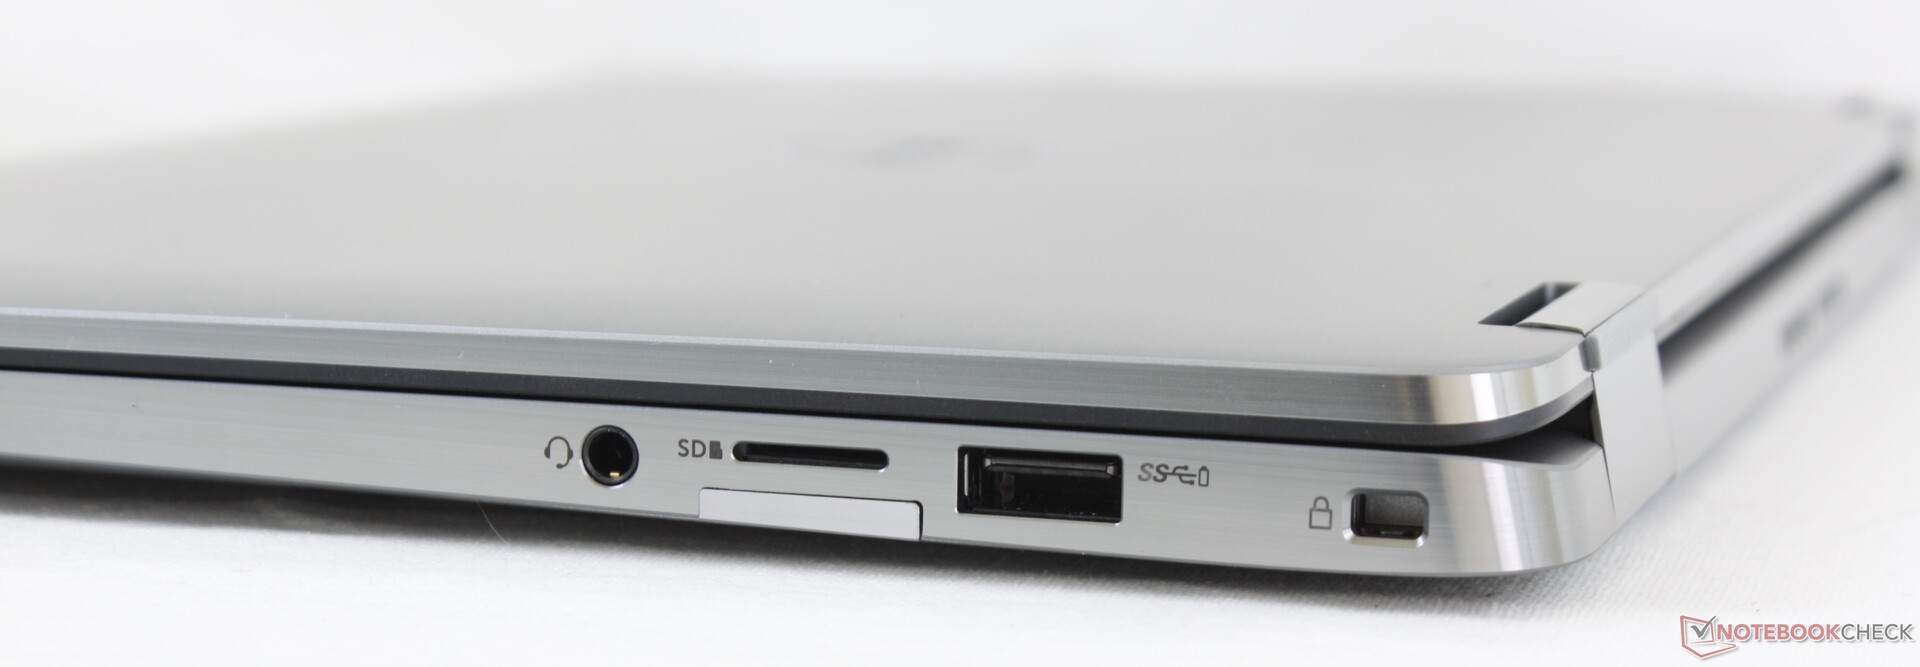
SD Card Reader
Transfer rates from the integrated MicroSD reader are fast and comparable to the XPS series. Moving 1 GB of pictures from our UHS-II test card to desktop is over 6x faster than on the Asus ZenBook Flip 14.
| SD Card Reader | |
| average JPG Copy Test (av. of 3 runs) | |
| Dell Latitude 14 9410 2-in-1 P110G (Toshiba Exceria Pro M501 64 GB UHS-II) | |
| Dell Latitude 7400 2-in-1 (Toshiba Exceria Pro M501 UHS-II) | |
| LG Gram 14T90N (Toshiba Exceria Pro M501 64 GB UHS-II) | |
| Asus ZenBook Flip 14 UX463FA-AI039T (Toshiba Exceria Pro M501 microSDXC 64GB) | |
| maximum AS SSD Seq Read Test (1GB) | |
| Dell Latitude 7400 2-in-1 (Toshiba Exceria Pro M501 UHS-II) | |
| Dell Latitude 14 9410 2-in-1 P110G (Toshiba Exceria Pro M501 64 GB UHS-II) | |
| LG Gram 14T90N (Toshiba Exceria Pro M501 64 GB UHS-II) | |
| Asus ZenBook Flip 14 UX463FA-AI039T (Toshiba Exceria Pro M501 microSDXC 64GB) | |
Communication
Wireless has been upgraded from the Intel 9560 on last year's Latitude 7400 to the Intel AX201 on our Latitude 9410 for Wi-Fi 6 compatibility. We experienced no issues when connected to our Netgear RAX200 test router.
Webcam


Security
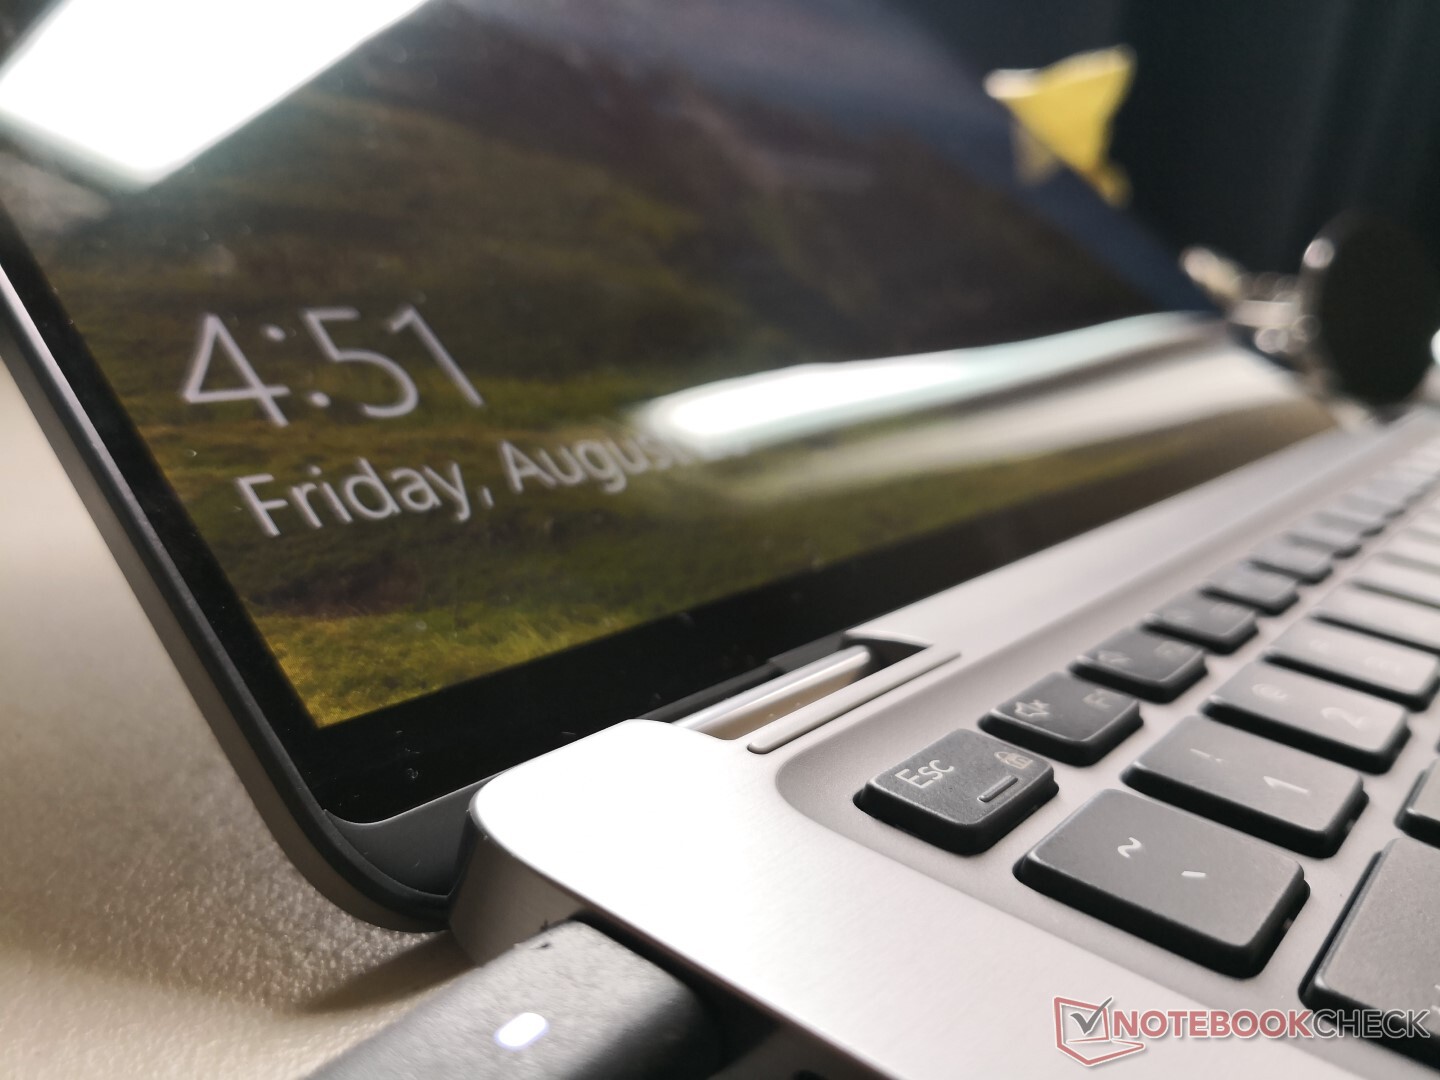
Aside from vPro, IR, Noble Lock, and a fingerprint reader, the system carries a proximity sensor that's unique to certain Dell laptops. It's able to automatically detect when a user is nearby and then initiate the IR camera for hands-free ExpressSign-in. There is no webcam shutter option, however.
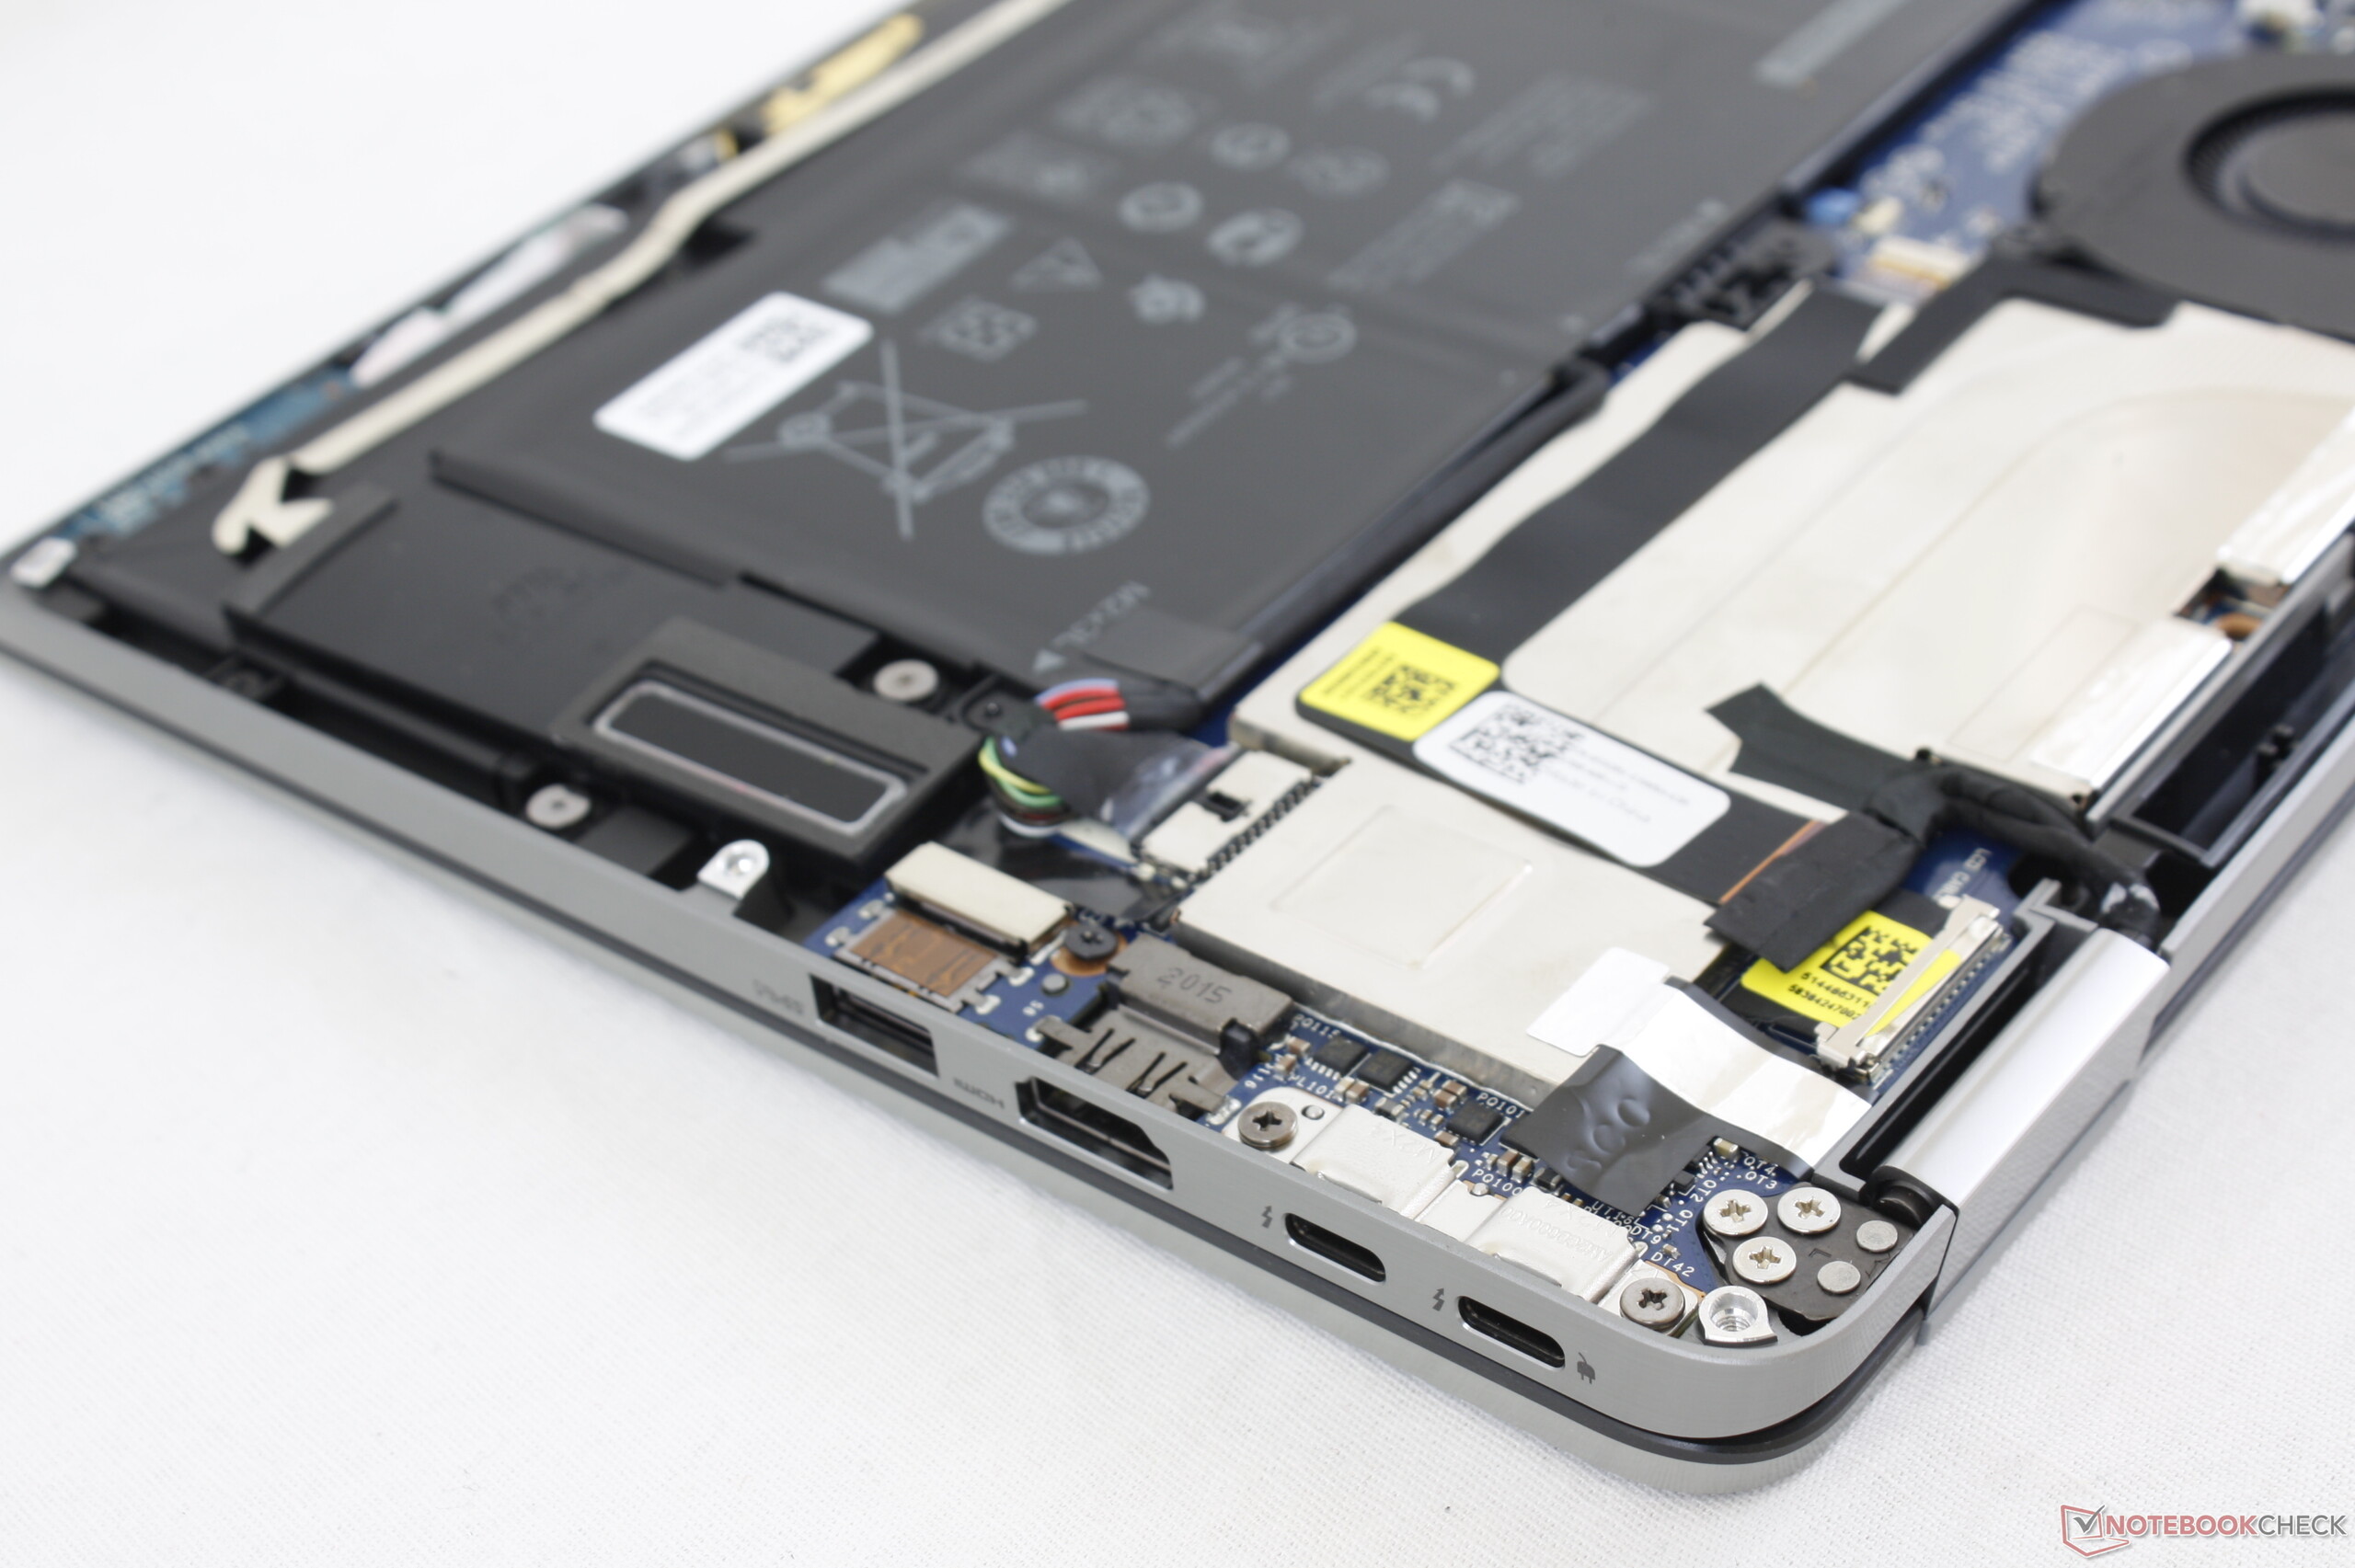
Maintenance
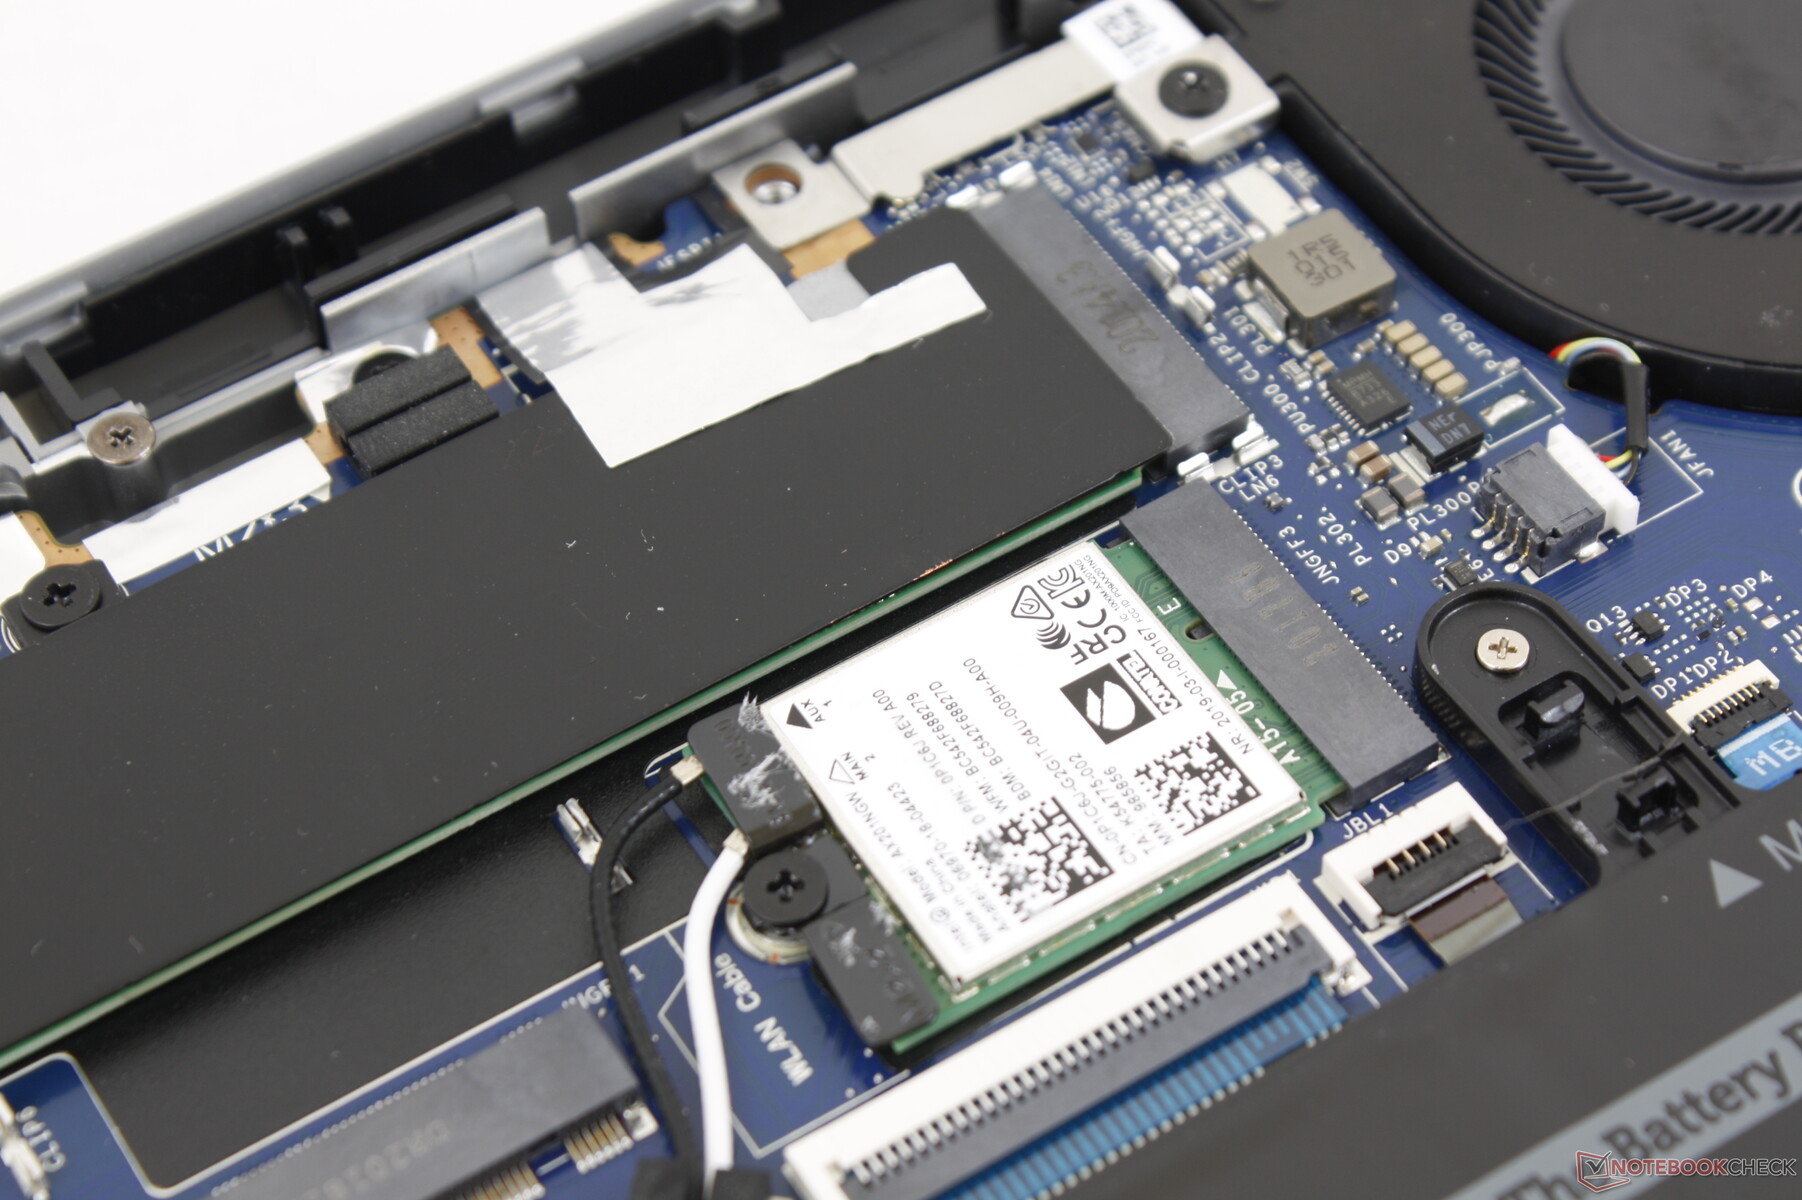
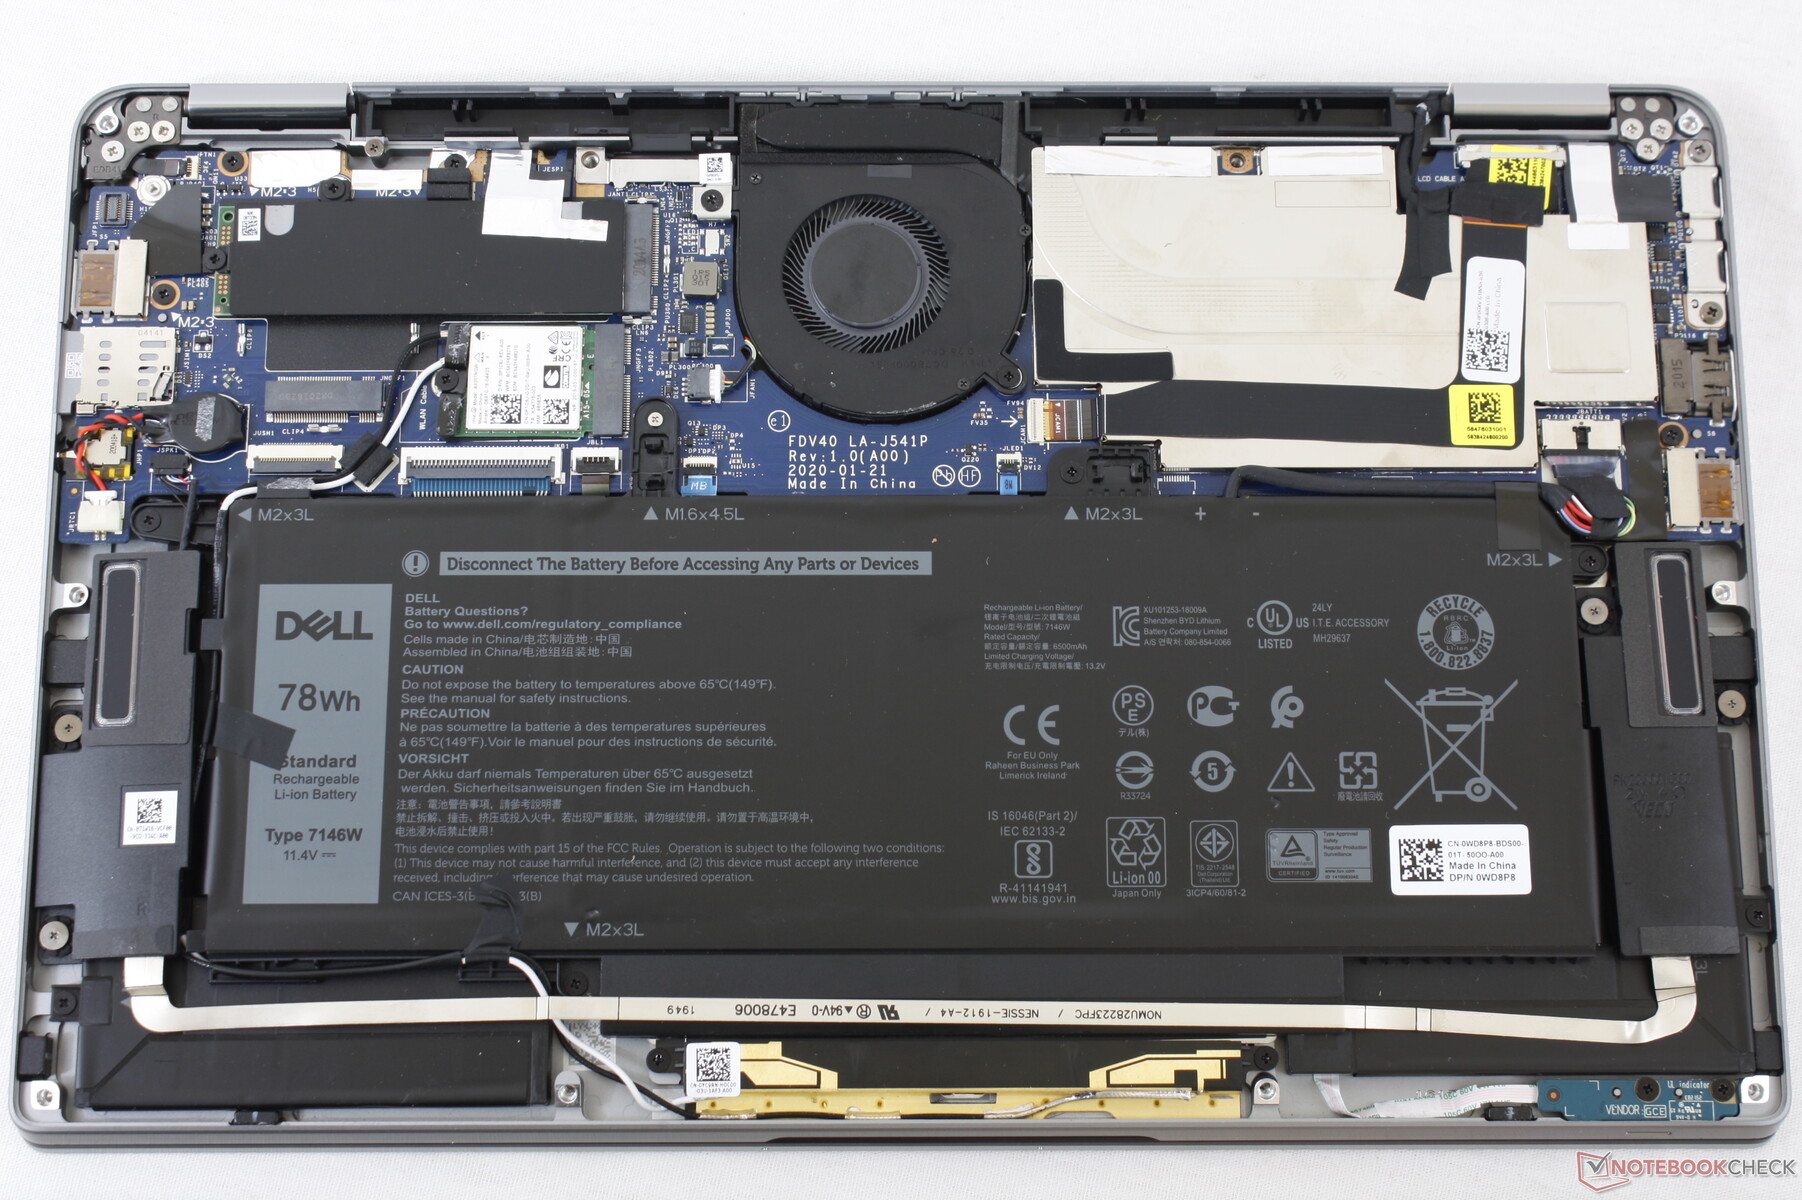
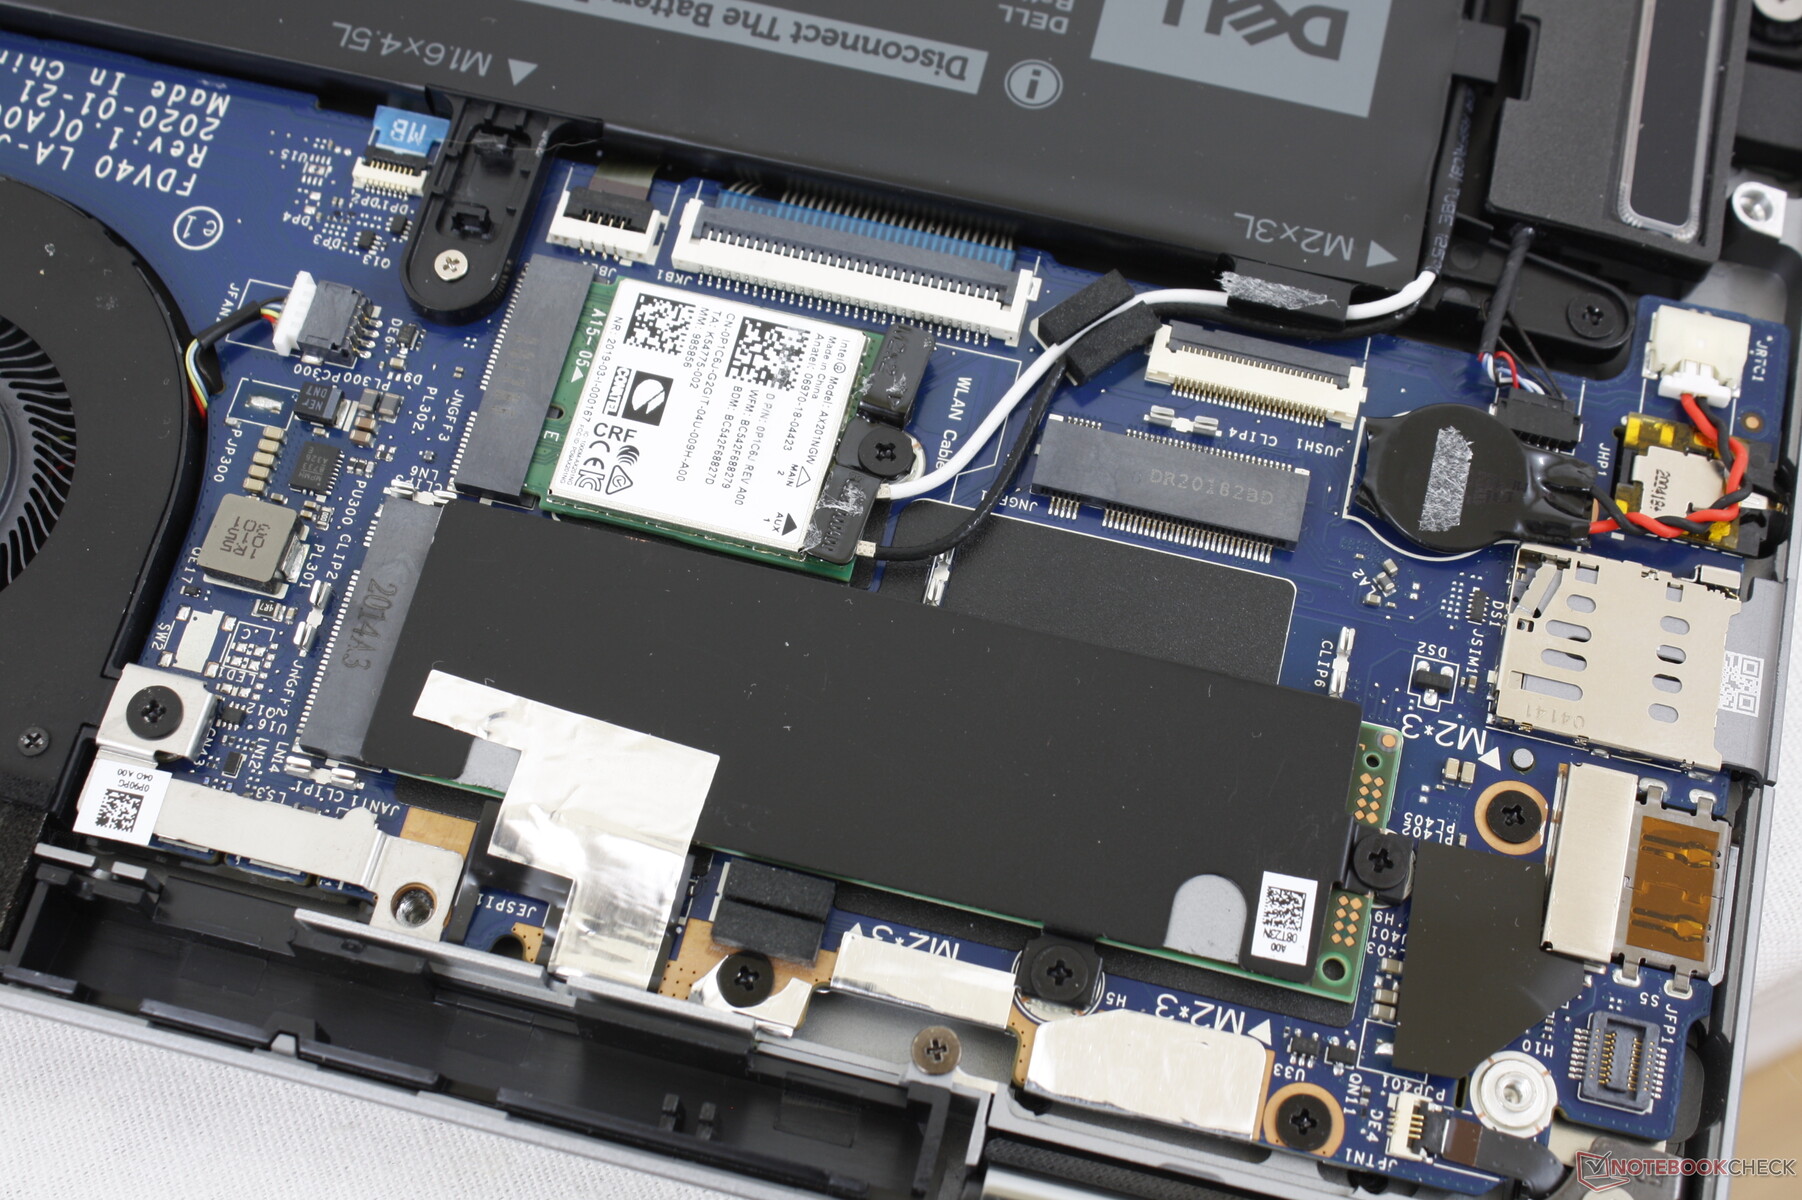
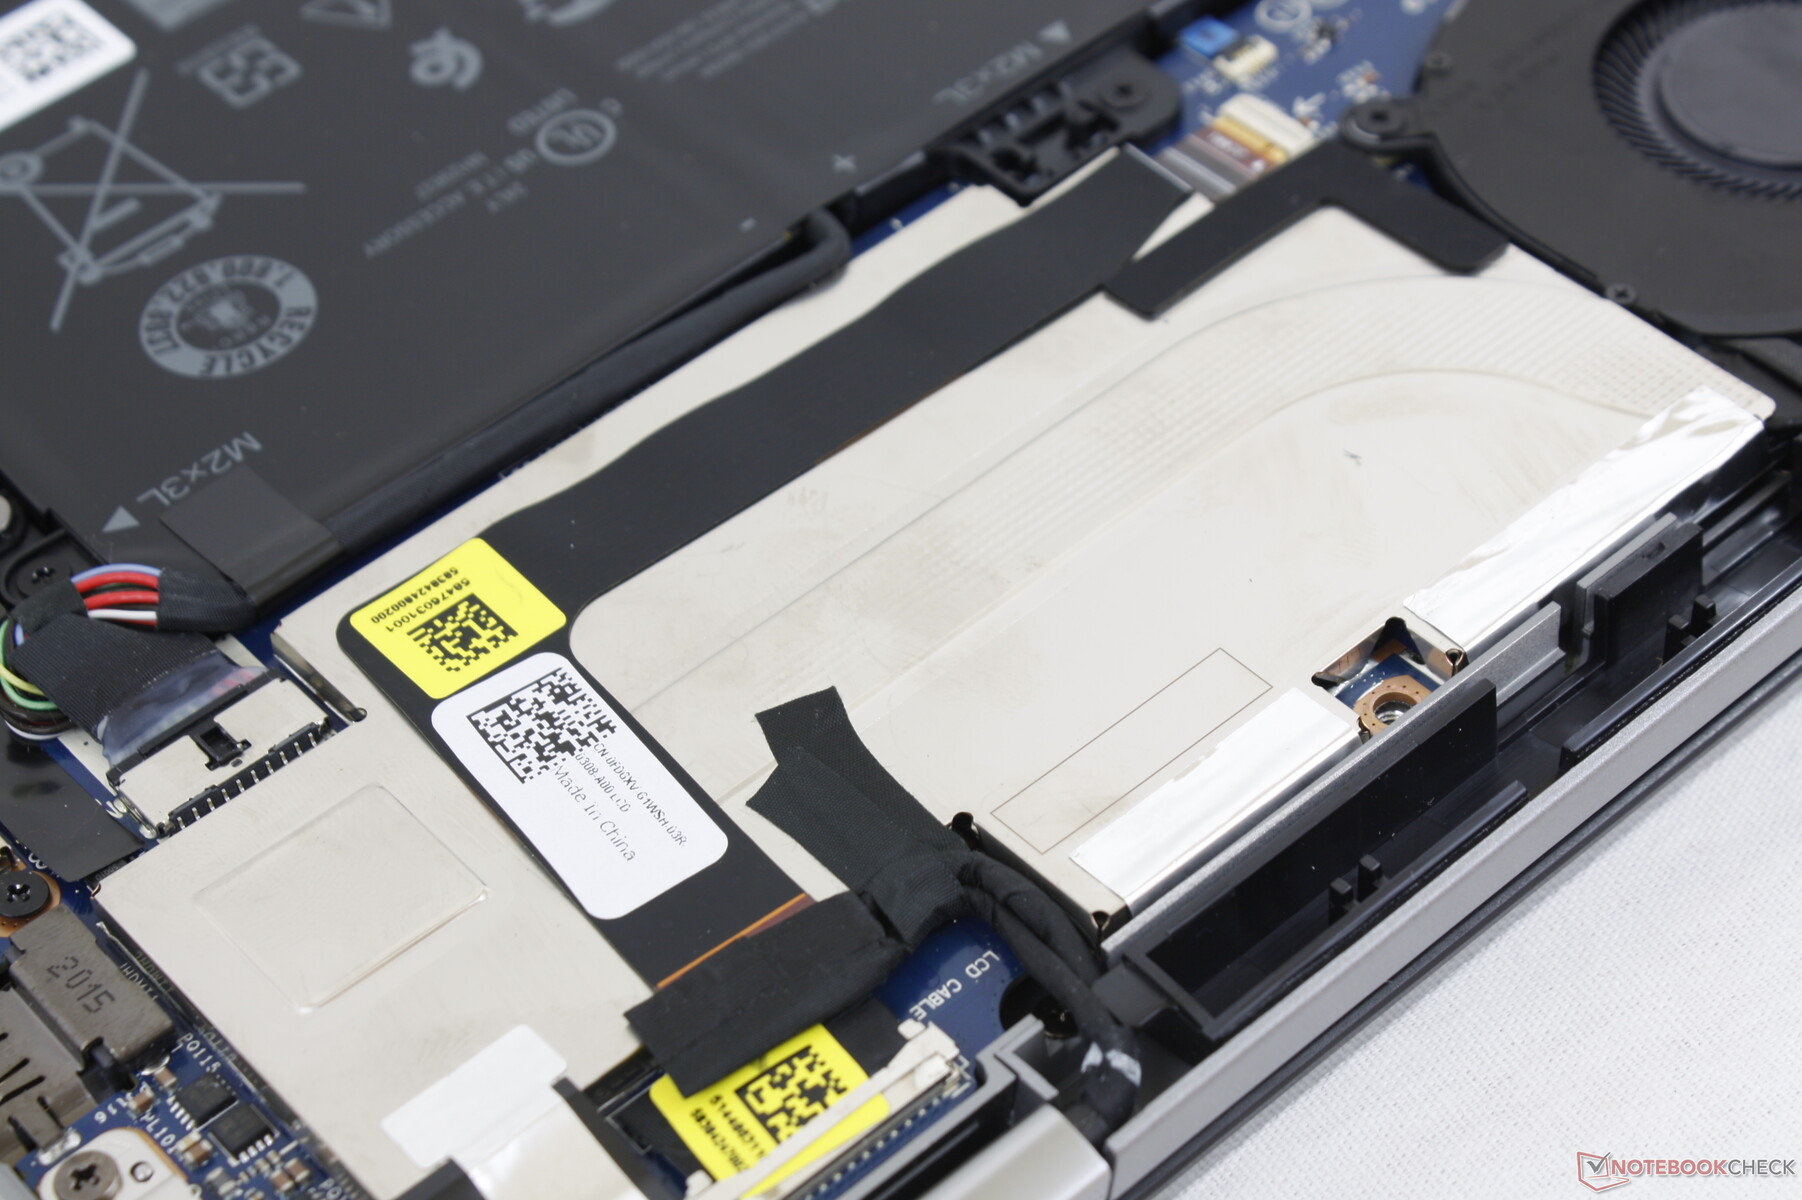
The bottom panel is relatively easy to remove after loosening 10 Philips screws. The M.2 storage bay and wireless module are removable while RAM is fixed. The WAN slot is also present but rendered useless on our non-WAN configuration.
Accessories and Warranty
There are no extras in the box other than the paperwork and AC adapter. Optional accessories include the Premium Active Pen (PN579X) and Latitude carrying sleeve.
A three-year limited warranty comes standard with plenty of extension options.
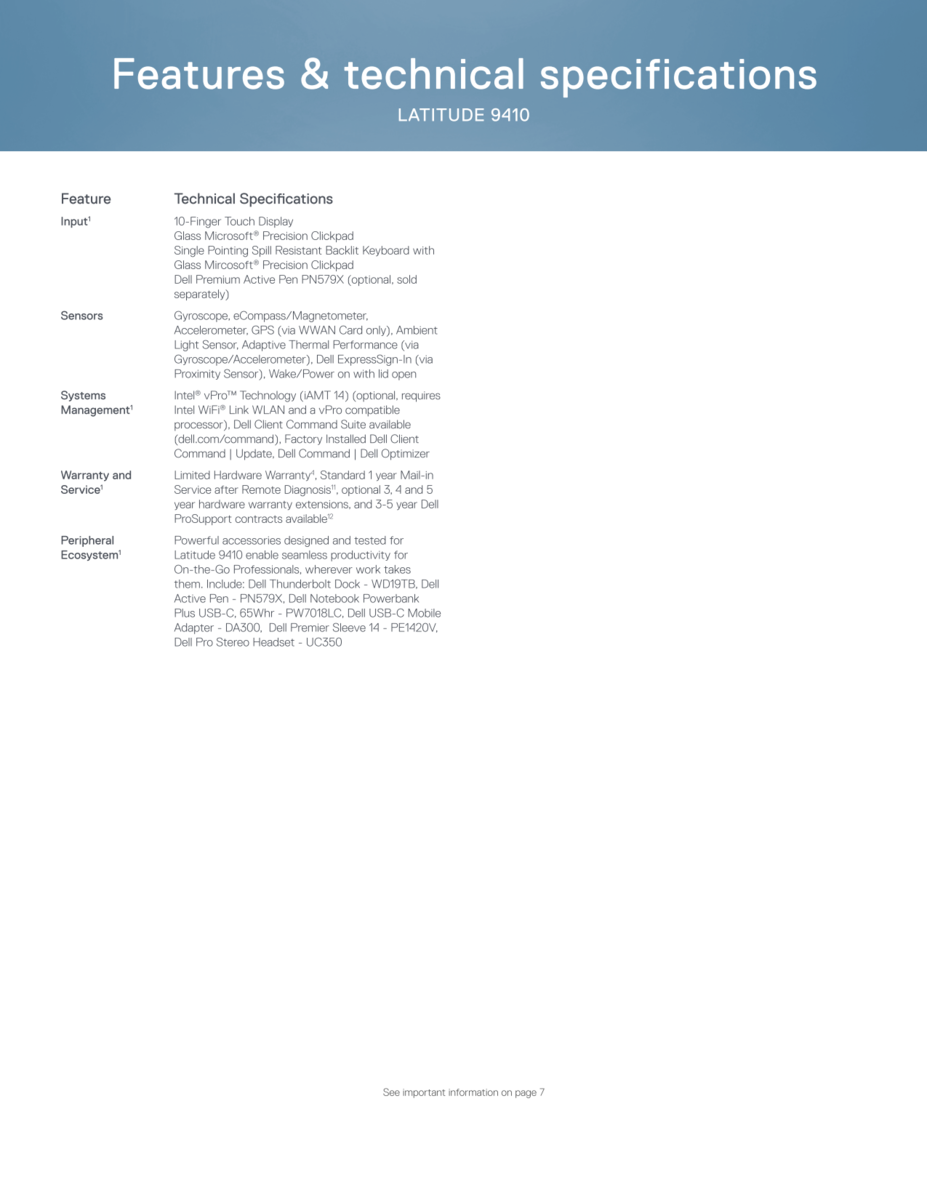
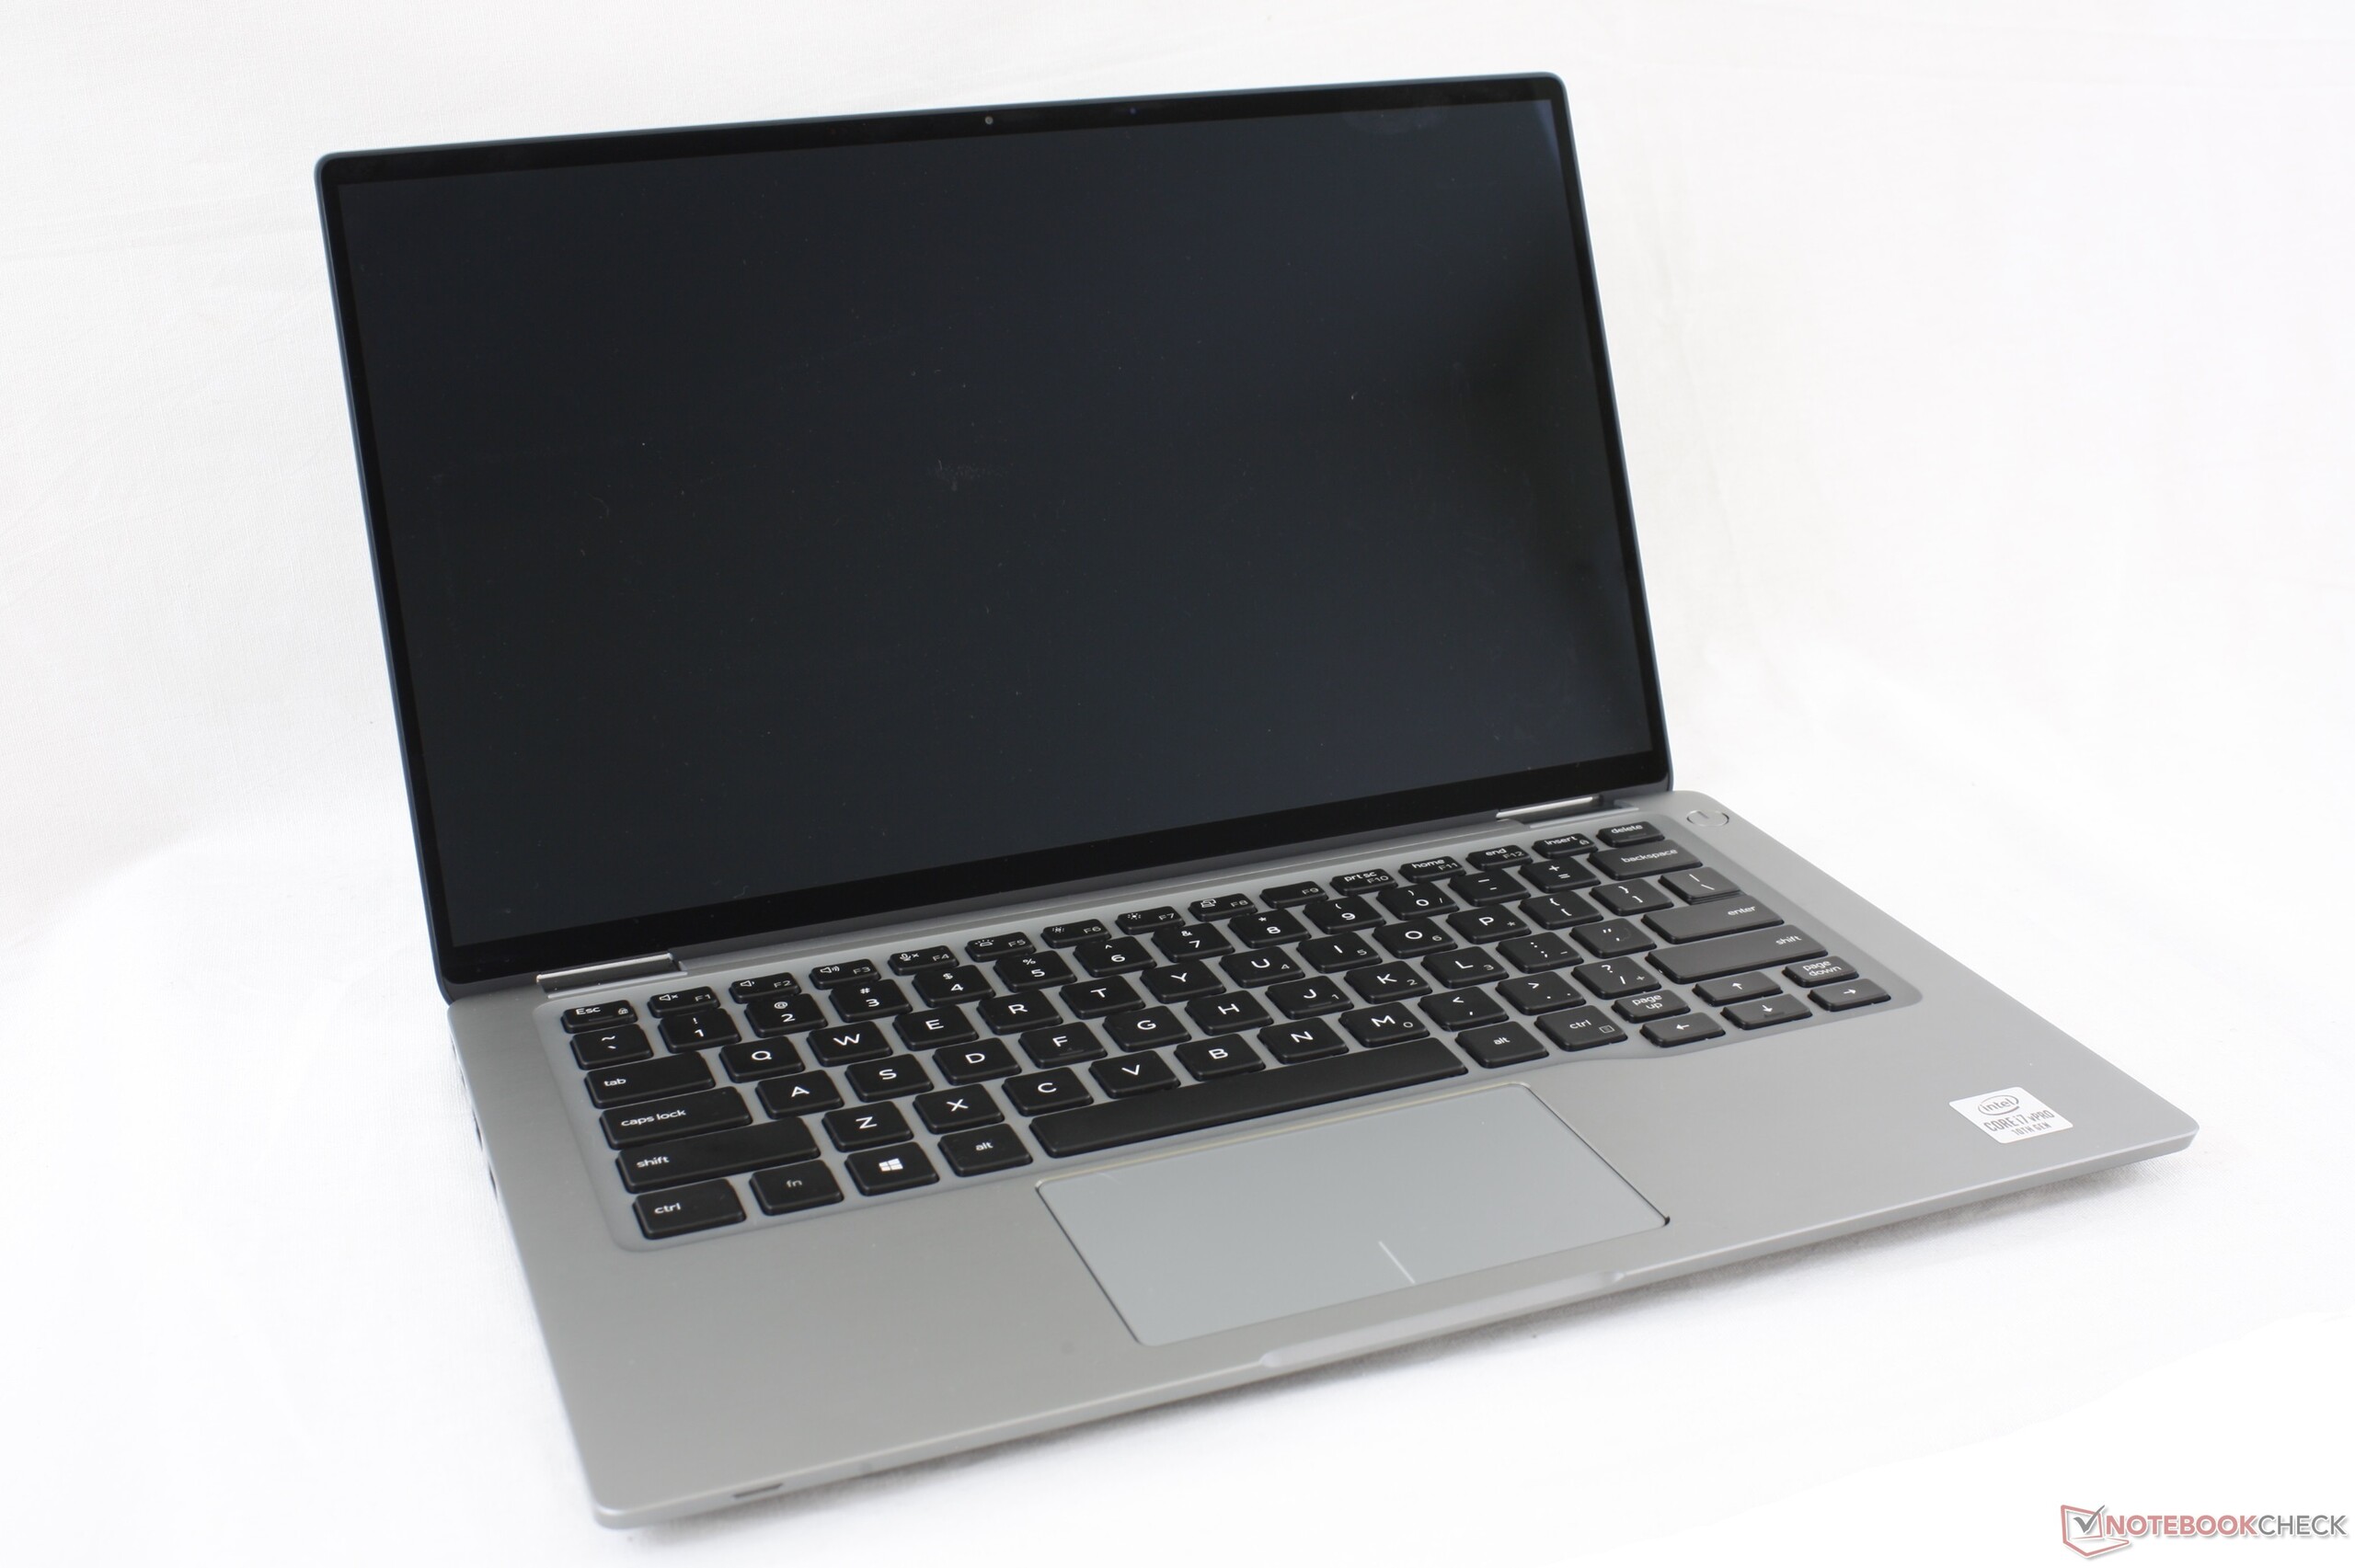
Input Devices
Keyboard
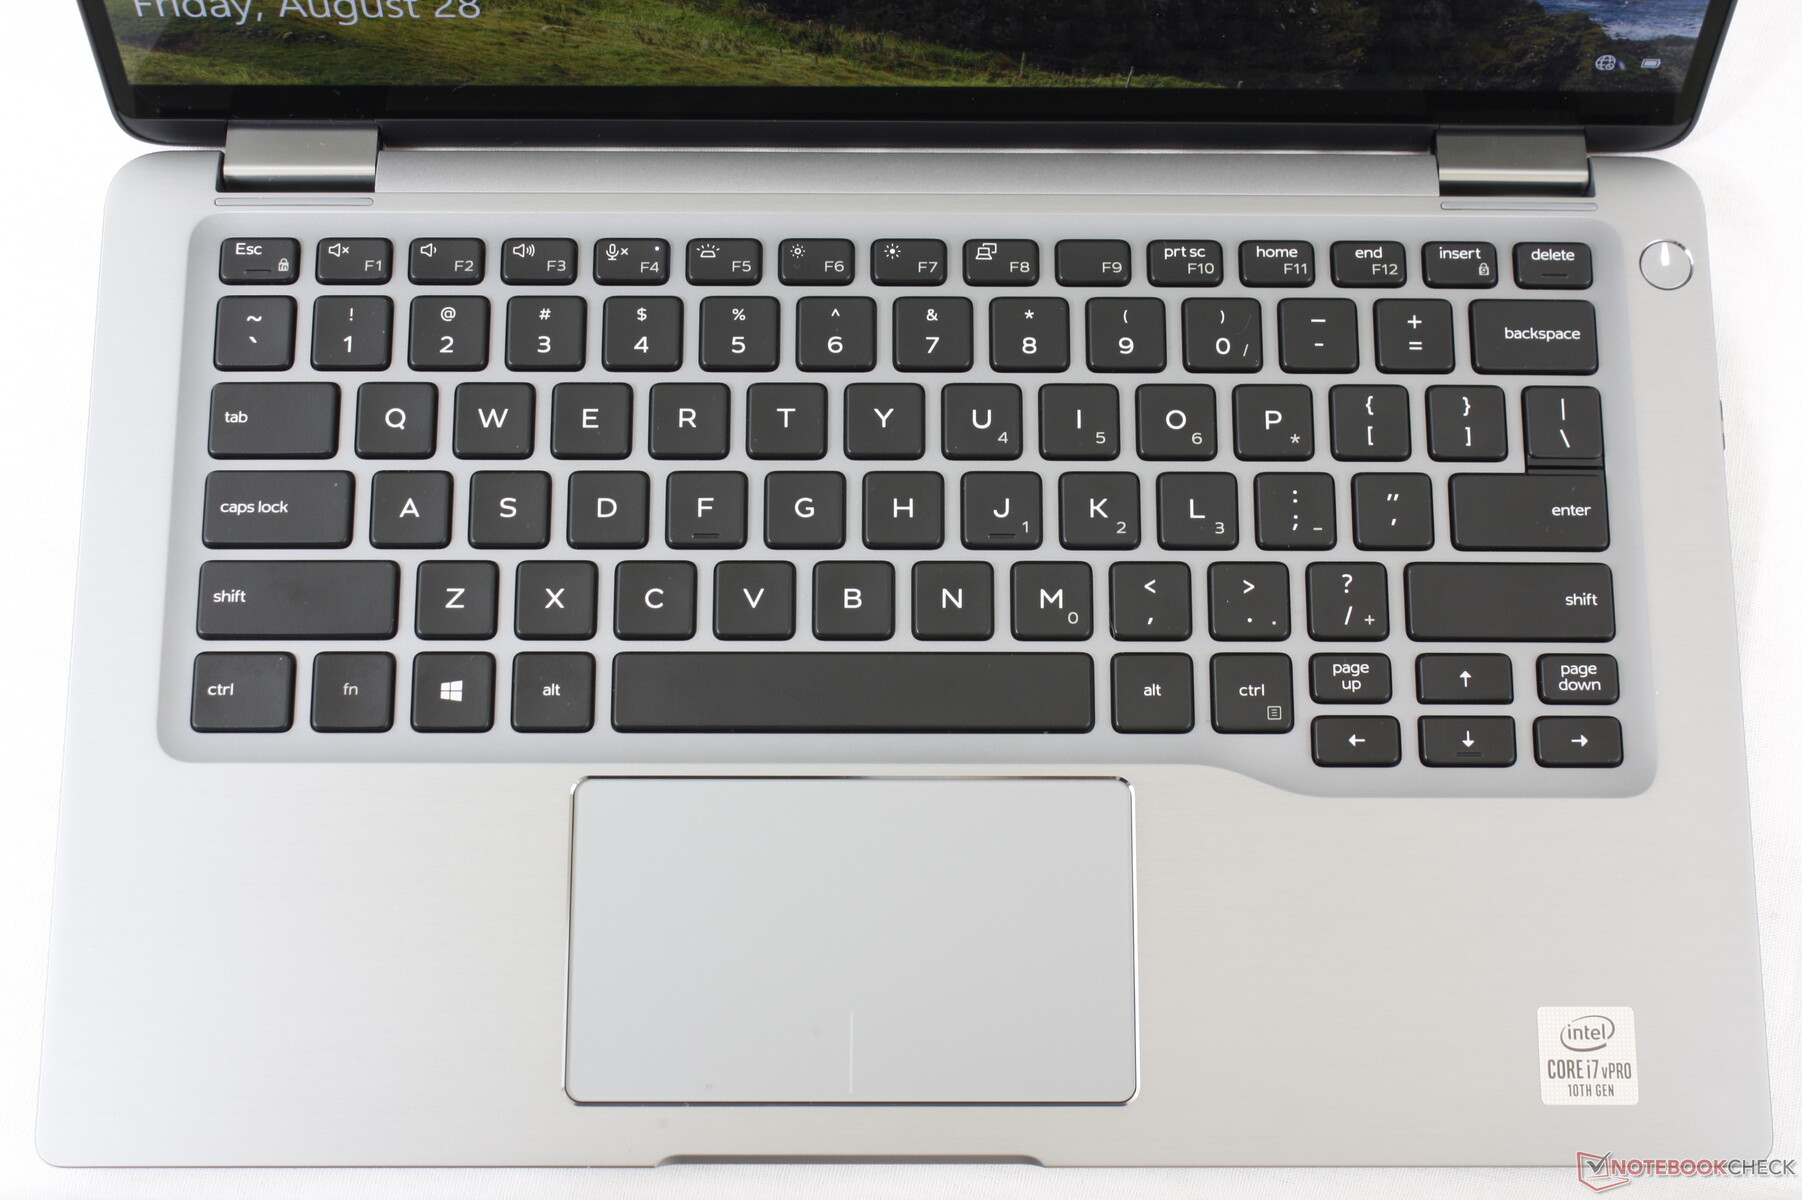
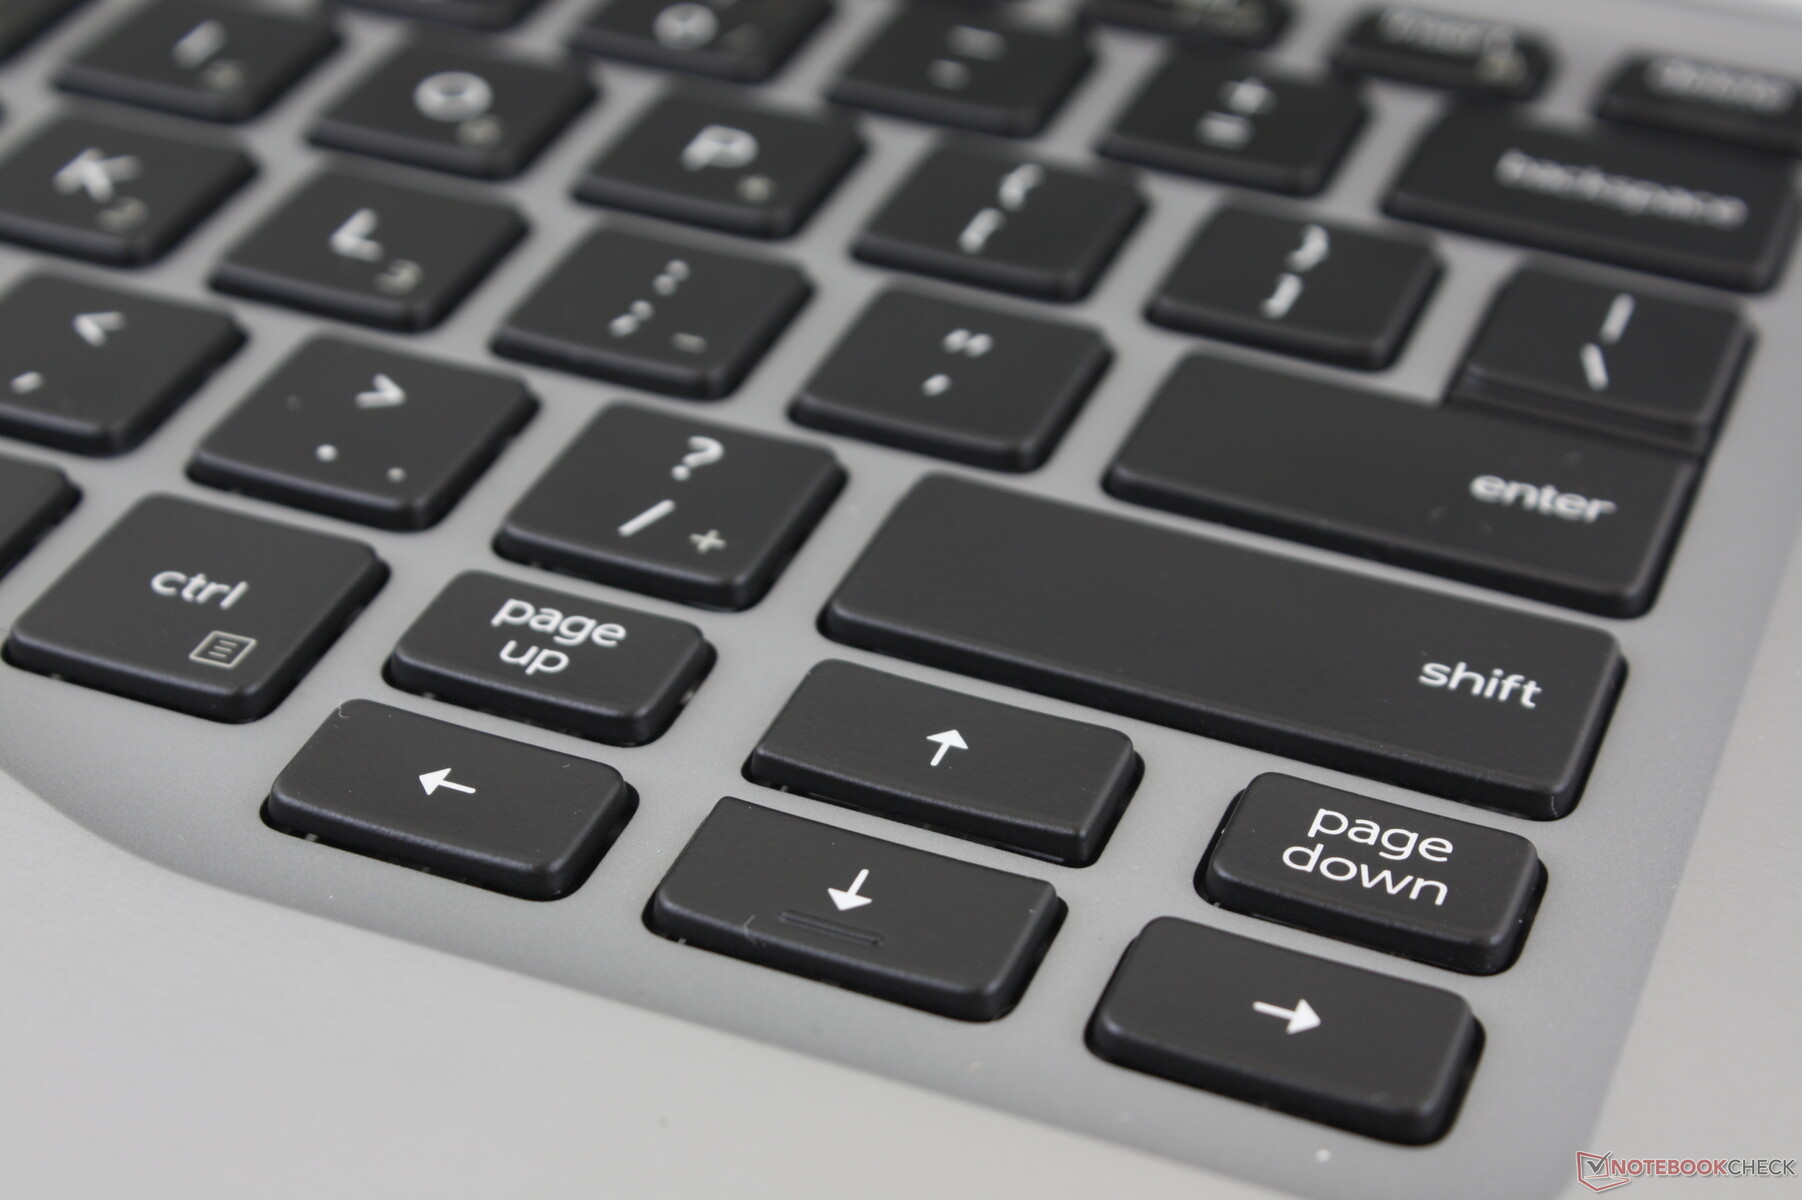
Key layout and feedback remain identical to the Latitude 7400 2-in-1 which isn't a bad thing since we found the typing experience on the older Latitude to be one of the best for a subnotebook convertible. Feedback is crisper and with deeper travel than on most other Ultrabooks including Dell's own XPS 13 series. Key clatter is slightly louder, however, which is a fair trade-off for more comfortable keys.
The F9 key continues to have no secondary function. An electronic webcam shutter like on the latest HP Envy series would have been great to see here.
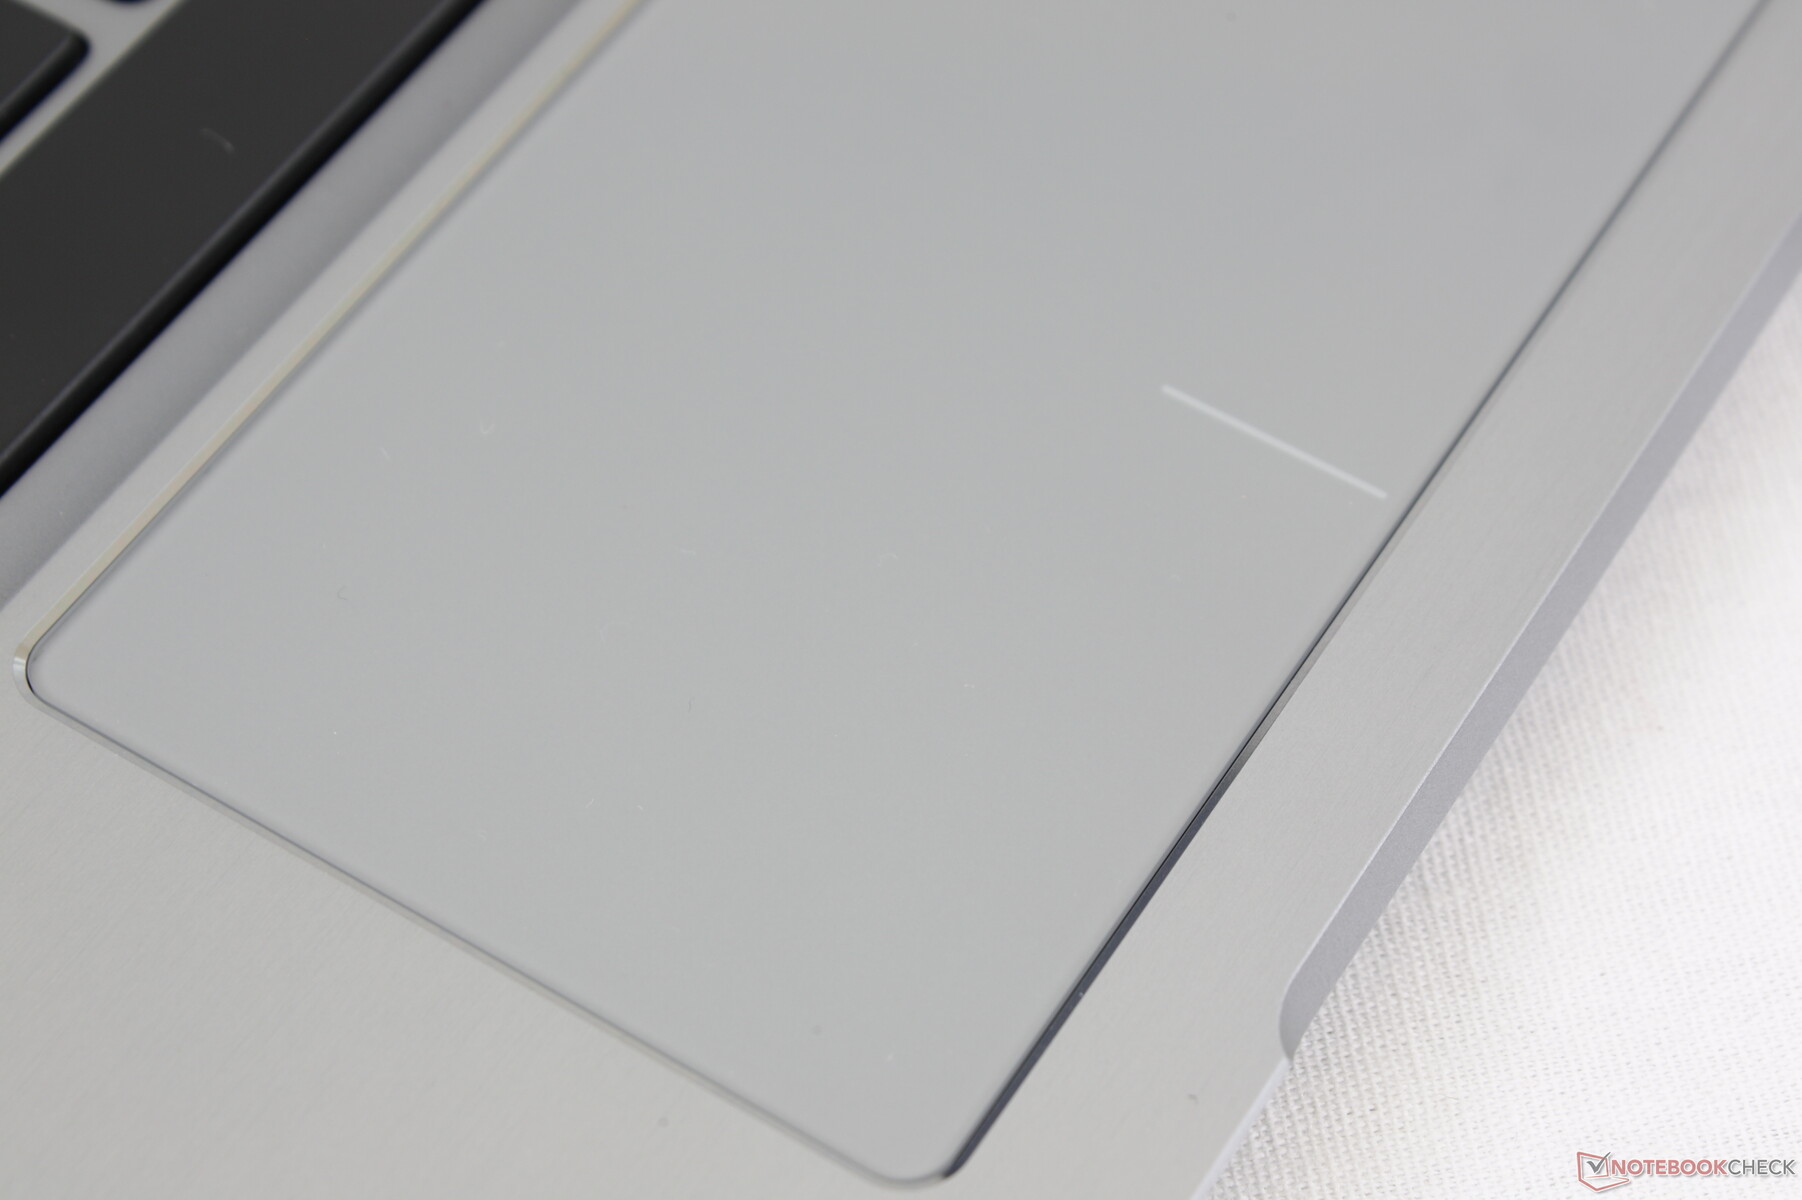
Touchpad
The Precision glass clickpad (~10.5 x 6 cm) is smooth and with almost no sticking even when gliding at slow speeds. Its integrated mouse buttons are moderate in feedback and clatter and they feel easier to use than the softer clickpads on the XPS series. We wish the clickpad could have been a little bigger, but it's not a major issue since the small surface area pairs well with the small screen.

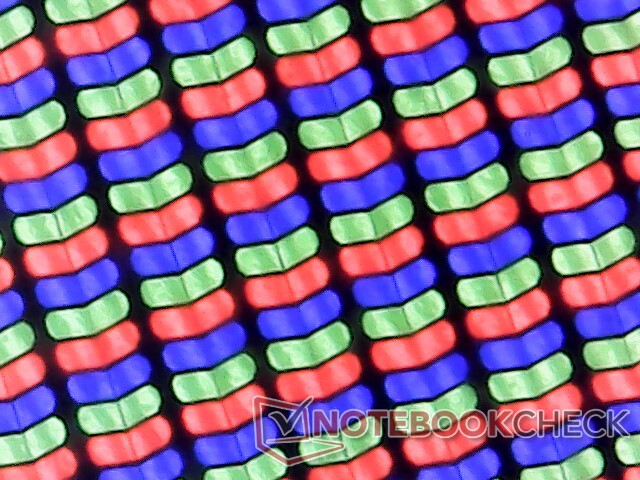
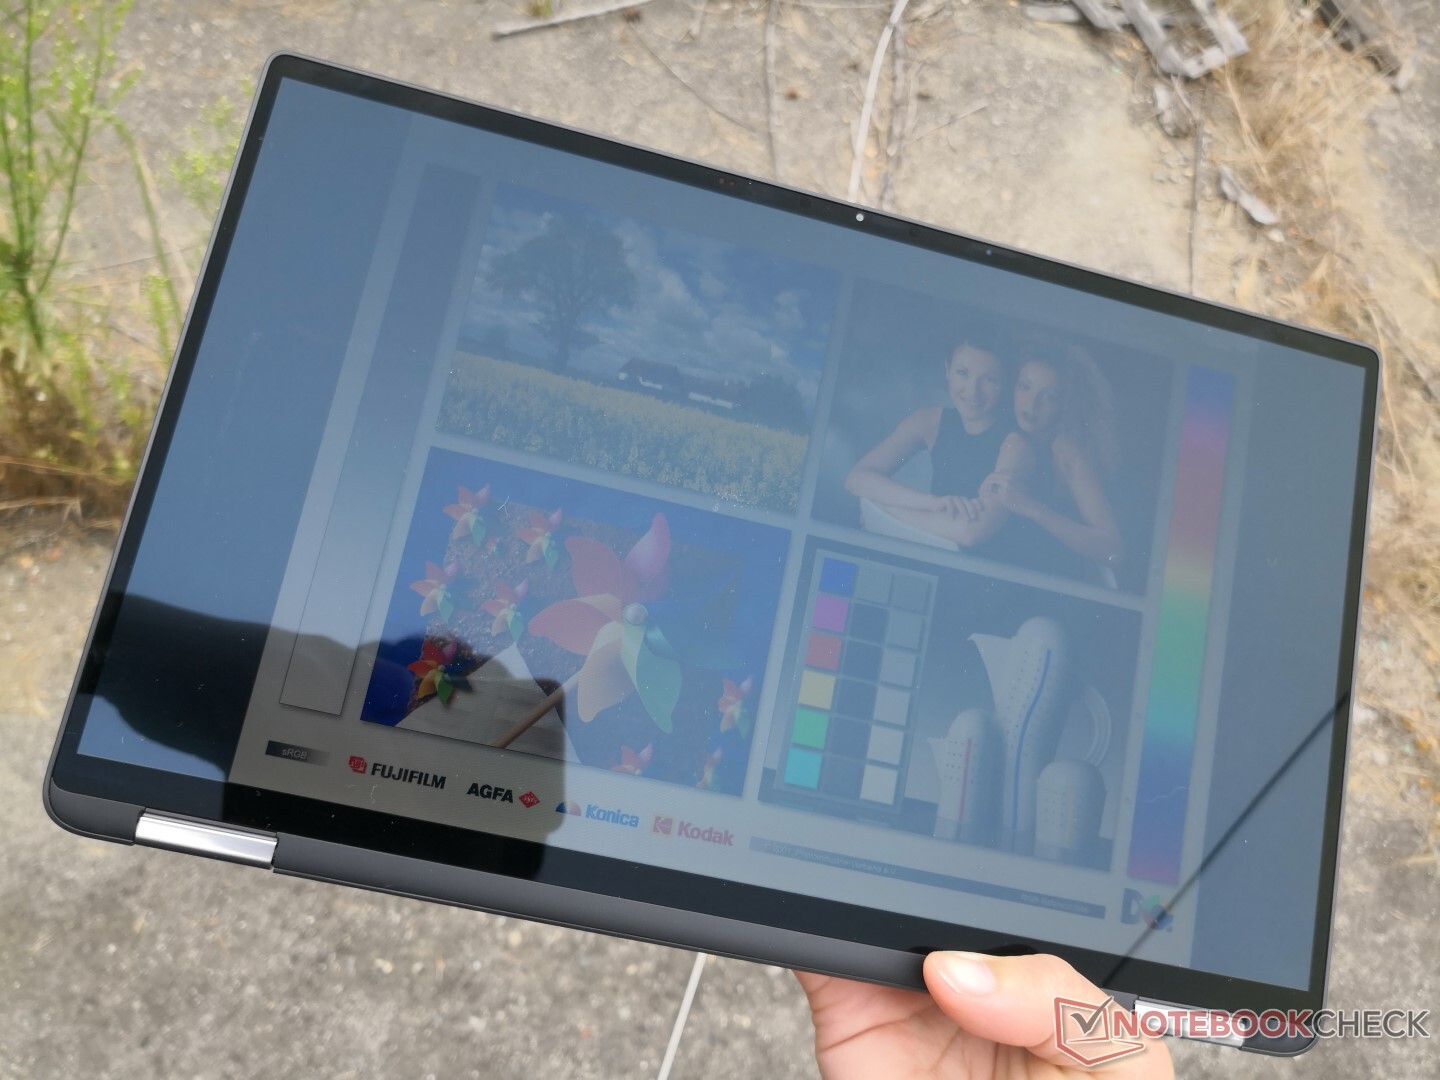
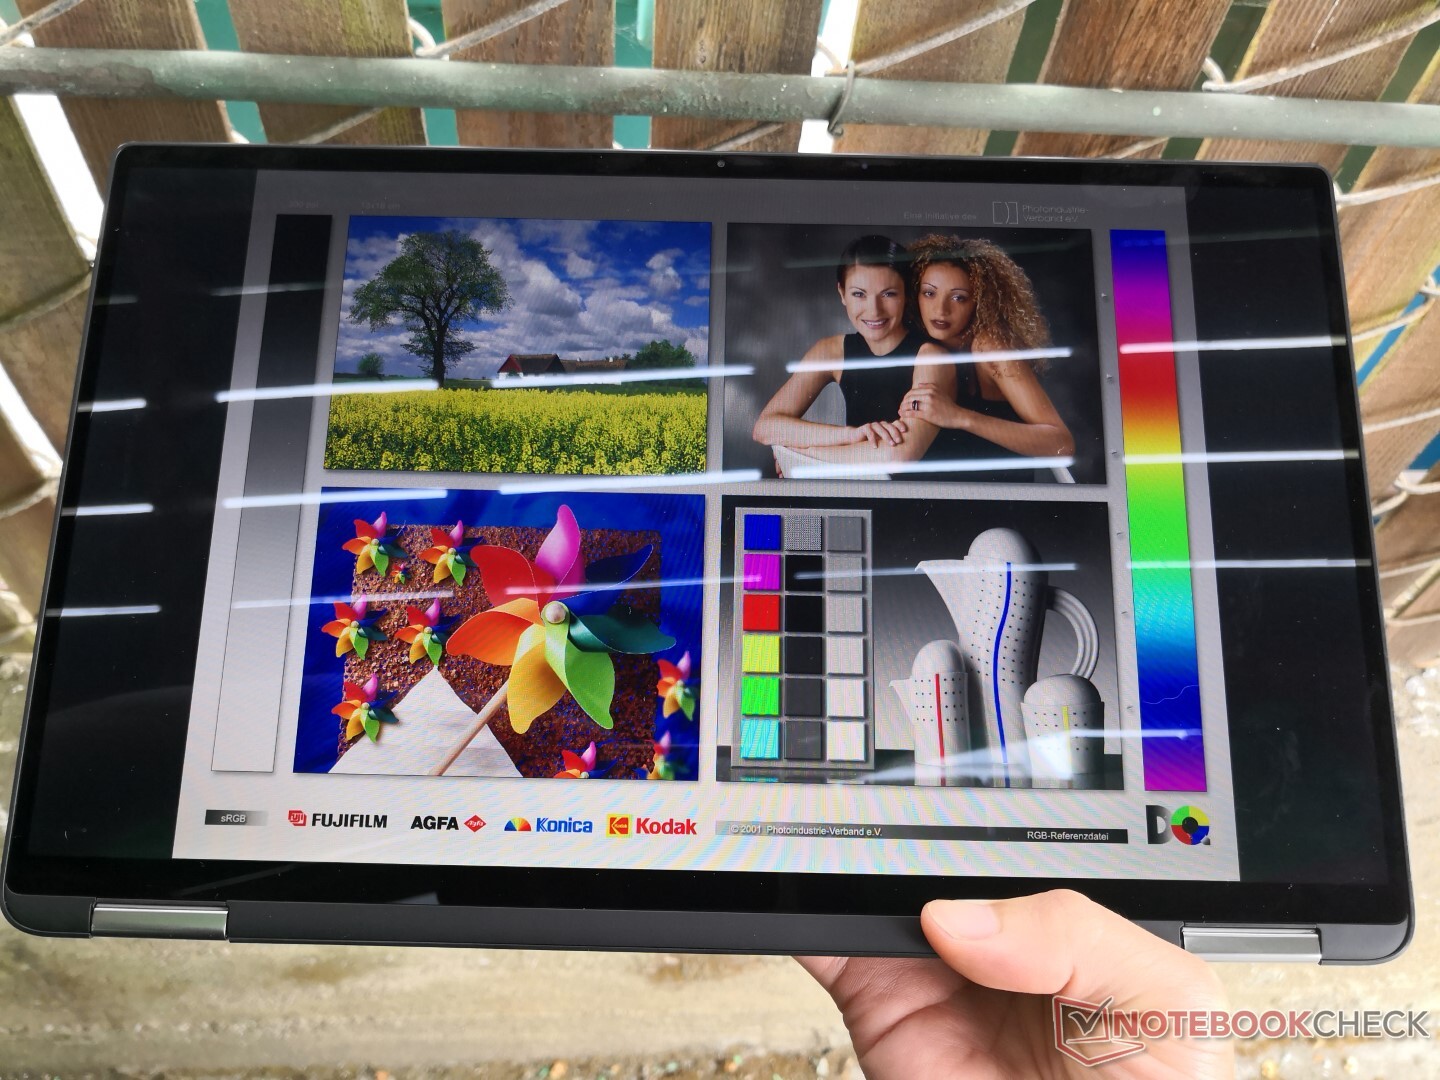
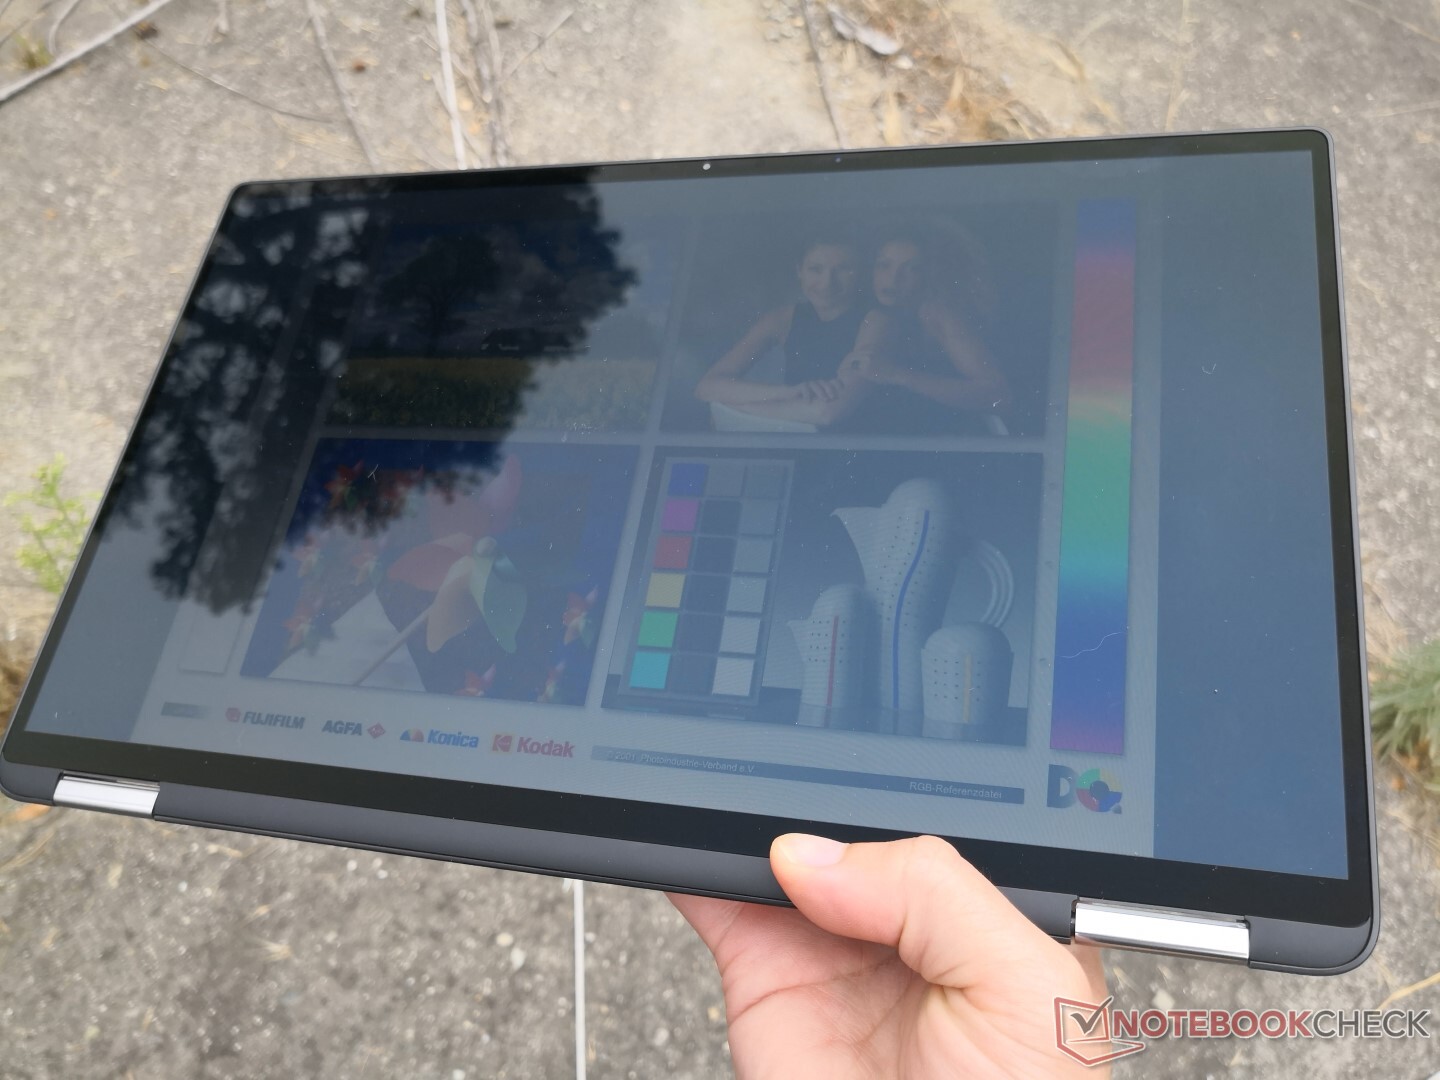
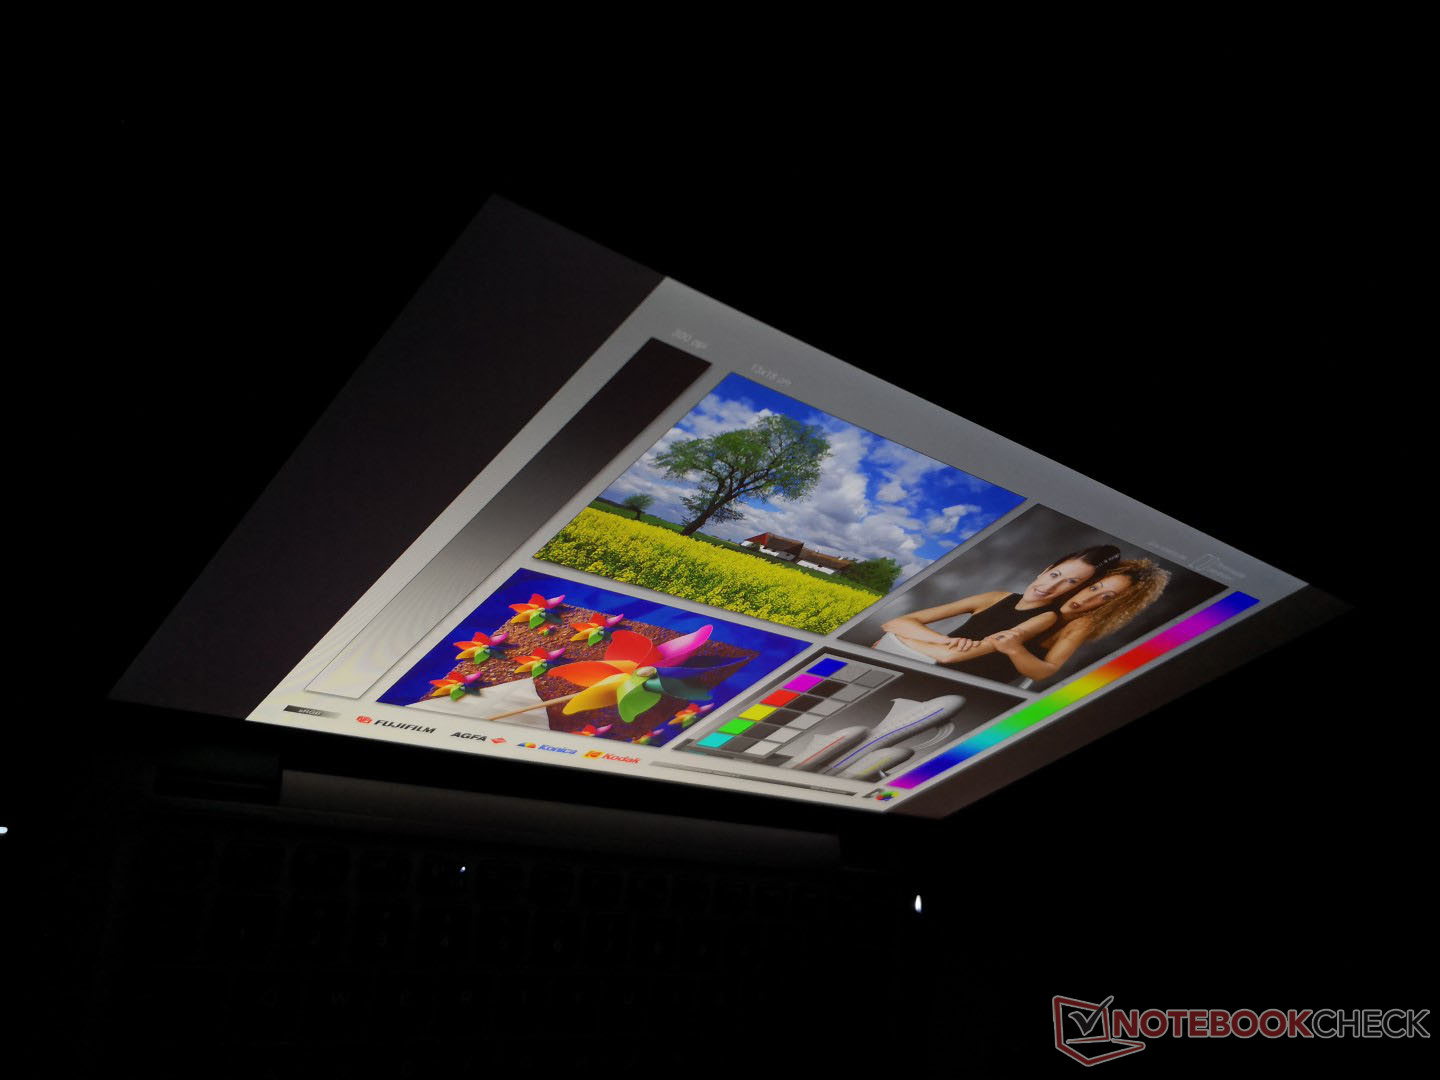
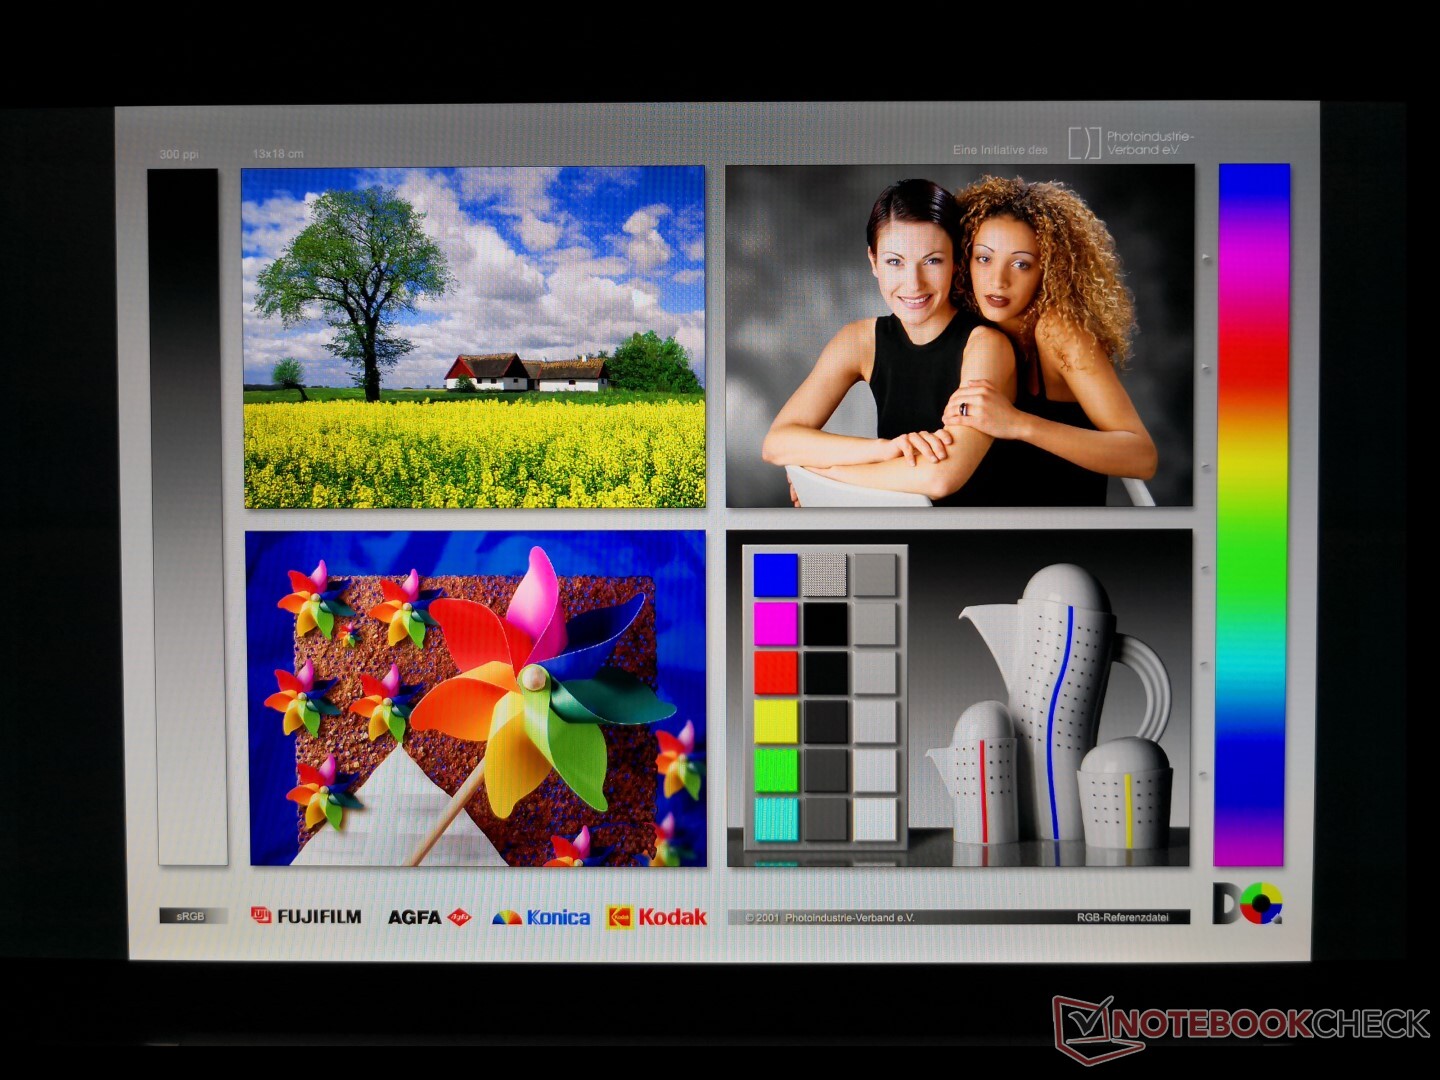
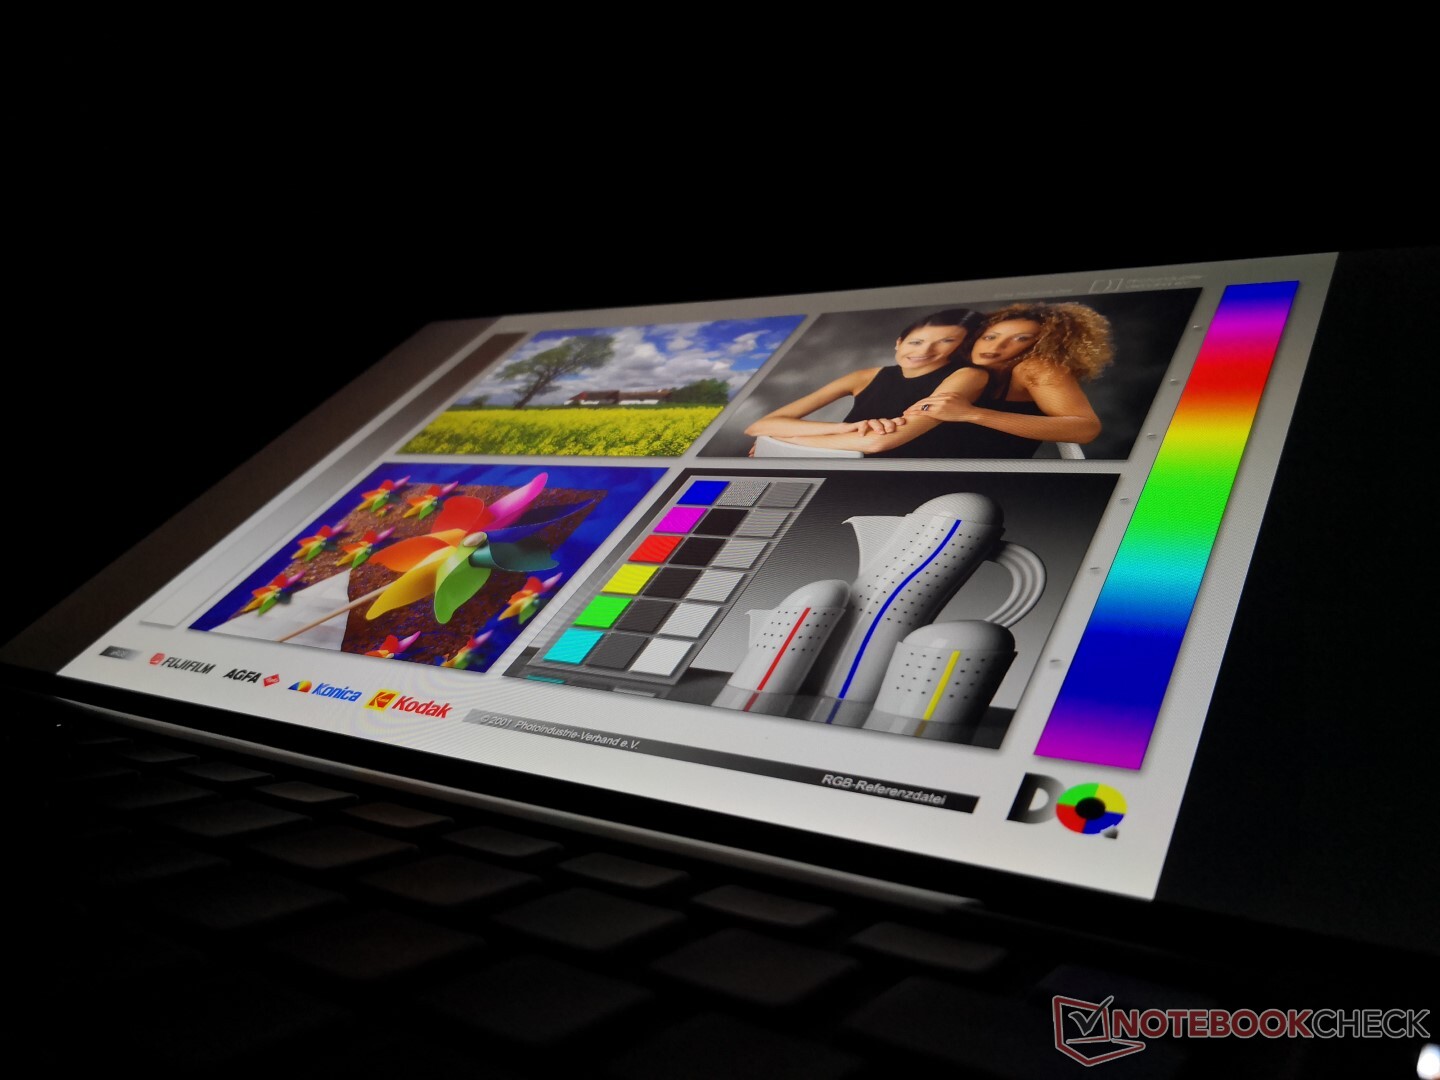
Display
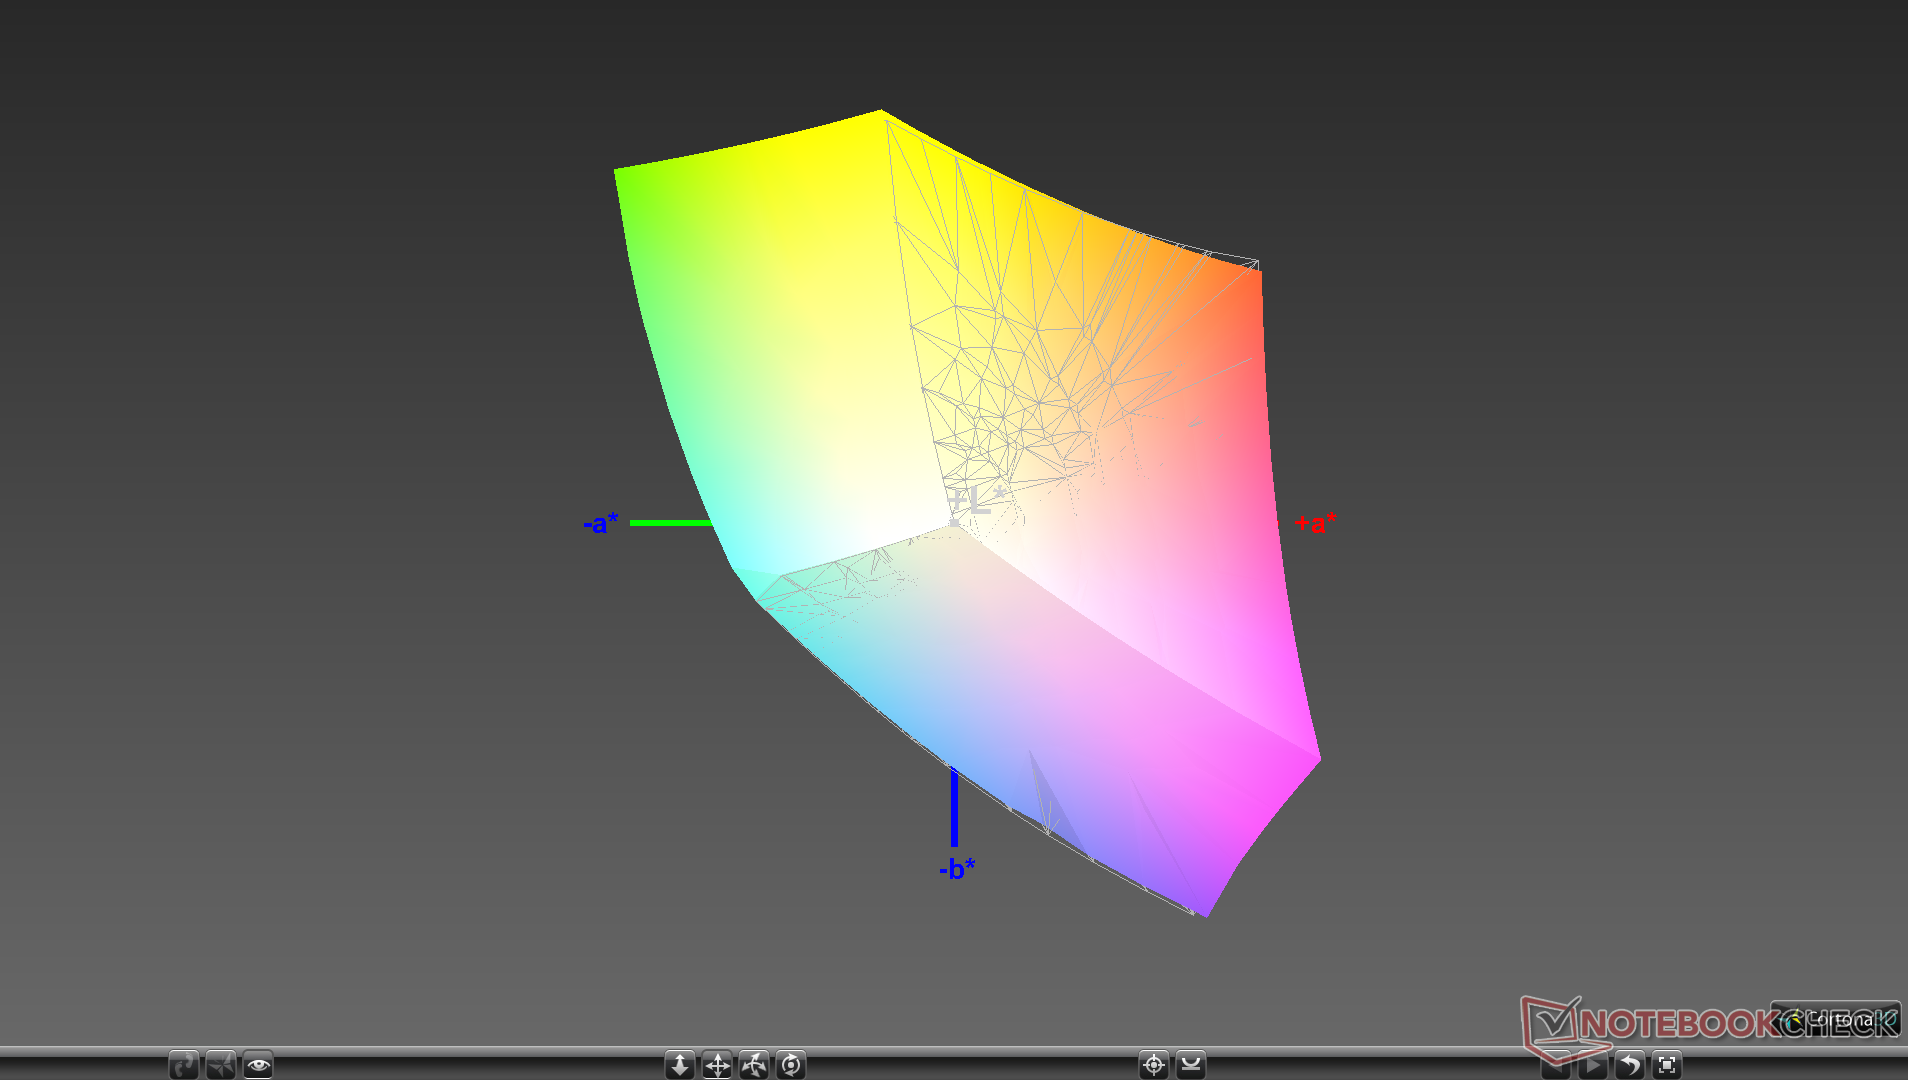
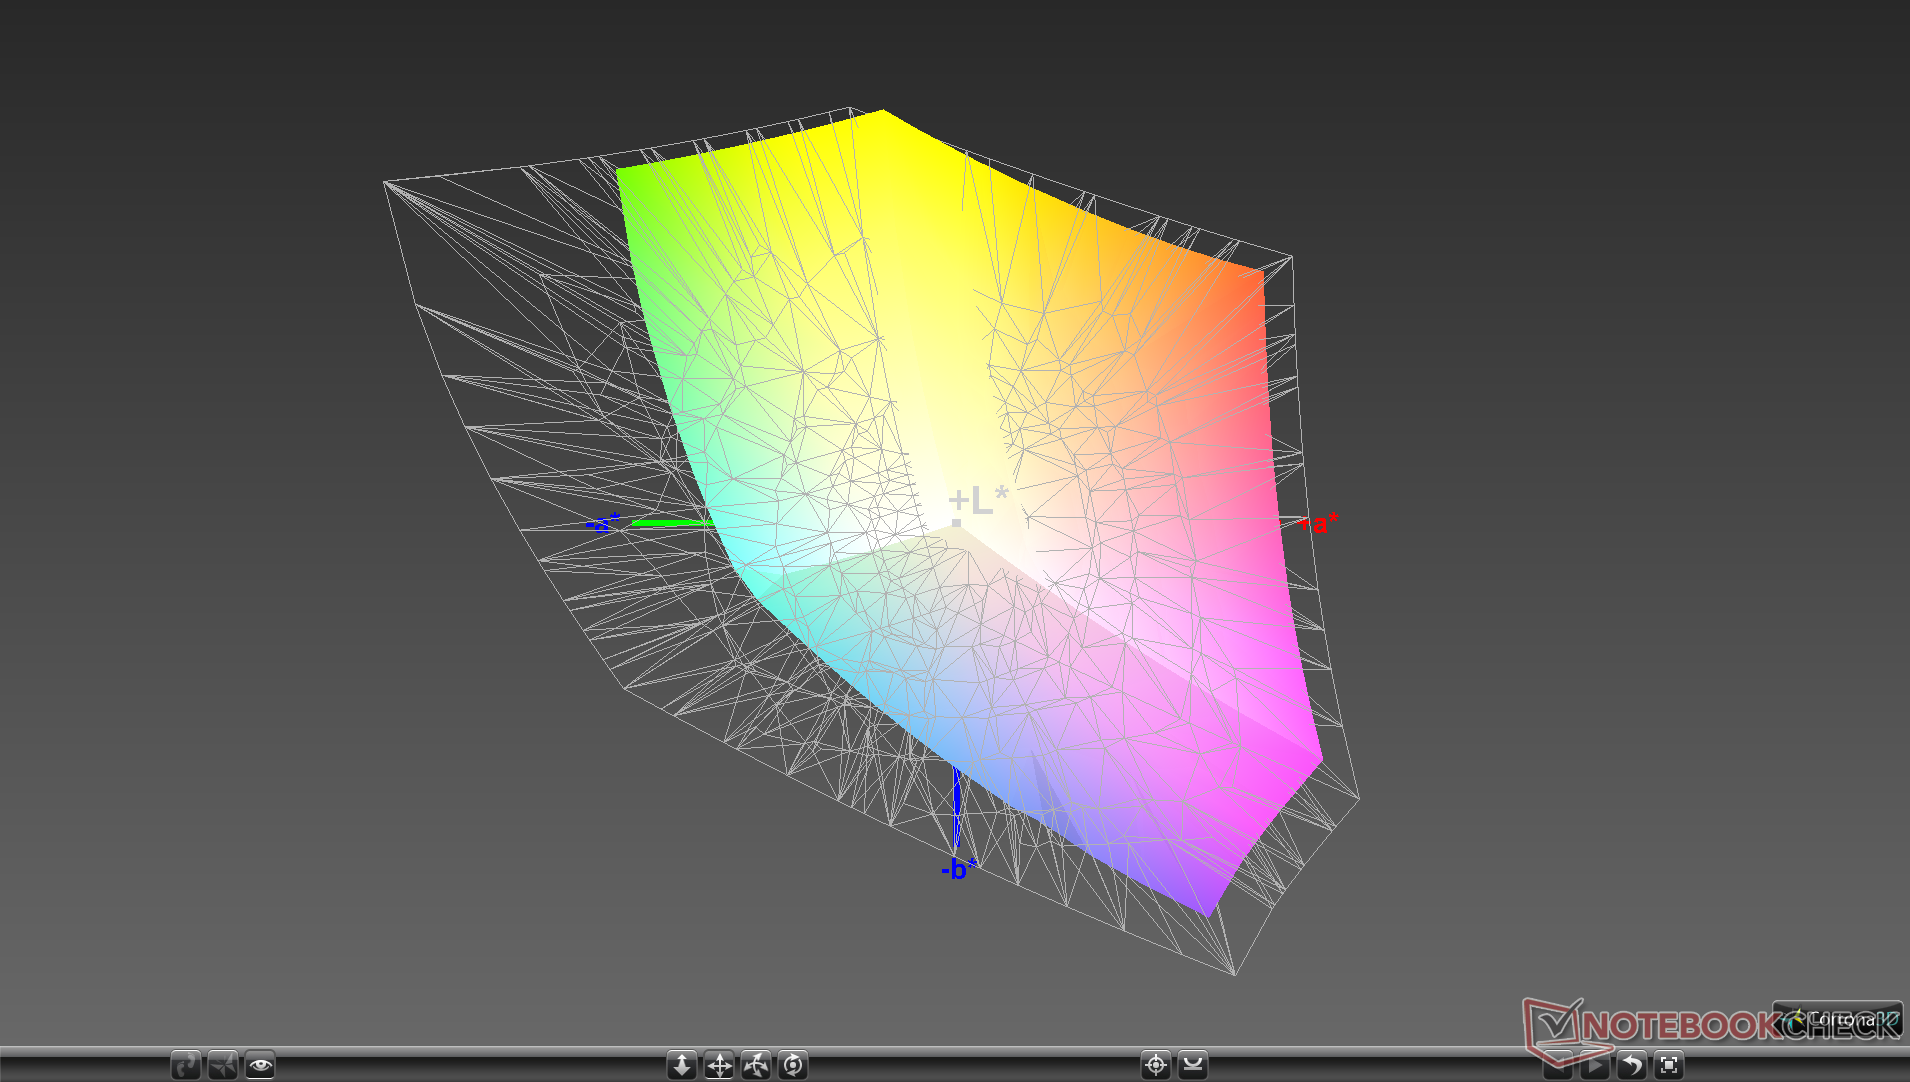
The Latitude 9410 2-in-1 uses the same Sharp SHP14D2 controller and Sharp LQ140M1 IPS touchscreen as on last year's Latitude 7400 2-in-1. Thus, it's not surprising to find that innate attributes like response times, contrast ratios, color coverage, brightness, and even pulse-width modulation frequencies are almost identical between the two models. Though the display is still excellent, it's somewhat disappointing to not see any year-over-year improvements such as higher resolution options or a brighter backlight like what HP offers on some competing EliteBooks.
Color reproduction covers all of sRGB and approximately 64 percent of AdobeRGB not unlike most high-end Ultrabooks.

| |||||||||||||||||||||||||
Brightness Distribution: 92 %
Center on Battery: 293.4 cd/m²
Contrast: 1544:1 (Black: 0.19 cd/m²)
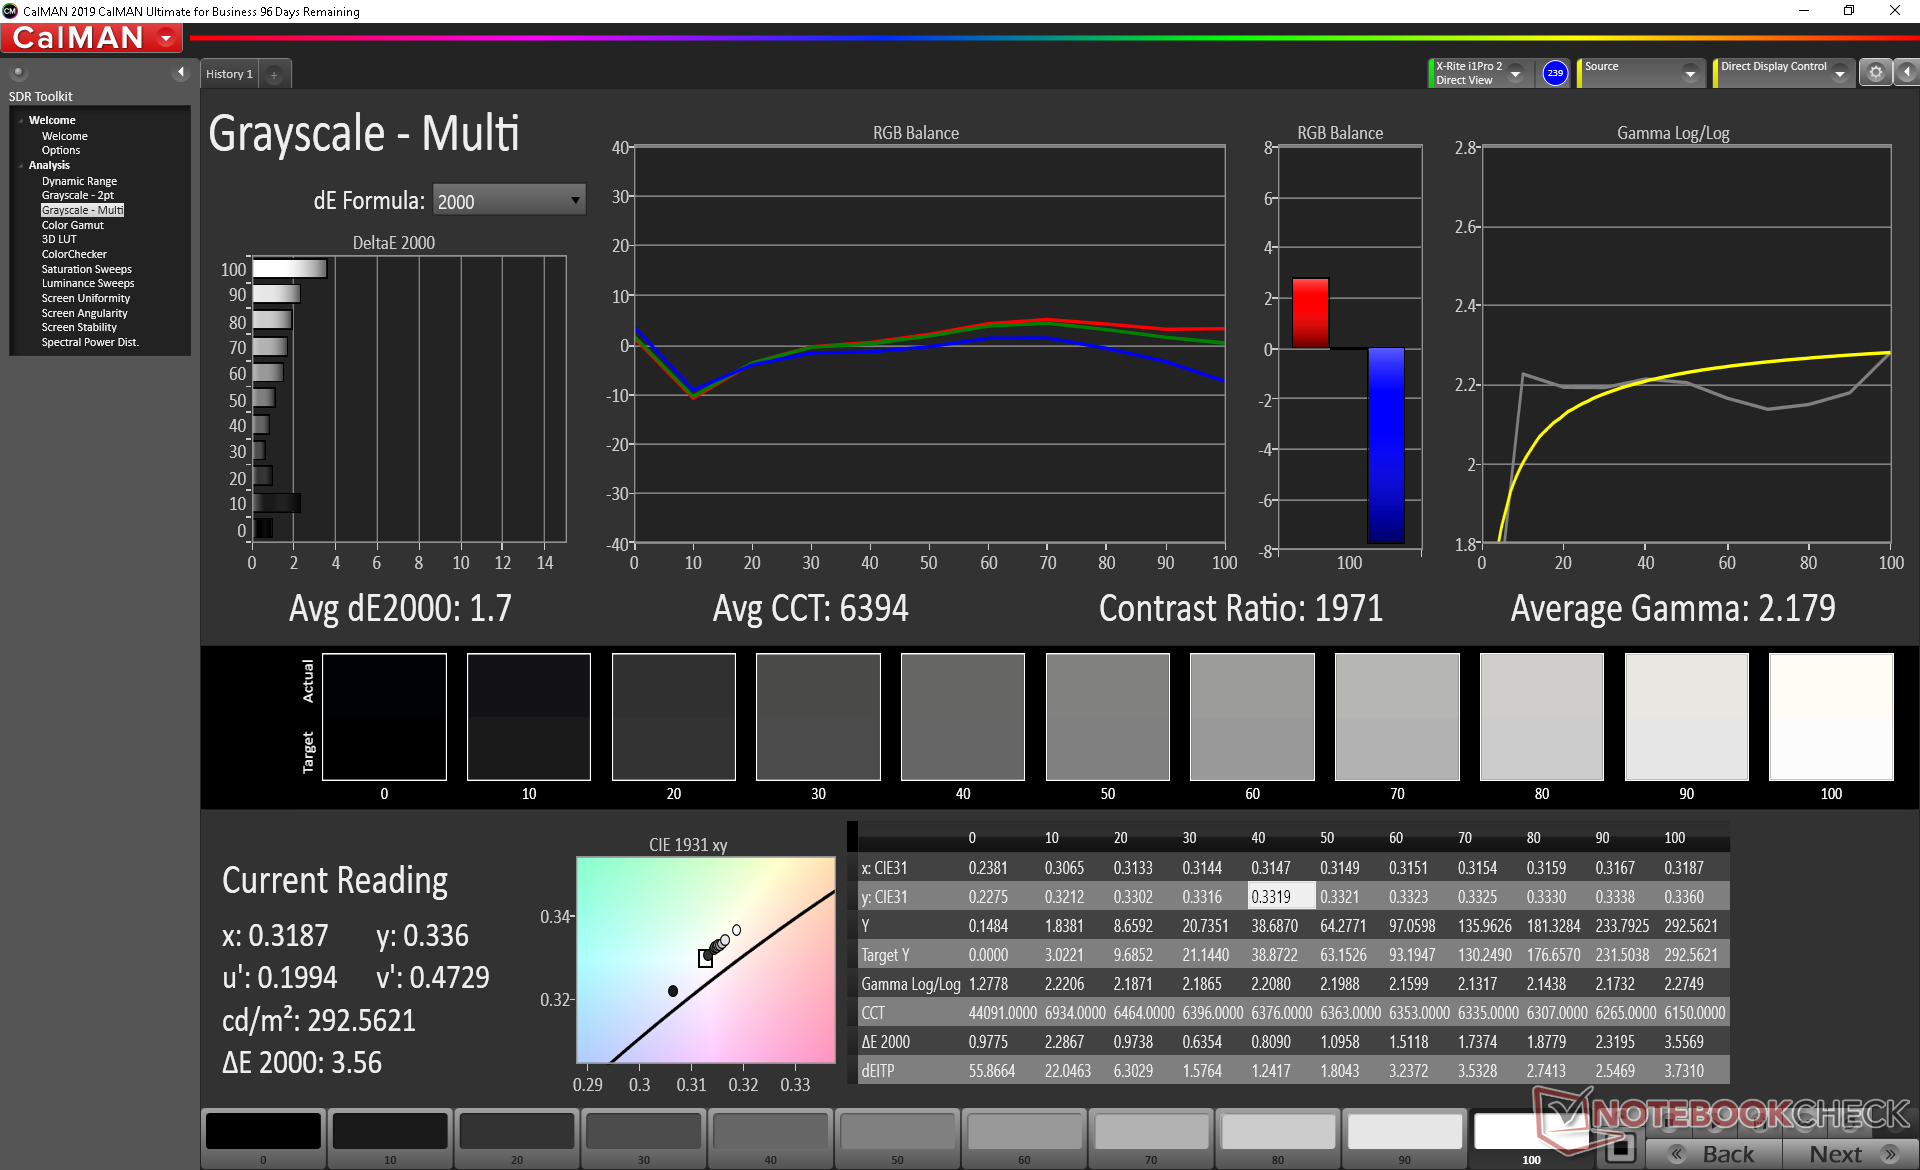
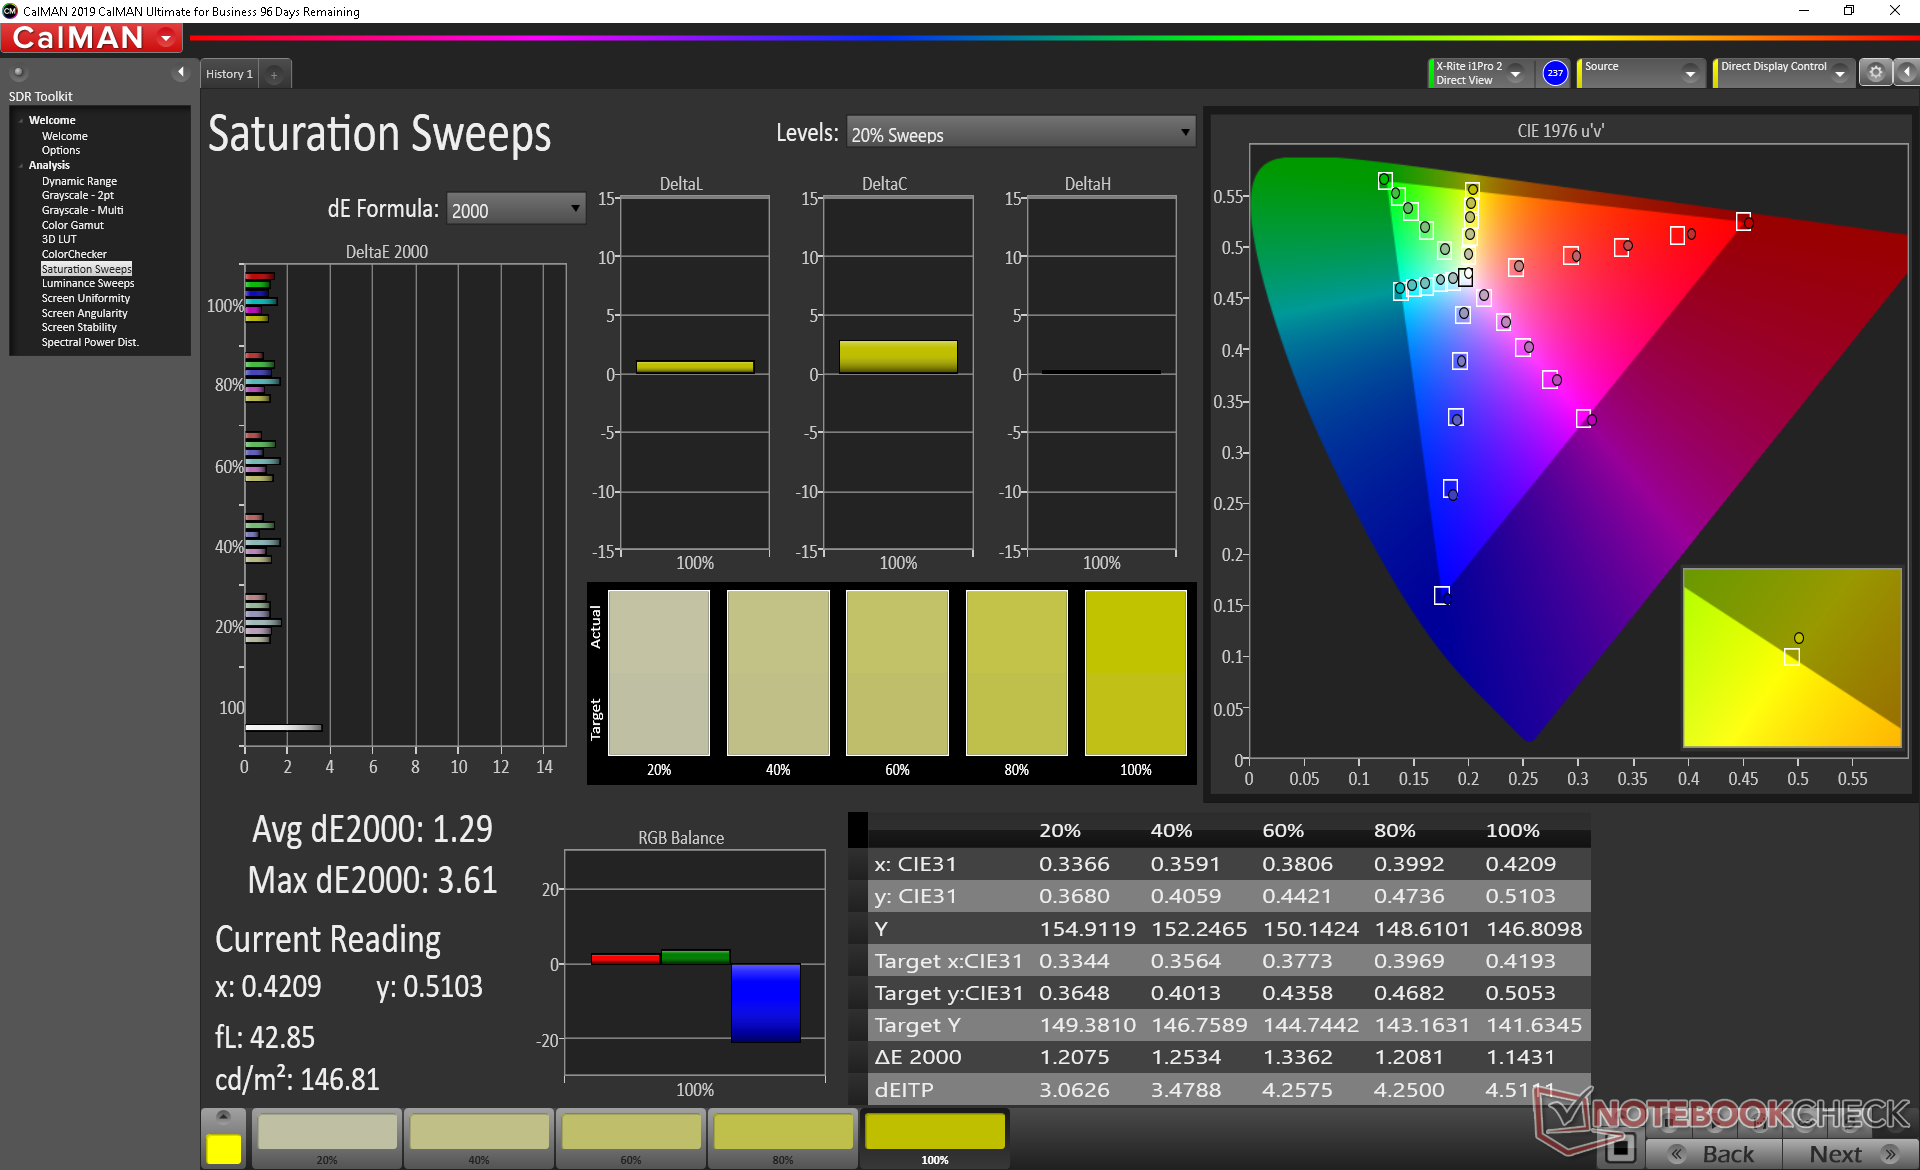
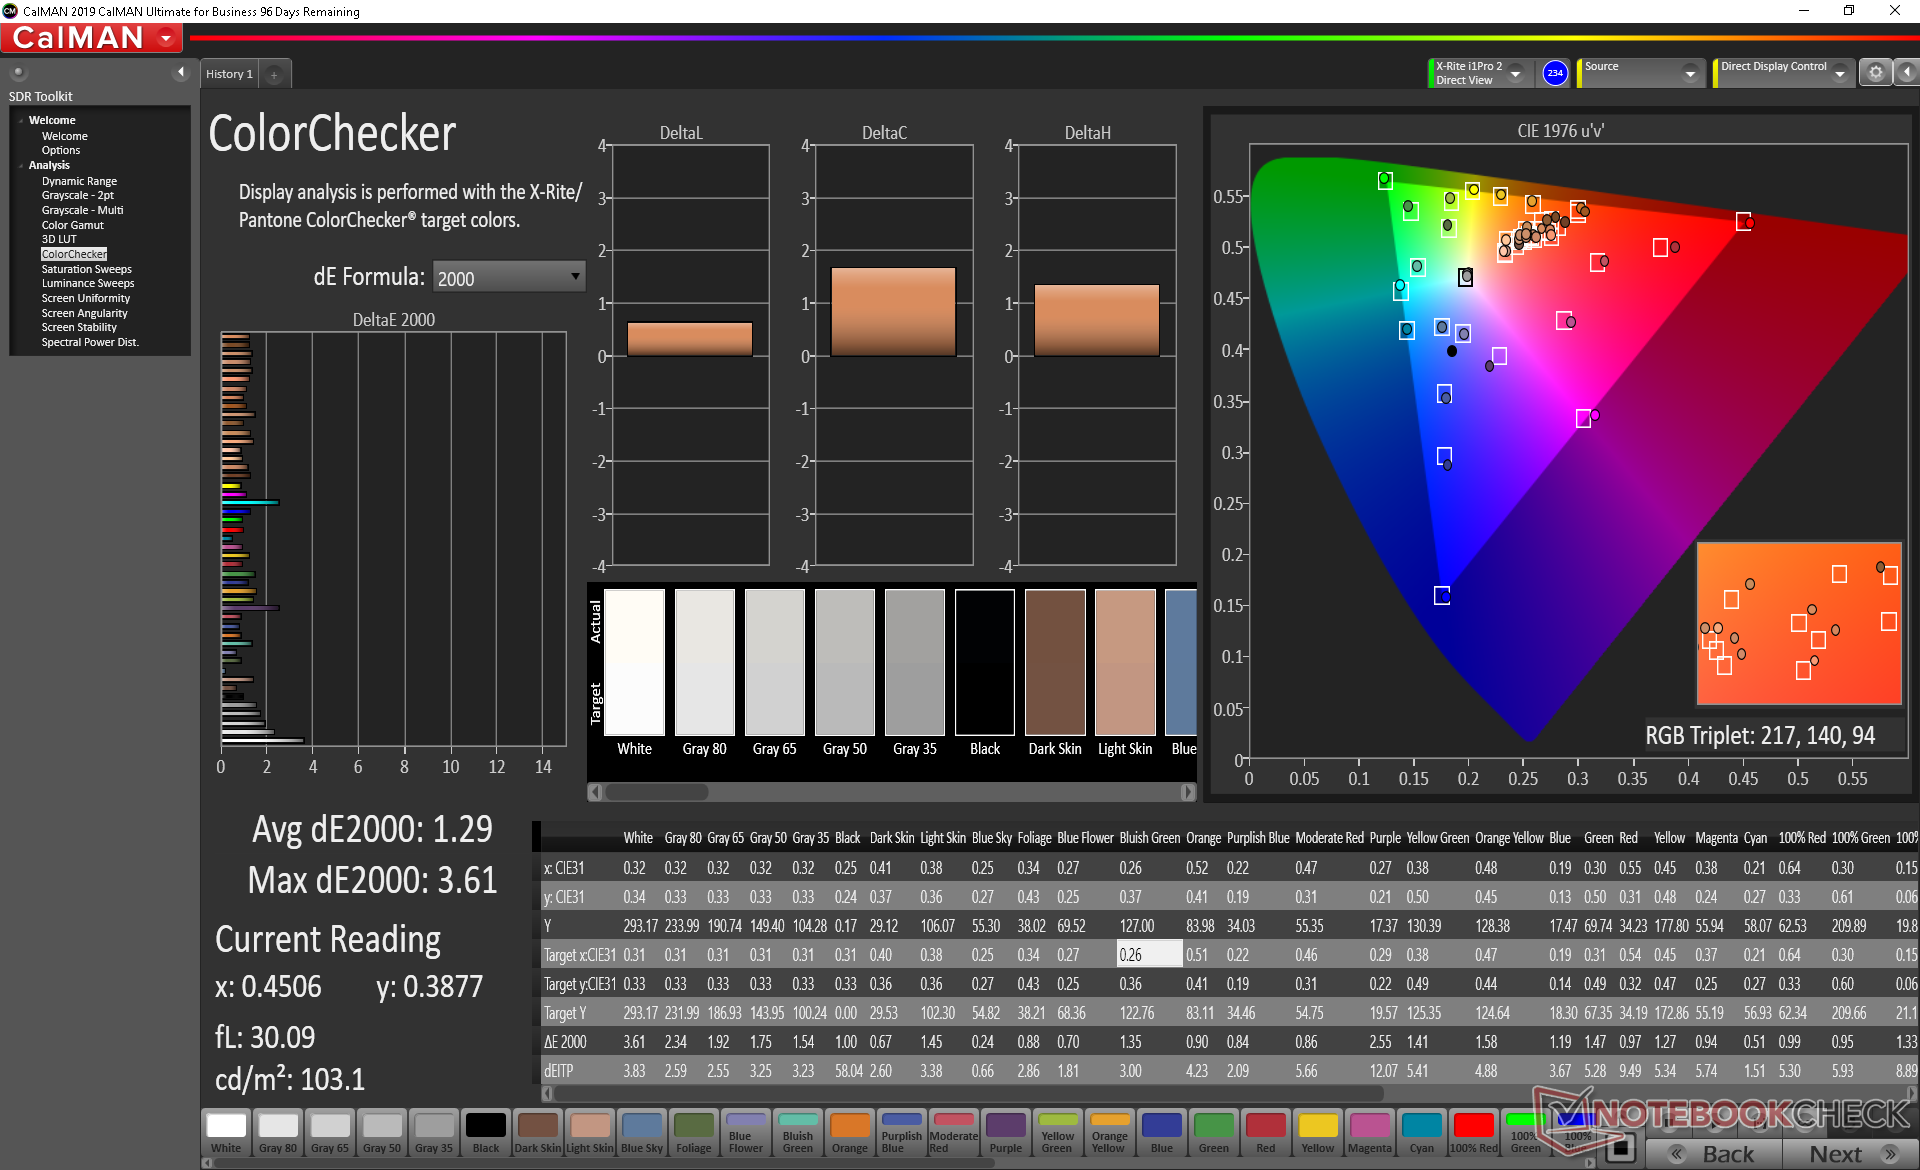
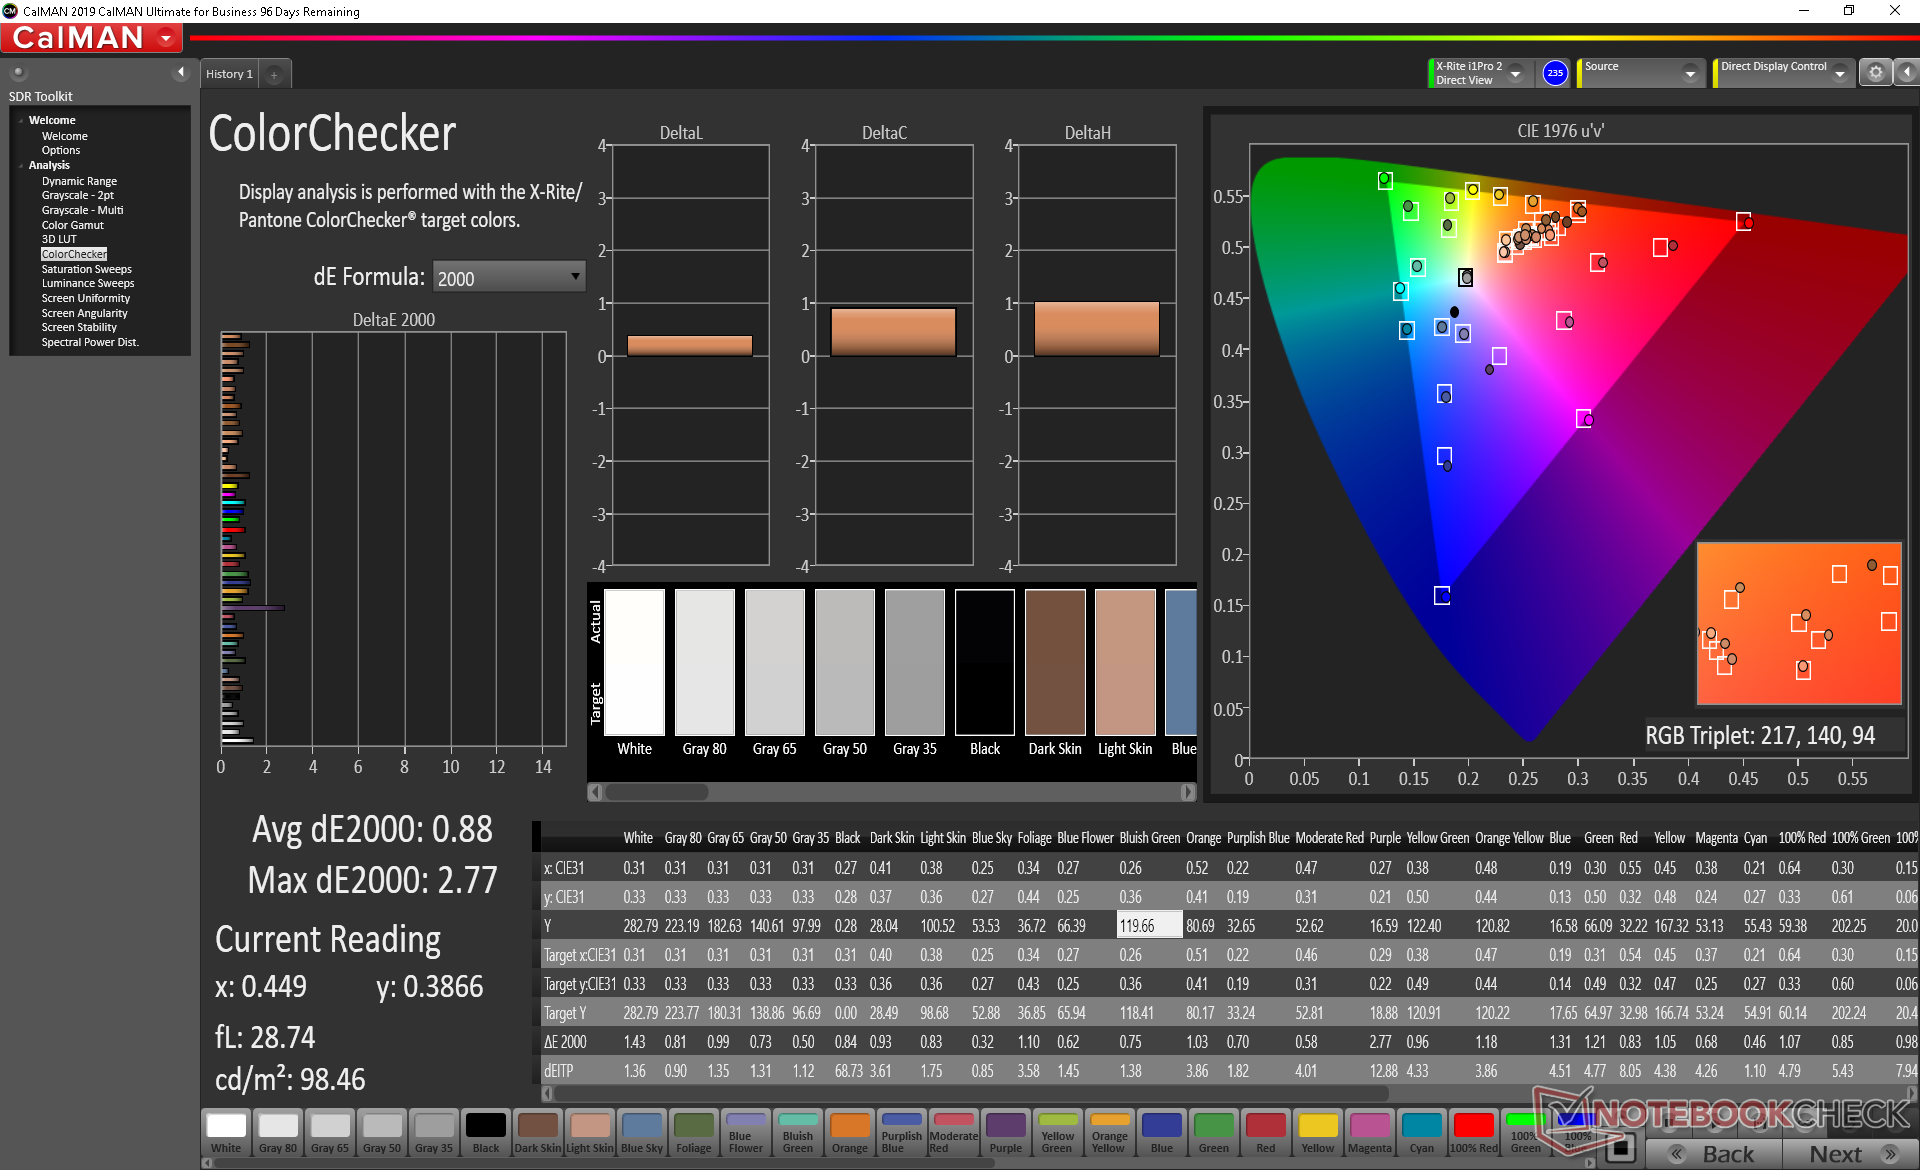
ΔE ColorChecker Calman: 1.29 | ∀{0.5-29.43 Ø4.71}
calibrated: 0.88
ΔE Greyscale Calman: 1.7 | ∀{0.09-98 Ø4.96}
99.1% sRGB (Argyll 1.6.3 3D)
63.8% AdobeRGB 1998 (Argyll 1.6.3 3D)
69.4% AdobeRGB 1998 (Argyll 3D)
99.2% sRGB (Argyll 3D)
68.1% Display P3 (Argyll 3D)
Gamma: 2.18
CCT: 6394 K
| Dell Latitude 14 9410 2-in-1 P110G Sharp LQ140M1, IPS, 14", 1920x1080 | Lenovo Yoga C940-14IIL LP140WF9-SPE2, IPS LED, 14", 1920x1080 | LG Gram 14T90N LG Philips LP140WFA-SPY1, IPS, 14", 1920x1080 | HP Elitebook x360 1040 G5 AU Optronics AUO533D, IPS, 14", 1920x1080 | Dell Latitude 7400 2-in-1 SHP14A2, IPS, 14", 1920x1080 | Asus ZenBook Flip 14 UX463FA-AI039T AU AUO323D, IPS, 14", 1920x1080 | |
|---|---|---|---|---|---|---|
| Display | -2% | -4% | -6% | 1% | -13% | |
| Display P3 Coverage (%) | 68.1 | 66 -3% | 65 -5% | 64.3 -6% | 68.6 1% | 60.1 -12% |
| sRGB Coverage (%) | 99.2 | 97.9 -1% | 95.7 -4% | 94.1 -5% | 99.6 0% | 85.5 -14% |
| AdobeRGB 1998 Coverage (%) | 69.4 | 67.3 -3% | 66.7 -4% | 65.5 -6% | 70 1% | 61.1 -12% |
| Response Times | 17% | 10% | -7% | 1% | 32% | |
| Response Time Grey 50% / Grey 80% * (ms) | 58.4 ? | 49.6 ? 15% | 54 ? 8% | 70.8 ? -21% | 56 ? 4% | 36 ? 38% |
| Response Time Black / White * (ms) | 37.2 ? | 30 ? 19% | 32.8 ? 12% | 34.4 ? 8% | 38 ? -2% | 28 ? 25% |
| PWM Frequency (Hz) | 1667 ? | 735 ? | 1667 ? | |||
| Screen | -27% | -45% | -32% | -26% | -69% | |
| Brightness middle (cd/m²) | 293.4 | 384 31% | 322.2 10% | 416.3 42% | 277.2 -6% | 280 -5% |
| Brightness (cd/m²) | 290 | 363 25% | 301 4% | 400 38% | 263 -9% | 286 -1% |
| Brightness Distribution (%) | 92 | 90 -2% | 86 -7% | 89 -3% | 83 -10% | 78 -15% |
| Black Level * (cd/m²) | 0.19 | 0.17 11% | 0.25 -32% | 0.29 -53% | 0.2 -5% | 0.208 -9% |
| Contrast (:1) | 1544 | 2259 46% | 1289 -17% | 1436 -7% | 1386 -10% | 1346 -13% |
| Colorchecker dE 2000 * | 1.29 | 3.5 -171% | 3.62 -181% | 2.69 -109% | 2.1 -63% | 3.97 -208% |
| Colorchecker dE 2000 max. * | 3.61 | 5.5 -52% | 6.9 -91% | 4.95 -37% | 5.91 -64% | 8.29 -130% |
| Colorchecker dE 2000 calibrated * | 0.88 | 1 -14% | 1.22 -39% | 2.13 -142% | 1.03 -17% | 3.42 -289% |
| Greyscale dE 2000 * | 1.7 | 4.6 -171% | 3.9 -129% | 2.9 -71% | 3.4 -100% | 2.83 -66% |
| Gamma | 2.18 101% | 2.32 95% | 2.43 91% | 2.4 92% | 2.241 98% | 2.34 94% |
| CCT | 6394 102% | 6884 94% | 6344 102% | 6623 98% | 6030 108% | 6556 99% |
| Color Space (Percent of AdobeRGB 1998) (%) | 63.8 | 62 -3% | 61.3 -4% | 60.1 -6% | 64 0% | 56 -12% |
| Color Space (Percent of sRGB) (%) | 99.1 | 97.7 -1% | 95.6 -4% | 94.5 -5% | 100 1% | 85 -14% |
| Total Average (Program / Settings) | -4% /
-17% | -13% /
-30% | -15% /
-24% | -8% /
-17% | -17% /
-46% |
* ... smaller is better
X-Rite colorimeter measurements reveal a well-calibrated display out of the box with average grayscale and color deltaE values of only 1.7 and 1.29, respectively. Calibrating the panel even further ourselves would result in even lower deltaE values to be one of the most color accurate sRGB displays we've seen on any subnotebook.


Display Response Times
| ↔ Response Time Black to White | ||
|---|---|---|
| 37.2 ms ... rise ↗ and fall ↘ combined | ↗ 18.4 ms rise | 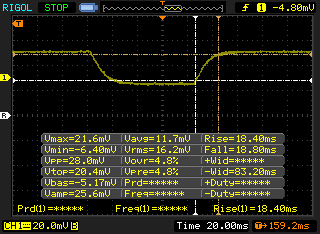 |
| ↘ 18.8 ms fall | ||
| The screen shows slow response rates in our tests and will be unsatisfactory for gamers. In comparison, all tested devices range from 0.1 (minimum) to 240 (maximum) ms. » 95 % of all devices are better. This means that the measured response time is worse than the average of all tested devices (19.8 ms). | ||
| ↔ Response Time 50% Grey to 80% Grey | ||
| 58.4 ms ... rise ↗ and fall ↘ combined | ↗ 26 ms rise | 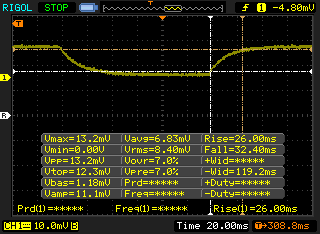 |
| ↘ 32.4 ms fall | ||
| The screen shows slow response rates in our tests and will be unsatisfactory for gamers. In comparison, all tested devices range from 0.165 (minimum) to 636 (maximum) ms. » 95 % of all devices are better. This means that the measured response time is worse than the average of all tested devices (31 ms). | ||
Screen Flickering / PWM (Pulse-Width Modulation)
| Screen flickering / PWM detected | 1667 Hz | ≤ 44 % brightness setting |  |
The display backlight flickers at 1667 Hz (worst case, e.g., utilizing PWM) Flickering detected at a brightness setting of 44 % and below. There should be no flickering or PWM above this brightness setting. The frequency of 1667 Hz is quite high, so most users sensitive to PWM should not notice any flickering. In comparison: 52 % of all tested devices do not use PWM to dim the display. If PWM was detected, an average of 7754 (minimum: 5 - maximum: 343500) Hz was measured. | |||
Outdoor visibility hasn't changed from the Latitude 7400 2-in-1 since they use the same Sharp IPS panel with almost equal brightness. Dell's own XPS 13 convertible comes equipped with a noticeably brighter display than what is offered here on the Latitude (550 nits vs. 300 nits).
Performance
Most people might assume that the Core i7-10610U will perform faster than the Core i7-10510U based on their product names alone. However, the Core i7-10610U and Core i7-10510U are differentiated by vPro support and not raw performance much like the last generation Core i7-8665U and Core i7-8565U. Dell offers no other options outside of Core i5 and Core i7 Comet Lake-U processors.
All benchmarks below were performed on Dell's Ultra Performance power profile for the highest scores possible.
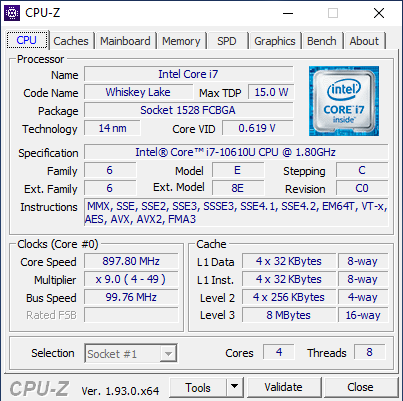
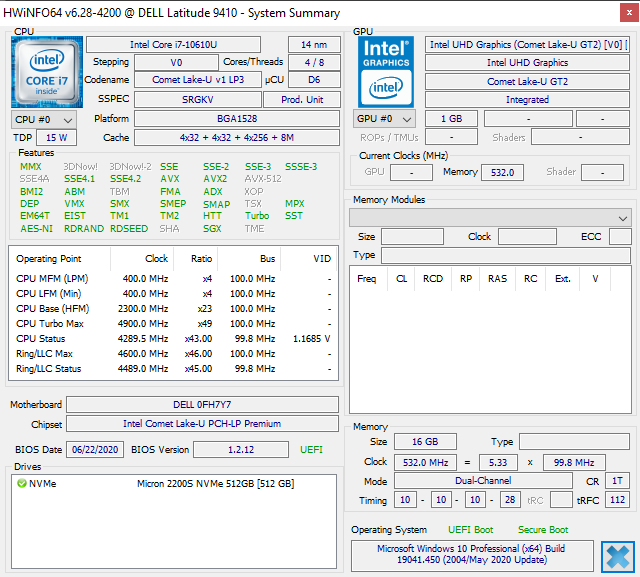
Processor
Raw CPU performance is not all that different from the lesser Core i5-10210U, i5-10310U, or even the last generation Core i7-8565U. Users will have to configure with the higher-end hexa-core Core i7-10810U option for any appreciable gains in this regard.
Running CineBench R15 xT in a loop returns fluctuating scores as shown by our graph below due to the cycling core clock rates and temperatures when the system is subjected to extreme stress. In comparison, most other laptops have a high initial burst in speed before falling and stabilizing at fixed clock rates and temperatures. This behavior is explained in more detail in our Stress Test section below.
See our dedicated page on the Core i7-10610U for more technical information and benchmarks.
Cinebench R15: CPU Multi 64Bit | CPU Single 64Bit
Blender: v2.79 BMW27 CPU
7-Zip 18.03: 7z b 4 -mmt1 | 7z b 4
Geekbench 5.5: Single-Core | Multi-Core
HWBOT x265 Benchmark v2.2: 4k Preset
LibreOffice : 20 Documents To PDF
R Benchmark 2.5: Overall mean
| Geekbench 5.5 / Single-Core | |
| LG Gram 14T90N | |
| Average Intel Core i7-10610U (1155 - 1261, n=6) | |
| Acer TravelMate P6 P614-51T-G2-72ZU | |
| Dell Latitude 14 9410 2-in-1 P110G | |
| Asus VivoBook Flip 14 TM420IA | |
| Lenovo ThinkPad E14 Gen2-20T7S00W00 | |
| Lenovo ThinkPad T14s-20T00044GE | |
| Geekbench 5.5 / Multi-Core | |
| Asus VivoBook Flip 14 TM420IA | |
| Lenovo ThinkPad E14 Gen2-20T7S00W00 | |
| Acer TravelMate P6 P614-51T-G2-72ZU | |
| Average Intel Core i7-10610U (3731 - 4622, n=6) | |
| Dell Latitude 14 9410 2-in-1 P110G | |
| Lenovo ThinkPad T14s-20T00044GE | |
| LG Gram 14T90N | |
| LibreOffice / 20 Documents To PDF | |
| Dell Latitude 14 9410 2-in-1 P110G | |
| Average Intel Core i7-10610U (56.1 - 106, n=6) | |
| Lenovo ThinkPad E14 Gen2-20T7S00W00 | |
| LG Gram 14T90N | |
| Asus VivoBook Flip 14 TM420IA | |
| Acer TravelMate P6 P614-51T-G2-72ZU | |
| Lenovo ThinkPad T14s-20T00044GE | |
| R Benchmark 2.5 / Overall mean | |
| Dell Latitude 14 9410 2-in-1 P110G | |
| Lenovo ThinkPad T14s-20T00044GE | |
| Average Intel Core i7-10610U (0.637 - 0.855, n=6) | |
| LG Gram 14T90N | |
| Acer TravelMate P6 P614-51T-G2-72ZU | |
| Lenovo ThinkPad E14 Gen2-20T7S00W00 | |
| Asus VivoBook Flip 14 TM420IA | |
Cinebench R15: CPU Multi 64Bit | CPU Single 64Bit
Blender: v2.79 BMW27 CPU
7-Zip 18.03: 7z b 4 -mmt1 | 7z b 4
Geekbench 5.5: Single-Core | Multi-Core
HWBOT x265 Benchmark v2.2: 4k Preset
LibreOffice : 20 Documents To PDF
R Benchmark 2.5: Overall mean
* ... smaller is better
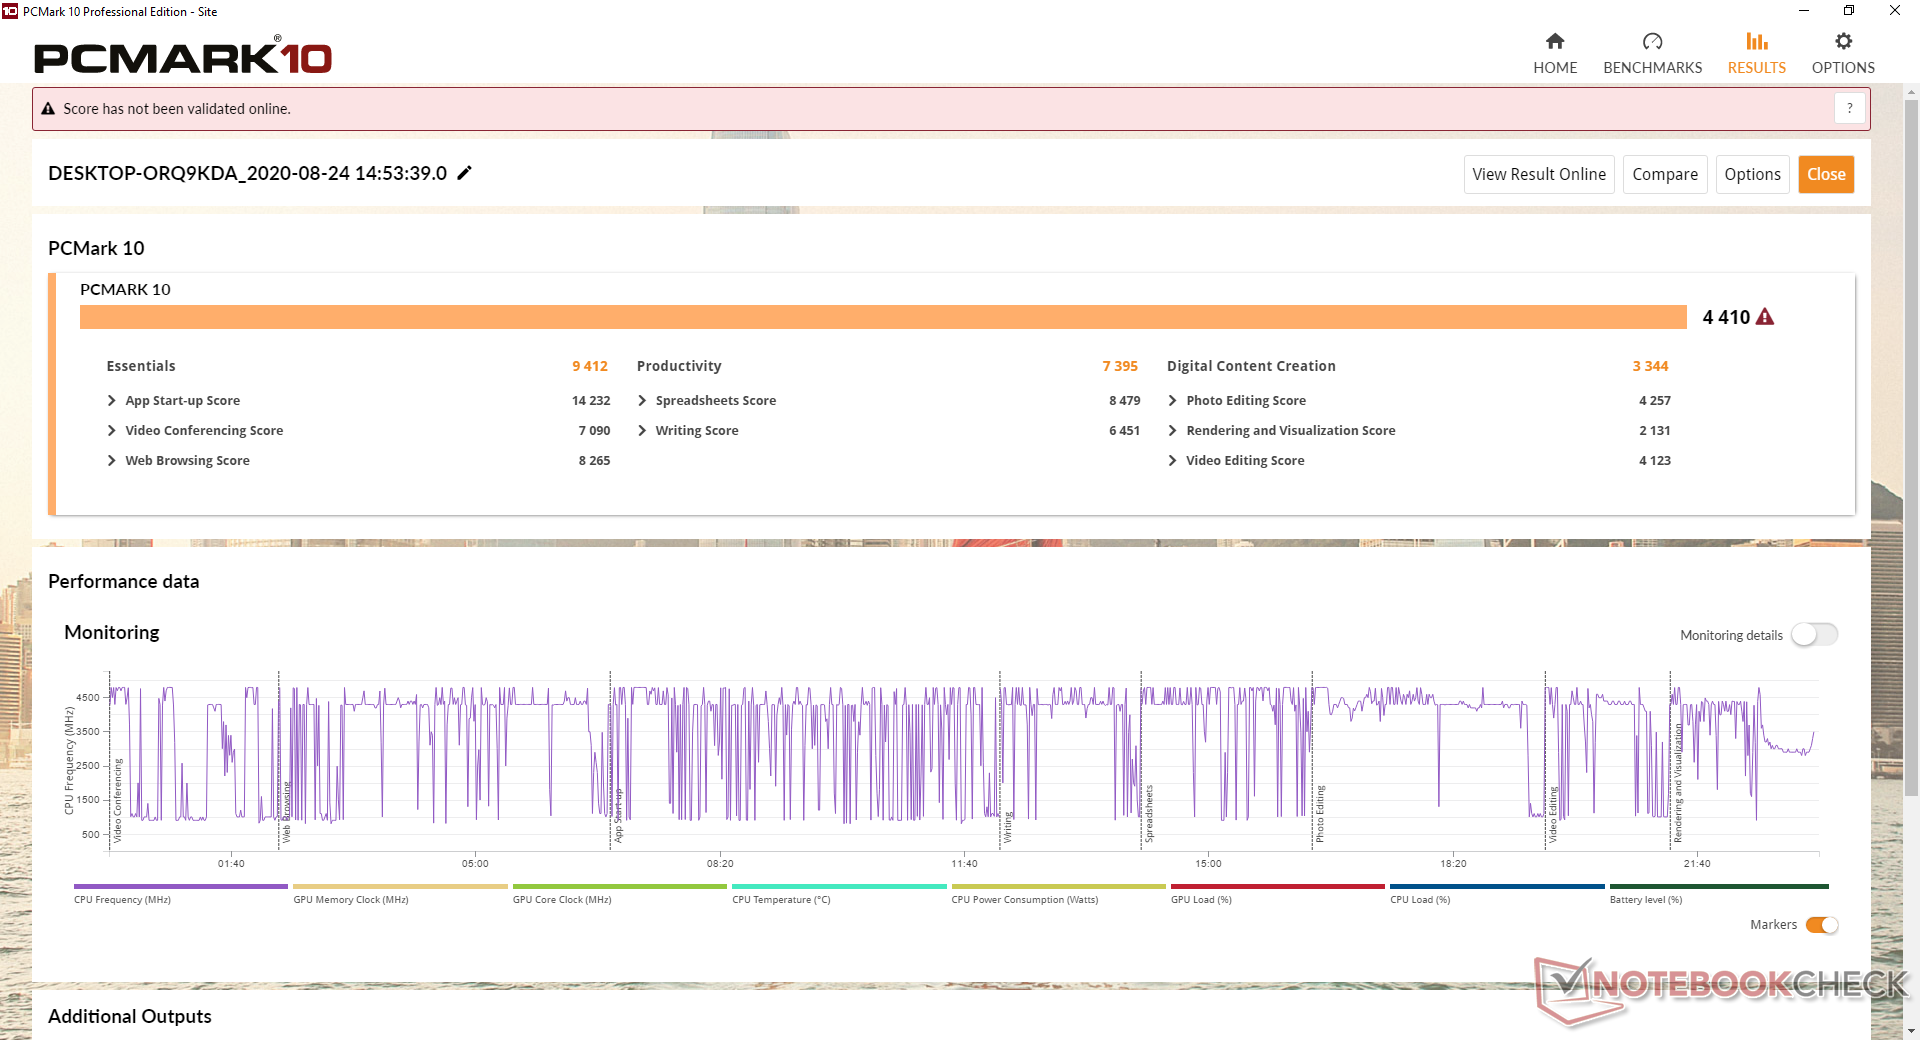
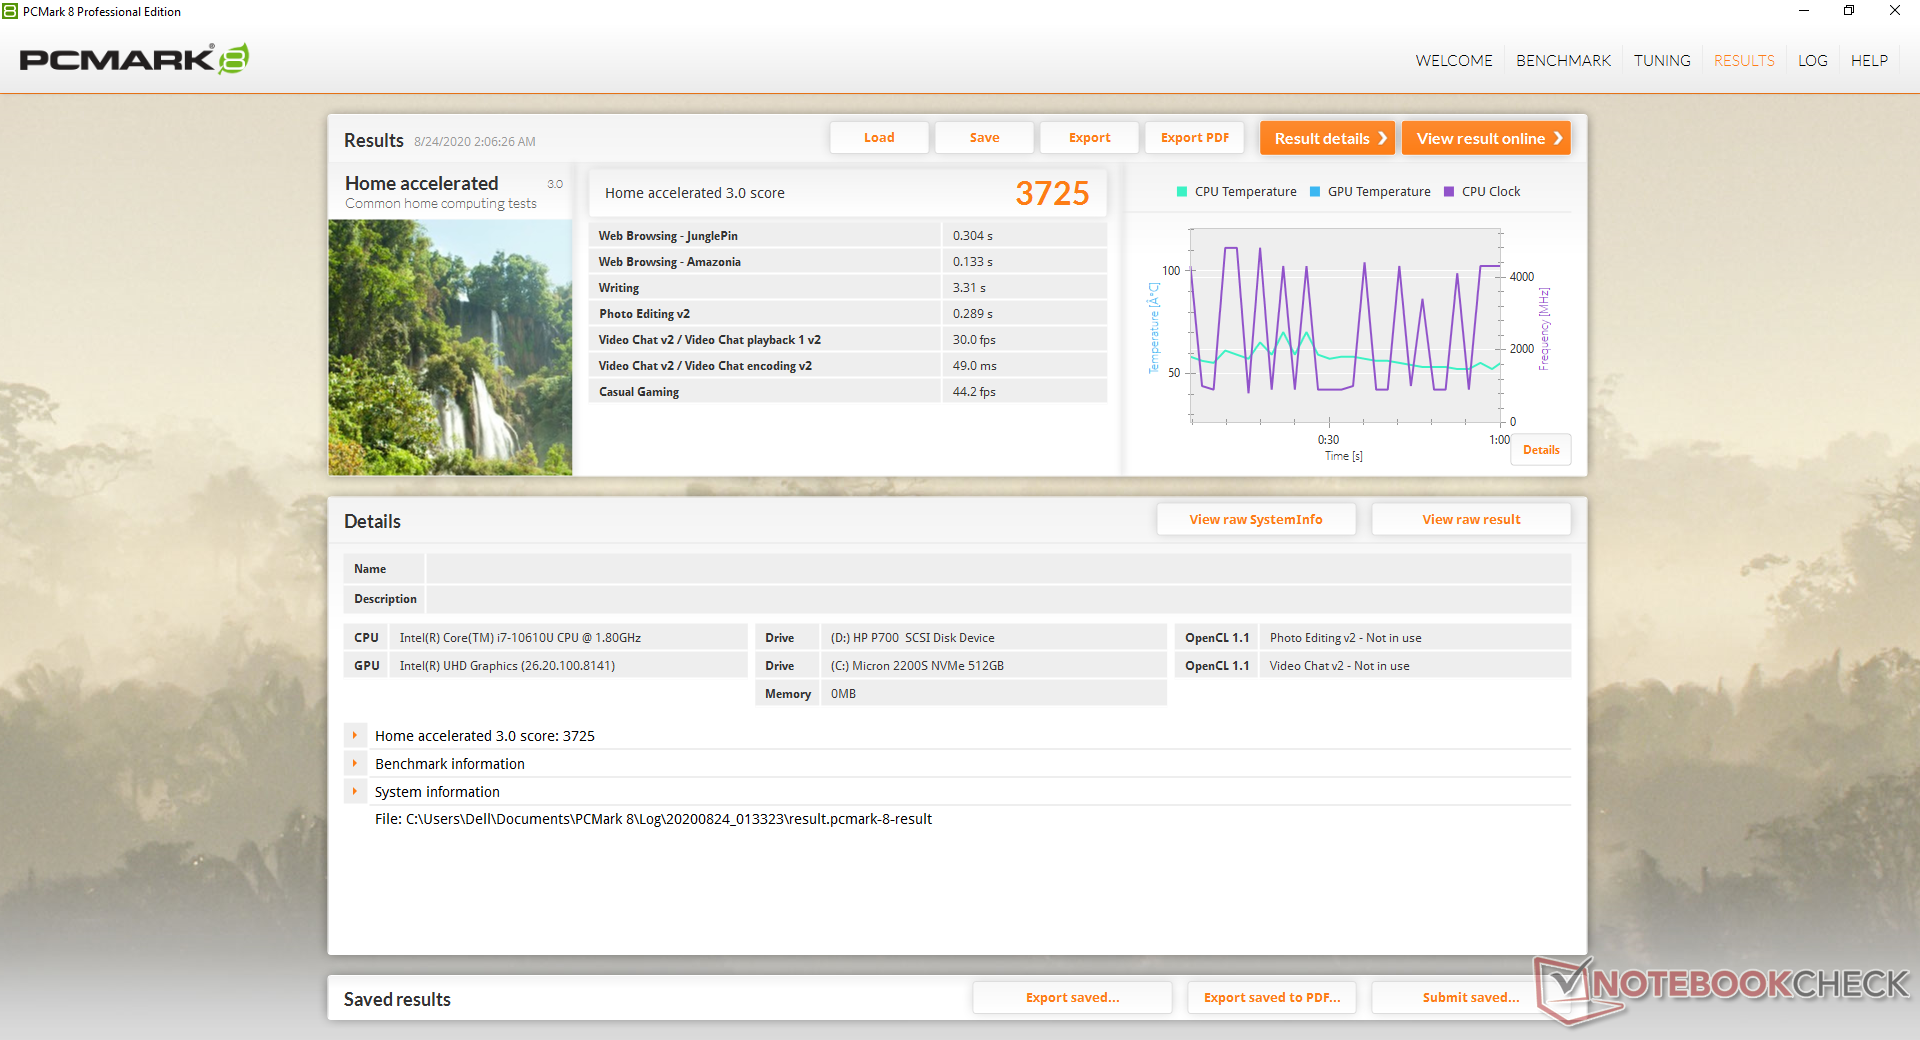
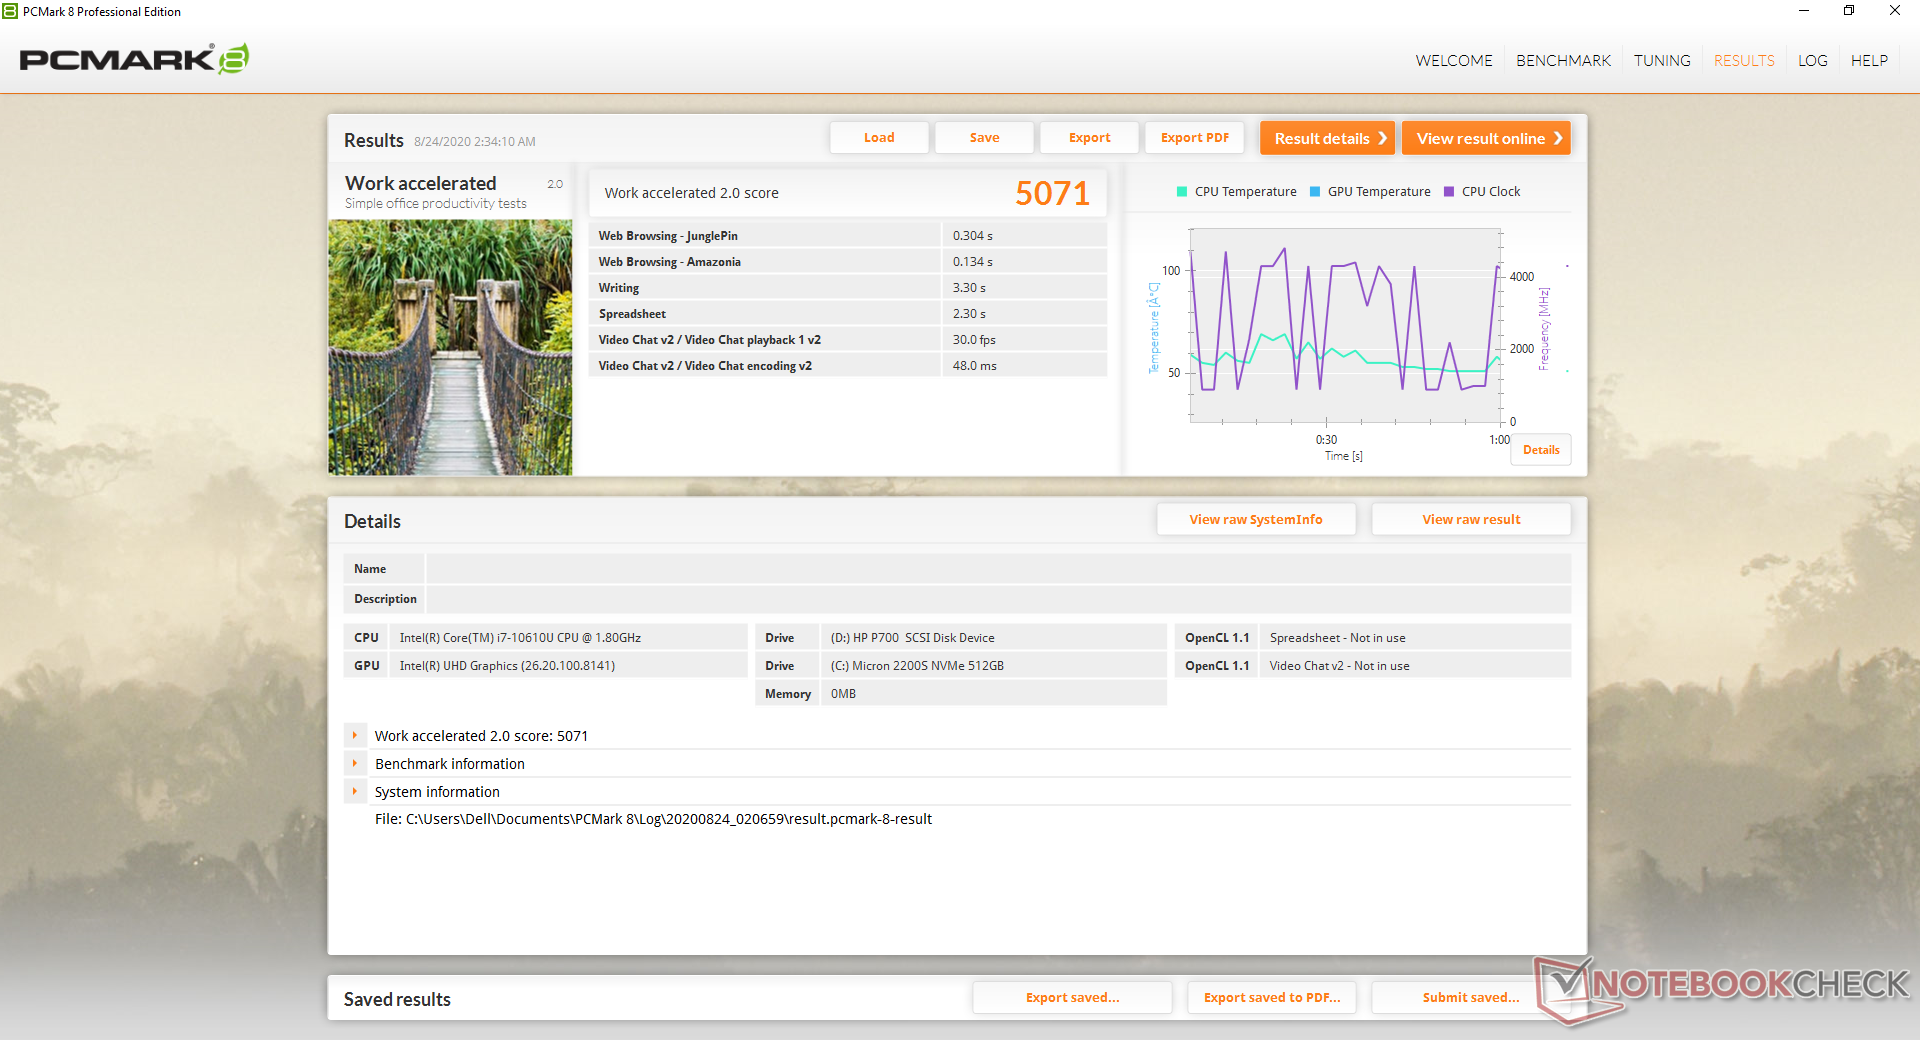
System Performance
PCMark results are in the same ballpark as other 14-inch subnotebooks equipped with UHD Graphics and Core U-series CPUs. Scores are consistently higher than the older Latitude 7400 2-in-1 albeit just marginally. We didn't experience any software or hardware issues during our time with the test unit.
| PCMark 8 | |
| Home Score Accelerated v2 | |
| Lenovo Yoga C940-14IIL | |
| Dell Latitude 14 9410 2-in-1 P110G | |
| LG Gram 14T90N | |
| Dell Latitude 7400 2-in-1 | |
| HP Elitebook x360 1040 G5 | |
| Work Score Accelerated v2 | |
| Lenovo Yoga C940-14IIL | |
| LG Gram 14T90N | |
| Dell Latitude 14 9410 2-in-1 P110G | |
| Dell Latitude 7400 2-in-1 | |
| HP Elitebook x360 1040 G5 | |
| PCMark 8 Home Score Accelerated v2 | 3725 points | |
| PCMark 8 Work Score Accelerated v2 | 5071 points | |
| PCMark 10 Score | 4410 points | |
Help | ||
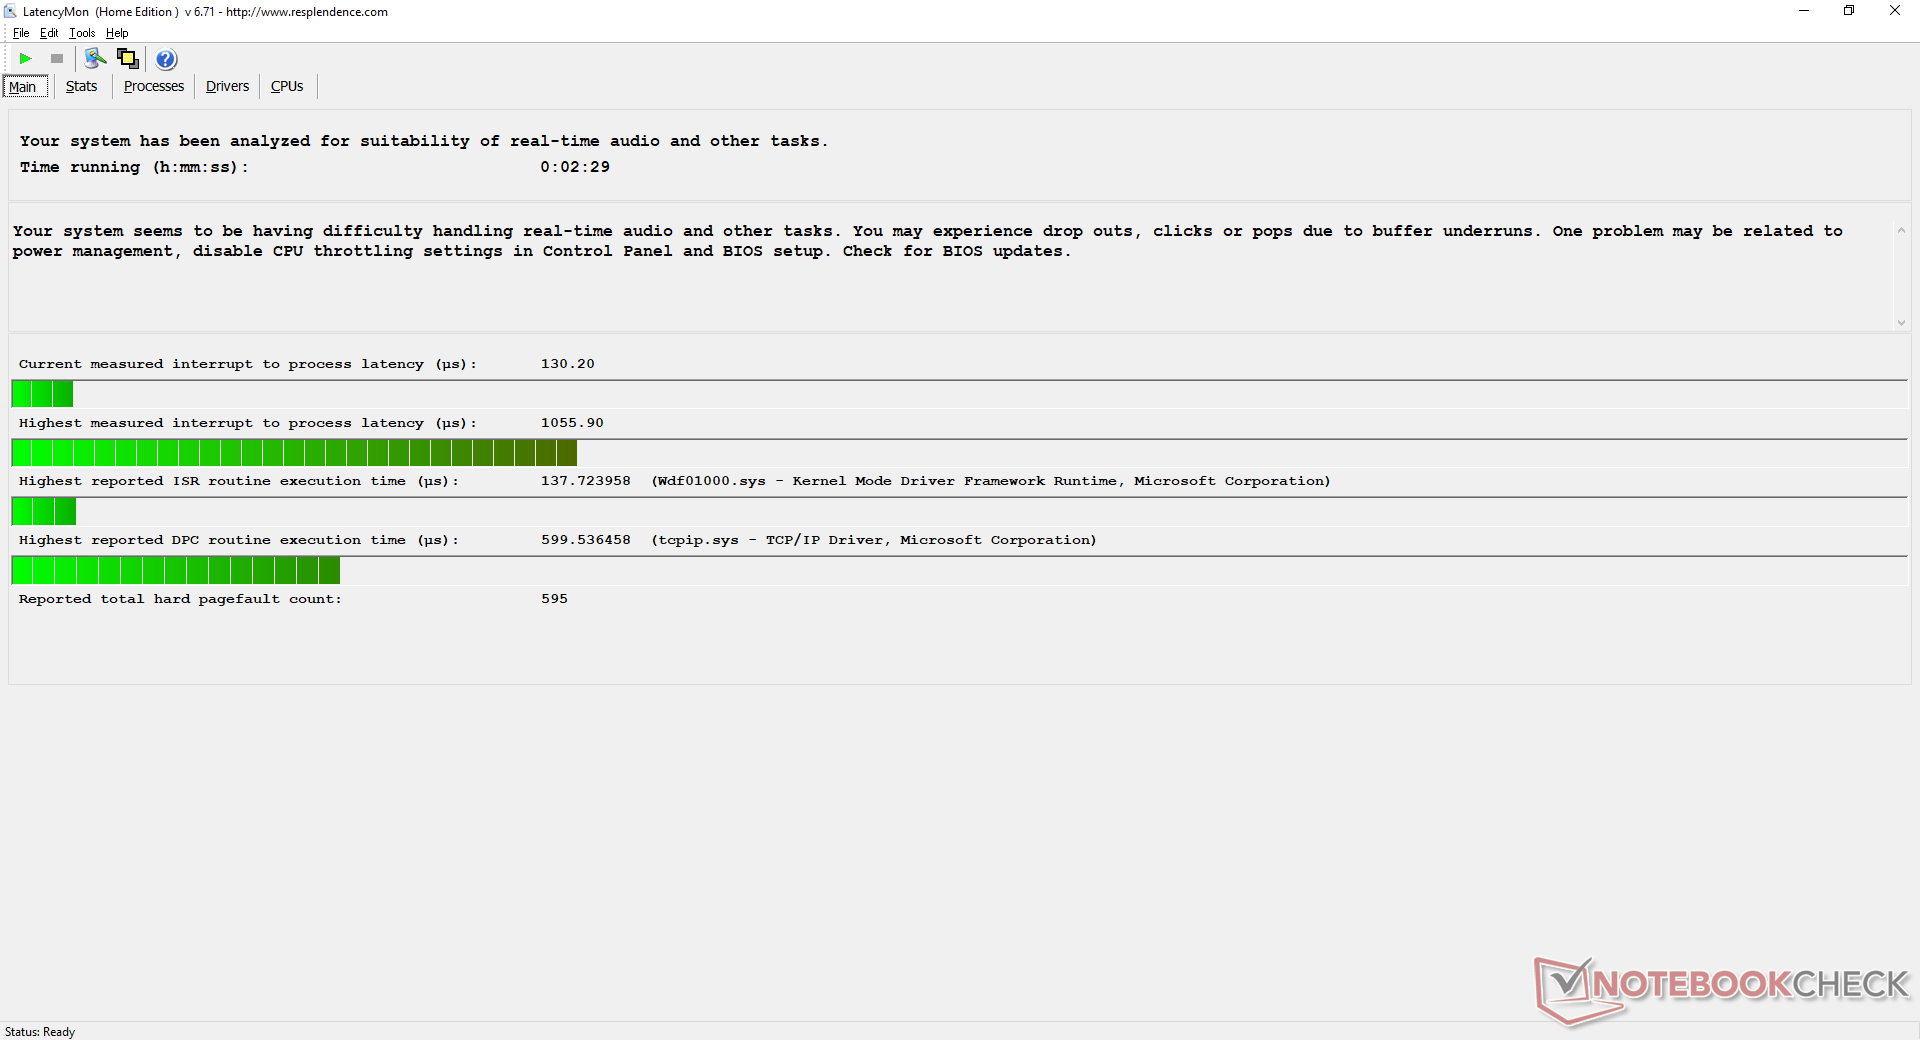
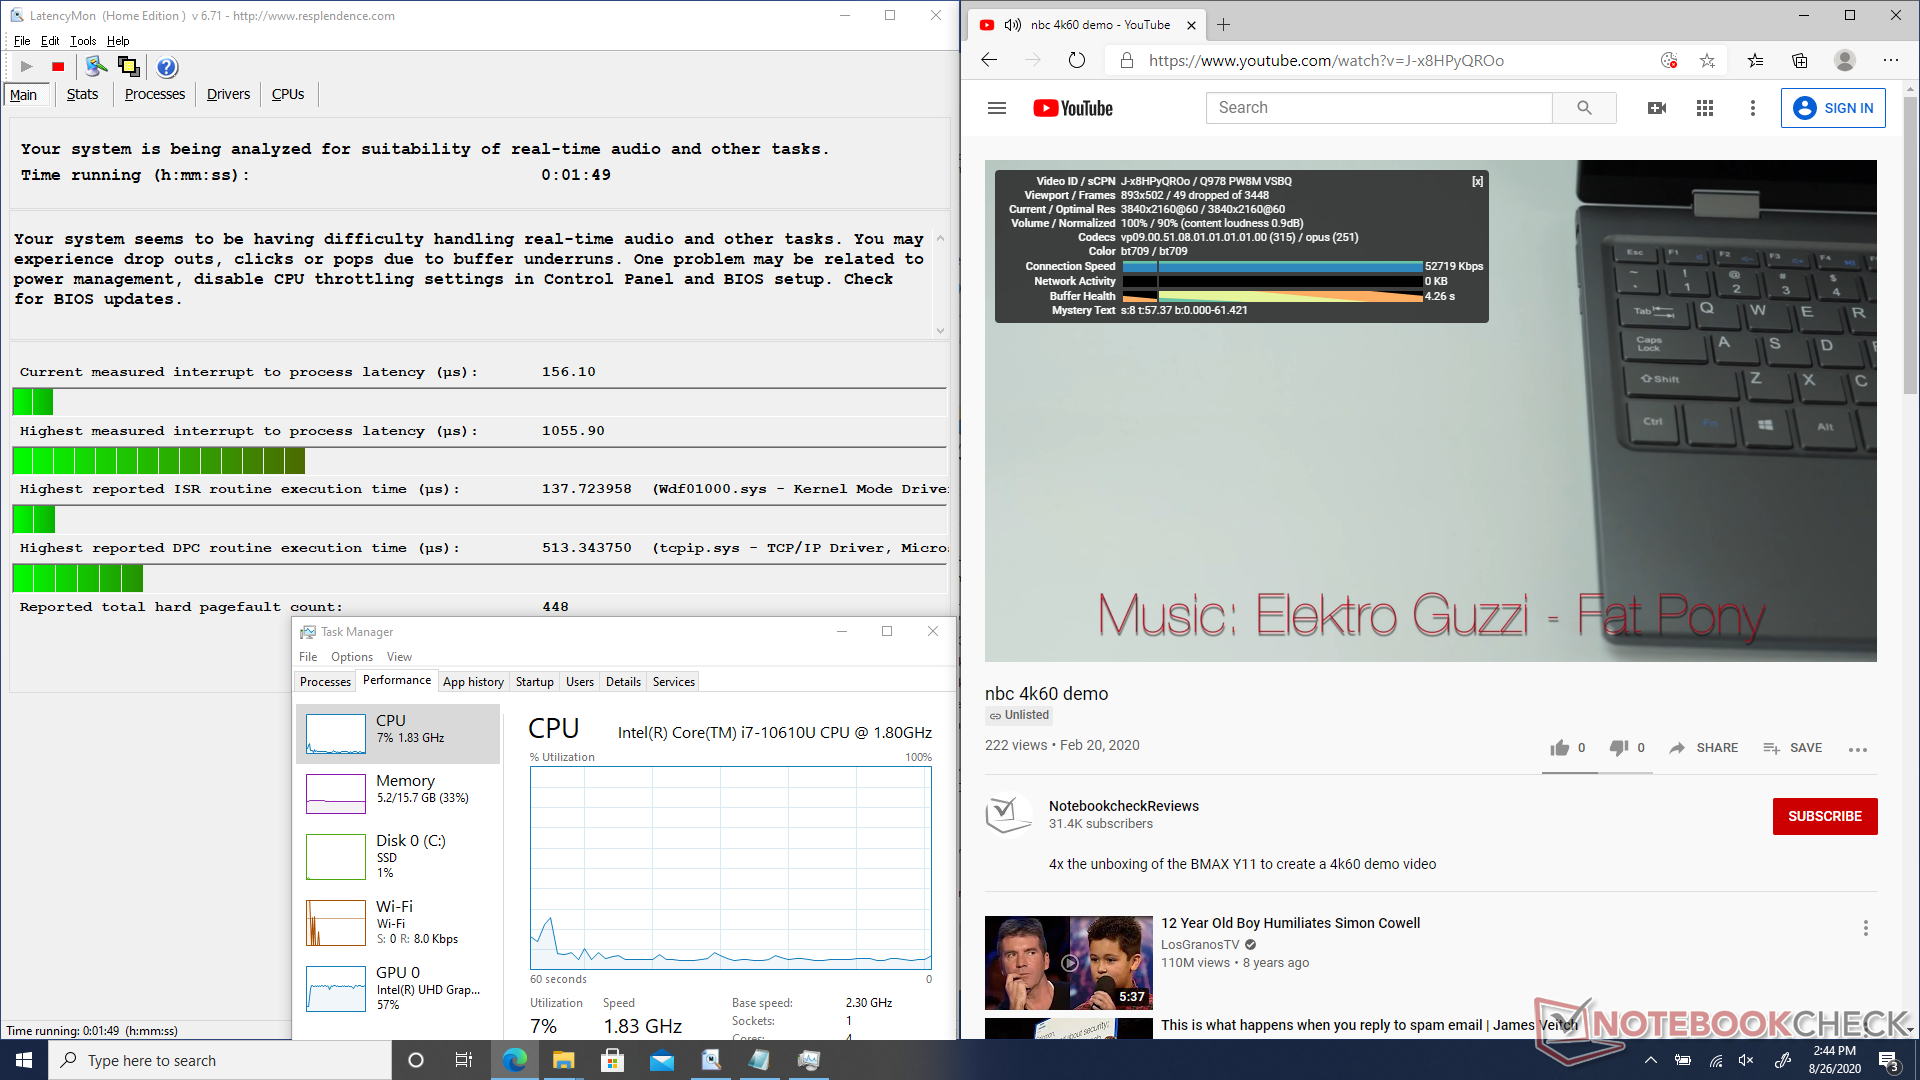
DPC Latency
LatencyMon shows DPC latency issues when opening multiple tabs on our homepage. 4K60 video playback is not perfect either with 49 dropped frames during our minute-long YouTube test.
| DPC Latencies / LatencyMon - interrupt to process latency (max), Web, Youtube, Prime95 | |
| Acer TravelMate P6 P614-51T-G2-72ZU | |
| Lenovo ThinkPad T14s-20T00044GE | |
| LG Gram 14T90N | |
| Dell Latitude 14 9410 2-in-1 P110G | |
| Lenovo ThinkPad E14 Gen2-20T7S00W00 | |
| Asus VivoBook Flip 14 TM420IA | |
| Asus ZenBook Flip 14 UX463FA-AI039T | |
* ... smaller is better
Storage Devices
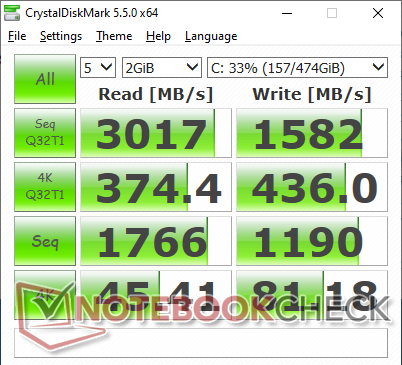
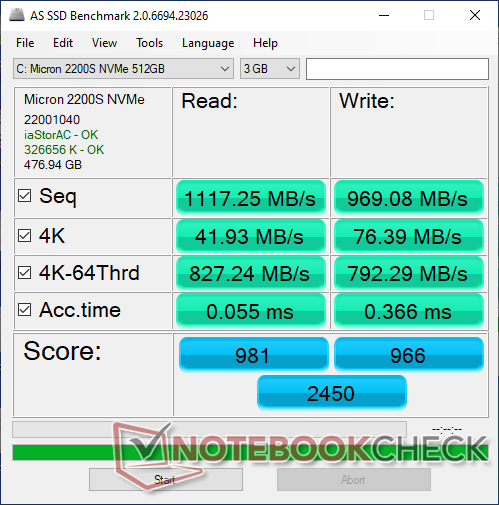
Our test unit comes configured with a Micron 2200S NVMe SSD in contrast to the Toshiba XG6 drive on our older Latitude 7400 2-in-1. Sequential read rates are fast at just over 3000 MB/s, but it can take many read iterations to reach such speeds as exemplified by our DiskSpd loop test below. Write rates are much slower at about 1500 MB/s compared to almost twice that on the Samsung PM981 series.
See our table of HDDs and SSDs for more benchmark comparisons.
| Dell Latitude 14 9410 2-in-1 P110G Micron 2200S 512GB | Lenovo Yoga C940-14IIL Samsung SSD PM981 MZVLB512HAJQ | LG Gram 14T90N Samsung SSD PM981a MZVLB512HBJQ | HP Elitebook x360 1040 G5 Samsung SSD PM981 MZVLB512HAJQ | Dell Latitude 7400 2-in-1 Toshiba XG6 KXG60ZNV512G | Asus ZenBook Flip 14 UX463FA-AI039T Kingston RBUSNS8154P3512GJ1 | |
|---|---|---|---|---|---|---|
| AS SSD | 48% | 60% | 38% | -24% | -16% | |
| Seq Read (MB/s) | 1117 | 2525 126% | 1829 64% | 1816 63% | 2289 105% | 1336 20% |
| Seq Write (MB/s) | 969 | 1253 29% | 2048 111% | 1270 31% | 1163 20% | 653 -33% |
| 4K Read (MB/s) | 41.93 | 59.1 41% | 54.2 29% | 46.25 10% | 22.29 -47% | 26.65 -36% |
| 4K Write (MB/s) | 76.4 | 134.1 76% | 120.5 58% | 104.1 36% | 28.92 -62% | 52.7 -31% |
| 4K-64 Read (MB/s) | 827 | 1010 22% | 1512 83% | 1342 62% | 415.6 -50% | 644 -22% |
| 4K-64 Write (MB/s) | 792 | 1461 84% | 1573 99% | 1209 53% | 199.5 -75% | 482.9 -39% |
| Access Time Read * (ms) | 0.055 | 0.052 5% | 0.046 16% | 0.043 22% | 0.122 -122% | 0.074 -35% |
| Access Time Write * (ms) | 0.366 | 0.029 92% | 0.091 75% | 0.035 90% | 0.143 61% | 0.072 80% |
| Score Read (Points) | 981 | 1322 35% | 1749 78% | 1569 60% | 667 -32% | 804 -18% |
| Score Write (Points) | 966 | 1721 78% | 1899 97% | 1440 49% | 345 -64% | 601 -38% |
| Score Total (Points) | 2450 | 3670 50% | 4560 86% | 3790 55% | 1300 -47% | 1786 -27% |
| Copy ISO MB/s (MB/s) | 1290 | 2016 56% | 1891 47% | 2034 58% | 1767 37% | |
| Copy Program MB/s (MB/s) | 661 | 542 -18% | 569 -14% | 450.3 -32% | 379.4 -43% | |
| Copy Game MB/s (MB/s) | 1271 | 1278 1% | 1425 12% | 1024 -19% | 1055 -17% | |
| CrystalDiskMark 5.2 / 6 | 30% | 42% | 20% | -29% | -32% | |
| Write 4K (MB/s) | 81.2 | 128.4 58% | 181.4 123% | 122.7 51% | 35.06 -57% | 54.6 -33% |
| Read 4K (MB/s) | 45.41 | 46.37 2% | 52.5 16% | 46.57 3% | 23.64 -48% | 28.19 -38% |
| Write Seq (MB/s) | 1190 | 1863 57% | 1592 34% | 1725 45% | 1537 29% | 840 -29% |
| Read Seq (MB/s) | 1766 | 2340 33% | 1617 -8% | 2392 35% | 1782 1% | 905 -49% |
| Write 4K Q32T1 (MB/s) | 436 | 451.1 3% | 556 28% | 470.6 8% | 100.3 -77% | 409.5 -6% |
| Read 4K Q32T1 (MB/s) | 374.4 | 415.3 11% | 539 44% | 313.2 -16% | 62.7 -83% | 292.4 -22% |
| Write Seq Q32T1 (MB/s) | 1582 | 2985 89% | 2955 87% | 1869 18% | 2698 71% | 1038 -34% |
| Read Seq Q32T1 (MB/s) | 3017 | 2565 -15% | 3270 8% | 3380 12% | 1073 -64% | 1607 -47% |
| Write 4K Q8T8 (MB/s) | 451.4 | |||||
| Read 4K Q8T8 (MB/s) | 1004 | |||||
| Total Average (Program / Settings) | 39% /
42% | 51% /
53% | 29% /
32% | -27% /
-26% | -24% /
-23% |
* ... smaller is better

Disk Throttling: DiskSpd Read Loop, Queue Depth 8
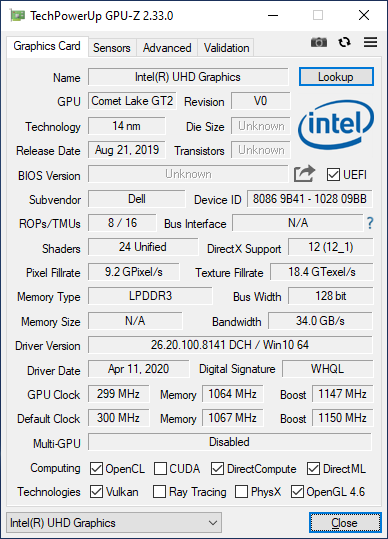
GPU Performance
The UHD Graphics 620 hasn't changed in years which is fine if you mainly plan on video streaming, web browsing, or emailing. Nonetheless, it's too bad that Dell isn't offering any Ice Lake, Ryzen, or GeForce MX options which would have boosted graphics performance significantly for those who want it.
See our dedicated page on the UHD Graphics 620 for more technical information and benchmark comparisons.
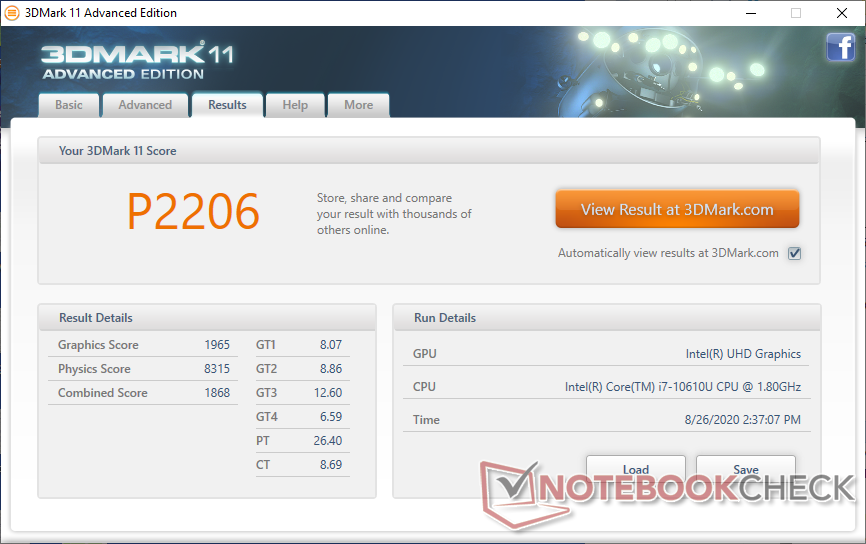

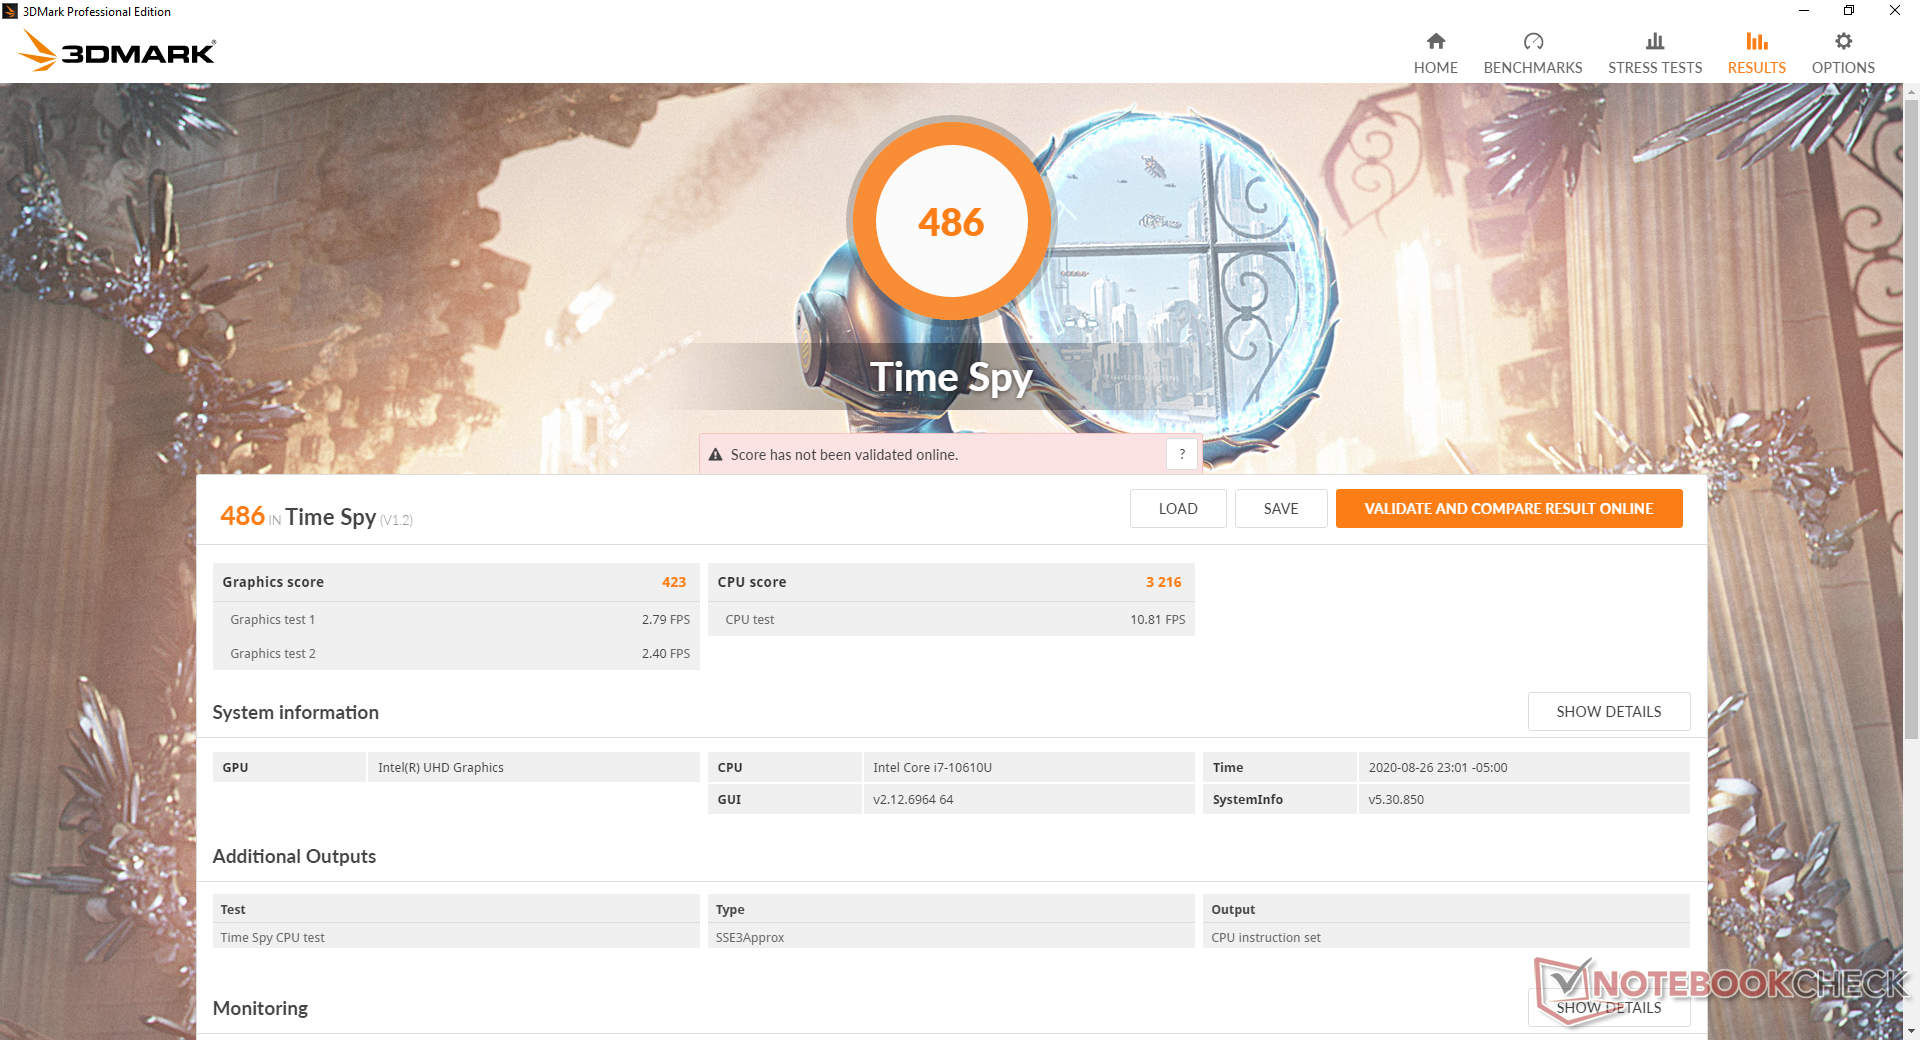
| 3DMark 11 Performance | 2206 points | |
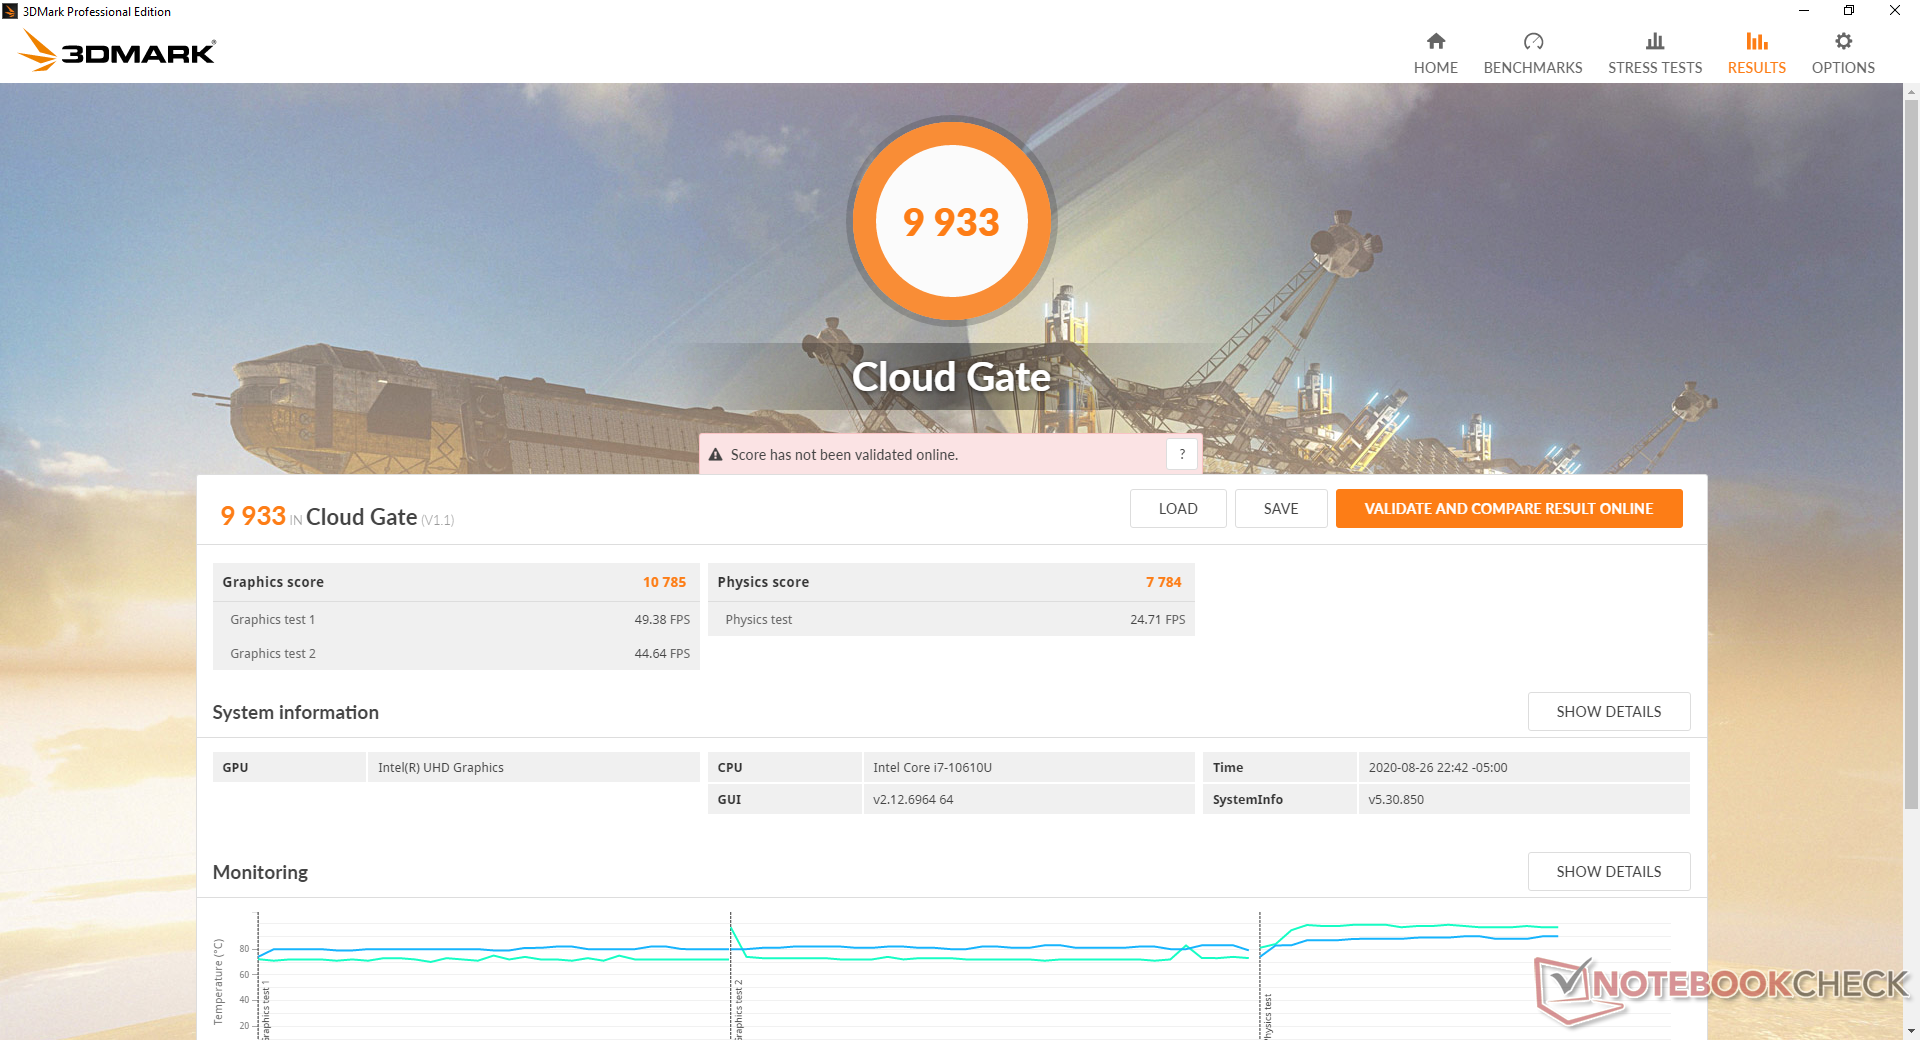
| 3DMark Cloud Gate Standard Score | 9933 points | |
| 3DMark Fire Strike Score | 1218 points | |
| 3DMark Time Spy Score | 486 points | |
Help | ||
| low | med. | high | ultra | |
|---|---|---|---|---|
| Dota 2 Reborn (2015) | 59.1 | 48.4 | 20.5 | 18.7 |
| X-Plane 11.11 (2018) | 12 | 10.9 | 10.5 |
Emissions
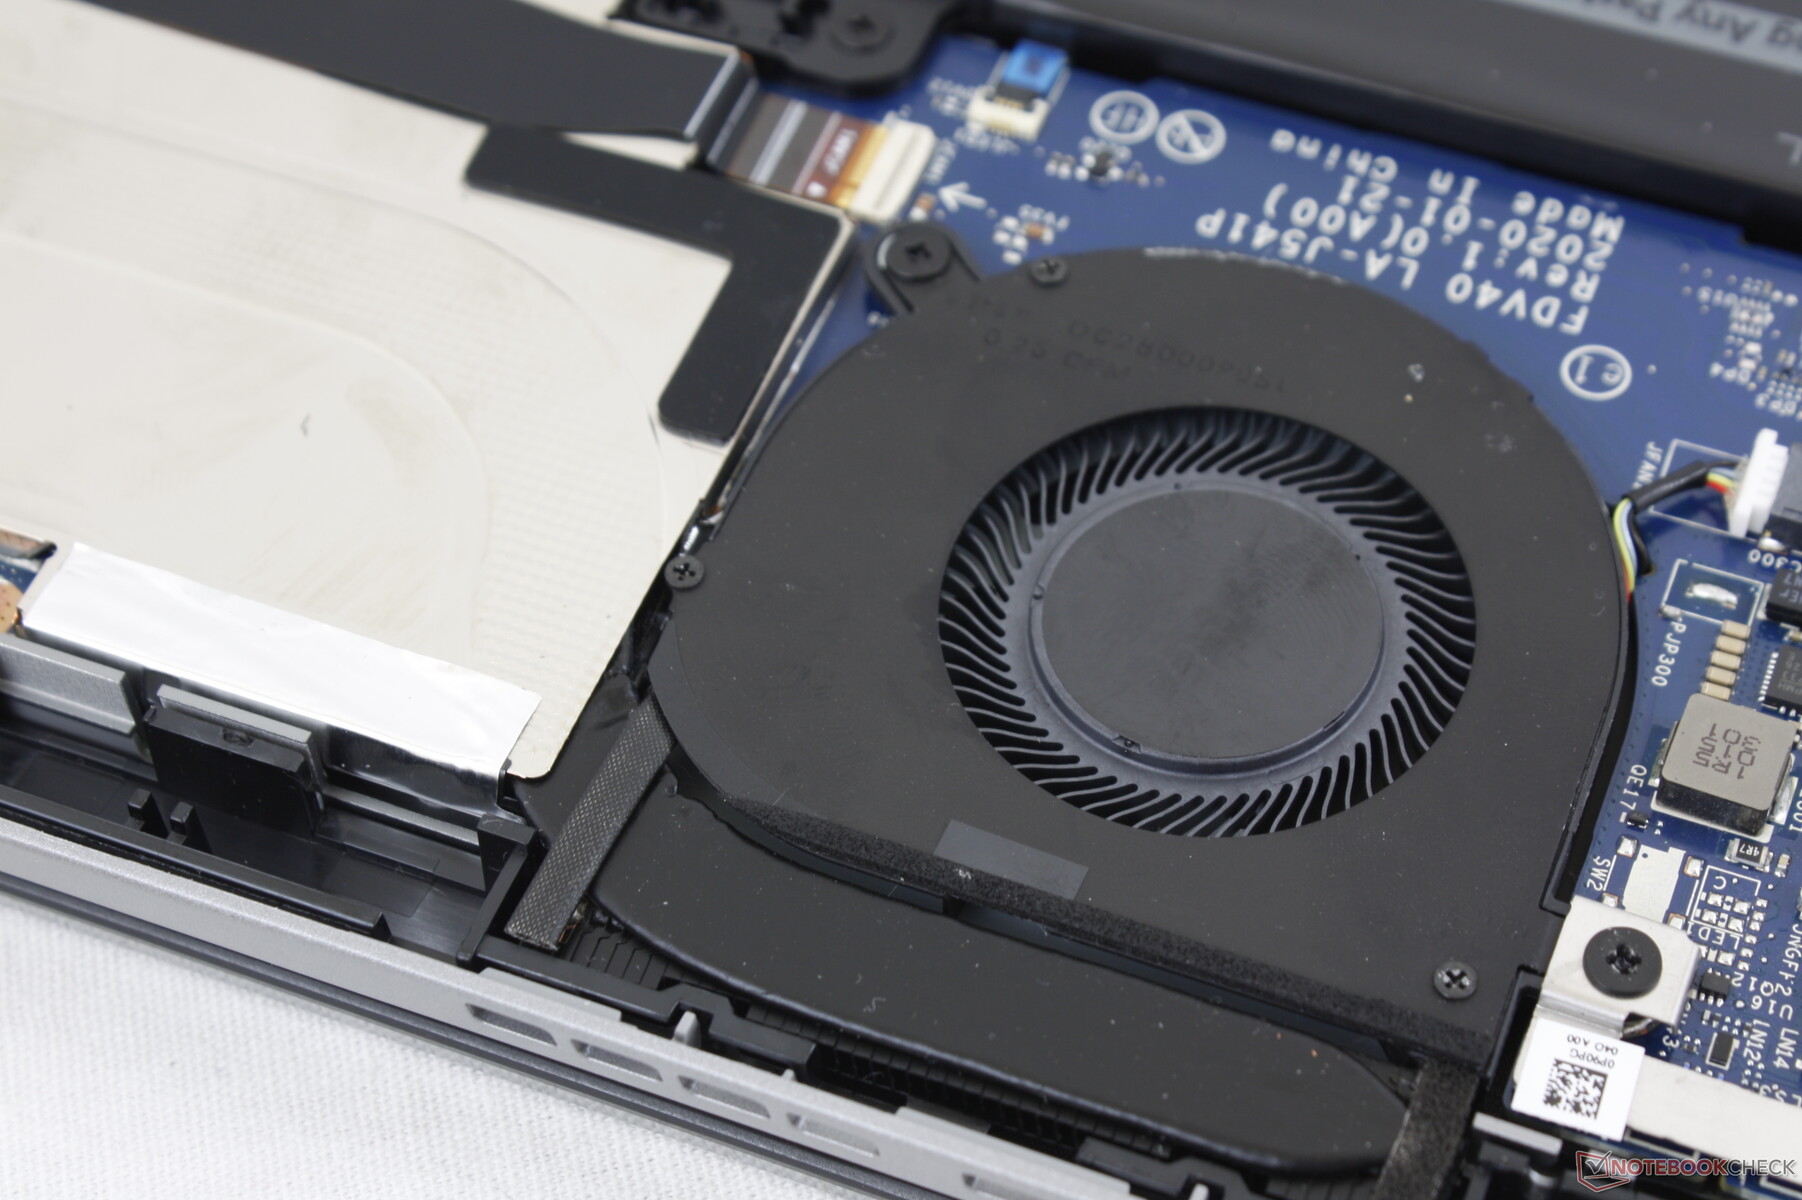
System Noise
Whereas the fan in our Latitude 7400 2-in-1 test unit was unusually lethargic, the fan in our Latitude 9410 2-in-1 behaves more normally. The fan is barely audible at just 31.7 dB(A) at worst when browsing or video streaming and with no annoying pulsing behavior. Running higher loads like 3DMark 06 will bump fan noise to almost 40 dB(A) near the end of the 90-second benchmark to be louder than competitors, but it quickly becomes almost silent again once the heavy processing load stops.
Interestingly, fan noise when under heavy loads like CineBench or Prime95 is constant despite the cycling clock rates and temperatures as detailed in our Stress Test section below.
| Dell Latitude 14 9410 2-in-1 P110G UHD Graphics 620, i7-10610U, Micron 2200S 512GB | Lenovo Yoga C940-14IIL Iris Plus Graphics G7 (Ice Lake 64 EU), i7-1065G7, Samsung SSD PM981 MZVLB512HAJQ | LG Gram 14T90N UHD Graphics 620, i7-10510U, Samsung SSD PM981a MZVLB512HBJQ | HP Elitebook x360 1040 G5 UHD Graphics 620, i7-8650U, Samsung SSD PM981 MZVLB512HAJQ | Dell Latitude 7400 2-in-1 UHD Graphics 620, i7-8665U, Toshiba XG6 KXG60ZNV512G | Asus ZenBook Flip 14 UX463FA-AI039T UHD Graphics 620, i5-10210U, Kingston RBUSNS8154P3512GJ1 | |
|---|---|---|---|---|---|---|
| Noise | -1% | -5% | 1% | 6% | -1% | |
| off / environment * (dB) | 26.1 | 29.3 -12% | 29 -11% | 28.3 -8% | 28.2 -8% | 30.1 -15% |
| Idle Minimum * (dB) | 26.1 | 29.3 -12% | 30 -15% | 28.3 -8% | 28.2 -8% | 30.1 -15% |
| Idle Average * (dB) | 26.1 | 29.3 -12% | 30 -15% | 28.3 -8% | 28.2 -8% | 30.1 -15% |
| Idle Maximum * (dB) | 26.1 | 29.3 -12% | 30 -15% | 28.3 -8% | 28.3 -8% | 30.1 -15% |
| Load Average * (dB) | 39.9 | 33.3 17% | 35.2 12% | 32.6 18% | 28.2 29% | 30.1 25% |
| Load Maximum * (dB) | 44.7 | 33.3 26% | 37 17% | 36.6 18% | 28.8 36% | 32.02 28% |
* ... smaller is better
Noise level
| Idle |
| 26.1 / 26.1 / 26.1 dB(A) |
| Load |
| 39.9 / 44.7 dB(A) |
 | ||
30 dB silent 40 dB(A) audible 50 dB(A) loud |
||
min: | ||
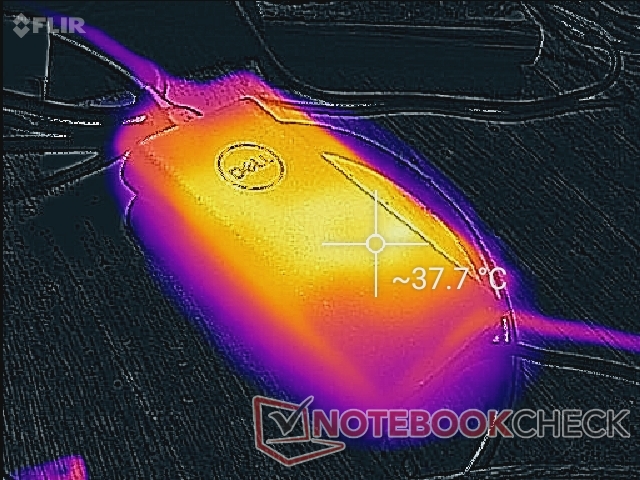
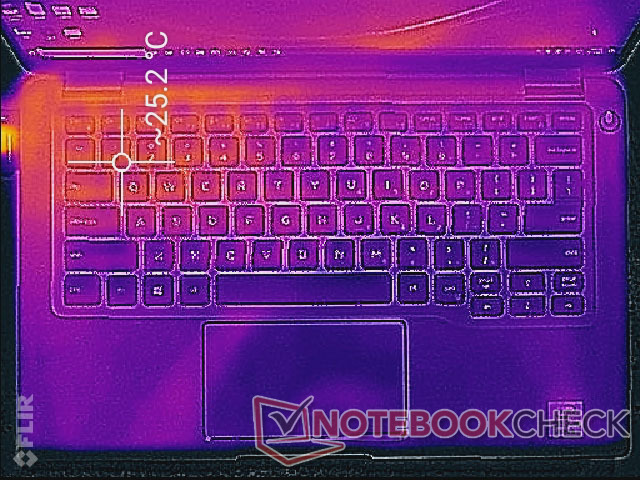
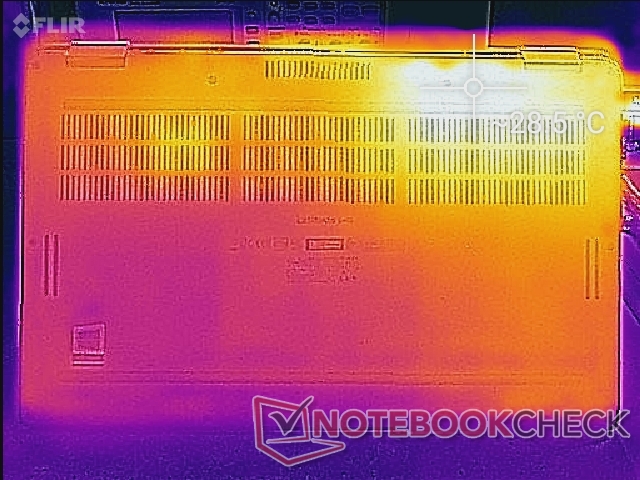
Temperature
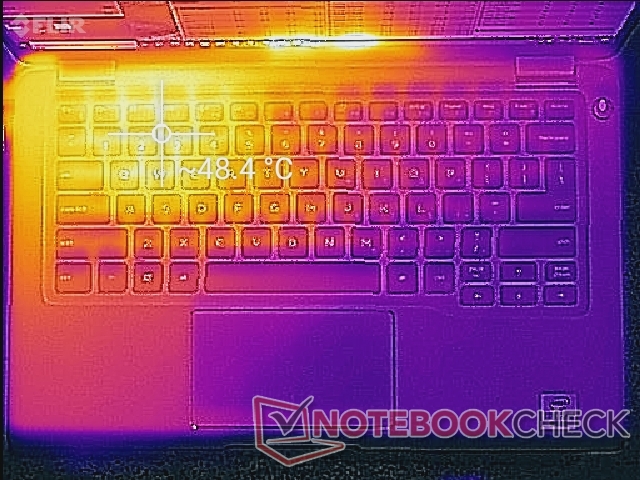
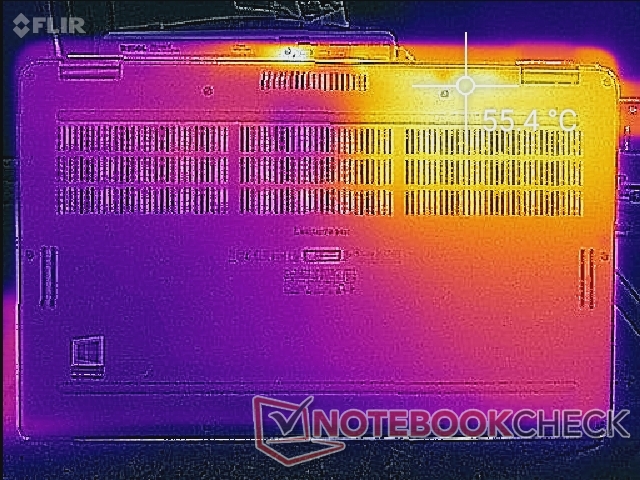
Surface temperatures will always be warmer on the left half of the laptop than the right due to the positioning of the processor within. Hot spots in this region can reach a toasty 48 C to 56 C as shown by our temperature maps below, but this is thankfully away from the frontal quadrants of the chassis and most of the keyboard keys.
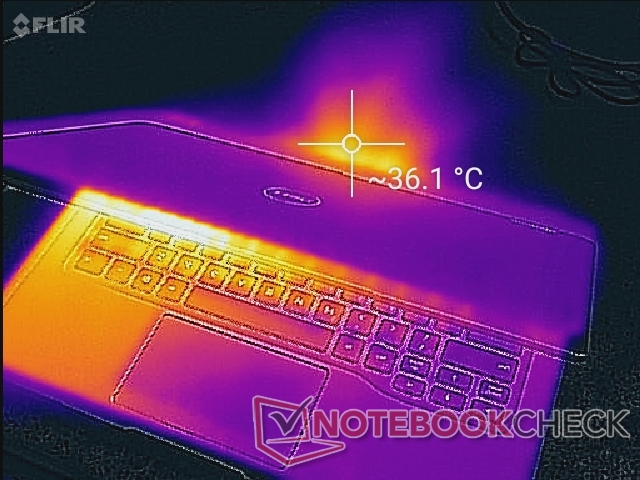
(-) The maximum temperature on the upper side is 48.4 °C / 119 F, compared to the average of 35.4 °C / 96 F, ranging from 19.6 to 60 °C for the class Convertible.
(-) The bottom heats up to a maximum of 55.2 °C / 131 F, compared to the average of 36.9 °C / 98 F
(+) In idle usage, the average temperature for the upper side is 23.8 °C / 75 F, compared to the device average of 30.3 °C / 87 F.
(+) The palmrests and touchpad are reaching skin temperature as a maximum (32.2 °C / 90 F) and are therefore not hot.
(-) The average temperature of the palmrest area of similar devices was 28 °C / 82.4 F (-4.2 °C / -7.6 F).
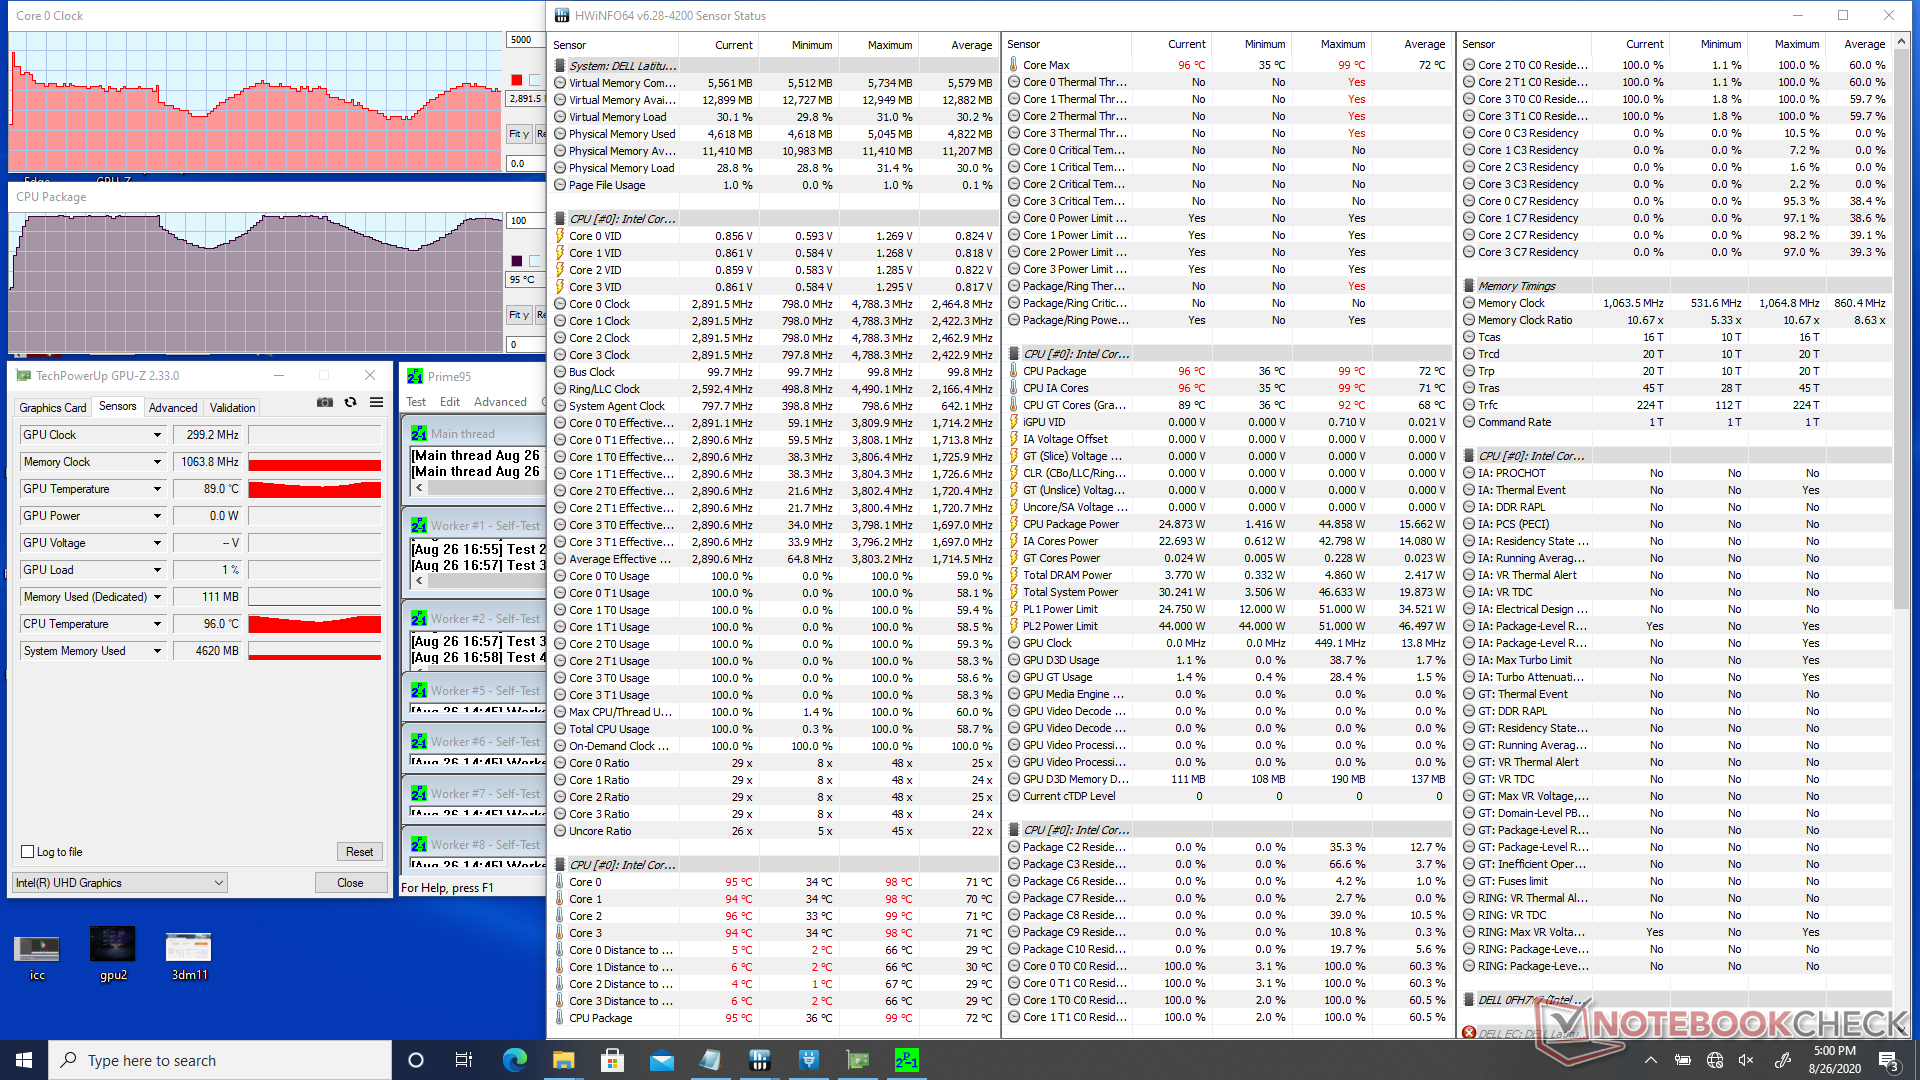
Stress Test
When running Prime95 to stress the CPU, clock rates would boost to about 3.6 GHz for the first couple of seconds until core temperature reaches 98 C. Clock rates would then stabilize at around 3.0 to 3.1 GHz for the next minute or so before finally cycling between 2.2 GHz and 3.3 GHz and 79 C to 98 C as shown by our screenshots below. This cycling behavior is not observed on most other laptops where fixed clock rates and temperatures are more common, but Dell favors it for the faster burst clock rates even if they are only temporary.
Running on battery will limit CPU performance. A 3DMark 11 run on battery power would return Physics and Graphics scores of 7118 and 1975 points, respectively, compared to 8315 and 1965 points when on mains.
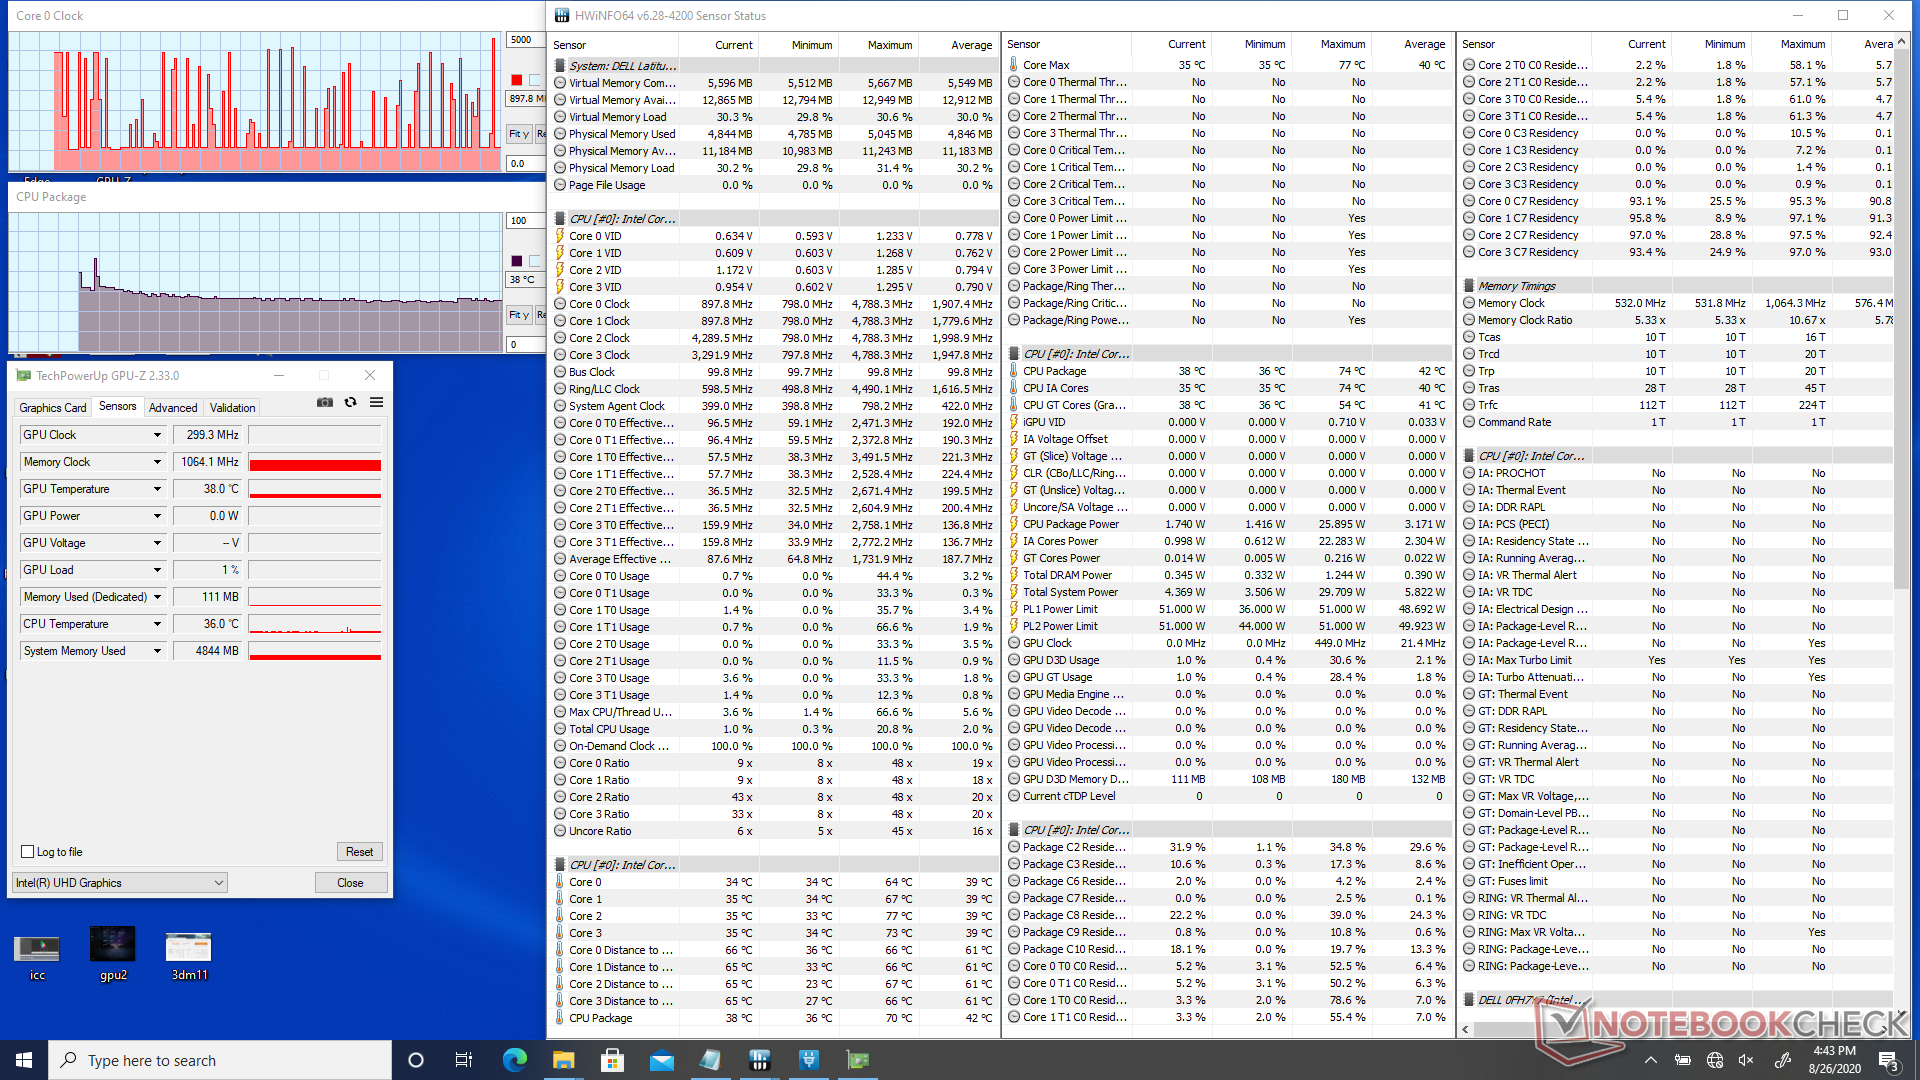
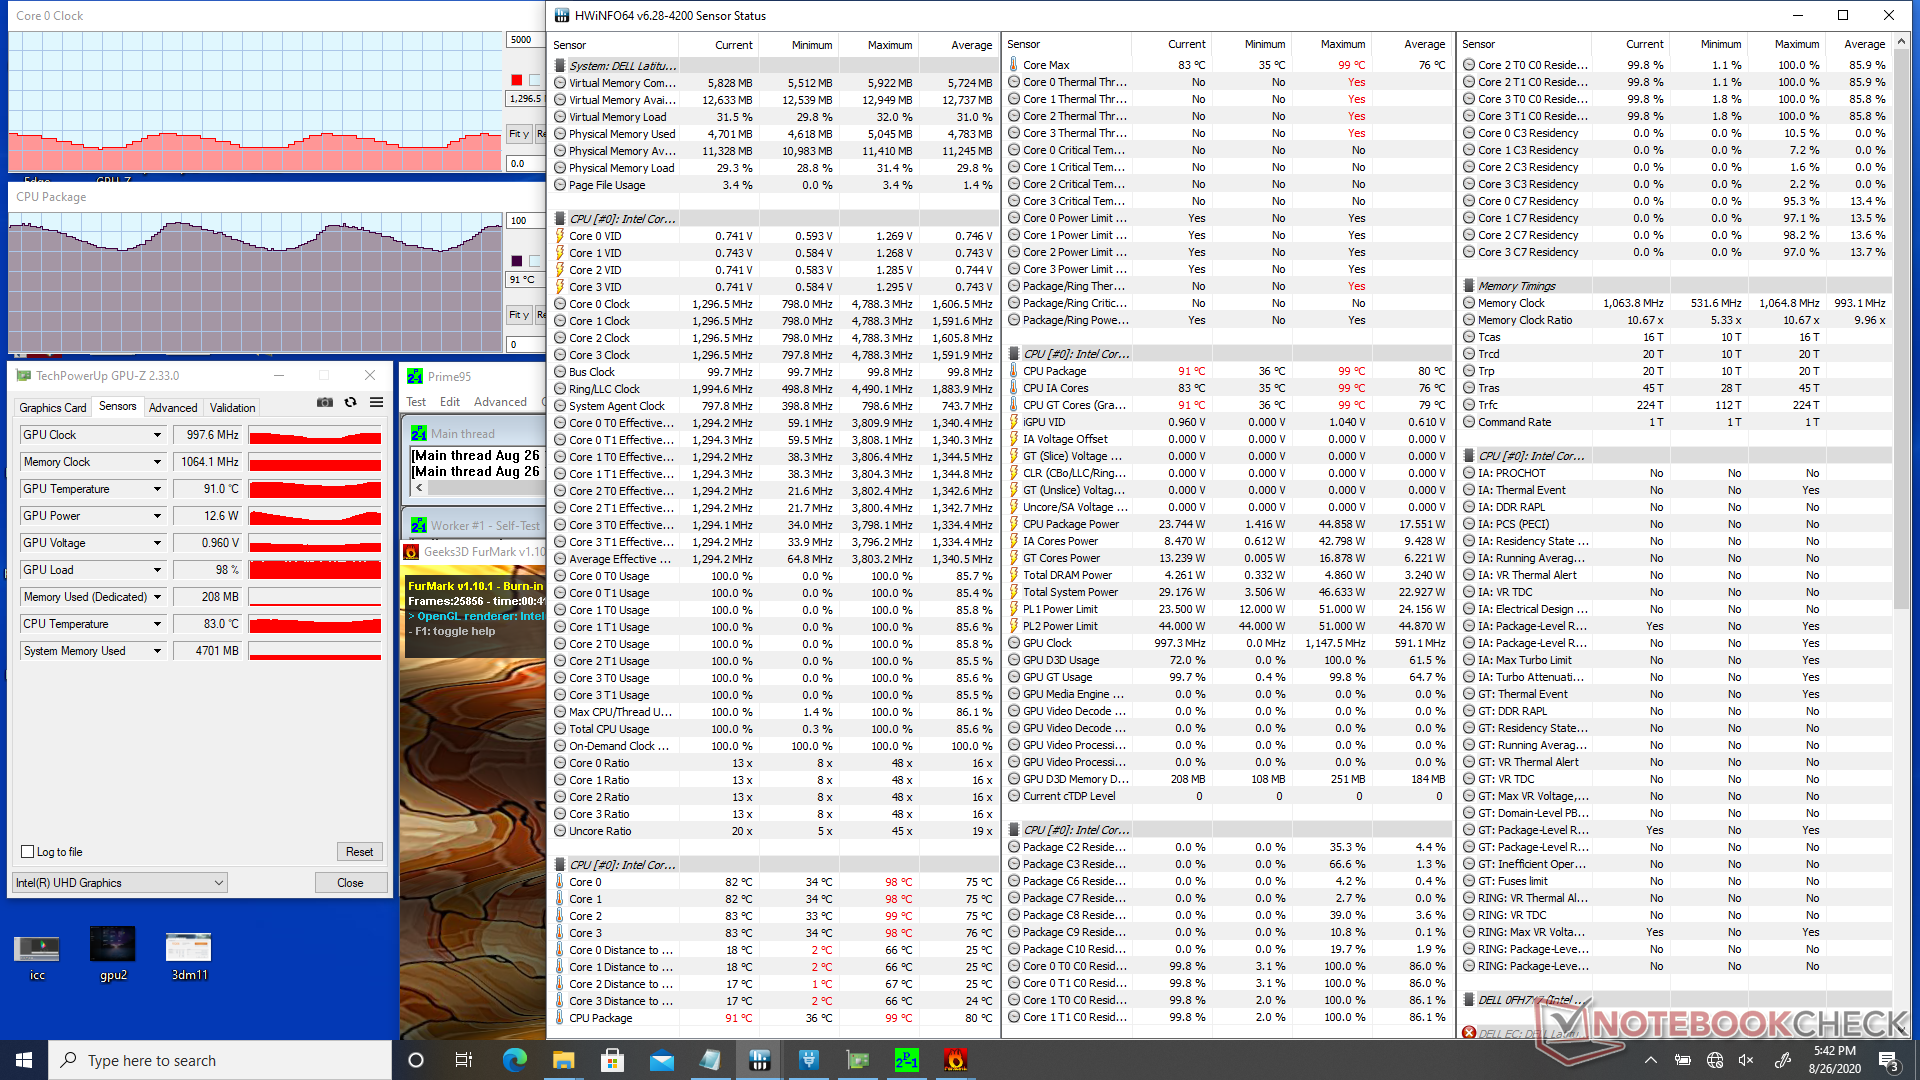
| CPU Clock (GHz) | GPU Clock (MHz) | Average CPU Temperature (°C) | |
| System Idle | -- | -- | 38 |
| Prime95 Stress | 2.2 - 3.2 | -- | 79 - 98 |
| Prime95 + FurMark Stress | 0.9 - 1.4 | 650 - 1050 | 74 - 92 |
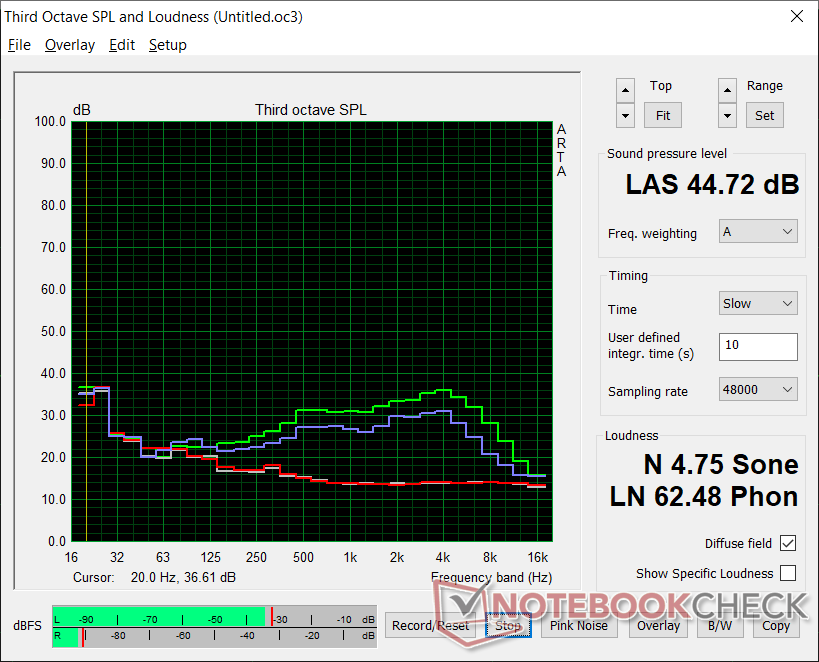
Speakers


Dell Latitude 14 9410 2-in-1 P110G audio analysis
(±) | speaker loudness is average but good (80.8 dB)
Bass 100 - 315 Hz
(±) | reduced bass - on average 14.6% lower than median
(±) | linearity of bass is average (12.9% delta to prev. frequency)
Mids 400 - 2000 Hz
(+) | balanced mids - only 4.1% away from median
(+) | mids are linear (4% delta to prev. frequency)
Highs 2 - 16 kHz
(±) | higher highs - on average 5.3% higher than median
(+) | highs are linear (6.6% delta to prev. frequency)
Overall 100 - 16.000 Hz
(±) | linearity of overall sound is average (16.3% difference to median)
Compared to same class
» 30% of all tested devices in this class were better, 3% similar, 67% worse
» The best had a delta of 6%, average was 20%, worst was 57%
Compared to all devices tested
» 27% of all tested devices were better, 6% similar, 68% worse
» The best had a delta of 4%, average was 23%, worst was 134%
Apple MacBook 12 (Early 2016) 1.1 GHz audio analysis
(+) | speakers can play relatively loud (83.6 dB)
Bass 100 - 315 Hz
(±) | reduced bass - on average 11.3% lower than median
(±) | linearity of bass is average (14.2% delta to prev. frequency)
Mids 400 - 2000 Hz
(+) | balanced mids - only 2.4% away from median
(+) | mids are linear (5.5% delta to prev. frequency)
Highs 2 - 16 kHz
(+) | balanced highs - only 2% away from median
(+) | highs are linear (4.5% delta to prev. frequency)
Overall 100 - 16.000 Hz
(+) | overall sound is linear (10.2% difference to median)
Compared to same class
» 7% of all tested devices in this class were better, 2% similar, 90% worse
» The best had a delta of 5%, average was 18%, worst was 53%
Compared to all devices tested
» 5% of all tested devices were better, 1% similar, 94% worse
» The best had a delta of 4%, average was 23%, worst was 134%
Energy Management
Power Consumption
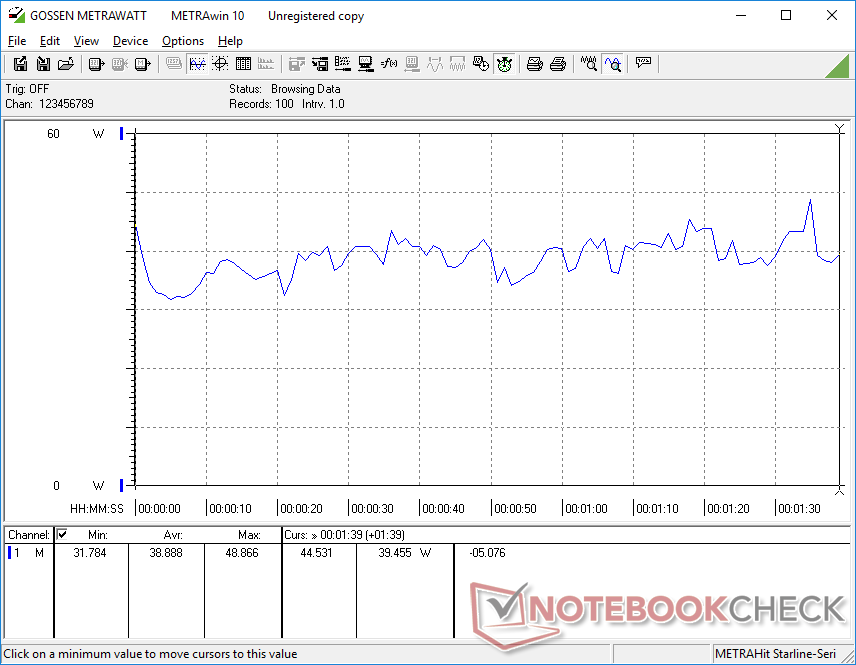
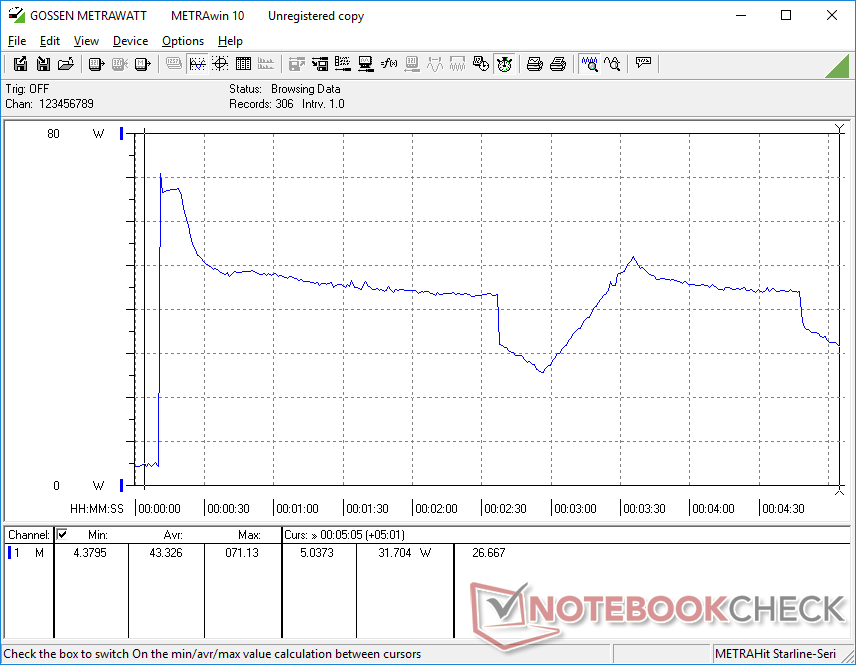
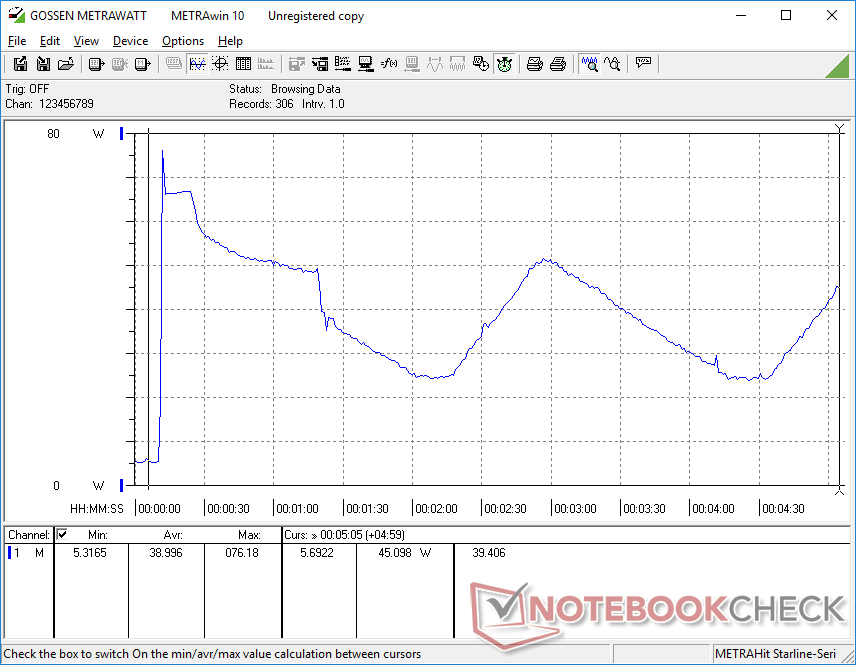
Dell Latitude laptops have always been very power efficient due in part to having no discrete GPU options. Idling on desktop draws only between 2 W and 5 W even when on to the maximum brightness setting.
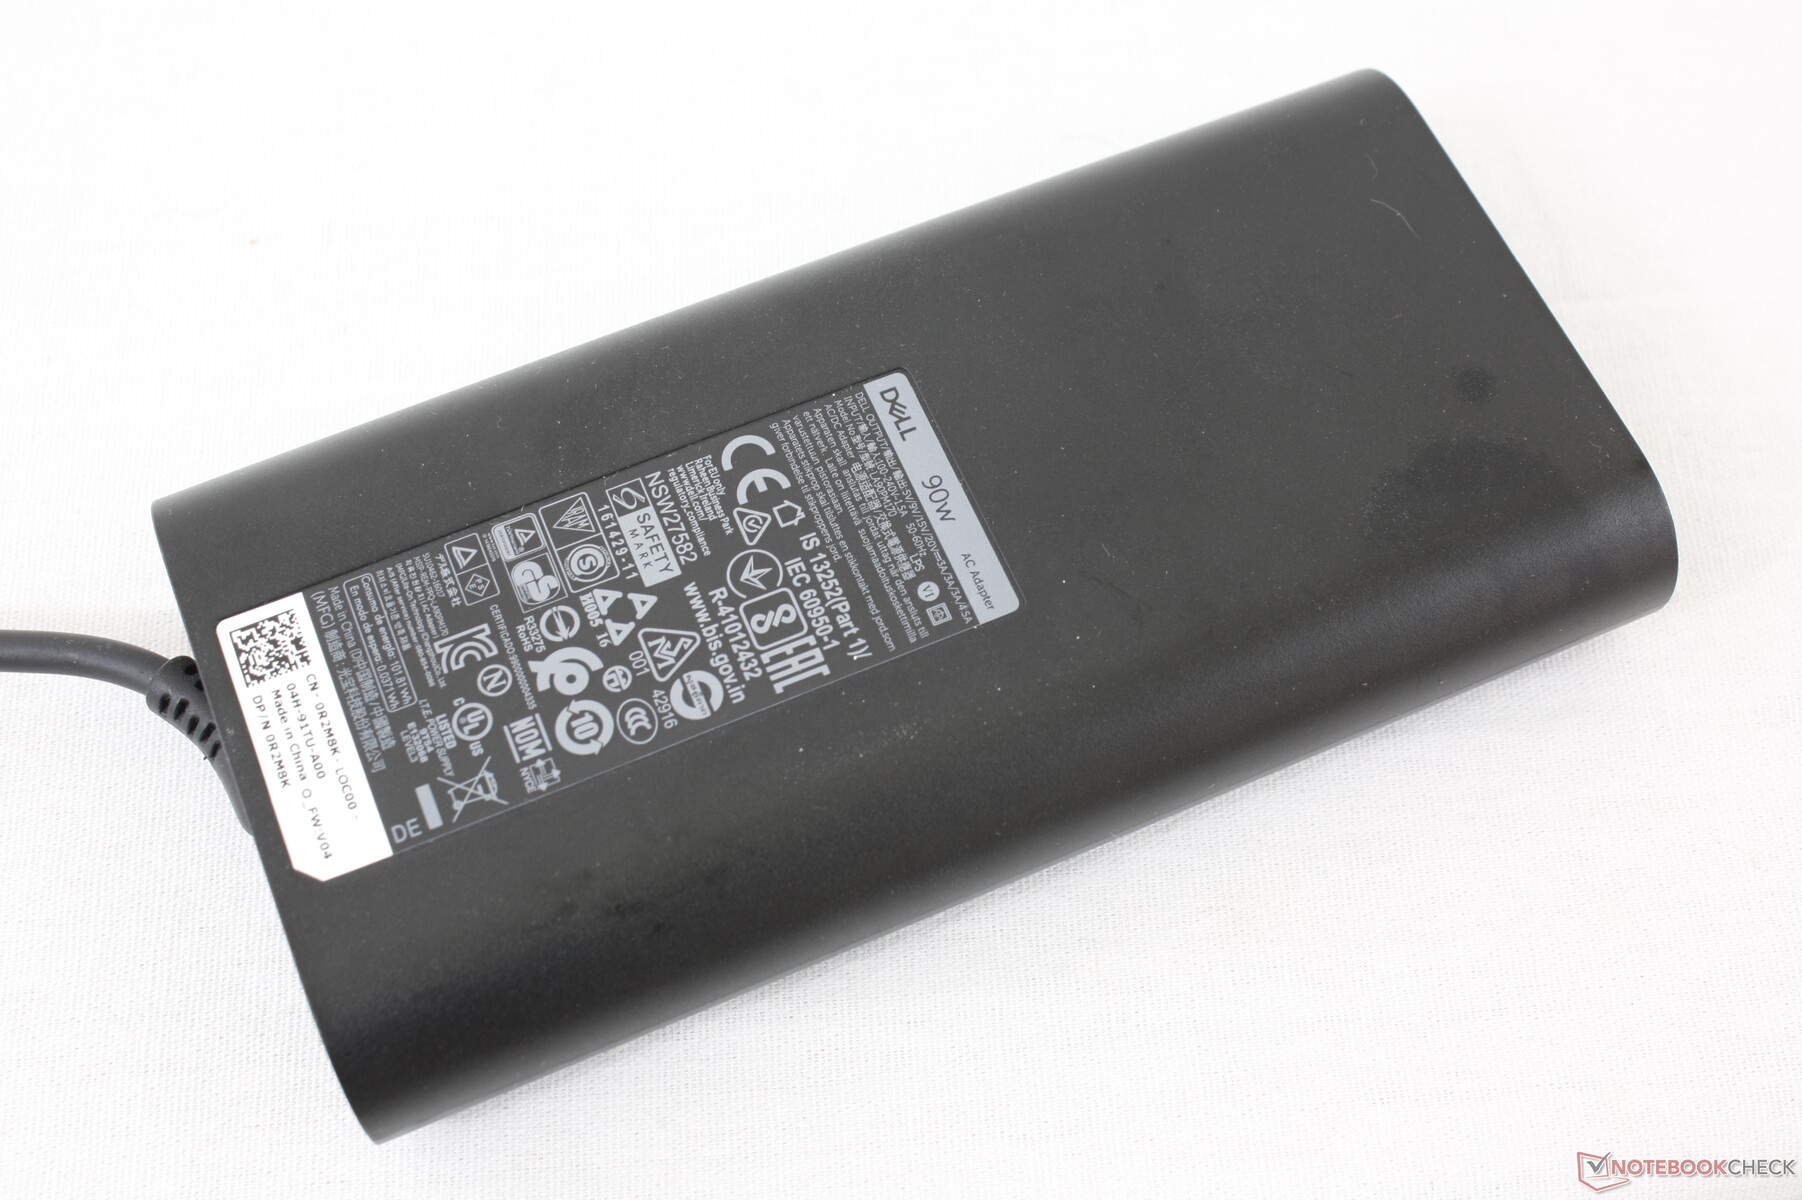
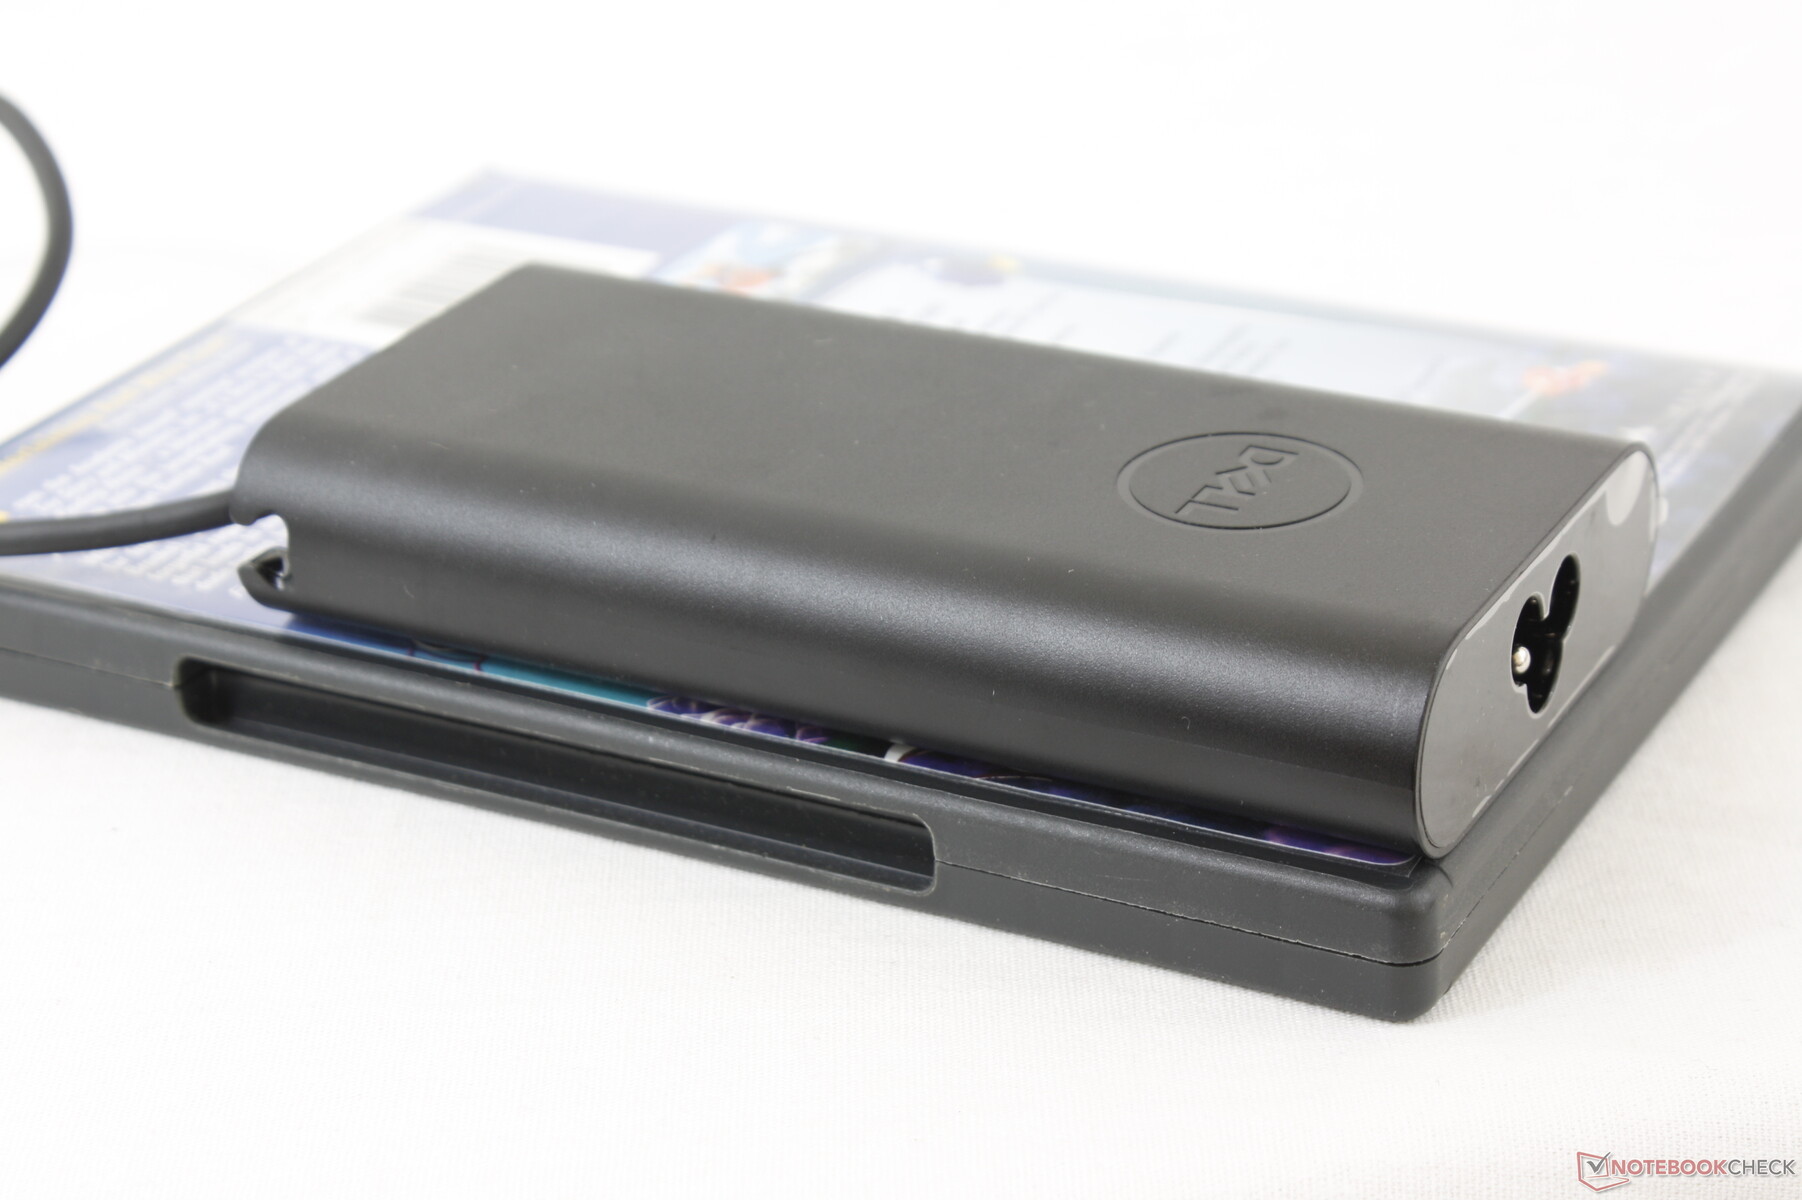
Interestingly, power consumption can be very high for an ULV subnotebook when under demanding loads because of the included 90 W (~13 x 6.8 x 2.2 cm) AC adapter. In comparison, most Ultrabooks come with 45 W or 60 W adapters instead. When running extreme loads like Prime95, consumption can spike to as high as 76 W which is good because that means the processor can run at higher Turbo Boost clock rates even if only for very short periods.
| Off / Standby | |
| Idle | |
| Load |
|
Key:
min: | |
| Dell Latitude 14 9410 2-in-1 P110G i7-10610U, UHD Graphics 620, Micron 2200S 512GB, IPS, 1920x1080, 14" | Lenovo Yoga C940-14IIL i7-1065G7, Iris Plus Graphics G7 (Ice Lake 64 EU), Samsung SSD PM981 MZVLB512HAJQ, IPS LED, 1920x1080, 14" | LG Gram 14T90N i7-10510U, UHD Graphics 620, Samsung SSD PM981a MZVLB512HBJQ, IPS, 1920x1080, 14" | HP Elitebook x360 1040 G5 i7-8650U, UHD Graphics 620, Samsung SSD PM981 MZVLB512HAJQ, IPS, 1920x1080, 14" | Dell Latitude 7400 2-in-1 i7-8665U, UHD Graphics 620, Toshiba XG6 KXG60ZNV512G, IPS, 1920x1080, 14" | Asus ZenBook Flip 14 UX463FA-AI039T i5-10210U, UHD Graphics 620, Kingston RBUSNS8154P3512GJ1, IPS, 1920x1080, 14" | |
|---|---|---|---|---|---|---|
| Power Consumption | -40% | -9% | -37% | -3% | -42% | |
| Idle Minimum * (Watt) | 2.6 | 3.2 -23% | 2.9 -12% | 2.7 -4% | 2.6 -0% | 3.6 -38% |
| Idle Average * (Watt) | 3.9 | 7 -79% | 5.8 -49% | 6.5 -67% | 4.3 -10% | 7.5 -92% |
| Idle Maximum * (Watt) | 4.6 | 8.9 -93% | 6.2 -35% | 11.5 -150% | 5.5 -20% | 9.4 -104% |
| Load Average * (Watt) | 38.9 | 47.6 -22% | 32.9 15% | 38.7 1% | 32 18% | 42 -8% |
| Load Maximum * (Watt) | 76.2 | 63.1 17% | 48.5 36% | 50.5 34% | 78.8 -3% | 51 33% |
* ... smaller is better
Battery Life
Battery capacity is large for a 14-inch convertible form factor at 78 Wh. We're able to record 19 hours of real-world WLAN use before automatic shutdown to be a lot longer than most other subnotebooks. A smaller 52 Wh option is available for users who want a lighter system.
Charging from empty to full takes about two hours.
| Dell Latitude 14 9410 2-in-1 P110G i7-10610U, UHD Graphics 620, 78 Wh | Lenovo Yoga C940-14IIL i7-1065G7, Iris Plus Graphics G7 (Ice Lake 64 EU), 60 Wh | LG Gram 14T90N i7-10510U, UHD Graphics 620, 72 Wh | HP Elitebook x360 1040 G5 i7-8650U, UHD Graphics 620, 56 Wh | Dell Latitude 7400 2-in-1 i7-8665U, UHD Graphics 620, 78 Wh | Asus ZenBook Flip 14 UX463FA-AI039T i5-10210U, UHD Graphics 620, 50 Wh | |
|---|---|---|---|---|---|---|
| Battery runtime | -56% | -30% | -32% | -36% | -59% | |
| Reader / Idle (h) | 48.2 | 32.8 -32% | 27.9 -42% | |||
| WiFi v1.3 (h) | 19 | 10.6 -44% | 12.5 -34% | 10.4 -45% | 12.2 -36% | 7.7 -59% |
| Load (h) | 3.4 | 1.1 -68% | 2.6 -24% | 3.1 -9% |
Pros
Cons
Verdict
The good news is that the Latitude 9410 2-in-1 isn't all that different from the already excellent Latitude 7400 2-in-1. Dell didn't mess with a good thing and instead simply upgraded some components like the CPU and WLAN to remain competitive against the HP EliteBook x360 and Lenovo Yoga convertible series.
On the other hand, the bad news is that the Latitude 9410 2-in-1 isn't all that different from the already excellent Latitude 7400 2-in-1. It's a double-edged sword because users can purchase last year's Latitude 7400 2-in-1 for essentially the same experience and performance as the pricier 2020 Latitude 9410 2-in-1. Minor drawbacks like the lack of a proper webcam or brighter display options haven't been addressed and GPU options are still nonexistent, but they don't detract from a superb chassis design that's barely a year old.
Don't let the brand new name fool you because the Latitude 9410 2-in-1 is just a minor refresh of the already excellent Latitude 7400 2-in-1. It's still one of the best 14-inch business convertibles you can get right now even though it may not have the brightest display out there.
Dell Latitude 14 9410 2-in-1 P110G
- 08/31/2020 v7 (old)
Allen Ngo
Price comparison
