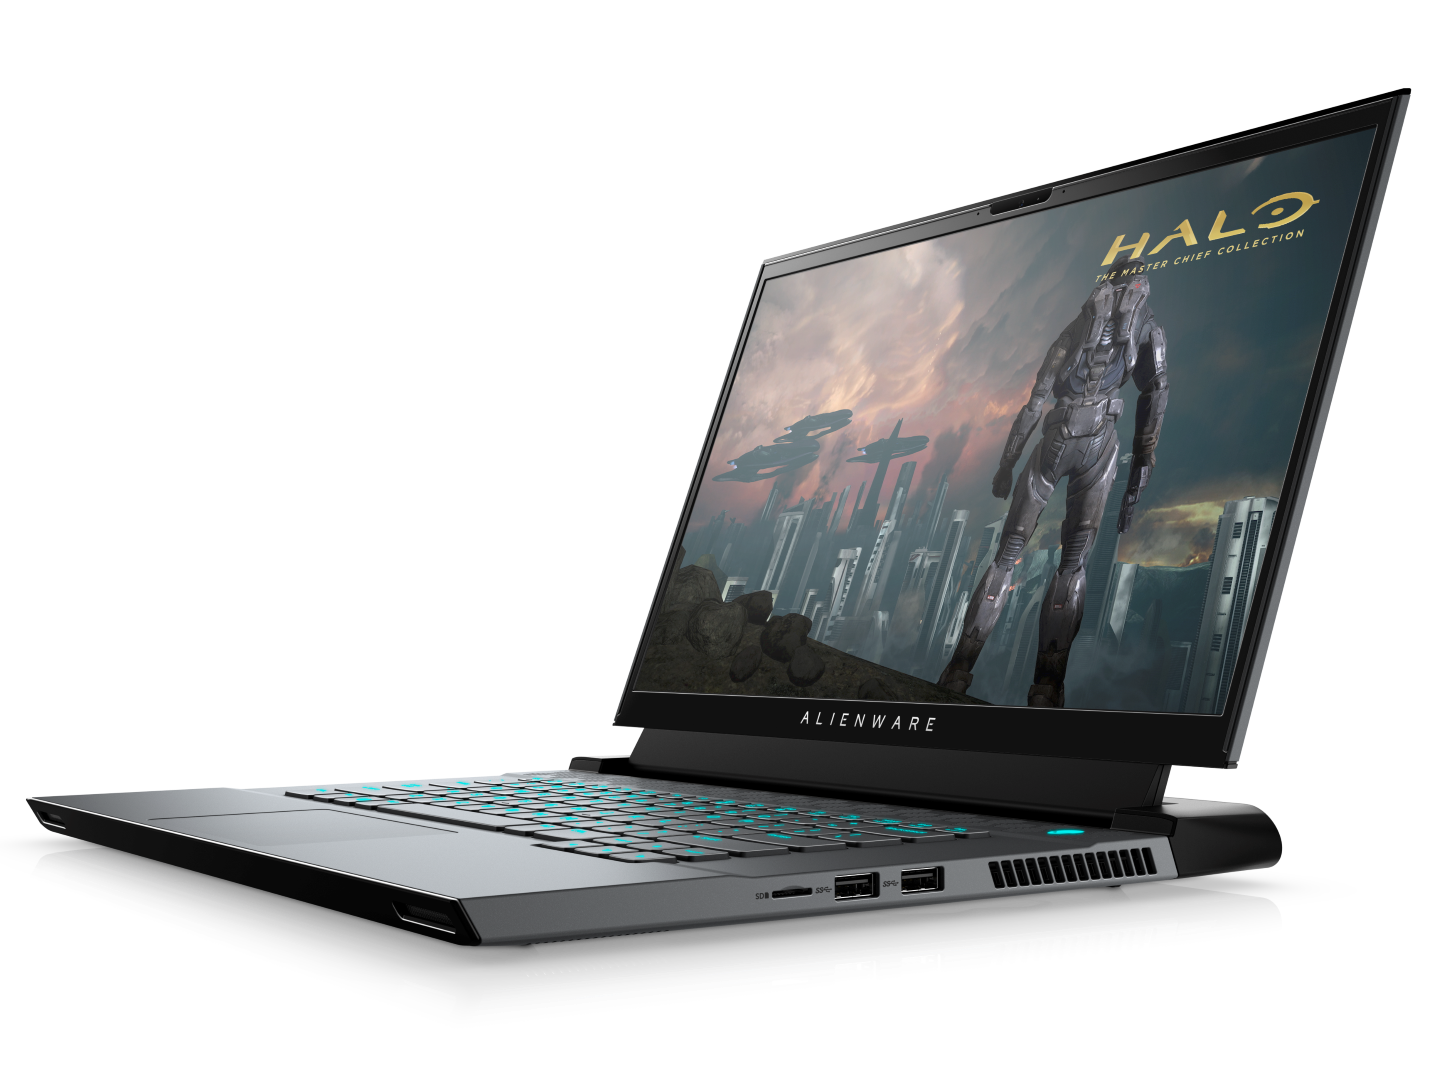
Dell Alienware m15 R3 Laptop Review: Vapor Chamber Saves The Day
The 2020 Dell Alienware m15 R3 is an internal refresh of the 2019 Alienware m15 R2. However, that statement alone undersells all the changes to the m15 R3 as the latest model offers more than just updated processor and display options that we usually see from most other OEMs. Dell has revamped the cooling solution without impacting the size of the system for what should lead to cooler core temperatures when gaming.
Competitors to the Alienware m15 R3 include other high-end ultra-thin gaming laptops like the MSI GS66, Razer Blade Pro 17, Asus Zephyrus S GX701, Acer Predator Triton, or Lenovo Legion Y740. See our review on the Alienware m15 R2 for more information on the chassis and its features since the m15 R3 is almost visually identically.
More Dell reviews:
Rating | Date | Model | Weight | Height | Size | Resolution | Price |
|---|---|---|---|---|---|---|---|
| 84.8 % v7 (old) | 07 / 2020 | Alienware m15 R3 P87F i7-10750H, GeForce RTX 2070 Mobile | 2.3 kg | 19.9 mm | 15.60" | 1920x1080 | |
| 82.6 % v7 (old) | 05 / 2020 | Eluktronics RP-15 R7 4800H, GeForce RTX 2060 Mobile | 1.9 kg | 20 mm | 15.60" | 1920x1080 | |
| 86 % v7 (old) | 05 / 2020 | Razer Blade 15 RZ09-0328 i7-10750H, GeForce RTX 2070 Max-Q | 2.1 kg | 19.9 mm | 15.60" | 3840x2160 | |
| 81.3 % v7 (old) | 05 / 2019 | Asus Zephyrus S GX502GW i7-9750H, GeForce RTX 2070 Mobile | 2.1 kg | 19 mm | 15.60" | 1920x1080 | |
| 82.8 % v7 (old) | 05 / 2020 | MSI GS66 Stealth 10SFS i9-10980HK, GeForce RTX 2070 Super Max-Q | 2.2 kg | 20 mm | 15.60" | 1920x1080 |
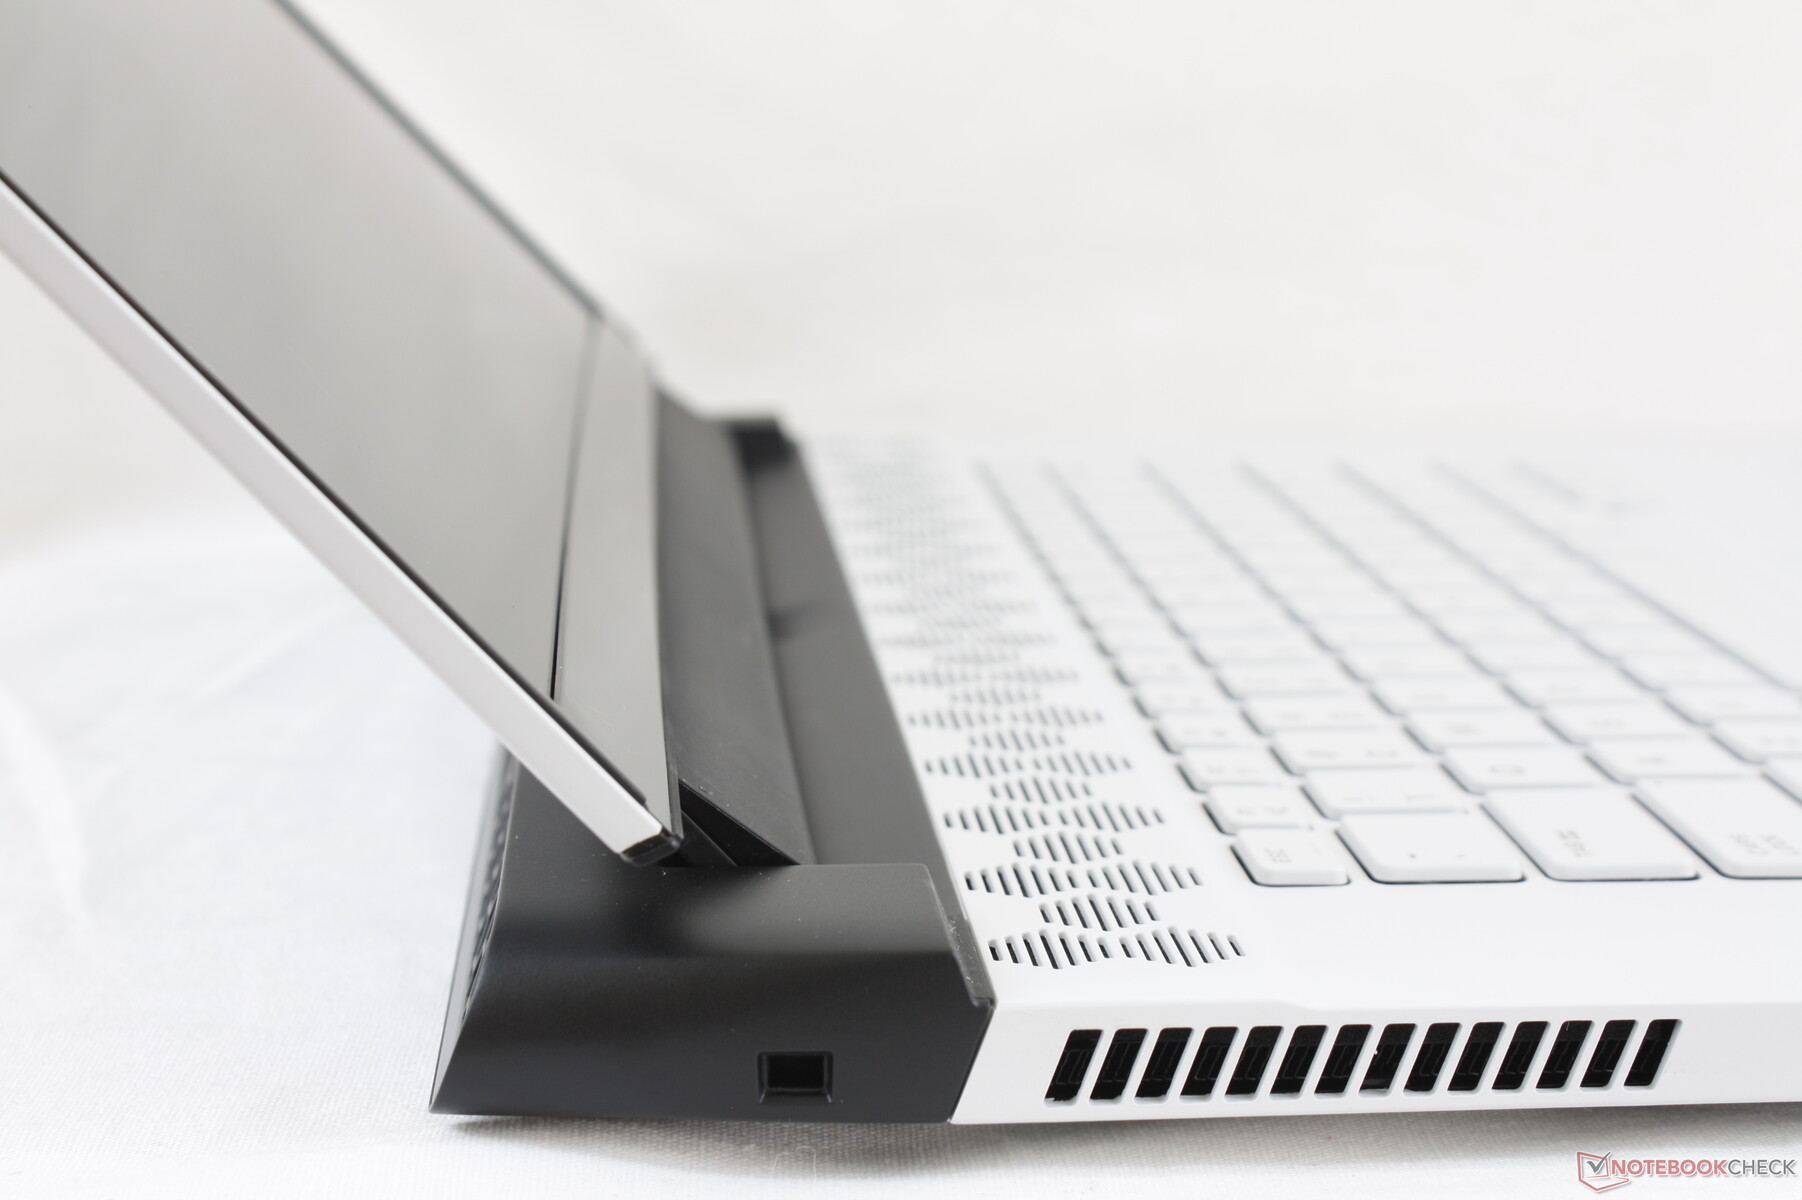
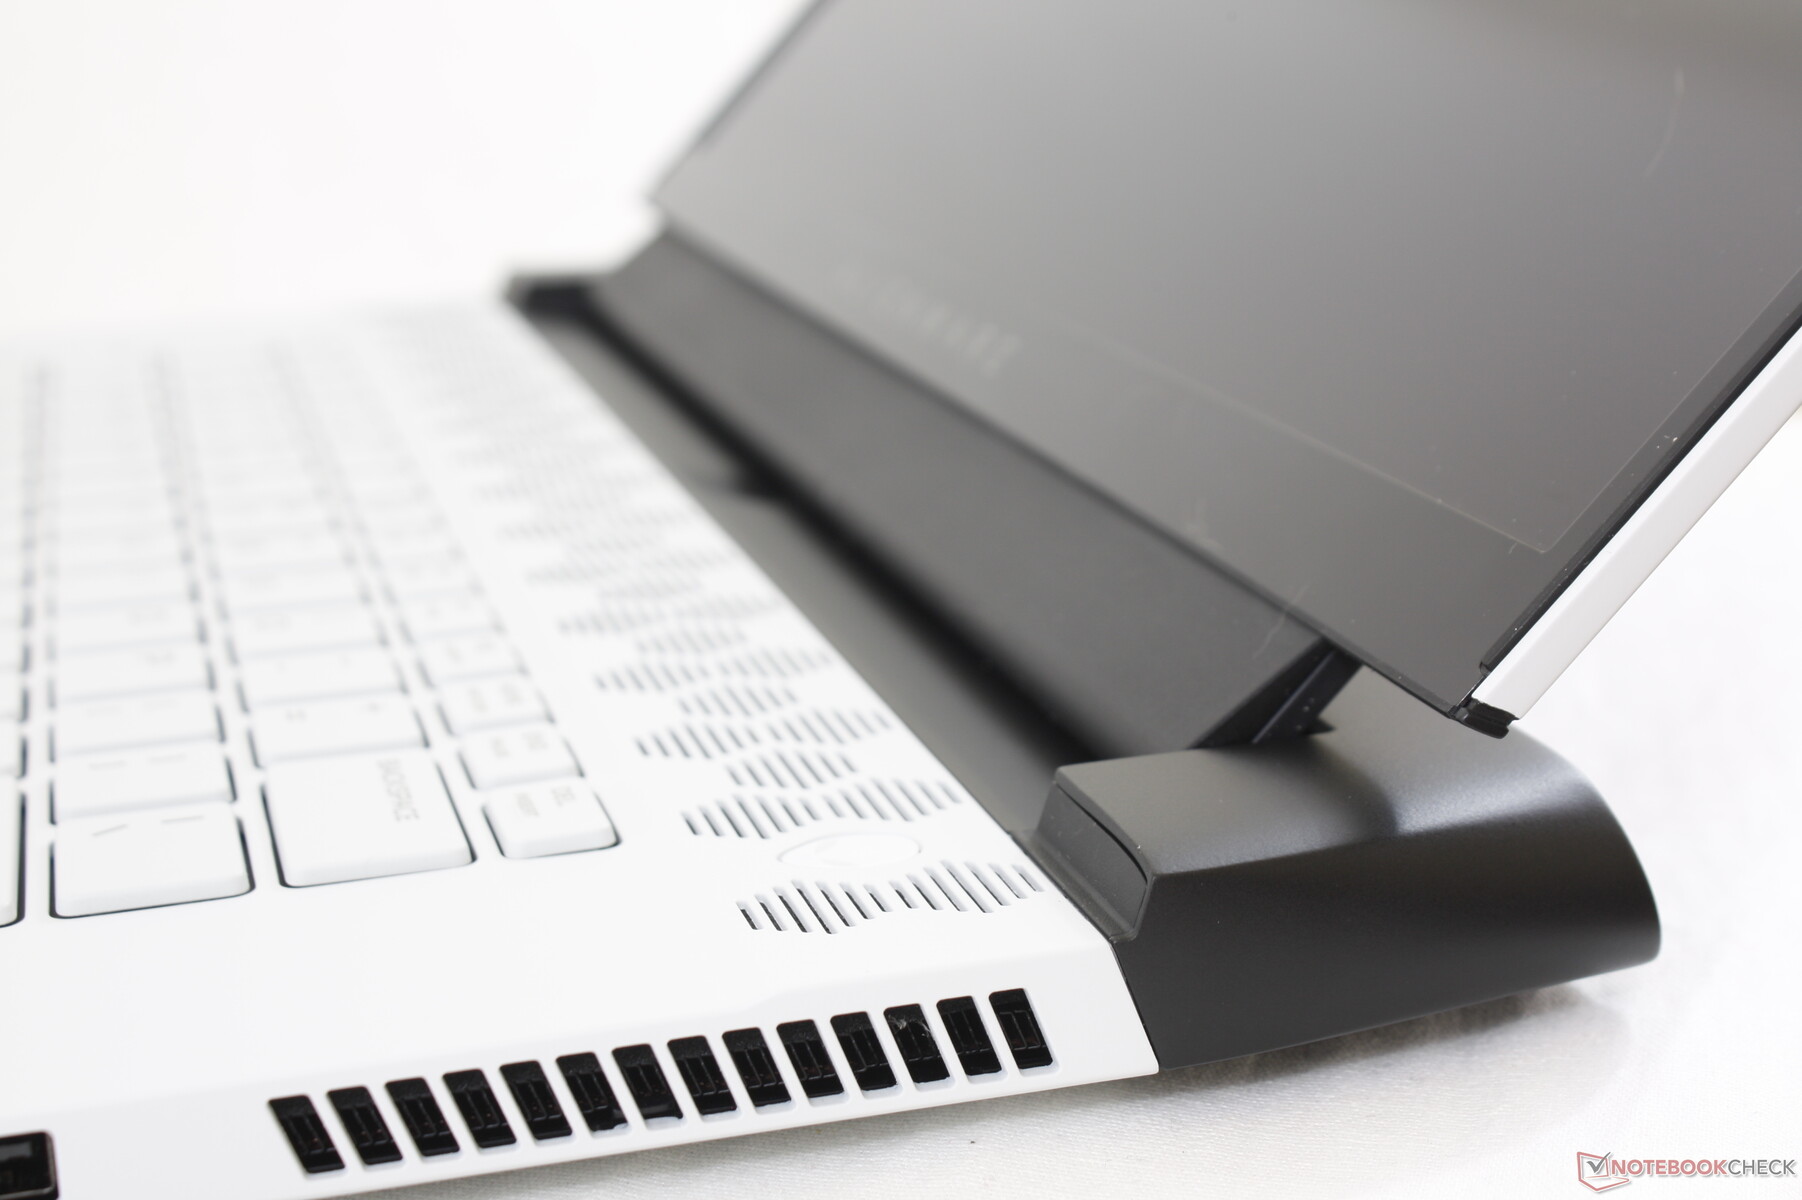
Case
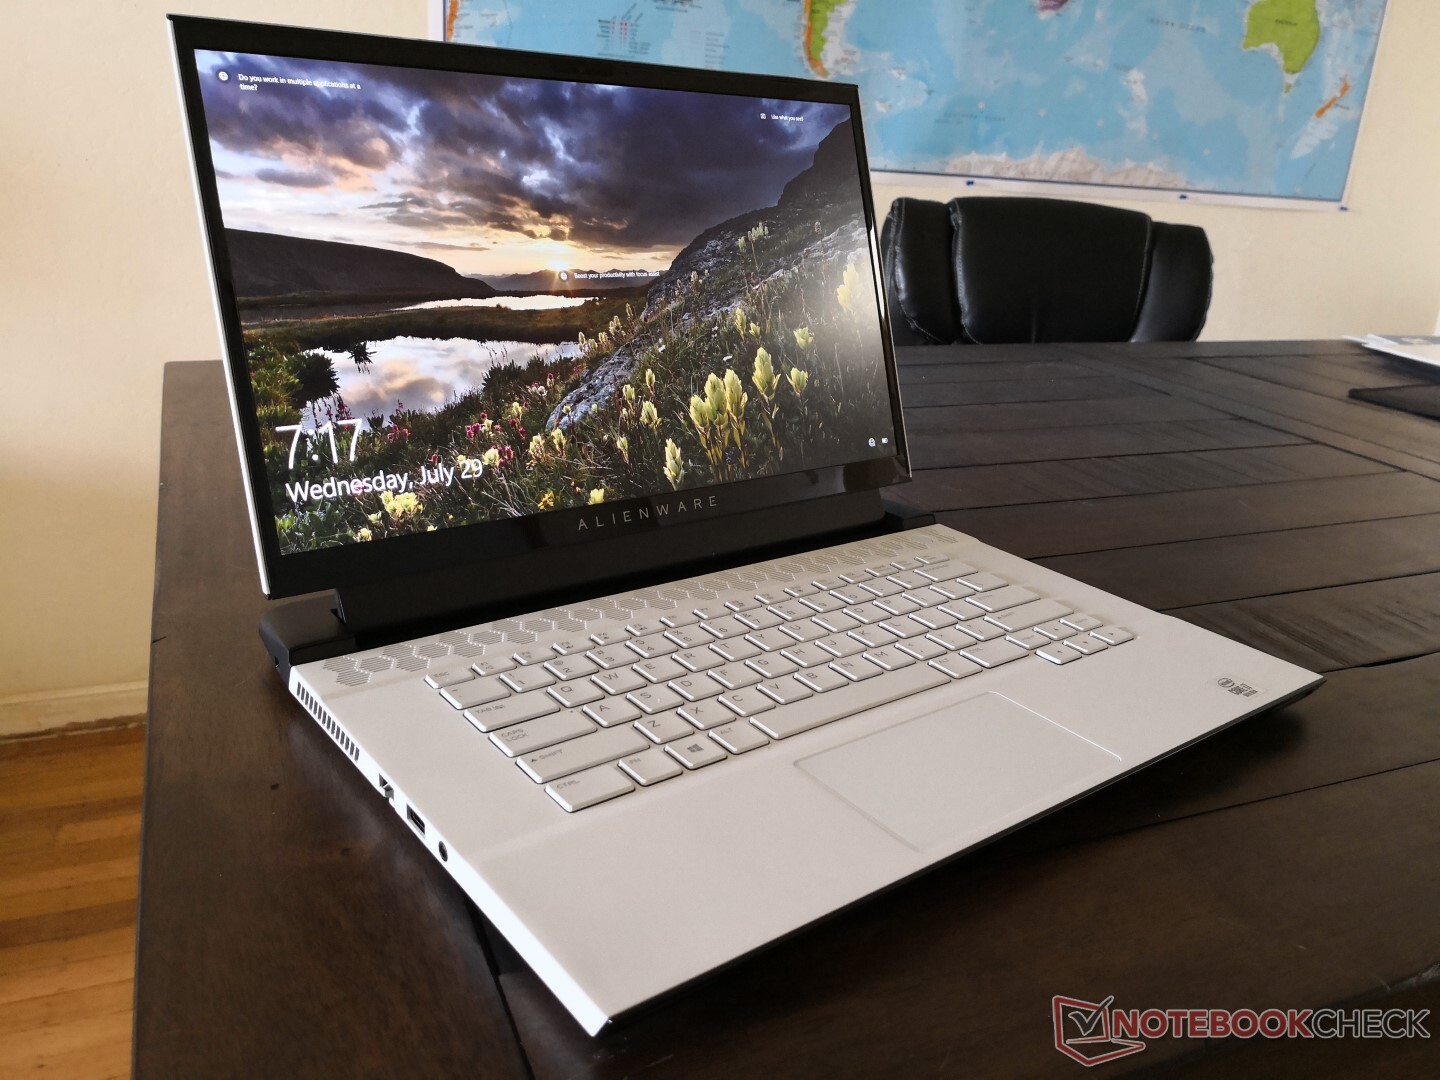
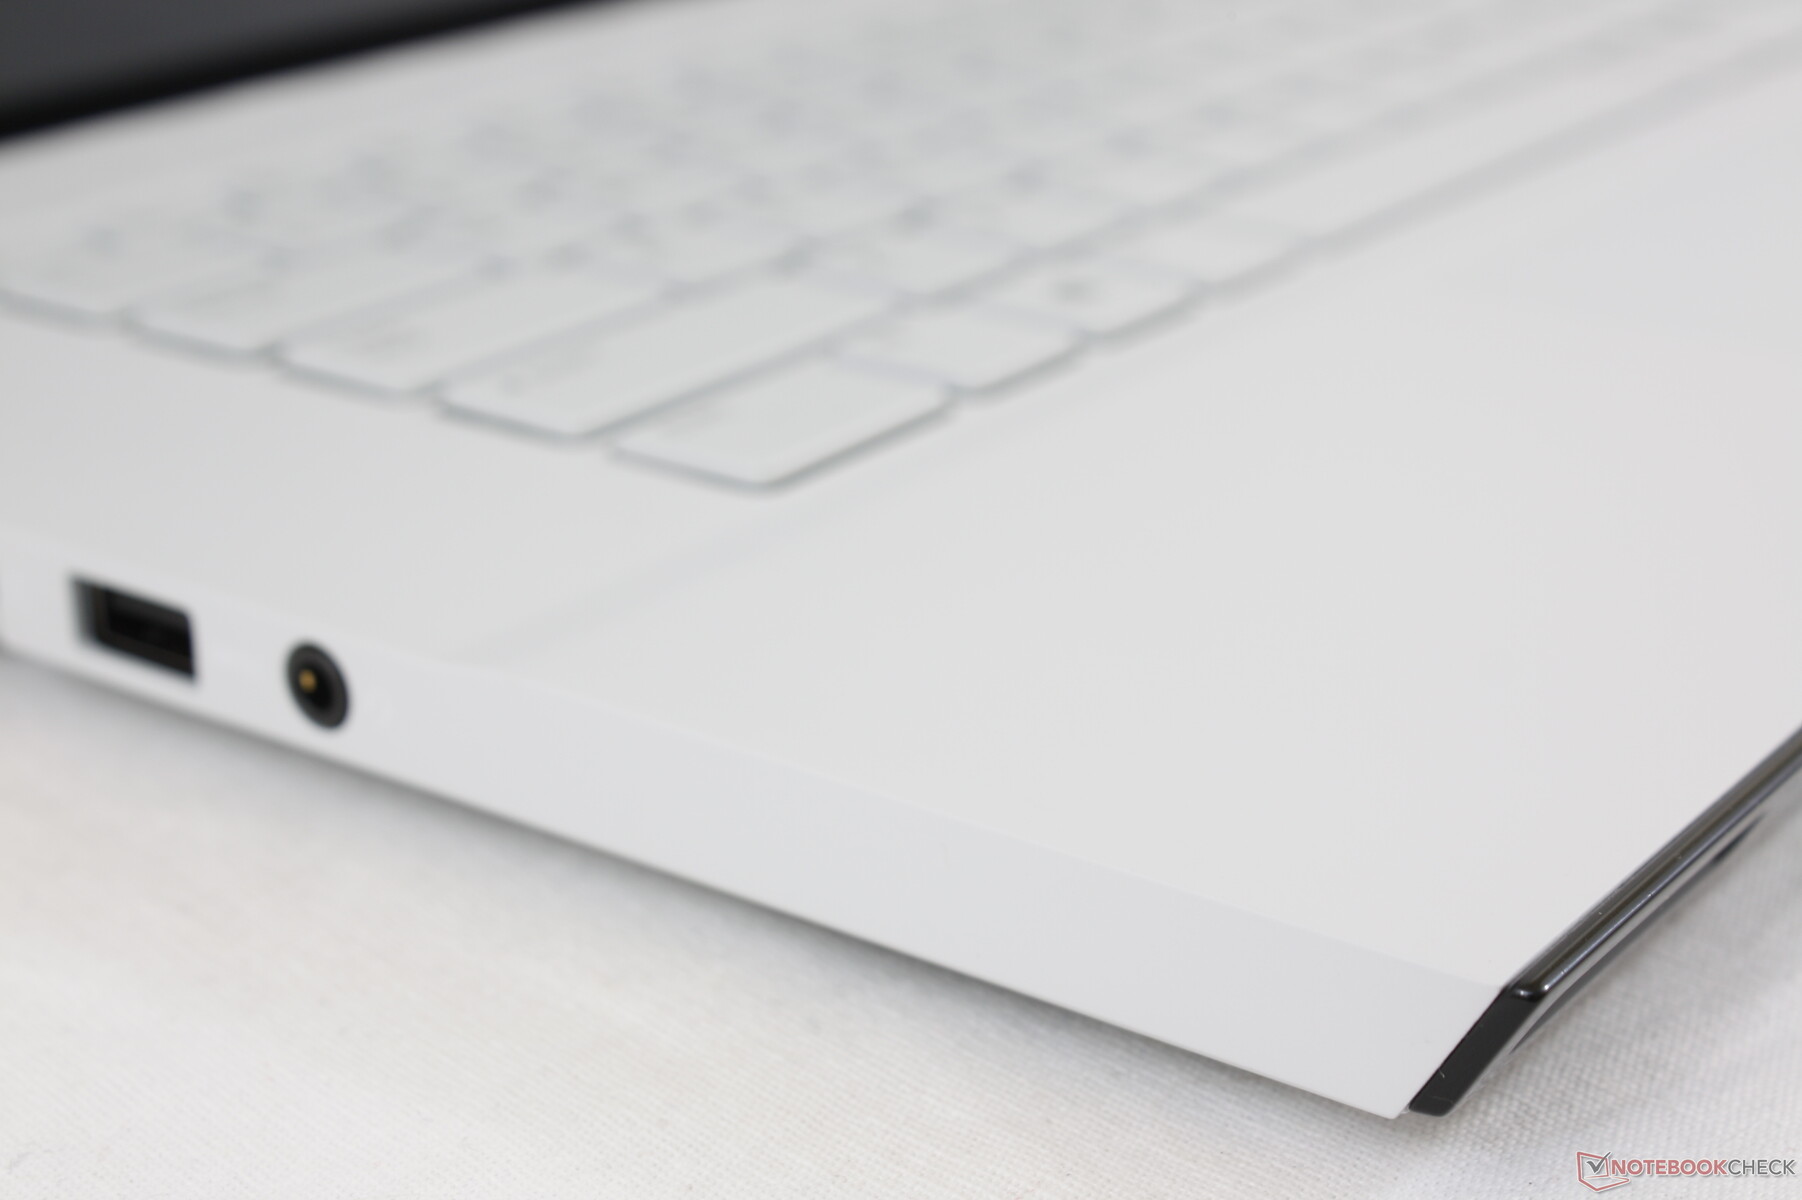
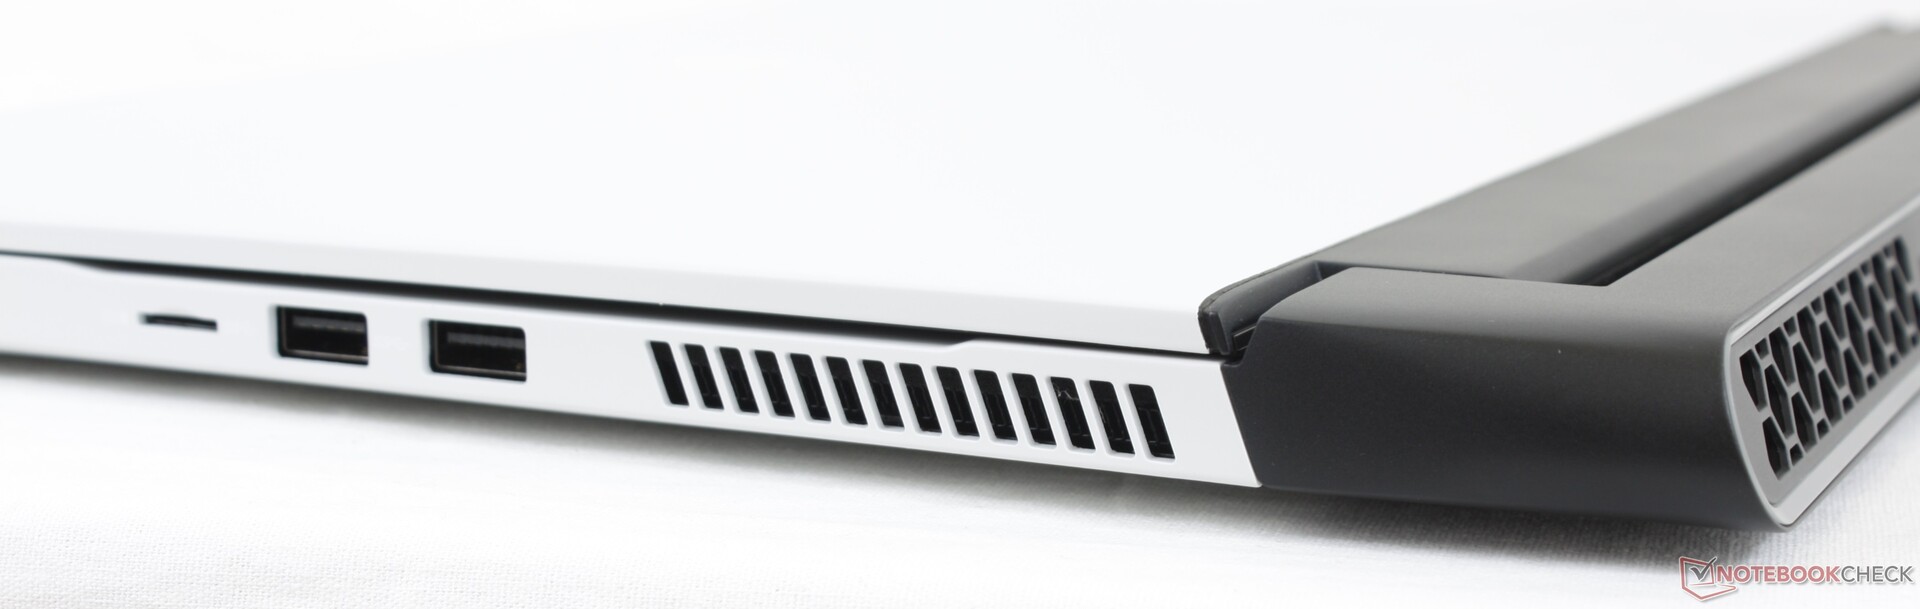
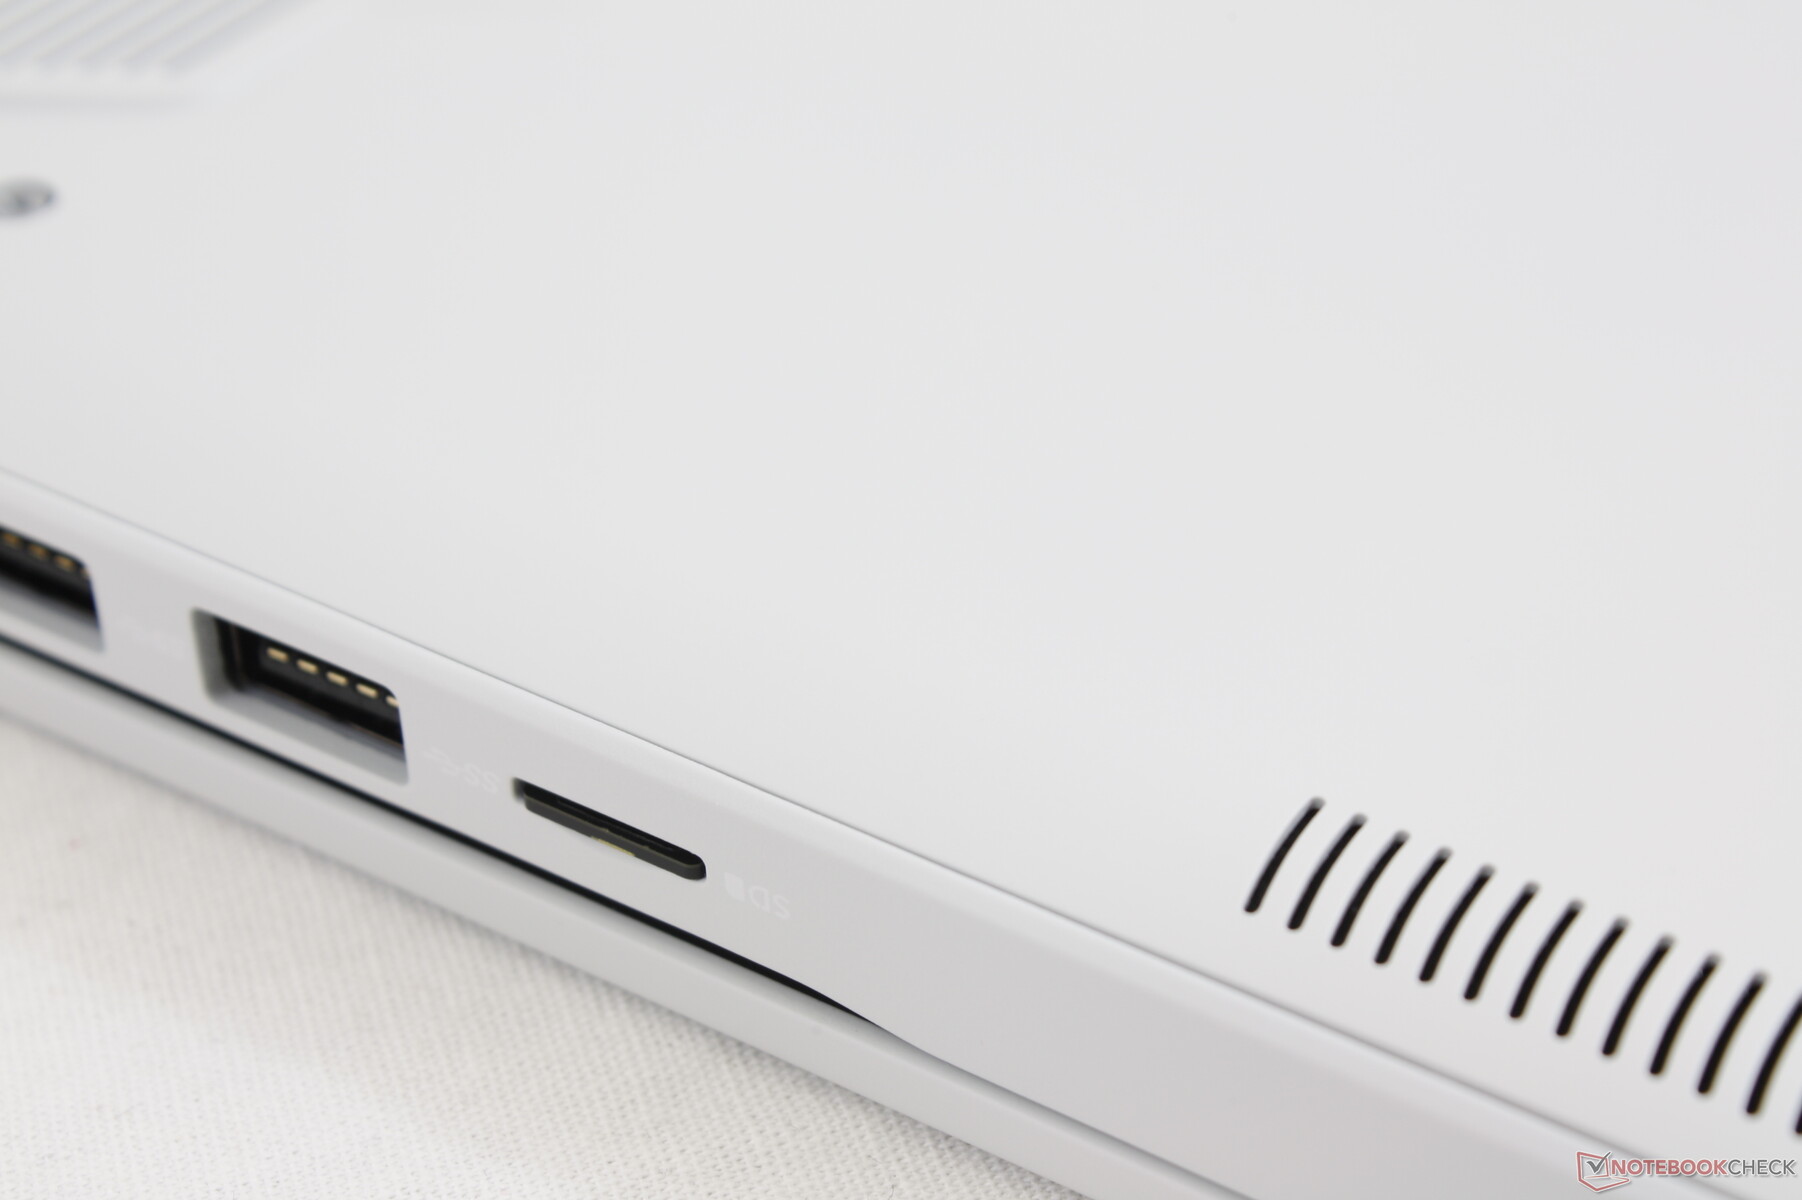
The easiest way to identify an Alienware m15 R3 from the m15 R2 is by looking for the MicroSD card reader along the left edge. Otherwise, the systems share the same chassis design. The current look is barely a year old so it's not time for Dell to completely refresh the chassis just yet.
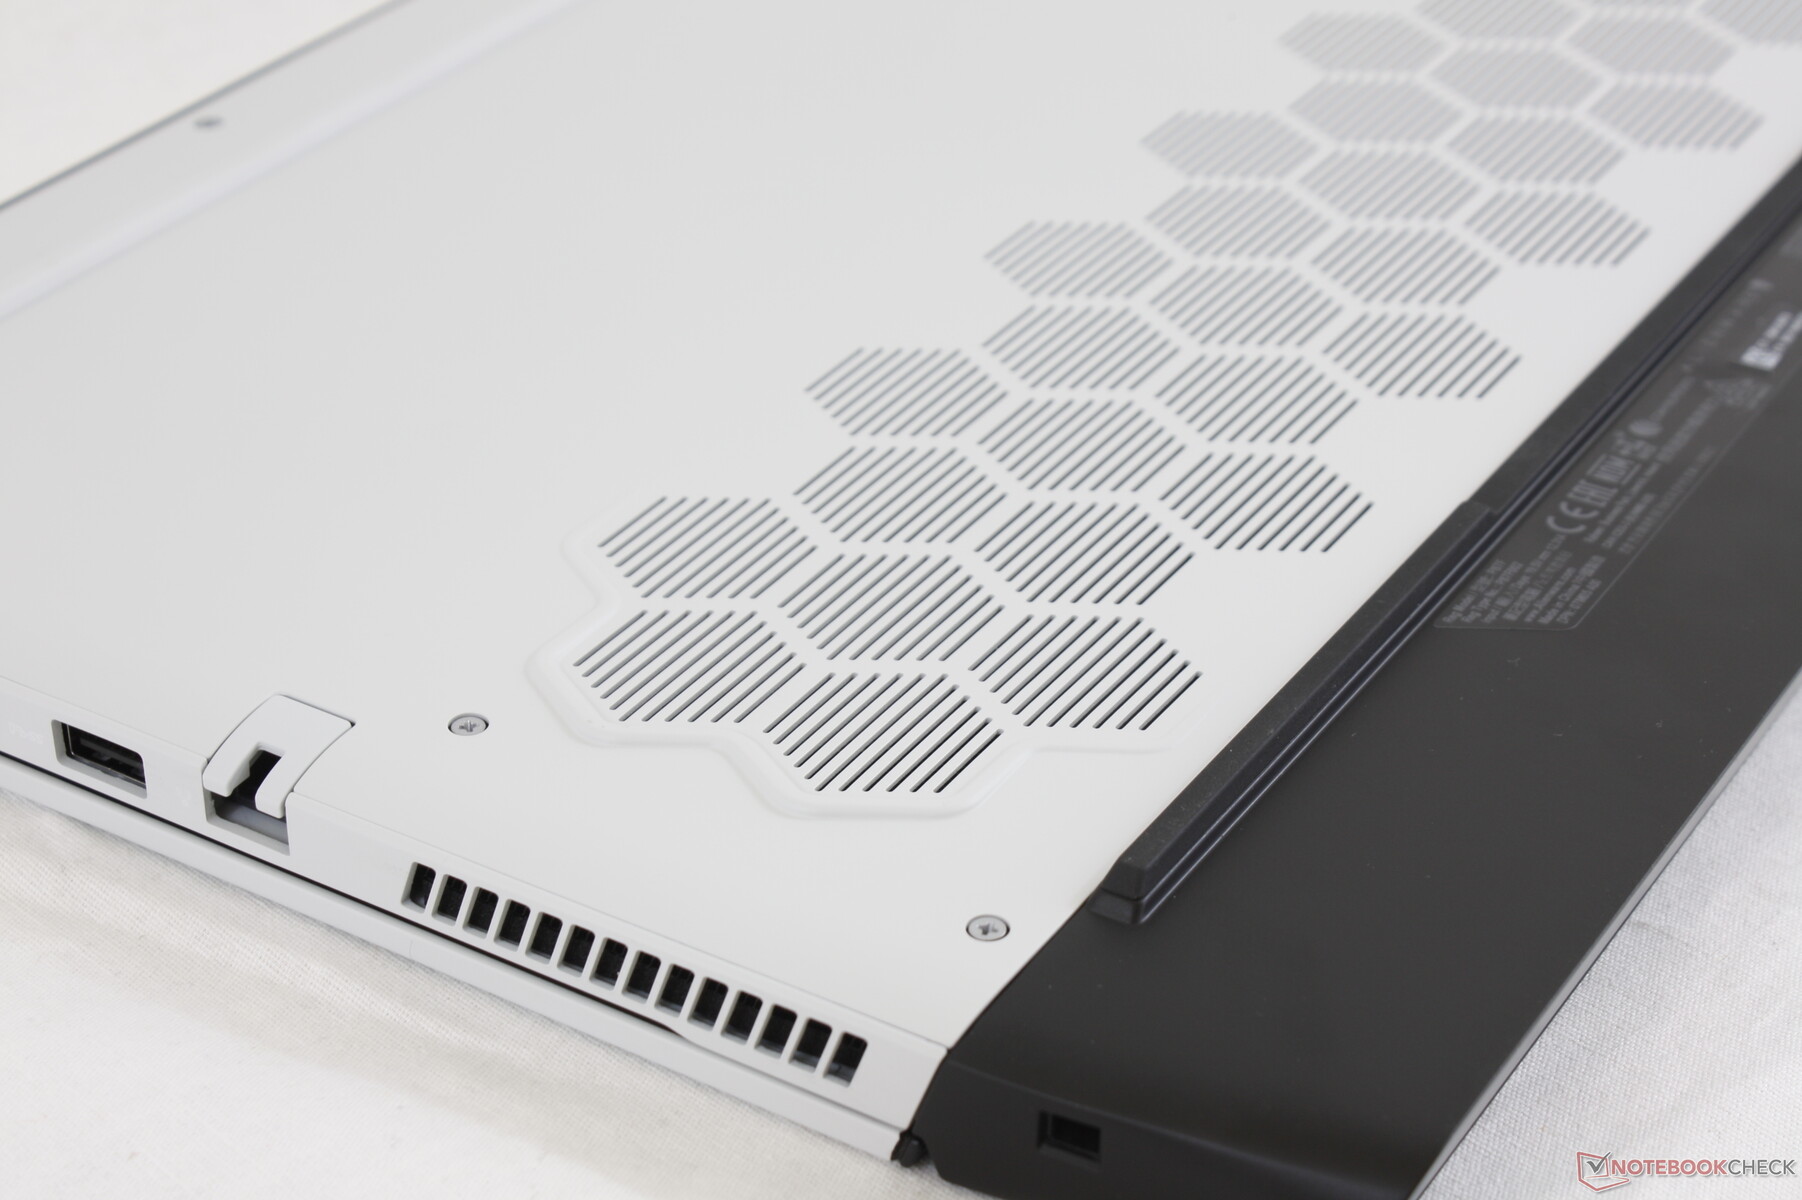
Another smaller exterior update is the use of a new "High Endurance Clear Coat" finish to reduce fingerprint buildup. We suspect that this will make a bigger difference on the black chassis option as fingerprints are already difficult to see on our white test unit.

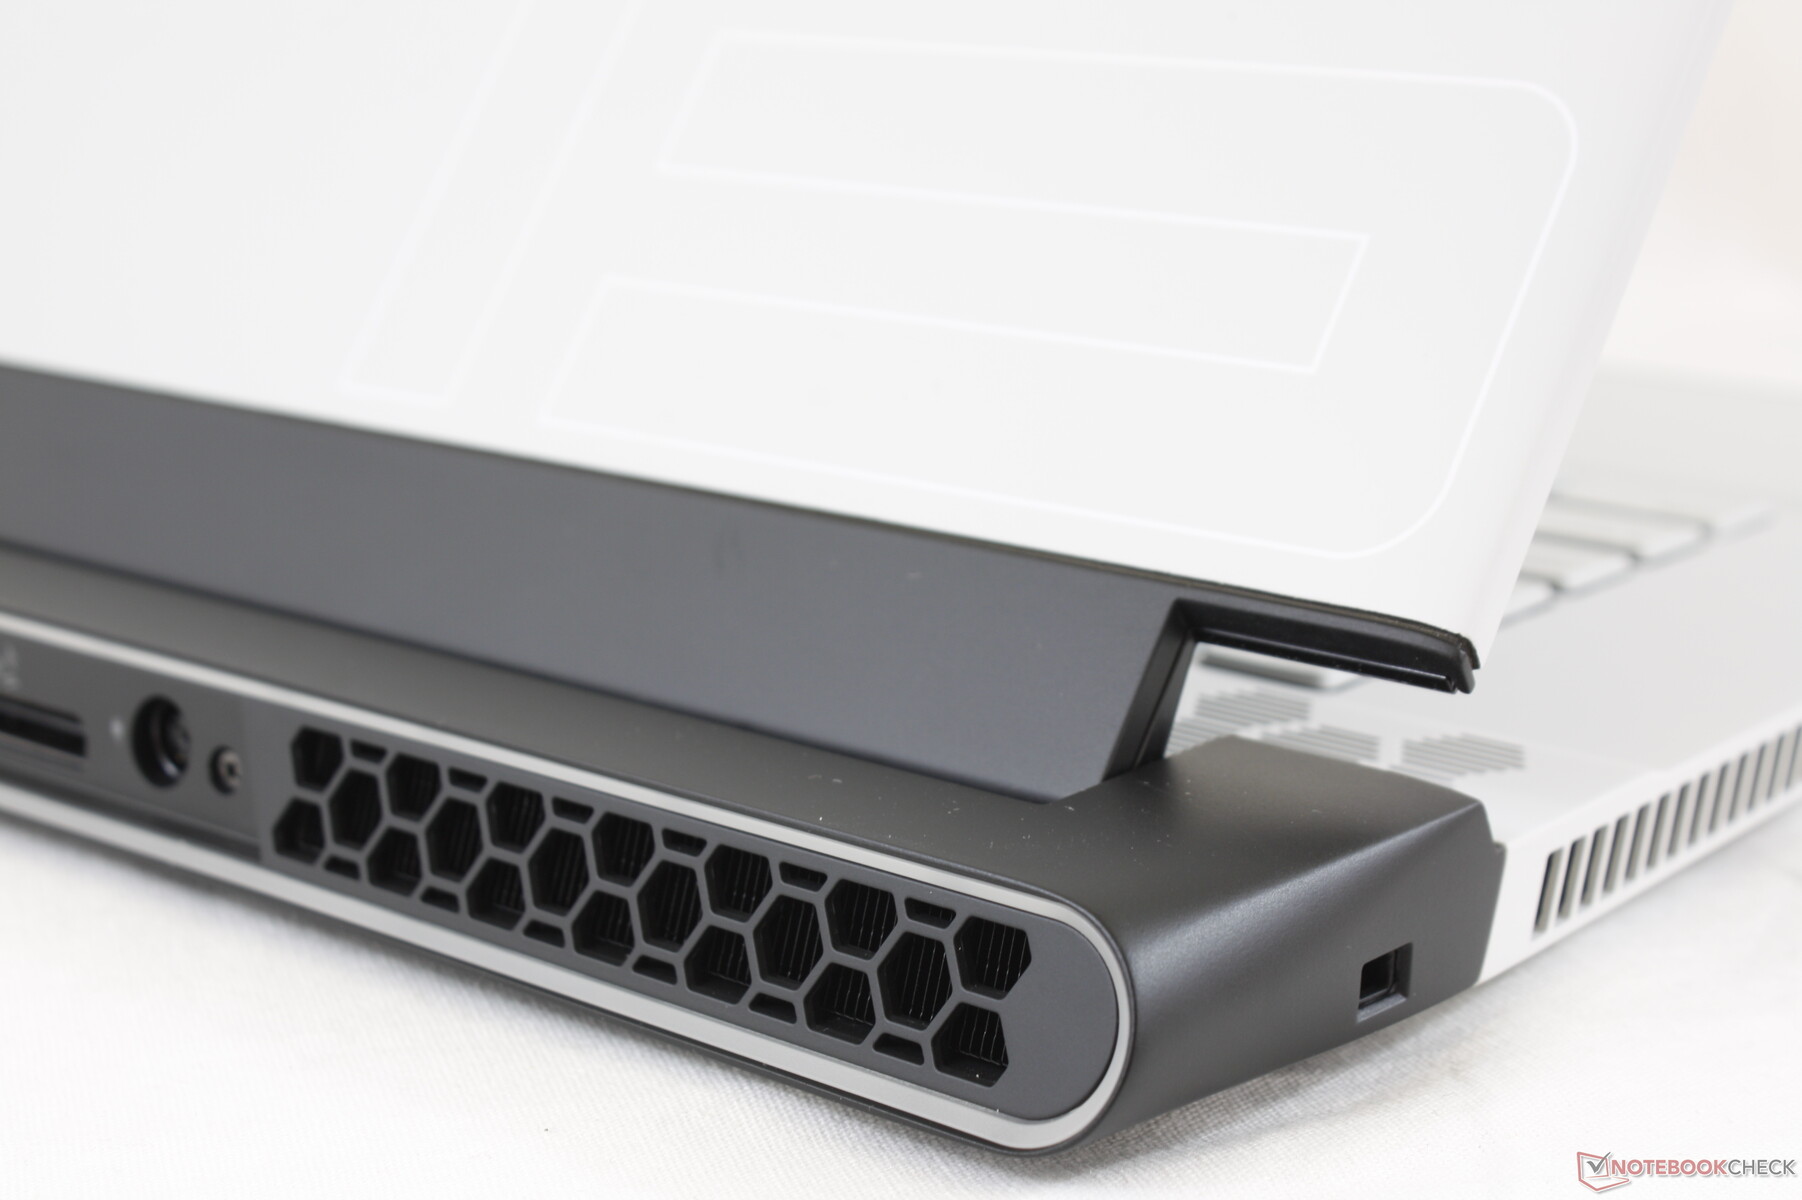
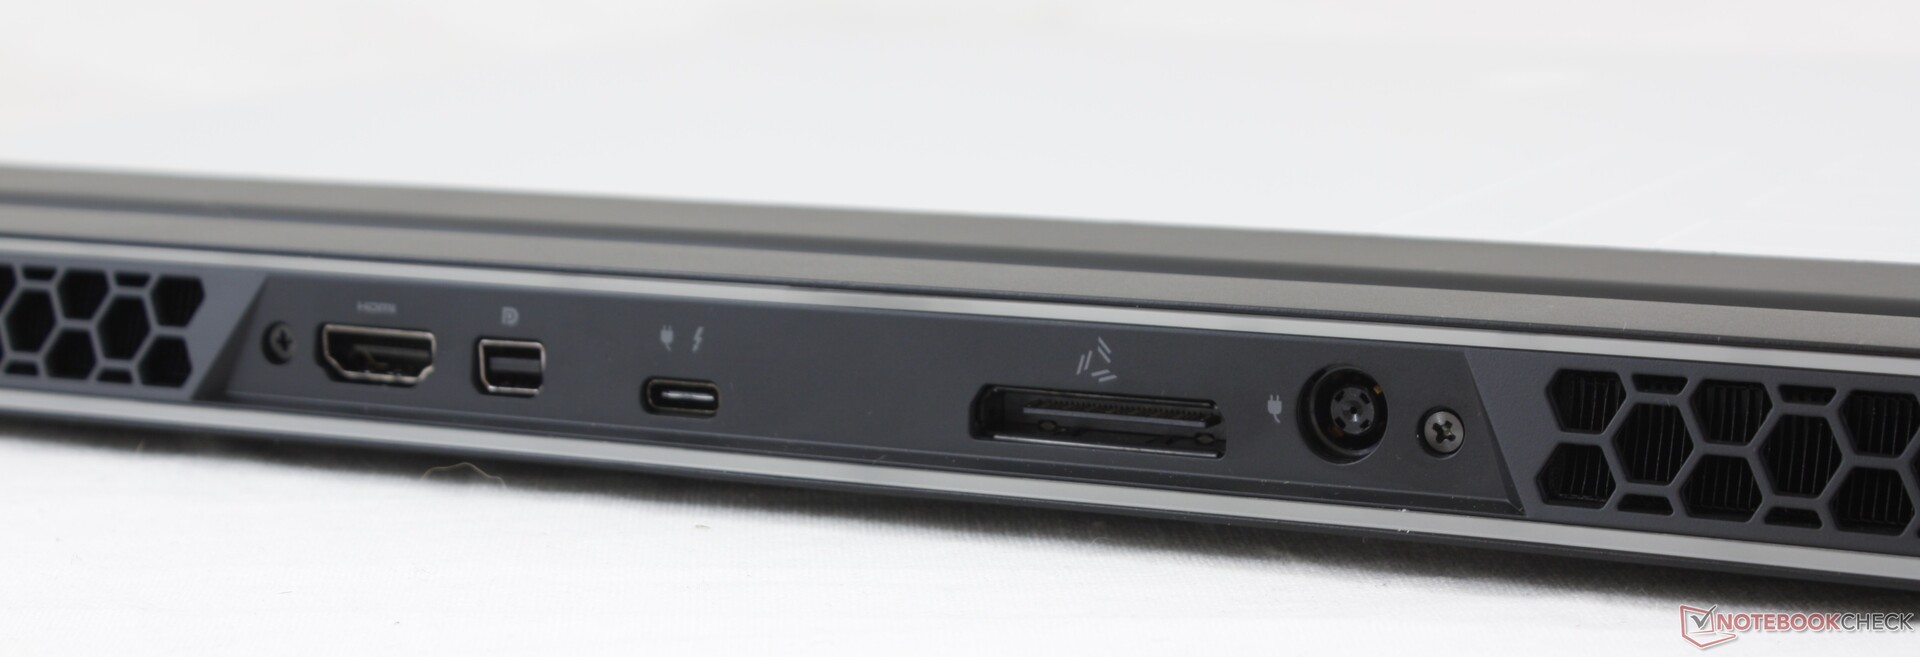
Connectivity
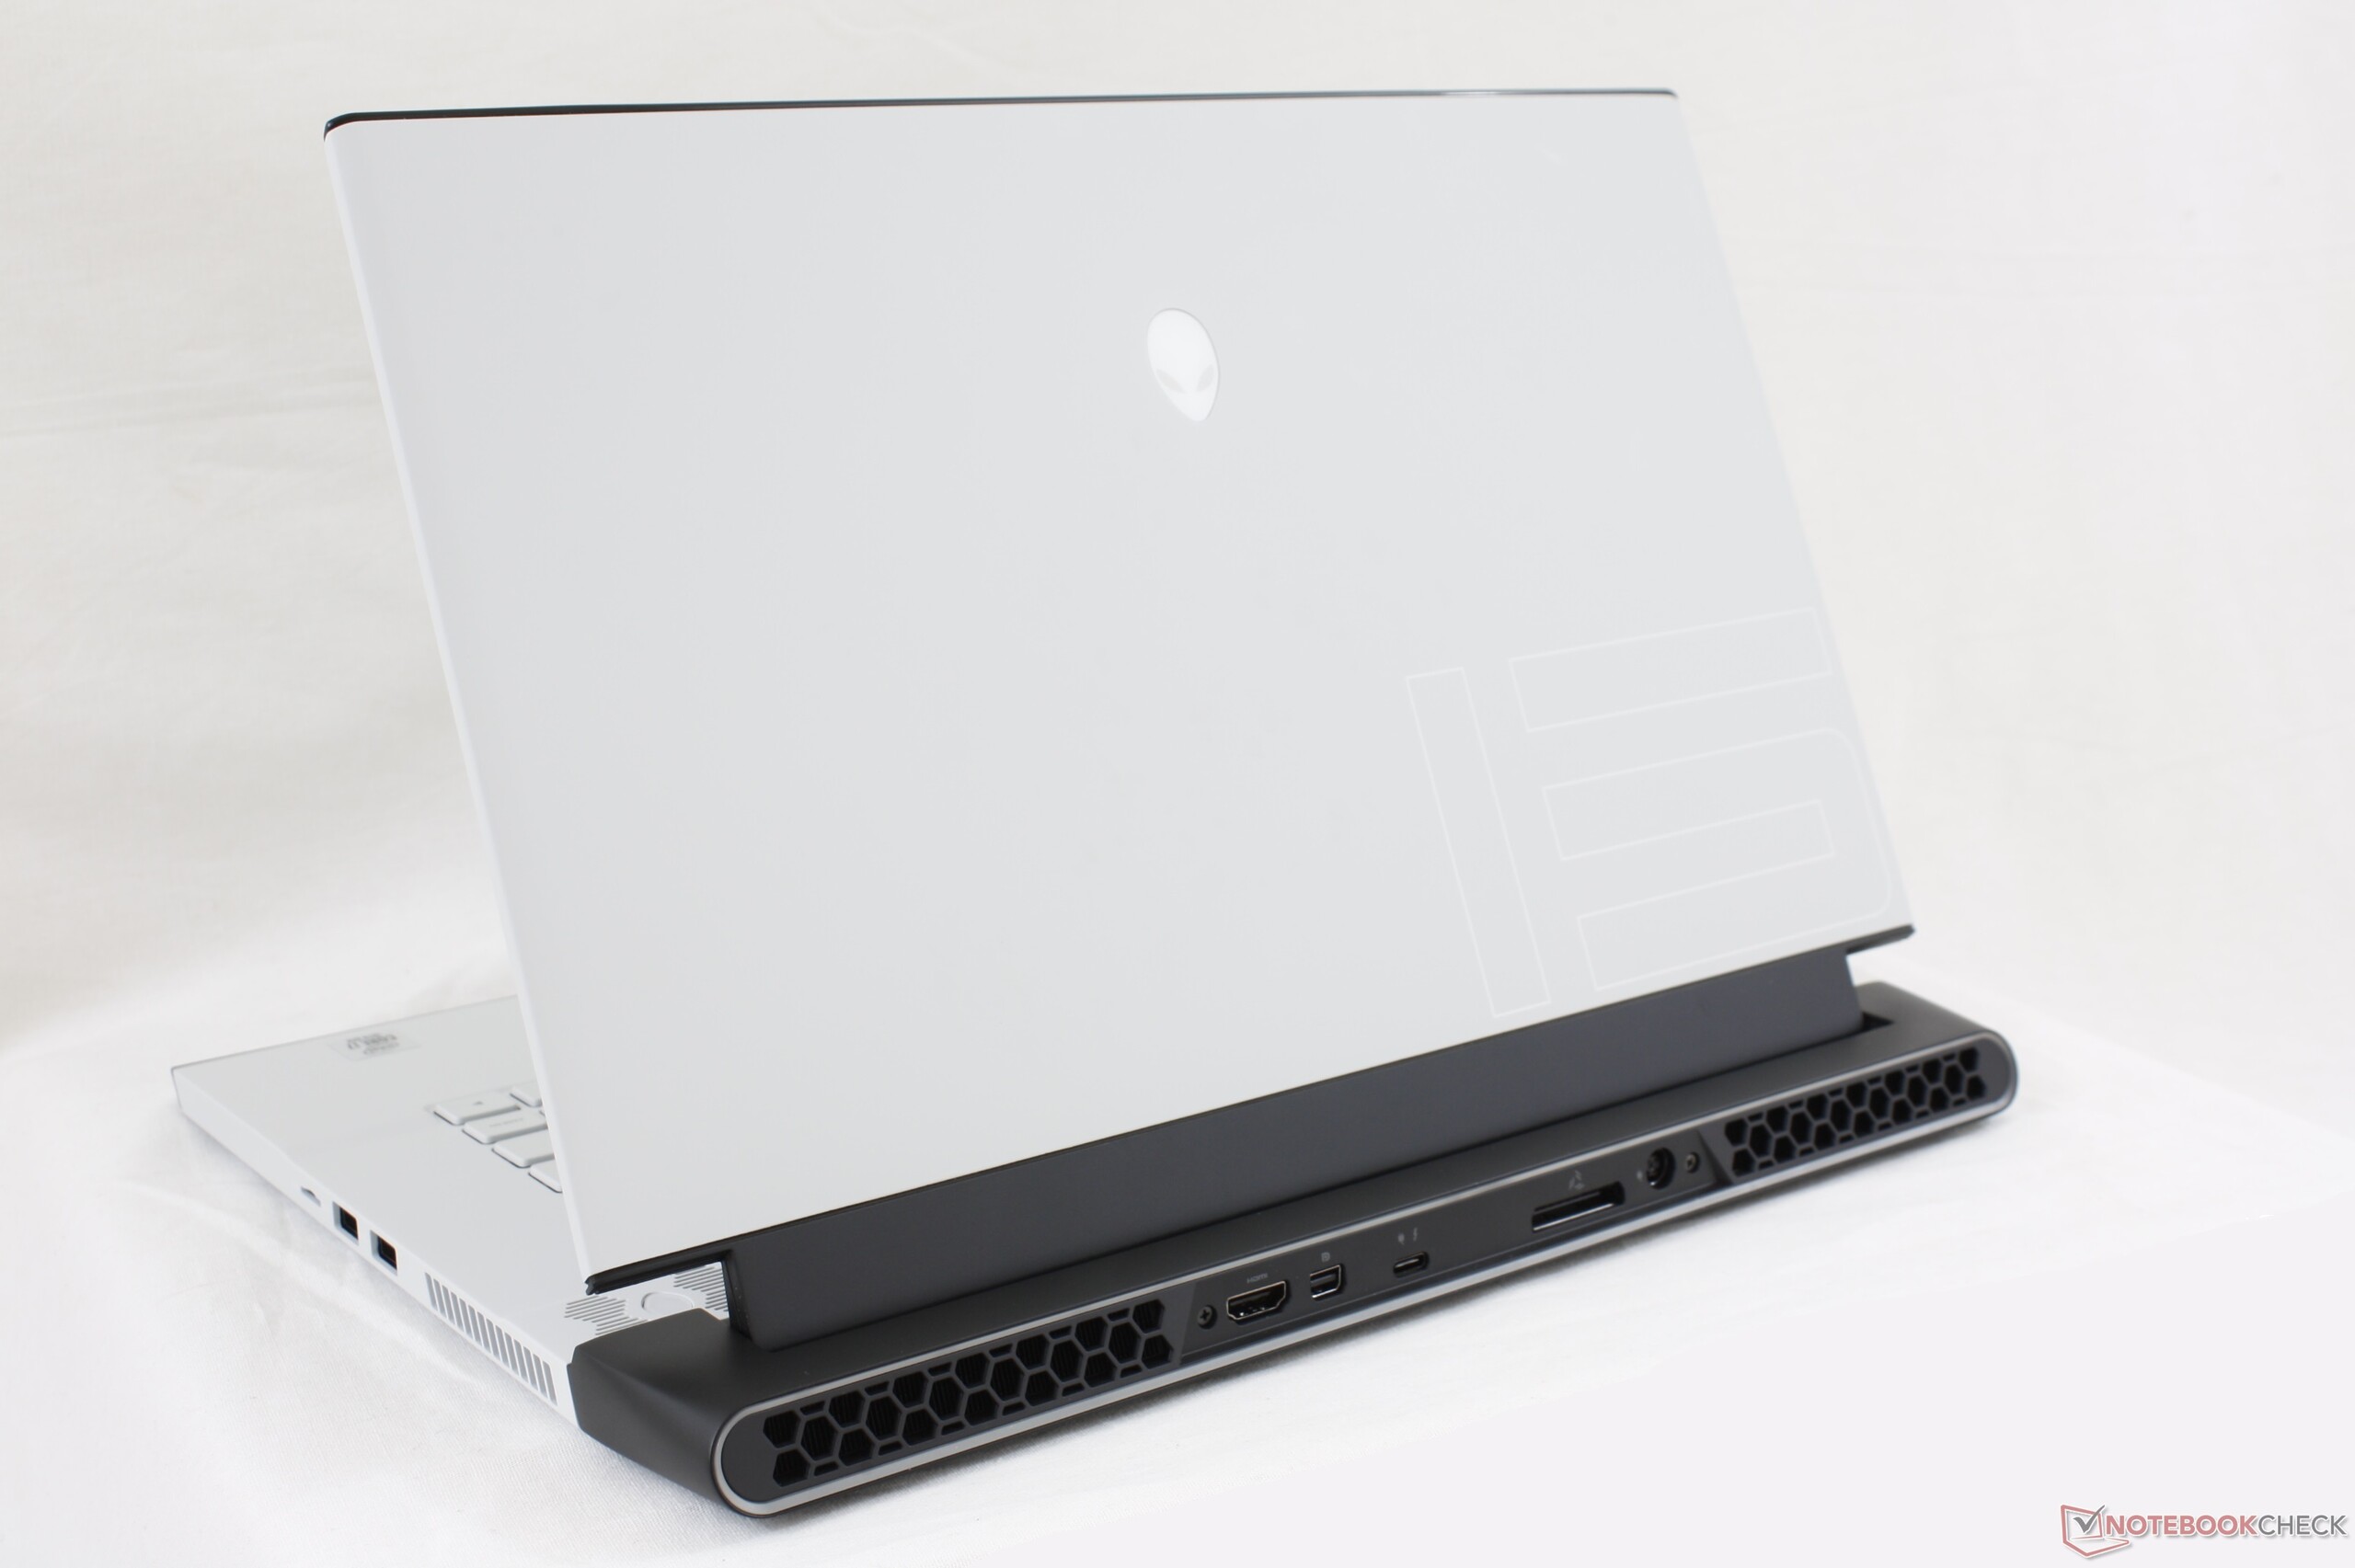
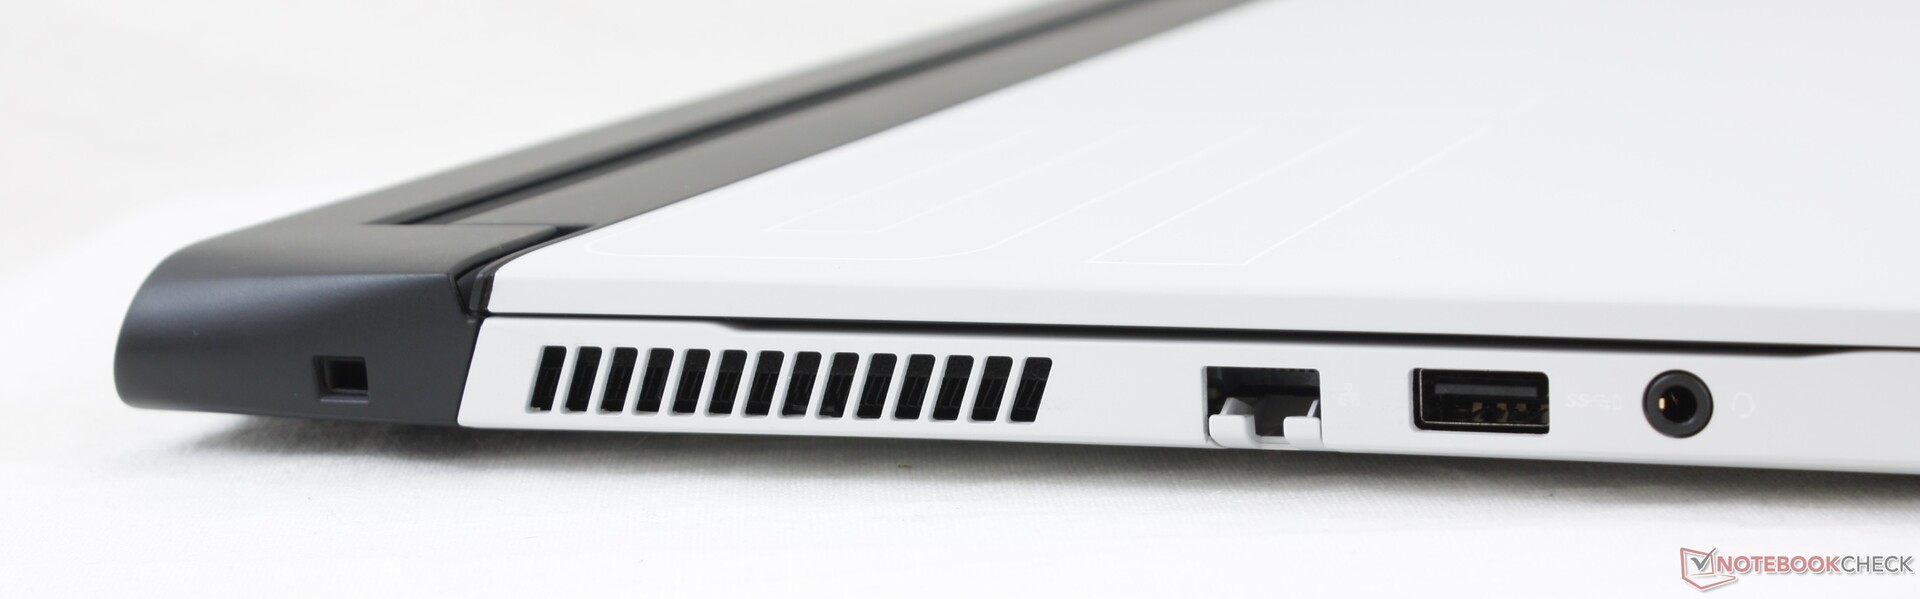
Ports remain identical to the m15 R2 including the return of the proprietary Graphics Amplifier port. The USB-C port, however, can now recharge the laptop. We would have loved to see LED indicators for the rear ports much like on the older Lenovo Legion Y730 for easier access. As of now, they are hard to see without first getting up and reaching over.
SD Card Reader
Transfer rates are extremely fast with our UHS-II test card. Moving 1 GB of pictures from card to desktop takes only about 6 seconds much like on the XPS series.
| SD Card Reader | |
| average JPG Copy Test (av. of 3 runs) | |
| MSI GS75 10SF-609US (Toshiba Exceria Pro M501 UHS-II) | |
| Dell XPS 15 9500 Core i7 4K UHD (Toshiba Exceria Pro SDXC 64 GB UHS-II) | |
| Gigabyte Aero 15 OLED XA (Toshiba Exceria Pro SDXC 64 GB UHS-II) | |
| Alienware m15 R3 P87F (Toshiba Exceria Pro M501 UHS-II) | |
| Eluktronics RP-15 (Toshiba Exceria Pro SDXC 64 GB UHS-II) | |
| maximum AS SSD Seq Read Test (1GB) | |
| Gigabyte Aero 15 OLED XA (Toshiba Exceria Pro SDXC 64 GB UHS-II) | |
| Alienware m15 R3 P87F (Toshiba Exceria Pro M501 UHS-II) | |
| MSI GS75 10SF-609US (Toshiba Exceria Pro M501 UHS-II) | |
| Dell XPS 15 9500 Core i7 4K UHD (Toshiba Exceria Pro SDXC 64 GB UHS-II) | |
| Eluktronics RP-15 (Toshiba Exceria Pro SDXC 64 GB UHS-II) | |
Communication
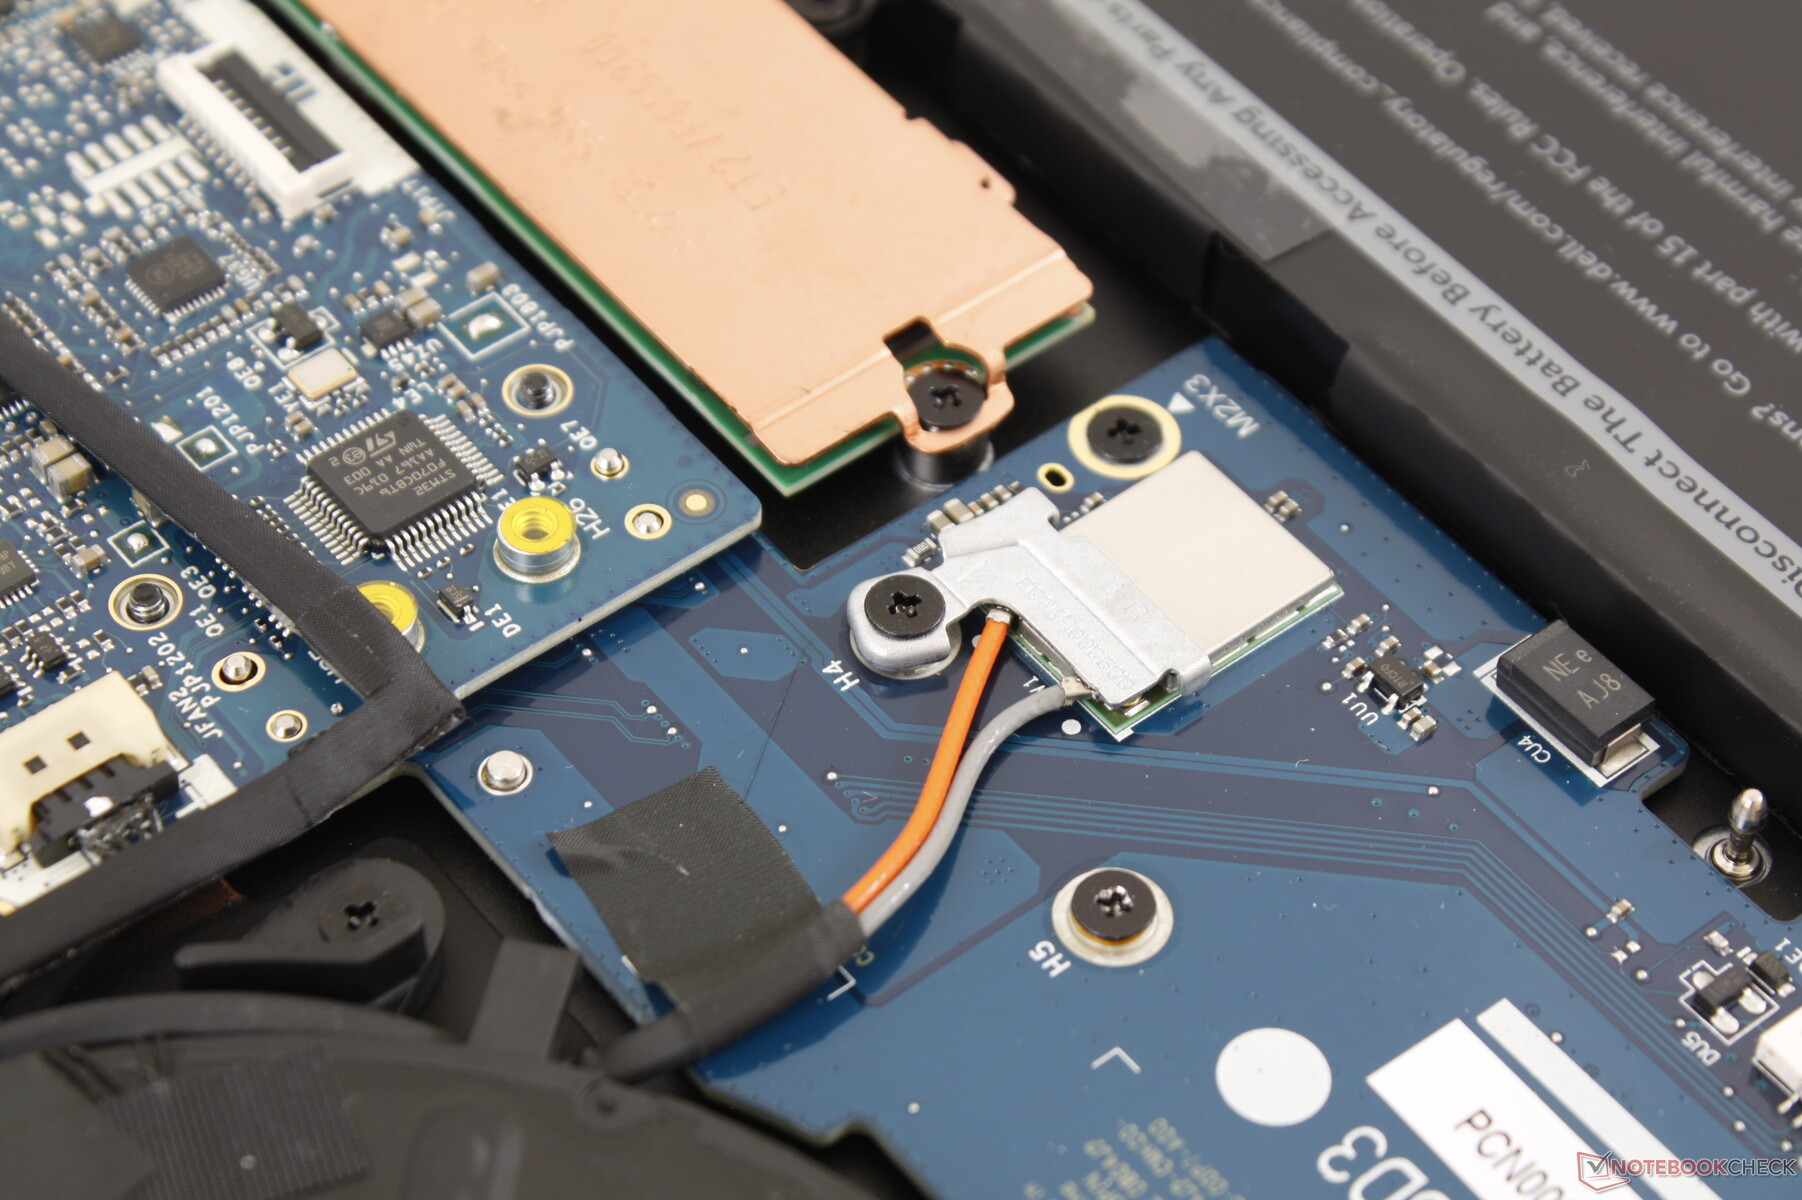
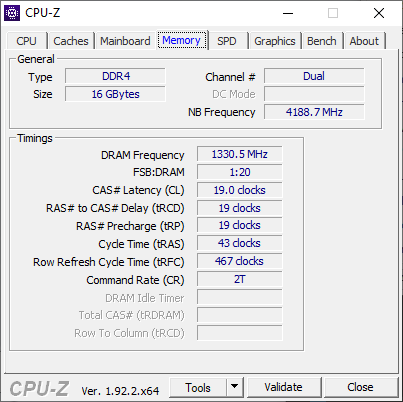
The Killer AX1650w comes standard for Wi-Fi 6 connectivity and Bluetooth 5.1. It is essentially identical to the Intel AX201 but with gaming-specific enhancements.
Webcam

")
")
Maintenance
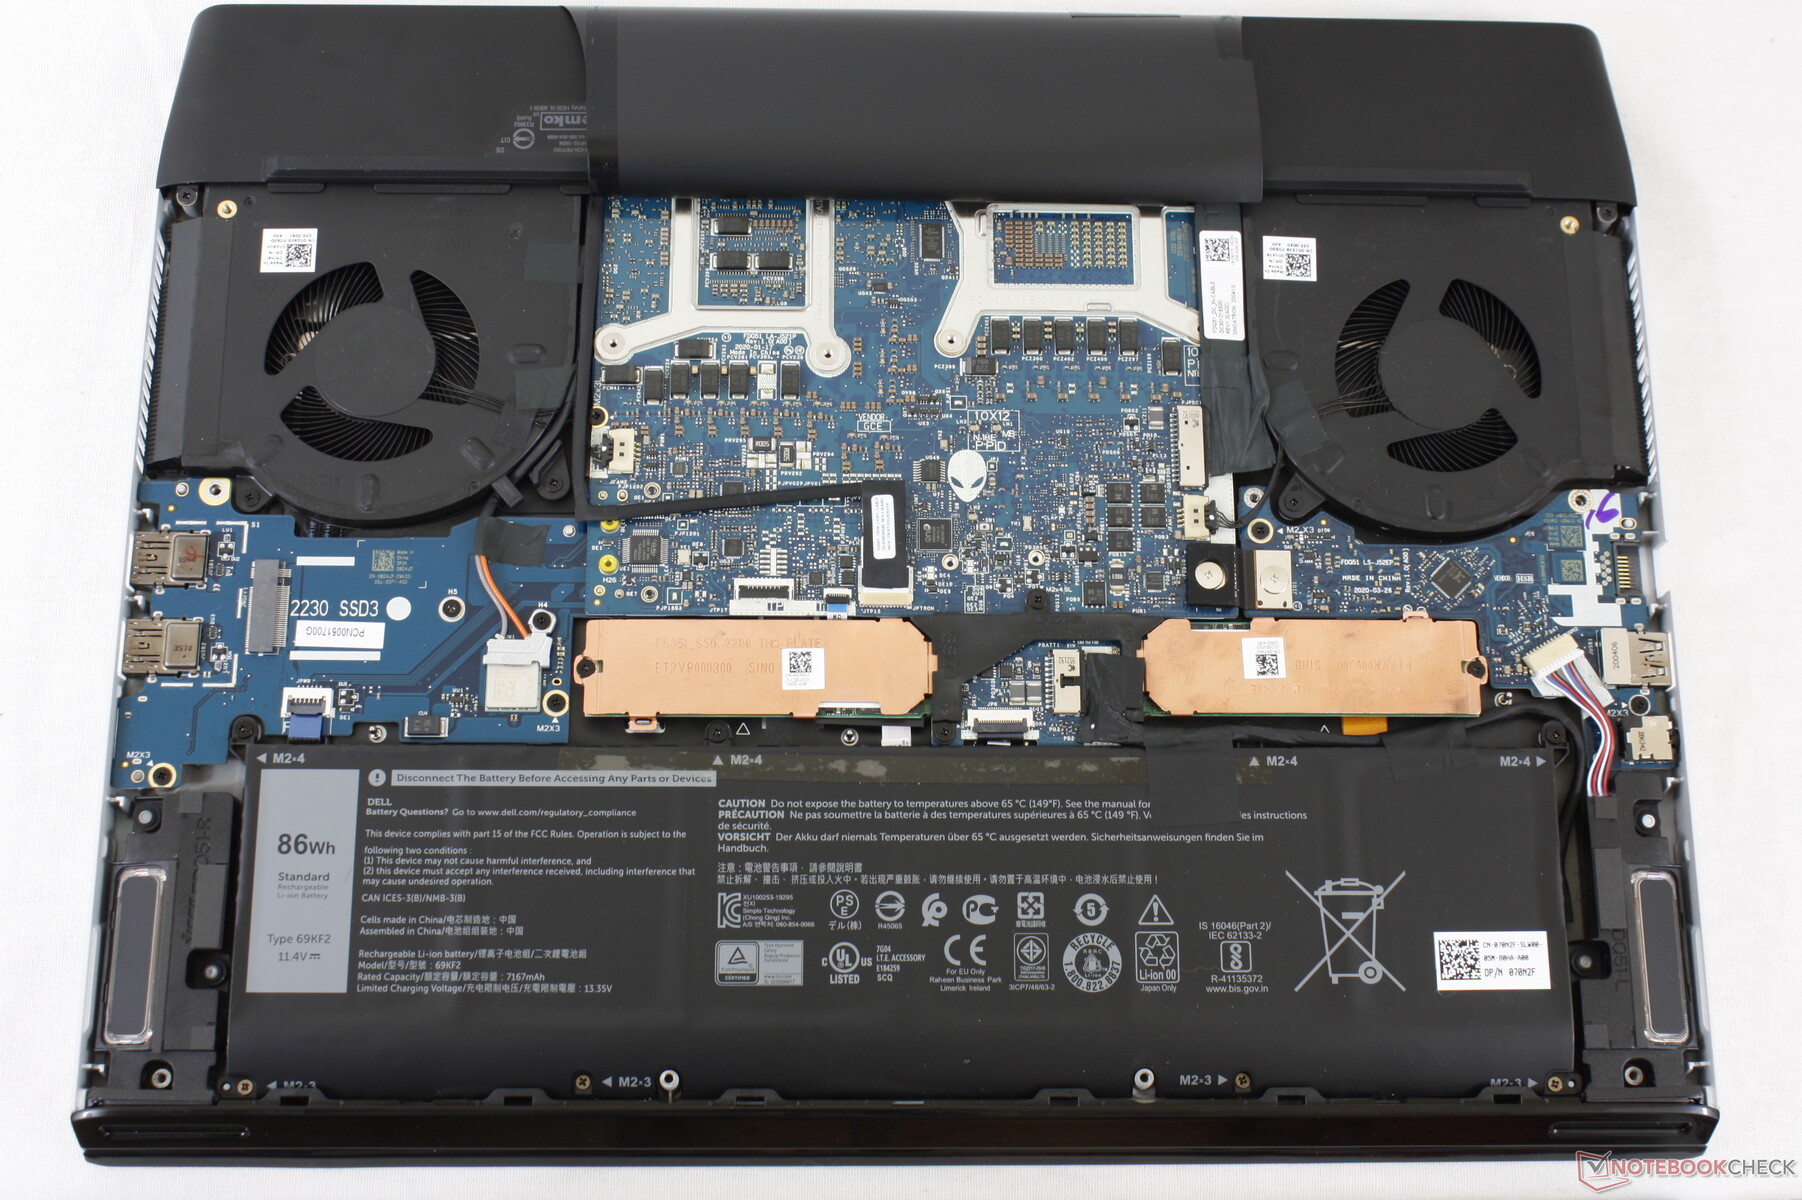
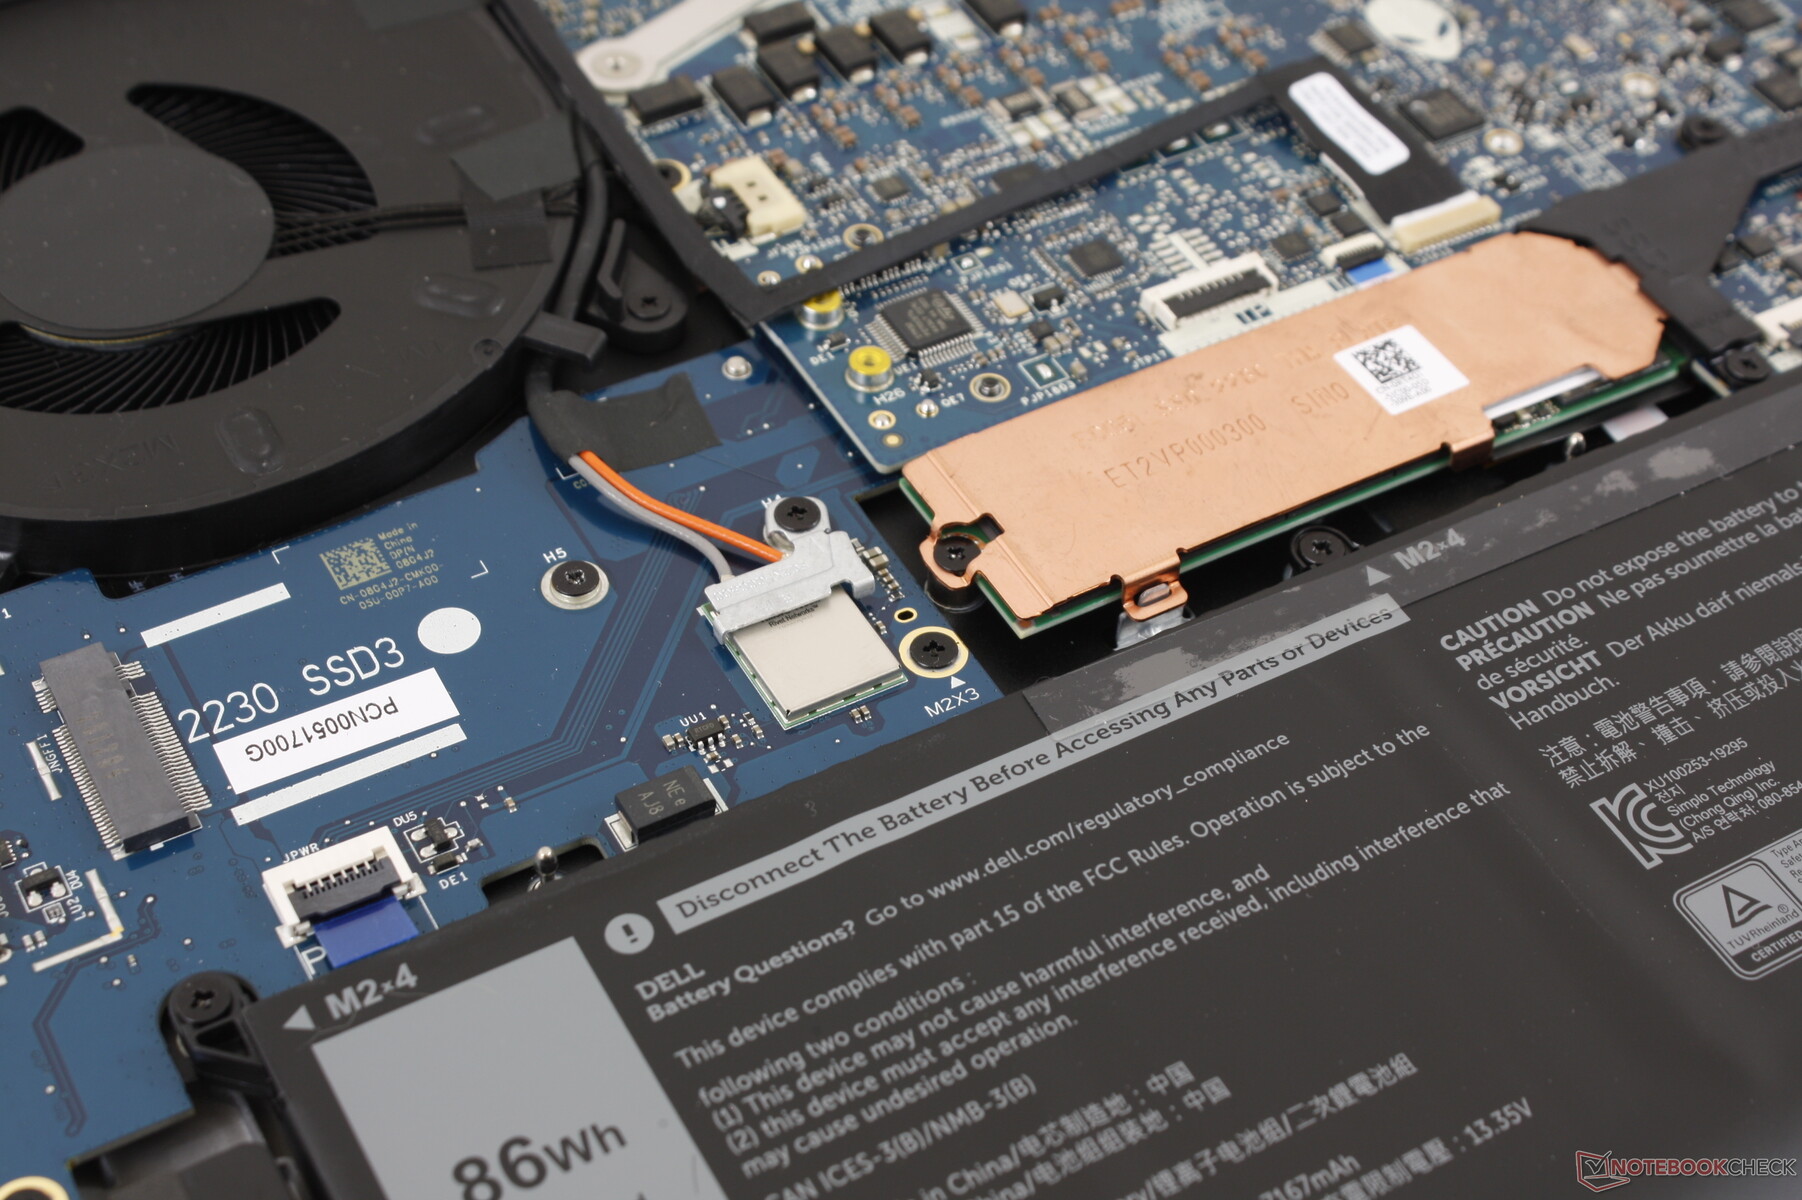
The bottom panel is secured by 8 Philips screws and it's relatively easy to remove. Users have access to three storage bays now, but WLAN and RAM remain soldered. Dell has upped the maximum configurable RAM to 32 GB when compared to the m15 R2.
Accessories and Warranty
There are no extras in the box other than the usual AC adapter and paperwork. The standard one-year limited warranty applies with extension options of up to 4 years.
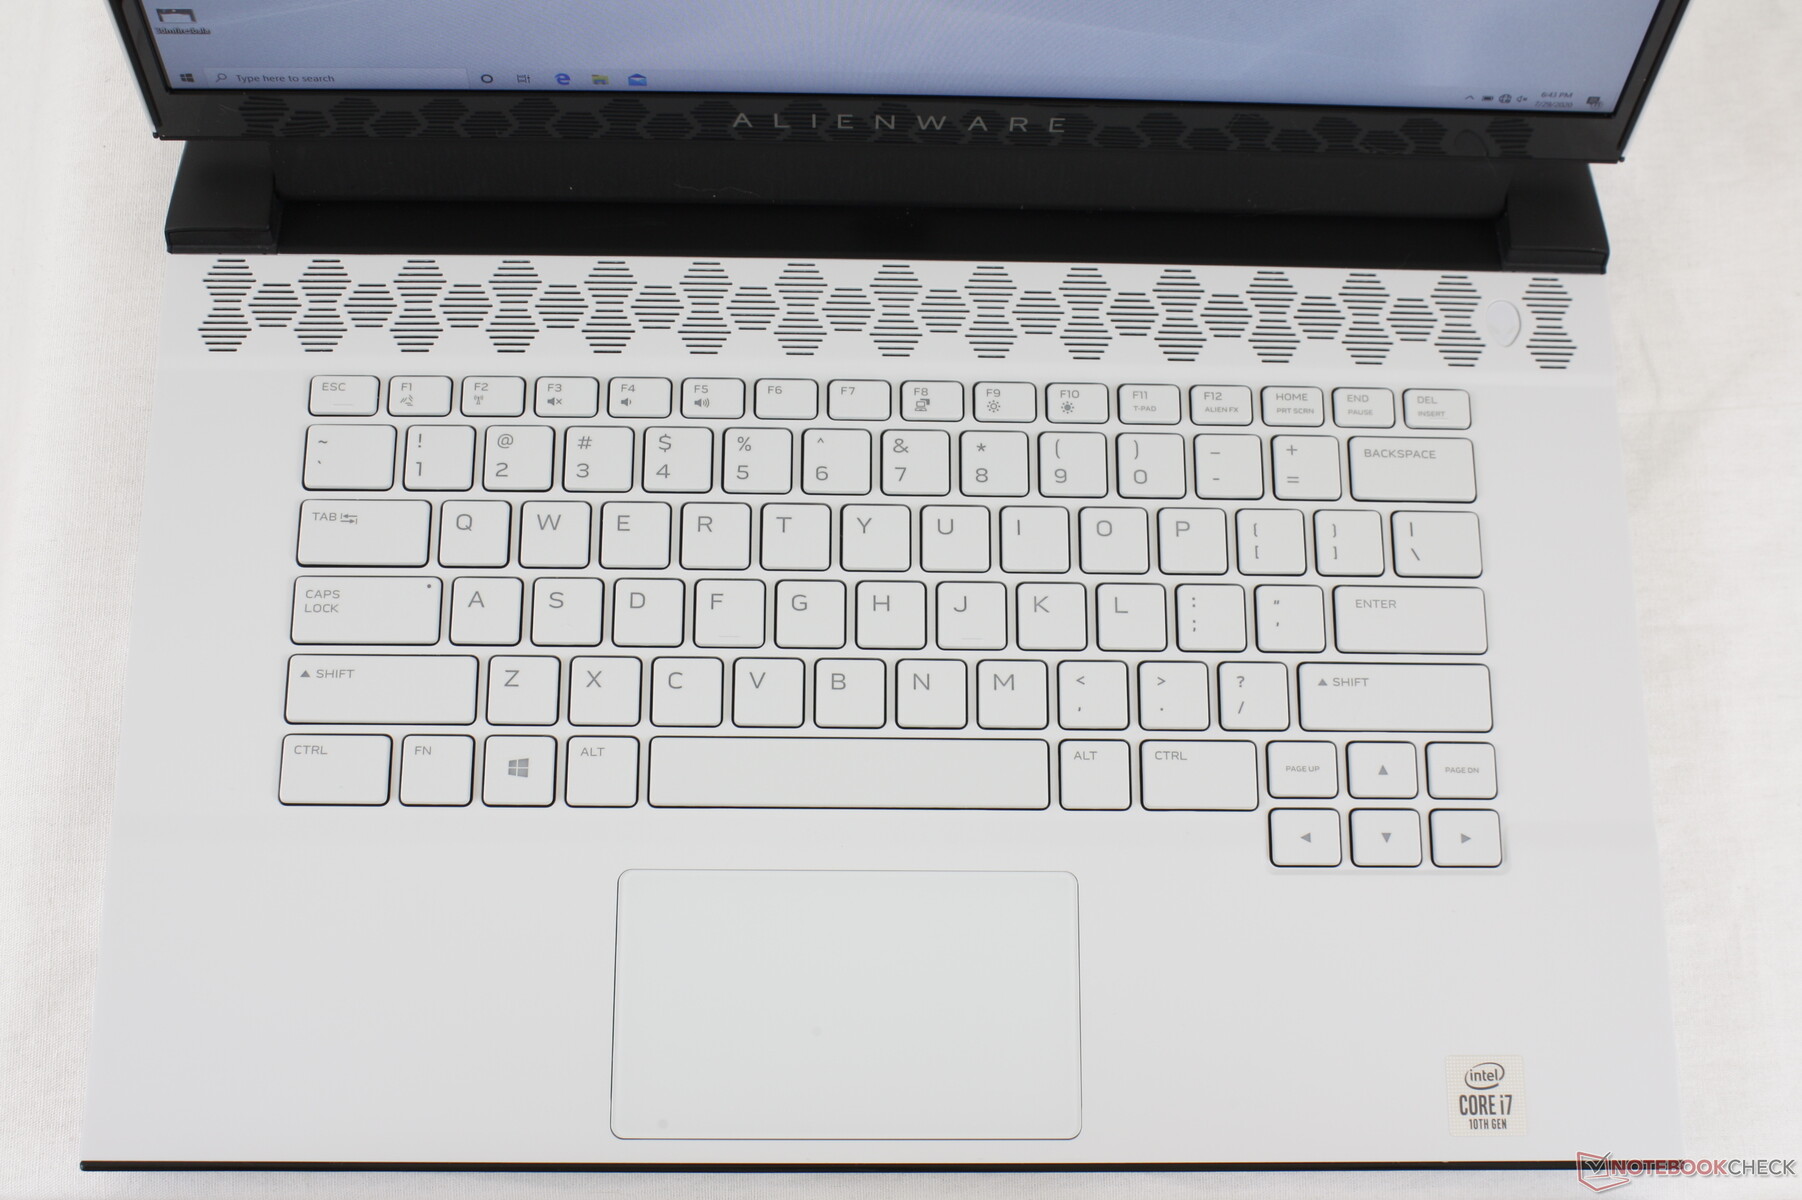
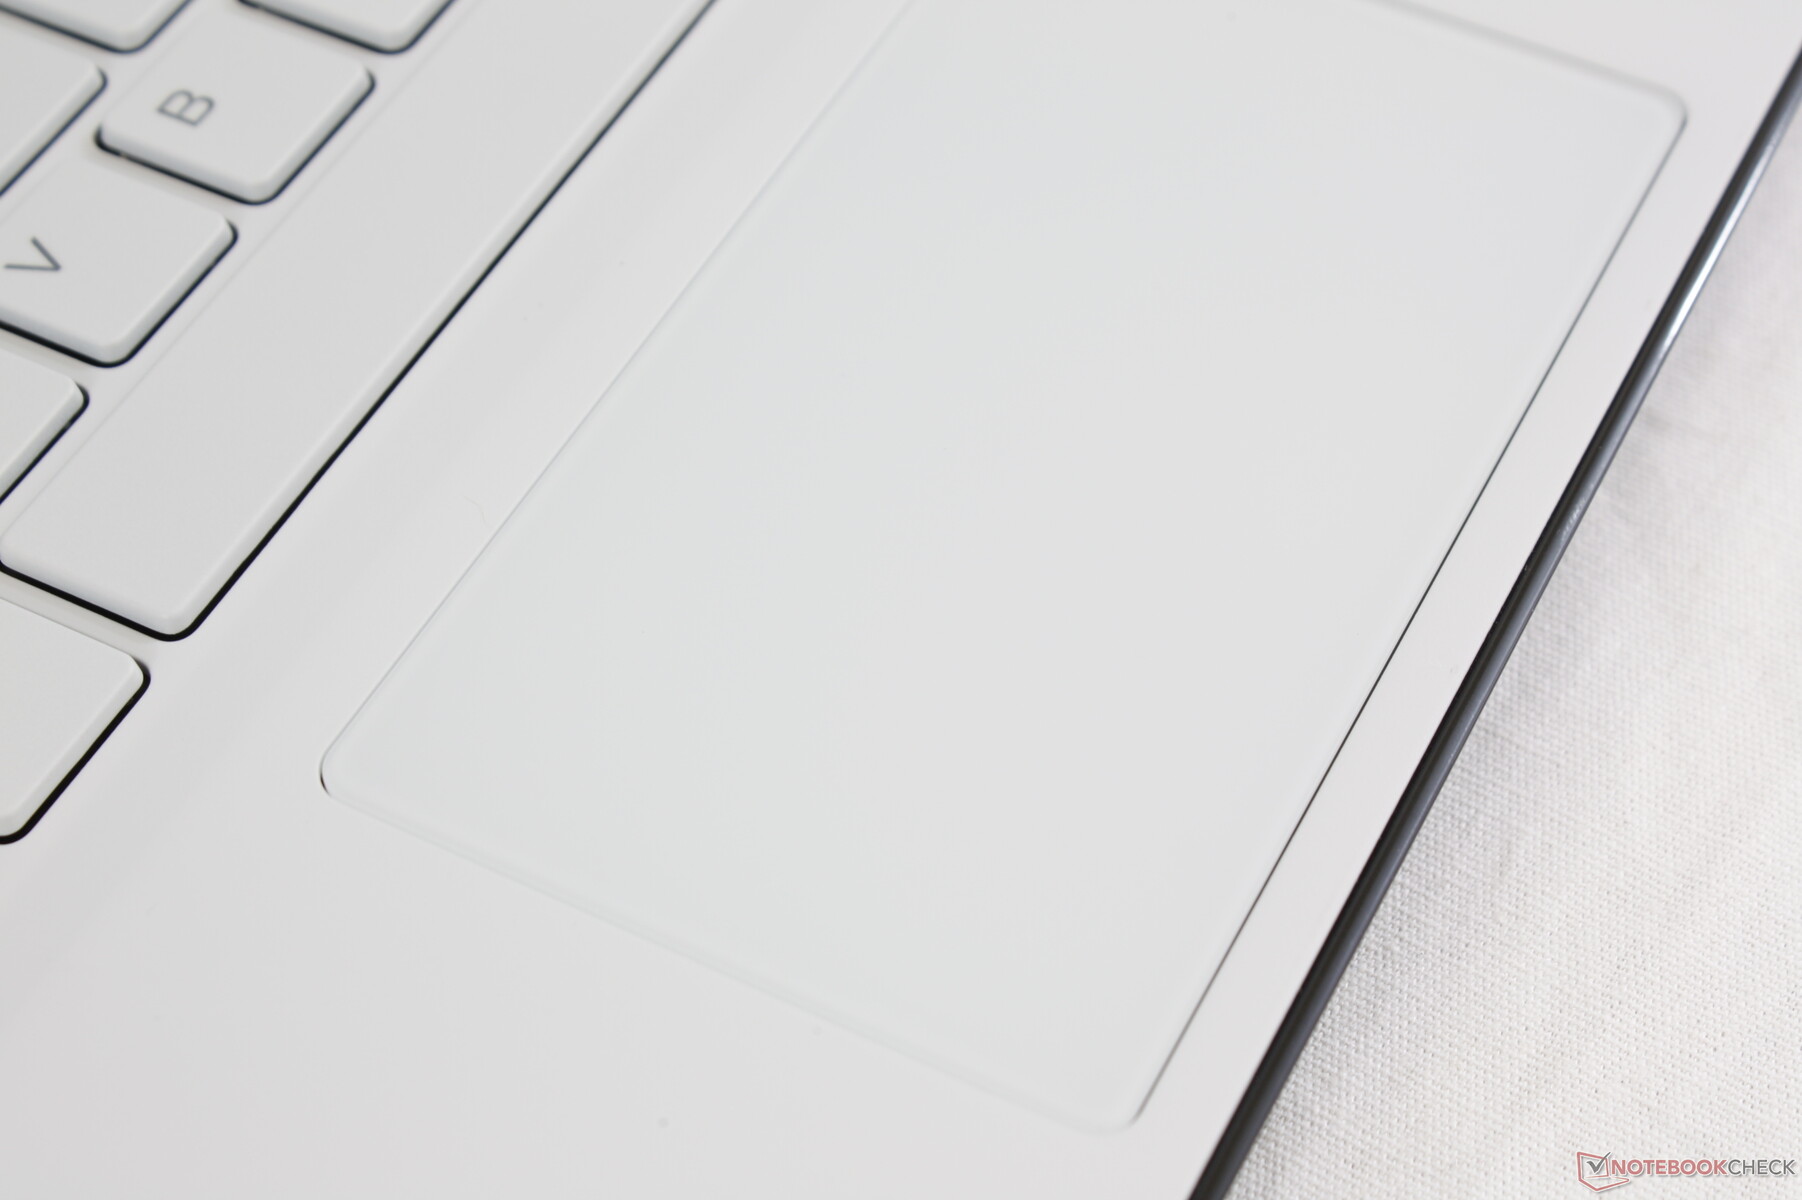
Input Devices
Keyboard and Touchpad


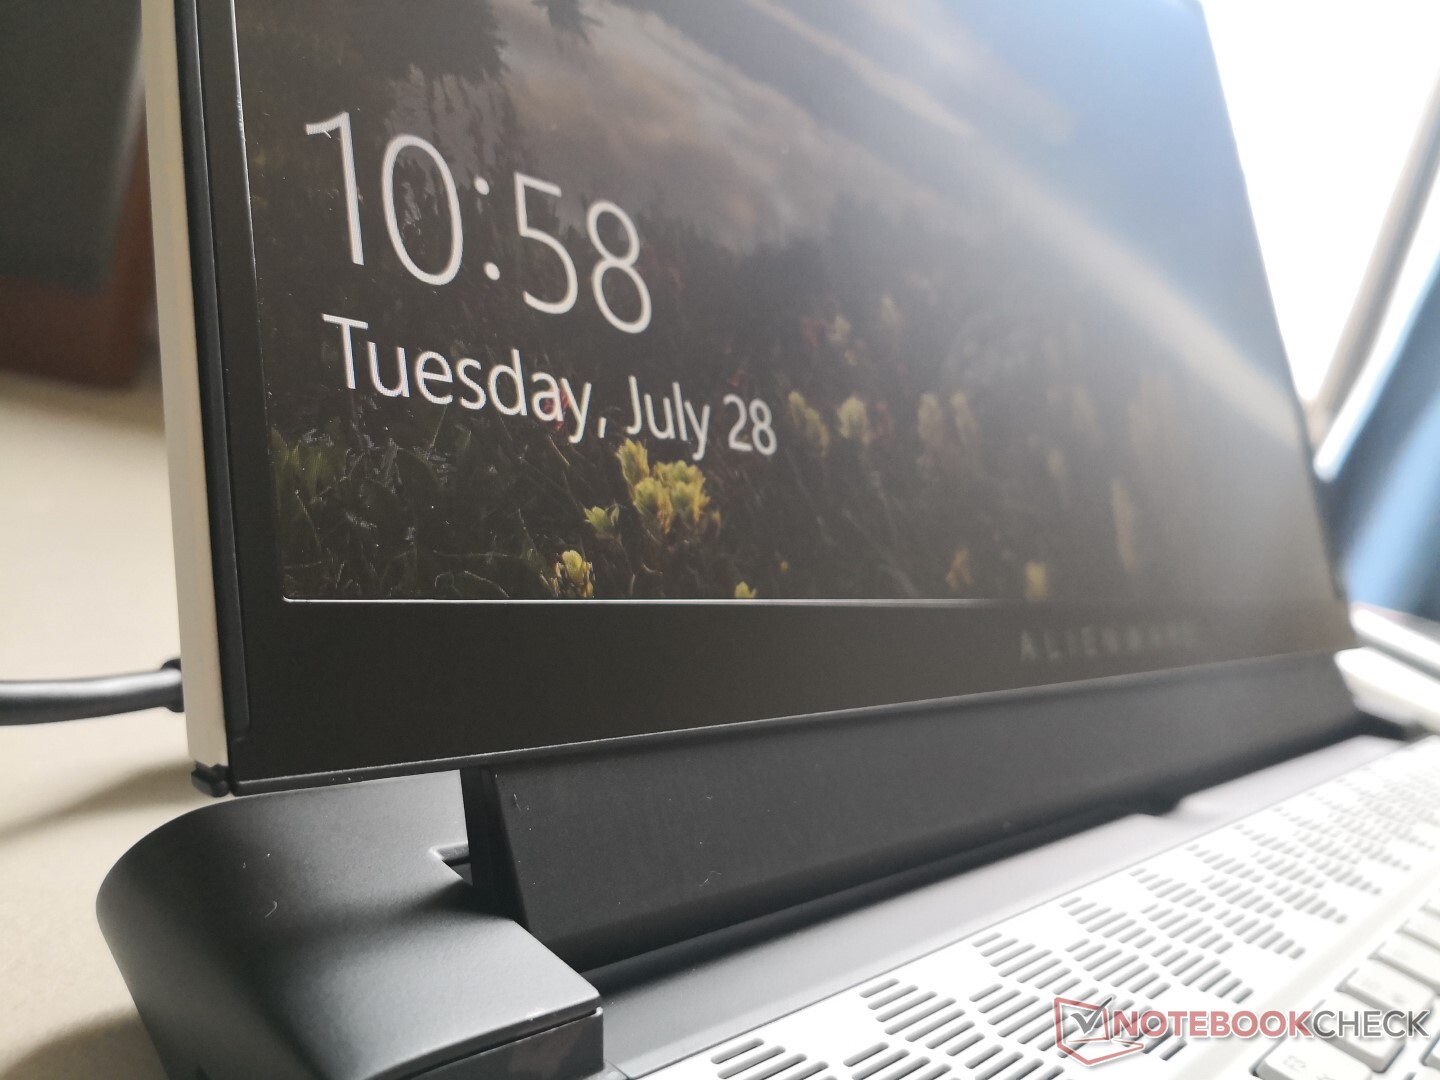
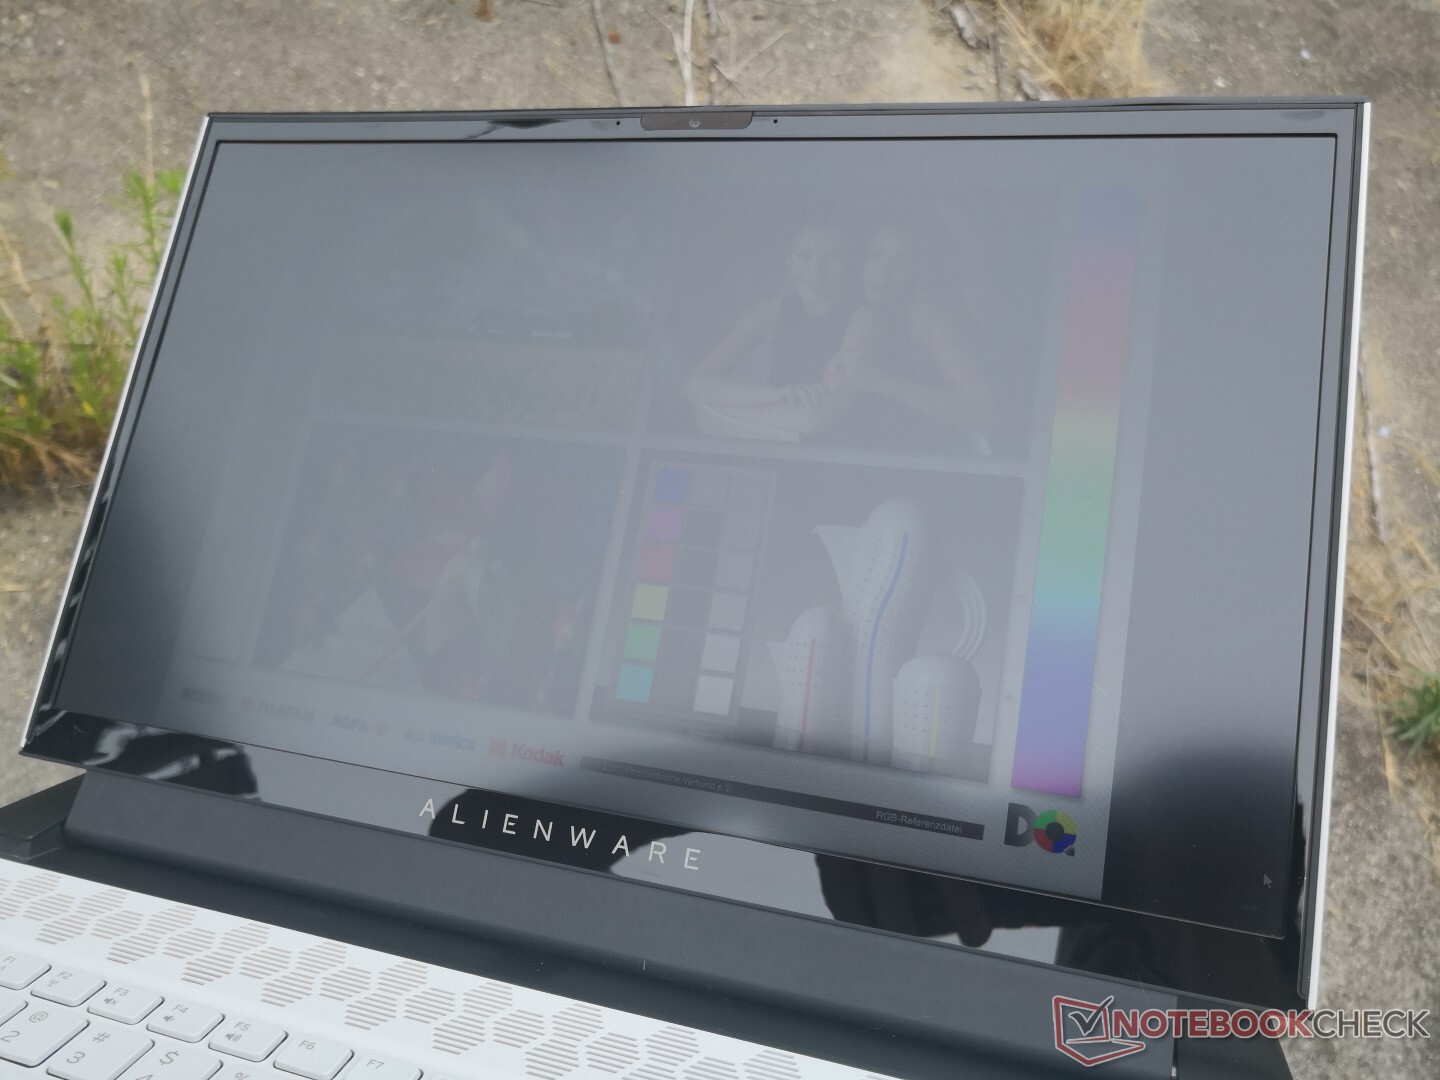
Display
The Alienware m15 R3 drops the 60 Hz and 240 Hz IPS options on last year's model in favor of 144 Hz as the new base option and 300 Hz as the new high-end option. The 300 Hz AUO B156HAN on our test unit is similar to the one found on the MSI GS66. Users can also configure with 60 Hz 4K OLED, but the ultra-smooth refresh rate of 300 Hz makes it tough to go back to 60 Hz unless if you really value the deeper colors and higher native resolution of OLED.


| |||||||||||||||||||||||||
Brightness Distribution: 87 %
Center on Battery: 326.7 cd/m²
Contrast: 990:1 (Black: 0.33 cd/m²)
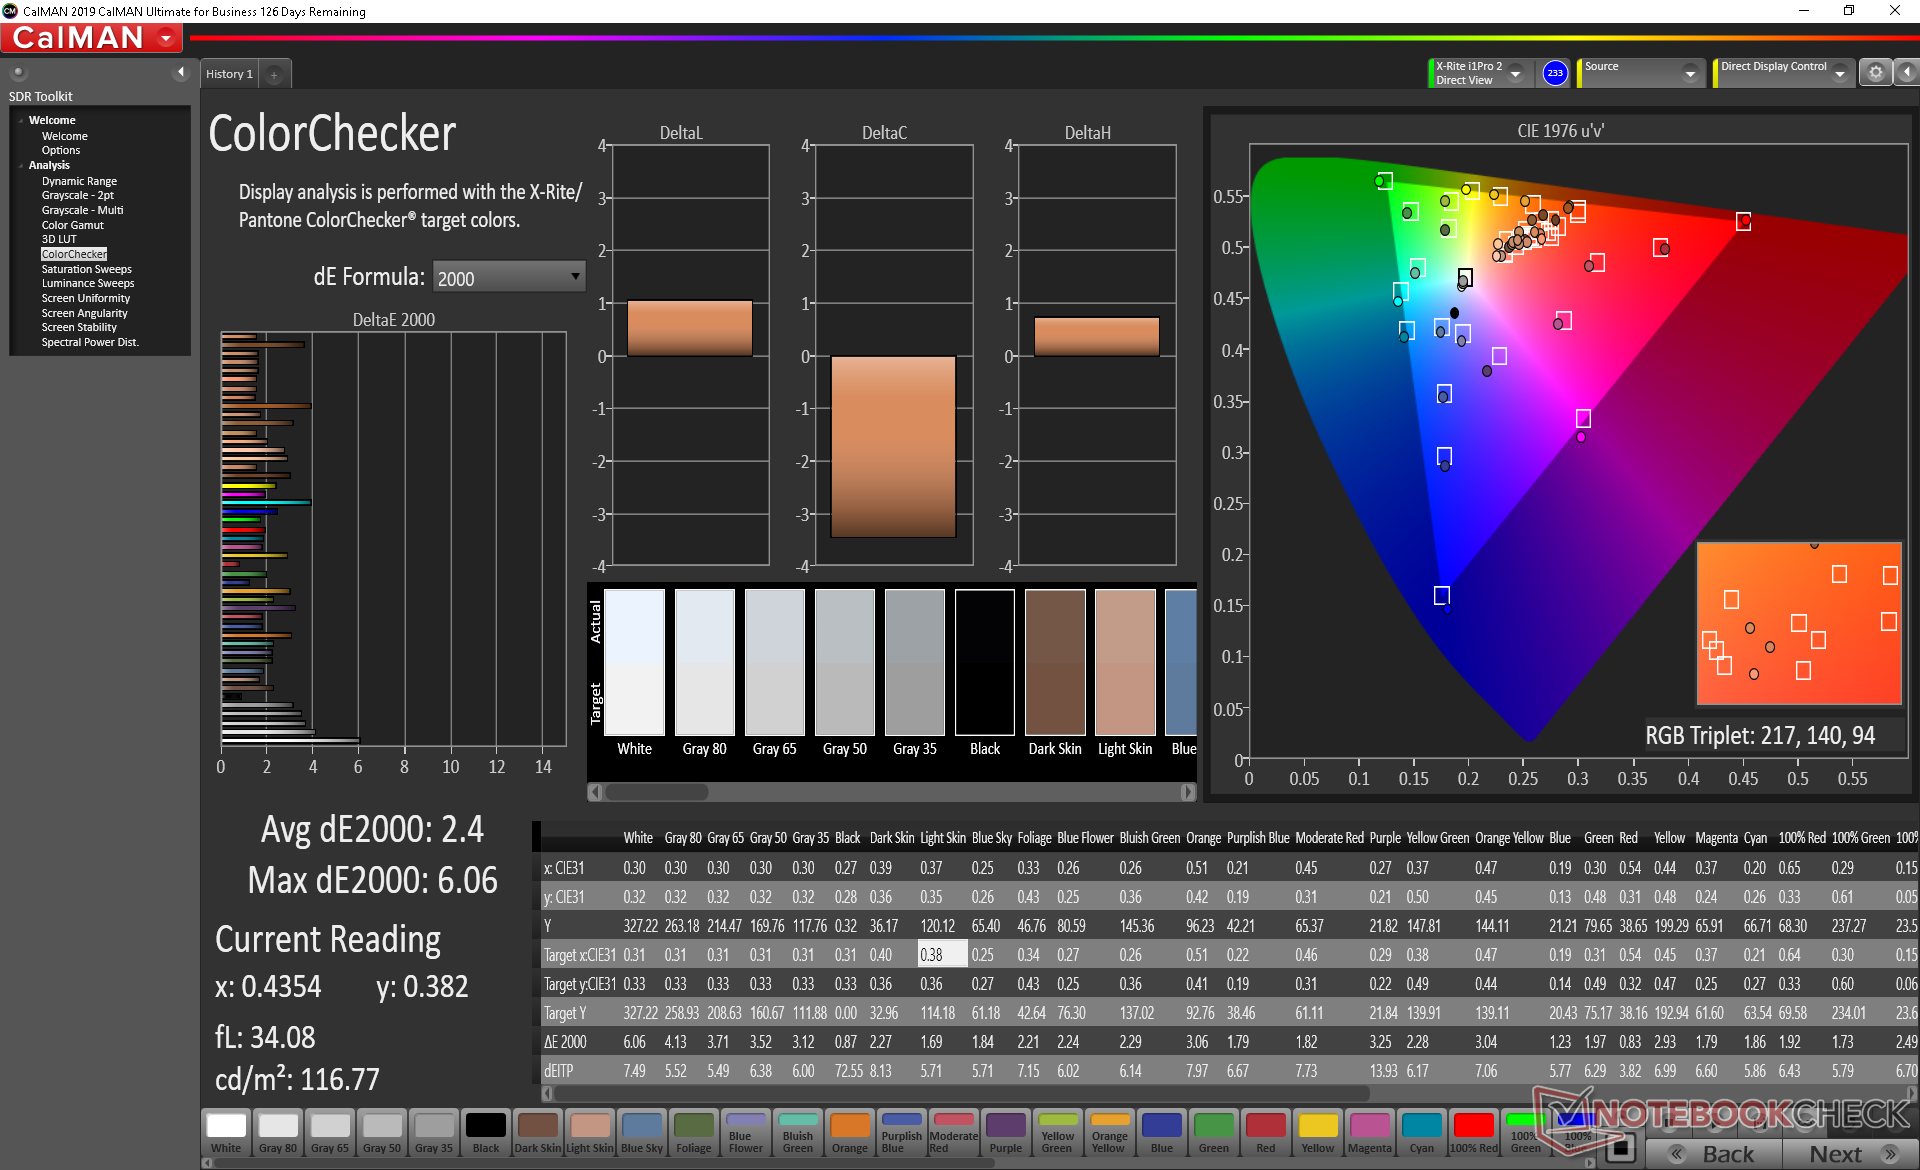
ΔE ColorChecker Calman: 2.4 | ∀{0.5-29.43 Ø4.73}
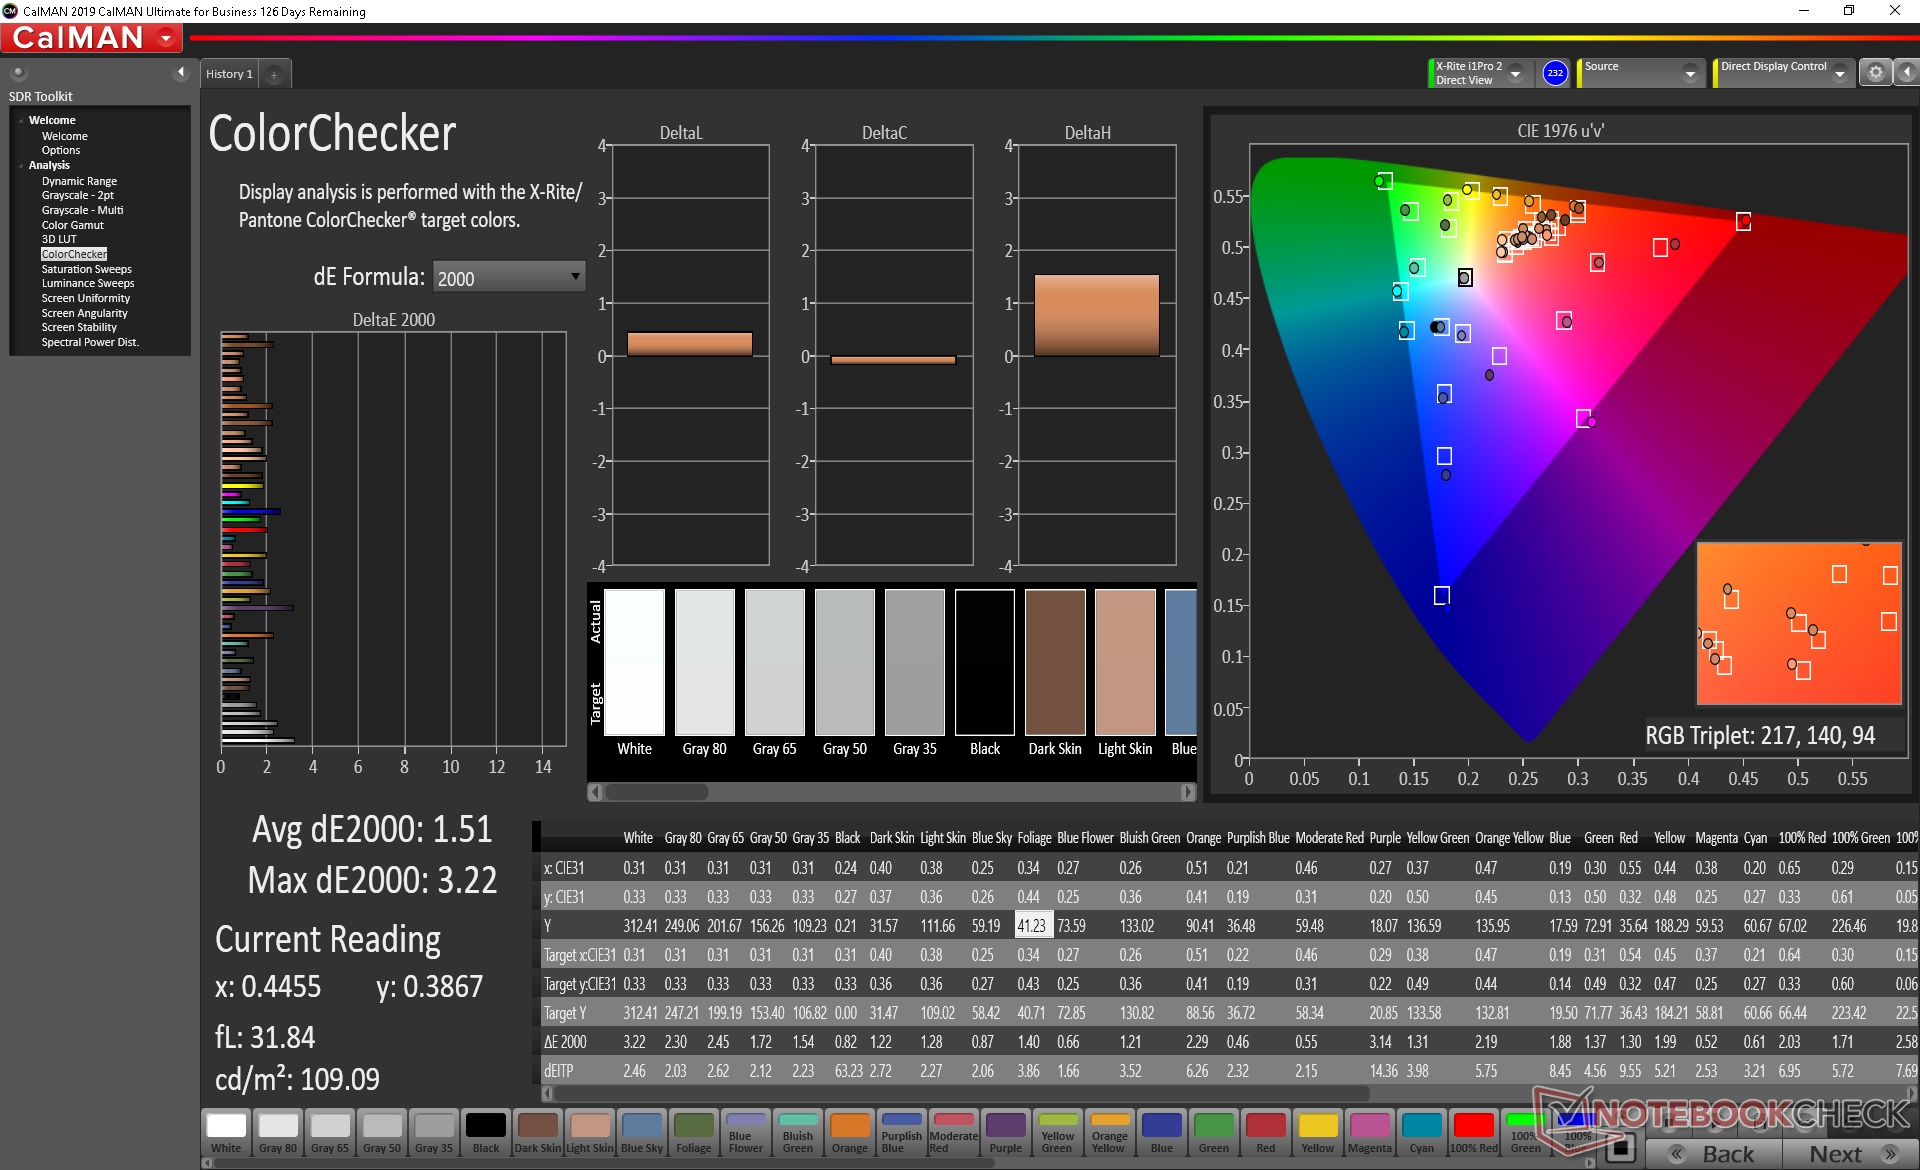
calibrated: 1.51
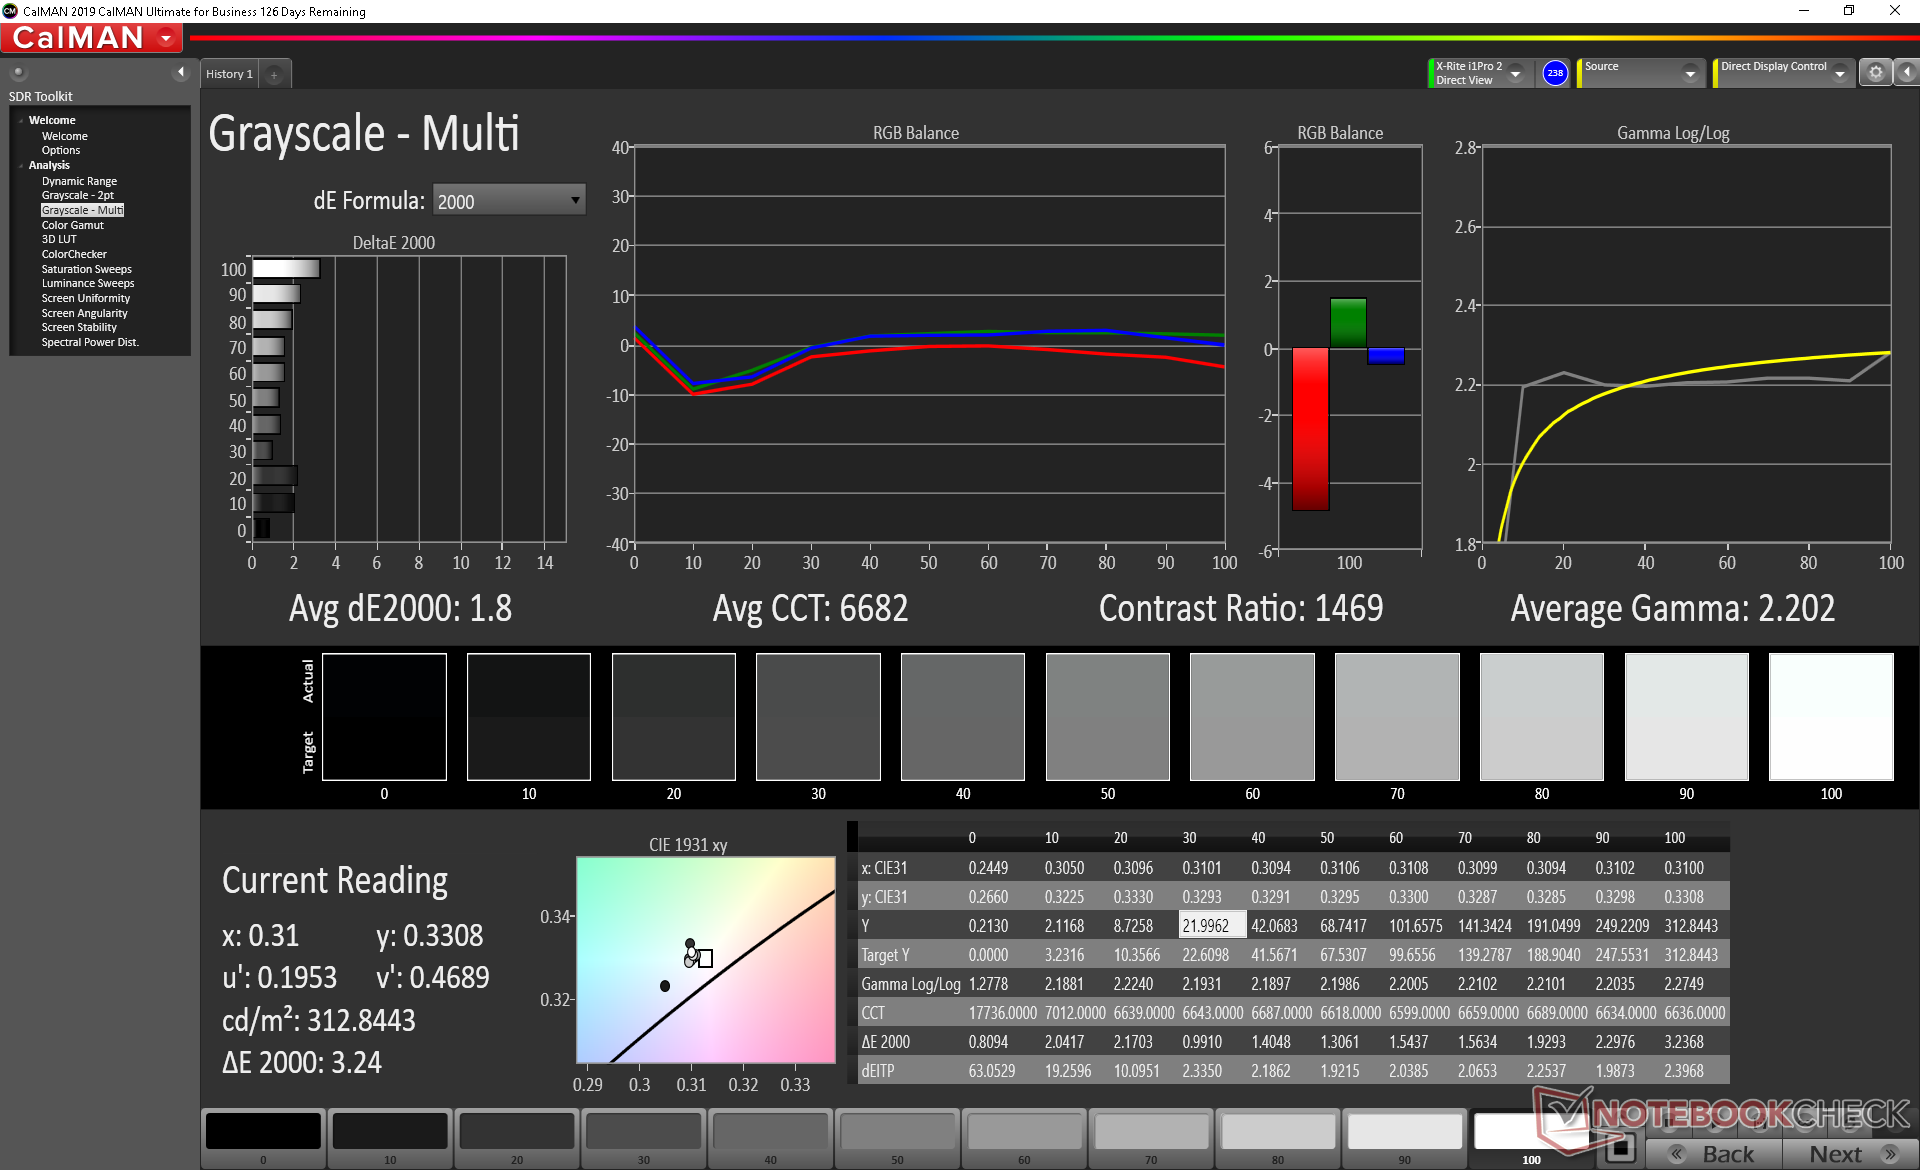
ΔE Greyscale Calman: 3.2 | ∀{0.09-98 Ø4.97}
99.2% sRGB (Argyll 1.6.3 3D)
63.7% AdobeRGB 1998 (Argyll 1.6.3 3D)
69.8% AdobeRGB 1998 (Argyll 3D)
98.9% sRGB (Argyll 3D)
68.6% Display P3 (Argyll 3D)
Gamma: 2.13
CCT: 7129 K
| Alienware m15 R3 P87F AU Optronics B156HAN, IPS, 15.6", 1920x1080 | Alienware m15 P79F Samsung SDCA029, 156WR04, OLED, 15.6", 3840x2160 | Eluktronics RP-15 BOE NV156FHM-N4G, IPS, 15.6", 1920x1080 | Razer Blade 15 RZ09-0328 Samsung SDCA029, AMOLED, 15.6", 3840x2160 | Asus Zephyrus S GX502GW AU Optronics B156HAN08.2 (AUO82ED), IPS, 15.6", 1920x1080 | MSI GS66 Stealth 10SFS AUO B156HAN12.0 (AUO328E), IPS, 15.6", 1920x1080 | |
|---|---|---|---|---|---|---|
| Display | 30% | -7% | 29% | -6% | 1% | |
| Display P3 Coverage (%) | 68.6 | 99.9 46% | 63.7 -7% | 99.9 46% | 64.9 -5% | 69.5 1% |
| sRGB Coverage (%) | 98.9 | 100 1% | 92 -7% | 100 1% | 91 -8% | 99.6 1% |
| AdobeRGB 1998 Coverage (%) | 69.8 | 100 43% | 65.2 -7% | 97.4 40% | 65.9 -6% | 70.8 1% |
| Response Times | 57% | -163% | 54% | -31% | -120% | |
| Response Time Grey 50% / Grey 80% * (ms) | 4 ? | 2.6 ? 35% | 17.2 ? -330% | 2.7 ? 32% | 7.2 ? -80% | 14 ? -250% |
| Response Time Black / White * (ms) | 10.8 ? | 2.3 ? 79% | 10.4 ? 4% | 2.6 ? 76% | 8.8 ? 19% | 9.6 ? 11% |
| PWM Frequency (Hz) | 60.2 ? | 59.5 ? | ||||
| Screen | -17% | -28% | -5% | -5% | 5% | |
| Brightness middle (cd/m²) | 326.7 | 452.1 38% | 298.6 -9% | 366.7 12% | 286 -12% | 316 -3% |
| Brightness (cd/m²) | 316 | 452 43% | 289 -9% | 371 17% | 275 -13% | 311 -2% |
| Brightness Distribution (%) | 87 | 90 3% | 90 3% | 91 5% | 90 3% | 92 6% |
| Black Level * (cd/m²) | 0.33 | 0.35 -6% | 0.37 -12% | 0.21 36% | ||
| Contrast (:1) | 990 | 853 -14% | 773 -22% | 1505 52% | ||
| Colorchecker dE 2000 * | 2.4 | 6.34 -164% | 5.01 -109% | 5.21 -117% | 2.19 9% | 3.03 -26% |
| Colorchecker dE 2000 max. * | 6.06 | 12.97 -114% | 7.06 -17% | 7.92 -31% | 4.4 27% | 7.32 -21% |
| Colorchecker dE 2000 calibrated * | 1.51 | 2.52 -67% | 2.27 -50% | 1.1 27% | ||
| Greyscale dE 2000 * | 3.2 | 2.8 13% | 5.4 -69% | 2 37% | 2.2 31% | 3.9 -22% |
| Gamma | 2.13 103% | 2.21 100% | 2.54 87% | 2.17 101% | 2.41 91% | 2.42 91% |
| CCT | 7129 91% | 6114 106% | 7461 87% | 6514 100% | 6405 101% | 7439 87% |
| Color Space (Percent of AdobeRGB 1998) (%) | 63.7 | 91 43% | 59.1 -7% | 86.6 36% | 59 -7% | 65 2% |
| Color Space (Percent of sRGB) (%) | 99.2 | 100 1% | 91.6 -8% | 100 1% | 91 -8% | 100 1% |
| Total Average (Program / Settings) | 23% /
5% | -66% /
-41% | 26% /
12% | -14% /
-8% | -38% /
-12% |
* ... smaller is better
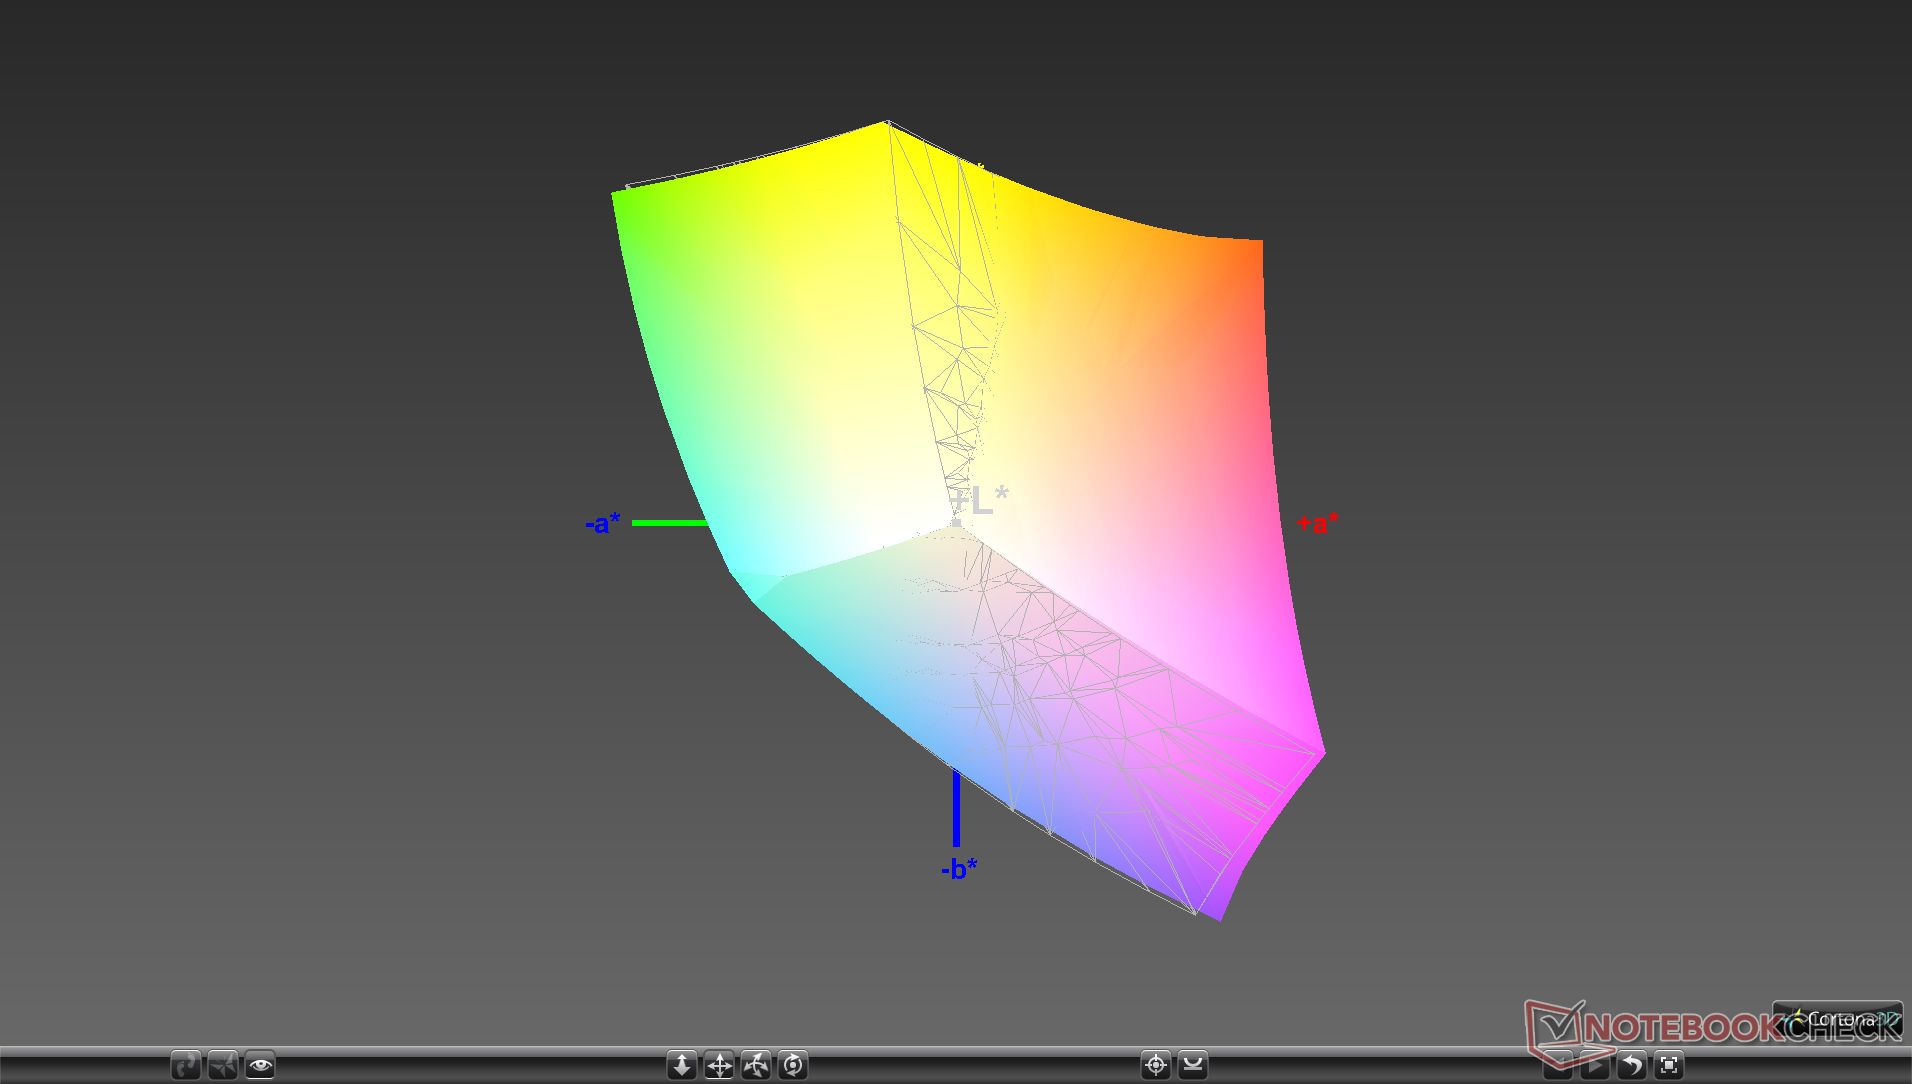
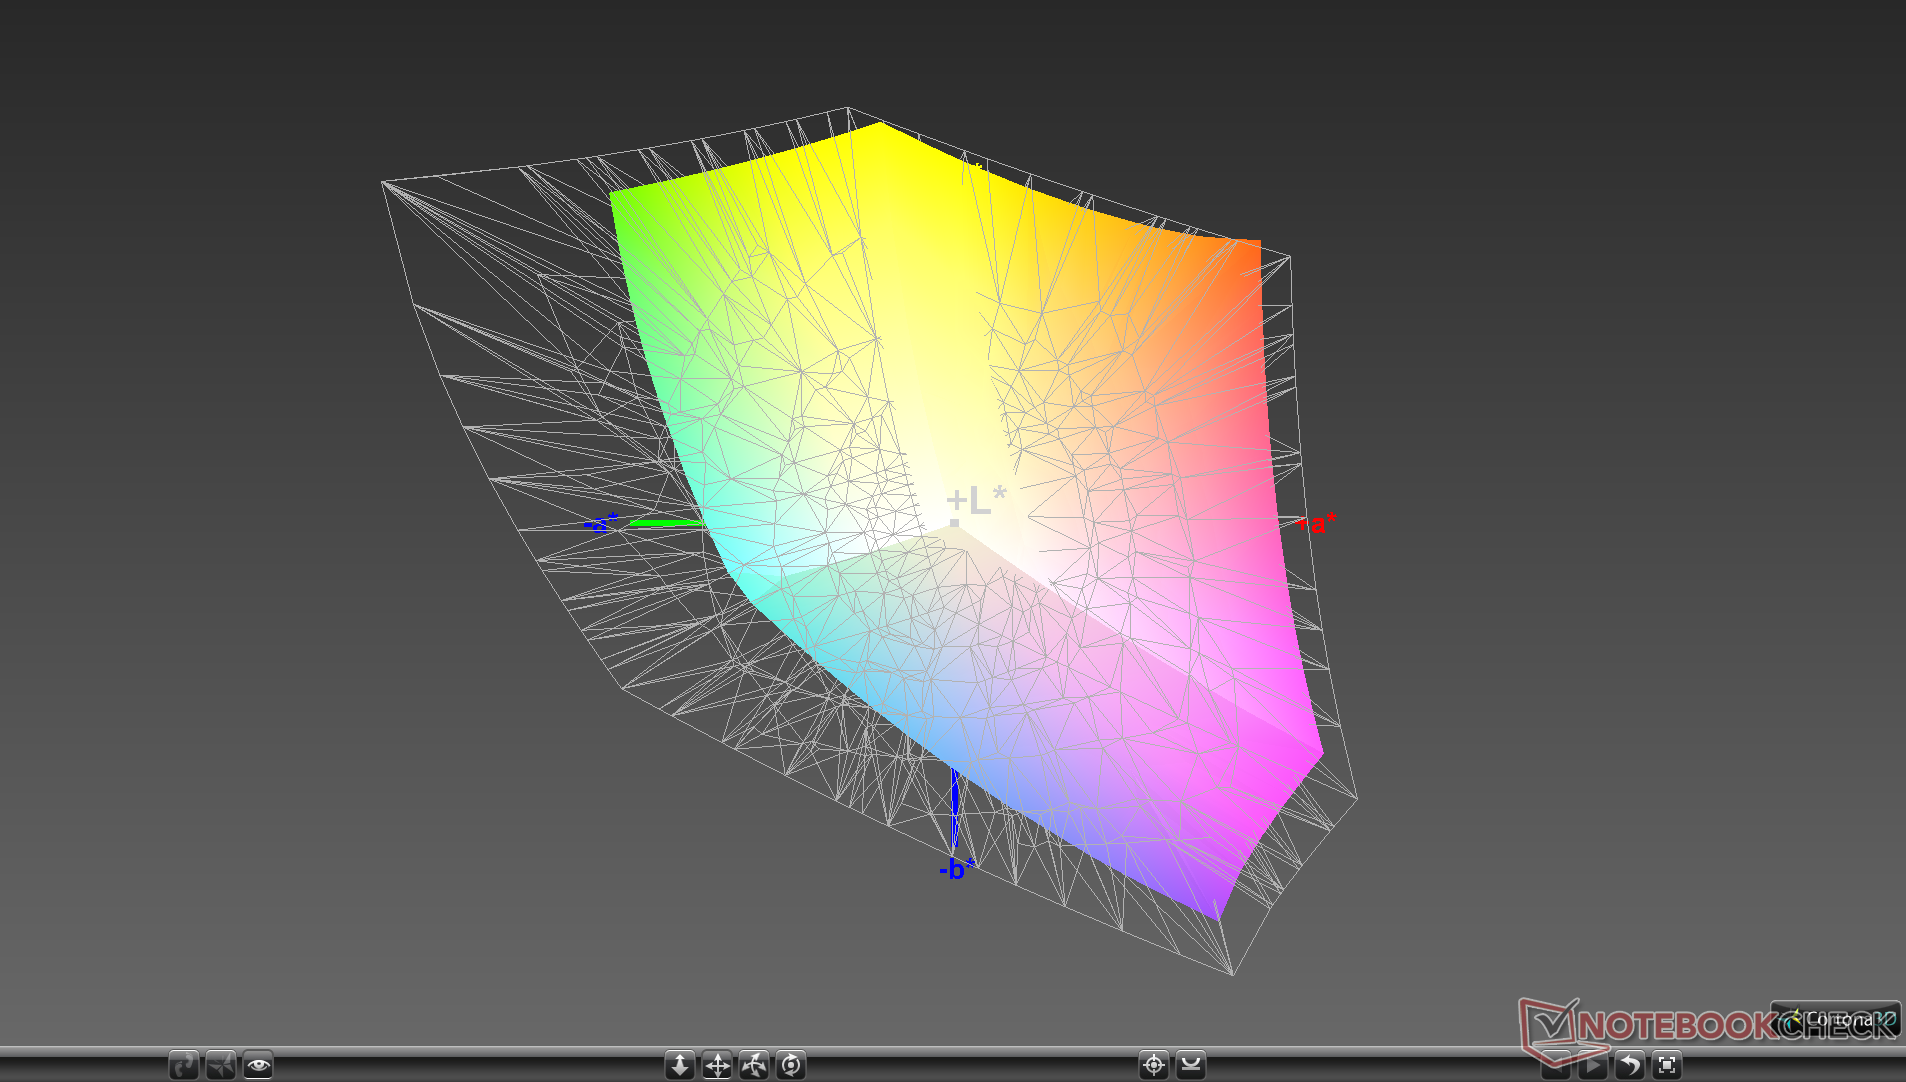
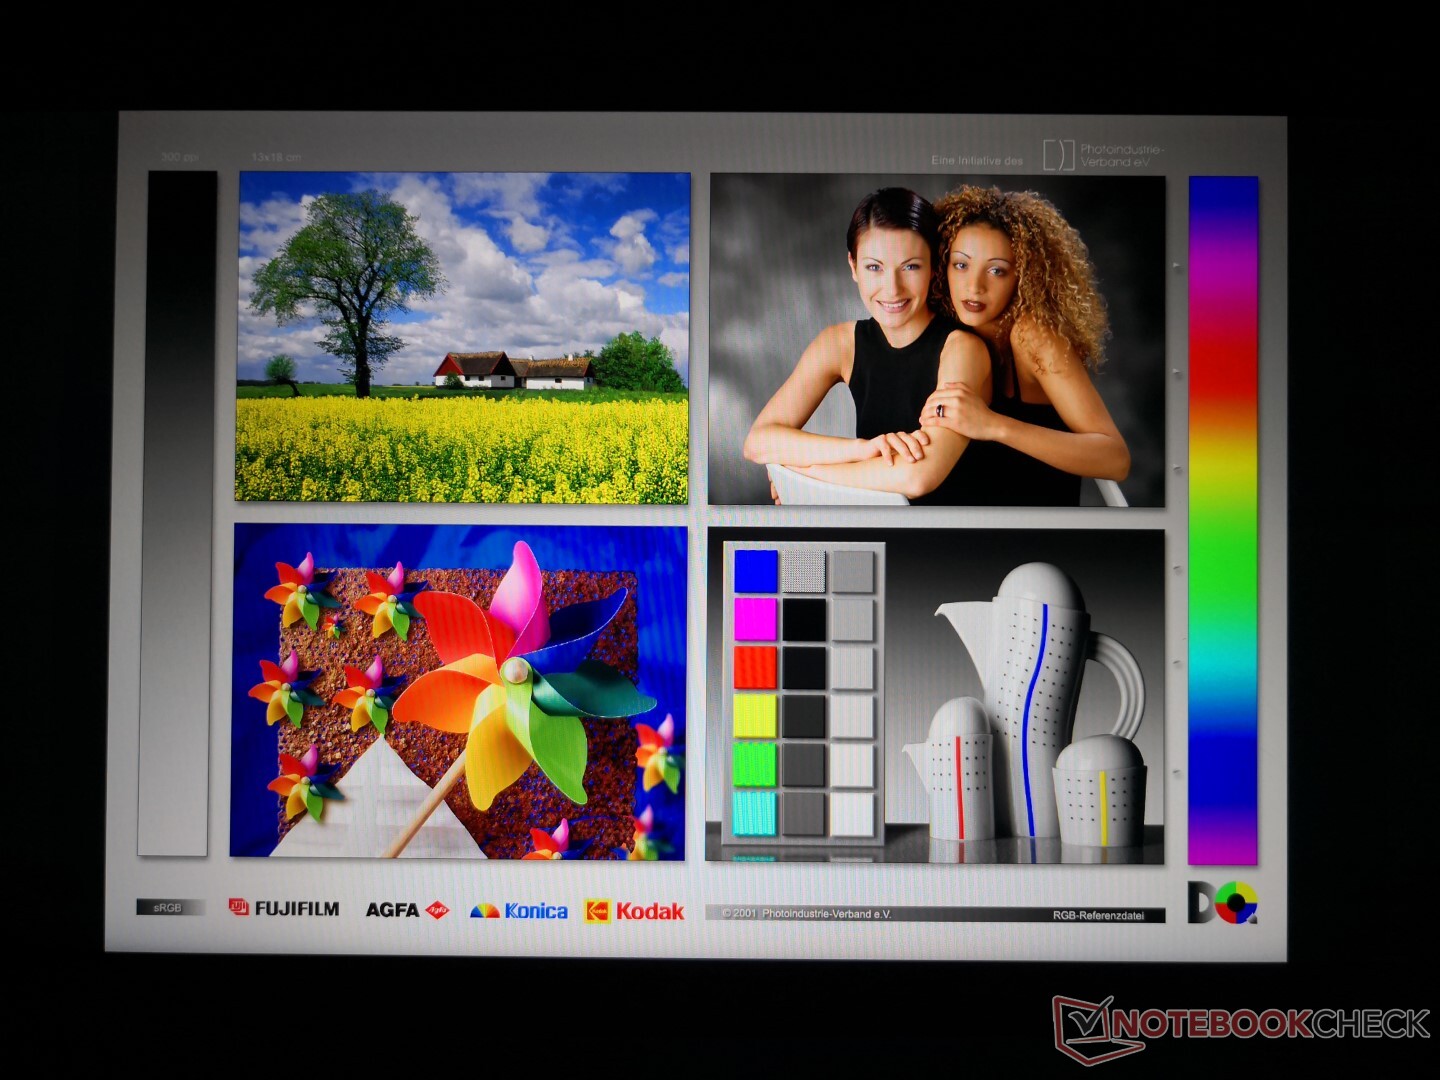
Color space covers all of sRGB and approximately 64 percent of AdobeRGB much like most other fast refresh rate panels. Dell's OLED option promises DCI-P3 coverage with HDR playback compatibility at the cost of a slower 60 Hz refresh rate.
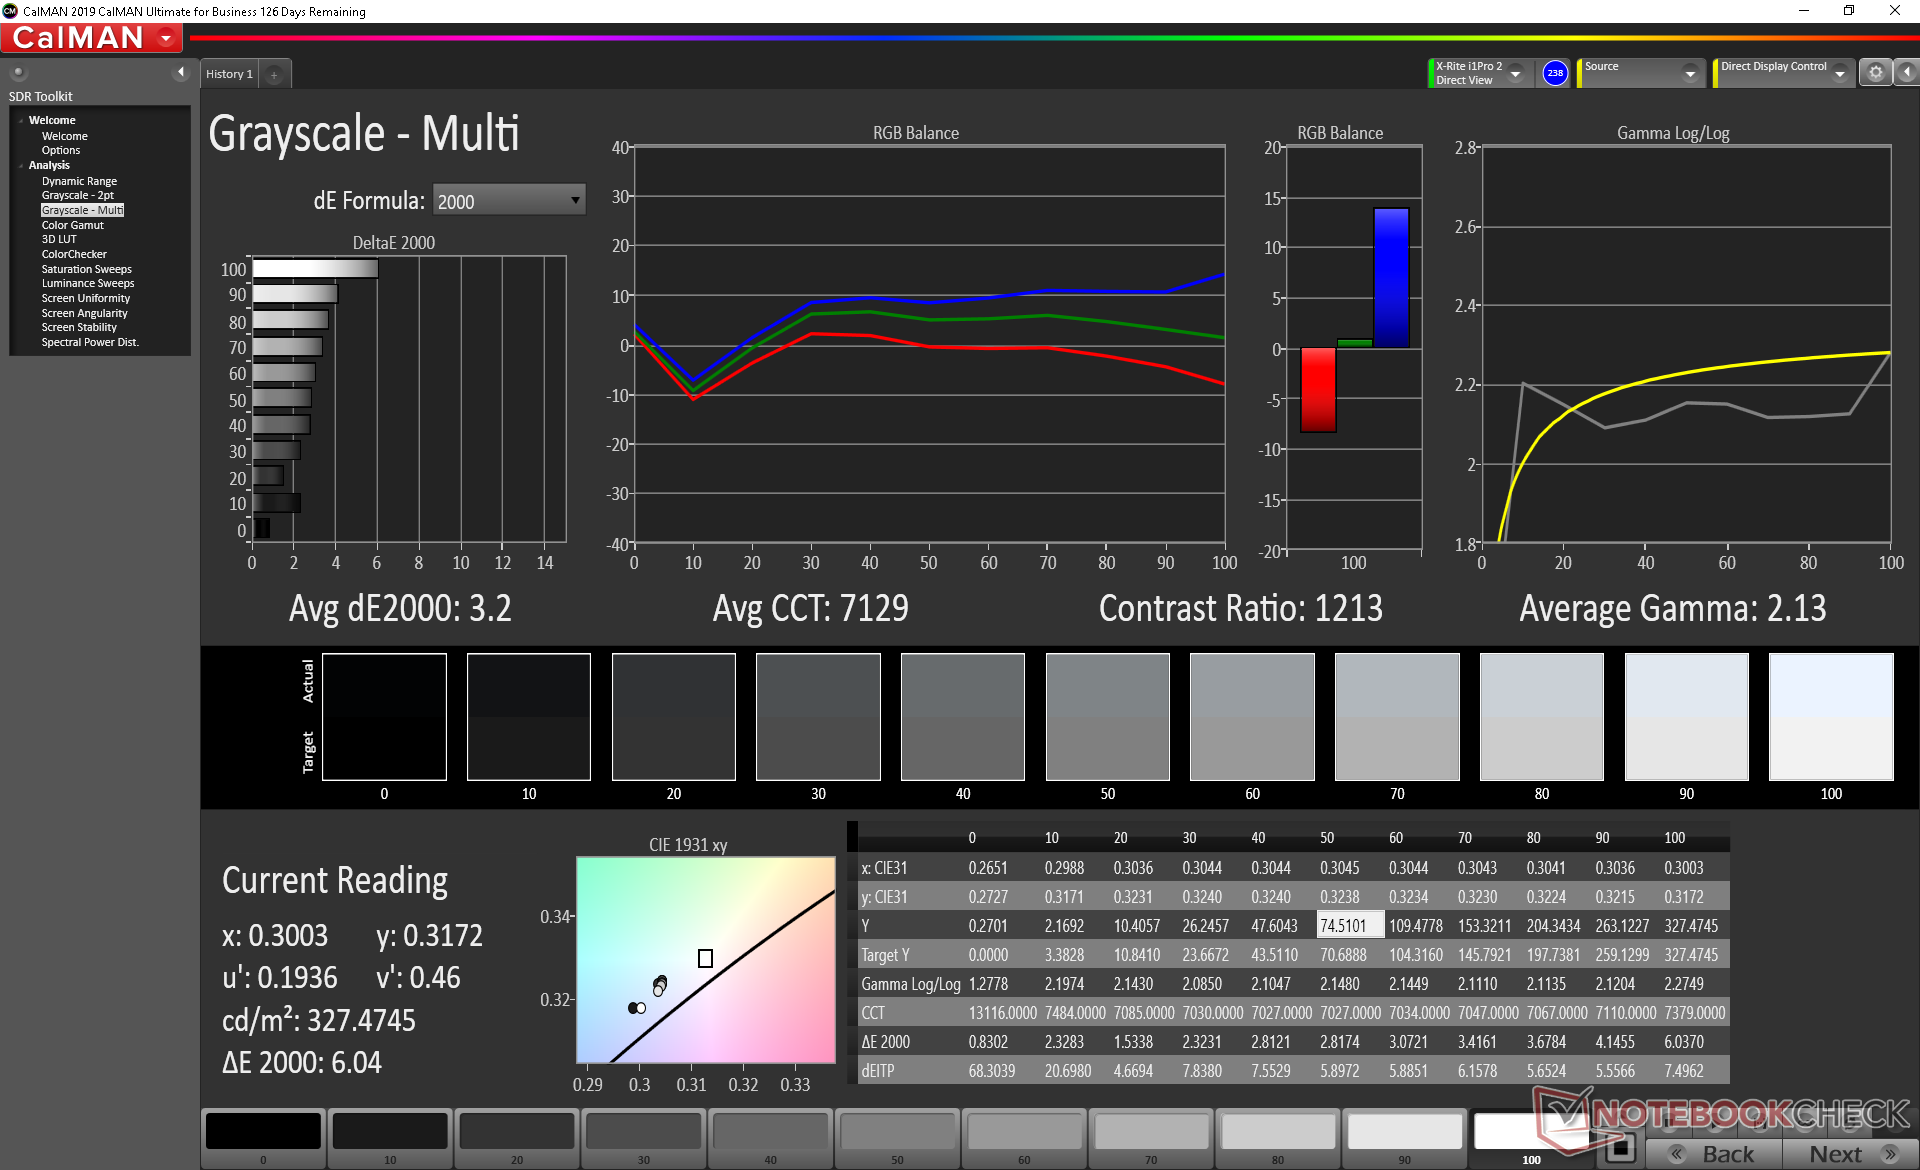
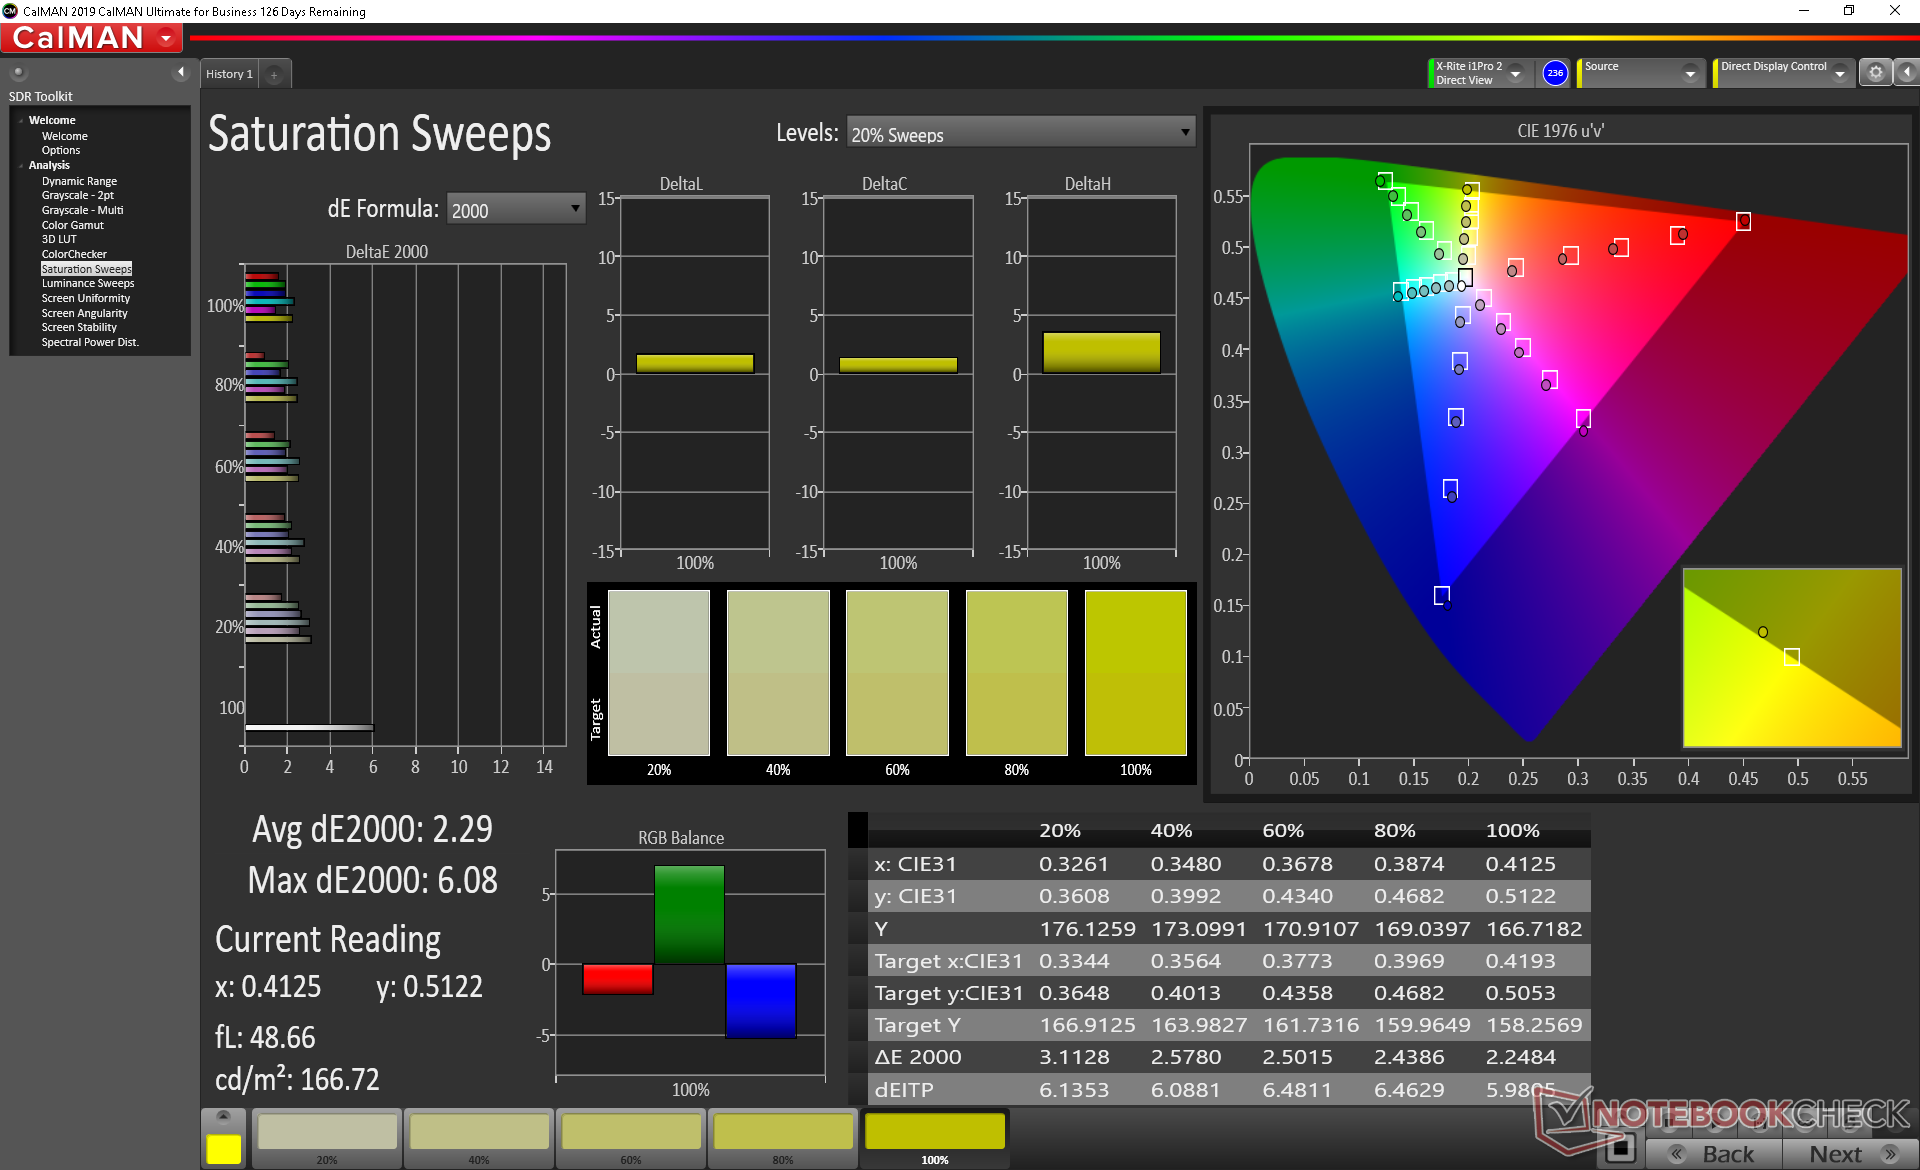
Measurements with an X-Rite colorimeter reveal color temperature to be slightly on the cool side. An end-user calibration addresses this to improve the average grayscale DeltaE value from an already low 3.2 to an even lower 1.8. Otherwise, colors are accurate out of the box with no real need for further calibration.

Display Response Times
| ↔ Response Time Black to White | ||
|---|---|---|
| 10.8 ms ... rise ↗ and fall ↘ combined | ↗ 5.2 ms rise | 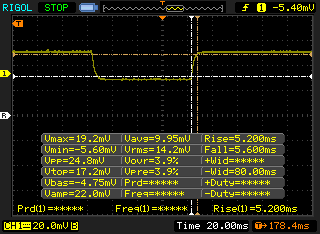 |
| ↘ 5.6 ms fall | ||
| The screen shows good response rates in our tests, but may be too slow for competitive gamers. In comparison, all tested devices range from 0.1 (minimum) to 240 (maximum) ms. » 29 % of all devices are better. This means that the measured response time is better than the average of all tested devices (19.9 ms). | ||
| ↔ Response Time 50% Grey to 80% Grey | ||
| 4 ms ... rise ↗ and fall ↘ combined | ↗ 1.6 ms rise | 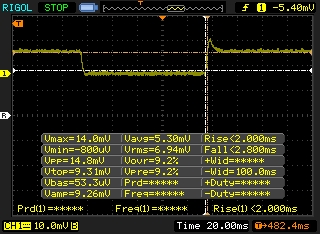 |
| ↘ 2.4 ms fall | ||
| The screen shows very fast response rates in our tests and should be very well suited for fast-paced gaming. In comparison, all tested devices range from 0.165 (minimum) to 636 (maximum) ms. » 15 % of all devices are better. This means that the measured response time is better than the average of all tested devices (31.1 ms). | ||
Screen Flickering / PWM (Pulse-Width Modulation)
| Screen flickering / PWM not detected | 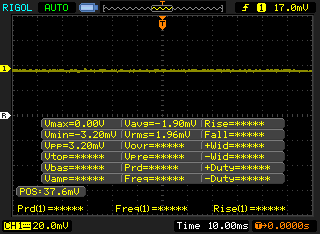 | ||
In comparison: 52 % of all tested devices do not use PWM to dim the display. If PWM was detected, an average of 7801 (minimum: 5 - maximum: 343500) Hz was measured. | |||
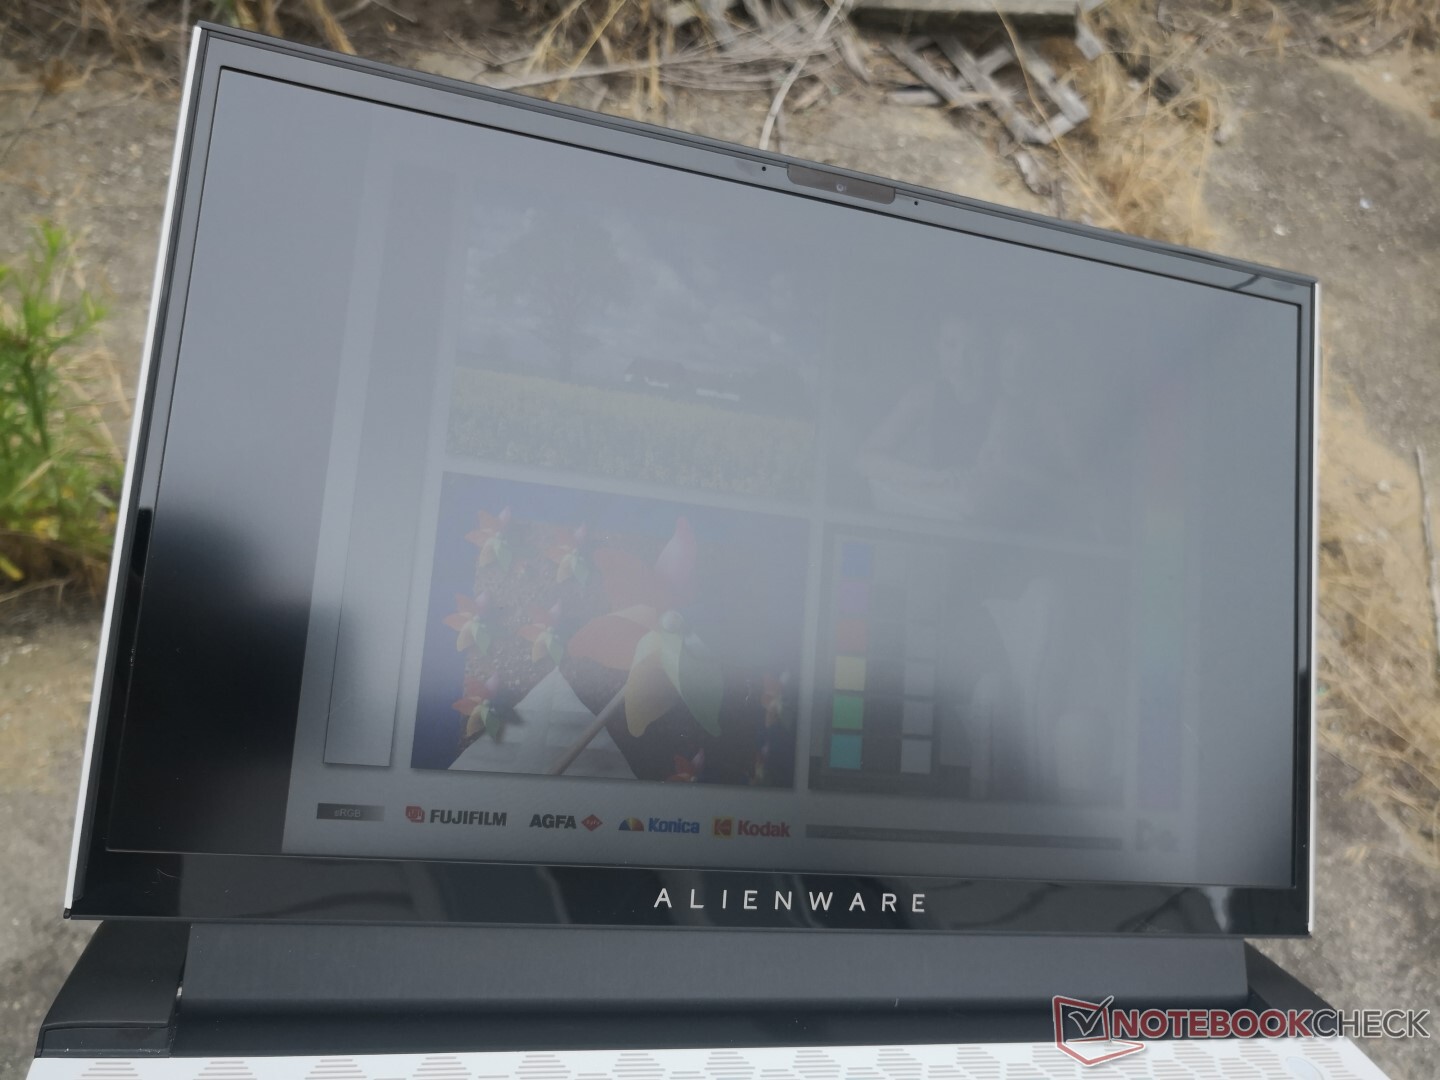
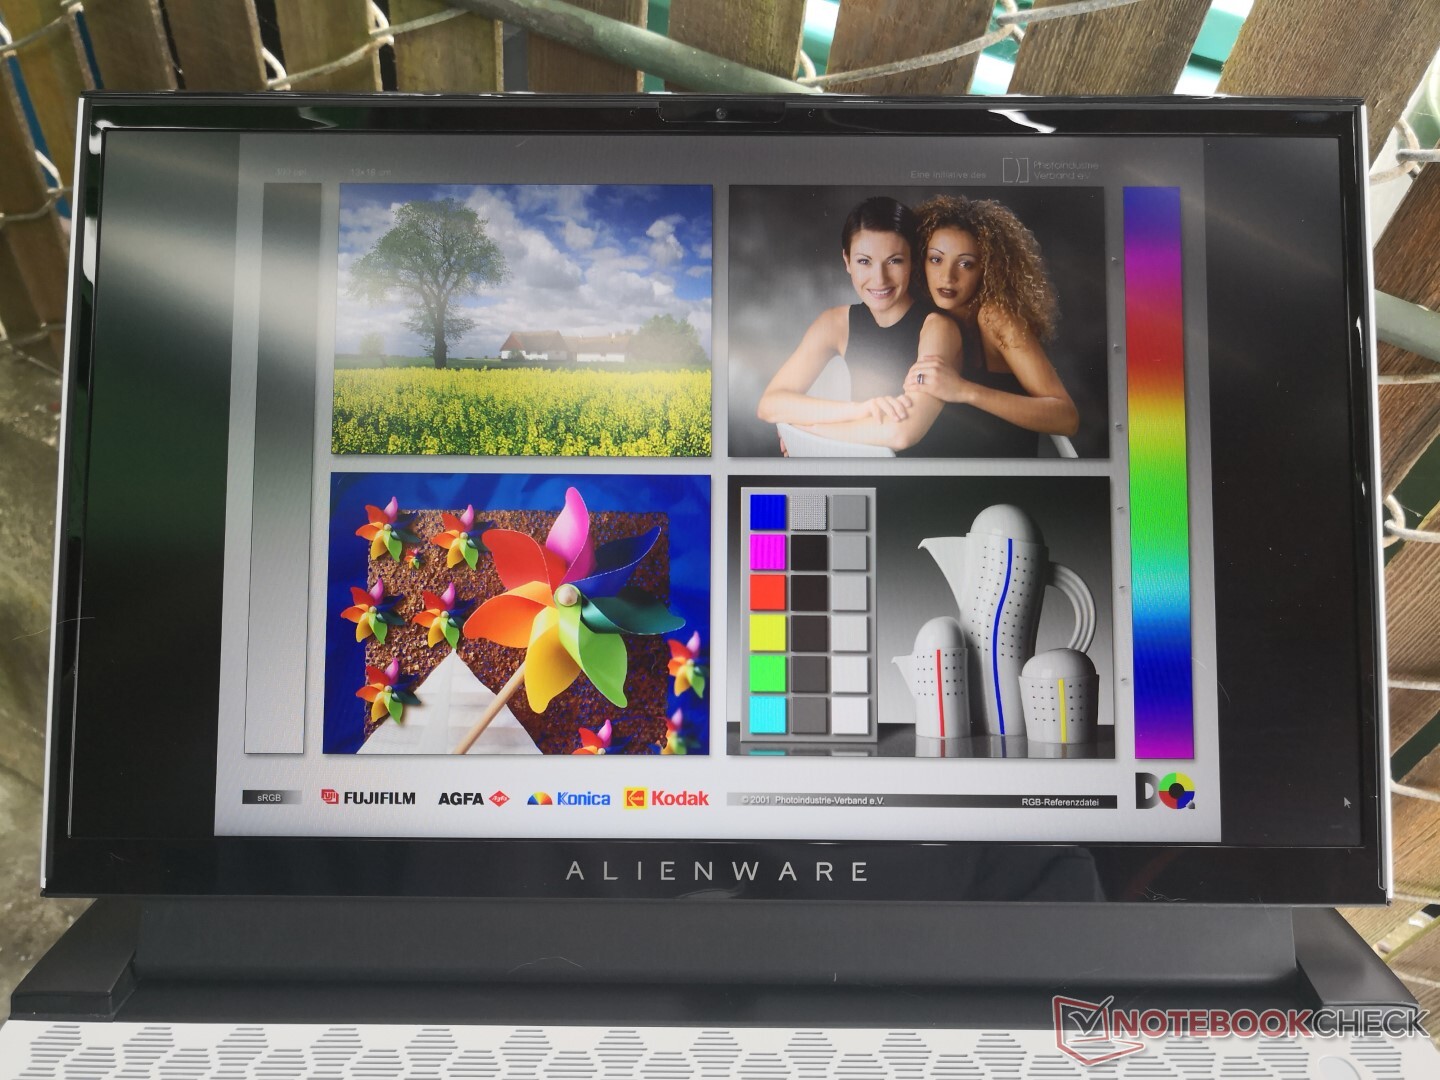
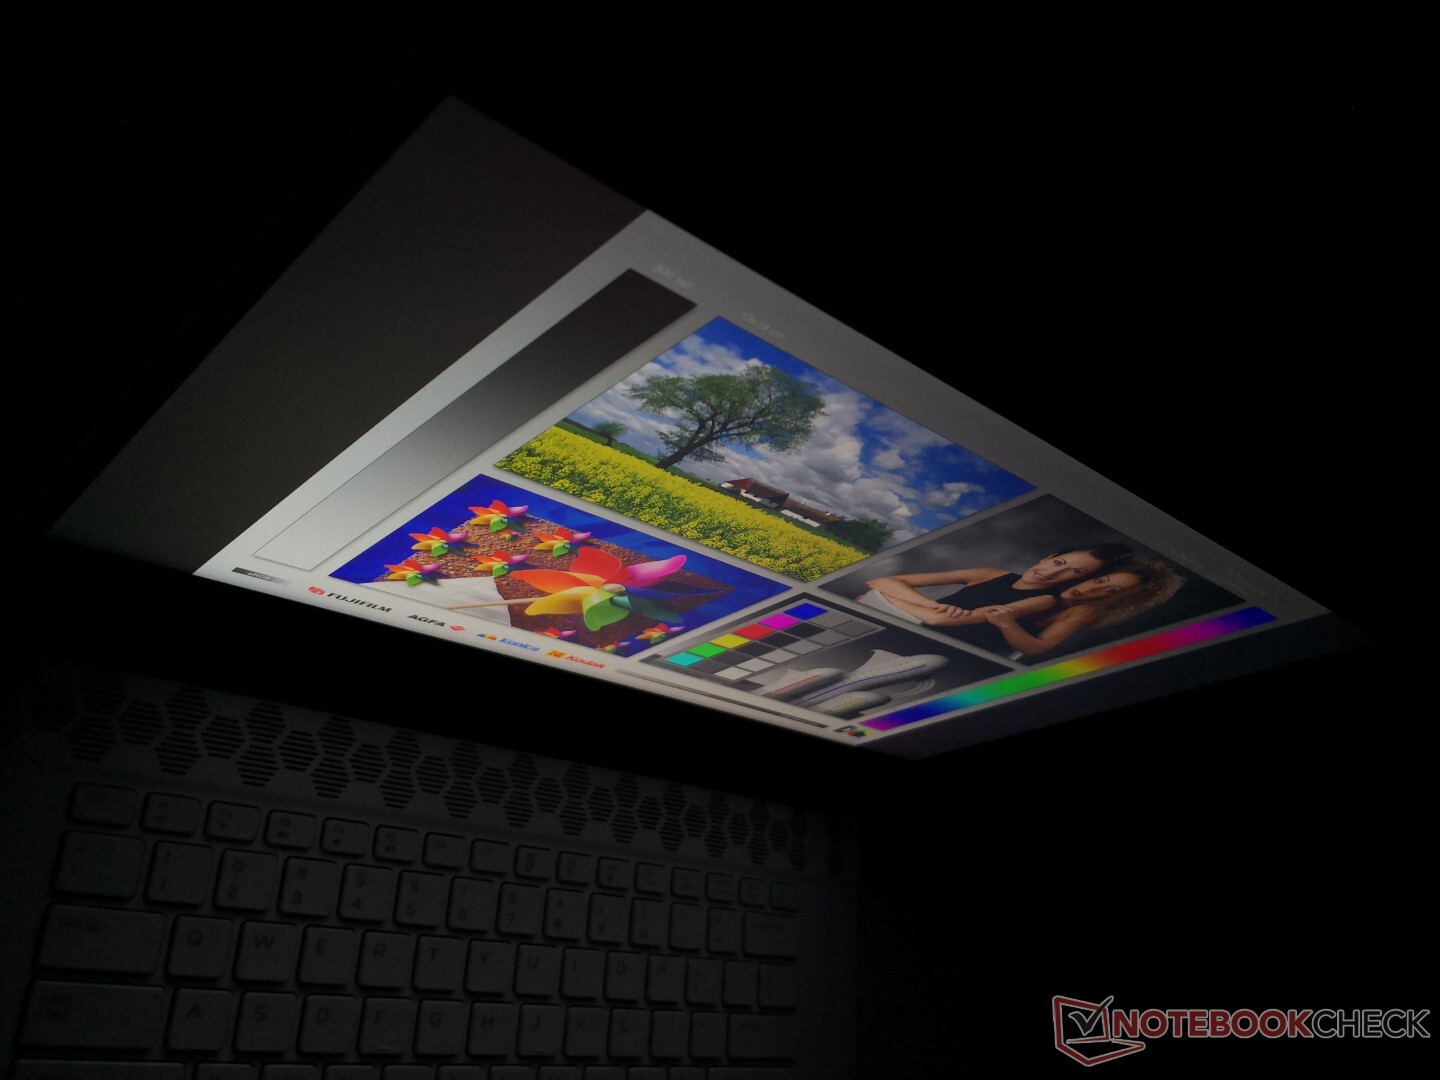
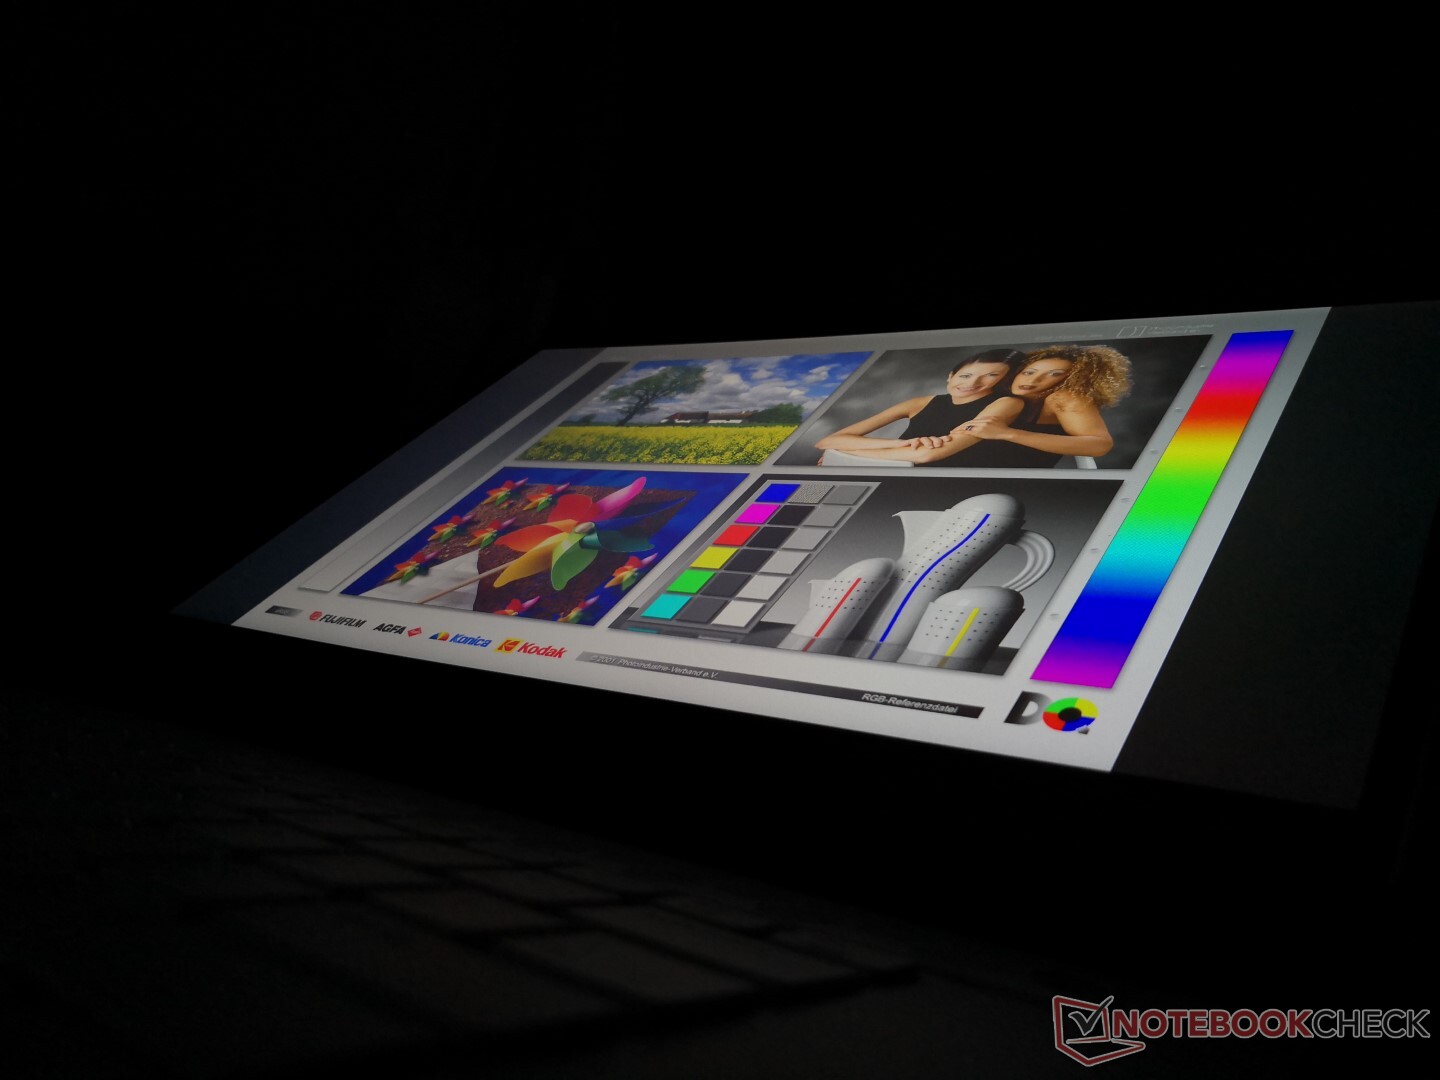
At 300 nits, the display is about average for its category. The OLED option will offer better outdoor viewability since it is both brighter and with higher contrast.
Performance
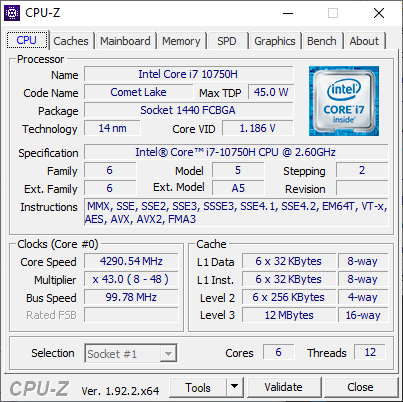
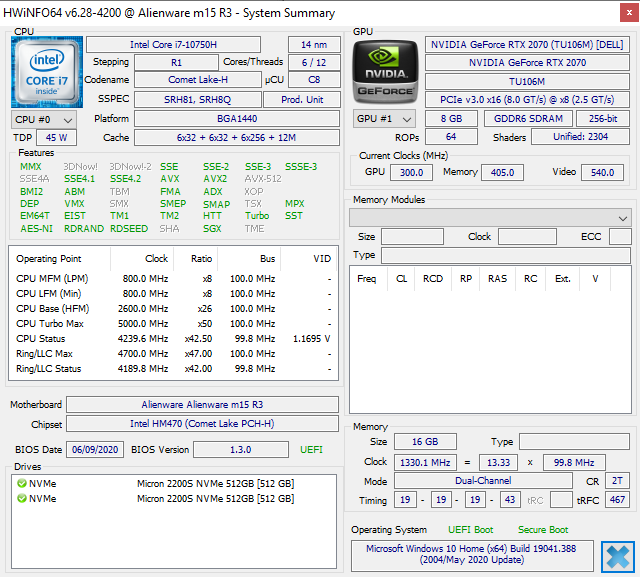
Users can choose between the 10th gen 6-core Core i7-10750H or unlocked 8-core Core i9-10980HK with no third option. A Core i7-10875H or even Ryzen 7 4800H would have been nice to see.
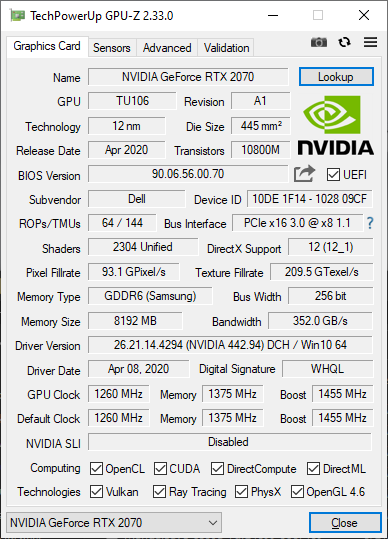
Graphics options range from the Radeon RX 5500M on the low end up to the GTX 1660 Ti, RTX 2060, RTX 2070, RTX 2070 Super, or RTX 2080 Super Max-Q. Mobile Nvidia GPUs have gotten out of control lately and so we recommend picking carefully.
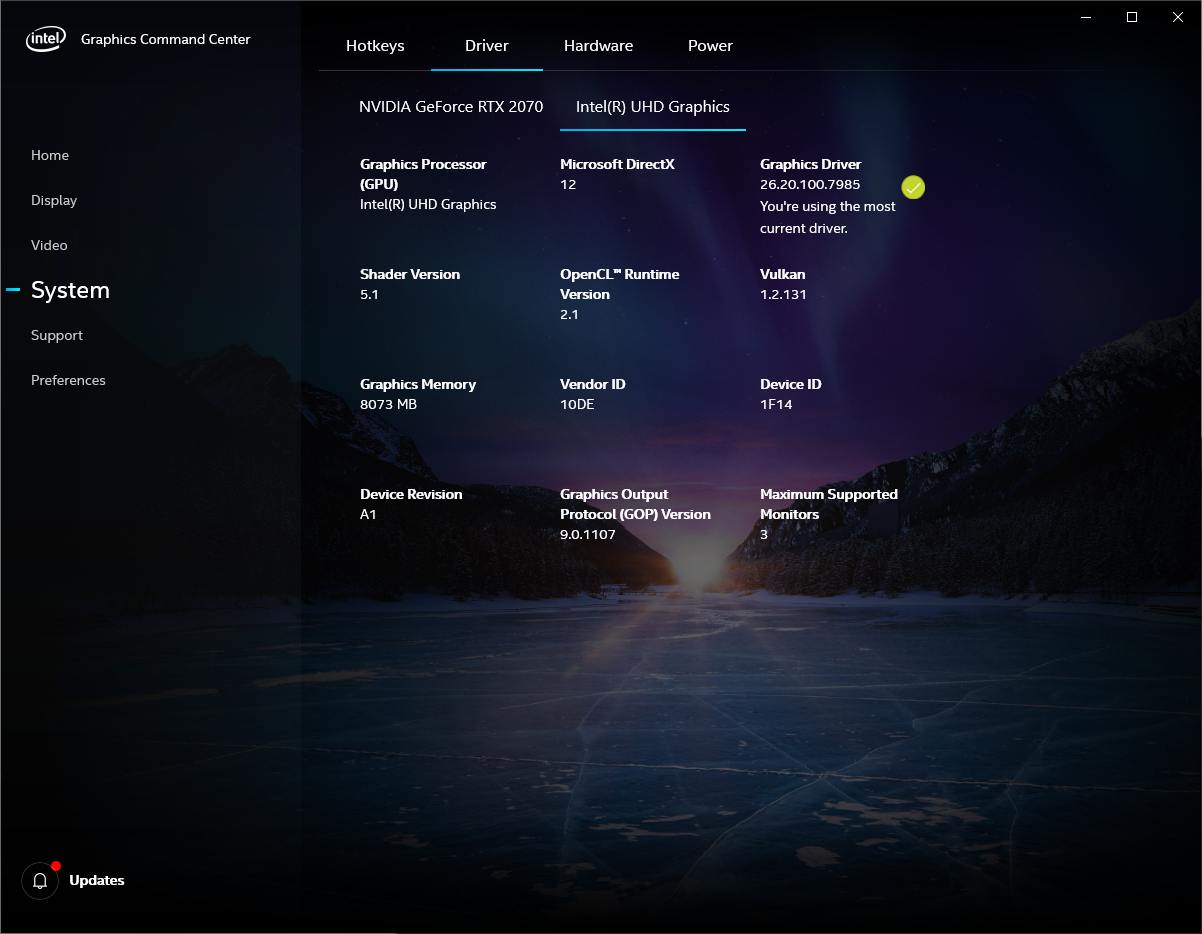
Dell says Nvidia Optimus is not included on SKUs with the 300 Hz panel like the one we have here because the integrated UHD Graphics 630 would have issues running the 300 Hz display. However, Optimus *is* available on the OLED and 144 Hz SKUs which should lead to longer battery life on those configurations.
G-Sync is not supported on the internal 300 Hz display despite the lack of Optimus on our test unit. Fortunately, the feature is still available when connected to external monitors.
All benchmarks below were run on Turbo mode for the best scores possible.
Processor
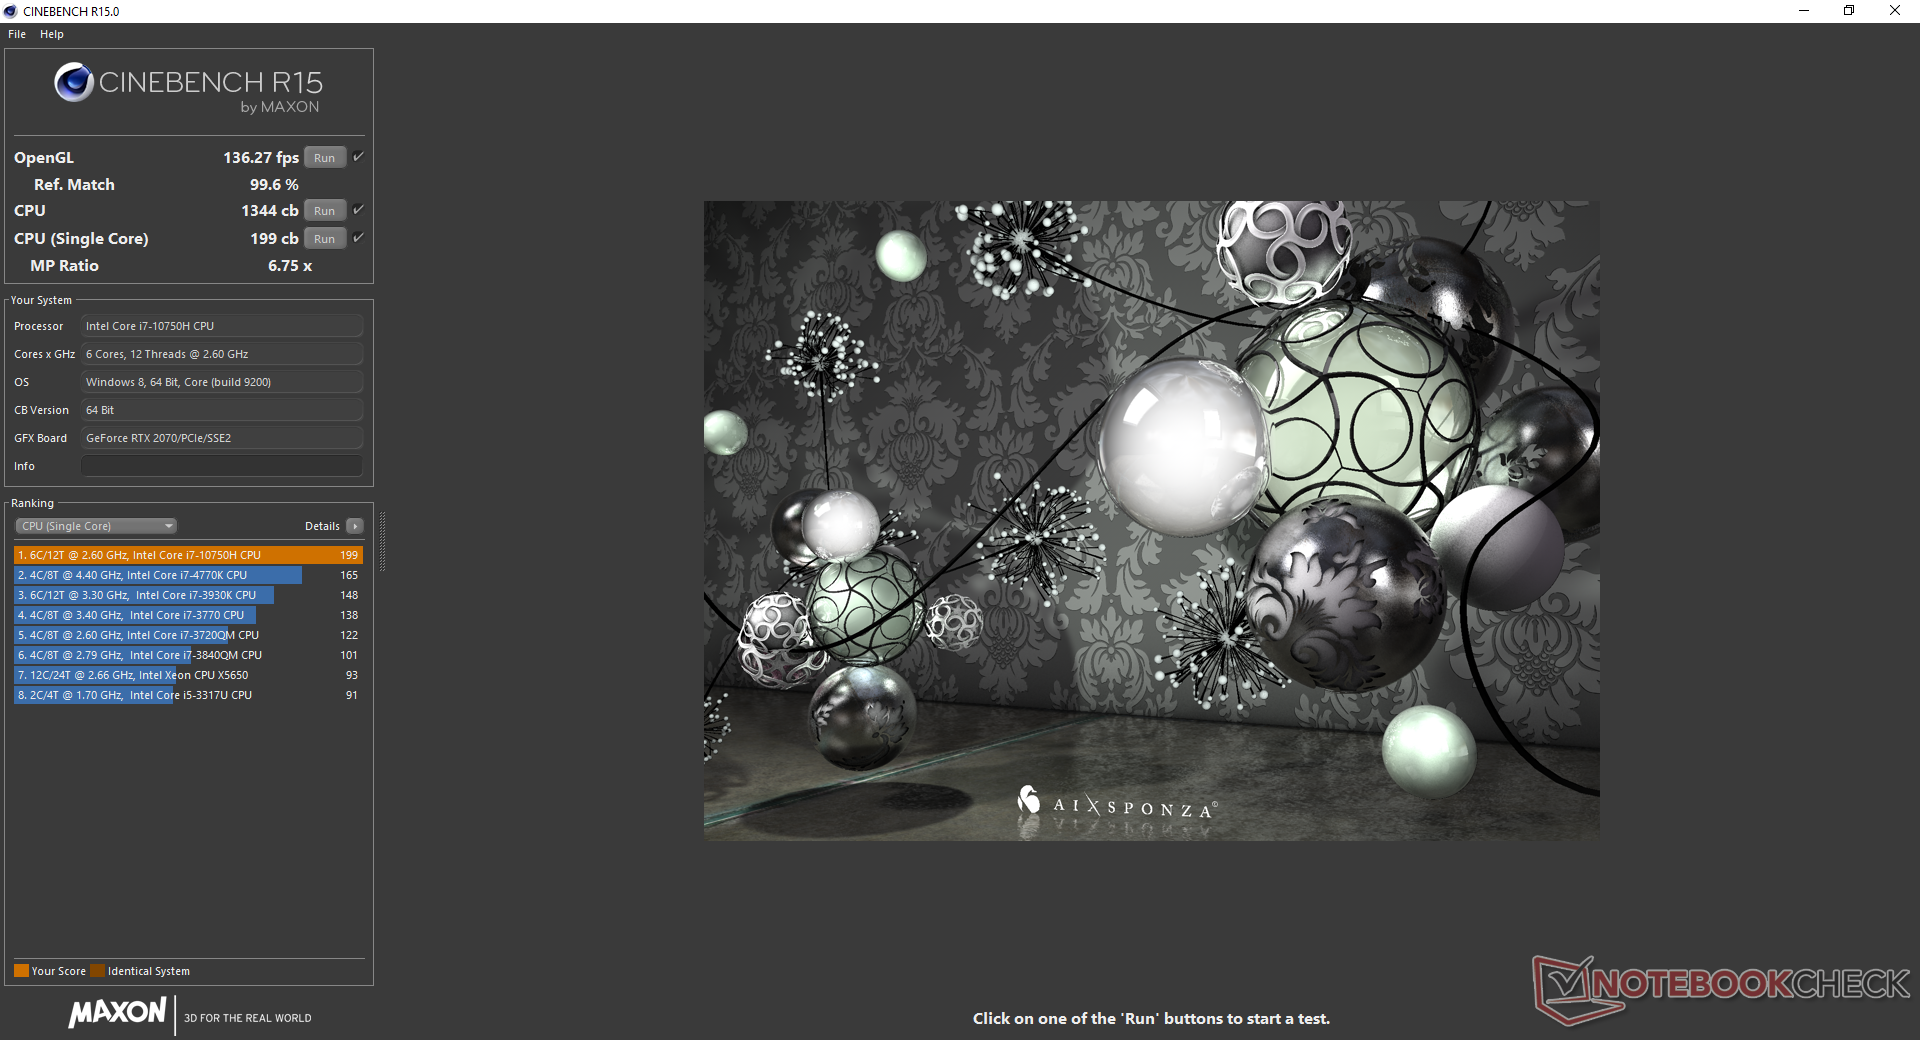
CPU performance is excellent especially in regard to sustainability. When running CineBench R15 xT in a loop, results would be constant throughout without the usual dips over time that we normally see on most other laptops as shown by the chart below.
Upgrading to the Core i9-10980HK should bring roughly 30 percent faster multi-threaded performance. It's too bad that Dell doesn't offer the Core i7-10875H as that would have performed similarly to the Core i9-10980HK but for a cheaper price.
See our dedicated page on the Core i7-10750H for more technical information and benchmark comparisons.
Cinebench R15: CPU Multi 64Bit | CPU Single 64Bit
Blender: v2.79 BMW27 CPU
7-Zip 18.03: 7z b 4 -mmt1 | 7z b 4
Geekbench 5.5: Single-Core | Multi-Core
HWBOT x265 Benchmark v2.2: 4k Preset
LibreOffice : 20 Documents To PDF
R Benchmark 2.5: Overall mean
| Cinebench R20 / CPU (Multi Core) | |
| Intel Core i9-10900K | |
| Dell G5 15 SE 5505 P89F | |
| Asus ROG Strix Scar 15 G532LWS | |
| Gigabyte Aero 15 OLED XB-8DE51B0SP | |
| MSI GE65 Raider 9SF-049US | |
| Alienware m15 R3 P87F | |
| Acer Nitro 5 AN515-44-R5FT | |
| Average Intel Core i7-10750H (1749 - 3325, n=43) | |
| Maingear Vector 15 | |
| MSI GE63 Raider 8SG | |
| Asus Zephyrus GX501 | |
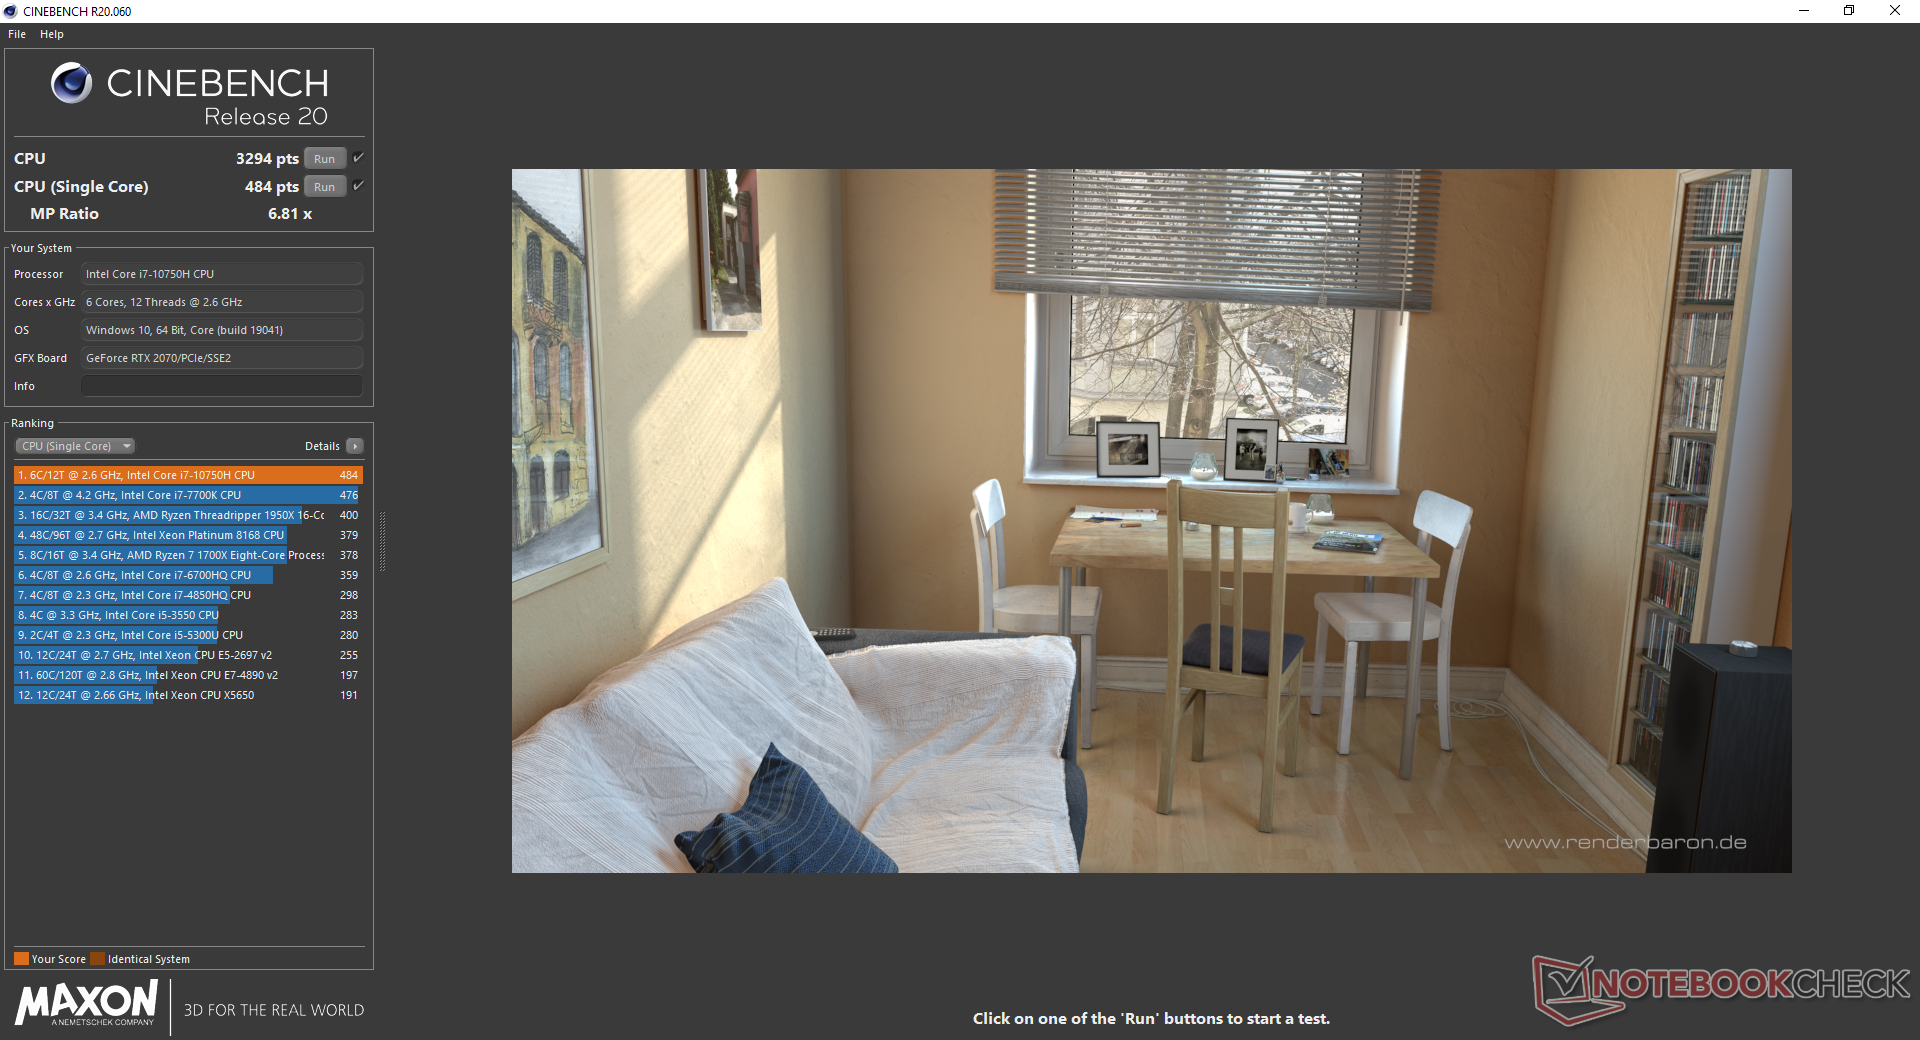
| Cinebench R20 / CPU (Single Core) | |
| Intel Core i9-10900K | |
| Gigabyte Aero 15 OLED XB-8DE51B0SP | |
| Asus ROG Strix Scar 15 G532LWS | |
| Dell G5 15 SE 5505 P89F | |
| Alienware m15 R3 P87F | |
| MSI GE65 Raider 9SF-049US | |
| Average Intel Core i7-10750H (431 - 504, n=43) | |
| Maingear Vector 15 | |
| Acer Nitro 5 AN515-44-R5FT | |
| MSI GE63 Raider 8SG | |
| Asus Zephyrus GX501 | |
| Cinebench R15 / CPU Multi 64Bit | |
| Intel Core i9-10900K | |
| Dell G5 15 SE 5505 P89F | |
| Gigabyte Aero 15 OLED XB-8DE51B0SP | |
| Asus ROG Strix Scar 15 G532LWS | |
| MSI GE65 Raider 9SF-049US | |
| Acer Nitro 5 AN515-44-R5FT | |
| Alienware m15 R3 P87F | |
| Maingear Vector 15 | |
| Average Intel Core i7-10750H (804 - 1418, n=50) | |
| MSI GE63 Raider 8SG | |
| Asus Zephyrus GX501 | |
| Cinebench R15 / CPU Single 64Bit | |
| Intel Core i9-10900K | |
| Gigabyte Aero 15 OLED XB-8DE51B0SP | |
| Asus ROG Strix Scar 15 G532LWS | |
| Alienware m15 R3 P87F | |
| MSI GE65 Raider 9SF-049US | |
| Average Intel Core i7-10750H (184 - 213, n=45) | |
| Dell G5 15 SE 5505 P89F | |
| Maingear Vector 15 | |
| Acer Nitro 5 AN515-44-R5FT | |
| MSI GE63 Raider 8SG | |
| Asus Zephyrus GX501 | |
| Blender / v2.79 BMW27 CPU | |
| Average Intel Core i7-10750H (322 - 587, n=43) | |
| Acer Nitro 5 AN515-44-R5FT | |
| Alienware m15 R3 P87F | |
| Gigabyte Aero 15 OLED XB-8DE51B0SP | |
| Asus ROG Strix Scar 15 G532LWS | |
| Dell G5 15 SE 5505 P89F | |
| Intel Core i9-10900K | |
| 7-Zip 18.03 / 7z b 4 -mmt1 | |
| Intel Core i9-10900K | |
| Asus ROG Strix Scar 15 G532LWS | |
| Gigabyte Aero 15 OLED XB-8DE51B0SP | |
| Average Intel Core i7-10750H (4504 - 5470, n=43) | |
| Dell G5 15 SE 5505 P89F | |
| Alienware m15 R3 P87F | |
| Acer Nitro 5 AN515-44-R5FT | |
| 7-Zip 18.03 / 7z b 4 | |
| Intel Core i9-10900K | |
| Dell G5 15 SE 5505 P89F | |
| Asus ROG Strix Scar 15 G532LWS | |
| Gigabyte Aero 15 OLED XB-8DE51B0SP | |
| Acer Nitro 5 AN515-44-R5FT | |
| Alienware m15 R3 P87F | |
| Average Intel Core i7-10750H (26040 - 37345, n=43) | |
| Geekbench 5.5 / Single-Core | |
| Intel Core i9-10900K | |
| Asus ROG Strix Scar 15 G532LWS | |
| Gigabyte Aero 15 OLED XB-8DE51B0SP | |
| Alienware m15 R3 P87F | |
| Average Intel Core i7-10750H (1114 - 1333, n=43) | |
| Dell G5 15 SE 5505 P89F | |
| Acer Nitro 5 AN515-44-R5FT | |
| Geekbench 5.5 / Multi-Core | |
| Intel Core i9-10900K | |
| Asus ROG Strix Scar 15 G532LWS | |
| Gigabyte Aero 15 OLED XB-8DE51B0SP | |
| Dell G5 15 SE 5505 P89F | |
| Alienware m15 R3 P87F | |
| Average Intel Core i7-10750H (4443 - 6674, n=43) | |
| Acer Nitro 5 AN515-44-R5FT | |
| HWBOT x265 Benchmark v2.2 / 4k Preset | |
| Intel Core i9-10900K | |
| Gigabyte Aero 15 OLED XB-8DE51B0SP | |
| Asus ROG Strix Scar 15 G532LWS | |
| Dell G5 15 SE 5505 P89F | |
| Alienware m15 R3 P87F | |
| Average Intel Core i7-10750H (5.54 - 11.6, n=43) | |
| Acer Nitro 5 AN515-44-R5FT | |
| LibreOffice / 20 Documents To PDF | |
| Intel Core i9-10900K | |
| Dell G5 15 SE 5505 P89F | |
| Acer Nitro 5 AN515-44-R5FT | |
| Alienware m15 R3 P87F | |
| Average Intel Core i7-10750H (43.1 - 99.2, n=43) | |
| Gigabyte Aero 15 OLED XB-8DE51B0SP | |
| Asus ROG Strix Scar 15 G532LWS | |
| R Benchmark 2.5 / Overall mean | |
| Alienware m15 R3 P87F | |
| Acer Nitro 5 AN515-44-R5FT | |
| Average Intel Core i7-10750H (0.578 - 0.708, n=42) | |
| Dell G5 15 SE 5505 P89F | |
| Asus ROG Strix Scar 15 G532LWS | |
| Gigabyte Aero 15 OLED XB-8DE51B0SP | |
| Intel Core i9-10900K | |
* ... smaller is better
System Performance
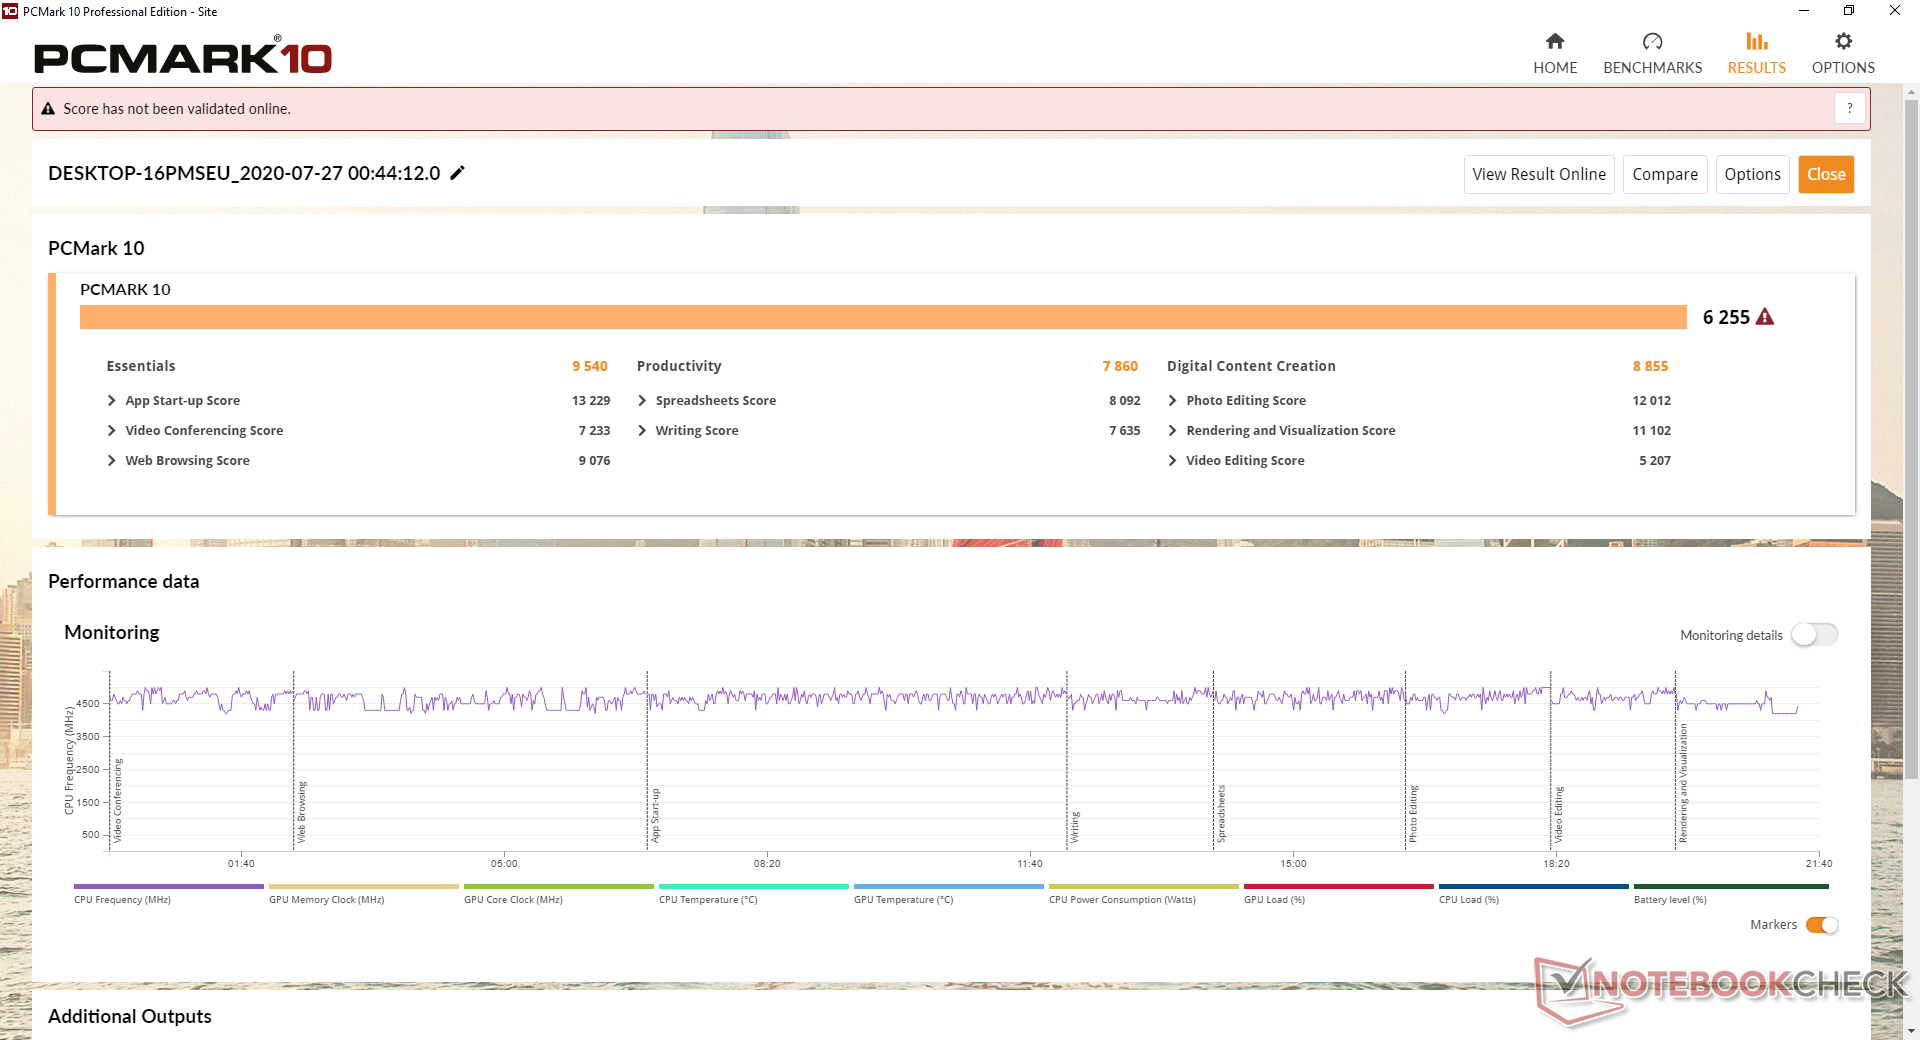
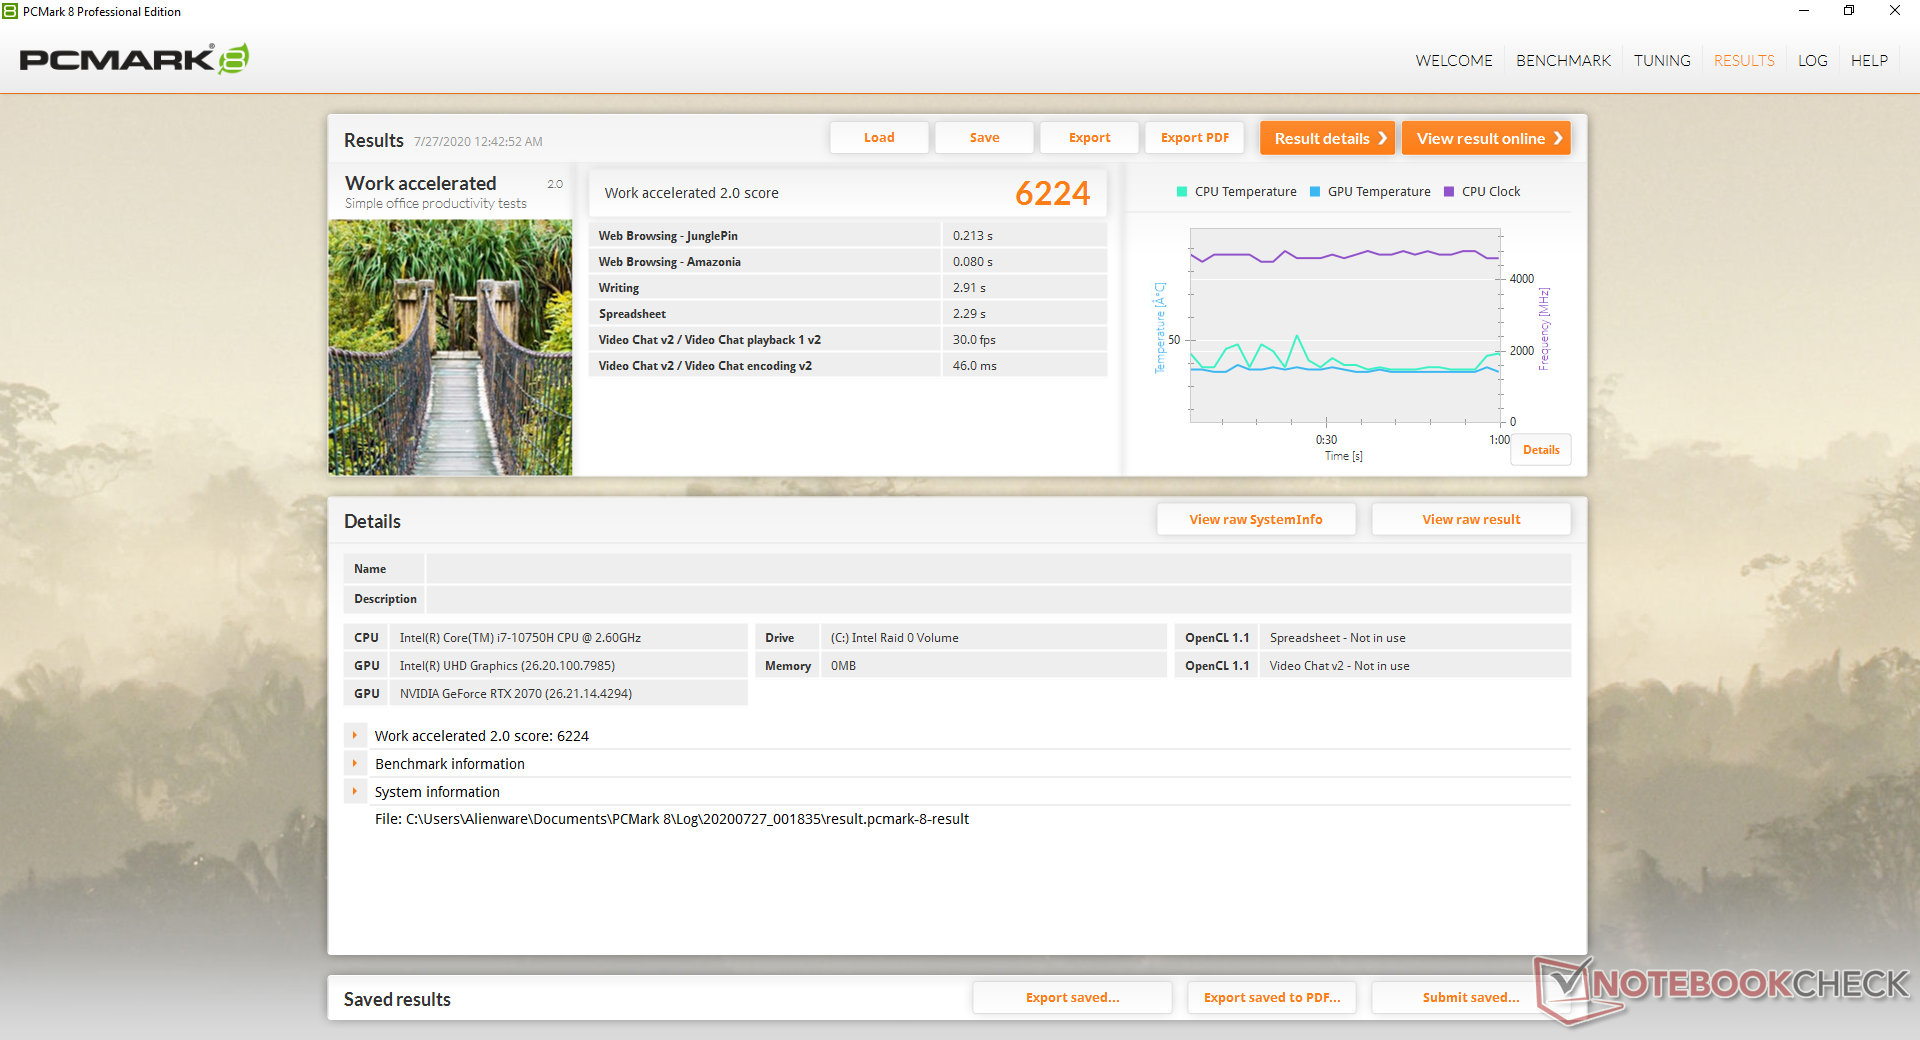
PCMark results are where we expect them to be for the high-end gaming category. We highly recommend that users become familiar with the pre-installed Alienware Command Center software as it directly controls the performance and fan behavior of the laptop more so than the default Windows power profiles.
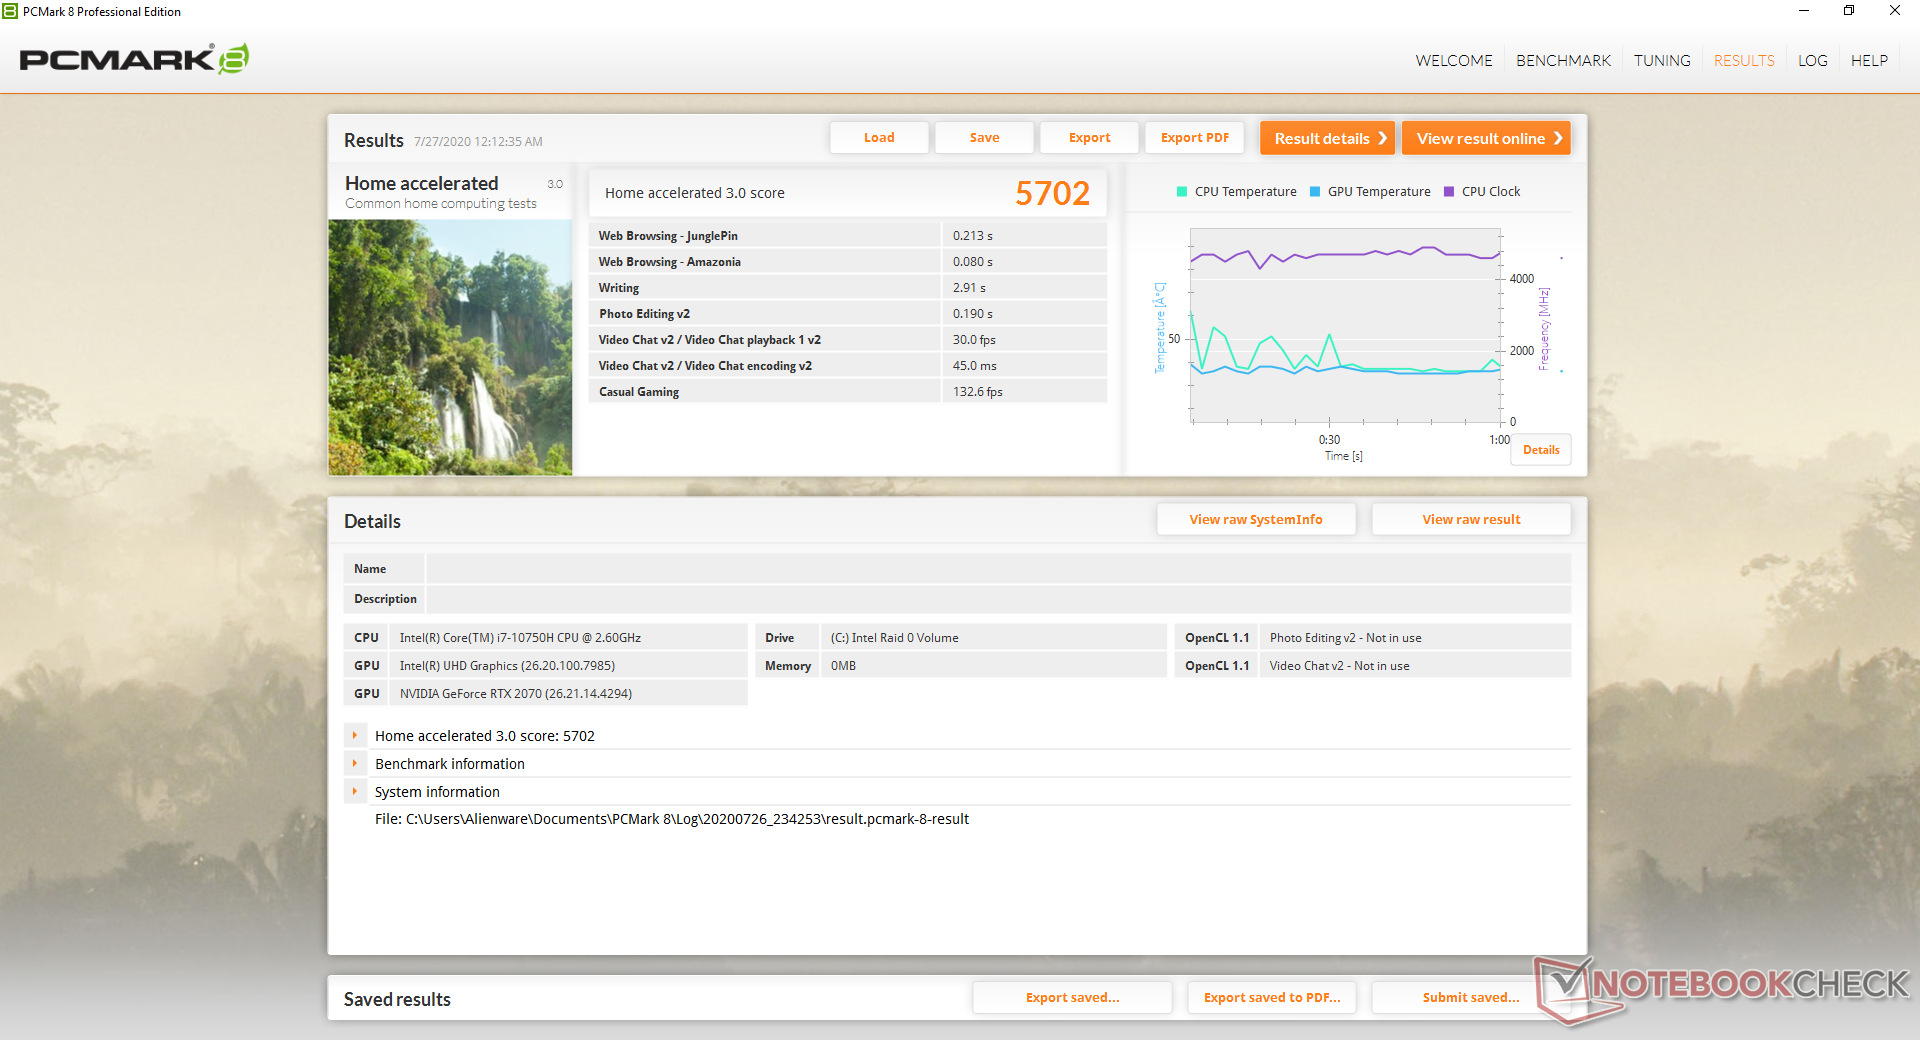
| PCMark 8 Home Score Accelerated v2 | 5702 points | |
| PCMark 8 Work Score Accelerated v2 | 6224 points | |
| PCMark 10 Score | 6255 points | |
Help | ||
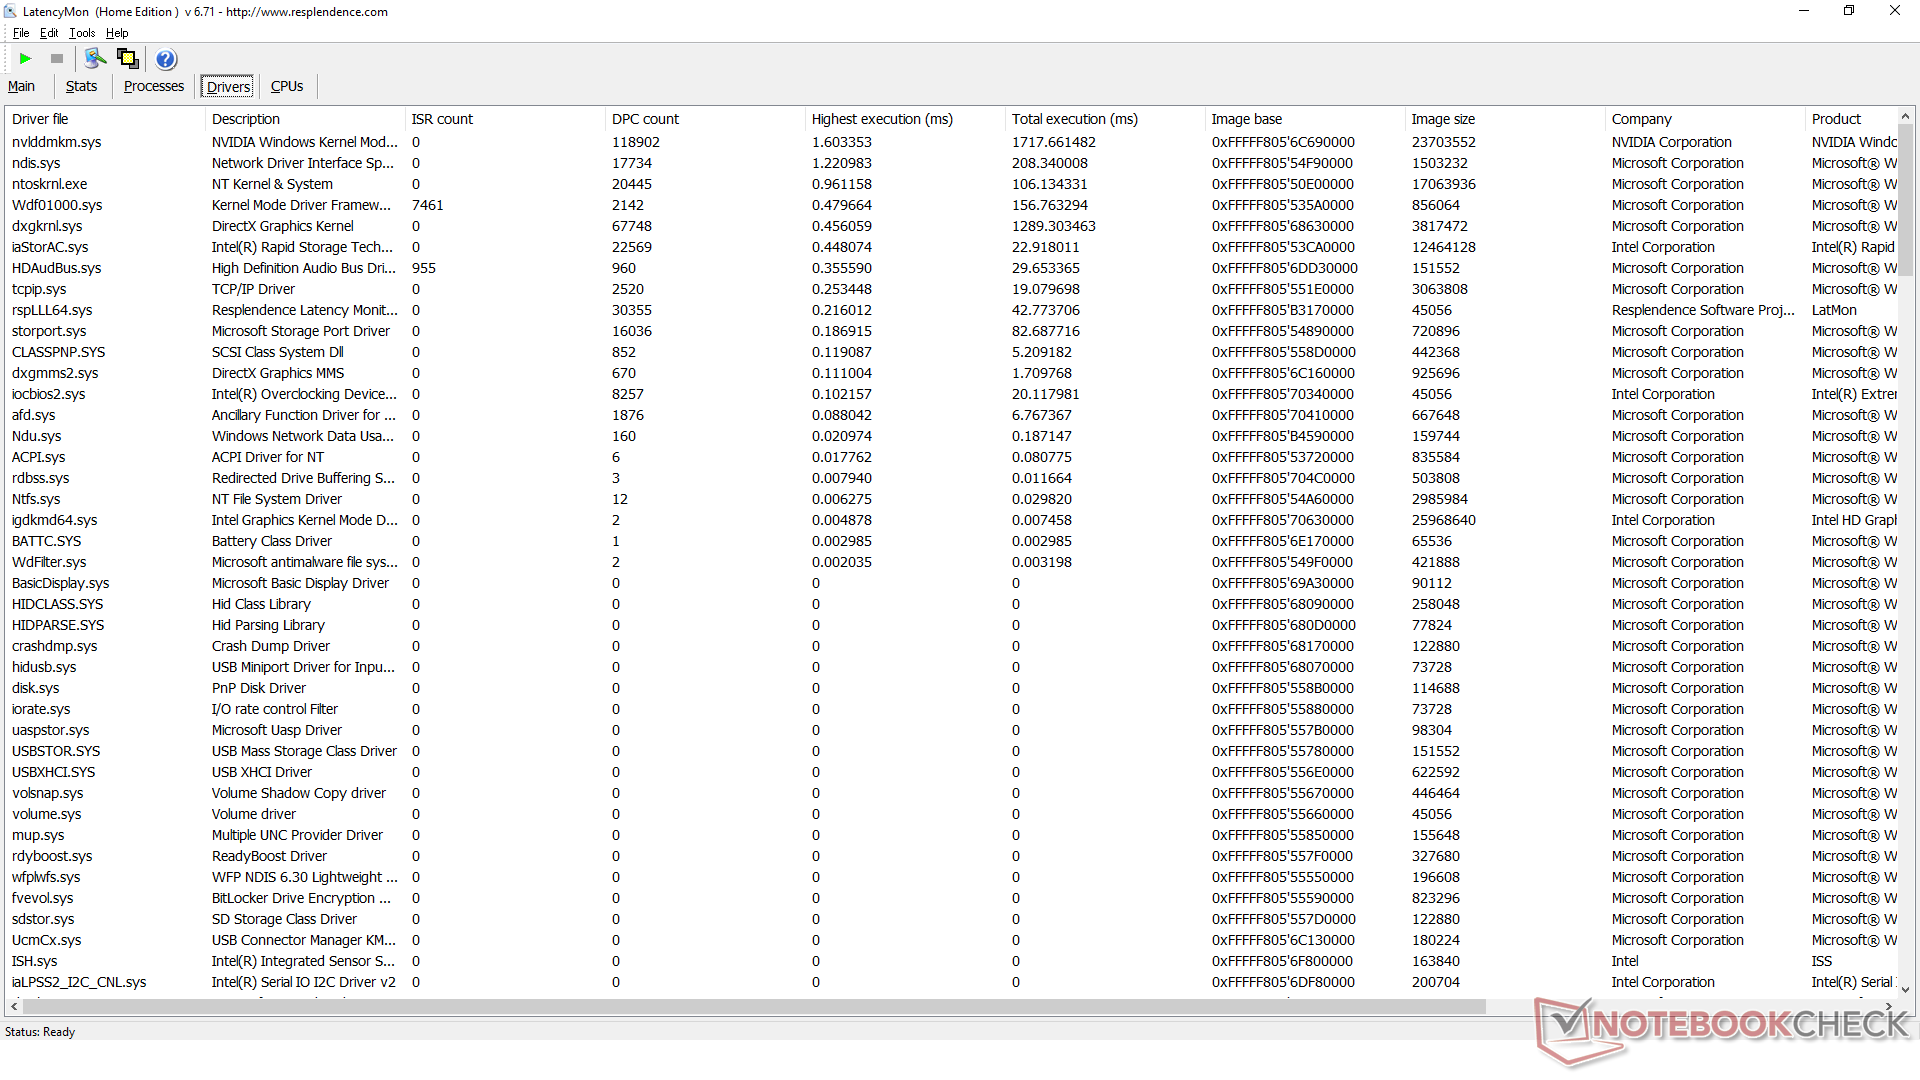
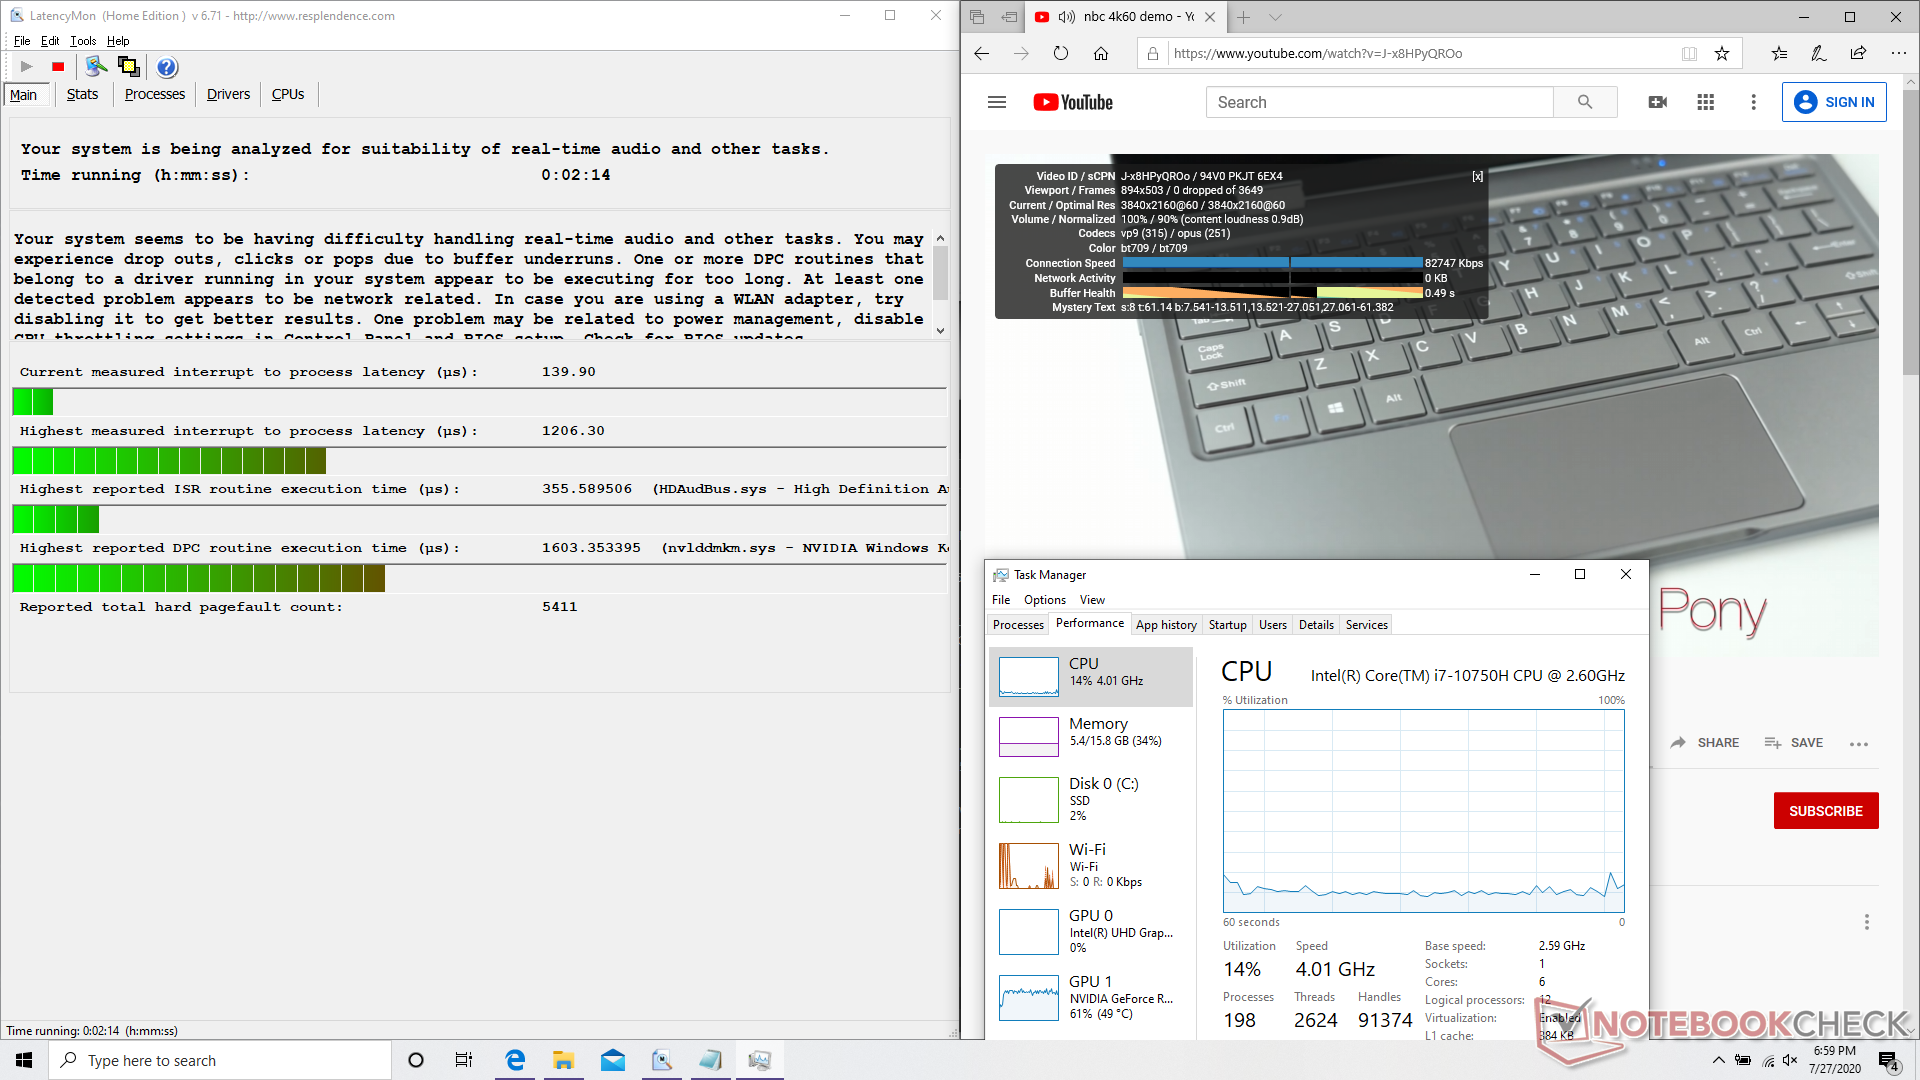
DPC Latency
LatencyMon shows DPC latency issues when opening multiple tabs on our homepage. 4K UHD video playback on YouTube is otherwise smooth and with no dropped frames unlike what we observed on the recent Asus ROG G532.
| DPC Latencies / LatencyMon - interrupt to process latency (max), Web, Youtube, Prime95 | |
| Dell G5 15 SE 5505 P89F | |
| MSI GS66 Stealth 10SFS | |
| Gigabyte Aero 15 OLED XB-8DE51B0SP | |
| Asus ROG Strix Scar 15 G532LWS | |
| Alienware m15 R3 P87F | |
| MSI GS66 Stealth 10SE-045 | |
| Acer Nitro 5 AN515-44-R5FT | |
| Razer Blade 15 RZ09-0328 | |
| Eluktronics RP-15 | |
| MSI GS75 10SF-609US | |
* ... smaller is better
Storage Devices
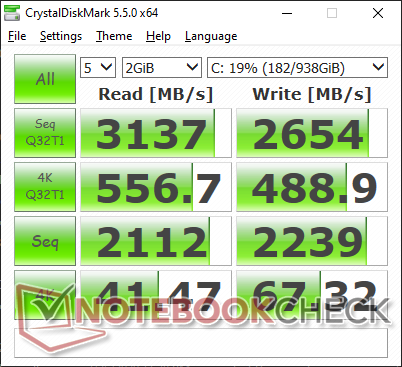
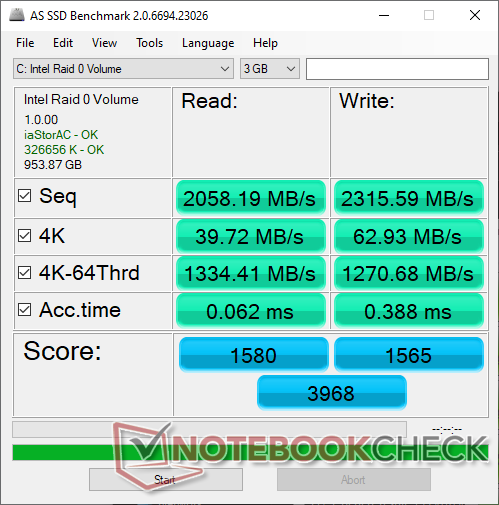
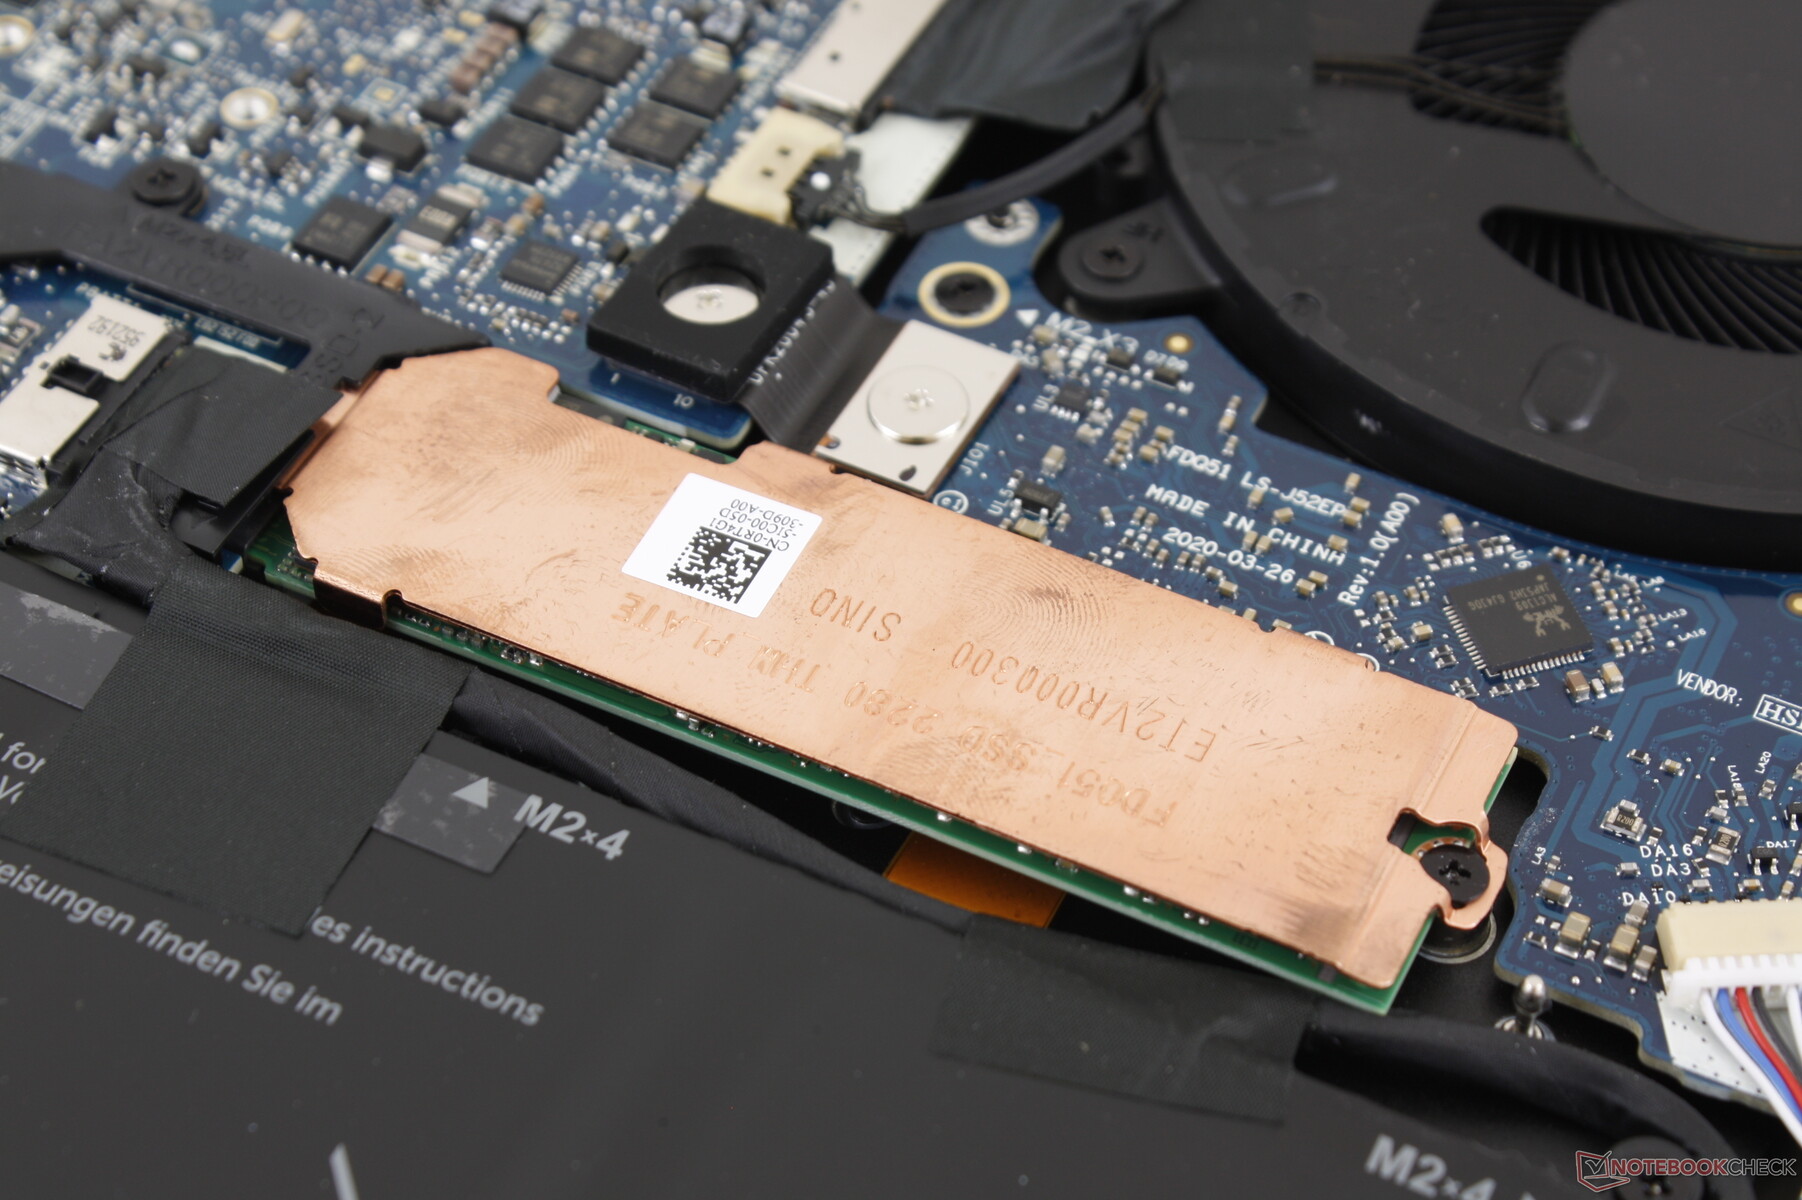
There are three M.2 storage slots compared to two on last year's model, but the third one only accepts shorter 2230 or 2242 drives. Our unit comes configured with two 512 GB Micron 2200S NVMe SSDs in RAID 0 configuration. Performance is close to a single 512 GB Lite-On CA5-8D512 SSD as found on the Razer Blade 15. It's possible that other SKUs and capacities will come from different drive manufacturers and not just Micron.
| Alienware m15 R3 P87F 2x Micron 2200S 512 GB (RAID 0) | Alienware m15 P79F Toshiba XG5 KXG50ZNV512G | Razer Blade 15 RZ09-0328 Lite-On CA5-8D512 | Asus Zephyrus S GX502GW 2x Intel SSD 660p SSDPEKNW512G8 (RAID 0) | MSI GS66 Stealth 10SFS Samsung SSD PM981 MZVLB1T0HALR | |
|---|---|---|---|---|---|
| AS SSD | -9% | 4% | 2% | 25% | |
| Seq Read (MB/s) | 2058 | 1937 -6% | 2021 -2% | 2506 22% | 1065 -48% |
| Seq Write (MB/s) | 2316 | 1066 -54% | 2090 -10% | 1712 -26% | 2360 2% |
| 4K Read (MB/s) | 39.72 | 31.76 -20% | 47.71 20% | 48.32 22% | 48.09 21% |
| 4K Write (MB/s) | 62.9 | 102.6 63% | 101.1 61% | 103.6 65% | 110.7 76% |
| 4K-64 Read (MB/s) | 1334 | 1140 -15% | 856 -36% | 624 -53% | 1635 23% |
| 4K-64 Write (MB/s) | 1271 | 938 -26% | 1041 -18% | 1253 -1% | 1829 44% |
| Access Time Read * (ms) | 0.062 | 0.058 6% | 0.052 16% | 0.08 -29% | 0.071 -15% |
| Access Time Write * (ms) | 0.388 | 0.04 90% | 0.111 71% | 0.04 90% | 0.034 91% |
| Score Read (Points) | 1580 | 1366 -14% | 1105 -30% | 923 -42% | 1790 13% |
| Score Write (Points) | 1565 | 1147 -27% | 1351 -14% | 1528 -2% | 2176 39% |
| Score Total (Points) | 3968 | 3168 -20% | 3037 -23% | 2896 -27% | 4950 25% |
| Copy ISO MB/s (MB/s) | 1685 | 946 -44% | 2474 47% | ||
| Copy Program MB/s (MB/s) | 669 | 452.8 -32% | 679 1% | ||
| Copy Game MB/s (MB/s) | 1493 | 1013 -32% | 1037 -31% | ||
| CrystalDiskMark 5.2 / 6 | 5% | 13% | -6% | 9% | |
| Write 4K (MB/s) | 67.3 | 148.4 121% | 118.7 76% | 97 44% | 131.3 95% |
| Read 4K (MB/s) | 41.47 | 49.65 20% | 52.4 26% | 49.58 20% | 45.84 11% |
| Write Seq (MB/s) | 2239 | 1139 -49% | 2247 0% | 1838 -18% | 2370 6% |
| Read Seq (MB/s) | 2112 | 2353 11% | 2234 6% | 2421 15% | 1509 -29% |
| Write 4K Q32T1 (MB/s) | 488.9 | 484.7 -1% | 515 5% | 326.9 -33% | 481.5 -2% |
| Read 4K Q32T1 (MB/s) | 557 | 542 -3% | 584 5% | 372.9 -33% | 560 1% |
| Write Seq Q32T1 (MB/s) | 2654 | 1139 -57% | 2235 -16% | 1894 -29% | 2392 -10% |
| Read Seq Q32T1 (MB/s) | 3137 | 3108 -1% | 3171 1% | 2828 -10% | 3232 3% |
| Total Average (Program / Settings) | -2% /
-4% | 9% /
7% | -2% /
-1% | 17% /
18% |
* ... smaller is better

Disk Throttling: DiskSpd Read Loop, Queue Depth 8
GPU Performance
The GeForce RTX 2070 is performing where we expect it to be relative to other laptops in our database equipped with the same GPU. Raw performance is almost 20 percent faster than the RTX 2070 Max-Q version as found on the Razer Blade 15 to be on the same level as the RTX 2070 Super Max-Q. Upgrading to the RTX 2070 Super or RTX 2080 Super Max-Q will net users very marginal improvements in the one-digit range based on our experience with a range of gaming laptops.
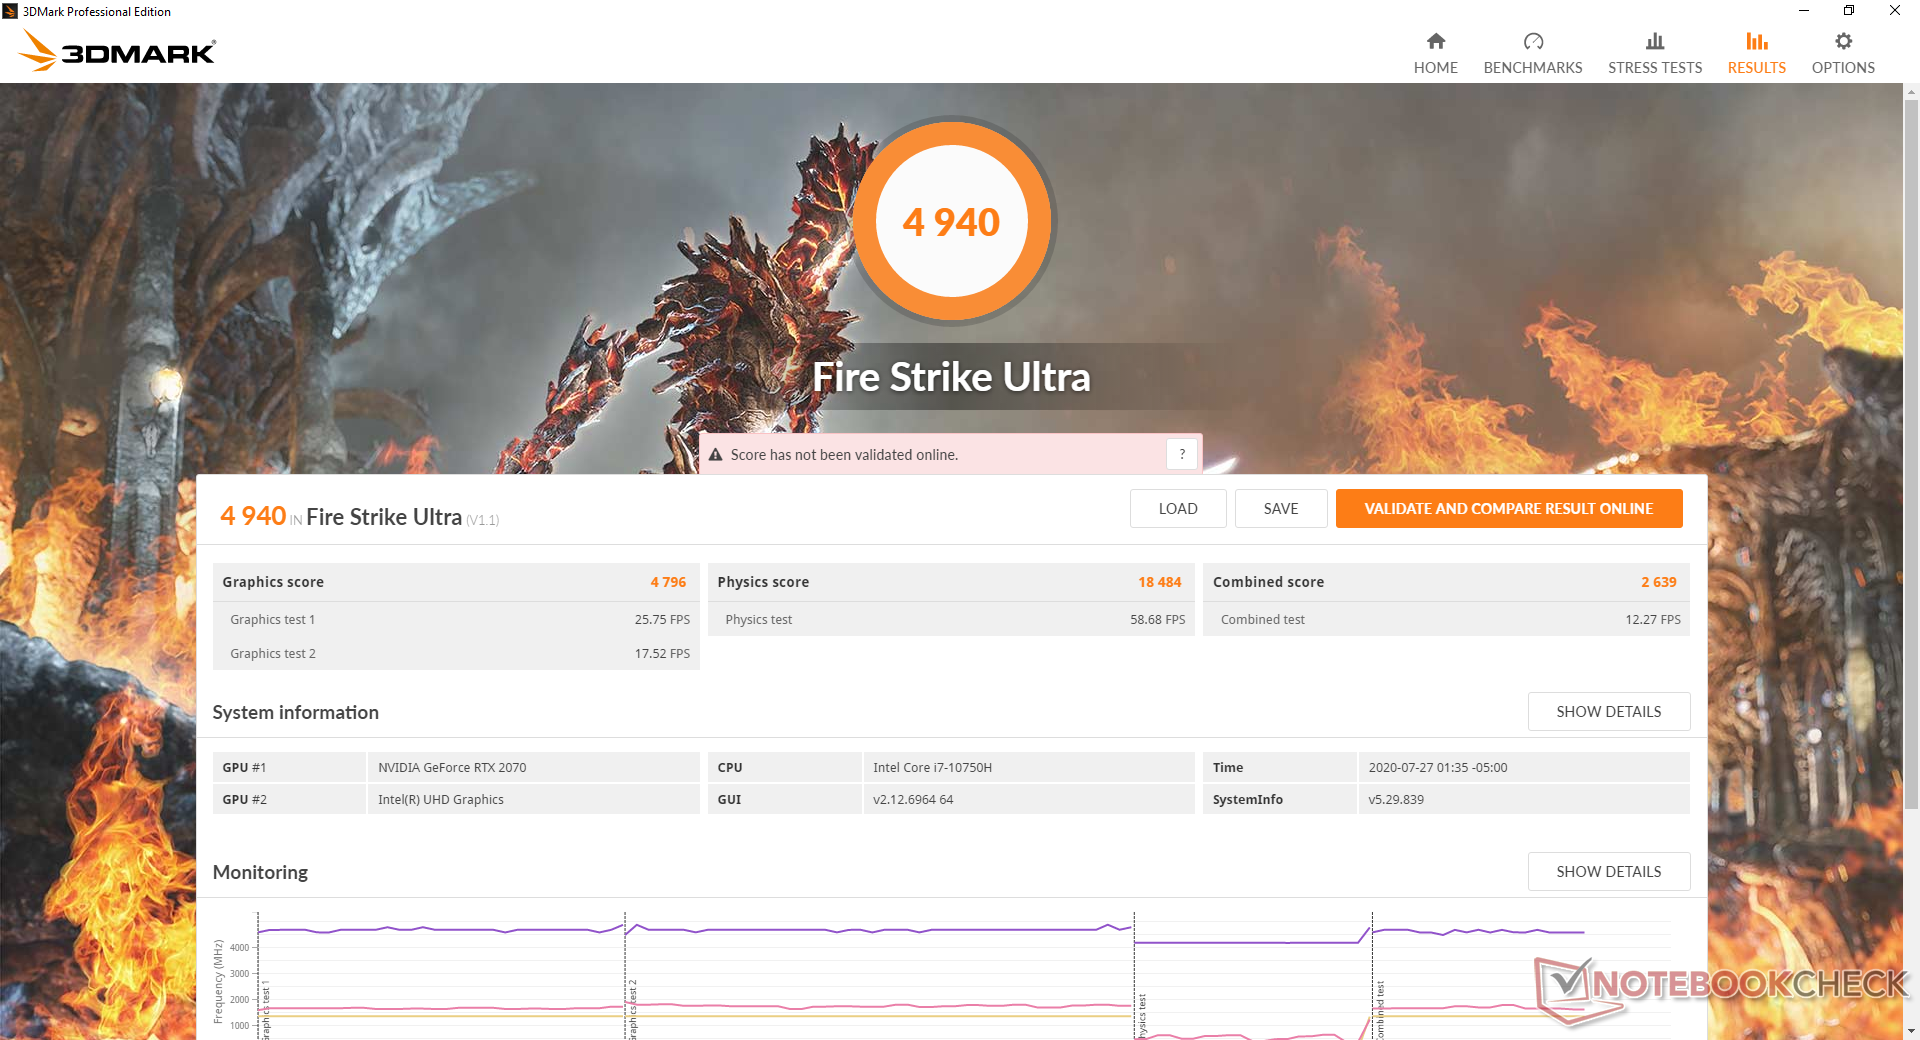
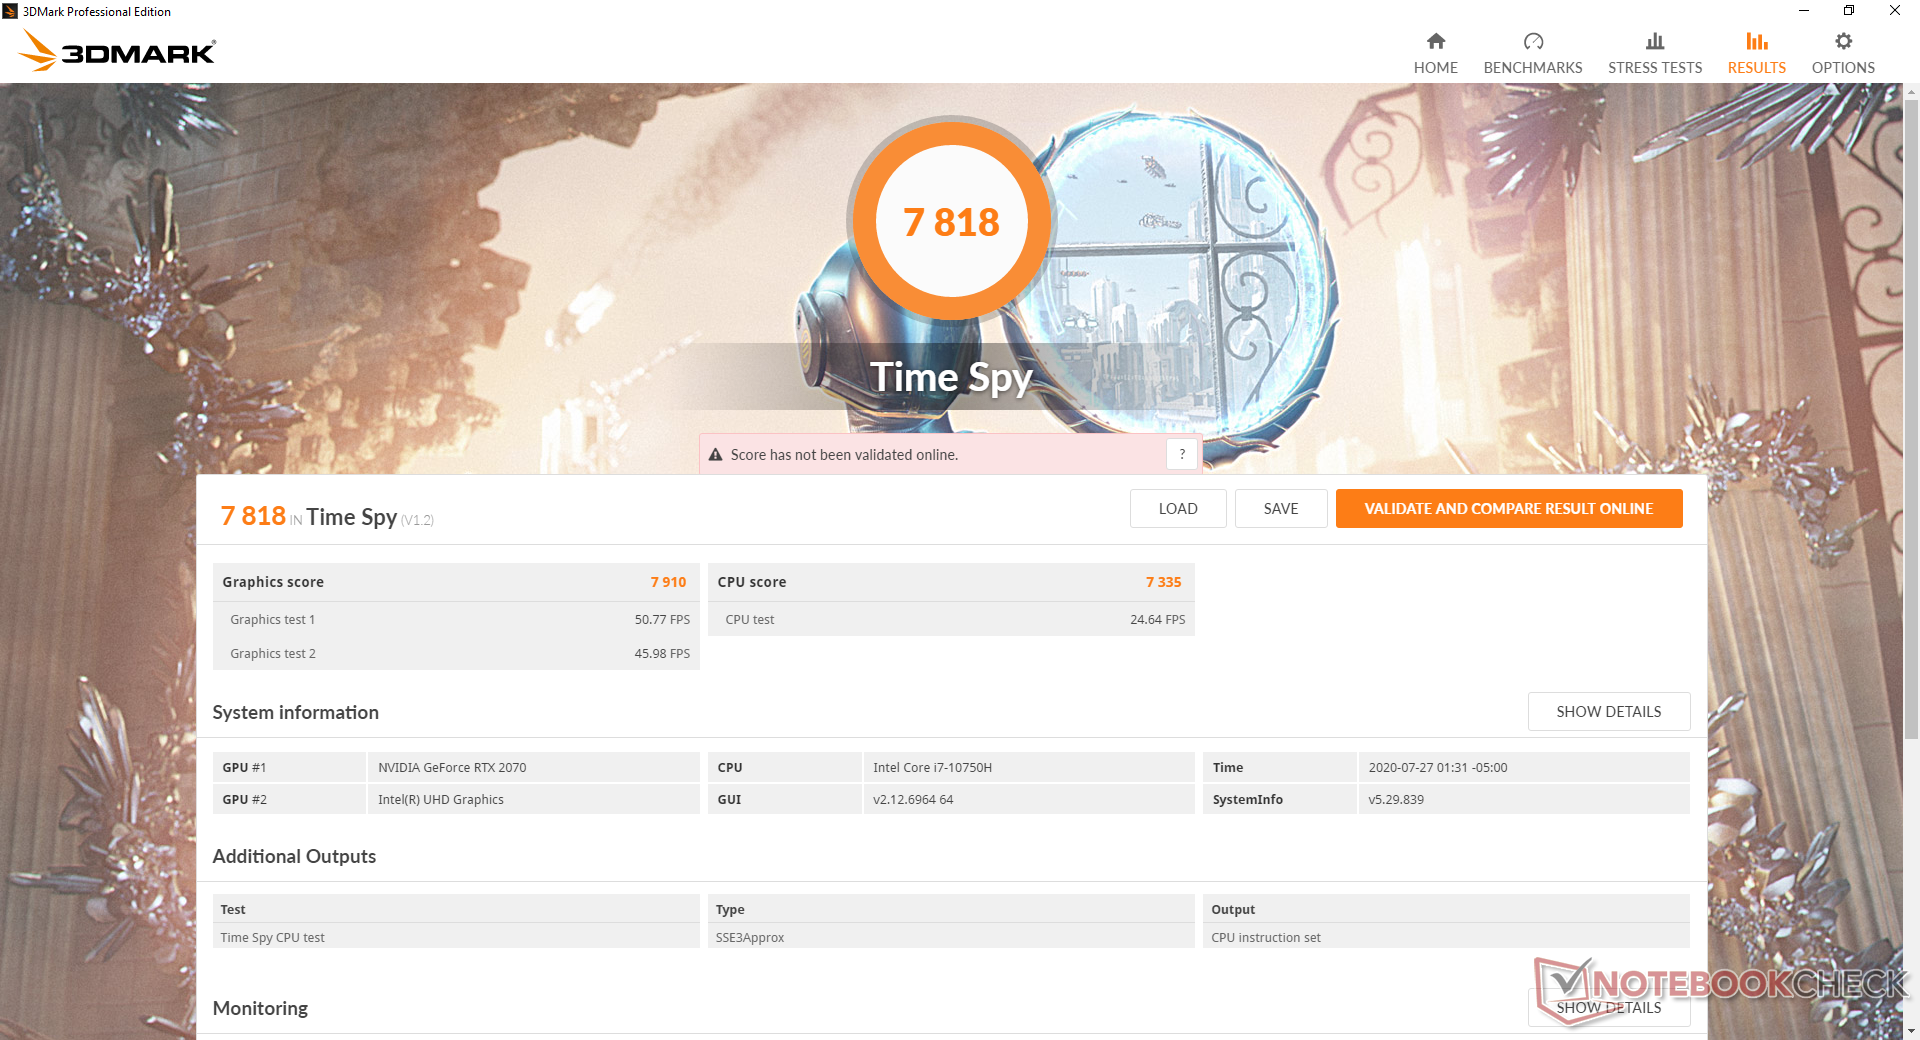
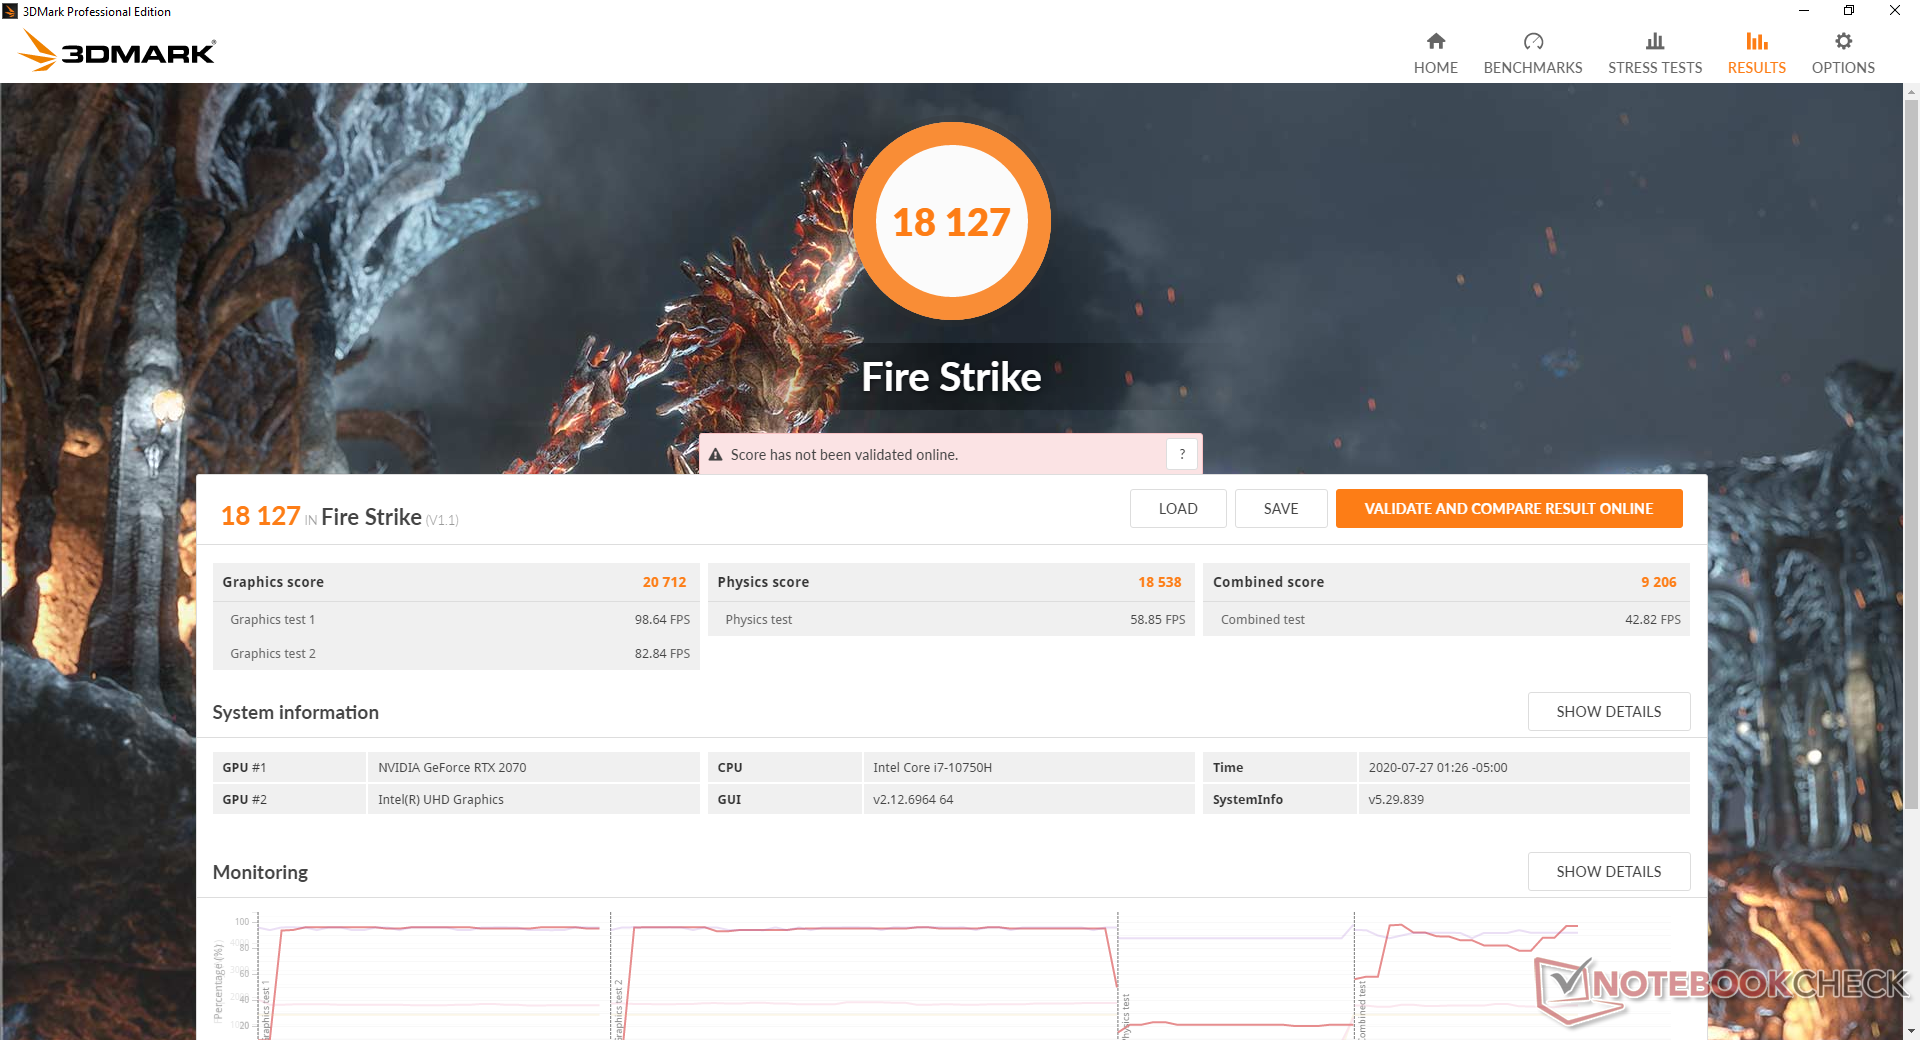
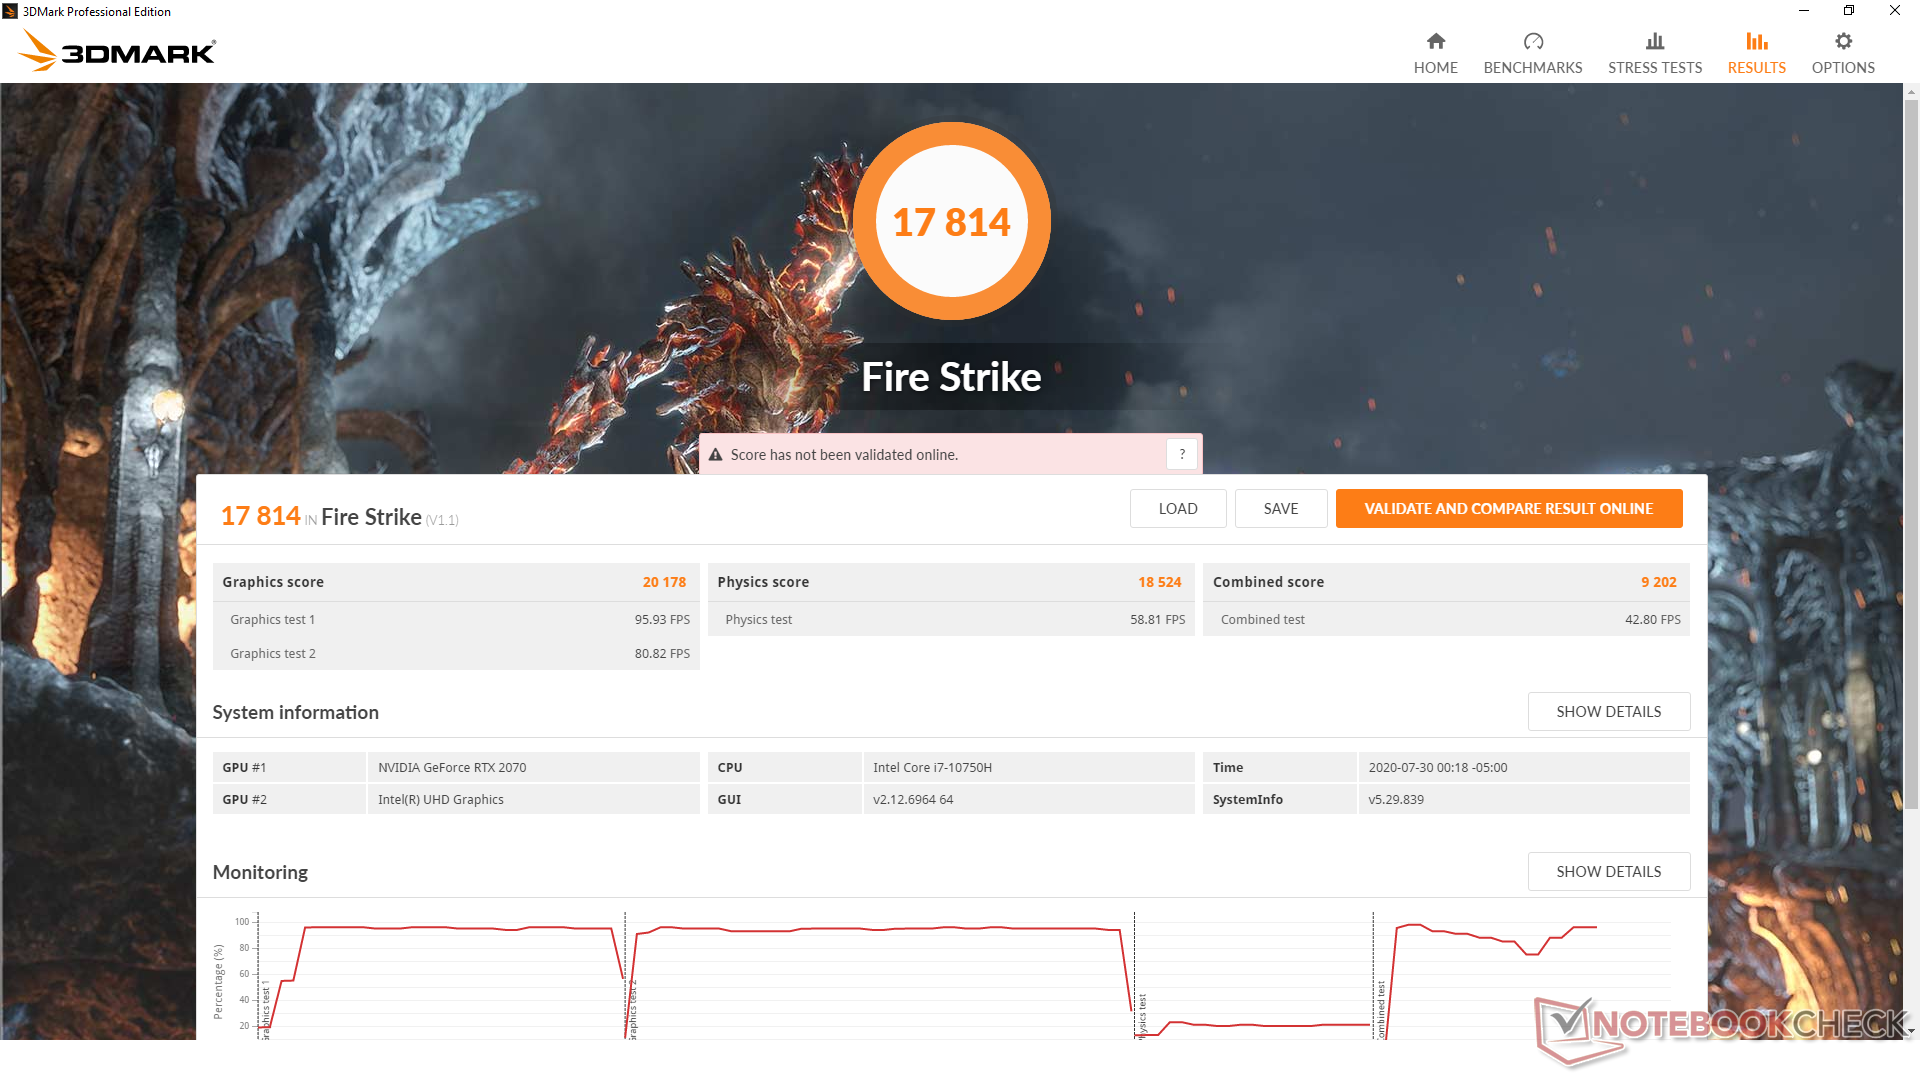
Interestingly, Fire Strike scores between Balanced mode, Performance mode, and Turbo fan mode are very close between them despite the differences in fan noise. If you don't plan on overclocking and don't mind higher core temperatures, then you can game on Balanced mode or Performance mode for quieter fan noise without sacrificing all that much performance.
See our dedicated page on the mobile GeForce RTX 2070 for more technical information and benchmark comparisons.
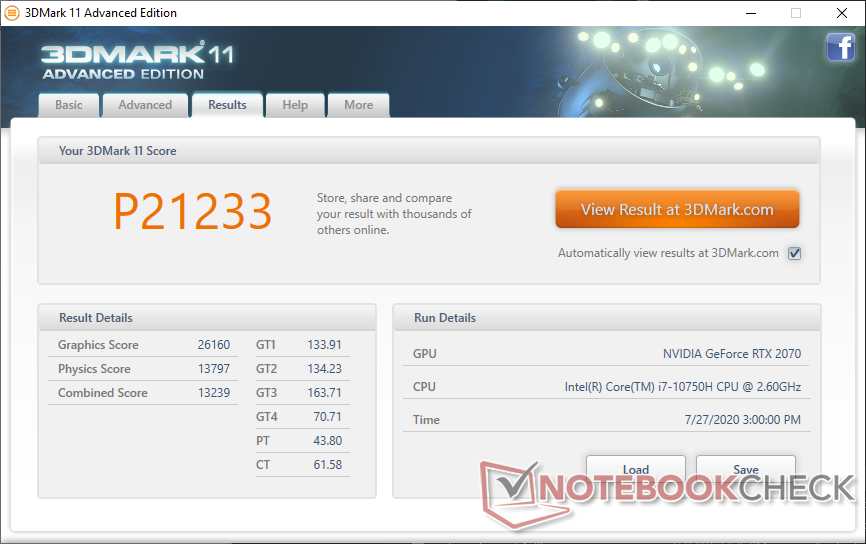

| 3DMark 11 Performance | 21233 points | |
| 3DMark Cloud Gate Standard Score | 41006 points | |
| 3DMark Fire Strike Score | 18127 points | |
| 3DMark Time Spy Score | 7818 points | |
Help | ||
| low | med. | high | ultra | |
|---|---|---|---|---|
| The Witcher 3 (2015) | 356.7 | 249.9 | 149.8 | 81 |
| Dota 2 Reborn (2015) | 142 | 133 | 125 | 120 |
| X-Plane 11.11 (2018) | 96.1 | 87.3 | 71.9 | |
| Shadow of the Tomb Raider (2018) | 138 | 111 | 103 | 93 |
Emissions
System Noise
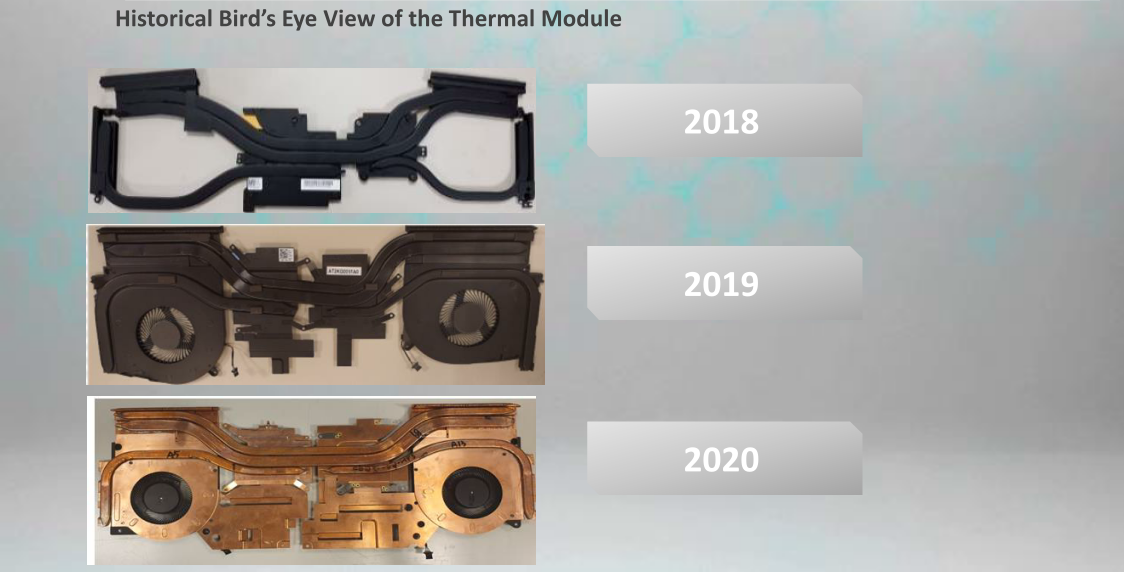
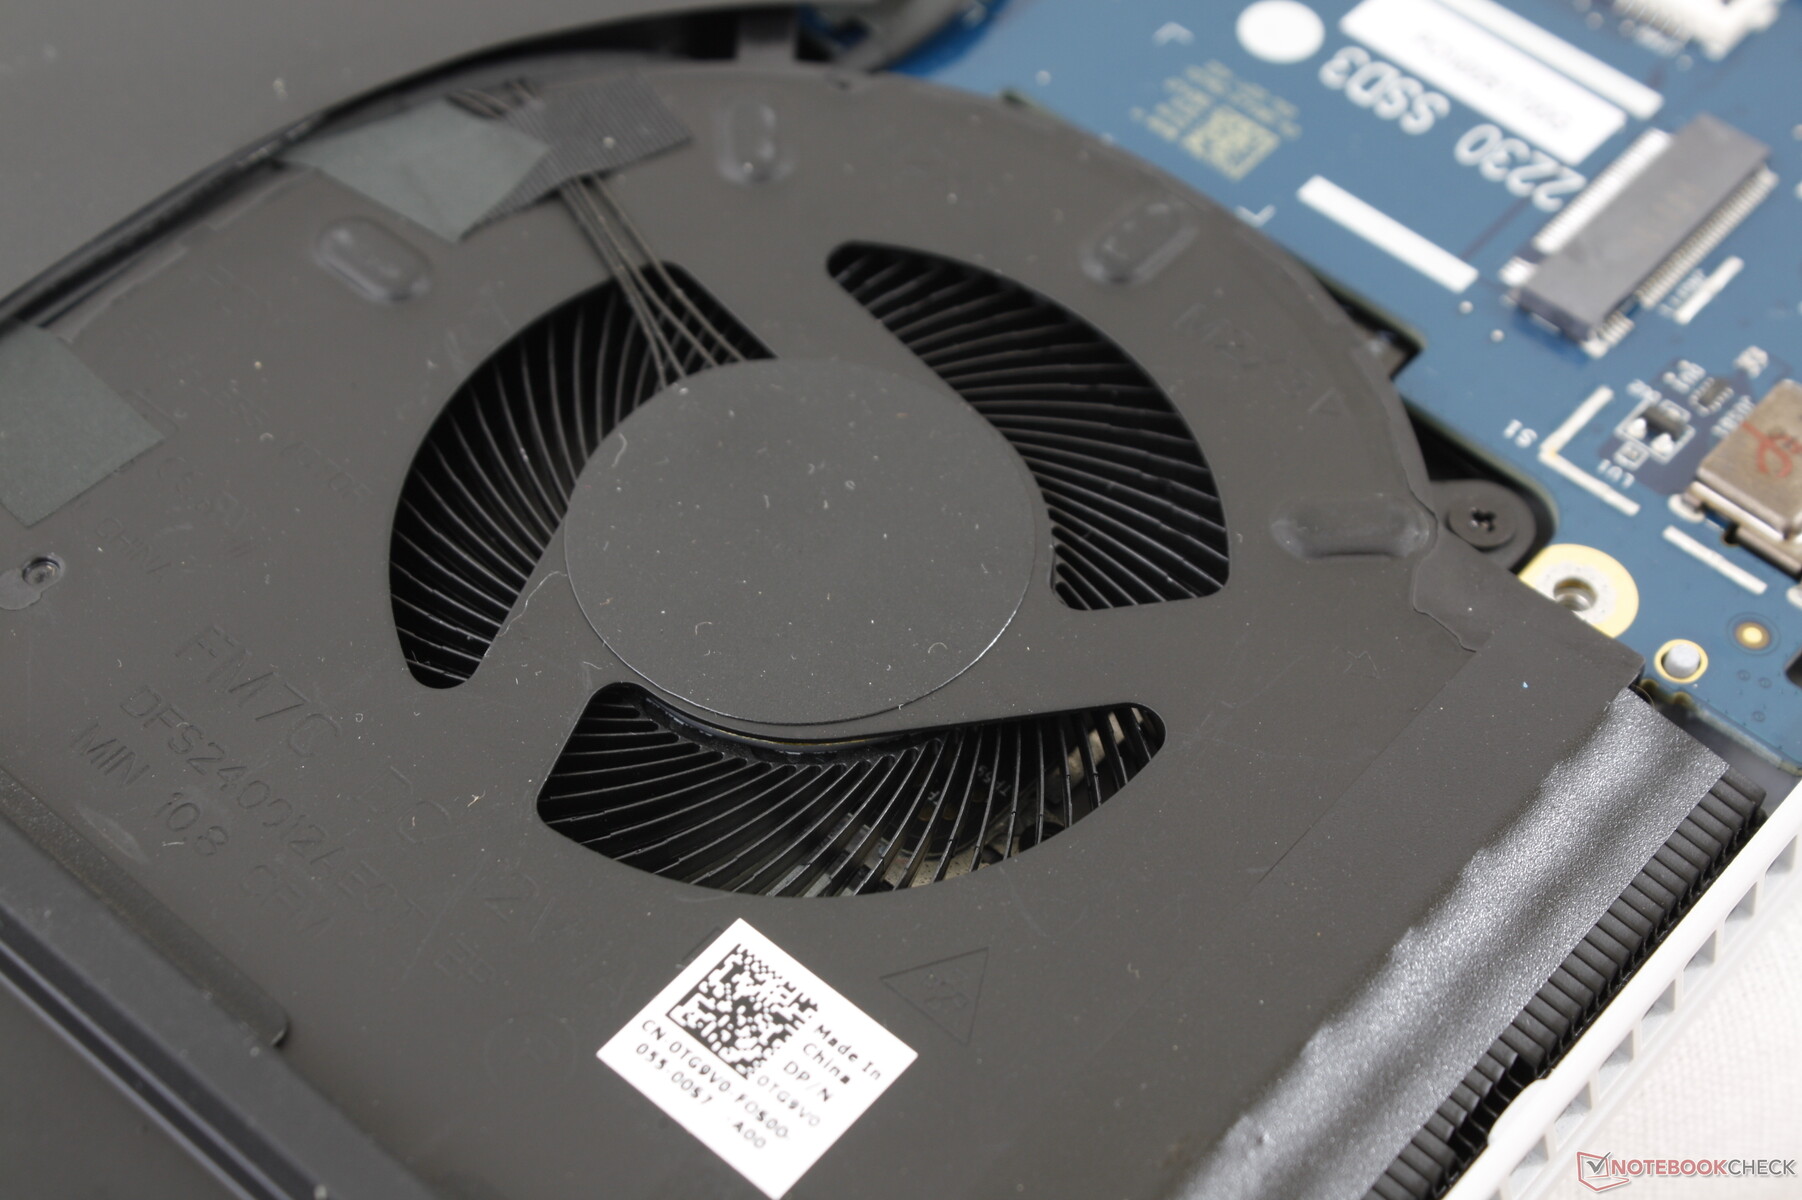
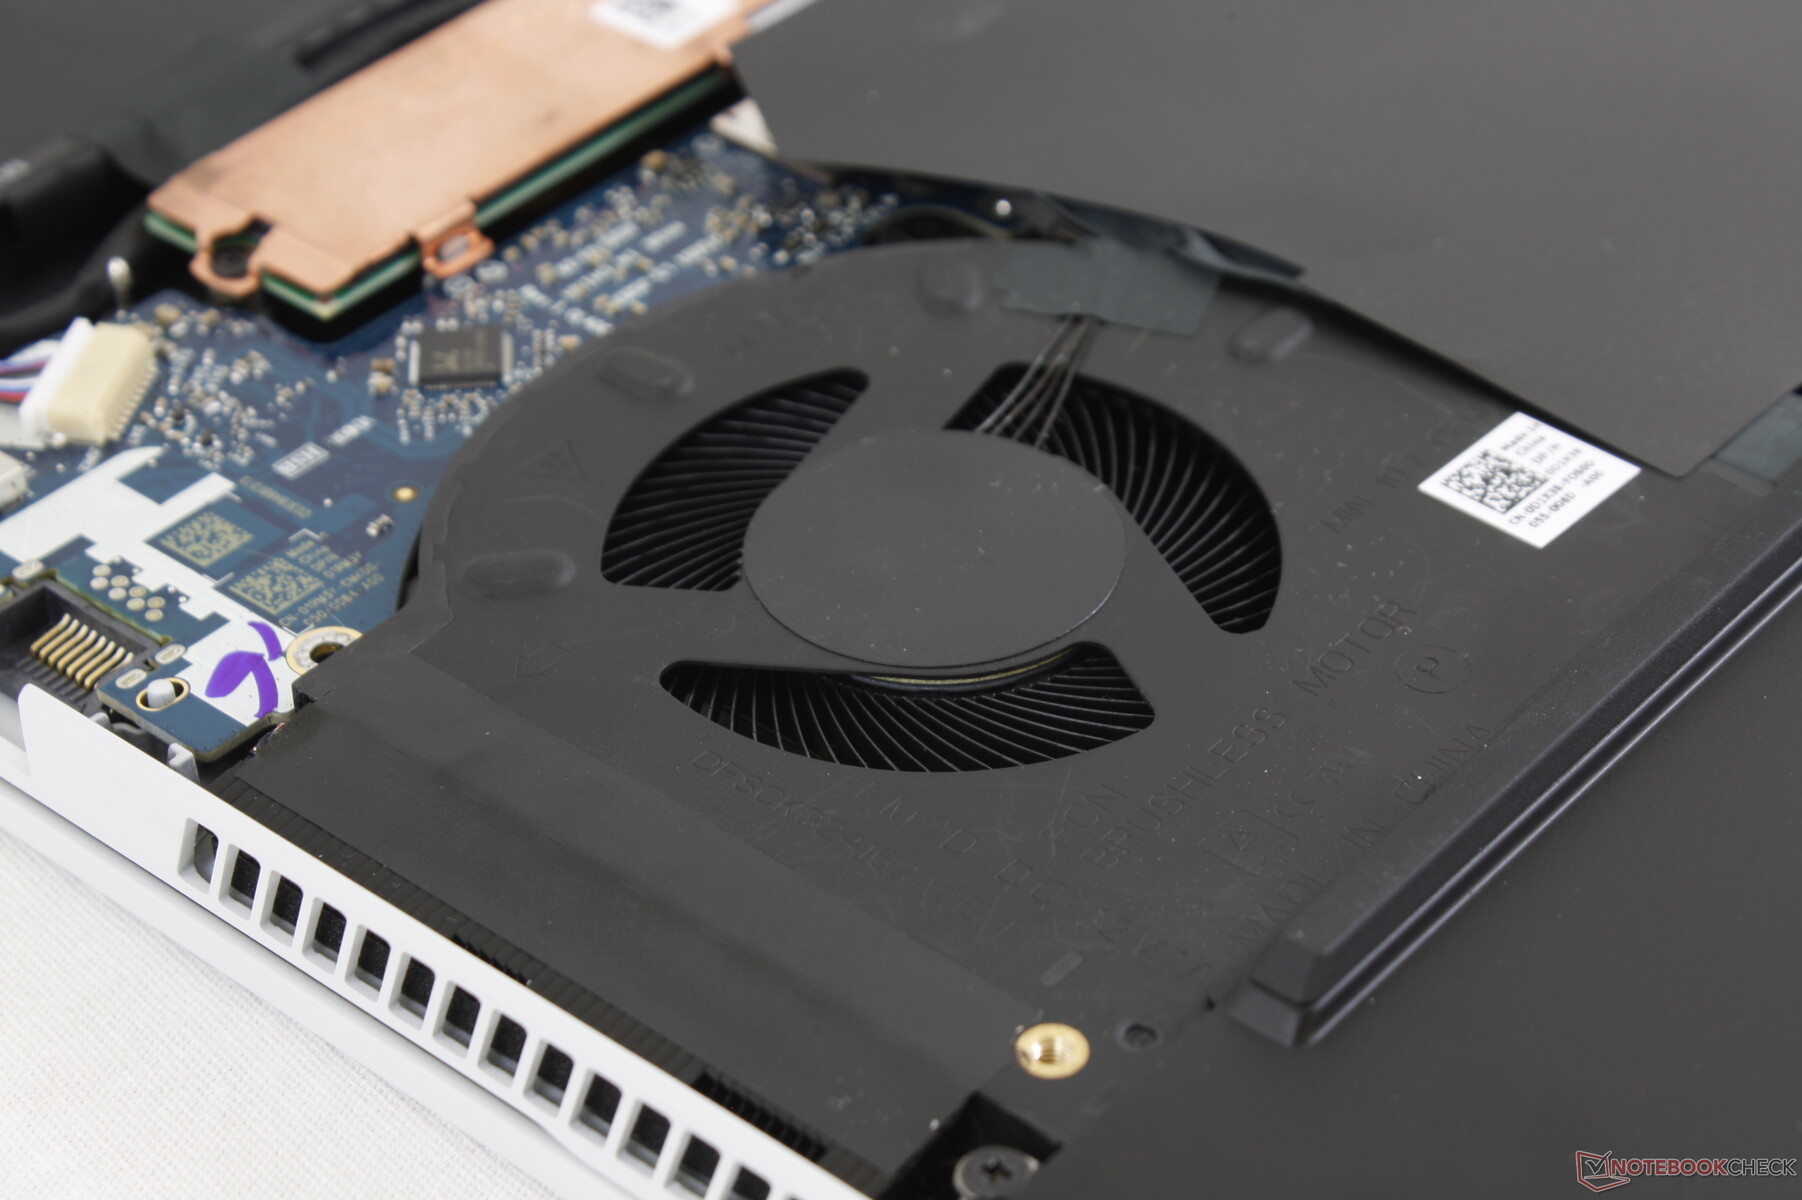
Perhaps the most important change between the m15 R2 and m15 R3 relates to the new Cryo-Tech cooling solution. The m15 R3 utilizes 39 percent more copper and 25 percent more fan blades over the m15 R2 for approximately 10 percent greater CFM air intake. To top it all off, the system now integrates vapor chamber cooling for all Nvidia GPU SKUs which Dell also recently embraced for its XPS 17 series. The vapor chamber applies only to the CPU and not the GPU, however.
While the vapor chamber has a significant impact on CPU temperature that our next section will demonstrate, fan noise and behavior hasn't changed by all that much gen-to-gen. Gaming, for example, still induces a fan noise of ~50 dB(A) much like most other high-performance gaming laptops in this size class. The Alienware is therefore not noticeably quieter or louder despite the cooling changes.
Fan noise will hover up to a maximum of 30.7 db(A) against a background of 26.3 dB(A) when set to Quiet mode while Turbo mode will instantly crank up the fans to their maximum of 59.7 dB(A) no matter the onscreen load. The fans will also pulse more frequently if set to Balanced mode and so it's recommended to run the laptop on Quiet mode if simply browsing or video streaming.
| Alienware m15 R3 P87F GeForce RTX 2070 Mobile, i7-10750H, 2x Micron 2200S 512 GB (RAID 0) | Alienware m15 R2 P87F GeForce RTX 2080 Max-Q, i7-9750H, 2x Toshiba XG6 KXG60ZNV512G (RAID 0) | Razer Blade 15 RZ09-0328 GeForce RTX 2070 Max-Q, i7-10750H, Lite-On CA5-8D512 | Asus Zephyrus S GX502GW GeForce RTX 2070 Mobile, i7-9750H, 2x Intel SSD 660p SSDPEKNW512G8 (RAID 0) | MSI GS66 Stealth 10SFS GeForce RTX 2070 Super Max-Q, i9-10980HK, Samsung SSD PM981 MZVLB1T0HALR | Asus ROG Strix Scar 15 G532LWS GeForce RTX 2070 Super Mobile, i9-10980HK, 2x Intel SSD 660p 1TB SSDPEKNW010T8 (RAID 0) | |
|---|---|---|---|---|---|---|
| Noise | -13% | -3% | -14% | -15% | -10% | |
| off / environment * (dB) | 26.3 | 28.3 -8% | 28.4 -8% | 30 -14% | 30 -14% | 26.5 -1% |
| Idle Minimum * (dB) | 26.7 | 28.5 -7% | 28.4 -6% | 31 -16% | 32 -20% | 27.1 -1% |
| Idle Average * (dB) | 26.7 | 28.5 -7% | 28.4 -6% | 33 -24% | 34 -27% | 32.2 -21% |
| Idle Maximum * (dB) | 30.7 | 49 -60% | 31.7 -3% | 38 -24% | 39 -27% | 34 -11% |
| Load Average * (dB) | 40.2 | 49 -22% | 47.7 -19% | 50 -24% | 53 -32% | 52.4 -30% |
| Witcher 3 ultra * (dB) | 51 | 49 4% | 47.5 7% | 53 -4% | 48 6% | 57.5 -13% |
| Load Maximum * (dB) | 59.7 | 55 8% | 49.5 17% | 56 6% | 53 11% | 57.5 4% |
* ... smaller is better
Noise level
| Idle |
| 26.7 / 26.7 / 30.7 dB(A) |
| Load |
| 40.2 / 59.7 dB(A) |
 | ||
30 dB silent 40 dB(A) audible 50 dB(A) loud |
||
min: | ||
Temperature
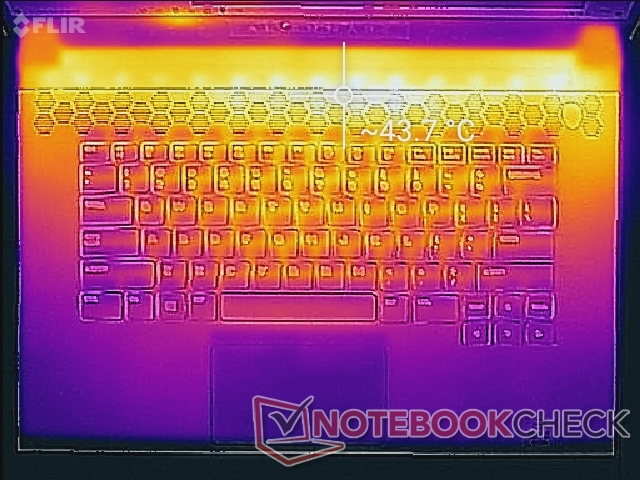
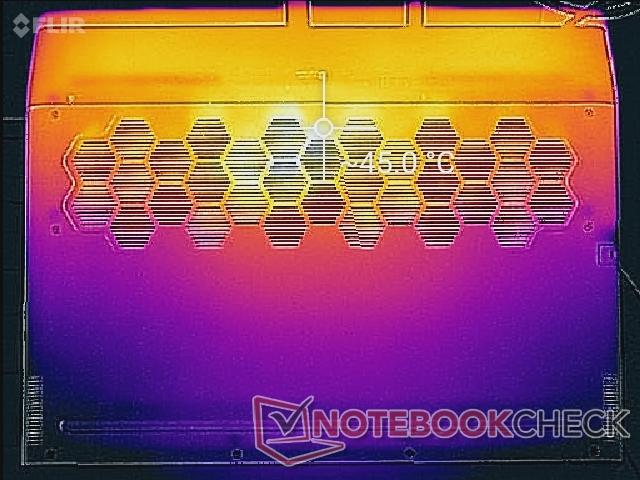
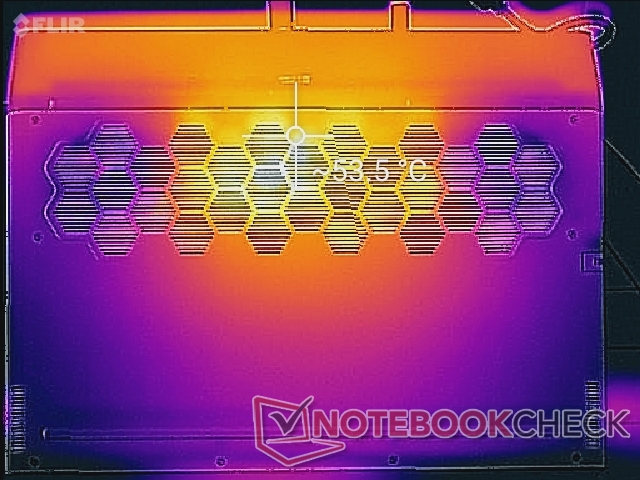
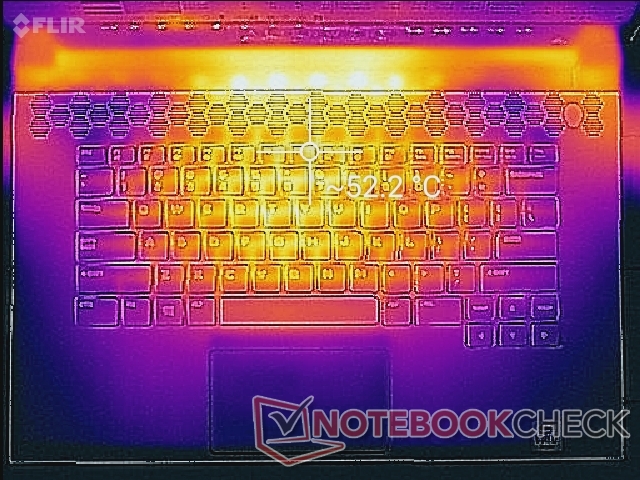
Surface temperatures when idling are very warm with hot spots reaching 43 C to 45 C likely because the fans are completely idle at this state. Thus, the price to pay for a silent browsing or video streaming experience is a warmer laptop.
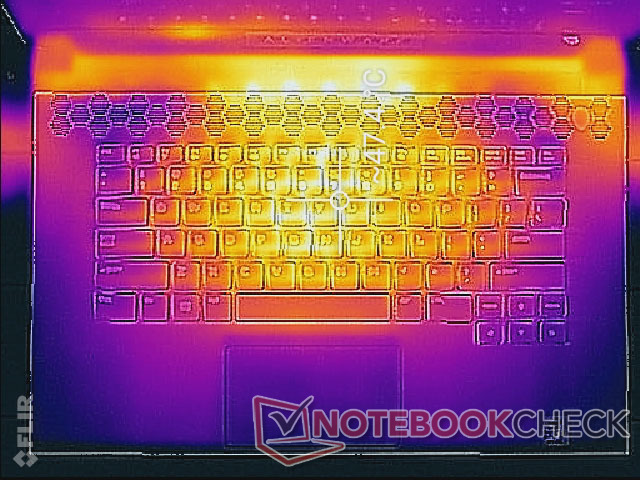
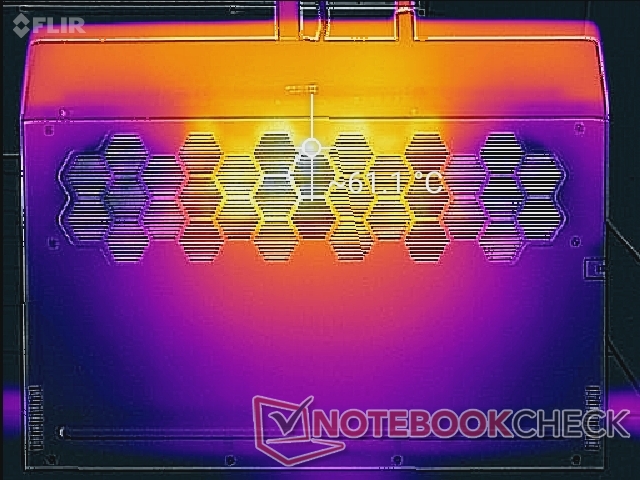
When gaming or running extreme loads, surface temperatures can reach over 50 C near the center of the keyboard similar to what we recorded on the MSI GS66. The WASD keys become warm as well but not enough to be uncomfortable to the touch.
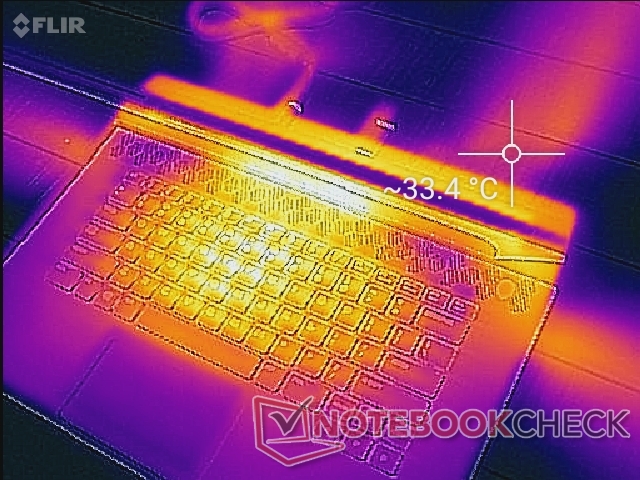
(-) The maximum temperature on the upper side is 55.8 °C / 132 F, compared to the average of 40.4 °C / 105 F, ranging from 21.2 to 68.8 °C for the class Gaming.
(-) The bottom heats up to a maximum of 62 °C / 144 F, compared to the average of 43.2 °C / 110 F
(±) In idle usage, the average temperature for the upper side is 35.4 °C / 96 F, compared to the device average of 33.9 °C / 93 F.
(±) Playing The Witcher 3, the average temperature for the upper side is 35.8 °C / 96 F, compared to the device average of 33.9 °C / 93 F.
(+) The palmrests and touchpad are cooler than skin temperature with a maximum of 29.4 °C / 84.9 F and are therefore cool to the touch.
(±) The average temperature of the palmrest area of similar devices was 28.8 °C / 83.8 F (-0.6 °C / -1.1 F).
Stress Test
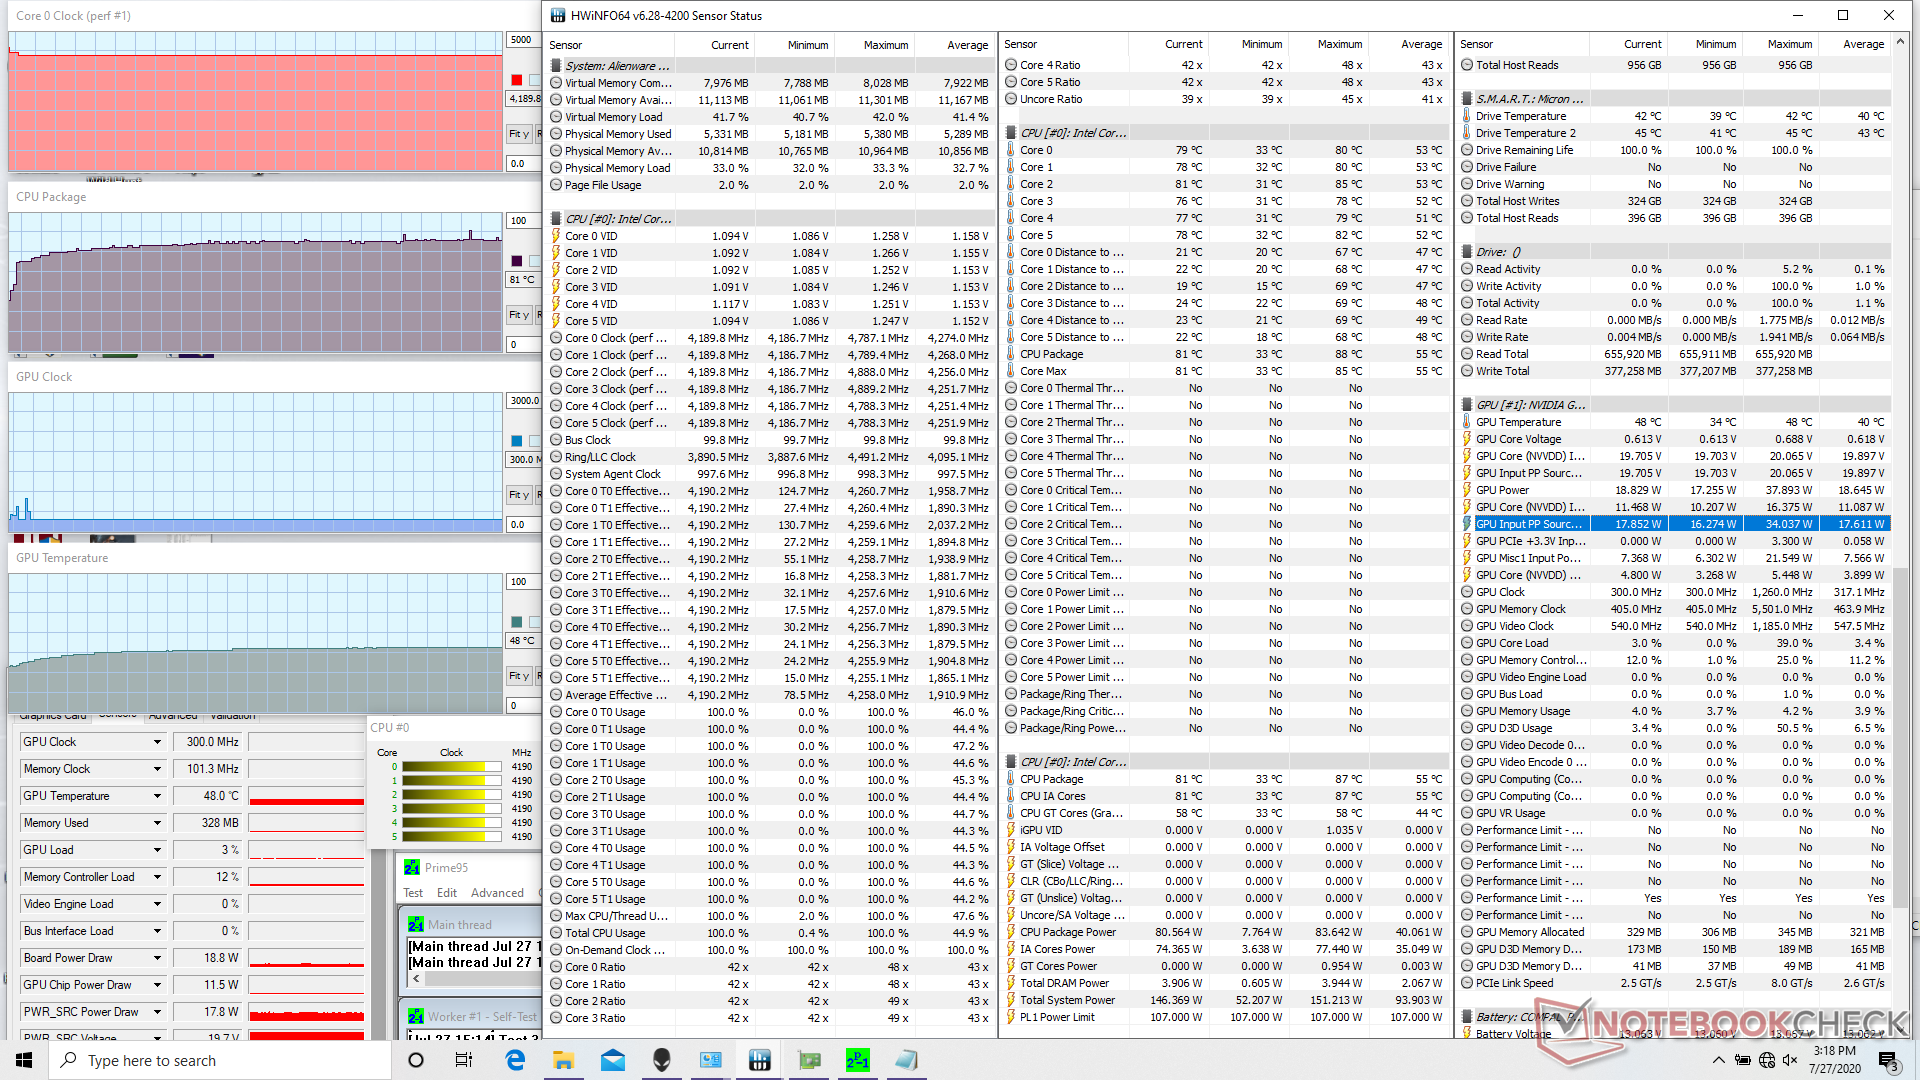
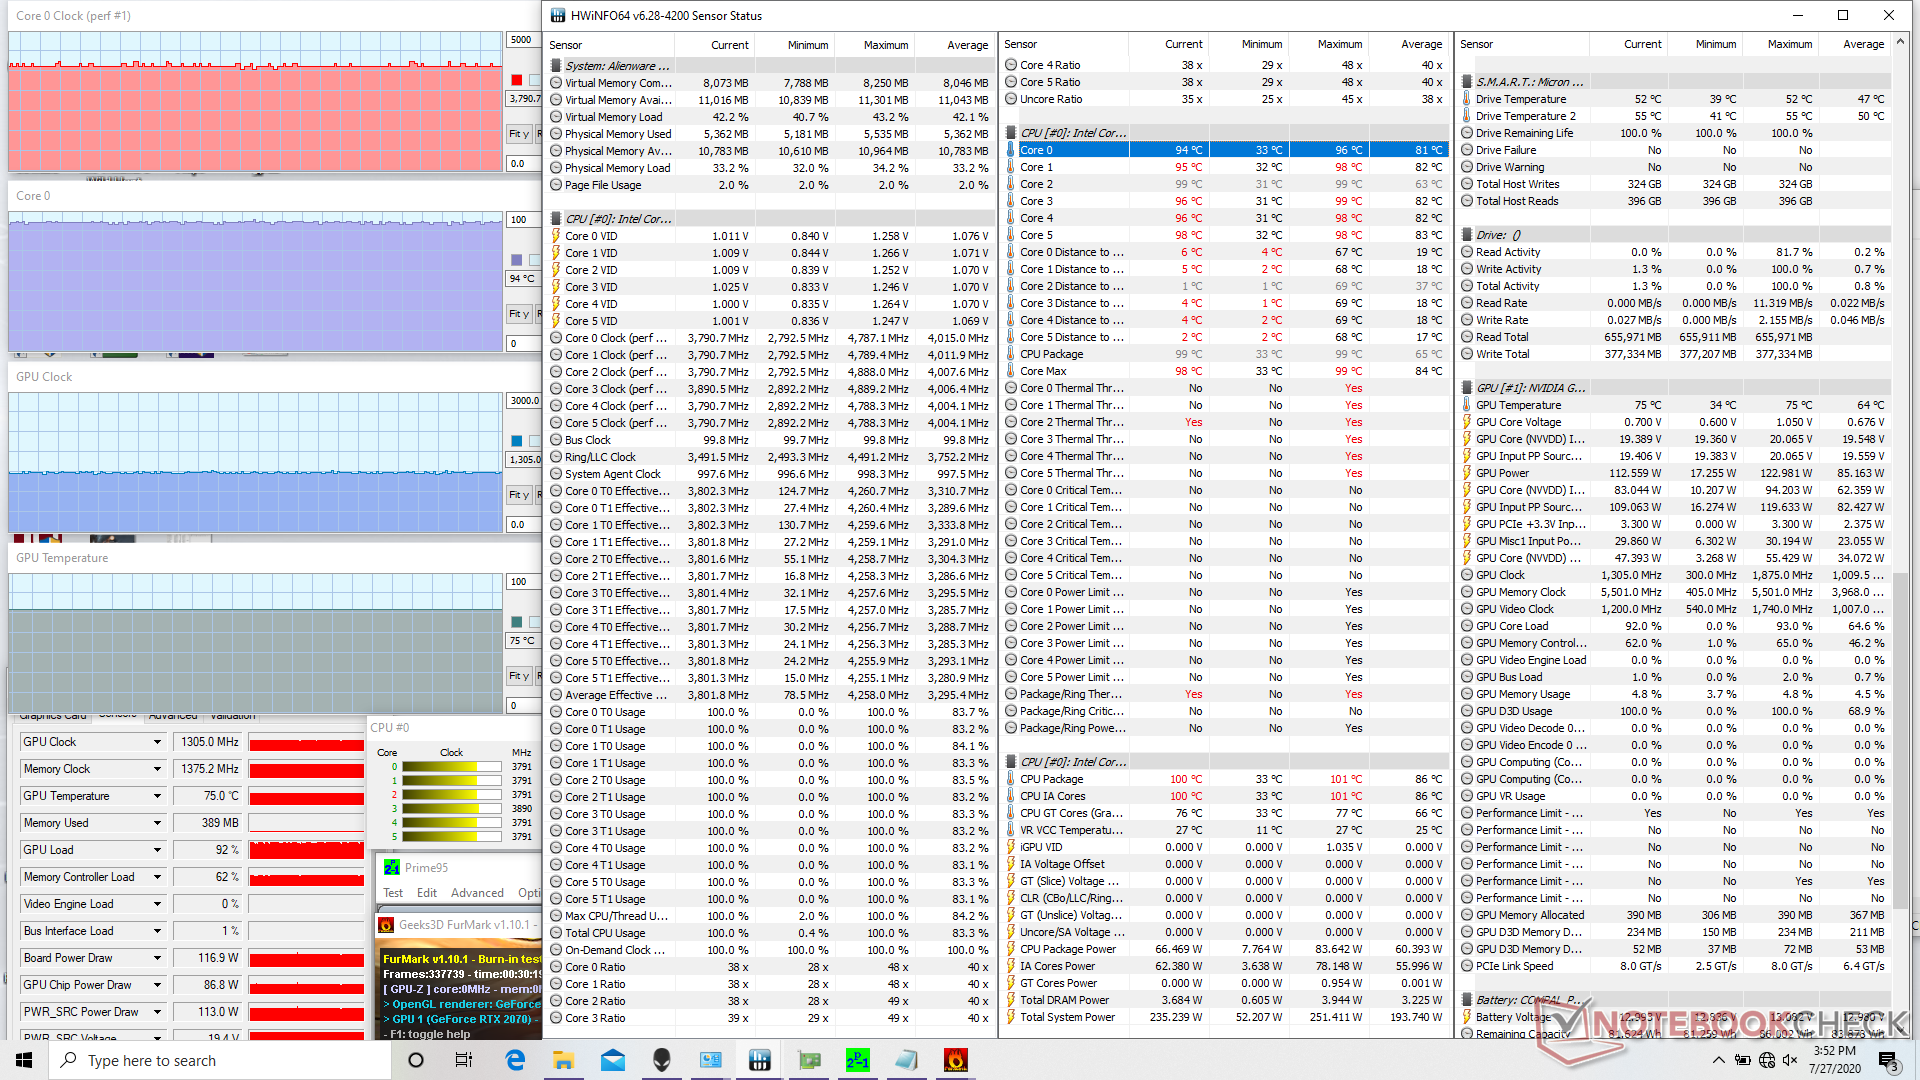
When running Prime95, clock rates would spike to 4.4 GHz for a couple of seconds before stabilizing at 4.2 GHz and at a core temperature of 81 C. Running both Prime95 and FurMark will cause the CPU to run at 99 C much like on most other Alienware and XPS 15/17 systems. The high core temperature is the price to pay for the excellent CPU performance sustainability we mentioned above.
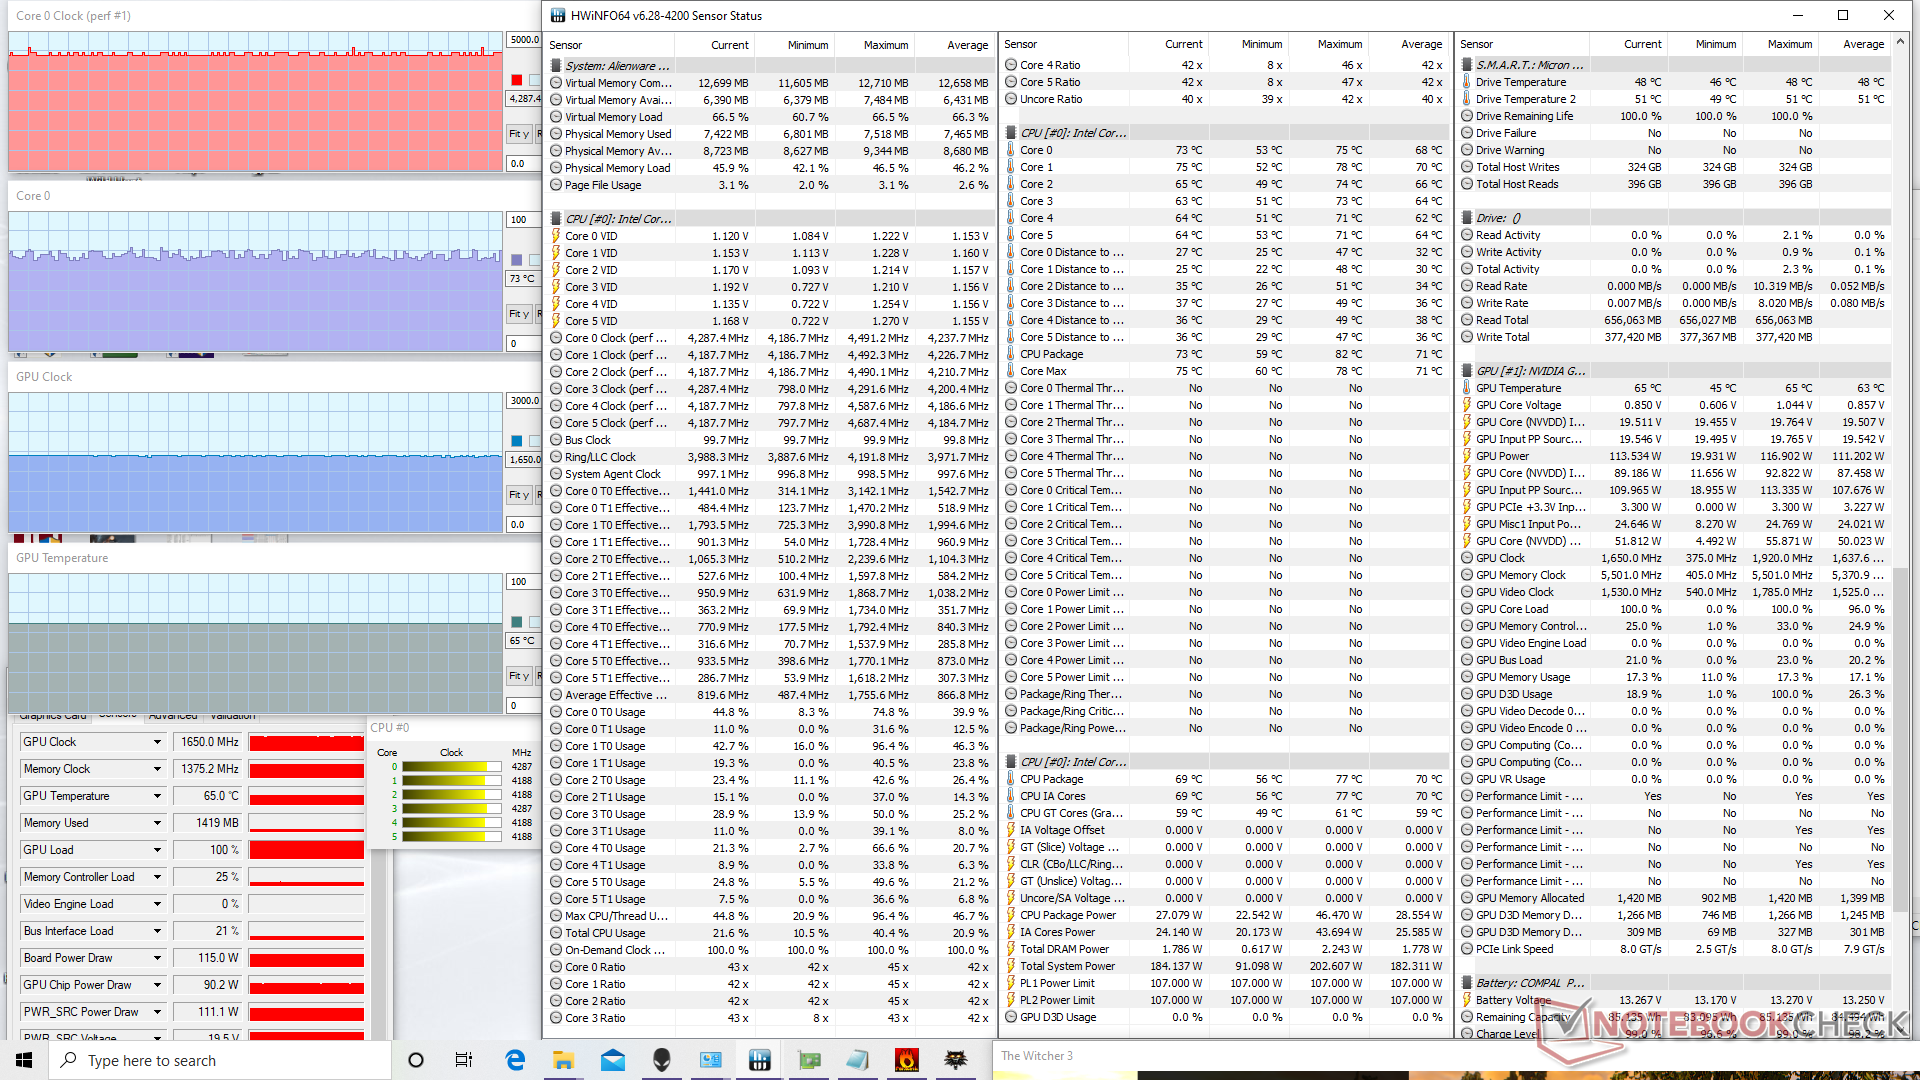
Running Witcher 3 in Turbo fan mode is more representative of real-world gaming loads. The CPU and GPU would stabilize at 73 C and 65 C, respectively, compared to 96 C and 79 C on the cheaper MSI GL65 equipped with the same CPU and GPU. If the Alienware is running on Balanced mode, CPU and GPU temperatures would stabilize at warmer 80 C and 74 C readings, respectively, while clock rates remain almost the same. Thus, Turbo fan mode can provide additional headroom for end-user GPU overclocking.
Results are still significantly better than what we recorded on last year's m15 R2 where the CPU and GPU would stabilize at 99 C and 70 C, respectively, even when Turbo fan mode is active. Dell's new cooling solution for the m15 R3 is likely responsible for the tangible improvements.
Running on battery power will limit graphics performance. A Fire Strike run on batteries would return Physics and Graphics scores of 18534 and 9994 points, respectively, compared to 18538 and 20712 points when on mains.
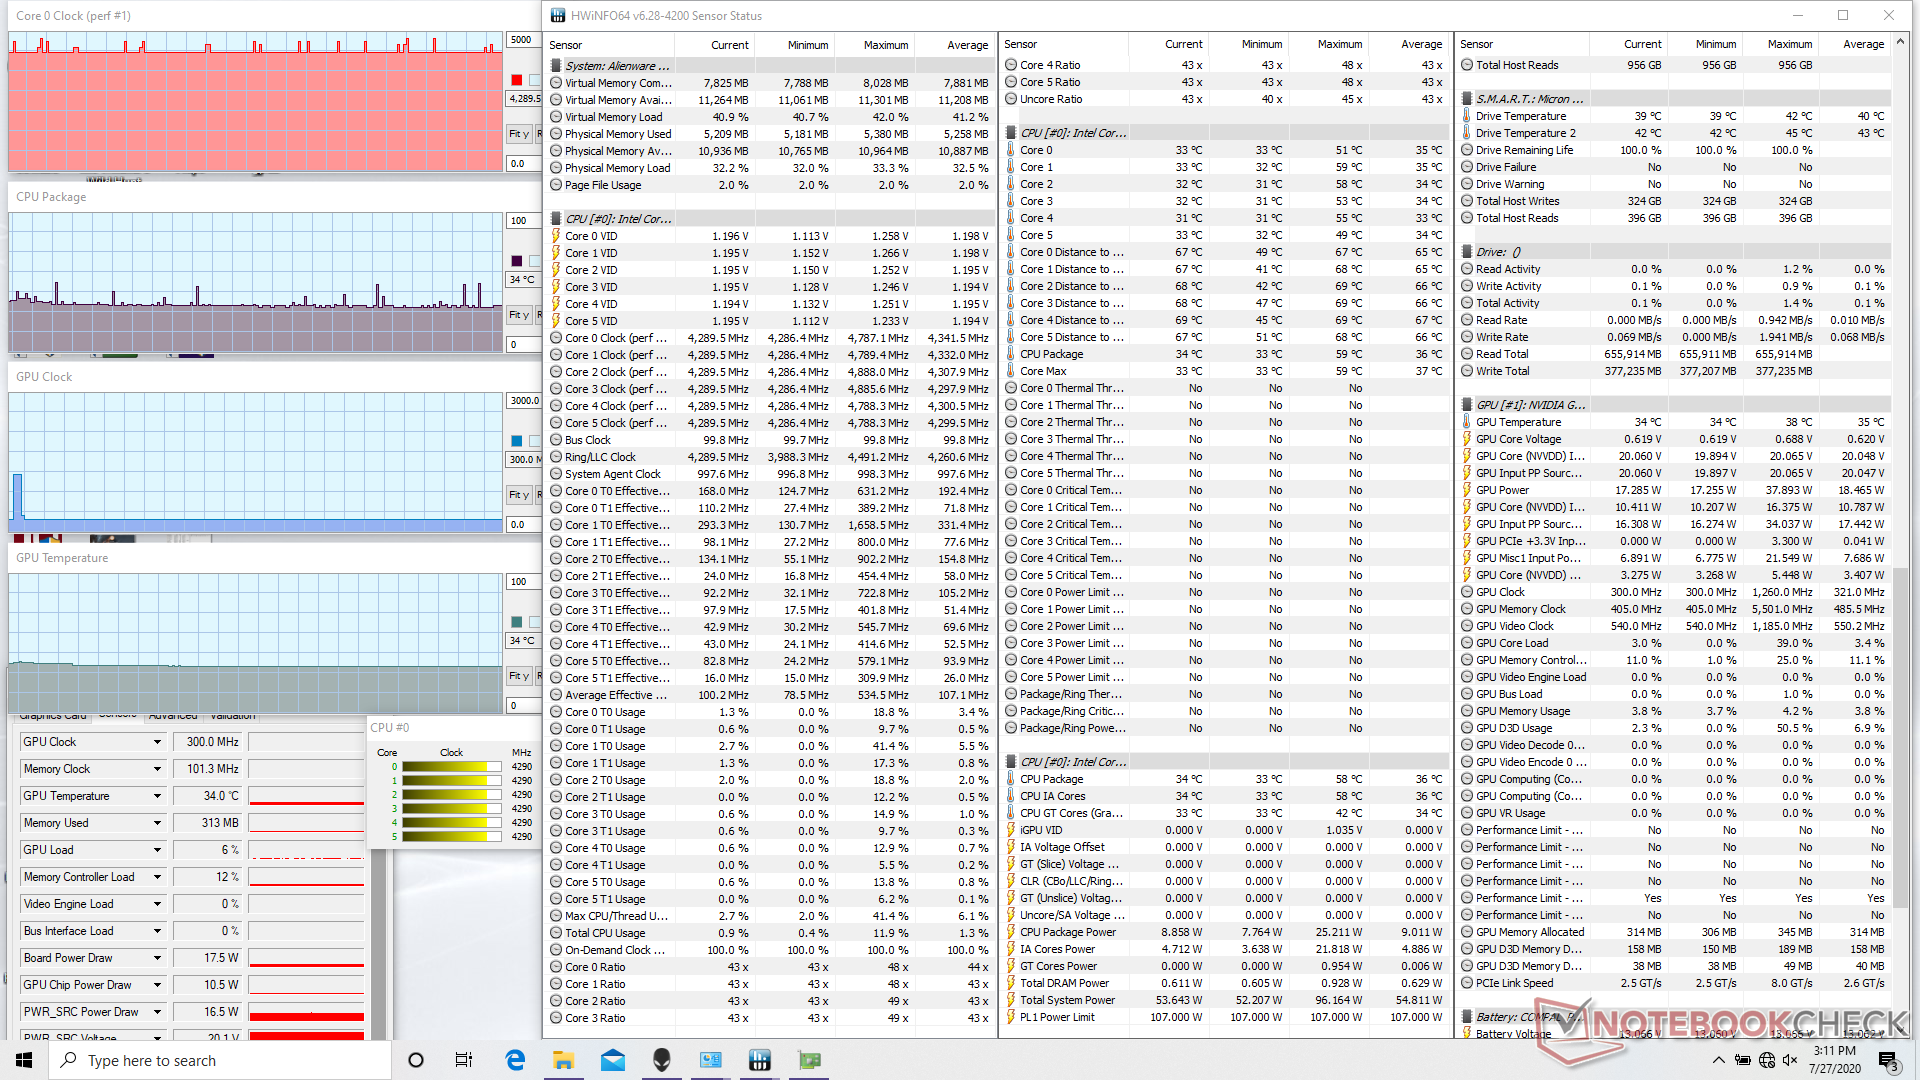
| CPU Clock (GHz) | GPU Clock (MHz) | Average CPU Temperature (°C) | Average GPU Temperature (°C) | |
| System Idle (Turbo fan off) | -- | -- | 48 | 50 |
| System Idle (Turbo fan on) | -- | -- | 34 | 34 |
| Prime95 Stress (Turbo fan on) | 4.2 | -- | 81 | 48 |
| Prime95 + FurMark Stress (Turbo fan on) | 3.8 | 1305 | 94 | 75 |
| Witcher 3 Stress (Turbo fan on) | 4.2 - 4.3 | 1650 | ~73 | 65 |
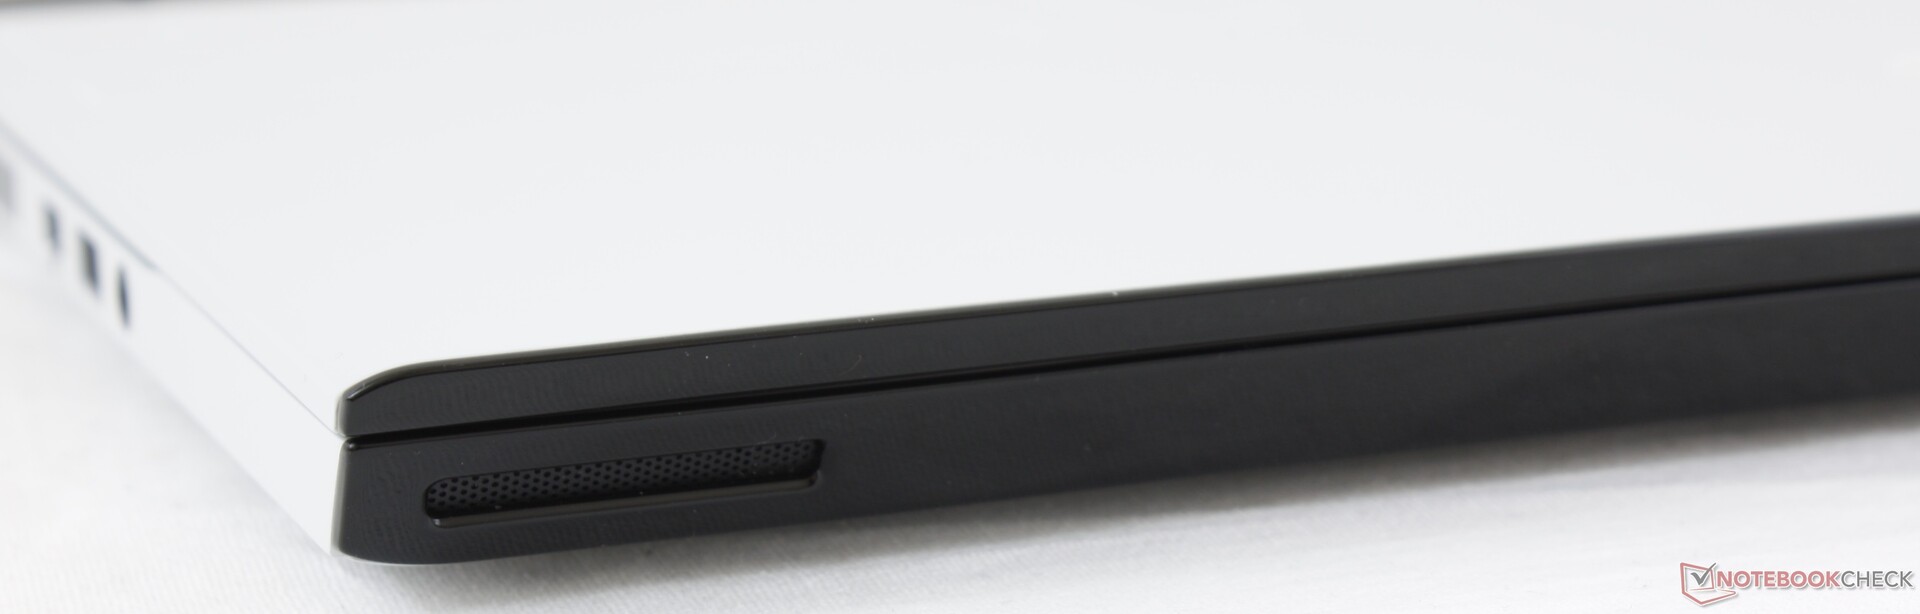
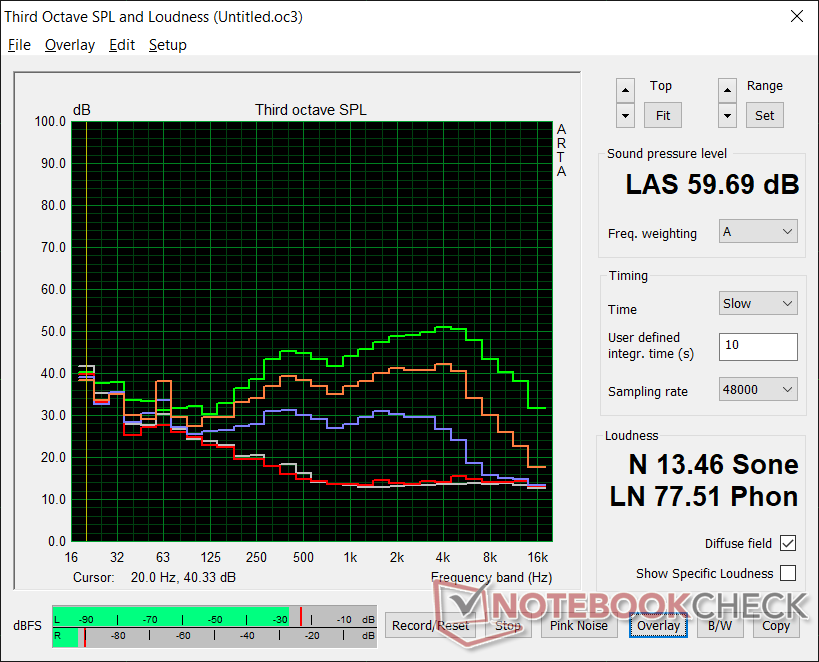
Speakers


Alienware m15 R3 P87F audio analysis
(+) | speakers can play relatively loud (89.5 dB)
Bass 100 - 315 Hz
(-) | nearly no bass - on average 20.6% lower than median
(±) | linearity of bass is average (8.1% delta to prev. frequency)
Mids 400 - 2000 Hz
(±) | reduced mids - on average 6.6% lower than median
(+) | mids are linear (6.7% delta to prev. frequency)
Highs 2 - 16 kHz
(±) | higher highs - on average 5% higher than median
(±) | linearity of highs is average (7.5% delta to prev. frequency)
Overall 100 - 16.000 Hz
(±) | linearity of overall sound is average (16.5% difference to median)
Compared to same class
» 42% of all tested devices in this class were better, 7% similar, 51% worse
» The best had a delta of 6%, average was 18%, worst was 132%
Compared to all devices tested
» 28% of all tested devices were better, 6% similar, 66% worse
» The best had a delta of 4%, average was 24%, worst was 134%
Apple MacBook 12 (Early 2016) 1.1 GHz audio analysis
(+) | speakers can play relatively loud (83.6 dB)
Bass 100 - 315 Hz
(±) | reduced bass - on average 11.3% lower than median
(±) | linearity of bass is average (14.2% delta to prev. frequency)
Mids 400 - 2000 Hz
(+) | balanced mids - only 2.4% away from median
(+) | mids are linear (5.5% delta to prev. frequency)
Highs 2 - 16 kHz
(+) | balanced highs - only 2% away from median
(+) | highs are linear (4.5% delta to prev. frequency)
Overall 100 - 16.000 Hz
(+) | overall sound is linear (10.2% difference to median)
Compared to same class
» 7% of all tested devices in this class were better, 2% similar, 91% worse
» The best had a delta of 5%, average was 18%, worst was 53%
Compared to all devices tested
» 5% of all tested devices were better, 1% similar, 94% worse
» The best had a delta of 4%, average was 24%, worst was 134%
Energy Management
Power Consumption
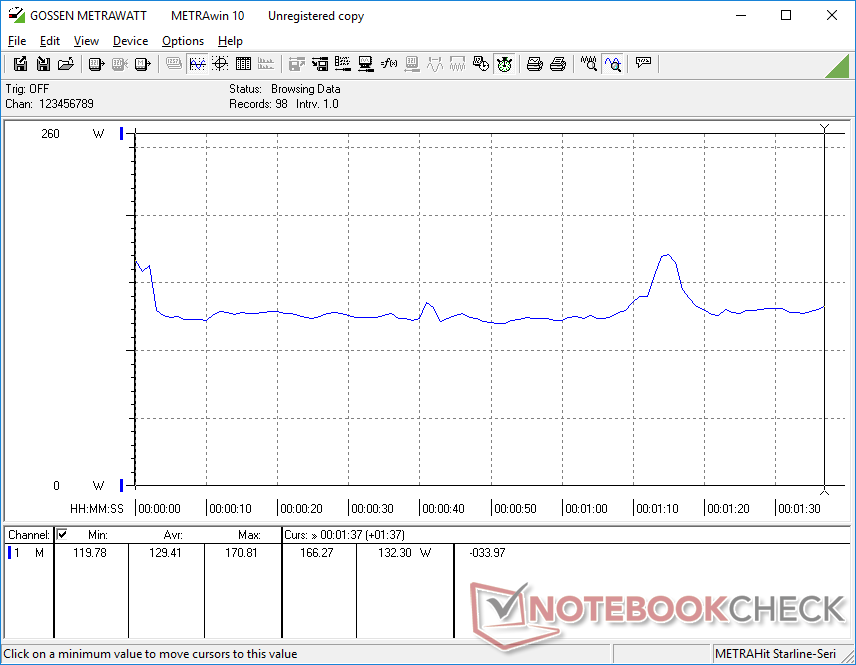
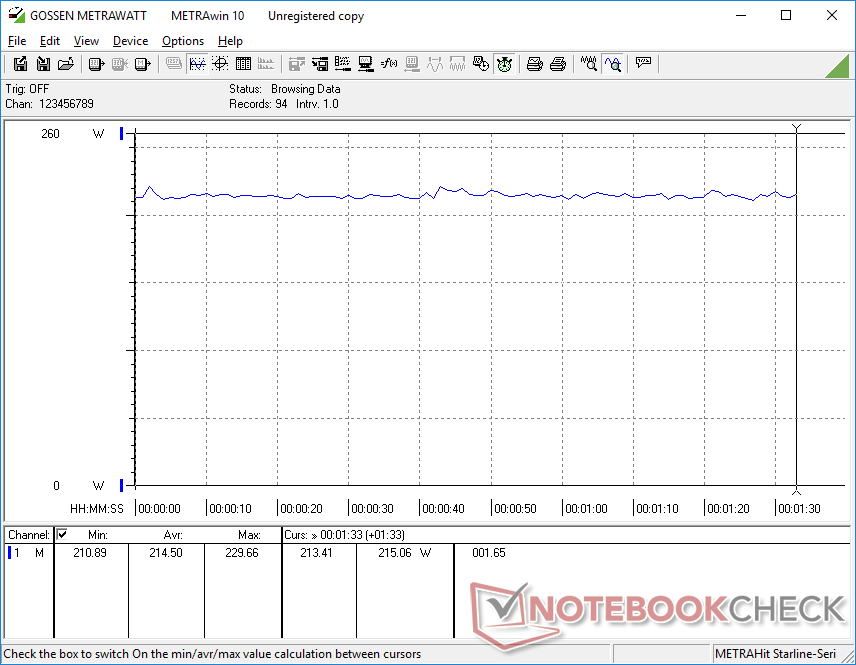
The Alienware is a very power-hungry machine — perhaps more than it needs to be. When gaming, the system draws 215 W compared to only 155 W on the MSI GS66 equipped with the GeForce RTX 2070 Super Max-Q or 185 W on the MSI GP65 with the exact same Core i7 and RTX 2070 GPU. Keep in mind that the RTX 2070 Super Max-Q is essentially on par with our standard mobile RTX 2070 in terms of graphics horsepower.
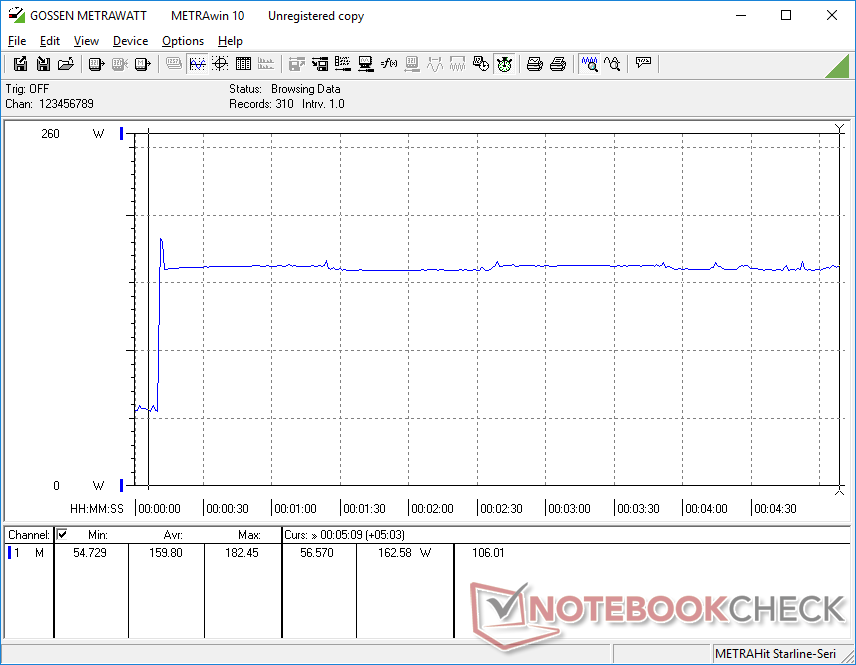
Power consumption when idling on desktop is also very high at 34 W to 59 W which partly explains the very warm idling surface temperatures we recorded above.
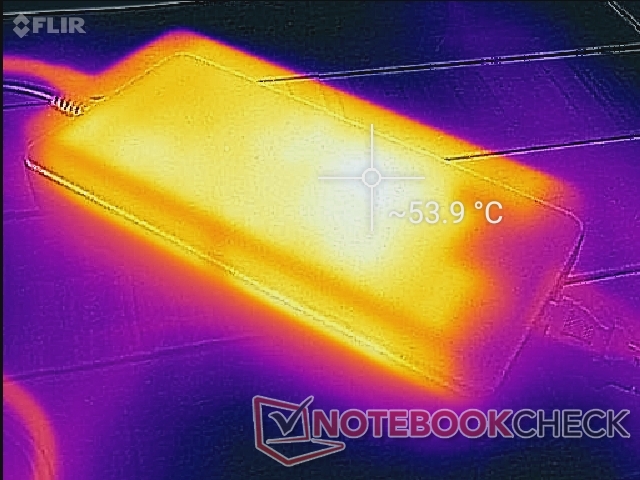
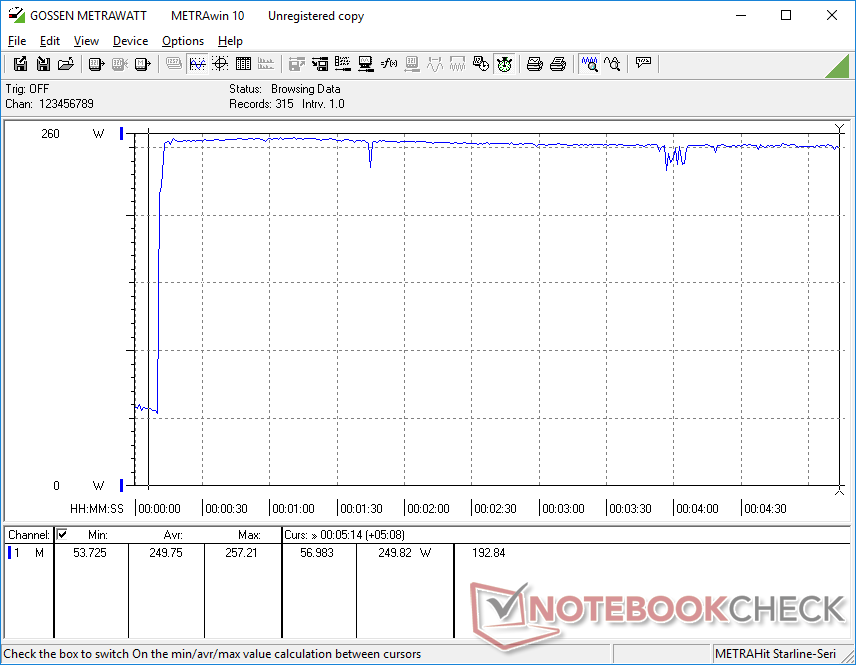
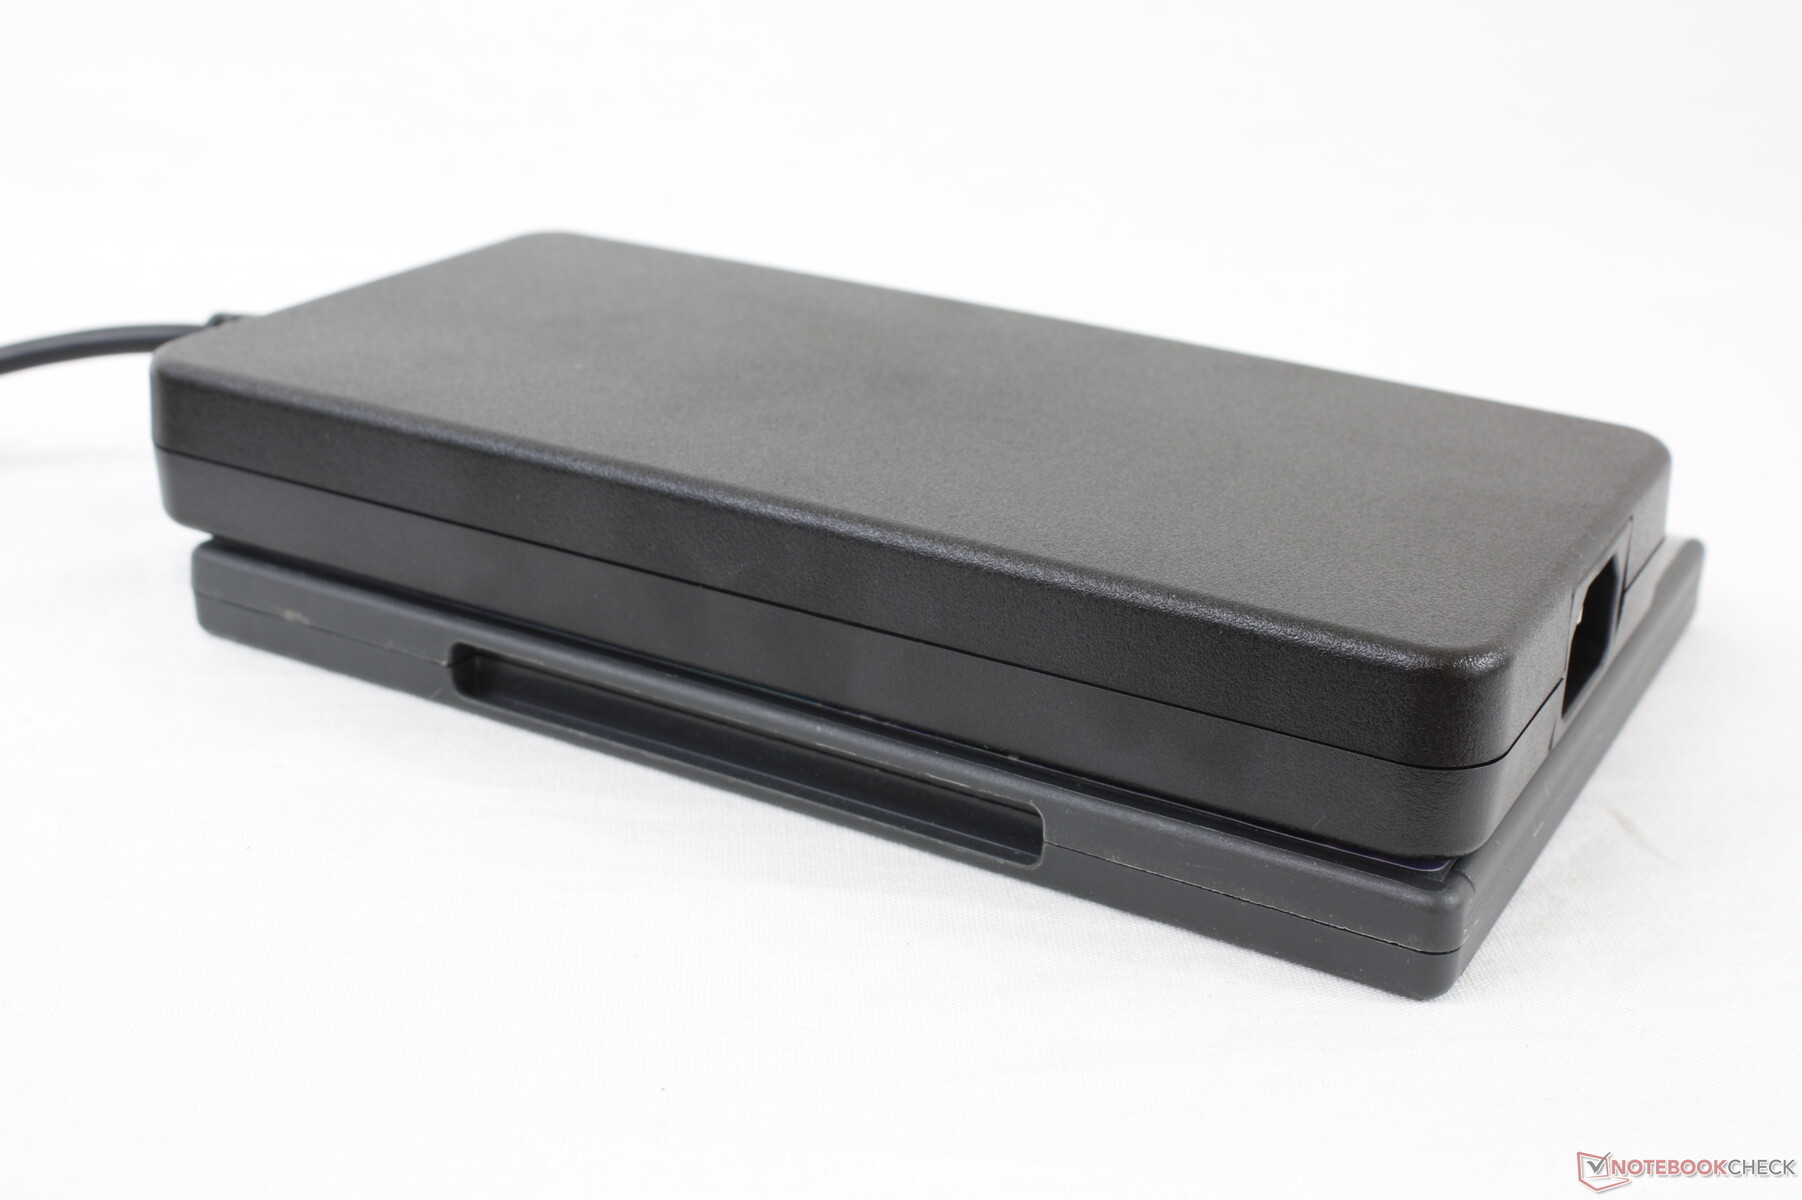
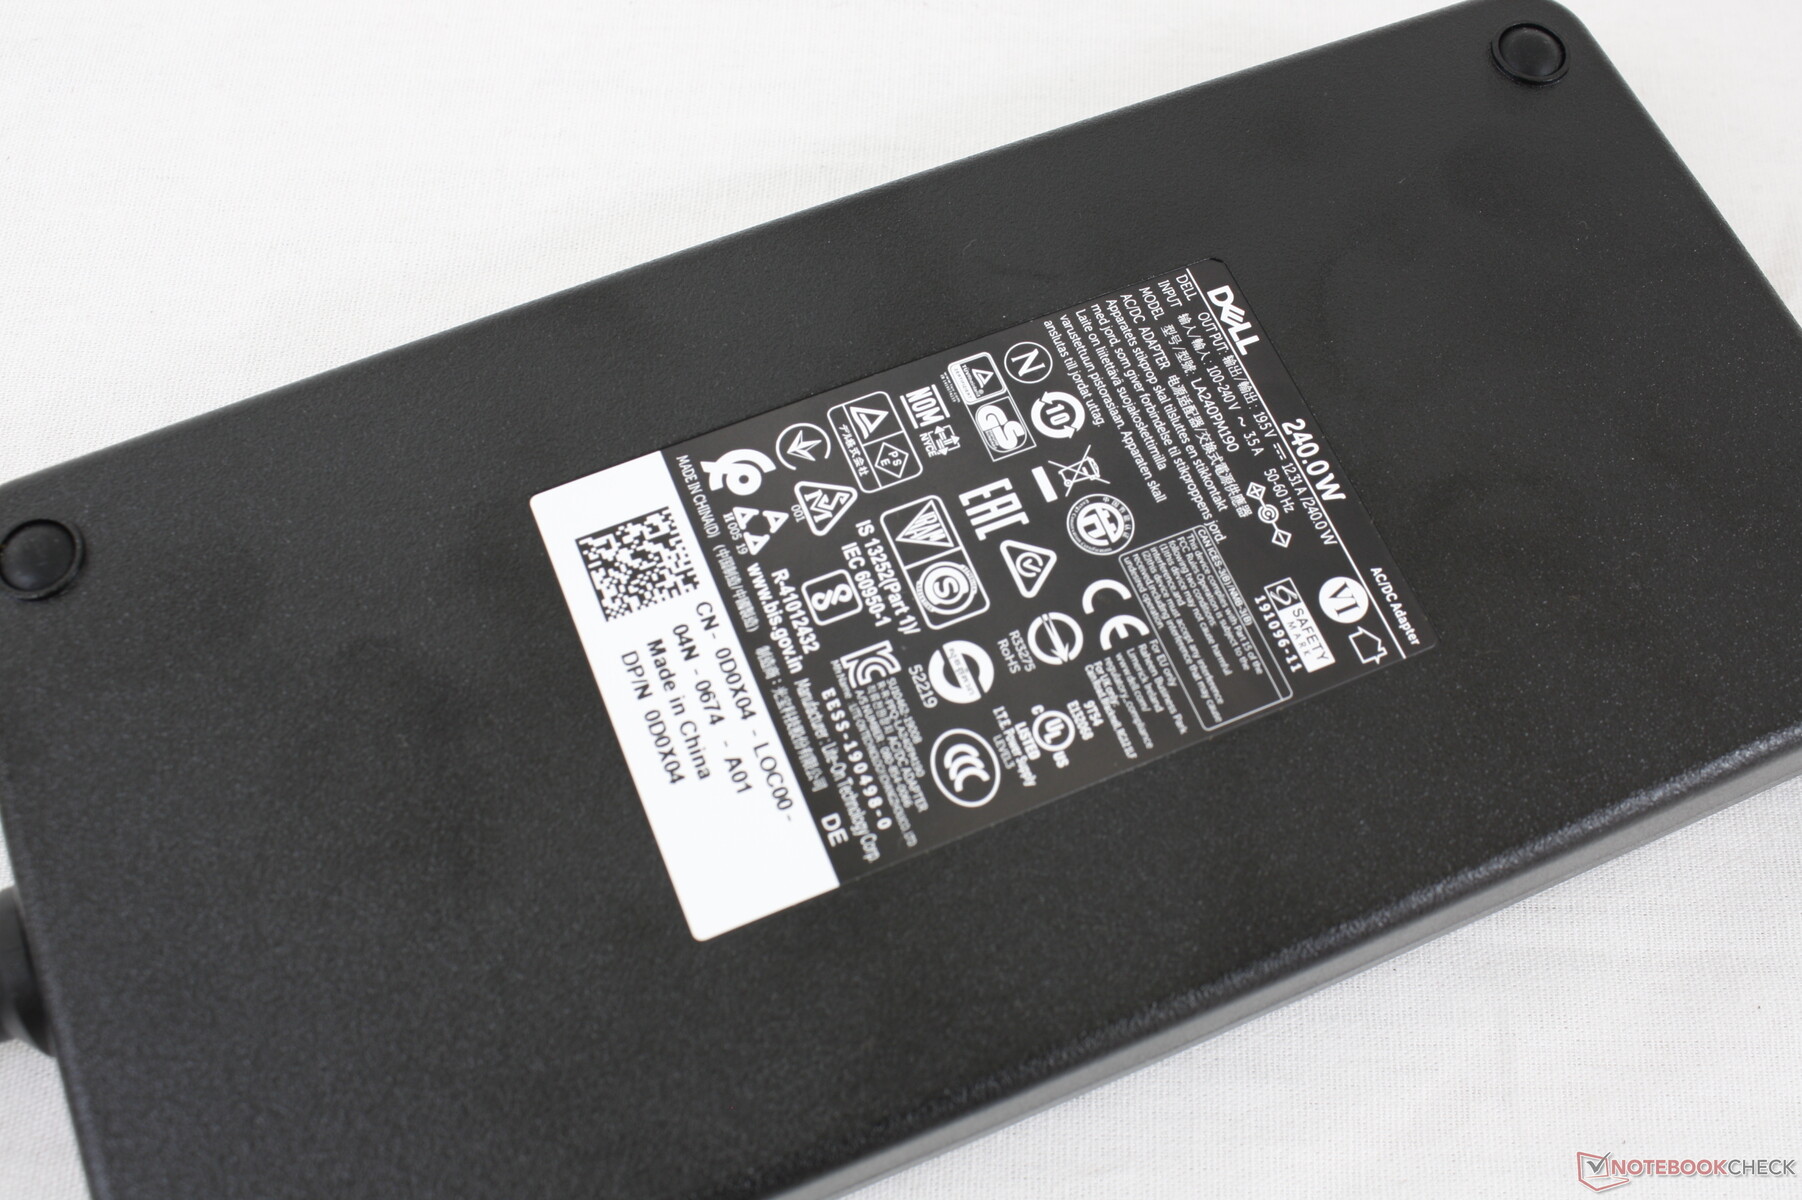
We're able to record a maximum of 257.3 W from the large (~20 x 10 x 2.6 cm) 240 W AC adapter when running Prime95 and FurMark simultaneously. Note that the battery will drain very slowly when running such extreme loads on the system.
| Off / Standby | |
| Idle | |
| Load |
|
Key:
min: | |
| Alienware m15 R3 P87F i7-10750H, GeForce RTX 2070 Mobile, IPS, 1920x1080, 15.6" | Alienware m15 P79F i7-8750H, GeForce RTX 2070 Max-Q, OLED, 3840x2160, 15.6" | Eluktronics RP-15 R7 4800H, GeForce RTX 2060 Mobile, IPS, 1920x1080, 15.6" | Razer Blade 15 RZ09-0328 i7-10750H, GeForce RTX 2070 Max-Q, AMOLED, 3840x2160, 15.6" | Asus Zephyrus S GX502GW i7-9750H, GeForce RTX 2070 Mobile, IPS, 1920x1080, 15.6" | MSI GS66 Stealth 10SFS i9-10980HK, GeForce RTX 2070 Super Max-Q, IPS, 1920x1080, 15.6" | MSI GP65 10SFK-047US i7-10750H, GeForce RTX 2070 Mobile, IPS, 1920x1080, 15.6" | |
|---|---|---|---|---|---|---|---|
| Power Consumption | 45% | 31% | 41% | 25% | 39% | 38% | |
| Idle Minimum * (Watt) | 34 | 10.9 68% | 21.7 36% | 11.1 67% | 24 29% | 13 62% | 14.2 58% |
| Idle Average * (Watt) | 48.6 | 12.3 75% | 30.1 38% | 13.7 72% | 27 44% | 16 67% | 18.8 61% |
| Idle Maximum * (Watt) | 58.2 | 19 67% | 35 40% | 33.4 43% | 33 43% | 27 54% | 23.9 59% |
| Load Average * (Watt) | 129.4 | 96 26% | 112.6 13% | 104.4 19% | 129 -0% | 109 16% | 96.9 25% |
| Witcher 3 ultra * (Watt) | 214.5 | 161.7 25% | 134.4 37% | 159.9 25% | 176 18% | 155 28% | 185 14% |
| Load Maximum * (Watt) | 257.3 | 229.1 11% | 201.5 22% | 203.8 21% | 216 16% | 236 8% | 233.4 9% |
* ... smaller is better
Battery Life
Runtimes are short even for a gaming laptop likely as a consequence of the very high power consumption readings above and lack of Optimus. Browsing the web on the Balanced power profile lasts just under 3 hours to be shorter than we recorded on the Alienware m15 R1 or m15 R2. Simply idling on desktop at the lowest brightness setting and power profile available would last just 5 hours before automatic shutdown.
Recharging from empty to full capacity takes about 2 to 2.5 hours. The system can be recharged via USB-C much like on the MSI GS75 or Asus Zephyrus M. Some SKUs may come with a smaller 56 Wh battery instead of 86 Wh.
| Alienware m15 R3 P87F i7-10750H, GeForce RTX 2070 Mobile, 86 Wh | Alienware m15 P79F i7-8750H, GeForce RTX 2070 Max-Q, 90 Wh | Eluktronics RP-15 R7 4800H, GeForce RTX 2060 Mobile, 46.7 Wh | Razer Blade 15 RZ09-0328 i7-10750H, GeForce RTX 2070 Max-Q, 65 Wh | Asus Zephyrus S GX502GW i7-9750H, GeForce RTX 2070 Mobile, 76 Wh | MSI GS66 Stealth 10SFS i9-10980HK, GeForce RTX 2070 Super Max-Q, 99.99 Wh | |
|---|---|---|---|---|---|---|
| Battery runtime | 86% | 29% | 43% | 31% | 110% | |
| Reader / Idle (h) | 5 | 5.9 18% | 8.4 68% | |||
| WiFi v1.3 (h) | 2.8 | 5.2 86% | 3.6 29% | 4 43% | 3.7 32% | 6.1 118% |
| Load (h) | 0.7 | 1 43% | 1.7 143% |
Pros
Cons
Verdict
Externally, the Alienware m15 R3 looks like nothing more than a minor update over last year's m15 R2. Instead, all the major changes are internal which is kind of a shame because they will likely go unnoticed to most users. Dell directly addressed one of biggest issues on the m15 R2 with the m15 R3 by moving to a much stronger cooling solution and bringing core temperatures down by about 20 C when gaming. Pair this with the new CPU and GPU options and you have a system that can run both faster and cooler than its immediate predecessor despite looking almost the same from the outside. In short, the Alienware m15 R3 is what the m15 R2 should have been.
With one of the biggest issues from last year's model now taken care of, it's time to improve the other aspects of the system. Fan noise in particular hasn't changed meaning you're still going to want a good pair of headphones when gaming. The thin-and-light chassis isn't as thin or light as others in the same category and the inclusion of a vapor chamber has made the system slightly heavier than before. The very high power consumption and short battery life make the system a poorer solution for travelers as well when compared to the MSI GS66 or Razer Blade 15 which offer almost the same CPU and GPU options as our Dell.
Overall, the Alienware m15 R3 is a notable improvement over the m15 R2 especially in terms of core temperature. The new processor options are also welcomed, but almost everything else remains the same as last year's m15 R2 model for many of the same disadvantages as well.
Alienware m15 R3 P87F
- 07/31/2020 v7 (old)
Allen Ngo
Price comparison
