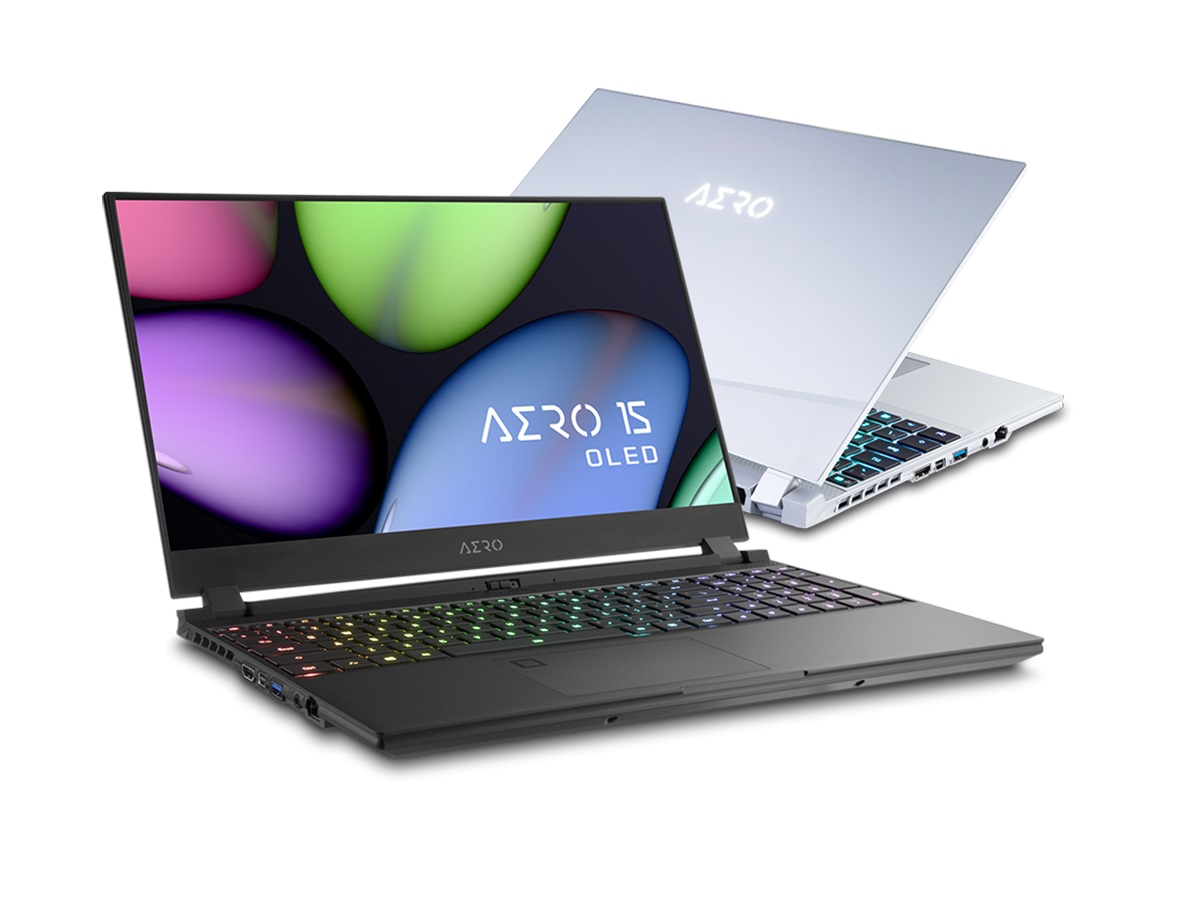
Gigabyte Aero 15 XB laptop review: Taking the lead with OLED

The Aero 15 OLED is available in several configuration variants. Depending on the model, a Core i7-10750H, a Core i7-10875H or a Core i9-10980HK is used as processor. There are even four options for the graphics card. In this way, the buyer has to decide from a GeForce GTX 1660 Ti, a GeForce RTX 2060, a GeForce RTX 2070 Super Max-Q and a GeForce RTX 2080 Super Max-Q. In addition, there is a maximum of 64 GB of DDR4 RAM and up to two storage drives (M.2 type 2280) are added to this. The biggest highlight is, of course, the OLED display, which has an X-Rite Pantone certification and an ample resolution of 3840x2160 pixels.
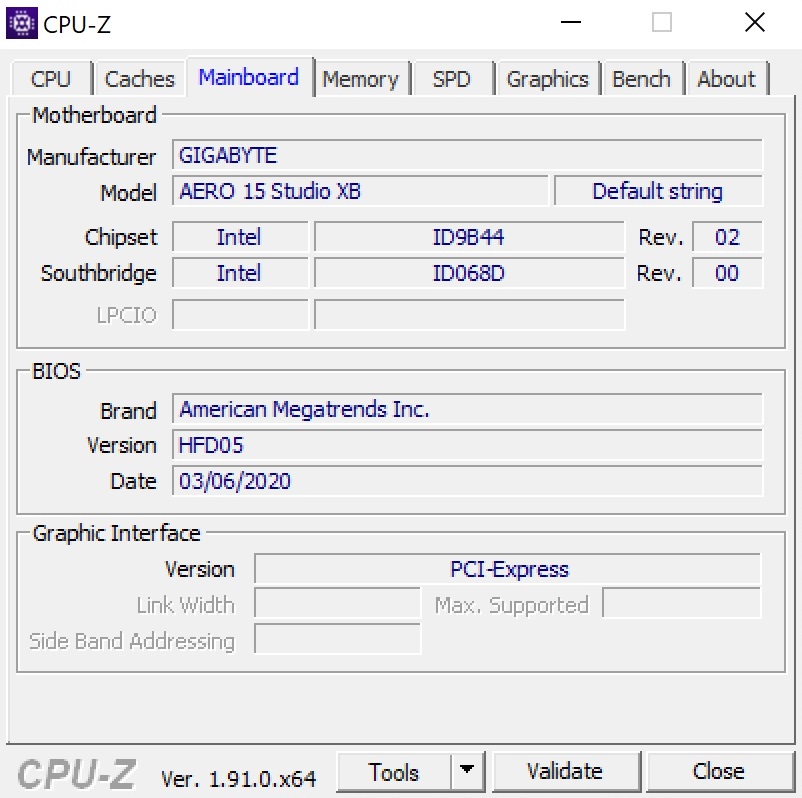
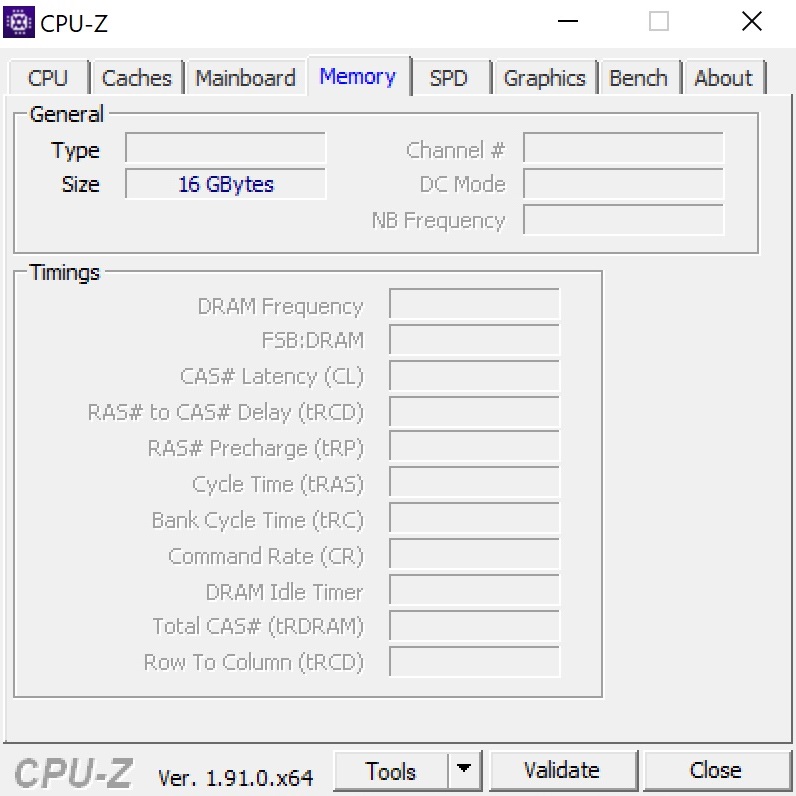
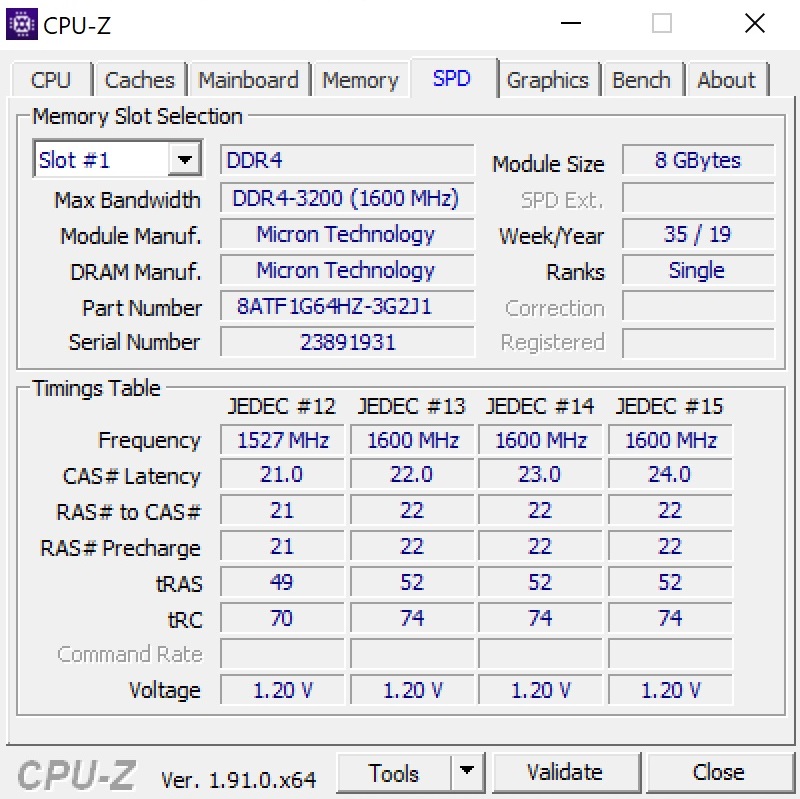
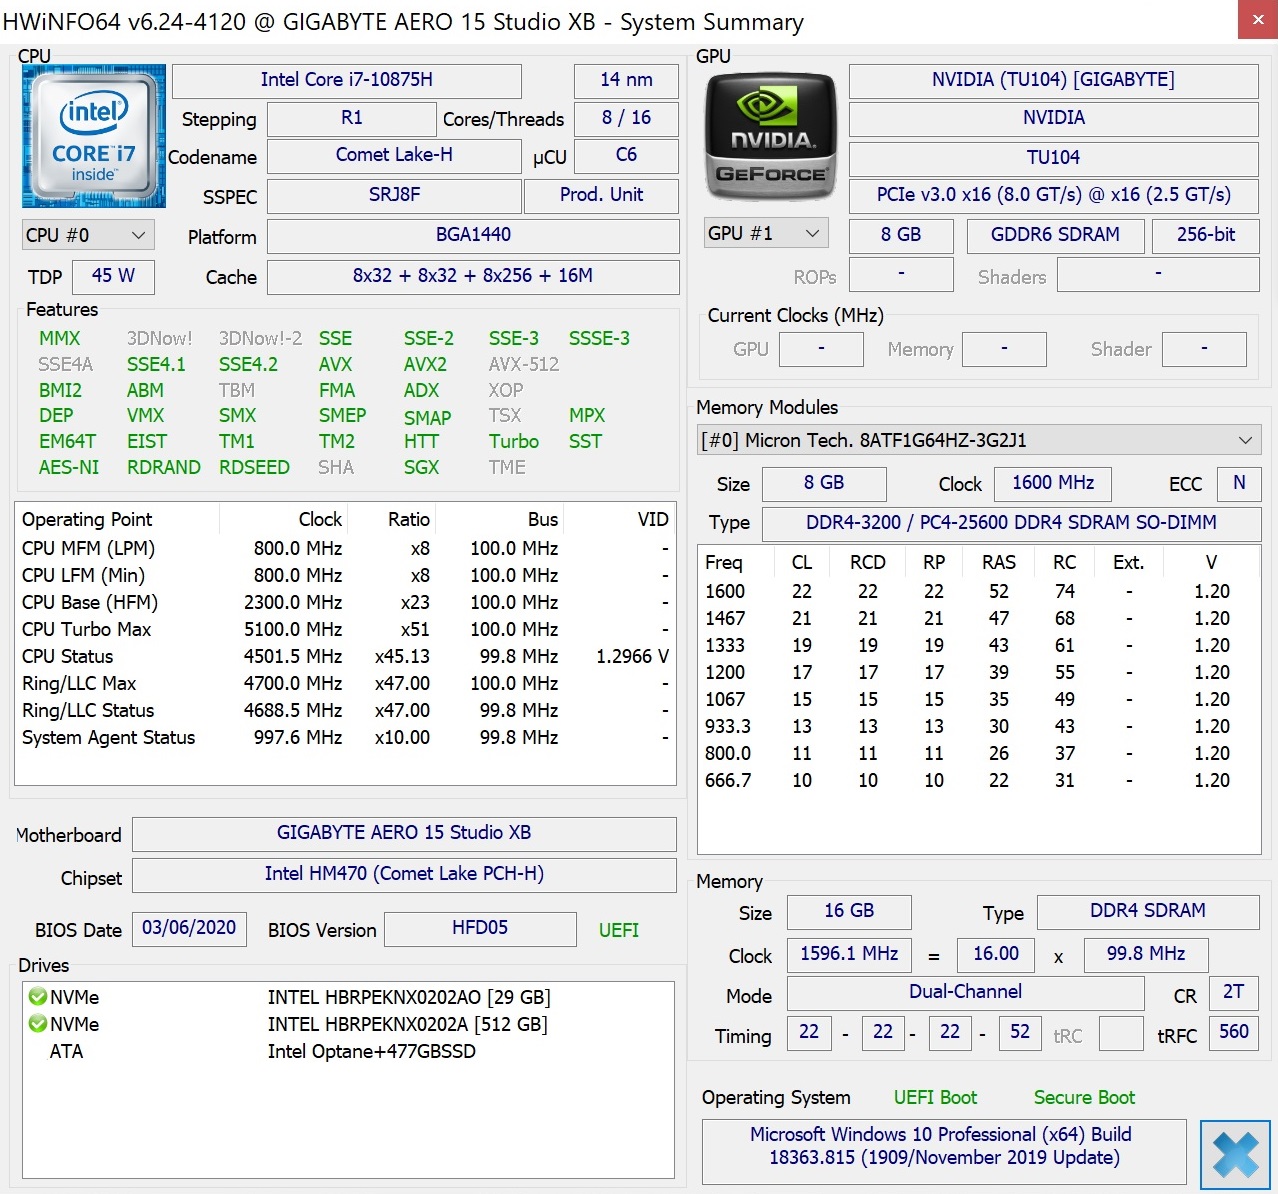
Our test device, which is equipped with a Core i7-10875H, a GeForce RTX 2070 Super Max-Q, 2x 8 GB DDR4 3200 RAM and a 500 GB SSD, currently costs around 2,600 Euros (~$2,808).
Since Gigabyte hasn't made any changes to the chassis, we won't go any further into the case, ports and input devices in this article. You can find the corresponding information in the review of the predecessor.
Rating | Date | Model | Weight | Height | Size | Resolution | Price |
|---|---|---|---|---|---|---|---|
| 85.8 % v7 (old) | 05 / 2020 | Gigabyte Aero 15 OLED XB-8DE51B0SP i7-10875H, GeForce RTX 2070 Super Max-Q | 2.2 kg | 20 mm | 15.60" | 3840x2160 | |
| 82.8 % v7 (old) | 05 / 2020 | MSI GS66 Stealth 10SFS i9-10980HK, GeForce RTX 2070 Super Max-Q | 2.2 kg | 20 mm | 15.60" | 1920x1080 | |
| 84.4 % v7 (old) | 07 / 2019 | Gigabyte Aero 15 OLED XA i7-9750H, GeForce RTX 2070 Max-Q | 2.2 kg | 20 mm | 15.60" | 3840x2160 | |
| 84 % v7 (old) | 08 / 2019 | Acer Predator Triton 500 PT515-51-71PZ i7-9750H, GeForce RTX 2070 Max-Q | 2.1 kg | 18 mm | 15.60" | 1920x1080 | |
| 82.3 % v7 (old) | 09 / 2019 | HP Omen X 2S 15-dg0075cl i7-9750H, GeForce RTX 2070 Max-Q | 2.4 kg | 19.8 mm | 15.60" | 1920x1080 | |
| 82.8 % v7 (old) | 11 / 2019 | Schenker XMG Neo 15 XNE15M19 i7-9750H, GeForce RTX 2070 Max-Q | 2.1 kg | 22 mm | 15.60" | 1920x1080 |
Competitors of the Aero 15 OLED include other 15-inch gaming devices from the "thin and light" category with GeForce RTX 2070 (Super) Max-Q graphics such as the MSI GS66 Stealth 10SFS, the Acer Predator Triton 500, the HP Omen X 2S and the Schenker XMG Neo 15. The latter laptops appear in the tables as comparison devices.
SD card reader
| SD Card Reader | |
| average JPG Copy Test (av. of 3 runs) | |
| Gigabyte Aero 15 OLED XB-8DE51B0SP (Toshiba Exceria Pro SDXC 64 GB UHS-II) | |
| Gigabyte Aero 15 OLED XA (Toshiba Exceria Pro SDXC 64 GB UHS-II) | |
| Schenker XMG Neo 15 XNE15M19 (Toshiba Exceria Pro SDXC 64 GB UHS-II) | |
| maximum AS SSD Seq Read Test (1GB) | |
| Gigabyte Aero 15 OLED XB-8DE51B0SP (Toshiba Exceria Pro SDXC 64 GB UHS-II) | |
| Gigabyte Aero 15 OLED XA (Toshiba Exceria Pro SDXC 64 GB UHS-II) | |
| Schenker XMG Neo 15 XNE15M19 (Toshiba Exceria Pro SDXC 64 GB UHS-II) | |
Communication
| Networking | |
| iperf3 transmit AX12 | |
| MSI GS66 Stealth 10SFS | |
| Gigabyte Aero 15 OLED XB-8DE51B0SP | |
| Schenker XMG Neo 15 XNE15M19 | |
| iperf3 receive AX12 | |
| Schenker XMG Neo 15 XNE15M19 | |
| MSI GS66 Stealth 10SFS | |
| Gigabyte Aero 15 OLED XB-8DE51B0SP | |
Webcam

")
")
Display
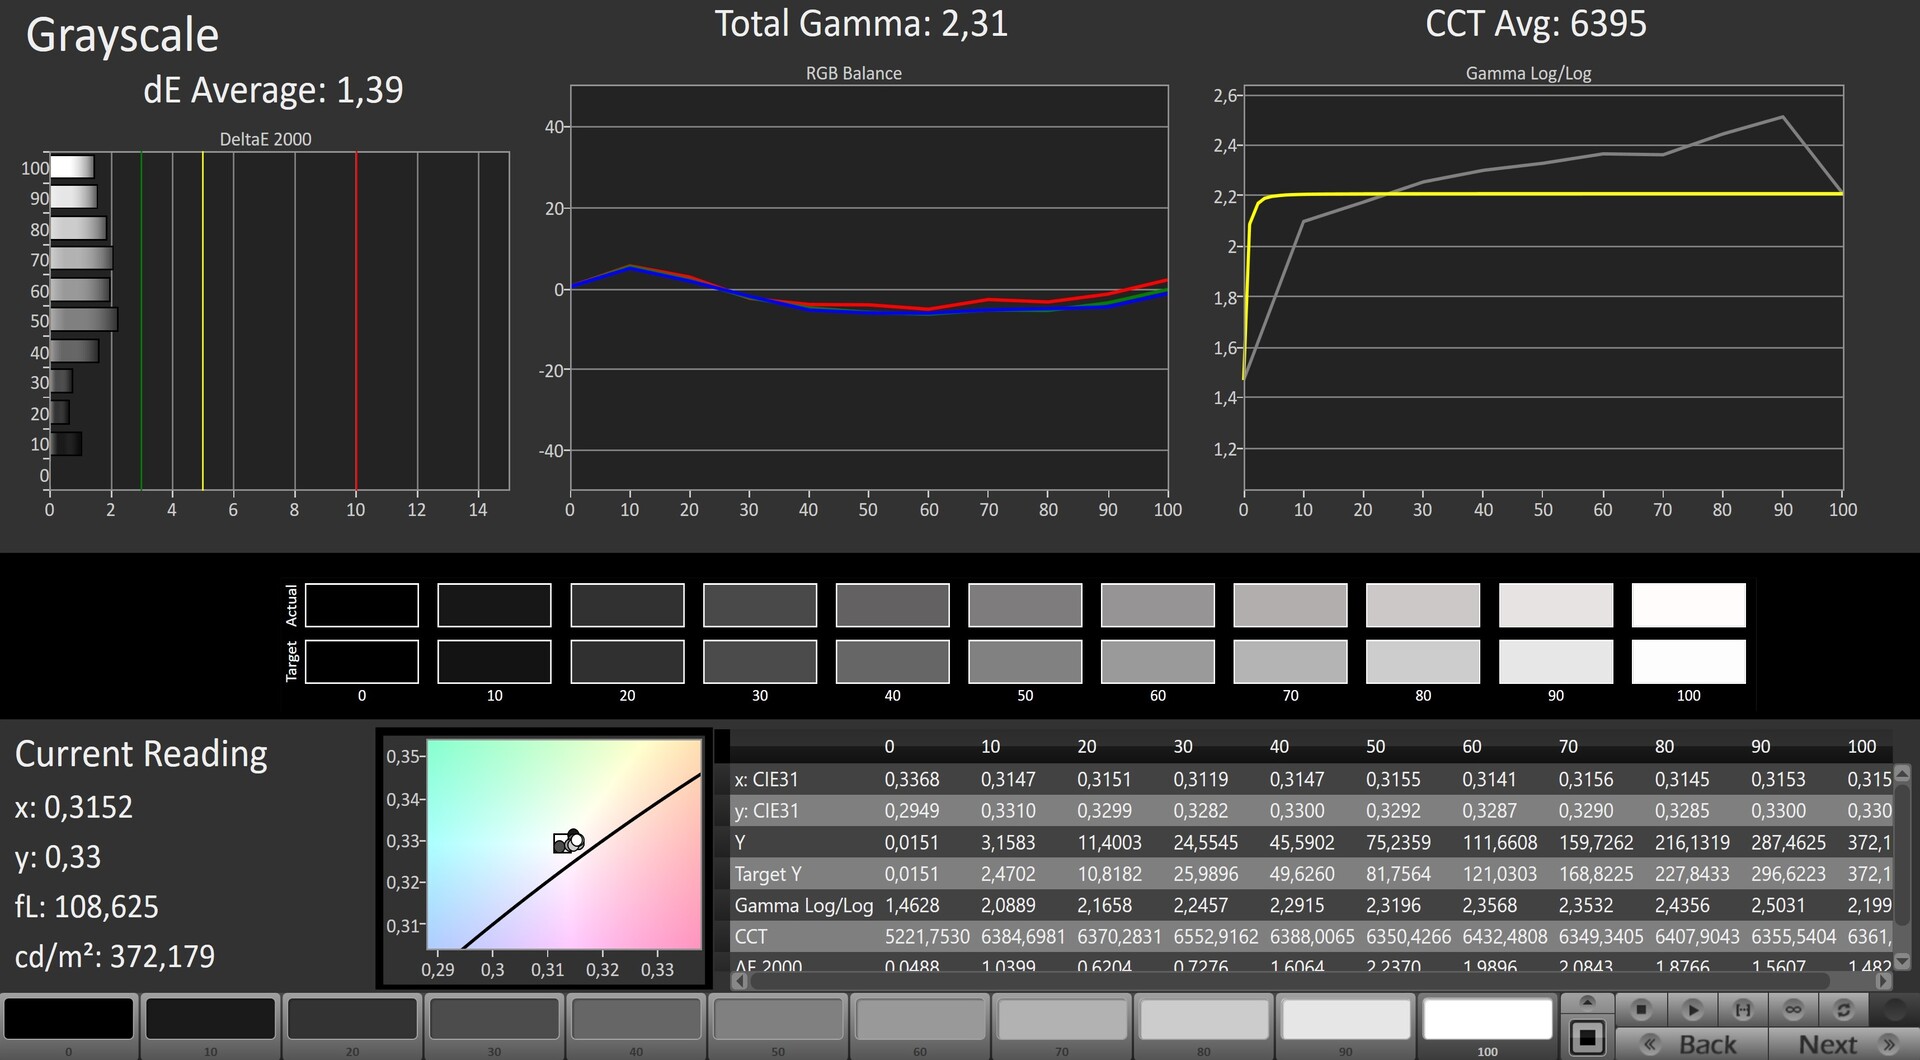
Similar to the old Aero 15 OLED, Gigabyte has used the SDCA029 panel from Samsung. Not only does the 4K screen score points with a relatively high brightness (390 cd/m² on average) but also with a gigantic contrast thanks to the outstanding black value, which outshines all conventional panels (IPS, TN, etc.) and makes them look extremely pale and undifferentiated.
| |||||||||||||||||||||||||
Brightness Distribution: 93 %
Center on Battery: 385 cd/m²
Contrast: ∞:1 (Black: 0 cd/m²)
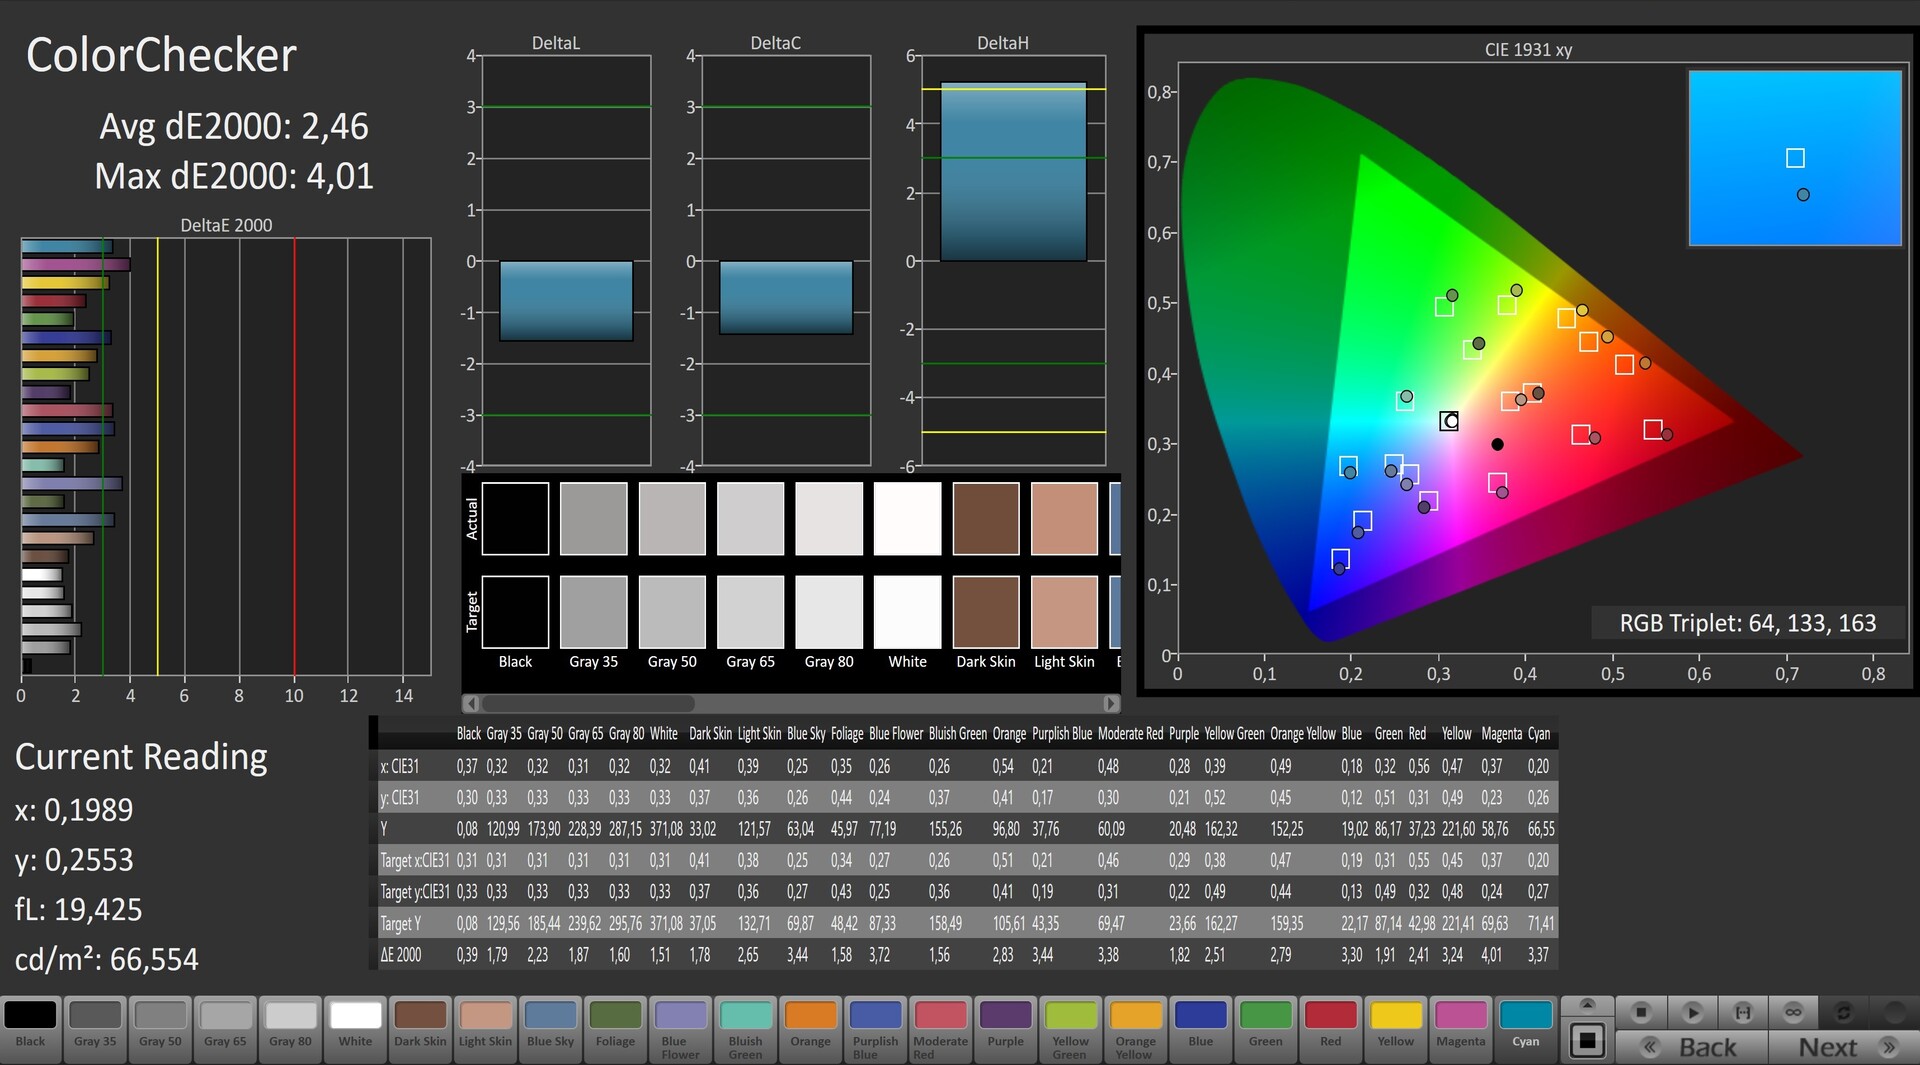
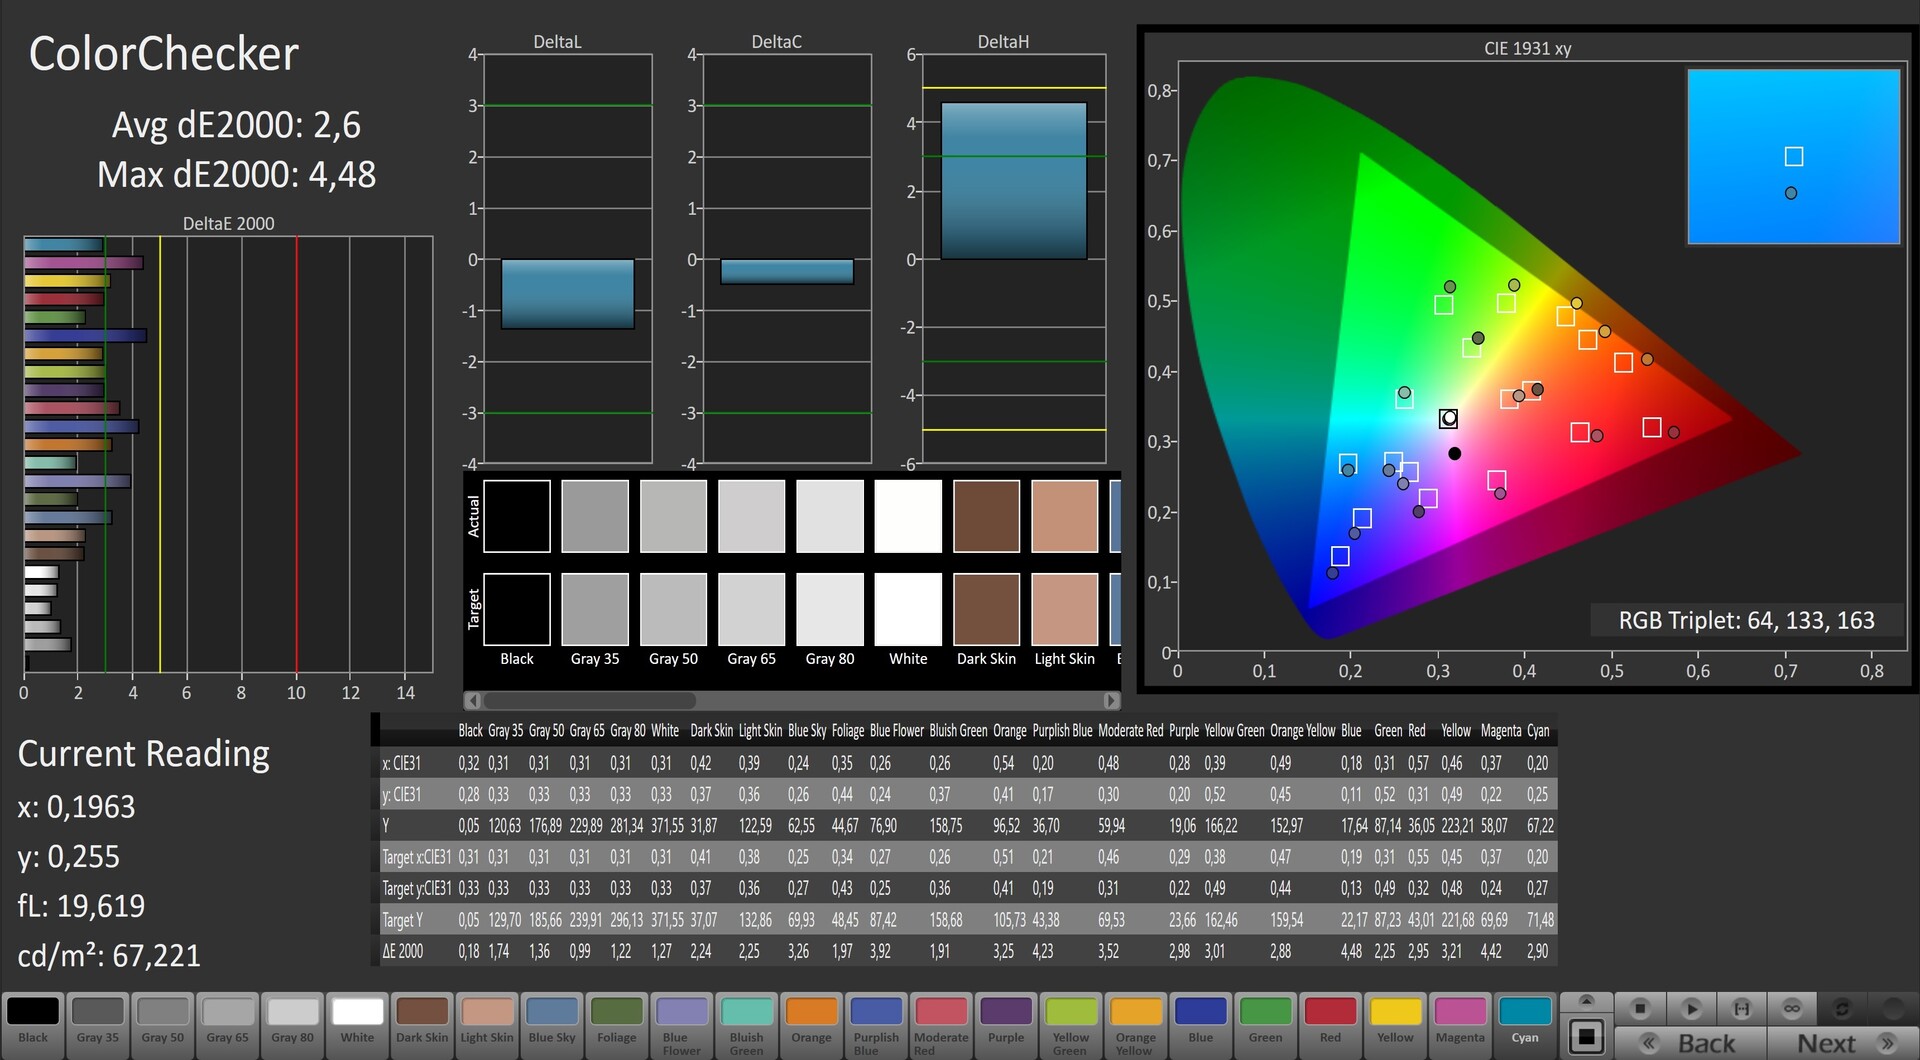
ΔE ColorChecker Calman: 2.46 | ∀{0.5-29.43 Ø4.71}
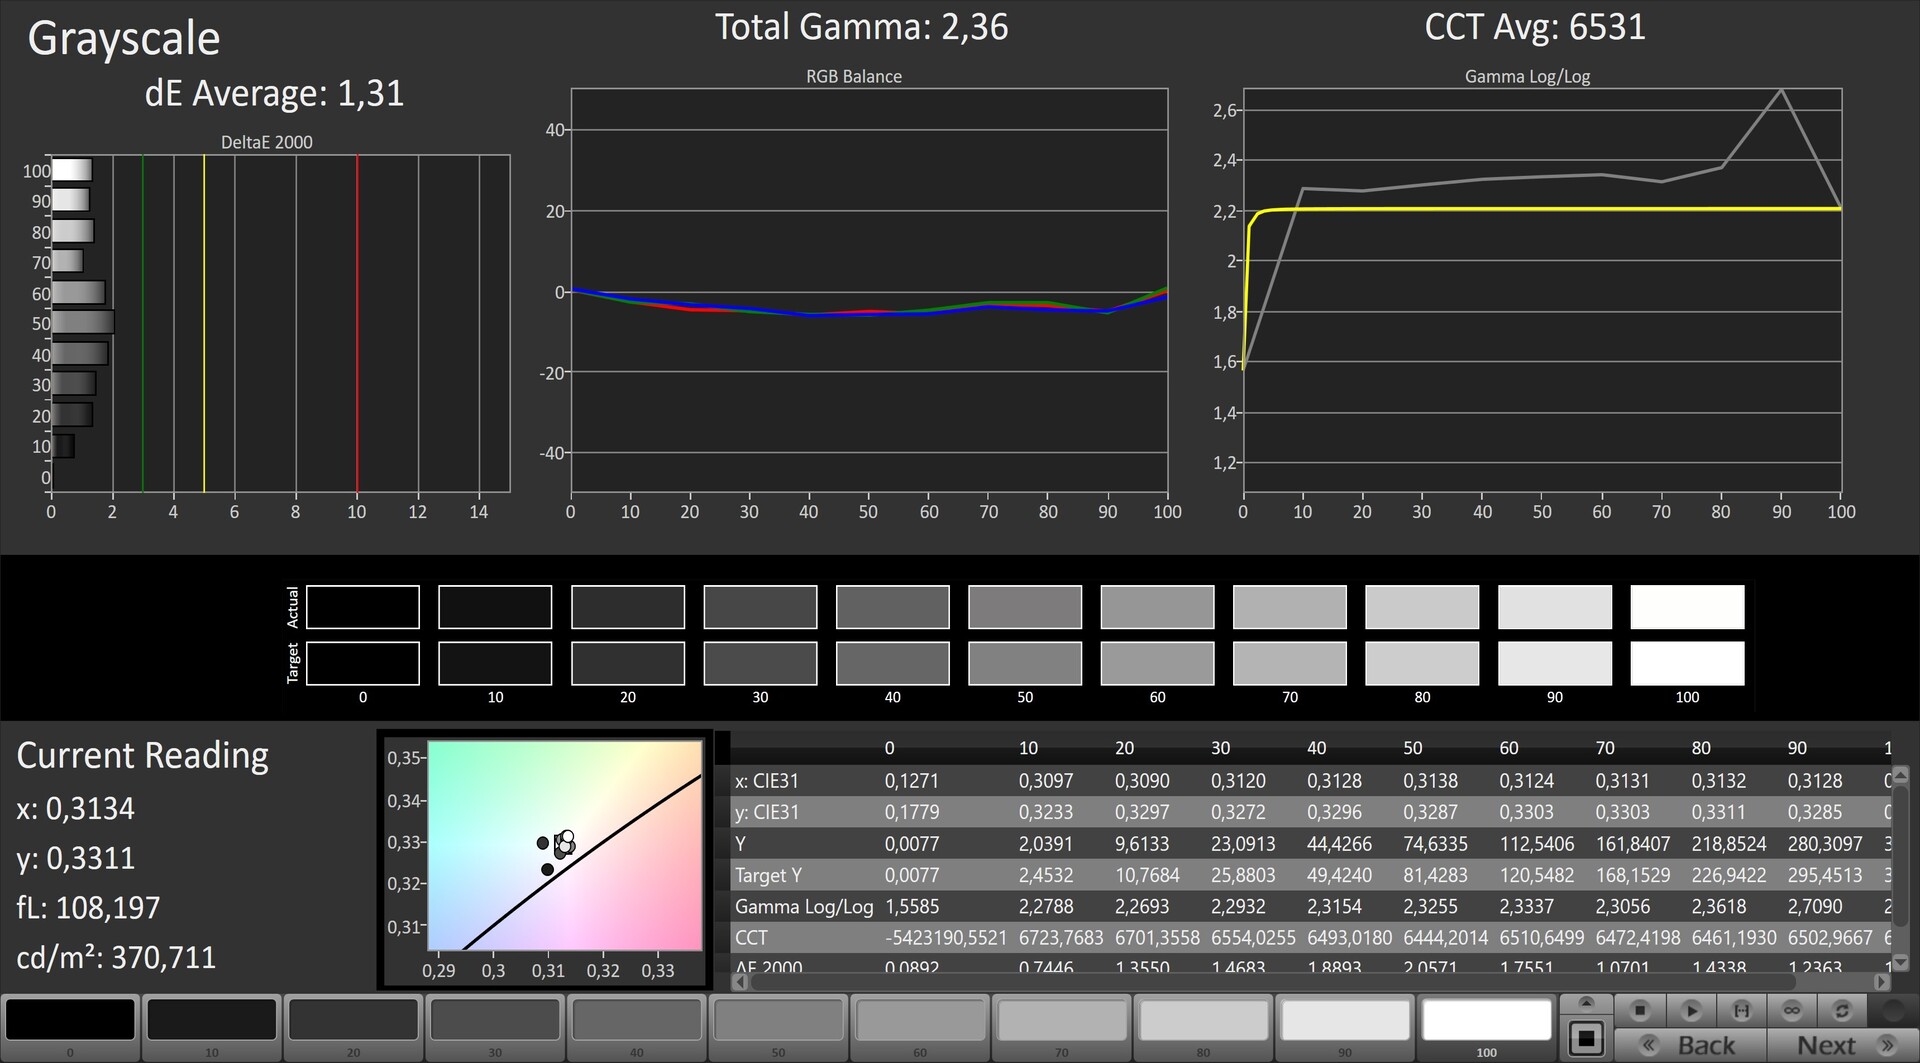
calibrated: 2.6
ΔE Greyscale Calman: 1.39 | ∀{0.09-98 Ø4.96}
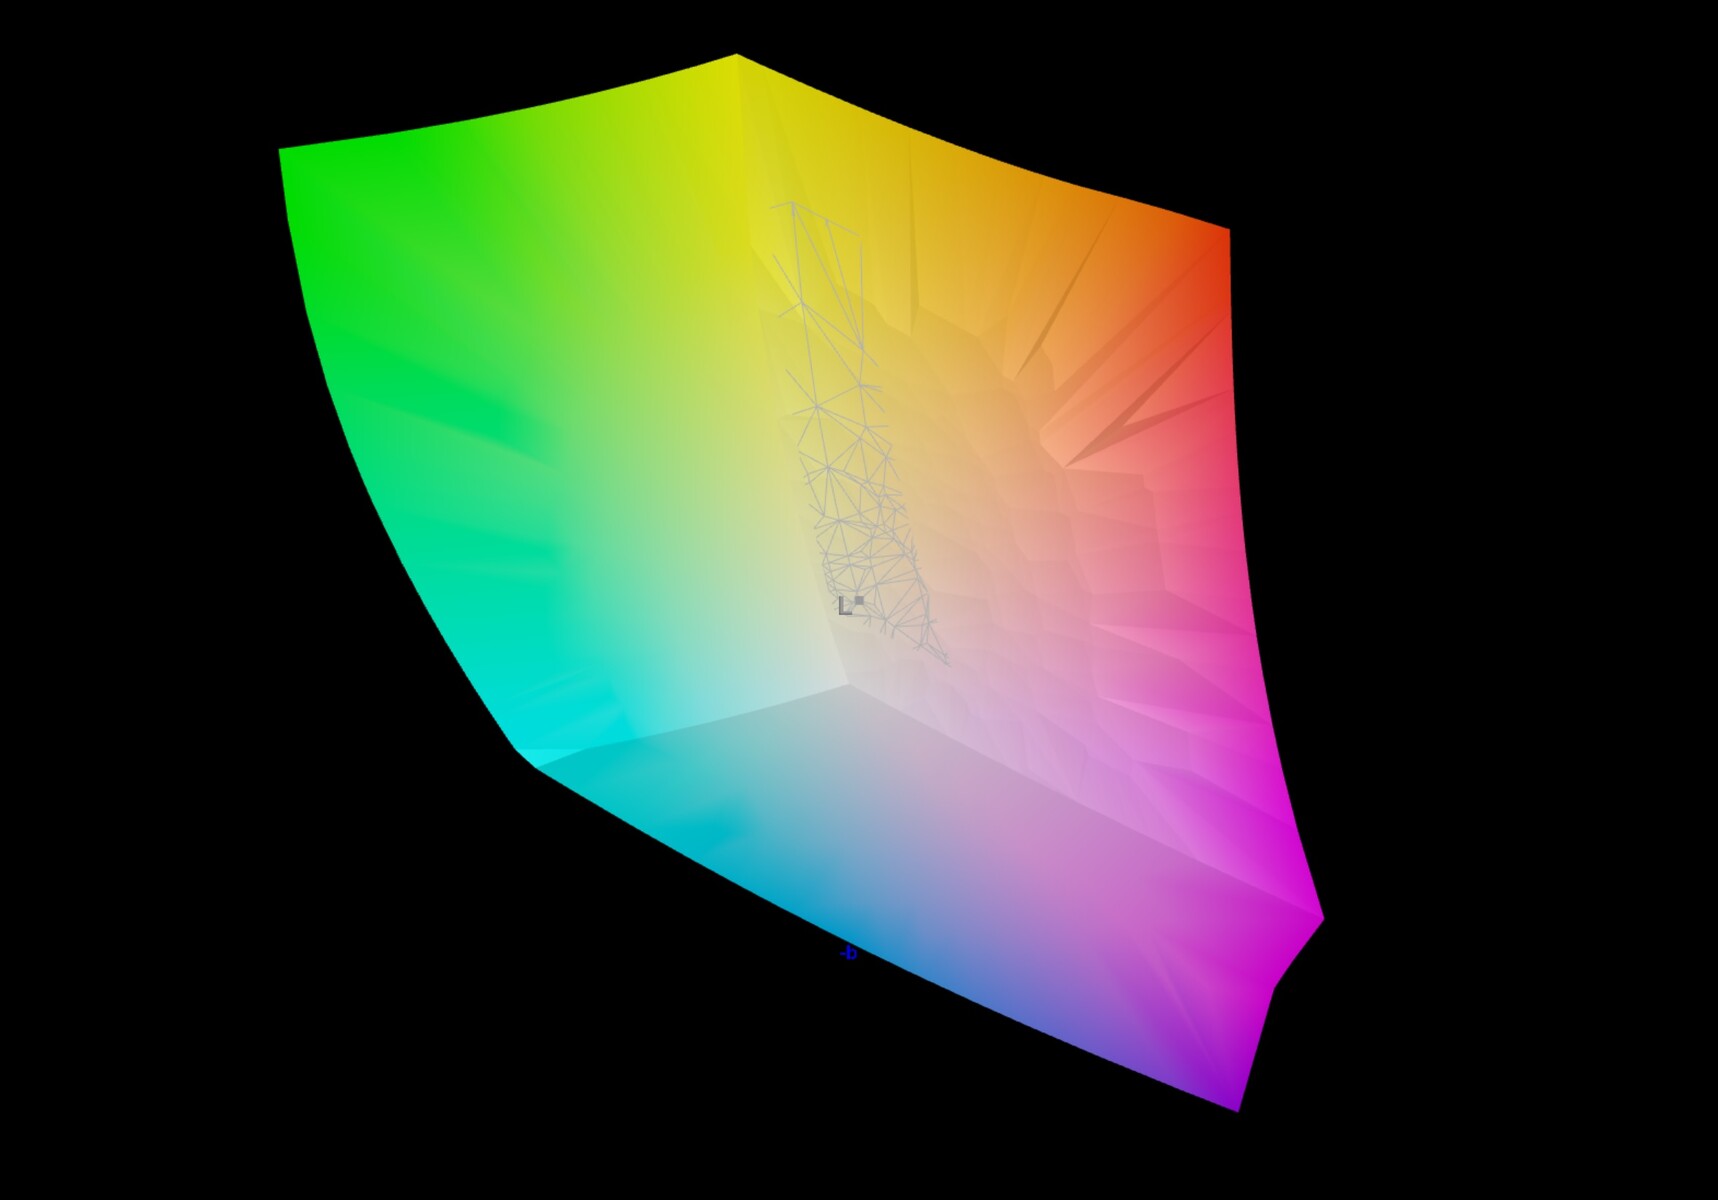
100% sRGB (Argyll 1.6.3 3D)
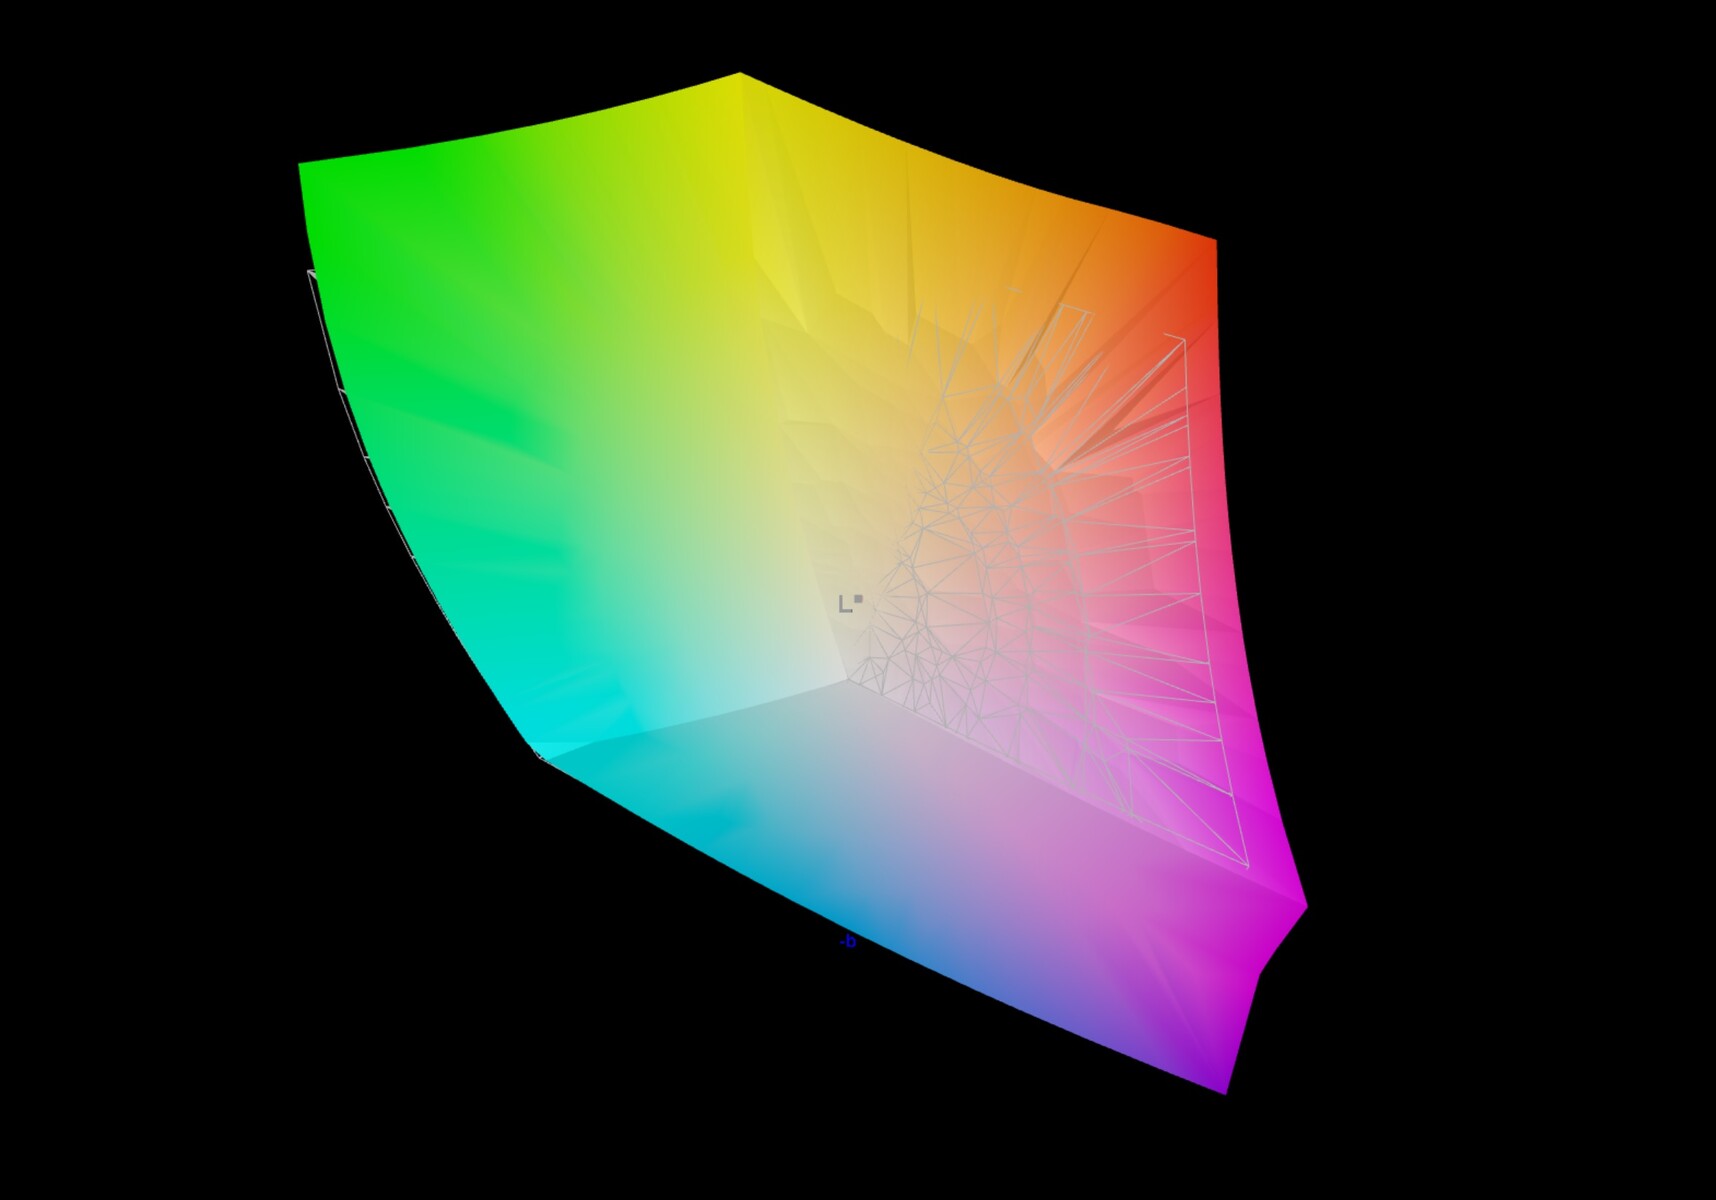
98% AdobeRGB 1998 (Argyll 1.6.3 3D)
98.2% AdobeRGB 1998 (Argyll 3D)
100% sRGB (Argyll 3D)
99.9% Display P3 (Argyll 3D)
Gamma: 2.31
CCT: 6395 K
| Gigabyte Aero 15 OLED XB-8DE51B0SP Samsung SDCA029, OLED, 3840x2160 | MSI GS66 Stealth 10SFS AUO B156HAN12.0 (AUO328E), IPS, 1920x1080 | Gigabyte Aero 15 OLED XA Samsung SDCA029, OLED, 3840x2160 | Acer Predator Triton 500 PT515-51-71PZ NV156FHM-N4K (BOE082A), IPS, 1920x1080 | HP Omen X 2S 15-dg0075cl AU Optronics AUO82ED, IPS, 1920x1080 | Schenker XMG Neo 15 XNE15M19 NV156FHM-N4G (BOE084D), IPS, 1920x1080 | |
|---|---|---|---|---|---|---|
| Display | -19% | -25% | -25% | -26% | ||
| Display P3 Coverage (%) | 99.9 | 69.5 -30% | 64.6 -35% | 66.2 -34% | 64 -36% | |
| sRGB Coverage (%) | 100 | 99.6 0% | 92.6 -7% | 92.3 -8% | 90.3 -10% | |
| AdobeRGB 1998 Coverage (%) | 98.2 | 70.8 -28% | 66 -33% | 67.2 -32% | 65.4 -33% | |
| Response Times | -485% | -16% | -329% | -546% | -452% | |
| Response Time Grey 50% / Grey 80% * (ms) | 2.2 ? | 14 ? -536% | 2.4 ? -9% | 5.2 ? -136% | 15.2 ? -591% | 9.6 ? -336% |
| Response Time Black / White * (ms) | 1.8 ? | 9.6 ? -433% | 2.2 ? -22% | 11.2 ? -522% | 10.8 ? -500% | 12 ? -567% |
| PWM Frequency (Hz) | 60 ? | 60 ? | ||||
| Screen | -34% | -31% | -34% | -67% | -31% | |
| Brightness middle (cd/m²) | 385 | 316 -18% | 373 -3% | 288 -25% | 324.8 -16% | 313 -19% |
| Brightness (cd/m²) | 390 | 311 -20% | 375 -4% | 265 -32% | 316 -19% | 295 -24% |
| Brightness Distribution (%) | 93 | 92 -1% | 93 0% | 84 -10% | 84 -10% | 89 -4% |
| Black Level * (cd/m²) | 0.21 | 0.22 | 0.26 | 0.3 | ||
| Colorchecker dE 2000 * | 2.46 | 3.03 -23% | 3.98 -62% | 3.22 -31% | 4.96 -102% | 3.33 -35% |
| Colorchecker dE 2000 max. * | 4.01 | 7.32 -83% | 6.28 -57% | 6.26 -56% | 8.95 -123% | 6.25 -56% |
| Colorchecker dE 2000 calibrated * | 2.6 | 1.1 58% | 1.5 42% | 3.23 -24% | 1.77 32% | |
| Greyscale dE 2000 * | 1.39 | 3.9 -181% | 2.81 -102% | 3.43 -147% | 5 -260% | 3.1 -123% |
| Gamma | 2.31 95% | 2.42 91% | 2.62 84% | 2.41 91% | 2.21 100% | 2.51 88% |
| CCT | 6395 102% | 7439 87% | 6434 101% | 7290 89% | 7742 84% | 6930 94% |
| Color Space (Percent of AdobeRGB 1998) (%) | 98 | 65 -34% | 78 -20% | 60 -39% | 59.8 -39% | 59 -40% |
| Color Space (Percent of sRGB) (%) | 100 | 100 0% | 97 -3% | 93 -7% | 91.8 -8% | 90 -10% |
| Contrast (:1) | 1505 | 1309 | 1249 | 1043 | ||
| Total Average (Program / Settings) | -179% /
-95% | -24% /
-28% | -129% /
-74% | -213% /
-126% | -170% /
-90% |
* ... smaller is better
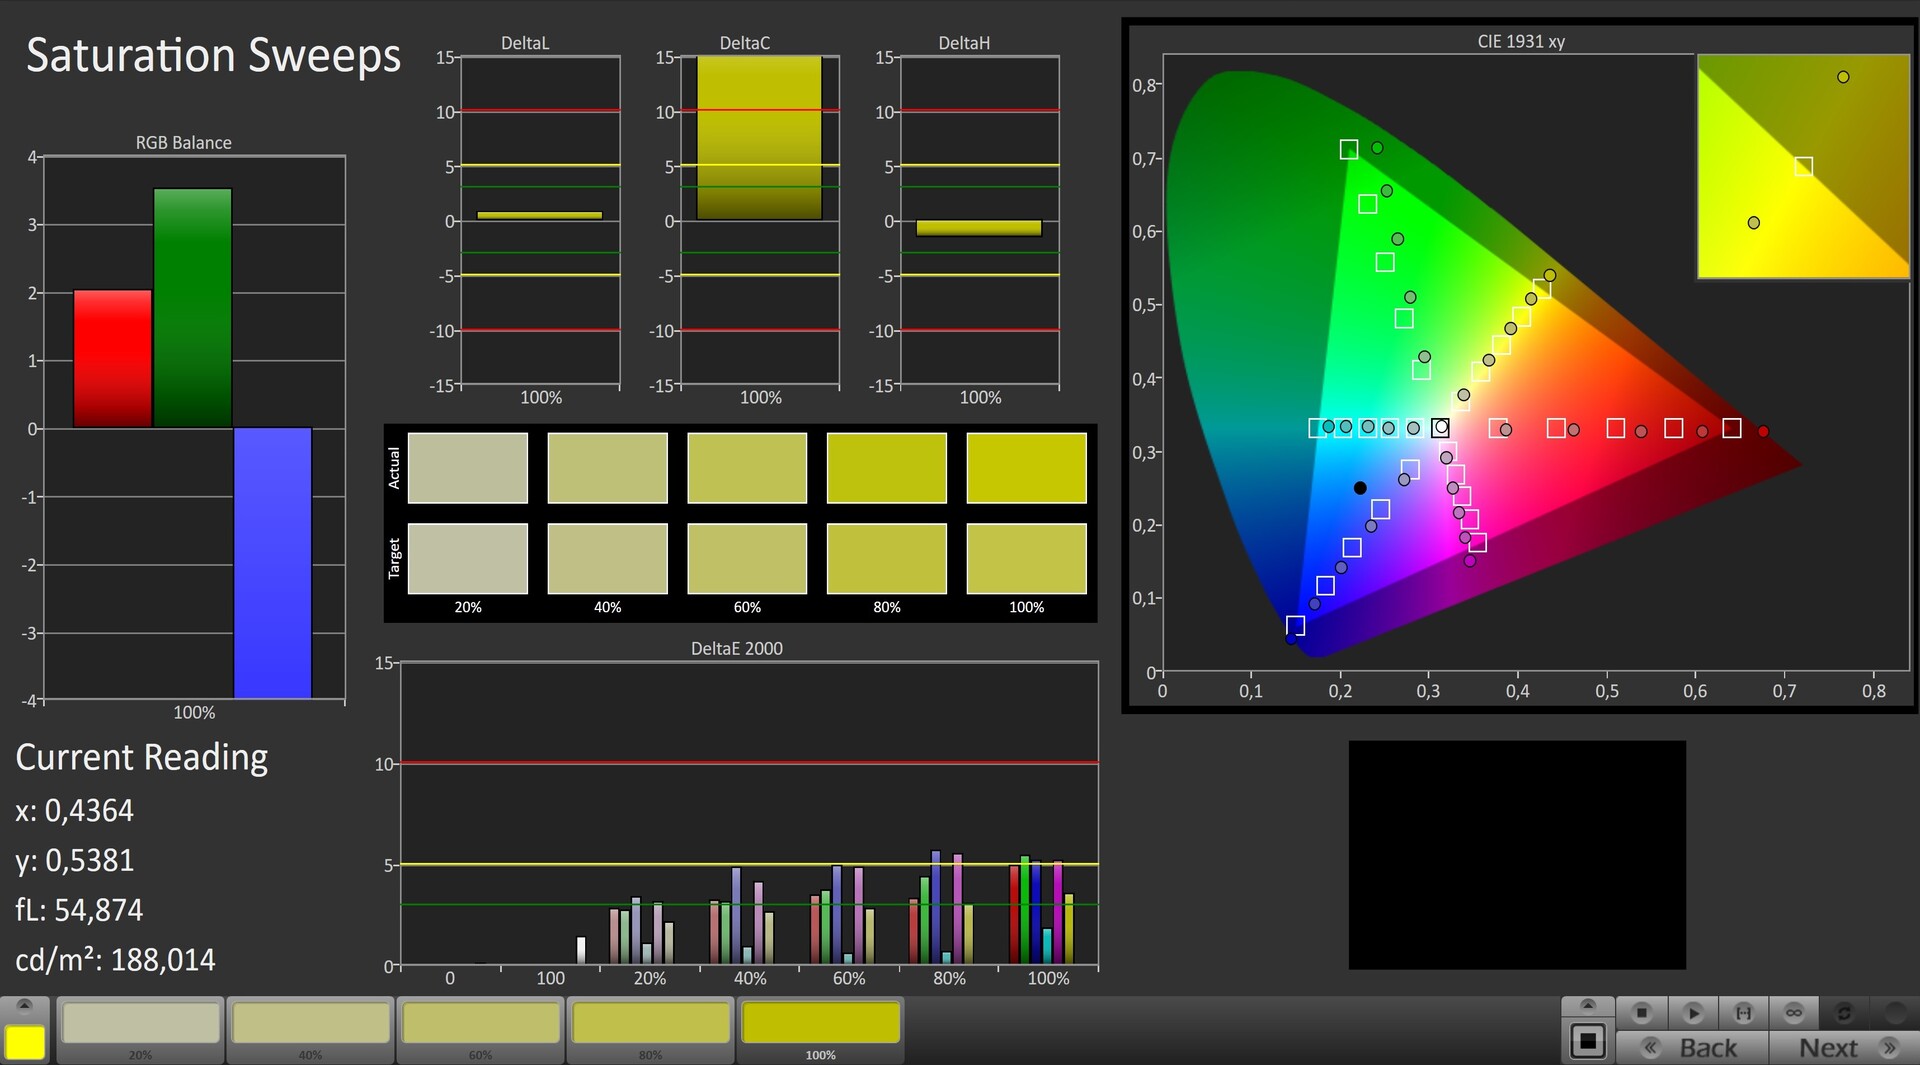
The calibration also ensures a very accurate and natural color representation that is unlike any other. In general, the display impresses with a very large color space. Professional users will be especially pleased that the AdobeRGB color space is almost completely covered.
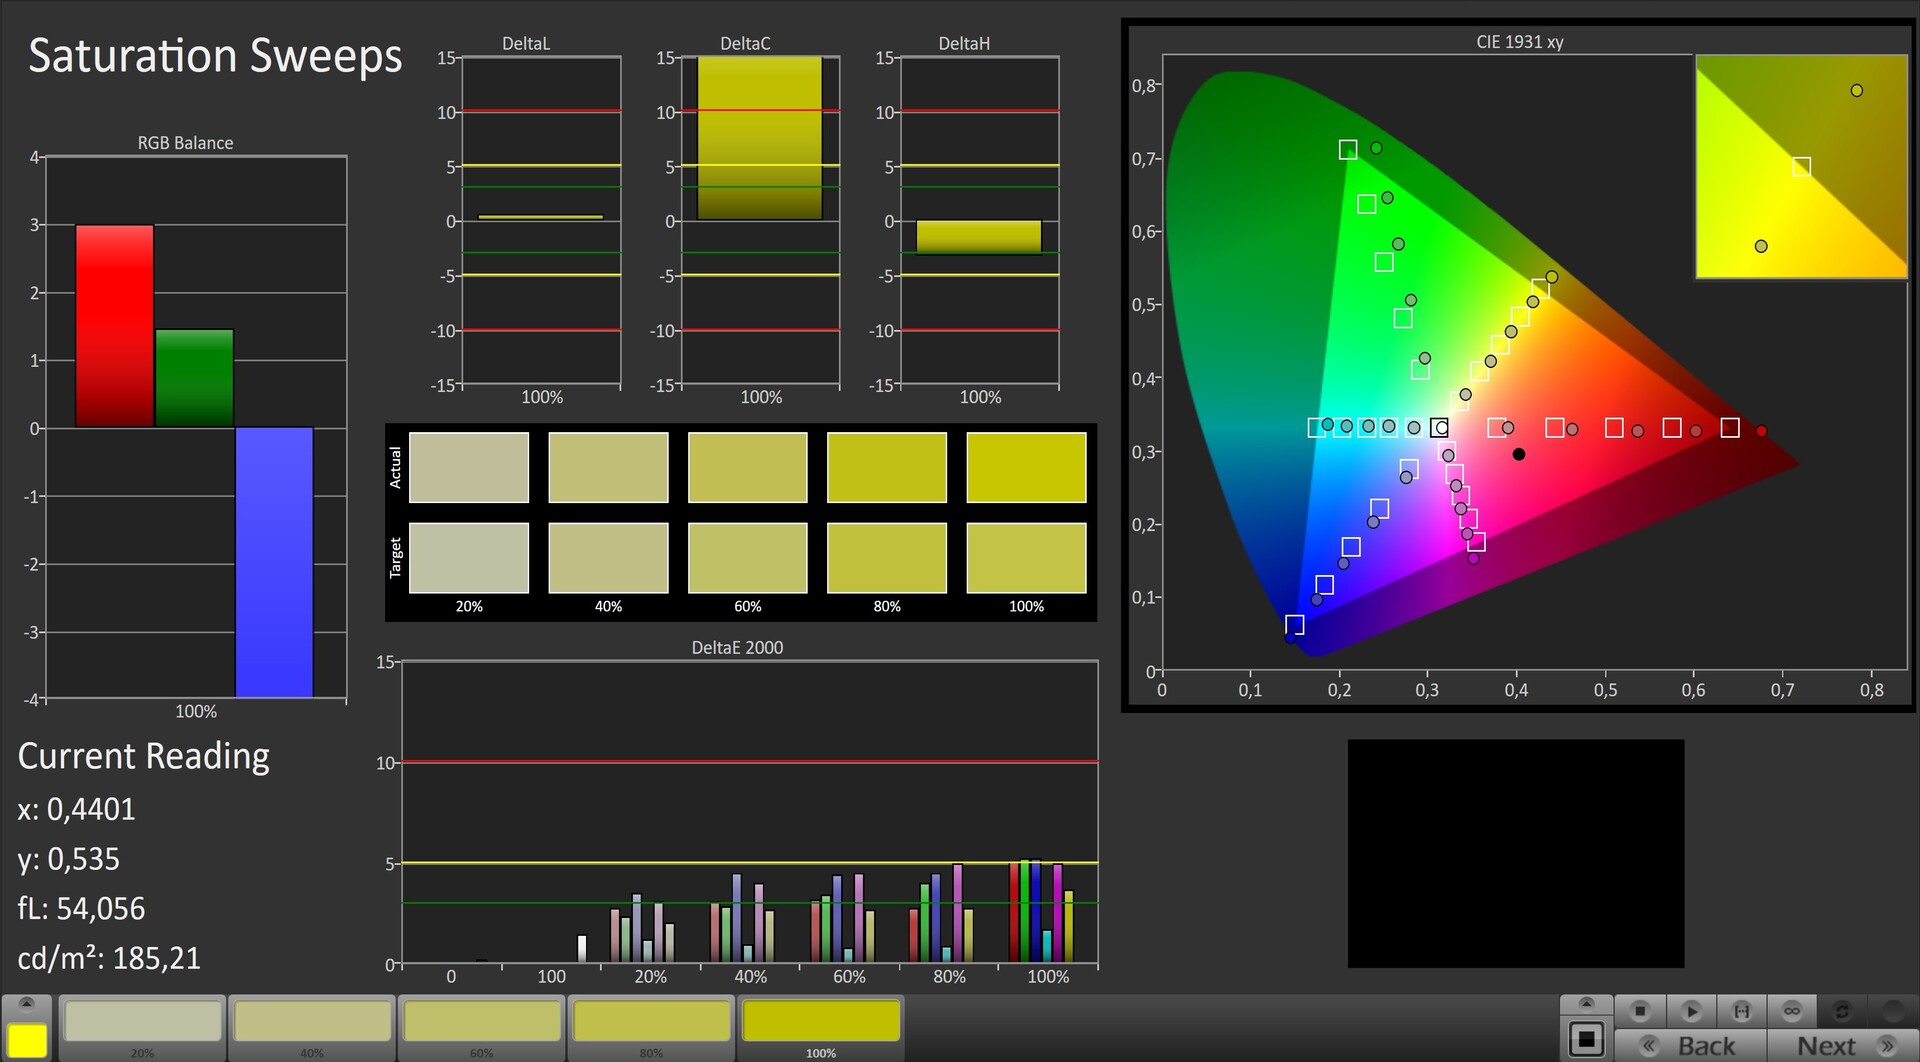
Gamers are likely to rejoice at the short response times. Just under 2 ms is an excellent value. For comparison: Even fast IPS panels achieve about 10 ms in our test. On the other hand, it's a bit of a shame that the screen only manages 60 Hz. Some buyers will expect more in times of 240 and 300 Hz panels.
Caution: Below 80% brightness, the Aero 15 OLED will flicker at 60 Hz (240 Hz at less than 44%), which can cause problems for sensitive users. However, the most annoying thing for us was the glossy surface. Due to the strong reflections, the device isn't really suitable for outdoor use.
Display Response Times
| ↔ Response Time Black to White | ||
|---|---|---|
| 1.8 ms ... rise ↗ and fall ↘ combined | ↗ 1 ms rise | 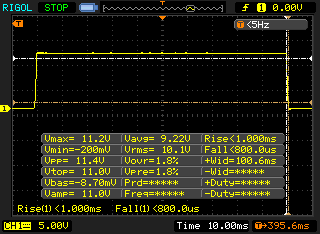 |
| ↘ 0.8 ms fall | ||
| The screen shows very fast response rates in our tests and should be very well suited for fast-paced gaming. In comparison, all tested devices range from 0.1 (minimum) to 240 (maximum) ms. » 11 % of all devices are better. This means that the measured response time is better than the average of all tested devices (19.8 ms). | ||
| ↔ Response Time 50% Grey to 80% Grey | ||
| 2.2 ms ... rise ↗ and fall ↘ combined | ↗ 1 ms rise | 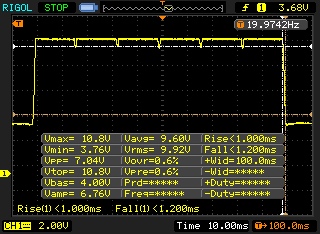 |
| ↘ 1.2 ms fall | ||
| The screen shows very fast response rates in our tests and should be very well suited for fast-paced gaming. In comparison, all tested devices range from 0.165 (minimum) to 636 (maximum) ms. » 11 % of all devices are better. This means that the measured response time is better than the average of all tested devices (31 ms). | ||
Screen Flickering / PWM (Pulse-Width Modulation)
| Screen flickering / PWM detected | 60 Hz | ≤ 80 % brightness setting | 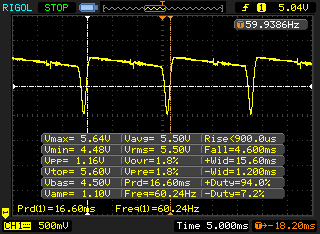 |
The display backlight flickers at 60 Hz (worst case, e.g., utilizing PWM) Flickering detected at a brightness setting of 80 % and below. There should be no flickering or PWM above this brightness setting. The frequency of 60 Hz is very low, so the flickering may cause eyestrain and headaches after extended use. In comparison: 52 % of all tested devices do not use PWM to dim the display. If PWM was detected, an average of 7757 (minimum: 5 - maximum: 343500) Hz was measured. | |||
Test conditions
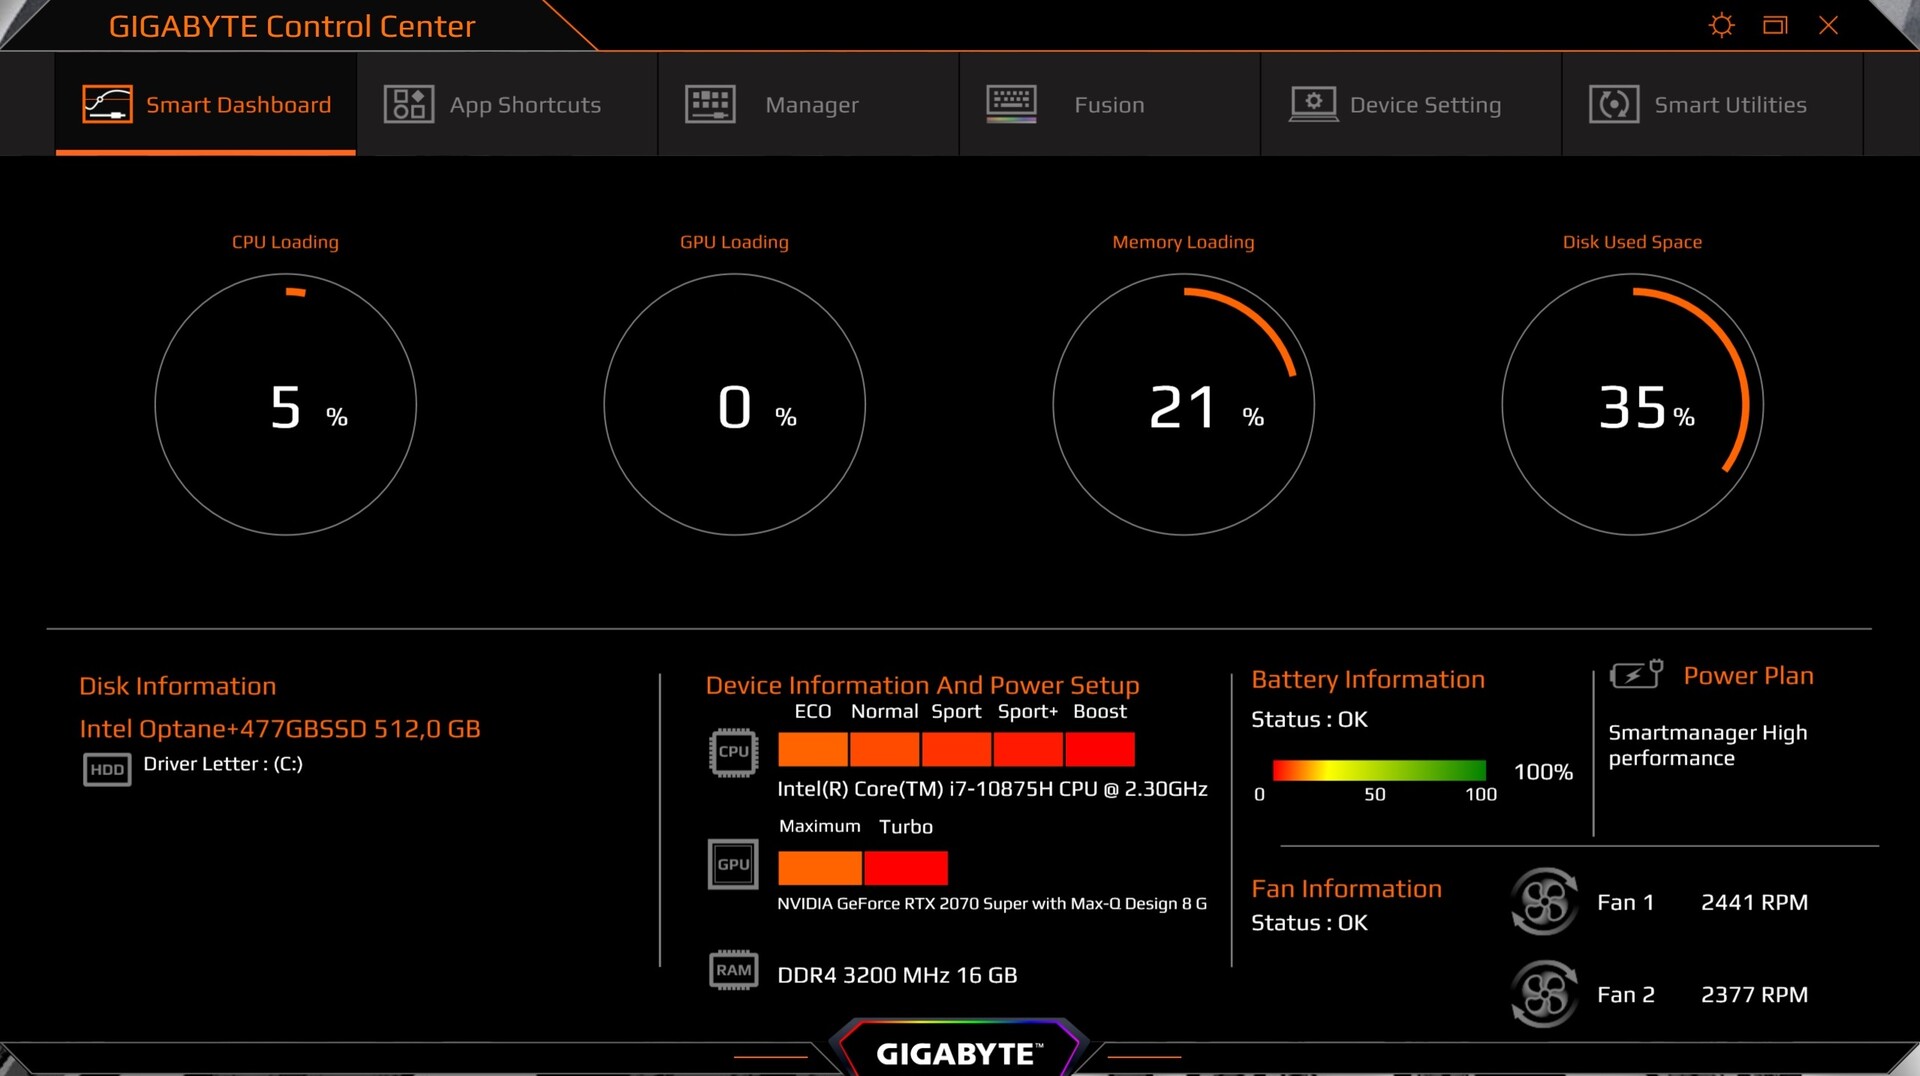
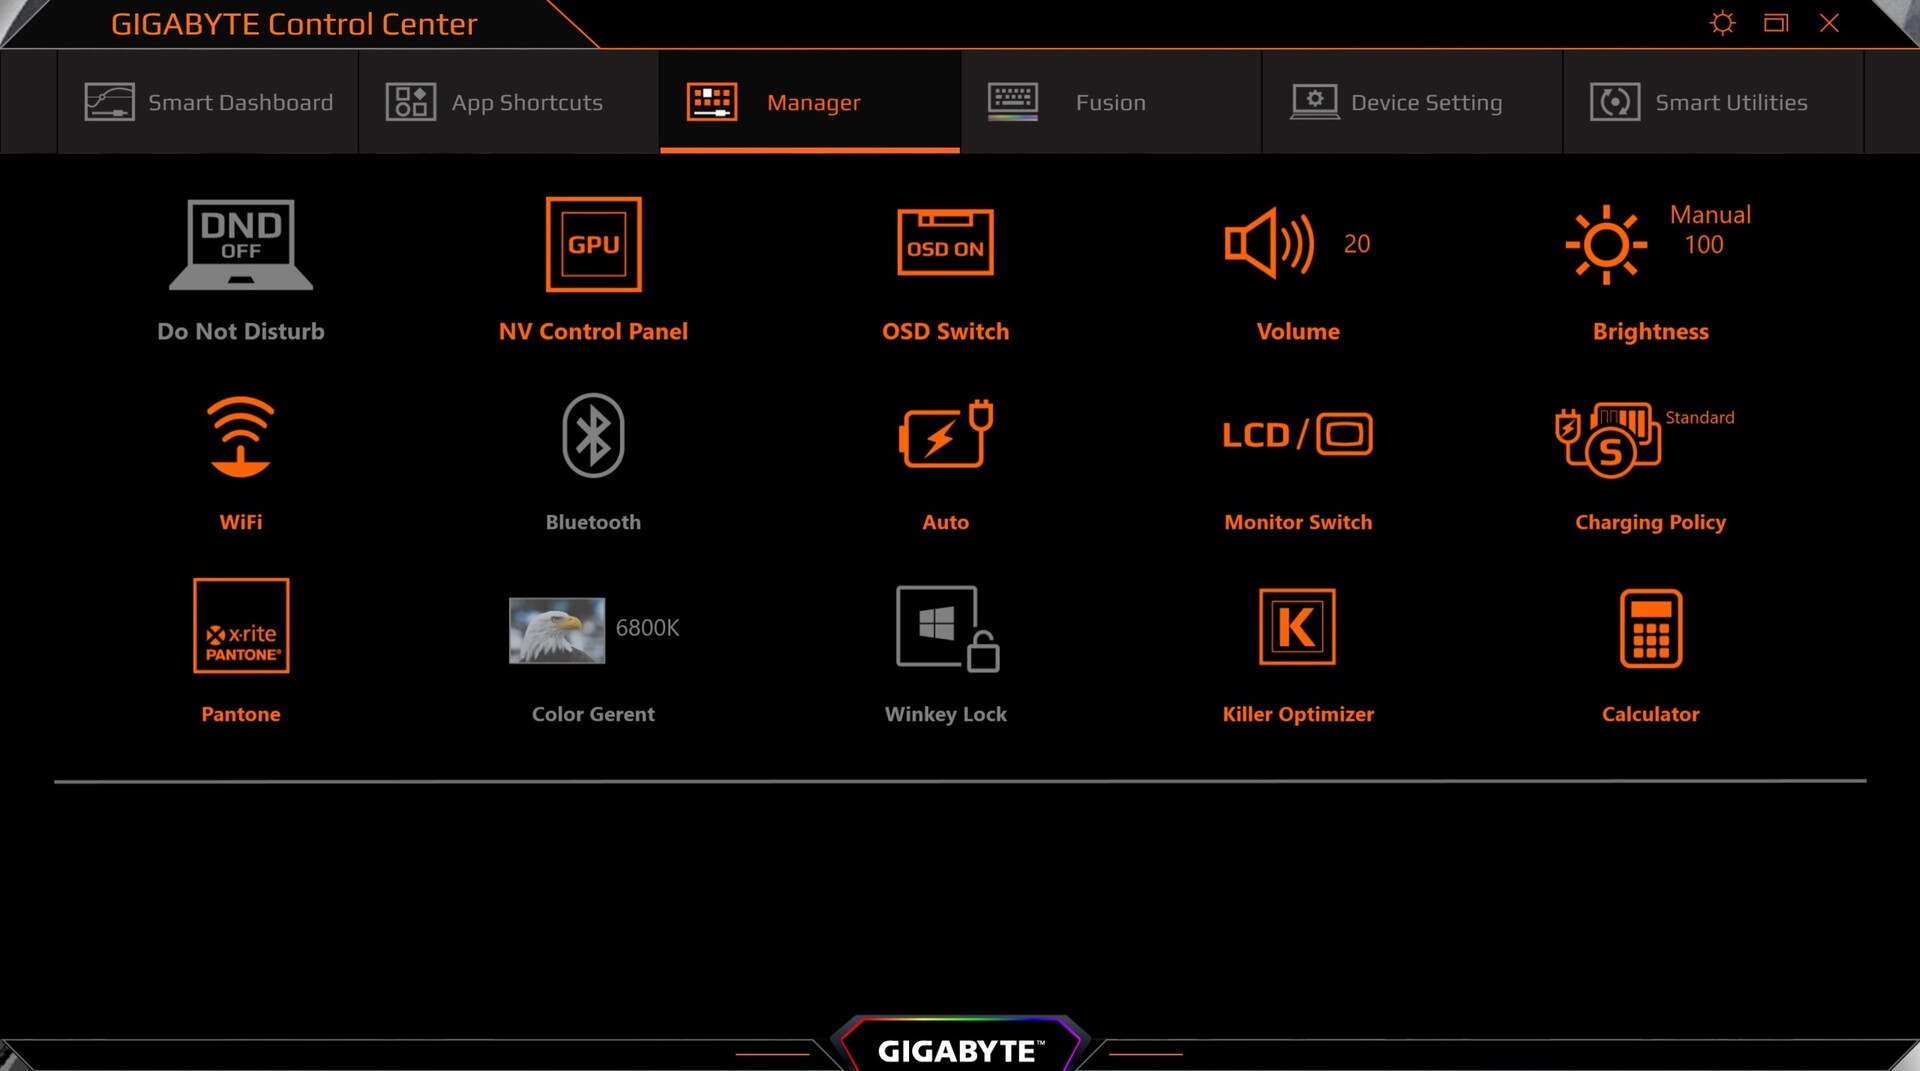
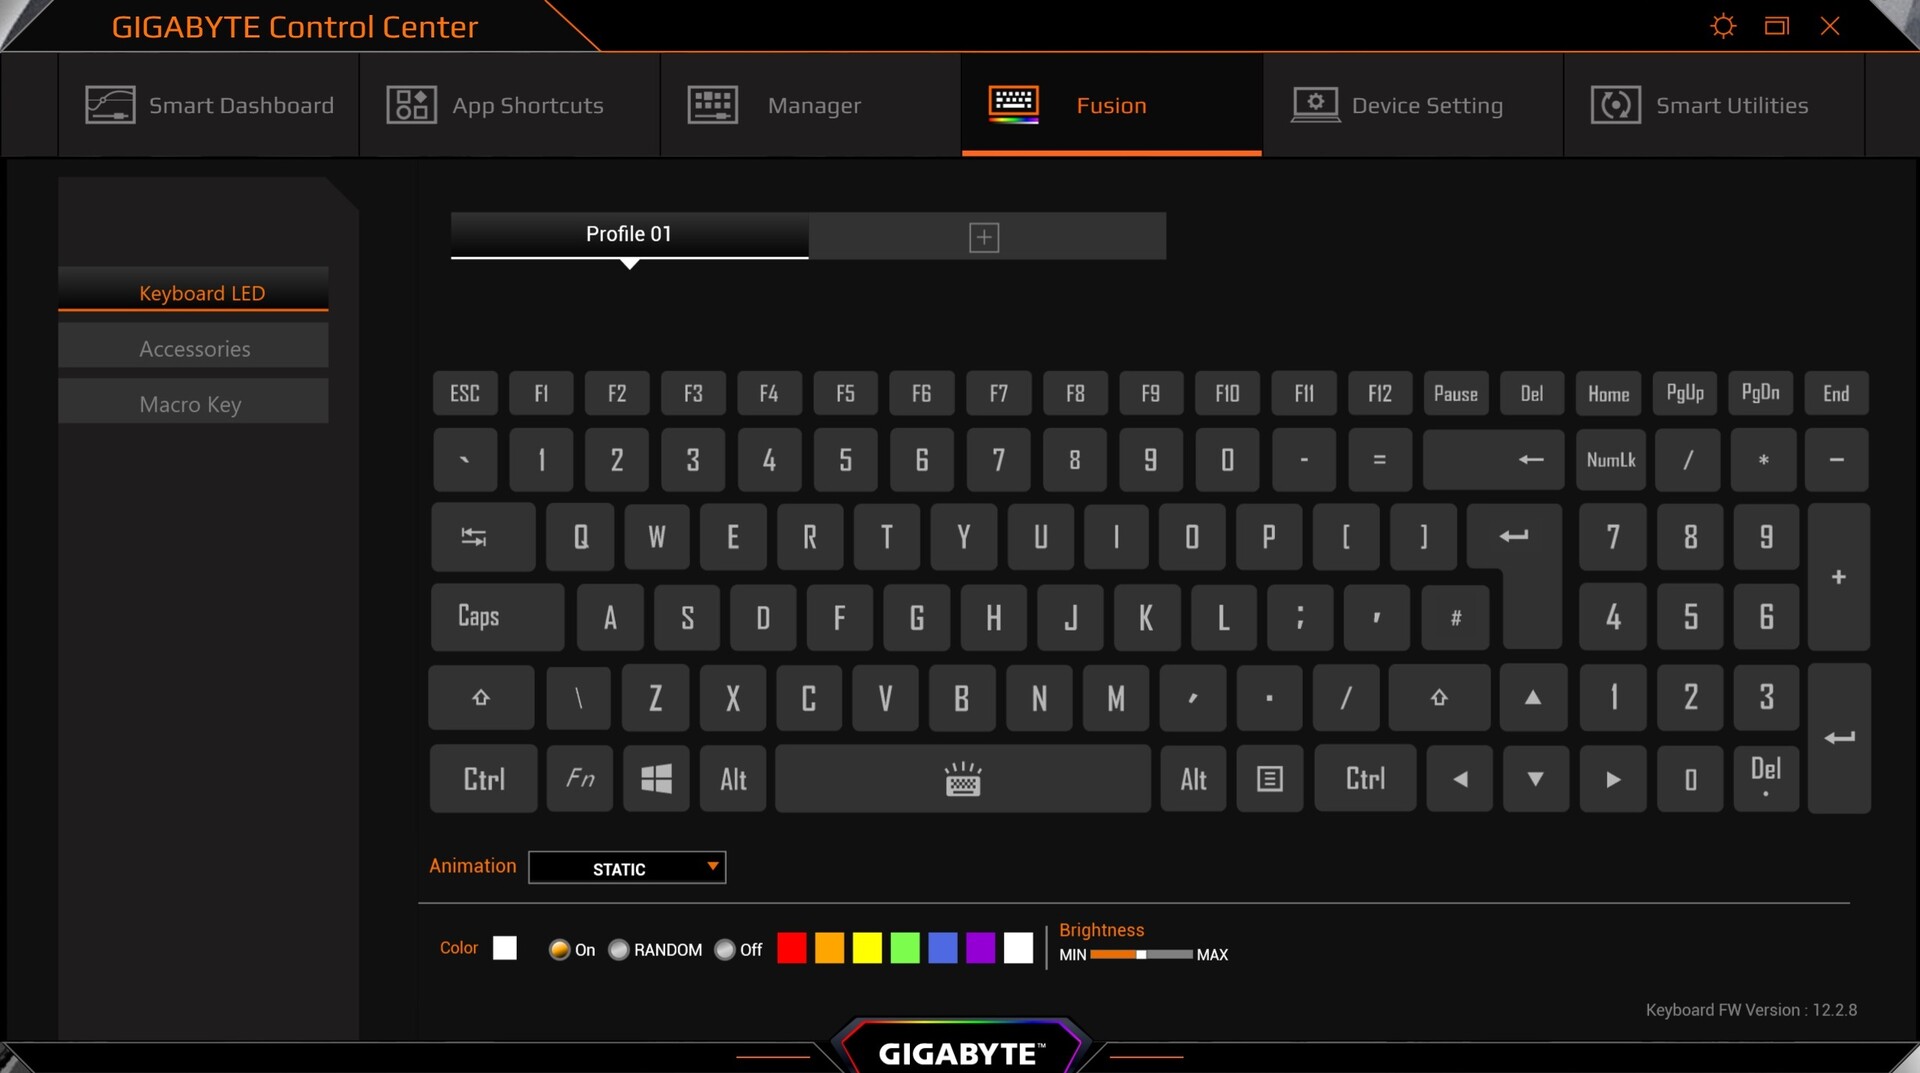
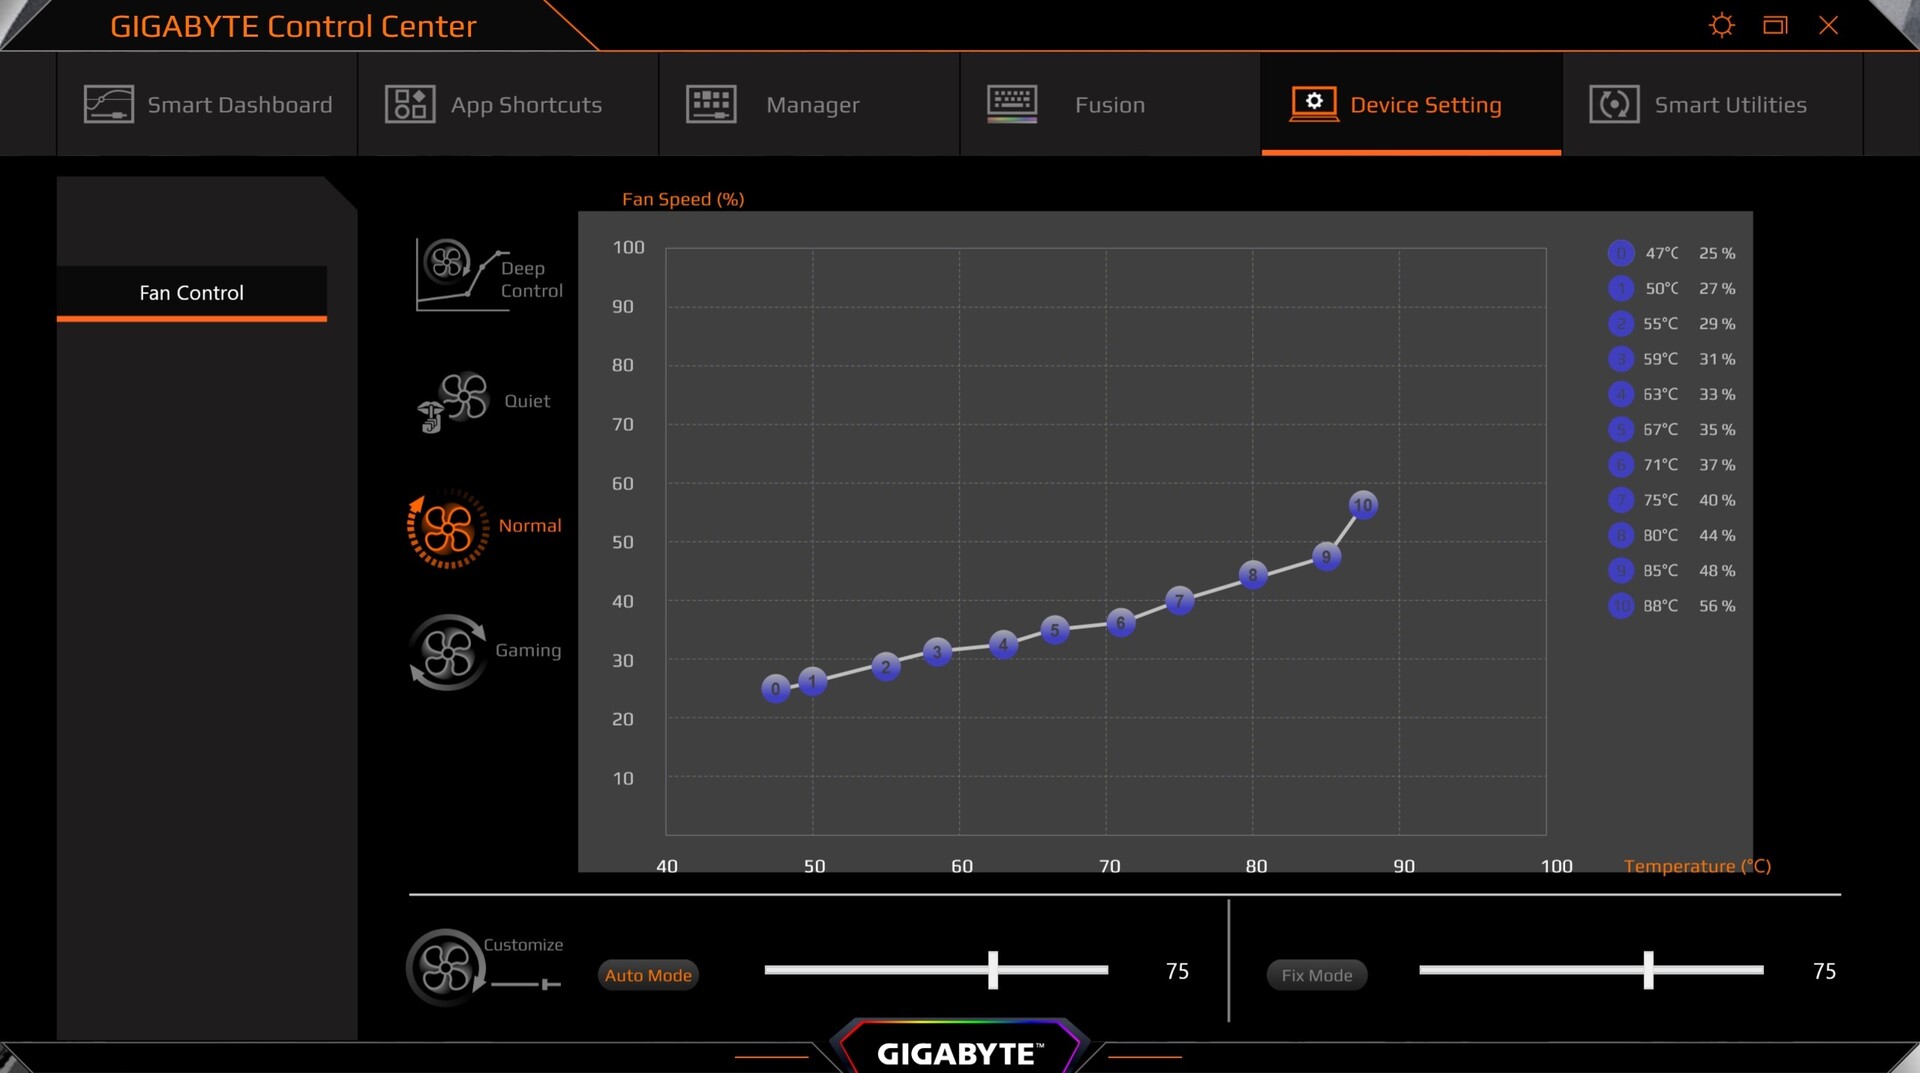
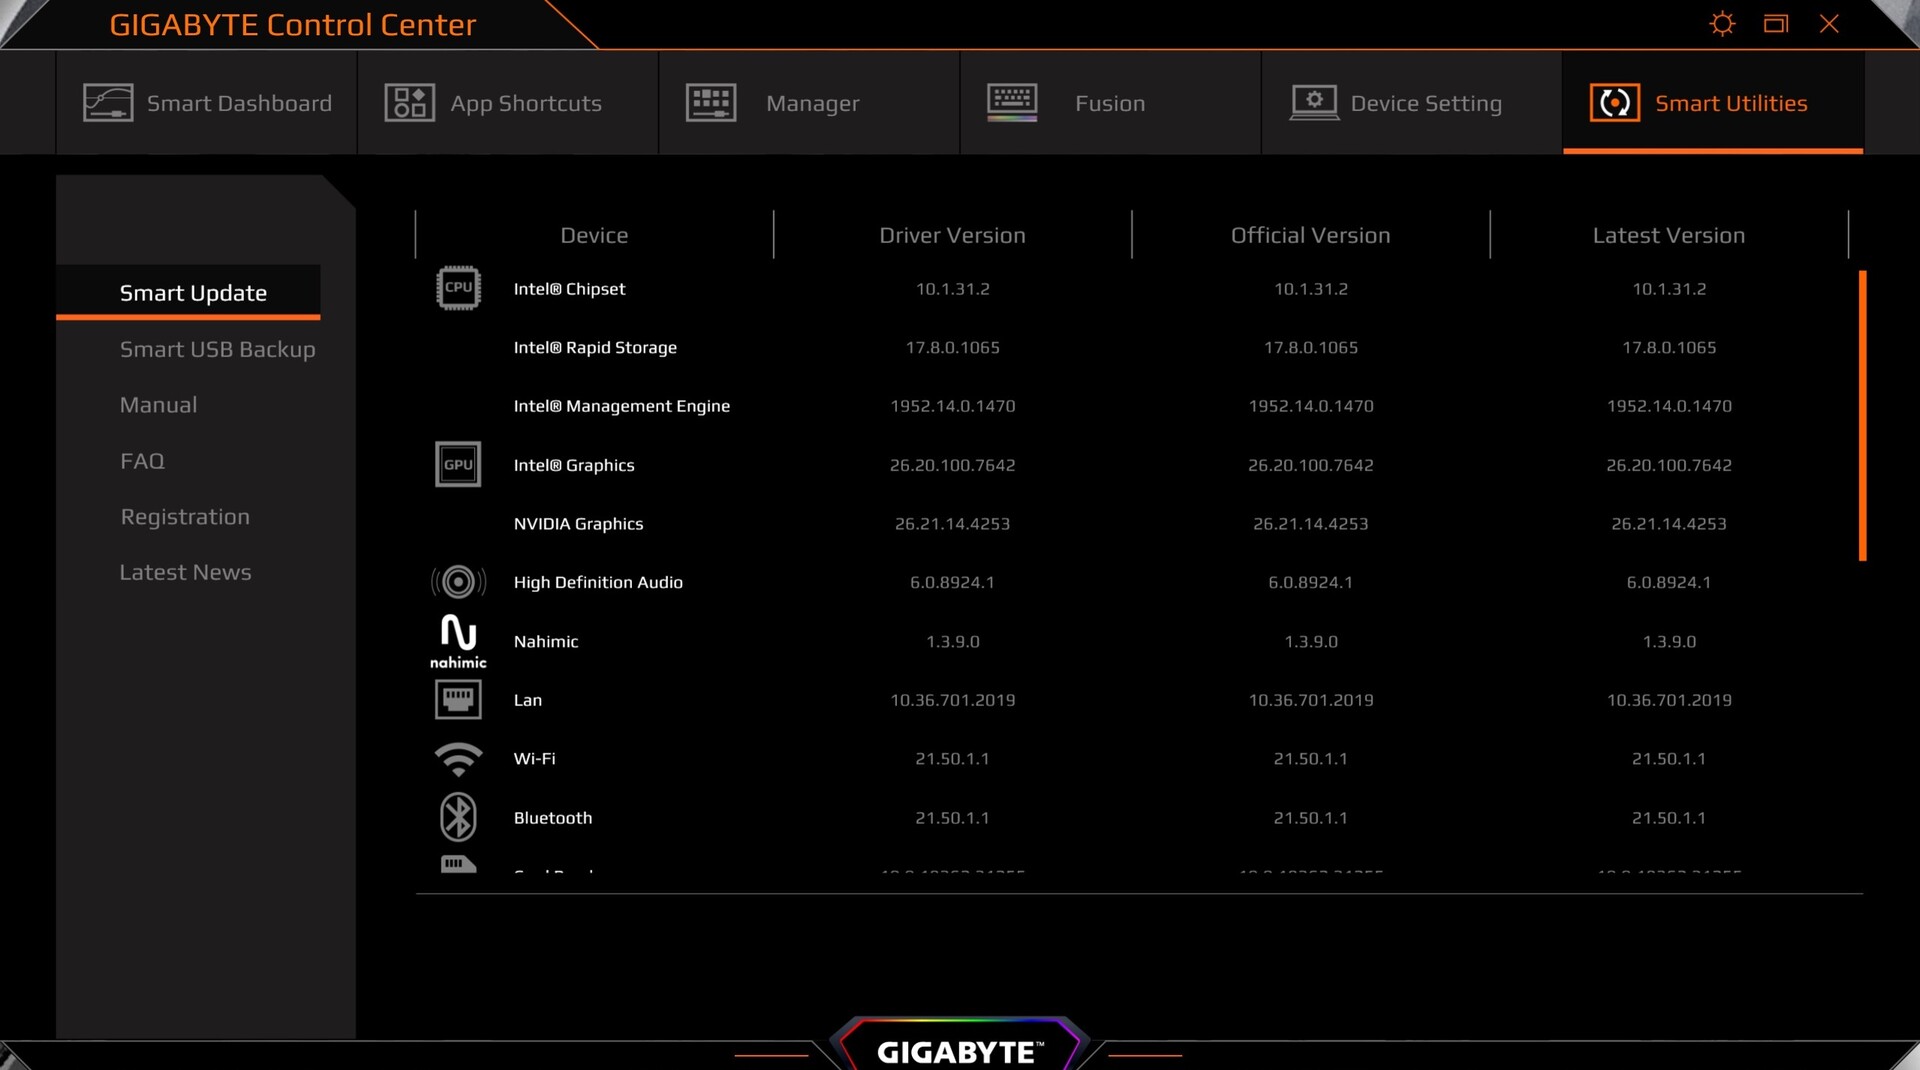
The preinstalled Control Center comes with a lot of settings options. Our tests use the "Auto" power profile (see screenshot #3) and were performed with Azure AI activated.
Performance
All editions of the Aero 15 OLED belong to the high-end segment. As already indicated, Gigabyte wants to attract professional users who are focused on video and photo-editing, for example, in addition to the gaming faction. Just to say it up front: The compact 15-incher manages this balancing act quite well.
Processor
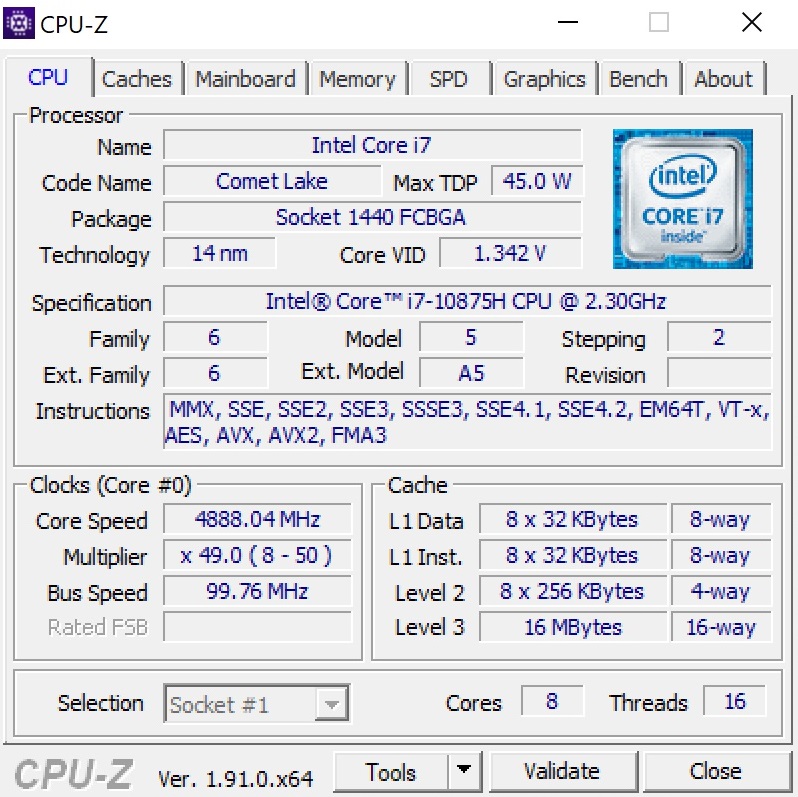
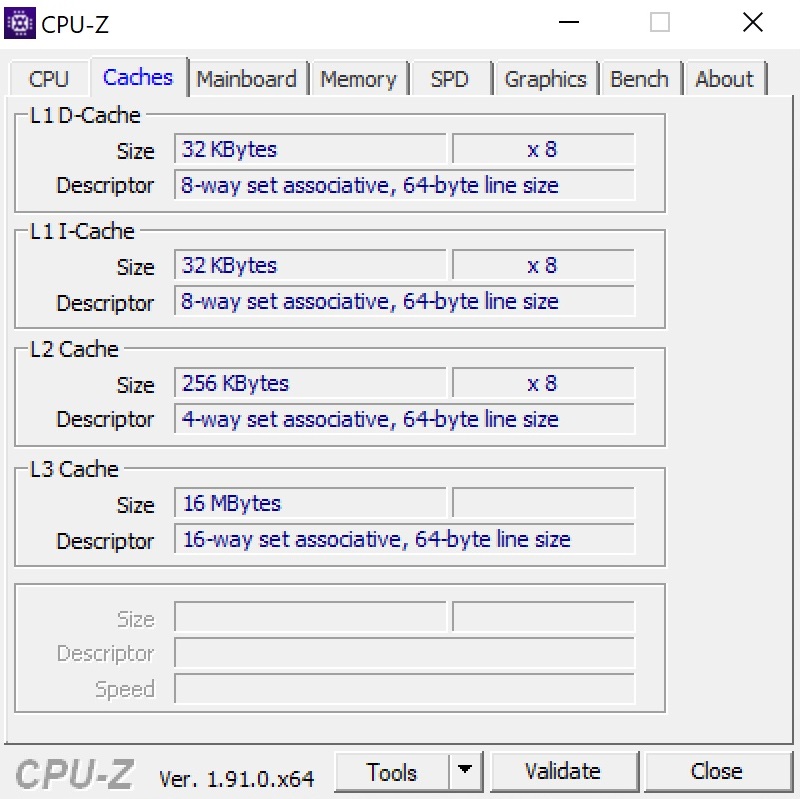
While the Core i9-10980HK seems a bit oversized in view of the laptop's dimensions, the Core i7-10875H is the best choice for users who would like to call an octa-core CPU from Intel their own. The Comet Lake chip, which is still manufactured in a 14 nm process (AMD is already at 7 nm), offers 16 MB of L3 cache and has a TDP of 45 watts. The octa-core processor can handle up to 16 threads in parallel through Hyper-Threading. The base clock speed is 2.3 GHz, but via Turbo Boost up to 5.1 GHz is possible in the ideal case.
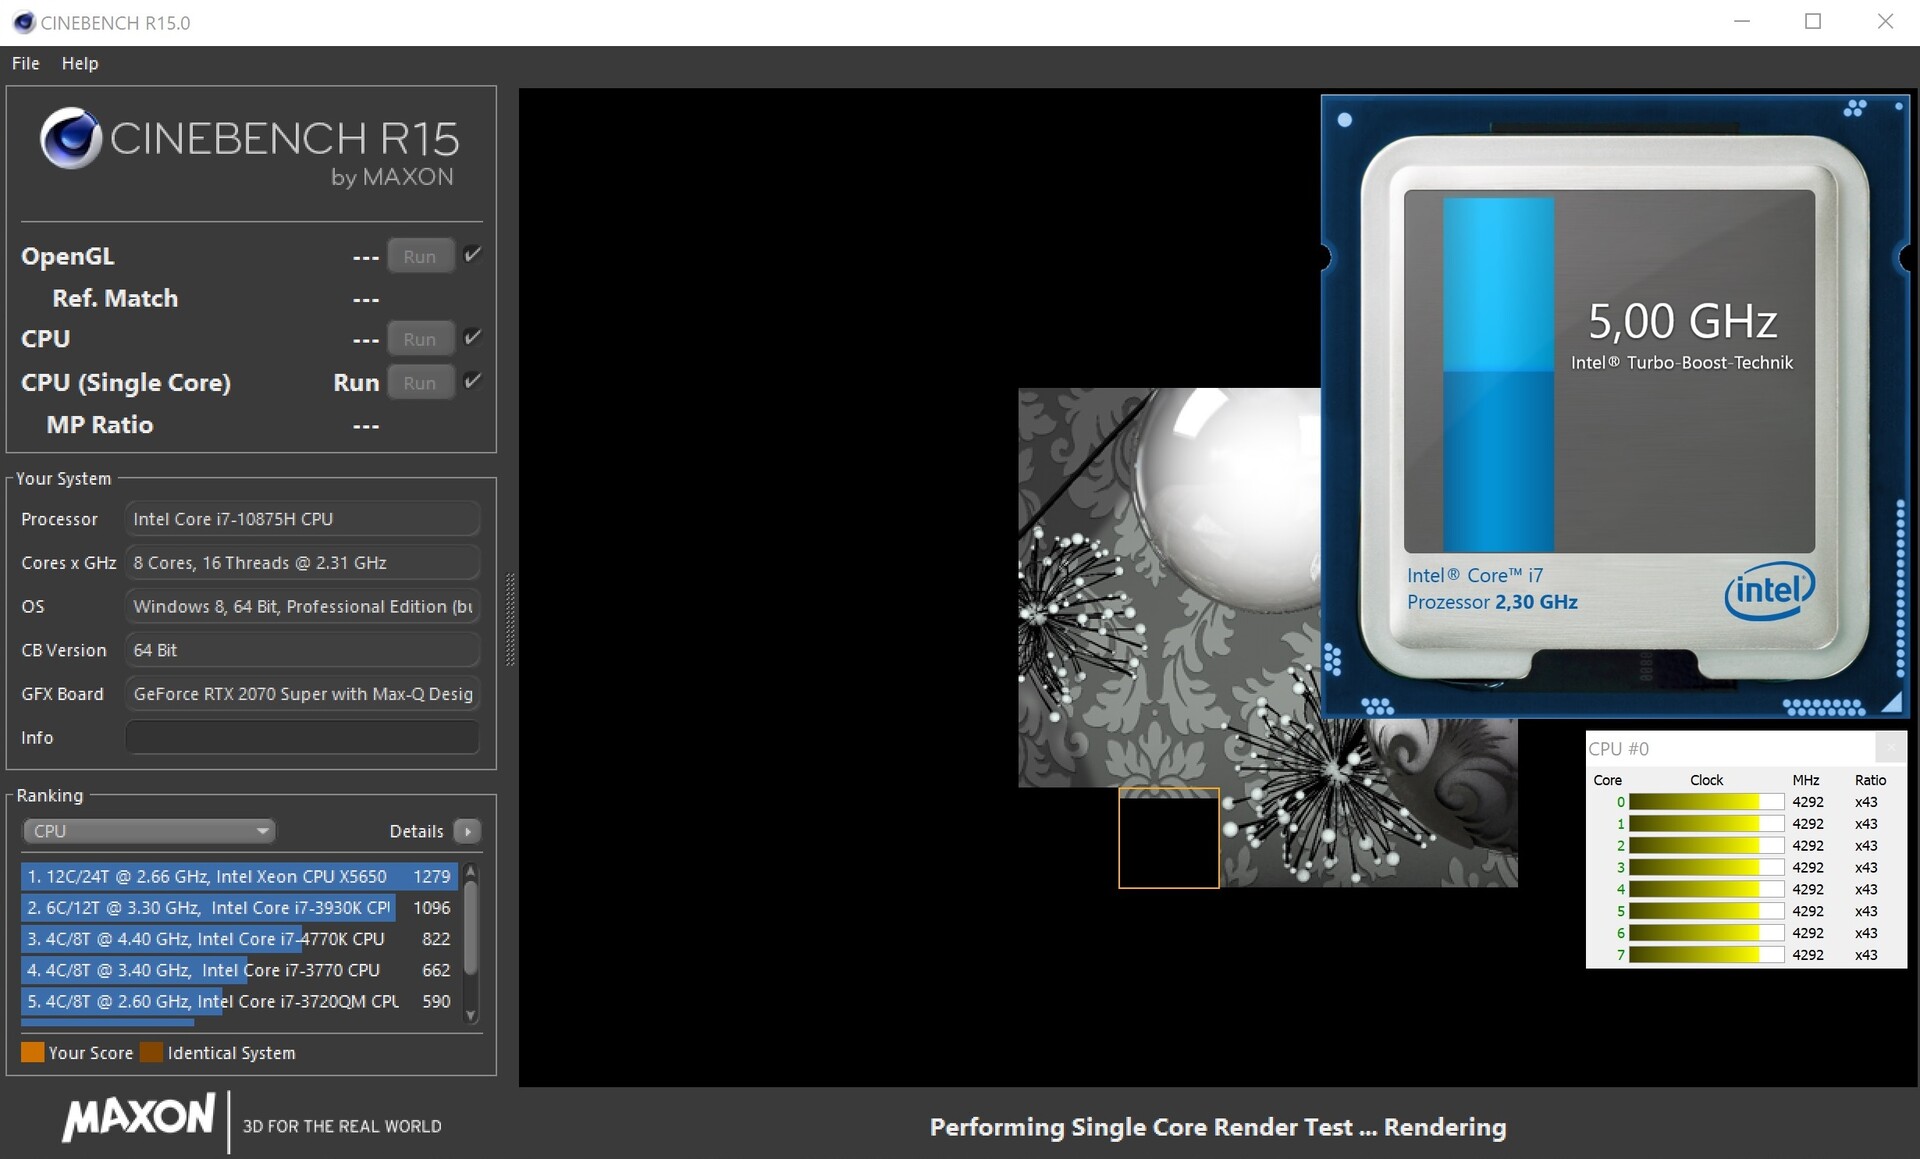
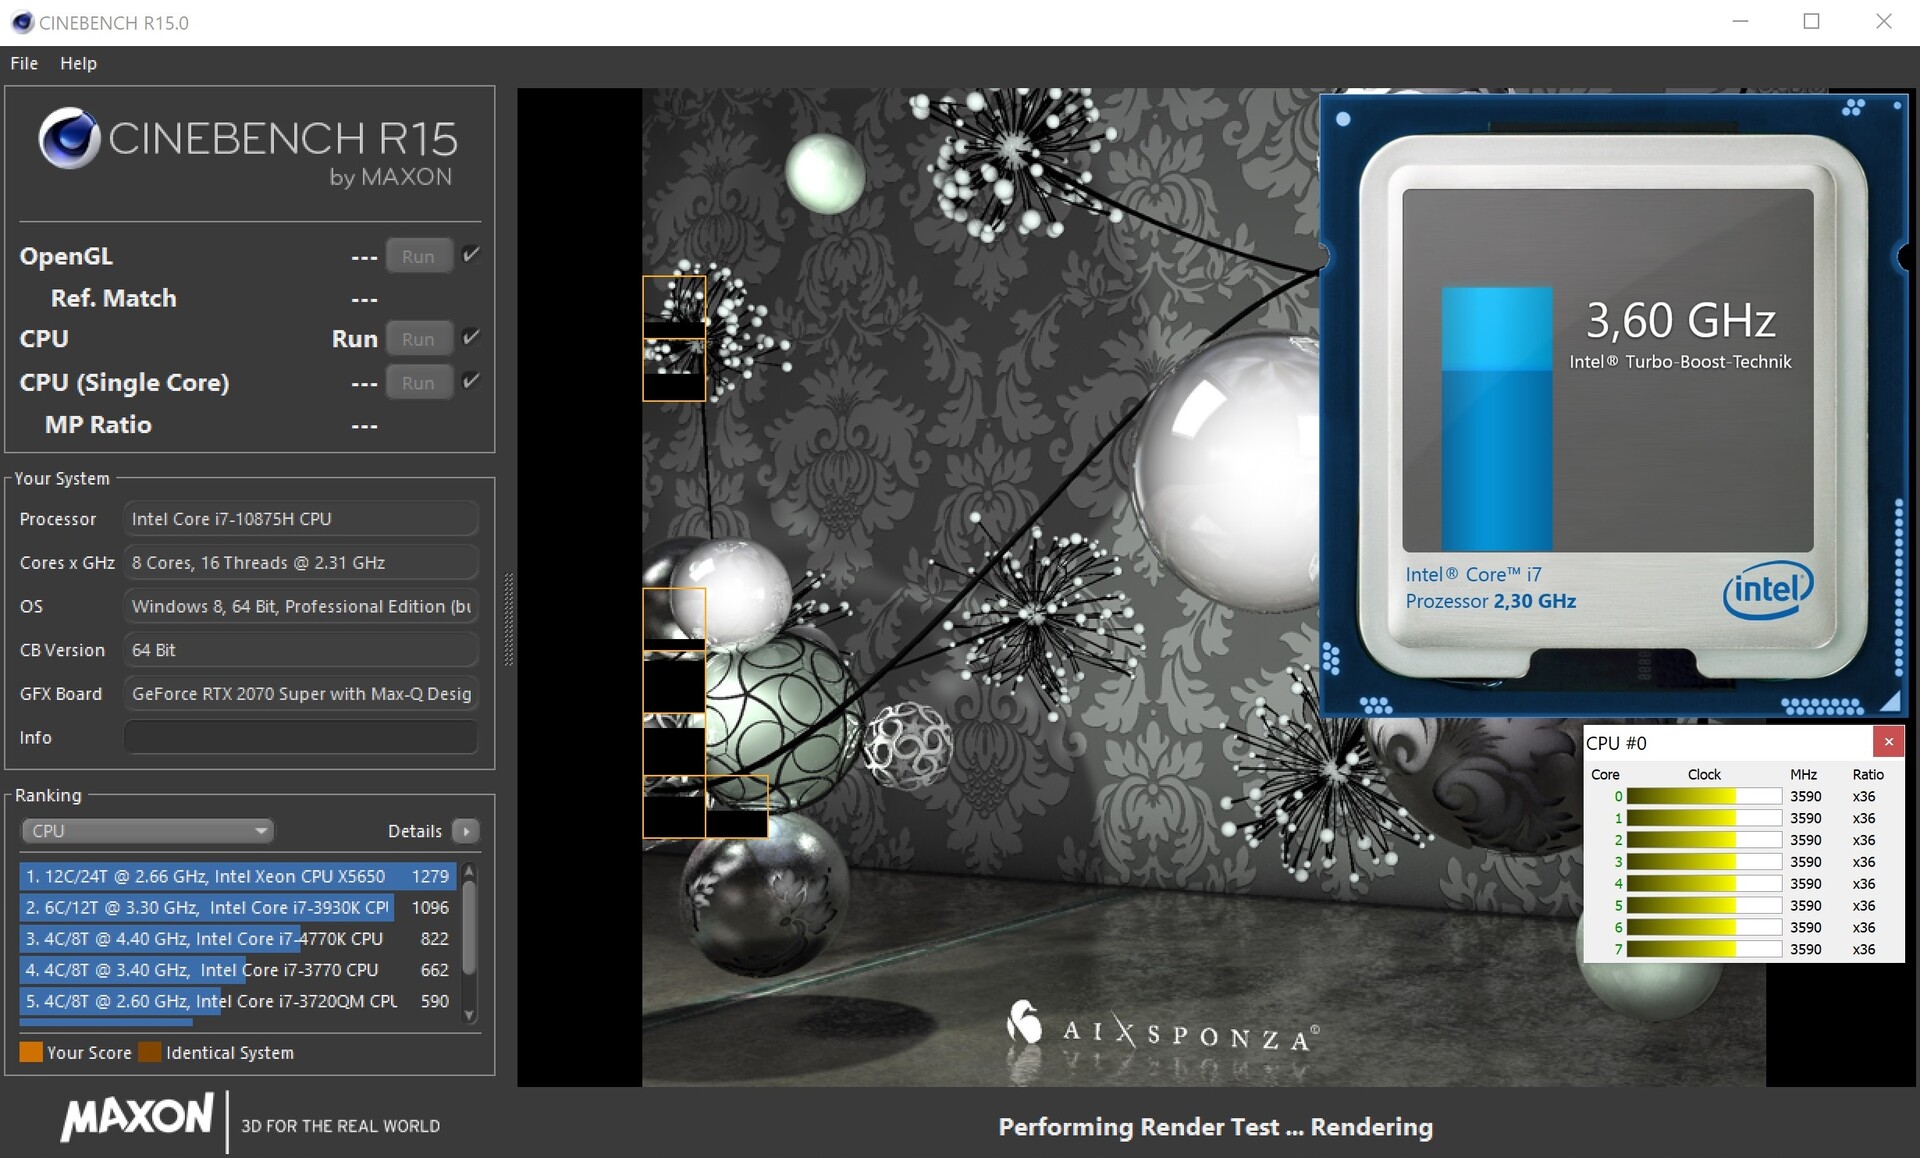
We have checked the i7-10875H's clock-speed behavior with the help of Cinebench R15. It turned out that the Turbo lagged a bit behind its capabilities. Even in the first run of the multi-core test, the clock rate drops from 4.1 to 4.3 to 3.5 to 3.6 GHz after a while, which causes a performance loss of over 10%. As the lower graph shows, performance is then relatively stable beginning with the second run and remains at a similar level. With the MSI GS66 competitor, the result doesn't drop quite as much, but the MSI device performs worse overall despite the actually more powerful CPU. You can see very clearly here that more does not necessarily mean better.
The Core i7-10875H clearly sprints past the old hexa-core favorite, the Core i7-9750H. In the Cinebench R20 multi-core test, the improvement amounts to 55% to 65%. However, gamers will be happy with the Core i7-10750H too.
| Blender - v2.79 BMW27 CPU | |
| MSI GS66 Stealth 10SFS | |
| Gigabyte Aero 15 OLED XB-8DE51B0SP | |
| 7-Zip 18.03 | |
| 7z b 4 -mmt1 | |
| Gigabyte Aero 15 OLED XB-8DE51B0SP | |
| MSI GS66 Stealth 10SFS | |
| 7z b 4 | |
| Gigabyte Aero 15 OLED XB-8DE51B0SP | |
| MSI GS66 Stealth 10SFS | |
| Geekbench 5.5 | |
| Single-Core | |
| Gigabyte Aero 15 OLED XB-8DE51B0SP | |
| MSI GS66 Stealth 10SFS | |
| Multi-Core | |
| Gigabyte Aero 15 OLED XB-8DE51B0SP | |
| MSI GS66 Stealth 10SFS | |
| HWBOT x265 Benchmark v2.2 - 4k Preset | |
| Gigabyte Aero 15 OLED XB-8DE51B0SP | |
| MSI GS66 Stealth 10SFS | |
| LibreOffice - 20 Documents To PDF | |
| MSI GS66 Stealth 10SFS | |
| Gigabyte Aero 15 OLED XB-8DE51B0SP | |
| R Benchmark 2.5 - Overall mean | |
| MSI GS66 Stealth 10SFS | |
| Gigabyte Aero 15 OLED XB-8DE51B0SP | |
* ... smaller is better
System performance
In terms of system performance, the Aero 15 OLED also makes itself comfortable at the top of the test field. 6,580 points in PCMark 10 means first place among the comparison devices, although there are hardly any differences from a subjective point of view.
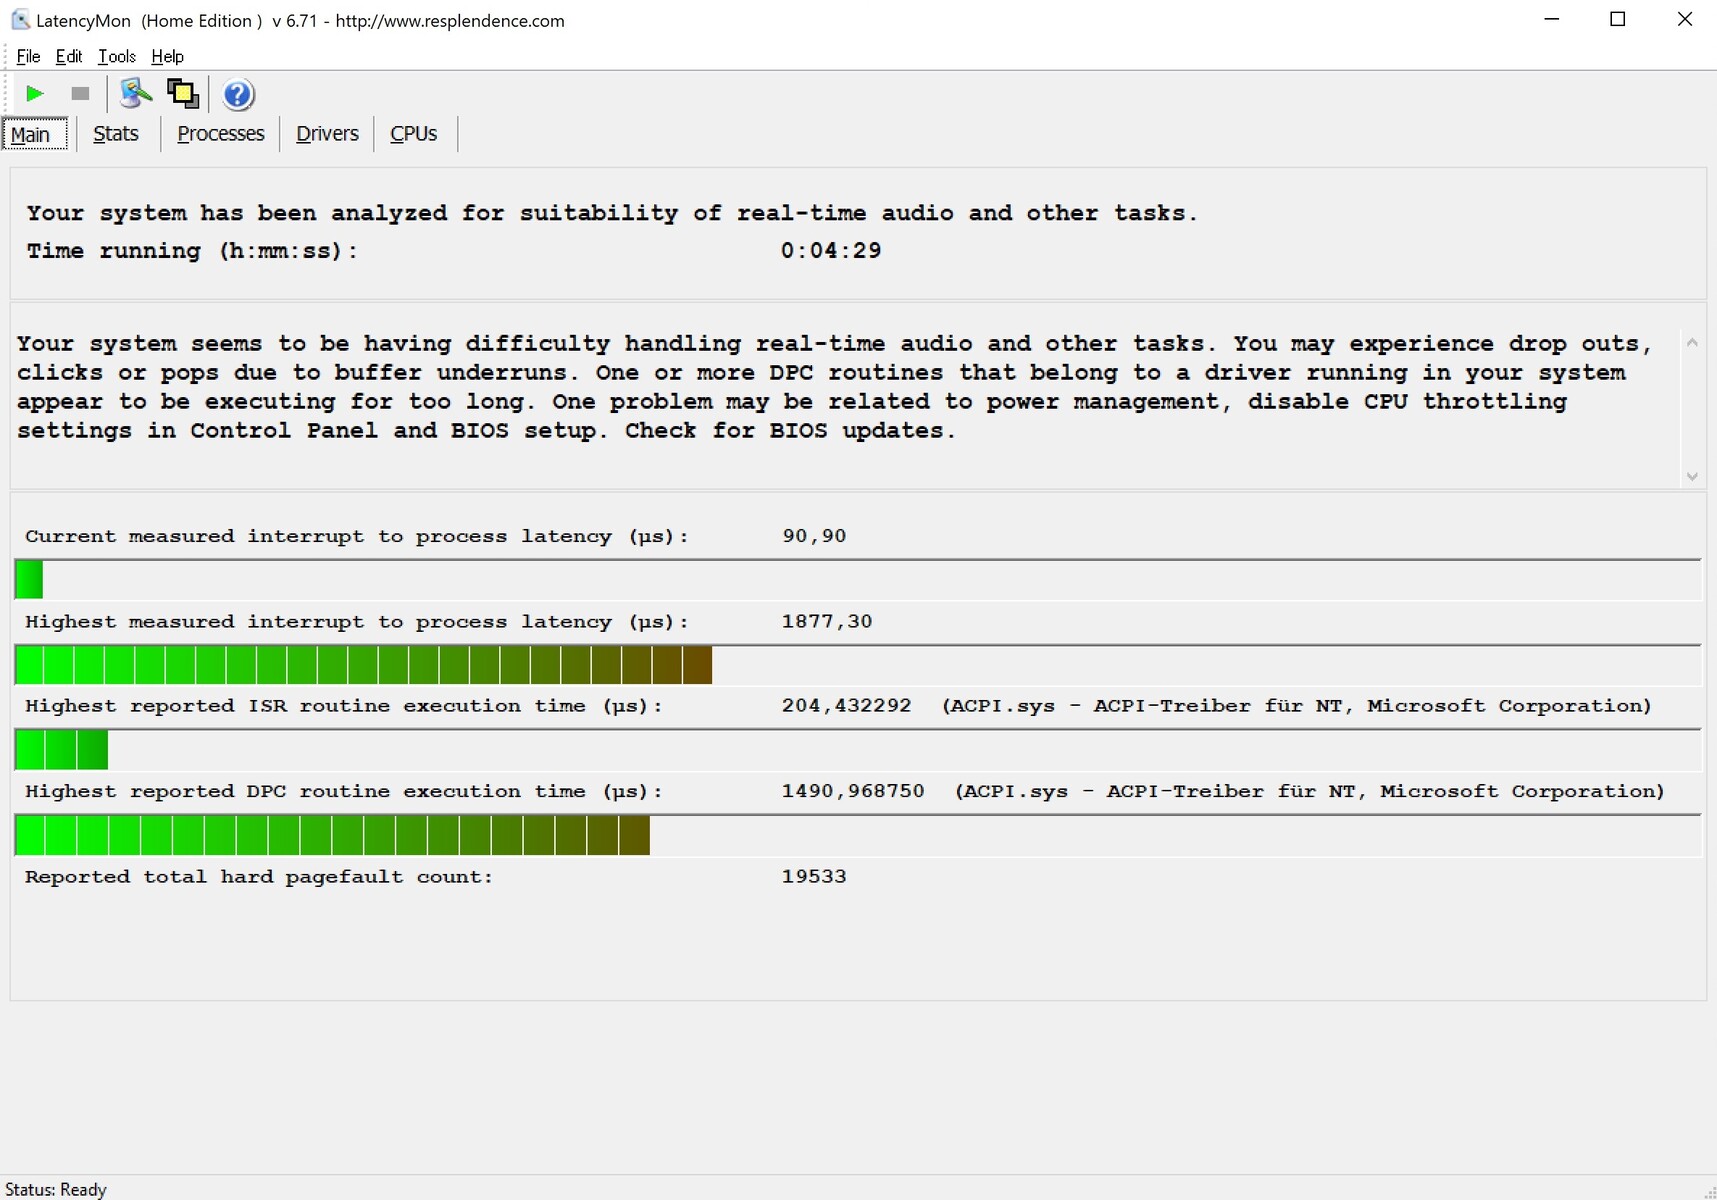
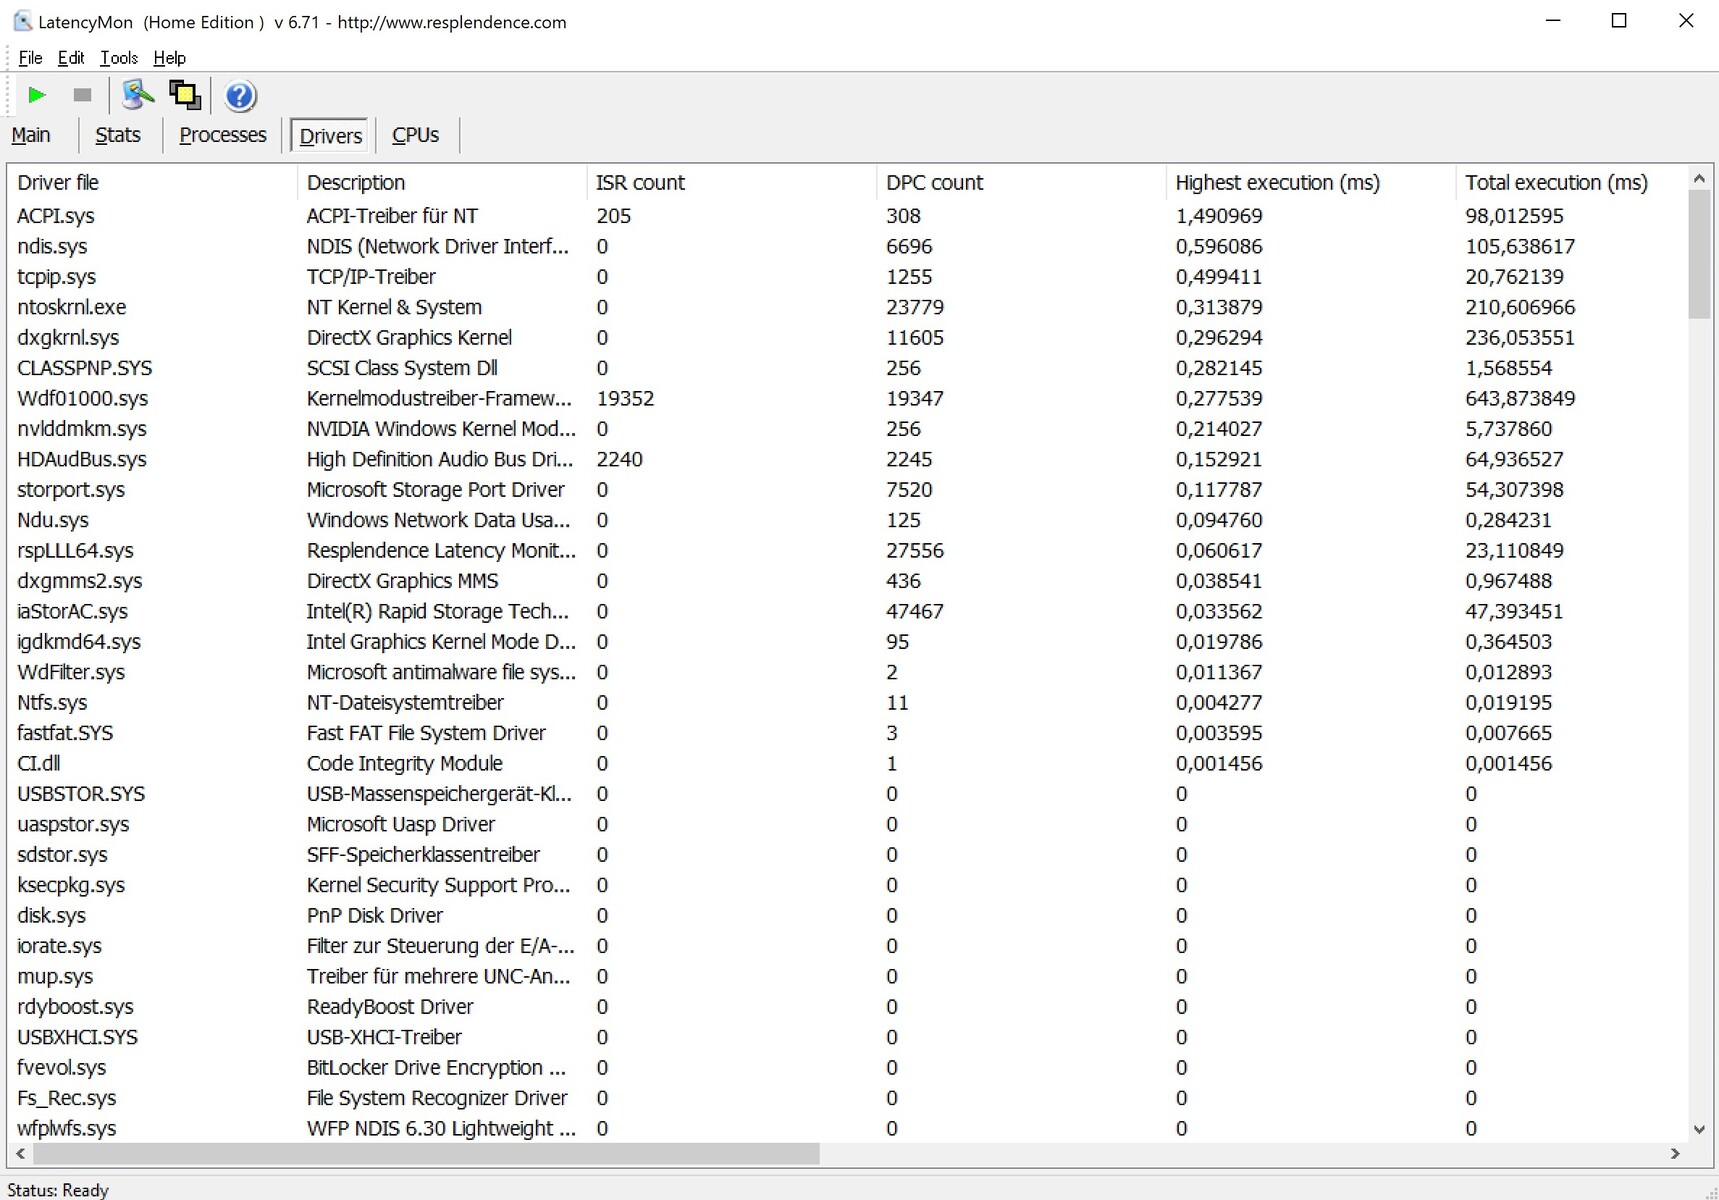
DPC latency
The latency is rather moderate and positions itself on the level of the MSI GS66 Stealth.
| DPC Latencies / LatencyMon - interrupt to process latency (max), Web, Youtube, Prime95 | |
| MSI GS66 Stealth 10SFS | |
| Gigabyte Aero 15 OLED XB-8DE51B0SP | |
* ... smaller is better
Storage
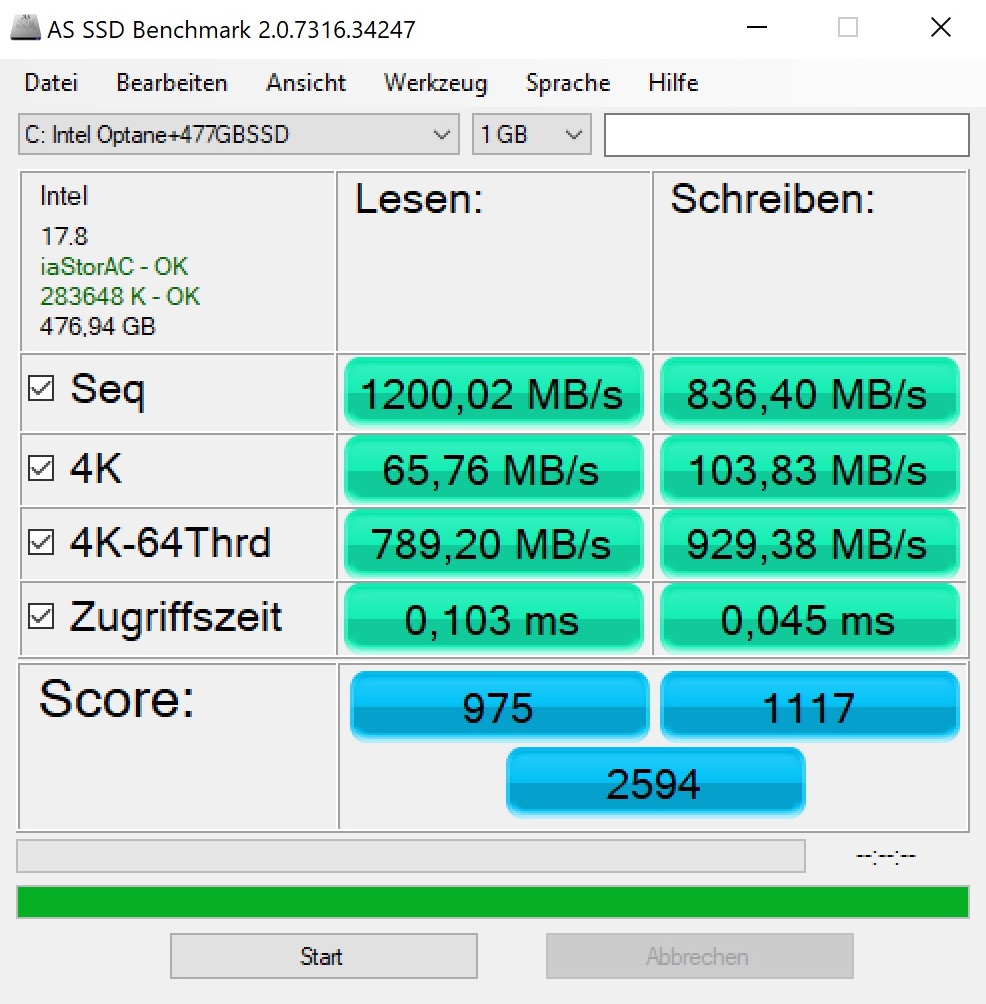
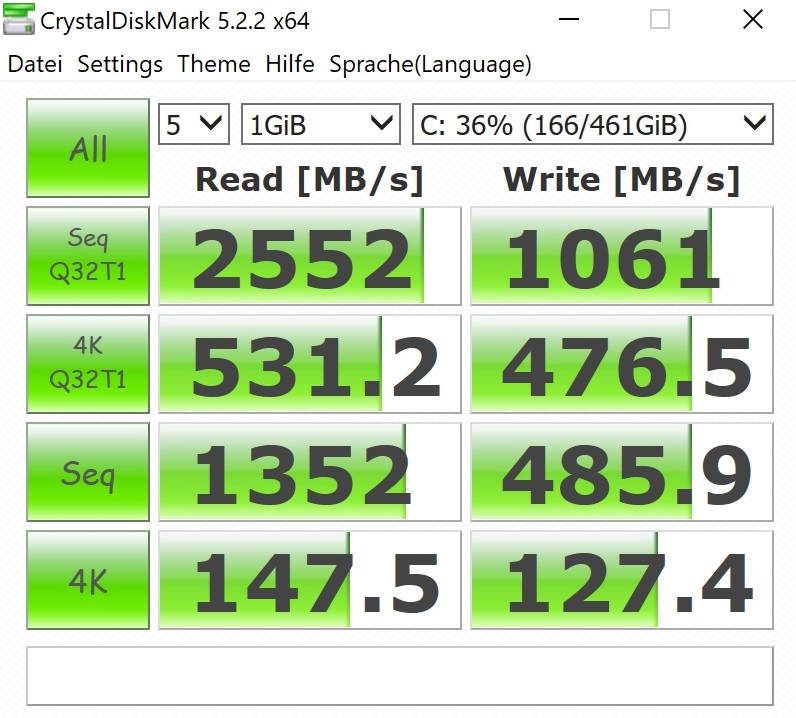
Surprisingly, Gigabyte has not used a "normal" PCIe SSD but an Optane model that combines a particularly fast 32 GB storage device (3D XPOINT) with a further 512 GB of storage (QLC 3D NAND). In practice, however, we couldn't determine any improvements - quite the contrary. On one hand, file transfers from our external SATA III SSD regularly dropped from over 300 MB/s to just 60 MB/s (tested on several USB ports with different cables). On the other hand, loading times in games often took longer than with classic SSDs. The storage benchmarks also show a tendency for the Optane drive to lag behind the competition.
| Gigabyte Aero 15 OLED XB-8DE51B0SP Intel Optane Memory H10 with Solid State Storage 32GB + 512GB HBRPEKNX0202A(L/H) | MSI GS66 Stealth 10SFS Samsung SSD PM981 MZVLB1T0HALR | Gigabyte Aero 15 OLED XA Intel SSD 600p SSDPEKKW512G8L | Acer Predator Triton 500 PT515-51-71PZ WDC PC SN720 SDAPNTW-512G | HP Omen X 2S 15-dg0075cl WDC PC SN720 SDAPNTW-1T00 | Schenker XMG Neo 15 XNE15M19 Seagate FireCuda 510 SSD ZP1000GM30001 | |
|---|---|---|---|---|---|---|
| CrystalDiskMark 5.2 / 6 | 62% | 34% | 62% | 70% | 28% | |
| Write 4K (MB/s) | 127.4 | 131.3 3% | 126.7 -1% | 108.8 -15% | 137.4 8% | 108.7 -15% |
| Read 4K (MB/s) | 147.5 | 45.84 -69% | 66.1 -55% | 40.31 -73% | 41.37 -72% | 41.4 -72% |
| Write Seq (MB/s) | 485.9 | 2370 388% | 1538 217% | 2488 412% | 2500 415% | 1083 123% |
| Read Seq (MB/s) | 1352 | 1509 12% | 2269 68% | 1916 42% | 1576 17% | 917 -32% |
| Write 4K Q32T1 (MB/s) | 476.5 | 481.5 1% | 456.7 -4% | 382.4 -20% | 446.7 -6% | 468.5 -2% |
| Read 4K Q32T1 (MB/s) | 531 | 560 5% | 554 4% | 421.8 -21% | 522 -2% | 530 0% |
| Write Seq Q32T1 (MB/s) | 1061 | 2392 125% | 1541 45% | 2542 140% | 2796 164% | 3057 188% |
| Read Seq Q32T1 (MB/s) | 2552 | 3232 27% | 2567 1% | 3320 30% | 3415 34% | 3422 34% |

Graphics card
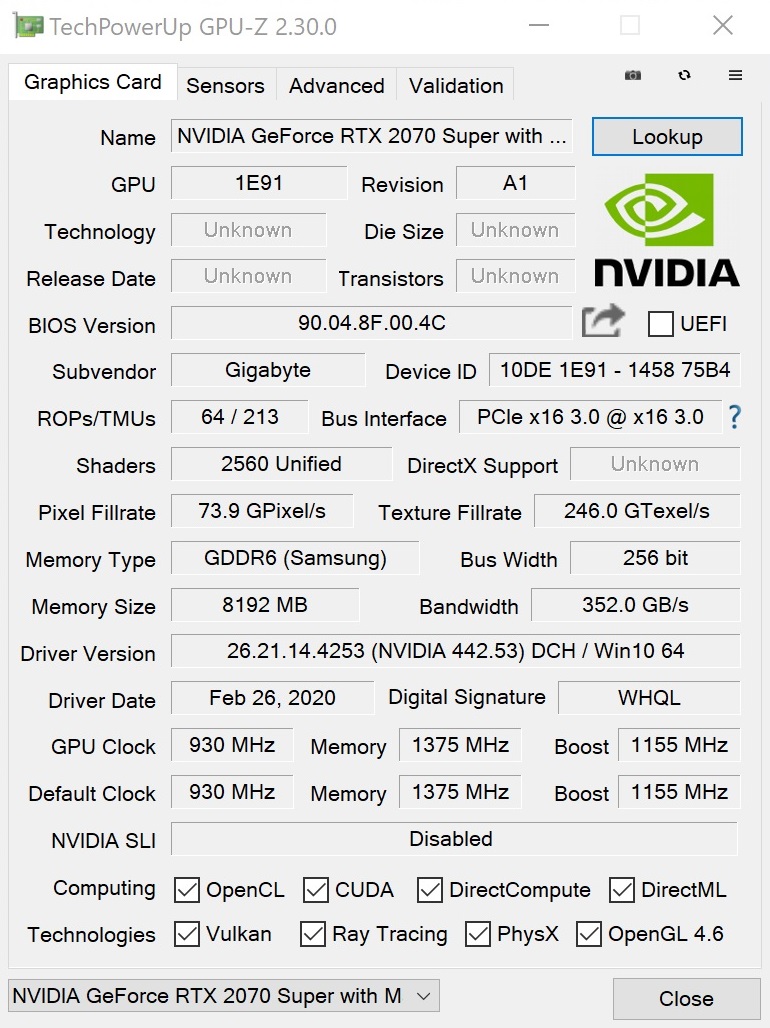
The GeForce RTX 2070 Super Max-Q is a particularly efficient and energy-saving version of the standard RTX 2070 Super. While the number of shaders (2,560 CUDA cores) and the size of the VRAM (8 GB GDDR6) are identical, the Max-Q edition has to make do with a lower clock rate. Instead of 1,140 MHz, there's only 930 MHz here.
| 3DMark 11 Performance | 24383 points | |
| 3DMark Cloud Gate Standard Score | 47119 points | |
| 3DMark Fire Strike Score | 18947 points | |
| 3DMark Time Spy Score | 8066 points | |
Help | ||
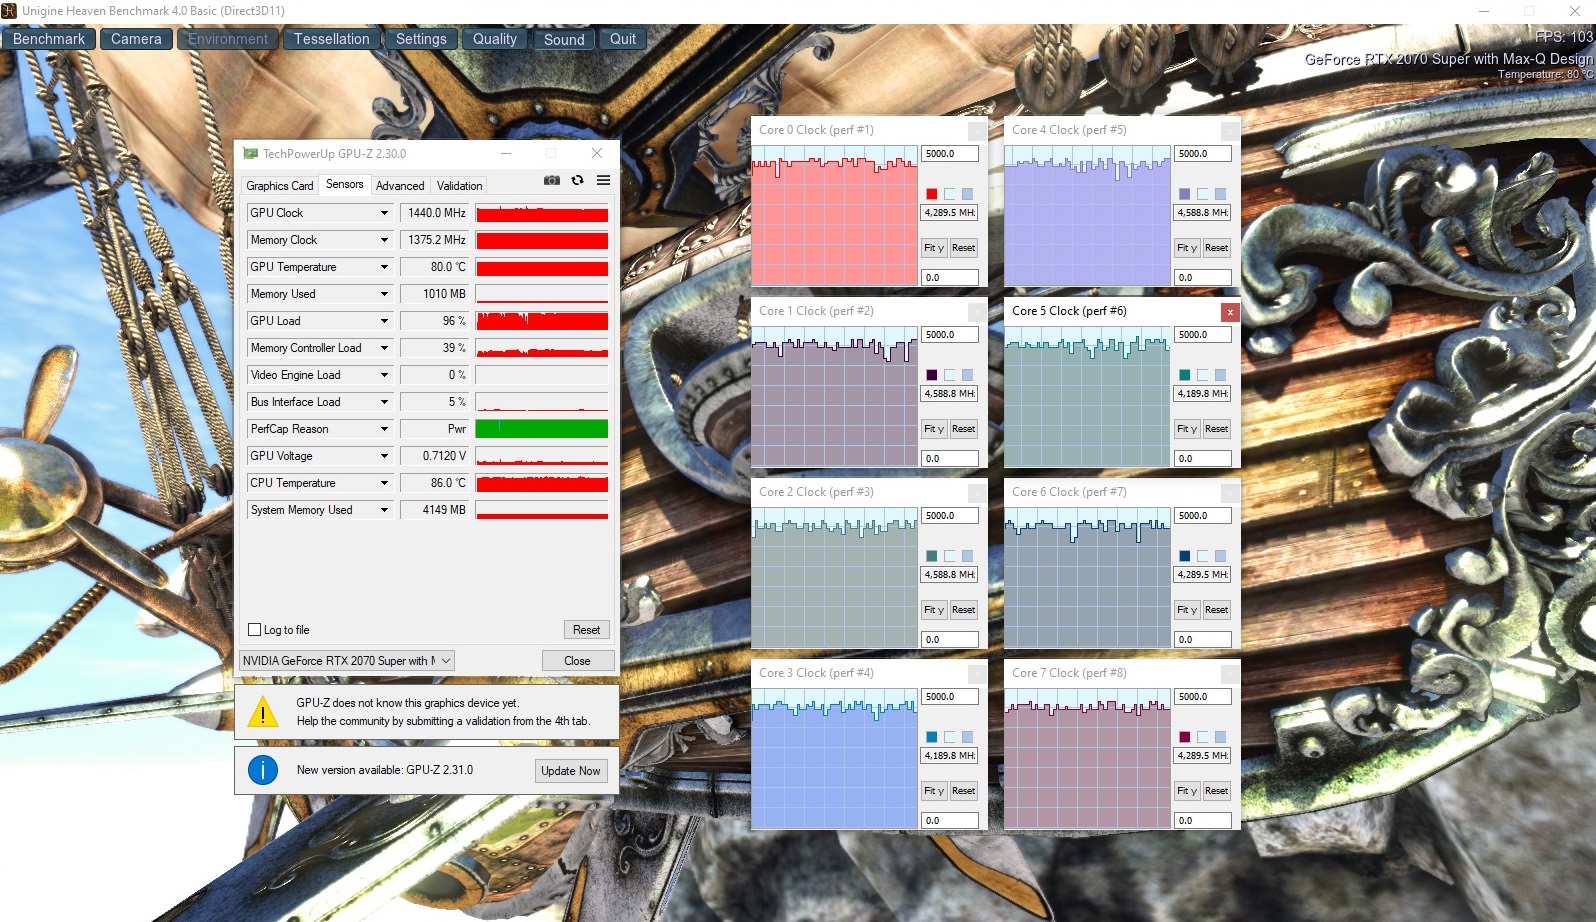
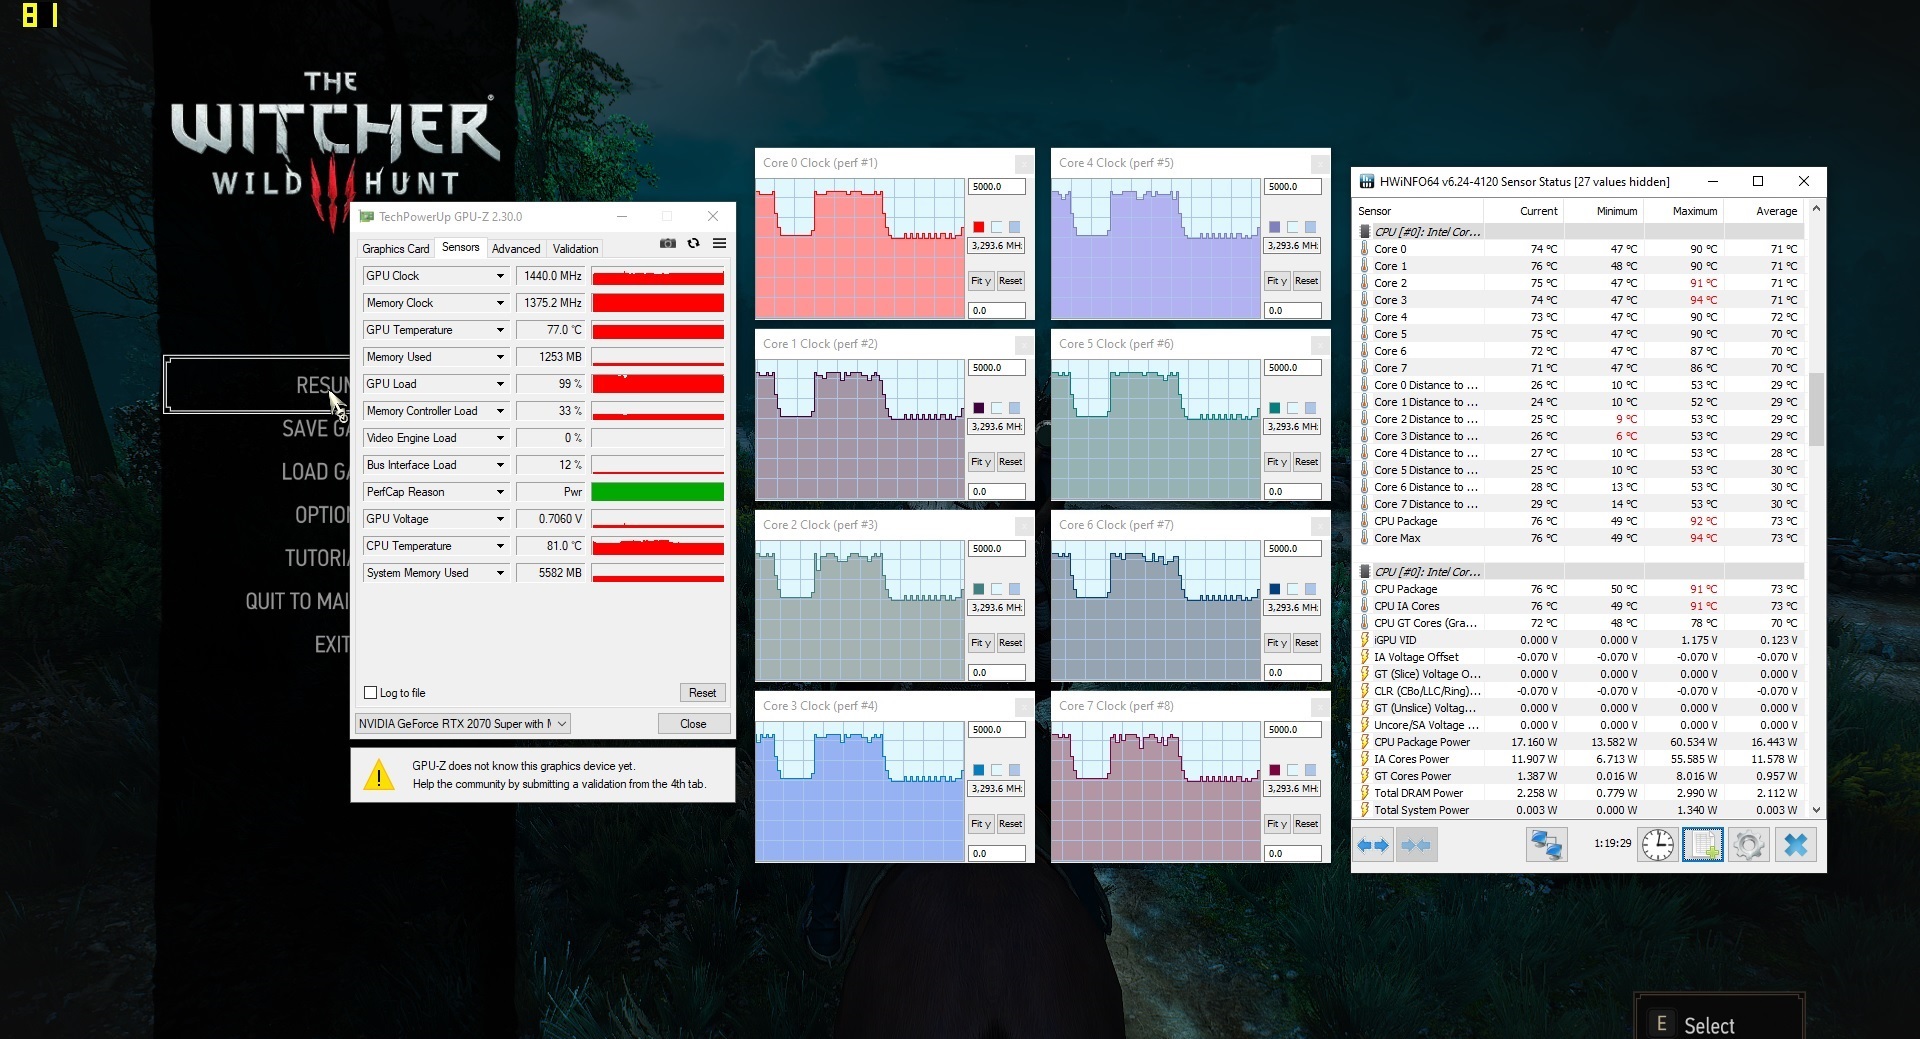
Thanks to the automatic GPU boost, however, the clock rate is raised well above the base value under load. In this way, we could draw an average of 1,440 MHz from the Turing GPU (12 nm process) in 3D usage (a maximum of 1,860 MHz in the GPU-Z tool's render test). As our 60-minute test with the role-playing game The Witcher 3 proves, performance is kept quite constant even over a longer period of time. There weren't any frame-rate drops or other abnormalities.
The fact that the 15-incher is about 10% ahead of the MSI GS66 Stealth, which also contains an RTX 2070 Super Max-Q, in the 3DMark tests is probably related to the cooling system on one hand and to the Dynamic Boost feature (reduces the CPU's TDP in favor of the GPU) on the other hand; the latter runs by default in the Gigabyte laptop and is a very useful technology for gamers since most games are graphically limited - at least at higher settings or resolutions.
Gaming performance
Despite the first-class performance, the GeForce RTX 2070 Super Max-Q doesn't manage to run all modern titles smoothly at maximum details and at the native 3840x2160 pixels. Demanding games like Red Dead Redemption 2, Anno 1800, Control and Borderlands 3 end in a real stuttering mess. In the QHD area, i.e. with 2560x1440 pixels (which is unfortunately not supported by the OLED display), the situation looks much better. Games that run below 40 FPS are rather the exception than the rule. 1920x1080 pixels is usually a breeze for the high-end chip (60 FPS+).
| The Witcher 3 | |
| 1920x1080 High Graphics & Postprocessing (Nvidia HairWorks Off) | |
| Gigabyte Aero 15 OLED XB-8DE51B0SP | |
| HP Omen X 2S 15-dg0075cl | |
| MSI GS66 Stealth 10SFS | |
| Acer Predator Triton 500 PT515-51-71PZ | |
| Schenker XMG Neo 15 XNE15M19 | |
| 1920x1080 Ultra Graphics & Postprocessing (HBAO+) | |
| Gigabyte Aero 15 OLED XB-8DE51B0SP | |
| MSI GS66 Stealth 10SFS | |
| HP Omen X 2S 15-dg0075cl | |
| Acer Predator Triton 500 PT515-51-71PZ | |
| Gigabyte Aero 15 OLED XA | |
| Schenker XMG Neo 15 XNE15M19 | |
| low | med. | high | ultra | QHD | 4K | |
|---|---|---|---|---|---|---|
| GTA V (2015) | 182 | 176 | 161 | 91.3 | 73.1 | |
| The Witcher 3 (2015) | 152 | 79.1 | 52.9 | |||
| Dota 2 Reborn (2015) | 157.8 | 148.3 | 140.9 | 132.3 | ||
| X-Plane 11.11 (2018) | 122 | 106 | 89.3 | 67.8 | ||
| Shadow of the Tomb Raider (2018) | 110 | 100 | 68 | 35 | ||
| Battlefield V (2018) | 139 | 130 | 100 | 58.2 | ||
| Far Cry New Dawn (2019) | 110 | 98 | 80 | 45 | ||
| Metro Exodus (2019) | 75.4 | 60.4 | 46.7 | 29.1 | ||
| The Division 2 (2019) | 105 | 77 | 54 | 29 | ||
| Anno 1800 (2019) | 84.2 | 46.8 | 37 | 21.5 | ||
| Control (2019) | 60.2 | 40.6 | 23.8 | |||
| Borderlands 3 (2019) | 84.4 | 64.8 | 45.6 | 24.5 | ||
| Ghost Recon Breakpoint (2019) | 92 | 69 | 50 | 29 | ||
| Red Dead Redemption 2 (2019) | 65.7 | 42.4 | 34.3 | 22 |
Emissions
Noise emissions
In the early days, Max-Q laptops were not only known for their moderate power consumption but also for their moderate noise levels. But the latter phenomenon hasn't happened for quite some time now. The Aero 15 OLED clearly draws attention under load too. 48 to 54 dB suggests the use of headphones.
As long as you use the auto mode, the fans are also audible in idle usage (34 to 36 dB) and tend to accelerate towards 40 dB at times, which isn't always comprehensible.
Noise level
| Idle |
| 34 / 36 / 41 dB(A) |
| Load |
| 48 / 54 dB(A) |
 | ||
30 dB silent 40 dB(A) audible 50 dB(A) loud |
||
min: | ||
| Gigabyte Aero 15 OLED XB-8DE51B0SP i7-10875H, GeForce RTX 2070 Super Max-Q | MSI GS66 Stealth 10SFS i9-10980HK, GeForce RTX 2070 Super Max-Q | Gigabyte Aero 15 OLED XA i7-9750H, GeForce RTX 2070 Max-Q | Acer Predator Triton 500 PT515-51-71PZ i7-9750H, GeForce RTX 2070 Max-Q | HP Omen X 2S 15-dg0075cl i7-9750H, GeForce RTX 2070 Max-Q | Schenker XMG Neo 15 XNE15M19 i7-9750H, GeForce RTX 2070 Max-Q | |
|---|---|---|---|---|---|---|
| Noise | 1% | -1% | 5% | 9% | 3% | |
| off / environment * (dB) | 30 | 30 -0% | 30 -0% | 30 -0% | 29 3% | 31 -3% |
| Idle Minimum * (dB) | 34 | 32 6% | 34 -0% | 30 12% | 30.5 10% | 31 9% |
| Idle Average * (dB) | 36 | 34 6% | 35 3% | 33 8% | 31.5 12% | 34 6% |
| Idle Maximum * (dB) | 41 | 39 5% | 45 -10% | 39 5% | 31.5 23% | 37 10% |
| Load Average * (dB) | 48 | 53 -10% | 43 10% | 45 6% | 40.6 15% | 47 2% |
| Witcher 3 ultra * (dB) | 48 | 48 -0% | 52 -8% | 49 -2% | 49.5 -3% | 50 -4% |
| Load Maximum * (dB) | 54 | 53 2% | 54 -0% | 51 6% | 53.4 1% | 54 -0% |
* ... smaller is better
Temperature
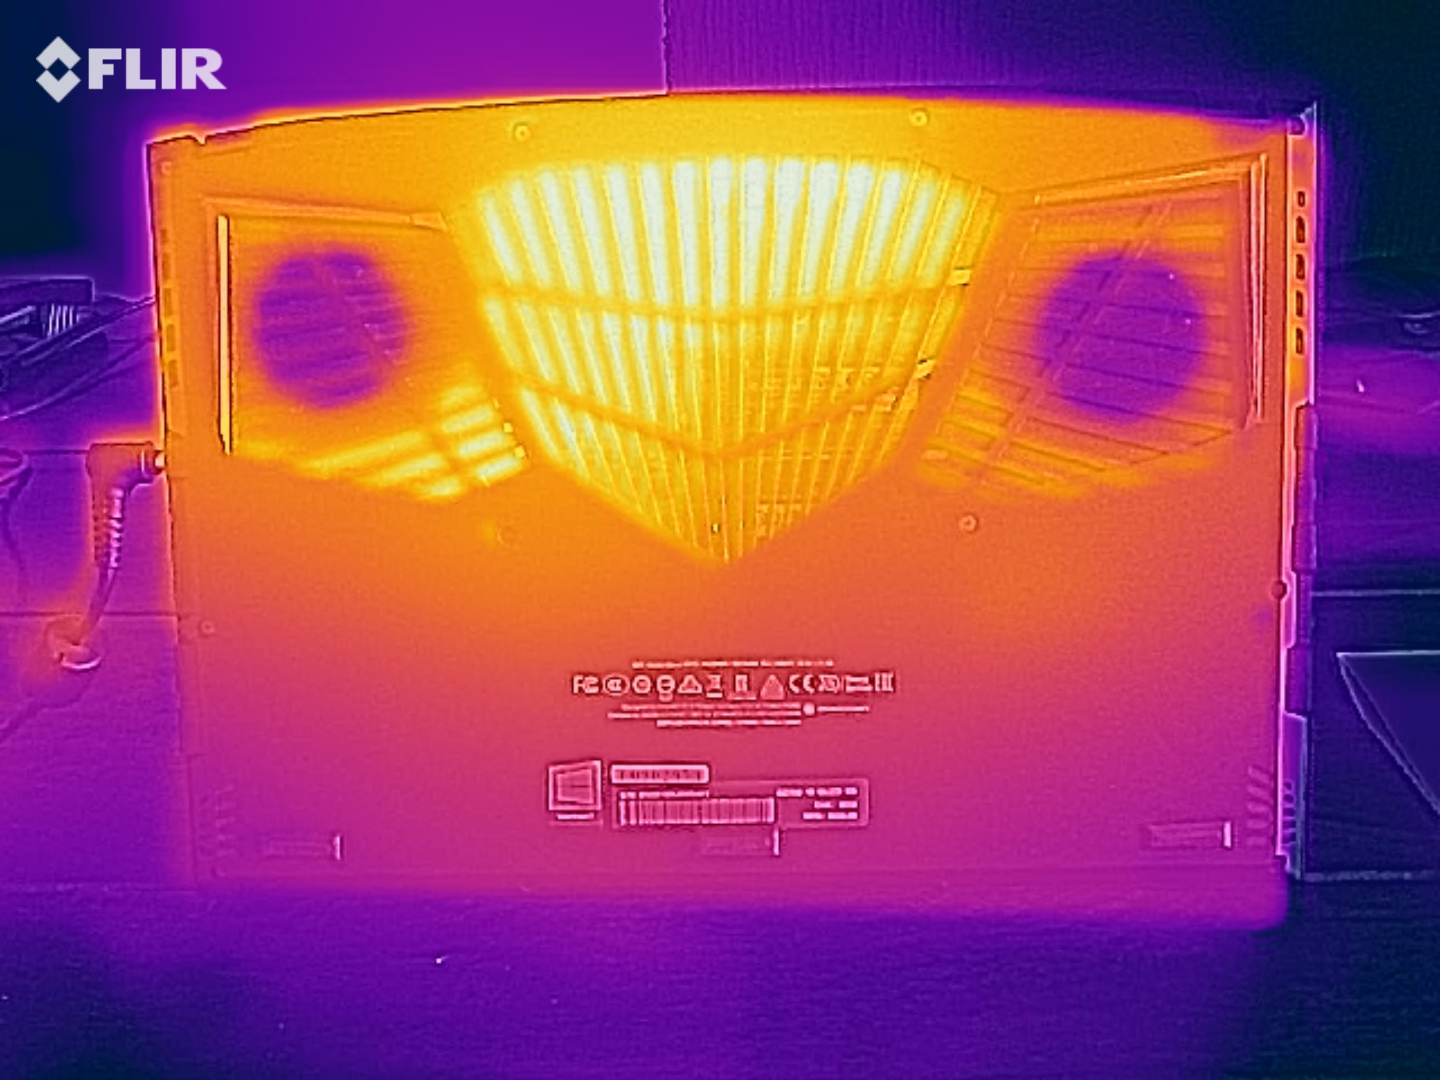
Users should stay away from gaming sessions with the computer on the lap. Under full load with the FurMark and Prime95 tools, the case bottom heated up to 61 °C (~142 °F). A maximum of 56 °C (~133 °F) in The Witcher 3 is also uncomfortable. The chassis doesn't raise any criticism during idle use. Between 25 °C (~77 °F) and 29 °C (~84 °F) is a good value.
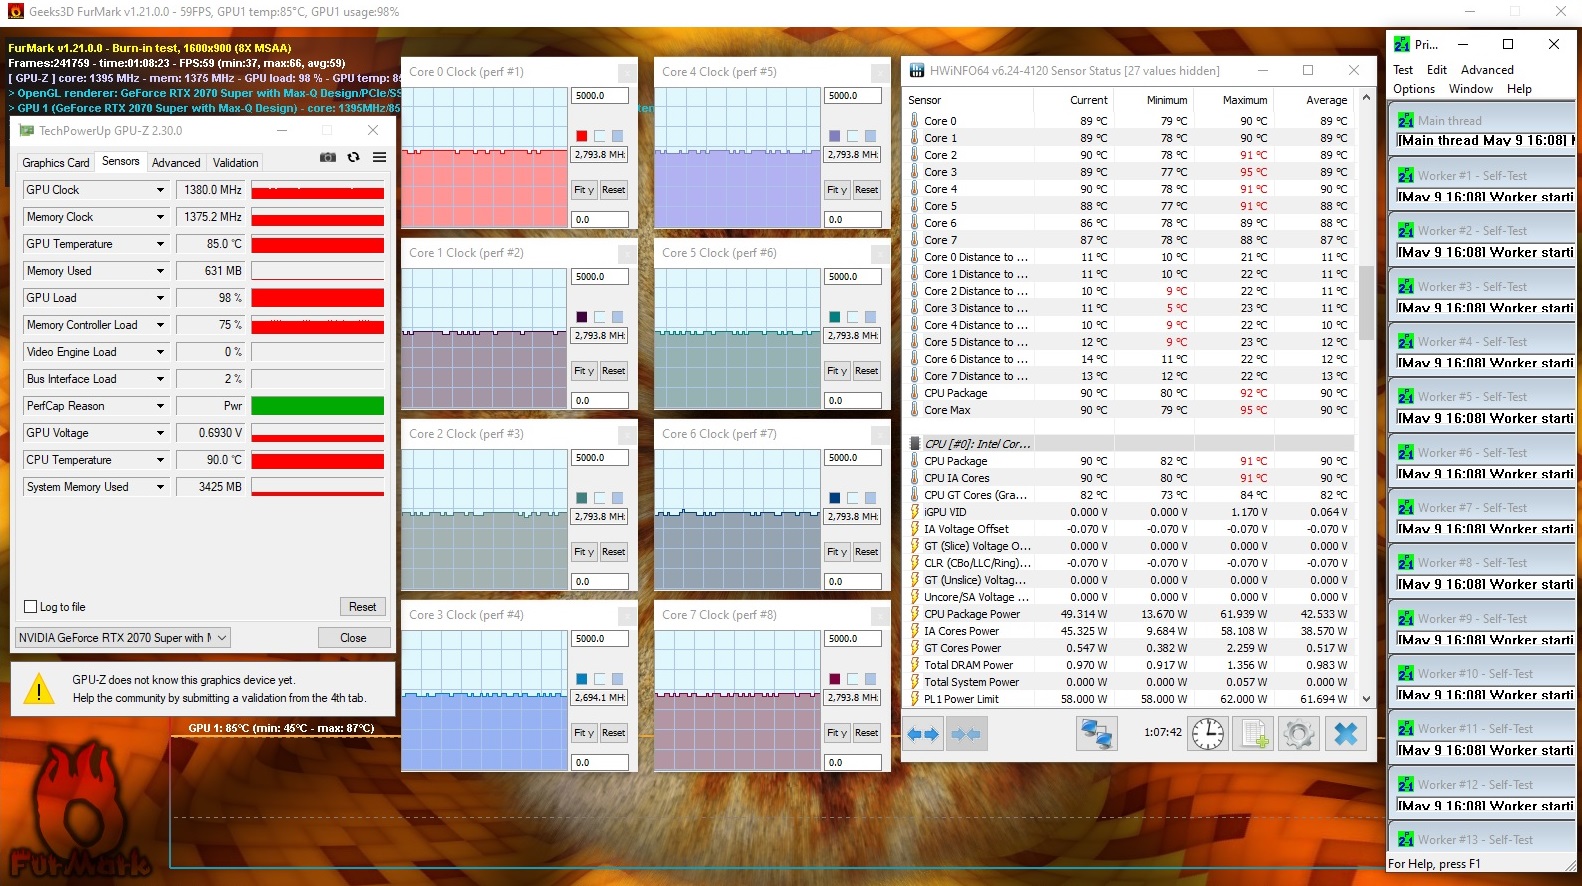
Let's take a look at the components, which become relatively hot under extreme load (maximum of 85 °C (~185 °F) @GPU, maximum of 95 °C (~203 °F) @CPU) but never throttle below their base values. The Turbo is always active to a certain degree.
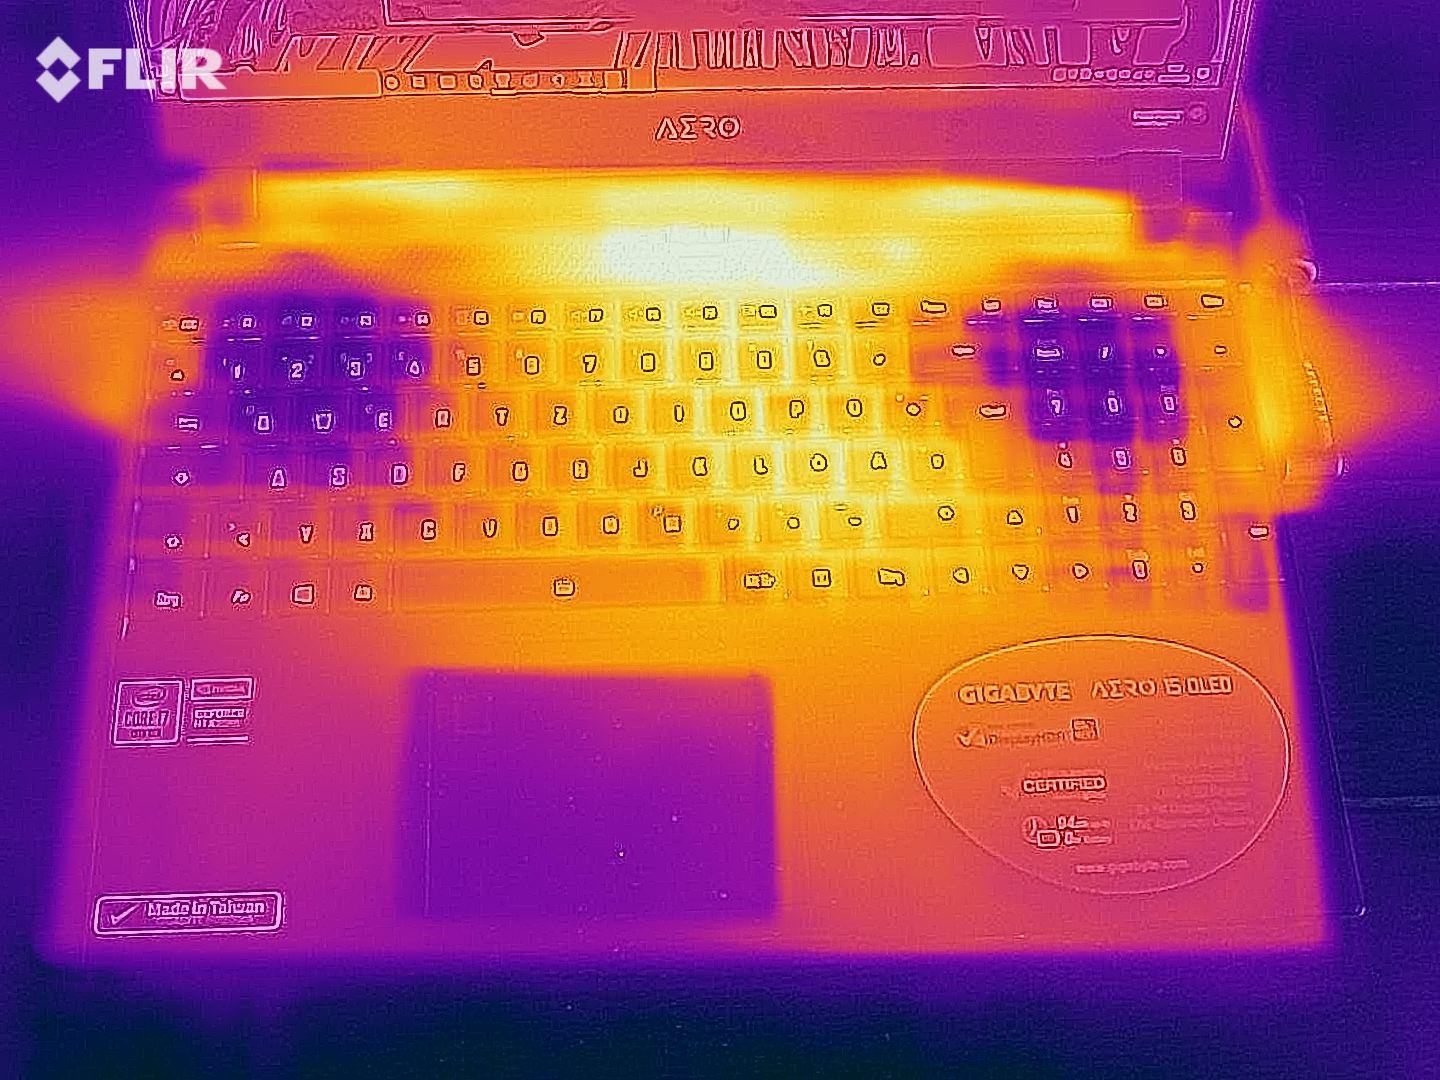
(-) The maximum temperature on the upper side is 49 °C / 120 F, compared to the average of 40.4 °C / 105 F, ranging from 21.2 to 68.8 °C for the class Gaming.
(-) The bottom heats up to a maximum of 61 °C / 142 F, compared to the average of 43.2 °C / 110 F
(+) In idle usage, the average temperature for the upper side is 25.6 °C / 78 F, compared to the device average of 33.9 °C / 93 F.
(-) Playing The Witcher 3, the average temperature for the upper side is 40.2 °C / 104 F, compared to the device average of 33.9 °C / 93 F.
(±) The palmrests and touchpad can get very hot to the touch with a maximum of 36 °C / 96.8 F.
(-) The average temperature of the palmrest area of similar devices was 28.8 °C / 83.8 F (-7.2 °C / -13 F).
| Gigabyte Aero 15 OLED XB-8DE51B0SP i7-10875H, GeForce RTX 2070 Super Max-Q | MSI GS66 Stealth 10SFS i9-10980HK, GeForce RTX 2070 Super Max-Q | Gigabyte Aero 15 OLED XA i7-9750H, GeForce RTX 2070 Max-Q | Acer Predator Triton 500 PT515-51-71PZ i7-9750H, GeForce RTX 2070 Max-Q | HP Omen X 2S 15-dg0075cl i7-9750H, GeForce RTX 2070 Max-Q | Schenker XMG Neo 15 XNE15M19 i7-9750H, GeForce RTX 2070 Max-Q | |
|---|---|---|---|---|---|---|
| Heat | -1% | -7% | -0% | -25% | -13% | |
| Maximum Upper Side * (°C) | 49 | 53 -8% | 49 -0% | 49 -0% | 48.8 -0% | 60 -22% |
| Maximum Bottom * (°C) | 61 | 55 10% | 59 3% | 59 3% | 55 10% | 66 -8% |
| Idle Upper Side * (°C) | 27 | 28 -4% | 33 -22% | 28 -4% | 41 -52% | 30 -11% |
| Idle Bottom * (°C) | 29 | 29 -0% | 32 -10% | 29 -0% | 45.6 -57% | 32 -10% |
* ... smaller is better
Speakers
Gigabyte Aero 15 OLED XB-8DE51B0SP audio analysis
(+) | speakers can play relatively loud (85 dB)
Bass 100 - 315 Hz
(-) | nearly no bass - on average 23.8% lower than median
(±) | linearity of bass is average (9.7% delta to prev. frequency)
Mids 400 - 2000 Hz
(±) | higher mids - on average 5.2% higher than median
(+) | mids are linear (6.9% delta to prev. frequency)
Highs 2 - 16 kHz
(+) | balanced highs - only 2.2% away from median
(+) | highs are linear (4.9% delta to prev. frequency)
Overall 100 - 16.000 Hz
(±) | linearity of overall sound is average (18.3% difference to median)
Compared to same class
» 58% of all tested devices in this class were better, 9% similar, 33% worse
» The best had a delta of 6%, average was 18%, worst was 132%
Compared to all devices tested
» 40% of all tested devices were better, 8% similar, 52% worse
» The best had a delta of 4%, average was 23%, worst was 134%
MSI GS66 Stealth 10SFS audio analysis
(+) | speakers can play relatively loud (91 dB)
Bass 100 - 315 Hz
(-) | nearly no bass - on average 25.3% lower than median
(+) | bass is linear (6.8% delta to prev. frequency)
Mids 400 - 2000 Hz
(±) | higher mids - on average 9.2% higher than median
(±) | linearity of mids is average (8.3% delta to prev. frequency)
Highs 2 - 16 kHz
(+) | balanced highs - only 2.9% away from median
(+) | highs are linear (5.8% delta to prev. frequency)
Overall 100 - 16.000 Hz
(±) | linearity of overall sound is average (23.5% difference to median)
Compared to same class
» 85% of all tested devices in this class were better, 5% similar, 10% worse
» The best had a delta of 6%, average was 18%, worst was 132%
Compared to all devices tested
» 70% of all tested devices were better, 6% similar, 24% worse
» The best had a delta of 4%, average was 23%, worst was 134%
Energy management
Energy consumption
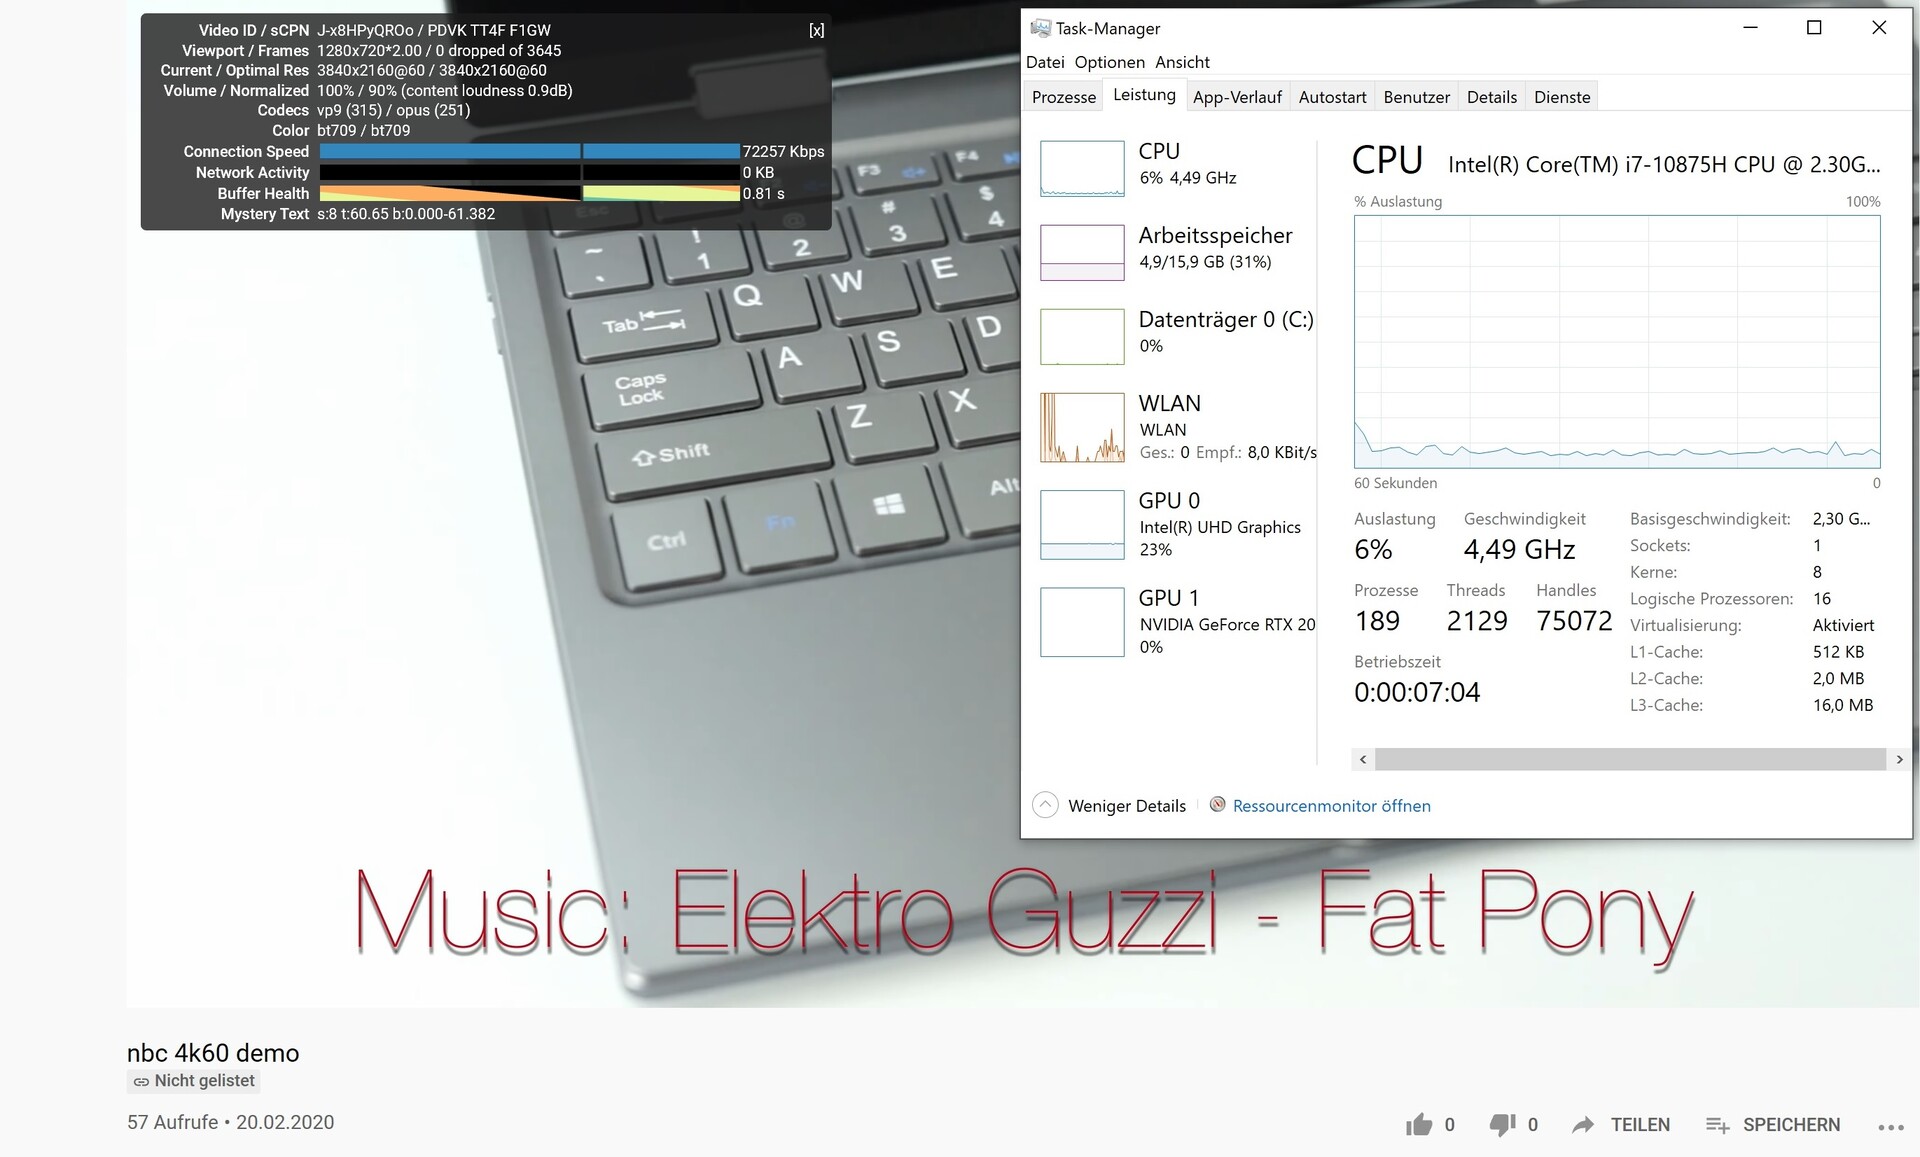
In order not to waste energy unnecessarily during simple activities like running Office applications, video playback and browsing the web, the Aero 15 makes use of the Optimus technology from Nvidia, which dynamically switches between the GeForce GPU and the graphics chip of the processor (UHD Graphics 630) depending on the scenario. As a result, the 15-incher only consumes 18 to 38 watts in idle mode. That other devices are even more energy-efficient is mainly due to the dimmer and lower-resolution displays. Under load, the measuring device showed between 113 and 256 watts. Therefore, the included 230-watt power supply is properly utilized, whereby the degree of efficiency is missing in our tests.
| Off / Standby | |
| Idle | |
| Load |
|
Key:
min: | |
| Gigabyte Aero 15 OLED XB-8DE51B0SP i7-10875H, GeForce RTX 2070 Super Max-Q | MSI GS66 Stealth 10SFS i9-10980HK, GeForce RTX 2070 Super Max-Q | Gigabyte Aero 15 OLED XA i7-9750H, GeForce RTX 2070 Max-Q | Acer Predator Triton 500 PT515-51-71PZ i7-9750H, GeForce RTX 2070 Max-Q | HP Omen X 2S 15-dg0075cl i7-9750H, GeForce RTX 2070 Max-Q | Schenker XMG Neo 15 XNE15M19 i7-9750H, GeForce RTX 2070 Max-Q | |
|---|---|---|---|---|---|---|
| Power Consumption | 15% | -2% | 34% | -65% | 28% | |
| Idle Minimum * (Watt) | 18 | 13 28% | 23 -28% | 7 61% | 46 -156% | 11 39% |
| Idle Average * (Watt) | 21 | 16 24% | 25 -19% | 12 43% | 59 -181% | 15 29% |
| Idle Maximum * (Watt) | 38 | 27 29% | 33 13% | 22 42% | 65.5 -72% | 21 45% |
| Load Average * (Watt) | 113 | 109 4% | 96 15% | 86 24% | 99.8 12% | 94 17% |
| Witcher 3 ultra * (Watt) | 149 | 155 -4% | 168 -13% | 144 3% | 154.1 -3% | 143 4% |
| Load Maximum * (Watt) | 256 | 236 8% | 197 23% | 177 31% | 222.7 13% | 173 32% |
* ... smaller is better
Battery life
The 15-incher offers quite good battery life. The 94 Wh battery lasted around 6 hours in the WLAN test at medium brightness, which is in line with the MSI GS66 Stealth's result (99.9 Wh).
| Gigabyte Aero 15 OLED XB-8DE51B0SP i7-10875H, GeForce RTX 2070 Super Max-Q, 94.2 Wh | MSI GS66 Stealth 10SFS i9-10980HK, GeForce RTX 2070 Super Max-Q, 99.99 Wh | Gigabyte Aero 15 OLED XA i7-9750H, GeForce RTX 2070 Max-Q, 94.24 Wh | Acer Predator Triton 500 PT515-51-71PZ i7-9750H, GeForce RTX 2070 Max-Q, Wh | HP Omen X 2S 15-dg0075cl i7-9750H, GeForce RTX 2070 Max-Q, 72 Wh | Schenker XMG Neo 15 XNE15M19 i7-9750H, GeForce RTX 2070 Max-Q, 62 Wh | |
|---|---|---|---|---|---|---|
| Battery runtime | -14% | -1% | 6% | -58% | -25% | |
| Reader / Idle (h) | 8.6 | 8.4 -2% | 9.9 15% | 11.1 29% | 3.7 -57% | 7.3 -15% |
| WiFi v1.3 (h) | 6.1 | 6.1 0% | 5.7 -7% | 8 31% | 2.2 -64% | 5.7 -7% |
| Load (h) | 2.8 | 1.7 -39% | 2.5 -11% | 1.6 -43% | 1.3 -54% | 1.3 -54% |
Pros
Cons
Verdict
If you place great importance on the image quality of a laptop, the Aero 15 OLED is exactly the right choice.
If you exclude the reflective surface and frequency, the 4K display only has plus points. Apart from the high brightness, the great contrast and the short response times, the large color space, which comes into its own thanks to X-Rite Pantone, should also be mentioned on the positive side.
Since the Aero 15 OLED doesn't allow itself any other flagrant errors, gamers and creators who connect a headset in 3D usage (keyword "volume") can go for it.
Gigabyte Aero 15 OLED XB-8DE51B0SP
- 08/31/2022 v7 (old)
Florian Glaser
Price comparison

