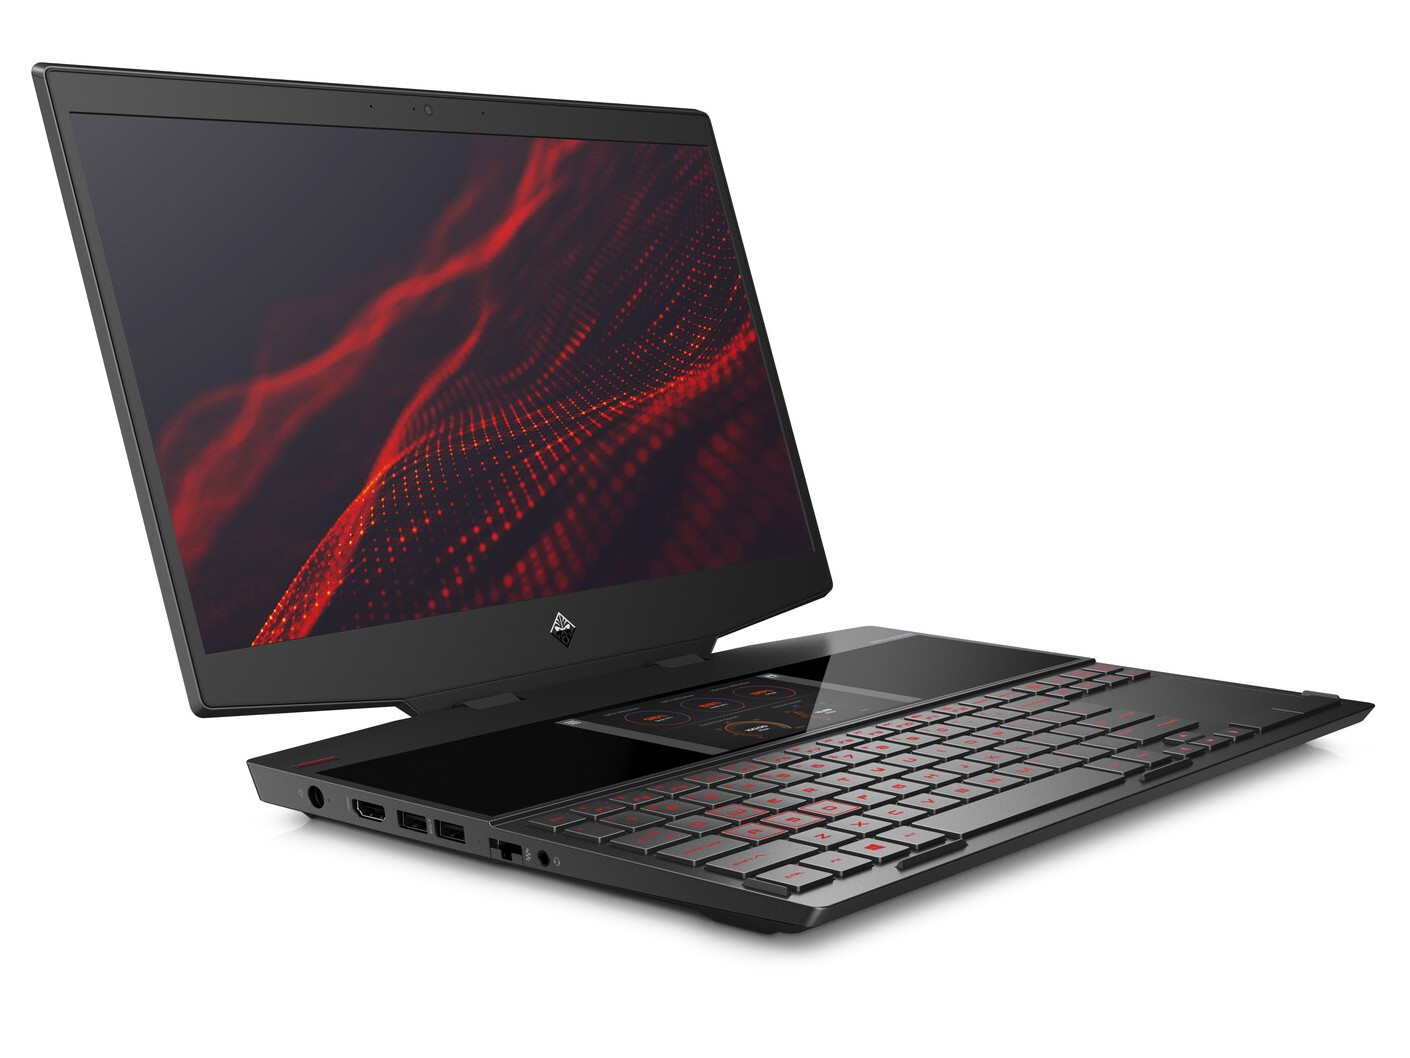
Double Trouble: HP Omen X 2S 15 Laptop Review
The Apple Touch Bar popularized the concept and potential of having a second screen. Asus expanded upon this idea last year with the ZenBook Pro UX580 by turning the traditional clickpad into a fully realized touchscreen. Called ScreenPad, it made multi-tasking easier even though it also introduced some unique drawbacks for users to overcome.
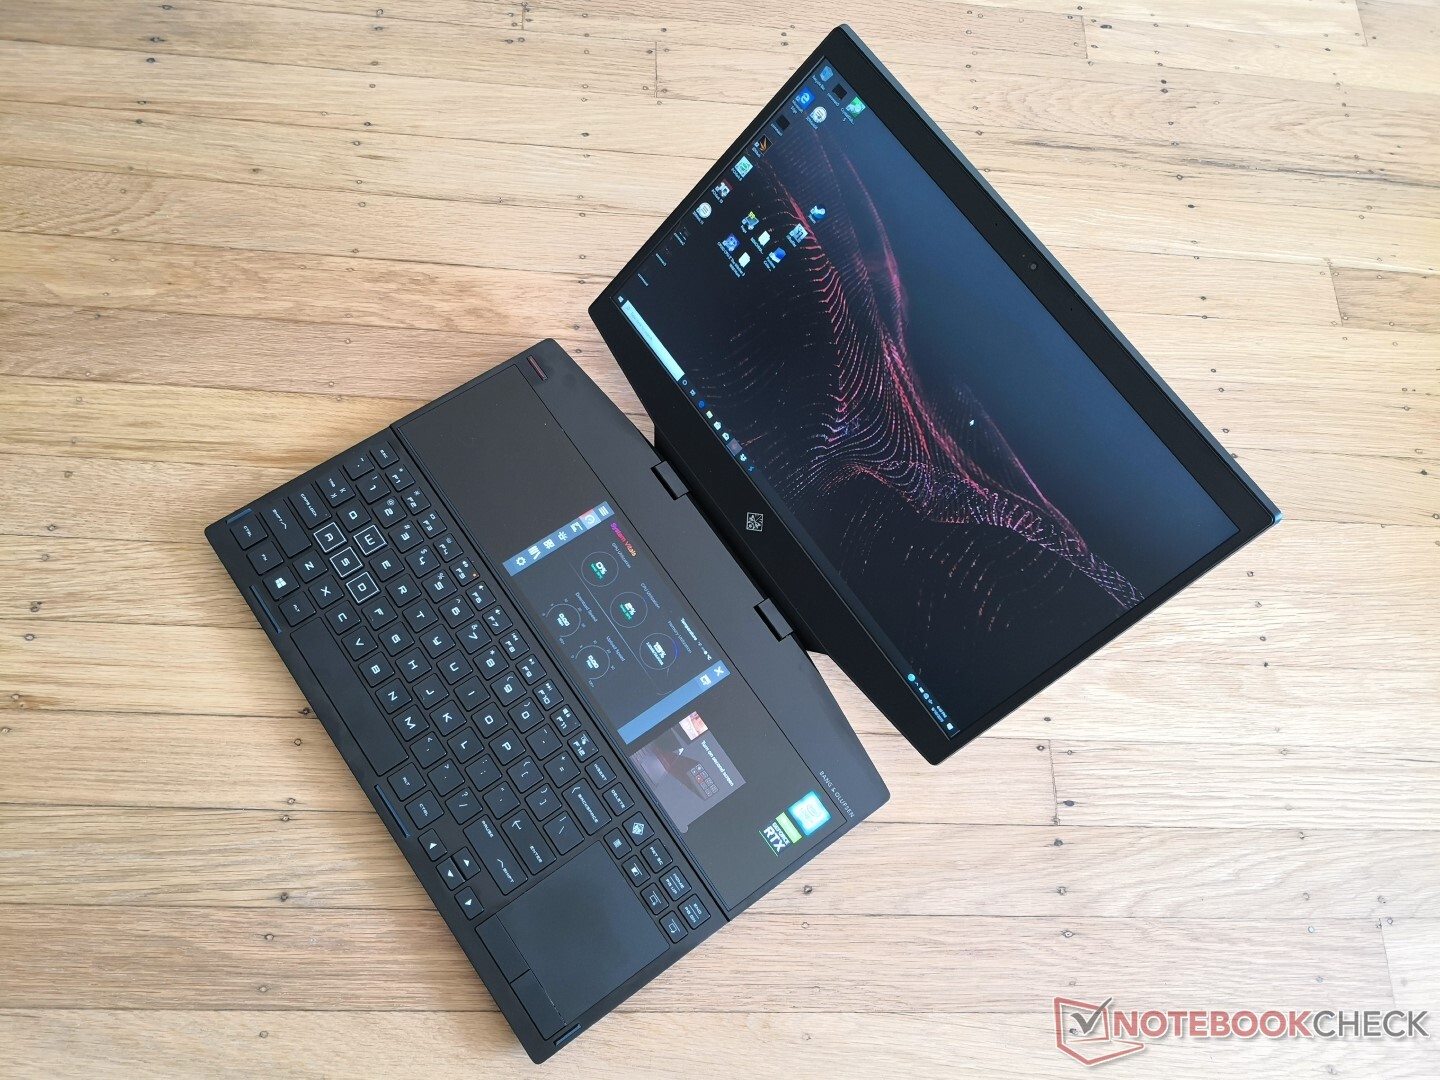
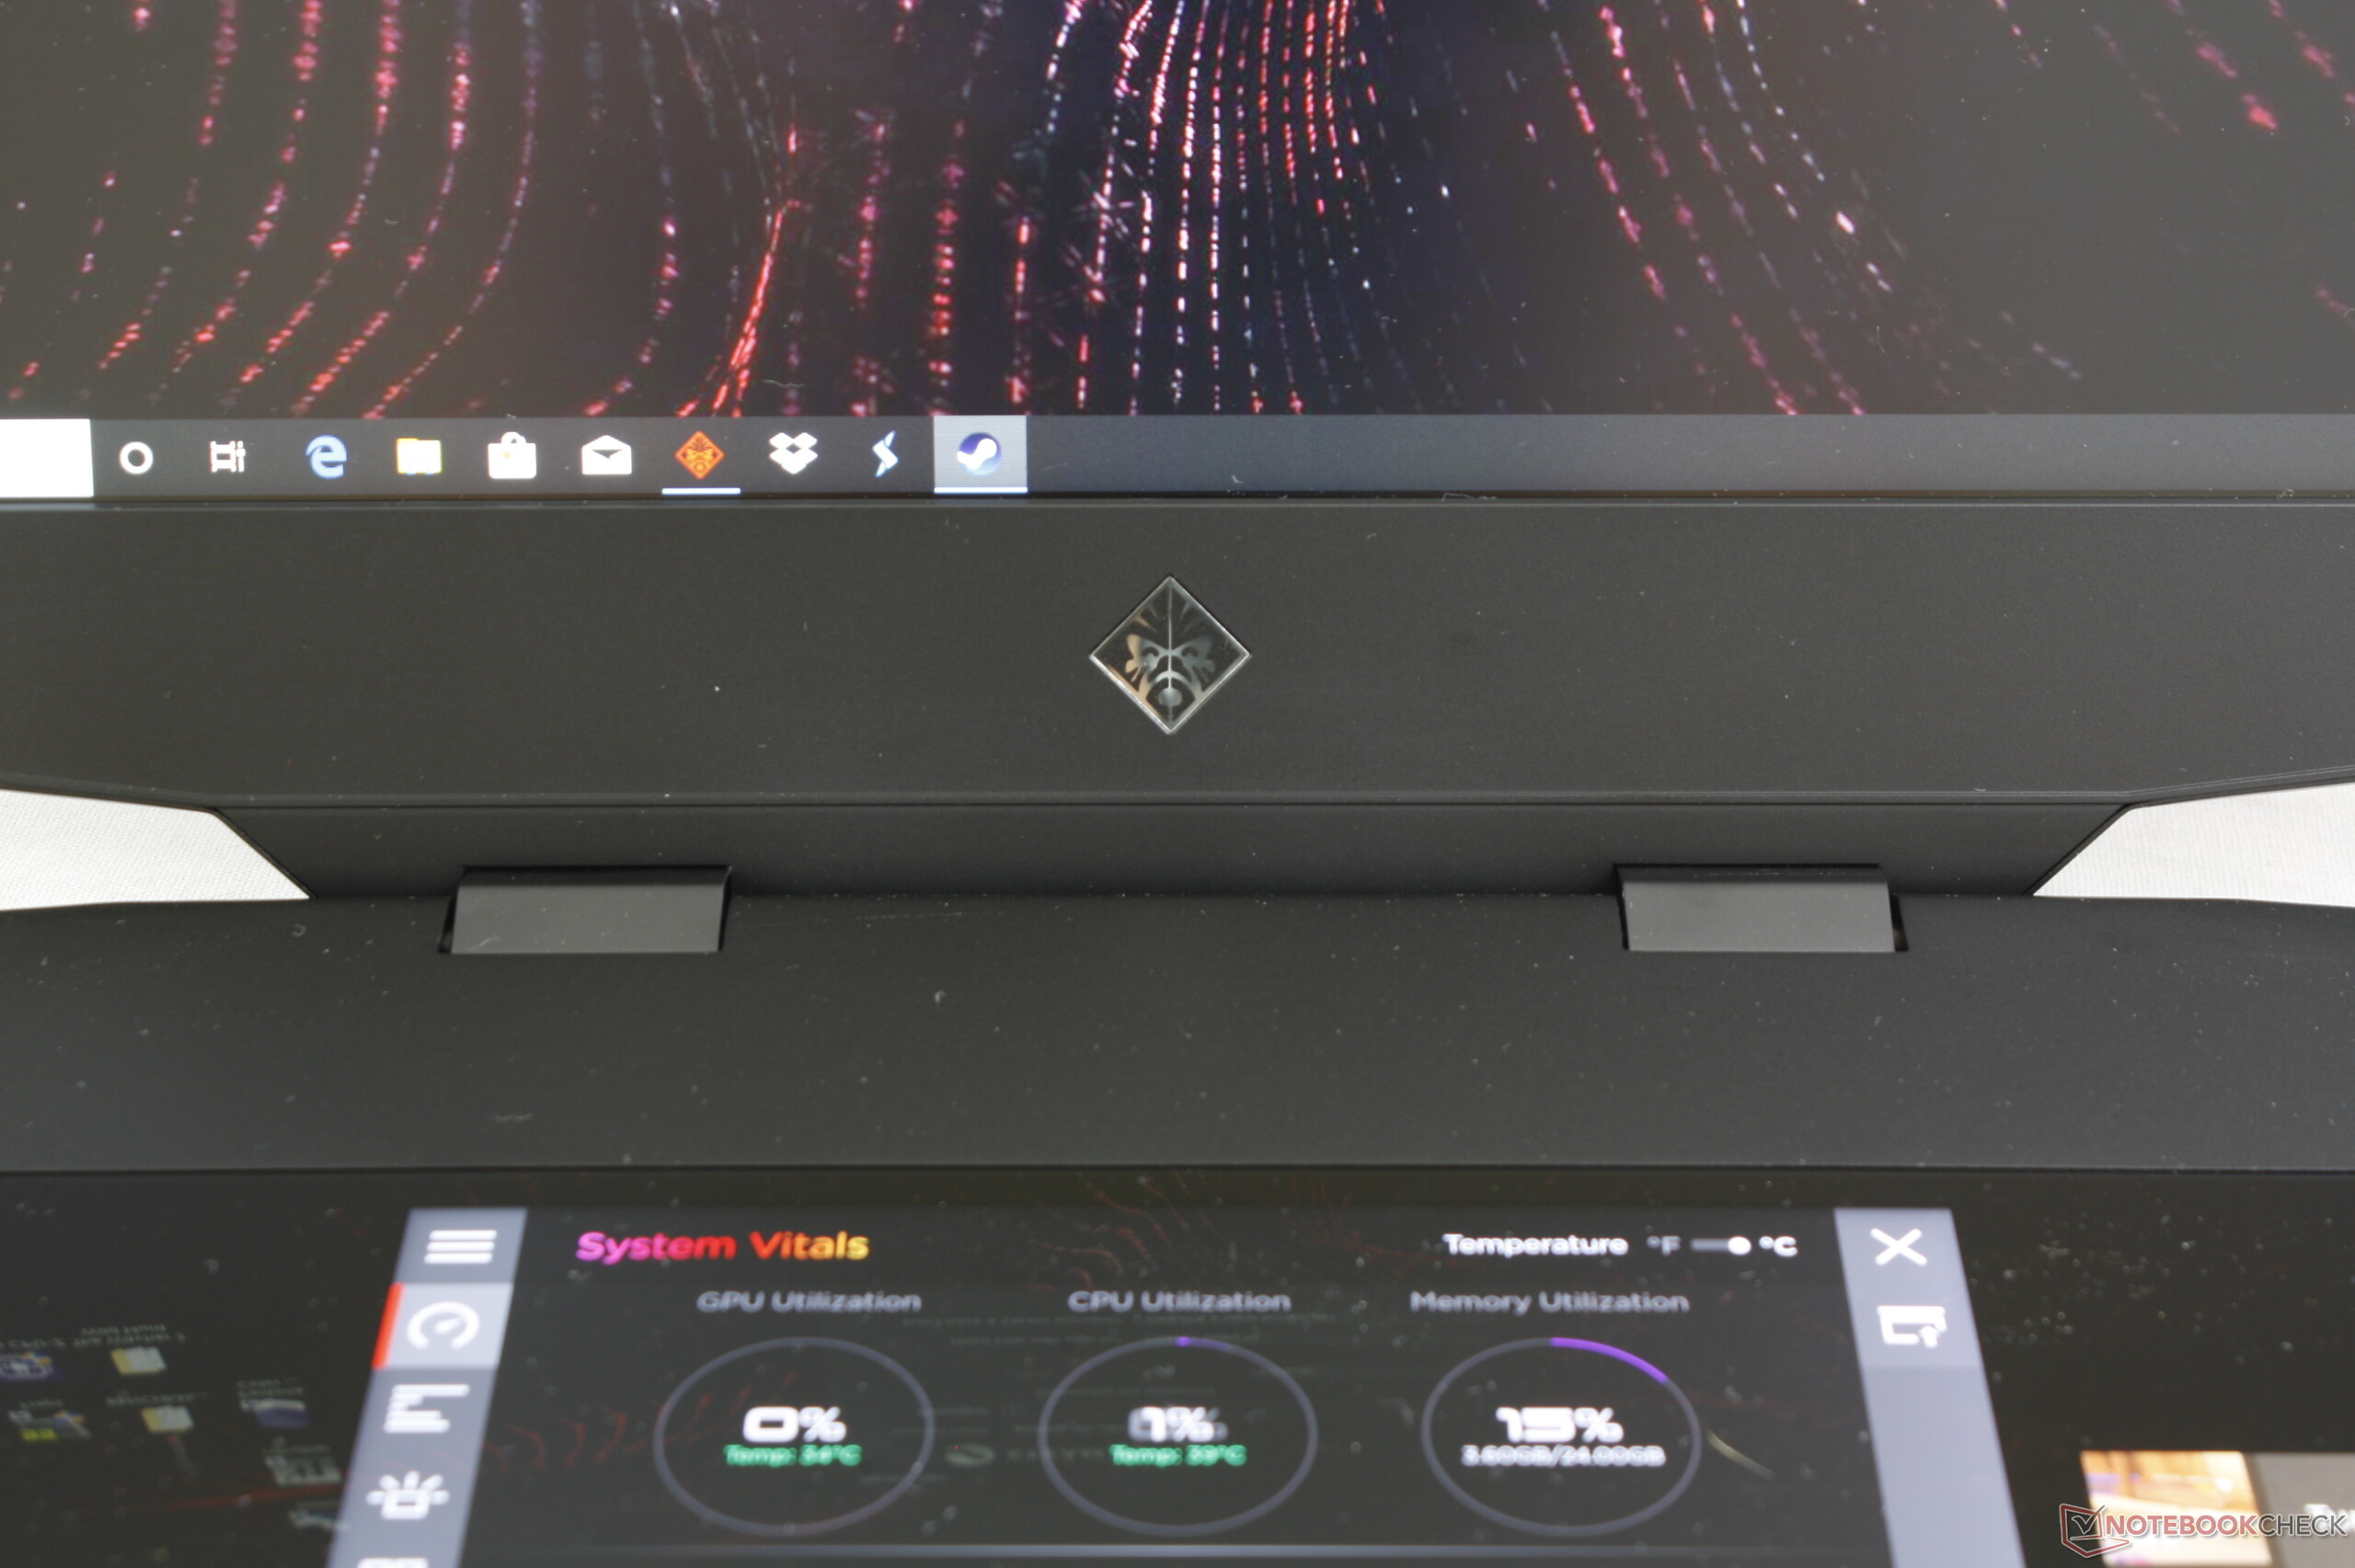
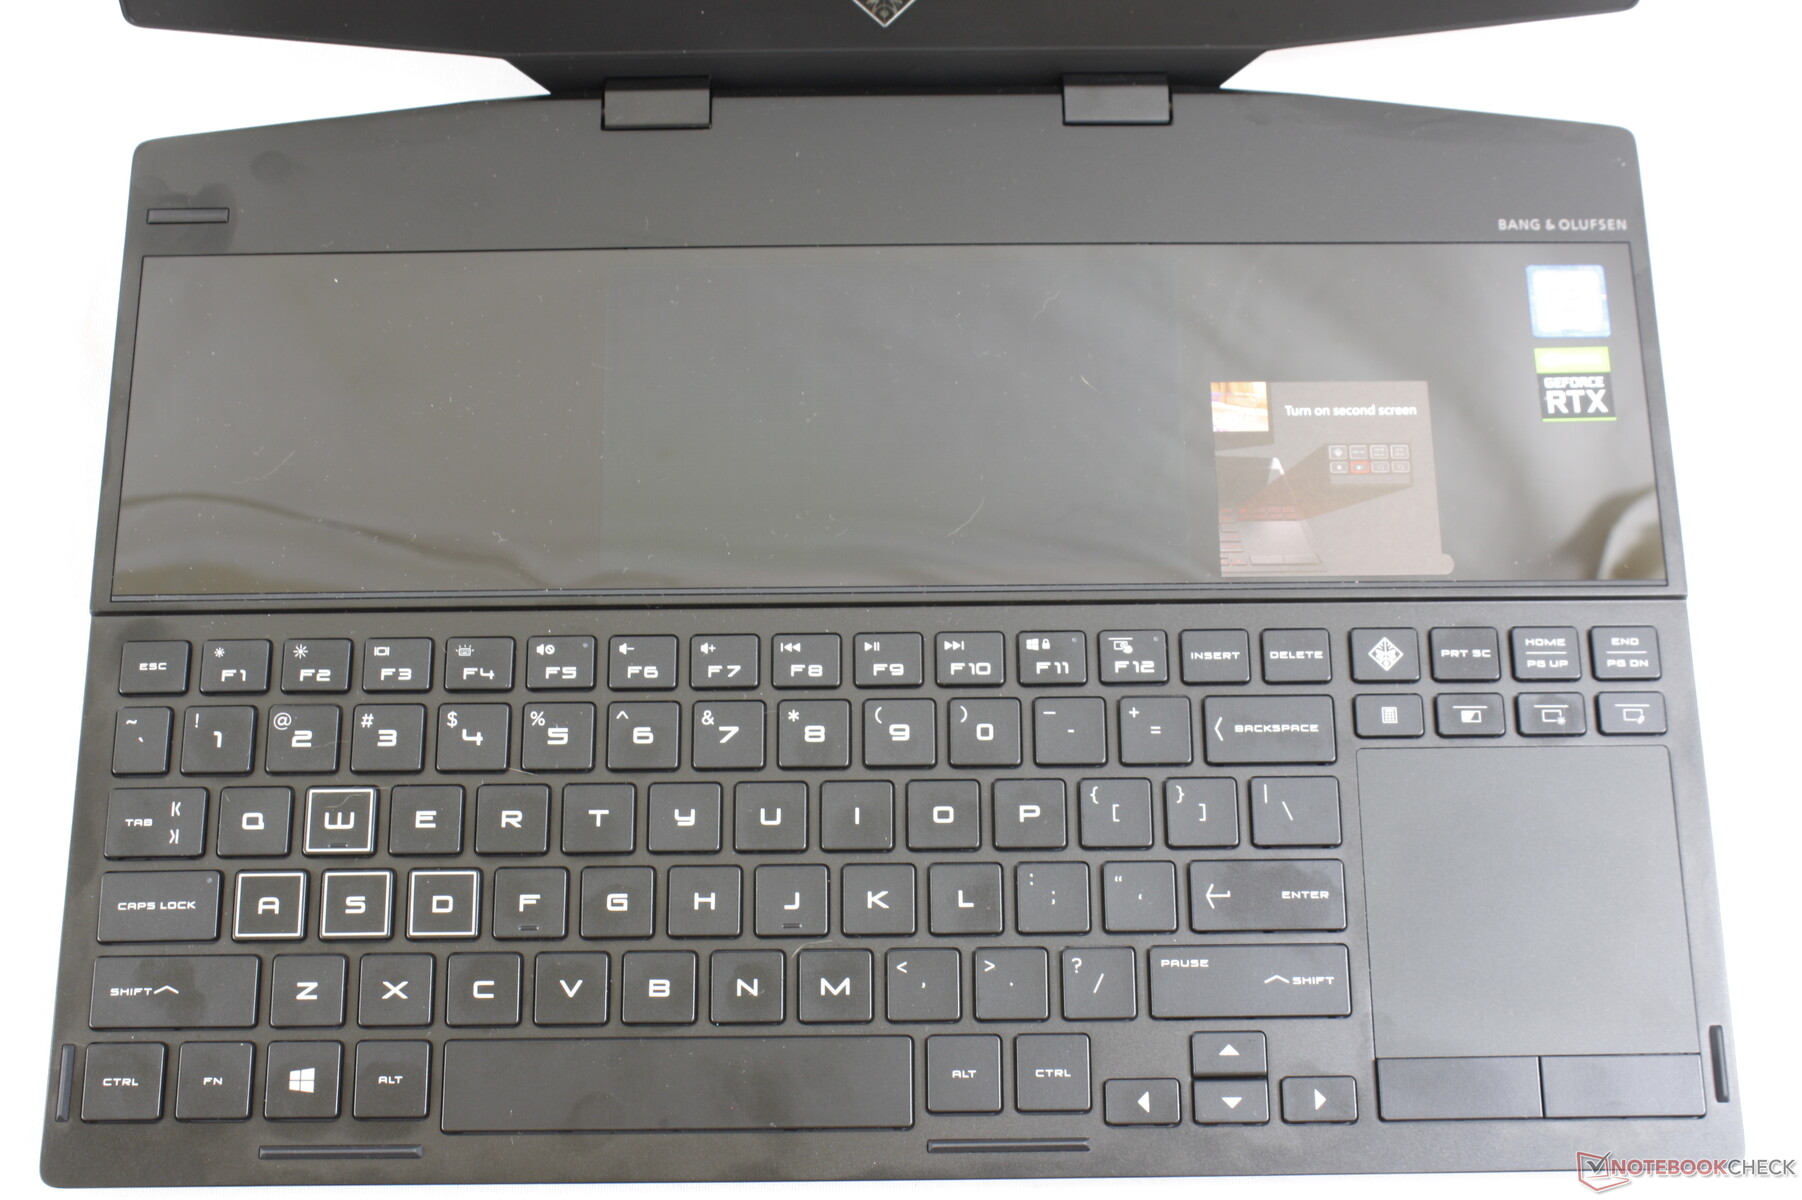
The Omen X 2S 15 is HP's own take on the secondary screen. Unlike the aforementioned matte Asus ScreenPad, the glossy secondary screen on the HP is positioned closer to the primary screen for improved ergonomics. Meanwhile, the keyboard has been pushed to the front of the laptop a la the Zephyrus GX501 or GX531. HP's approach solves some issues inherent to the ScreenPad while introducing its own set of drawbacks that we will explain in more detail below.
Unlike last year's mid-range Omen 15, the Omen X 2S 15 is an enthusiast product with higher-end specifications. Users can configure with either GeForce RTX 2070 Max-Q or RTX 2080 Max-Q graphics, Core i7-9750H or Core i9-9880H CPU, FHD 144/240 Hz or 4K UHD 60 Hz display, up to 2 TB of PCIe storage, and up to 32 GB of DDR4-2666 RAM for a starting price of $1850 USD. The second display remains fixed at 1080p across all SKUs.
Direct competitors to the Omen X2S 15 include other thin 15.6-inch gaming laptops like the high-end Razer Blade 15, Lenovo Legion Y740-15ICH, Gigabyte Aorus 15, MSI GS65, Asus Zephyrus S GX531, and the Dell Alienware m15 R2.
More HP reviews:
Case
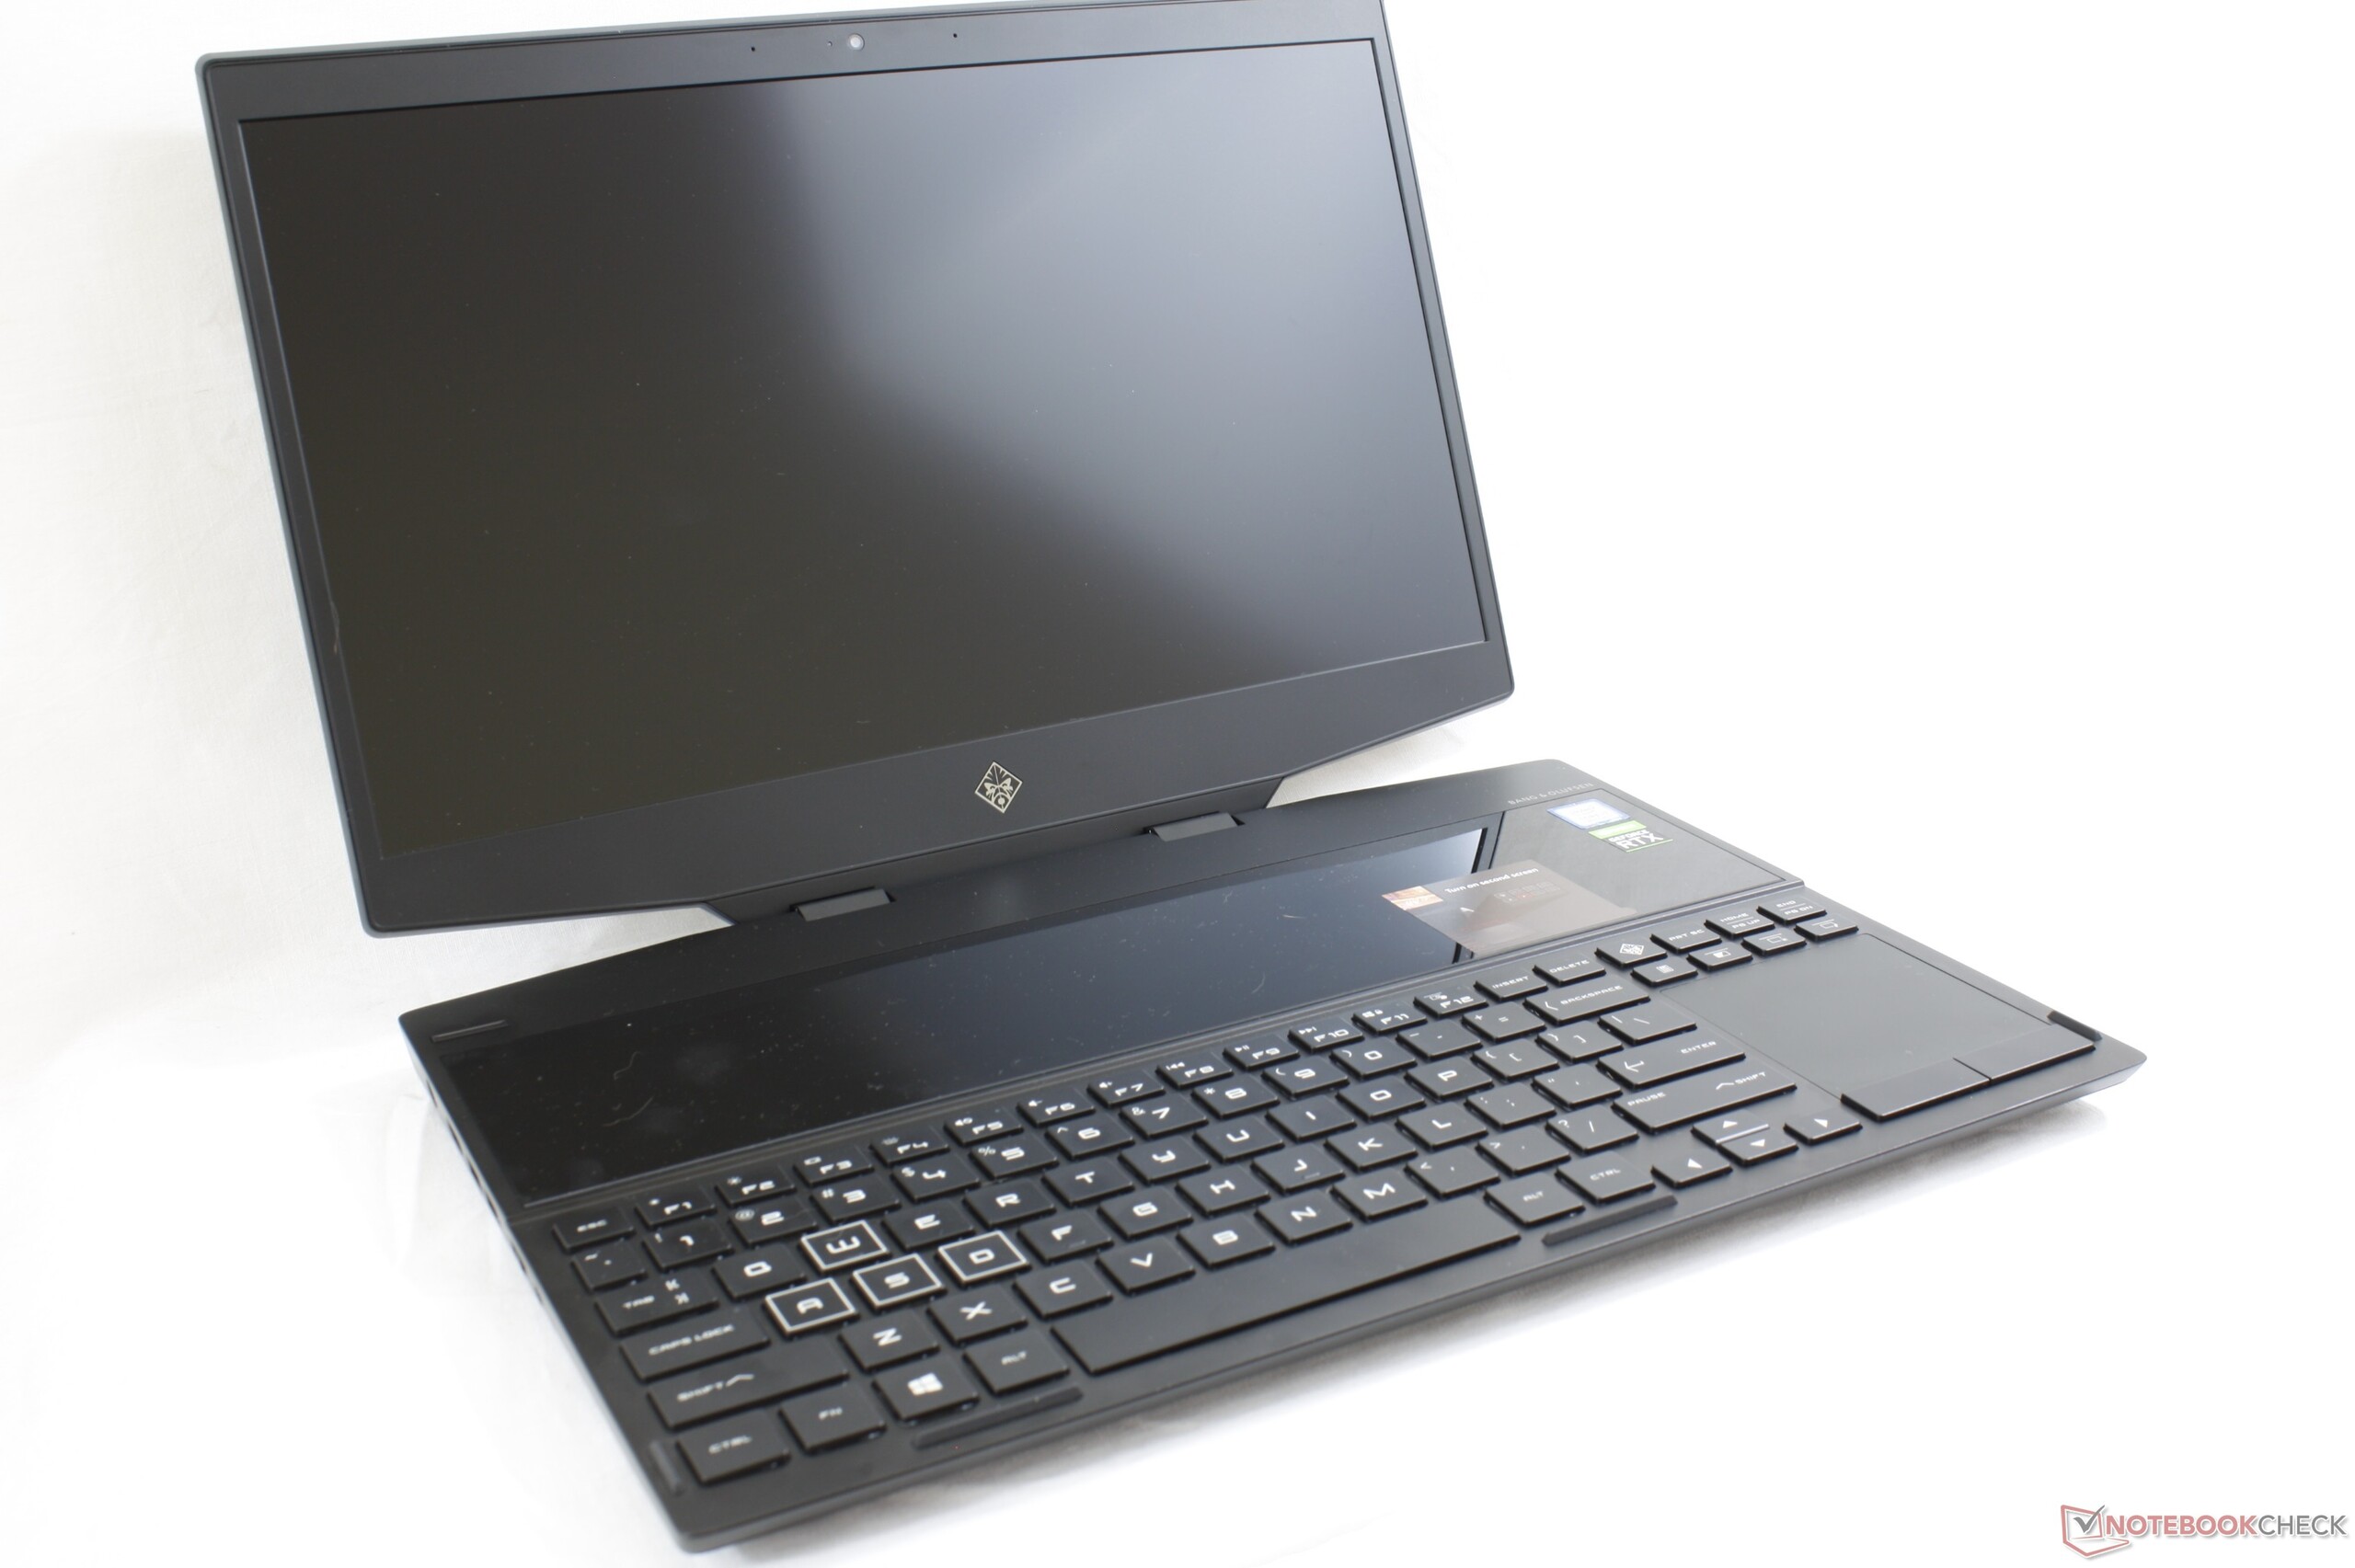
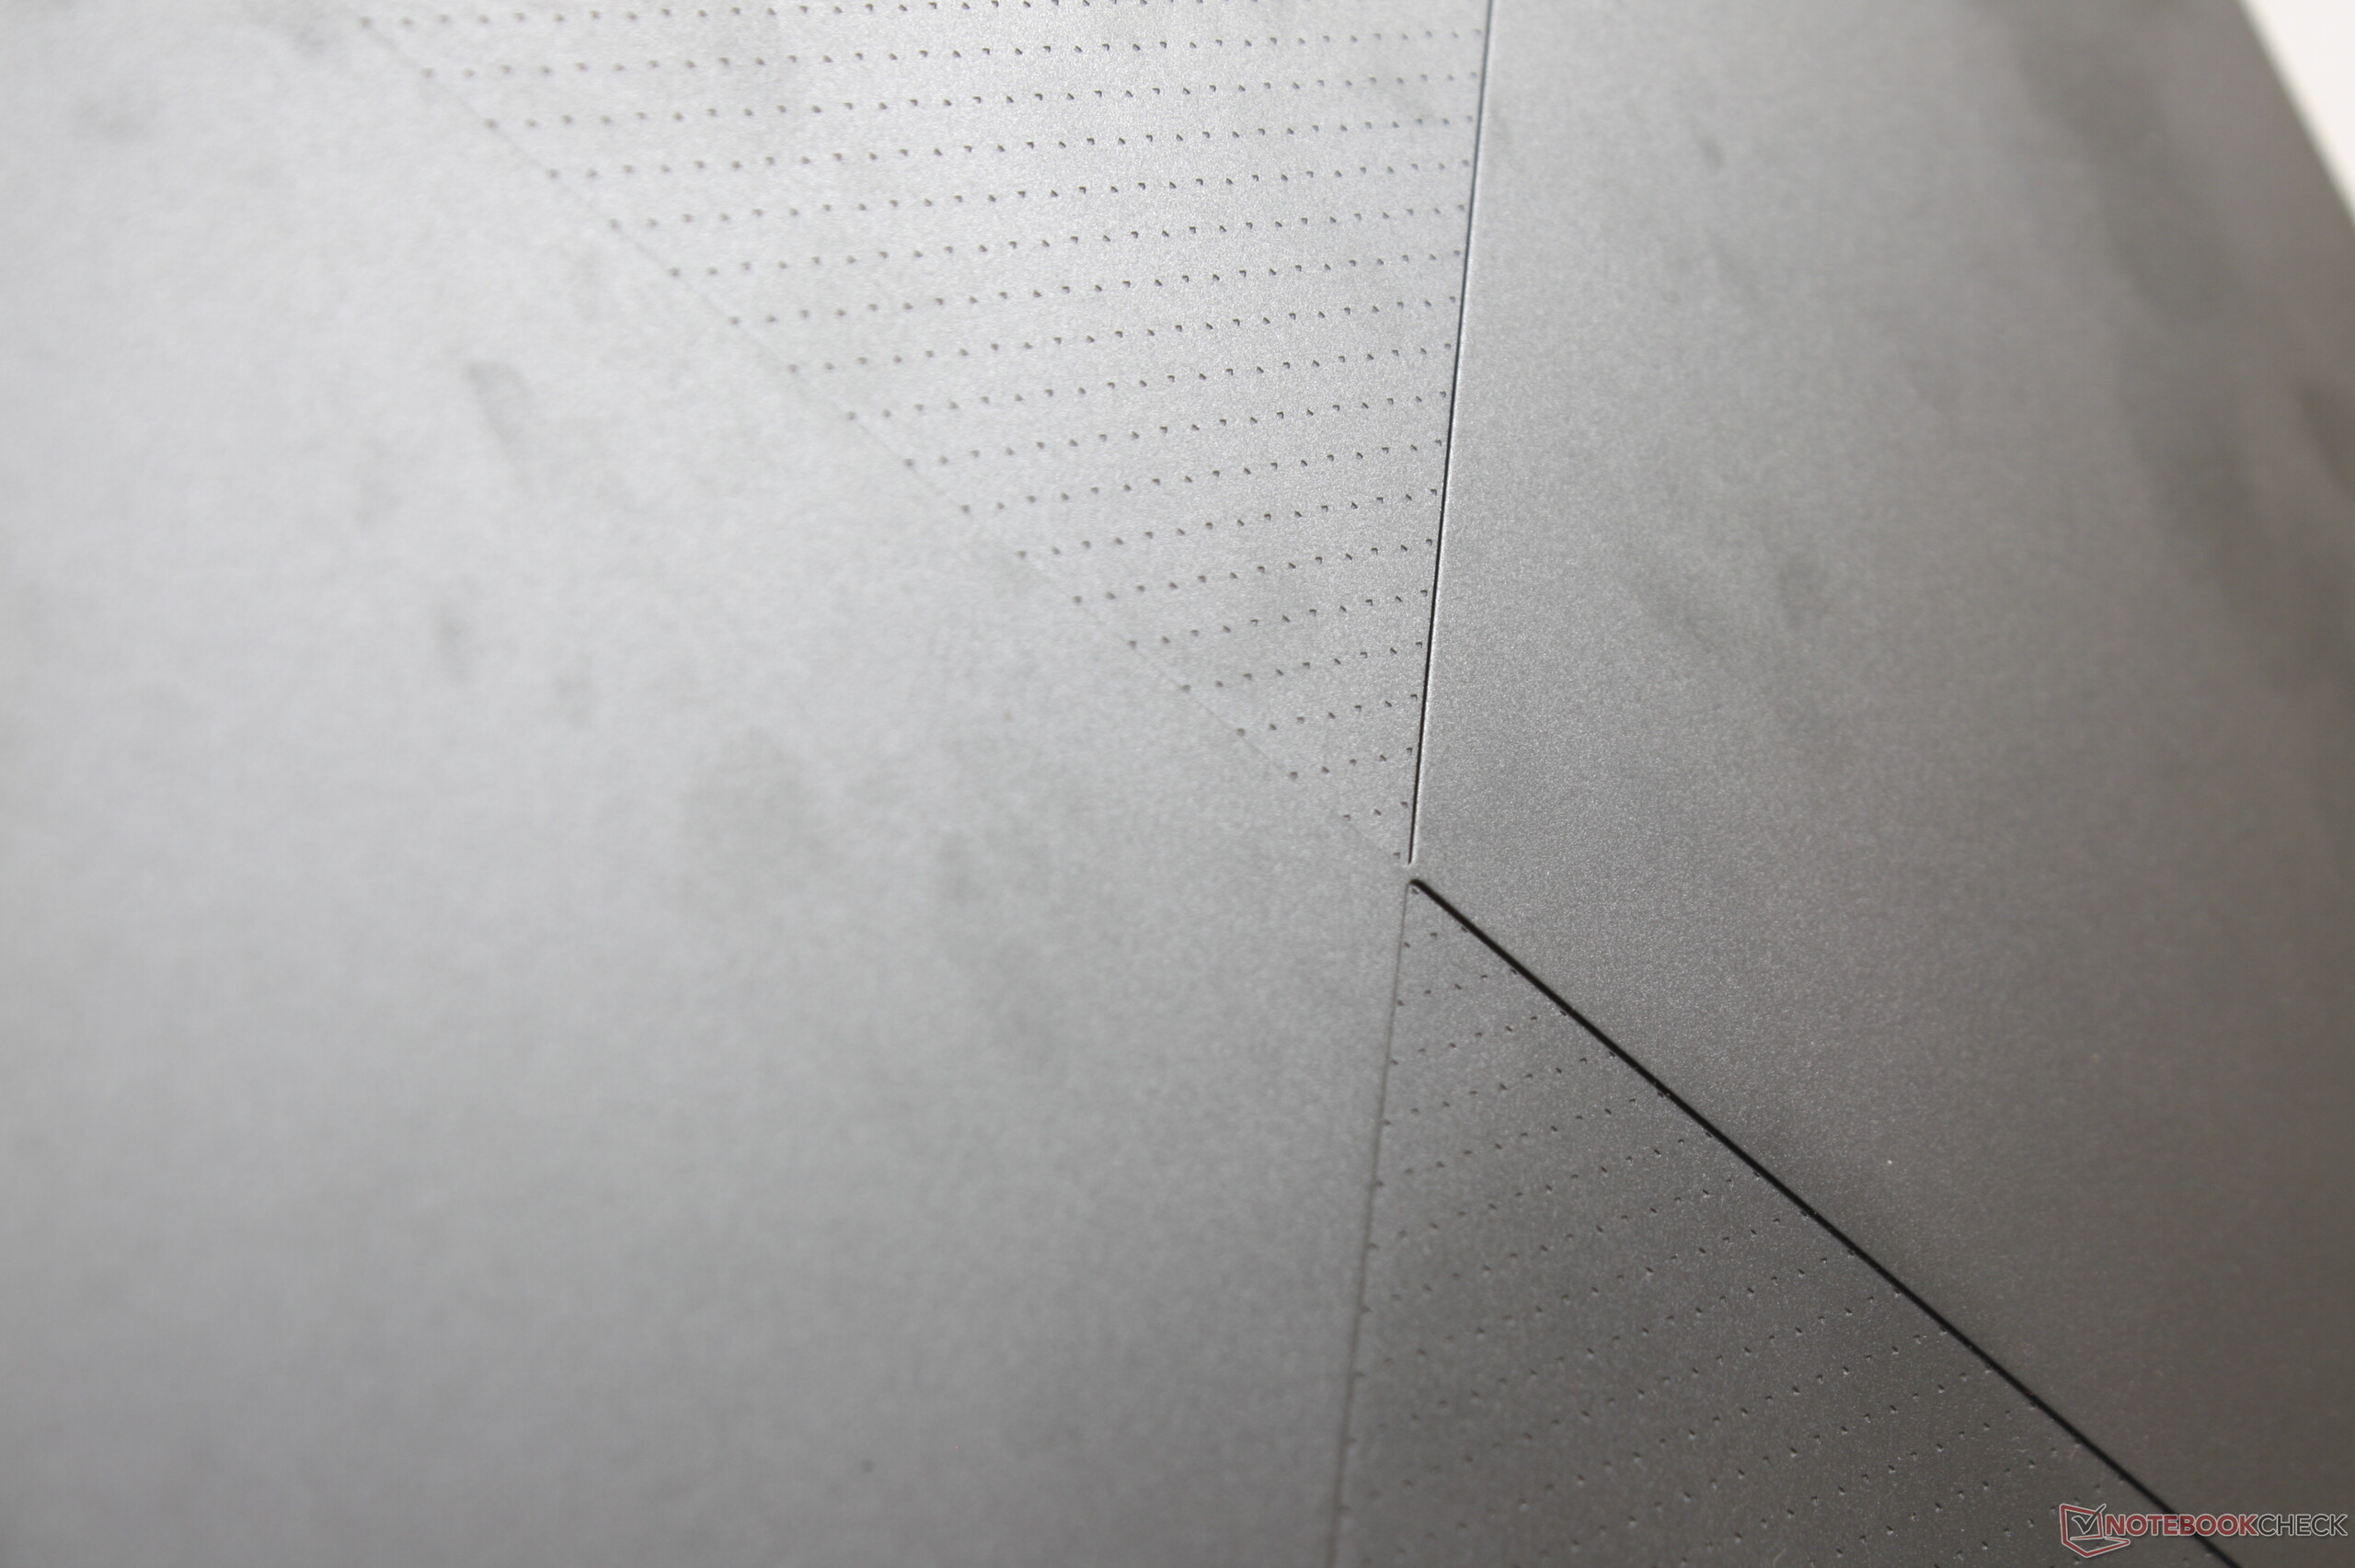
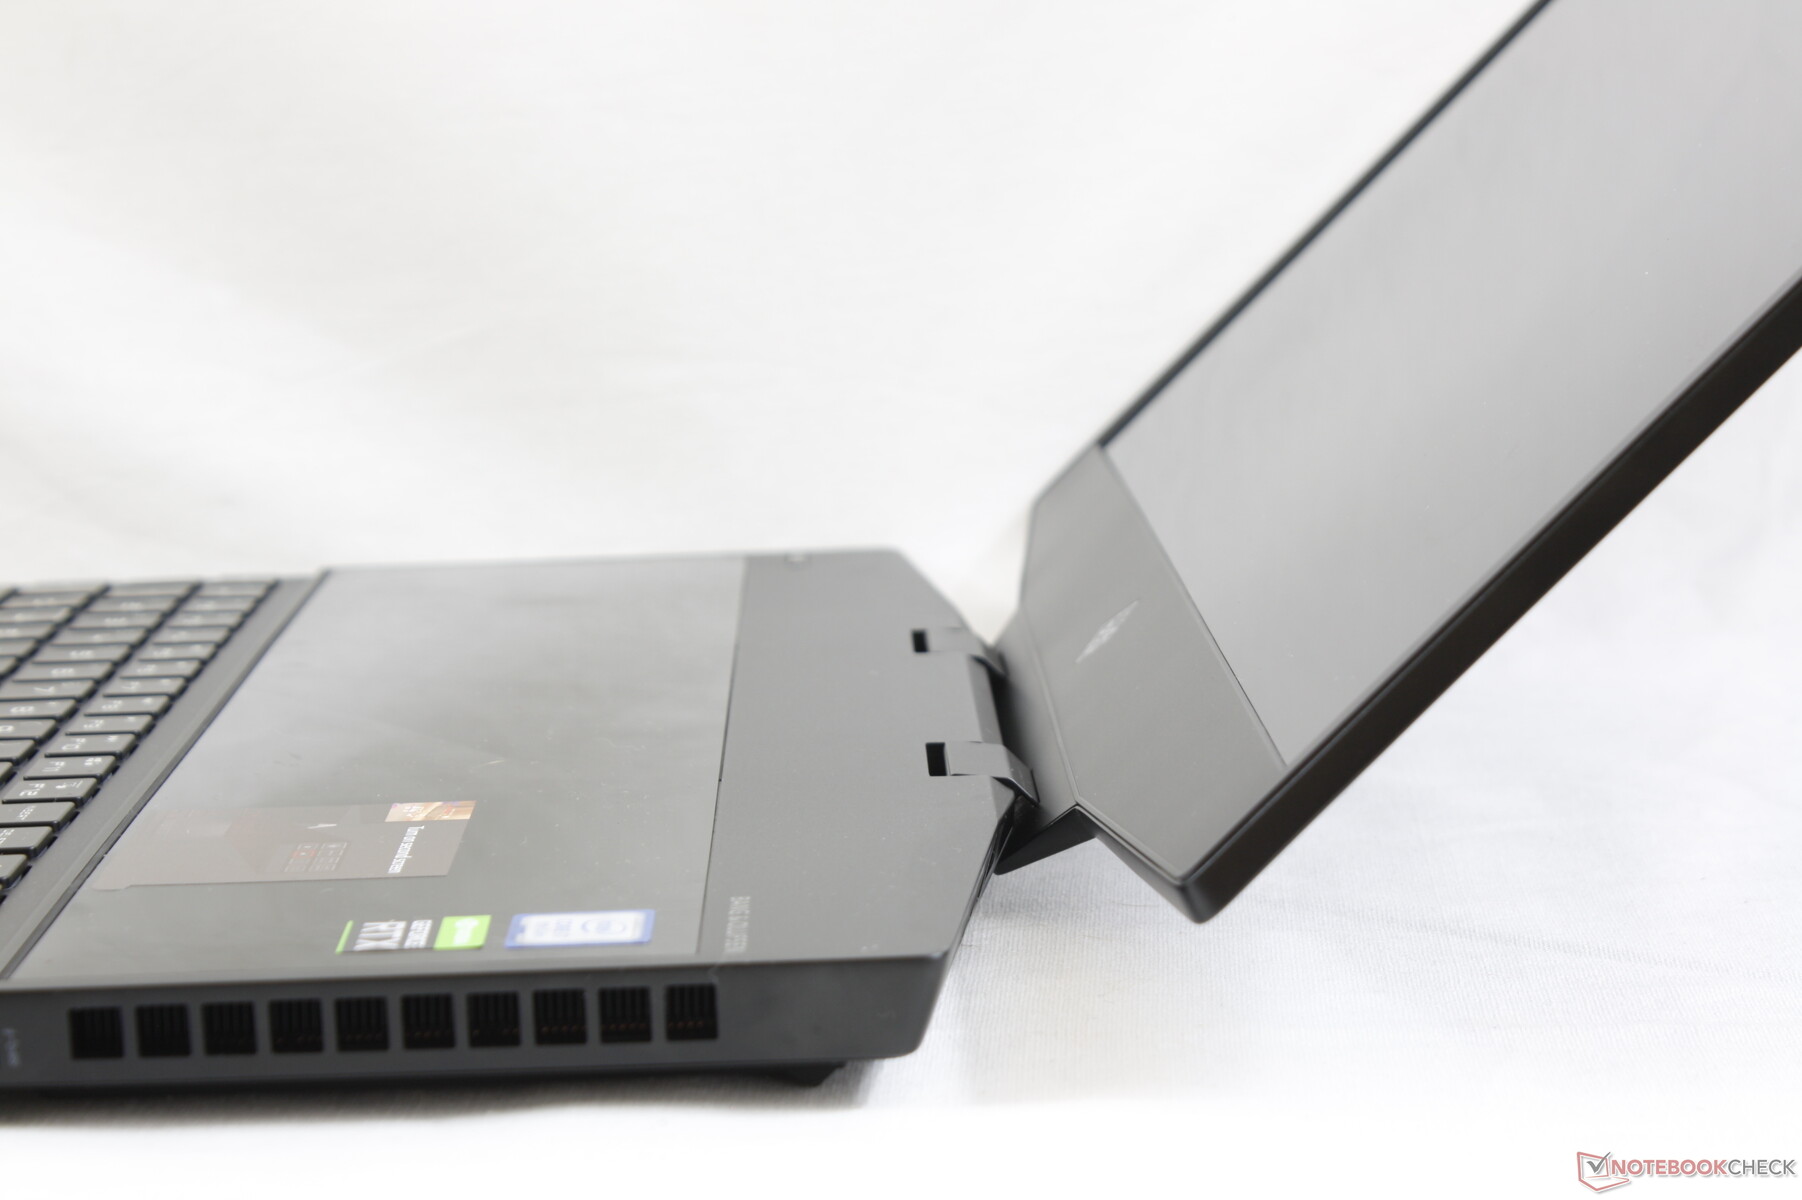
The chassis is comprised mostly of matte aluminum for the base and outer lid with some visual similarities to the larger Omen X 17. The section above the keyboard, however, is glossy glass that extends from one side of the keyboard to the other. It's both a stylistic and practical choice because it visually distinguishes the Omen X 2S from most other laptops while protecting the secondary touchscreen.
Looks aside, base rigidity is excellent as it exhibits just slight creaking and flexing when pushing down on the keyboard center. Its lid, however, is much more susceptible to flexing and twisting to be nearly as bad as on the Lenovo Legion Y740-15. Systems like the Razer Blade 15 or even HP's own Spectre x360 15 series have proven that it's possible to have a laptop with both narrow bezels and rigid displays.
Build quality is excellent from top to bottom with no unintended gaps or defects between materials on our unit.
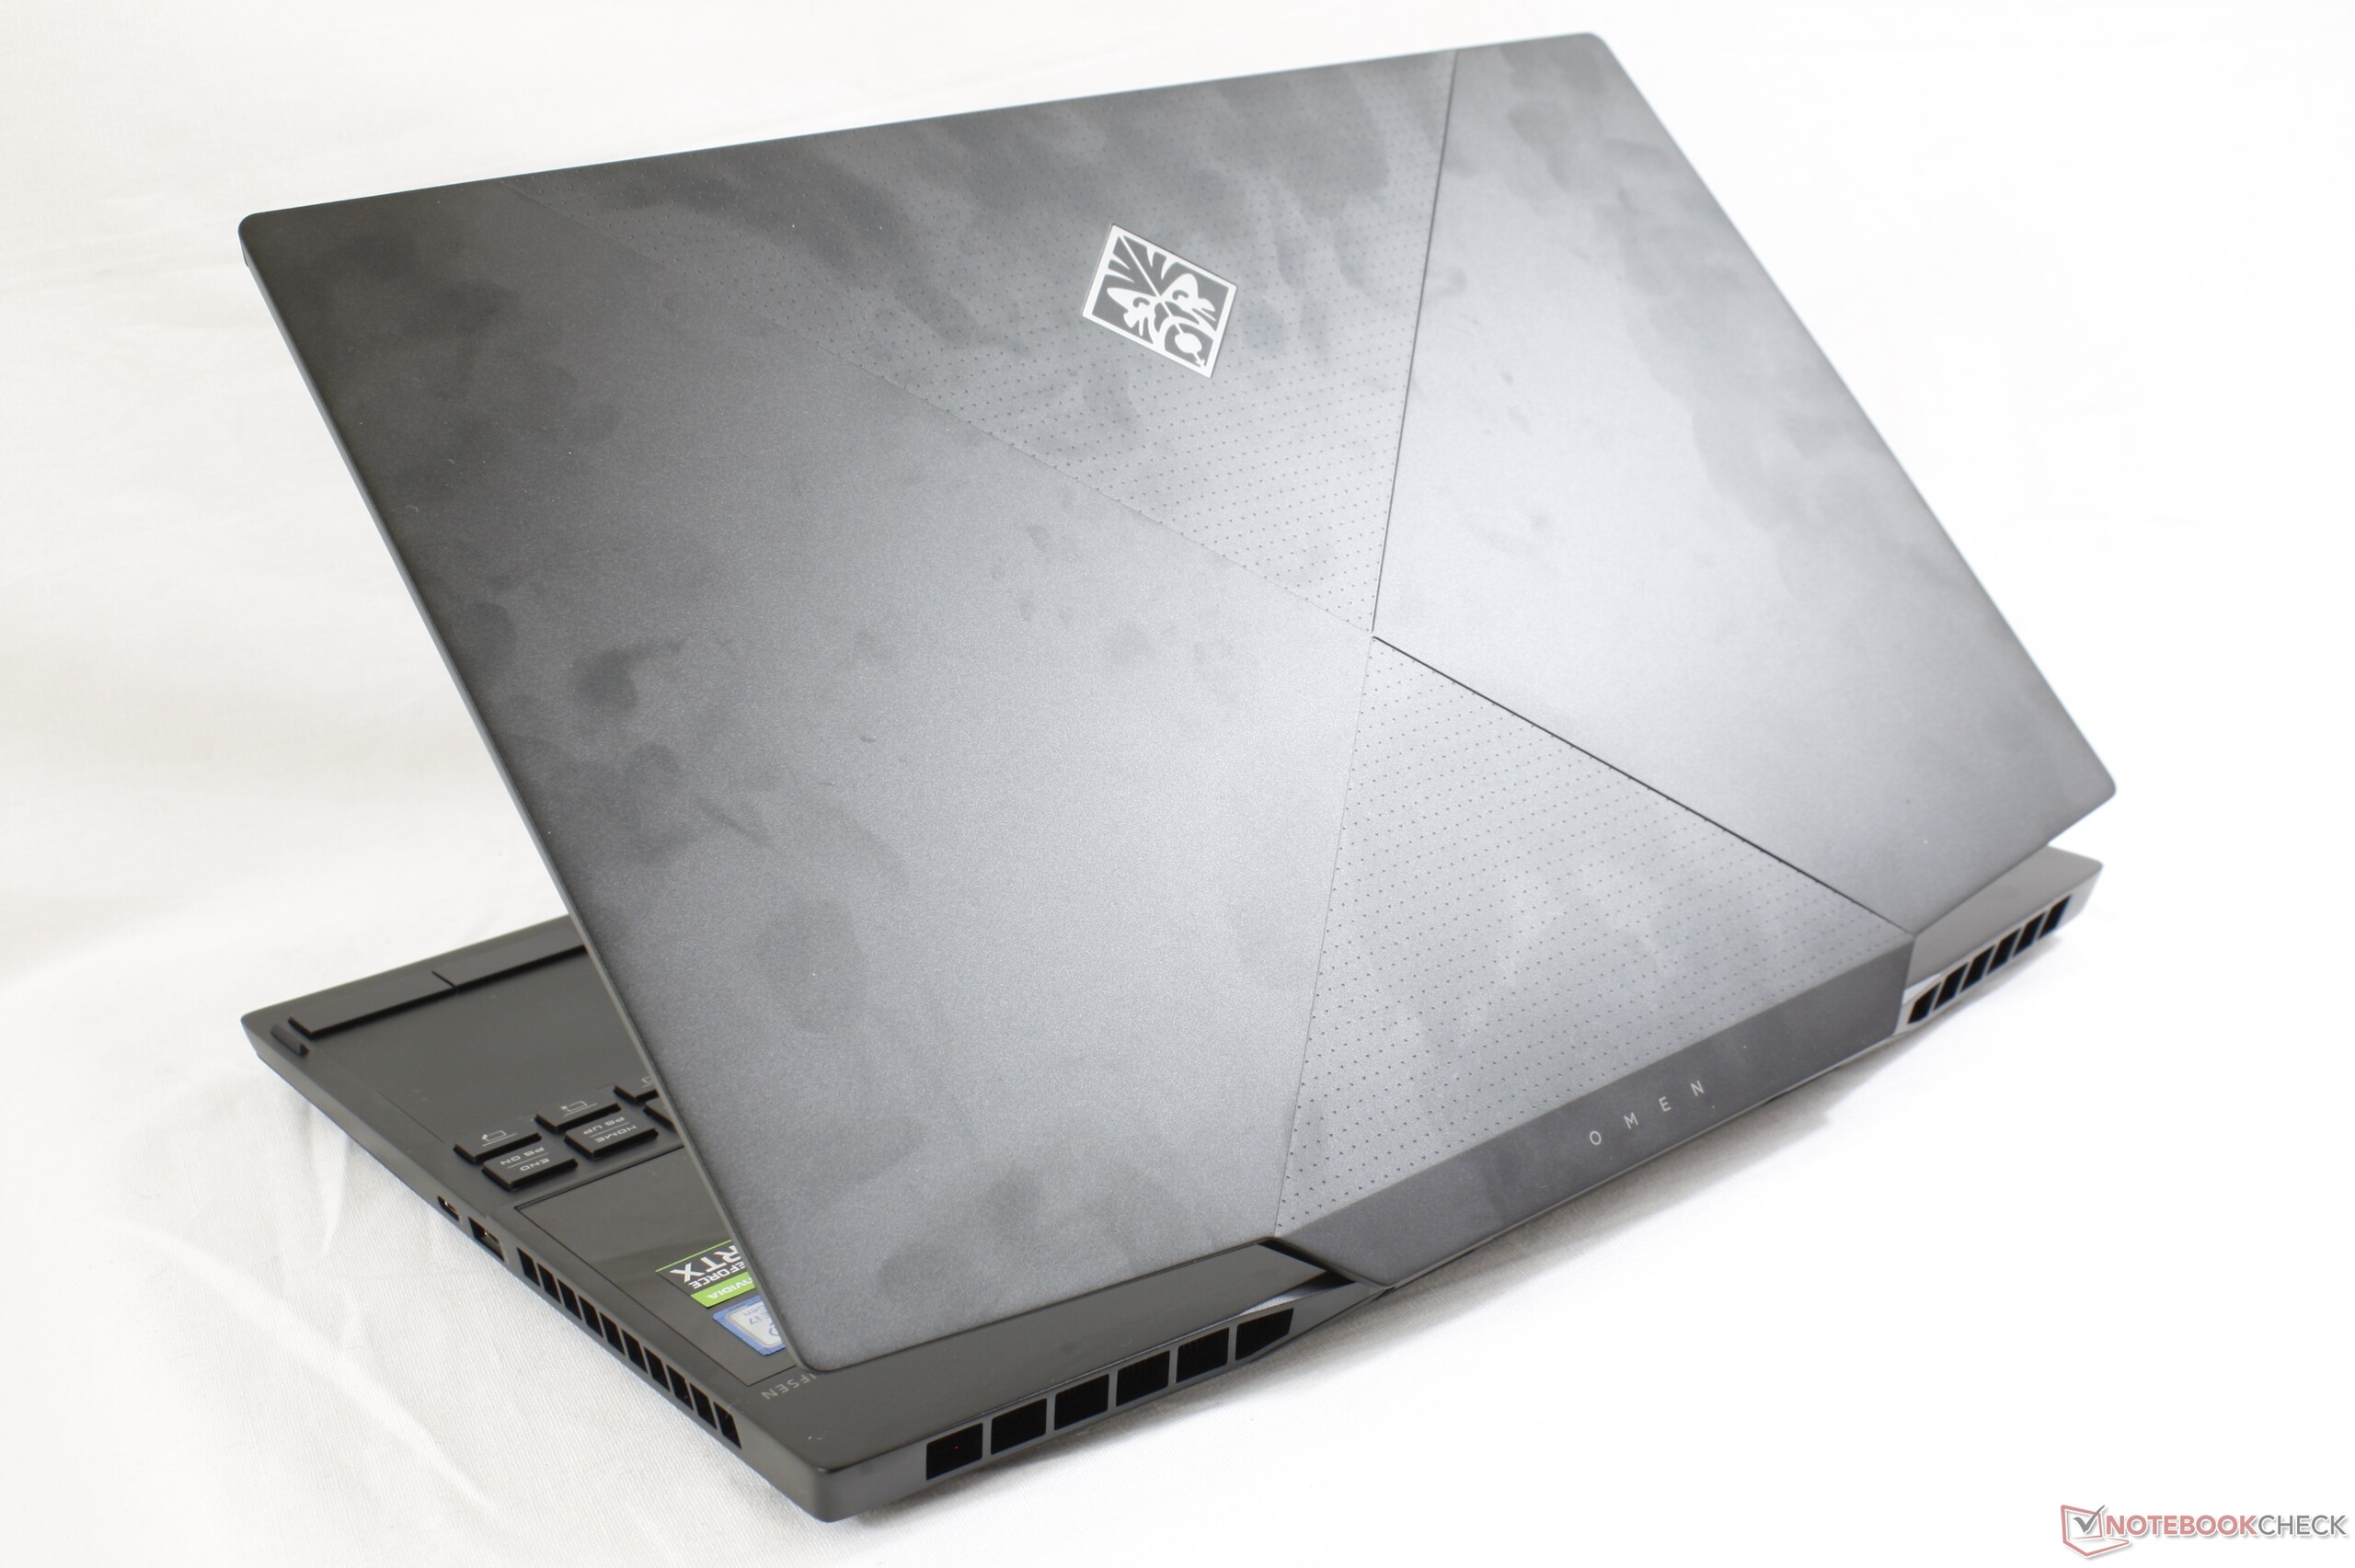
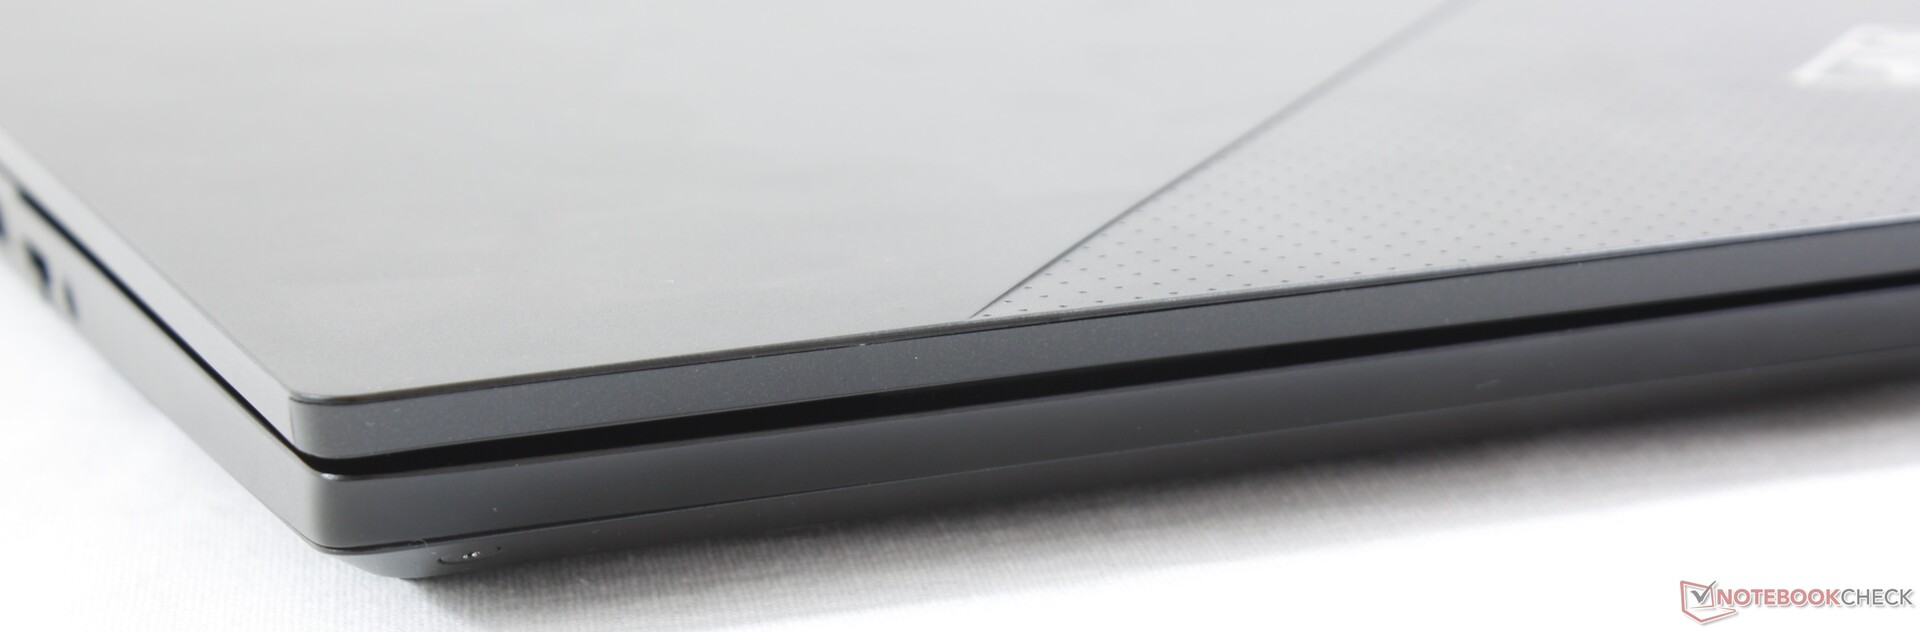
The new Omen design has nearly the same footprint as last year's model but at a significantly thinner profile (19.8 mm vs 25 mm). It's ever-so-slightly heavier than many other narrow bezel 15.6-inch laptops by about 100 g to 200 g including the Razer Blade 15, Lenovo Legion Y740, Alienware m15 R2, and even the last generation Omen 15.
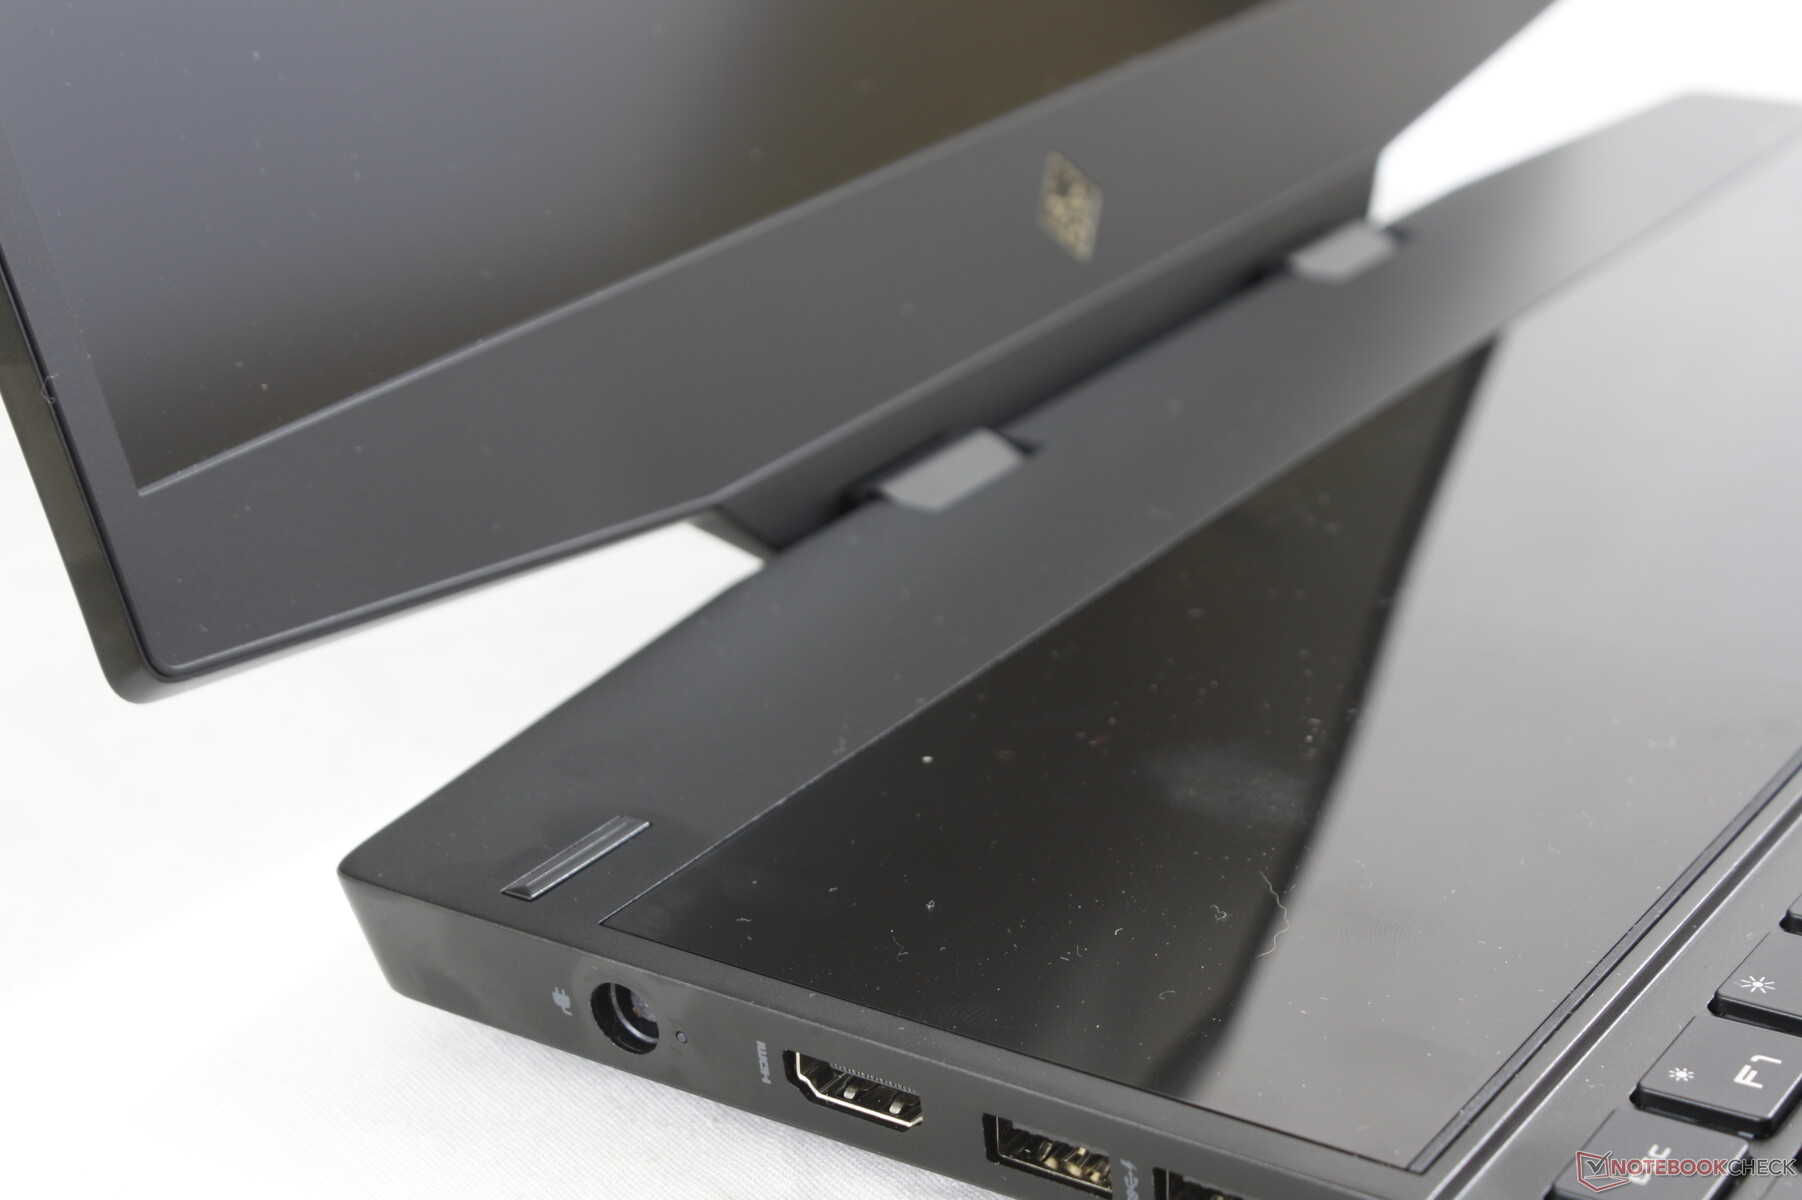
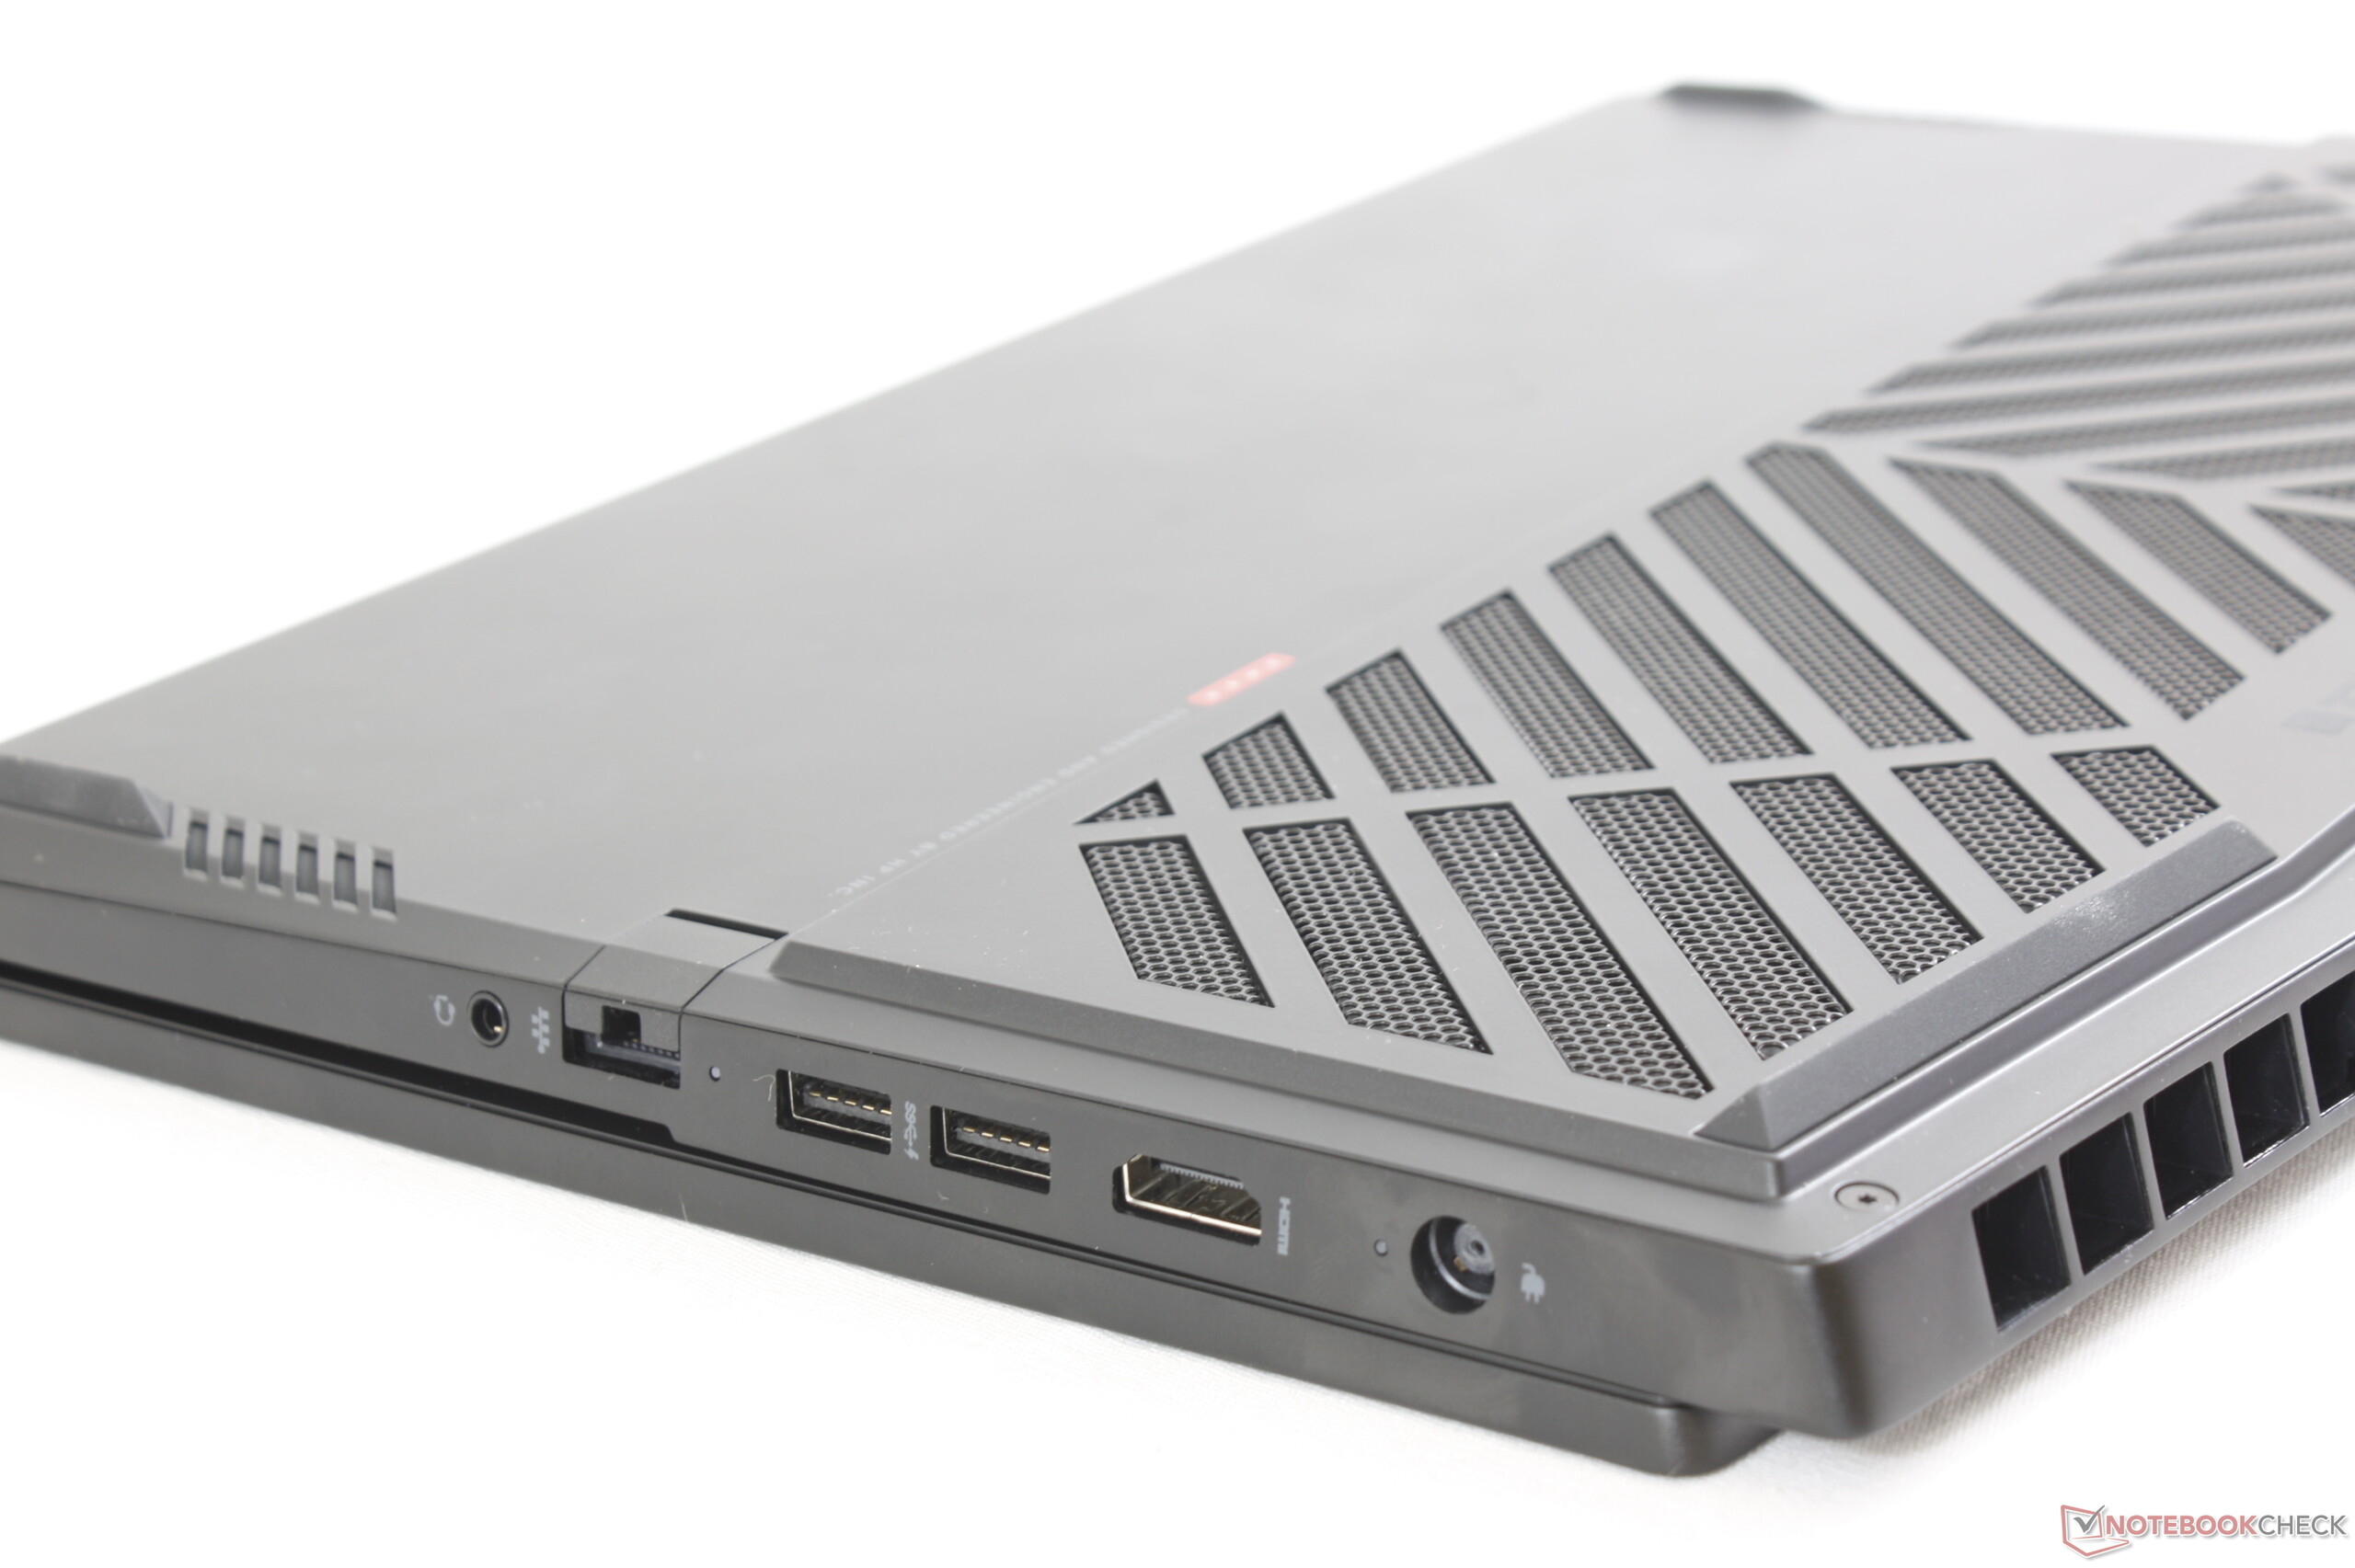
Connectivity
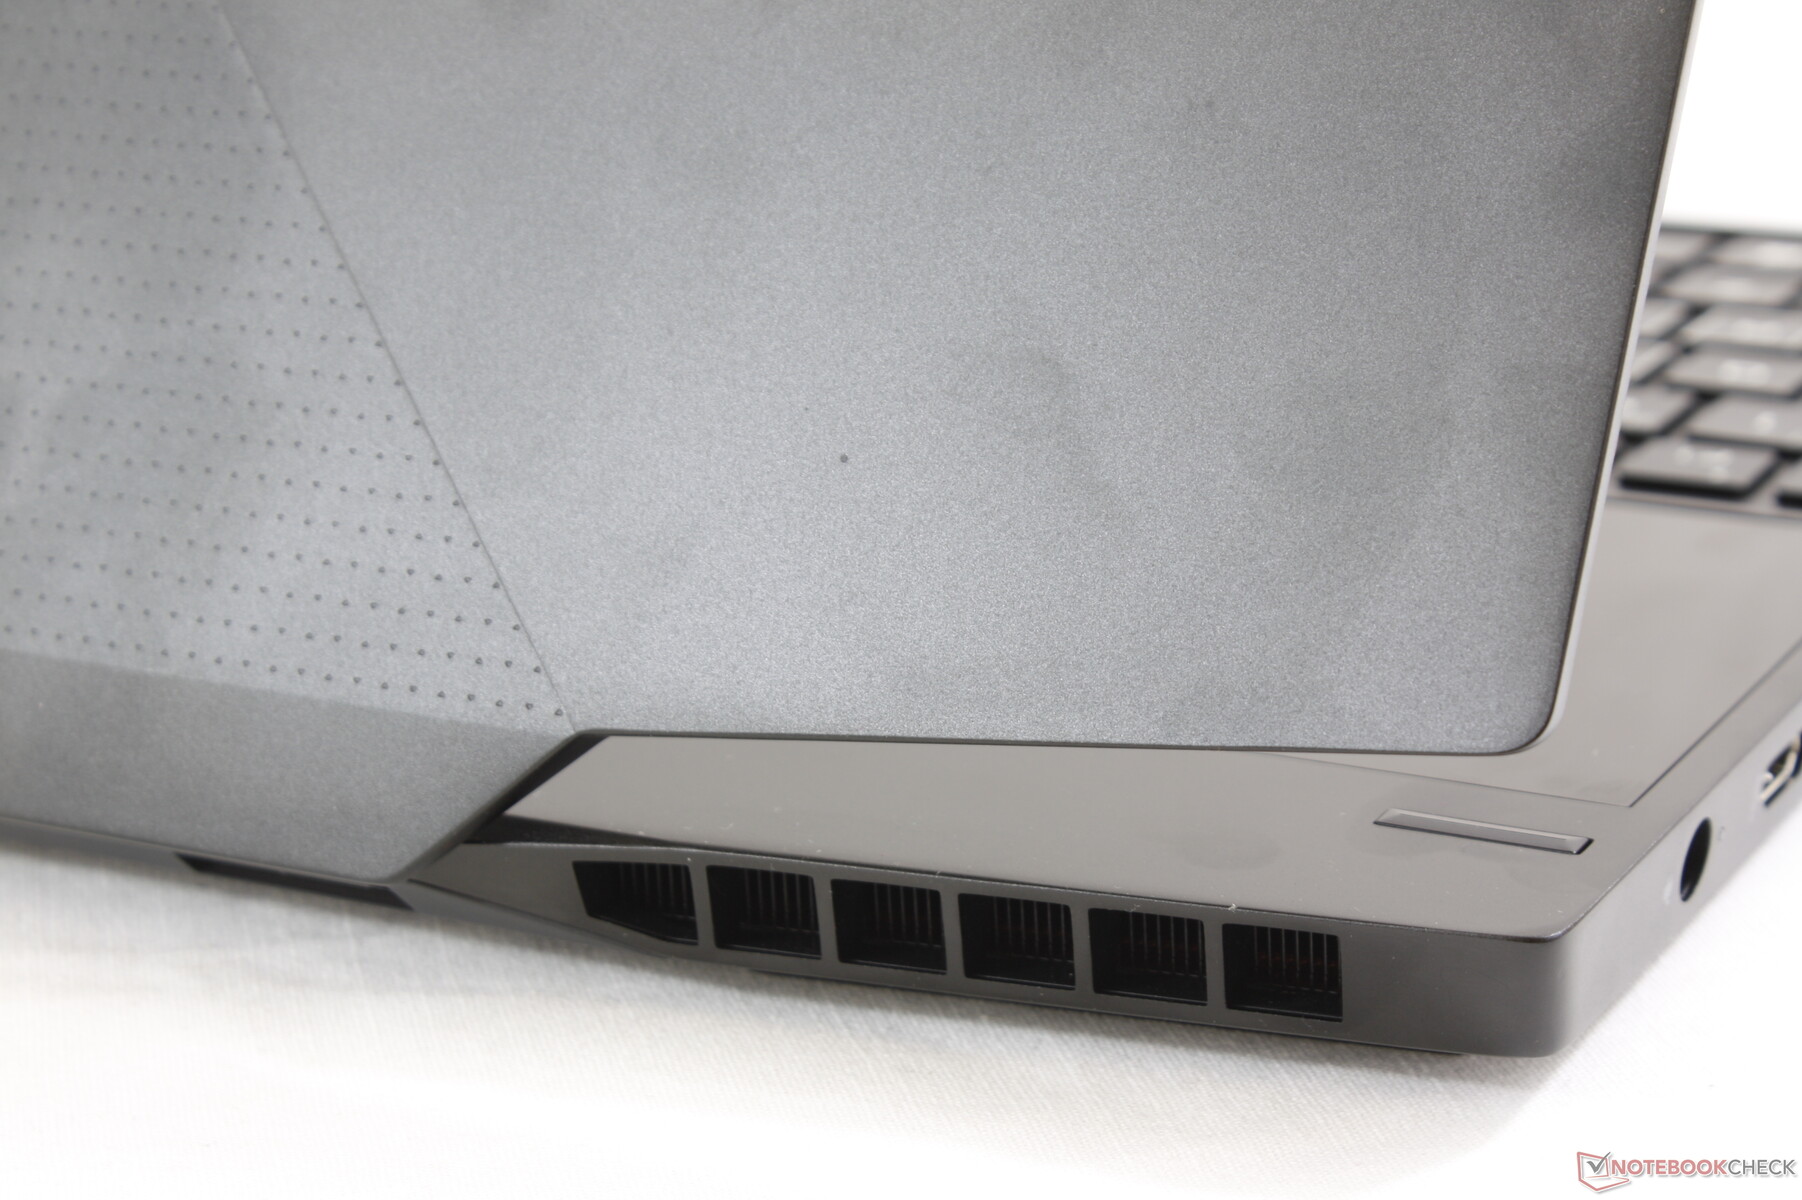
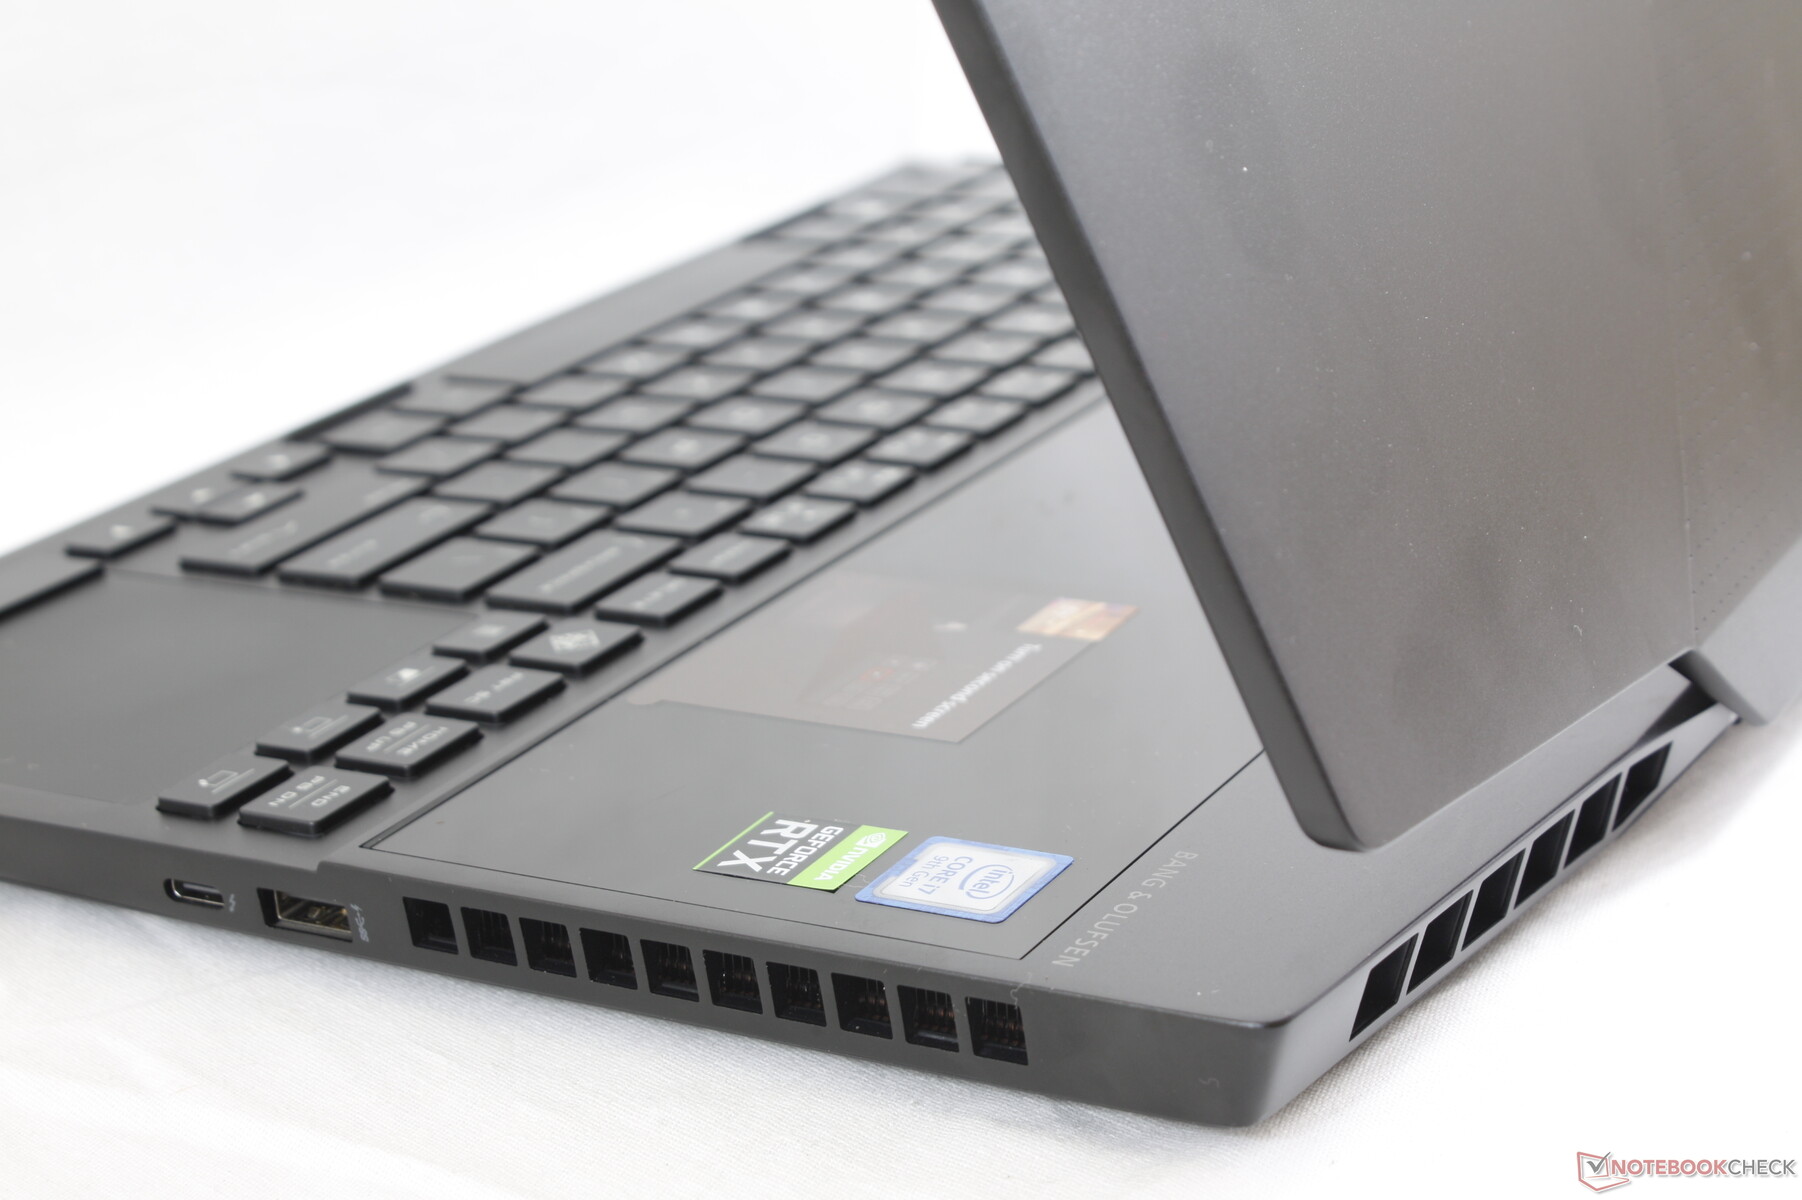
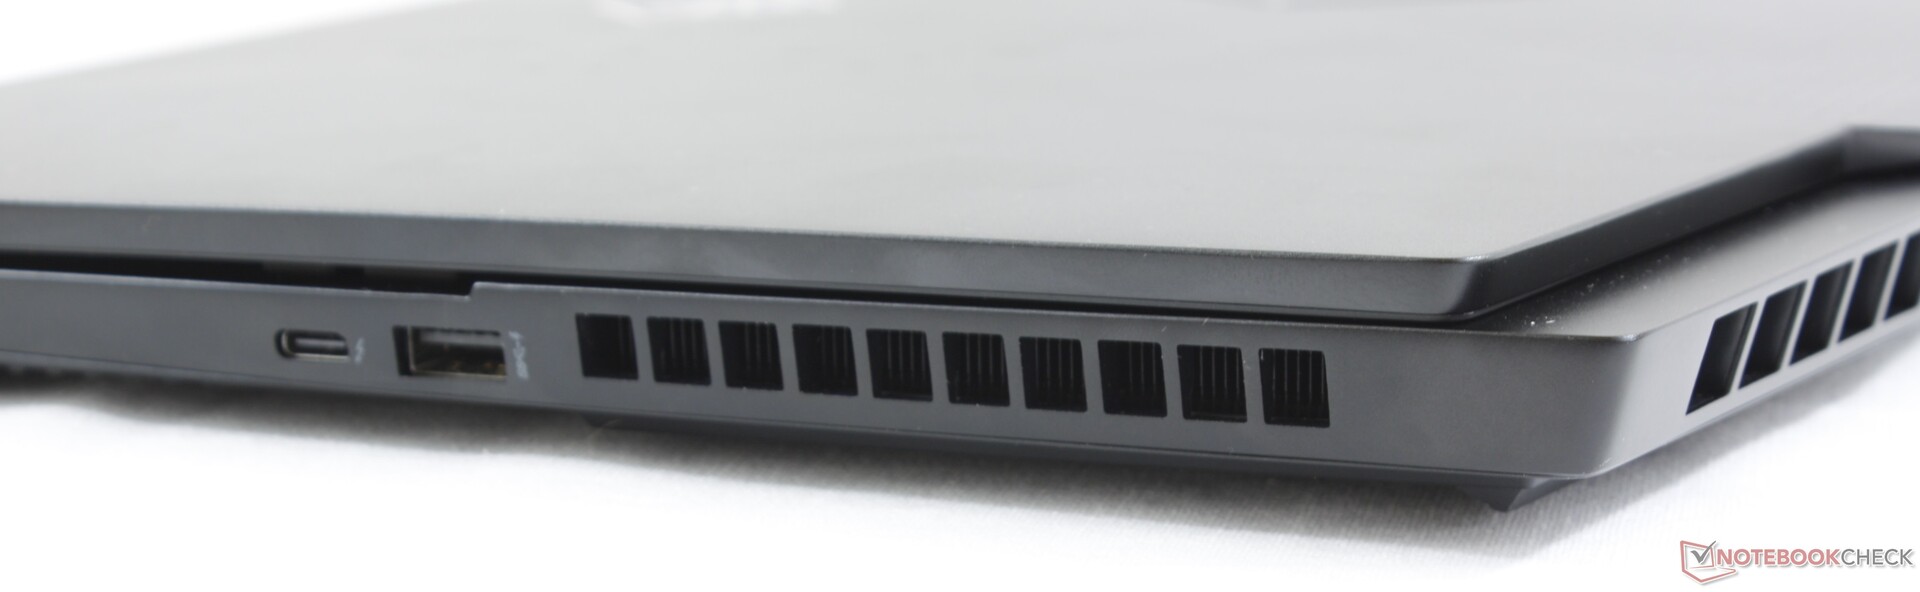
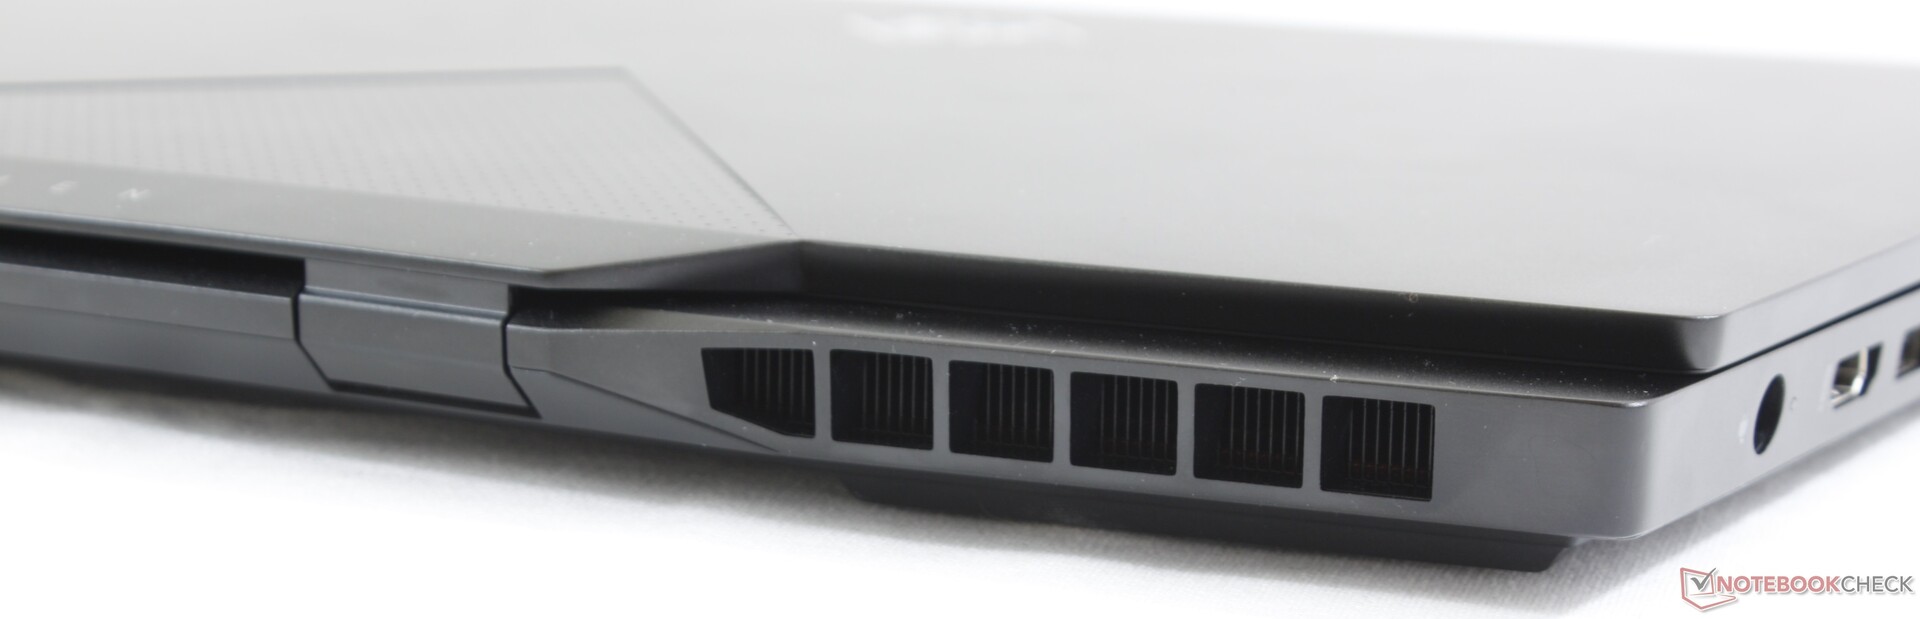
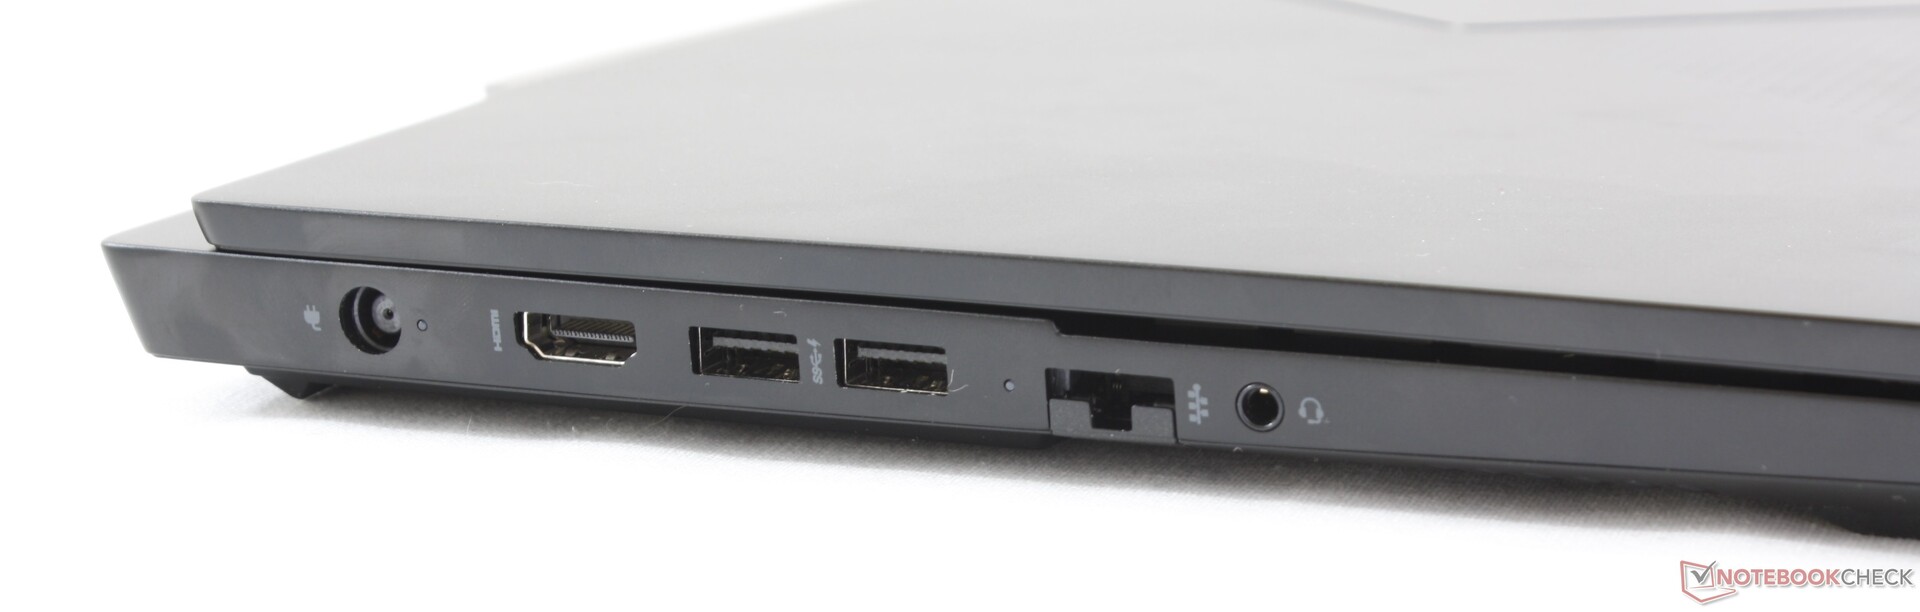
Port options and positioning have changed dramatically from last year's Omen 15. The mini-DisplayPort, Kensington Lock, and SD card reader have all been dropped in return for Thunderbolt 3 compatibility. All ports are now easier to reach as the rear ports have been moved to the sides instead.
Communication
WLAN is provided by an Intel 9560 module with integrated Bluetooth 5. There are no Wi-Fi 6 or Killer options and we experienced no connectivity issues during our time with the test unit.
Performance can be faster than what we've recorded below at up to 1.73 Gbps since our server is limited by a 1 Gbps line.
| Networking | |
| iperf3 transmit AX12 | |
| Razer Blade 15 RTX 2080 Max-Q | |
| HP Omen 15-dc1020ng | |
| HP Omen X 2S 15-dg0075cl | |
| HP Omen 15-dc1303ng | |
| iperf3 receive AX12 | |
| Razer Blade 15 RTX 2080 Max-Q | |
| HP Omen X 2S 15-dg0075cl | |
| HP Omen 15-dc1303ng | |
| HP Omen 15-dc1020ng | |
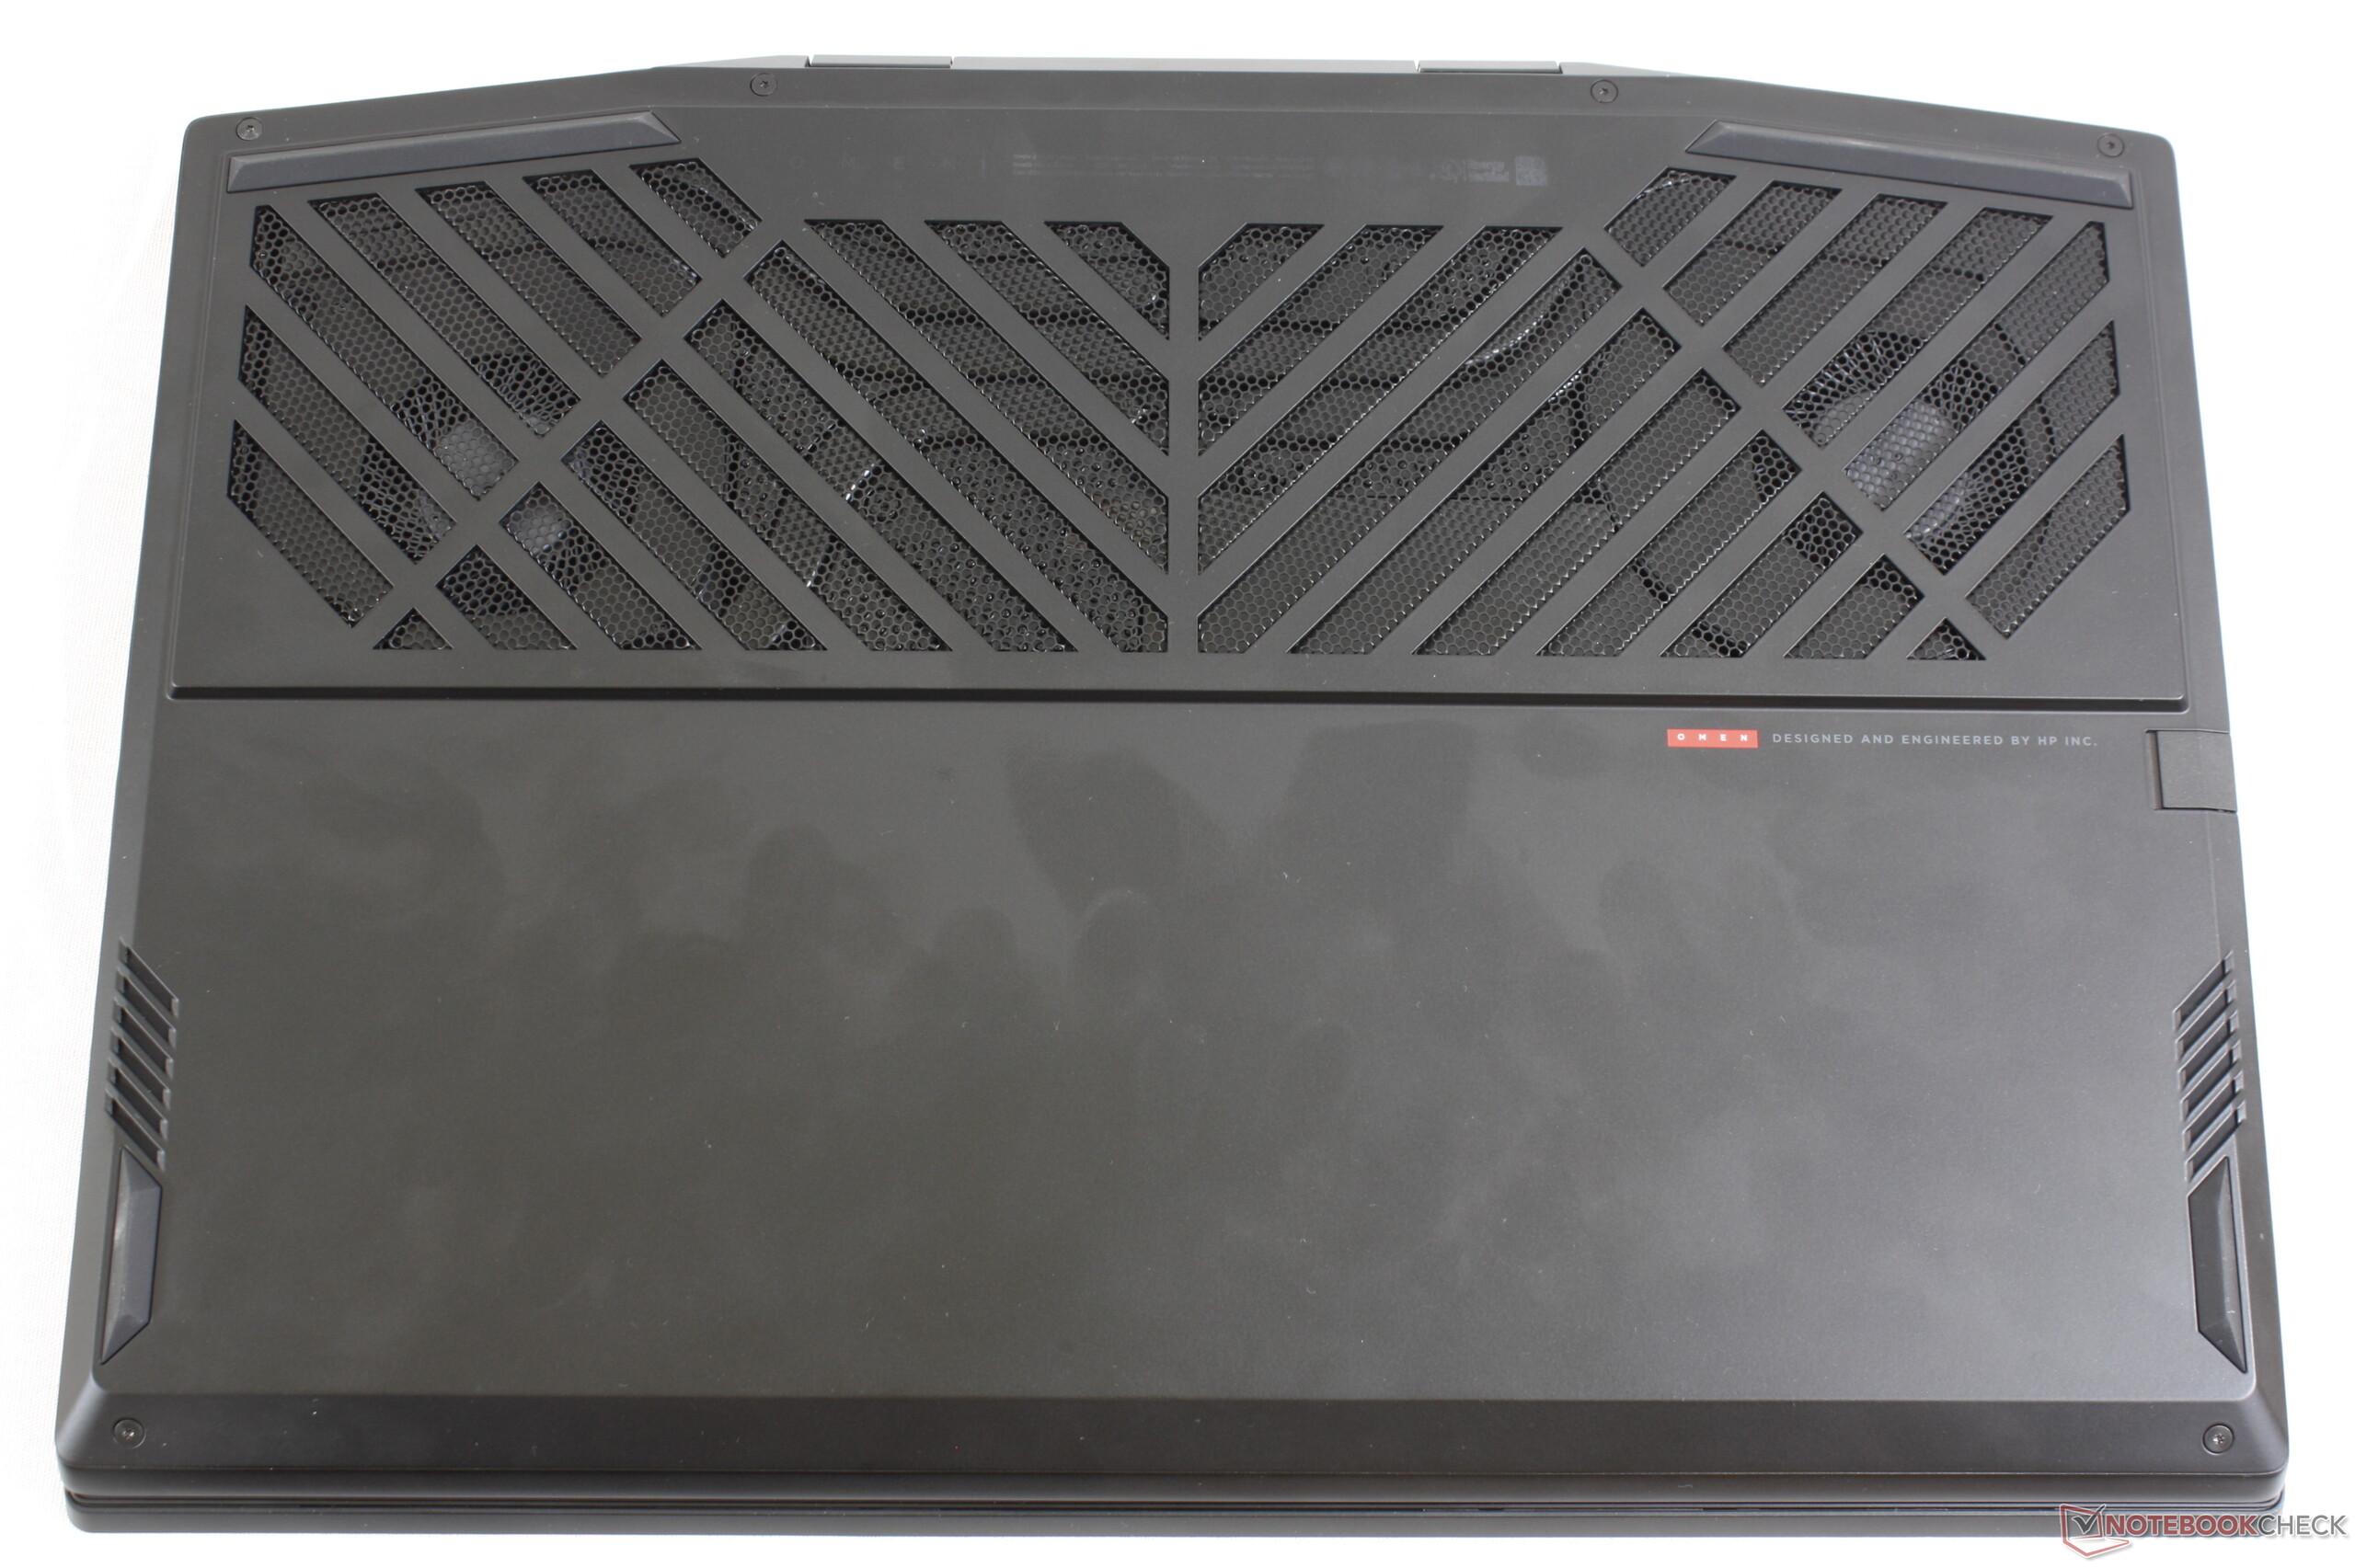
Maintenance
The bottom panel is secured by six T6 Torx screws. Unfortunately, the edges and corners are both sharp and tightly latched to discourage end-user tampering which is a shame because there are two SODIMM slots and two M.2 2280 PCIe x4 slots. LaptopMedia has a quick breakdown on the Omen X 2S 15 here.
Accessories and Warranty
The most notable accessory in the retail packaging is the soft Omen-branded wrist rest to make typing more comfortable. Typing without the wrist rest can be uncomfortable since there are no palm rests on the Omen 2S 15.
The standard one-year limited warranty applies with up to three years of accidental damage protection as optional.
Input Devices
Keyboard
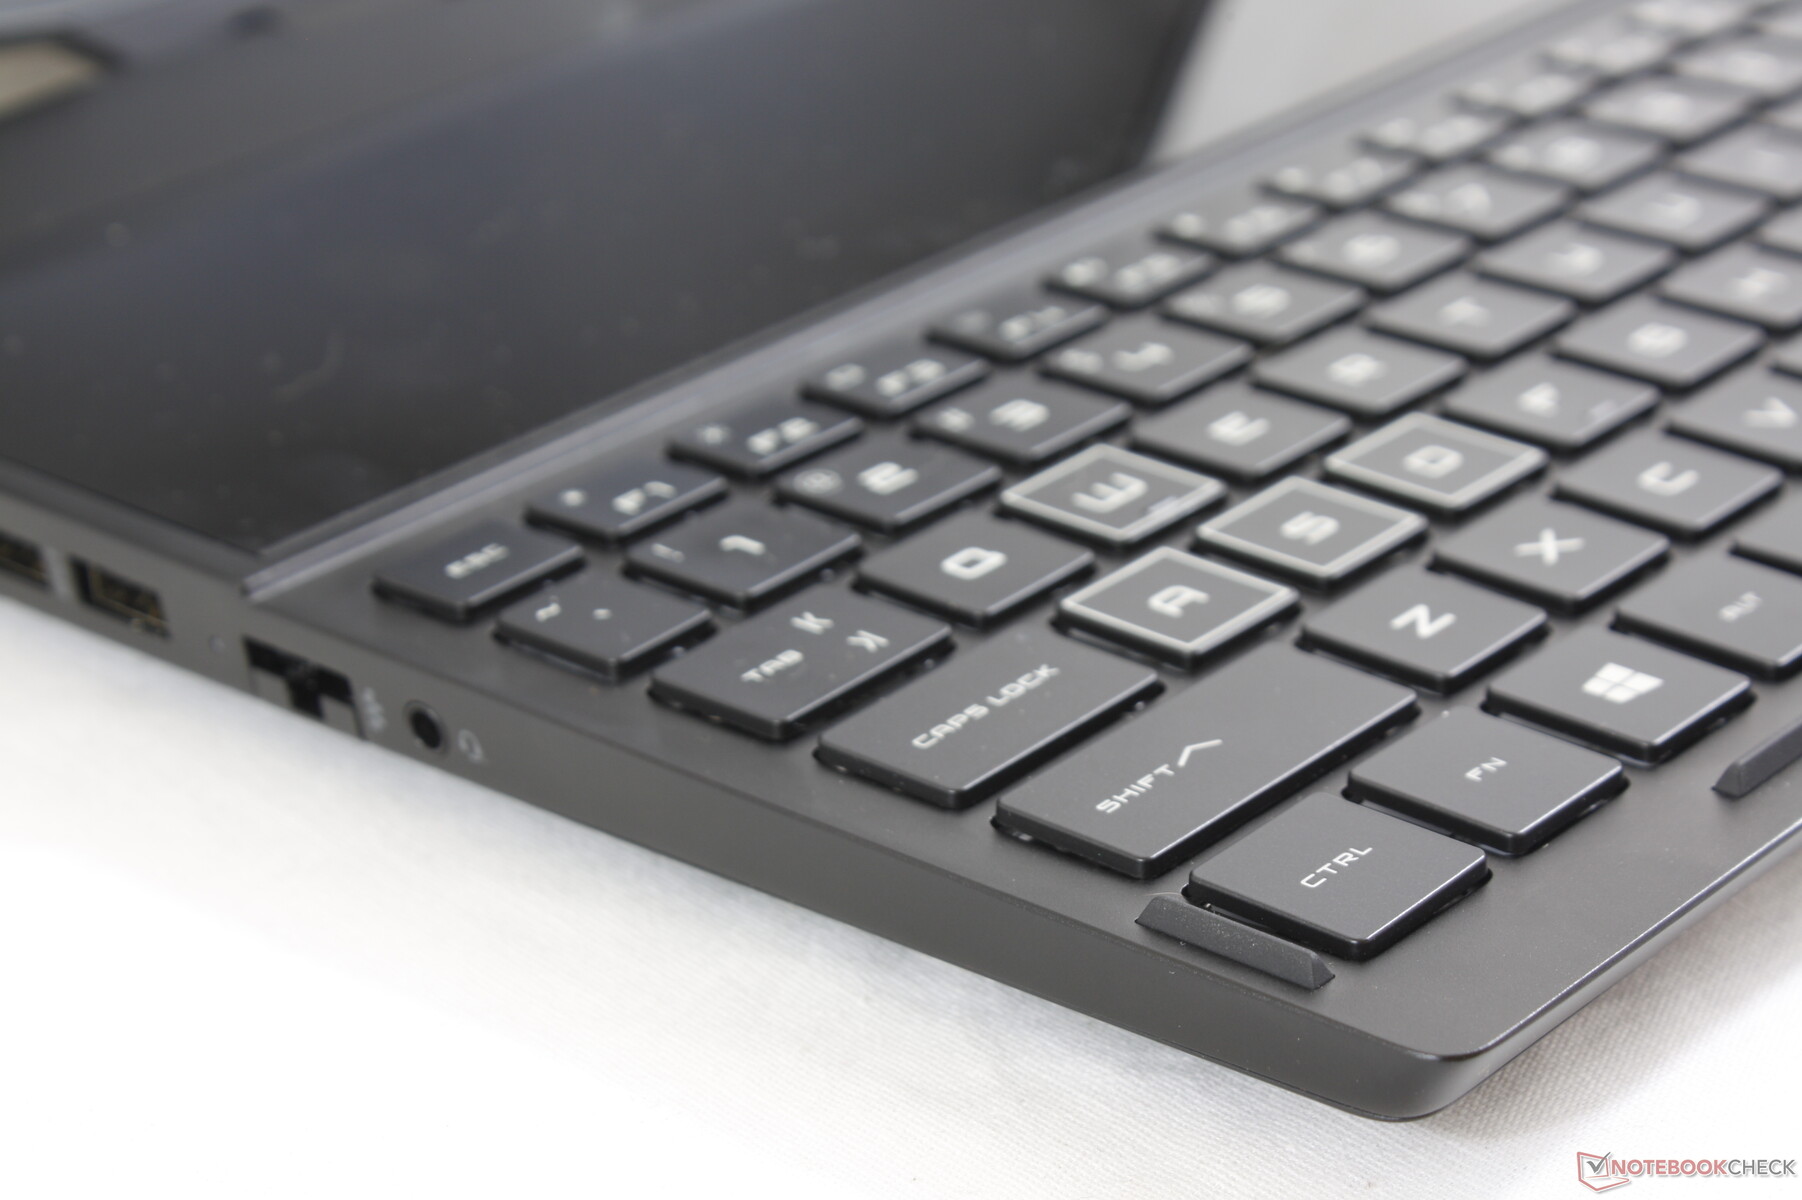
We had low expectations for the keyboard given the poor impressions of the Zephyrus GX501 keyboard. But to our surprise, the keyboard here on the Omen actually feels like a normal keyboard in terms of tactility. Travel and feedback do not appear to be compromised by the unusual positioning to feel closer to a regular gaming laptop. Even so, we would have preferred firmer key feedback like on the Spectre x360 15 especially for the Enter key which feels a bit on the soft side.
One of the worst drawbacks of a front keyboard is the lack of any palm rests when typing. Thus, your palms will be at a lower height than the keyboard base and you would have to compensate by arcing your fingers more when typing. It's recommended to use the included wrist rest for long sessions.
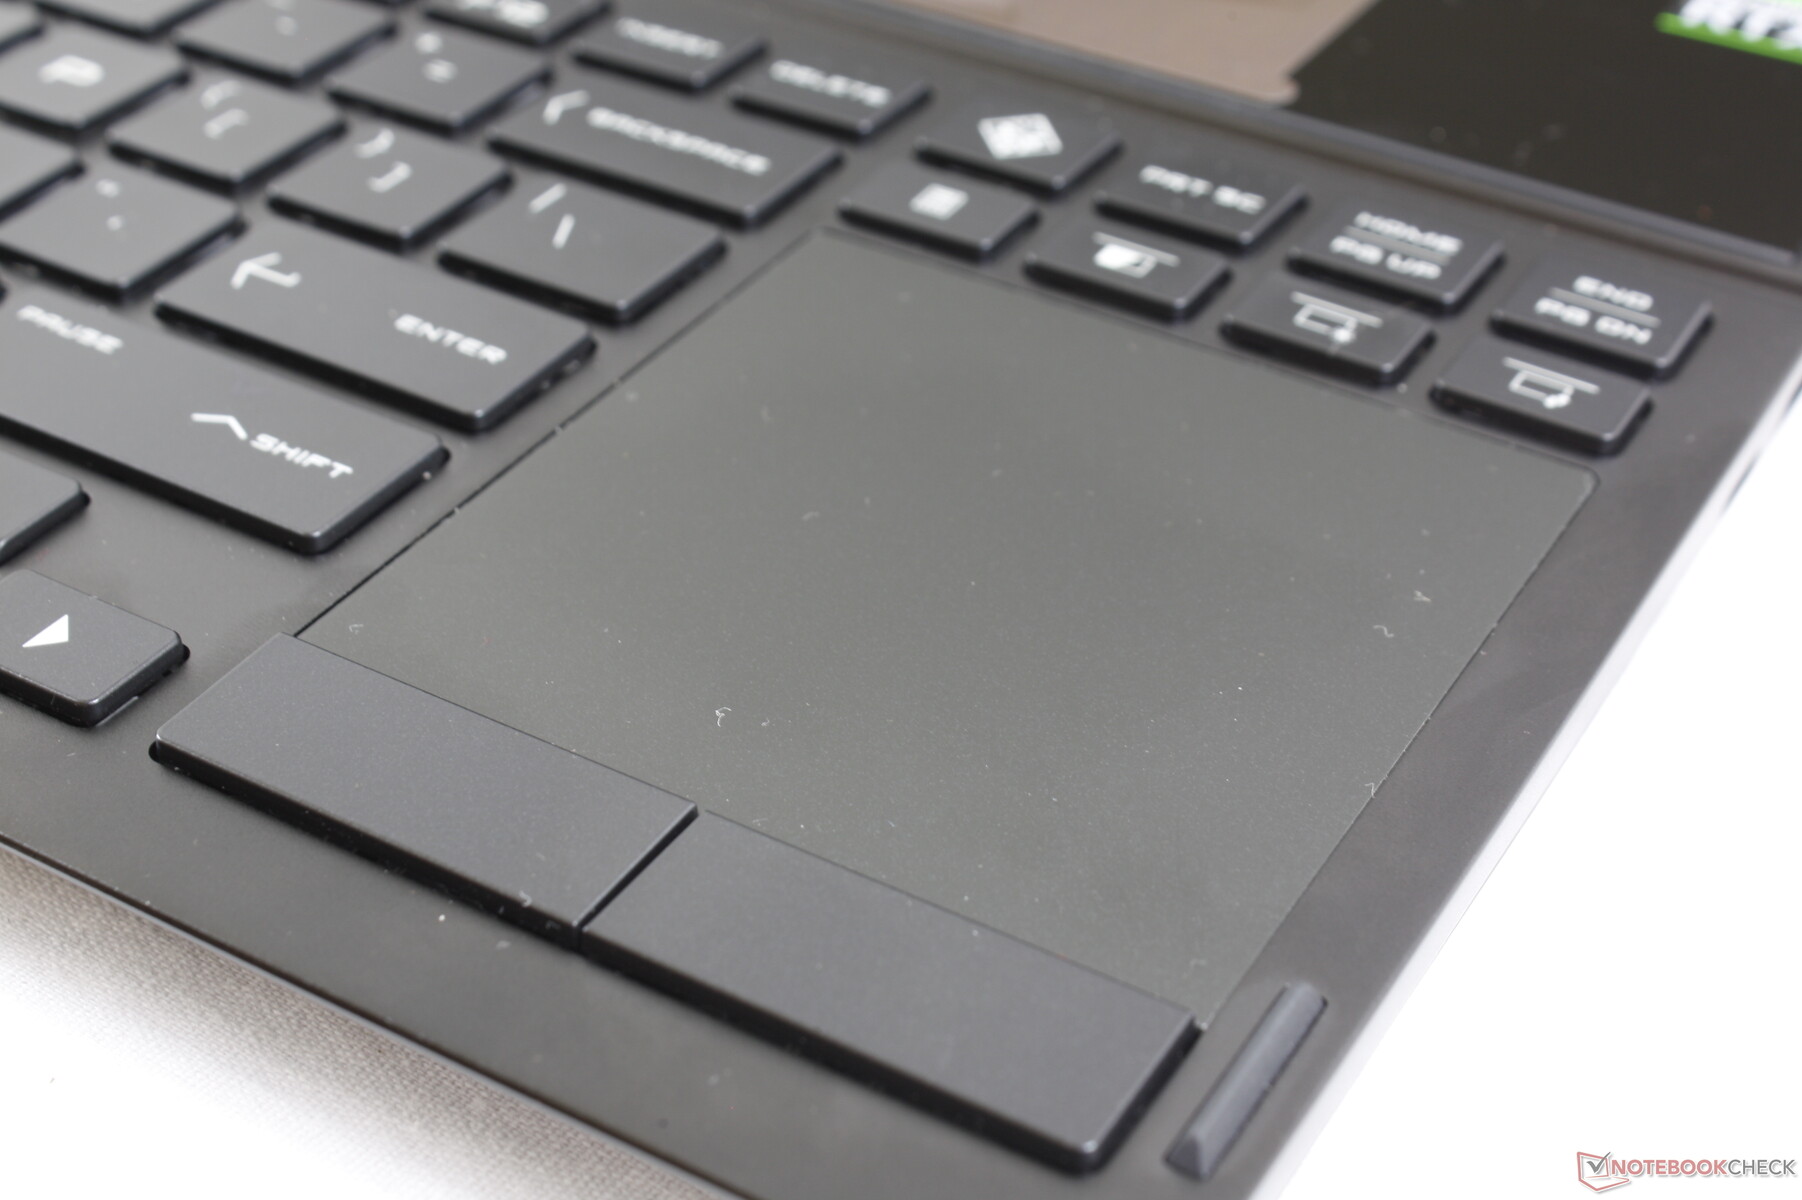
Touchpad
The small Precision-enabled trackpad (~7 x 6.8 cm) offers smooth gliding when moving at medium to fast speeds and some sticking when moving at slower speeds. While reliable and accurate fur cursor movements, the cramped surface area makes it cumbersome to use for long periods especially since there are two screens to work with.
Meanwhile, the dedicated mouse keys have moderate travel, very quiet clatter, and soft feedback when pressed. We still prefer it over integrated clickpad keys as multi-touch actions like dragging and dropping or highlighting are easier.


Display
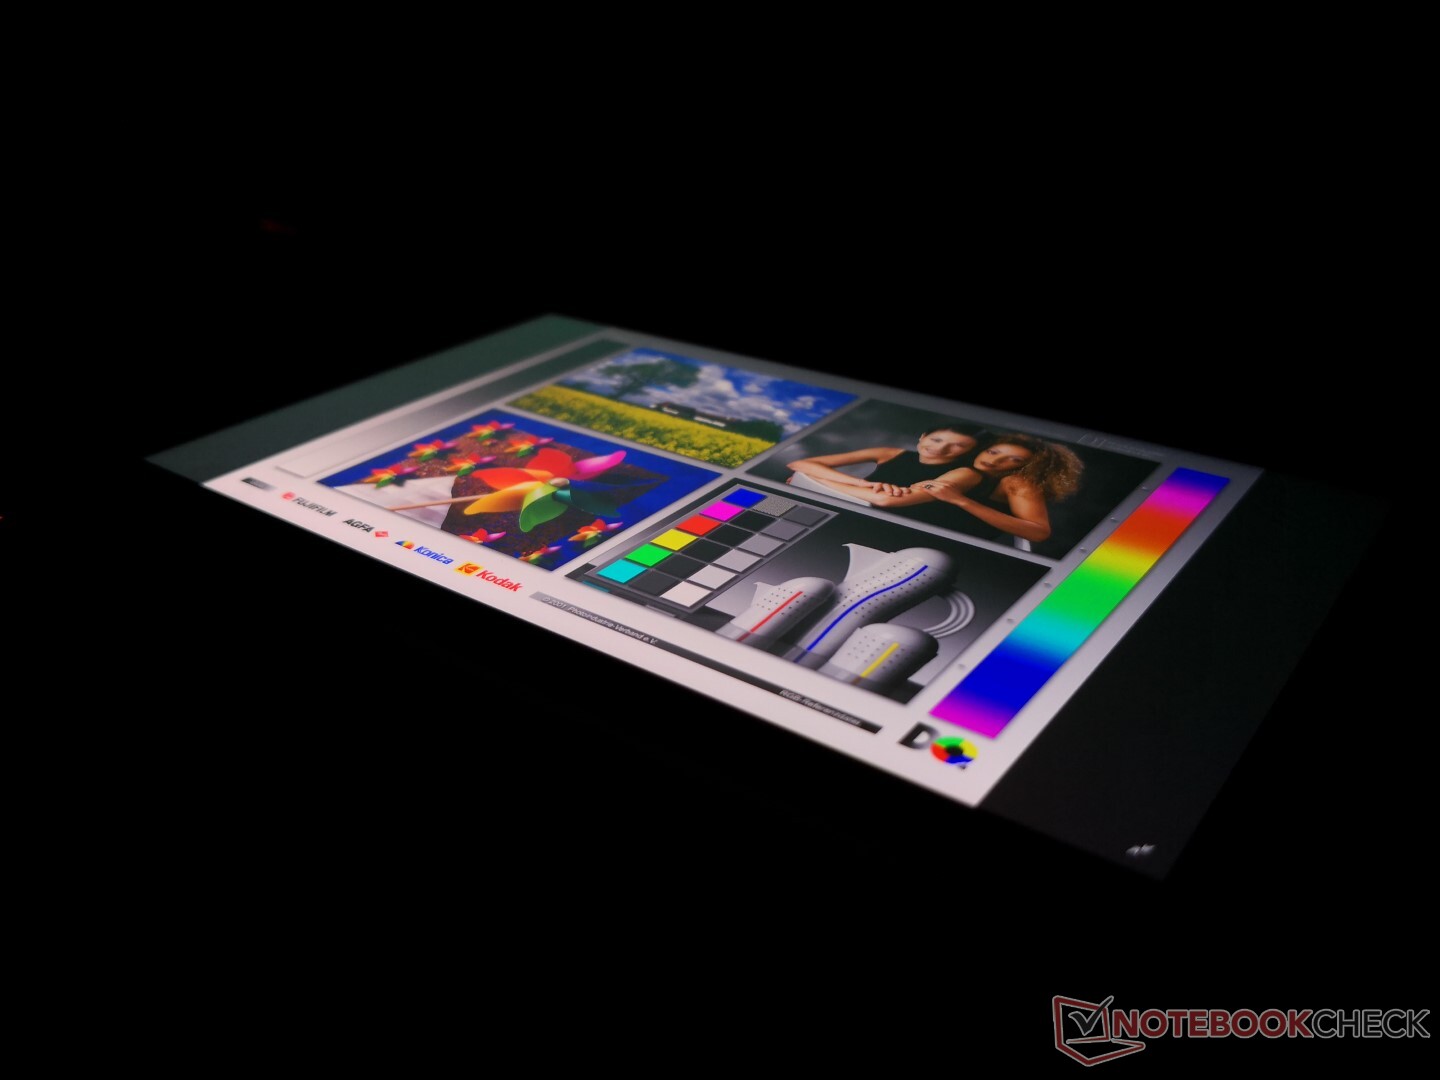
While the main display is sourced from AU Optronics, HWiNFO is unable to pull the exact panel name. The video controller, however, is AUO82ED which is very common on other 15.6-inch gaming laptops like the Asus ROG Strix GL504 Scar II. Coincidentally, both these HP and Asus systems share similar characteristics like the fast 144 Hz refresh rate, fast black-white response times, and wide reproducible color spaces.
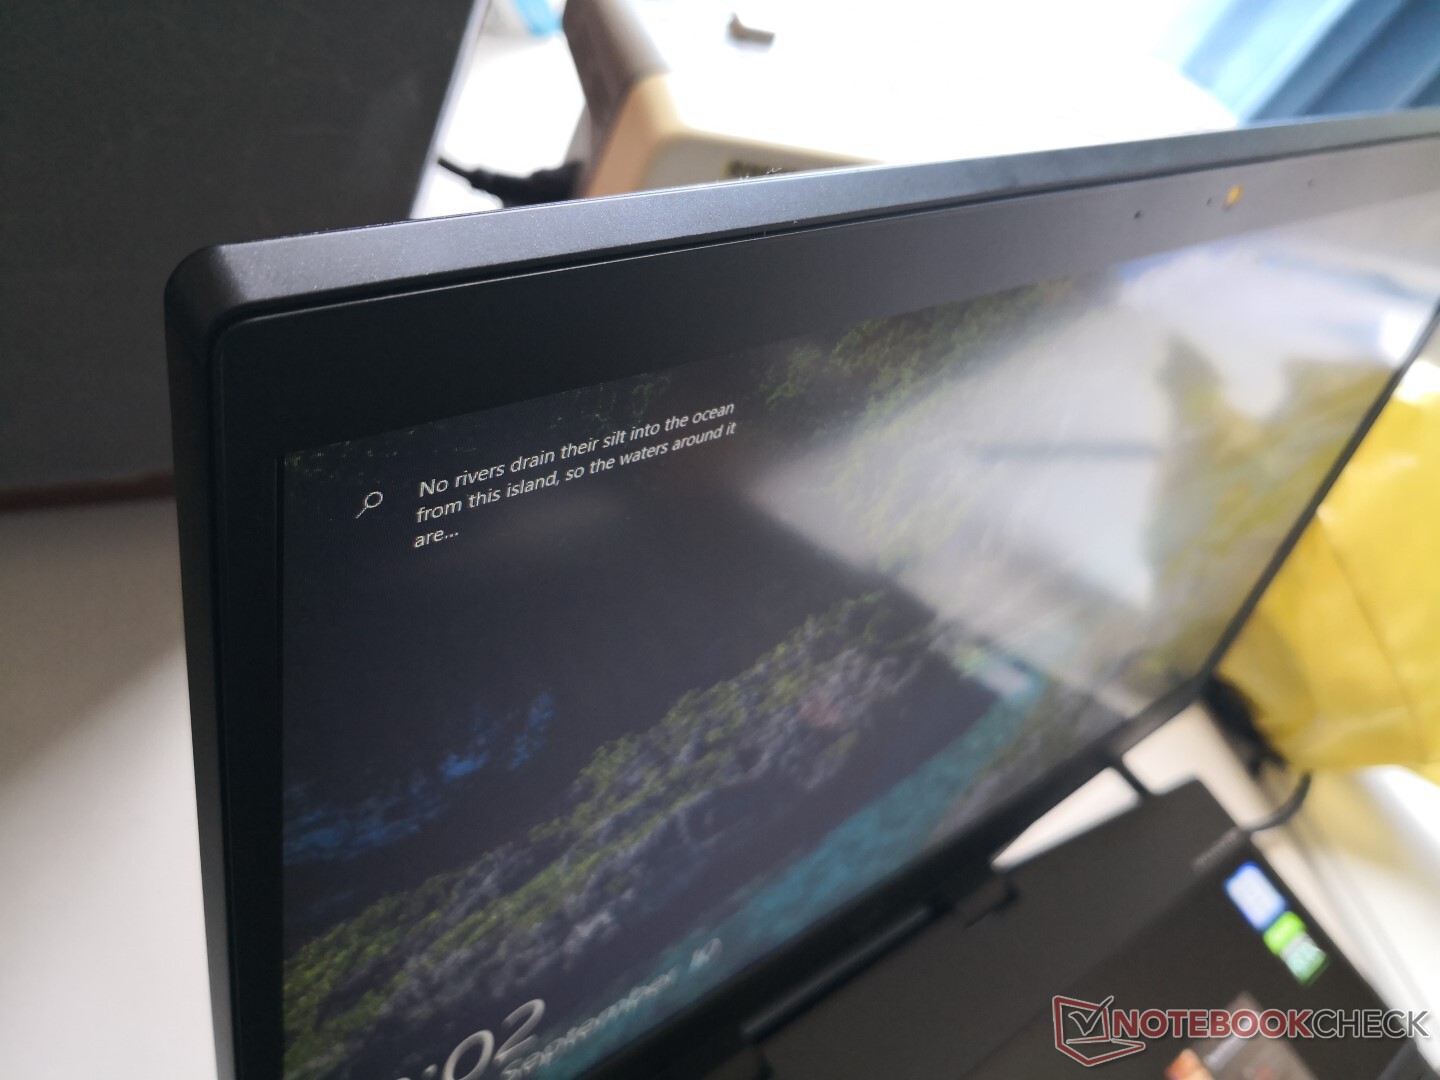
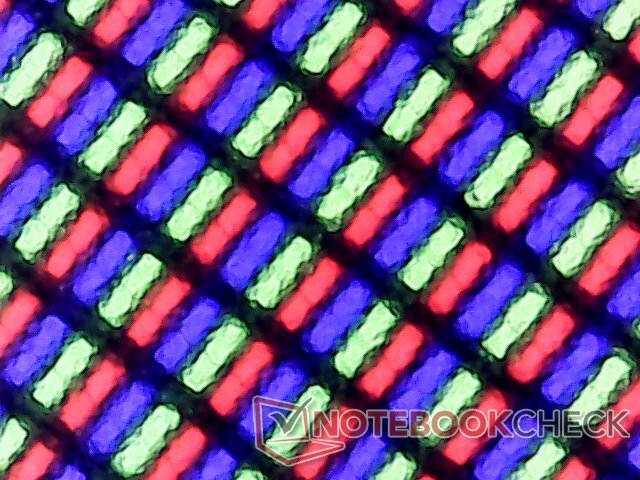
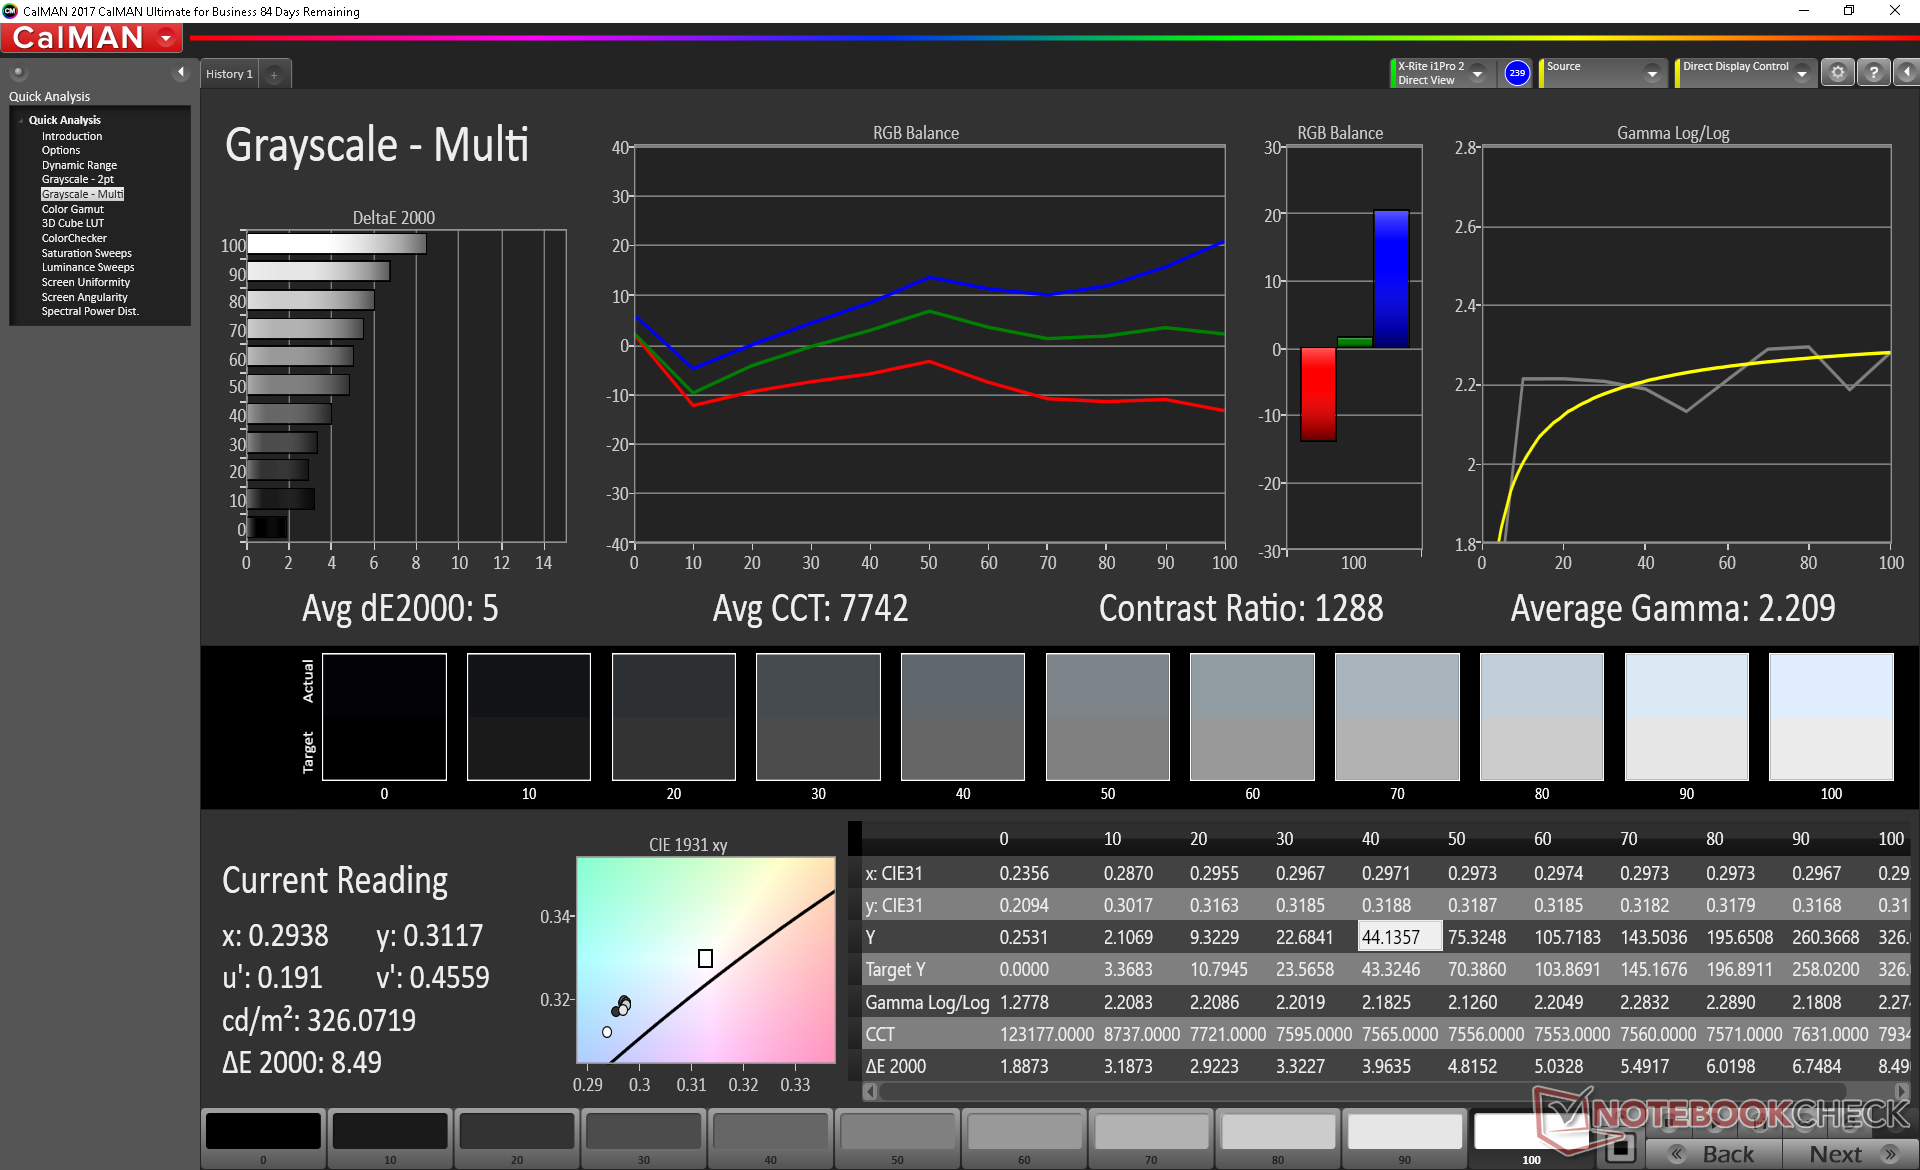
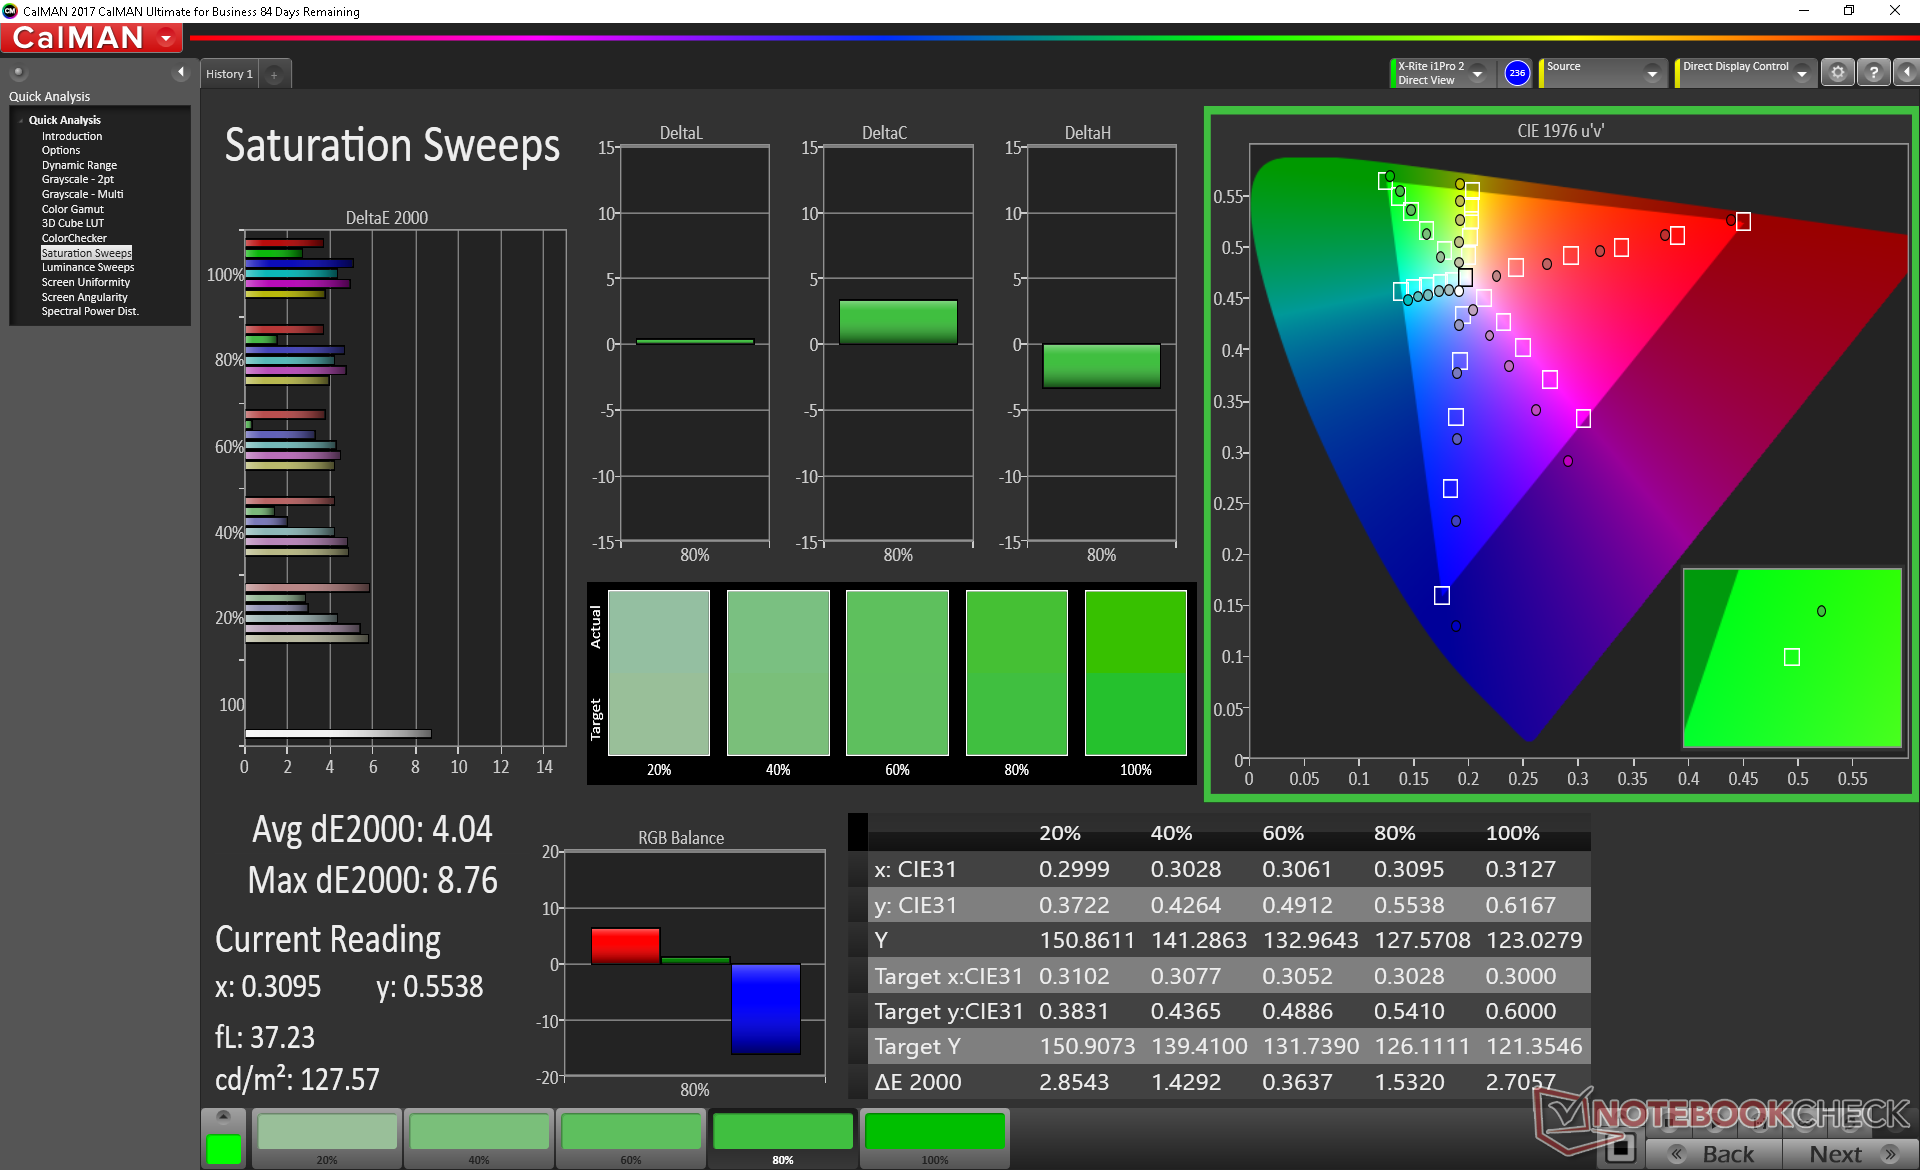
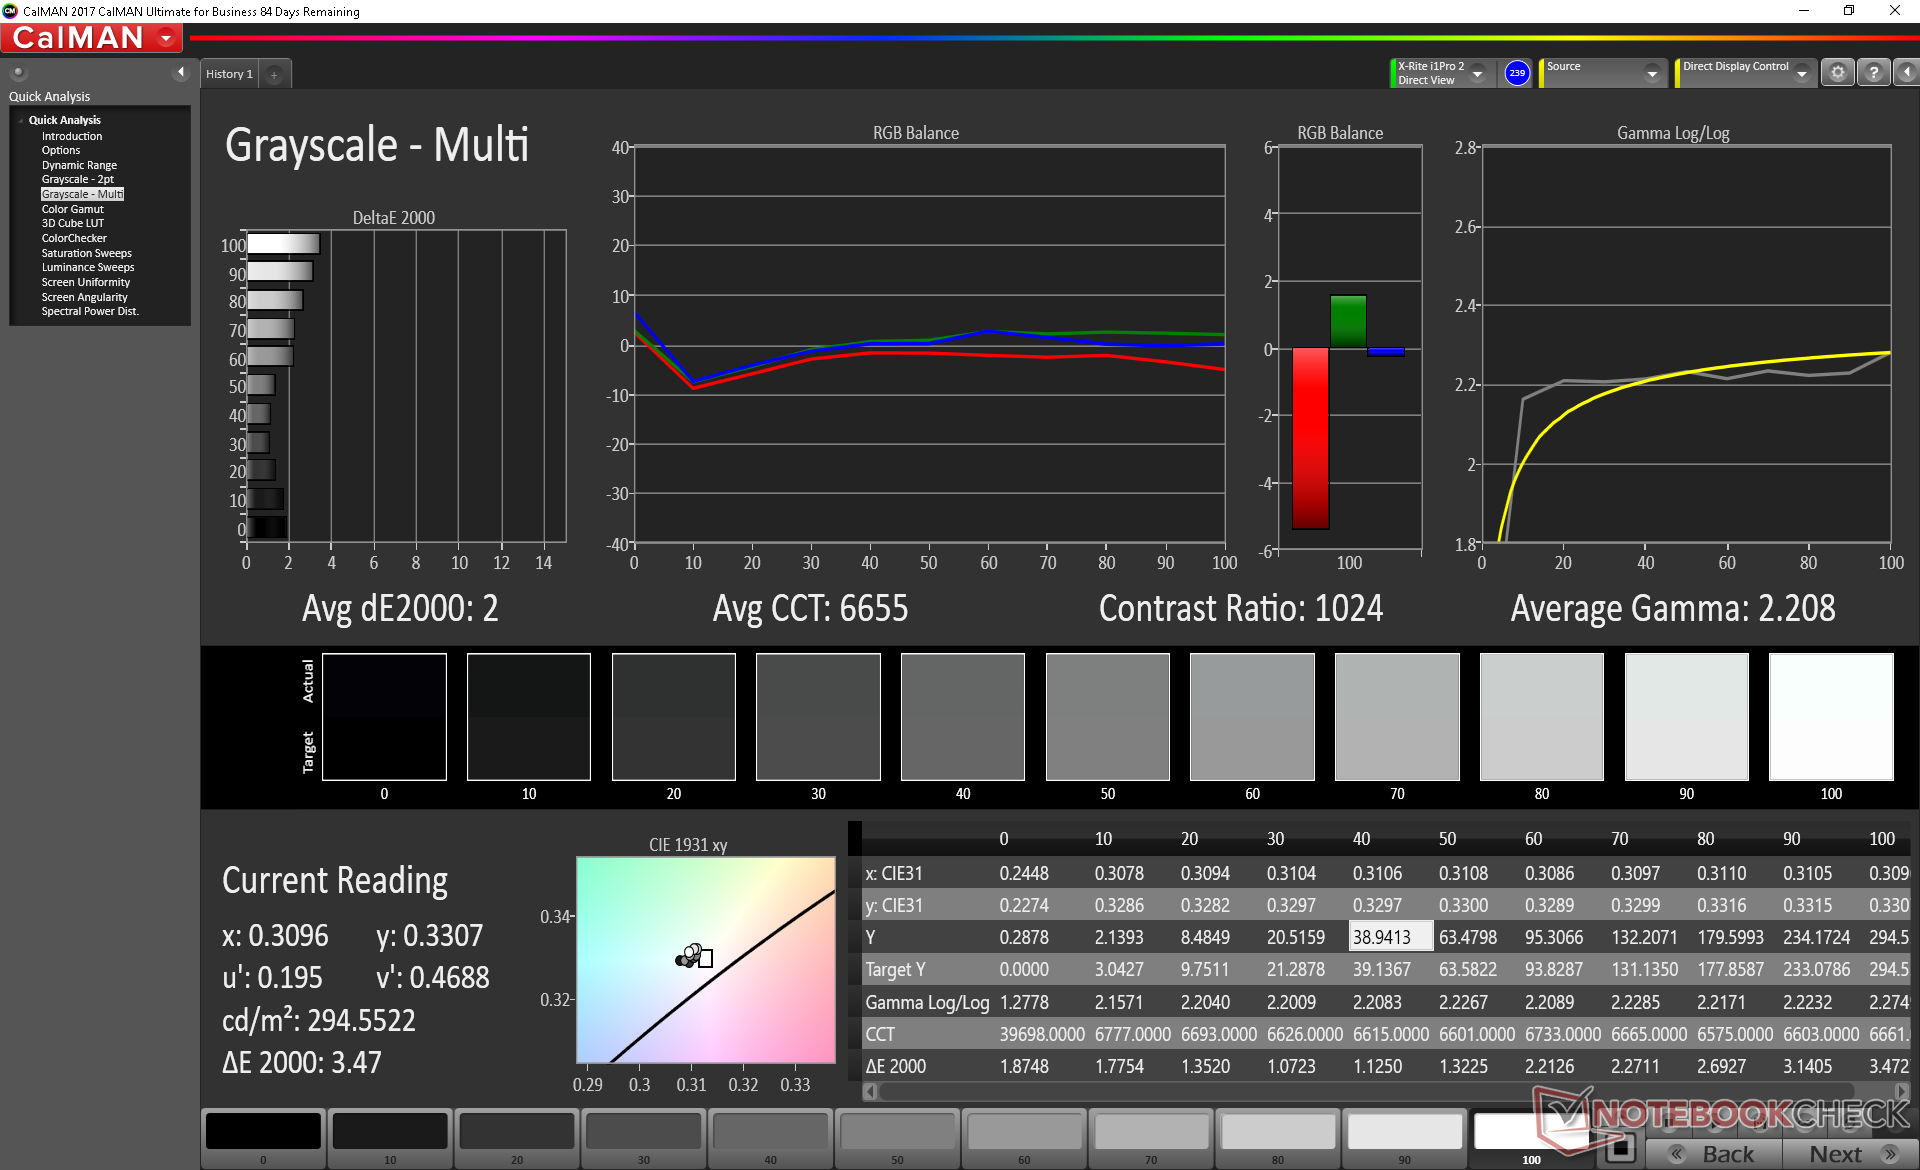
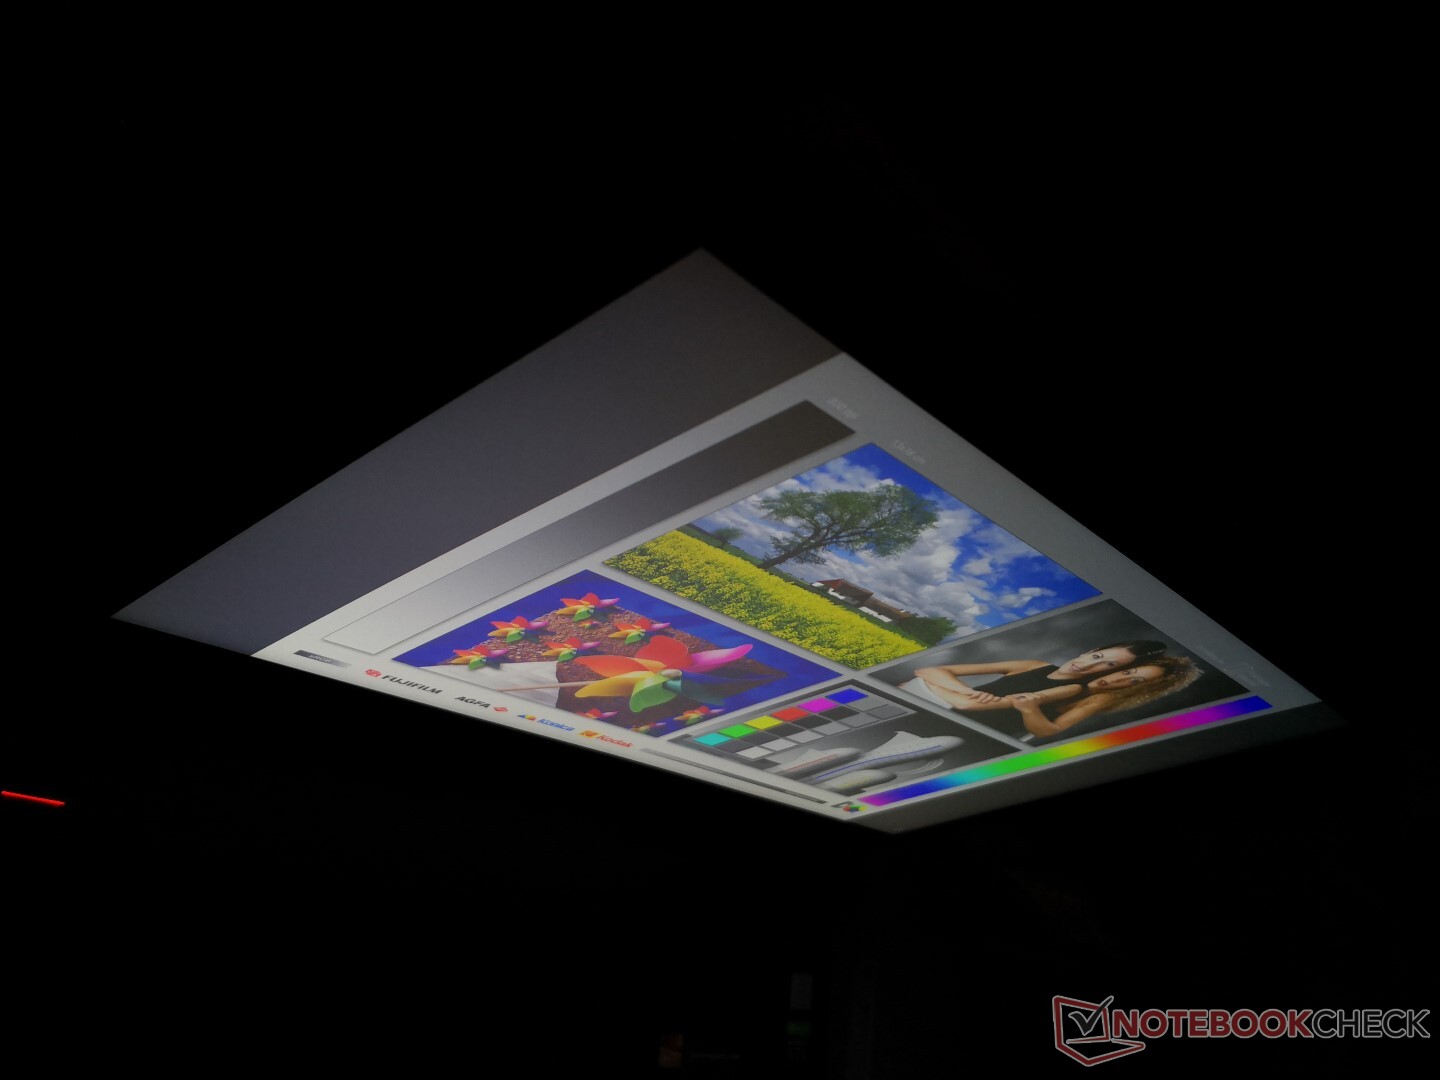
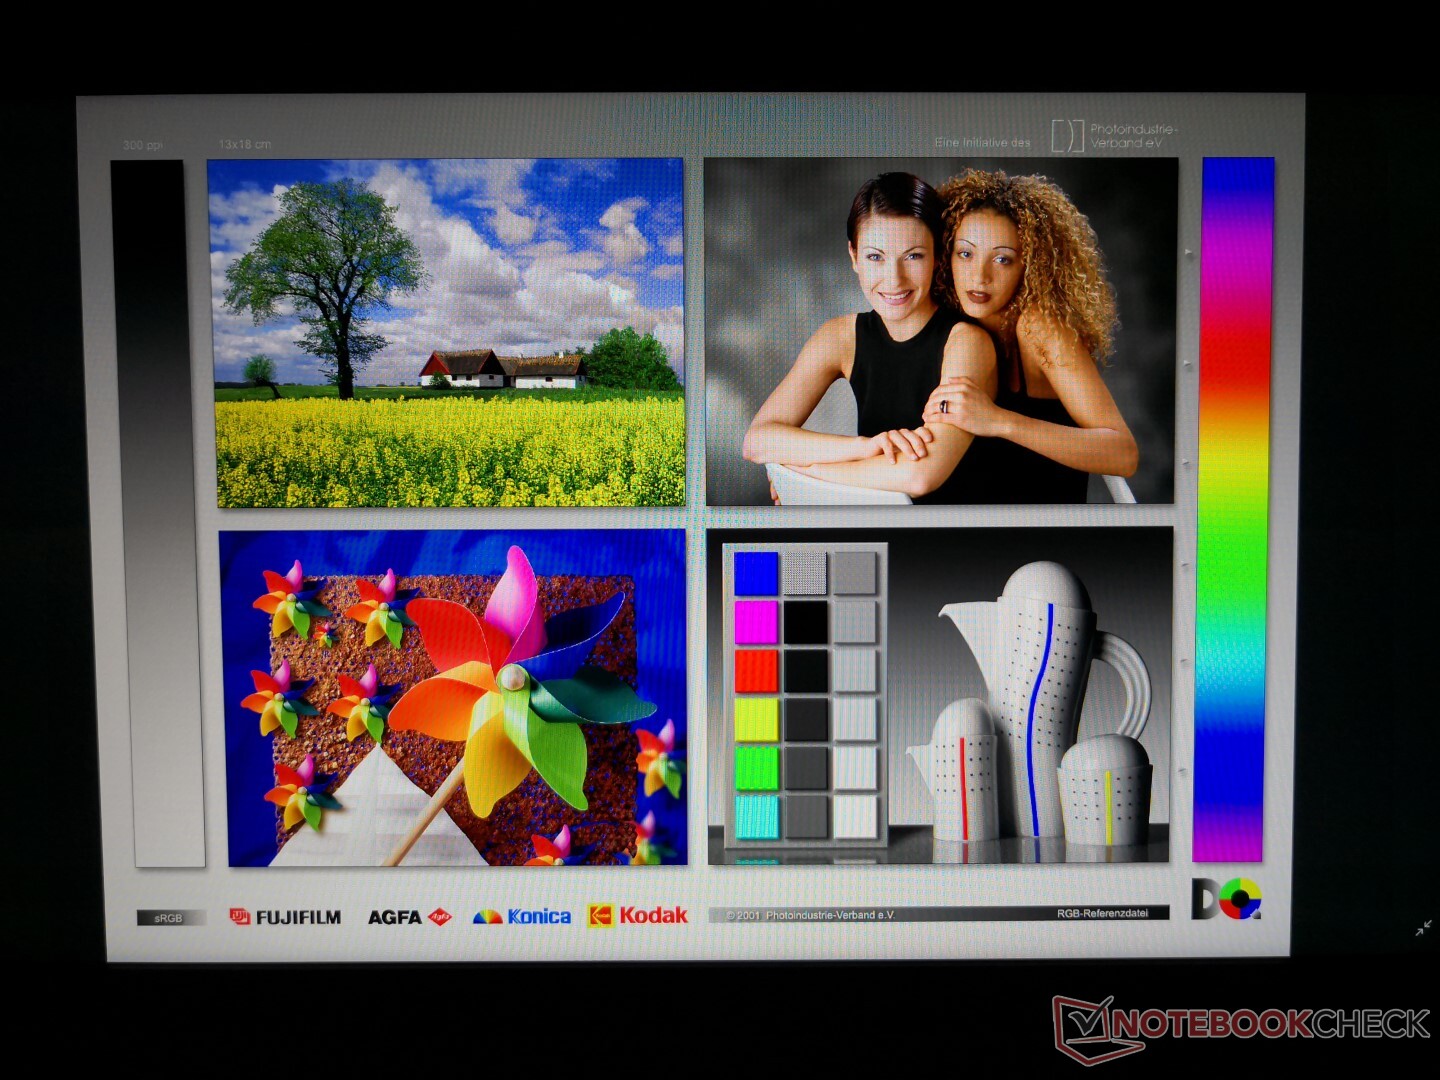
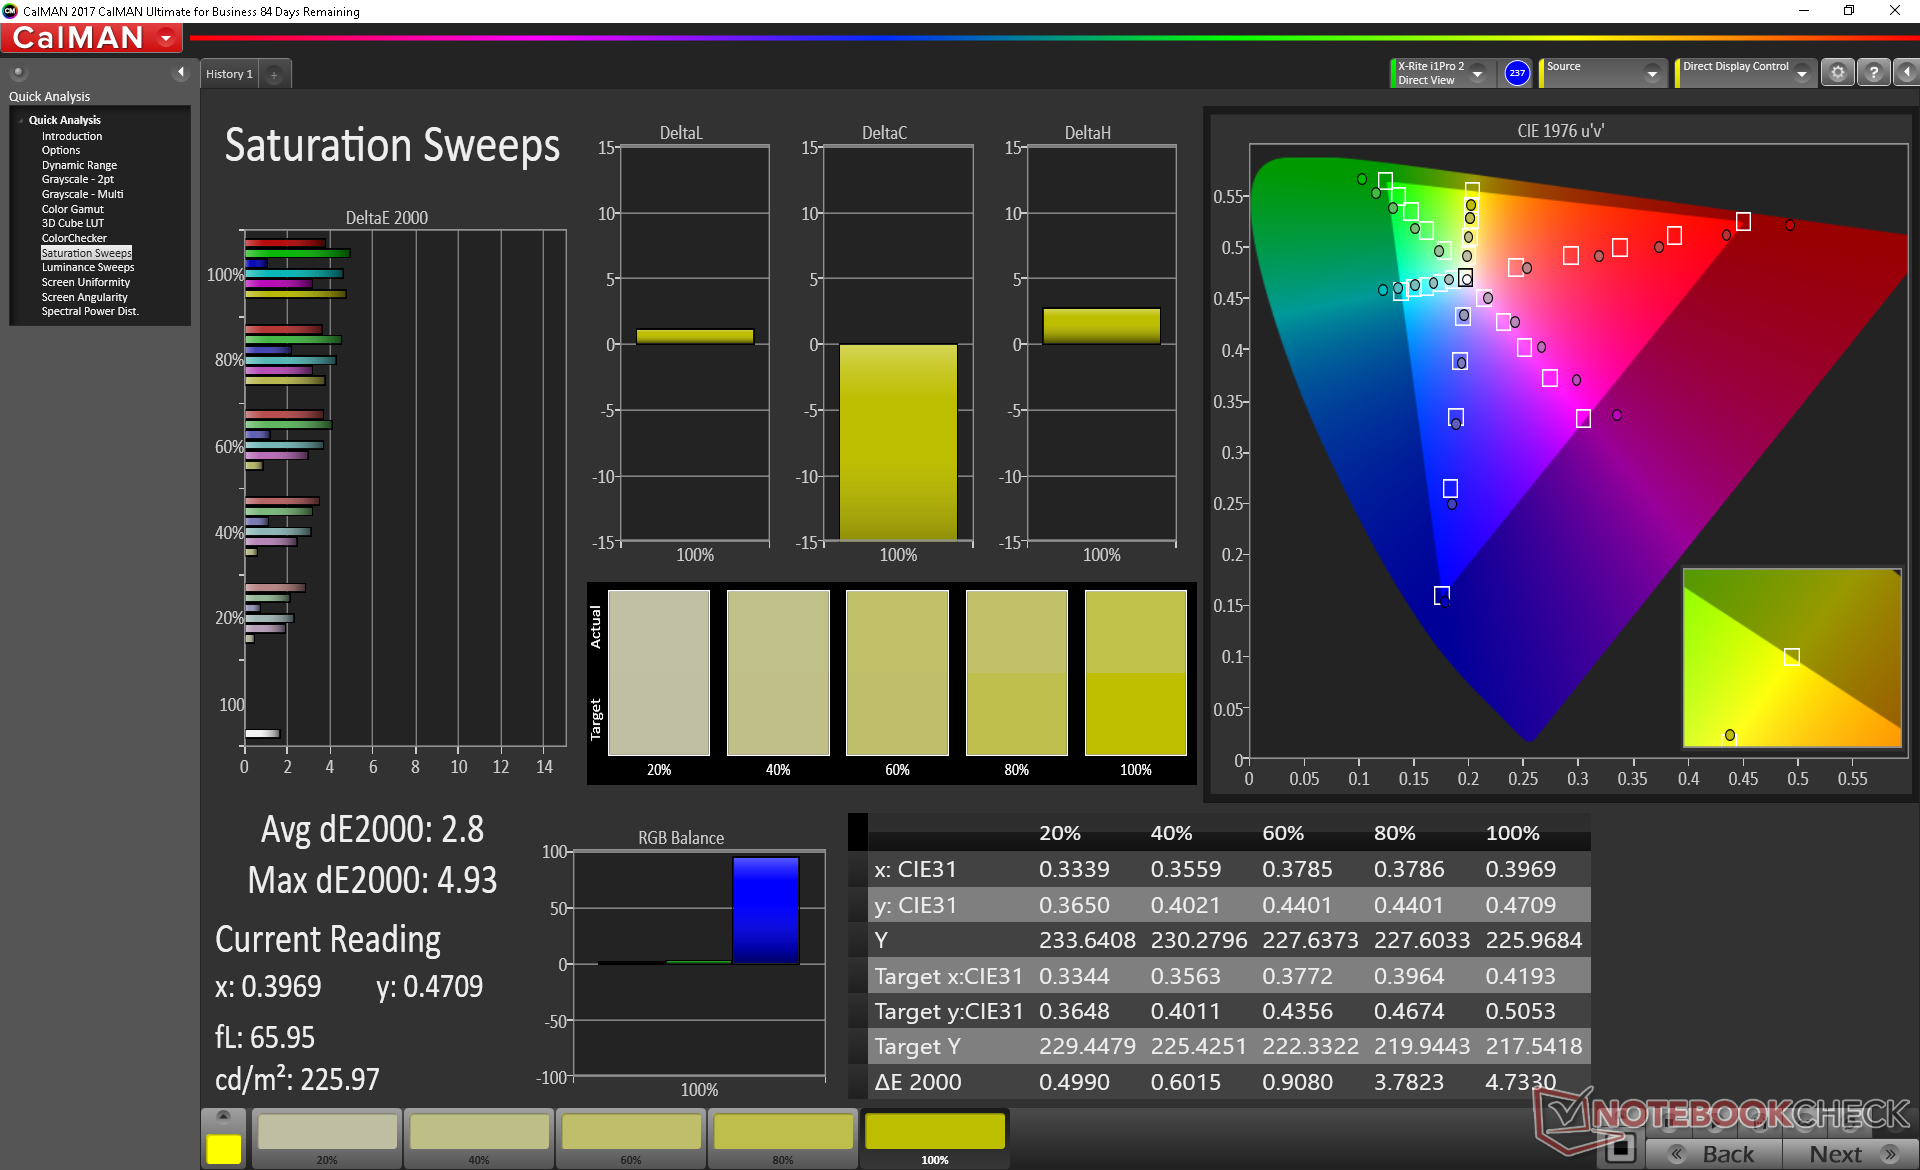
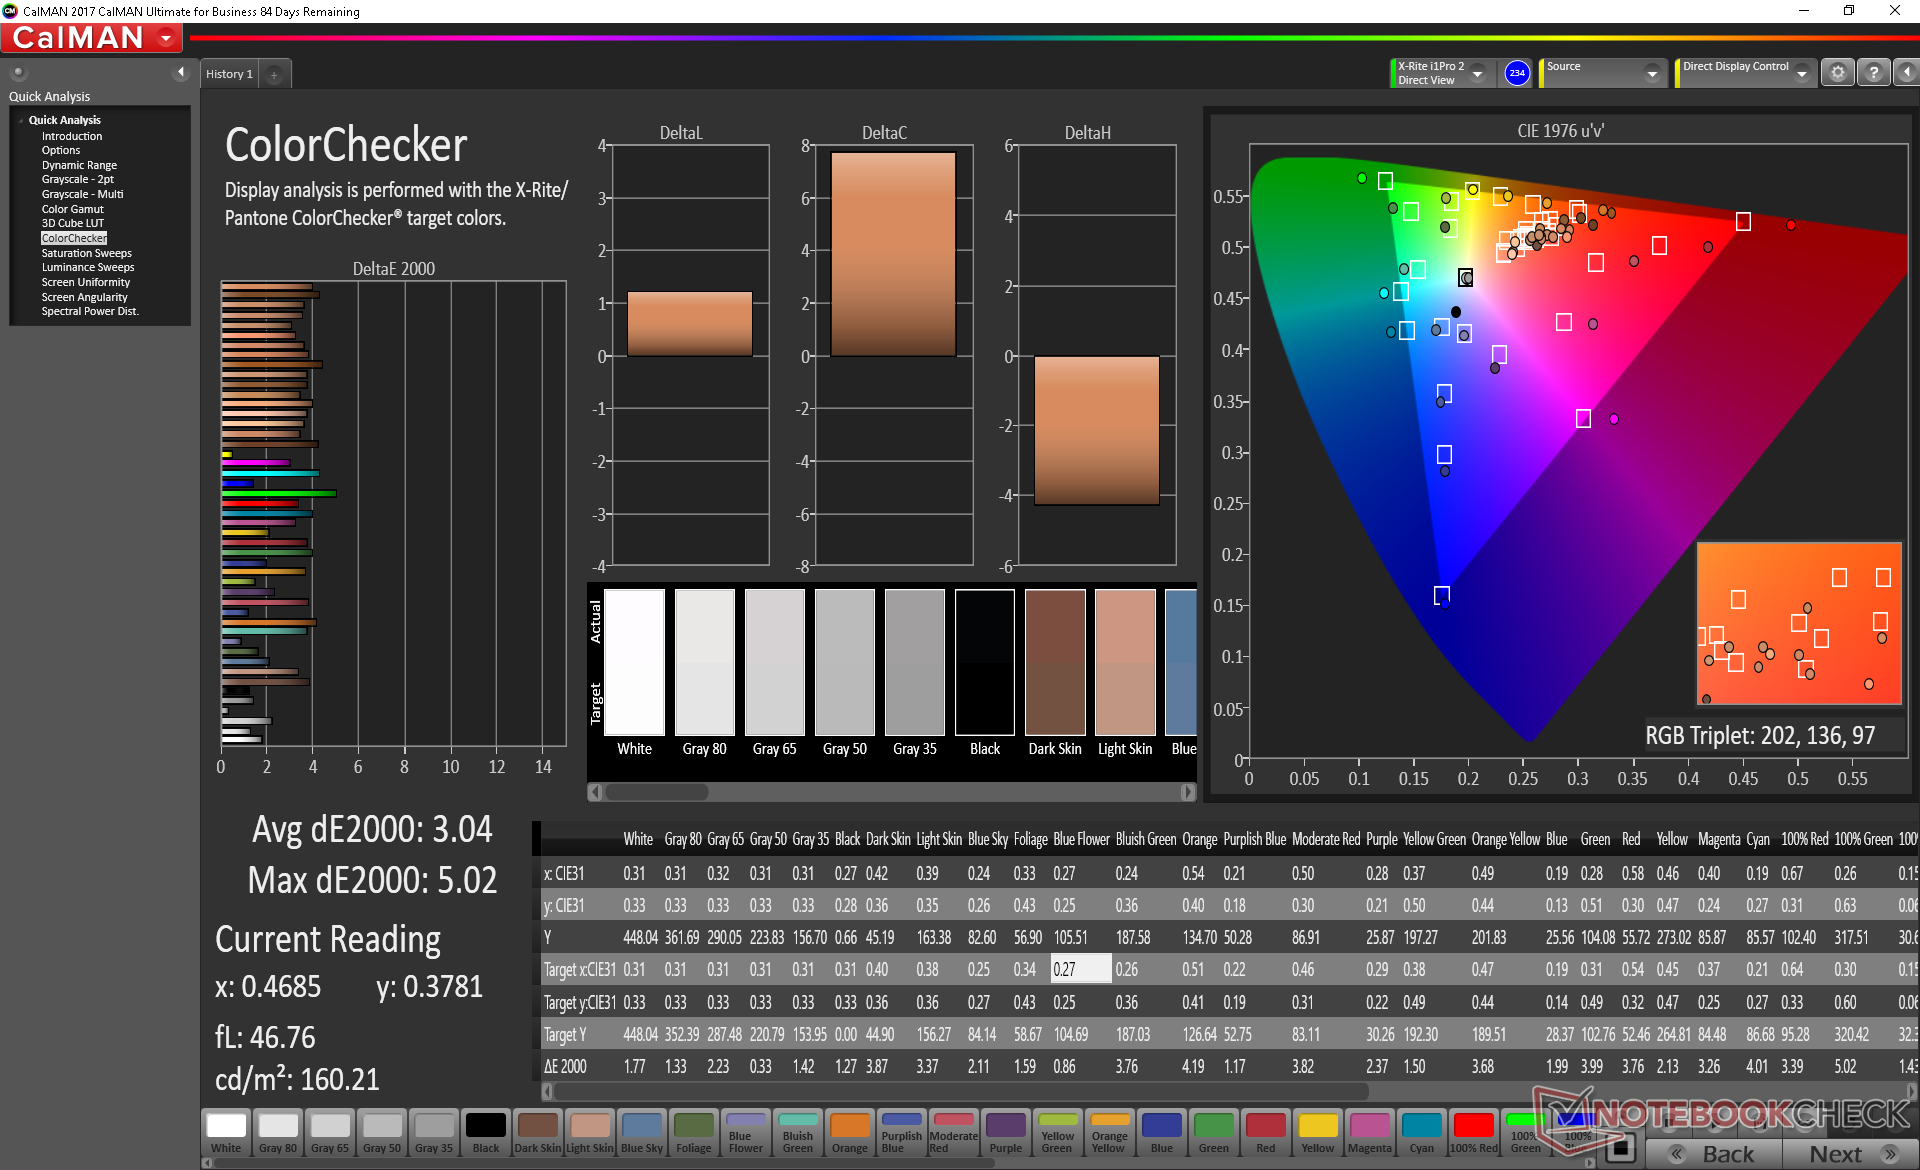
There are a couple of drawbacks to the display even though the underlying AUO panel is of high quality. The first is graininess as the matte screen is slightly grainier than a glossy alternative. It's a very minor disadvantage, but a disadvantage nonetheless especially when compared to the crisp and glossy second screen. The second drawback relates to the poor calibration of the panel out of the box. Temperature appears too cool and both grayscale and colors suffer as a result. This is thankfully addressable with a proper calibration as shown below.
Our test unit exhibits light-moderate uneven backlight bleeding that only becomes noticeable when viewing videos with black borders.


| |||||||||||||||||||||||||
Brightness Distribution: 84 %
Center on Battery: 324.8 cd/m²
Contrast: 1249:1 (Black: 0.26 cd/m²)
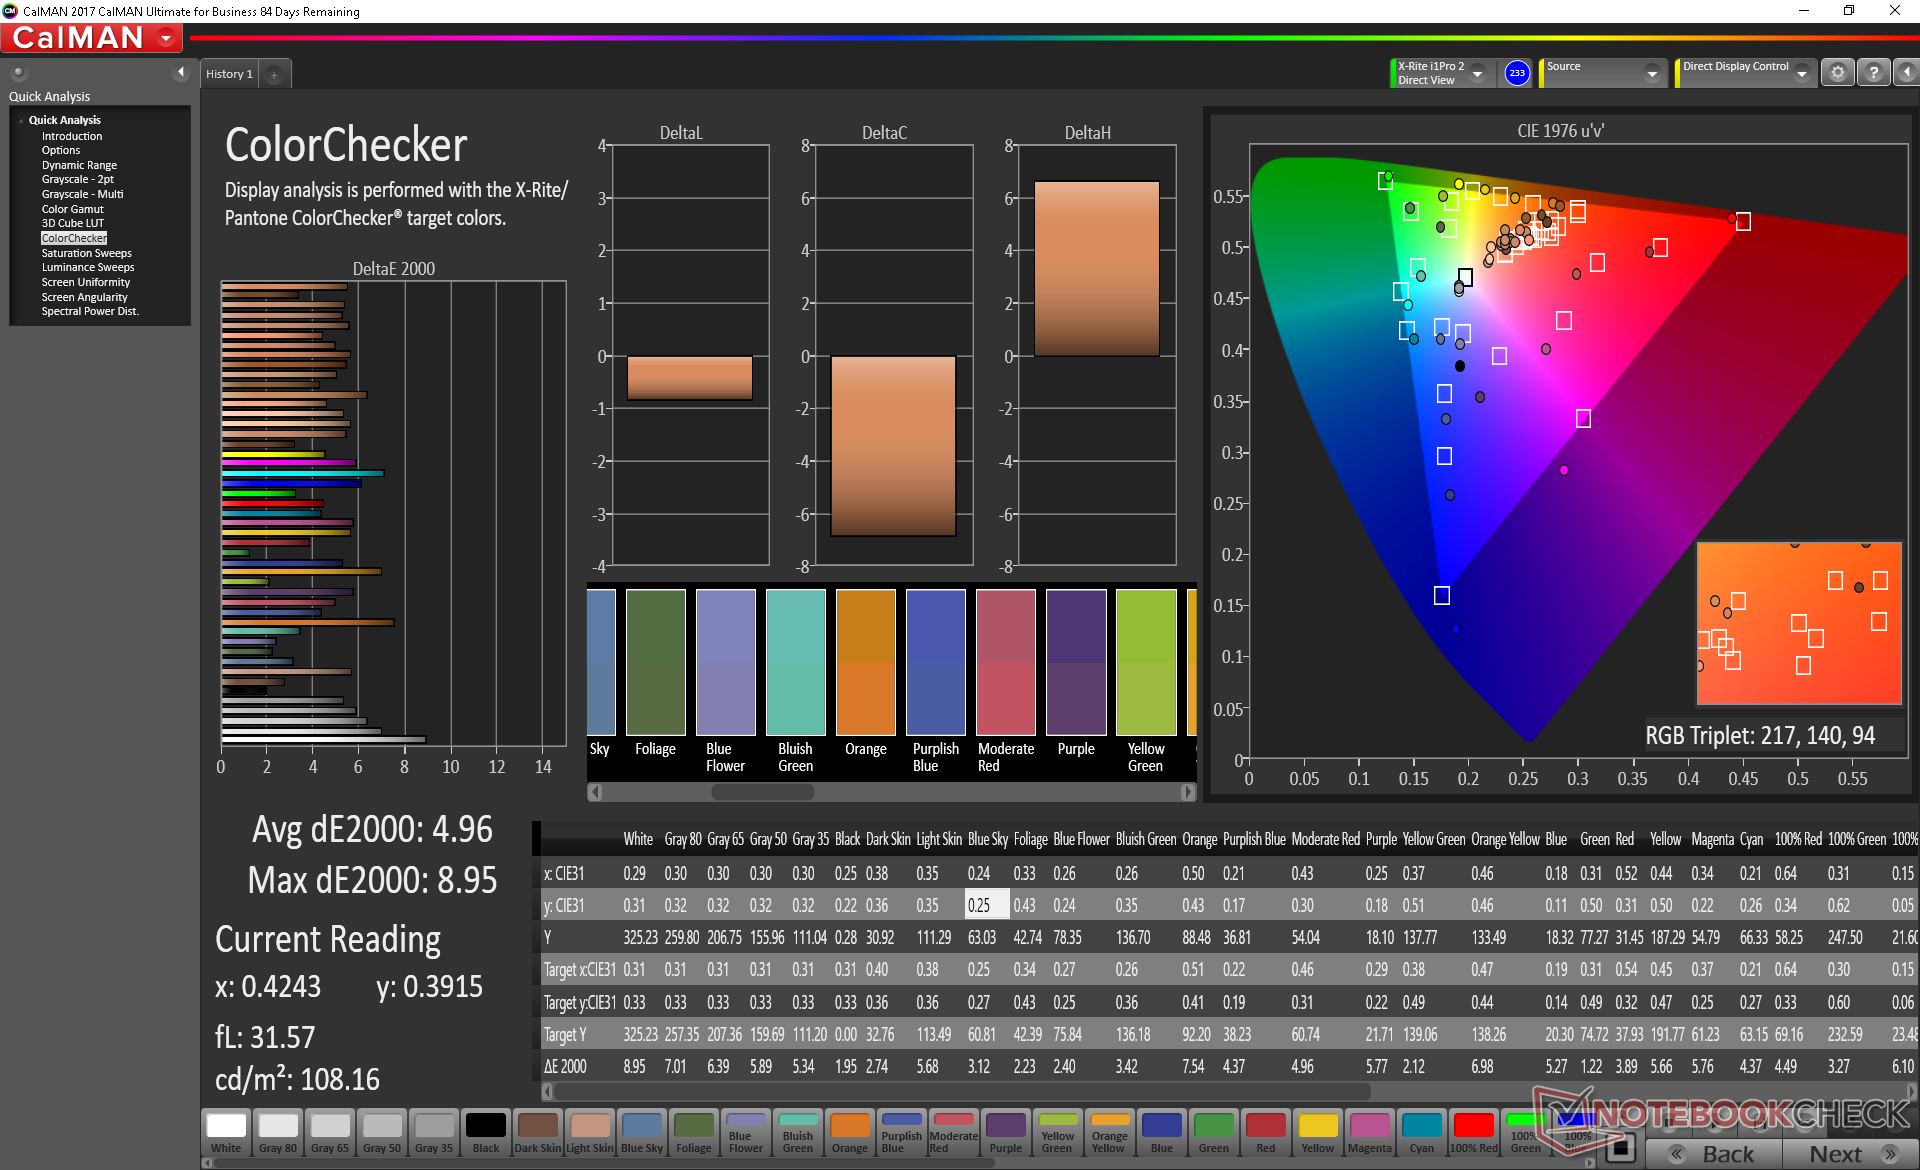
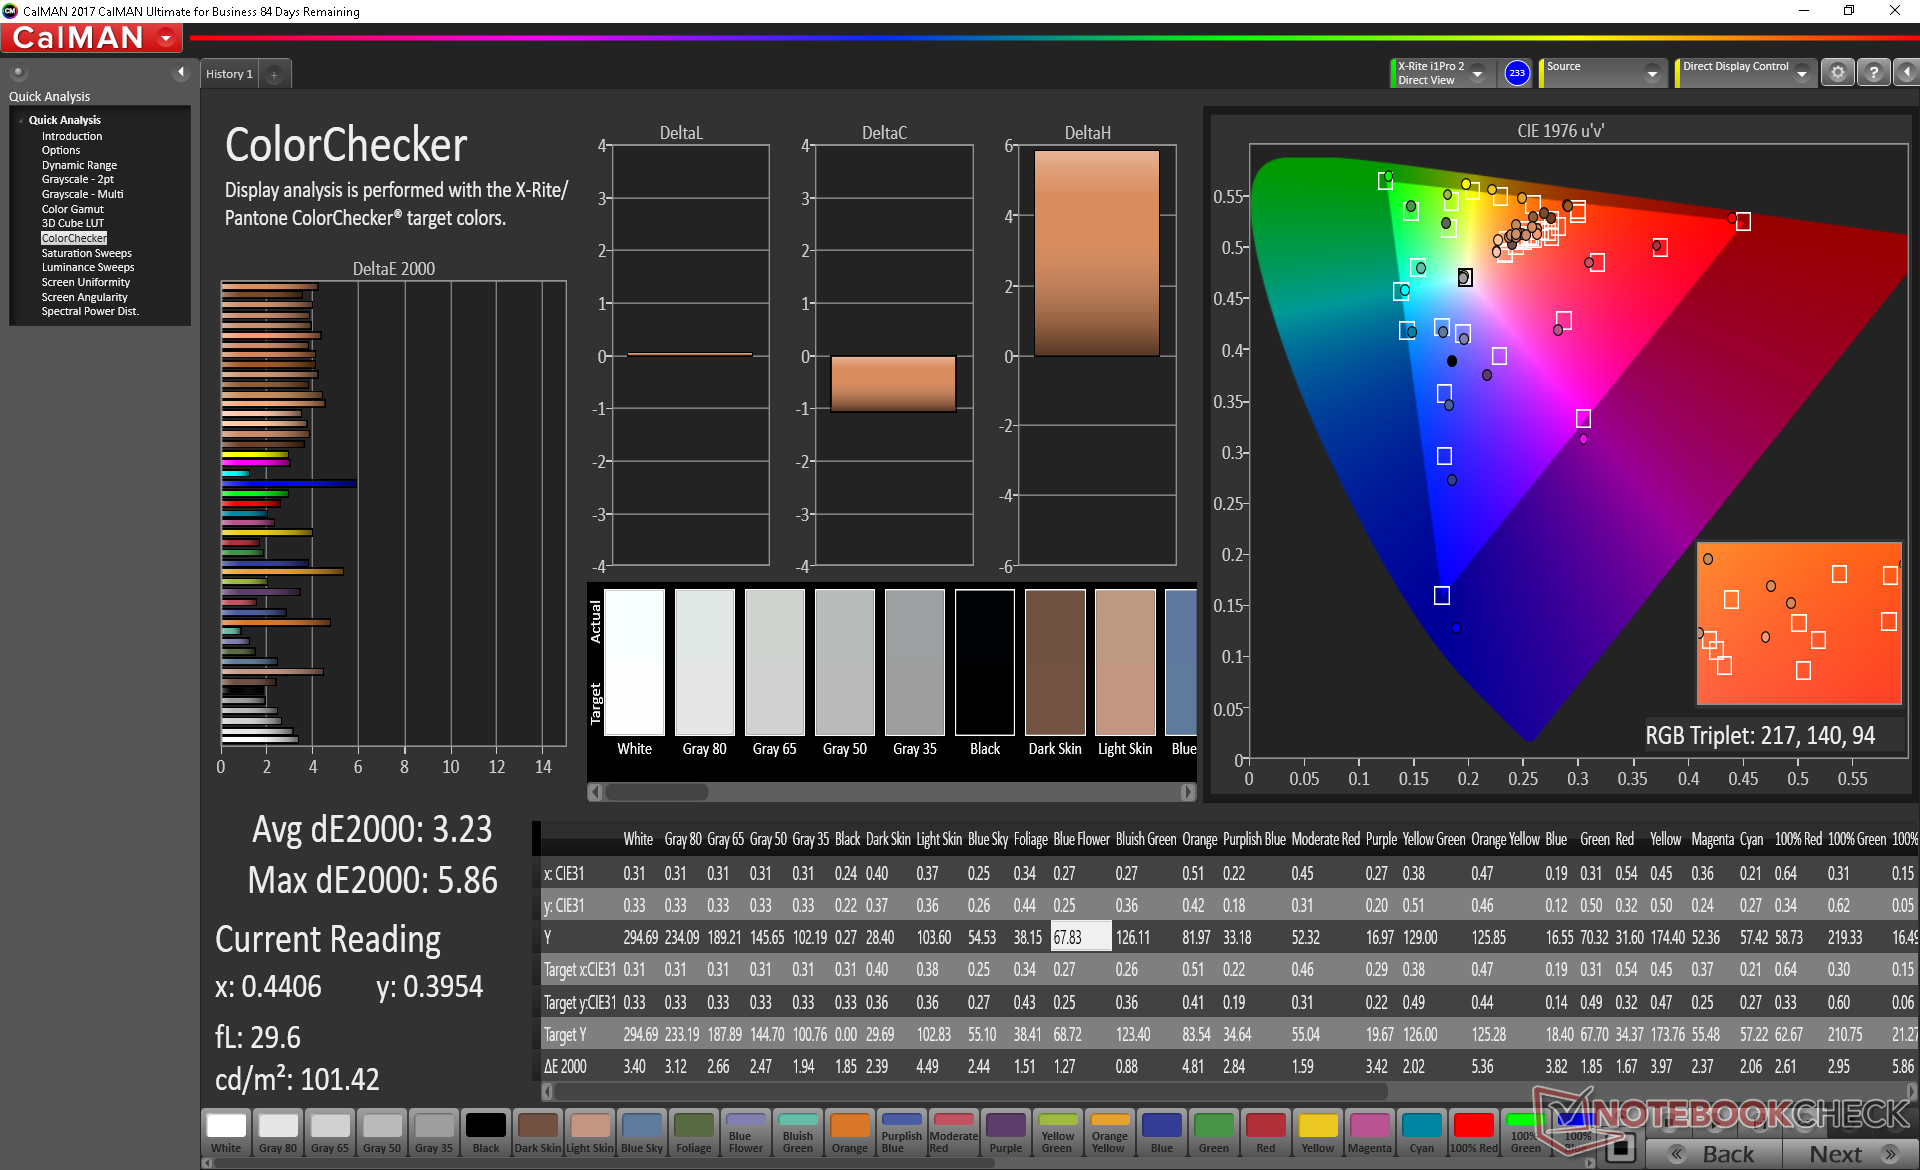
ΔE ColorChecker Calman: 4.96 | ∀{0.5-29.43 Ø4.71}
calibrated: 3.23
ΔE Greyscale Calman: 5 | ∀{0.09-98 Ø4.96}
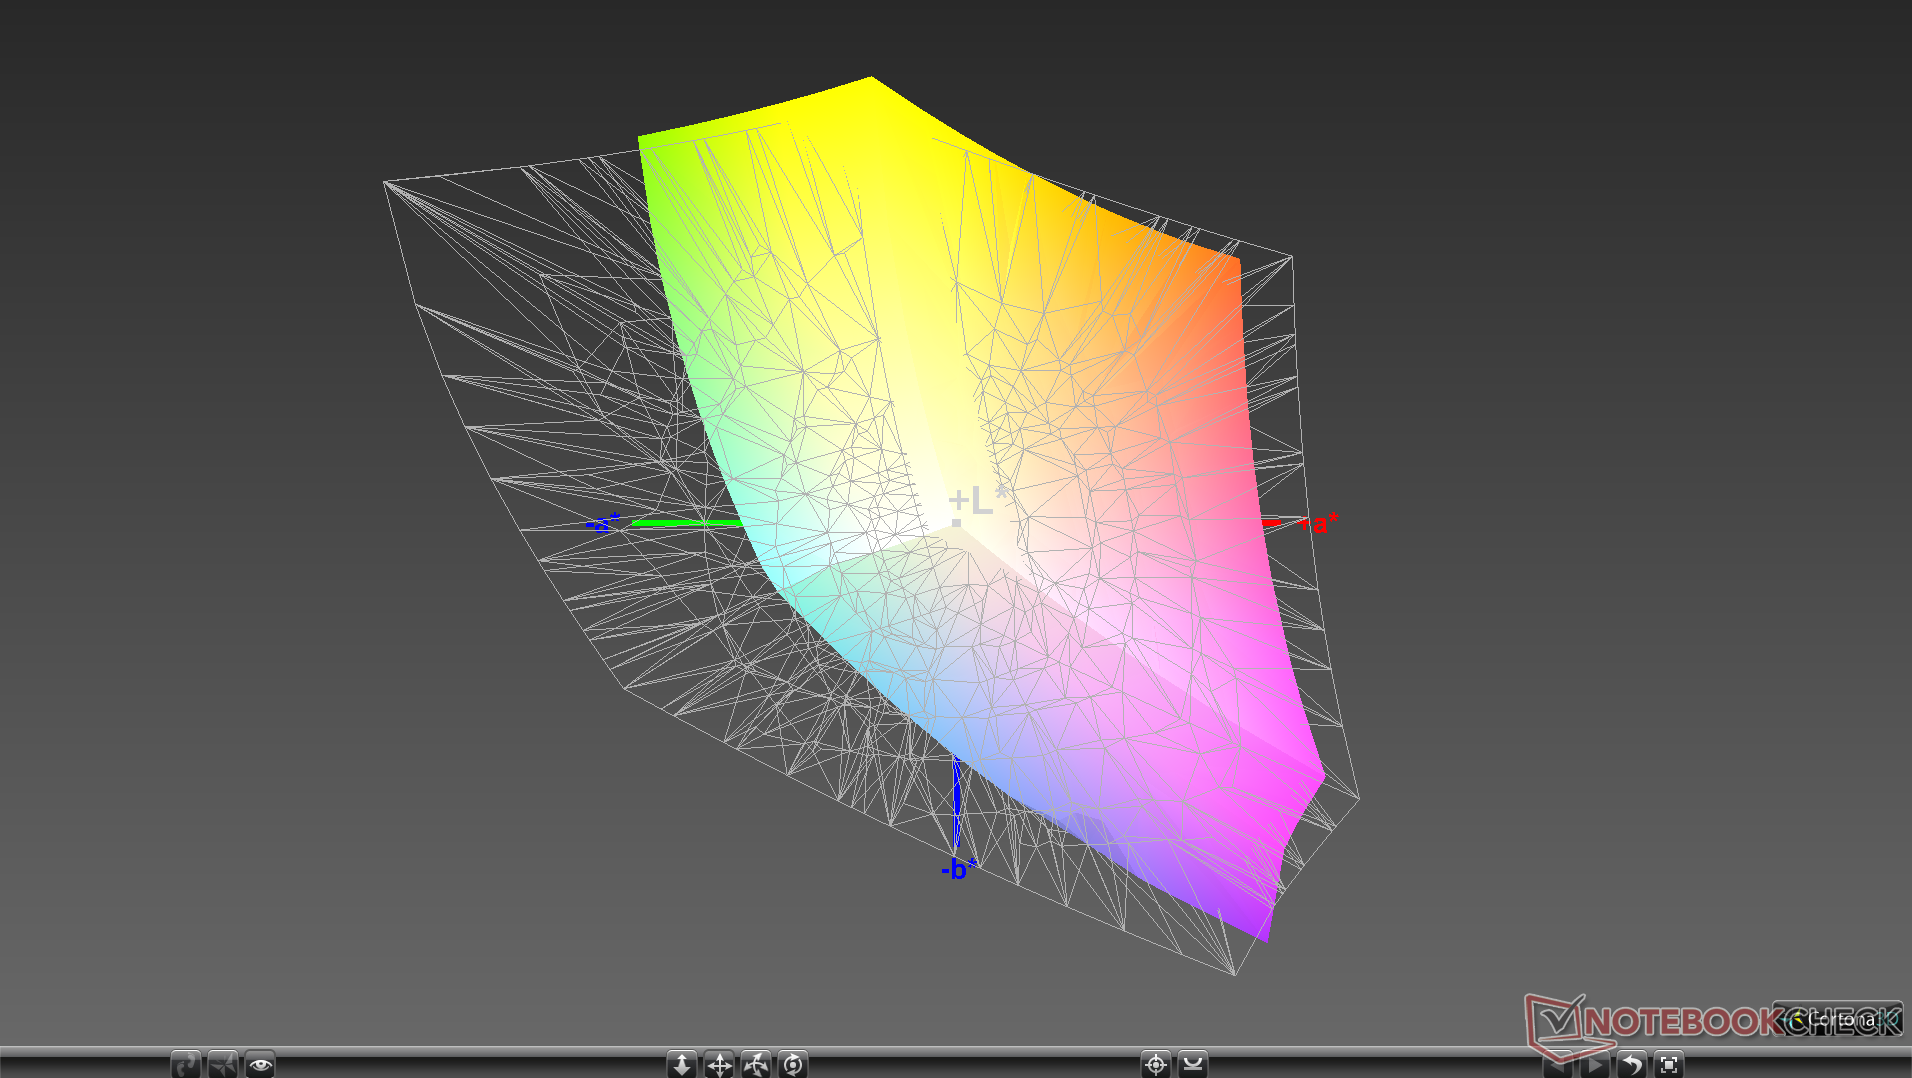
91.8% sRGB (Argyll 1.6.3 3D)
59.8% AdobeRGB 1998 (Argyll 1.6.3 3D)
67.2% AdobeRGB 1998 (Argyll 3D)
92.3% sRGB (Argyll 3D)
66.2% Display P3 (Argyll 3D)
Gamma: 2.21
CCT: 7742 K
| HP Omen X 2S 15-dg0075cl AU Optronics AUO82ED, IPS, 15.6", 1920x1080 | HP Omen 15-dc1020ng LGD05CE, IPS, 15.6", 1920x1080 | Razer Blade 15 RTX 2080 Max-Q Sharp LQ156M1JW03 (SHP14C5), IPS, 15.6", 1920x1080 | Alienware m15 R2 P87F Sharp LQ156M1, IPS, 15.6", 1920x1080 | MSI GT63 Titan 8RG-046 N156HHE-GA1, TN, 15.6", 1920x1080 | Lenovo Legion Y740-15ICHg LP156WFG-SPB2, IPS, 15.6", 1920x1080 | |
|---|---|---|---|---|---|---|
| Display | -40% | 3% | 0% | 25% | -3% | |
| Display P3 Coverage (%) | 66.2 | 38.37 -42% | 66.9 1% | 65.3 -1% | 91.3 38% | 63.5 -4% |
| sRGB Coverage (%) | 92.3 | 57.6 -38% | 98.1 6% | 95.1 3% | 99.9 8% | 92.4 0% |
| AdobeRGB 1998 Coverage (%) | 67.2 | 39.69 -41% | 68.5 2% | 65.9 -2% | 85.7 28% | 64.7 -4% |
| Response Times | -169% | 10% | 6% | 46% | -23% | |
| Response Time Grey 50% / Grey 80% * (ms) | 15.2 ? | 40 ? -163% | 12.8 ? 16% | 16.4 ? -8% | 8.4 ? 45% | 18.8 ? -24% |
| Response Time Black / White * (ms) | 10.8 ? | 29.6 ? -174% | 10.4 ? 4% | 8.8 ? 19% | 5.8 ? 46% | 13.2 ? -22% |
| PWM Frequency (Hz) | 23810 ? | 23810 ? | 25510 ? | |||
| Screen | -23% | 19% | -11% | 10% | 2% | |
| Brightness middle (cd/m²) | 324.8 | 251 -23% | 293 -10% | 324.2 0% | 307.1 -5% | 320.4 -1% |
| Brightness (cd/m²) | 316 | 232 -27% | 270 -15% | 304 -4% | 276 -13% | 298 -6% |
| Brightness Distribution (%) | 84 | 76 -10% | 87 4% | 90 7% | 80 -5% | 85 1% |
| Black Level * (cd/m²) | 0.26 | 0.17 35% | 0.29 -12% | 0.38 -46% | 0.37 -42% | 0.42 -62% |
| Contrast (:1) | 1249 | 1476 18% | 1010 -19% | 853 -32% | 830 -34% | 763 -39% |
| Colorchecker dE 2000 * | 4.96 | 6.2 -25% | 1.69 66% | 5.01 -1% | 2.53 49% | 3.21 35% |
| Colorchecker dE 2000 max. * | 8.95 | 18.6 -108% | 3.37 62% | 12.7 -42% | 4.66 48% | 5.54 38% |
| Colorchecker dE 2000 calibrated * | 3.23 | 4.8 -49% | 1.24 62% | 1.64 49% | 2.82 13% | 2.36 27% |
| Greyscale dE 2000 * | 5 | 4.2 16% | 2.3 54% | 7.9 -58% | 1.7 66% | 3.6 28% |
| Gamma | 2.21 100% | 2.32 95% | 2.3 96% | 2.35 94% | 2.194 100% | 2.27 97% |
| CCT | 7742 84% | 7454 87% | 6758 96% | 8455 77% | 6893 94% | 6503 100% |
| Color Space (Percent of AdobeRGB 1998) (%) | 59.8 | 36.5 -39% | 63 5% | 60.8 2% | 76 27% | 59 -1% |
| Color Space (Percent of sRGB) (%) | 91.8 | 57.4 -37% | 98.5 7% | 95.5 4% | 100 9% | 92 0% |
| Total Average (Program / Settings) | -77% /
-44% | 11% /
15% | -2% /
-7% | 27% /
17% | -8% /
-2% |
* ... smaller is better
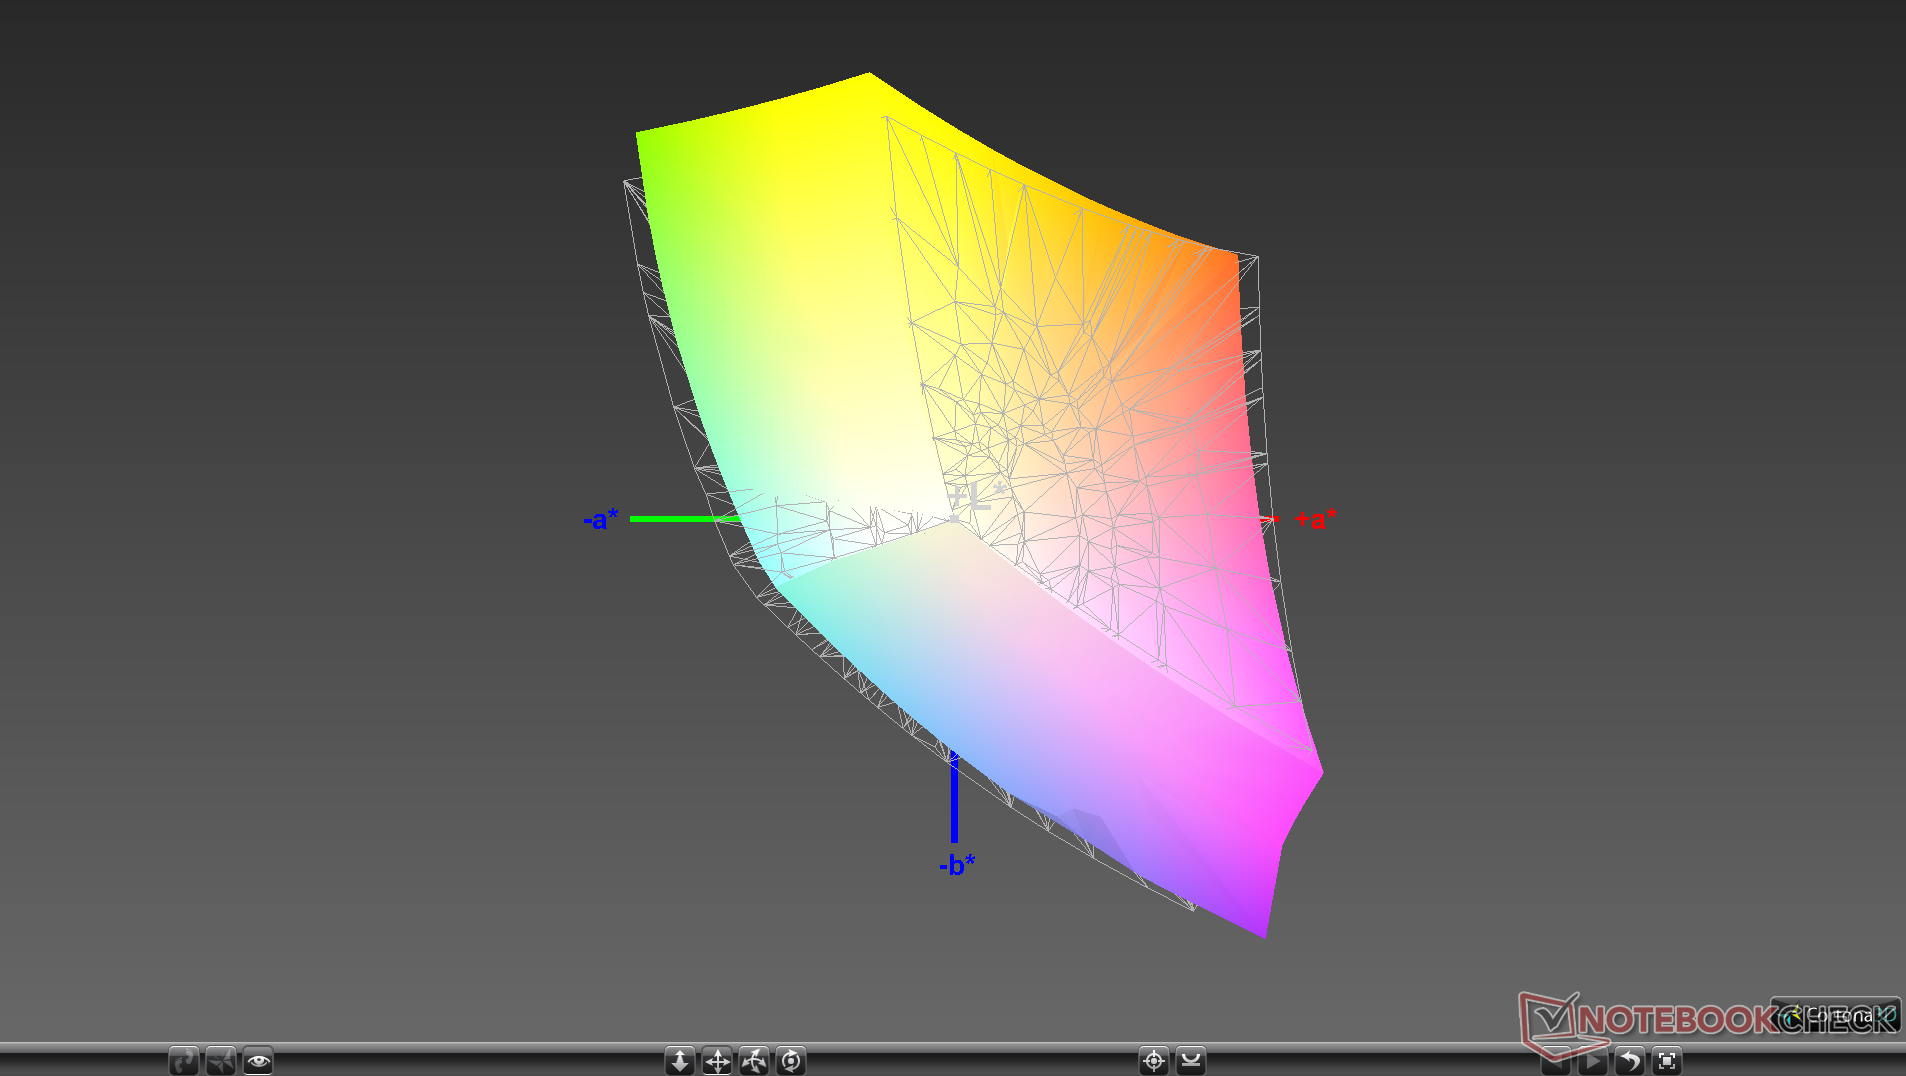
Color space covers approximately 92 percent and 60 percent of the sRGB and AdobeRGB standards, respectively, which is common amongst high refresh rate panels. Users who want even wider color coverage would have to opt for laptops with Sharp IGZO or 4K UHD panels that tend to offer both slower response times and refresh rates.
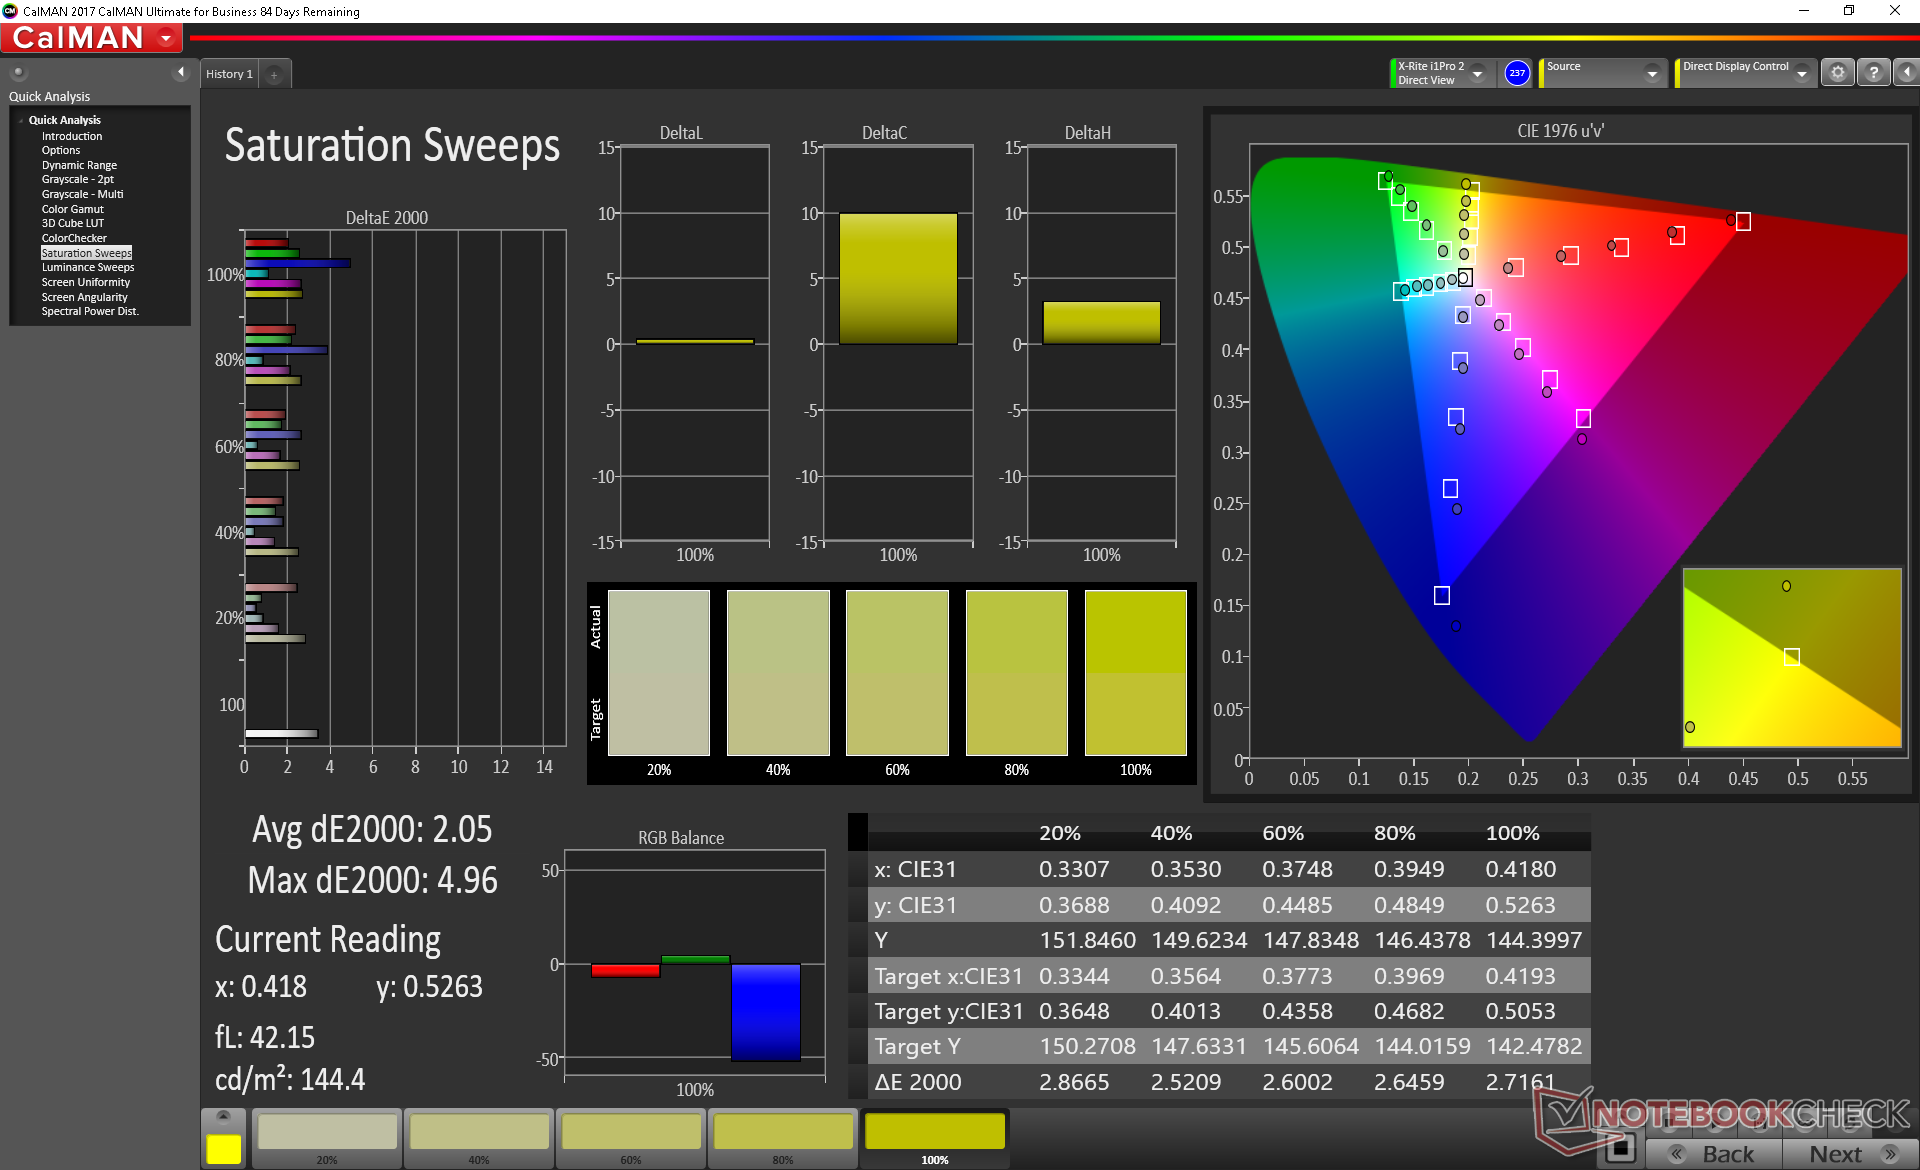
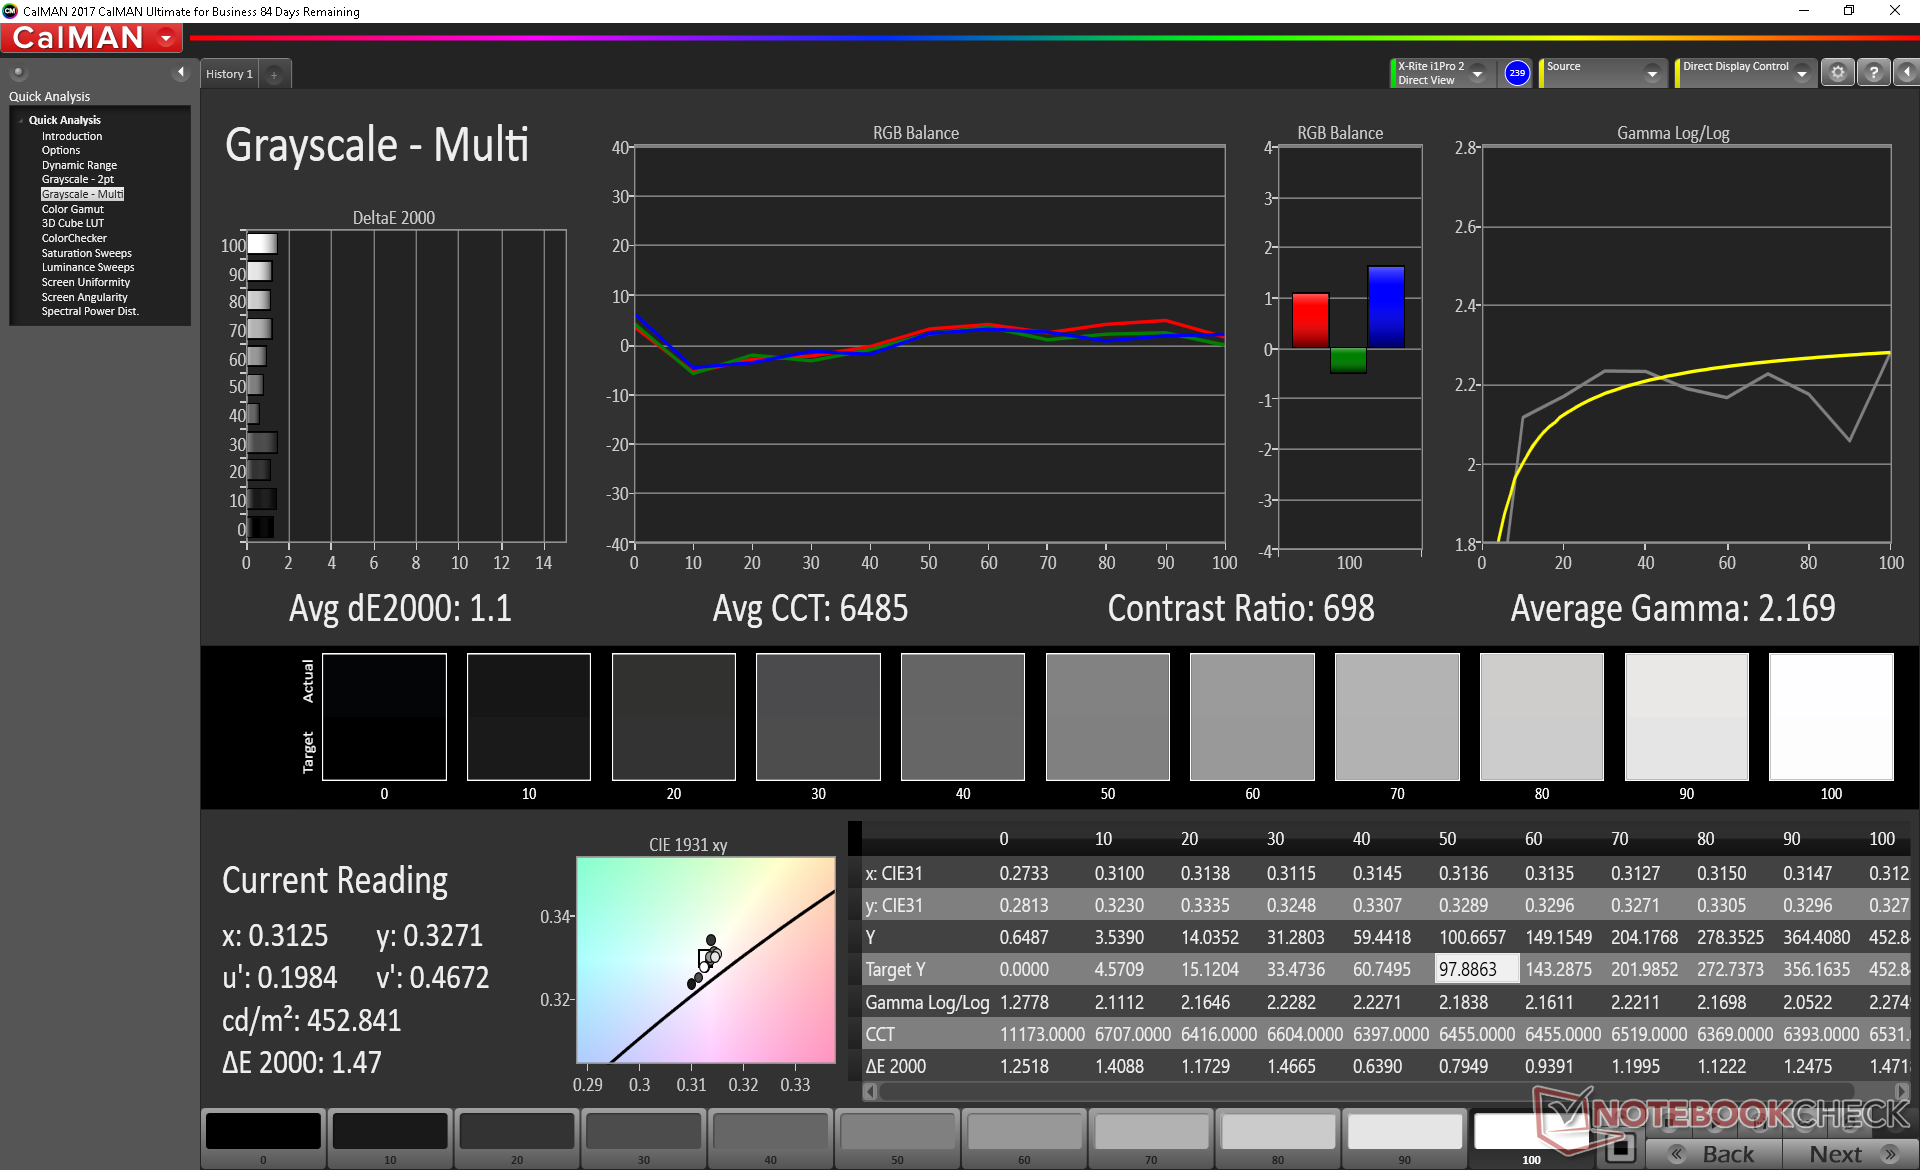
Further measurements with an X-Rite colorimeter confirm our suspicions above as color temperature is far too cool at 7742. Grayscale and color balance are therefore off and not as accurate as they could be. Calibration directly addresses the shortcomings for a significantly more accurate display as shown by our results CalMAN results below. Final grayscale and color average deltaE values sit at just 2 and 2.05, respectively. We recommend a calibration if possible to get the most out of the display or users can simply apply our calibrated ICM profile above instead.
Display Response Times
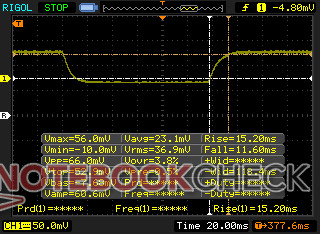
| ↔ Response Time Black to White | ||
|---|---|---|
| 10.8 ms ... rise ↗ and fall ↘ combined | ↗ 6 ms rise | 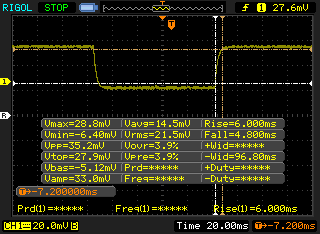 |
| ↘ 4.8 ms fall | ||
| The screen shows good response rates in our tests, but may be too slow for competitive gamers. In comparison, all tested devices range from 0.1 (minimum) to 240 (maximum) ms. » 29 % of all devices are better. This means that the measured response time is better than the average of all tested devices (19.8 ms). | ||
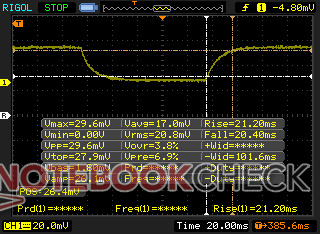
| ↔ Response Time 50% Grey to 80% Grey | ||
| 15.2 ms ... rise ↗ and fall ↘ combined | ↗ 7.6 ms rise | 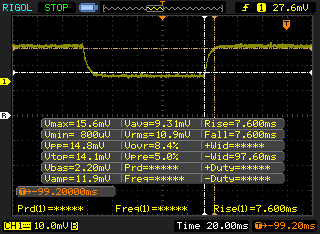 |
| ↘ 7.6 ms fall | ||
| The screen shows good response rates in our tests, but may be too slow for competitive gamers. In comparison, all tested devices range from 0.165 (minimum) to 636 (maximum) ms. » 29 % of all devices are better. This means that the measured response time is better than the average of all tested devices (30.9 ms). | ||
Screen Flickering / PWM (Pulse-Width Modulation)
| Screen flickering / PWM not detected | 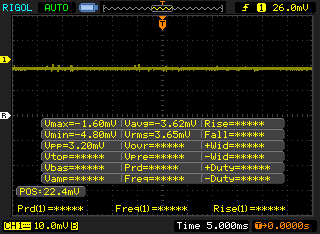 | ||
In comparison: 52 % of all tested devices do not use PWM to dim the display. If PWM was detected, an average of 7744 (minimum: 5 - maximum: 343500) Hz was measured. | |||
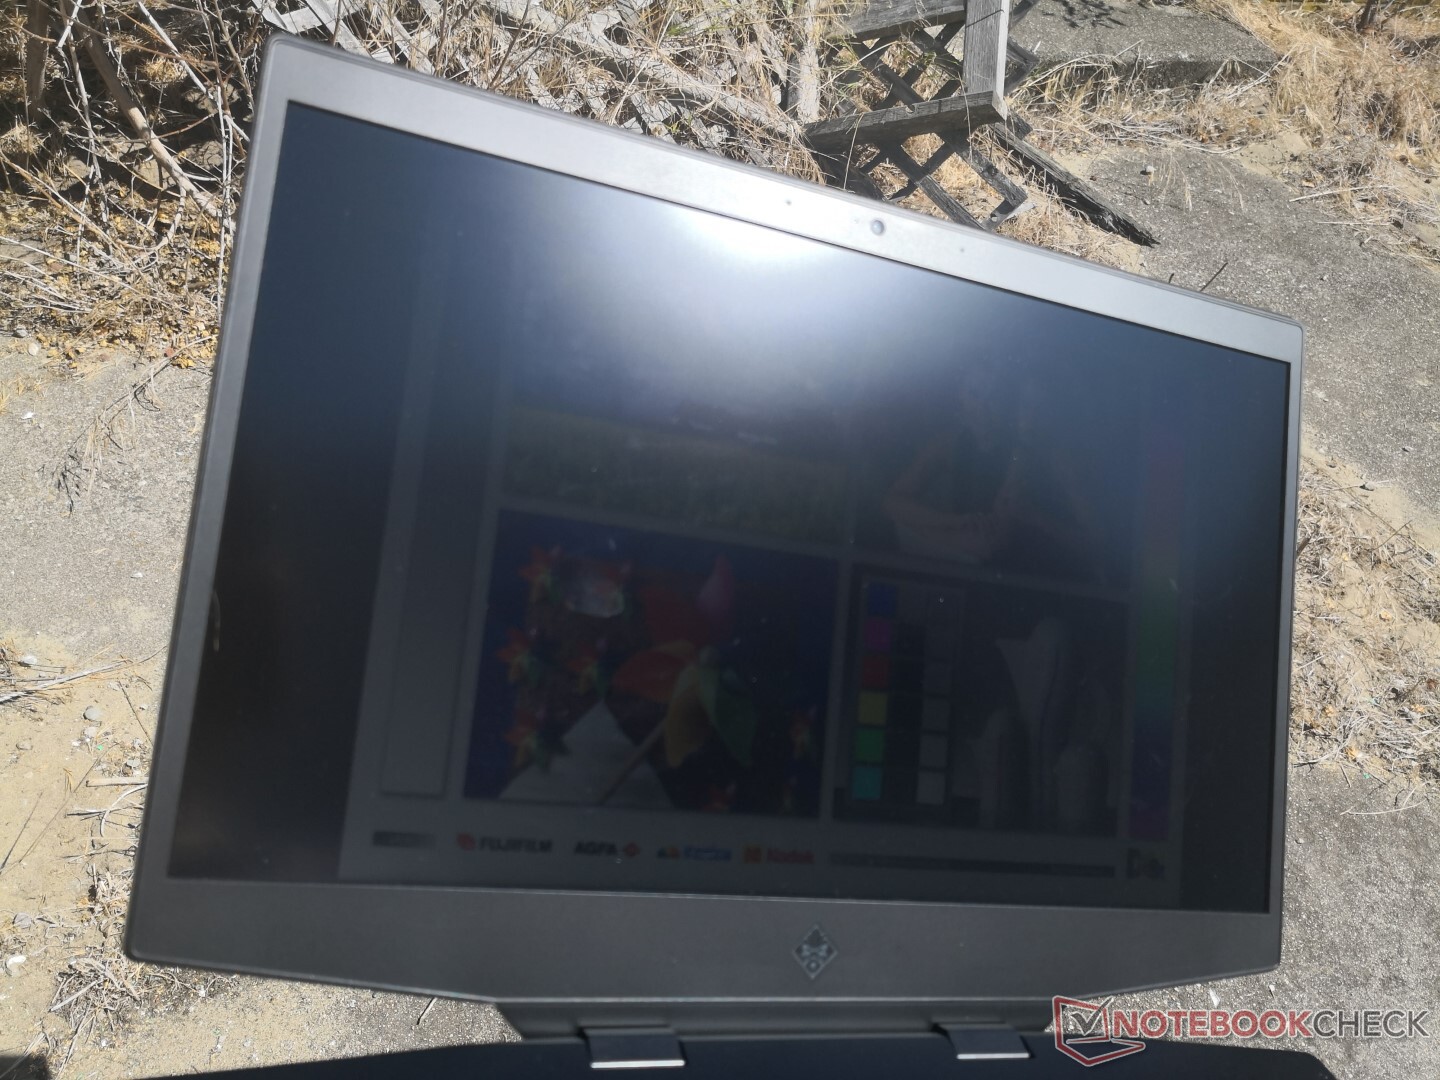
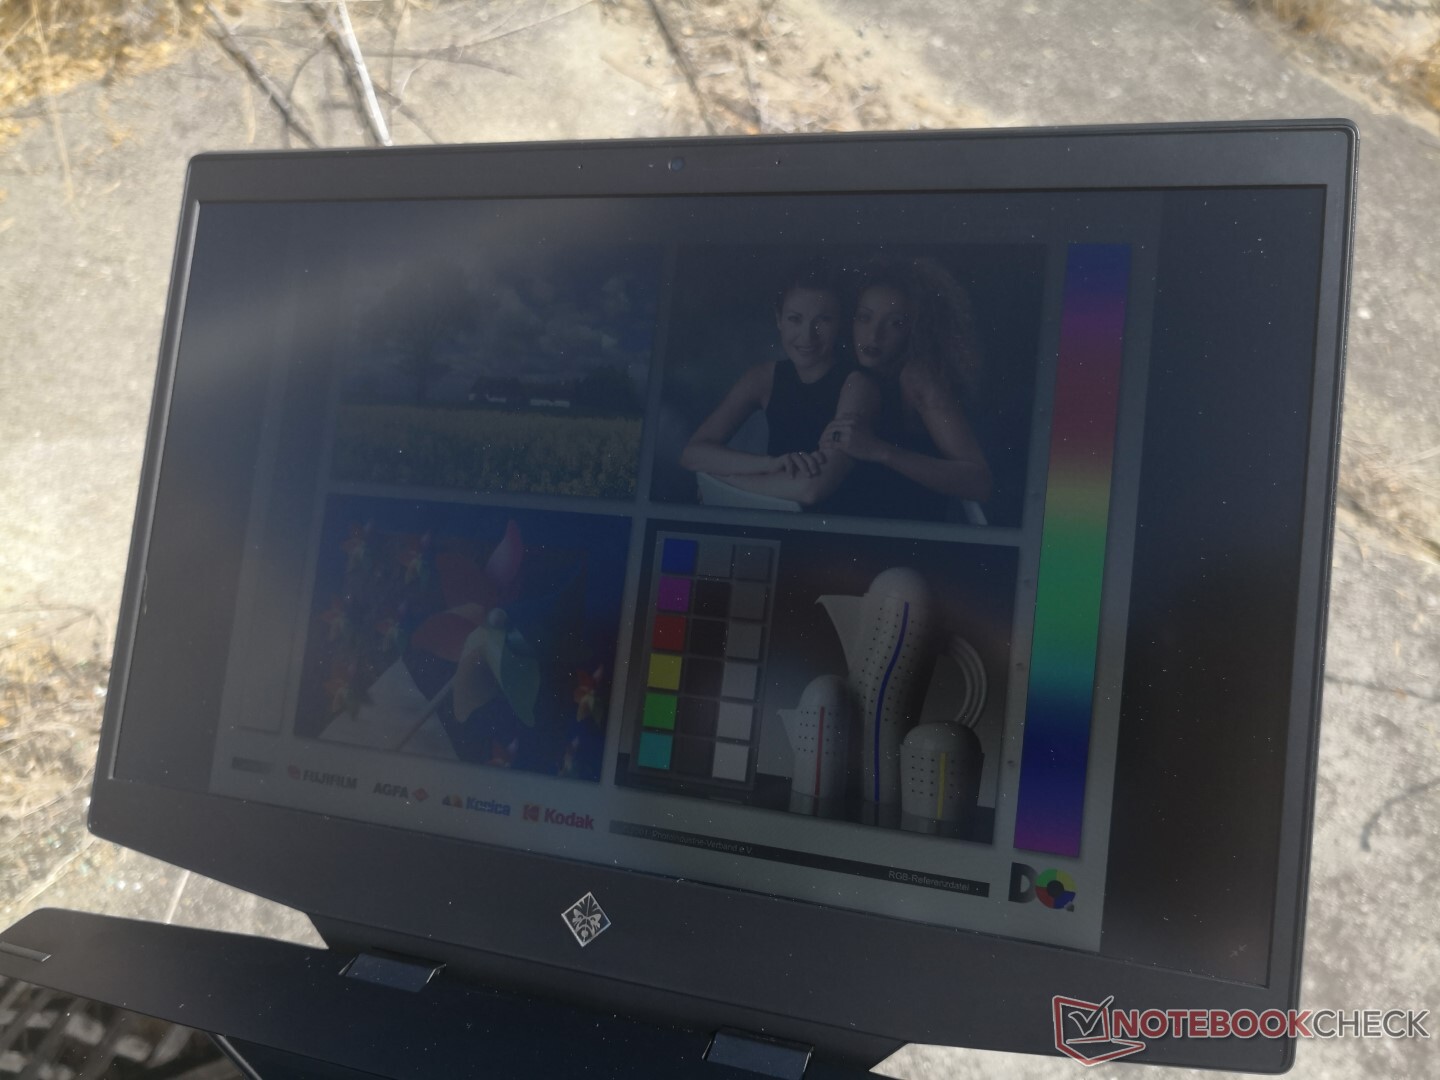
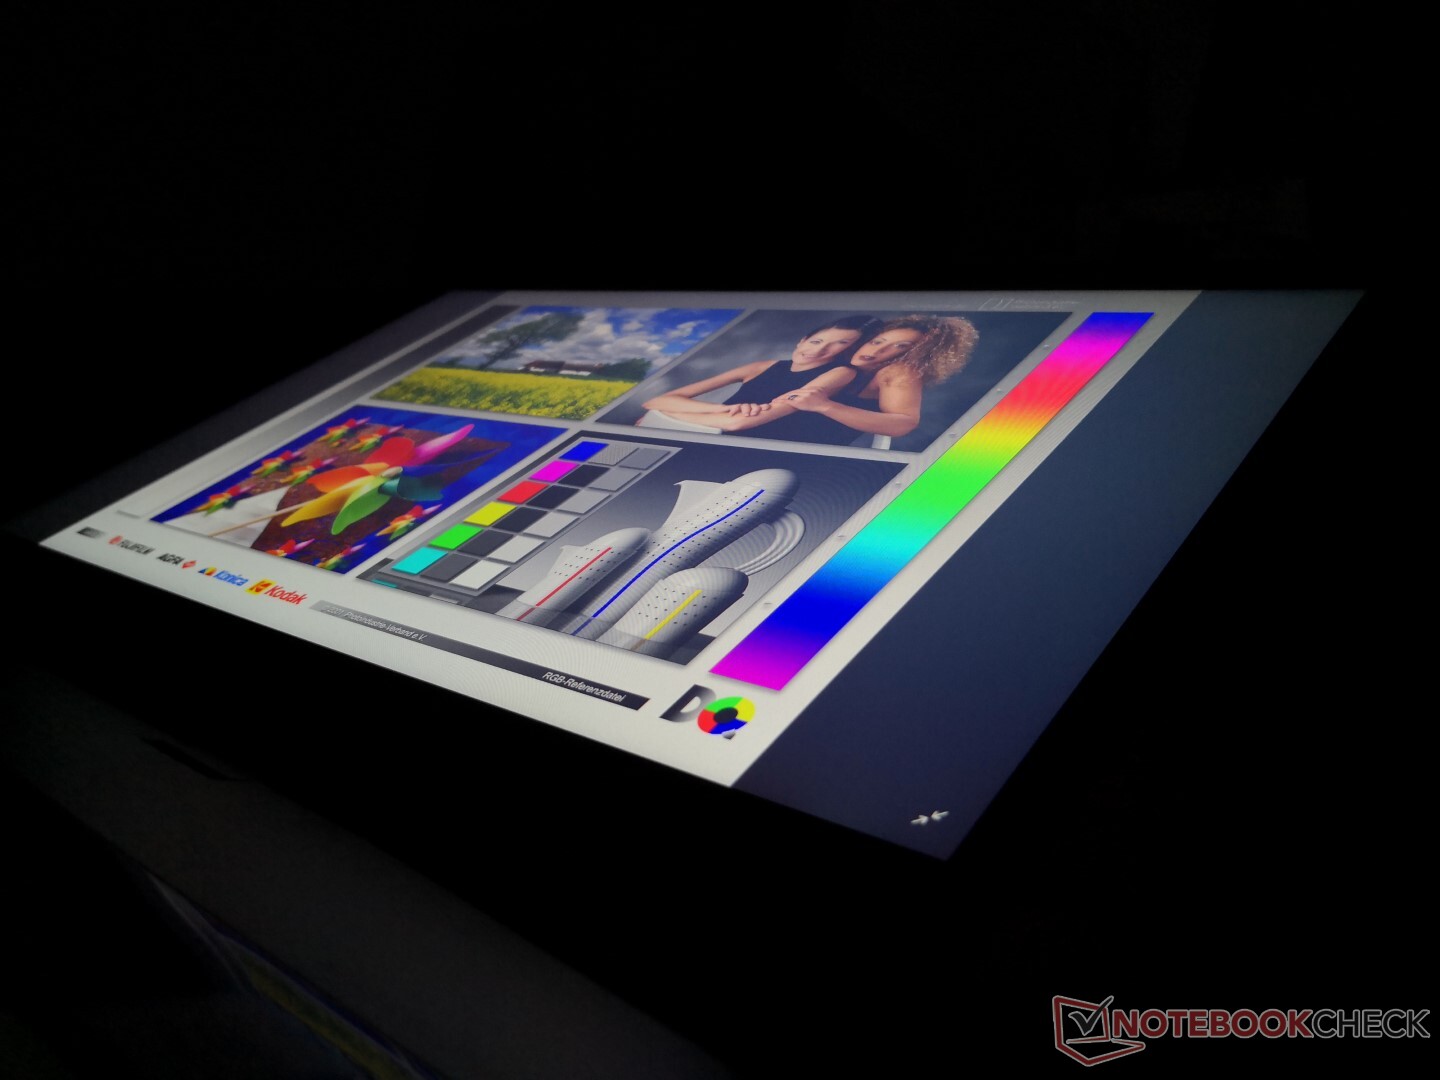
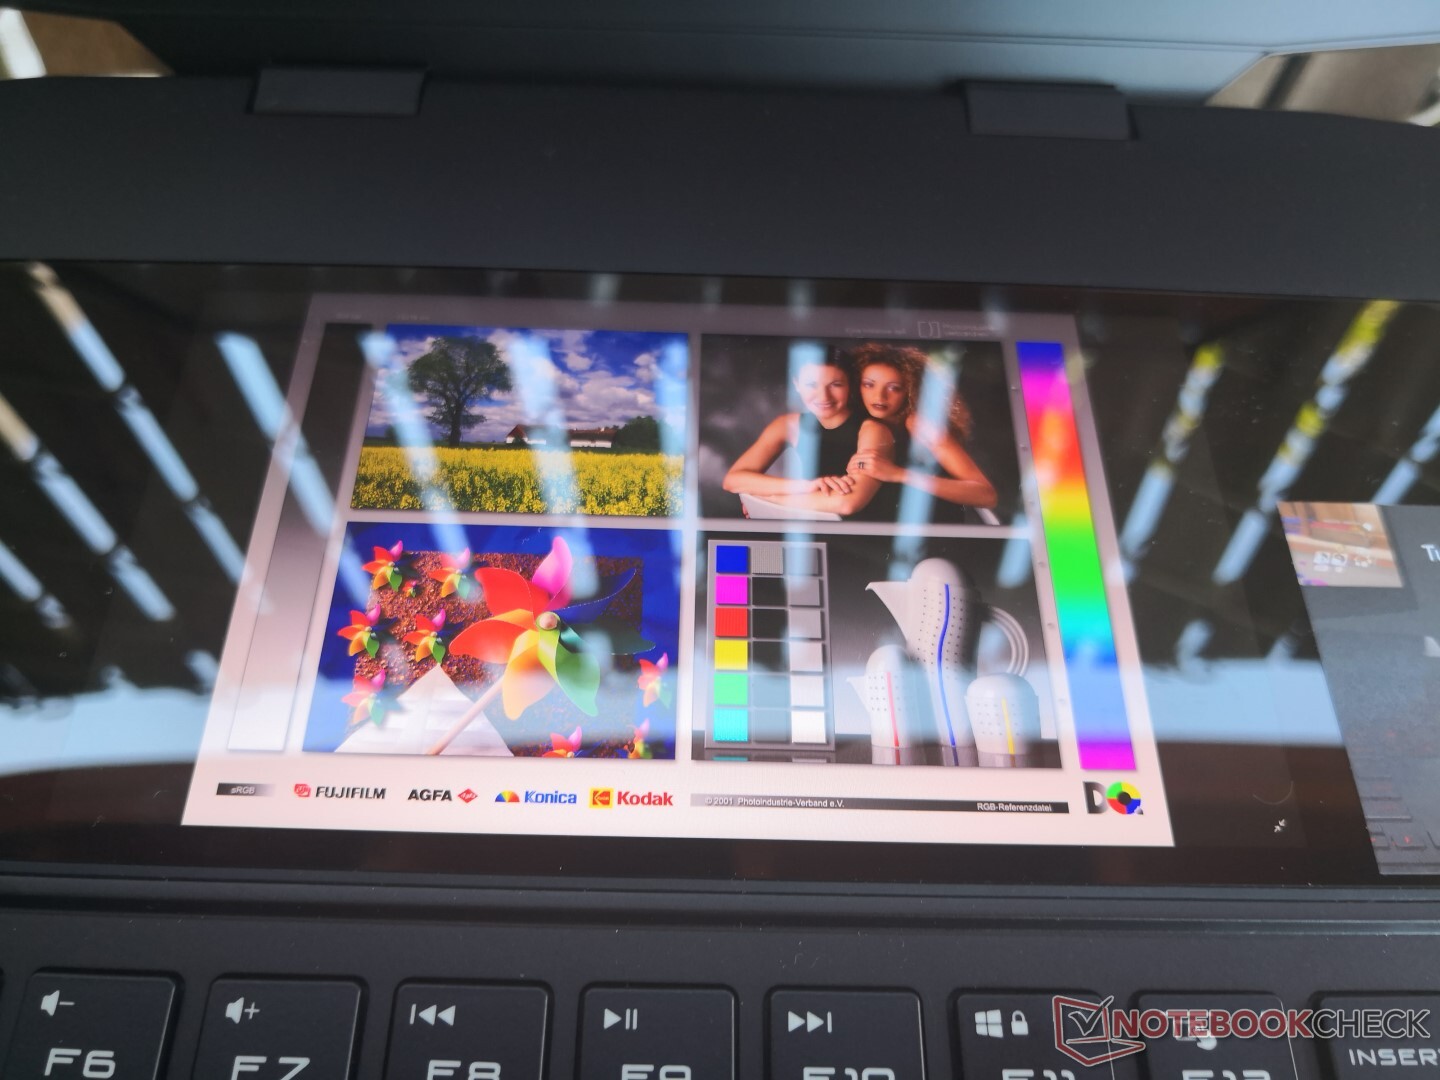
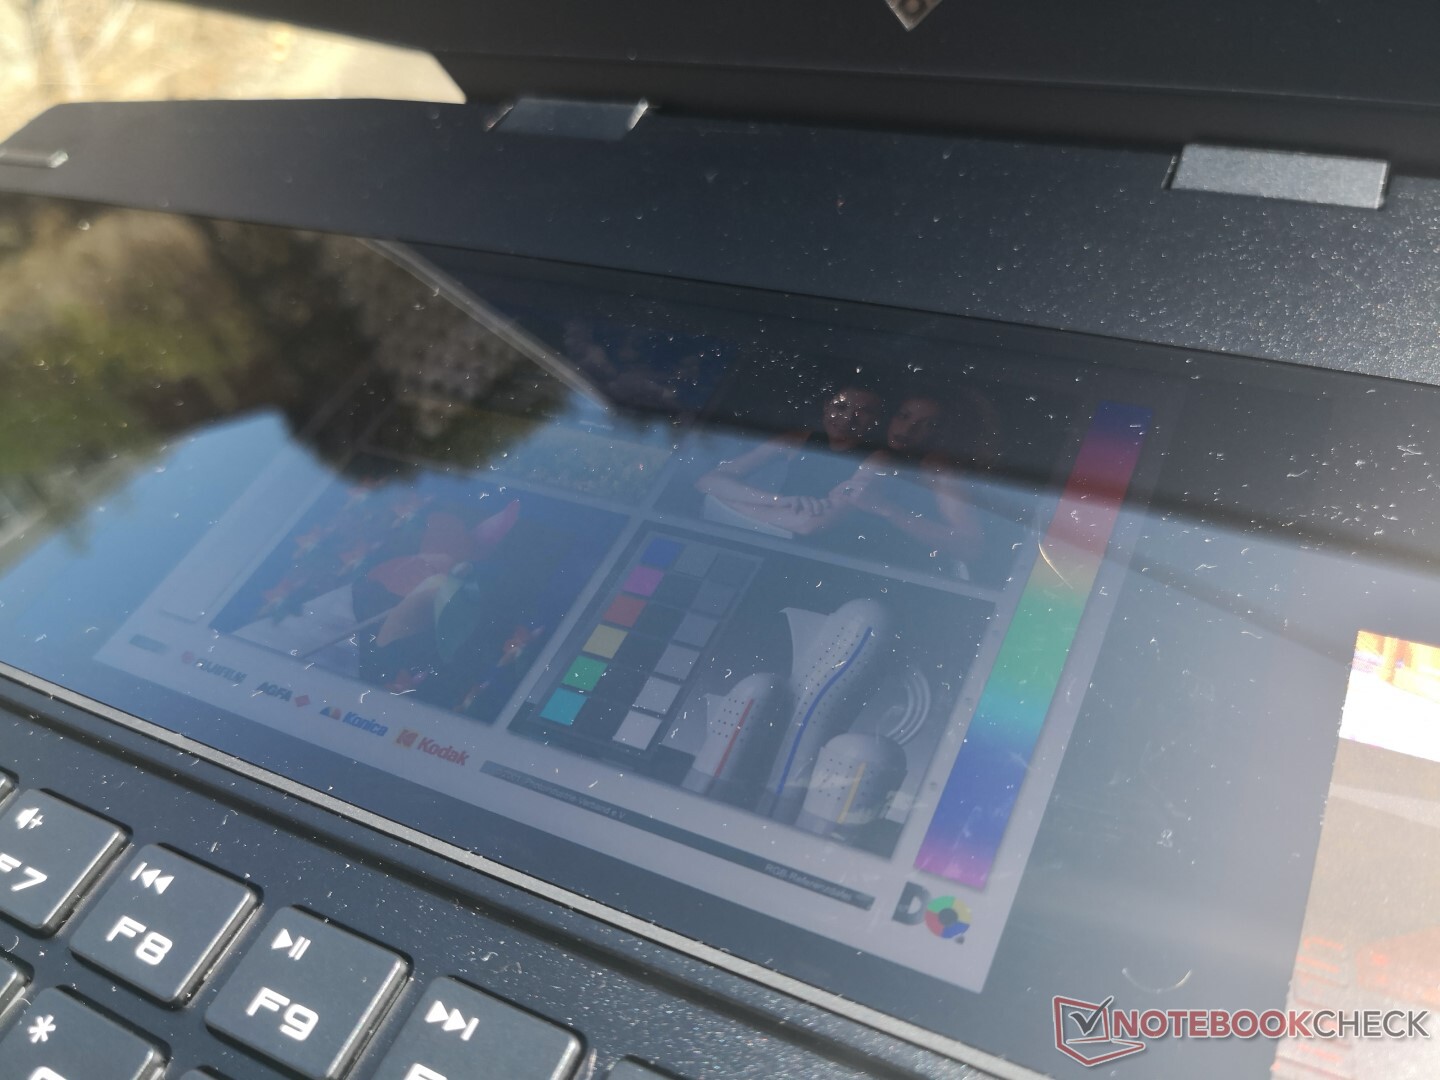
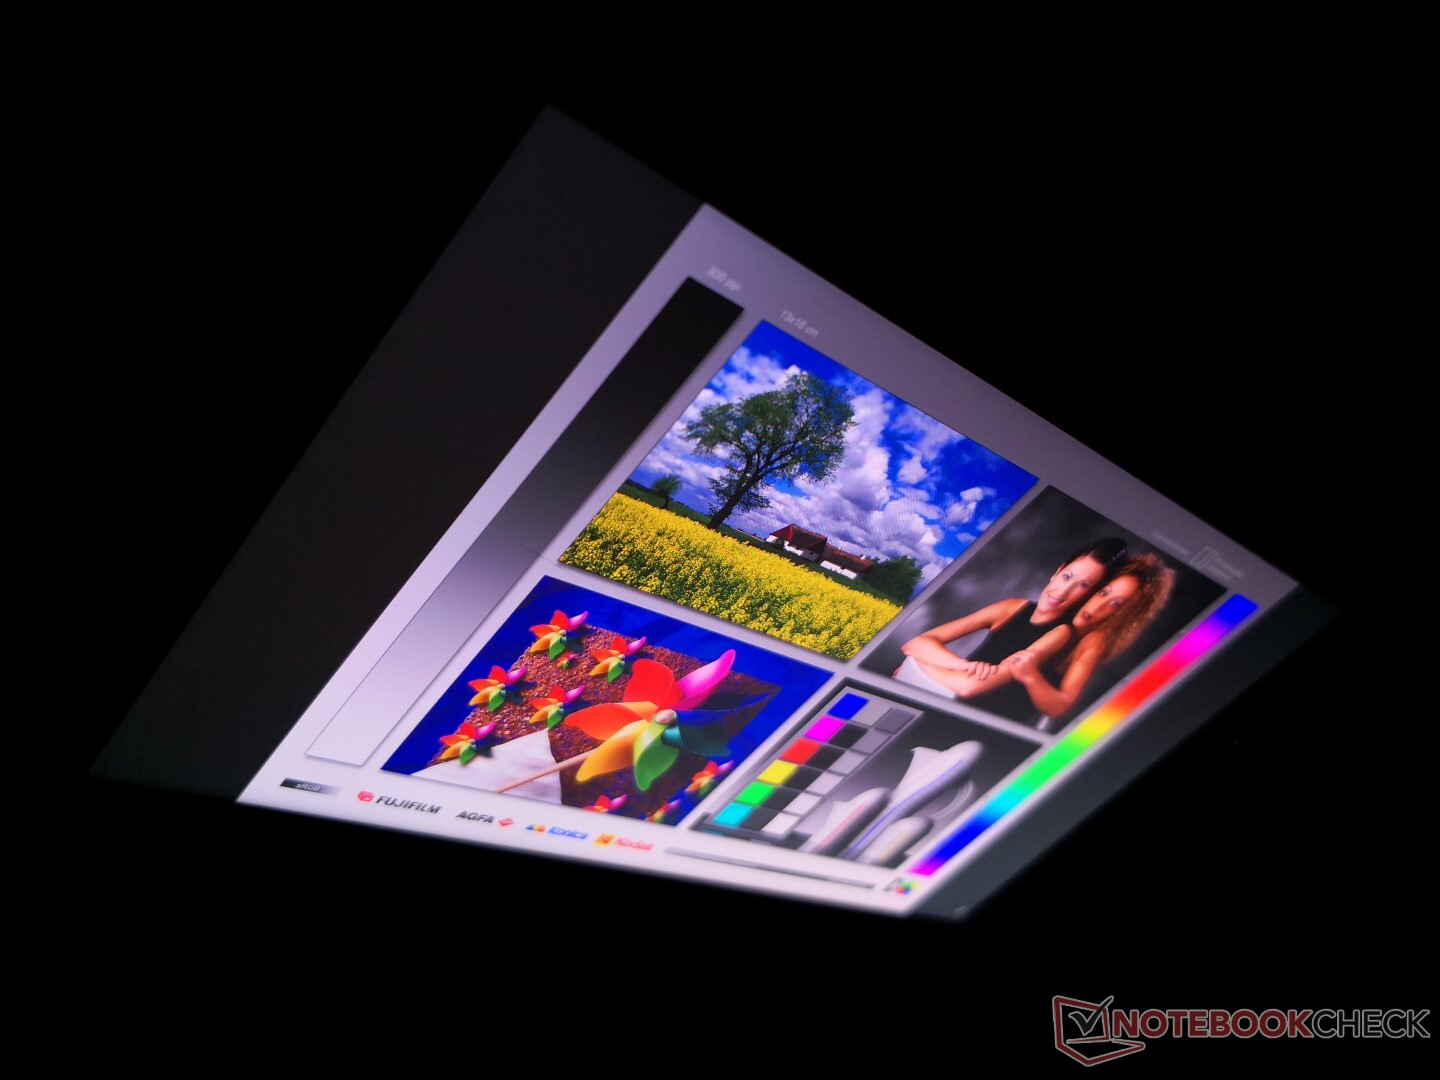
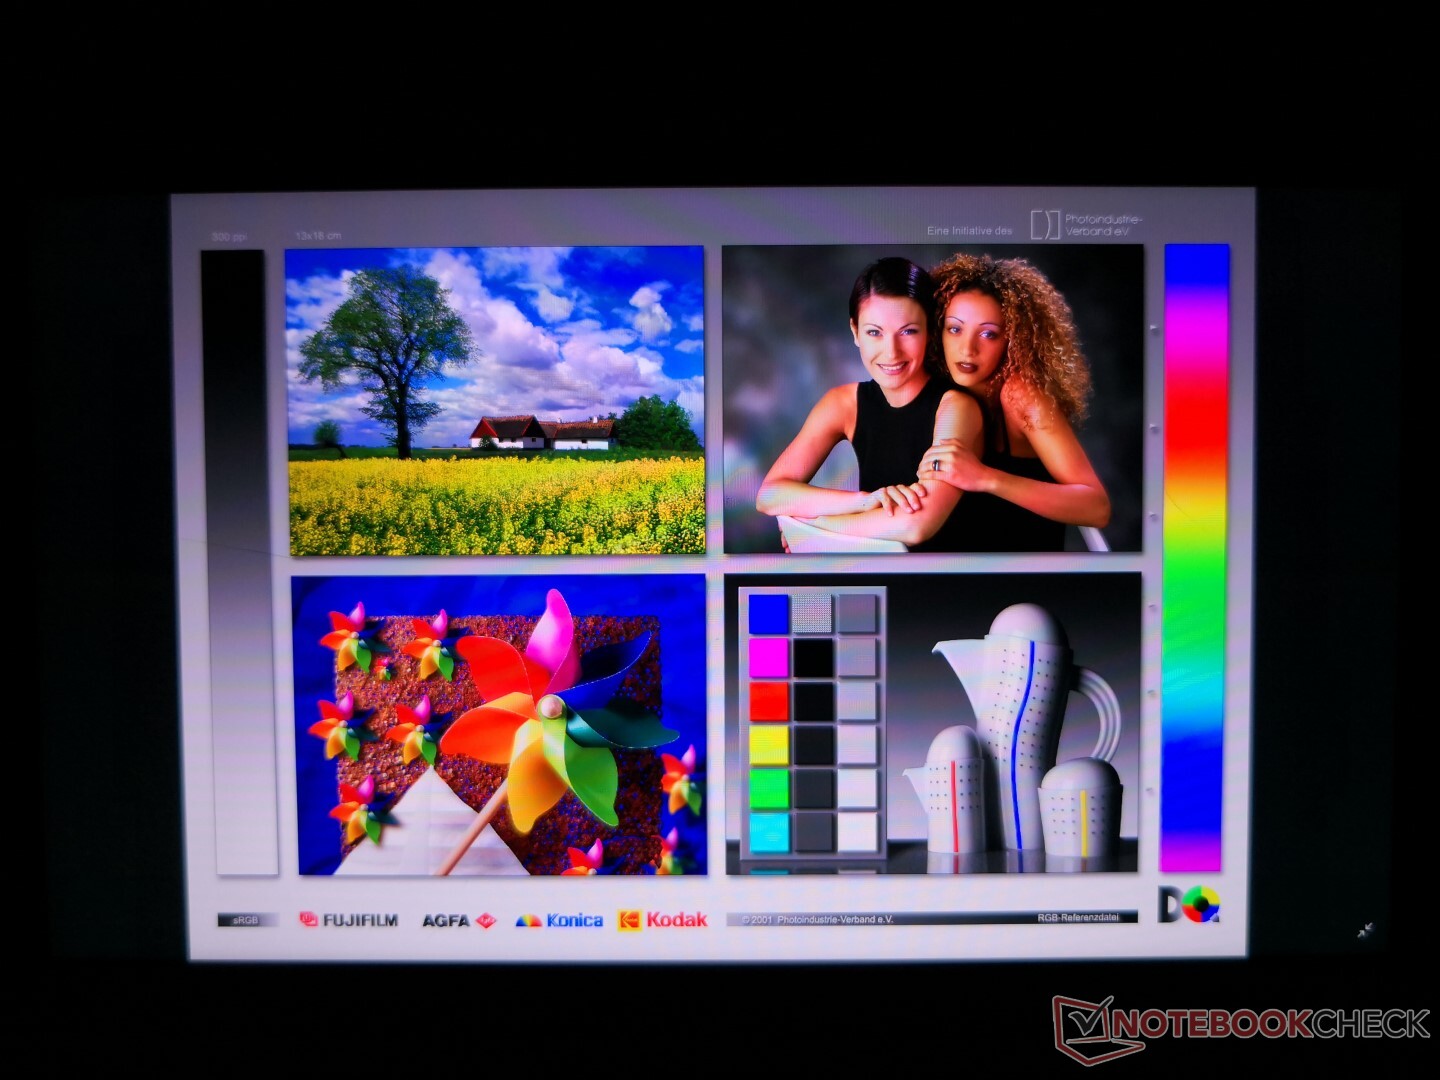
Outdoor visibility is not any better or worse than most other gaming laptops since our backlight is average for the category at roughly 300 nits maximum. If you intend on using the laptop outdoors frequently, then an Ultrabook or Razer Blade 15 OLED would suit you better. Viewing angles remain wide with shifts in colors and contrast occurring only from unrealistically wide angles.

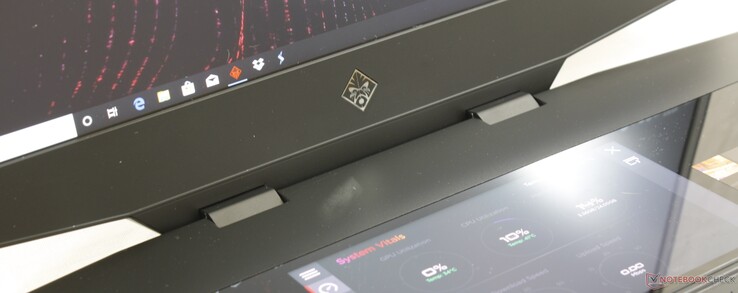
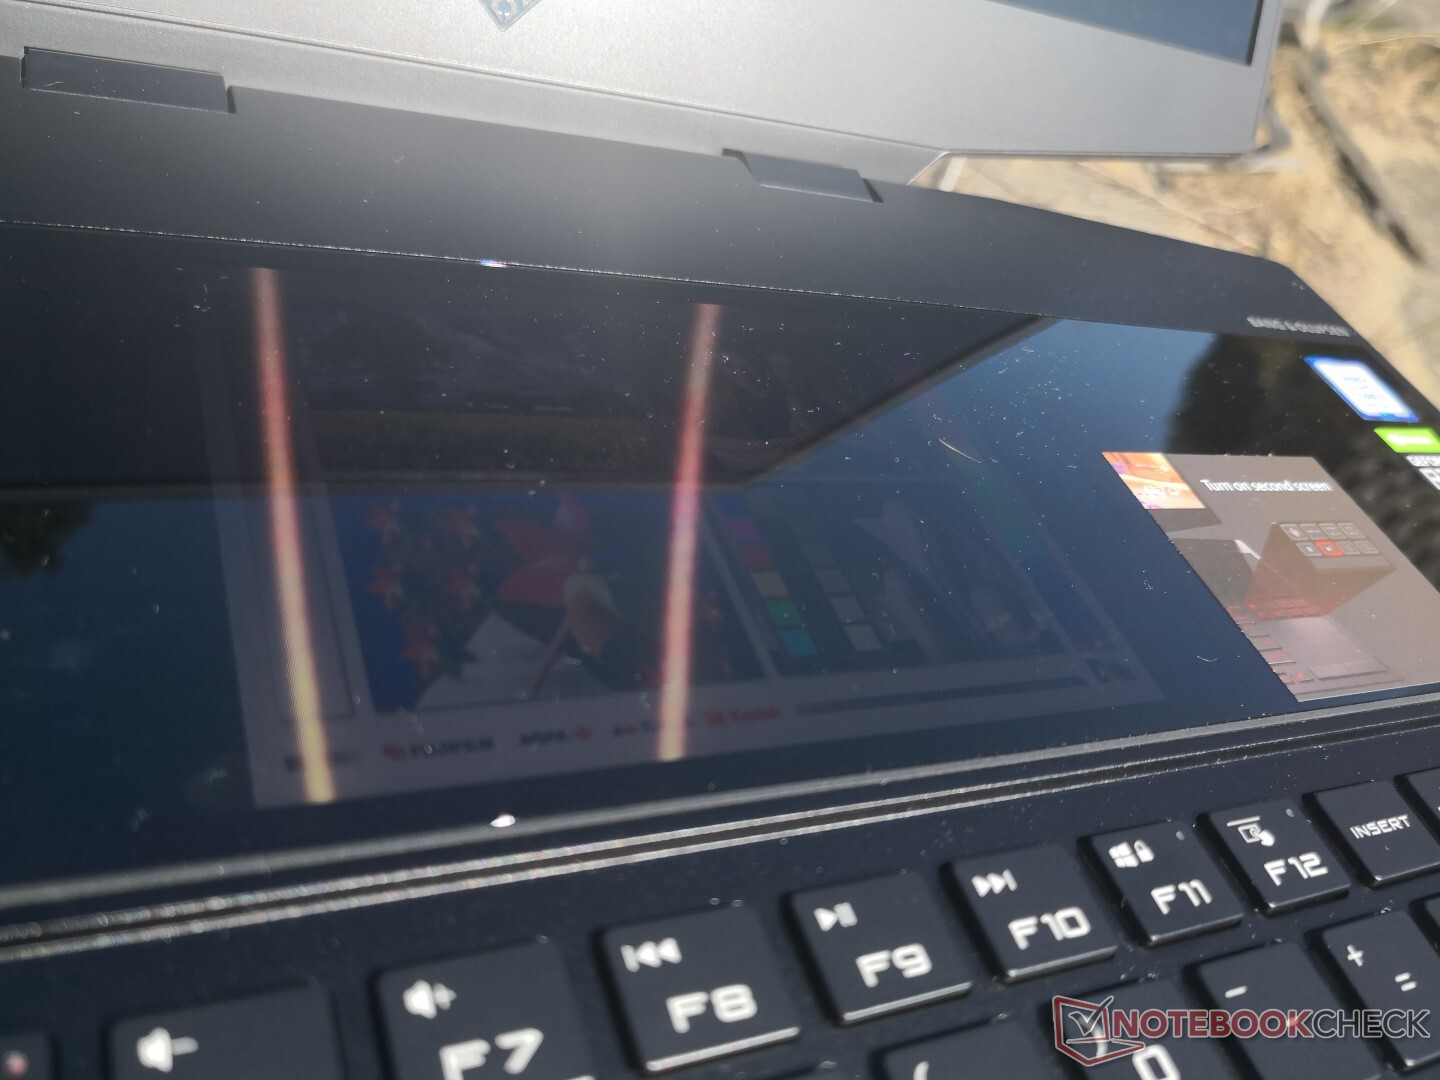
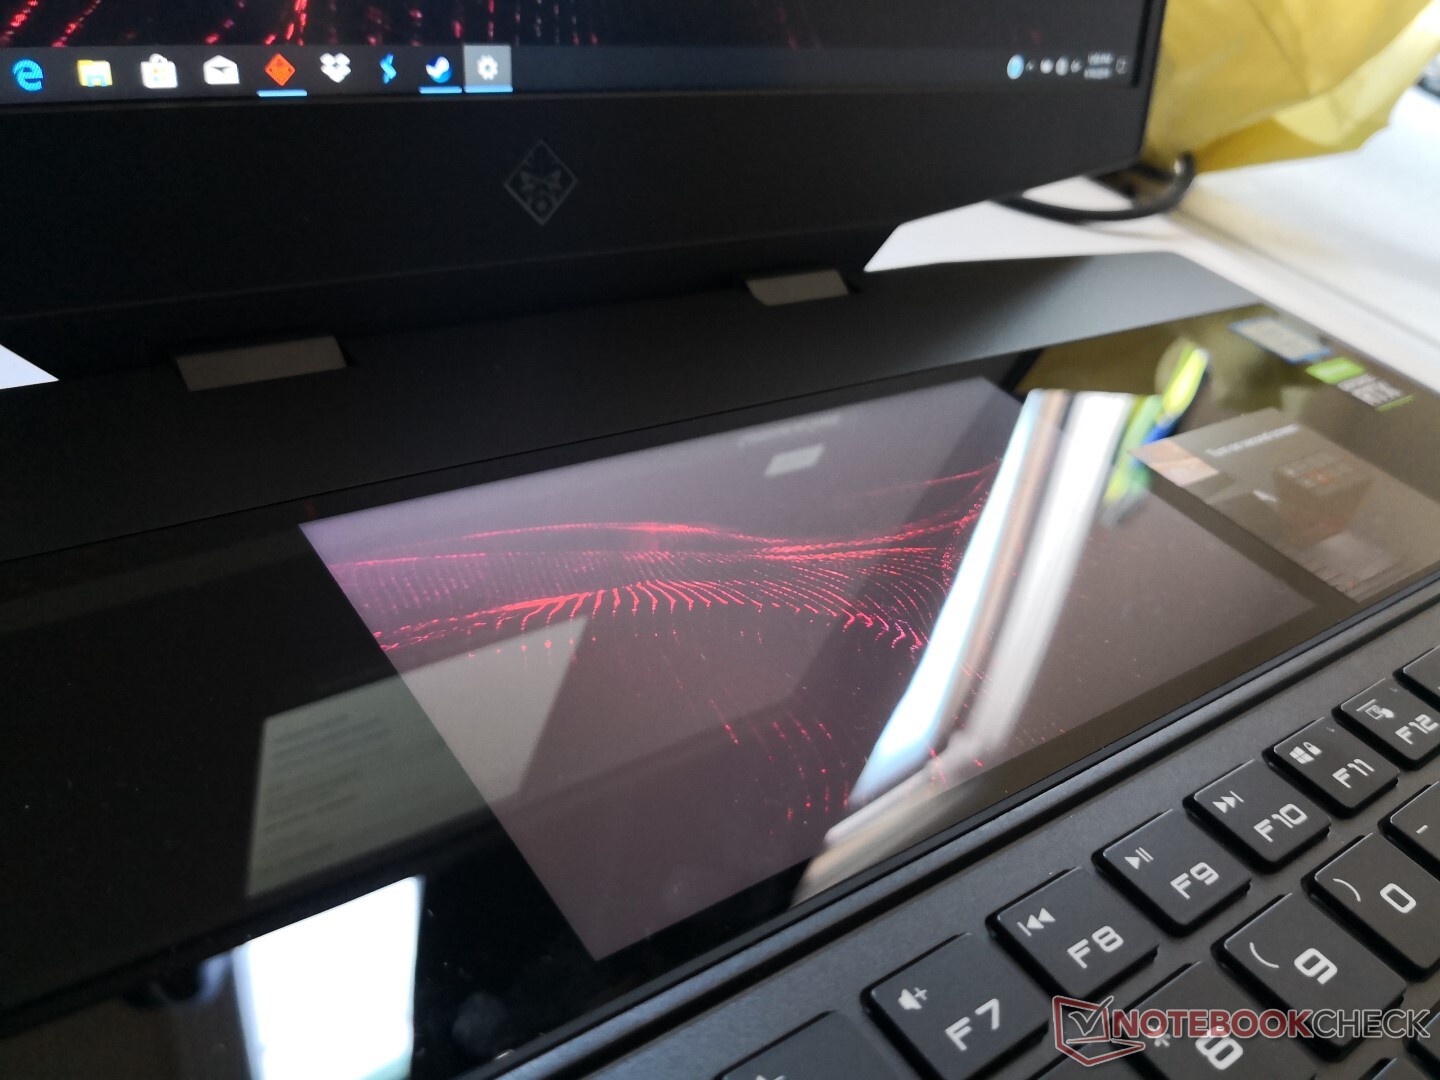
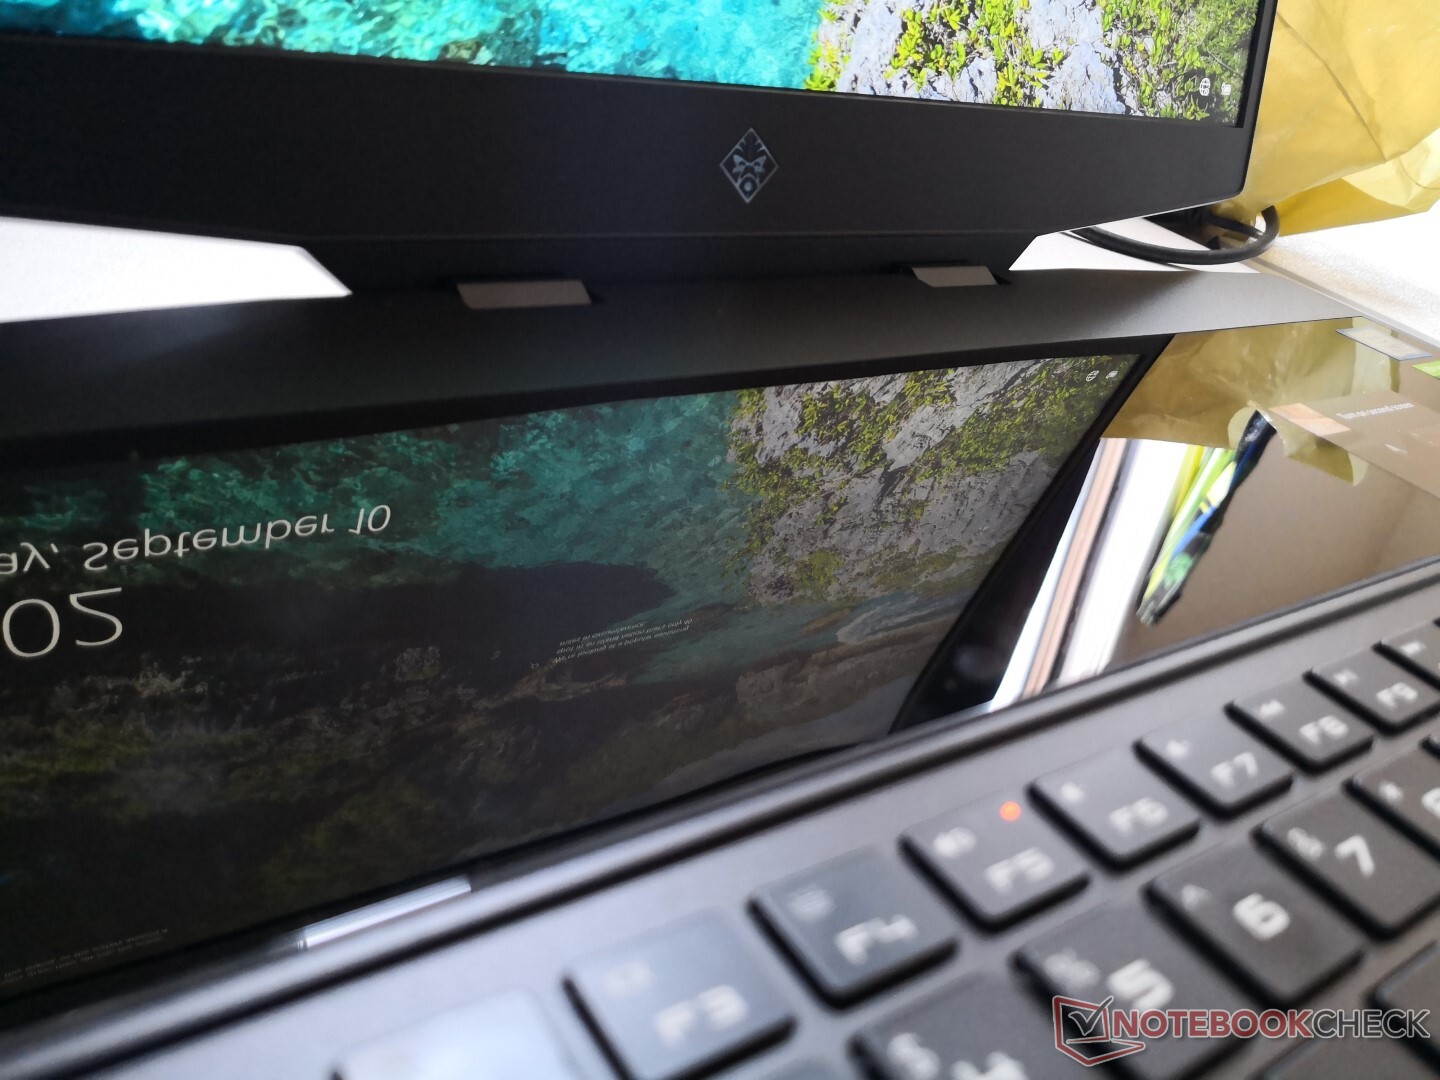
Secondary Touchscreen
What makes the Omen X 2S 15 unique is its sharp glossy second screen. This screen is of the same native 1080p resolution as the main screen for a more natural relationship between the two displays. The second screen has its obvious benefits when multi-tasking and its closer positioning to the main screen makes it less tiring to the eyes when compared to the ScreenPad of the Asus VivoBook S15.
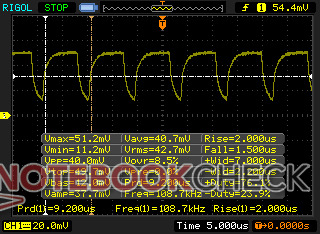
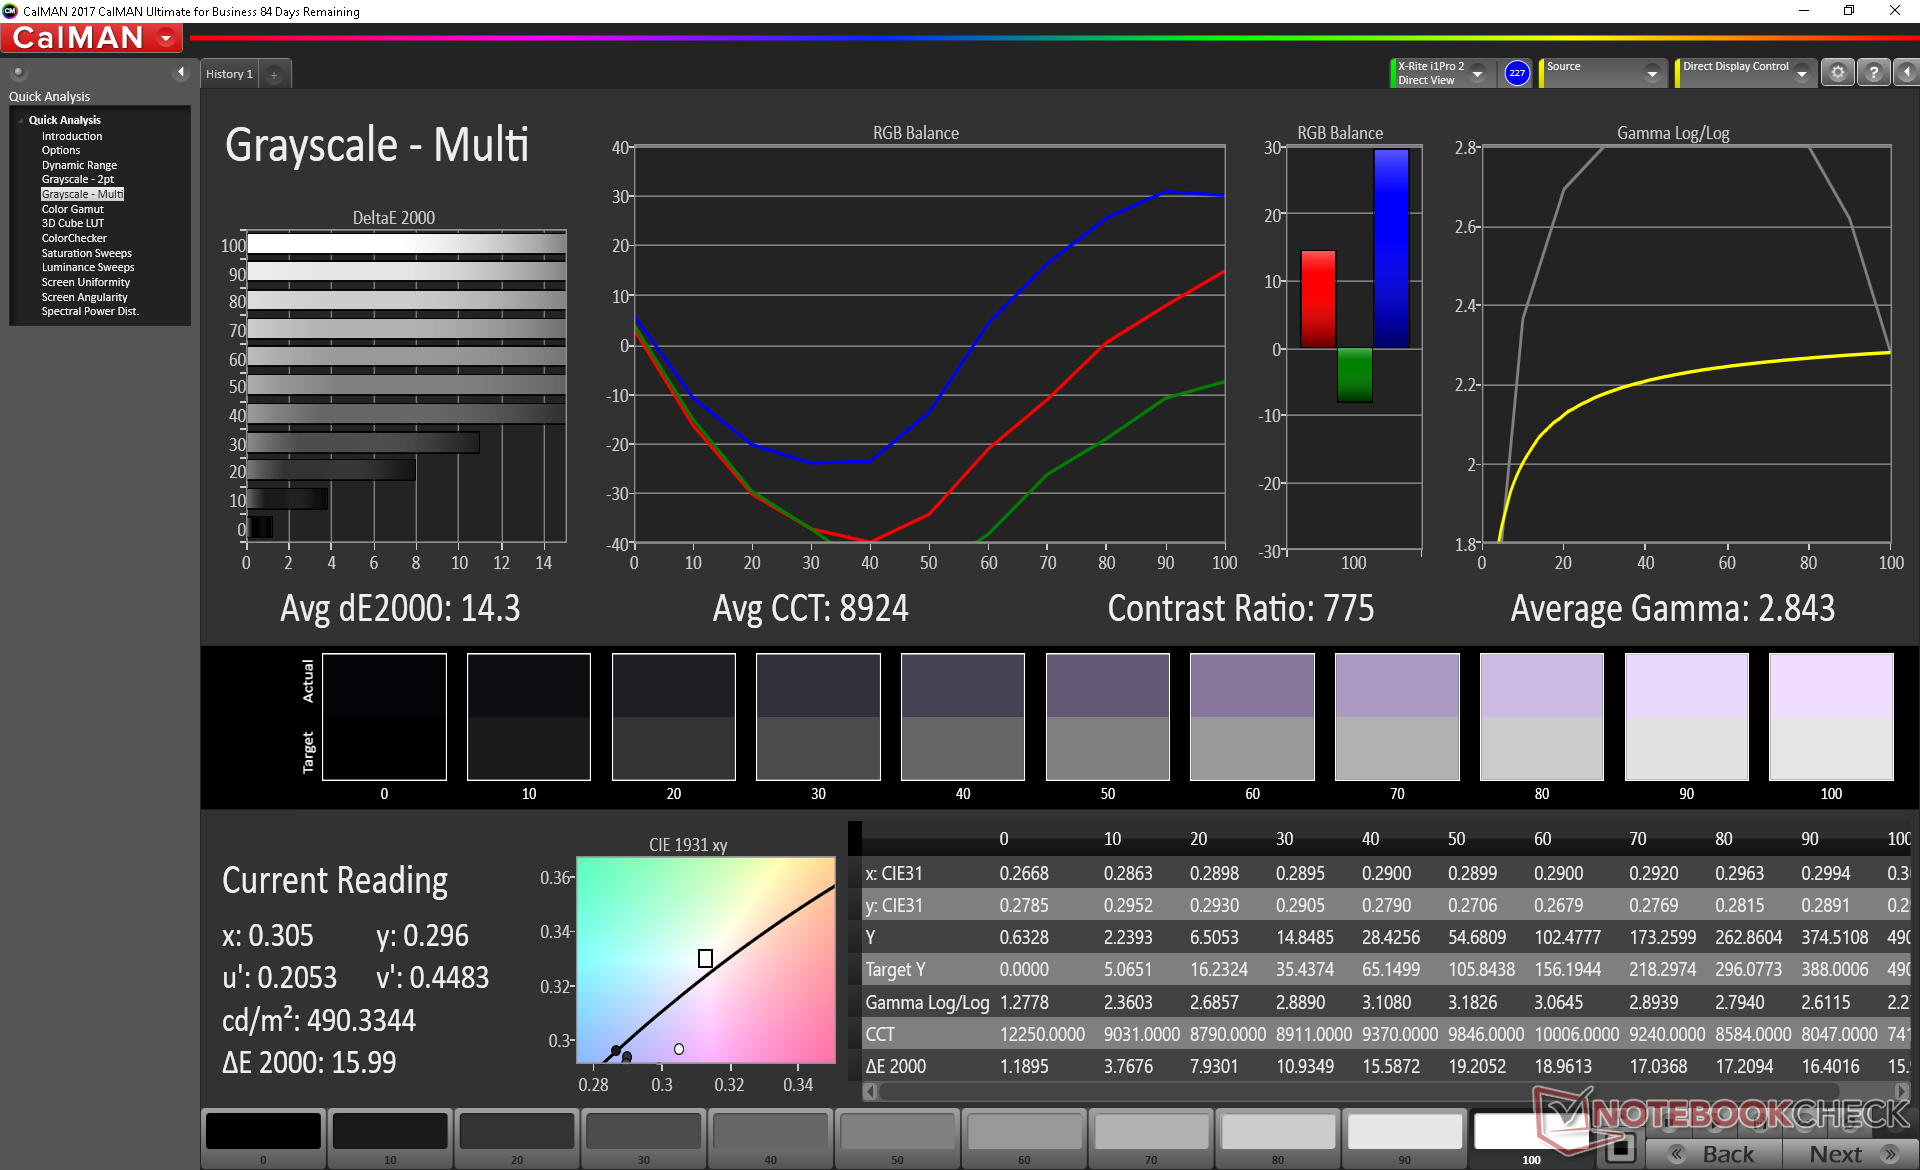
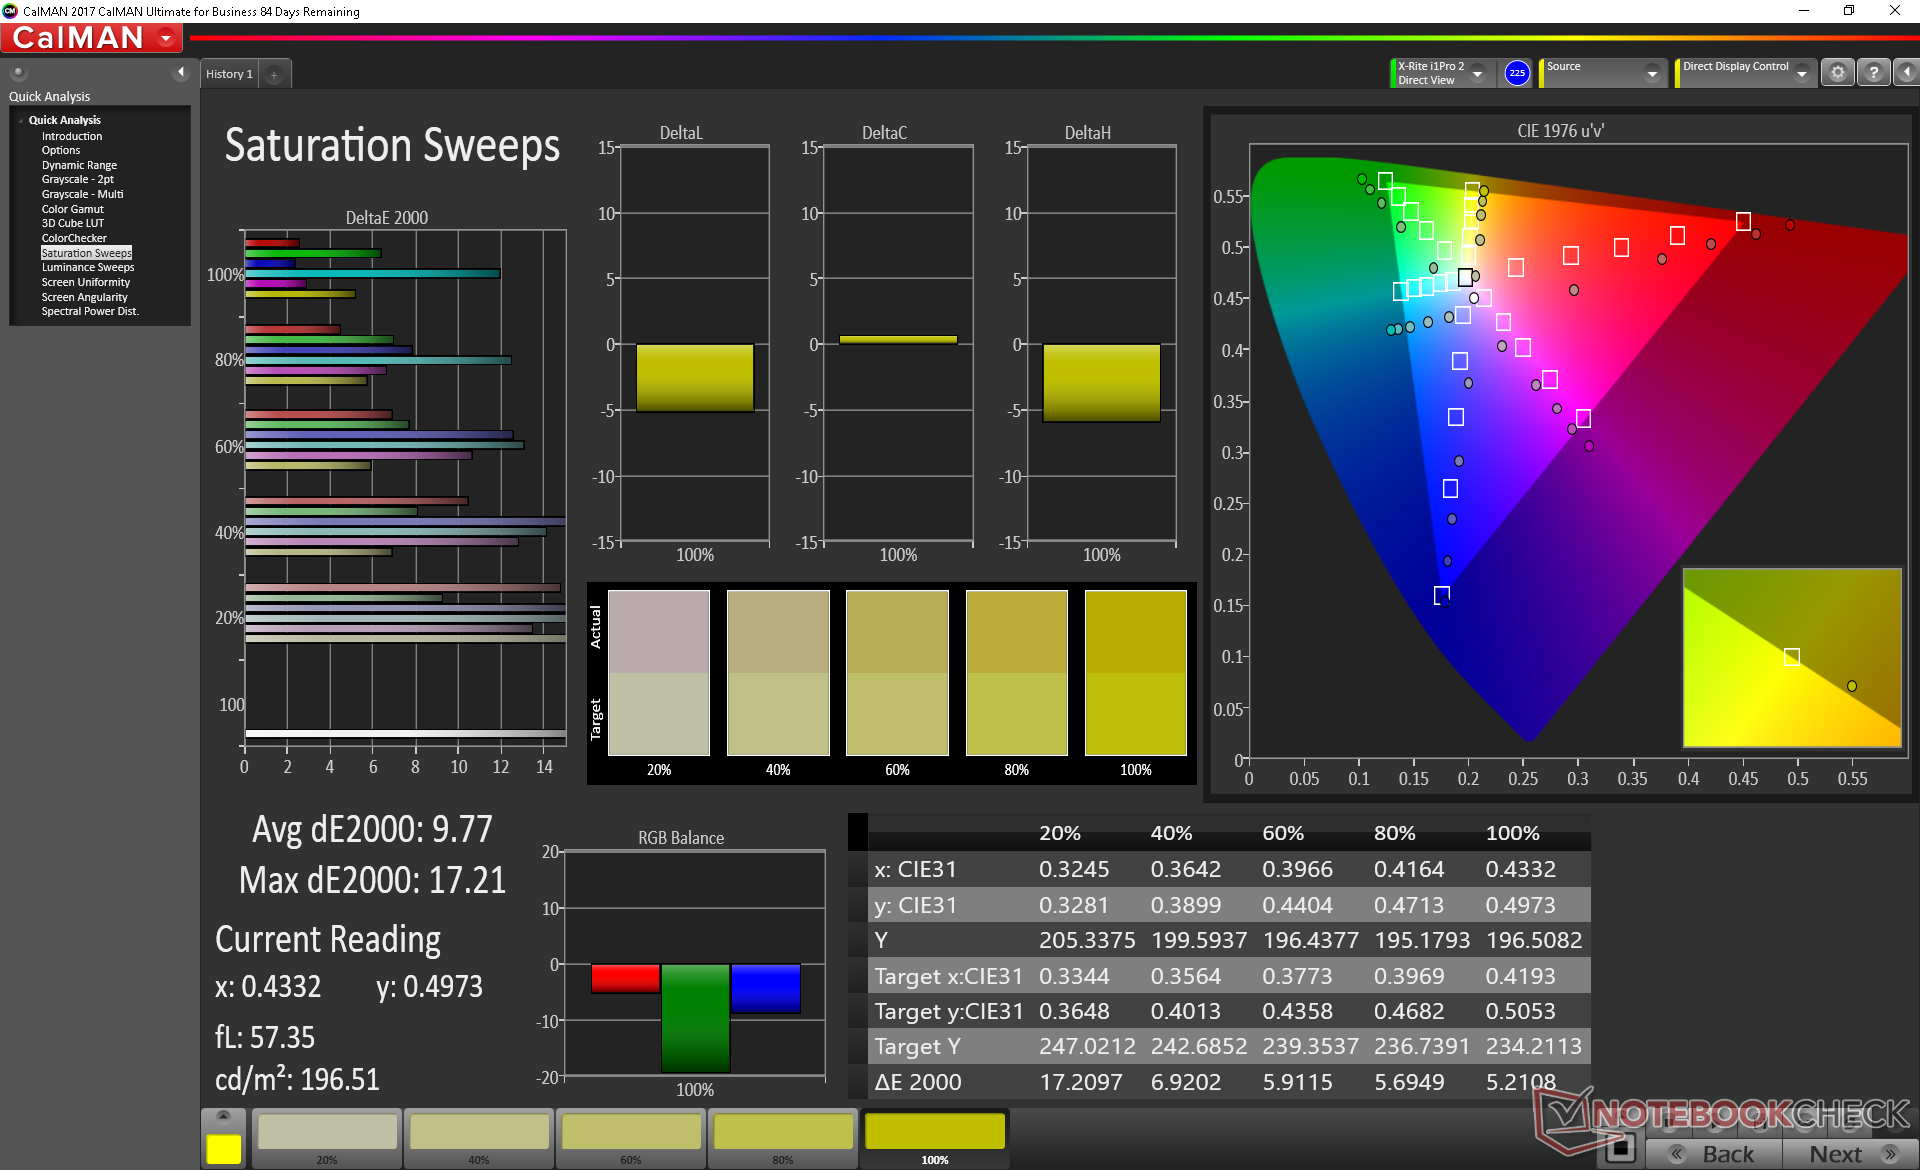
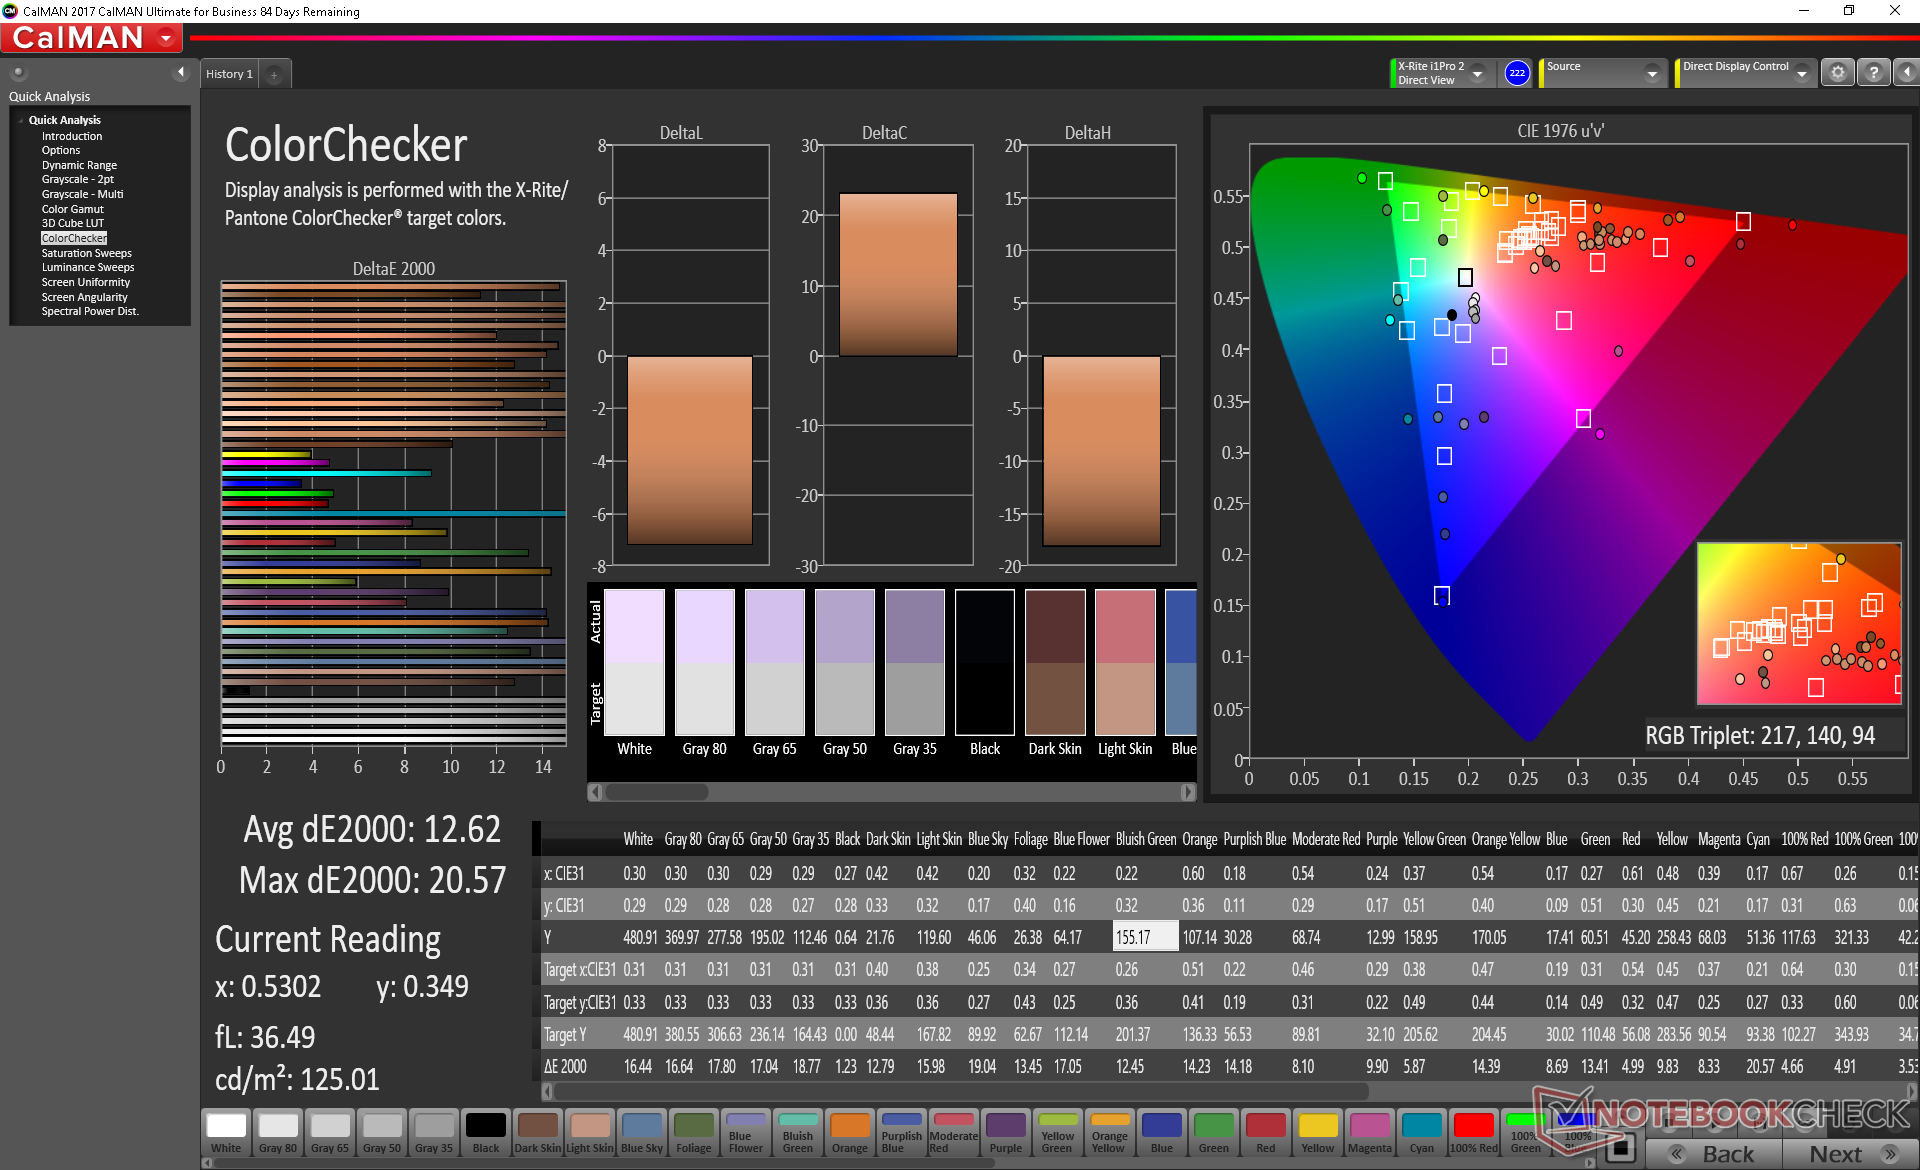
Unfortunately, the advantages end here because there are some major setbacks. Its first drawback relates to glare and brightness because you will always be looking at the screen from an angle. On any IPS display, apparent brightness will drop if you're not looking directly at the screen and this will always be the case on the Omen X 2S. The second drawback is its very poor calibration. Both temperature and RGB balance are way off and so grayscale is horrendous with its average DeltaE value of 14.3. Calibration addresses these issues, but to be so poorly calibrated in the first place is absurd for a ~$2000 laptop. Thirdly, expect to adjust the scaling of the text for more comfortable reading. And fourthly, the color space, response times, contrast, and refresh rate of the second screen are all different from the main screen instead of being 1:1.
The last drawback has more to do with Windows than the laptop itself. On a gaming laptop, the idea of playing a game on the main screen while browsing the web on the second touchscreen for guides, videos, items, and chatrooms sounds incredibly useful. As soon as you touch the second screen, however, the main game will minimize, pause or freeze because your window will have shifted focus. The experience is simply not as seamless as gamers would like it to be.
| Maximum Brightness | Contrast Ratio | Minimum Brightness | PWM | Black-White Response Time | Gray-Gray Response Time | sRGB Coverage | AdobeRGB Coverage |
| 476.6 nits | 733:1 | 44.4 nits | Yes, 108.7 KHz up to 99 percent brightness | 15.2 ms | 21.2 ms | 100 percent | 74.4 percent |


Performance
The lack of any Core i5 options or GPUs below the GeForce RTX 2070 Max-Q positions the Omen X 2S 15 as an enthusiast offering. Nvidia G-Sync comes standard in lieu of Optimus to push the gaming aspect of the system even further.
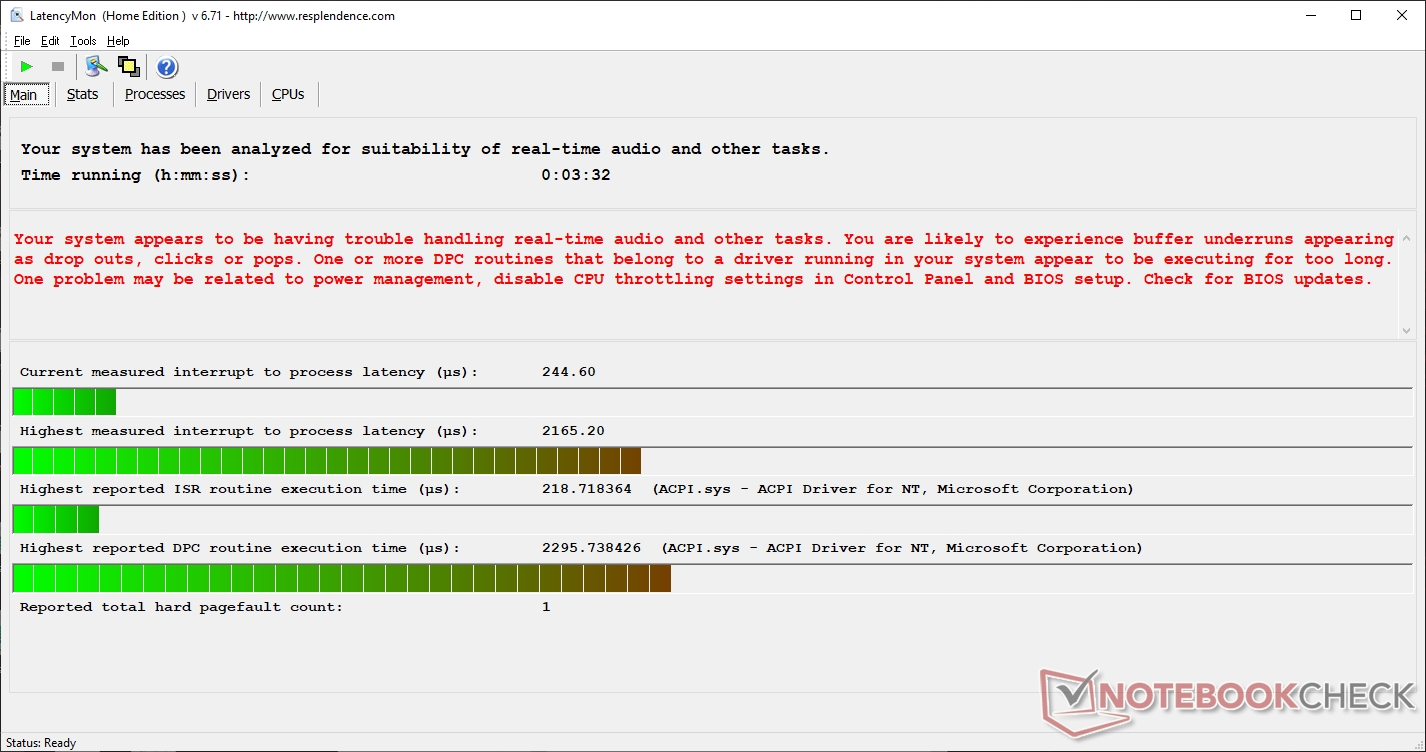
LatencyMon shows DPC latency issues even when the wireless is disabled.
Processor
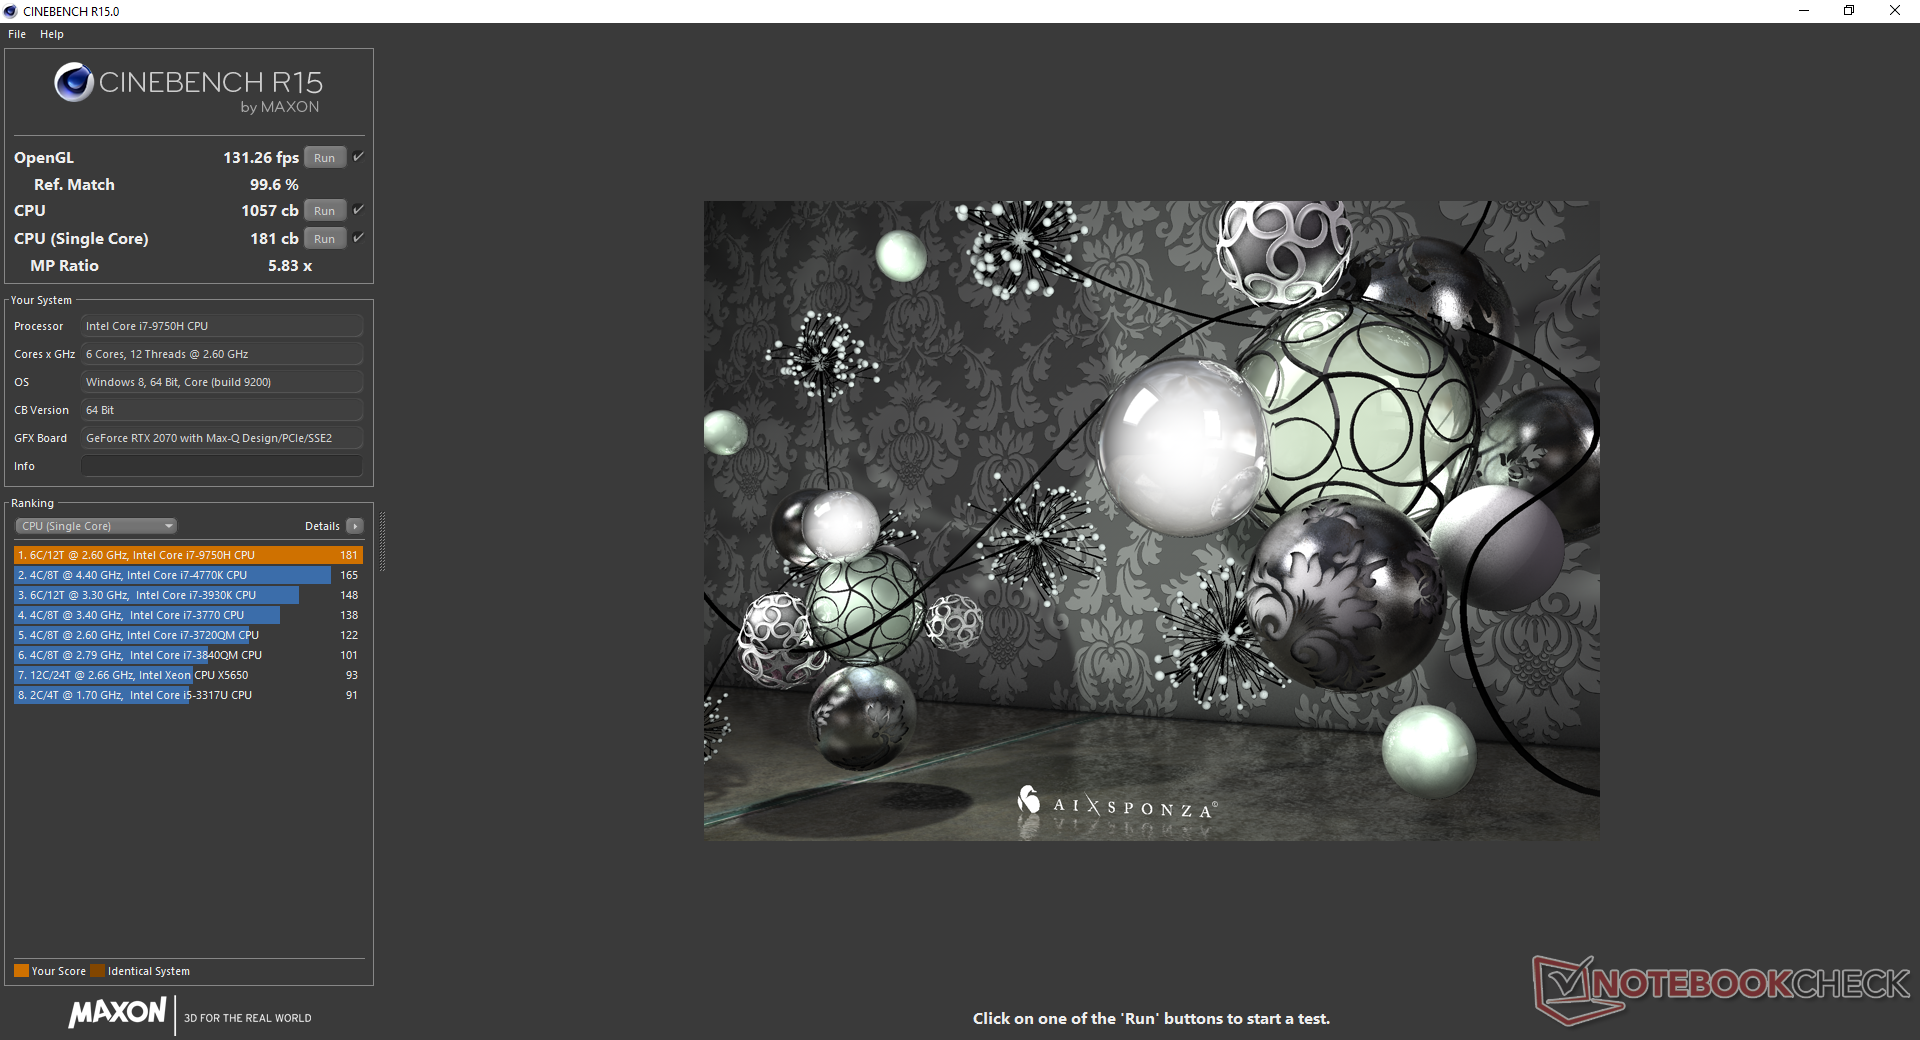
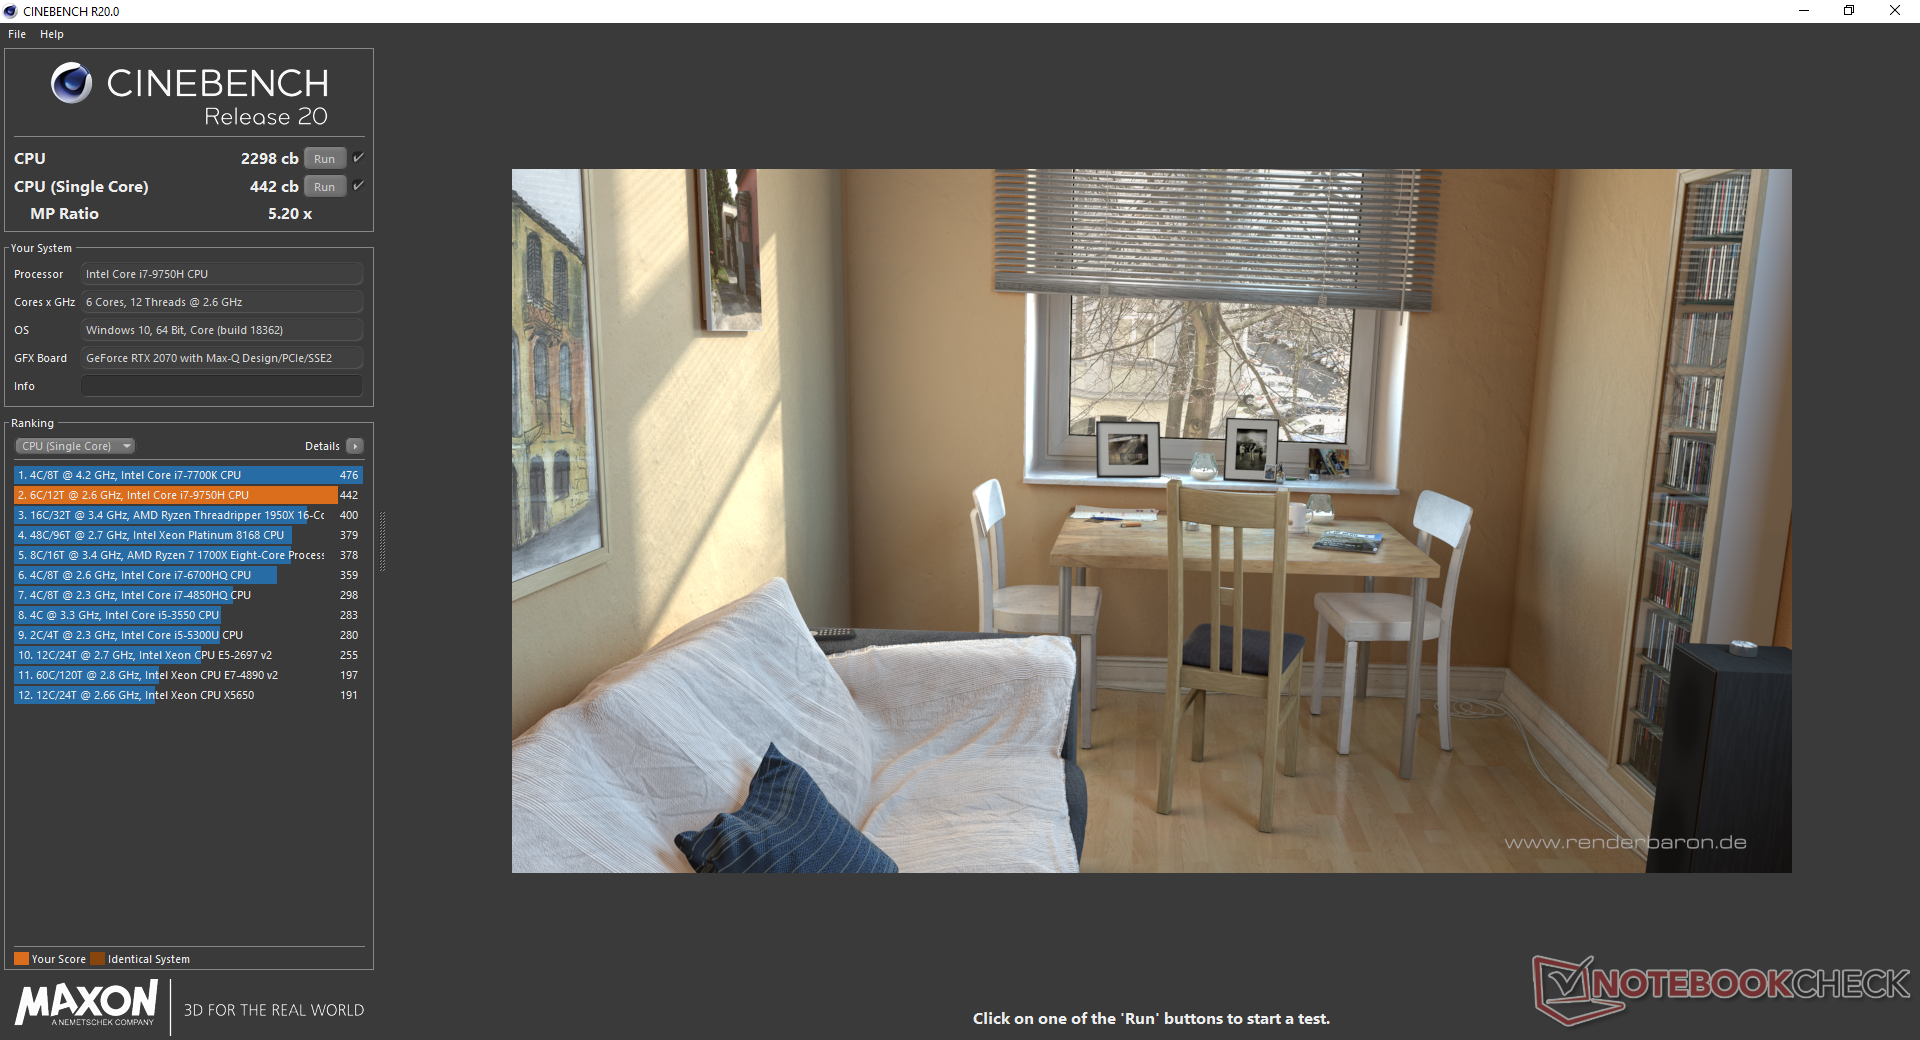
Multi-thread performance is about 10 percent slower than the average Core i7-9750H in our database taken from 40 other laptops to suggest that maximum Turbo Boost potential is very short-lived. When running CineBench R15 Multi-Thread in a loop, performance drops by 10 percent after just the first loop as shown by our graph below. Other gaming laptops with the exact same i7-9750H CPU like the Razer Blade 15 or Alienware m15 R2 are each able to sustain slightly faster clock rates for slightly faster performance.
Users upgrading from quad-core SKUs like the Core i7-7700HQ, i5-8300H, i5-9300H, or the competing AMD Ryzen 7 3750H will see a performance boost of about 30 percent. If you already have a Core i7-8750H laptop, however, then there's no reason to upgrade from a CPU performance perspective.
See our dedicated page on the Core i7-9750H for more technical information and benchmark comparisons.
System Performance
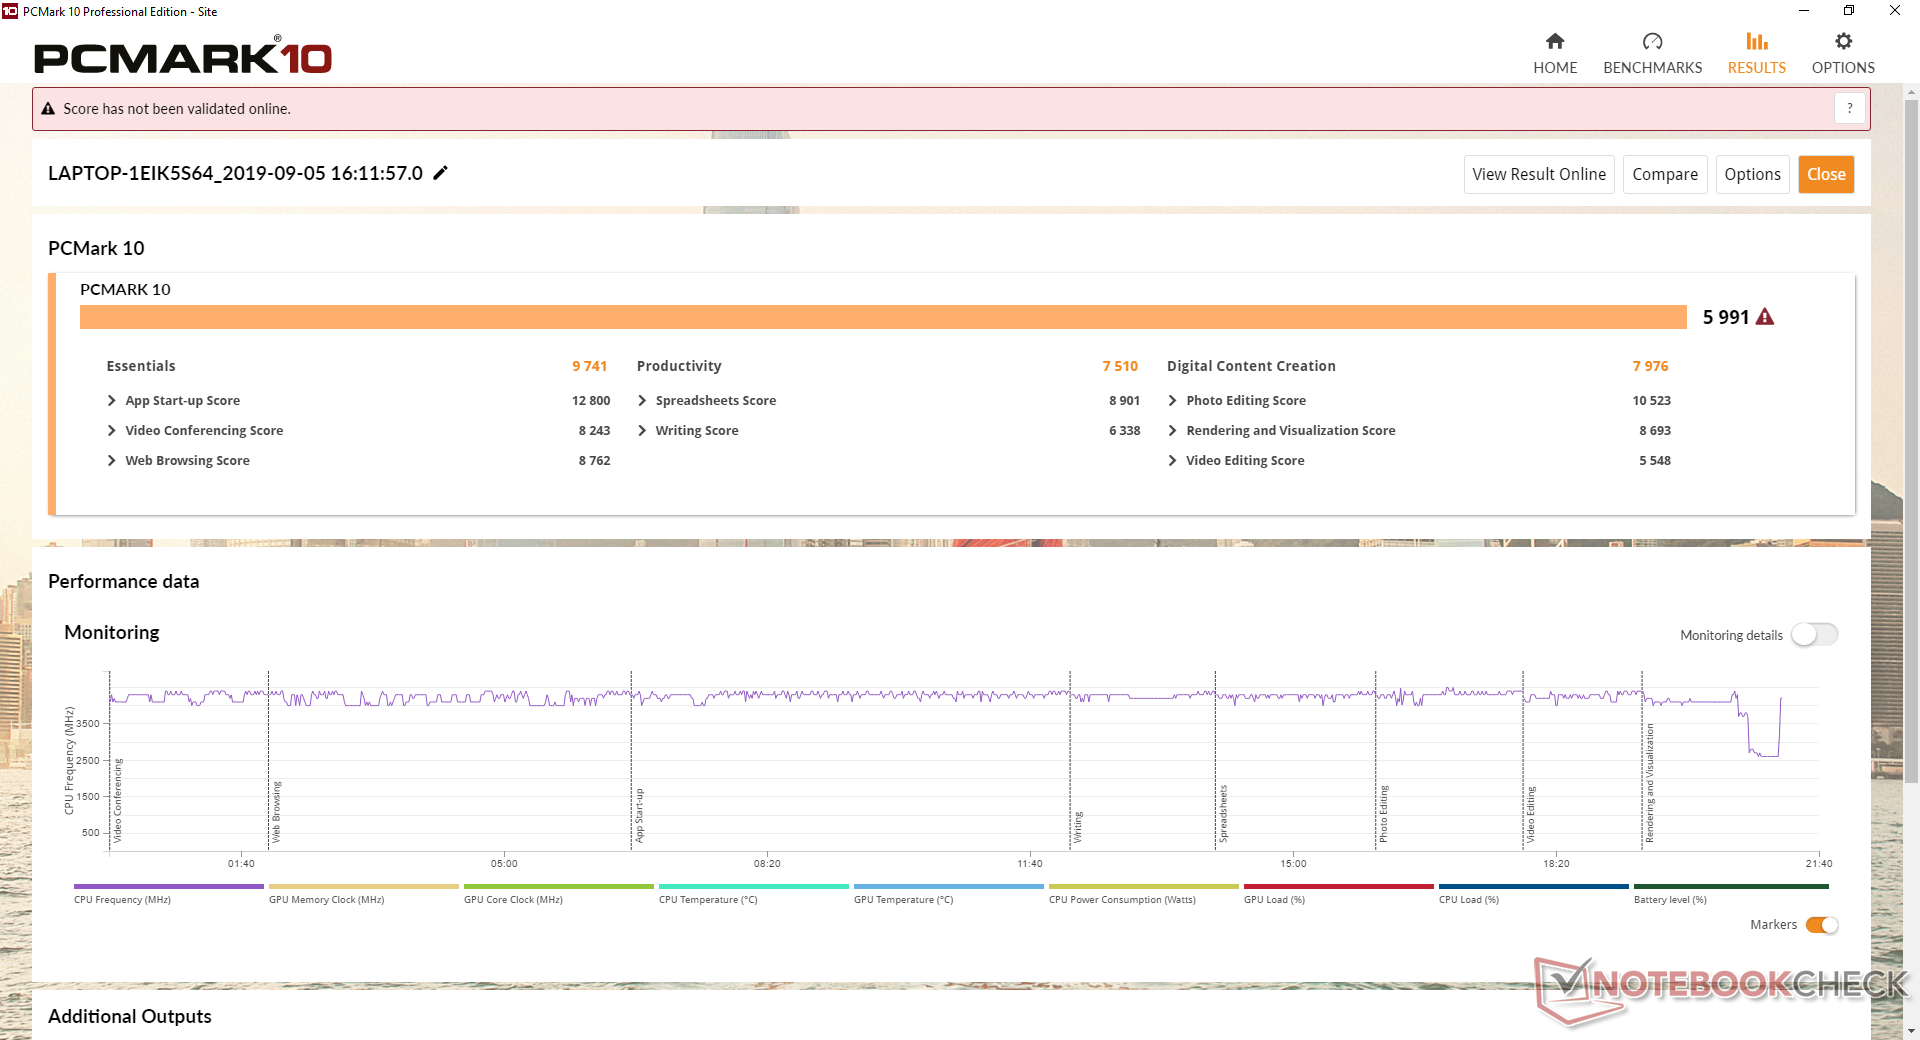
PCMark benchmarks show no surprises as scores are within just a few percentage points from other high-performance gaming laptops. We experienced no hardware issues during our time with the unit aside from unusually long wake-from-sleep times of about 6 seconds.
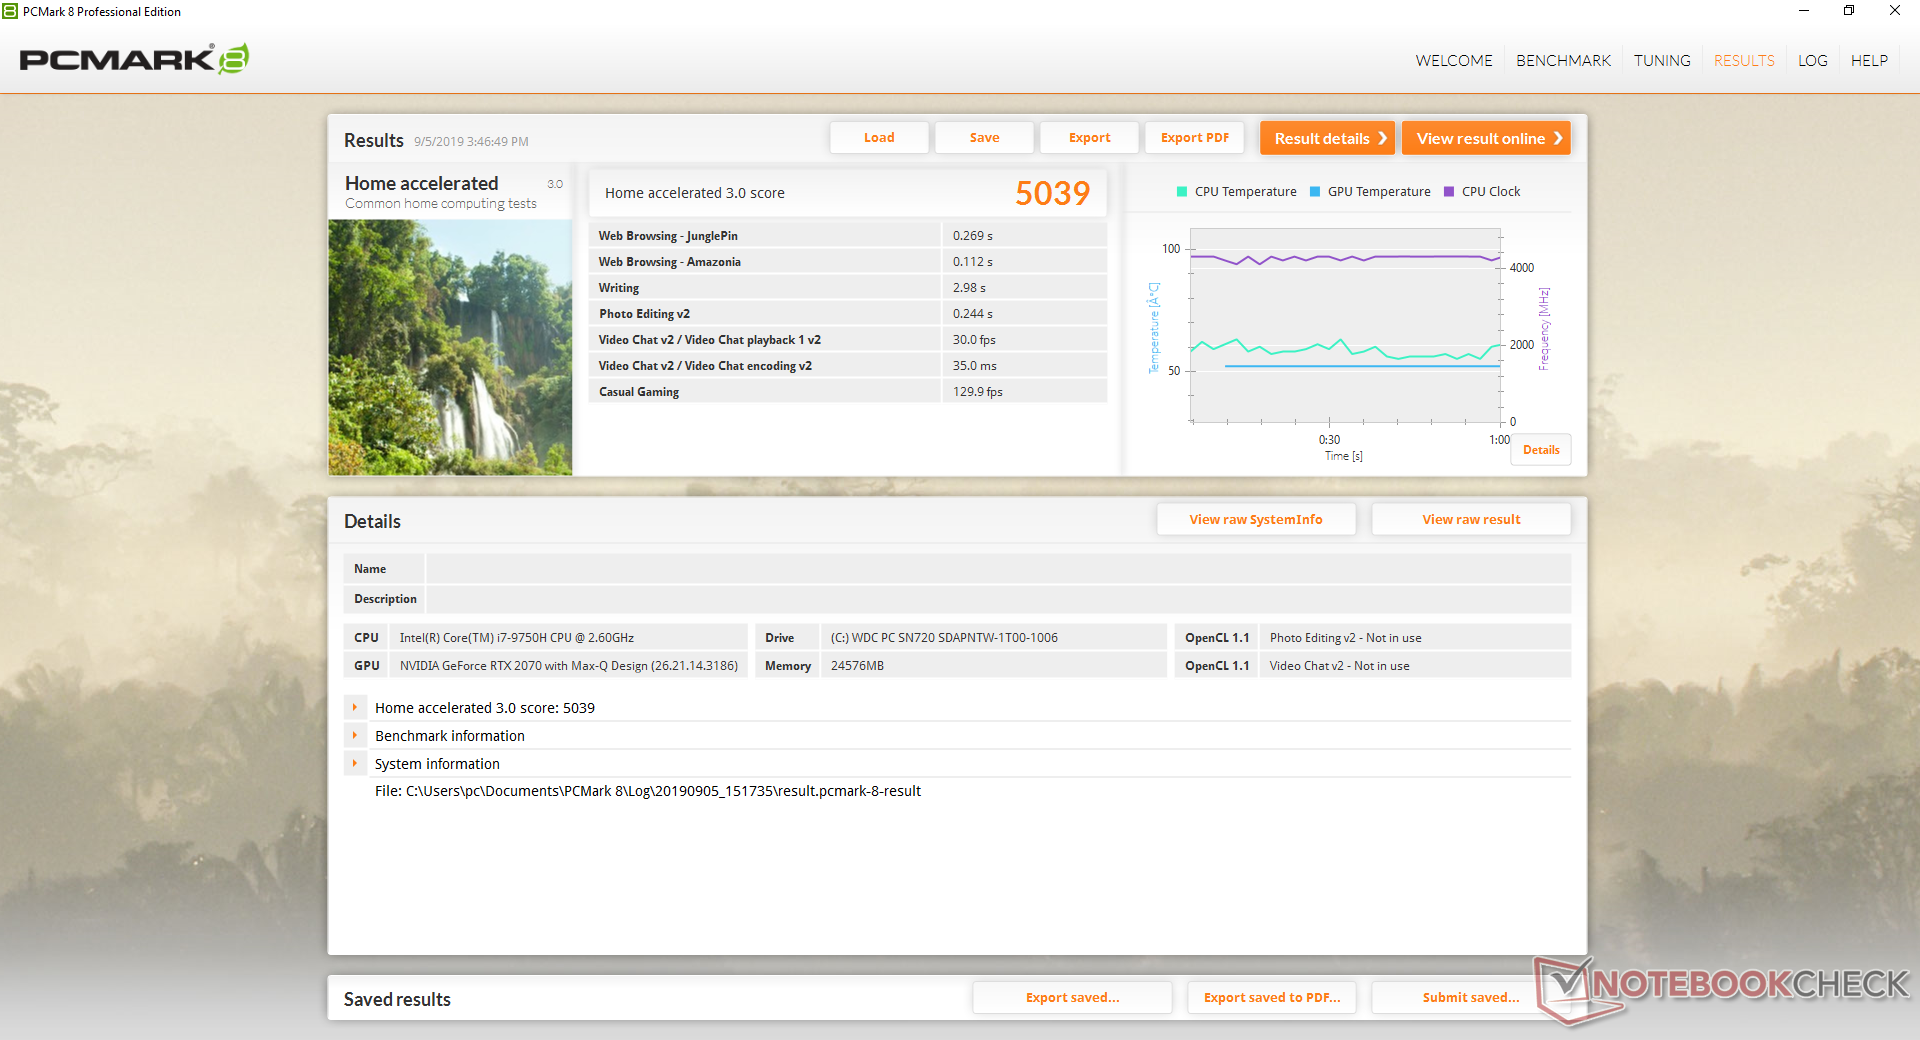
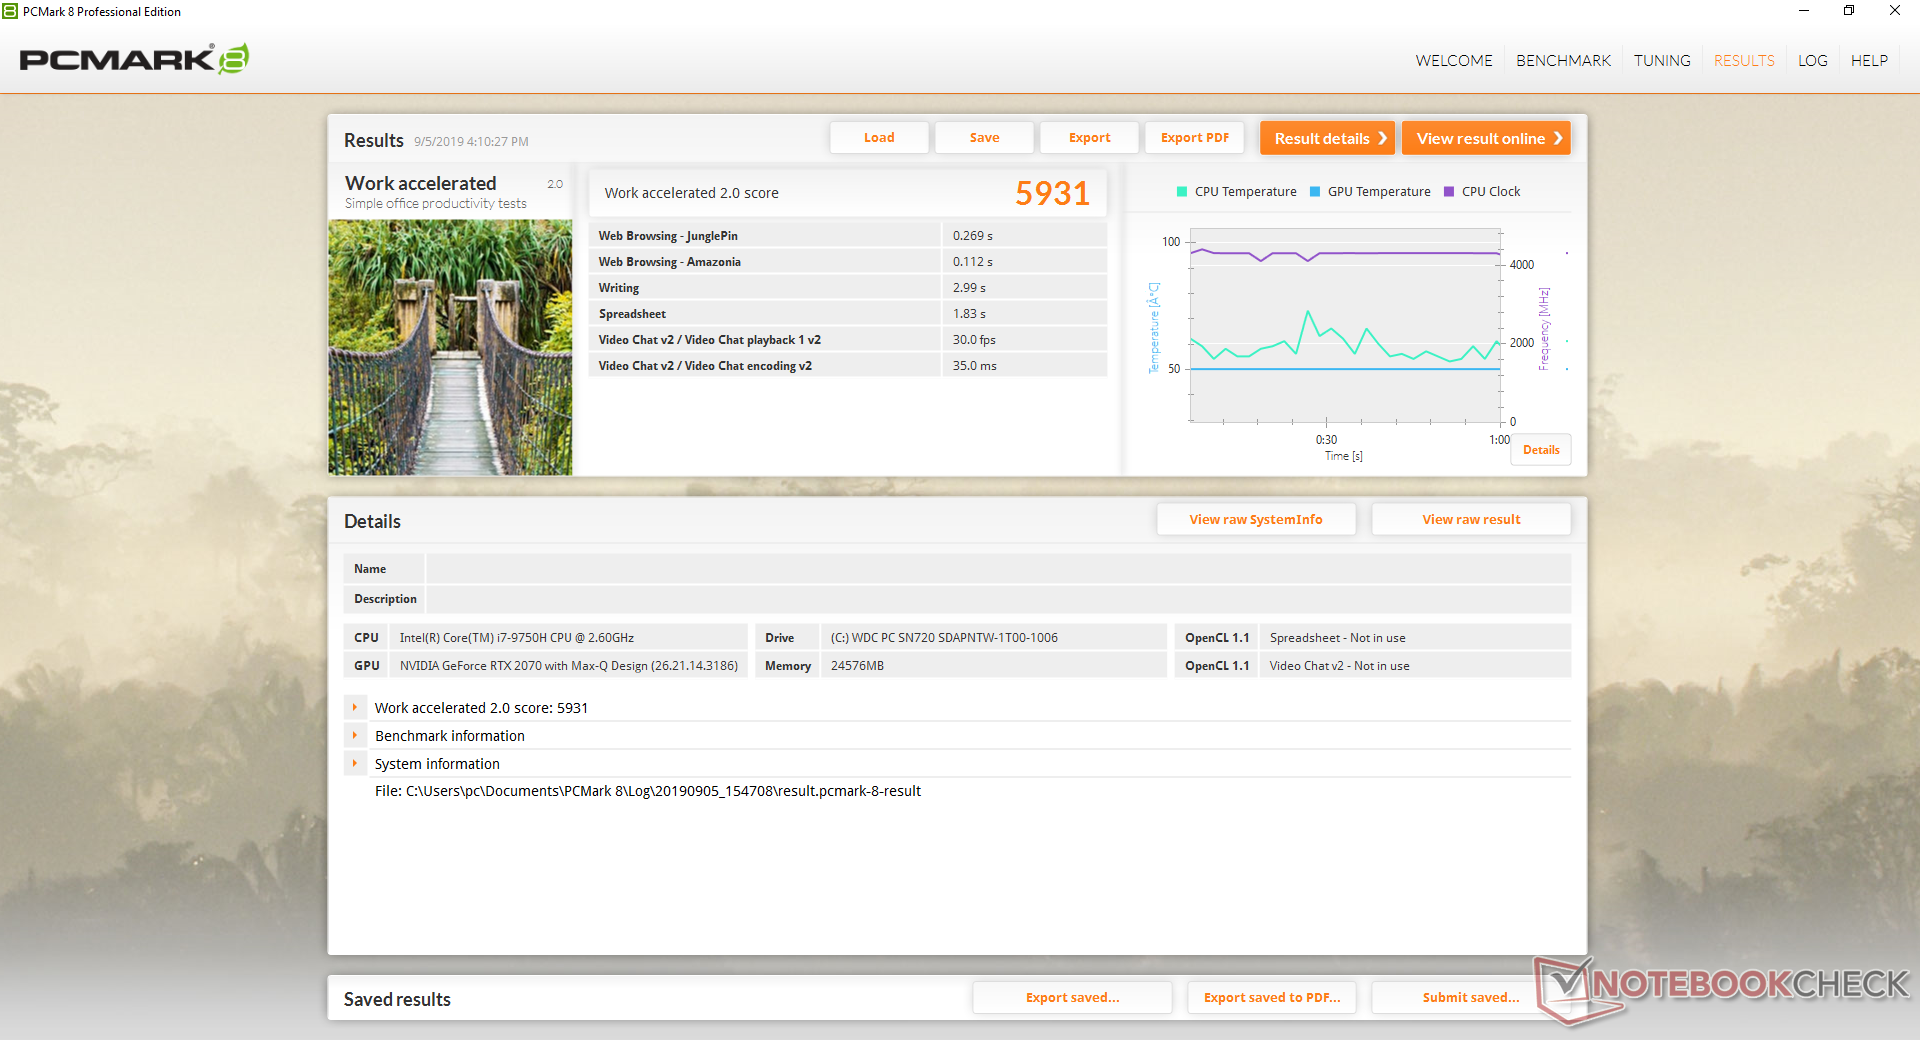
| PCMark 8 Home Score Accelerated v2 | 5039 points | |
| PCMark 8 Work Score Accelerated v2 | 5931 points | |
| PCMark 10 Score | 5991 points | |
Help | ||
Storage Devices
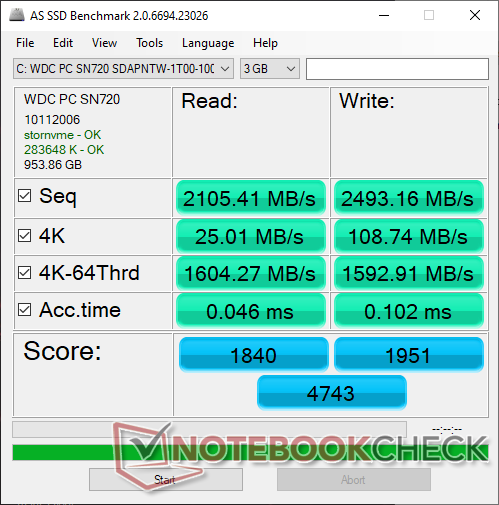
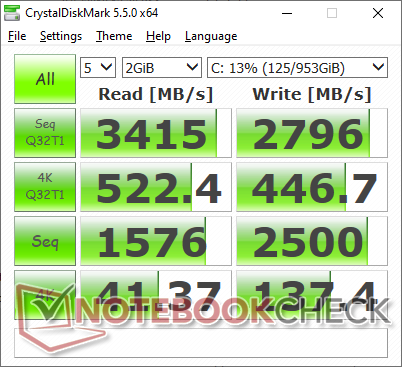
Two M.2 2280 slots are available with optional Intel Optane support. Our test unit comes configured with a single 1 TB WDC PC SN720 SDAPNTW, but different resellers may have different suppliers.
The 1 TB WDC PC SN720 is a fast NVMe drive with sequential read and write rates of over 2100 MB/s and 2400 MB/s, respectively, according to AS SSD to be even faster than the Samsung PM981 commonly found on high-end systems like the Razer Blade series. You'll have to choose your storage options carefully as adding a second drive may prove difficult as mentioned above.
See our table of HDDs and SSDs for more benchmark comparisons.
| HP Omen X 2S 15-dg0075cl WDC PC SN720 SDAPNTW-1T00 | HP Omen 15-dc1020ng WDC PC SN720 SDAQNTW-512G | Razer Blade 15 RTX 2080 Max-Q Samsung SSD PM981 MZVLB512HAJQ | Alienware m15 R2 P87F 2x Toshiba XG6 KXG60ZNV512G (RAID 0) | MSI GT63 Titan 8RG-046 CUK Cyclone 500GB M.2 NVMe | Lenovo Legion Y740-15ICHg Samsung SSD PM981 MZVLB256HAHQ | |
|---|---|---|---|---|---|---|
| AS SSD | -7% | -1% | -15% | -8% | -20% | |
| Seq Read (MB/s) | 2105 | 2955 40% | 1832 -13% | 1925 -9% | 2399 14% | 1953 -7% |
| Seq Write (MB/s) | 2493 | 2440 -2% | 1864 -25% | 2371 -5% | 1665 -33% | 1629 -35% |
| 4K Read (MB/s) | 25.01 | 40.56 62% | 52.1 108% | 37.2 49% | 49.17 97% | 33.2 33% |
| 4K Write (MB/s) | 108.7 | 118.6 9% | 108.3 0% | 108.9 0% | 87.7 -19% | 88.1 -19% |
| 4K-64 Read (MB/s) | 1604 | 1283 -20% | 1159 -28% | 1177 -27% | 1144 -29% | 757 -53% |
| 4K-64 Write (MB/s) | 1593 | 1538 -3% | 1807 13% | 1135 -29% | 648 -59% | 1501 -6% |
| Access Time Read * (ms) | 0.046 | 0.084 -83% | 0.05 -9% | 0.065 -41% | 0.05 -9% | 0.077 -67% |
| Access Time Write * (ms) | 0.102 | 0.032 69% | 0.034 67% | 0.108 -6% | 0.042 59% | 0.043 58% |
| Score Read (Points) | 1840 | 1619 -12% | 1394 -24% | 1407 -24% | 1433 -22% | 985 -46% |
| Score Write (Points) | 1951 | 1901 -3% | 2102 8% | 1481 -24% | 902 -54% | 1752 -10% |
| Score Total (Points) | 4743 | 4323 -9% | 4221 -11% | 3633 -23% | 3040 -36% | 3230 -32% |
| Copy ISO MB/s (MB/s) | 2250 | 1418 -37% | 2083 -7% | 2073 -8% | 1872 -17% | |
| Copy Program MB/s (MB/s) | 896 | 392.5 -56% | 496.5 -45% | 576 -36% | 478.2 -47% | |
| Copy Game MB/s (MB/s) | 1854 | 907 -51% | 977 -47% | 1426 -23% | 1165 -37% |
* ... smaller is better

GPU Performance
The GPU is performing where we expect it to be at within 4 percent of the average RTX 2070 Max-Q in our database taken from 16 other gaming laptops. Users can expect 15 to 20 percent slower performance than a regular mobile RTX 2070 or just 5 to 10 percent faster than a regular mobile RTX 2060. Users upgrading from the older mobile GTX 1060 will see a more significant graphics boost of 50 to 80 percent. We recommend enabling DX12 when gaming as Nvidia has optimized its Turing series for Microsoft's latest API.
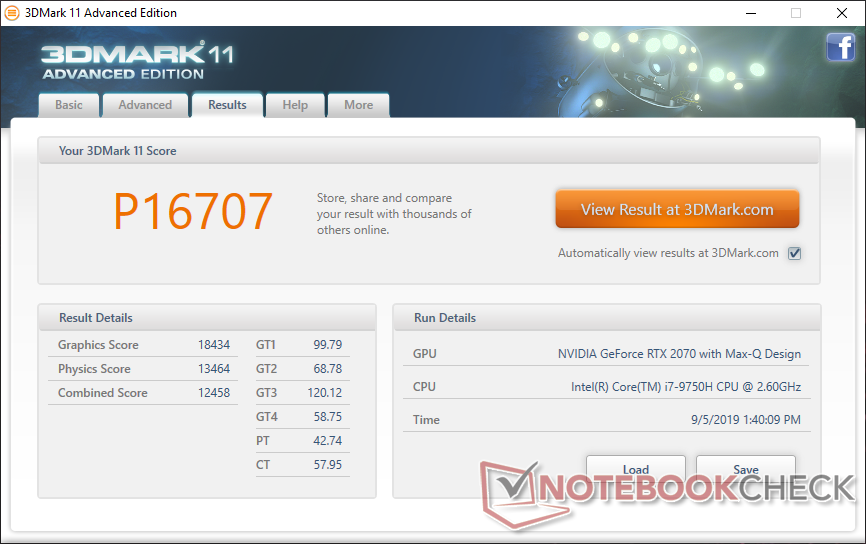
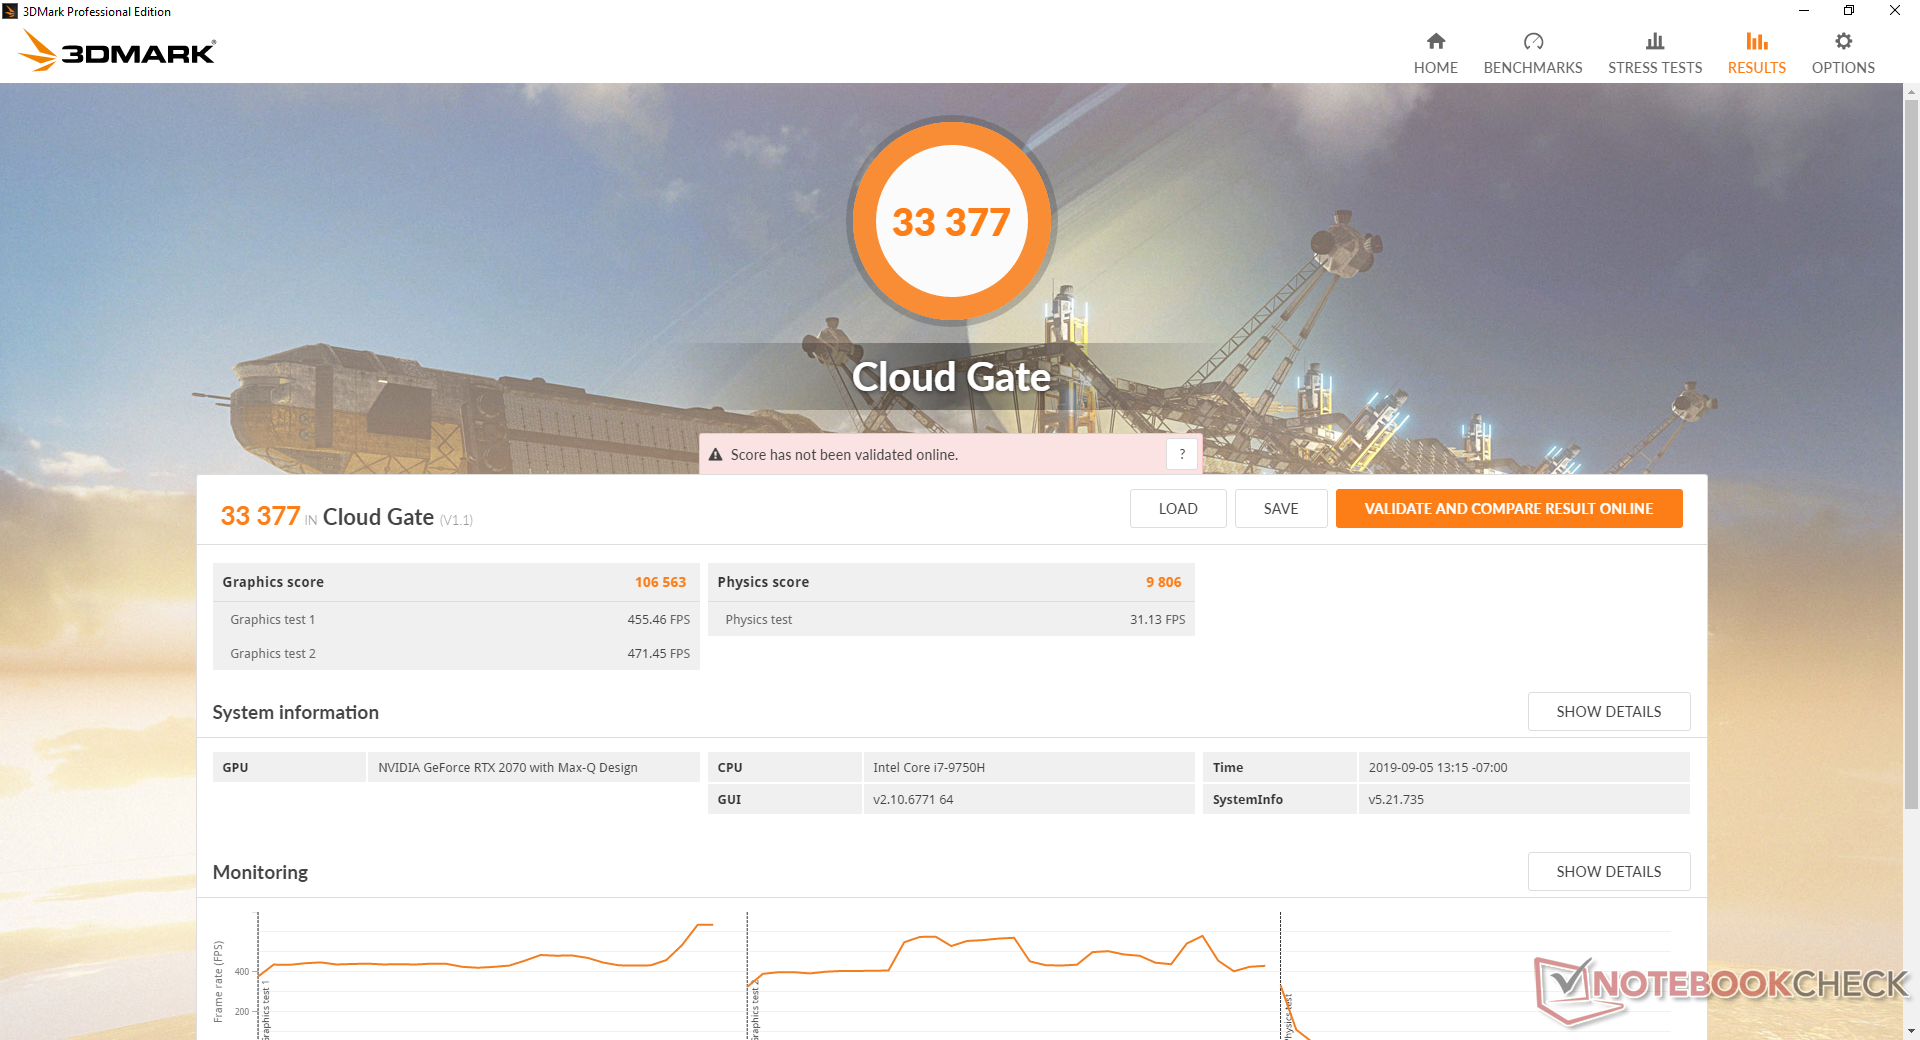
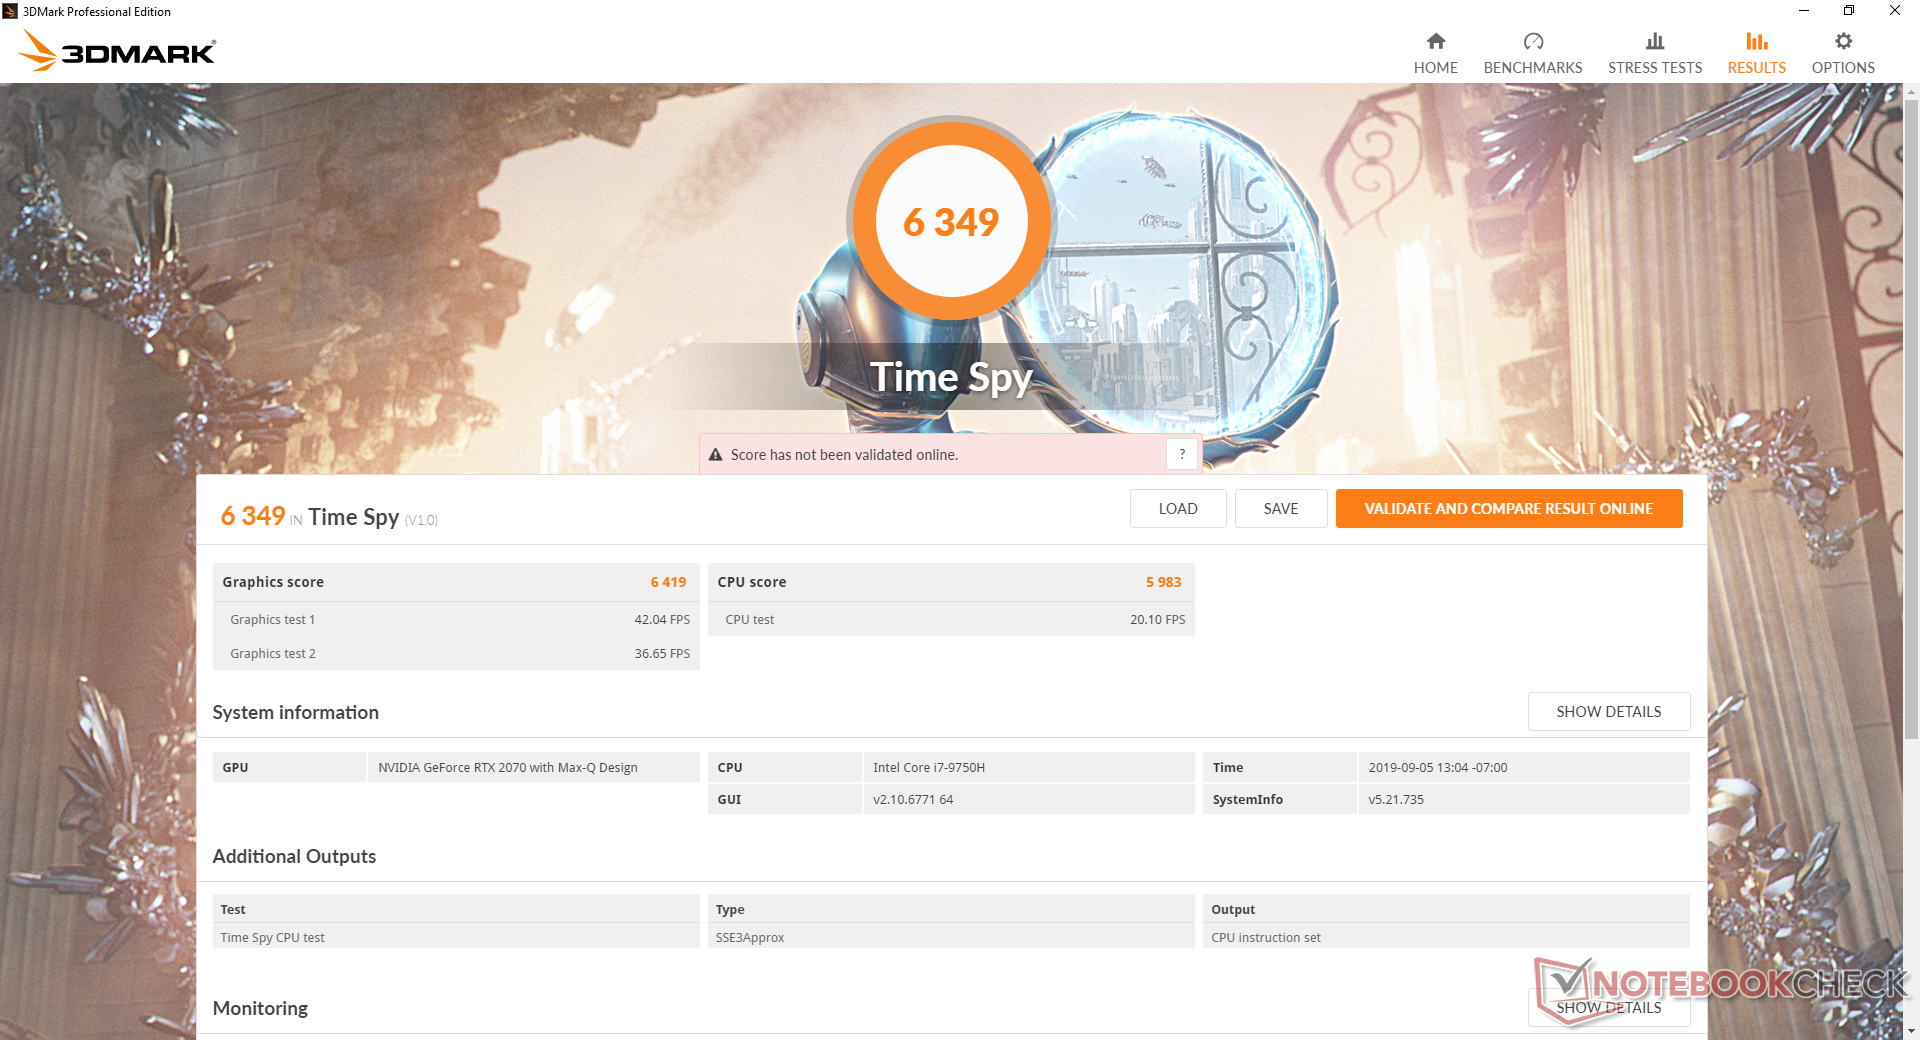
| 3DMark 11 Performance | 16707 points | |
| 3DMark Cloud Gate Standard Score | 33377 points | |
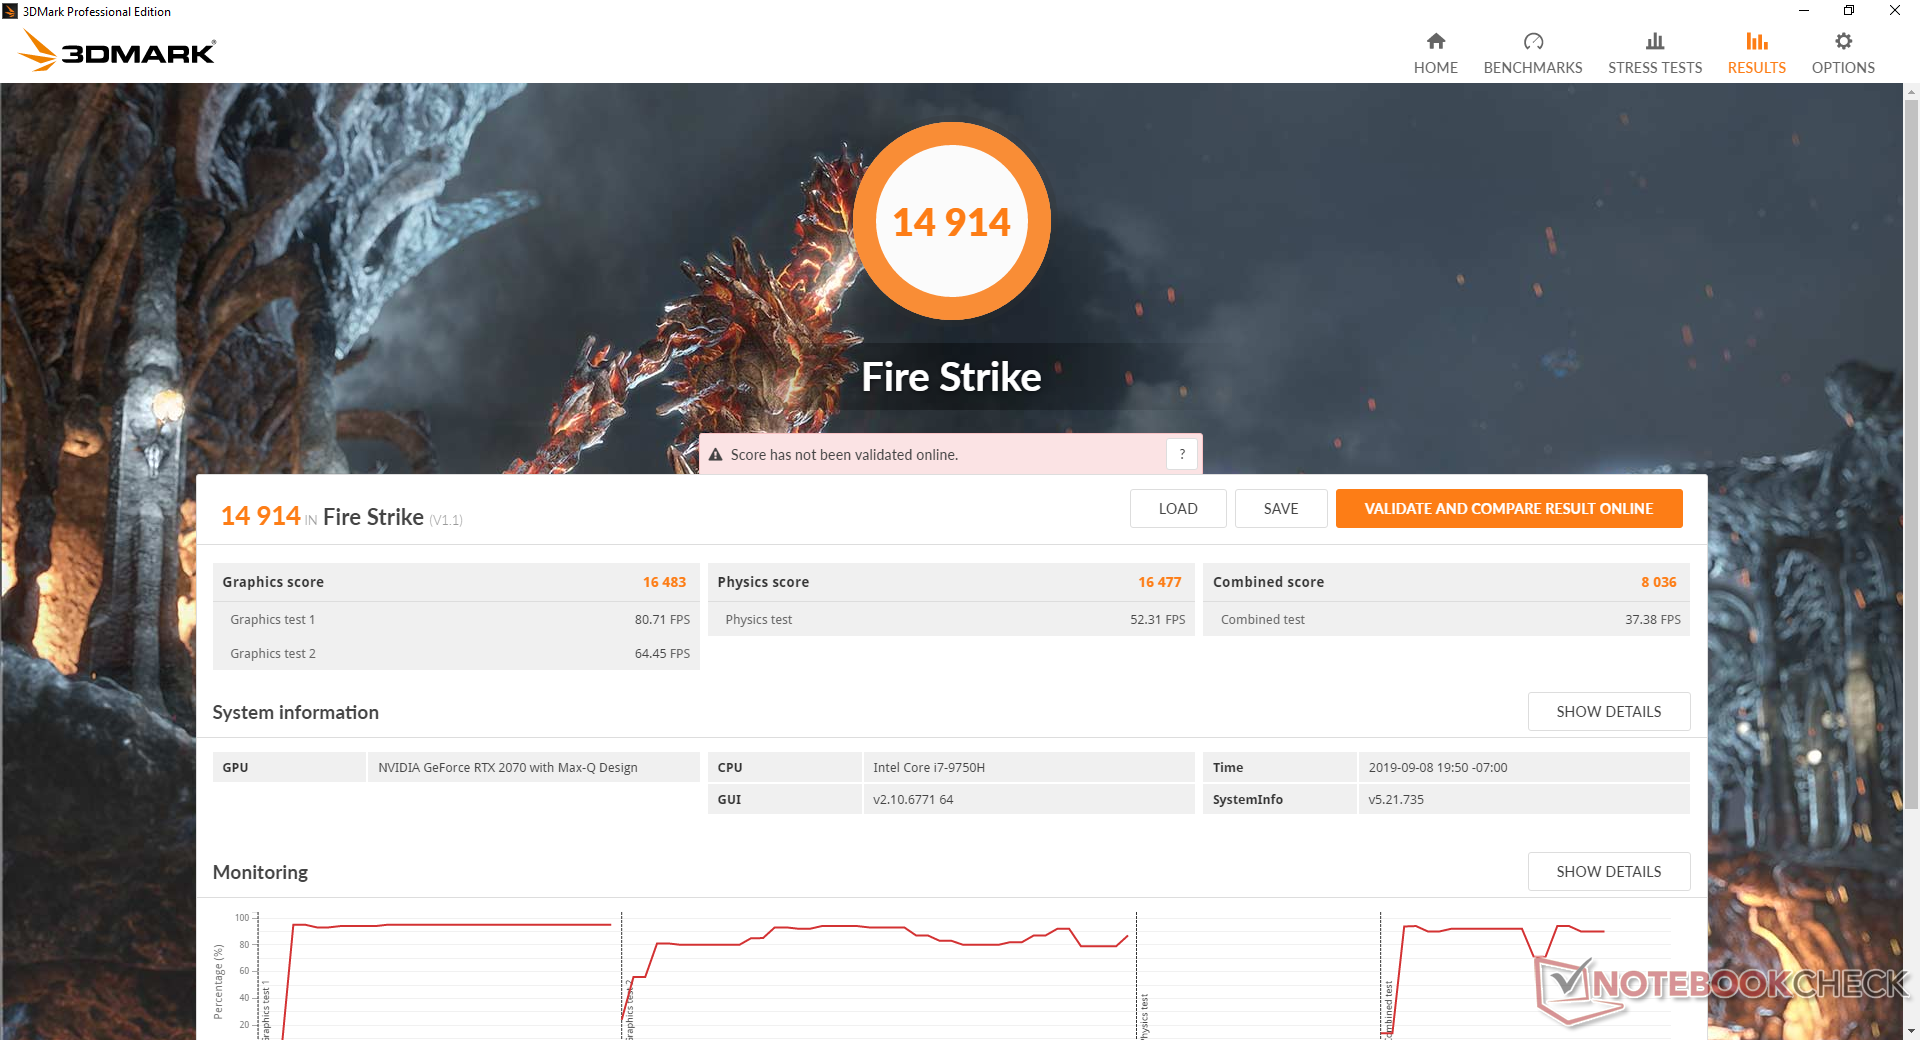
| 3DMark Fire Strike Score | 14914 points | |
| 3DMark Time Spy Score | 6349 points | |
Help | ||
Gaming Performance
The RTX 2070 Max-Q is powerful enough to play any title at the target 1080p resolution at 60 FPS or more. Reaching a stable 144 FPS will be easier on undemanding titles like Fortnite, Rocket League, or Overwatch, but you'll have to turn down more than a few settings on demanding titles like Witcher 3 or Shadow of the Tomb Raider. Keep in mind that you can still exploit the fast refresh rate of a 144 Hz panel with lower frame rates if need be.
See our dedicated page on the GeForce RTX 2070 Max-Q for more gaming benchmarks. Idling on Witcher 3 shows no frame dips to suggest no interrupting background activity while gaming.
| low | med. | high | ultra | |
|---|---|---|---|---|
| BioShock Infinite (2013) | 306.6 | 257.7 | 234.4 | 147.8 |
| The Witcher 3 (2015) | 295.3 | 222.9 | 136.6 | 69 |
| Shadow of the Tomb Raider (2018) | 128 | 98 | 91 | 83 |
Emissions
System Noise
The cooling solution consists of twin fans and four heat pipes between them. Both fans are always active no matter the load at about 30.5 dB(A). This may pulse to 31.5 dB(A) when browsing or streaming, but the noise never becomes bothersome during such undemanding loads.
Higher loads like gaming will induce a fan noise in the 49.5 to 53.4 dB(A) range to be very loud — louder than even the MSI GT63 Titan. We typically suggest wearing earphones when laptops crack the 50 dB(A) mark for a better gaming experience. Setting the system to the default Balanced mode will drop fan noise to a more manageable 46.5 dB(A).
We can notice no electronic noise or coil whine on our test unit.
| HP Omen X 2S 15-dg0075cl GeForce RTX 2070 Max-Q, i7-9750H, WDC PC SN720 SDAPNTW-1T00 | HP Omen 15-dc1020ng GeForce GTX 1650 Mobile, i5-9300H, WDC PC SN720 SDAQNTW-512G | Razer Blade 15 RTX 2080 Max-Q GeForce RTX 2080 Max-Q, i7-9750H, Samsung SSD PM981 MZVLB512HAJQ | Alienware m15 R2 P87F GeForce RTX 2080 Max-Q, i7-9750H, 2x Toshiba XG6 KXG60ZNV512G (RAID 0) | MSI GT63 Titan 8RG-046 GeForce GTX 1080 Mobile, i7-8750H, CUK Cyclone 500GB M.2 NVMe | Lenovo Legion Y740-15ICHg GeForce RTX 2070 Max-Q, i7-8750H, Samsung SSD PM981 MZVLB256HAHQ | |
|---|---|---|---|---|---|---|
| Noise | 11% | 9% | -9% | 3% | 5% | |
| off / environment * (dB) | 29 | 28.8 1% | 28.3 2% | 28.3 2% | 28 3% | 28 3% |
| Idle Minimum * (dB) | 30.5 | 28.8 6% | 28.8 6% | 28.5 7% | 31.4 -3% | 32.6 -7% |
| Idle Average * (dB) | 31.5 | 29.5 6% | 28.8 9% | 28.5 10% | 31.4 -0% | 32.7 -4% |
| Idle Maximum * (dB) | 31.5 | 31.1 1% | 29 8% | 49 -56% | 32.2 -2% | 32.7 -4% |
| Load Average * (dB) | 40.6 | 35.2 13% | 33.5 17% | 49 -21% | 35.5 13% | 33.3 18% |
| Witcher 3 ultra * (dB) | 49.5 | 35.2 29% | 45 9% | 49 1% | 47.6 4% | 41.6 16% |
| Load Maximum * (dB) | 53.4 | 41 23% | 45.2 15% | 55 -3% | 50.8 5% | 45.2 15% |
* ... smaller is better
Noise level
| Idle |
| 30.5 / 31.5 / 31.5 dB(A) |
| Load |
| 40.6 / 53.4 dB(A) |
 | ||
30 dB silent 40 dB(A) audible 50 dB(A) loud |
||
min: | ||
Temperature
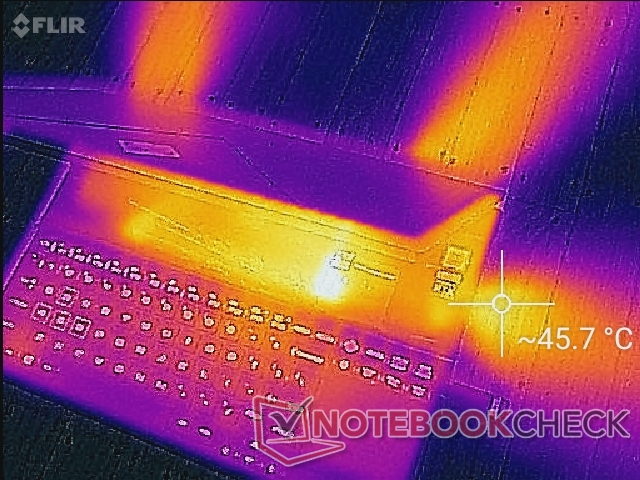
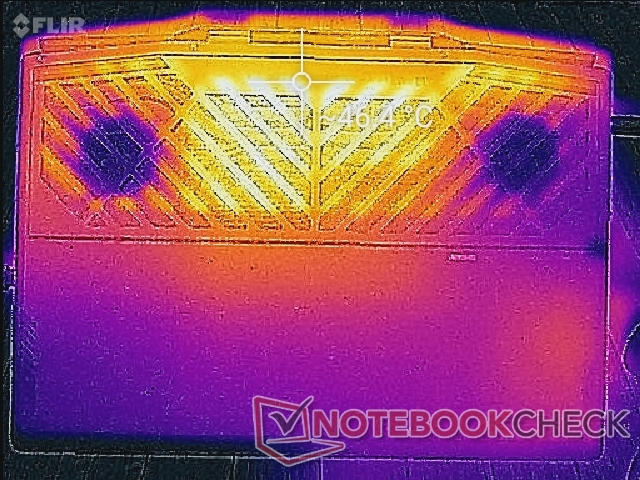
Surface temperatures are warmer than expected even when idling on desktop likely due to the poor power consumption of the system as we will note in our Power Consumption section. Hot spots along the rear can be as warm as 40 C to 45 C without much onscreen activity whereas most other laptops tend to hover in the low 30 C range under the same idling conditions.
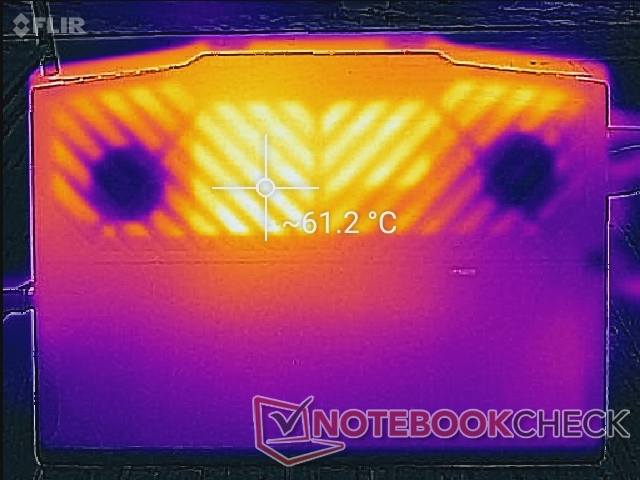
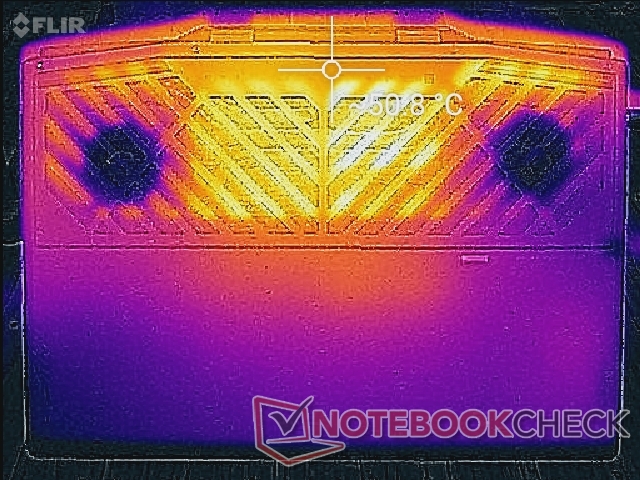
Running higher loads like gaming will induce hot spots of over 50 C not unlike on the Alienware m15 R2. In this case, HP has the advantage since its keyboard keys are pushed upfront to be away from the heat pipes and processors. Each and every keyboard key remains cool no matter the workload as a result.
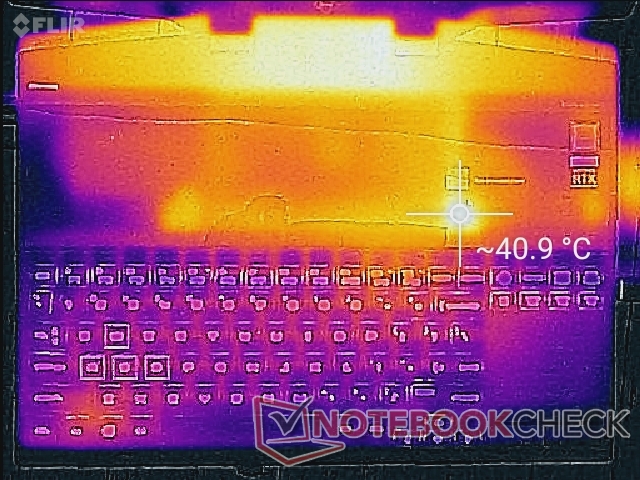
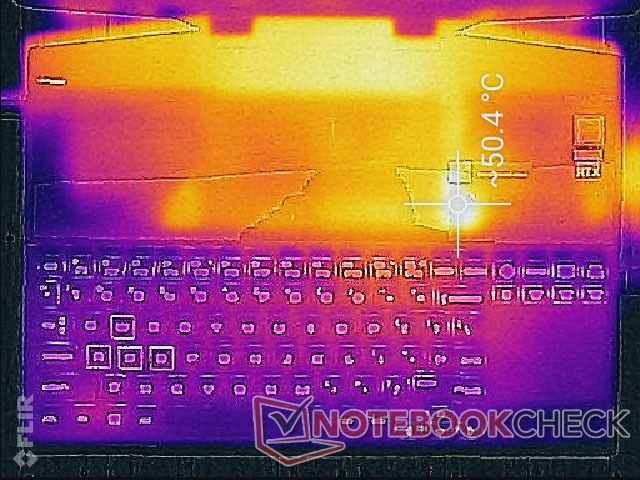
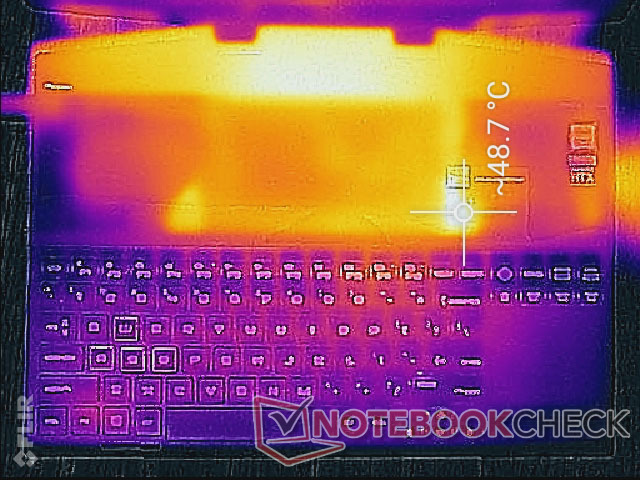
(-) The maximum temperature on the upper side is 48.8 °C / 120 F, compared to the average of 40.4 °C / 105 F, ranging from 21.2 to 68.8 °C for the class Gaming.
(-) The bottom heats up to a maximum of 55 °C / 131 F, compared to the average of 43.2 °C / 110 F
(±) In idle usage, the average temperature for the upper side is 35.3 °C / 96 F, compared to the device average of 33.9 °C / 93 F.
(-) Playing The Witcher 3, the average temperature for the upper side is 38.2 °C / 101 F, compared to the device average of 33.9 °C / 93 F.
(+) The palmrests and touchpad are reaching skin temperature as a maximum (34 °C / 93.2 F) and are therefore not hot.
(-) The average temperature of the palmrest area of similar devices was 28.8 °C / 83.8 F (-5.2 °C / -9.4 F).
Stress Test
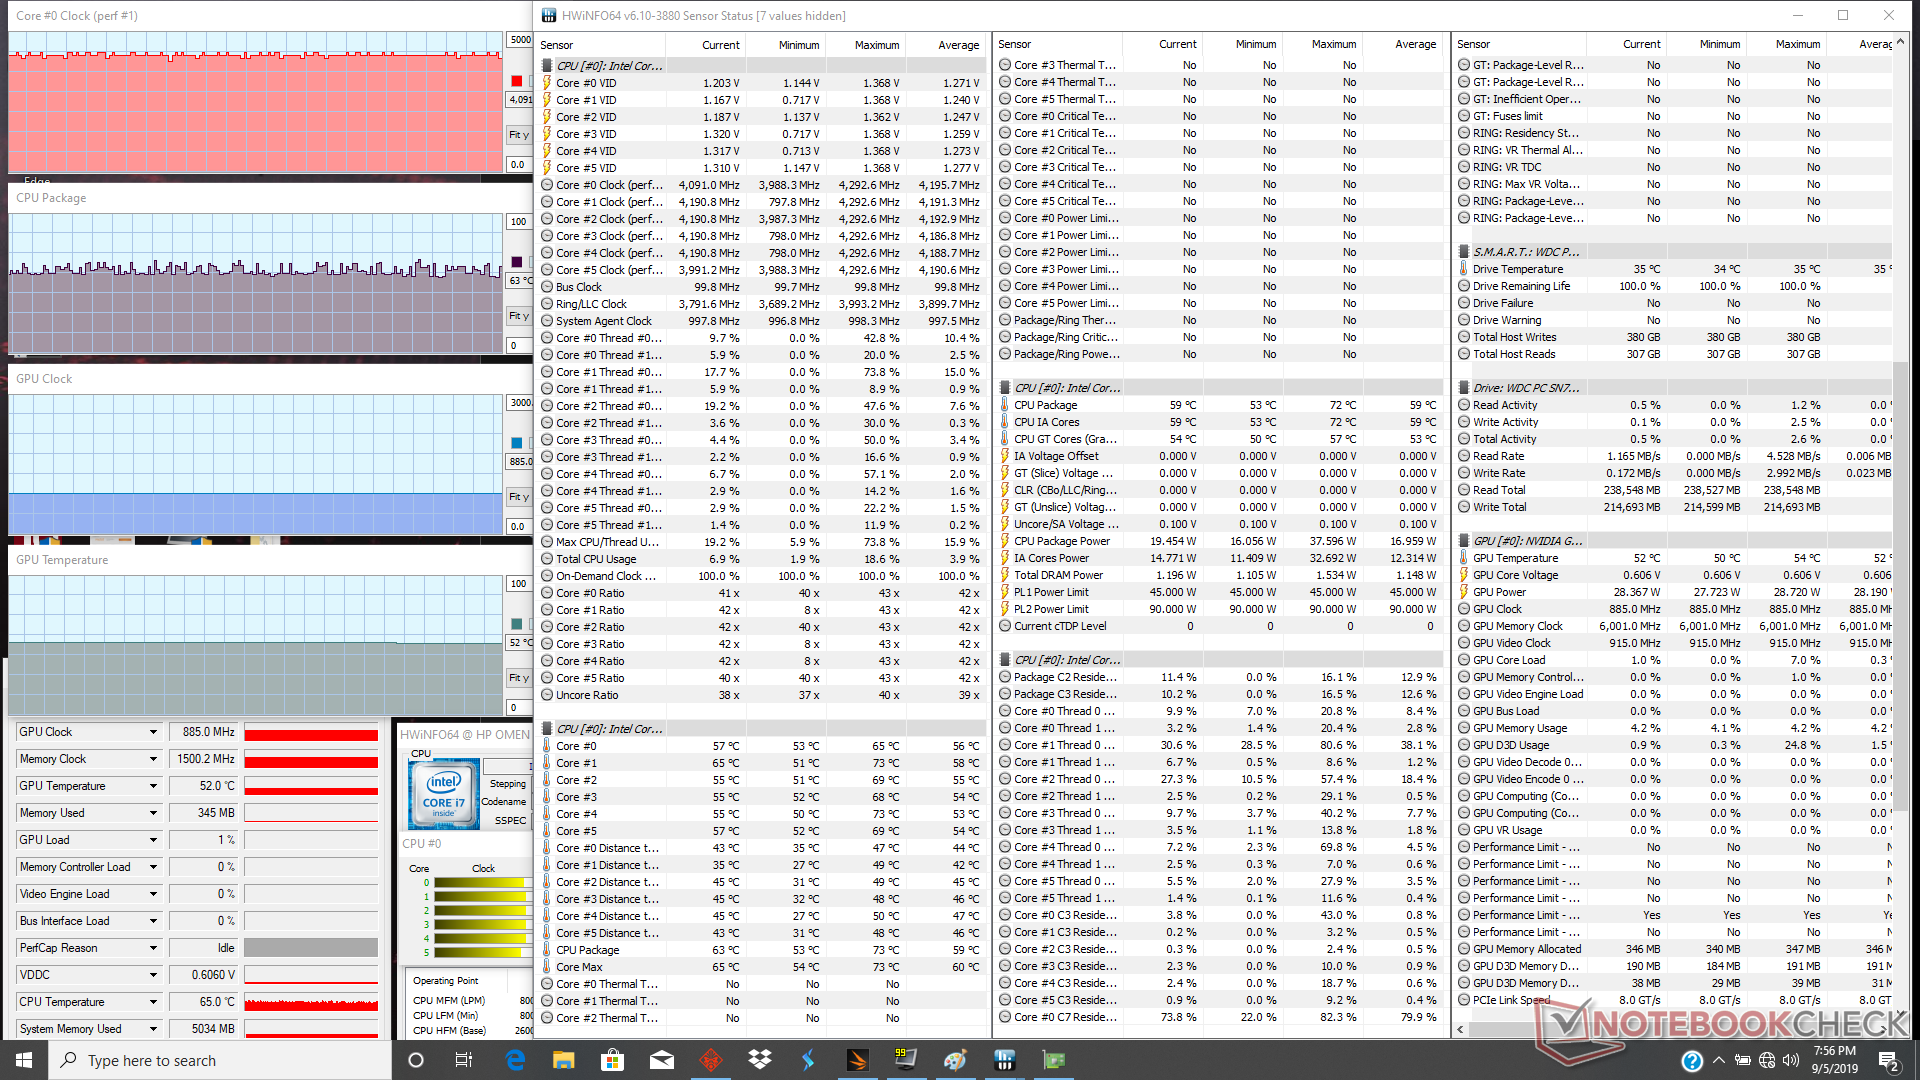
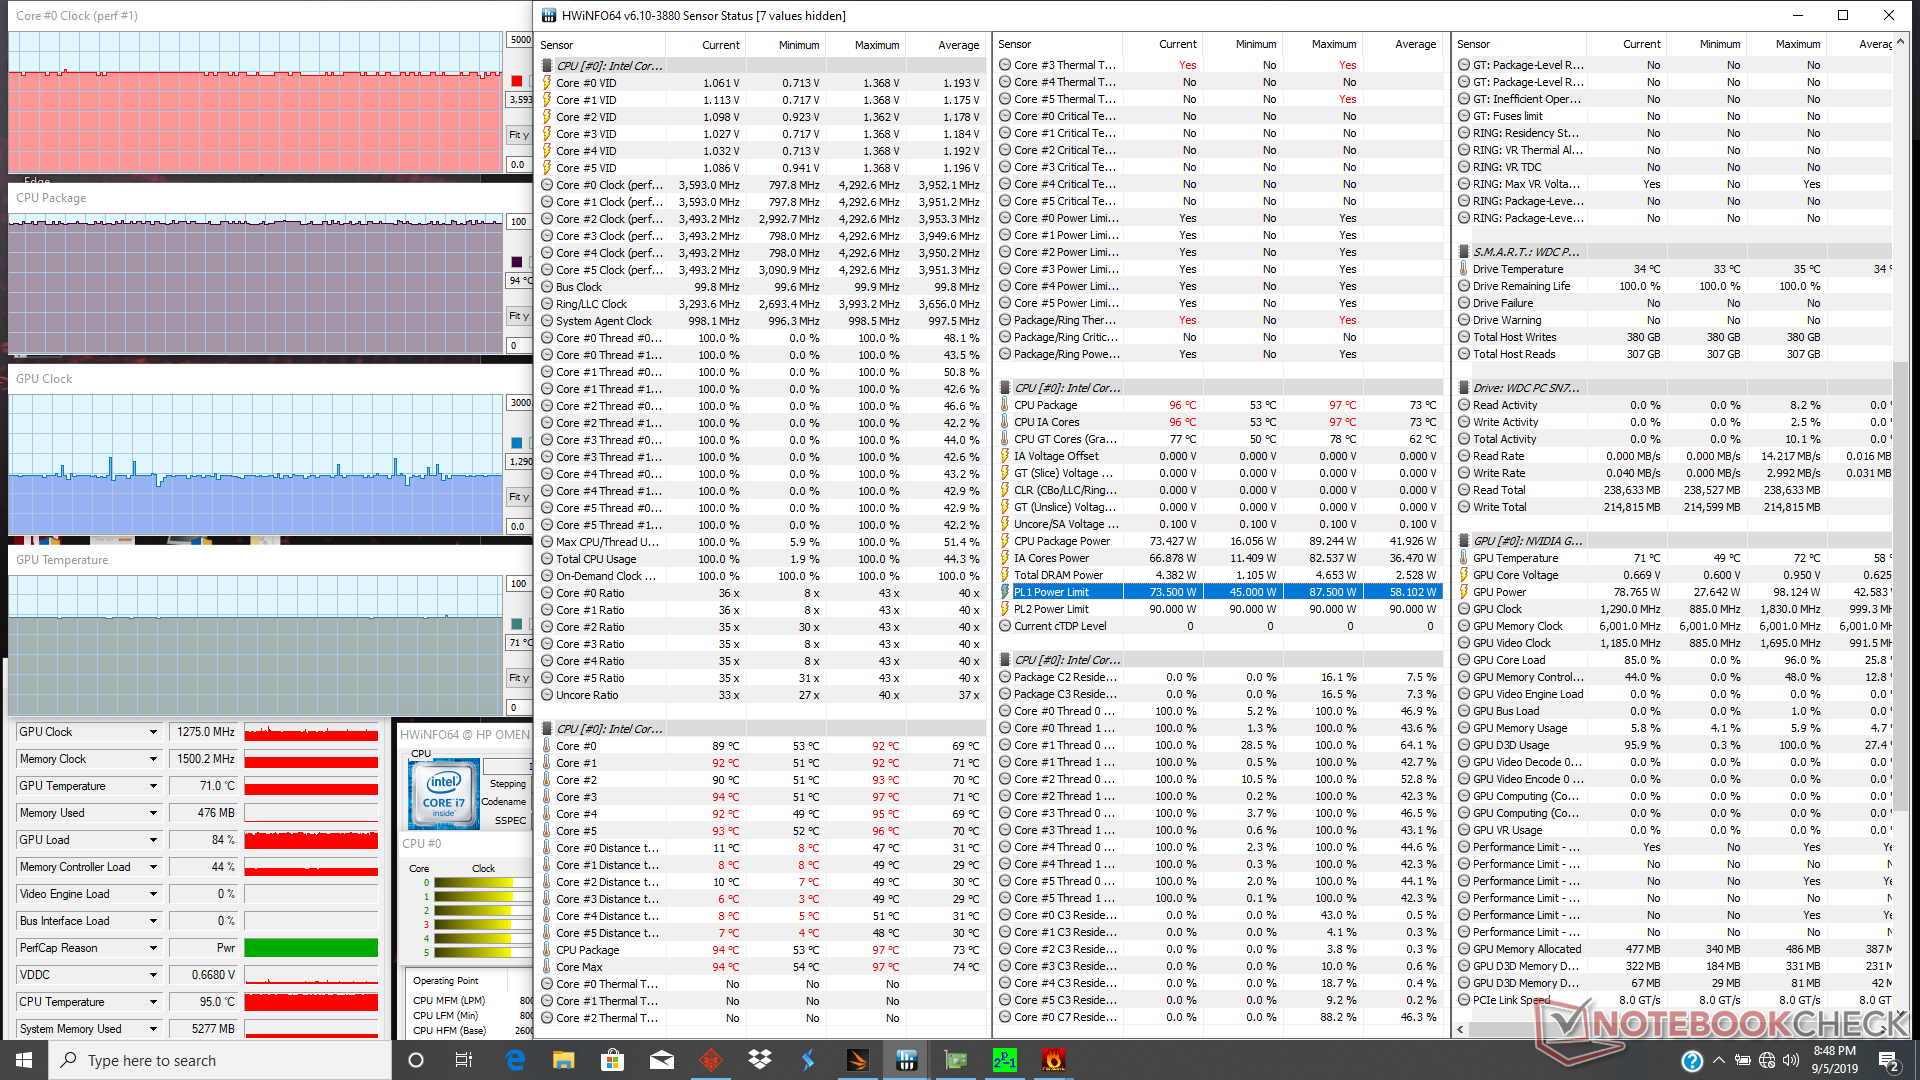
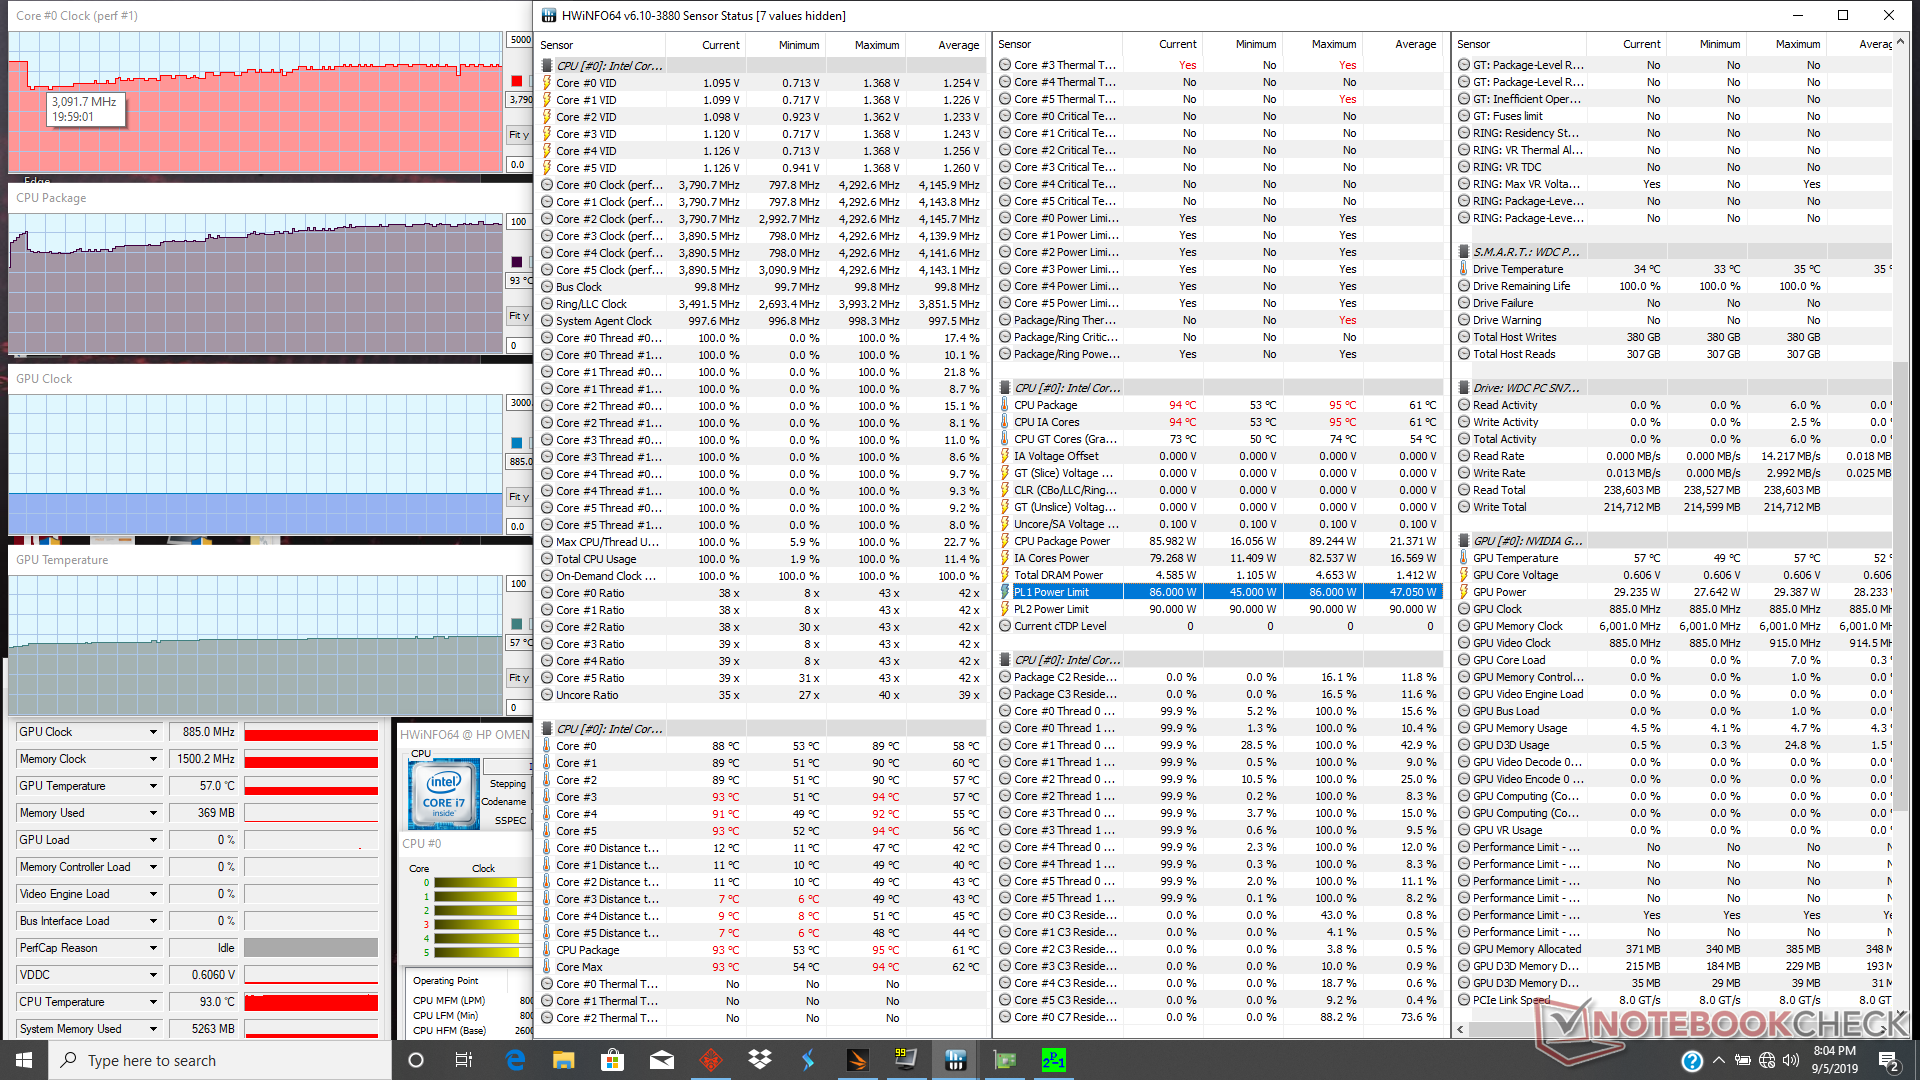
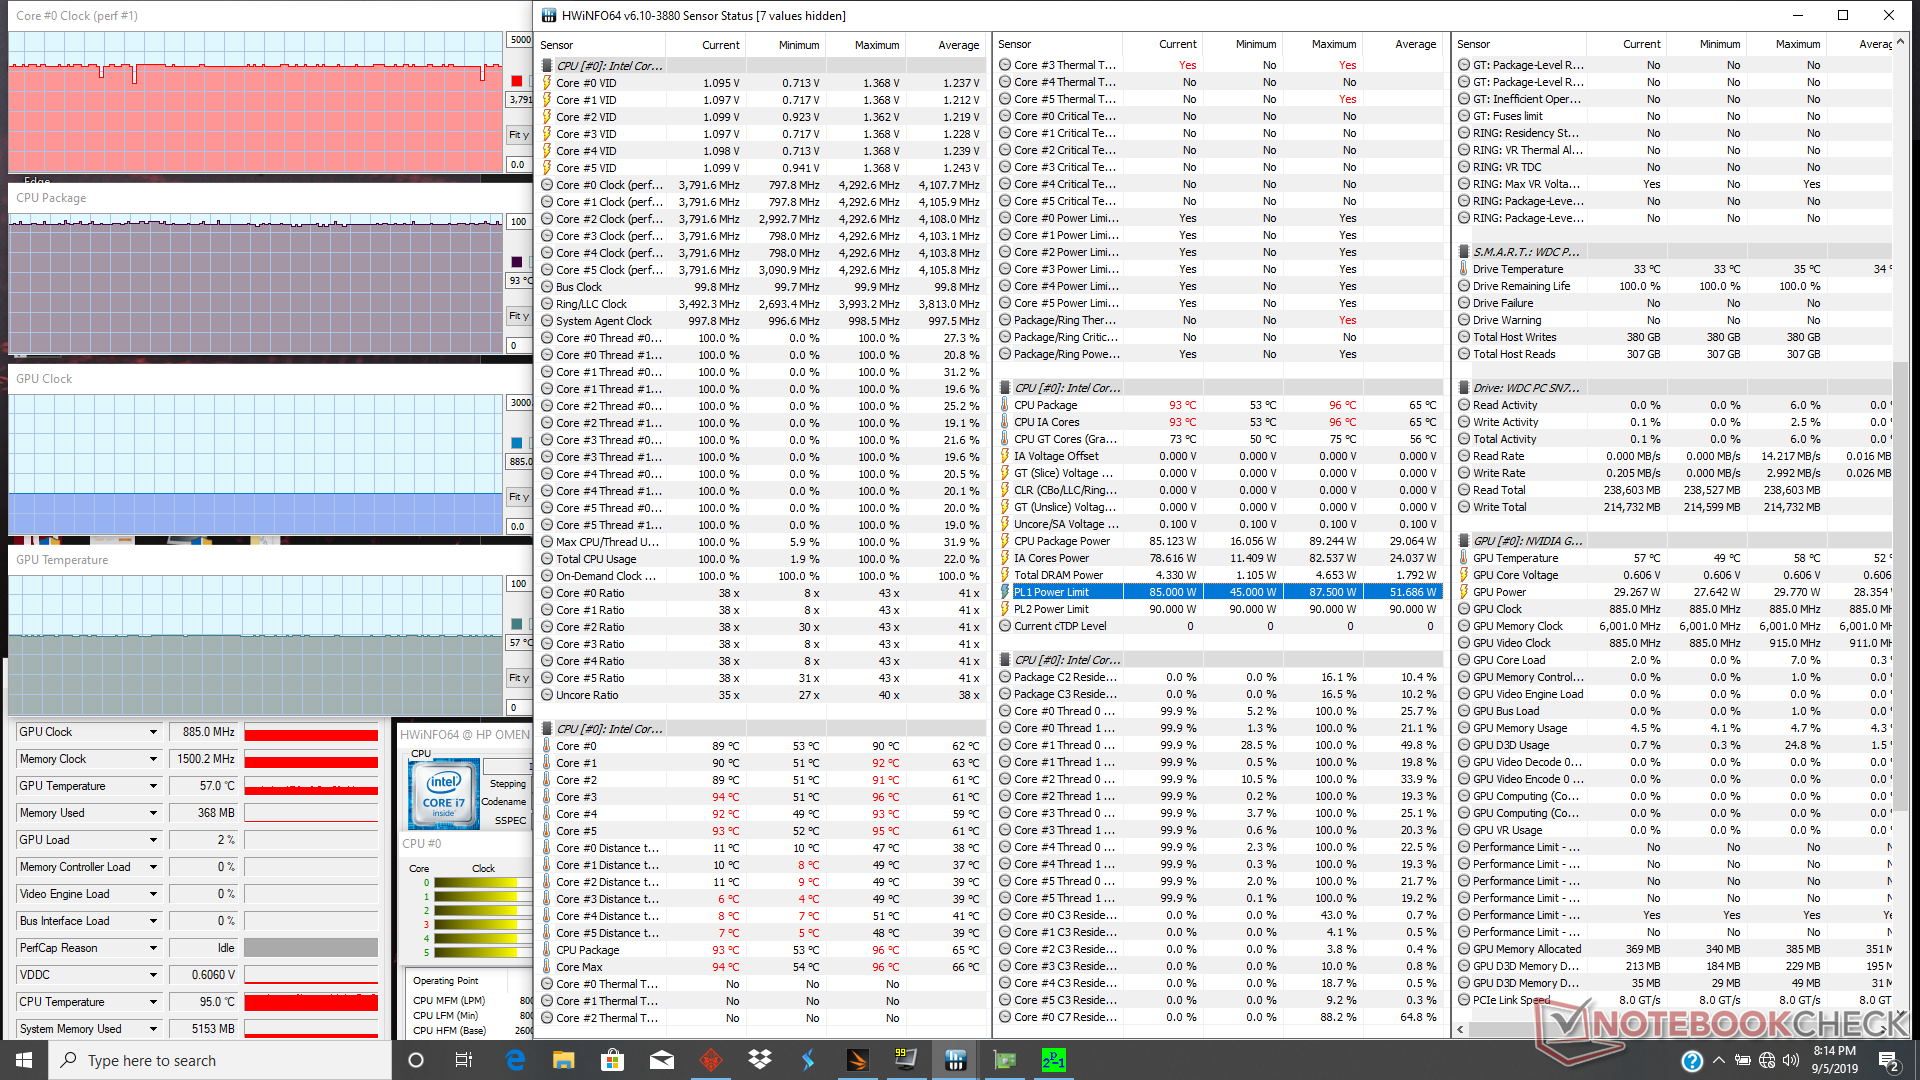
We stress the system with synthetic loads to identify for any potential throttling or stability issues. When running Prime95, clock rate jumps to 4.0 GHz for a few seconds until core temperature hits 88 C. Thereafter, clock rates drop to 3 GHz for a cooler core temperature of 73 C. Instead of maintaining these values, however, both clock rates and temperature will begin to slowly creep higher and higher until plateauing at 3.8 GHz and 93 C. When running both Prime95 and FurMark, CPU and GPU temperatures will stabilize at 94 C and 71 C, respectively.
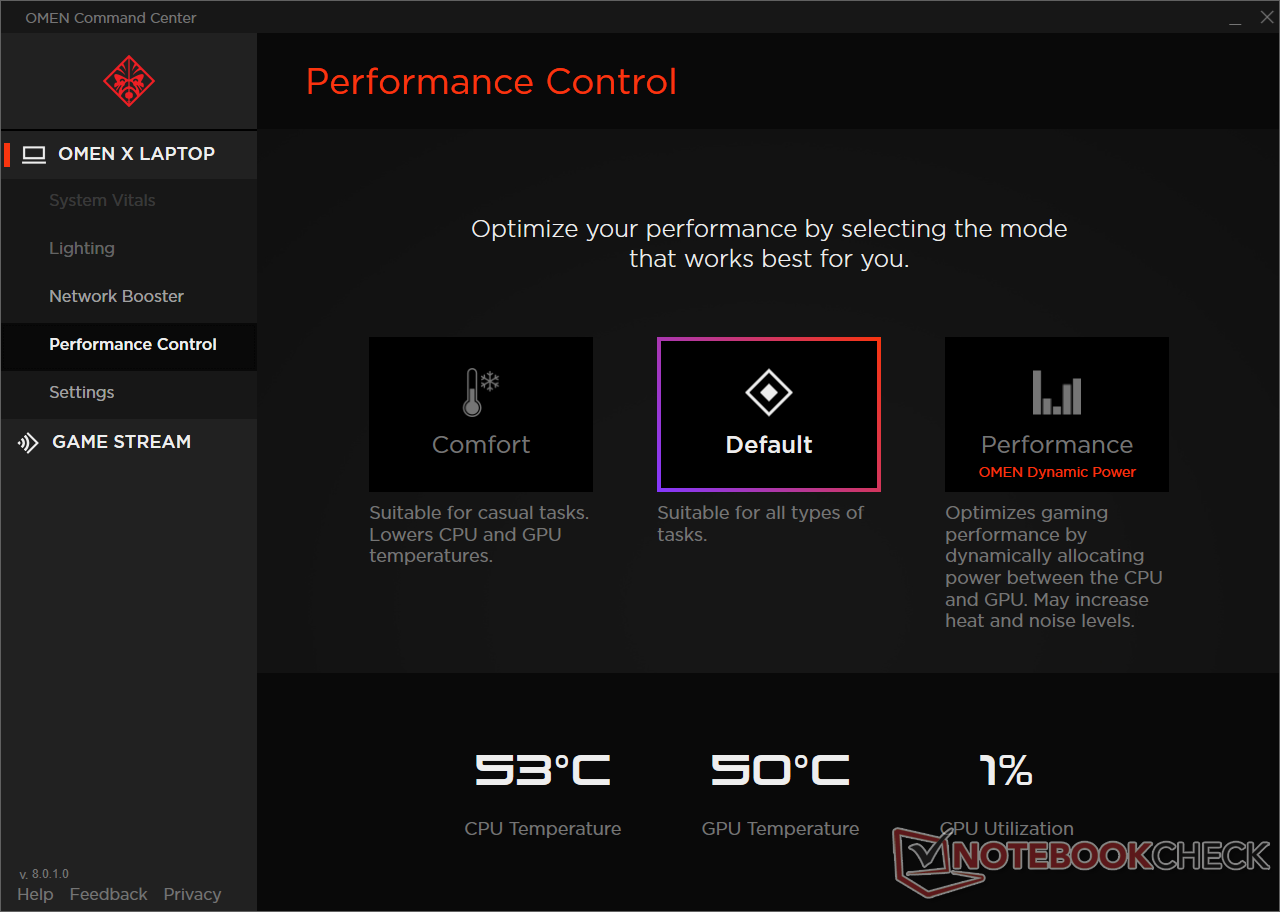
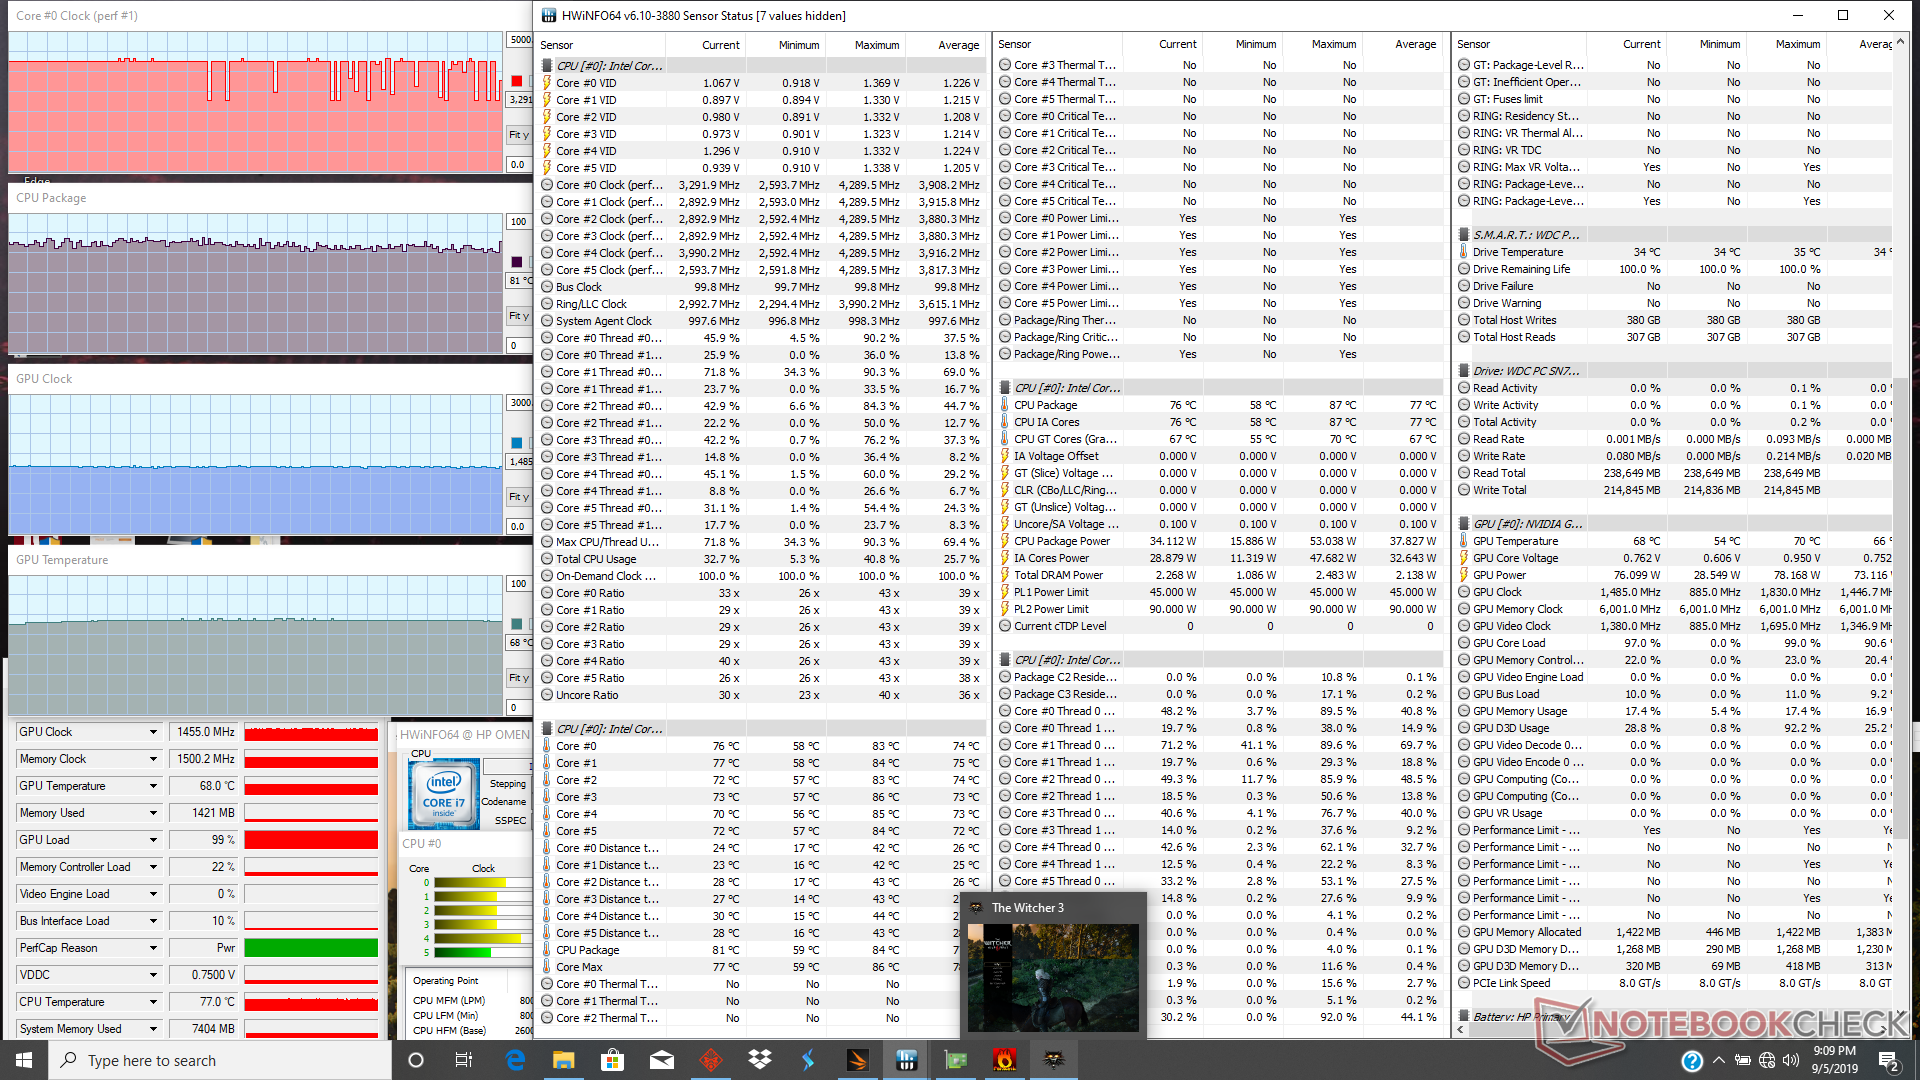
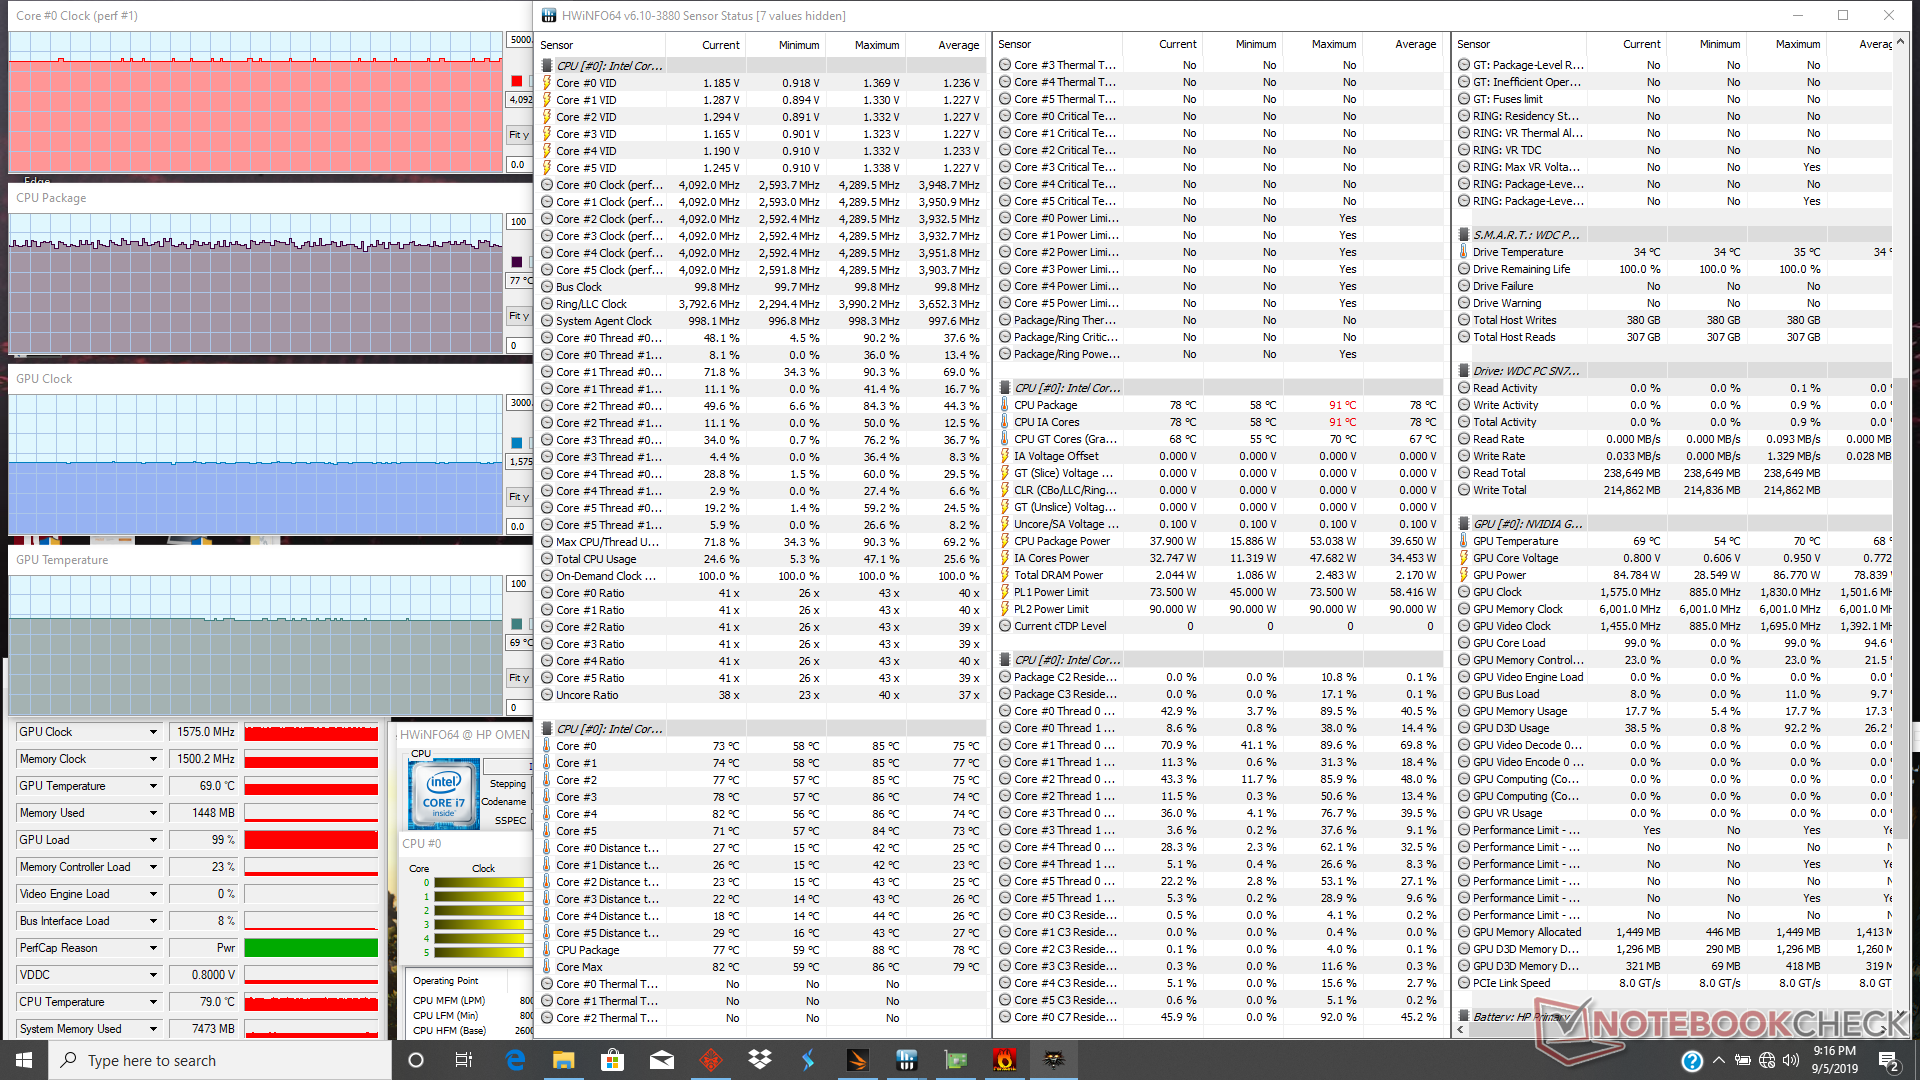
Running Witcher 3 is more representative of real-world gaming loads. When on the Default Balanced mode, the GPU stabilizes at 1455 MHz while the CPU can range from 2.5 to 4.0 GHz. When on Turbo mode, the CPU maintains a tighter 4.0 to 4.1 GHz range while the GPU stabilizes at a higher clock rate of 1575 MHz as shown by our table and screenshots below. CPU and GPU temperature between these two modes are about the same despite the clock rate differences since Turbo mode raises the fan noise ceiling.
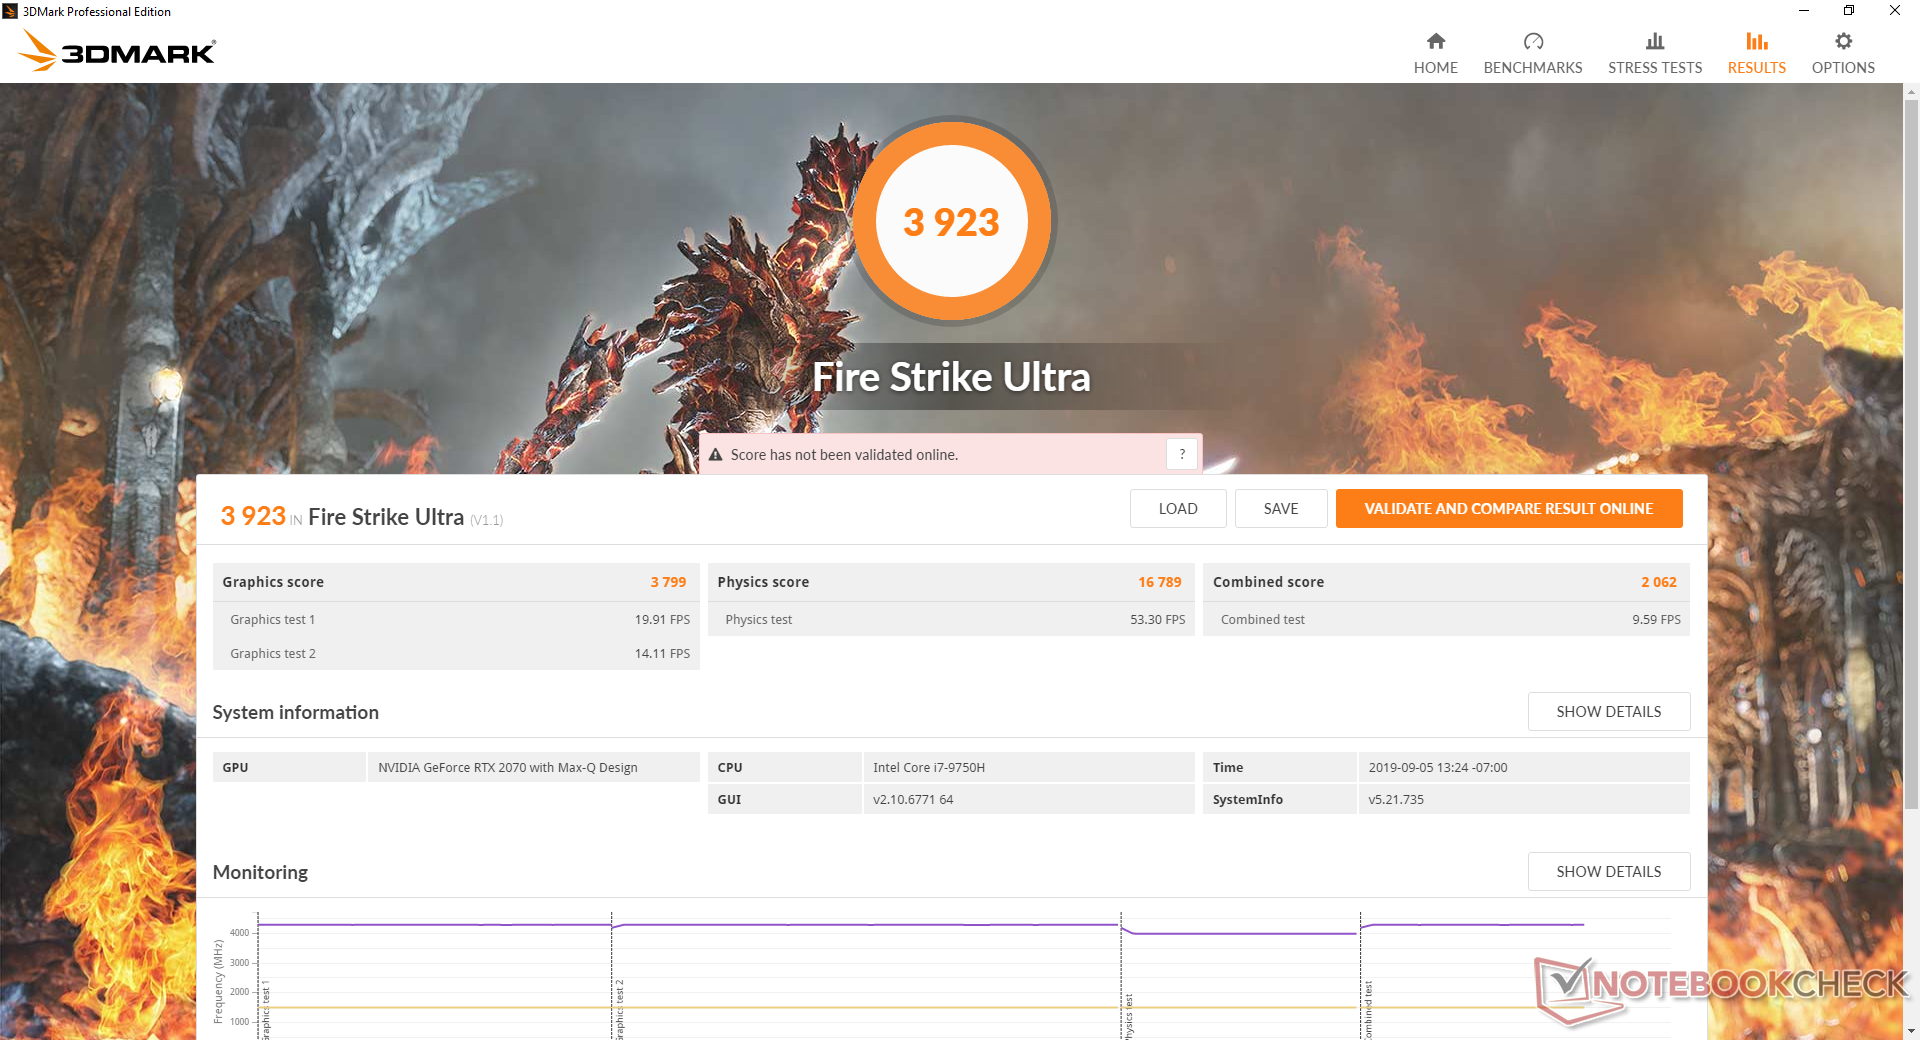
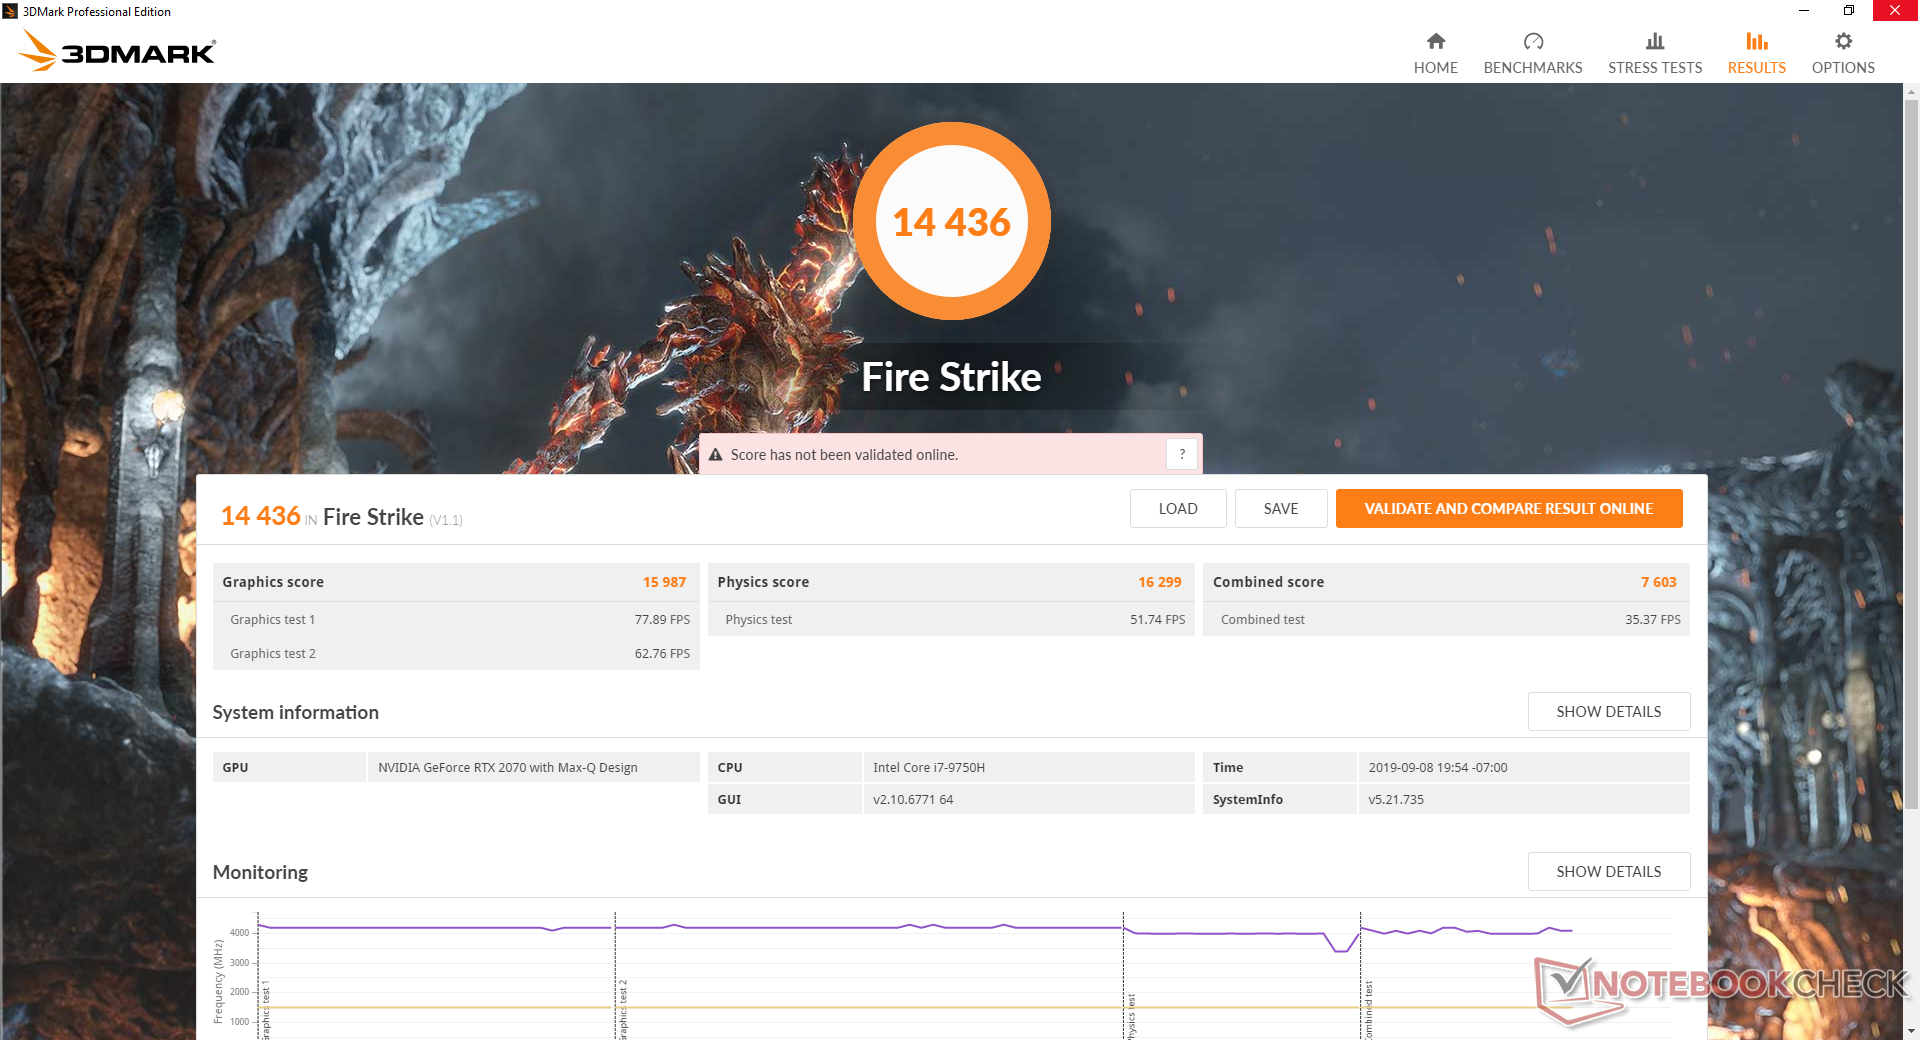
Running on battery power will limit performance. A Fire Strike run on batteries returns Physics and Graphics scores of 9592 and 5607 points, respectively, compared to 16477 and 16483 points when on mains.
| CPU Clock (GHz) | GPU Clock (MHz) | Average CPU Temperature (°C) | Average GPU Temperature (°C) | |
| System Idle | -- | -- | ~63 | 52 |
| Prime95 Stress | ~3.8 | -- | 93 | -- |
| Prime95 + FurMark Stress | ~3.6 | 1275 | 94 | 71 |
| Witcher 3 Stress (Default Fan mode) | ~2.5 - 4.0 | 1455 | 81 | 68 |
| Witcher 3 Stress (Turbo Fan mode) | 4.0 - 4.1 | 1575 | 77 | 69 |
Speakers
The integrated Bang & Olufsen speakers are sufficiently loud for personal use while lacking in bass as one would expect. Perhaps a dedicated subwoofer would have improved the audio experience.
High volume settings will cause the left and right sides of the keyboard to vibrate slightly which can be a little annoying if you have fingers on the WASD keys.


HP Omen X 2S 15-dg0075cl audio analysis
(±) | speaker loudness is average but good (80.5 dB)
Bass 100 - 315 Hz
(-) | nearly no bass - on average 16.8% lower than median
(±) | linearity of bass is average (12.2% delta to prev. frequency)
Mids 400 - 2000 Hz
(±) | reduced mids - on average 5.5% lower than median
(±) | linearity of mids is average (10.7% delta to prev. frequency)
Highs 2 - 16 kHz
(+) | balanced highs - only 2.5% away from median
(±) | linearity of highs is average (7.7% delta to prev. frequency)
Overall 100 - 16.000 Hz
(±) | linearity of overall sound is average (21.8% difference to median)
Compared to same class
» 78% of all tested devices in this class were better, 6% similar, 16% worse
» The best had a delta of 6%, average was 18%, worst was 132%
Compared to all devices tested
» 62% of all tested devices were better, 7% similar, 31% worse
» The best had a delta of 4%, average was 23%, worst was 134%
Apple MacBook 12 (Early 2016) 1.1 GHz audio analysis
(+) | speakers can play relatively loud (83.6 dB)
Bass 100 - 315 Hz
(±) | reduced bass - on average 11.3% lower than median
(±) | linearity of bass is average (14.2% delta to prev. frequency)
Mids 400 - 2000 Hz
(+) | balanced mids - only 2.4% away from median
(+) | mids are linear (5.5% delta to prev. frequency)
Highs 2 - 16 kHz
(+) | balanced highs - only 2% away from median
(+) | highs are linear (4.5% delta to prev. frequency)
Overall 100 - 16.000 Hz
(+) | overall sound is linear (10.2% difference to median)
Compared to same class
» 7% of all tested devices in this class were better, 2% similar, 90% worse
» The best had a delta of 5%, average was 18%, worst was 53%
Compared to all devices tested
» 5% of all tested devices were better, 1% similar, 94% worse
» The best had a delta of 4%, average was 23%, worst was 134%
Energy Management
Power Consumption
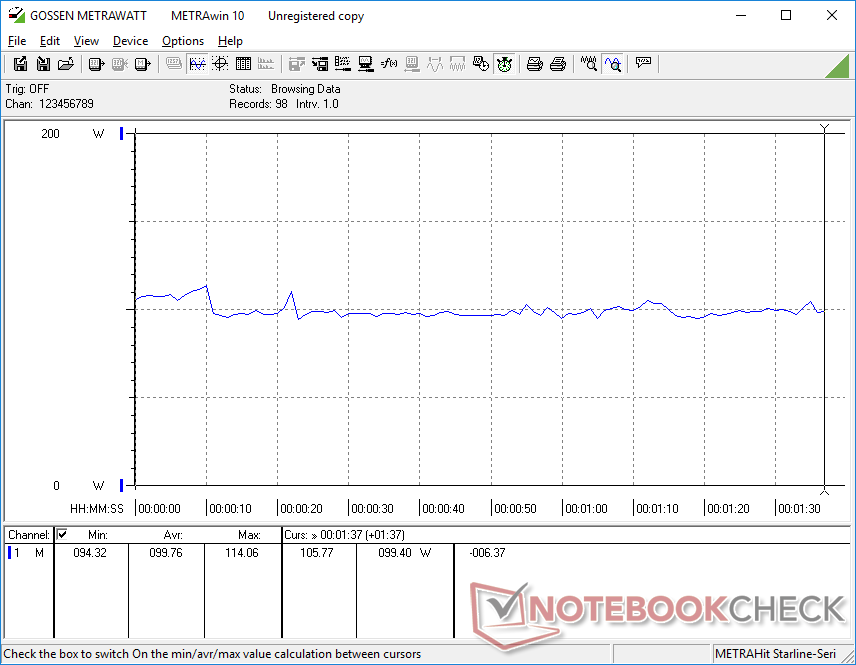
This HP system is not power efficient at the slightest. Merely idling on desktop draws anywhere between 46 W to 66 W depending on the power profile and brightness setting. Disabling the second screen barely makes a dent. In comparison, the basic Omen 15 draws only 4 W to 12 W when subjected to the same conditions. These high idling consumption rates are likely directly responsible for the poor battery life results in the next section below.
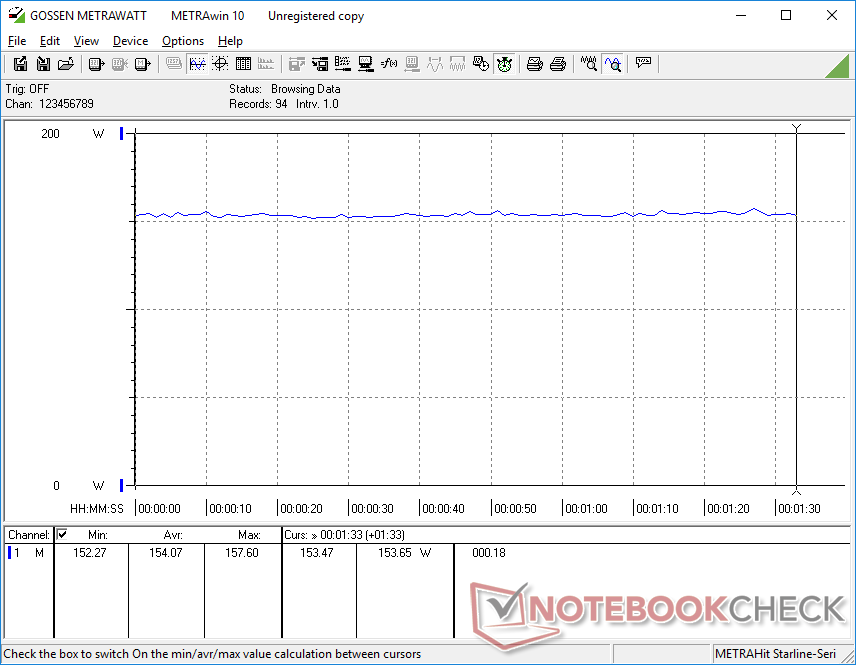
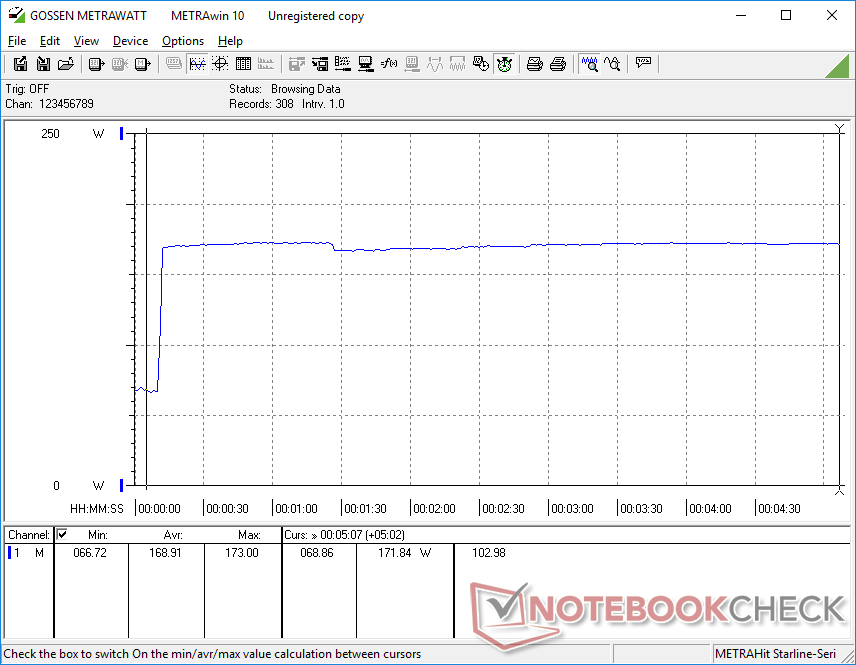
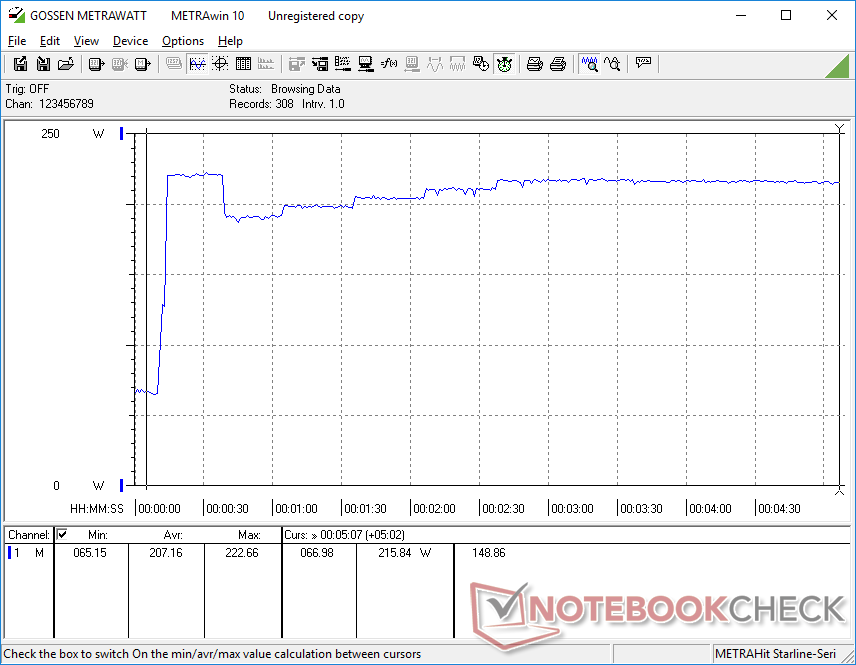
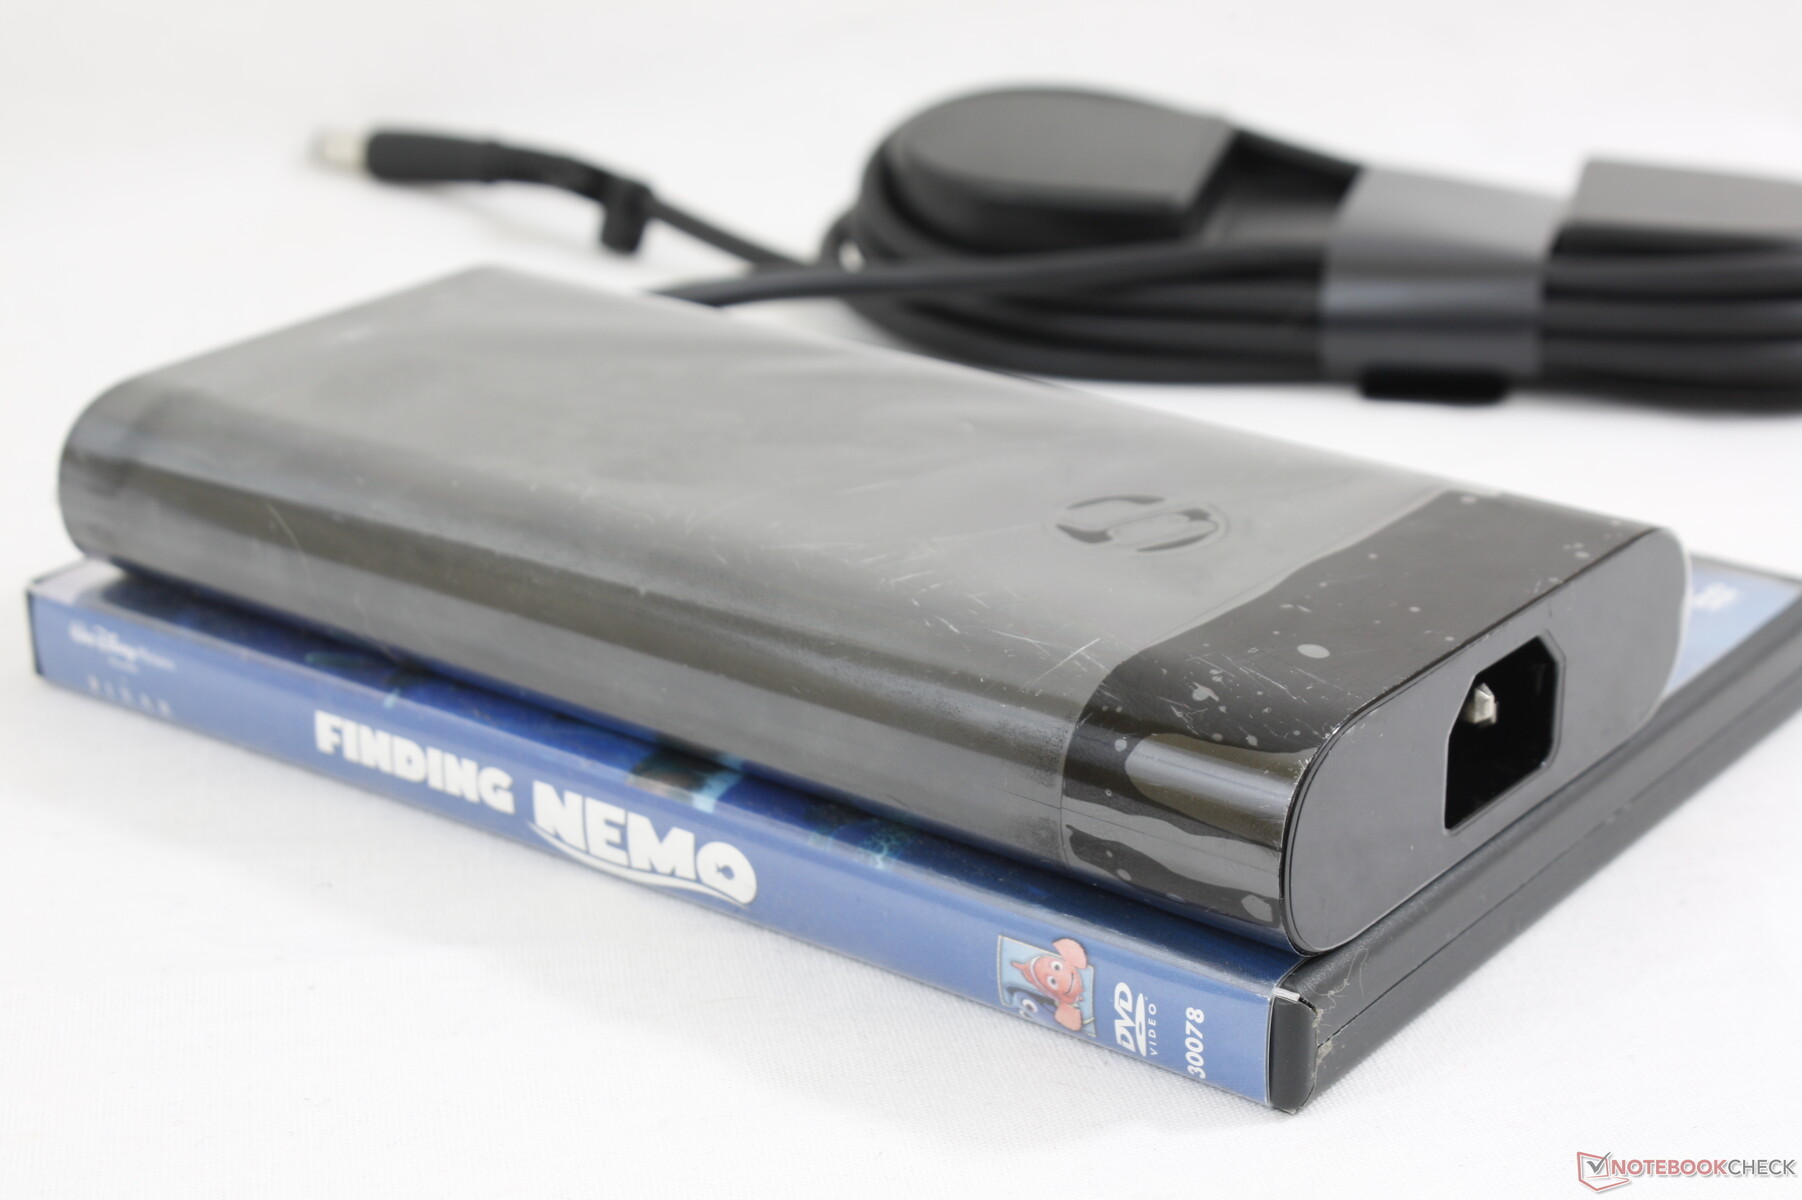
When gaming, power consumption becomes more normal for the CPU and GPU class at 154 W. The Lenovo Legion Y740 with the same Core i7 and RTX 2070 Max-Q specifications, for example, is within 5 to 10 percent of our HP. Running both Prime95 and FurMark simultaneously results in a maximum consumption of 222.7 W from the medium-large (~18 x 8.8 x 2.8 cm) 230 W AC adapter.
| Off / Standby | |
| Idle | |
| Load |
|
Key:
min: | |
| HP Omen X 2S 15-dg0075cl i7-9750H, GeForce RTX 2070 Max-Q, WDC PC SN720 SDAPNTW-1T00, IPS, 1920x1080, 15.6" | HP Omen 15-dc1020ng i5-9300H, GeForce GTX 1650 Mobile, WDC PC SN720 SDAQNTW-512G, IPS, 1920x1080, 15.6" | Razer Blade 15 RTX 2080 Max-Q i7-9750H, GeForce RTX 2080 Max-Q, Samsung SSD PM981 MZVLB512HAJQ, IPS, 1920x1080, 15.6" | Alienware m15 R2 P87F i7-9750H, GeForce RTX 2080 Max-Q, 2x Toshiba XG6 KXG60ZNV512G (RAID 0), IPS, 1920x1080, 15.6" | MSI GT63 Titan 8RG-046 i7-8750H, GeForce GTX 1080 Mobile, CUK Cyclone 500GB M.2 NVMe, TN, 1920x1080, 15.6" | Lenovo Legion Y740-15ICHg i7-8750H, GeForce RTX 2070 Max-Q, Samsung SSD PM981 MZVLB256HAHQ, IPS, 1920x1080, 15.6" | |
|---|---|---|---|---|---|---|
| Power Consumption | 59% | 38% | 10% | 15% | 36% | |
| Idle Minimum * (Watt) | 46 | 4.04 91% | 12.5 73% | 19 59% | 26.4 43% | 22.9 50% |
| Idle Average * (Watt) | 59 | 7.2 88% | 15.3 74% | 40.5 31% | 30 49% | 27.2 54% |
| Idle Maximum * (Watt) | 65.5 | 11.4 83% | 20.7 68% | 52 21% | 30.6 53% | 27.5 58% |
| Load Average * (Watt) | 99.8 | 80.8 19% | 90.2 10% | 132.3 -33% | 90.4 9% | 83.4 16% |
| Witcher 3 ultra * (Watt) | 154.1 | 93.6 39% | 162 -5% | 183.3 -19% | 255.6 -66% | 143.6 7% |
| Load Maximum * (Watt) | 222.7 | 144.5 35% | 209.3 6% | 217.2 2% | 224.4 -1% | 160.5 28% |
* ... smaller is better
Battery Life
Runtimes are some of the worst we've seen for a 15.6-inch gaming laptop. Despite having a decently sized 72 Wh battery, we're only able to record a WLAN runtime of just over 2 hours when set to the Balanced power profile and with the secondary screen turned on. Turning off this second screen and setting Windows to Power Saver mode instead will boost battery life to an 3.5 hours. Perhaps it's due to the lack of Optimus, but this is definitely a laptop that shouldn't stray from an outlet for too long.
Recharging from empty to full capacity takes about 1.5 to 2 hours.
| HP Omen X 2S 15-dg0075cl i7-9750H, GeForce RTX 2070 Max-Q, 72 Wh | HP Omen 15-dc1020ng i5-9300H, GeForce GTX 1650 Mobile, 52.5 Wh | Razer Blade 15 RTX 2080 Max-Q i7-9750H, GeForce RTX 2080 Max-Q, 80 Wh | Alienware m15 R2 P87F i7-9750H, GeForce RTX 2080 Max-Q, 76 Wh | MSI GT63 Titan 8RG-046 i7-8750H, GeForce GTX 1080 Mobile, 75.24 Wh | Lenovo Legion Y740-15ICHg i7-8750H, GeForce RTX 2070 Max-Q, 57 Wh | |
|---|---|---|---|---|---|---|
| Battery runtime | 171% | 187% | 84% | 45% | -2% | |
| Reader / Idle (h) | 3.7 | 15.9 330% | 15.9 330% | 9.2 149% | 3.9 5% | |
| WiFi v1.3 (h) | 2.2 | 6.4 191% | 6.6 200% | 5.5 150% | 3.2 45% | 2.8 27% |
| Load (h) | 1.3 | 1.2 -8% | 1.7 31% | 0.7 -46% | 0.8 -38% | |
| Witcher 3 ultra (h) | 1 |
Pros
Cons
Verdict
The 6-inch second screen doesn't make the Omen a better gaming laptop or travel companion. Battery life is incredibly short and using the second screen anywhere outdoors will attract heavy glare. Colors are poorly calibrated to be worse than even a mid-range Android smartphone. In fact, you'd be better off using your faster and more responsive smartphone for looking up game guides and forums rather than this suboptimally-angled integrated second screen.
If you intend to use the Omen X 2S 15 for a lot of word processing, video playback, browsing, or other multi-window tasks on a small desk where space is limited, then there will be value in the second screen. Otherwise, you may as well just connect an external monitor.
Gaming performance is excellent as one would expect from any gaming laptop retailing for $2000 USD. The main issues are almost everything else from the difficult serviceability to the thick top and bottom bezels of the flimsy lid and loud system fans. HP may want to work on creating a compelling standard gaming laptop first before integrating expensive novelties.
Heavy glare, short battery life, and a suboptimal viewing angle make the second screen almost worthless when outdoors. It has its uses when indoors where lighting is controlled, but you'd be better off investing in an external monitor instead if the laptop will be anchored more often than not.
HP Omen X 2S 15-dg0075cl
- 09/13/2019 v7 (old)
Allen Ngo
Price comparison
