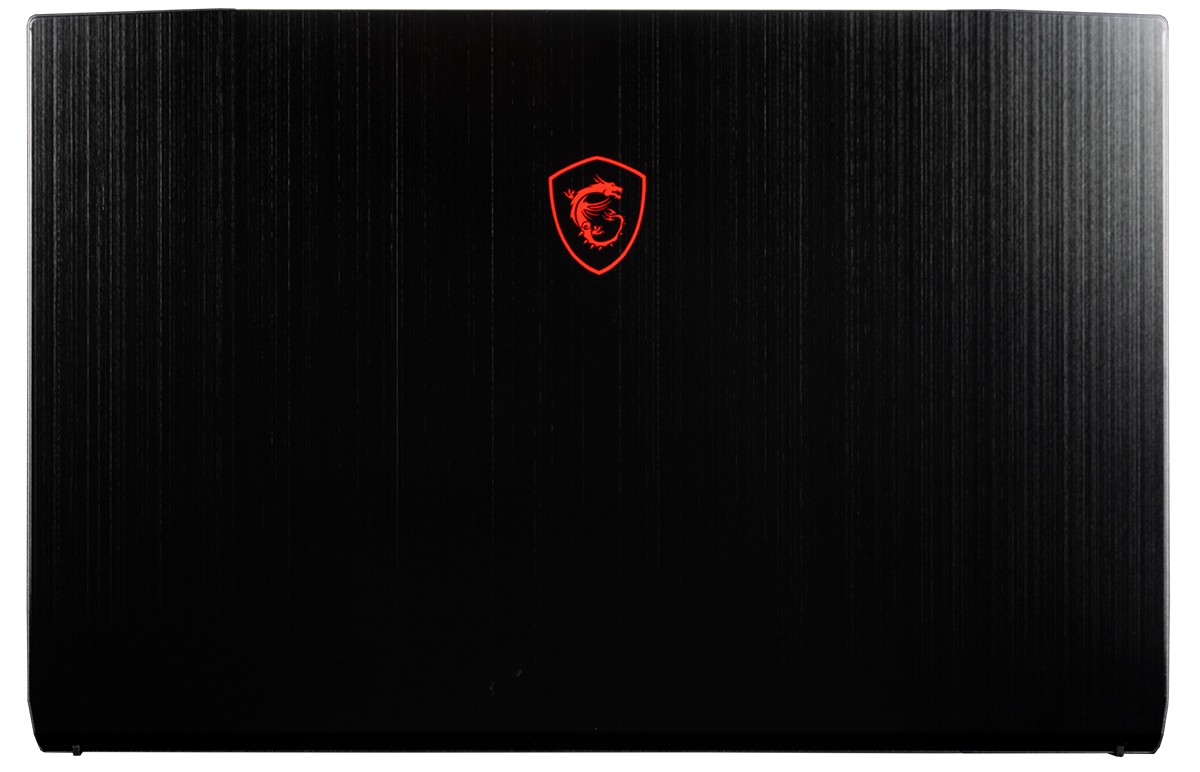
Thin is in: MSI GF75 Thin 9SC Laptop Review
The MSI GF series is the company's budget lineup of gaming laptops similar to the GL series and GP series. The GF75 directly succeeds the last generation GF72 with a new narrow-bezel chassis design for a noticeably smaller, lighter, and more compact gaming experience.
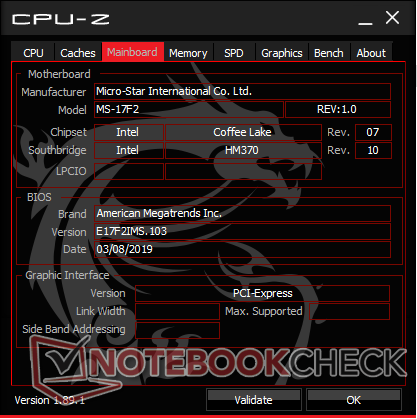
We already checked out the GF75 8RD earlier this year equipped with an Intel 8th gen Core i7-8750H CPU and Nvidia Pascal GeForce GTX 1050 Ti Max-Q GPU. Our unit today is the newer GF75 9SC equipped with an Intel 9th gen Core i7-9750H CPU and the Nvidia Turing GeForce GTX 1650 GPU. While the core specifications have improved, the chassis and motherboard remain identical to the GF75 8RD. We therefore recommend checking out our review on the GF75 8RD since our existing comments on the chassis, connectivity options, keyboard, speakers, and other physical features all apply here for the GF75 9SC.
Our MSI GF75 9SC as configured can be found on CUKUSA.com for a retail price of $1200 to $1400 USD. Direct competitors include other budget 17.3-inch gaming laptops such as the Asus TUF FX705, Asus Strix G GL731, Lenovo Legion Y540, Gigabyte Aorus 7, Acer Aspire V17, or the Dell G7 series.
More MSI reviews:
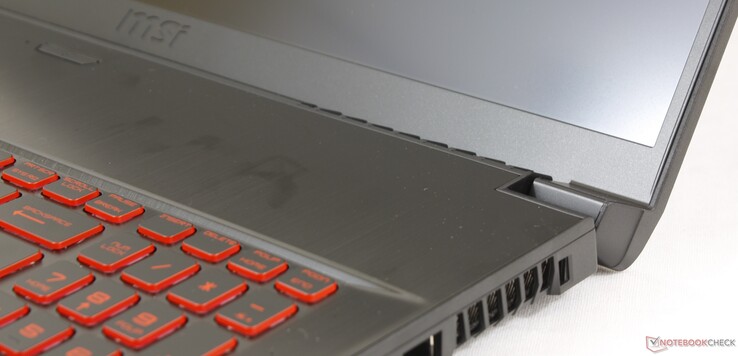
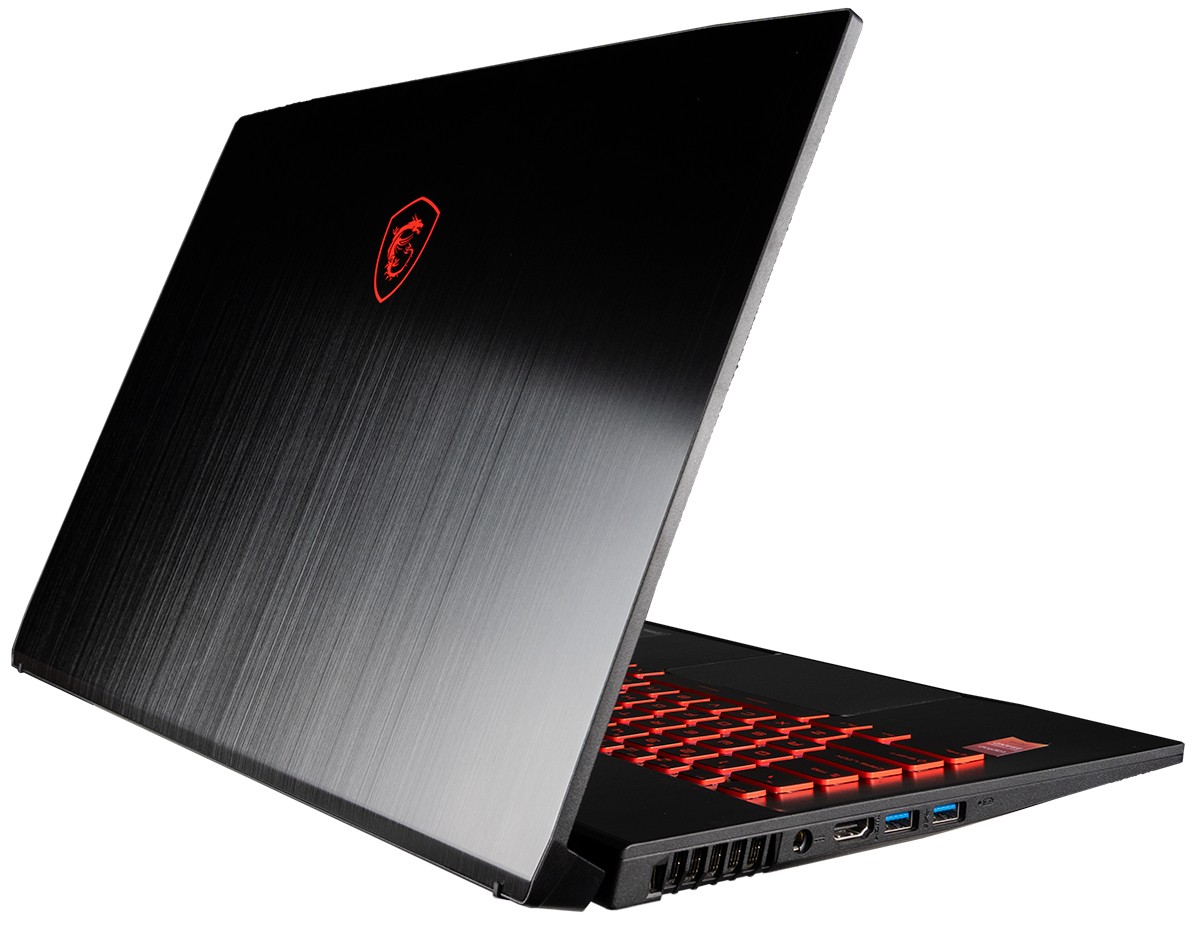
Case

Communication
| Networking | |
| iperf3 transmit AX12 | |
| MSI GP75 Leopard 9SD | |
| MSI GF75 Thin 9SC | |
| MSI GF72VR 7RF | |
| Asus TUF FX705DT-AU068T | |
| iperf3 receive AX12 | |
| MSI GP75 Leopard 9SD | |
| MSI GF72VR 7RF | |
| MSI GF75 Thin 9SC | |
| Asus TUF FX705DT-AU068T | |
Maintenance
Warranty
The standard one-year limited warranty applies. CUKUSA offers three-year warranty as standard on any configurable components installed by the reseller including RAM and storage. MSI may offer additional benefits for owners who register their purchases with the manufacturer online.
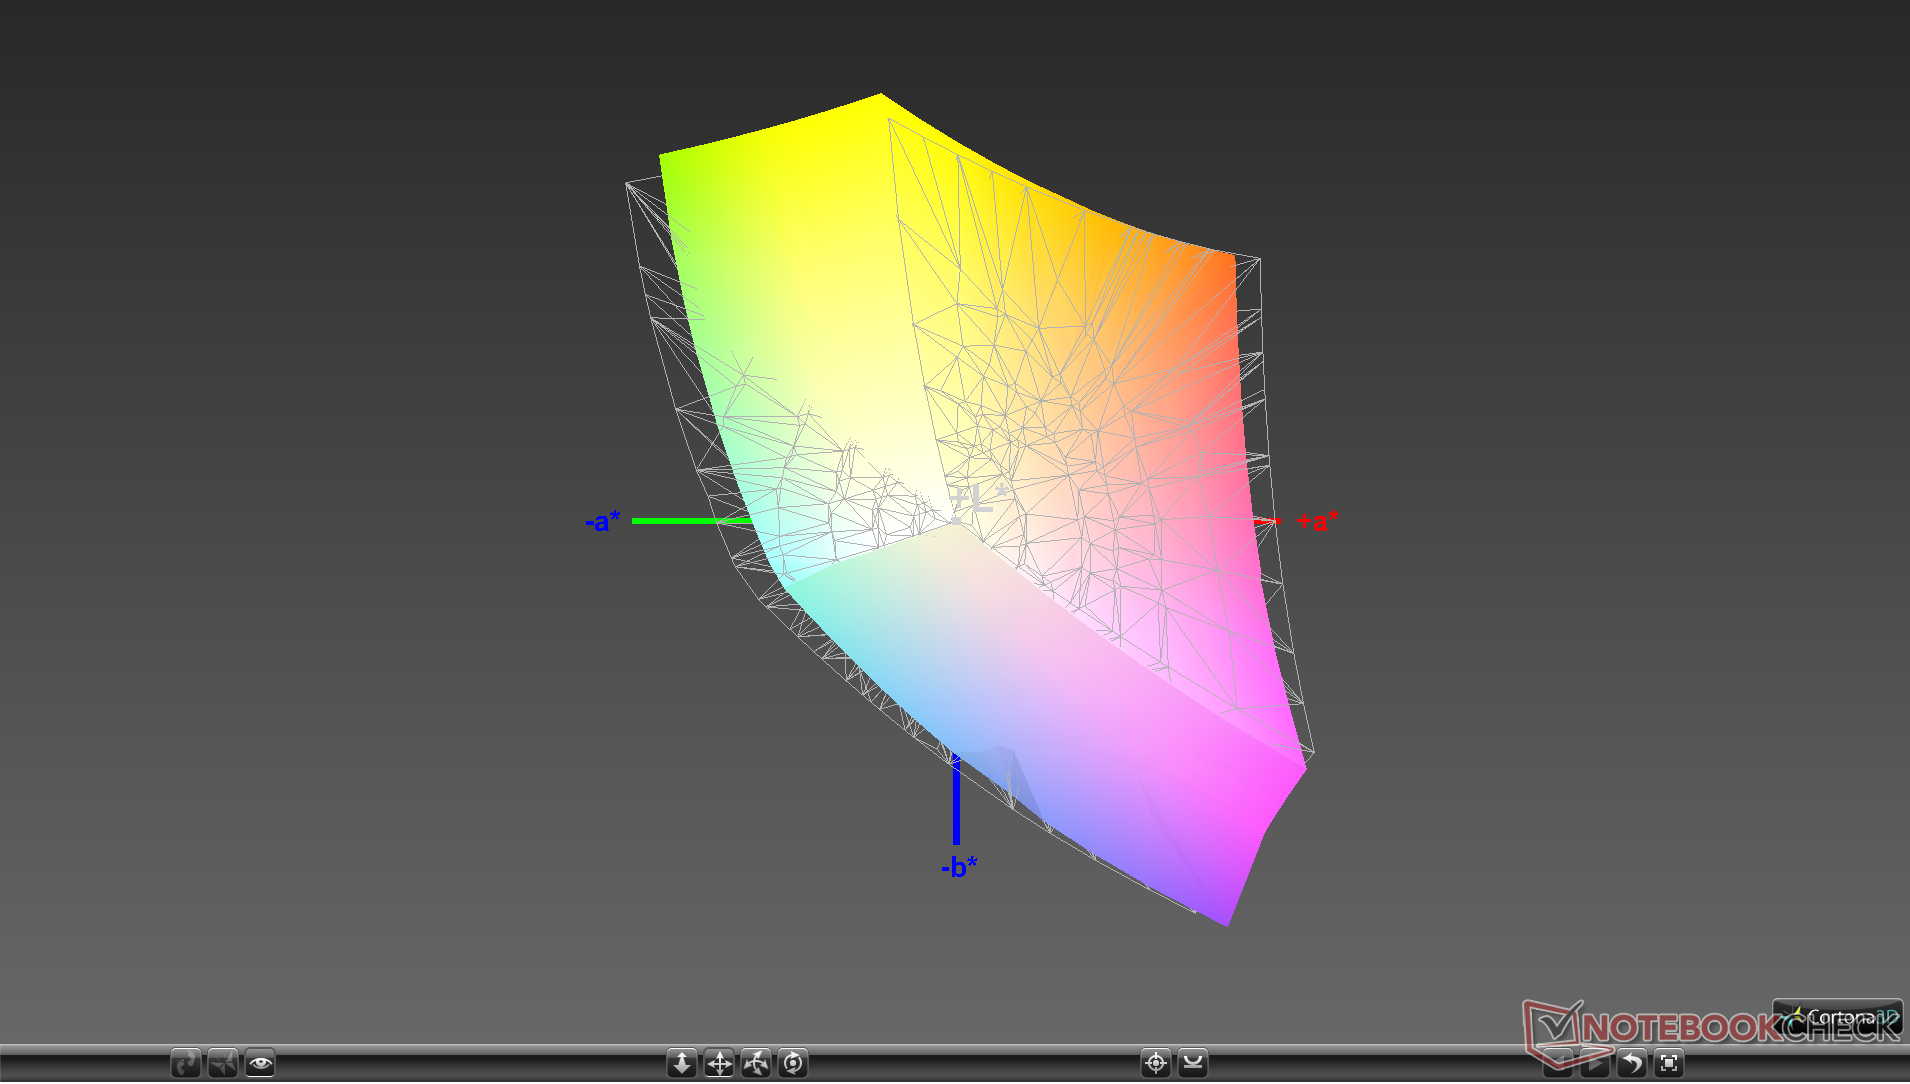
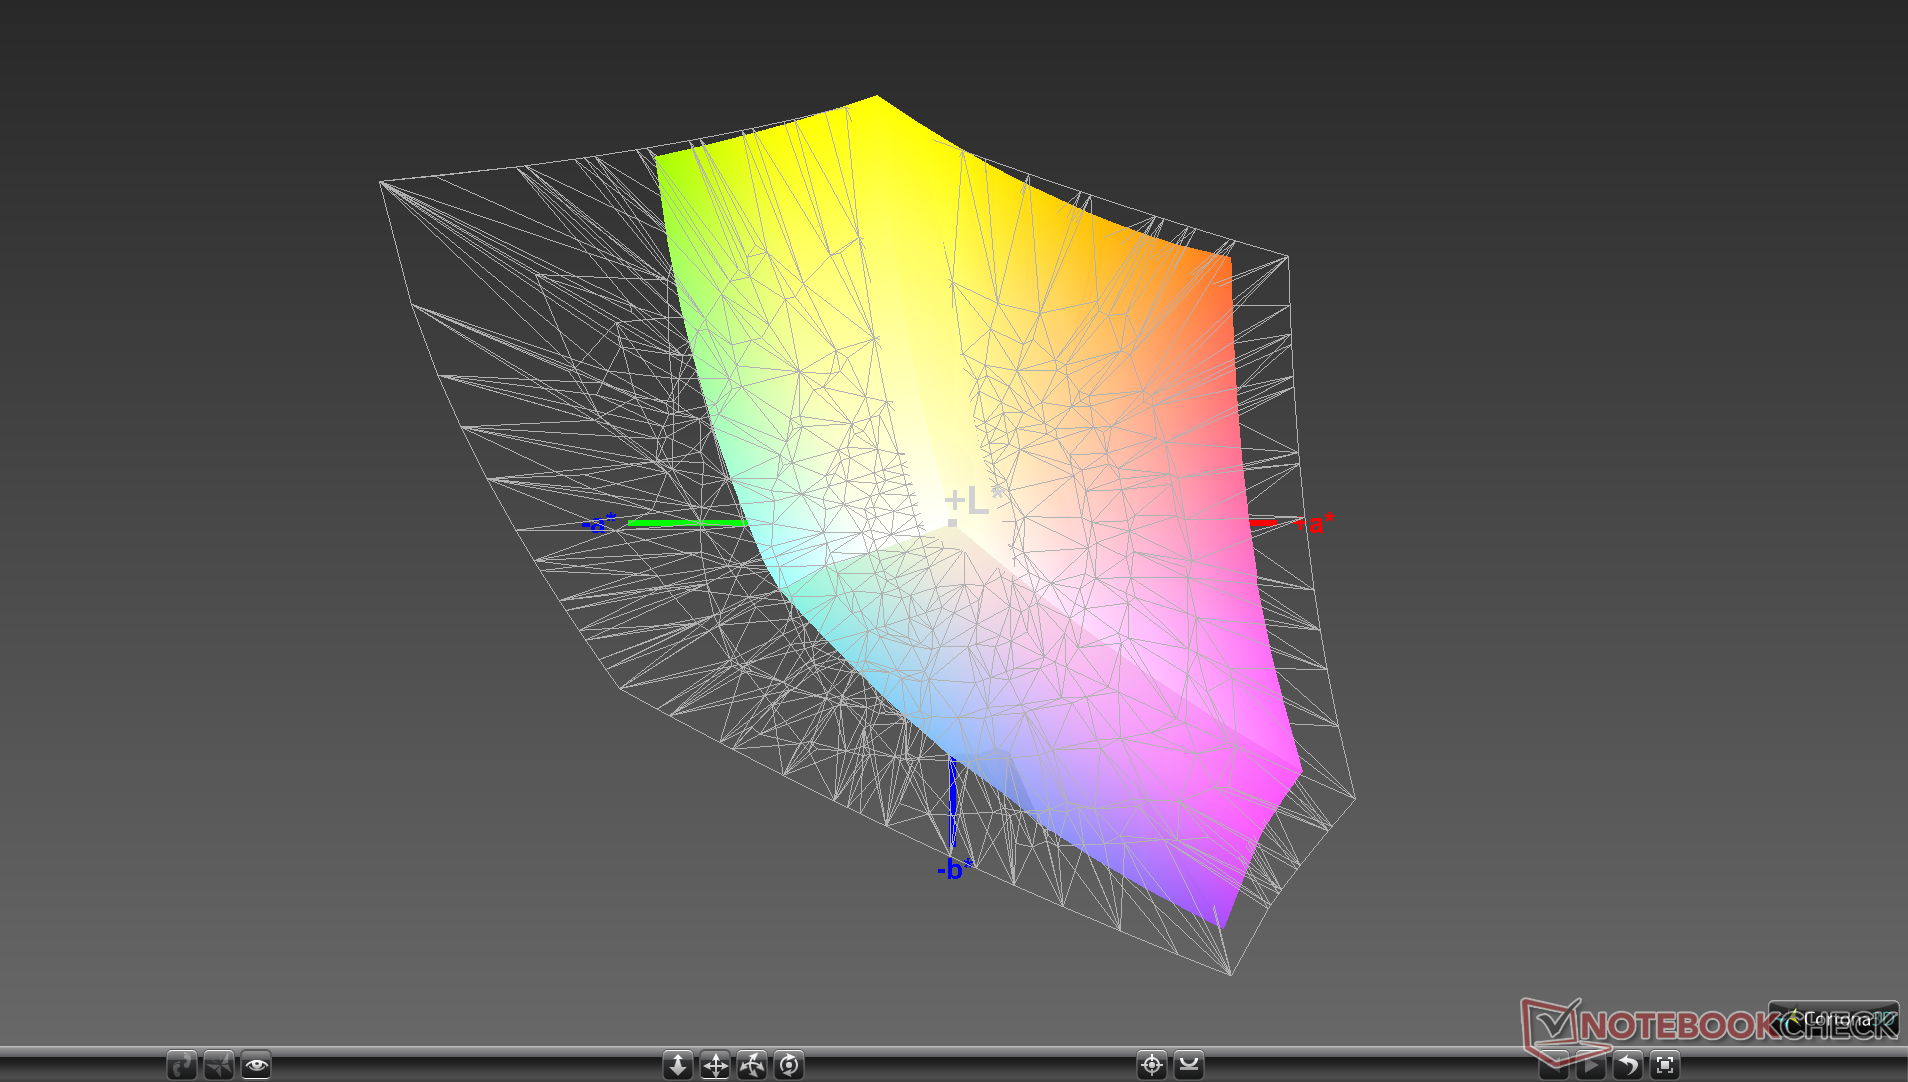
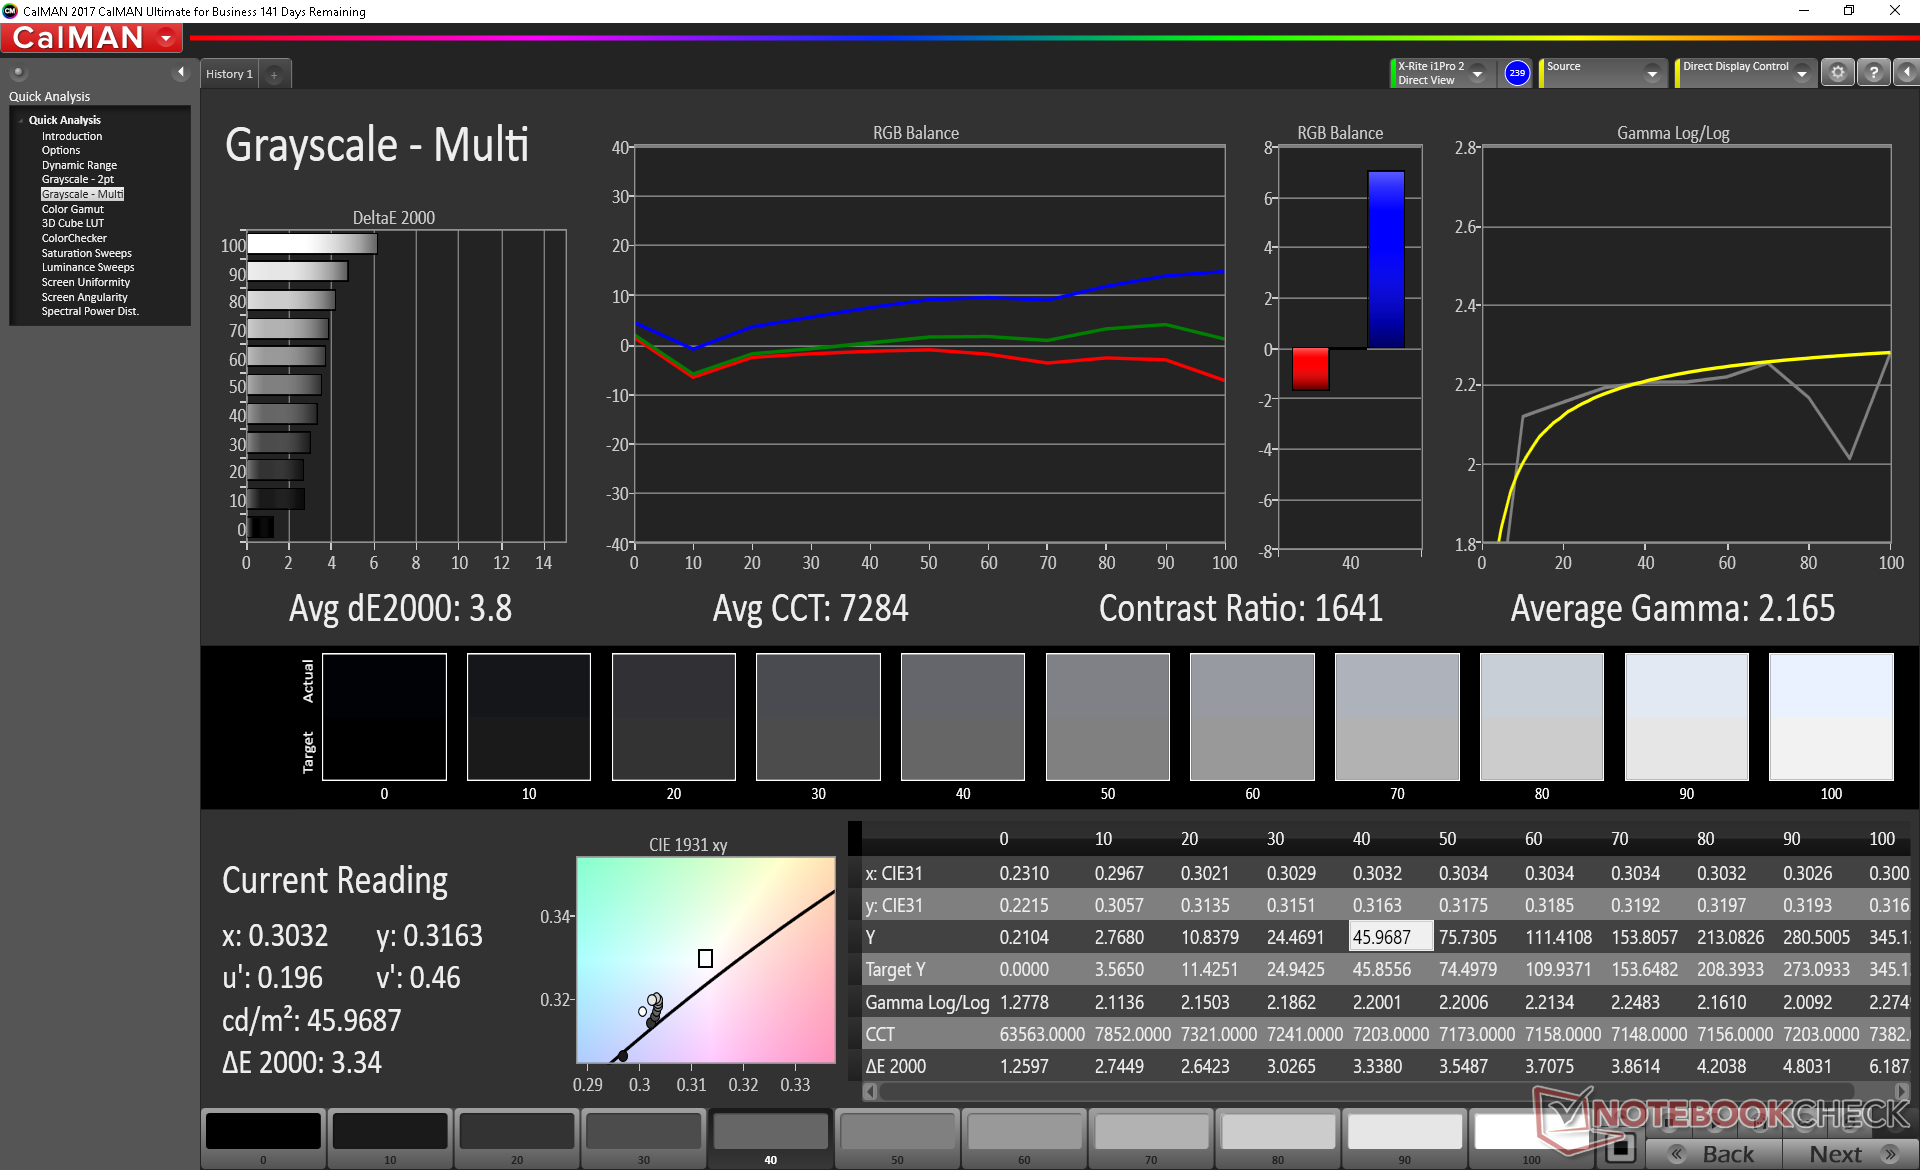
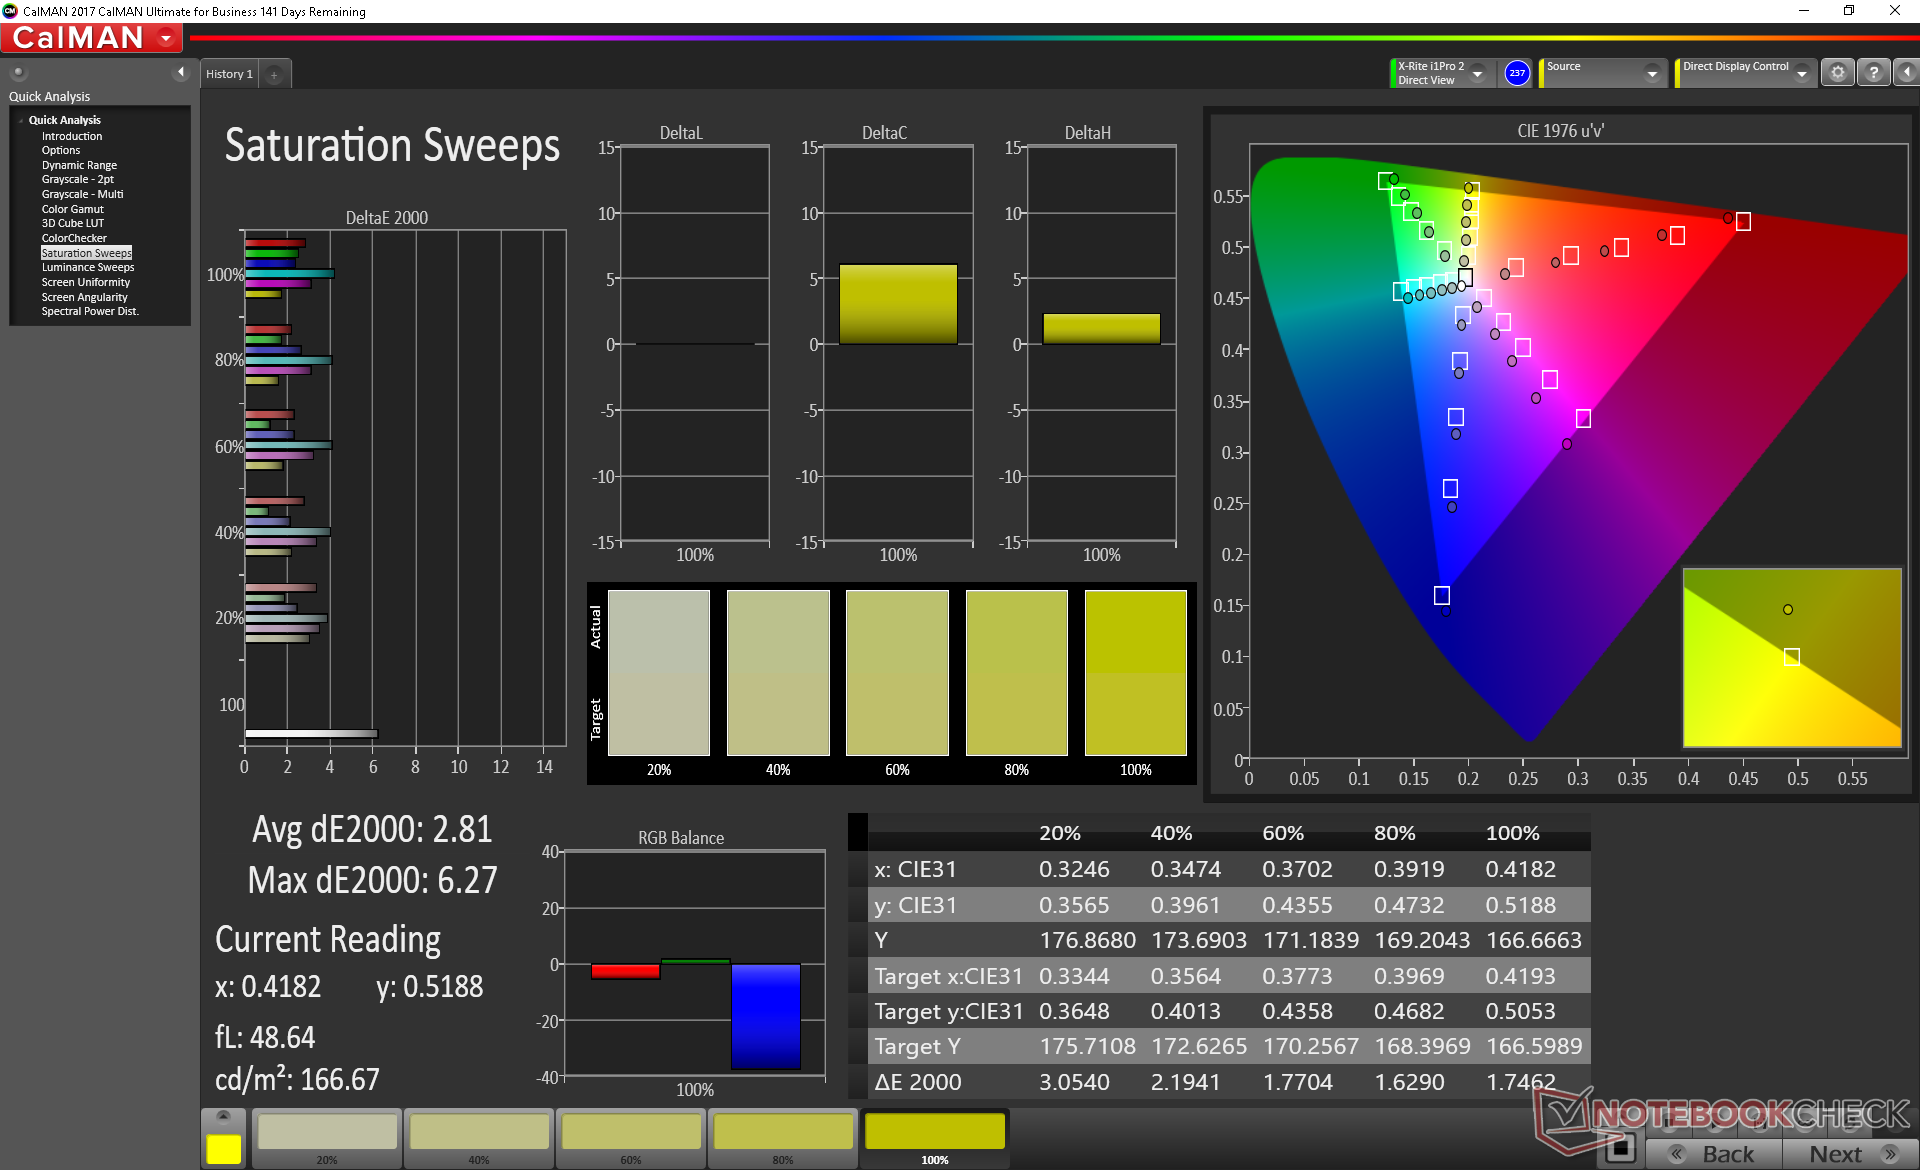
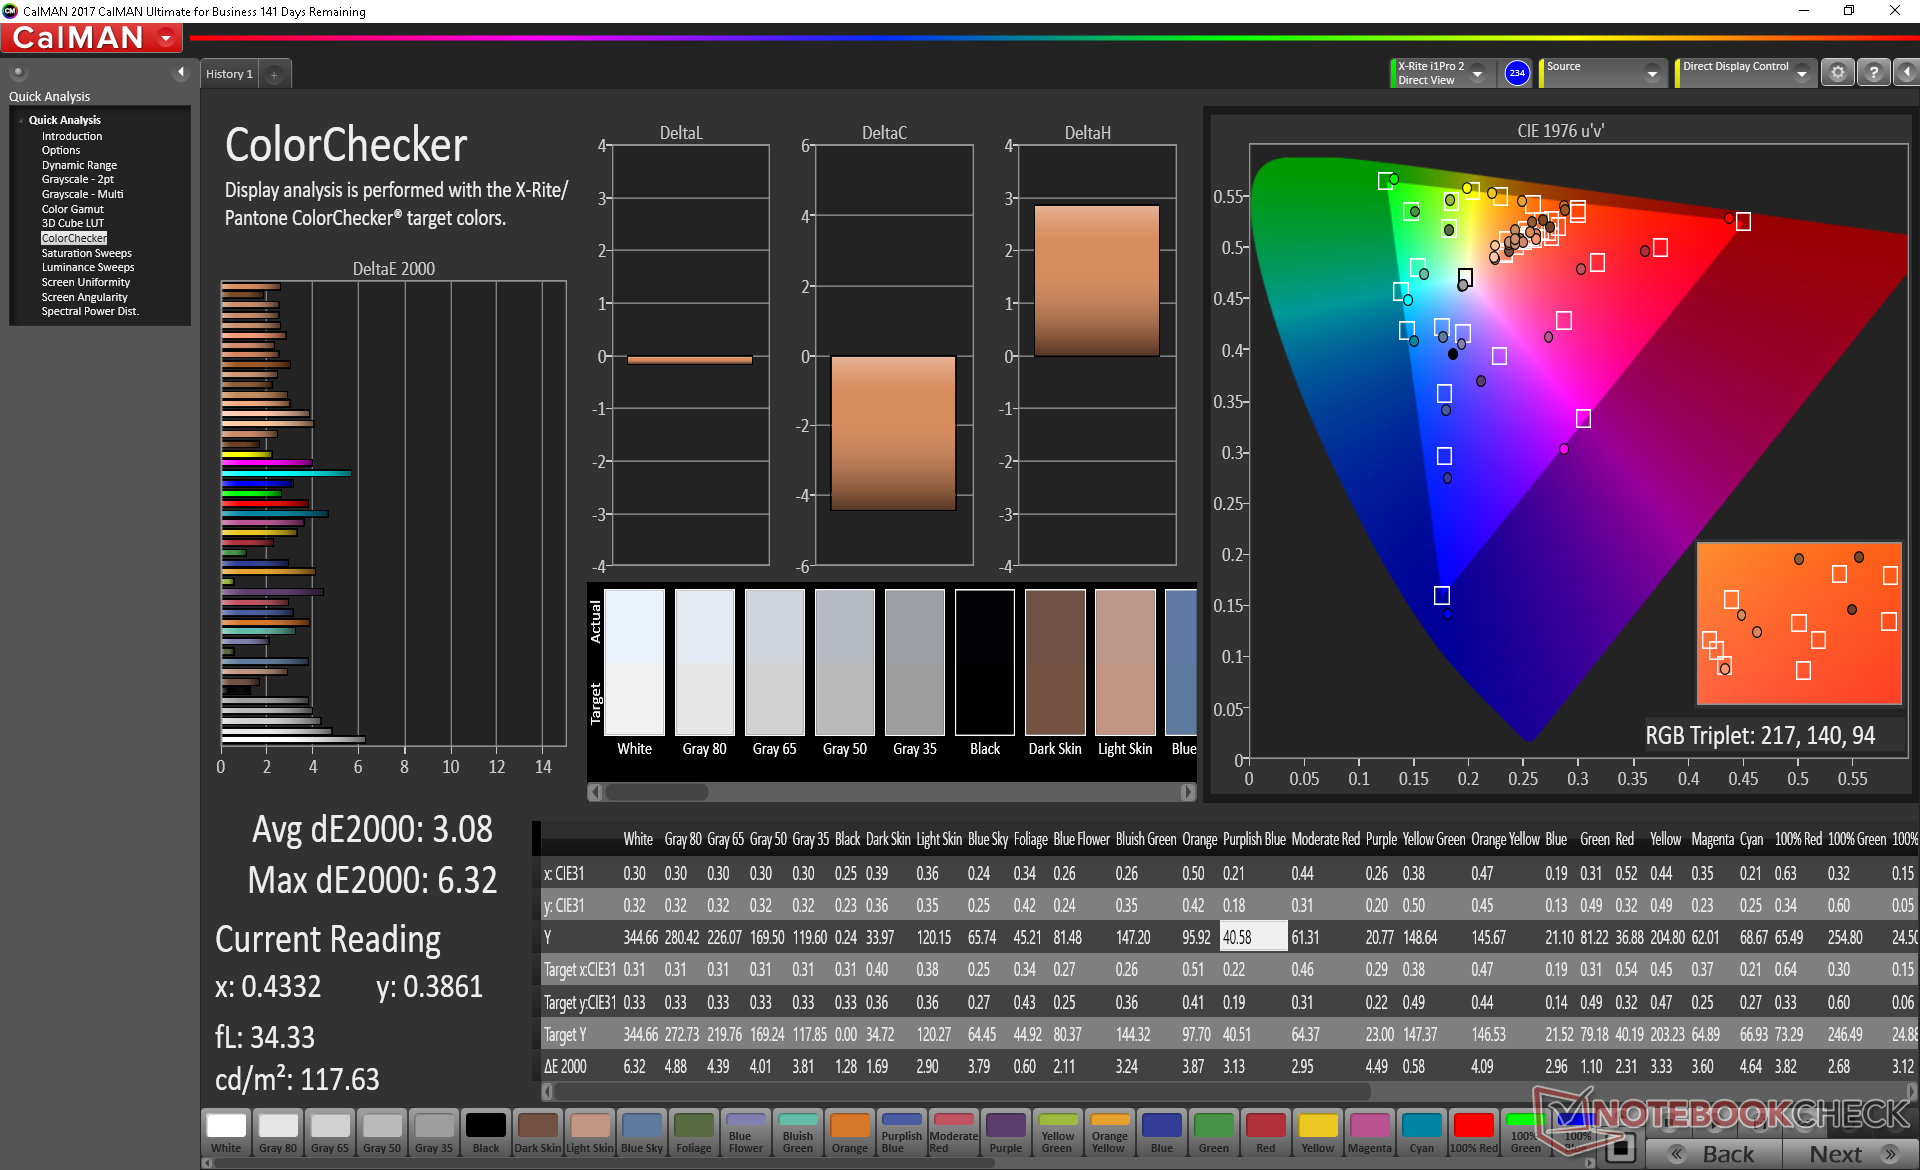
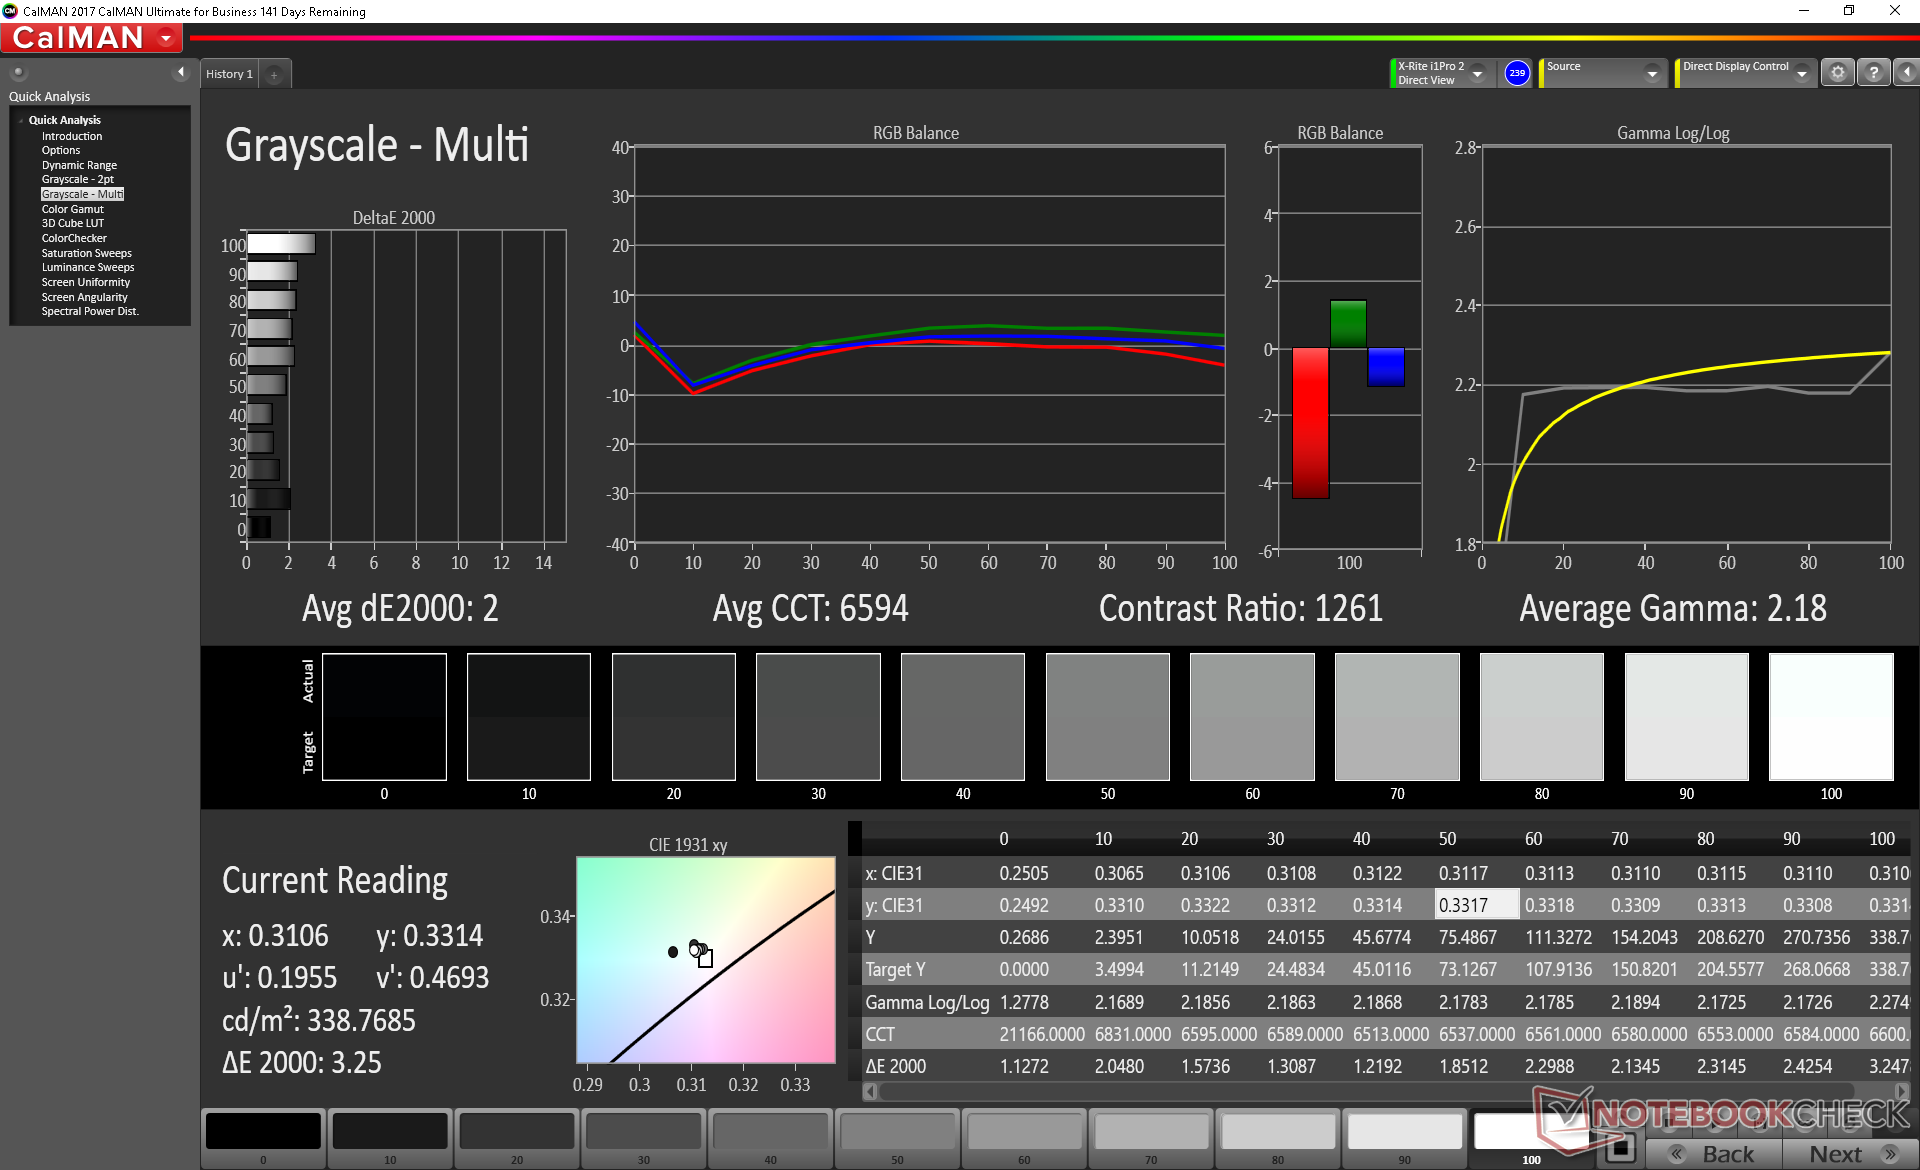
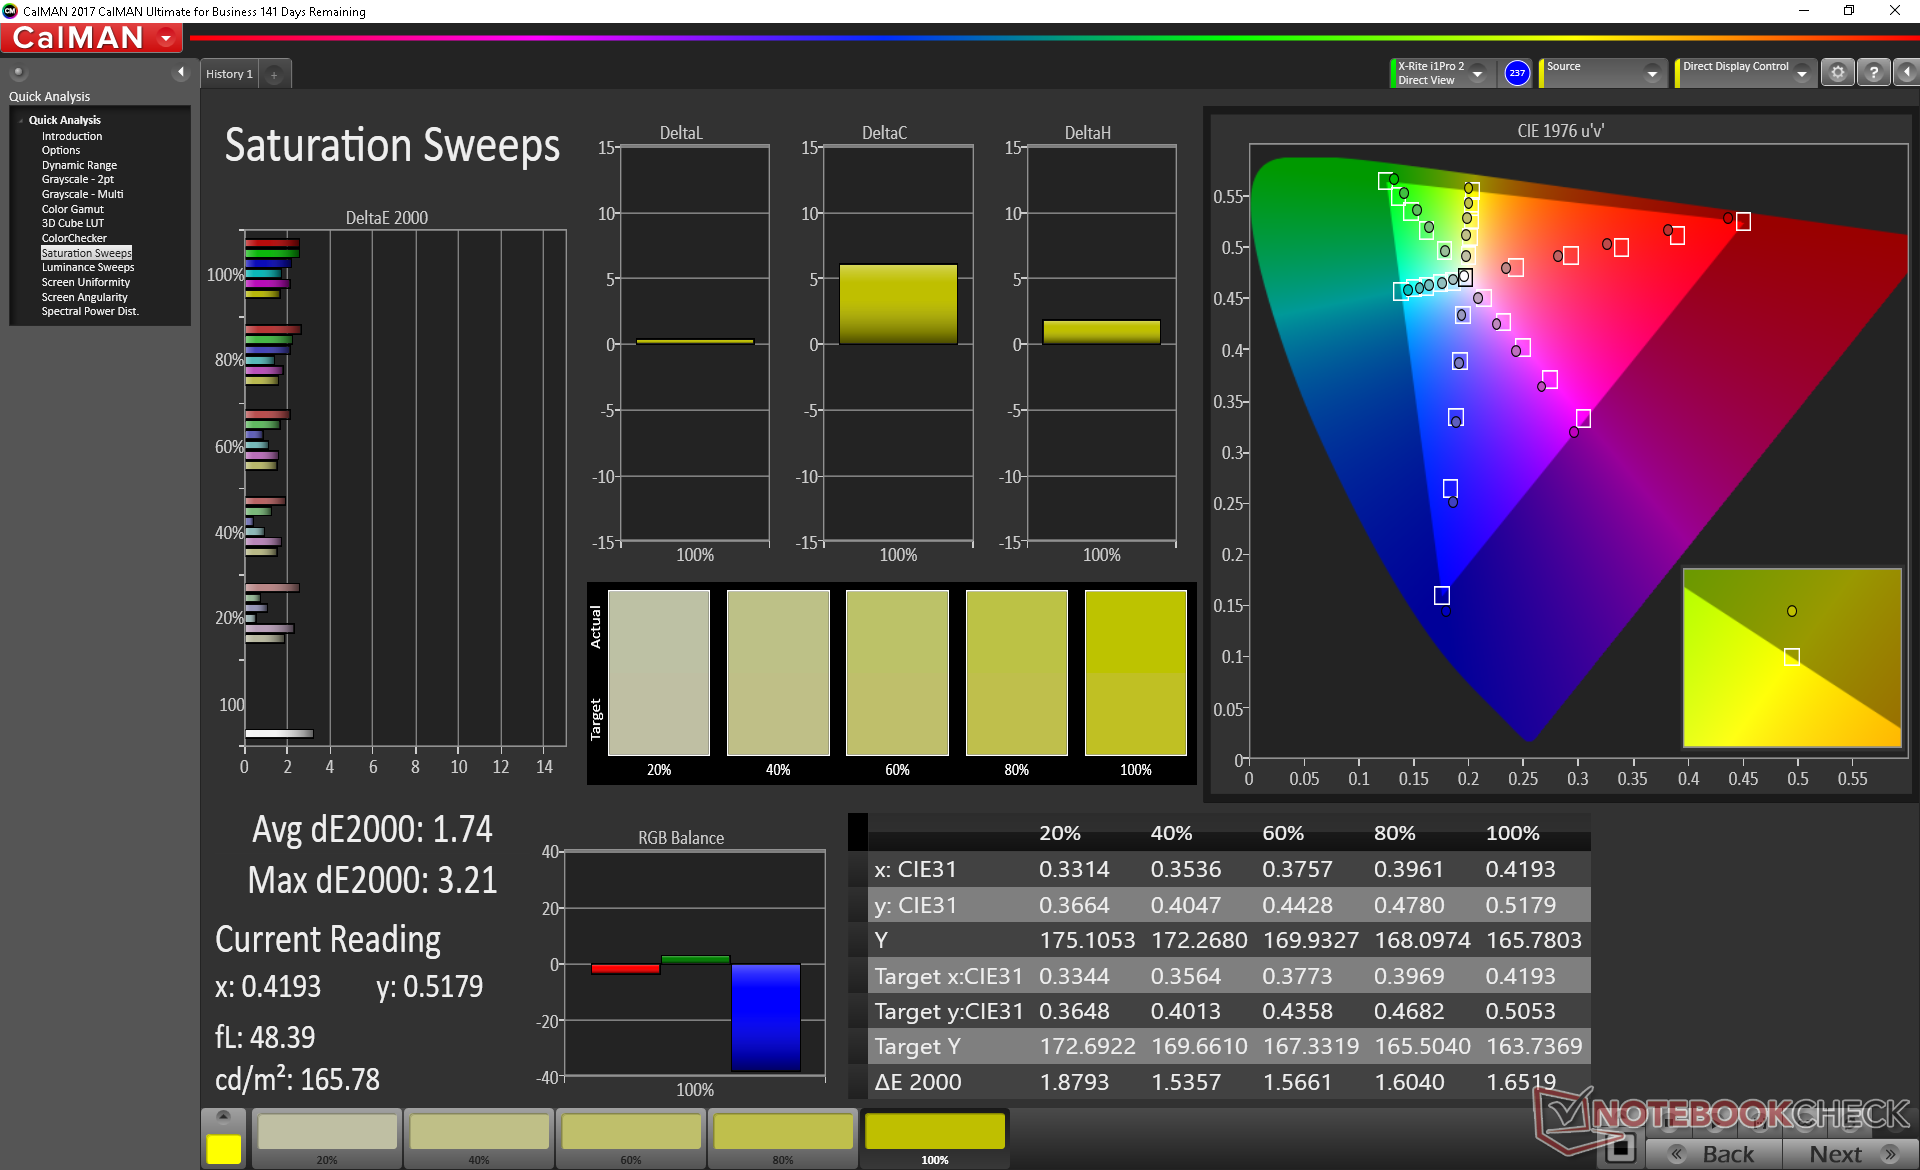
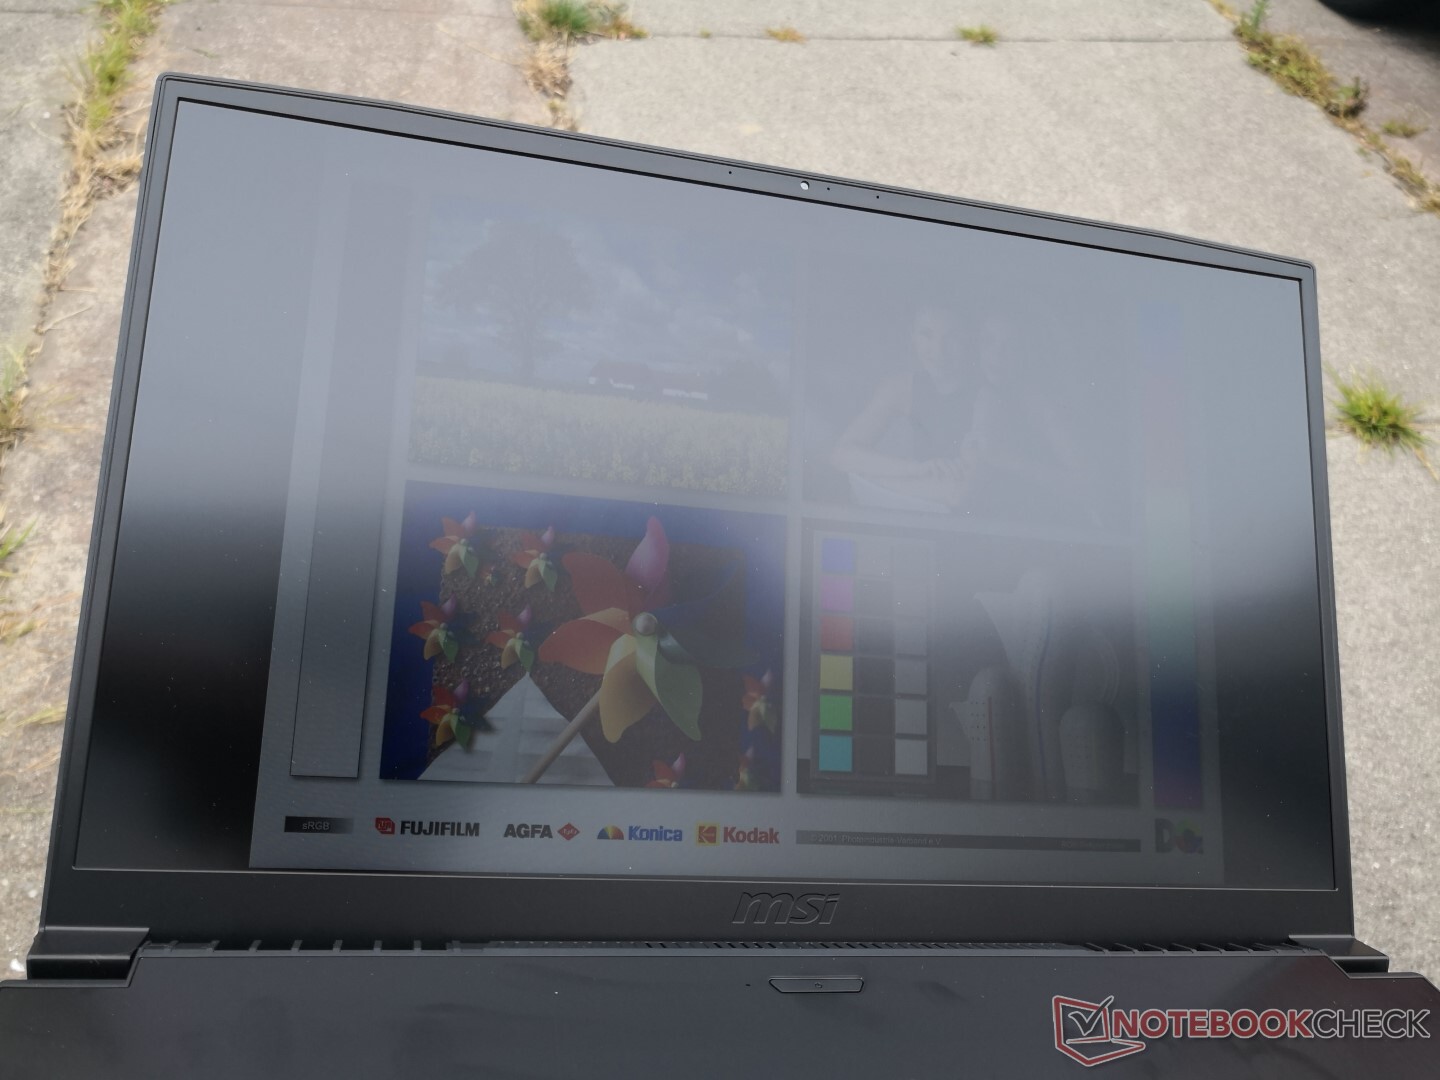
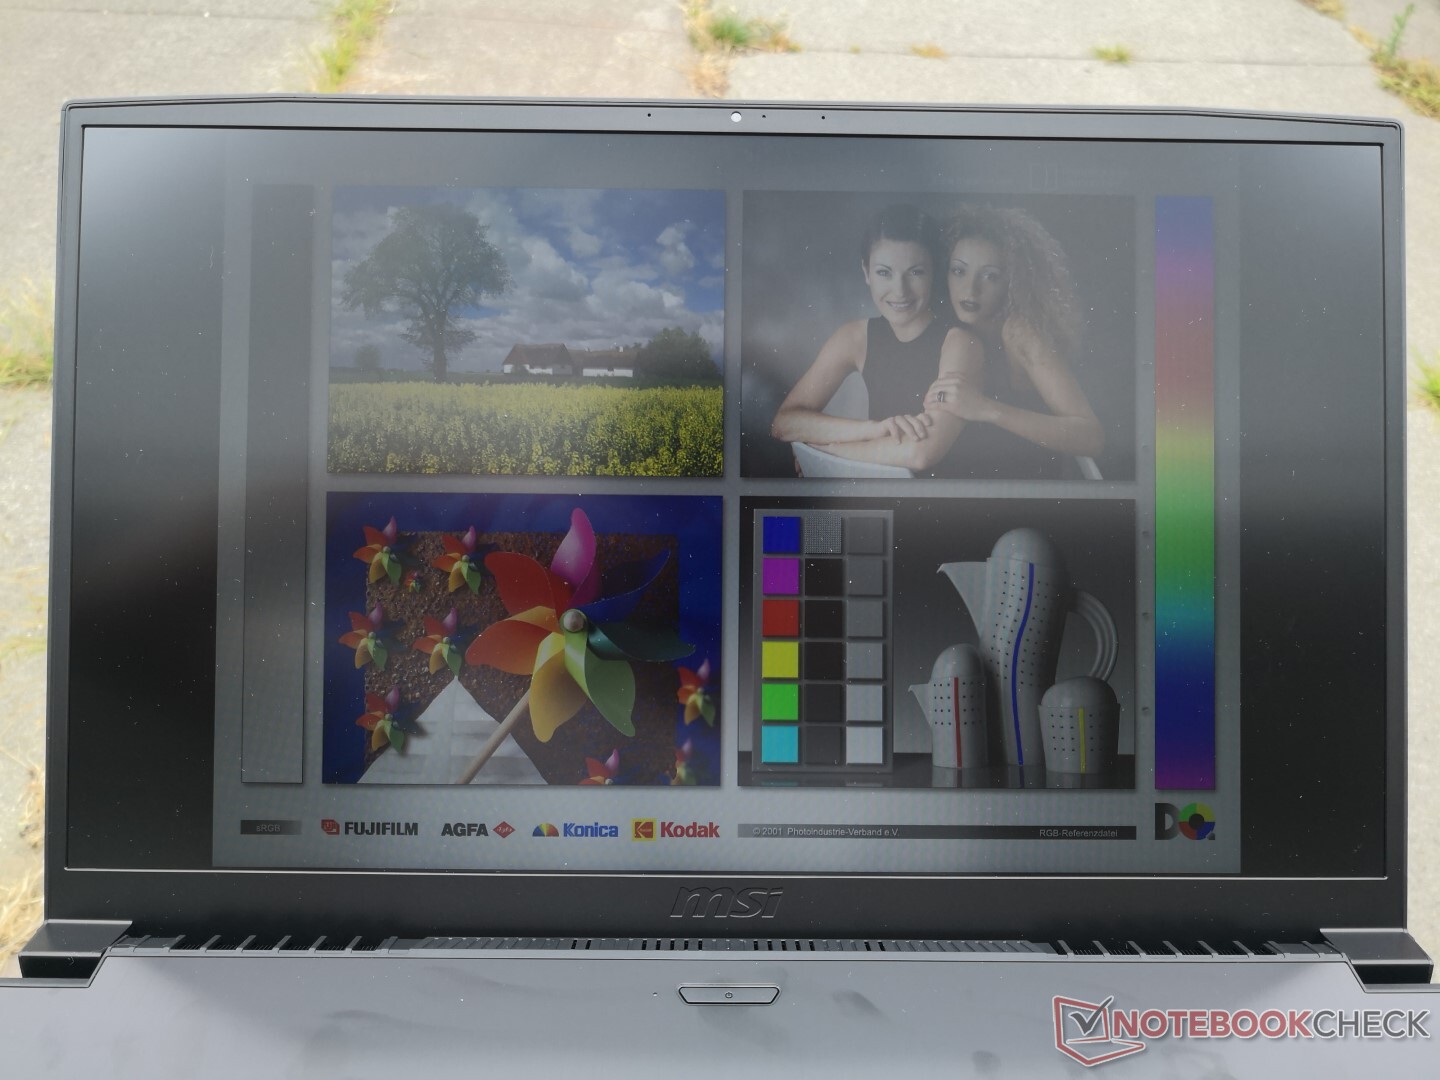
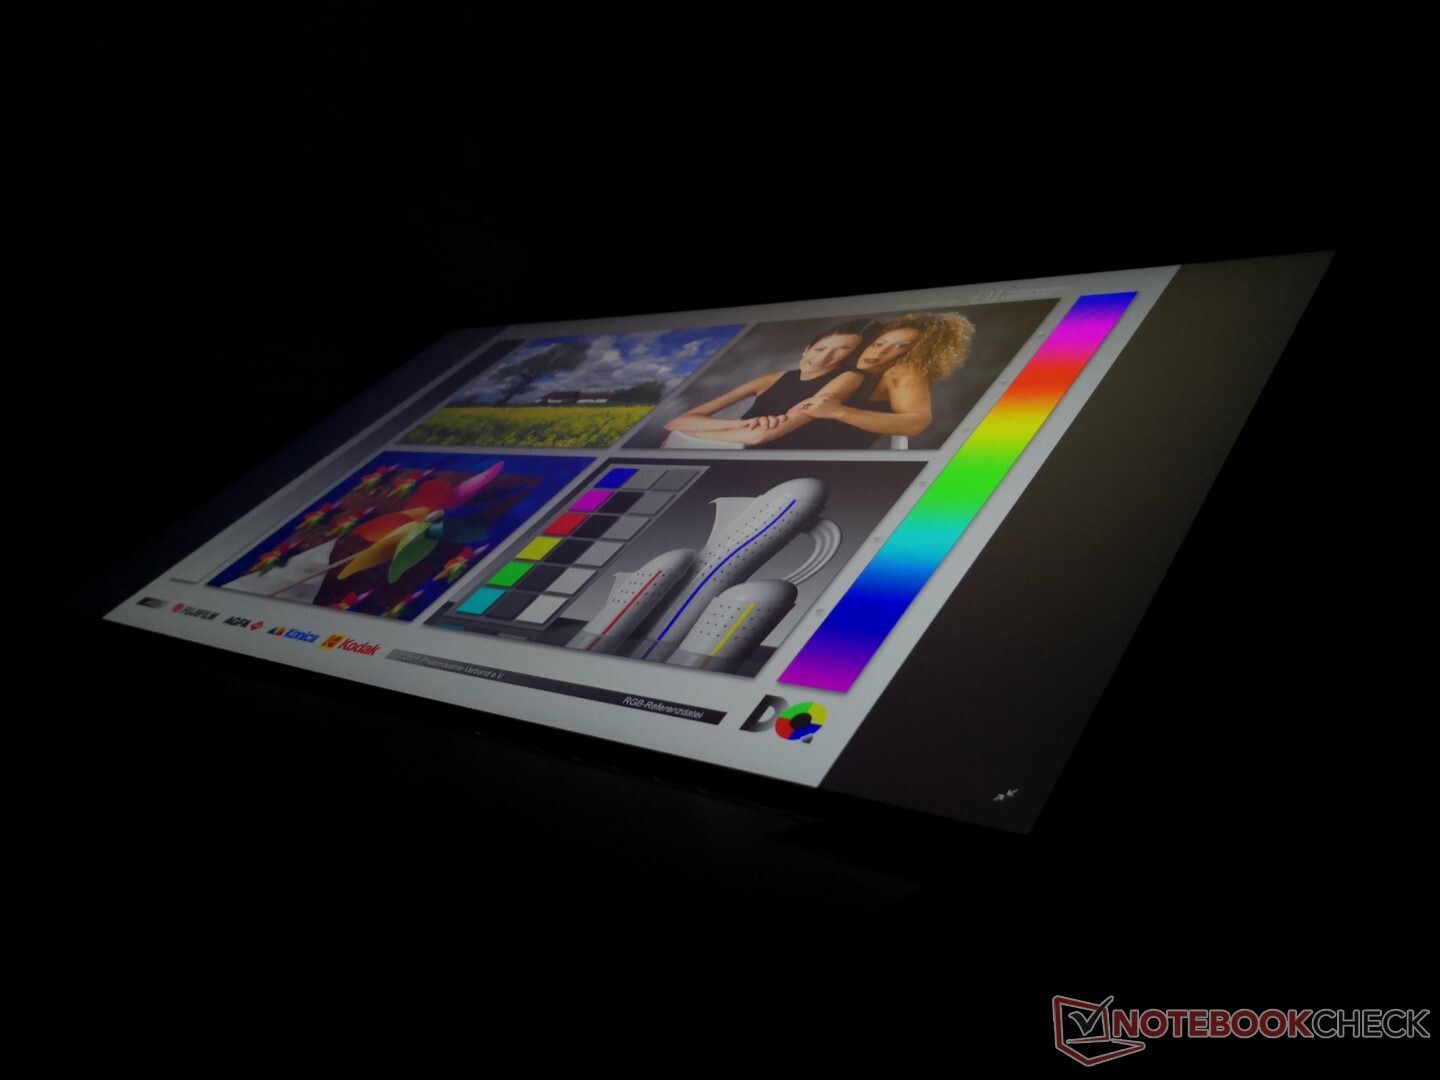
Display
The GF75 9SC utilizes the same AU Optronics B173HAN04.2 IPS panel as on the older GF75 8RD and so our existing comments still apply here. Attributes like the respectable contrast ratio, brightness, and gamut remain almost identical between the two generations. The most noticeable drawback of the display is its relatively slow black-white and gray-gray response times compared to the latest 1080p panels with 8 ms or faster response times. We would have liked to see MSI push higher-tier 120 Hz or 144 Hz panels as standard for the budget category.


| |||||||||||||||||||||||||
Brightness Distribution: 91 %
Center on Battery: 344.7 cd/m²
Contrast: 1149:1 (Black: 0.3 cd/m²)
ΔE ColorChecker Calman: 3.08 | ∀{0.5-29.43 Ø4.72}
calibrated: 2.94
ΔE Greyscale Calman: 3.8 | ∀{0.09-98 Ø4.97}
89.6% sRGB (Argyll 1.6.3 3D)
58% AdobeRGB 1998 (Argyll 1.6.3 3D)
64% AdobeRGB 1998 (Argyll 3D)
90% sRGB (Argyll 3D)
62.5% Display P3 (Argyll 3D)
Gamma: 2.17
CCT: 7284 K
| MSI GF75 Thin 9SC AU Optronics B173HAN04.2, IPS, 17.3", 1920x1080 | MSI GF72VR 7RF Chi Mei CMN1747, TN LED, 17.3", 1920x1080 | Asus TUF FX705DT-AU068T AU Optronics B173HAN04.2, IPS, 17.3", 1920x1080 | MSI GP75 Leopard 9SD Chi Mei N173HCE-G33 (CMN175C), IPS, 17.3", 1920x1080 | Lenovo Legion Y740-17ICH AU Optronics B173HAN03.2, IPS, 17.3", 1920x1080 | HP Omen 17t-3AW55AV_1 AU Optronics AUO309D, IPS, 17.3", 1920x1080 | |
|---|---|---|---|---|---|---|
| Display | 30% | -0% | 3% | 1% | 3% | |
| Display P3 Coverage (%) | 62.5 | 90.8 45% | 62.3 0% | 63.4 1% | 64 2% | 65.4 5% |
| sRGB Coverage (%) | 90 | 99.8 11% | 89.1 -1% | 94.9 5% | 90.4 0% | 90 0% |
| AdobeRGB 1998 Coverage (%) | 64 | 85.6 34% | 63.7 0% | 65.1 2% | 64.8 1% | 65.8 3% |
| Response Times | 44% | -10% | 74% | 56% | 58% | |
| Response Time Grey 50% / Grey 80% * (ms) | 34 ? | 24.4 ? 28% | 41 ? -21% | 8 ? 76% | 15.6 ? 54% | 17.6 ? 48% |
| Response Time Black / White * (ms) | 30.4 ? | 12.6 ? 59% | 30 ? 1% | 8.8 ? 71% | 12.8 ? 58% | 10 ? 67% |
| PWM Frequency (Hz) | 25000 ? | 25510 ? | ||||
| Screen | -37% | -1% | 10% | -24% | -5% | |
| Brightness middle (cd/m²) | 344.7 | 329.2 -4% | 316 -8% | 420 22% | 299.1 -13% | 343.6 0% |
| Brightness (cd/m²) | 332 | 318 -4% | 294 -11% | 393 18% | 273 -18% | 320 -4% |
| Brightness Distribution (%) | 91 | 92 1% | 84 -8% | 91 0% | 81 -11% | 87 -4% |
| Black Level * (cd/m²) | 0.3 | 0.4 -33% | 0.32 -7% | 0.32 -7% | 0.27 10% | 0.34 -13% |
| Contrast (:1) | 1149 | 823 -28% | 988 -14% | 1313 14% | 1108 -4% | 1011 -12% |
| Colorchecker dE 2000 * | 3.08 | 6.4 -108% | 3.39 -10% | 3.04 1% | 5.07 -65% | 3.74 -21% |
| Colorchecker dE 2000 max. * | 6.32 | 11.7 -85% | 5.56 12% | 7.22 -14% | 10.55 -67% | 5.33 16% |
| Colorchecker dE 2000 calibrated * | 2.94 | 2.14 27% | 0.89 70% | 3.31 -13% | 3.49 -19% | |
| Greyscale dE 2000 * | 3.8 | 9.2 -142% | 3.17 17% | 3.91 -3% | 6.8 -79% | 3.7 3% |
| Gamma | 2.17 101% | 2.18 101% | 2.39 92% | 2.26 97% | 2.46 89% | 2.36 93% |
| CCT | 7284 89% | 10484 62% | 7098 92% | 7138 91% | 7805 83% | 6388 102% |
| Color Space (Percent of AdobeRGB 1998) (%) | 58 | 76 31% | 51 -12% | 60 3% | 58.5 1% | 58 0% |
| Color Space (Percent of sRGB) (%) | 89.6 | 92 3% | 89 -1% | 95 6% | 89.9 0% | 90 0% |
| Total Average (Program / Settings) | 12% /
-13% | -4% /
-2% | 29% /
17% | 11% /
-9% | 19% /
4% |
* ... smaller is better
Display Response Times
| ↔ Response Time Black to White | ||
|---|---|---|
| 30.4 ms ... rise ↗ and fall ↘ combined | ↗ 18 ms rise | 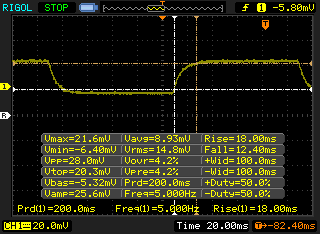 |
| ↘ 12.4 ms fall | ||
| The screen shows slow response rates in our tests and will be unsatisfactory for gamers. In comparison, all tested devices range from 0.1 (minimum) to 240 (maximum) ms. » 82 % of all devices are better. This means that the measured response time is worse than the average of all tested devices (19.8 ms). | ||
| ↔ Response Time 50% Grey to 80% Grey | ||
| 34 ms ... rise ↗ and fall ↘ combined | ↗ 17.6 ms rise | 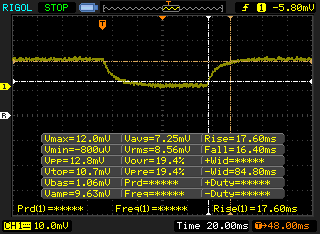 |
| ↘ 16.4 ms fall | ||
| The screen shows slow response rates in our tests and will be unsatisfactory for gamers. In comparison, all tested devices range from 0.165 (minimum) to 636 (maximum) ms. » 47 % of all devices are better. This means that the measured response time is similar to the average of all tested devices (31 ms). | ||
Screen Flickering / PWM (Pulse-Width Modulation)
| Screen flickering / PWM not detected | 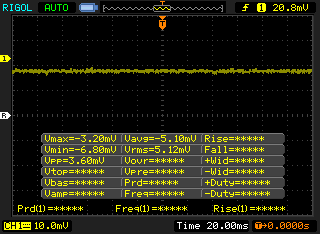 | ||
In comparison: 52 % of all tested devices do not use PWM to dim the display. If PWM was detected, an average of 7747 (minimum: 5 - maximum: 343500) Hz was measured. | |||

Performance
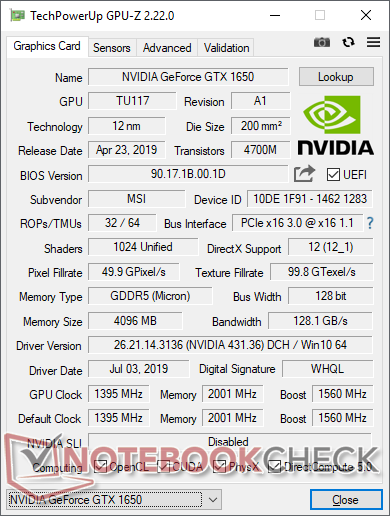
While the Core i7-9750H CPU can also be found on higher-end gaming laptops, the GeForce GTX 1650 puts the GF75 9SC squarely in the budget gaming category. The GTX 1650 is Nvidia's entry-level gaming GPU based on its latest Turing architecture to succeed the last generation Pascal series. It directly replaces the GTX 1050, GTX 1050 Ti, and GTX 1050 Ti Max-Q with performance levels rivaling the GTX 1060 as our benchmarks below will show.
There are no faster GPU options available. There are no G-Sync features as well since Nvidia Optimus comes standard.
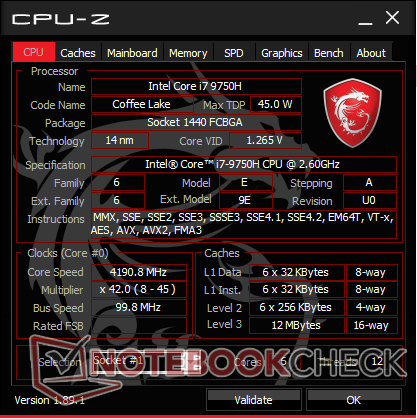
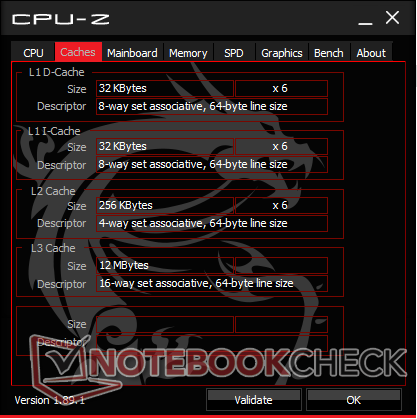
Processor
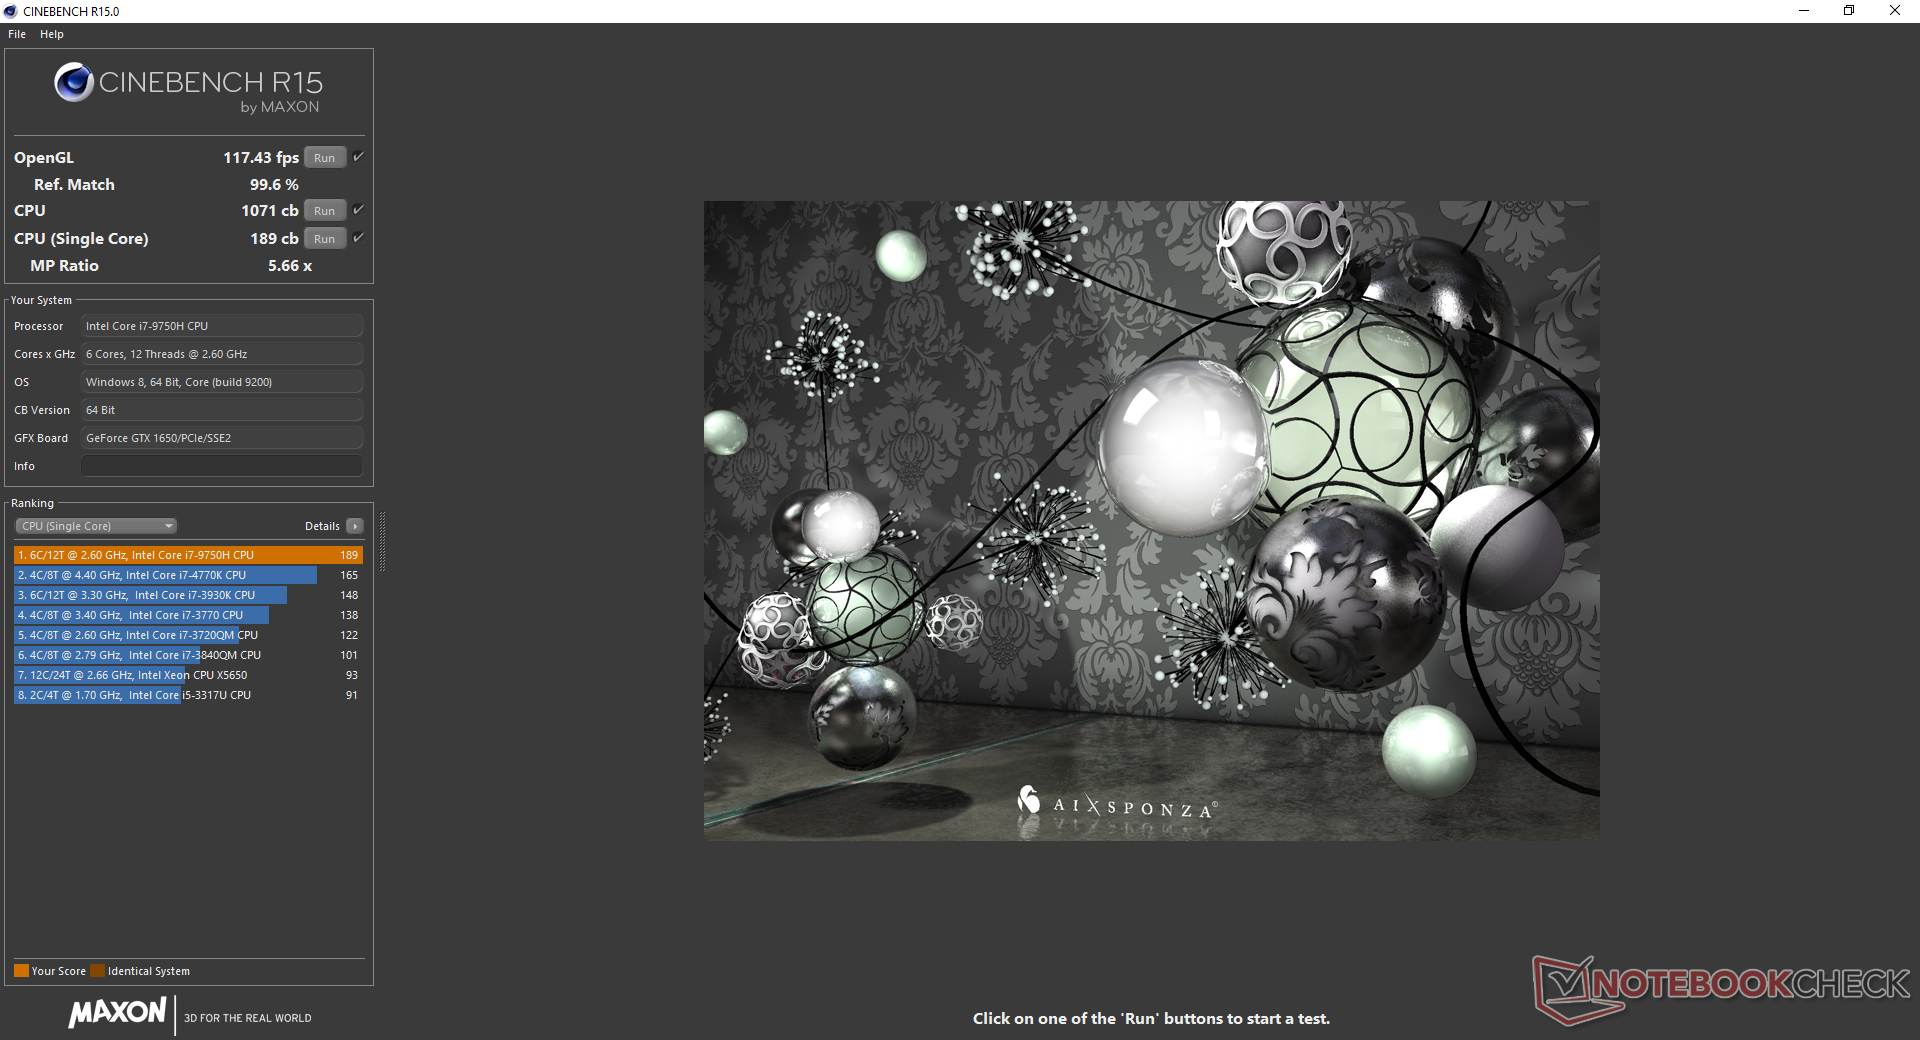
CPU performance is 10 percent slower than the average Core i7-9750H CPU in our database taken from 20 other gaming laptops. In fact, results are only marginally better than the Core i7-8750H in last year's GF75 8RD by just a couple of percentage points. The jump from 8th gen Core i7 to 9th gen Core i7 is negligible for gaming purposes.
When running CineBench R15 Multi-Thread in a loop, we can observe a performance dip of almost 13 percent by the second loop since the processor is unable to sustain maximum Turbo Boost clock rates indefinitely. The Eurocom Nightsky RX17 with the same i7-9750H CPU is able to maintain a +16 percent lead over our MSI.
See our dedicated page on the Core i7-9750H for more technical information and benchmark comparisons.
System Performance
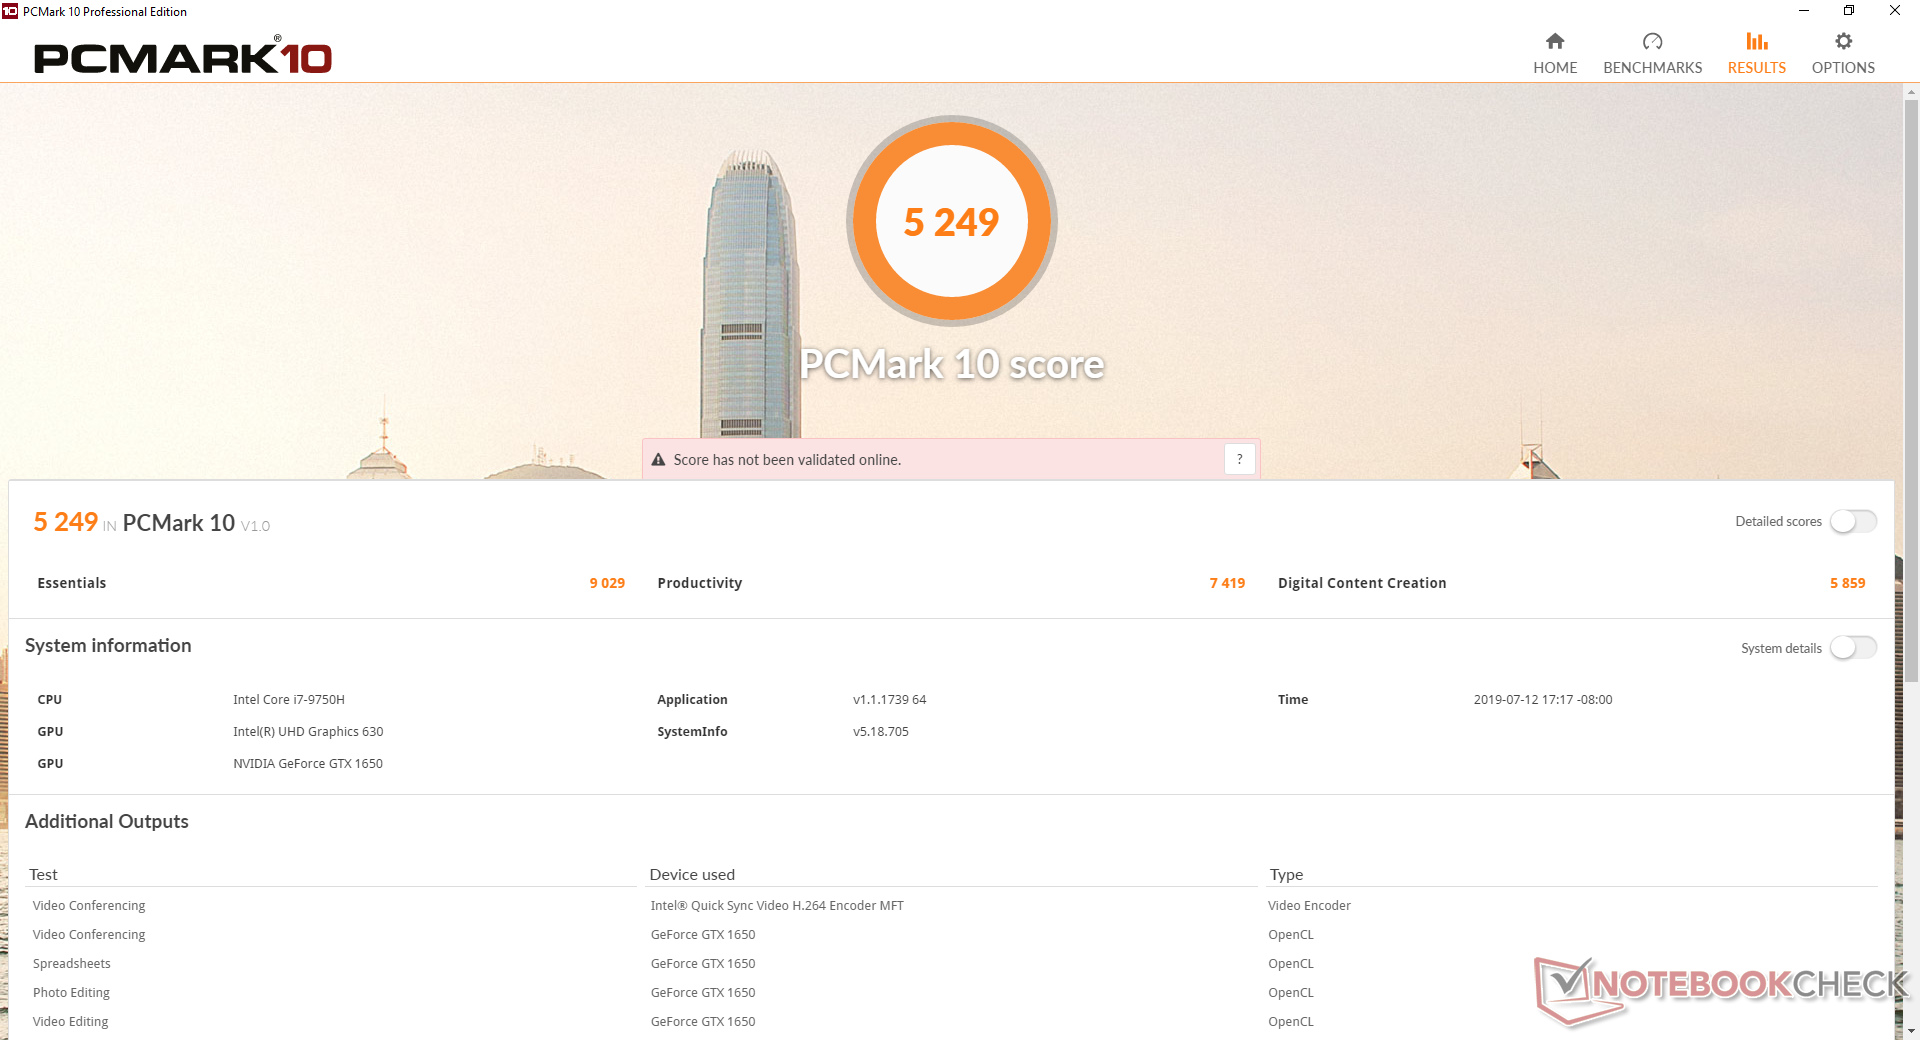
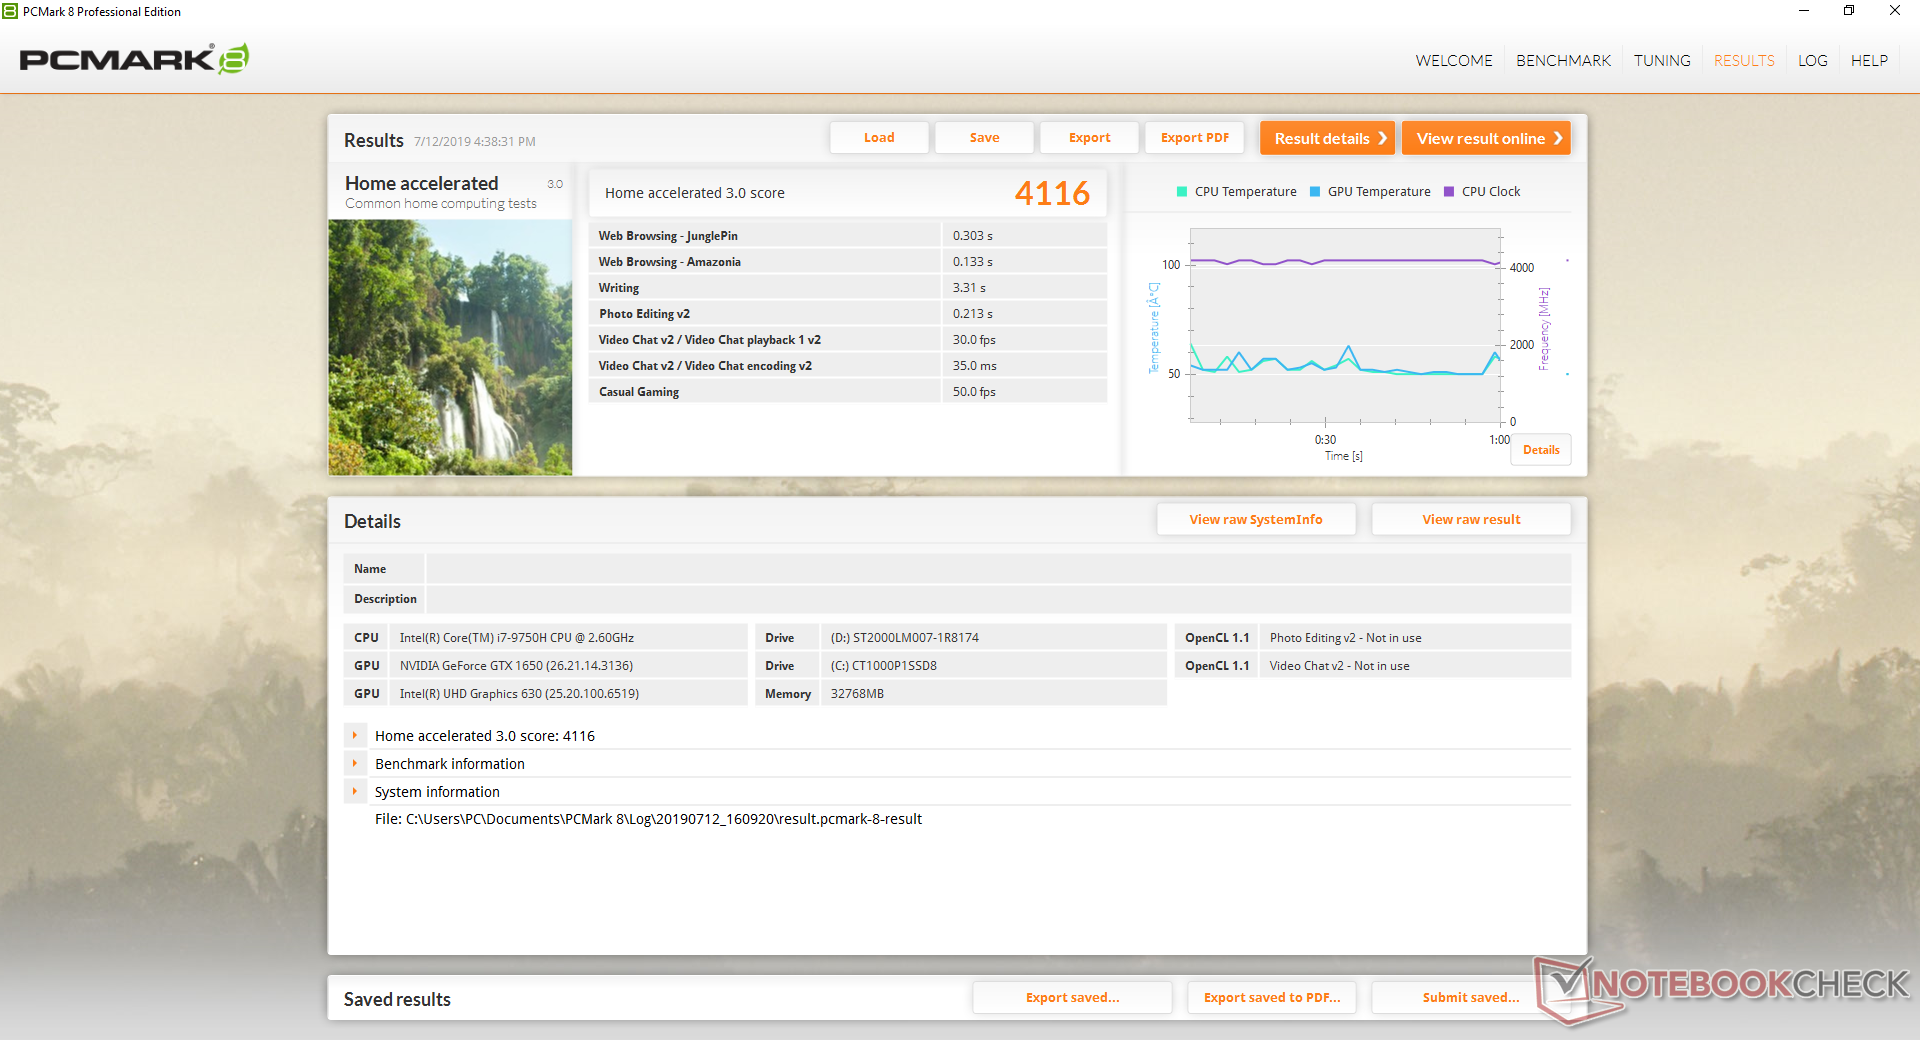
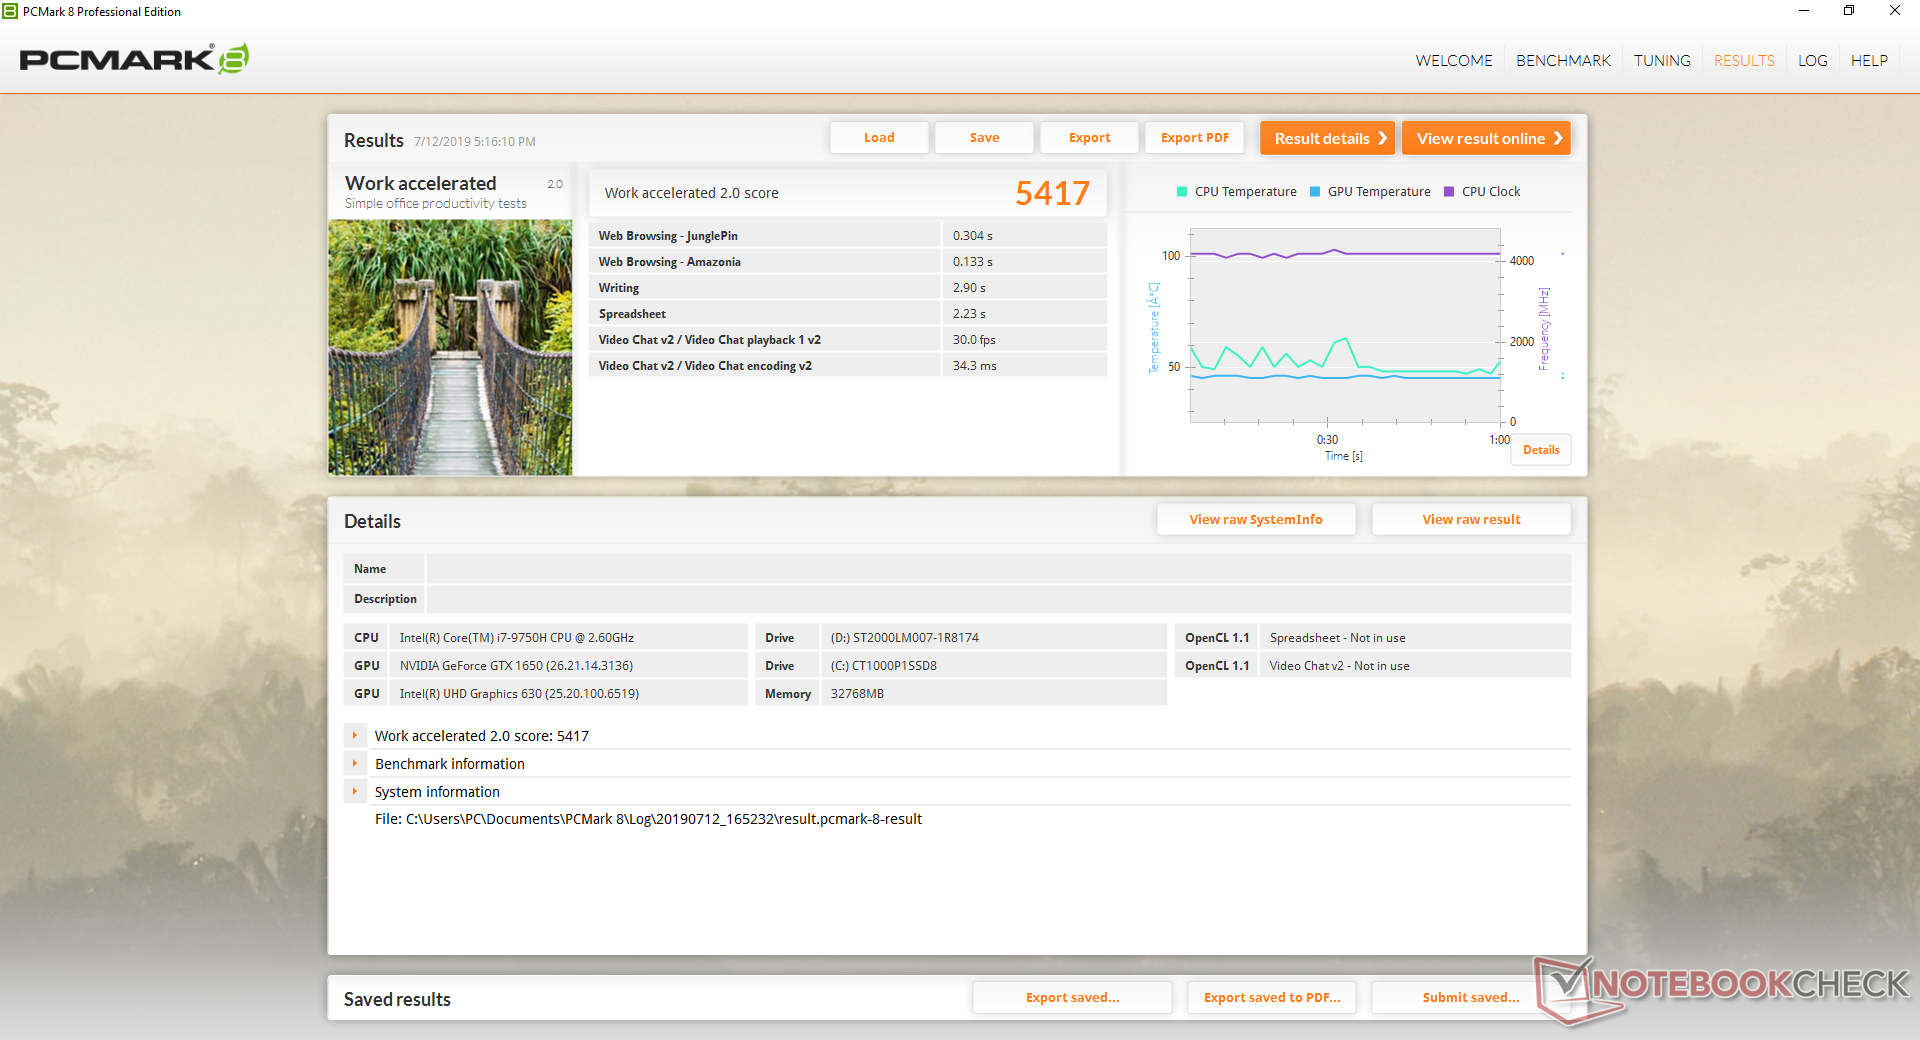
PCMark benchmarks rank the GF75 9SC consistently ahead of last year's GF75 8RD. We didn't experience any software or hardware issues during our time with the unit aside from the annoying MSI registration and pre-installed Norton Anti-Virus pop-ups.
| PCMark 8 | |
| Home Score Accelerated v2 | |
| Lenovo Legion Y740-17ICH | |
| Asus TUF FX705DT-AU068T | |
| MSI GF75 Thin 9SC | |
| MSI GF72VR 7RF | |
| MSI GF75 8RD-001 | |
| MSI GP75 Leopard 9SD | |
| Work Score Accelerated v2 | |
| Lenovo Legion Y740-17ICH | |
| MSI GP75 Leopard 9SD | |
| MSI GF75 Thin 9SC | |
| MSI GF75 8RD-001 | |
| MSI GF72VR 7RF | |
| Asus TUF FX705DT-AU068T | |
| PCMark 8 Home Score Accelerated v2 | 4116 points | |
| PCMark 8 Work Score Accelerated v2 | 5417 points | |
| PCMark 10 Score | 5249 points | |
Help | ||
Storage Devices
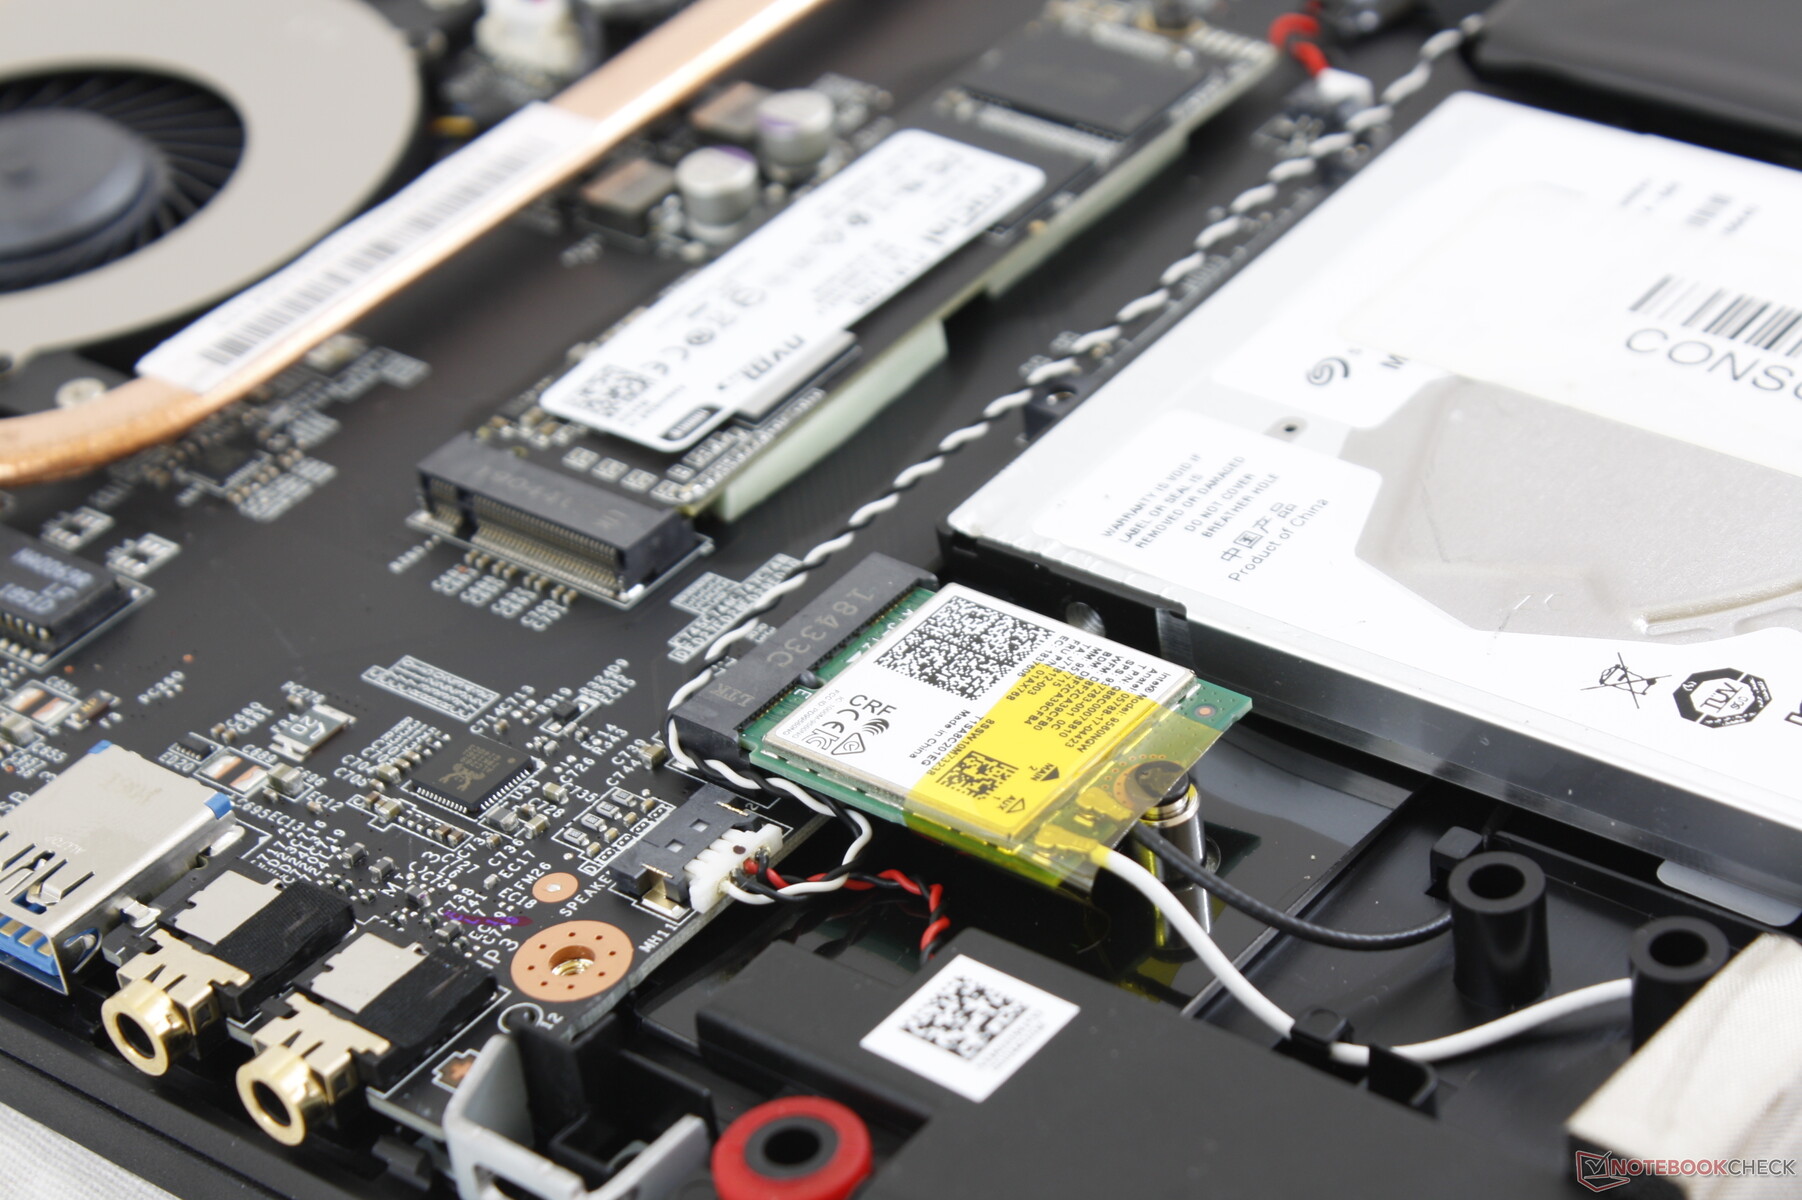
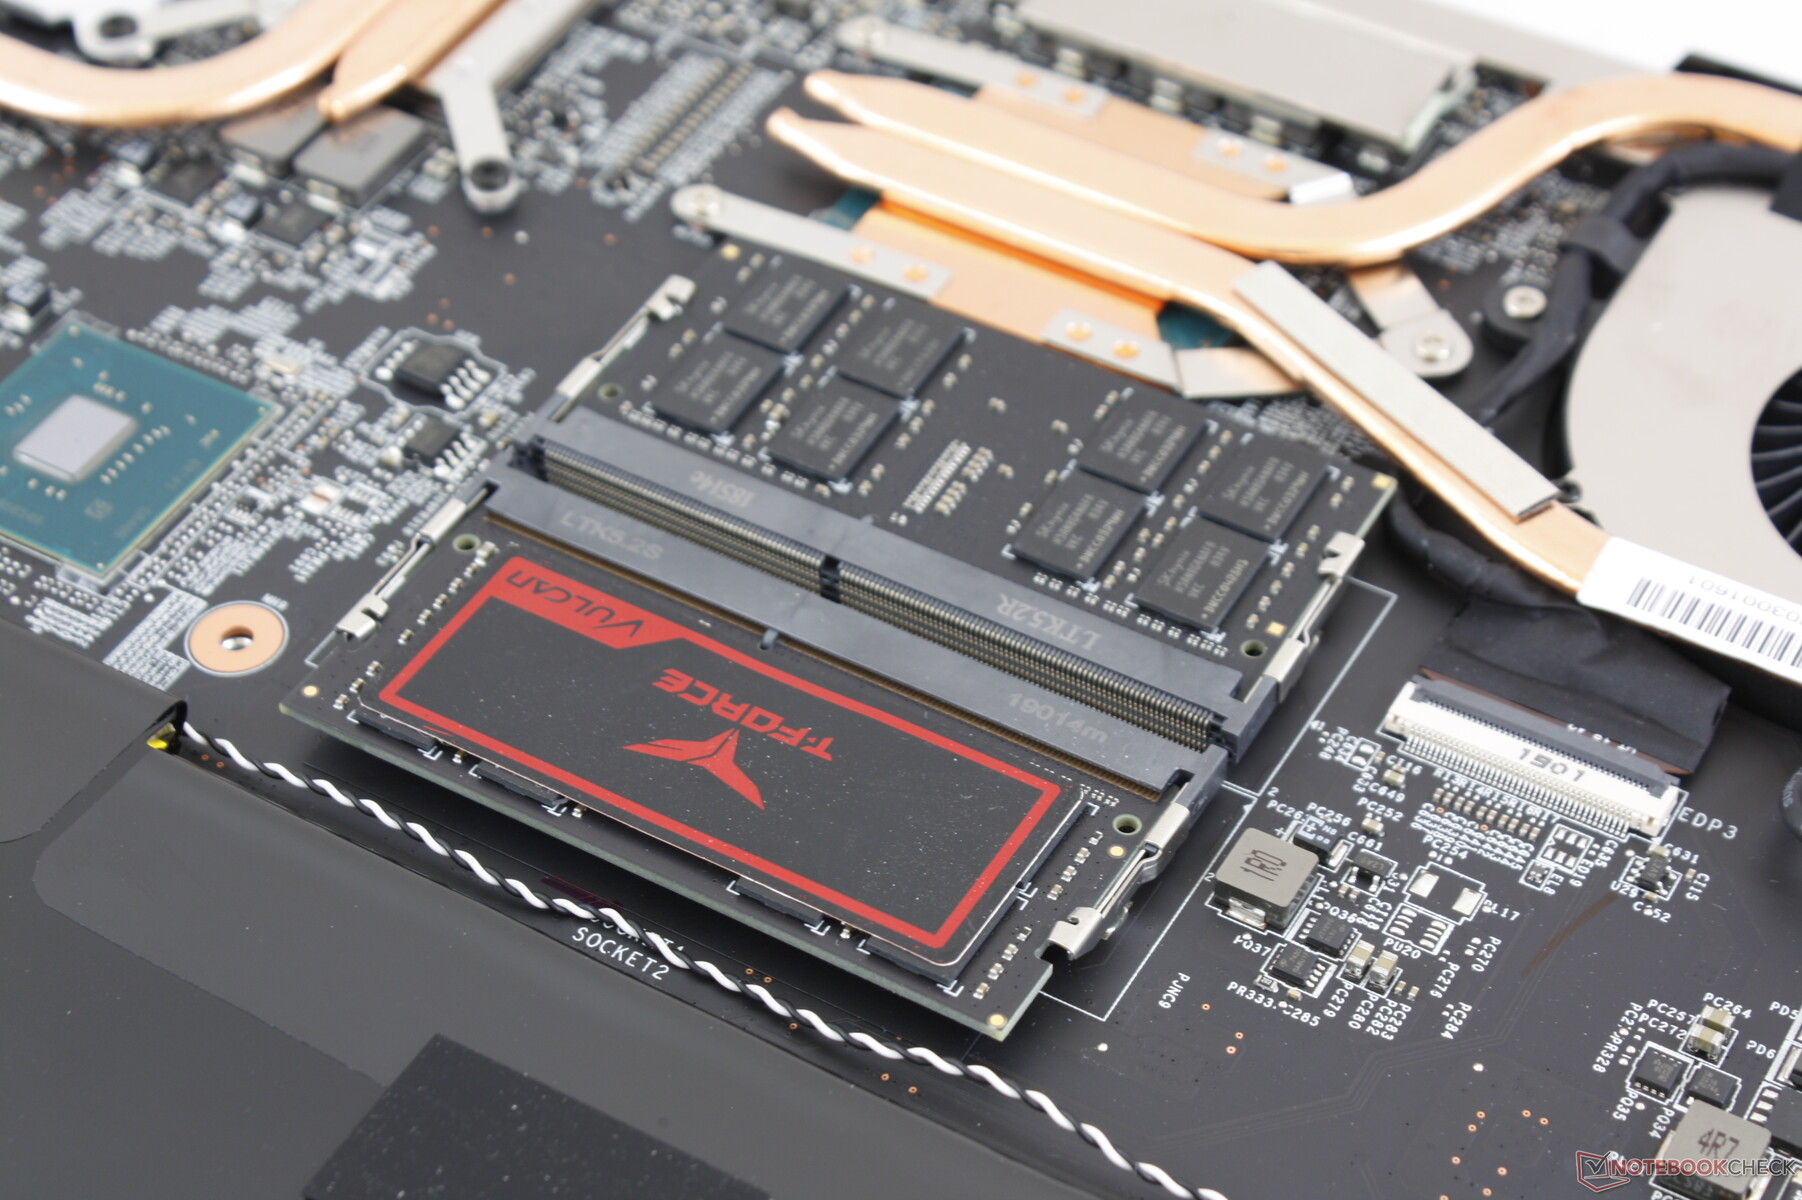
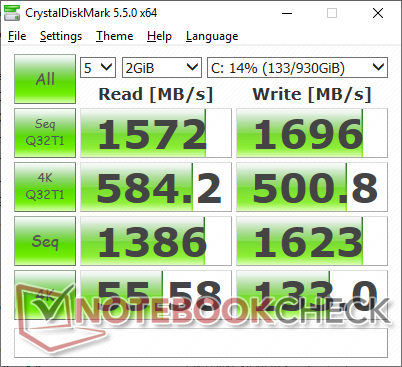
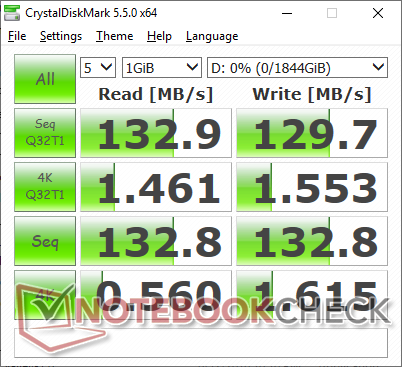
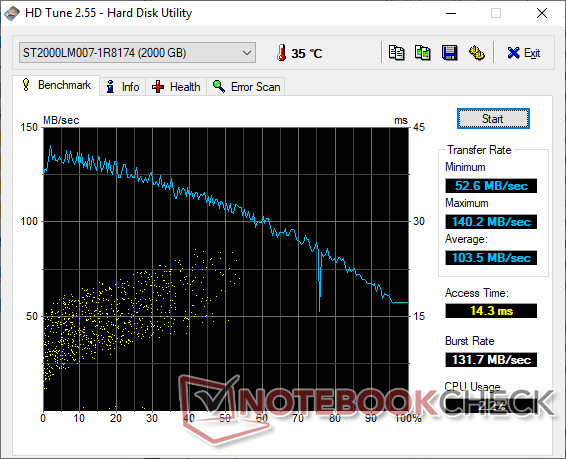
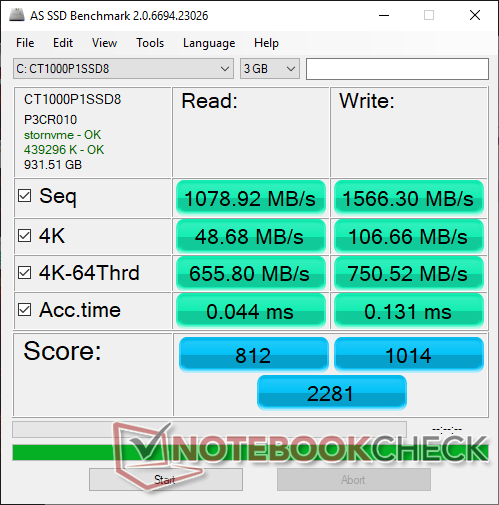
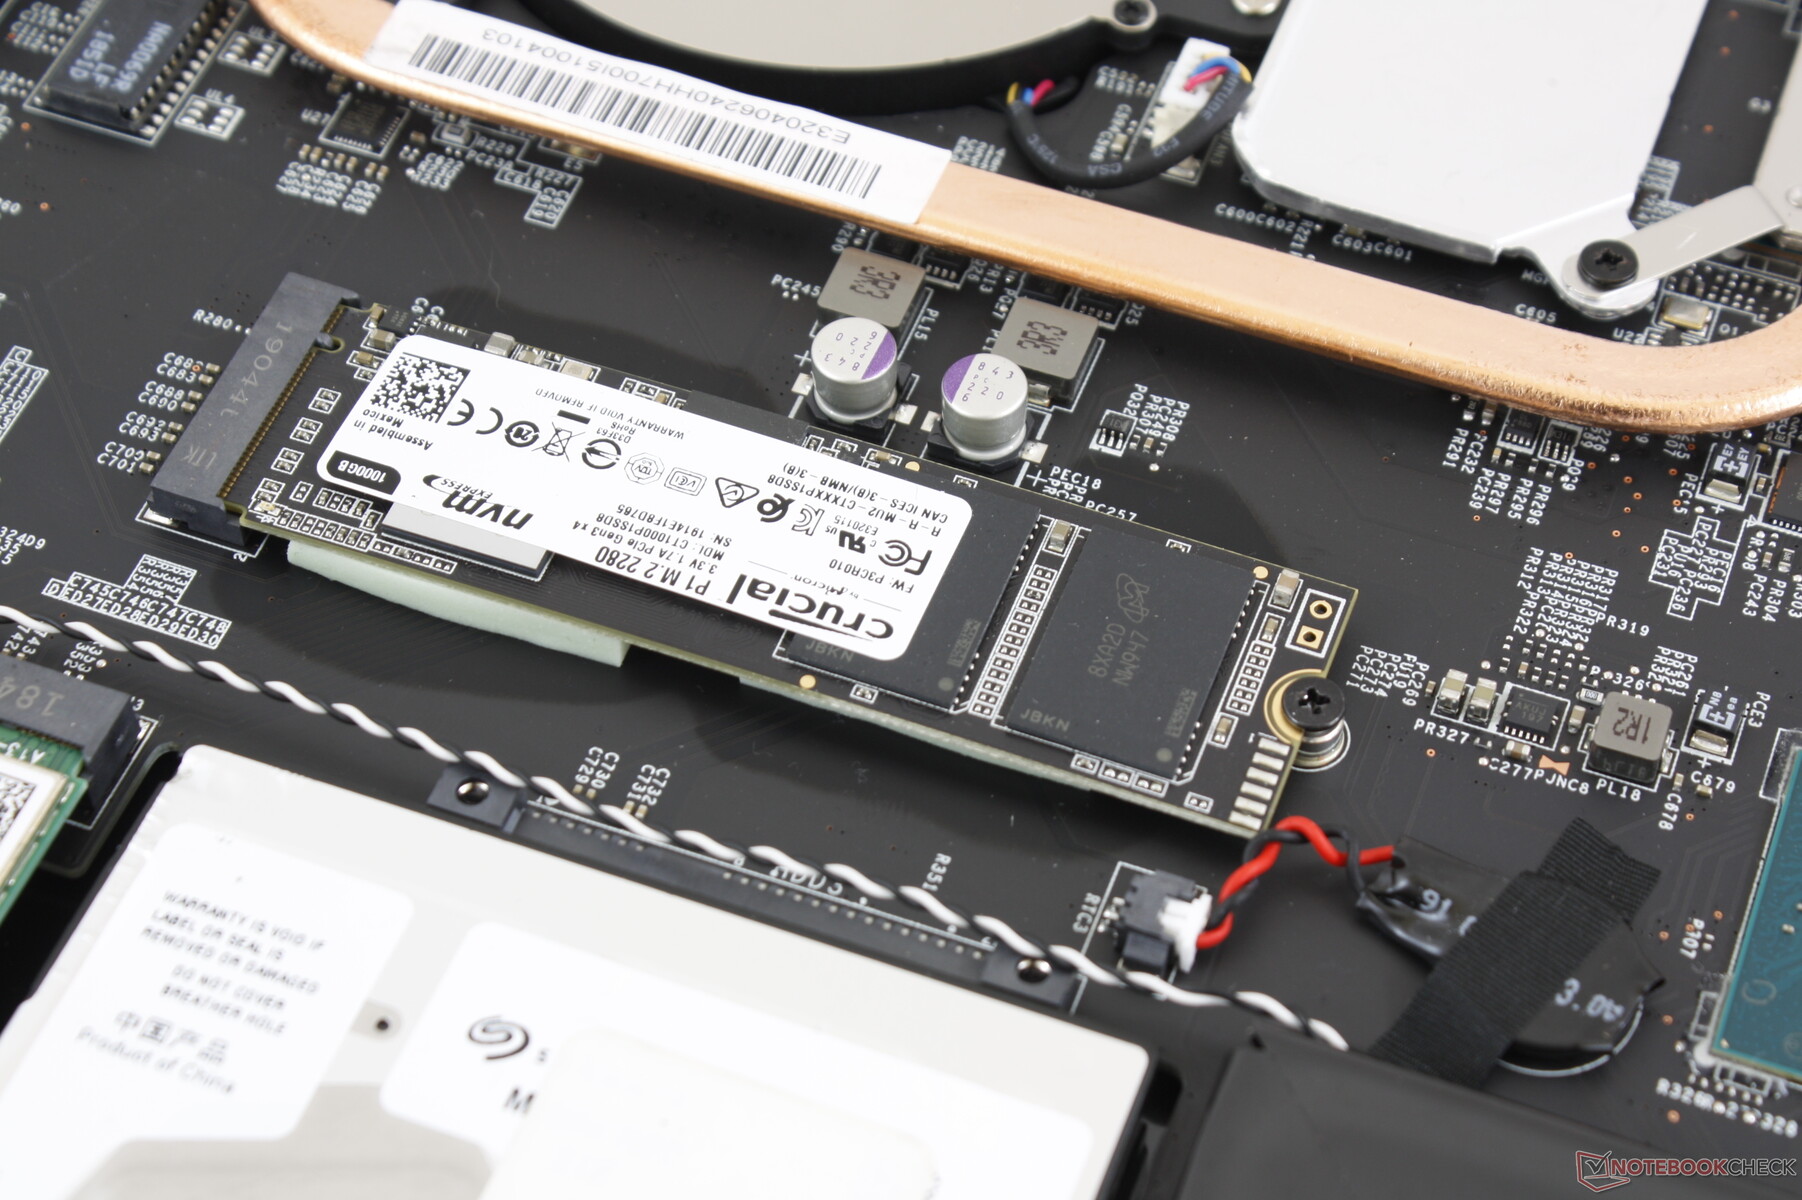
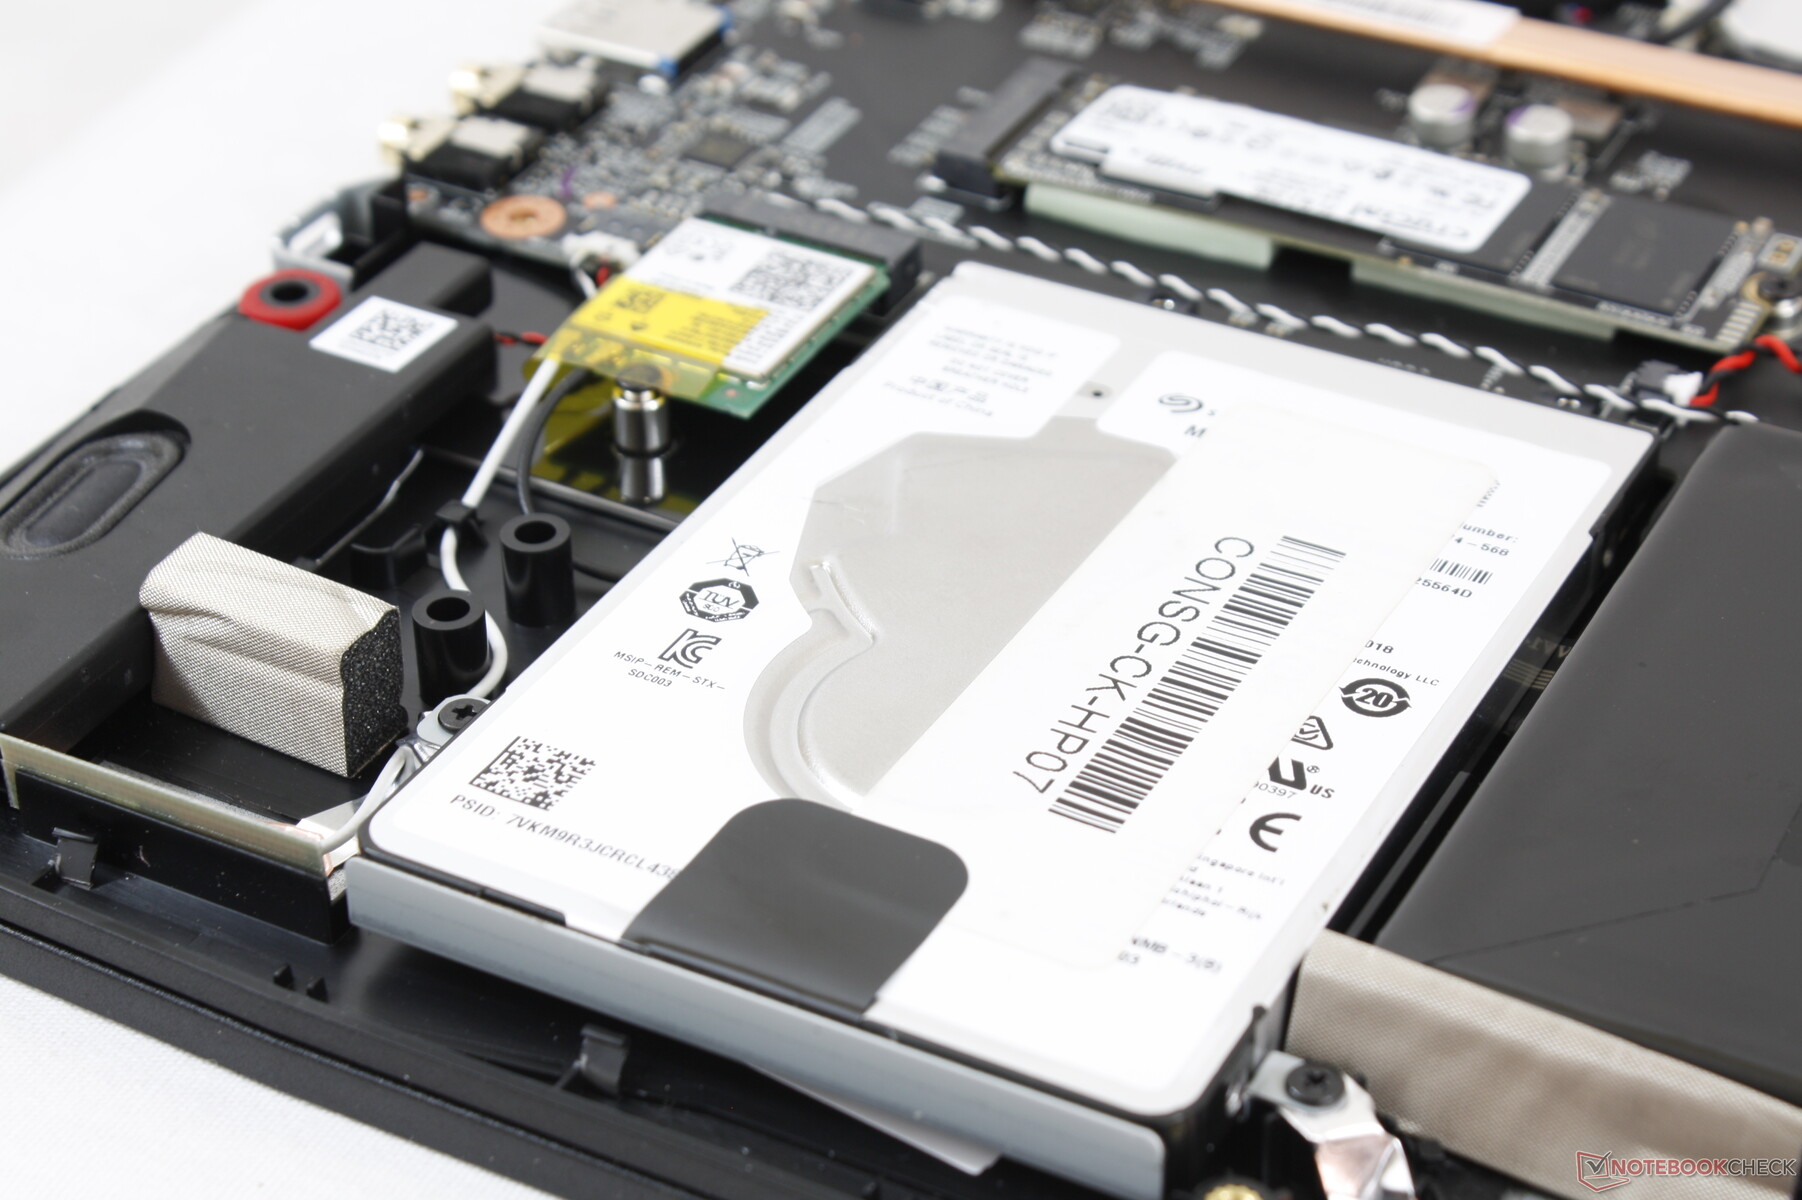
Two internal storage bays are available in the form of M.2 2280 PCIe and a 2.5-inch SATA III bay. Our test unit from CUKUSA comes equipped with a 1 TB Crucial P1 SSD and a secondary 5400 RPM 2 TB Seagate HDD. Other resellers are likely to offer different brands and capacity configurations.
We're able to record sequential read and write rates of about 1100 MB/s and 1600 MB/s, respectively, from the Crucial SSD. In comparison, the faster and more expensive 512 GB Samsung SSD PM981 in the MSI GS65 can perform in the 1600 to 2000 MB/s range. For the target budget gamer, however, higher SSD capacity will generally be more desirable than faster transfer rates.
See our table of HDDs and SSDs for more benchmark comparisons.
| MSI GF75 Thin 9SC Crucial P1 SSD CT1000P1SSD8 | MSI GF72VR 7RF Samsung PM961 MZVLW256HEHP | Asus TUF FX705DT-AU068T WDC PC SN520 SDAPNUW-256G | MSI GP75 Leopard 9SD Kingston RBUSNS8154P3256GJ1 | Lenovo Legion Y740-17ICH Samsung SSD PM981 MZVLB256HAHQ | |
|---|---|---|---|---|---|
| AS SSD | 19% | -28% | -65% | 9% | |
| Seq Read (MB/s) | 1079 | 2337 117% | 1546 43% | 748 -31% | 1153 7% |
| Seq Write (MB/s) | 1566 | 897 -43% | 1182 -25% | 219 -86% | 1328 -15% |
| 4K Read (MB/s) | 48.68 | 48.49 0% | 36.54 -25% | 25.7 -47% | 35.05 -28% |
| 4K Write (MB/s) | 106.7 | 126.1 18% | 109.2 2% | 82.4 -23% | 96 -10% |
| 4K-64 Read (MB/s) | 656 | 1122 71% | 612 -7% | 259.3 -60% | 727 11% |
| 4K-64 Write (MB/s) | 751 | 359.7 -52% | 436.6 -42% | 190.2 -75% | 1212 61% |
| Access Time Read * (ms) | 0.044 | 0.053 -20% | 0.113 -157% | 0.159 -261% | 0.063 -43% |
| Access Time Write * (ms) | 0.131 | 0.03 77% | 0.034 74% | 0.058 56% | 0.04 69% |
| Score Read (Points) | 812 | 1405 73% | 803 -1% | 360 -56% | 878 8% |
| Score Write (Points) | 1014 | 575 -43% | 664 -35% | 294 -71% | 1441 42% |
| Score Total (Points) | 2281 | 2635 16% | 1869 -18% | 821 -64% | 2784 22% |
| Copy ISO MB/s (MB/s) | 1414 | 698 -51% | 1487 5% | ||
| Copy Program MB/s (MB/s) | 531 | 114.1 -79% | 608 15% | ||
| Copy Game MB/s (MB/s) | 1483 | 379.6 -74% | 1162 -22% |
* ... smaller is better

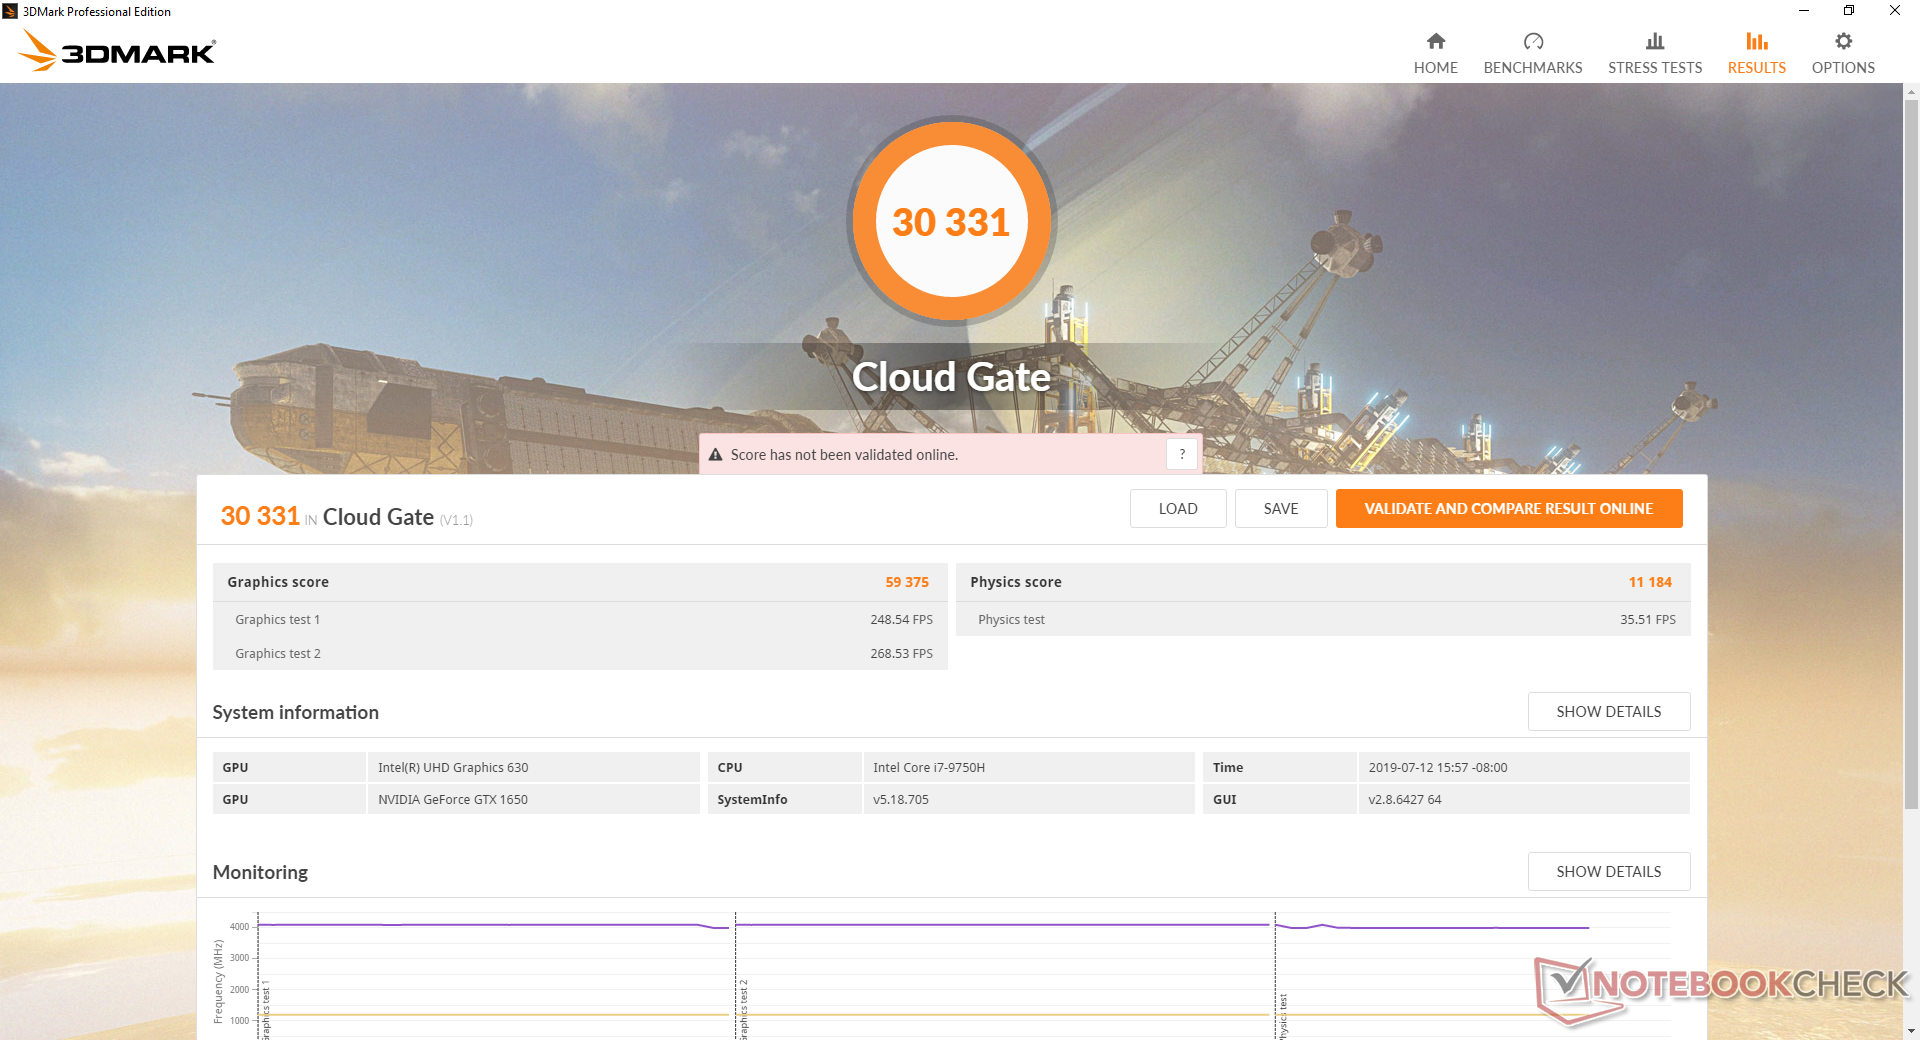
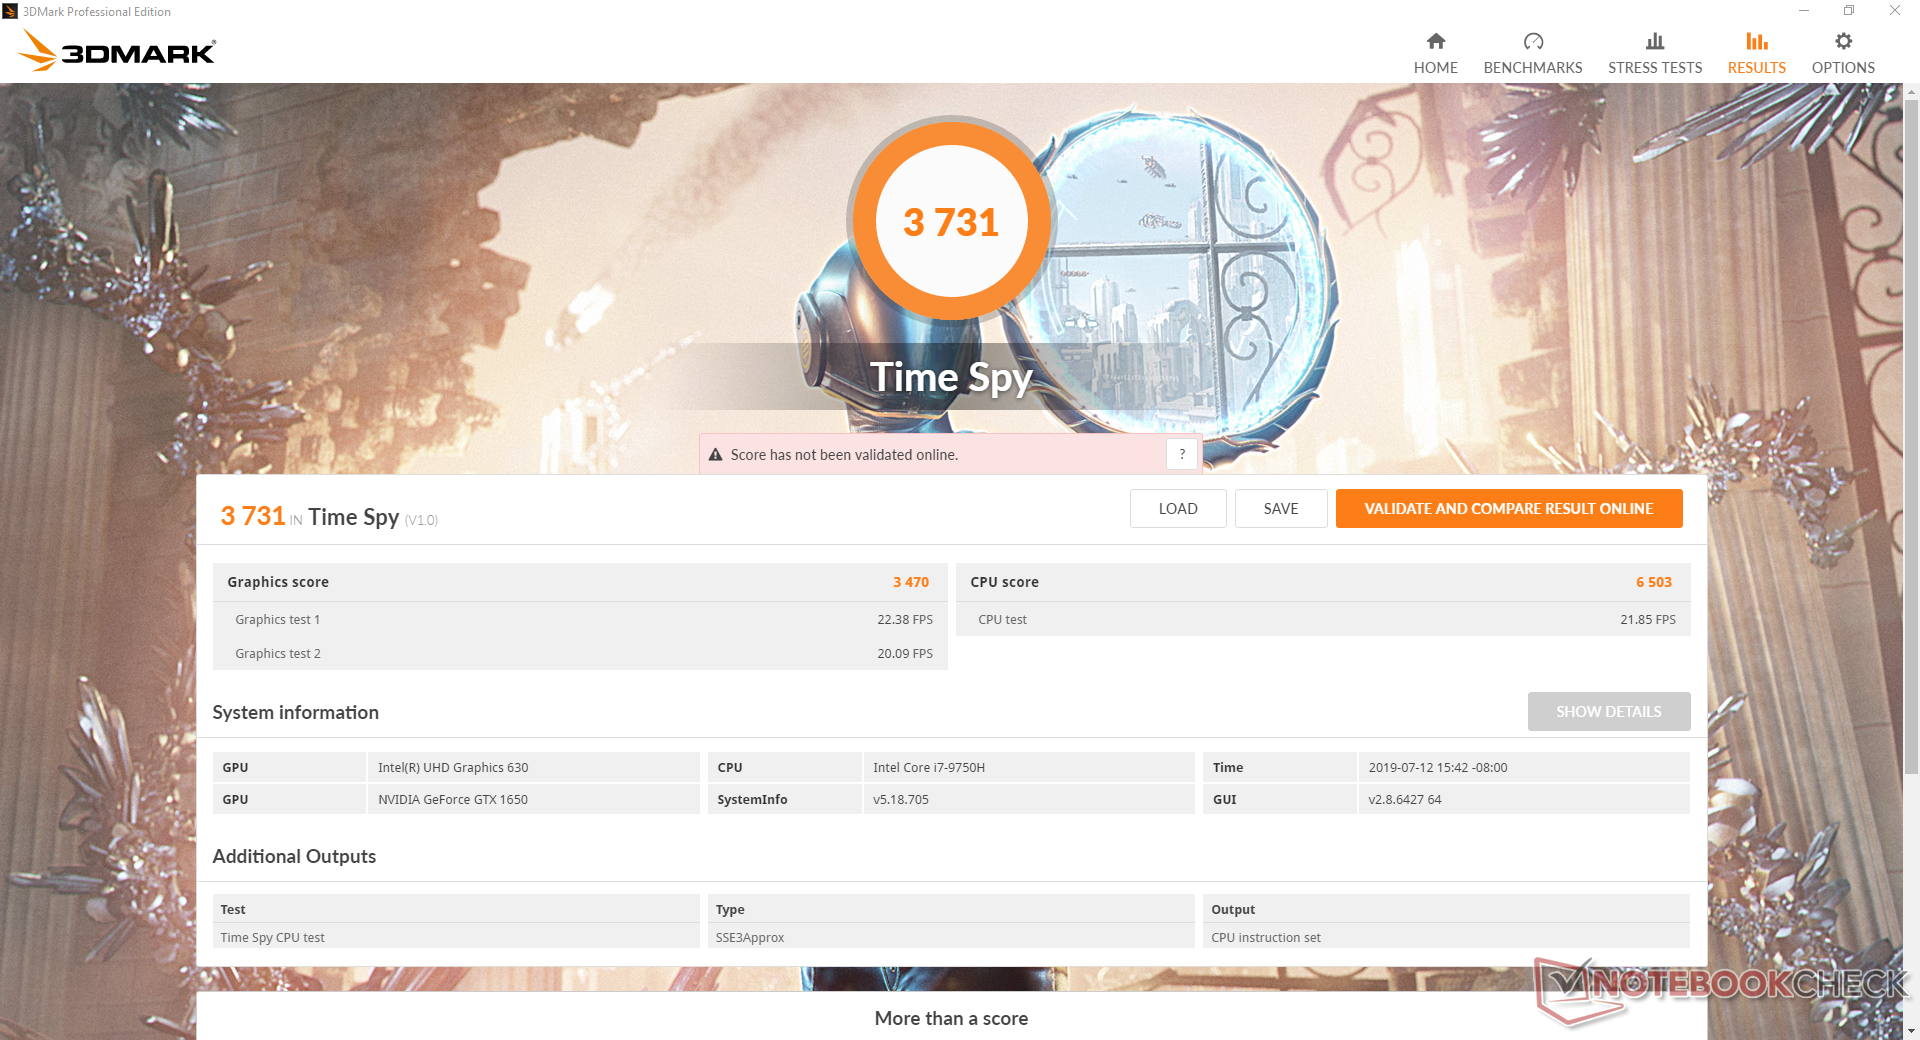
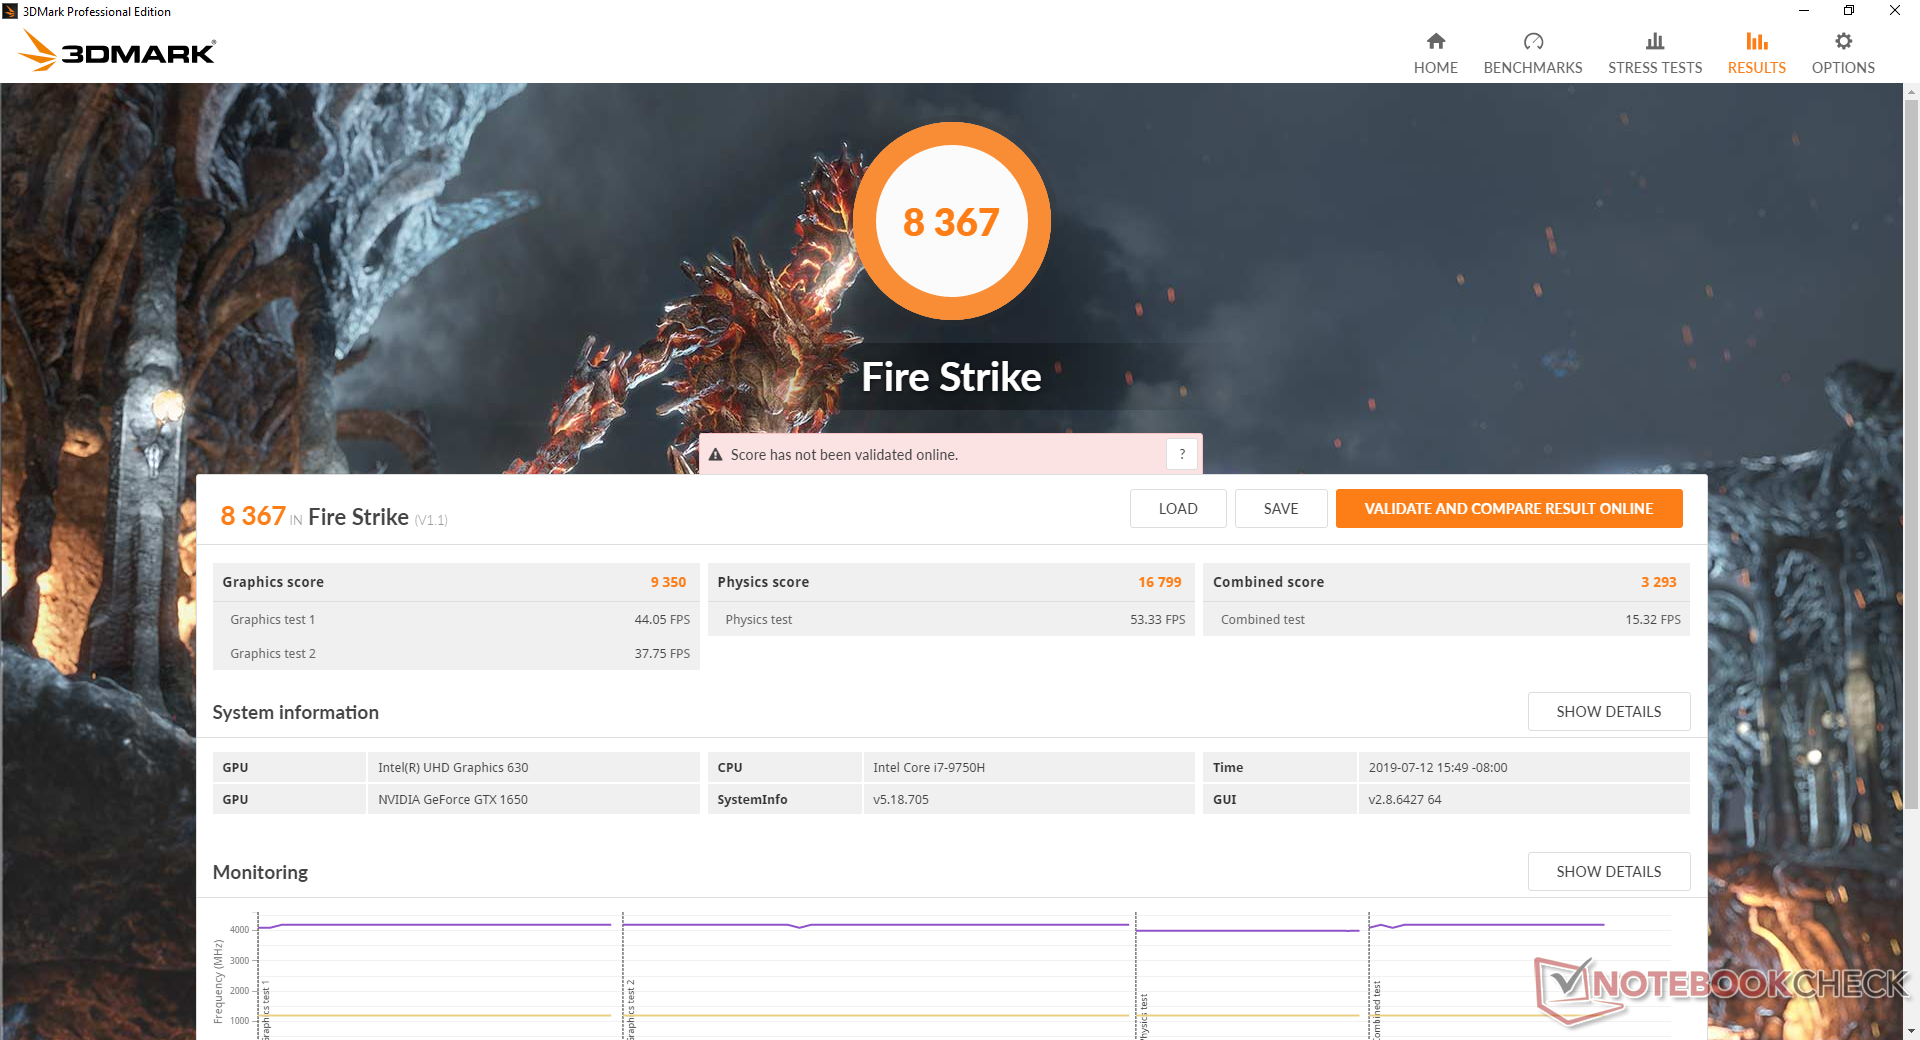
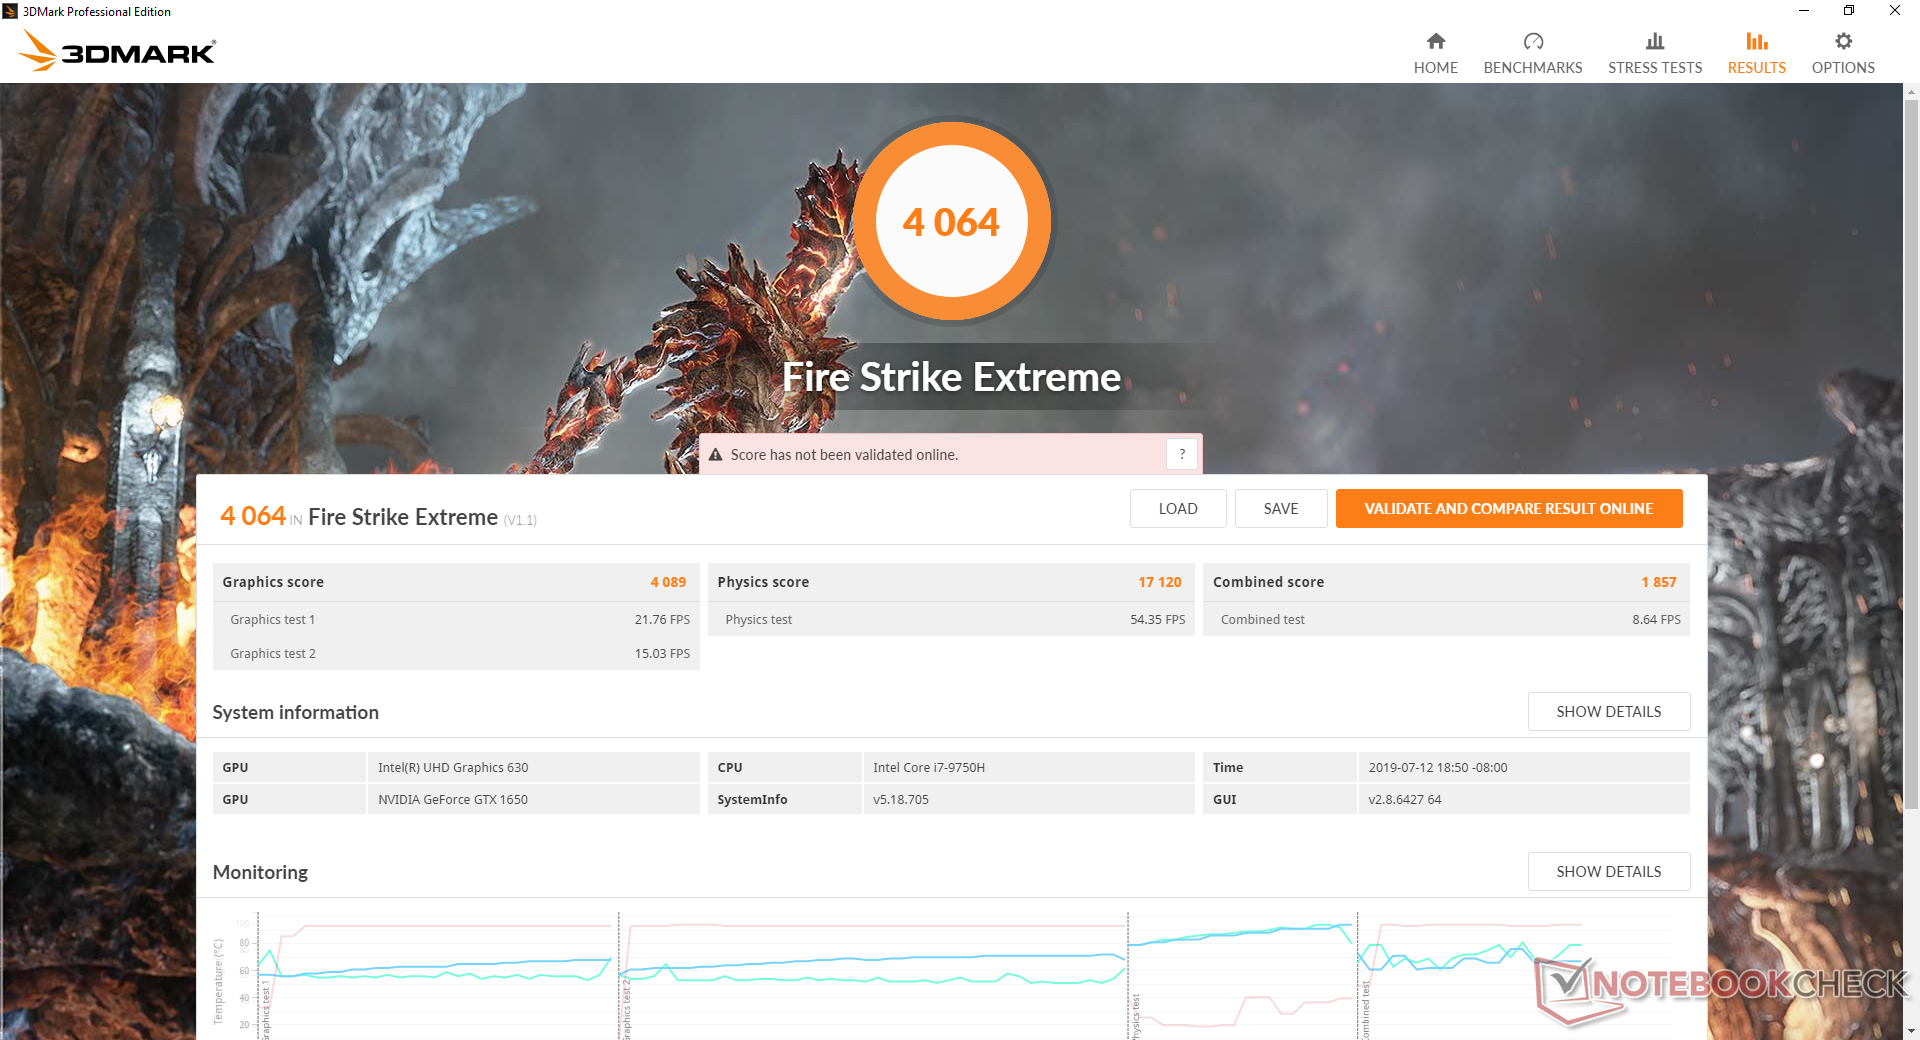
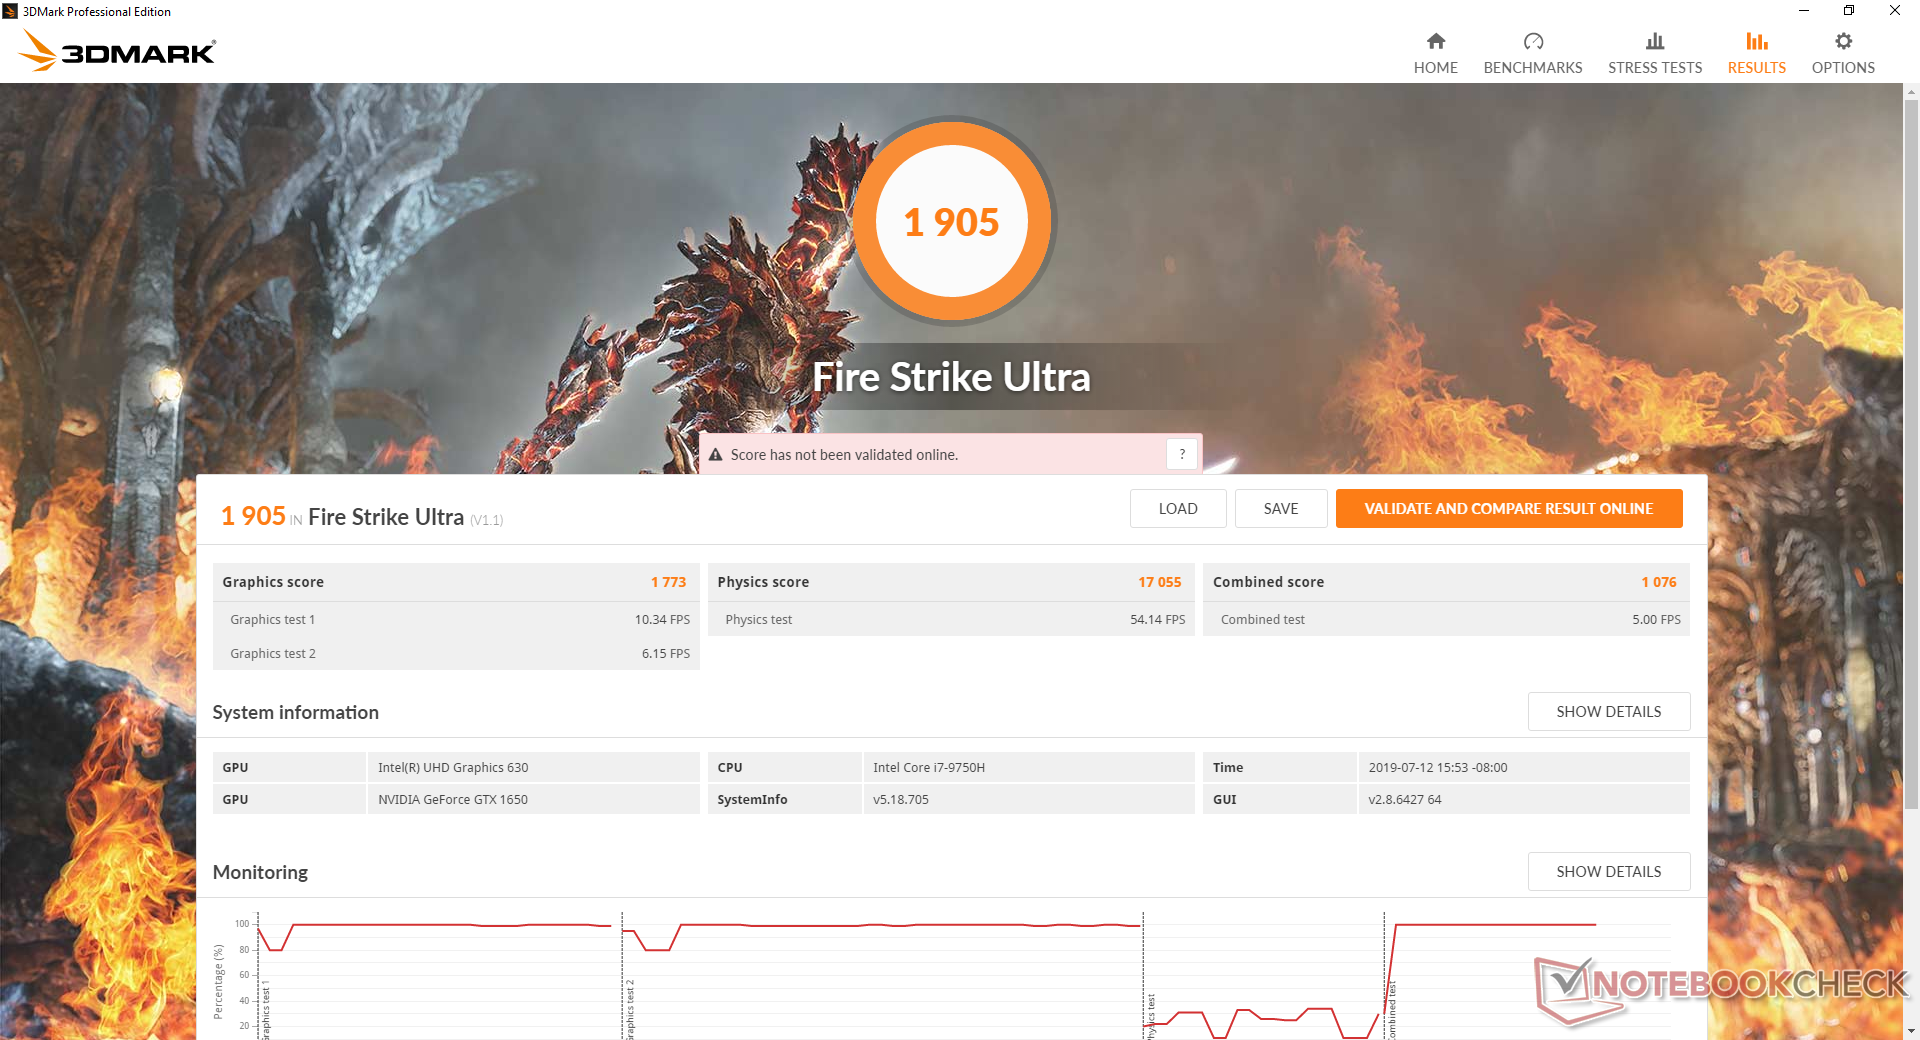
GPU Performance
Graphics performance is where we expect it to be when compared to other gaming laptops in our database sporting the same GeForce GTX 1650 GPU. Results are on par with the last generation GTX 1060 when running DX12 titles and about 15 to 20 percent slower than the same GPU when running DX11 titles according to 3DMark benchmarks. Thus, users will want to enable DX12 when playing the latest titles to make the most of the Nvidia Turing GPU. Overall performance is about 30 to 60 percent faster than the old GTX 1050 Ti or GTX 1050 Ti Max-Q that the GTX 1650 directly replaces.
The best part about the mobile GTX 1650 is that it is essentially on par with the desktop GTX 1650. In contrast, the mobile RTX 2060 can be about 25 percent slower than the desktop RTX 2060.
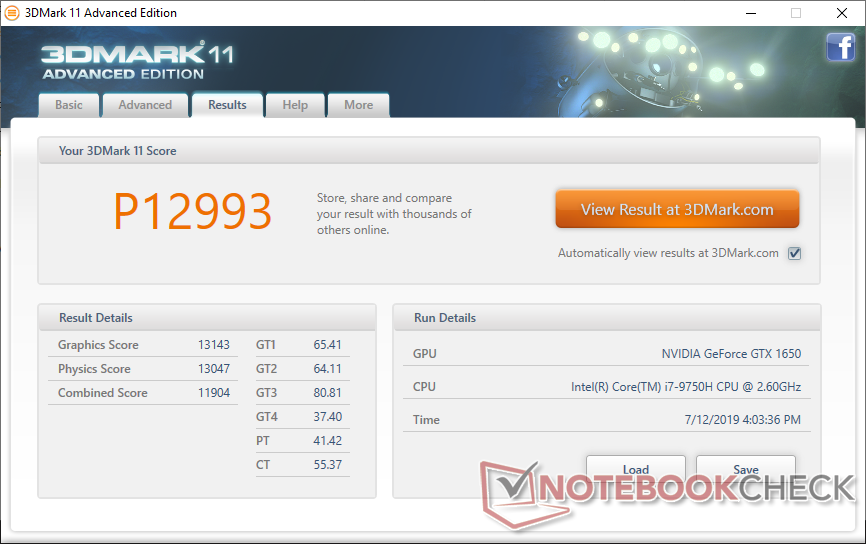
| 3DMark 11 Performance | 12993 points | |
| 3DMark Cloud Gate Standard Score | 30331 points | |
| 3DMark Fire Strike Score | 8367 points | |
| 3DMark Fire Strike Extreme Score | 4064 points | |
| 3DMark Time Spy Score | 3731 points | |
Help | ||
Gaming Performance
Performance in Shadow of the Tomb Raider is on par with the Asus ROG GX531GM equipped with GTX 1060 graphics as predicted by the 3DMark results above. The system is perfectly capable of playing the latest games at 1080p so long as users are satisfied with low-medium to medium settings. It's unfortunate that G-Sync is unavailable as it would have paired nicely with the GTX 1650.
Running Witcher 3 shows no recurring frame dips to suggest no interrupting background activity when gaming. See our dedicated page on the GeForce GTX 1650 for more technical information and gaming benchmarks.
| Shadow of the Tomb Raider - 1920x1080 Highest Preset AA:T | |
| MSI GE75 9SG | |
| Asus G752VS | |
| Asus ROG Zephyrus G15 GA502DU | |
| MSI GF75 Thin 9SC | |
| Average NVIDIA GeForce GTX 1650 Mobile (34 - 47, n=15) | |
| Asus Zephyrus S GX531GM | |
| Asus TUF FX505DT-EB73 | |
| Asus G752VY | |
| Asus TUF FX705GE-EW096T | |
| low | med. | high | ultra | |
|---|---|---|---|---|
| BioShock Infinite (2013) | 319.5 | 251 | 221.6 | 90.4 |
| The Witcher 3 (2015) | 209.1 | 126 | 67.6 | 37.7 |
| Shadow of the Tomb Raider (2018) | 128 | 59 | 51 | 45 |
Emissions
System Noise
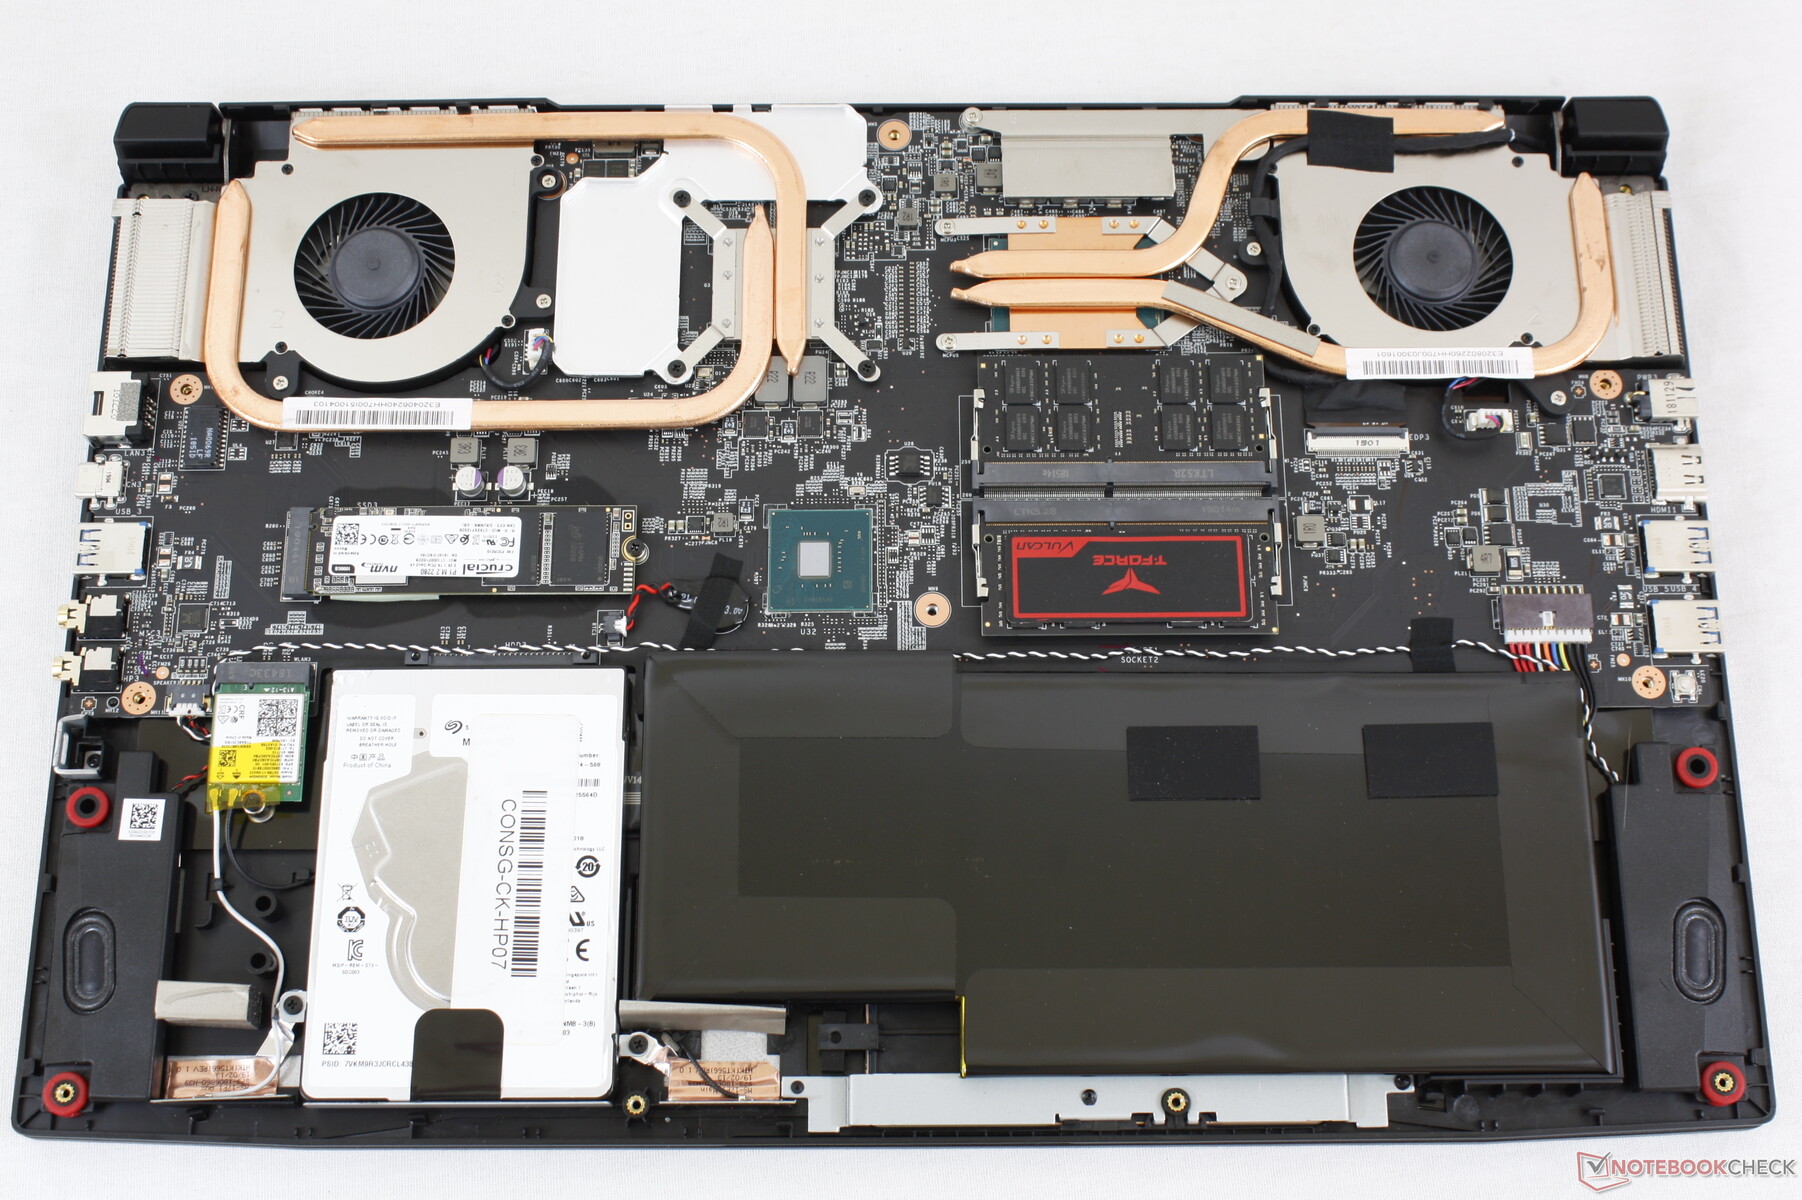
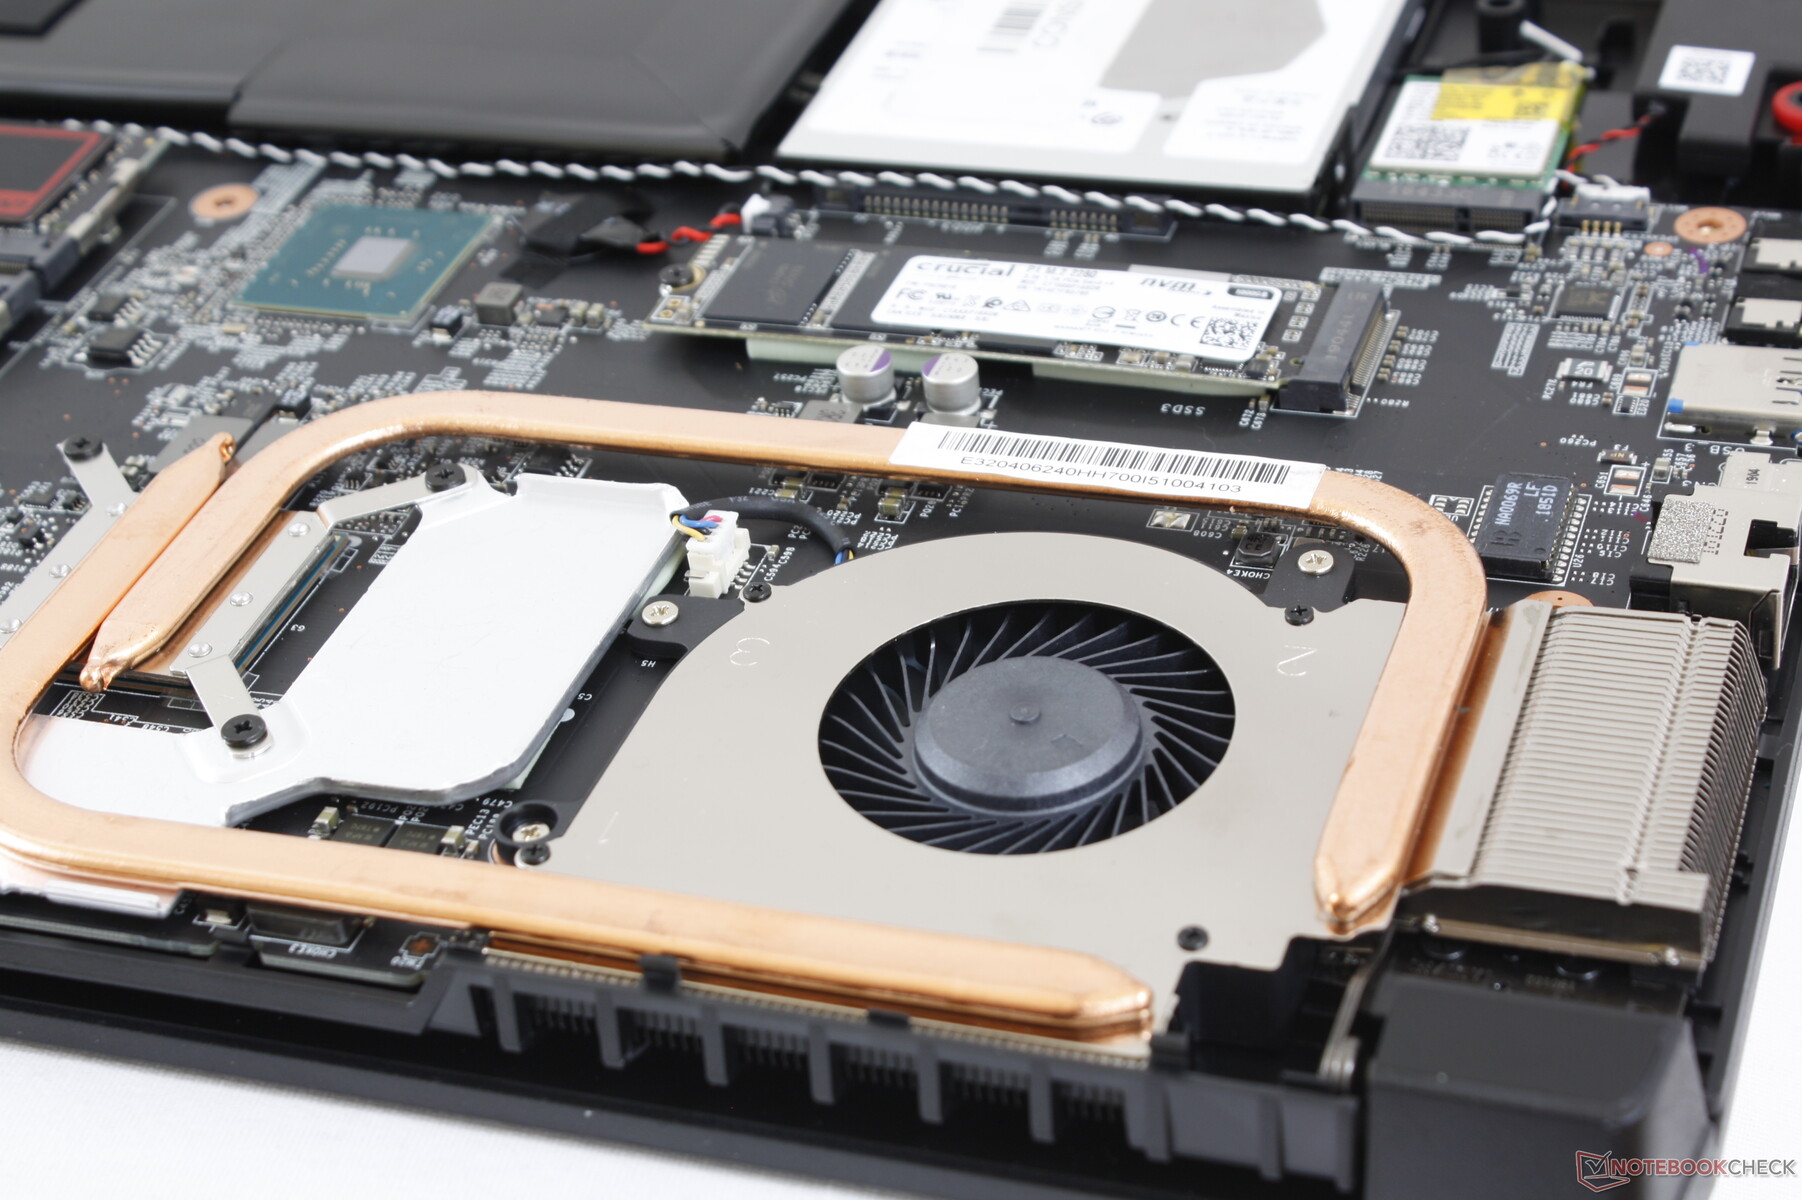
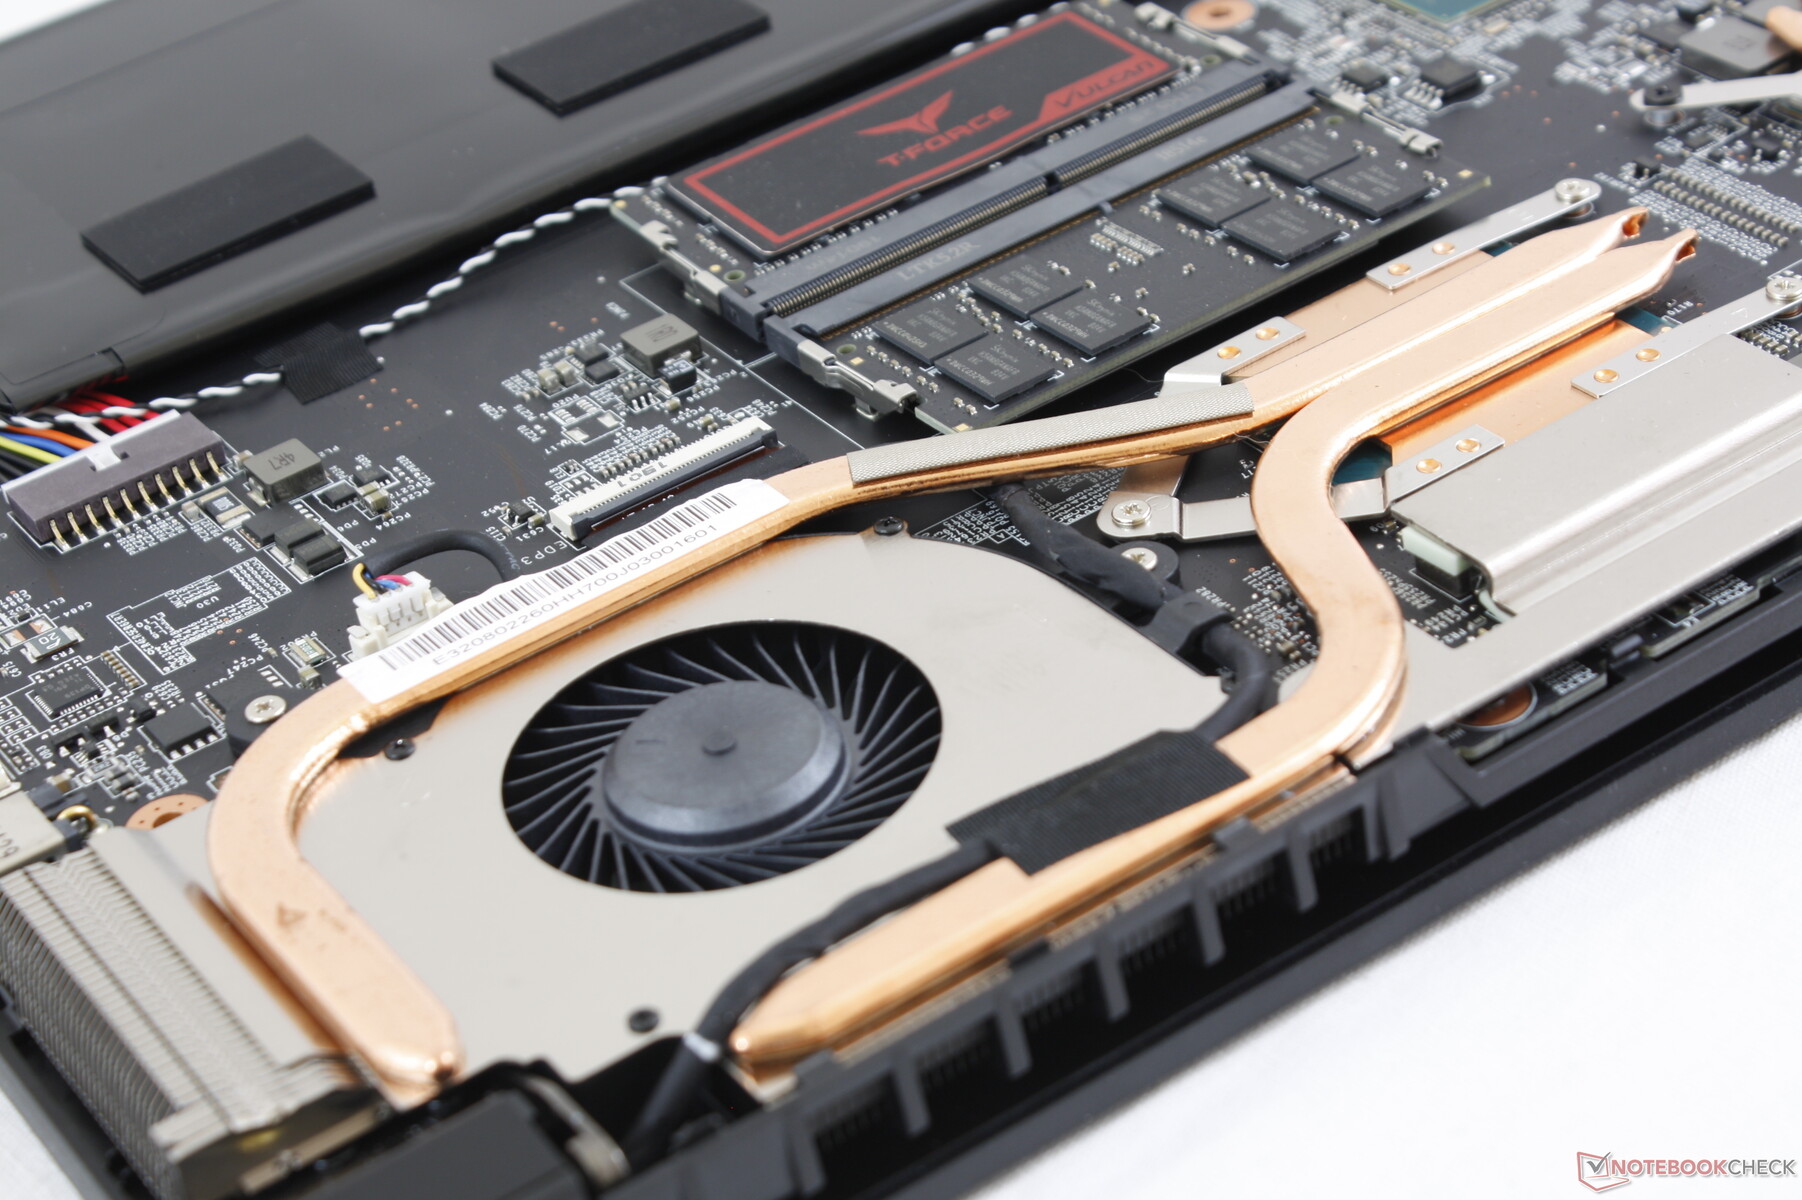
The CPU and GPU each get a fan and a pair of heat copper pipes. The cooling does not overlap between the processors which is rare for a budget gaming laptop. This means that one processor will not be thermally affected by the other since they do not share the same heat pipes.
The system fans almost never idle even when set to Eco mode. Expect a lowly but still audible fan noise of about 34 dB(A) when browsing or streaming video. When gaming, fan noise remains relatively constant at about 41 dB(A) to be quieter than many other gaming laptops where the mid-to-high 40 dB(A) range is more common. The MSI GP75 Leopard with faster GTX 1660 Ti graphics, for example, tops out at over 50 dB(A) when under the same gaming conditions.
We're able to notice no electronic noise or coil whine from our test unit.
| MSI GF75 Thin 9SC GeForce GTX 1650 Mobile, i7-9750H, Crucial P1 SSD CT1000P1SSD8 | MSI GF72VR 7RF GeForce GTX 1060 Mobile, i7-7700HQ, Samsung PM961 MZVLW256HEHP | MSI GP75 Leopard 9SD GeForce GTX 1660 Ti Mobile, i7-9750H, Kingston RBUSNS8154P3256GJ1 | Lenovo Legion Y740-17ICH GeForce RTX 2080 Max-Q, i7-8750H, Samsung SSD PM981 MZVLB256HAHQ | HP Omen 17t-3AW55AV_1 GeForce GTX 1070 Mobile, i7-8750H, Samsung SSD PM981 MZVLB512HAJQ | Asus TUF FX505DT-EB73 GeForce GTX 1650 Mobile, R7 3750H, Intel SSD 660p SSDPEKNW512G8 | |
|---|---|---|---|---|---|---|
| Noise | -2% | -13% | 3% | -2% | 0% | |
| off / environment * (dB) | 28.2 | 28.1 -0% | 29 -3% | 28.3 -0% | 27.8 1% | 28.2 -0% |
| Idle Minimum * (dB) | 33.6 | 31.4 7% | 29 14% | 31.5 6% | 31.1 7% | 28.2 16% |
| Idle Average * (dB) | 33.6 | 31.4 7% | 34 -1% | 31.6 6% | 31.1 7% | 28.2 16% |
| Idle Maximum * (dB) | 33.8 | 32.6 4% | 37 -9% | 31.6 7% | 35 -4% | 31.4 7% |
| Load Average * (dB) | 37.2 | 39.4 -6% | 53 -42% | 32.3 13% | 42 -13% | 39.8 -7% |
| Witcher 3 ultra * (dB) | 40.6 | 45.3 -12% | 51 -26% | 43 -6% | 44.5 -10% | 47 -16% |
| Load Maximum * (dB) | 44.4 | 52 -17% | 55 -24% | 45.5 -2% | 46.5 -5% | 50.2 -13% |
* ... smaller is better
Noise level
| Idle |
| 33.6 / 33.6 / 33.8 dB(A) |
| Load |
| 37.2 / 44.4 dB(A) |
 | ||
30 dB silent 40 dB(A) audible 50 dB(A) loud |
||
min: | ||
Temperature
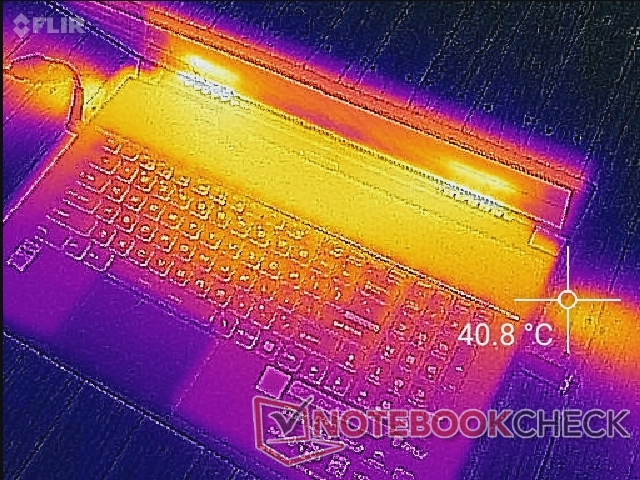
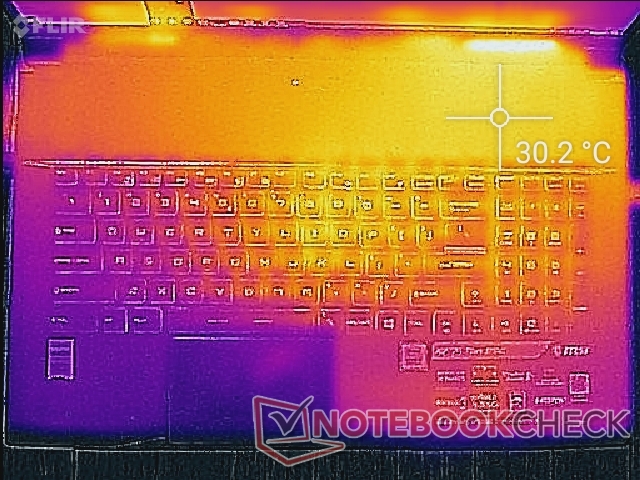
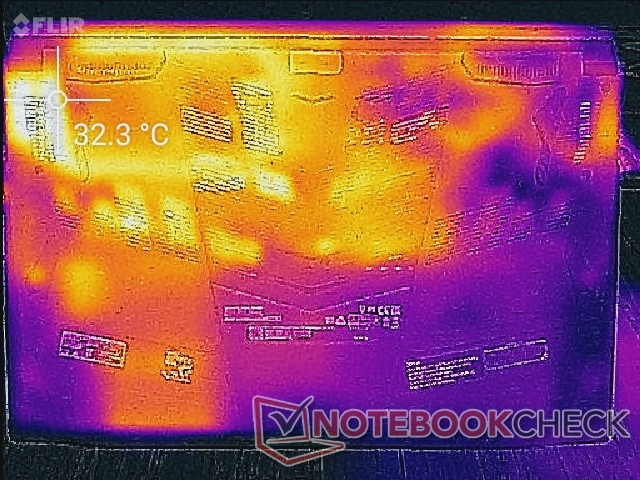
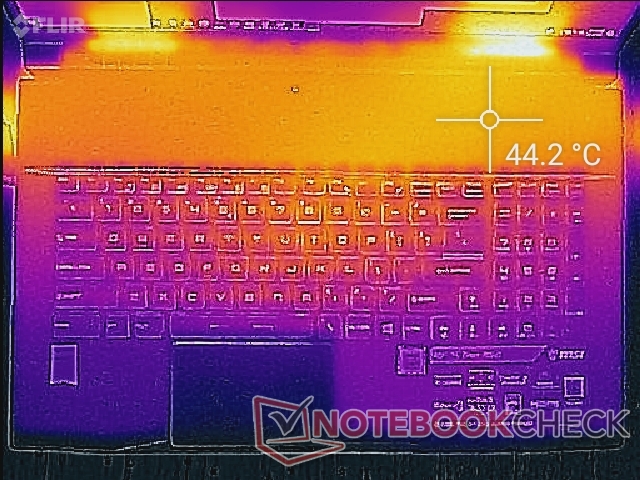
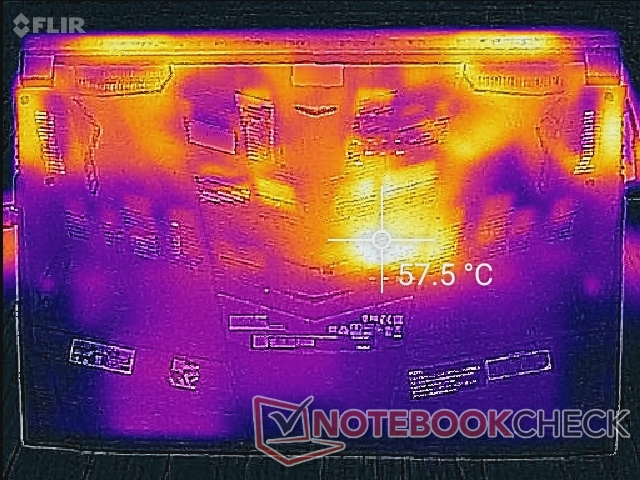
Hot spots are along the rear quadrants of the laptop above the first row of keyboard keys as shown by our temperature maps below. The flat surface can become as warm as 44 C to 48 C when gaming. Fortunately, these hot spots are far from the palm rests for less frequent skin contact. The palm rests, WASD keys, Arrow keys, and NumPad are comparatively cooler in the 30 C to 35 C range for comfortable gaming.
The competing Lenovo Legion Y740 and Asus Strix G GL731 are able to run cooler and faster when gaming albeit in larger chassis sizes.
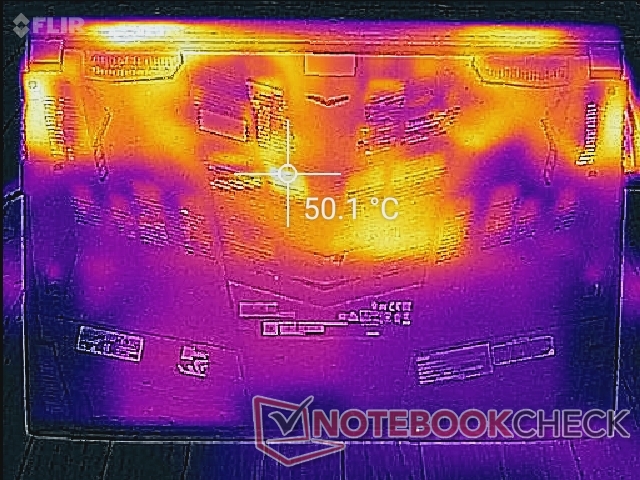
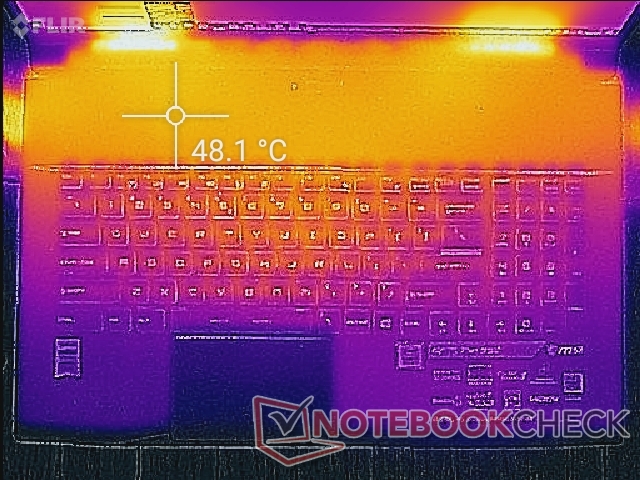
(-) The maximum temperature on the upper side is 47.8 °C / 118 F, compared to the average of 40.4 °C / 105 F, ranging from 21.2 to 68.8 °C for the class Gaming.
(-) The bottom heats up to a maximum of 57 °C / 135 F, compared to the average of 43.2 °C / 110 F
(+) In idle usage, the average temperature for the upper side is 27.7 °C / 82 F, compared to the device average of 33.9 °C / 93 F.
(±) Playing The Witcher 3, the average temperature for the upper side is 35.9 °C / 97 F, compared to the device average of 33.9 °C / 93 F.
(+) The palmrests and touchpad are cooler than skin temperature with a maximum of 31.2 °C / 88.2 F and are therefore cool to the touch.
(-) The average temperature of the palmrest area of similar devices was 28.8 °C / 83.8 F (-2.4 °C / -4.4 F).
Stress Test
We stress the system to identify for any potential throttling or stability issues. When running Prime95, CPU clock rates jump to 4.0 GHz for only the first few seconds until hitting a core temperature of 84 C. Thereafter, clock rates fall to the 2.8 to 2.9 GHz range in order to maintain a cooler core temperature of about 83 C as shown by our screenshot below. In comparison, the Asus ROG GL731 with the same Core i7-9750H CPU is able to maintain a faster clock rate of 3.2 GHz when under similar conditions. These observations support the underwhelming CineBench results of the GF75 9SC above. Running both Prime95 and FurMark simultaneously will cause CPU and GPU temperatures to plateau at 92 C and 78 C, respectively.
Running Witcher 3 is more representative of real-world gaming loads. The CPU and GPU stabilize at 68 C and 78 C, respectively, compared to 72 C and 65 C on the smaller 15.6-inch Asus TUF FX505DT equipped with the same GeForce GTX 1650 GPU. The already high GPU temperature may be why MSI offers no other faster GPU options at the moment for its GF75 Thin series.
Running on battery power will limit performance. A 3DMark Fire Strike run on batteries returns Physics and Graphics scores of 10134 and 7800 points, respectively, compared to 16799 and 9350 points when on mains.
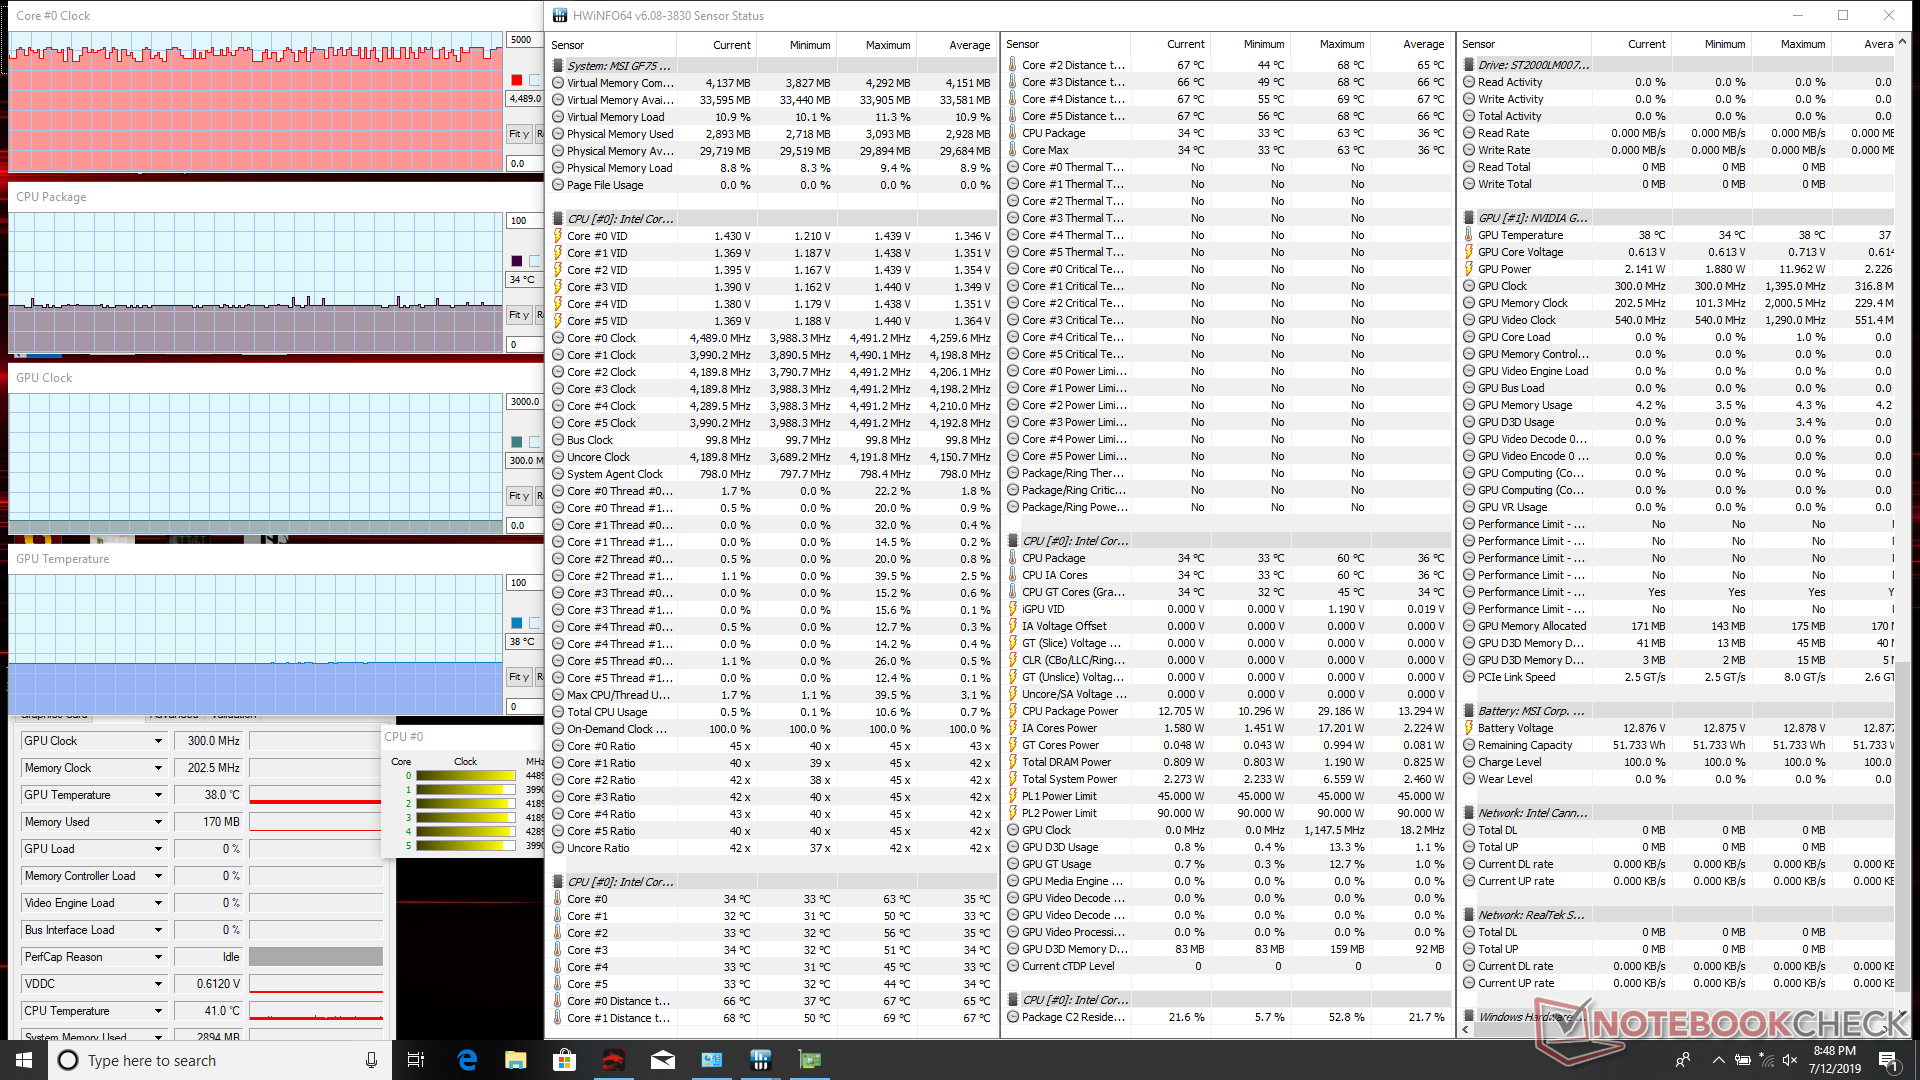
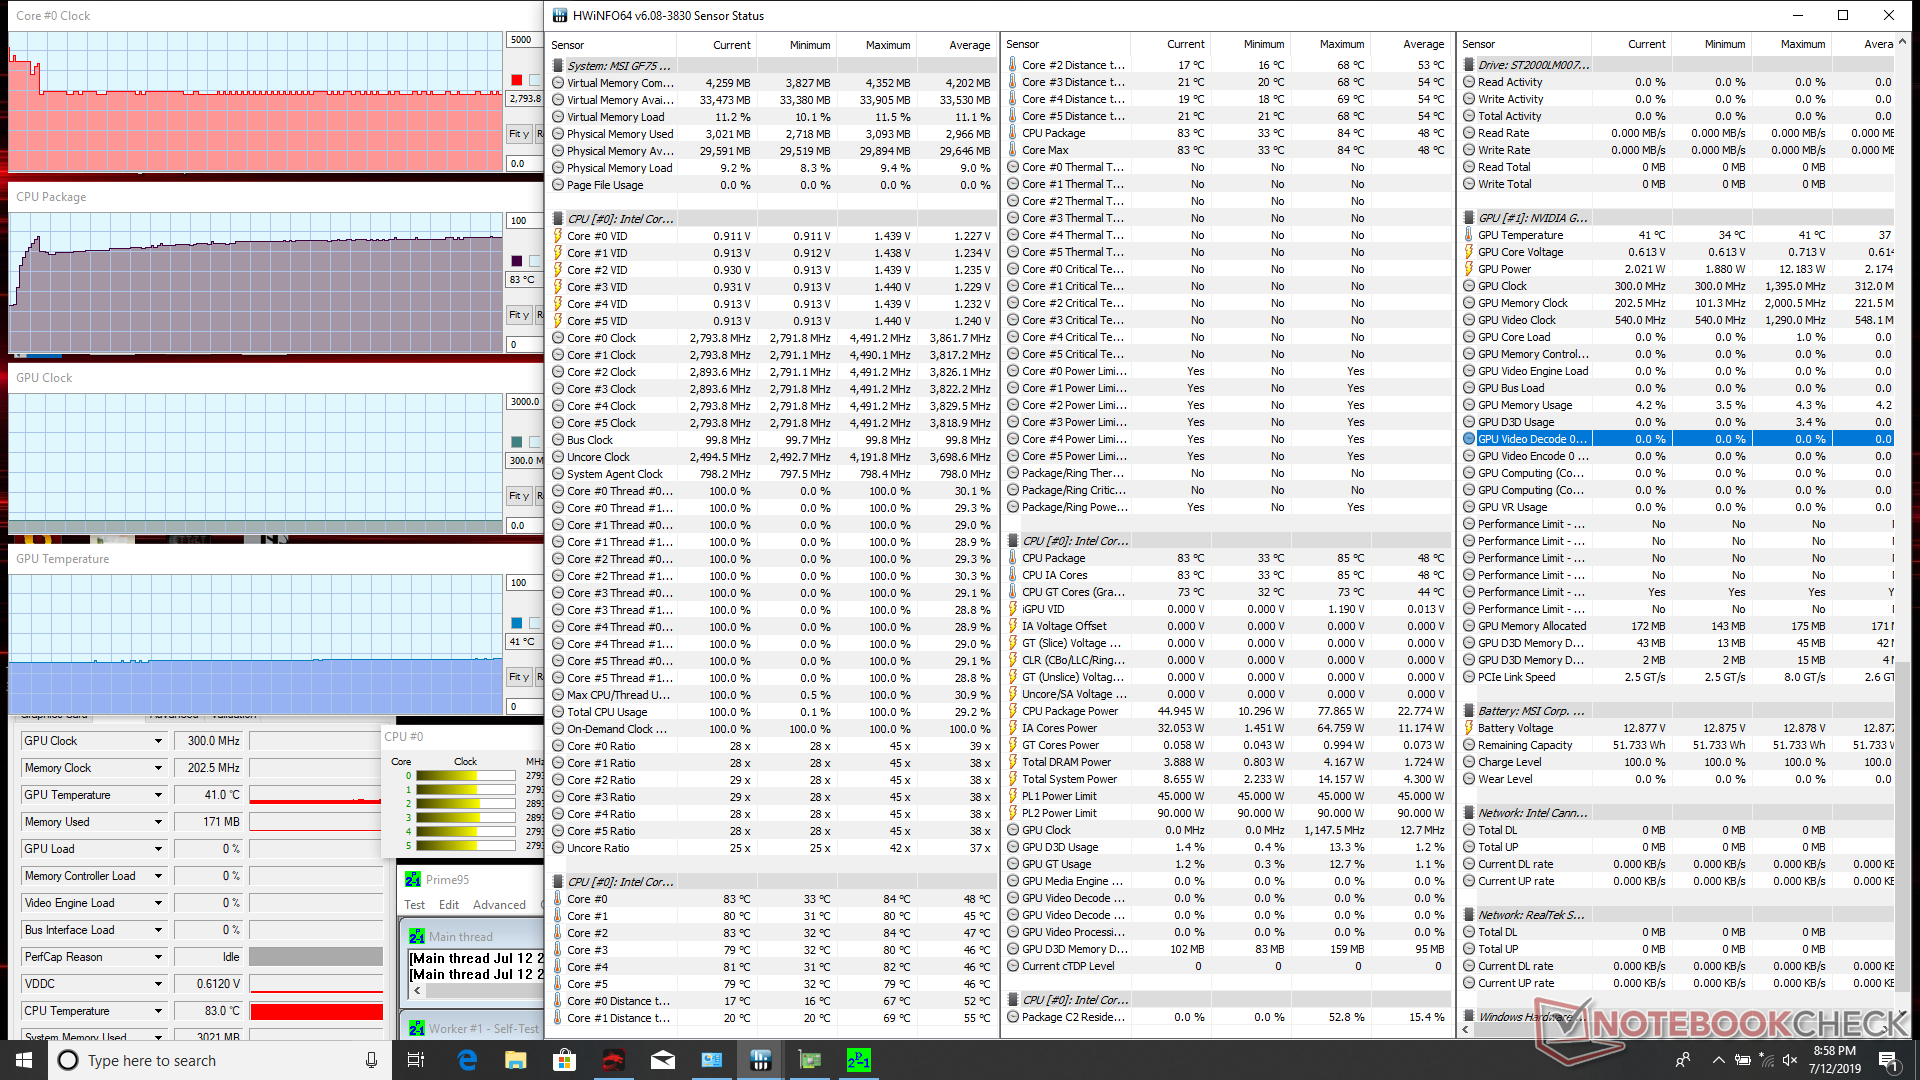
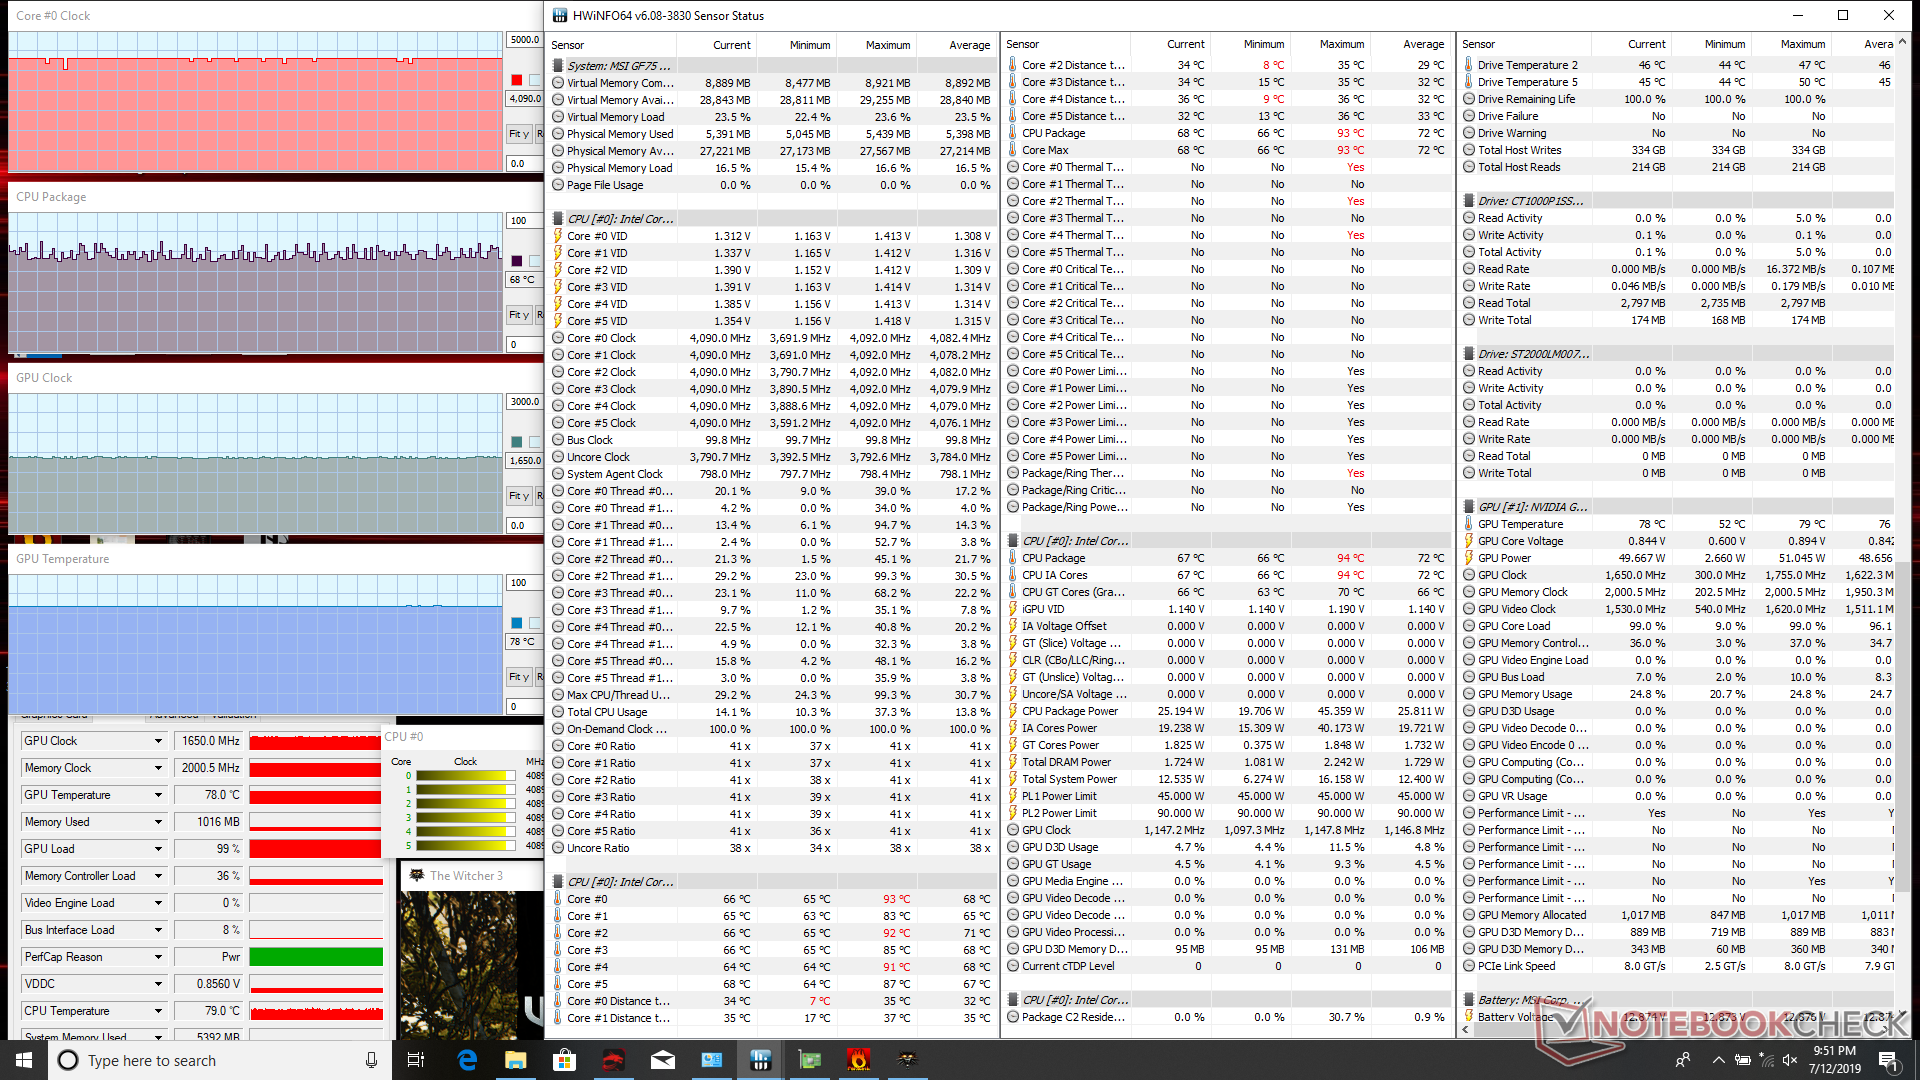
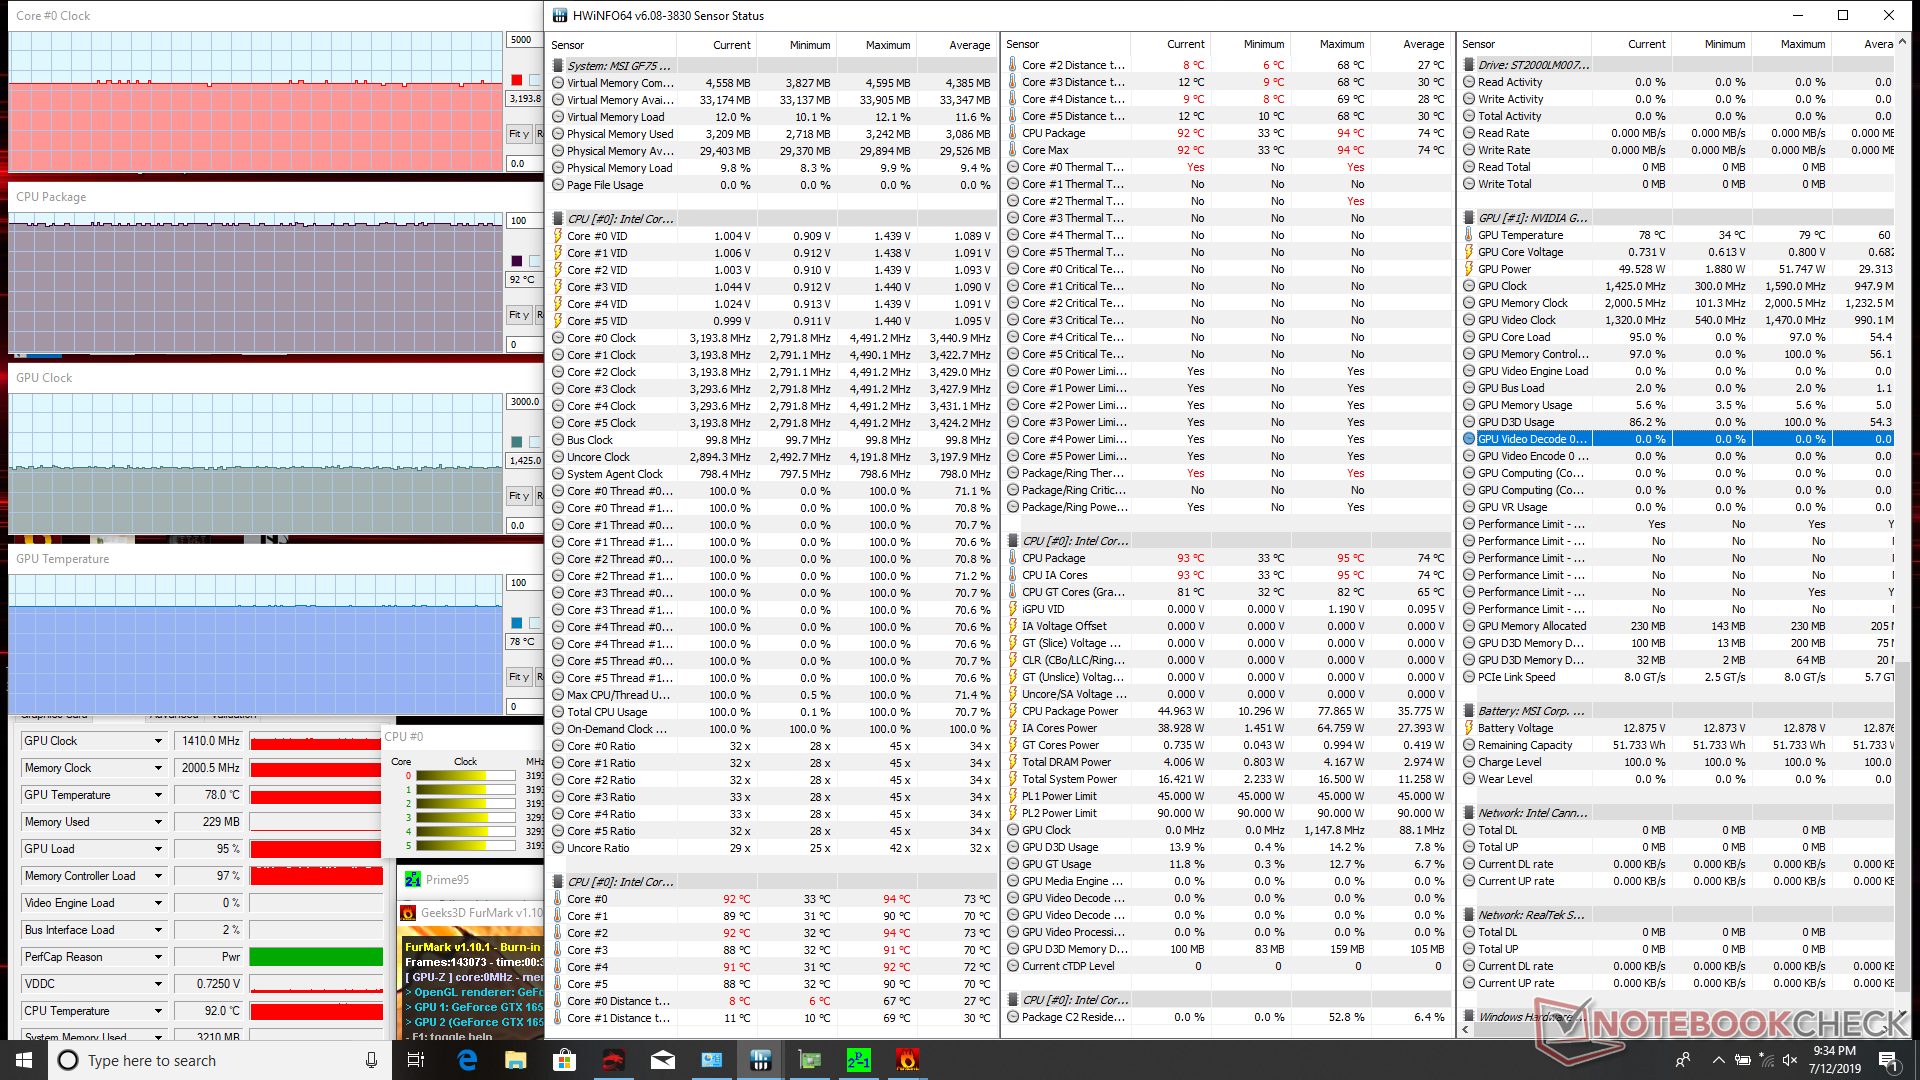
| CPU Clock (GHz) | GPU Clock (MHz) | Average CPU Temperature (°C) | Average GPU Temperature (°C) | |
| System Idle | -- | -- | 34 | 38 |
| Prime95 Stress | 2.8 - 2.9 | -- | 83 | 41 |
| Prime95 + FurMark Stress | 3.2 | 1410 | 92 | 78 |
| Witcher 3 Stress | 4.1 | 1650 | ~68 | 78 |
Speakers


MSI GF75 Thin 9SC audio analysis
(+) | speakers can play relatively loud (85 dB)
Analysis not possible as minimum curve is missing or too high
Apple MacBook 12 (Early 2016) 1.1 GHz audio analysis
(+) | speakers can play relatively loud (83.6 dB)
Bass 100 - 315 Hz
(±) | reduced bass - on average 11.3% lower than median
(±) | linearity of bass is average (14.2% delta to prev. frequency)
Mids 400 - 2000 Hz
(+) | balanced mids - only 2.4% away from median
(+) | mids are linear (5.5% delta to prev. frequency)
Highs 2 - 16 kHz
(+) | balanced highs - only 2% away from median
(+) | highs are linear (4.5% delta to prev. frequency)
Overall 100 - 16.000 Hz
(+) | overall sound is linear (10.2% difference to median)
Compared to same class
» 7% of all tested devices in this class were better, 2% similar, 90% worse
» The best had a delta of 5%, average was 18%, worst was 53%
Compared to all devices tested
» 5% of all tested devices were better, 1% similar, 94% worse
» The best had a delta of 4%, average was 23%, worst was 134%
Energy Management
Power Consumption
Idling on desktop demands anywhere between 6 W and 25 W depending on the brightness setting and power profile. When gaming, power consumption hovers around 106 W compared to 130 W on the last generation MSI GF72 with GTX 1060 graphics. It's an 18 percent power savings for roughly the same GPU performance when running DX12 titles.
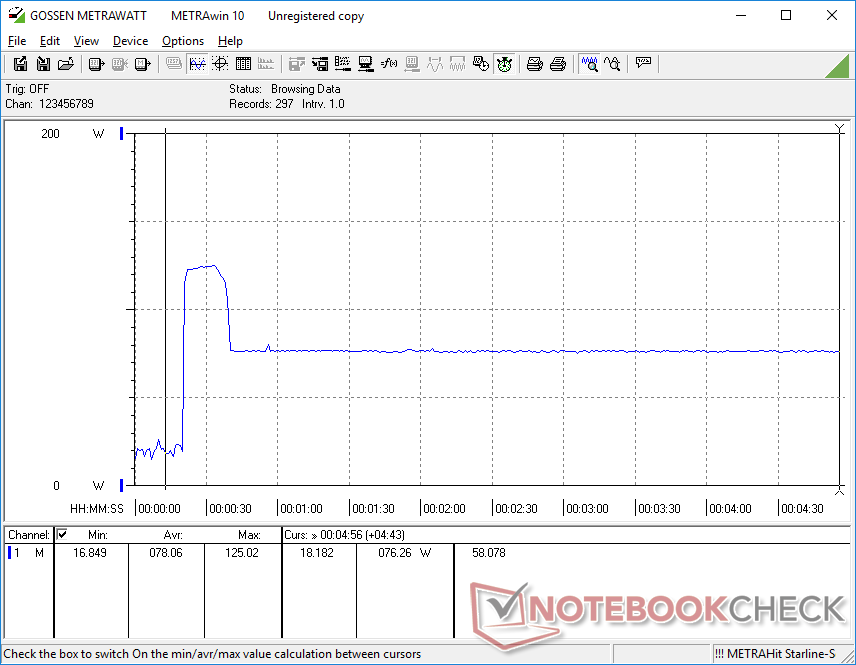
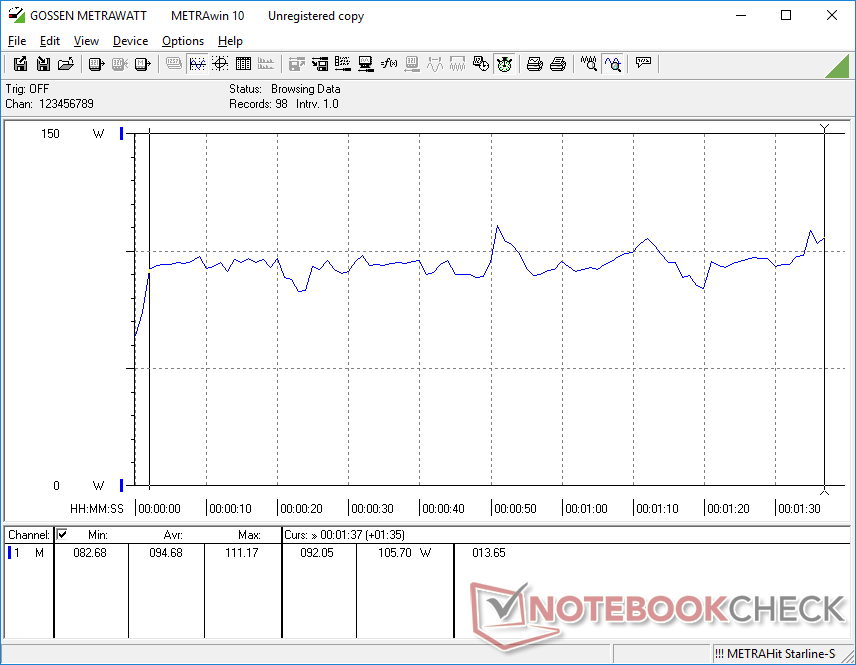
When running Prime95, power consumption spikes to 125 W for just a few seconds as shown by our graph below. This behavior corroborates with our stress test observations above where CPU clock rates would be fastest only during the first few seconds before eventually dropping.
We're able to record a maximum consumption of 192 W from the relatively small (~16.6 x 8 x 2.5 cm) 150 W AC adapter when running both Prime95 and FurMark simultaneously. Since this high of a power consumption is unsustainable, consumption eventually falls to below 150 W after just a few seconds. Thus, it will be impossible to get full CPU and GPU performance simultaneously when both processors are at 100 percent utilization because of the 150 W AC adapter. It's still possible to play games and recharge the laptop simultaneously.
| Off / Standby | |
| Idle | |
| Load |
|
Key:
min: | |
| MSI GF75 Thin 9SC i7-9750H, GeForce GTX 1650 Mobile, Crucial P1 SSD CT1000P1SSD8, IPS, 1920x1080, 17.3" | MSI GF72VR 7RF i7-7700HQ, GeForce GTX 1060 Mobile, Samsung PM961 MZVLW256HEHP, TN LED, 1920x1080, 17.3" | MSI GP75 Leopard 9SD i7-9750H, GeForce GTX 1660 Ti Mobile, Kingston RBUSNS8154P3256GJ1, IPS, 1920x1080, 17.3" | HP Omen 17t-3AW55AV_1 i7-8750H, GeForce GTX 1070 Mobile, Samsung SSD PM981 MZVLB512HAJQ, IPS, 1920x1080, 17.3" | Asus TUF FX505DT-EB73 R7 3750H, GeForce GTX 1650 Mobile, Intel SSD 660p SSDPEKNW512G8, IPS, 1920x1080, 15.6" | MSI GF75 8RD-001 i7-8750H, GeForce GTX 1050 Ti Max-Q, Kingston RBUSNS8154P3256GJ1, IPS, 1920x1080, 17.3" | |
|---|---|---|---|---|---|---|
| Power Consumption | -39% | -24% | -67% | 20% | 15% | |
| Idle Minimum * (Watt) | 6.1 | 15.7 -157% | 10 -64% | 17.8 -192% | 7 -15% | 6.5 -7% |
| Idle Average * (Watt) | 11.2 | 21.4 -91% | 15 -34% | 24.7 -121% | 9.9 12% | 11.9 -6% |
| Idle Maximum * (Watt) | 24.5 | 21.9 11% | 22 10% | 29.6 -21% | 12 51% | 13.1 47% |
| Load Average * (Watt) | 94.7 | 83.9 11% | 92 3% | 110 -16% | 68.4 28% | 86 9% |
| Witcher 3 ultra * (Watt) | 105.8 | 130.2 -23% | 153 -45% | 167.8 -59% | 94.9 10% | |
| Load Maximum * (Watt) | 192.2 | 159.6 17% | 216 -12% | 178.6 7% | 130.9 32% | 131 32% |
* ... smaller is better
Battery Life
Expect just over 4.5 hours of real-world WLAN use when set to the Balanced profile with the integrated Intel GPU active. Results are essentially the same as the older GF75 8RD (284 minutes vs. 281 minutes) even though the GF75 9SC is the faster configuration.
Charging from empty to full capacity takes just under 2 hours. Battery capacity is relatively small for a 17.3-inch laptop which is to be expected from a budget gaming model.
| MSI GF75 Thin 9SC i7-9750H, GeForce GTX 1650 Mobile, 51 Wh | MSI GF72VR 7RF i7-7700HQ, GeForce GTX 1060 Mobile, 43 Wh | Asus TUF FX705DT-AU068T R5 3550H, GeForce GTX 1650 Mobile, 64 Wh | MSI GP75 Leopard 9SD i7-9750H, GeForce GTX 1660 Ti Mobile, 51 Wh | Lenovo Legion Y740-17ICH i7-8750H, GeForce RTX 2080 Max-Q, 76 Wh | HP Omen 17t-3AW55AV_1 i7-8750H, GeForce GTX 1070 Mobile, 86 Wh | |
|---|---|---|---|---|---|---|
| Battery runtime | -49% | 66% | -32% | -32% | -11% | |
| WiFi v1.3 (h) | 4.7 | 2.4 -49% | 7.8 66% | 3.2 -32% | 3.2 -32% | 4.2 -11% |
| Reader / Idle (h) | 3.4 | 13.6 | 4.8 | 4.5 | ||
| Load (h) | 0.7 | 2.1 | 0.6 | 1.6 |
Pros
Cons
Verdict


It's tough to recommend a gaming laptop with the Core i7-9750H when the performance benefits over a Core i7-8750H are almost negligible. It's too bad that MSI doesn't offer the GF75 with the Core i7-8750H and GTX 1650 instead because gaming performance would have been essentially the same but for a cheaper price.
Speaking of price, the $1200 USD base MSRP is a little high for a budget gaming laptop. The MSI GL73 8SD, for example, comes equipped with a Core i7-8750H CPU and faster GTX 1660 Ti graphics for under $1100. The price premium for the GF75 goes towards the narrow bezels, light weight, and compact design rather than raw performance. If you intend on traveling frequently and can make use of a relatively lightweight 17.3-inch screen with respectable gaming qualities, then the MSI GF75 should fit the bill. Otherwise, users interested in the highest performance-per-buck may want to look elsewhere as laptops with the superior GTX 1660 Ti can be found for around the same price such as the HP Pavilion Gaming 17 or base Alienware m17.
The MSI GF75 is one of the lighter 17.3-inch gaming laptops available especially at this price range. You'll have to give up some performance and features along the way to make this more of a traveler-gamer hybrid than a pure gaming laptop.
MSI GF75 Thin 9SC
- 10/26/2019 v7 (old)
Allen Ngo
Price comparison
