No Intel Required: Asus TUF FX505DT Laptop Review with Ryzen 7 and GeForce GTX 1650
In our review of the Asus TUF FX505DY, we criticized the OEM for debuting AMD's latest mobile H-series CPU with a three generations old Polaris GPU instead of a newer Pascal or Turing Nvidia GPU. Fast forward a couple of months and Asus has right this wrong with the TUF FX505DT that more appropriately pairs a Ryzen 7 H-series CPU with the modern Nvidia GeForce GTX 1650 GPU.
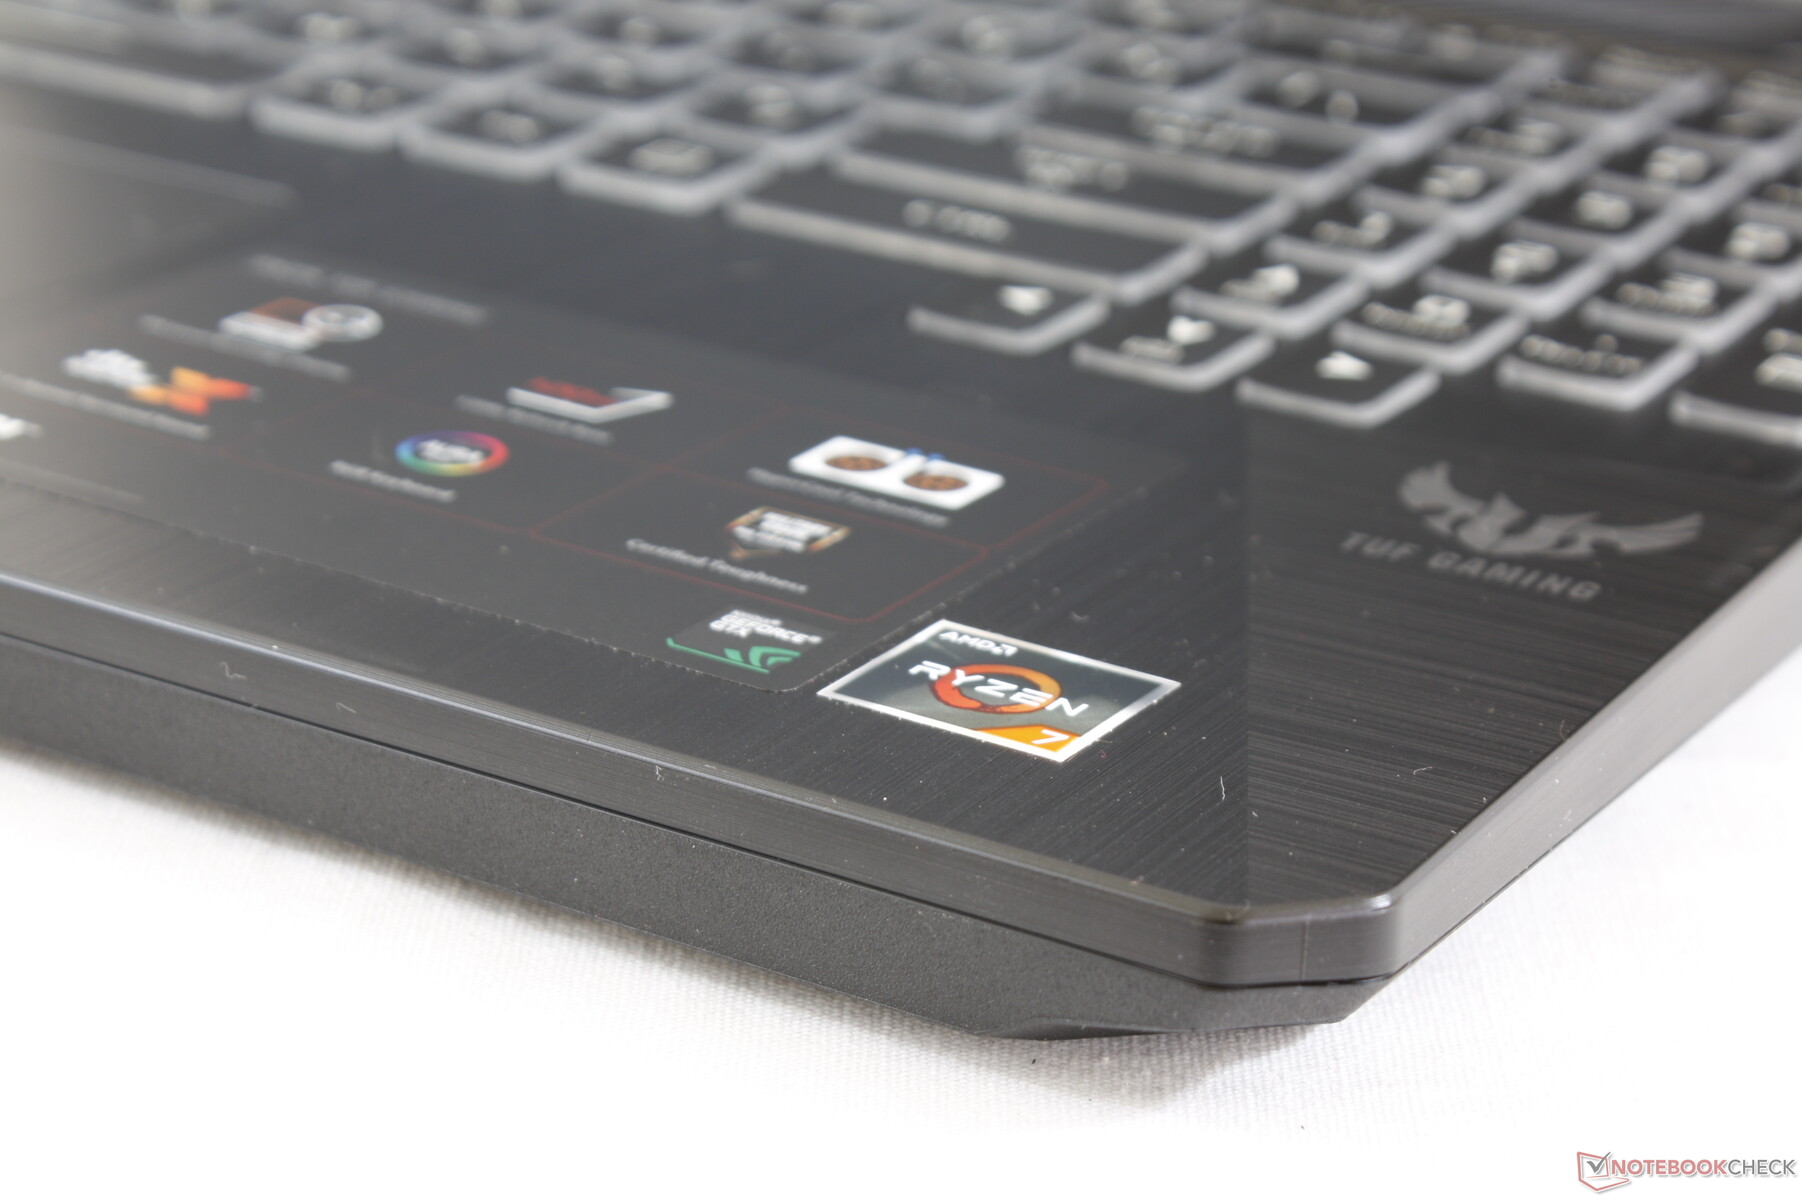
The TUF series is home to Asus' bottom-of-the-barrel gaming laptops that sit well below the flagship ROG series to appeal to gamers on tight budgets. Its focus on value means users shouldn't expect most luxurious features like metal alloy surfaces, per-key RGB lighting, or Thunderbolt 3. Direct competitors in this space include other entry-level 15.6-inch gaming laptops like the Dell G5 15, Lenovo Legion Y530, HP Pavilion Gaming 15, Acer Nitro 5, Aorus 15, and the MSI GP/GL/GF series.
Our specific configuration can be found on Xotic PC for about $900 USD with 8 GB of single-channel RAM, 512 GB NVMe SSD, and a 120 Hz IPS panel. Two other SKUs are currently available as well (FX505DD and FX505DU) that differ in GPU as detailed on the Asus product page here. We recommend checking out our existing reviews on the 15.6-inch TUF FX505DY and 17.3-inch TUF FX705DY as the FX505DT shares the exact same external chassis design and features. Thus, many of our same comments about the chassis, keyboard, clickpad, ports, serviceability, and speakers apply here for the FX505DT.
More Asus reviews:
Case
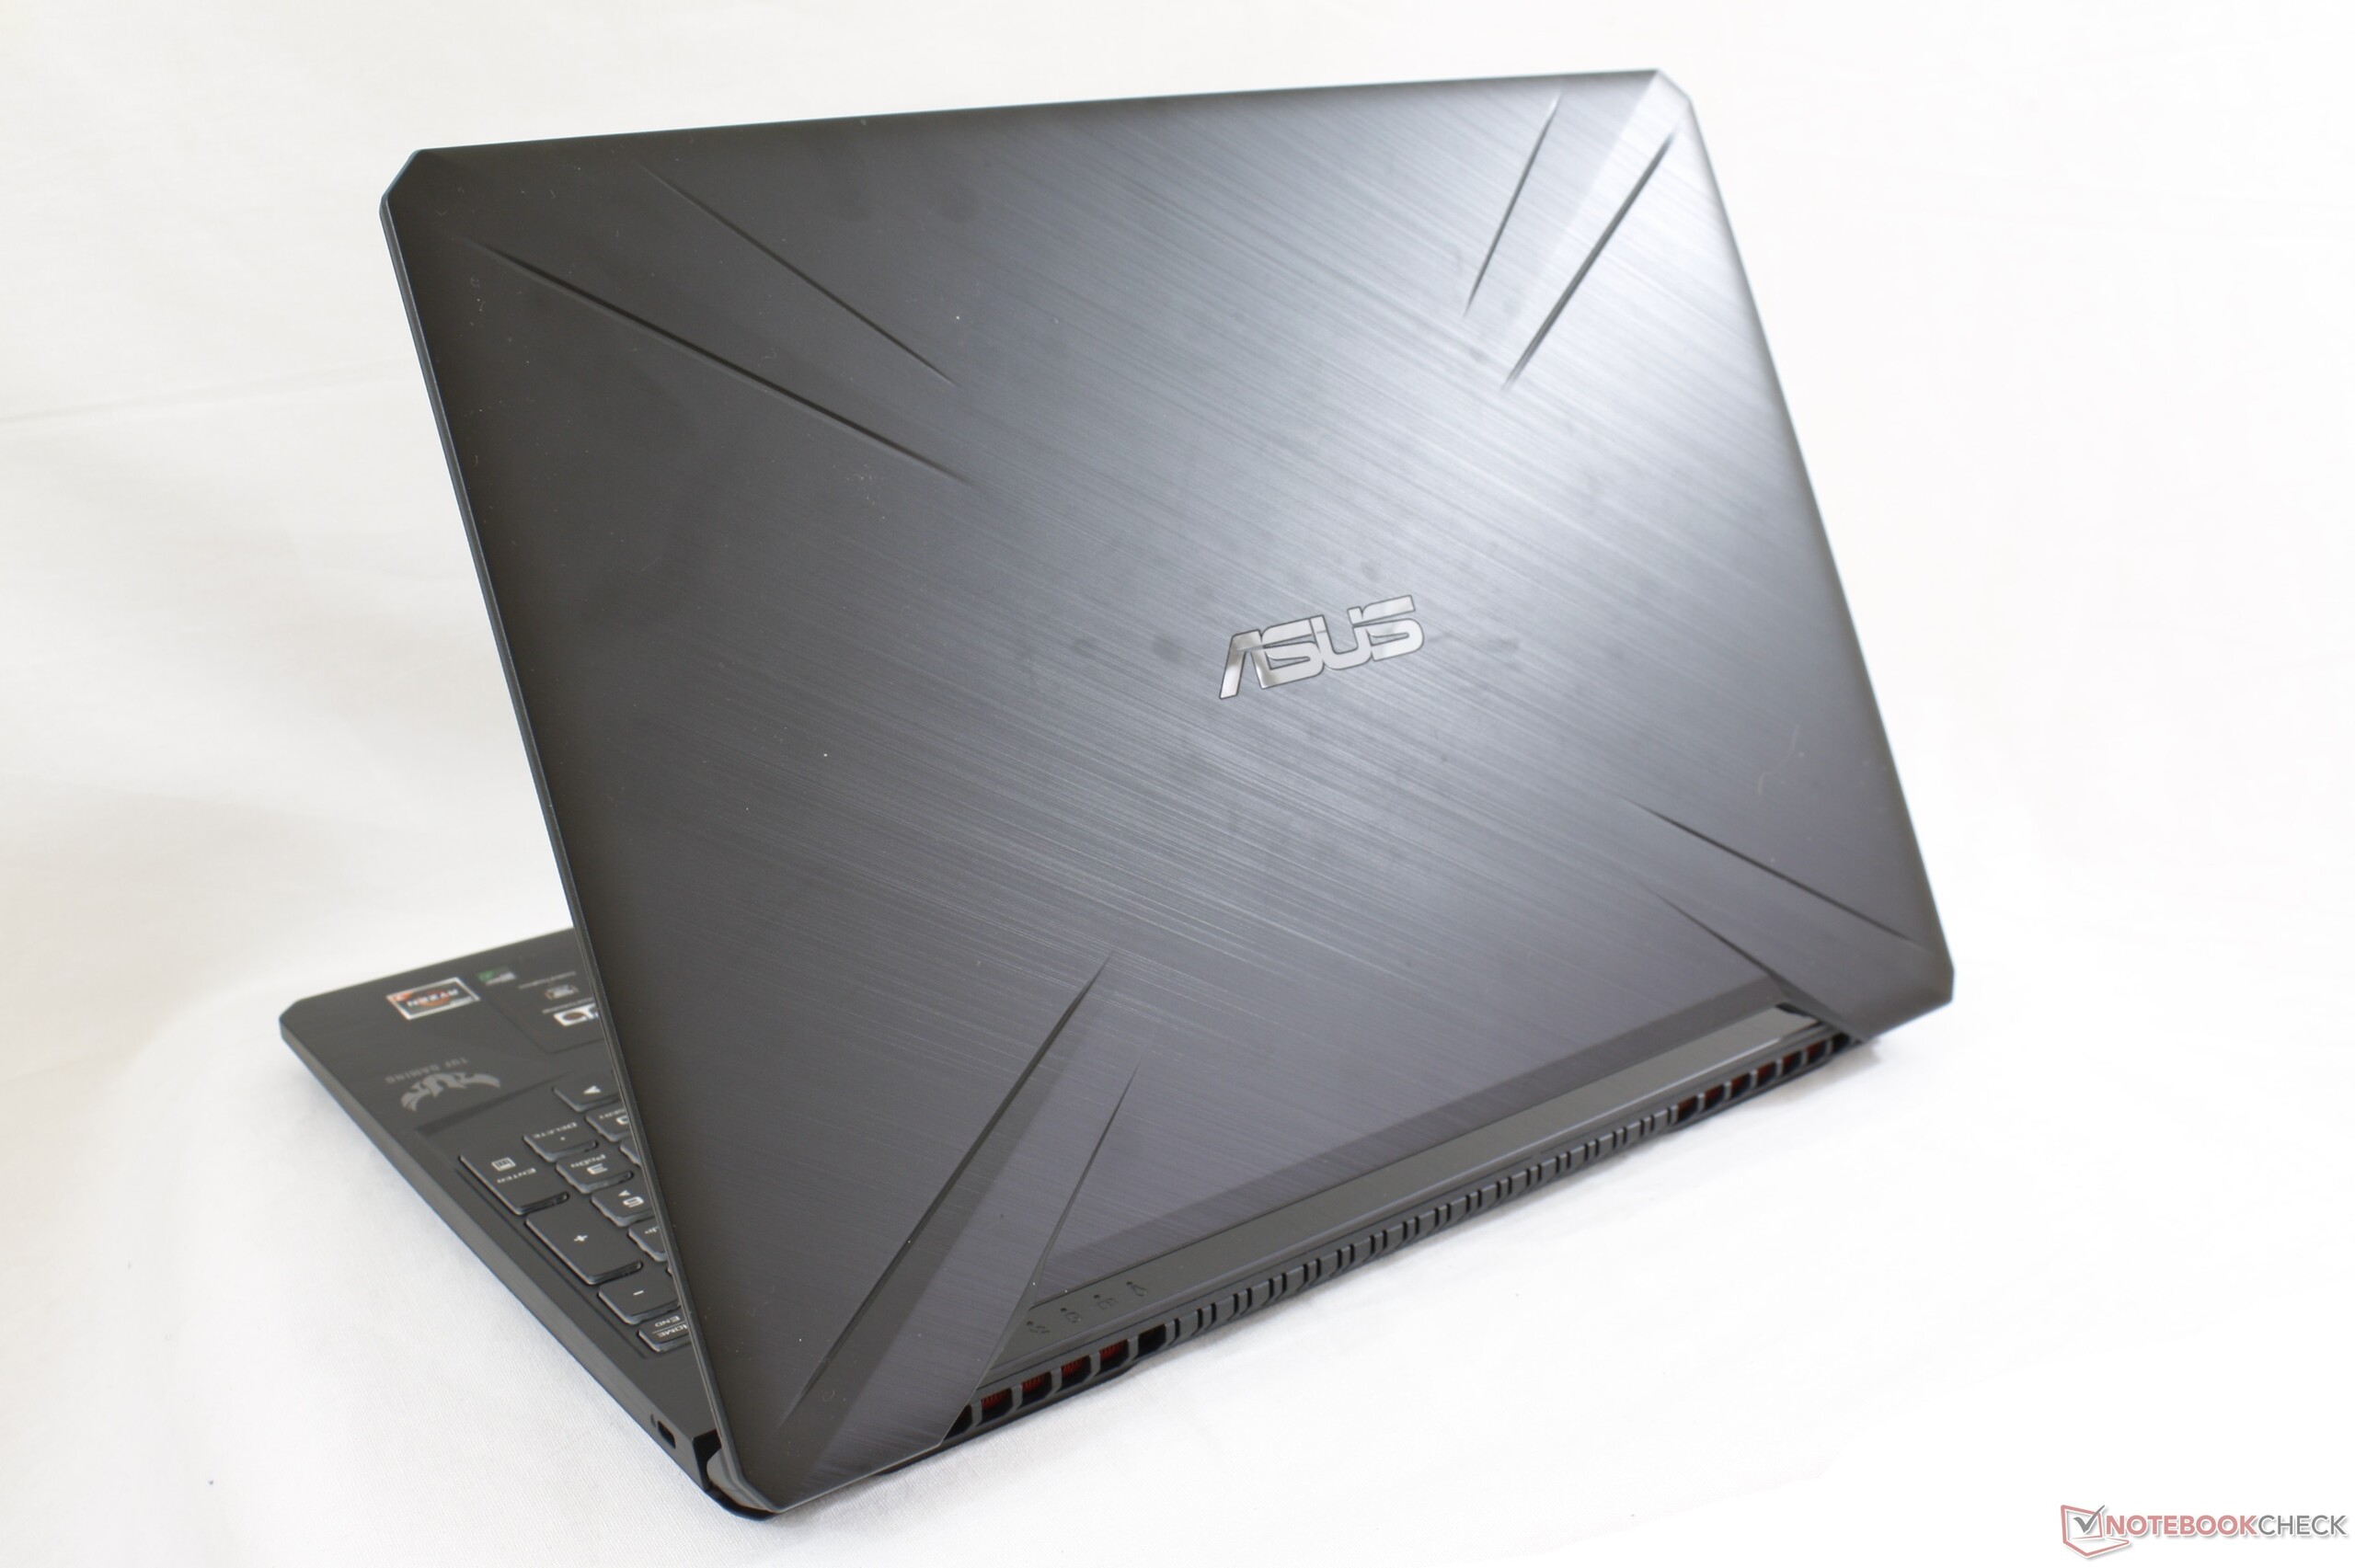
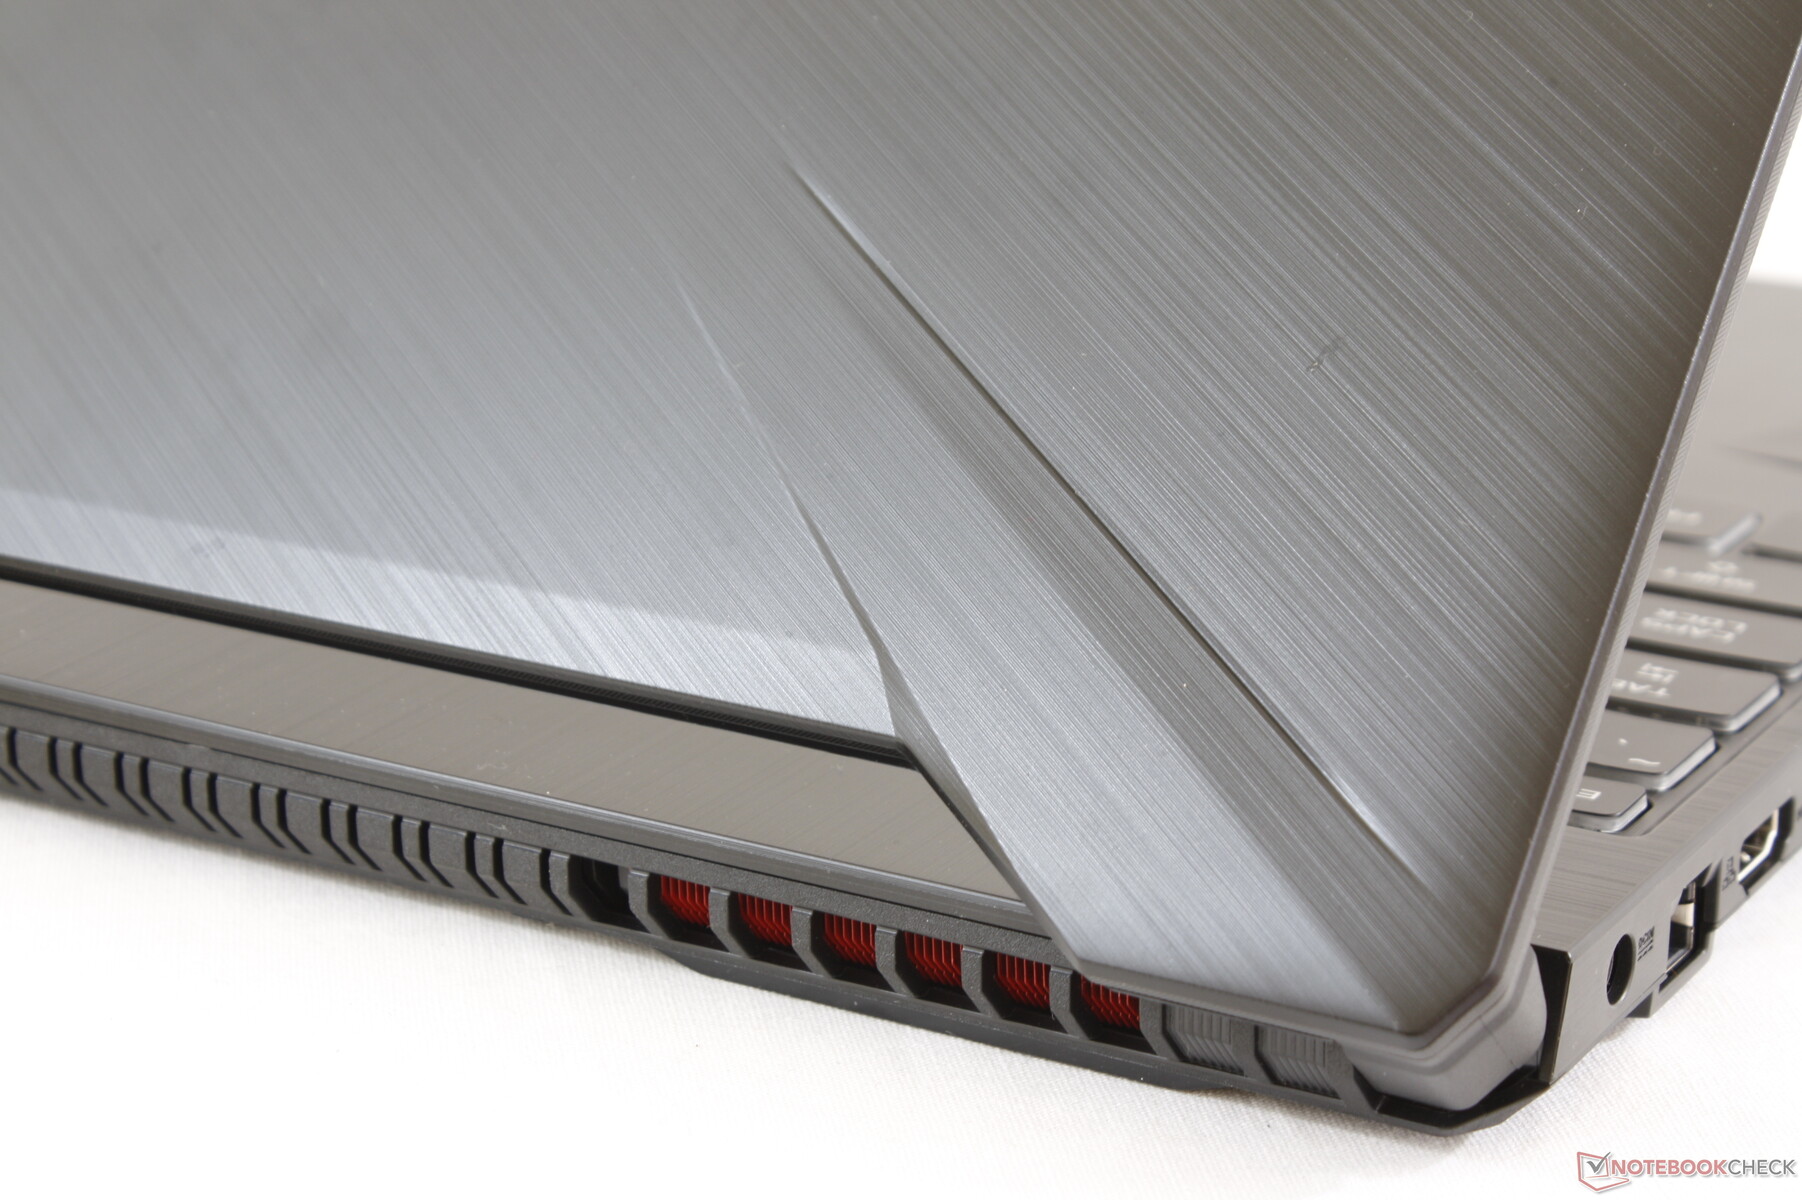
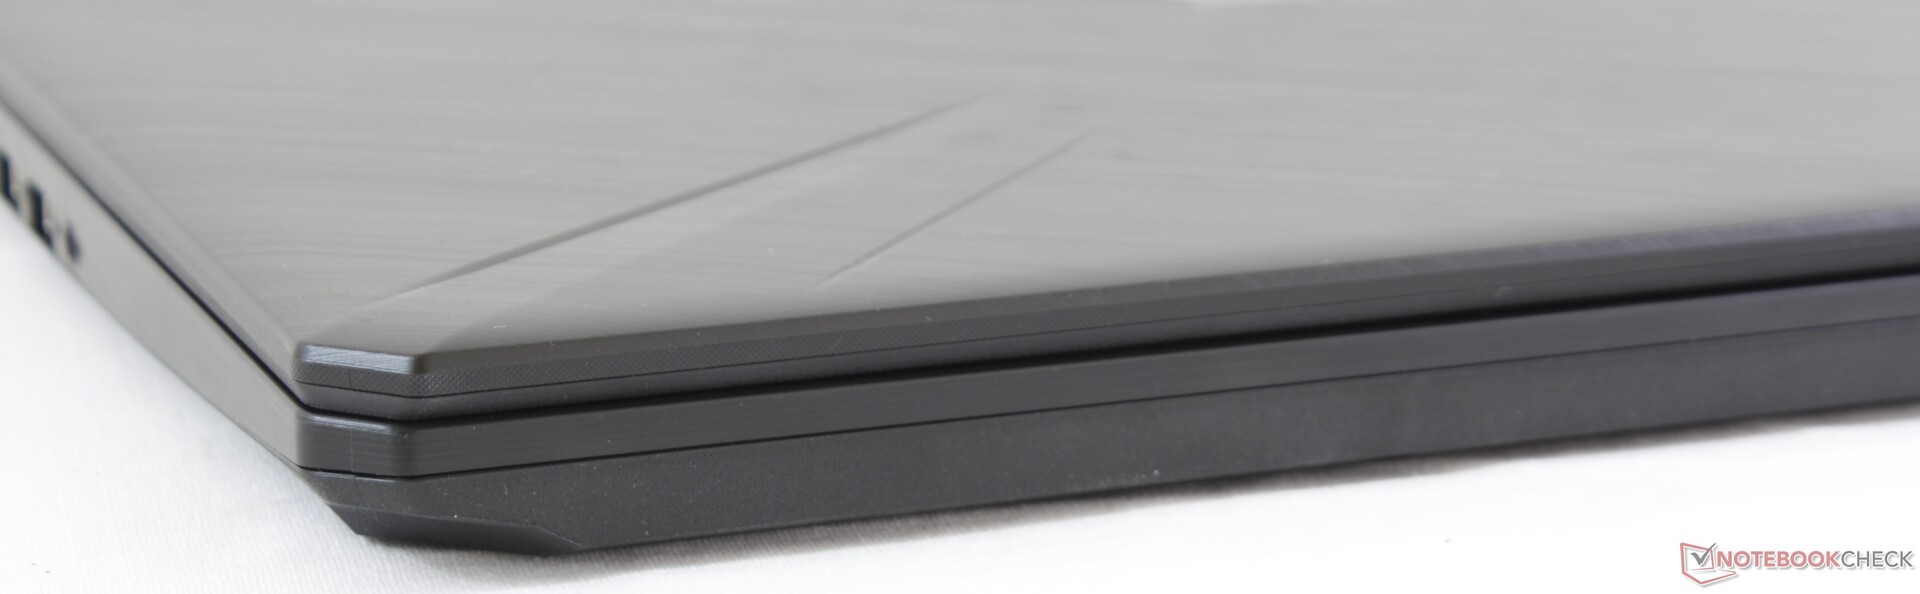
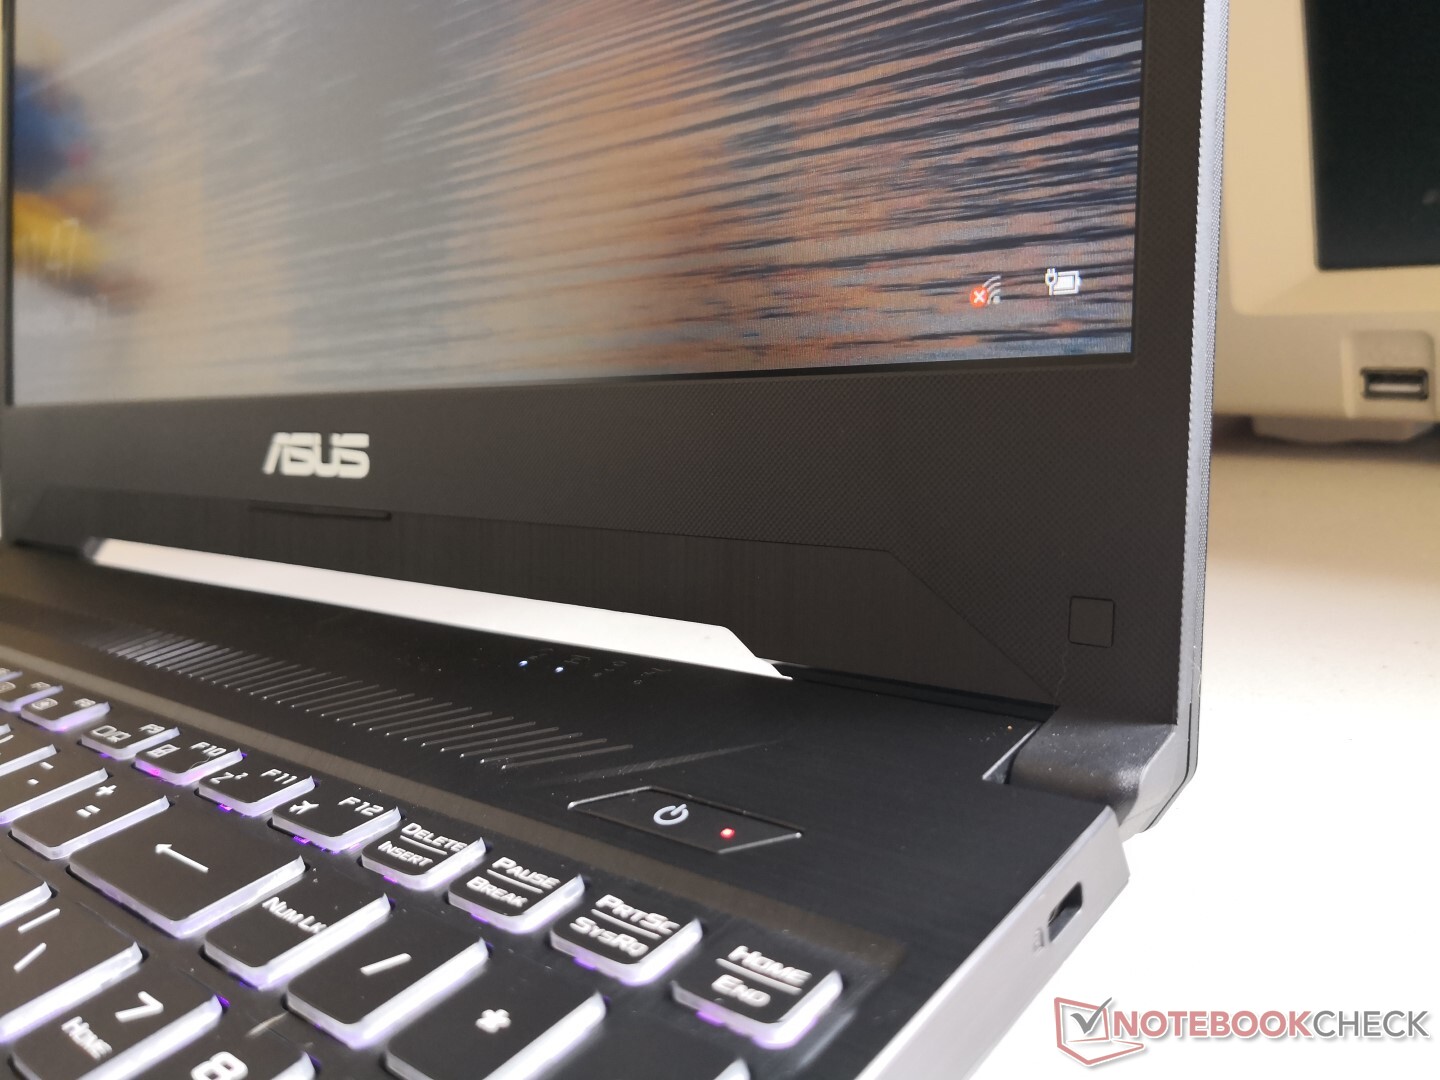
Our comments about the chassis of the FX505DY apply here on the FX505DT. In short, the plastic base and lid are stiffer than the competing Legion Y530 and on par with the Acer Nitro 5. Pushing down on the keyboard center will moderately flex the surface while the lid is even more flexible as on most laptops. The hinges in particular don't leave strong first impressions because of the slight creaking and teetering when adjust the display angle. These characteristics are common amongst budget gaming laptops and so we can't knock Asus too much for these shortcomings. Nonetheless, the visual and tactile experience is night and day when compared to Asus' firmer, denser, and pricier ROG Strix GL504 alternative.
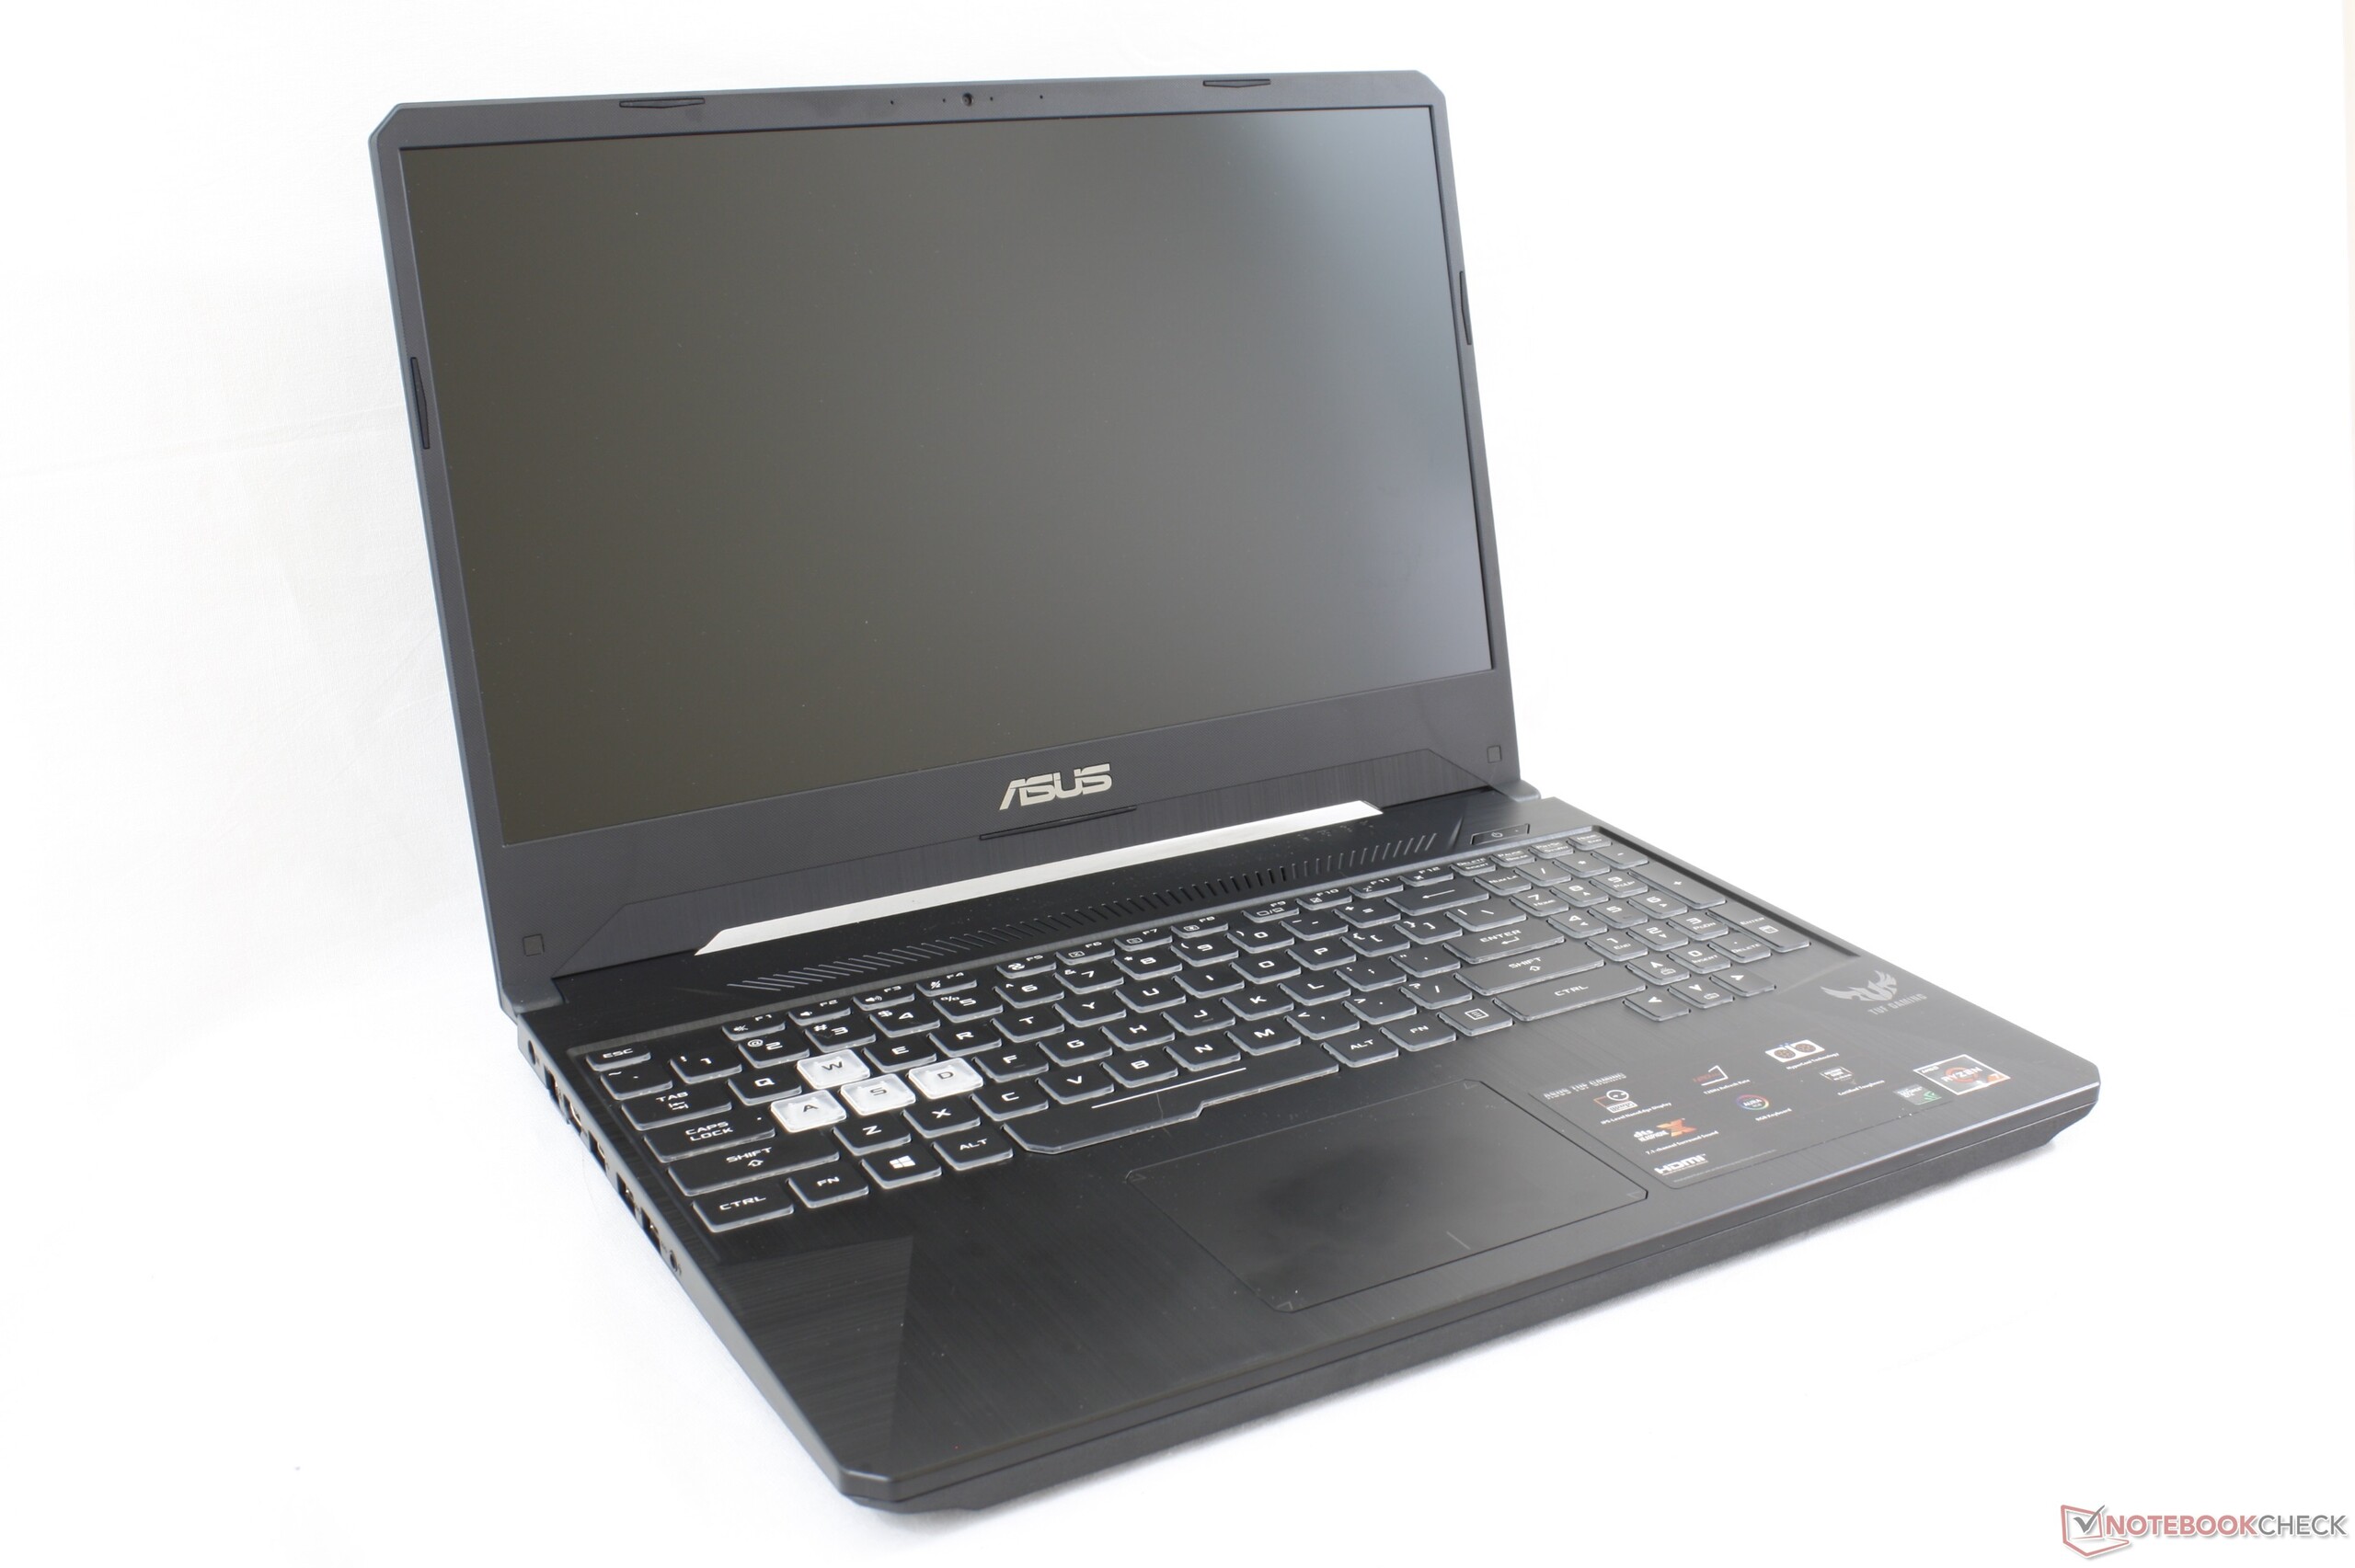
The narrow bezels make the FX505DT comparable to the Acer Nitro 5 and MSI GF63 in terms of dimensions while the MSI is still the much lighter option by about 300 g. The last generation FX504 was over 24 mm wider because of its now-outdated "thick bezel" design. It's good to see more narrow bezel designs on budget laptops as these were previously exclusive to higher-end models only.
Connectivity
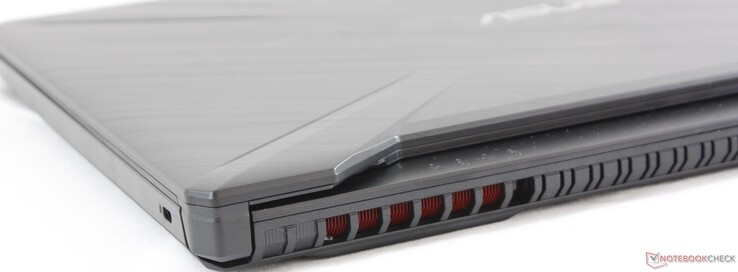
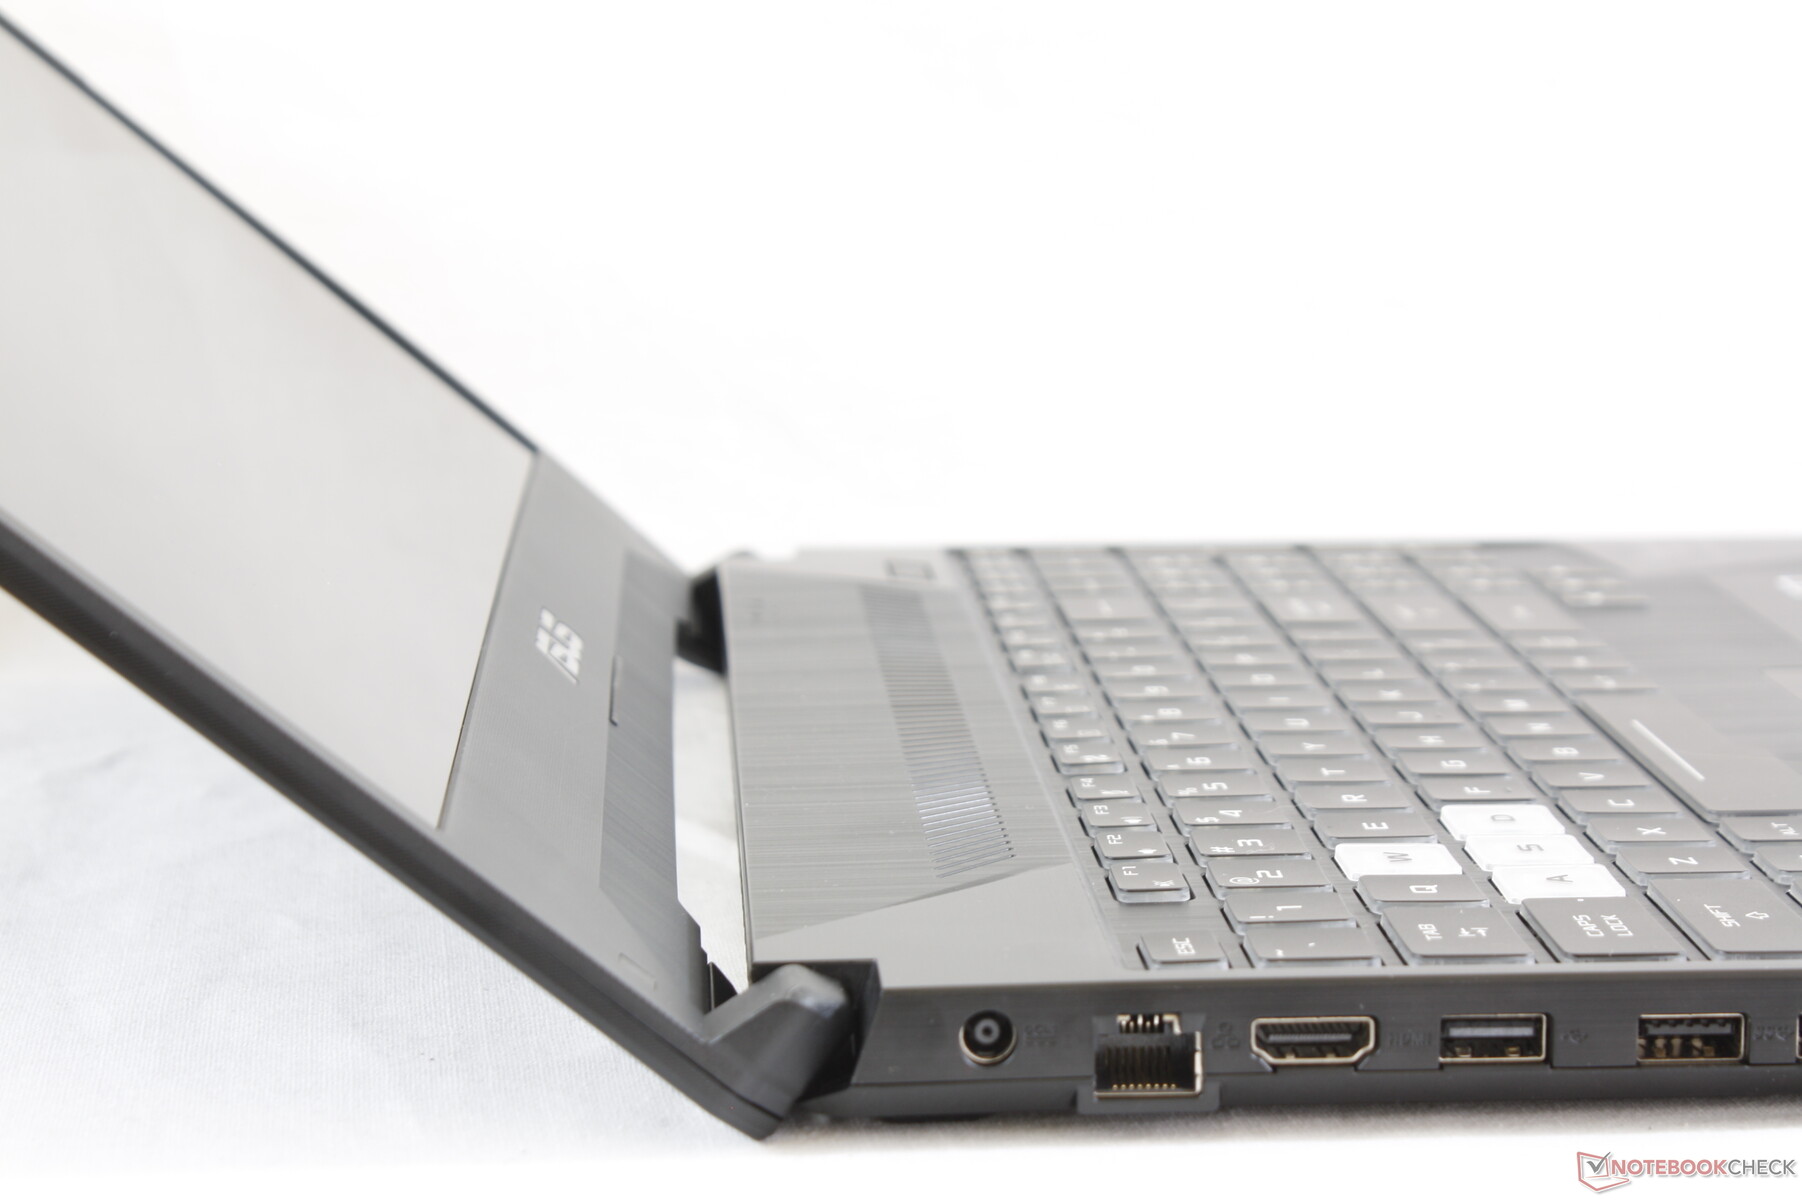
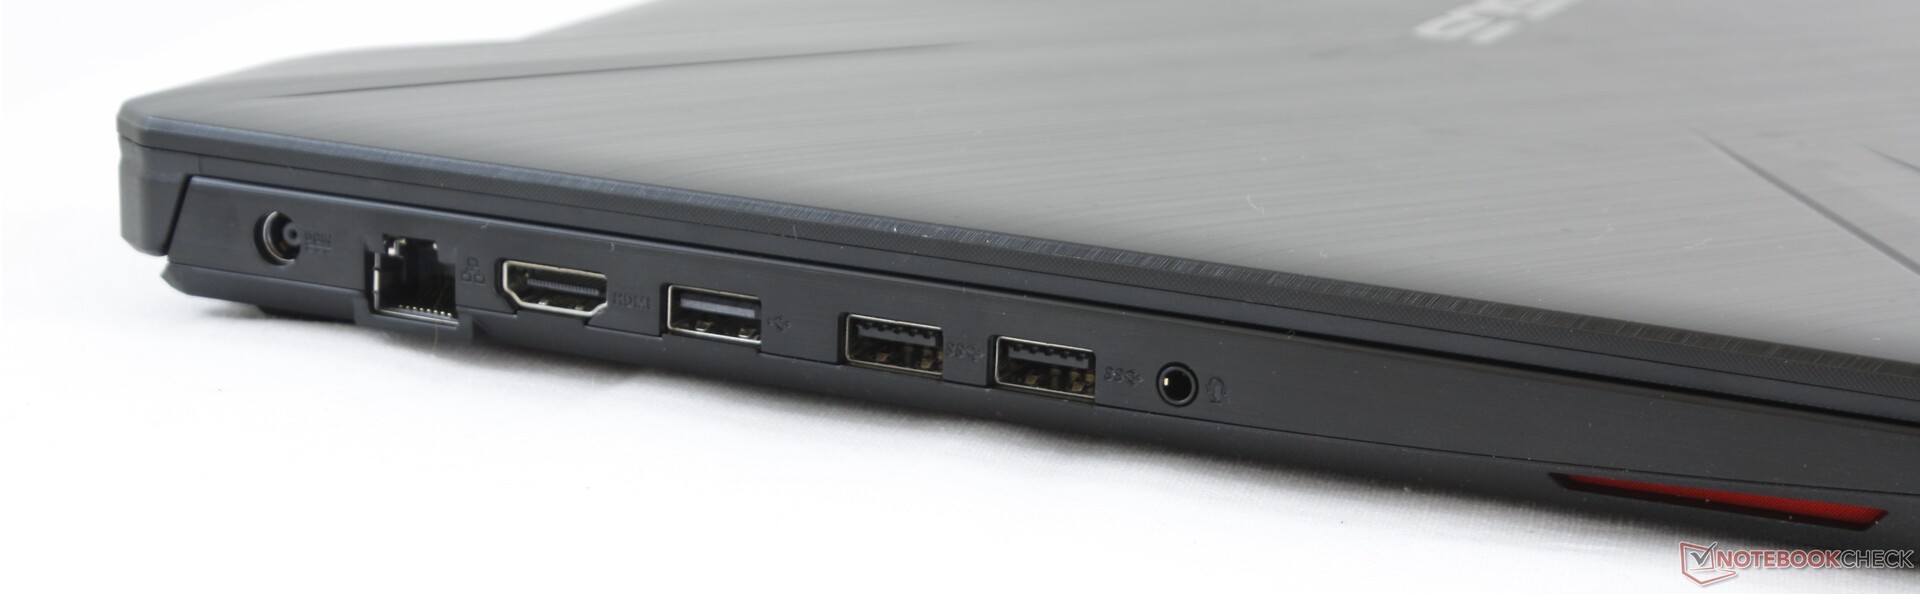
We can forgive the FX505DT for having a limited selection of ports since it is a budget gaming laptop, but its strange port positioning deserves a mention. Having all ports along the left edge only will clutter the left side of the laptop while leaving the right side empty. Depending on your desk setup or mouse preferences, this may be unfavorable. Competing systems distribute their ports more eveny around the edges of the chassis.

Communication
The FX505DT carries a faster Realtek RTL8822BE module compared to the Realtek 8821CE on the cheaper FX505DY. Note that Asus incorrectly advertises Bluetooth 5 on the official specifications sheet as this particular Realtek module integrates Bluetooth 4.2 only. We otherwise experienced no connectivity issues during our time with the test unit.
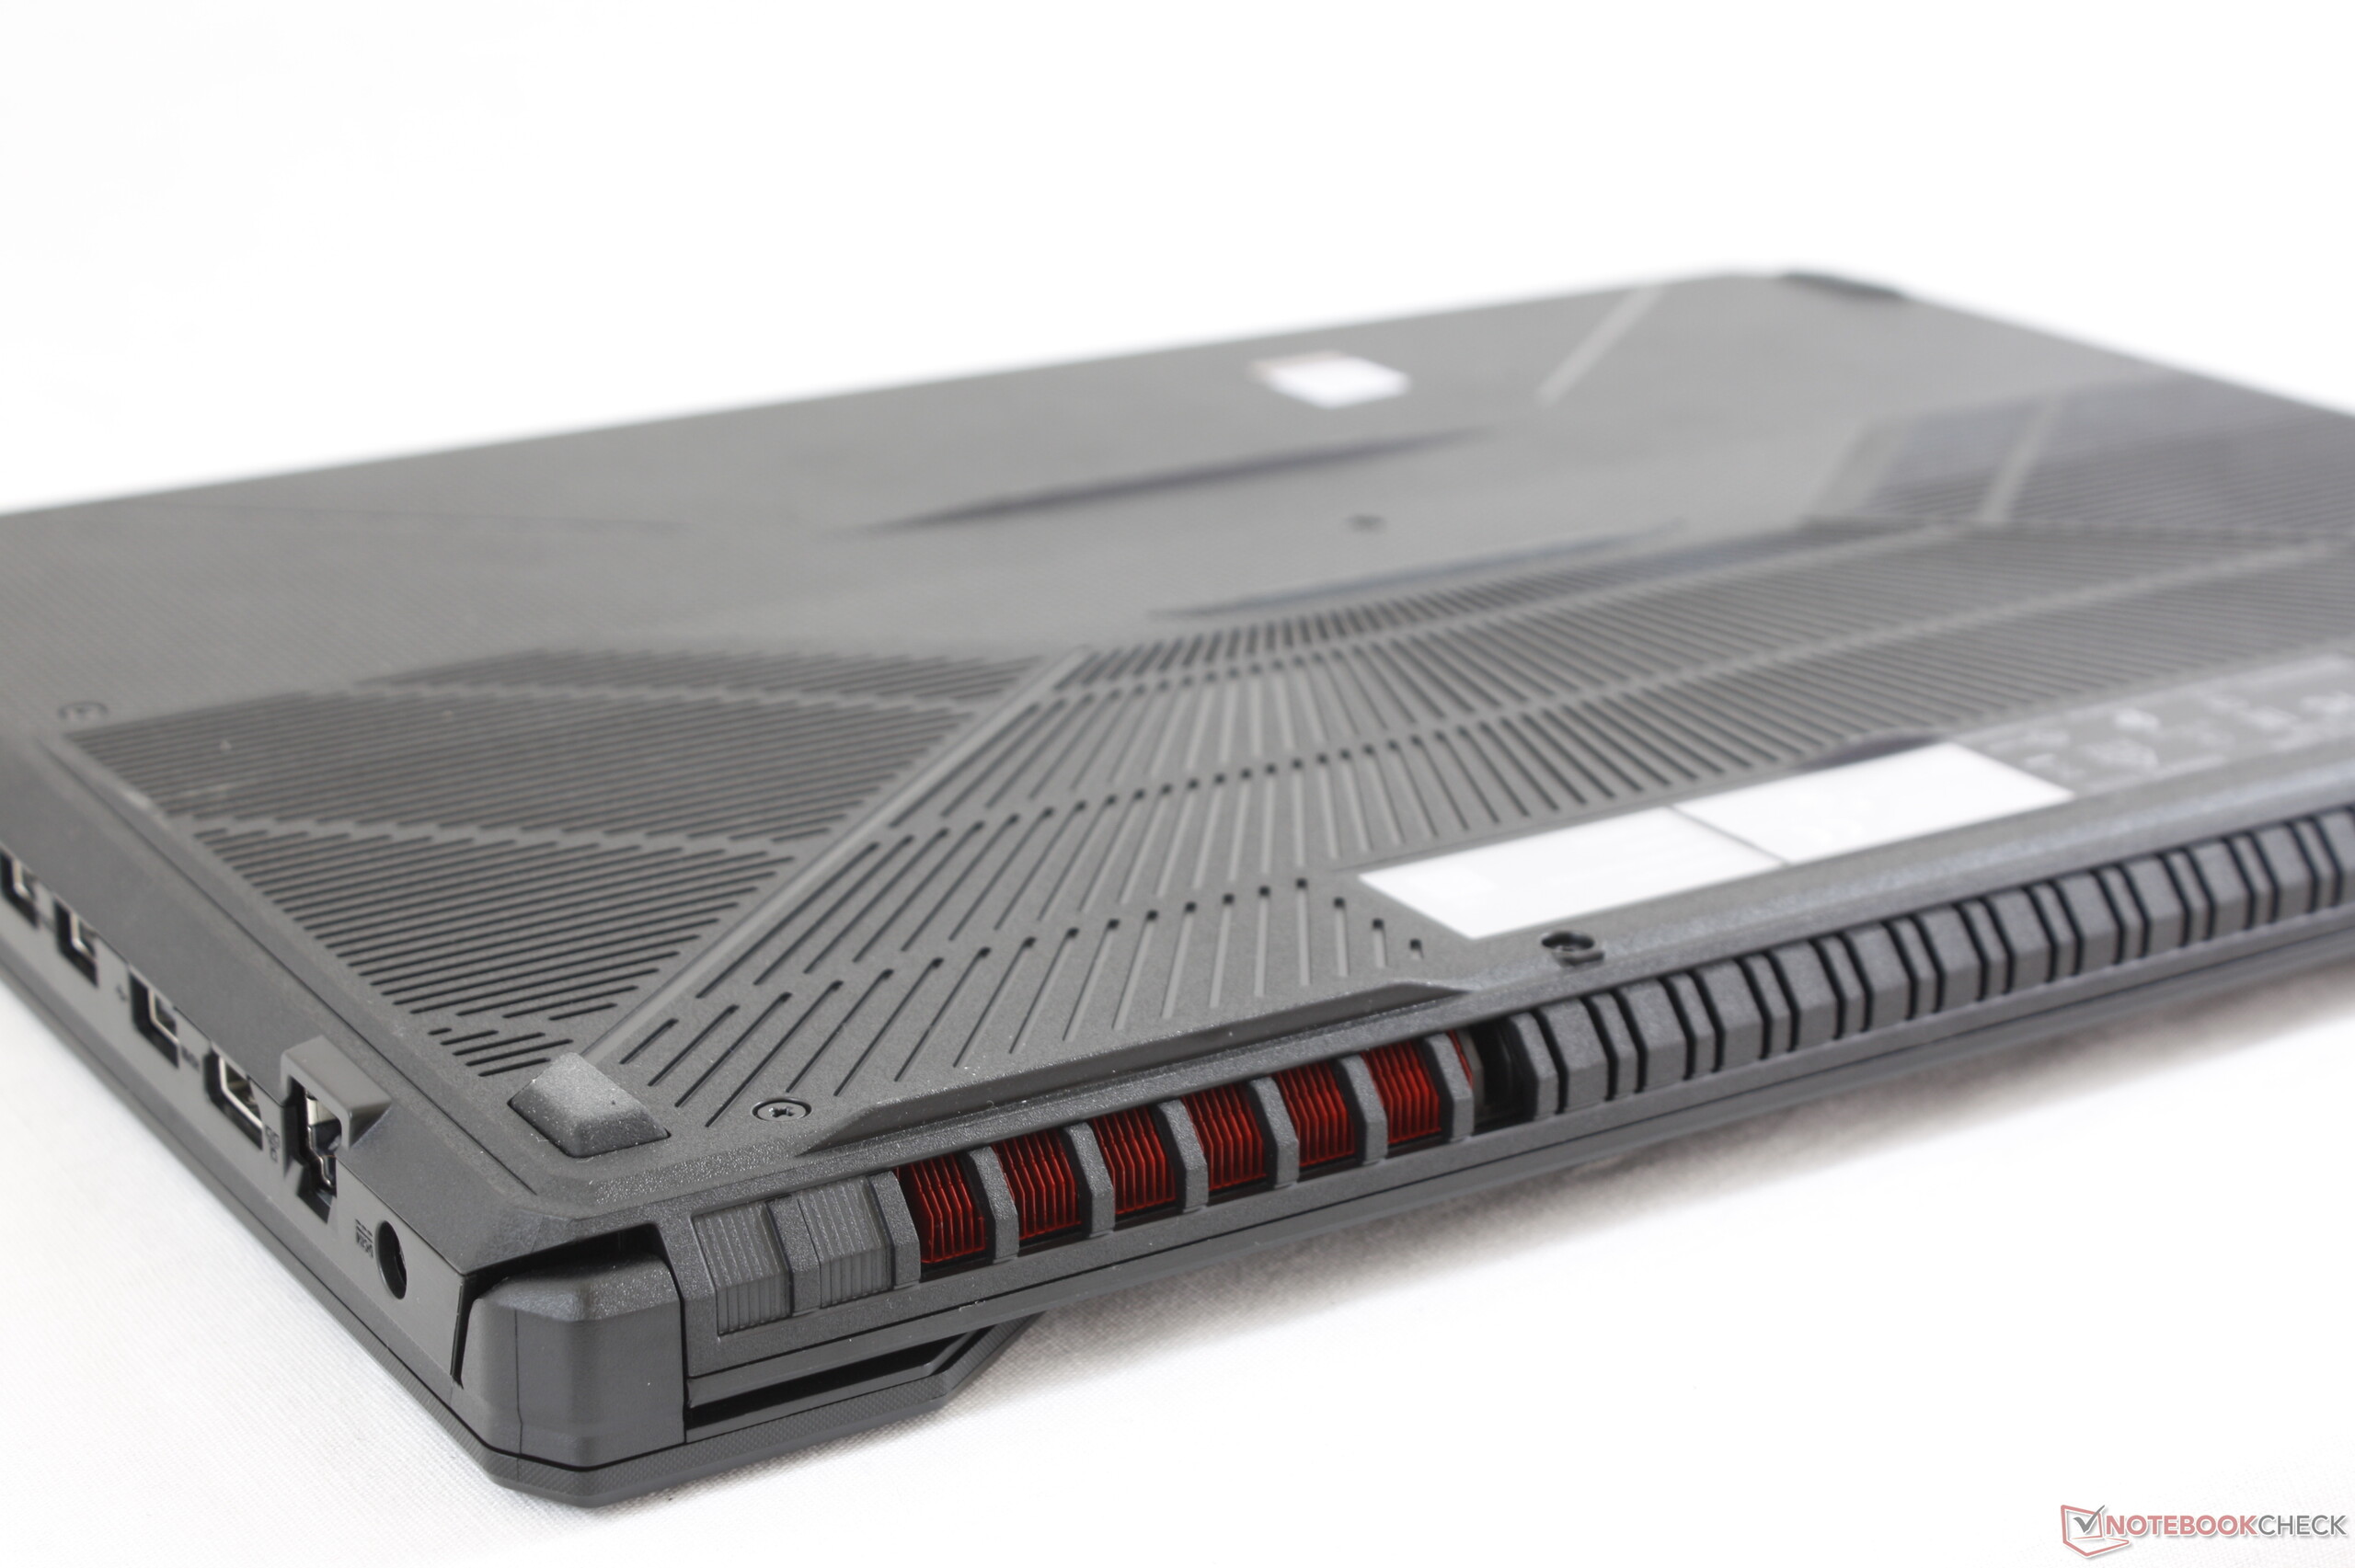
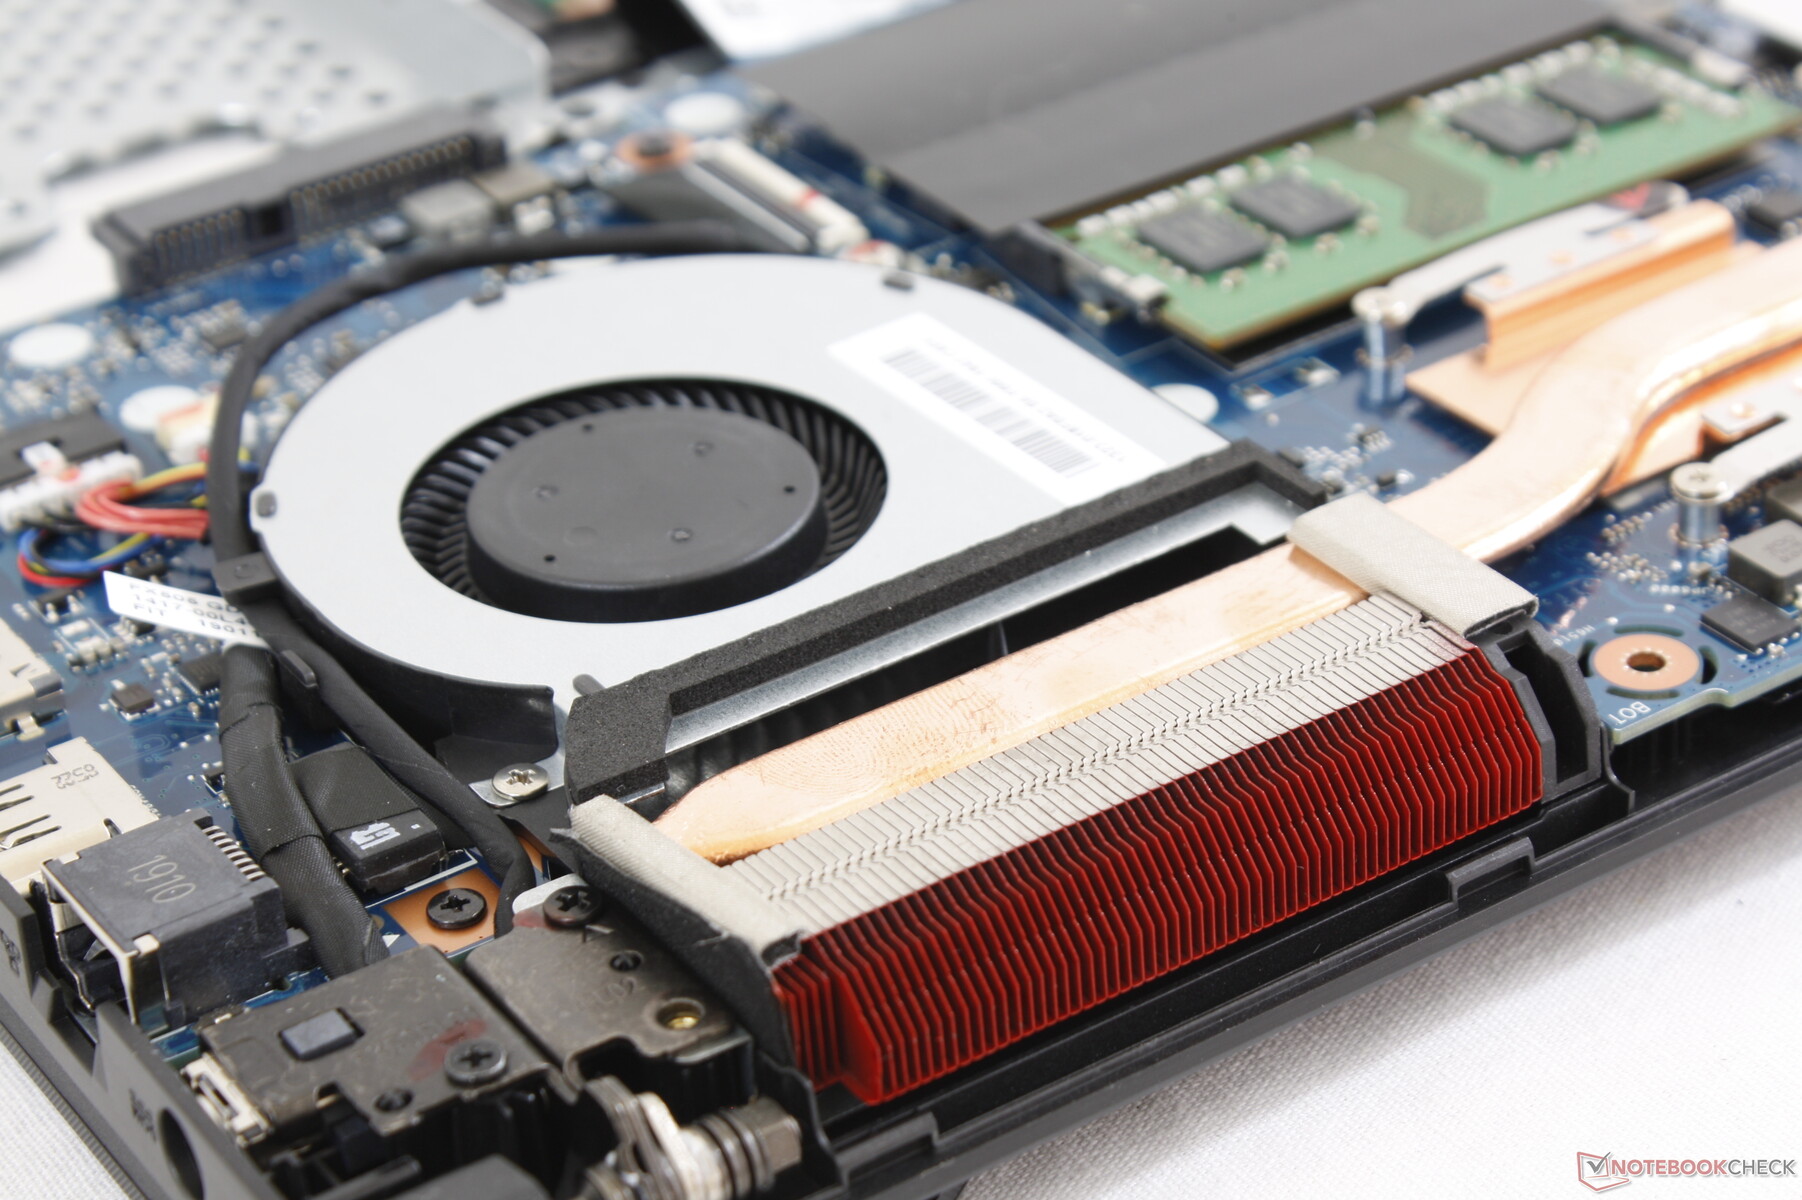
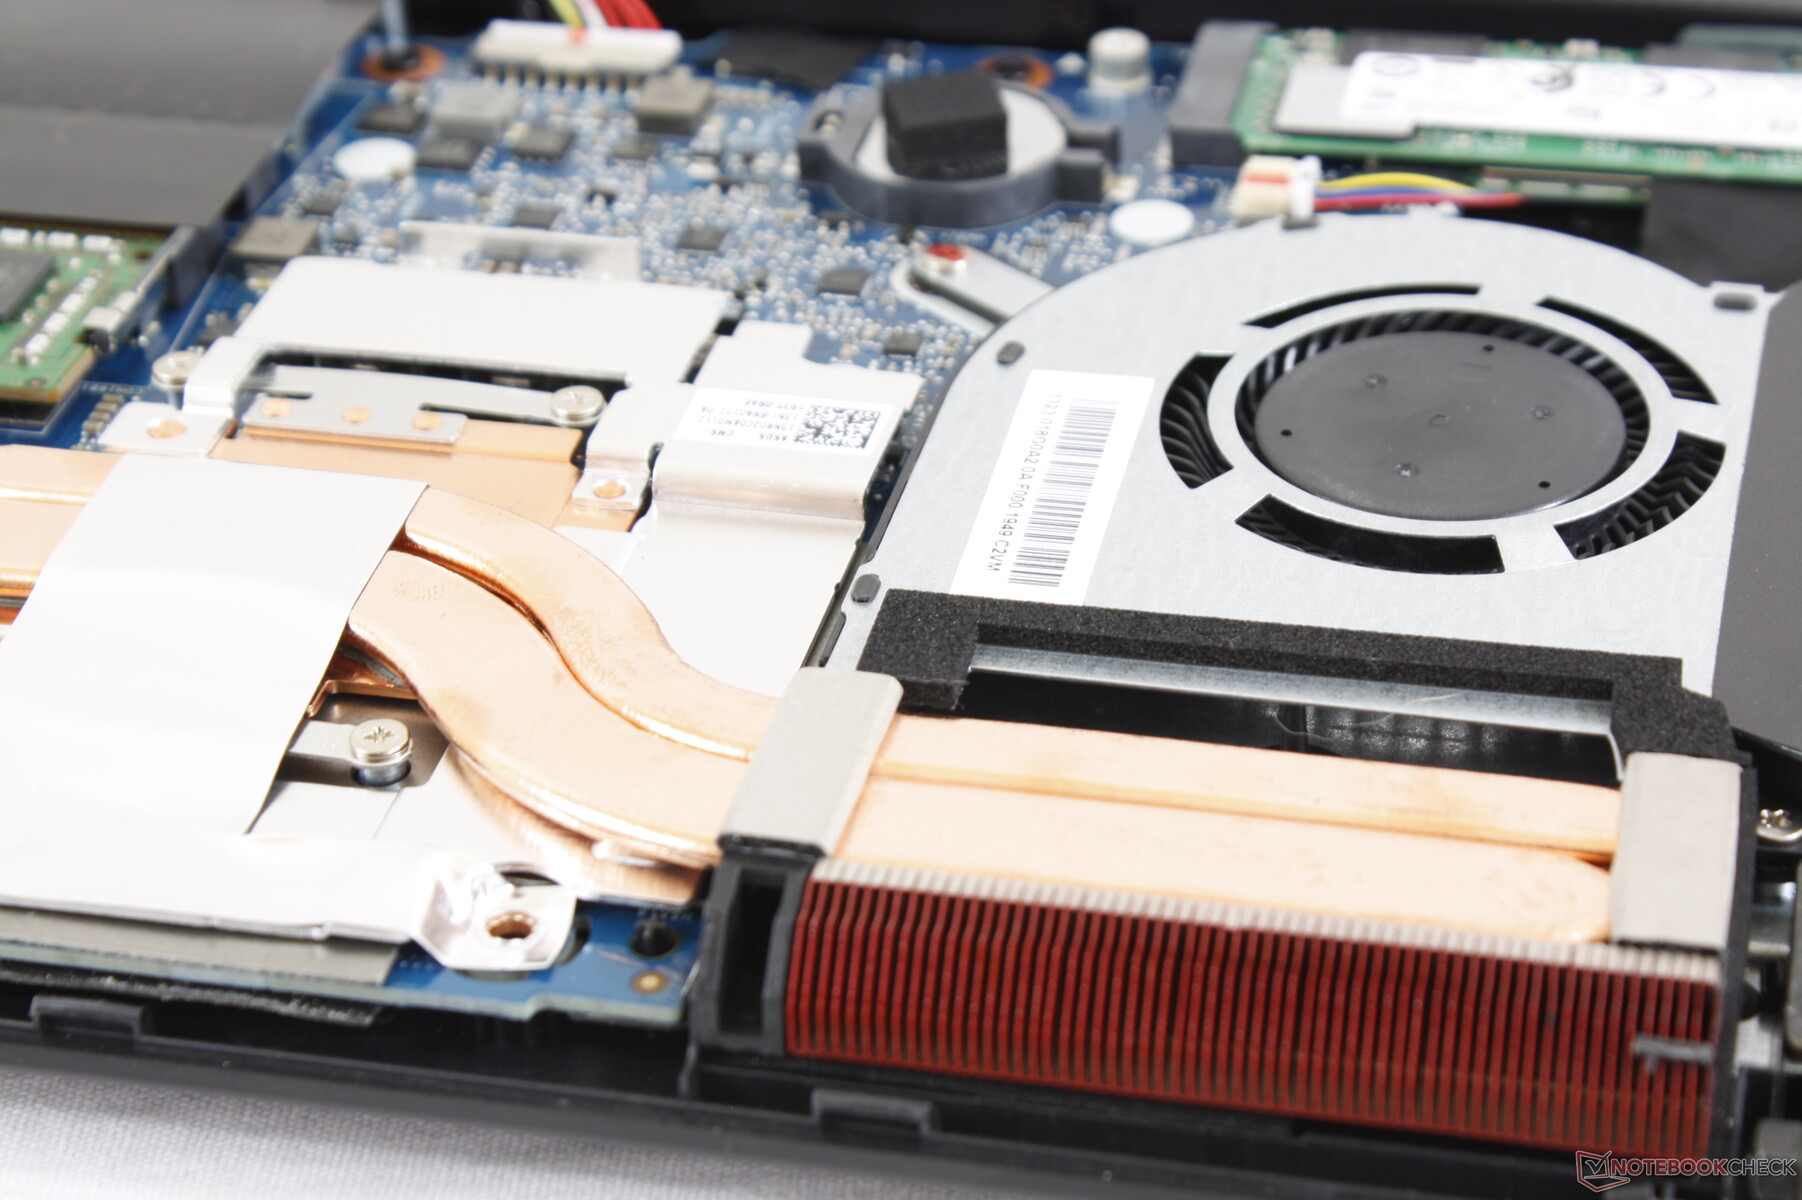
Maintenance
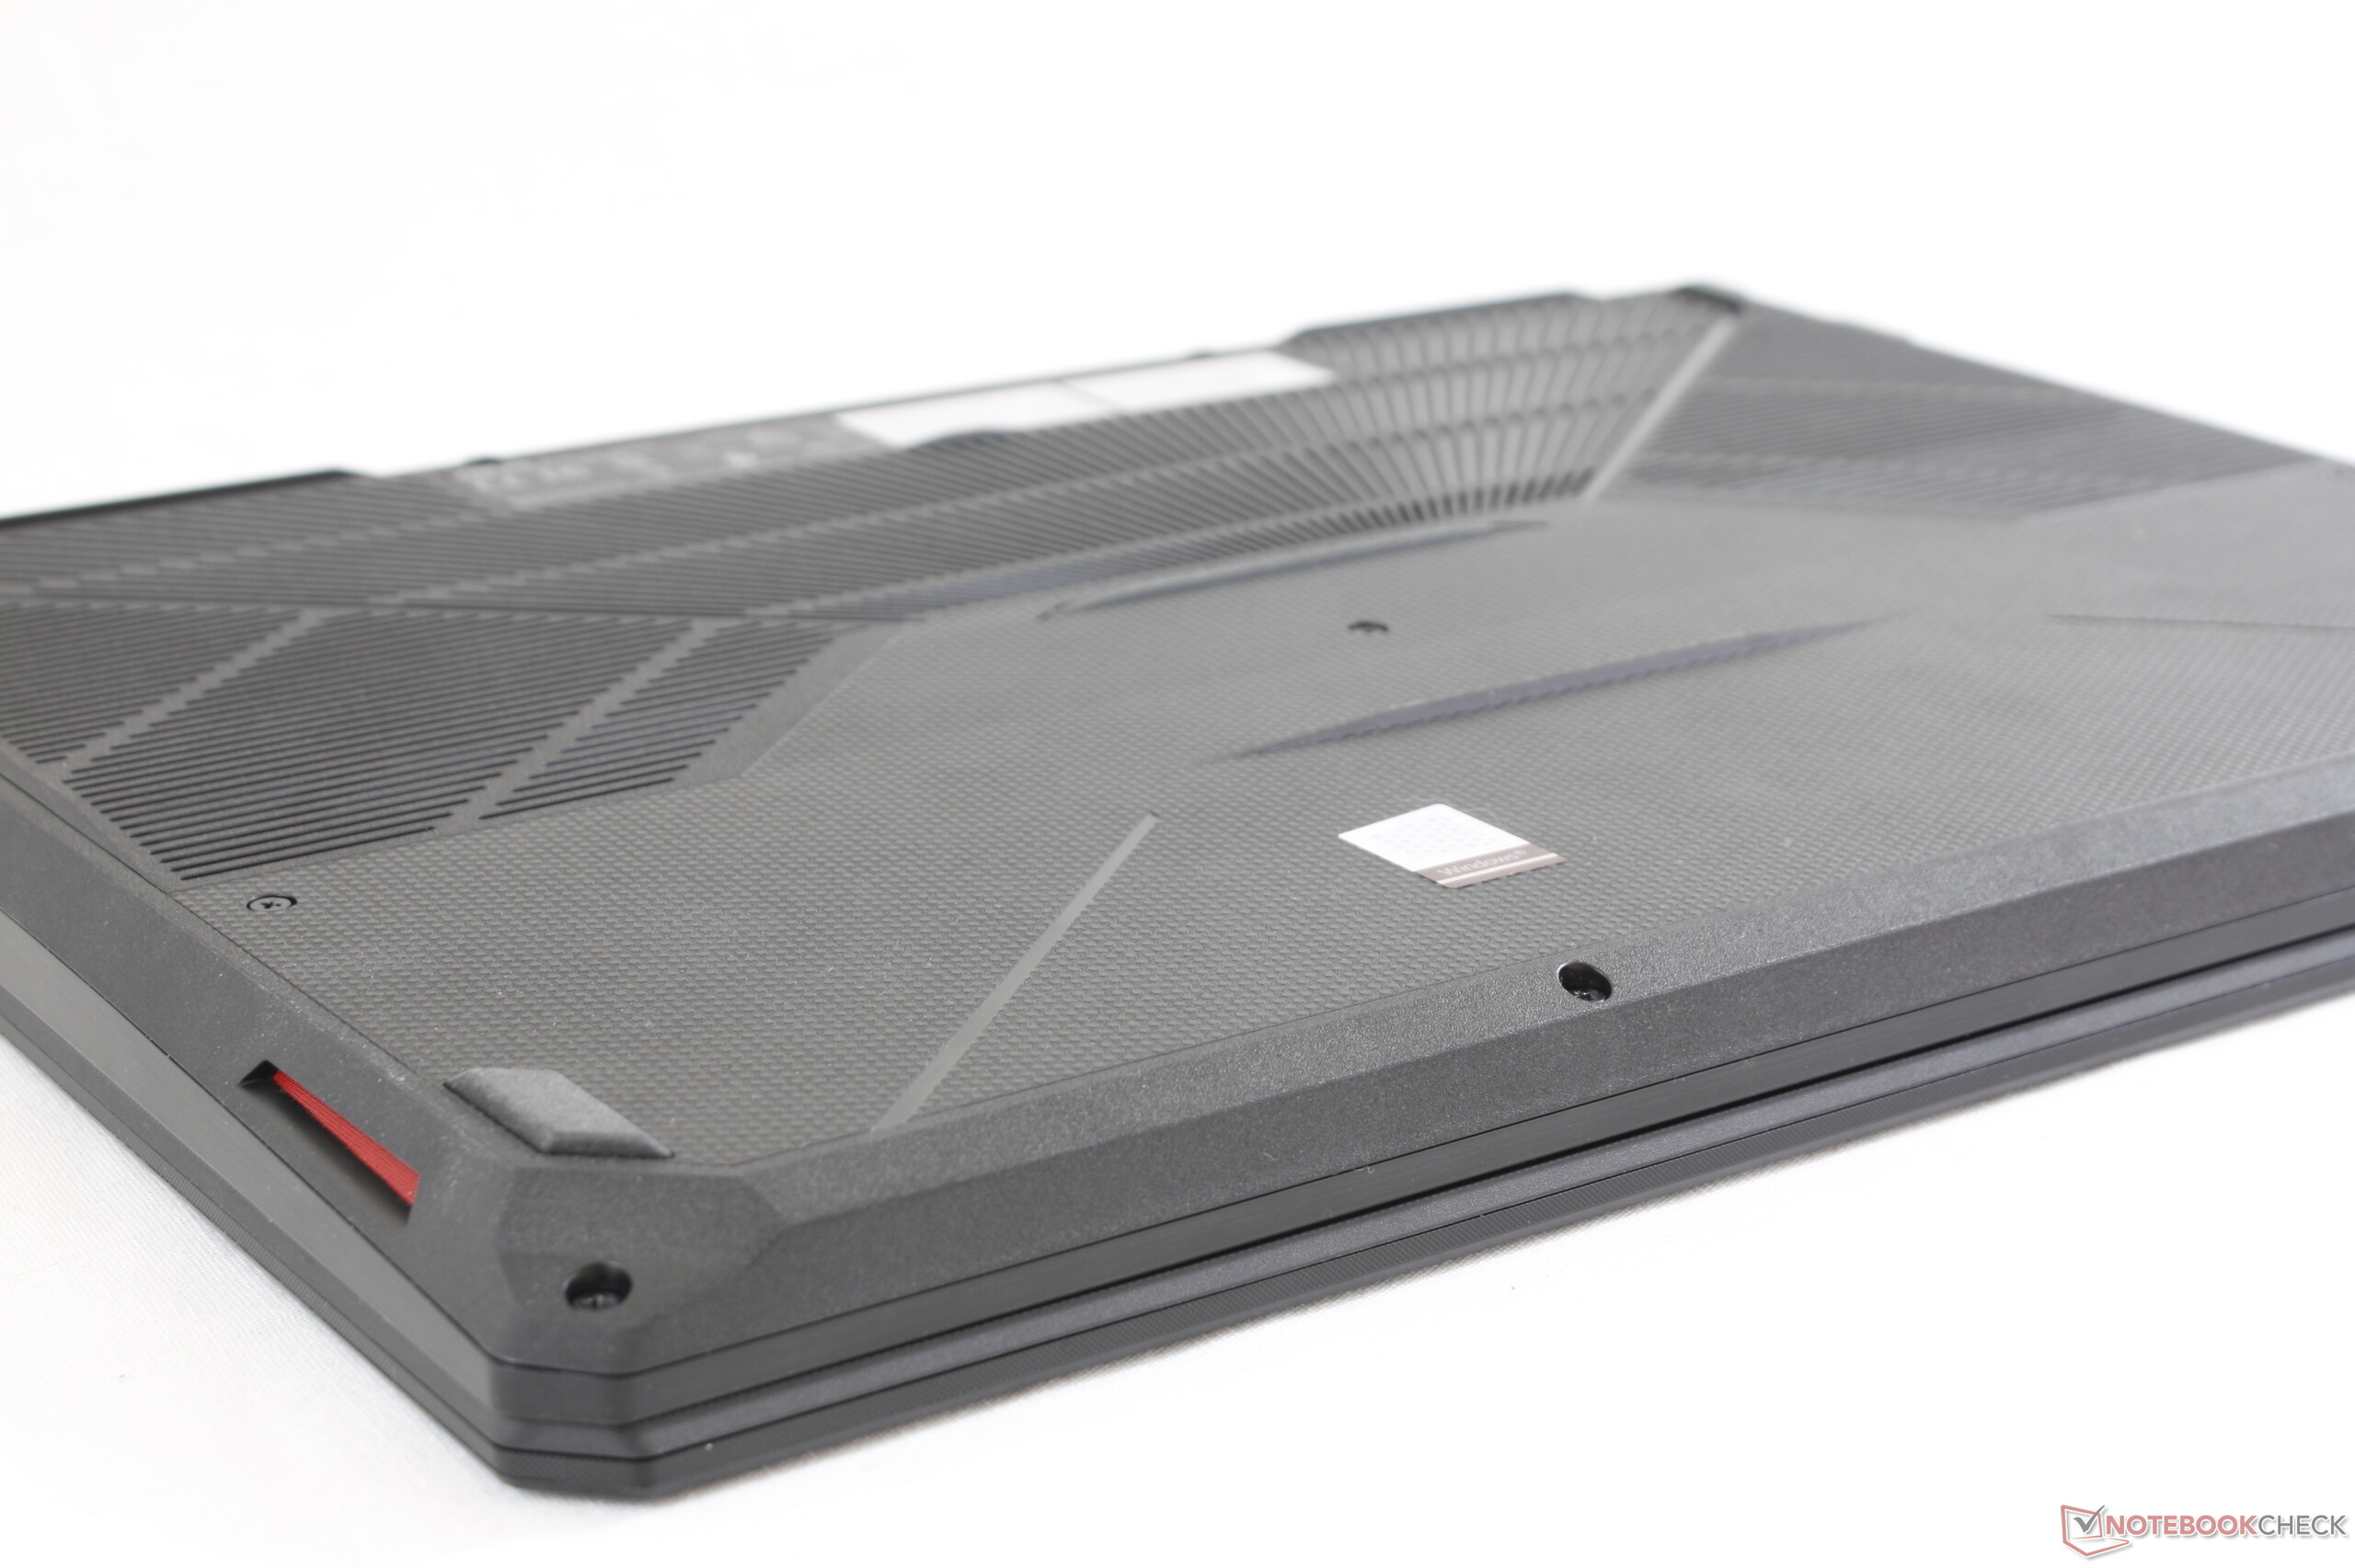
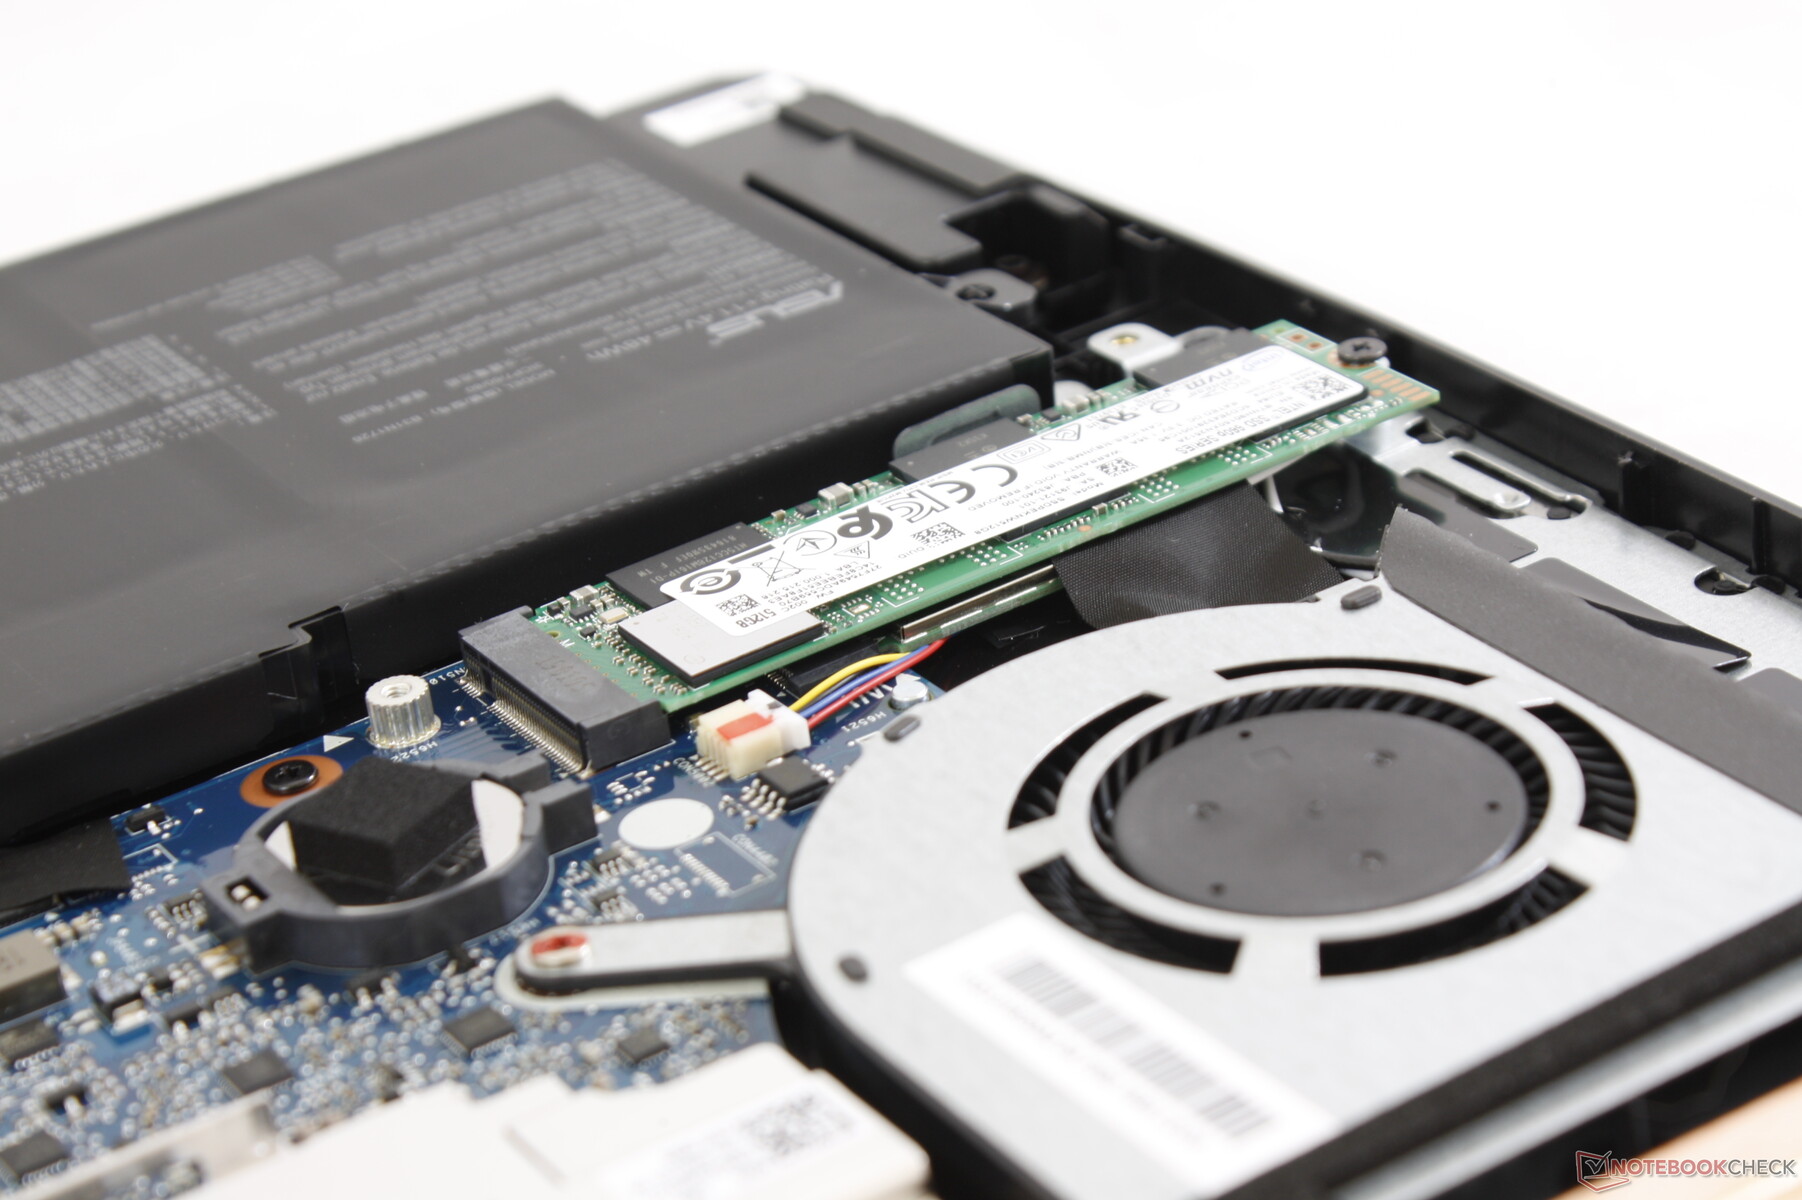
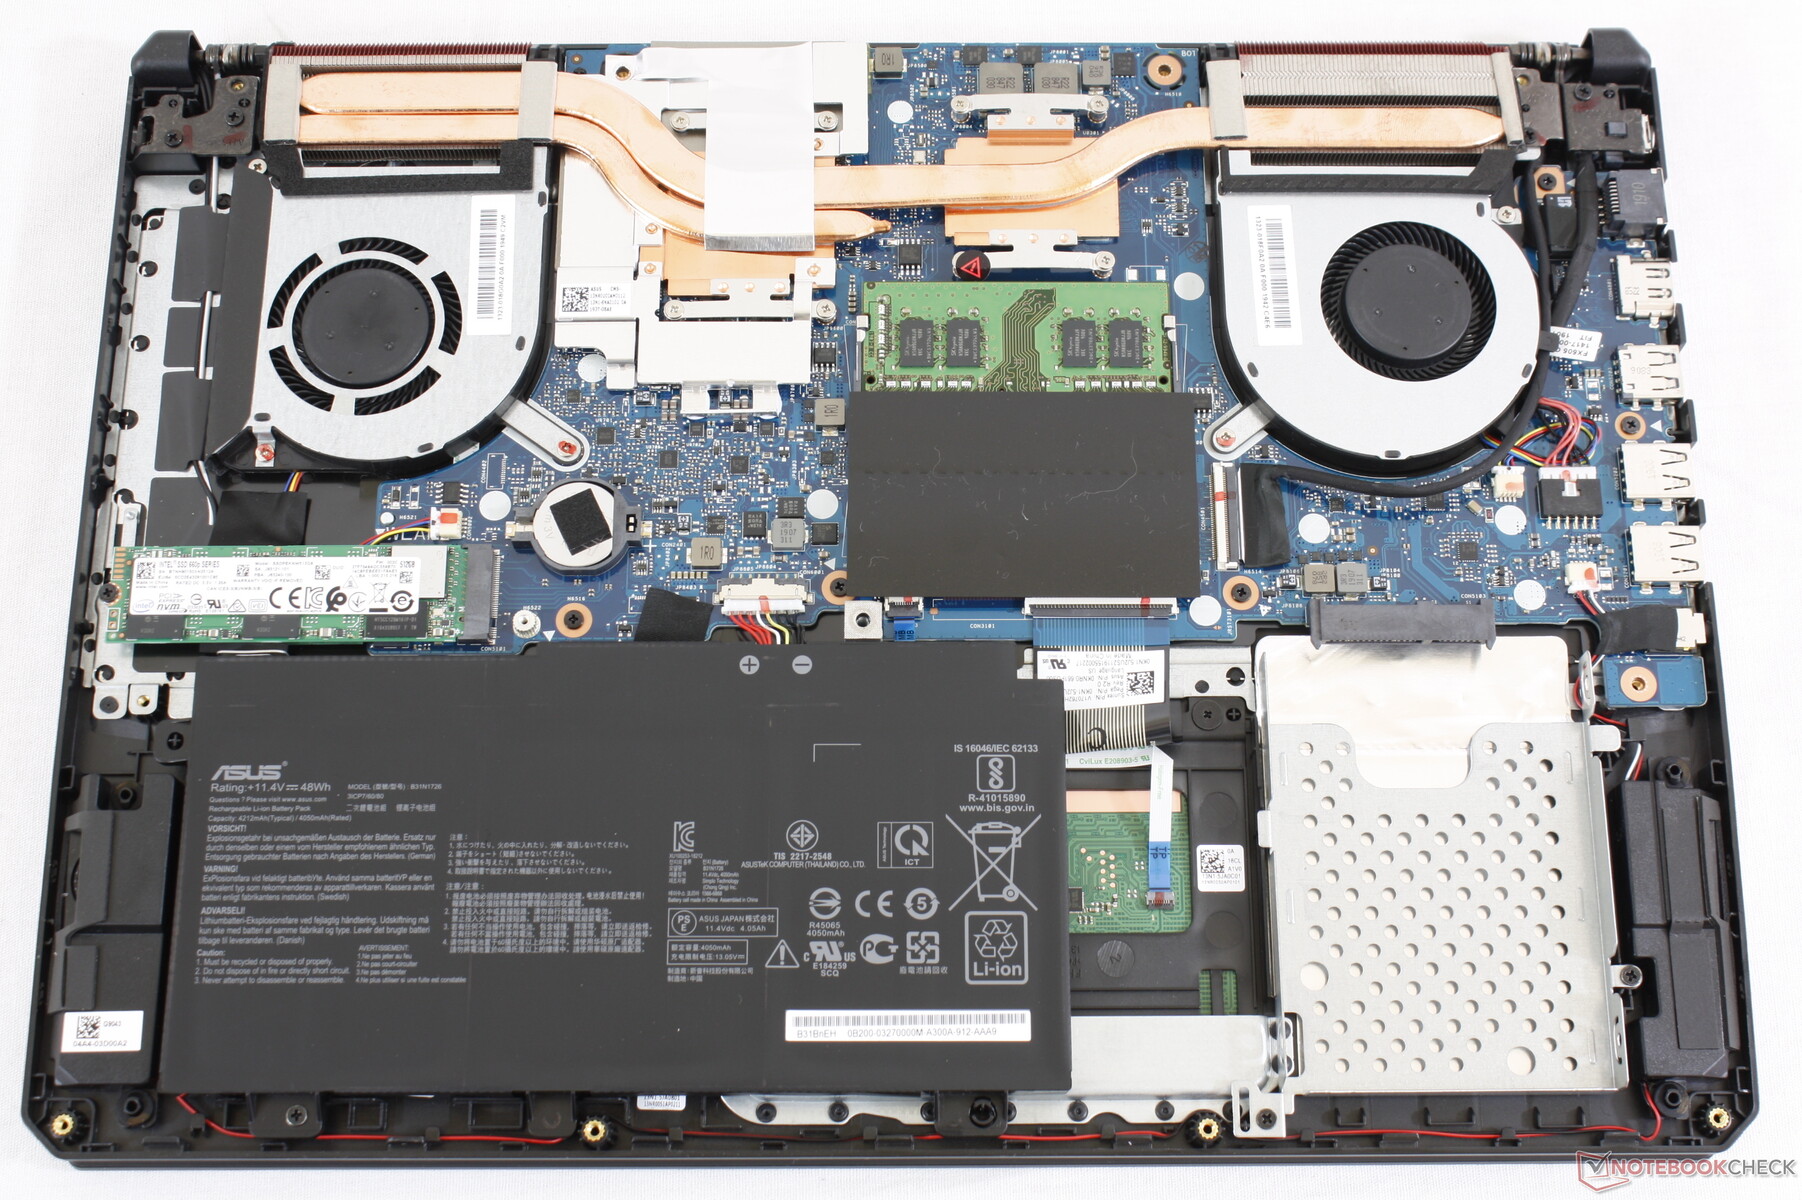
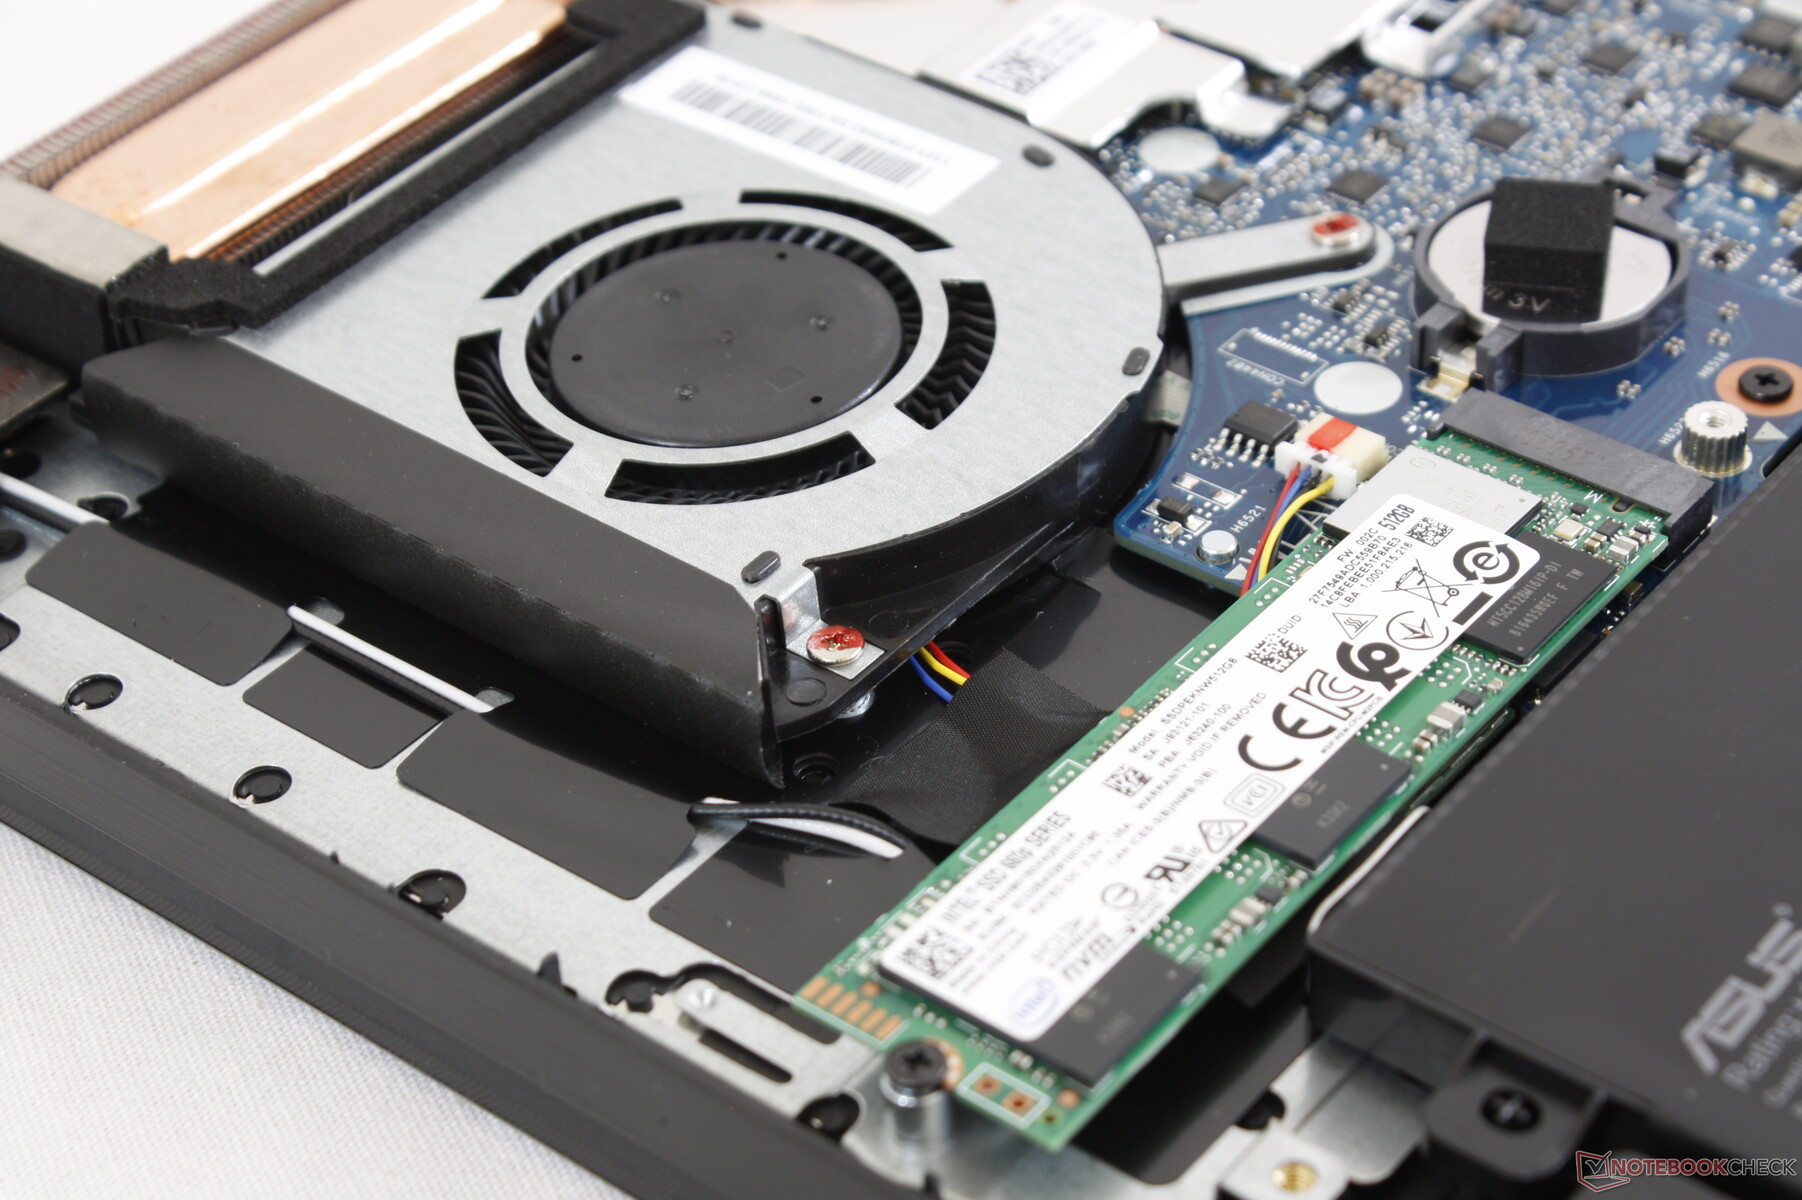
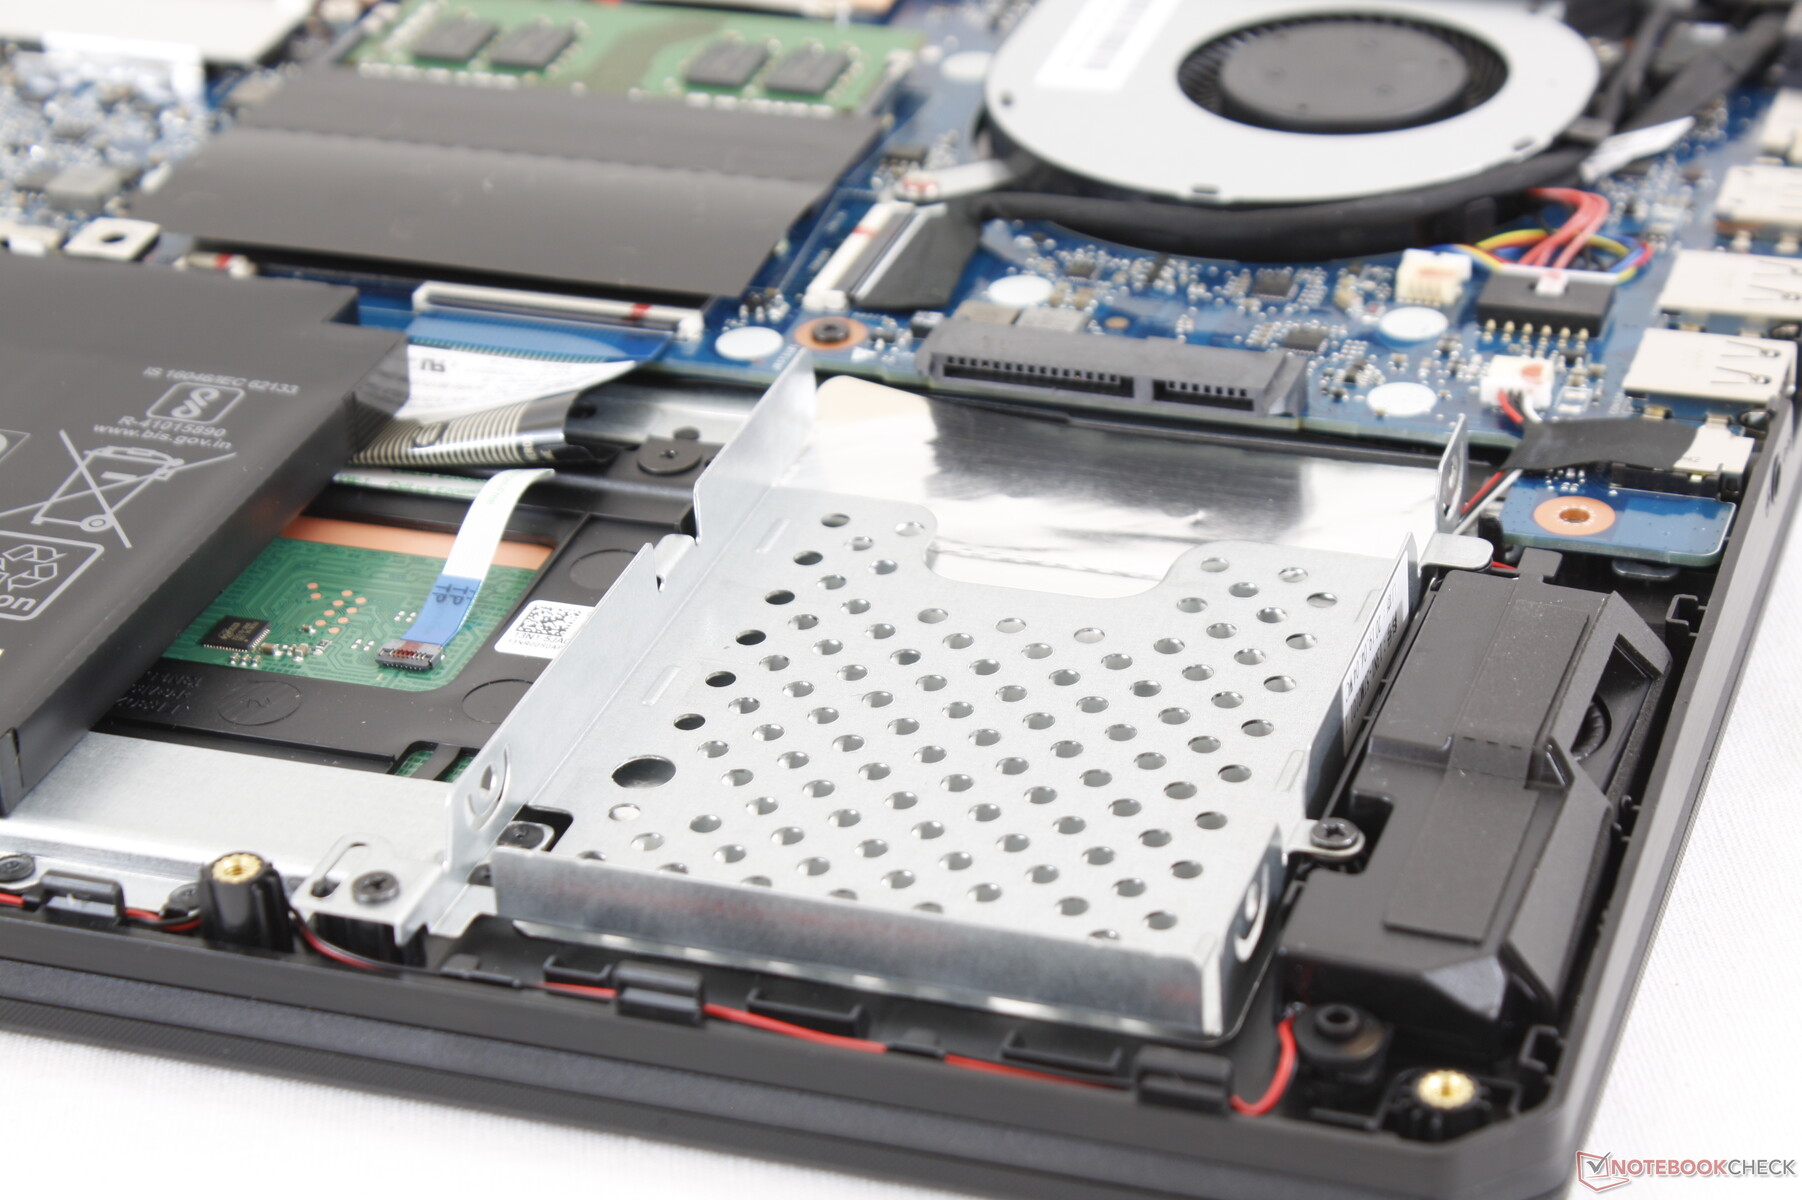
Gaming laptops should be easy to service and the FX505DT is no exception. Thankfully, the bottom panel pops off fairly easily after removing 11 screws to make upgrading straightforward. Owners have access to two storage bays, two SODIMM slots, and the BIOS battery. The M.2 storage drive must first be removed to access the WLAN module below it.
Accessories and Warranty
There are no extras in the box which is to be expected from a budget gaming laptop. Still, a velvet cleaning cloth would have been appreciated.
The standard one-year limited warranty applies. Asus will add in one year of accidental damage protection for free if you register your new purchase online.
Input Devices
Keyboard and Touchpad
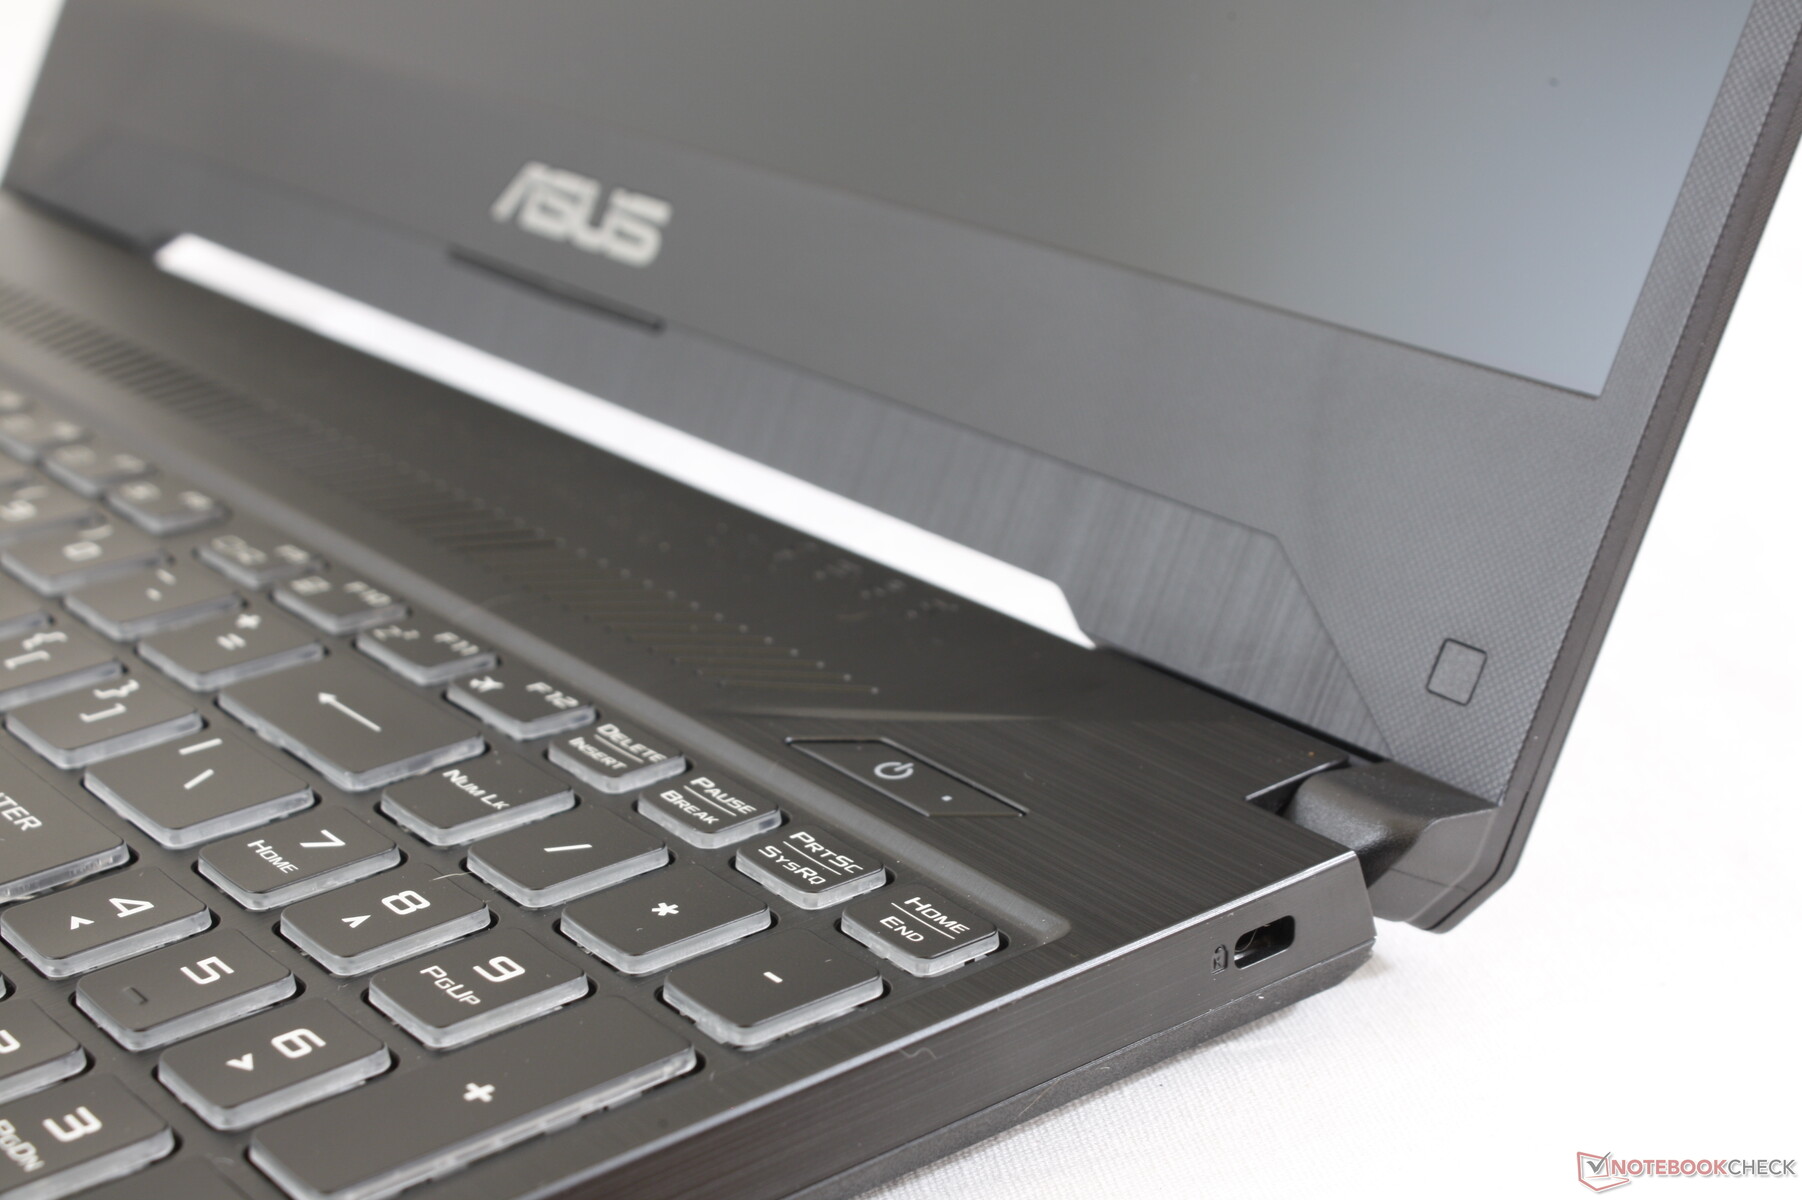
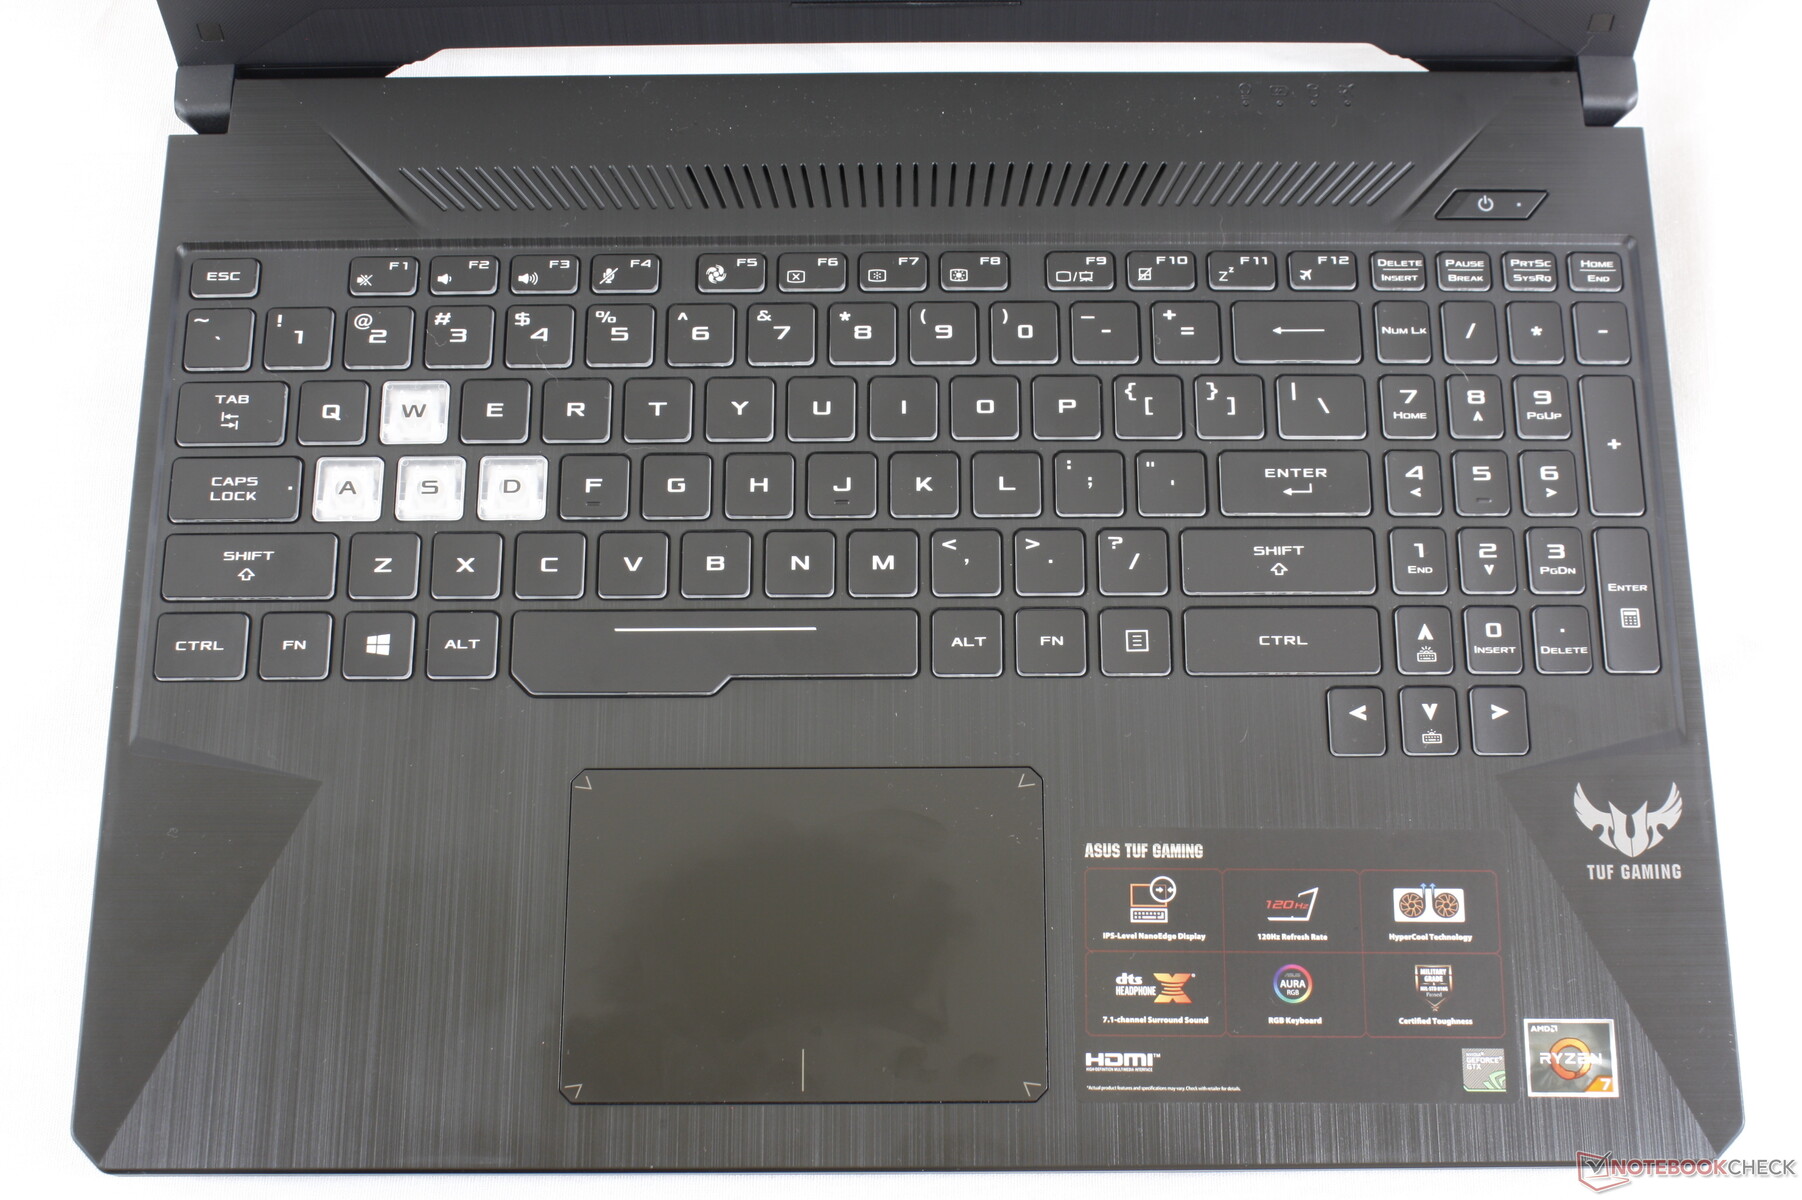
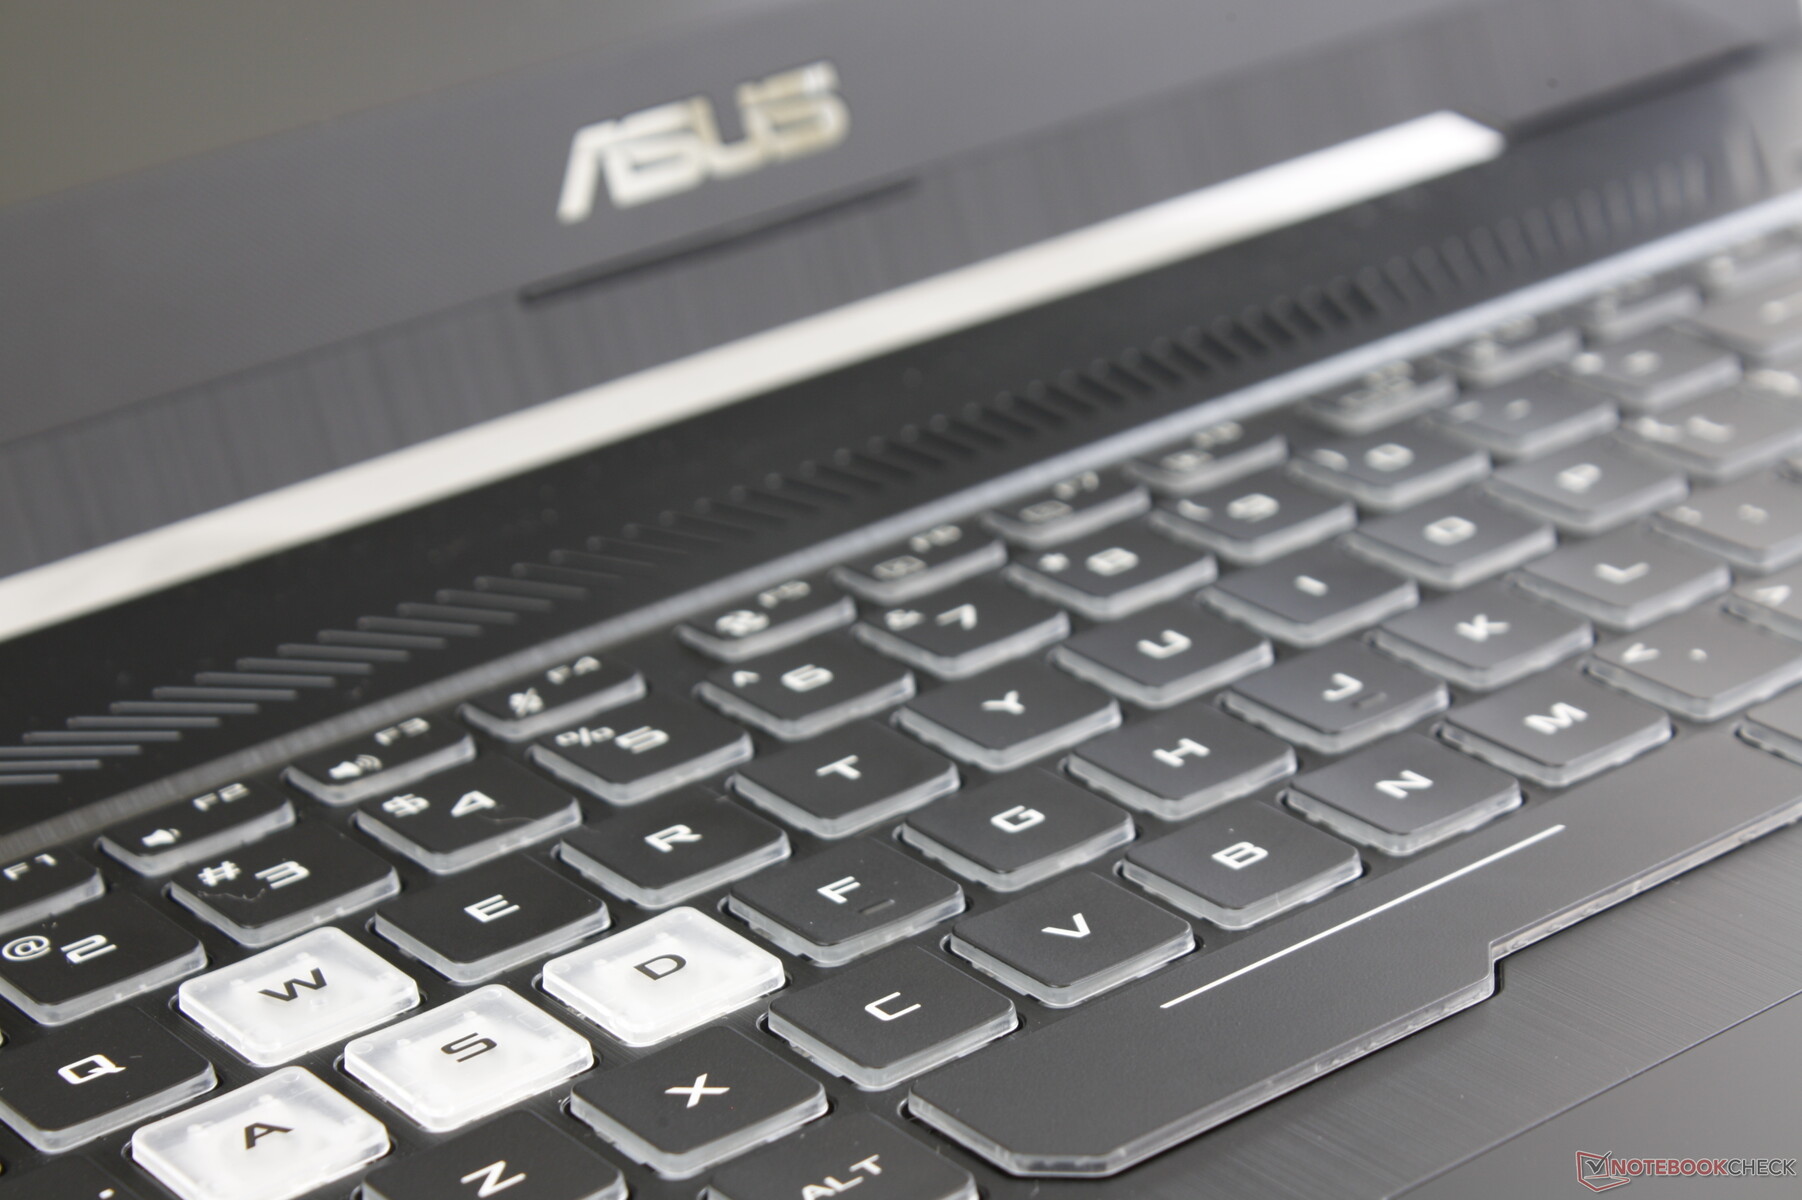
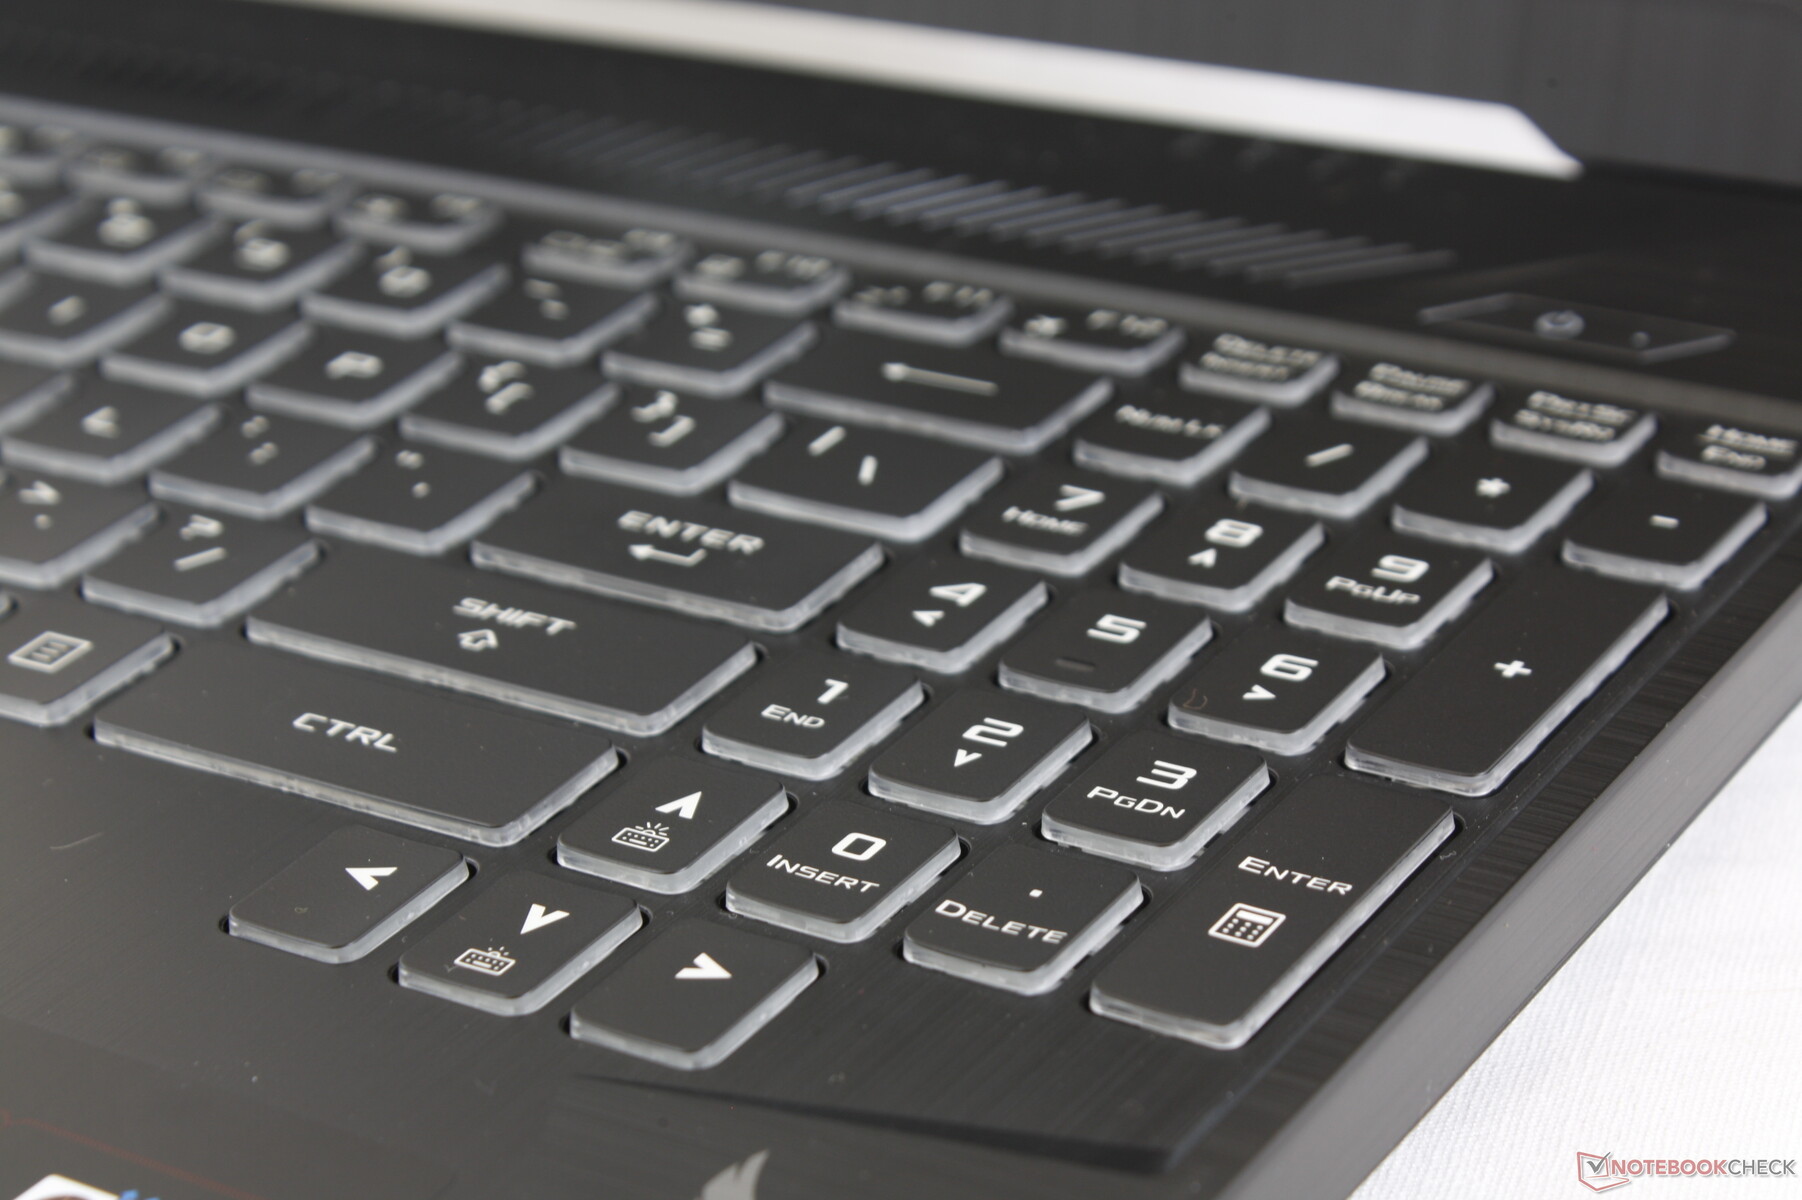
The keyboard and clickpad are essentially unchanged from the FX505DY, FX705DT, and FX705DY. Our existing comments therefore apply here on the FX505DT including the light-moderate clatter, slightly soft feedback, and moderately deep travel of the keyboard keys. Keep in mind that the NumPad and Arrow keys are smaller than the main QWERTY keys and are subsequently softer and more cramped to use.
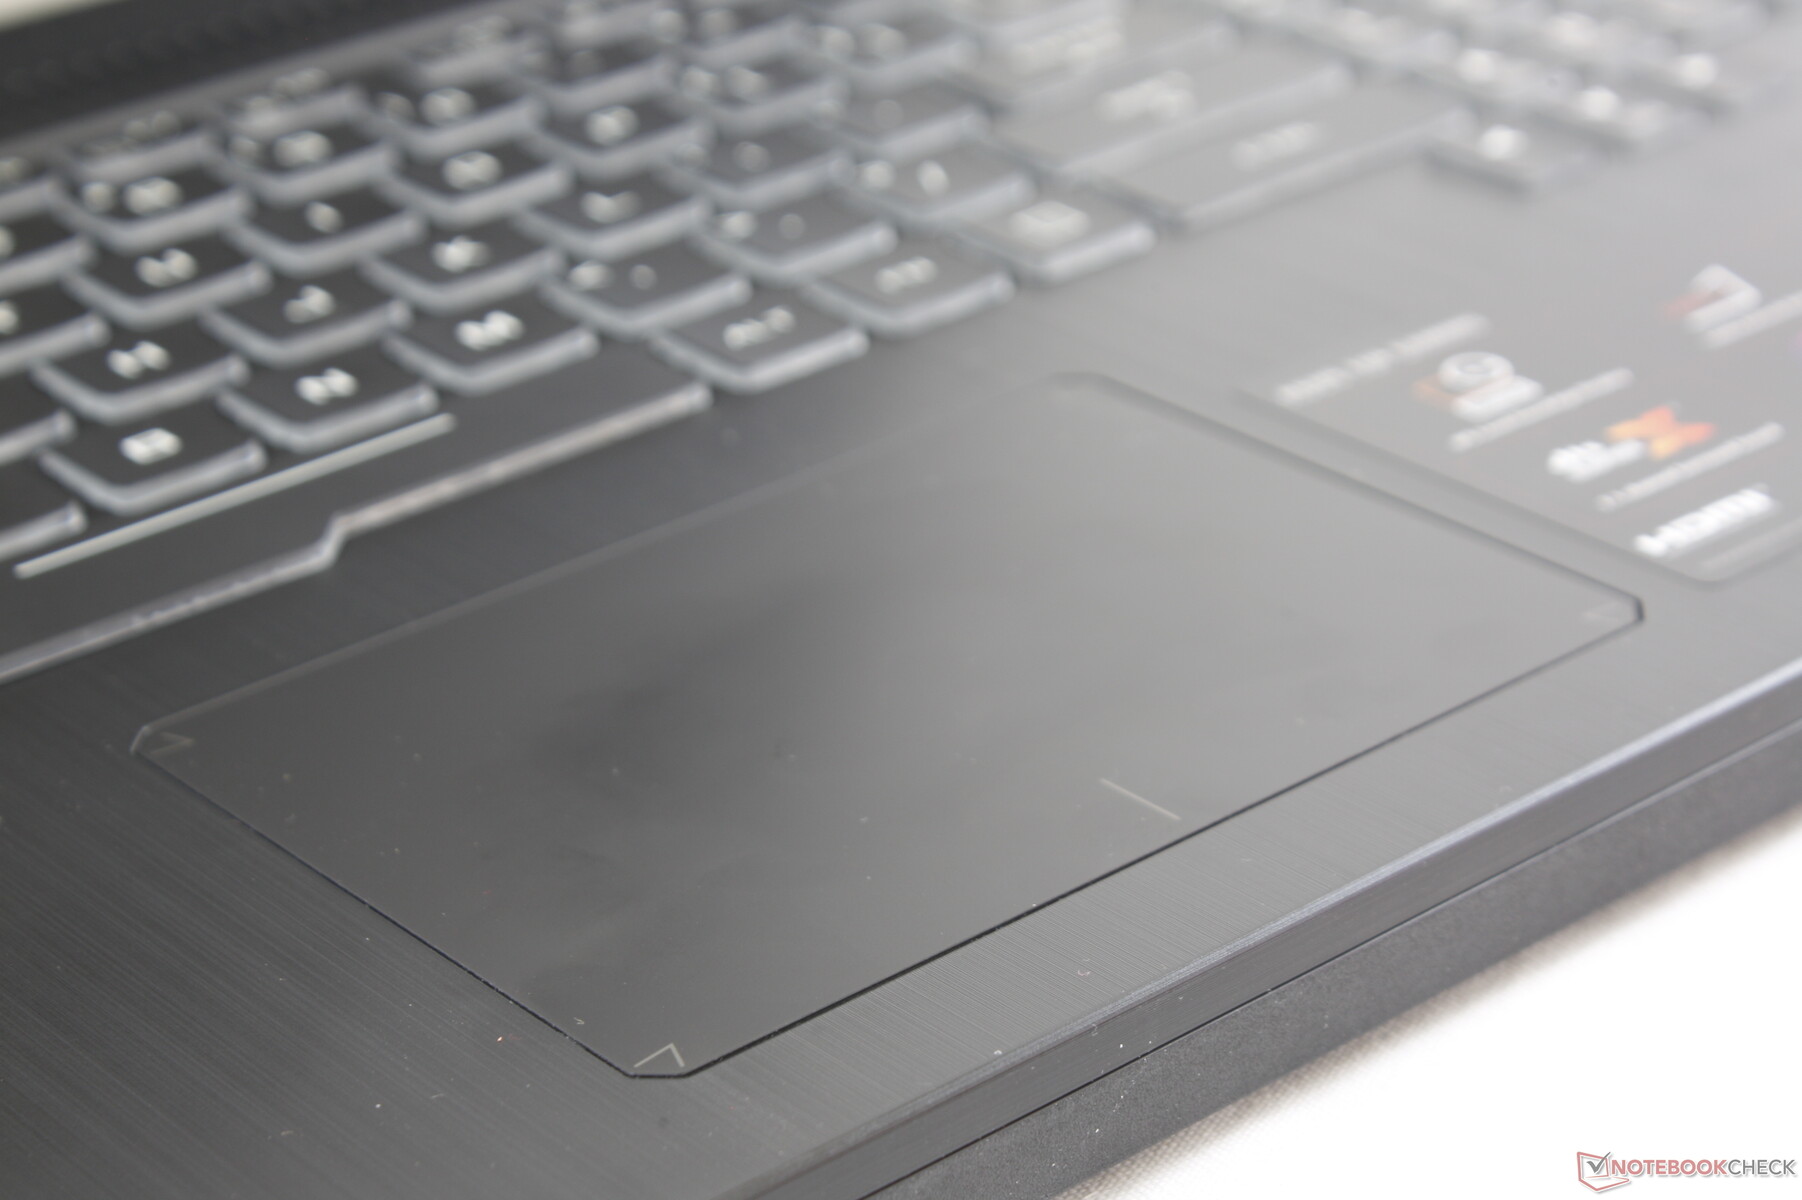
In contrast to the keyboard, the Precision-enabled clickpad has a firmer and louder feedback with shallow travel when pressed. It's actually quite good as far as integrated mouse keys go, but we still prefer dedicated mouse keys for more accuracy. The clickpad surface is unfortunately not that great for cursor control with its bumpy glide at slow-medium speeds.
Display

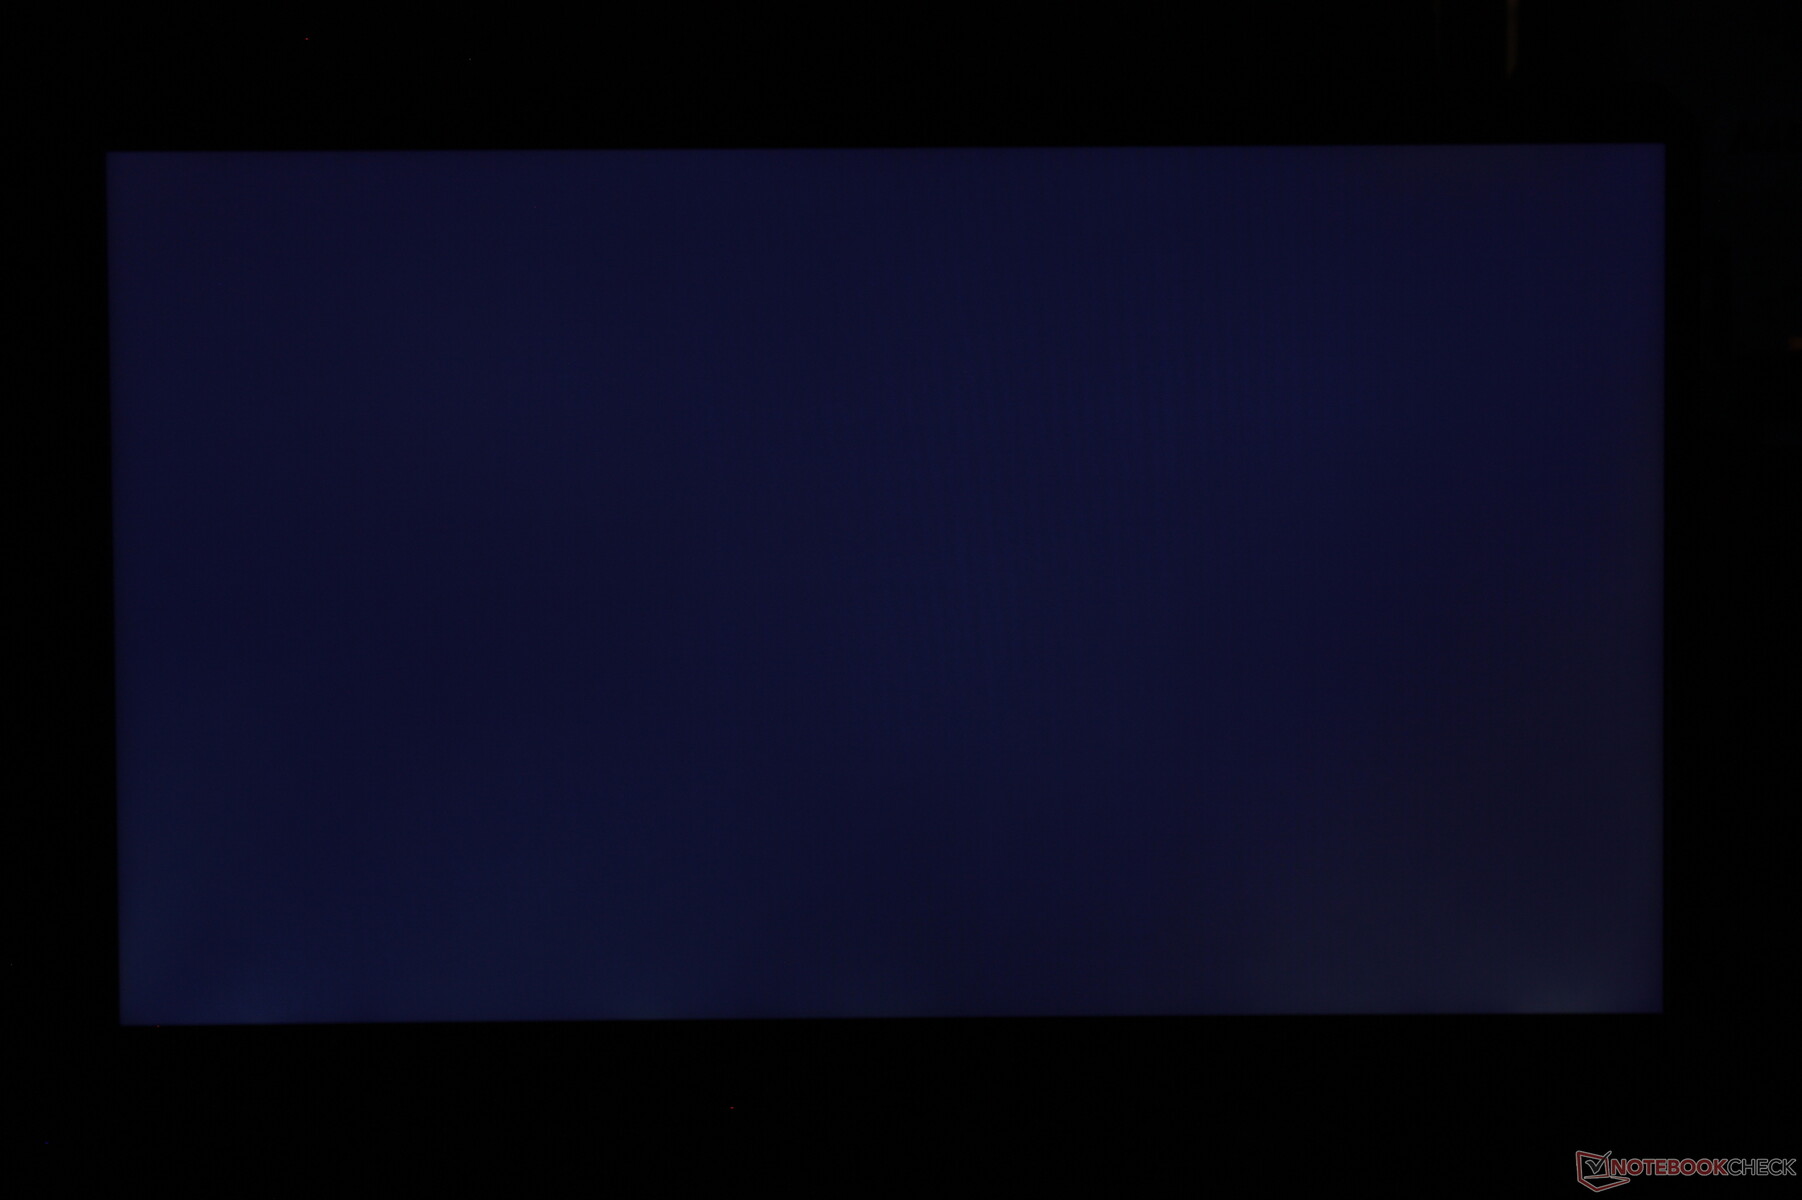
The 120 Hz display on our FX505DT is a notable improvement over the 60 Hz display on the older FX505DY. Aside from the smoother refresh rate, the panel is 33 percent brighter with slightly faster black-white and gray-gray response times all while maintaining nearly the same contrast ratios and color spaces. These improvements are perceptible both in and out of games for an overall better user experience. As we've mentioned before, it can be tough to go back to 60 Hz displays once you become accustomed to displays with very high native refresh rates.
The main drawbacks to the panel are its inaccurate colors and narrow color space. Both of these characteristics combine to create shallow colors that are not nearly as deep or precise as flagship Ultrabooks or higher-end gaming laptops.
Another drawback are the average black-white and gray-gray response times for noticeably more ghosting especially when compared to the newer 3 ms or 5 ms panels on pricier laptops like the MSI GS65. The AU Optronics panel on the Zephyrus S GX502, for example, is far smoother and with a wider gamut as well. The 120 Hz panel of our FX505DT is therefore a mid-range offering as it doesn't quite have the same deep colors or fast response times as the higher-end alternatives.
It's worth noting that HWiNFO labels this IPS panel as a Panda LM156LF-GL. Older versions of the software incorrectly labeled Panda panels as Sharp panels like what we discovered on the TUF FX505DY and Zephyrus G GA502.
| |||||||||||||||||||||||||
Brightness Distribution: 84 %
Center on Battery: 286.2 cd/m²
Contrast: 867:1 (Black: 0.33 cd/m²)
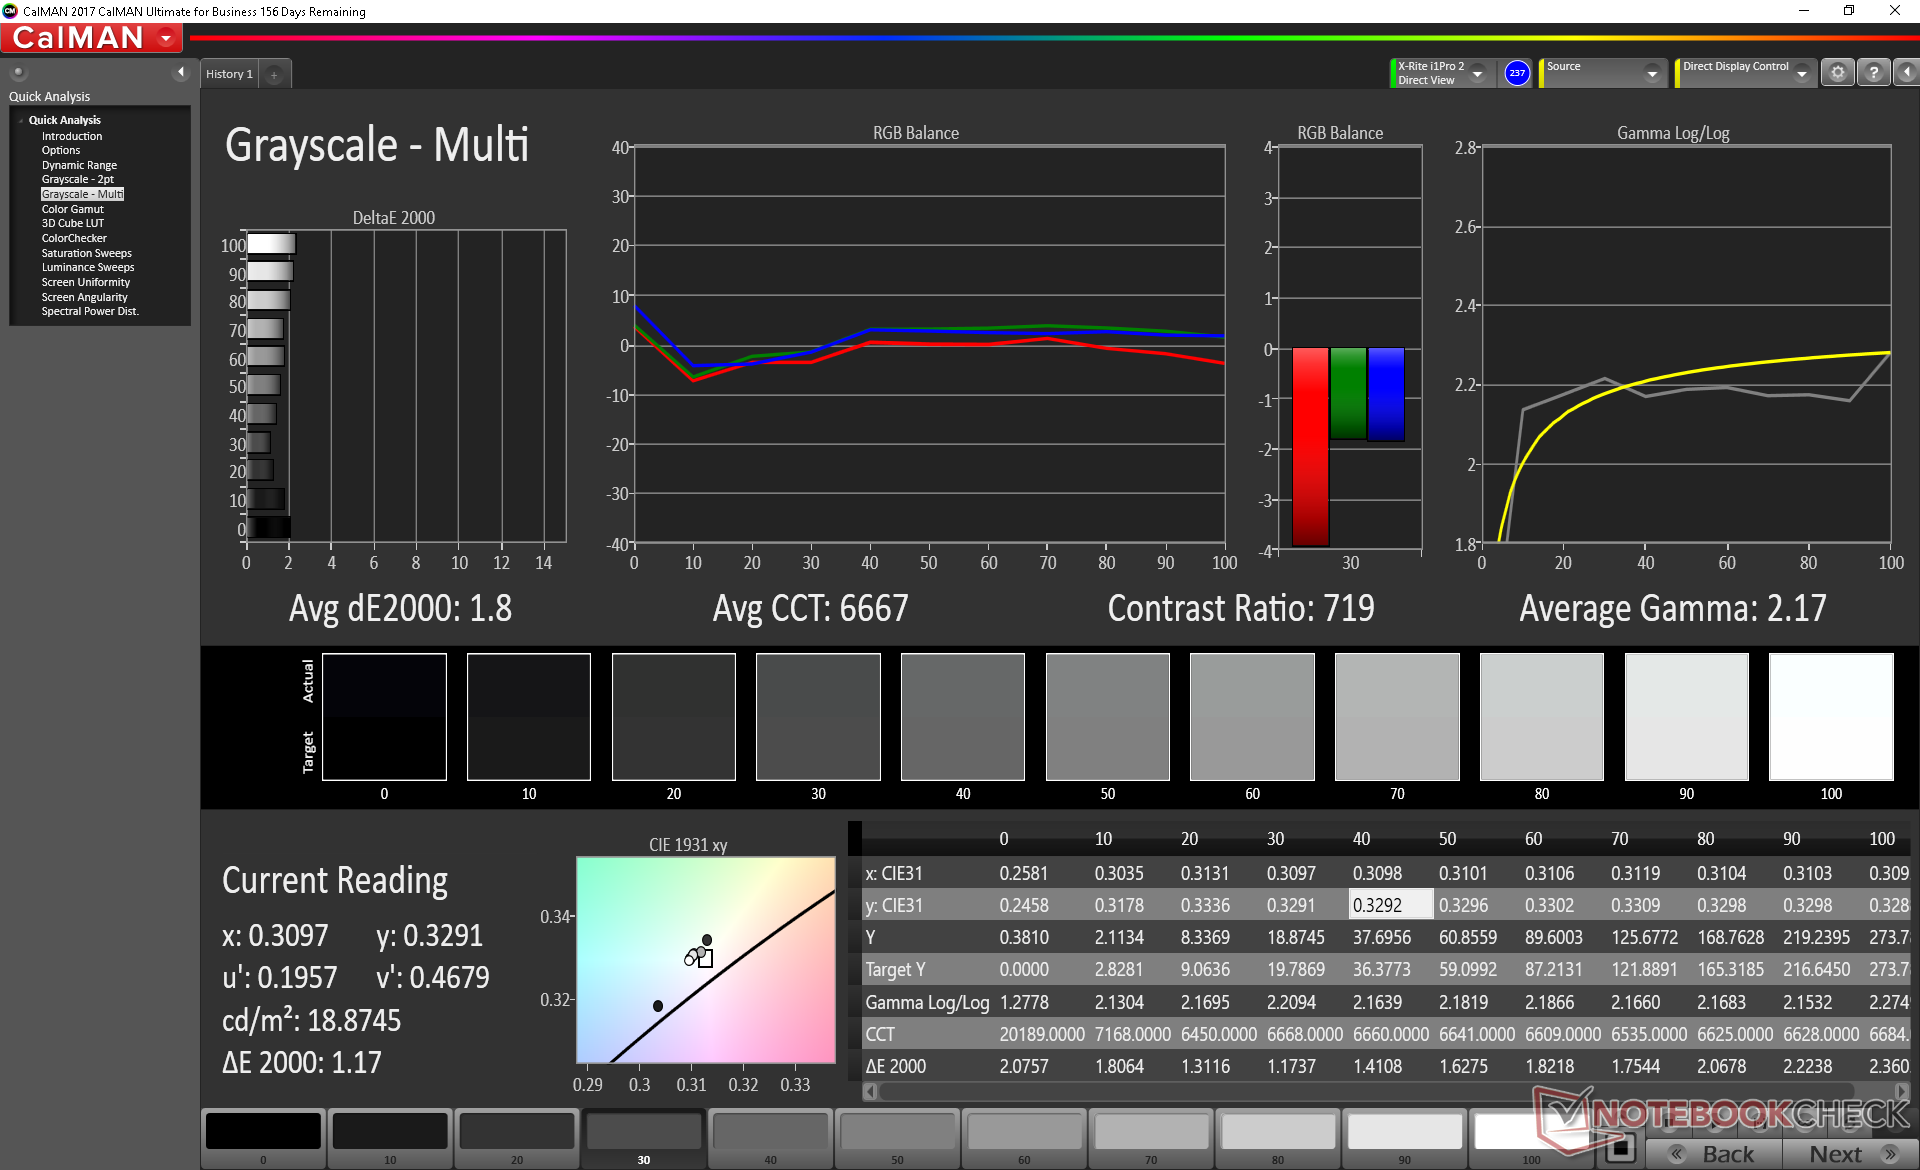
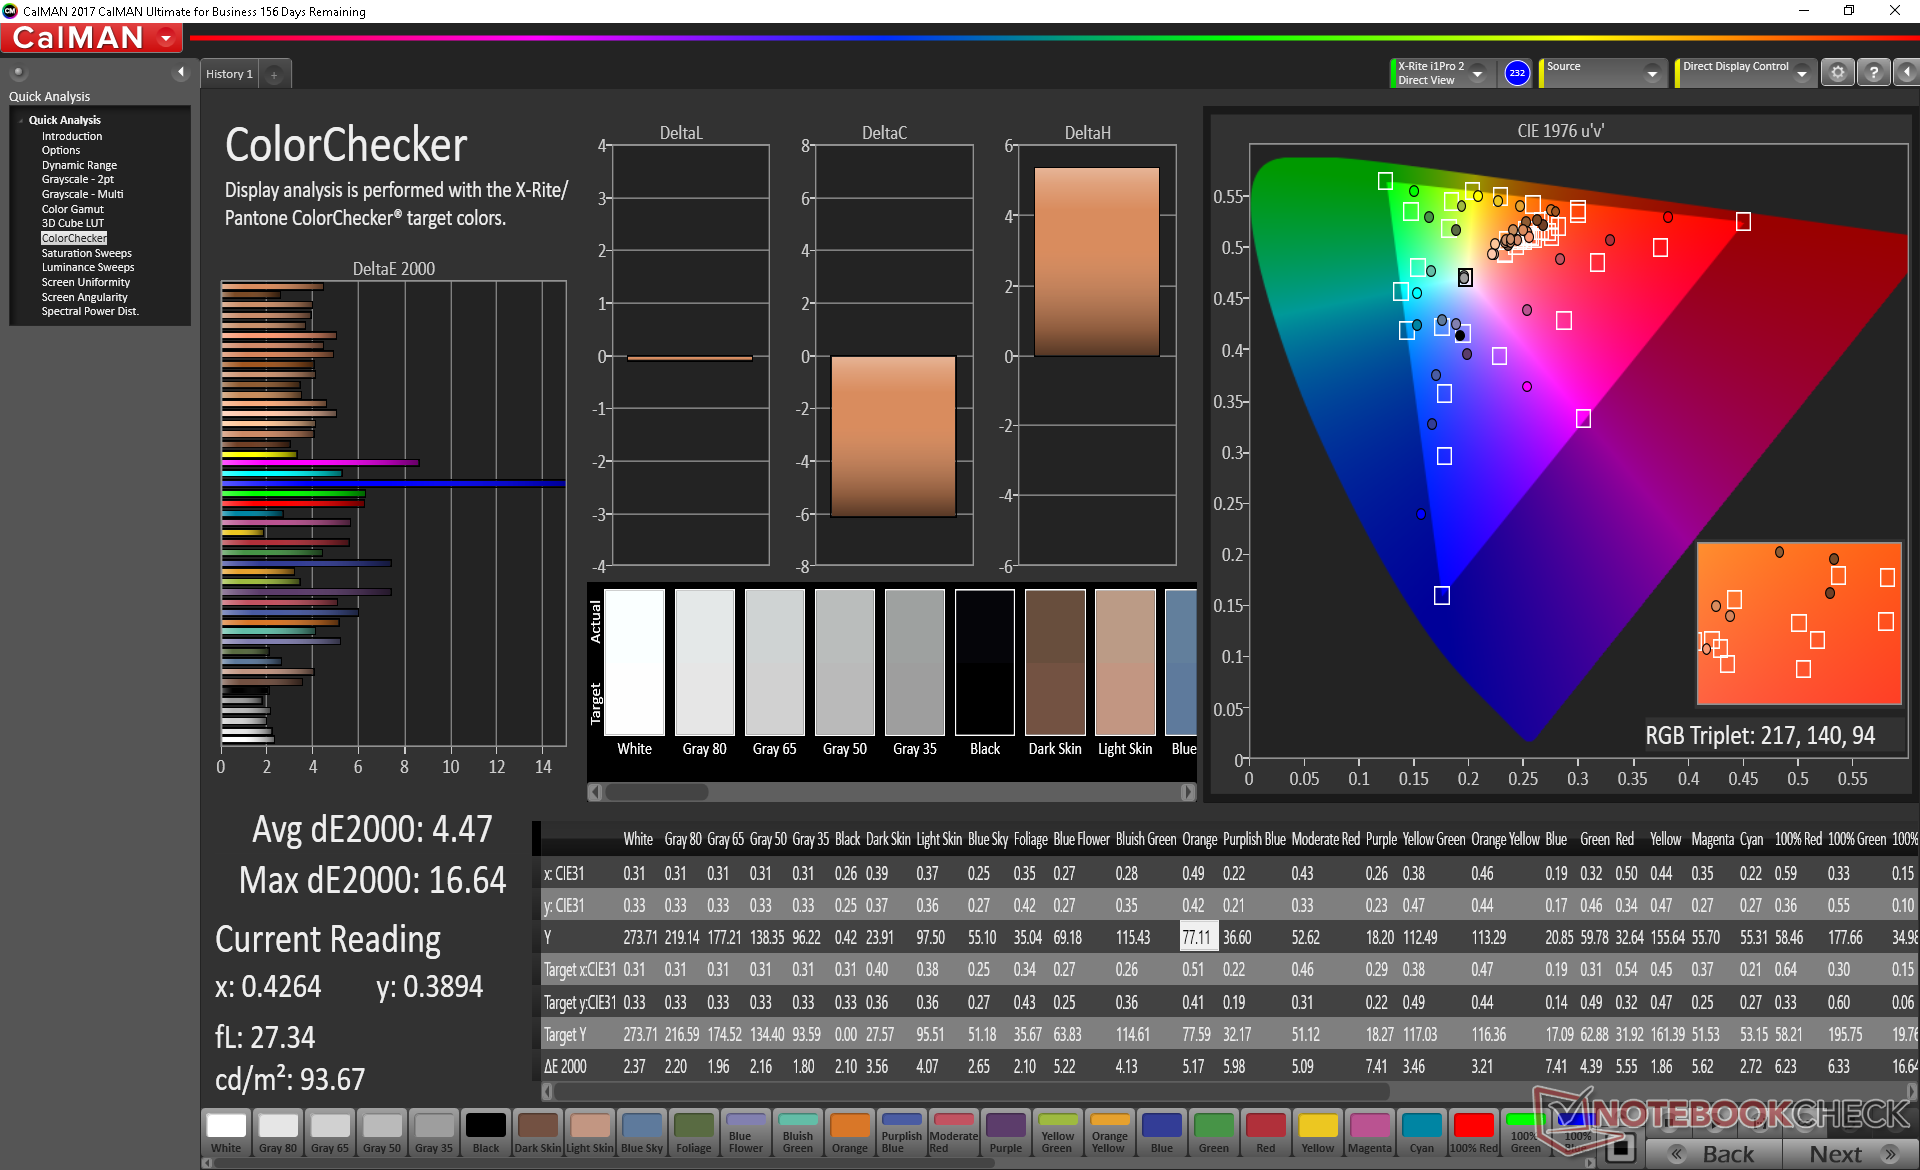
ΔE ColorChecker Calman: 5.45 | ∀{0.5-29.43 Ø4.71}
calibrated: 4.47
ΔE Greyscale Calman: 5.3 | ∀{0.09-98 Ø4.96}
59.1% sRGB (Argyll 1.6.3 3D)
37.6% AdobeRGB 1998 (Argyll 1.6.3 3D)
40.91% AdobeRGB 1998 (Argyll 3D)
59.5% sRGB (Argyll 3D)
39.56% Display P3 (Argyll 3D)
Gamma: 2.1
CCT: 7679 K
| Asus TUF FX505DT-EB73 Panda LM156LF-GL, IPS, 15.6", 1920x1080 | Asus Zephyrus S GX502GW AU Optronics B156HAN08.2 (AUO82ED), IPS, 15.6", 1920x1080 | Asus FX504GD AU Optronics B156HTN03.8, TN LED, 15.6", 1920x1080 | Acer Aspire Nitro 5 AN515-54-53Z2 LG LP156WFC-SPD1 (LGD0563), IPS, 15.6", 1920x1080 | Asus TUF FX505DY Panda LM156LF-CL03, IPS, 15.6", 1920x1080 | MSI GF63 8RC AU Optronics B156HAN02.1, IPS, 15.6", 1920x1080 | |
|---|---|---|---|---|---|---|
| Display | 59% | -6% | -4% | 1% | 0% | |
| Display P3 Coverage (%) | 39.56 | 64.9 64% | 37.09 -6% | 37.97 -4% | 40.04 1% | 39.43 0% |
| sRGB Coverage (%) | 59.5 | 91 53% | 55.8 -6% | 57 -4% | 60.2 1% | 59.3 0% |
| AdobeRGB 1998 Coverage (%) | 40.91 | 65.9 61% | 38.34 -6% | 39.23 -4% | 41.4 1% | 40.73 0% |
| Response Times | 72% | 4% | -18% | -30% | -4% | |
| Response Time Grey 50% / Grey 80% * (ms) | 30.4 ? | 7.2 ? 76% | 41.6 ? -37% | 42 ? -38% | 44.8 ? -47% | 33.2 ? -9% |
| Response Time Black / White * (ms) | 27.6 ? | 8.8 ? 68% | 15.2 ? 45% | 26.8 ? 3% | 30.8 ? -12% | 27.2 ? 1% |
| PWM Frequency (Hz) | 20830 ? | |||||
| Screen | 31% | -20% | 13% | 6% | 0% | |
| Brightness middle (cd/m²) | 286.2 | 286 0% | 260 -9% | 238 -17% | 211.5 -26% | 266.6 -7% |
| Brightness (cd/m²) | 267 | 275 3% | 241 -10% | 226 -15% | 200 -25% | 257 -4% |
| Brightness Distribution (%) | 84 | 90 7% | 85 1% | 83 -1% | 82 -2% | 89 6% |
| Black Level * (cd/m²) | 0.33 | 0.37 -12% | 0.55 -67% | 0.27 18% | 0.23 30% | 0.29 12% |
| Contrast (:1) | 867 | 773 -11% | 473 -45% | 881 2% | 920 6% | 919 6% |
| Colorchecker dE 2000 * | 5.45 | 2.19 60% | 7 -28% | 4.11 25% | 3.92 28% | 5.93 -9% |
| Colorchecker dE 2000 max. * | 18.08 | 4.4 76% | 22.52 -25% | 6.89 62% | 17.63 2% | 16.28 10% |
| Colorchecker dE 2000 calibrated * | 4.47 | 2.27 49% | 5.27 -18% | 3.76 16% | 4.16 7% | 3.6 19% |
| Greyscale dE 2000 * | 5.3 | 2.2 58% | 6.1 -15% | 1.78 66% | 3.1 42% | 6.8 -28% |
| Gamma | 2.1 105% | 2.41 91% | 1.97 112% | 2.41 91% | 2.23 99% | 2.43 91% |
| CCT | 7679 85% | 6405 101% | 7894 82% | 6311 103% | 6578 99% | 7192 90% |
| Color Space (Percent of AdobeRGB 1998) (%) | 37.6 | 59 57% | 35.5 -6% | 36 -4% | 38.1 1% | 37.6 0% |
| Color Space (Percent of sRGB) (%) | 59.1 | 91 54% | 61 3% | 57 -4% | 60 2% | 59.3 0% |
| Total Average (Program / Settings) | 54% /
41% | -7% /
-14% | -3% /
6% | -8% /
1% | -1% /
-0% |
* ... smaller is better
Color space covers only 59 percent and 38 percent of the sRGB and AdobeRGB standards, respectively, to be indicative of a budget IPS panel. Higher-end IPS panels as found on most flagship Ultrabooks tend to cover over 95 percent of sRGB for deeper and generally more accurate colors than our FX505DT. The pricier Zephyrus S GX502GW, for example, offers both a wider gamut and an even faster native refresh rate of 144 Hz.
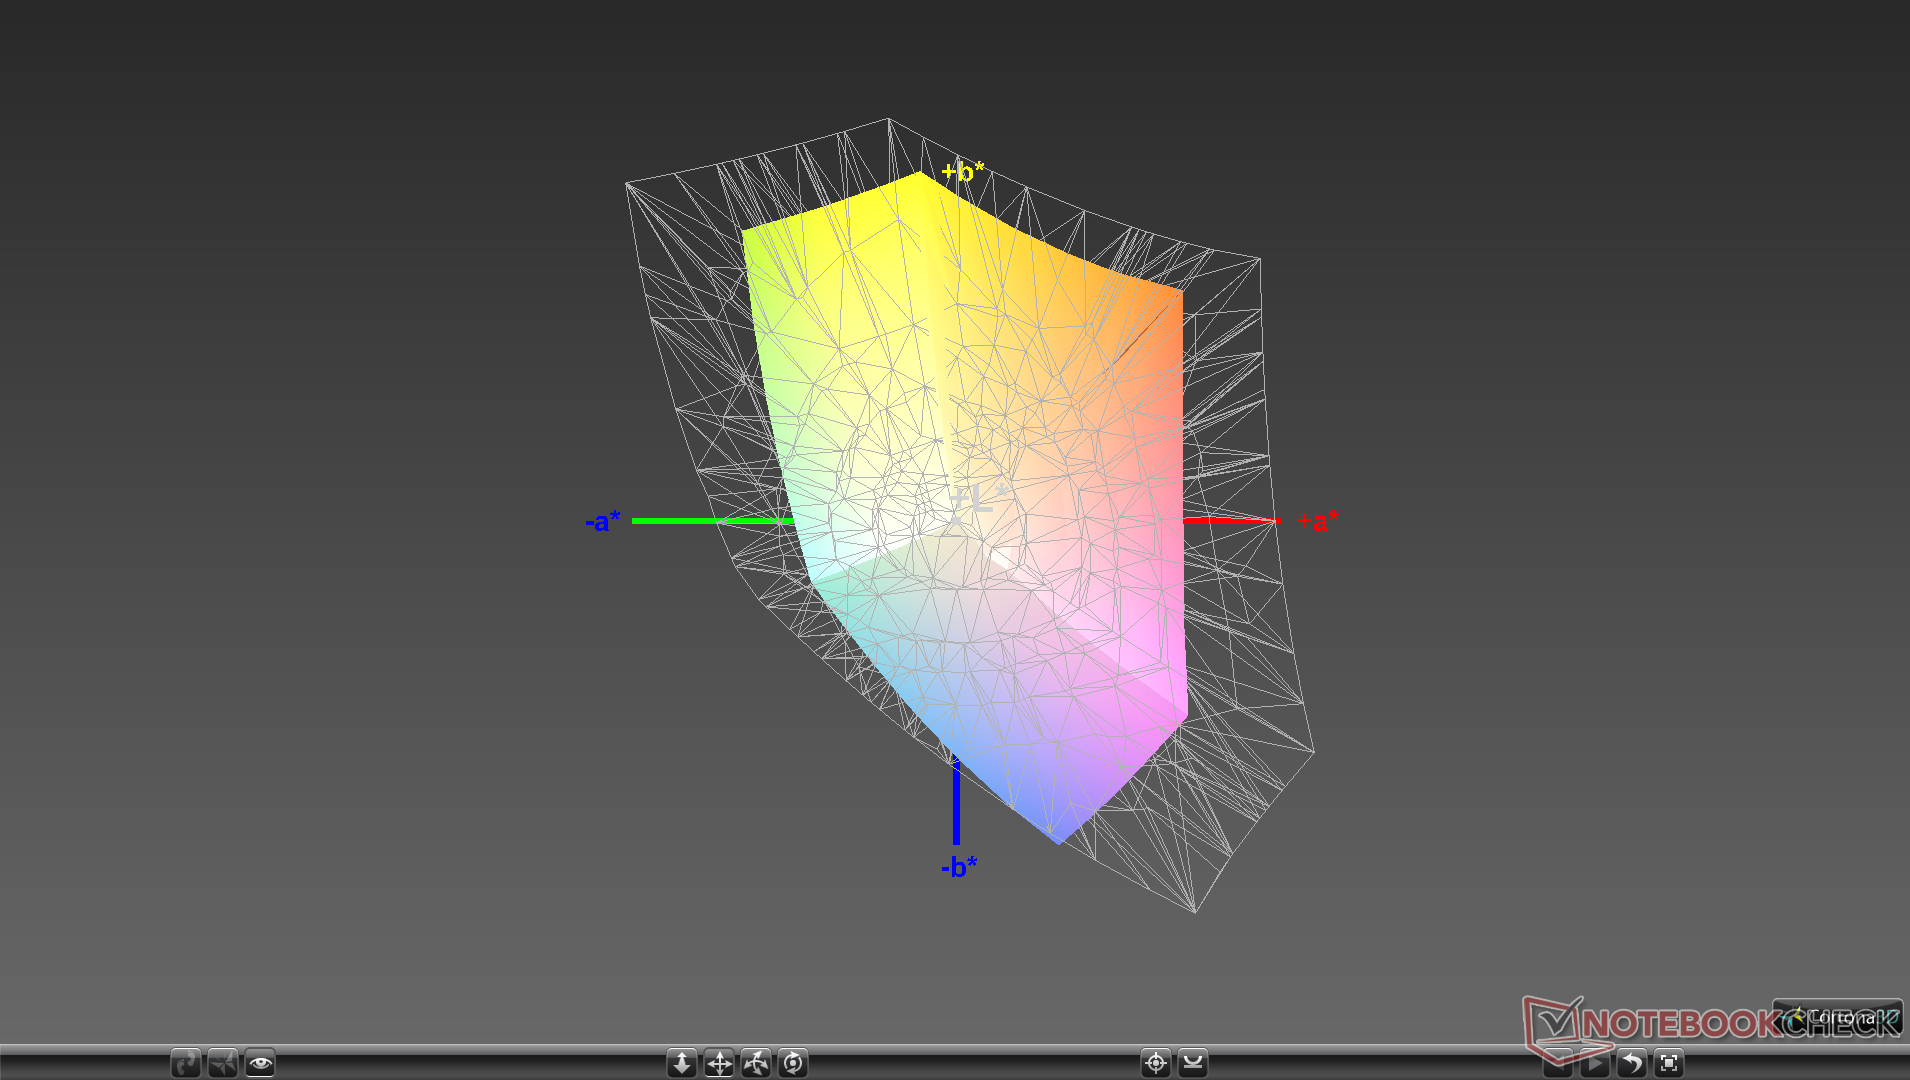
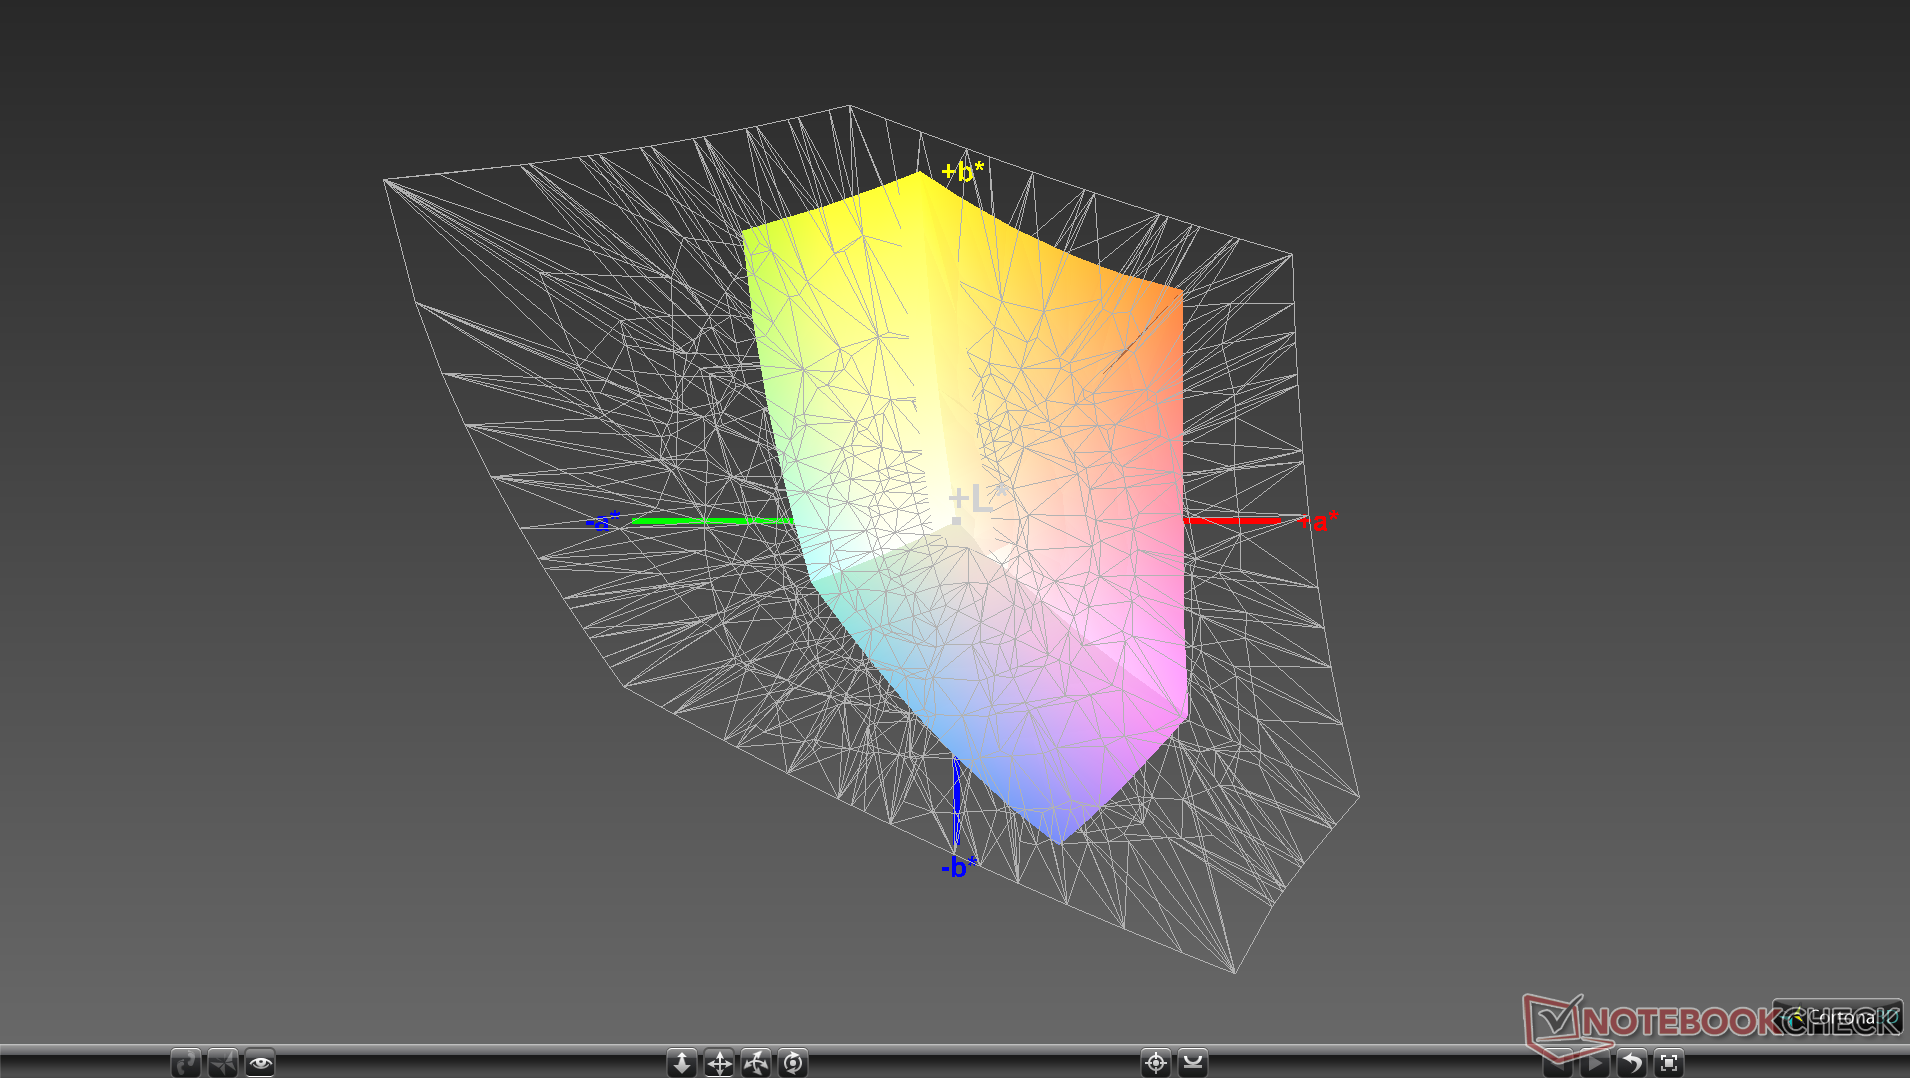
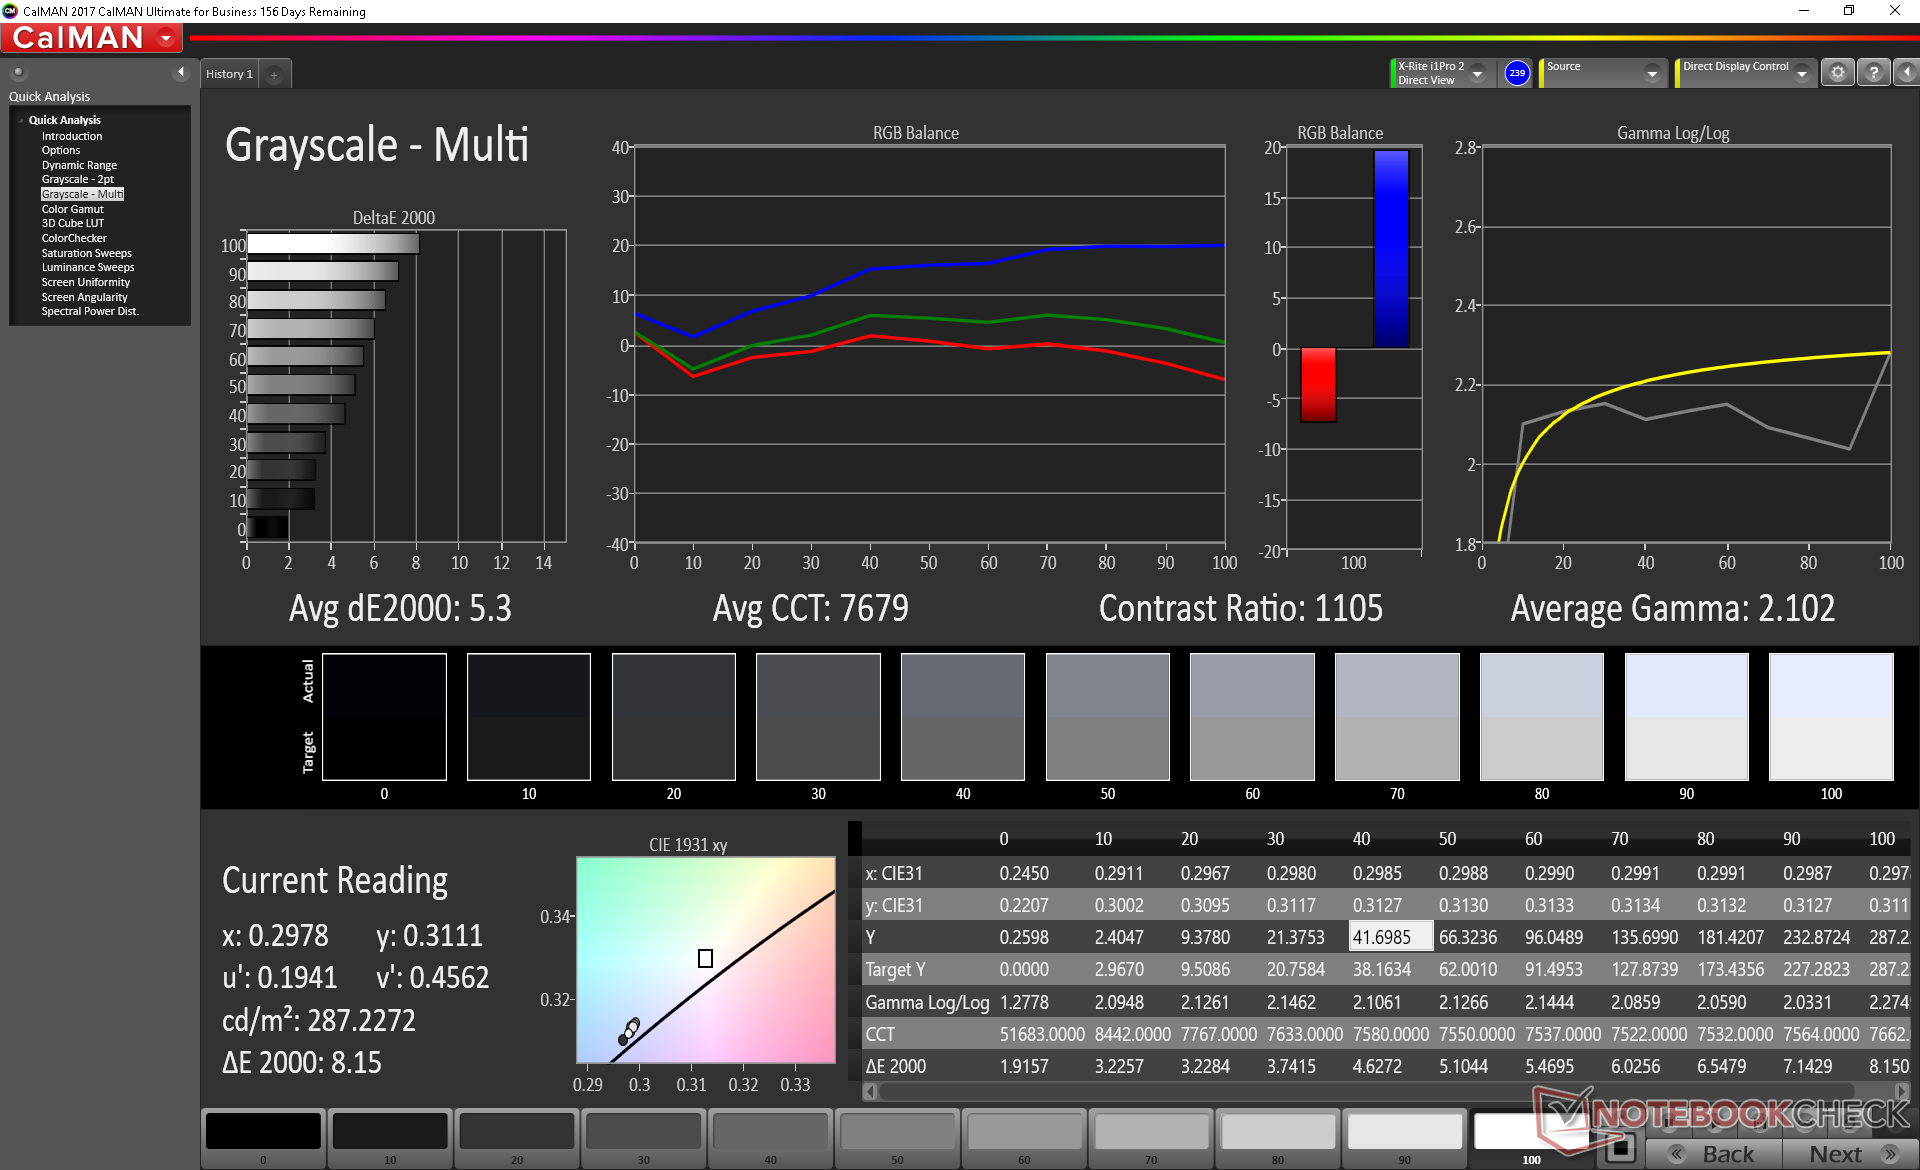
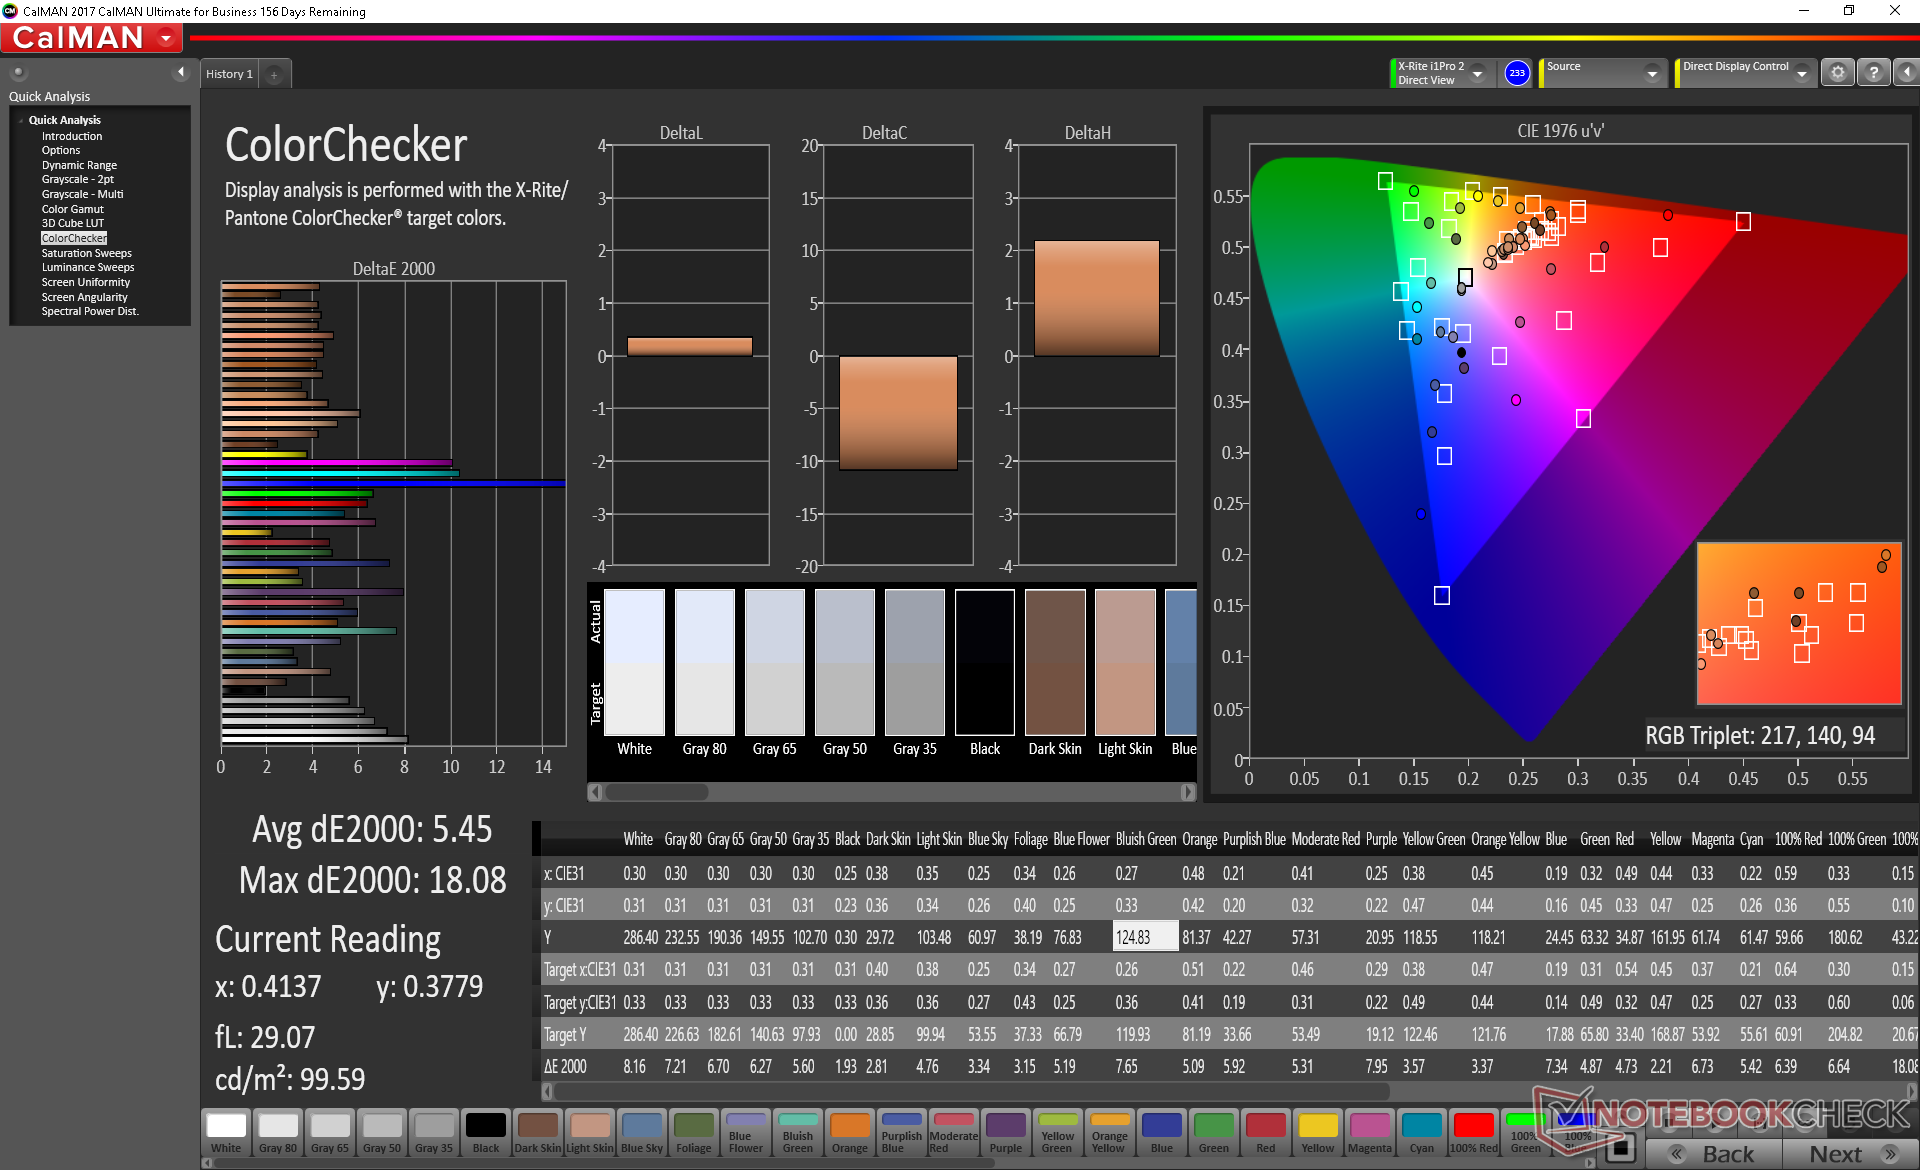
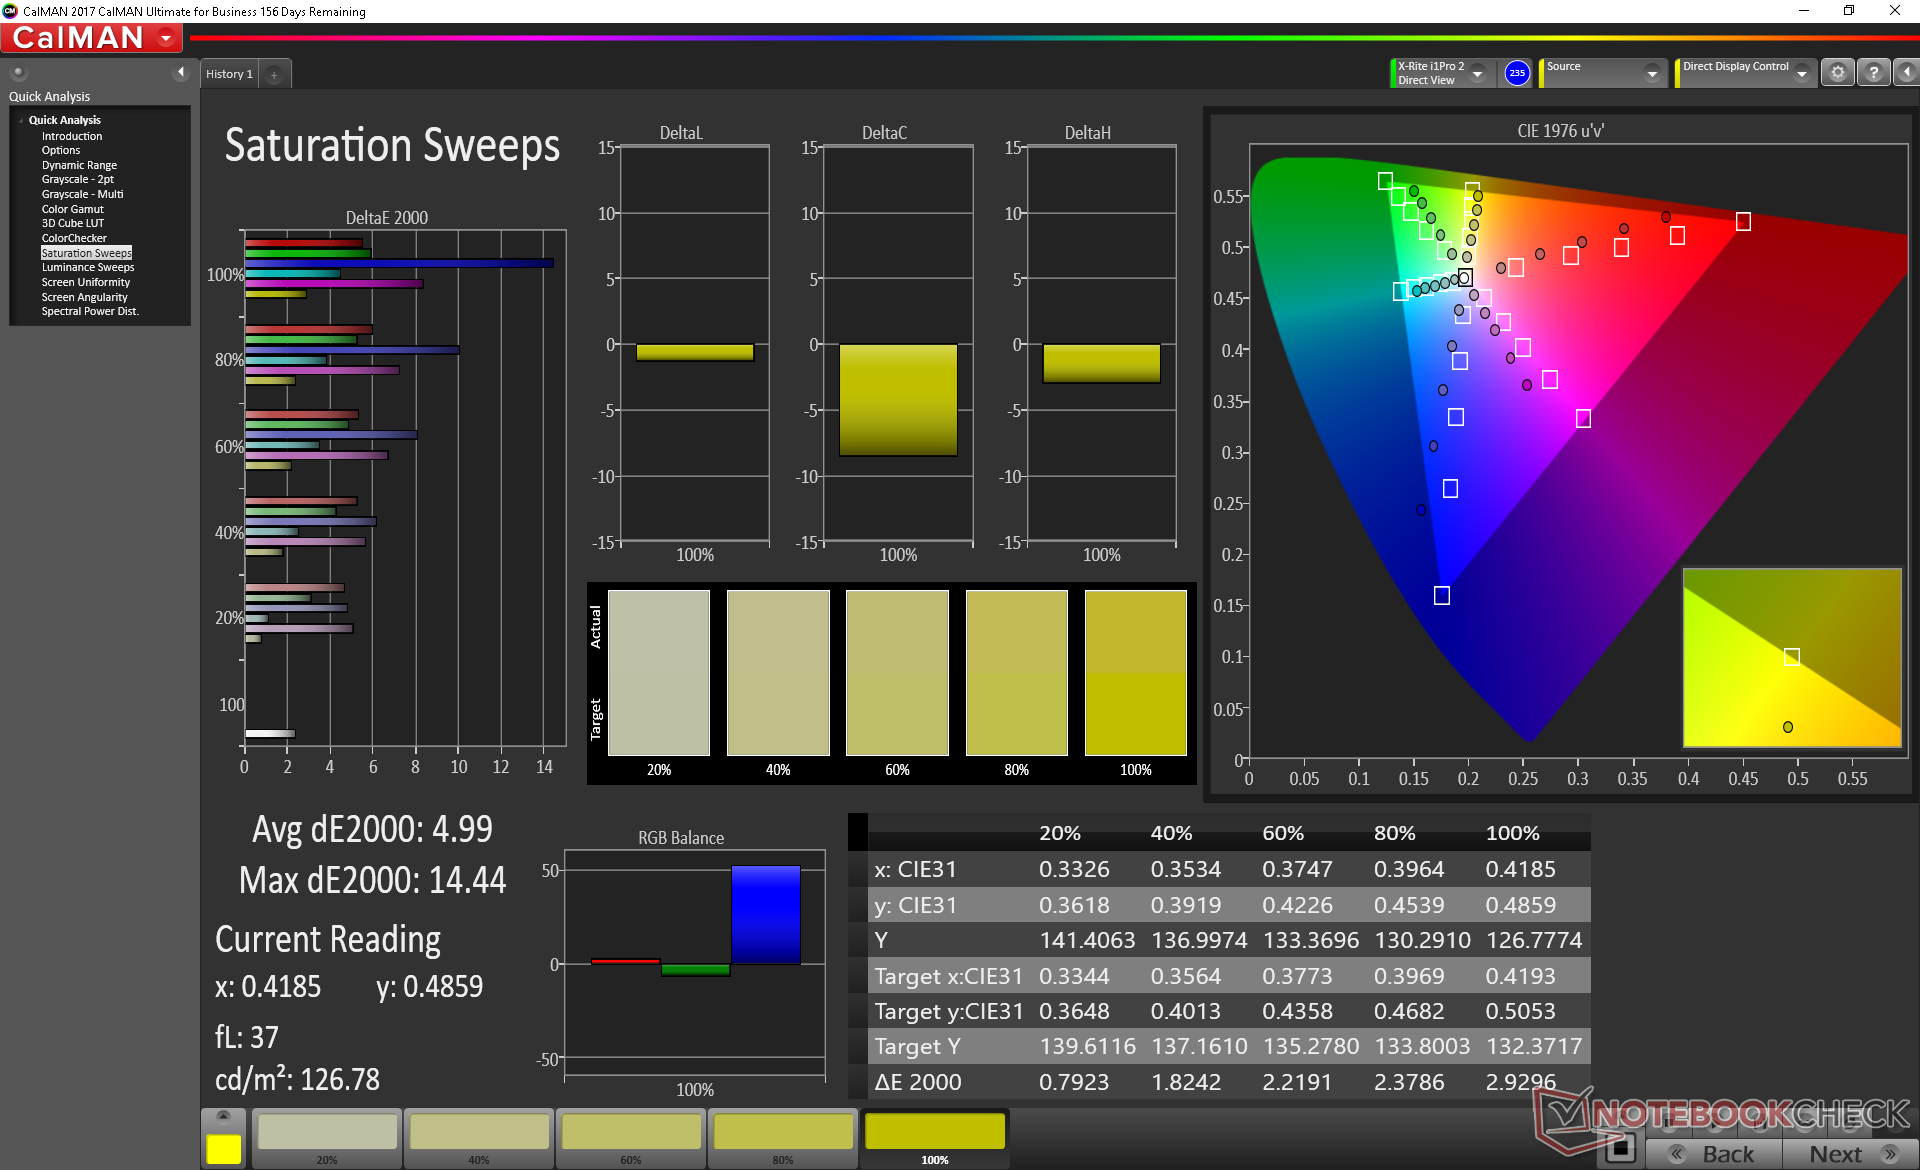
Further measurements with an X-Rite colorimeter reveal inaccurate colors and grayscale out of the box with average DeltaE values of 5.3 and 5.45, respectively. The color blue in particular is represented significantly more inaccurately than other colors especially at higher saturation levels. Our calibration attempts improve grayscale and colors across the board, but blue remains shallow and inaccurate. Colors still become less accurate at higher saturation levels since color space is so narrow.

Display Response Times
| ↔ Response Time Black to White | ||
|---|---|---|
| 27.6 ms ... rise ↗ and fall ↘ combined | ↗ 17.6 ms rise | 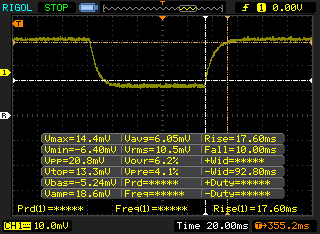 |
| ↘ 10 ms fall | ||
| The screen shows relatively slow response rates in our tests and may be too slow for gamers. In comparison, all tested devices range from 0.1 (minimum) to 240 (maximum) ms. » 70 % of all devices are better. This means that the measured response time is worse than the average of all tested devices (19.8 ms). | ||
| ↔ Response Time 50% Grey to 80% Grey | ||
| 30.4 ms ... rise ↗ and fall ↘ combined | ↗ 14 ms rise | 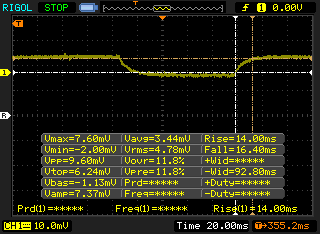 |
| ↘ 16.4 ms fall | ||
| The screen shows slow response rates in our tests and will be unsatisfactory for gamers. In comparison, all tested devices range from 0.165 (minimum) to 636 (maximum) ms. » 41 % of all devices are better. This means that the measured response time is similar to the average of all tested devices (31 ms). | ||
Screen Flickering / PWM (Pulse-Width Modulation)
| Screen flickering / PWM not detected | 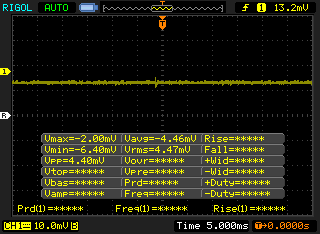 | ||
In comparison: 52 % of all tested devices do not use PWM to dim the display. If PWM was detected, an average of 7757 (minimum: 5 - maximum: 343500) Hz was measured. | |||
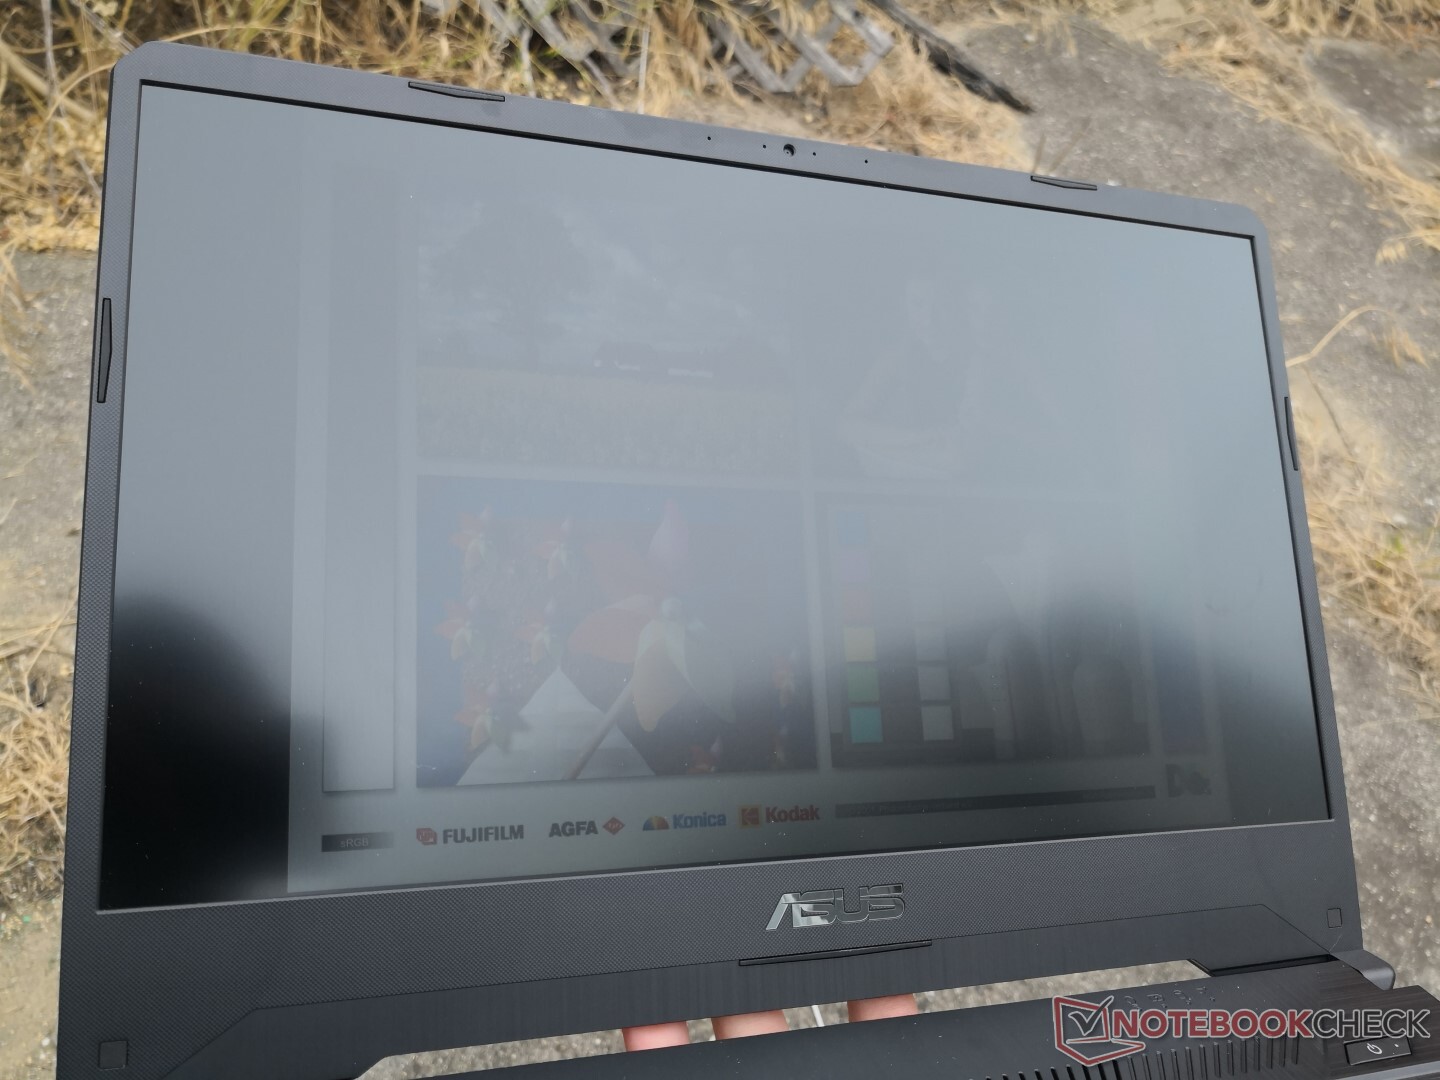
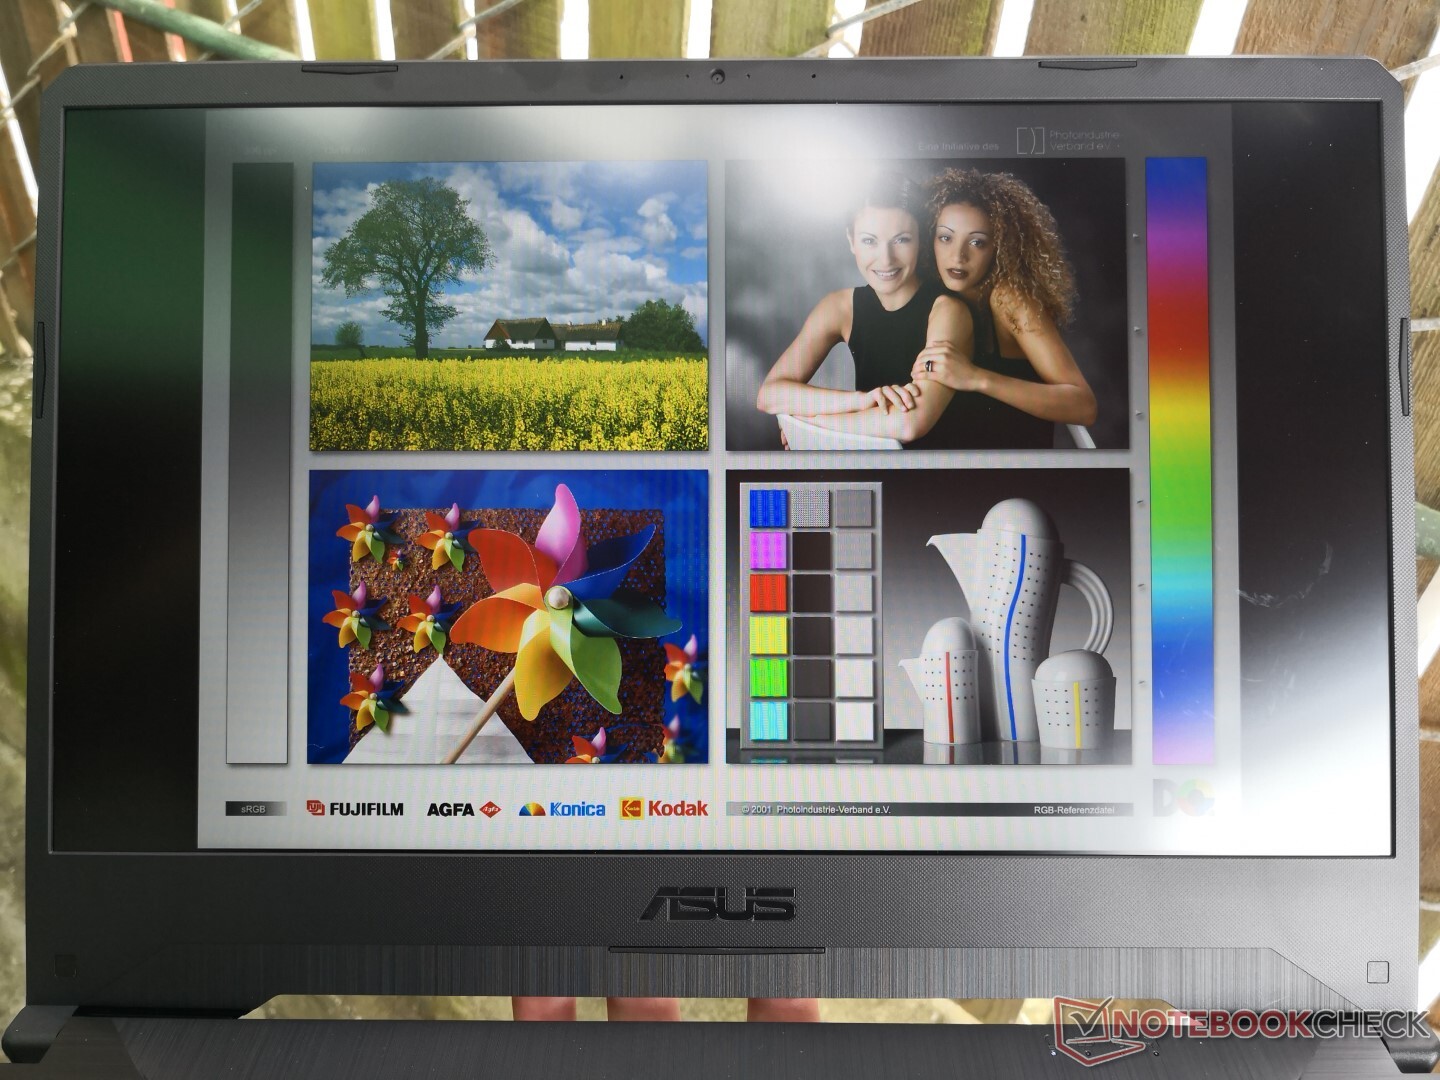
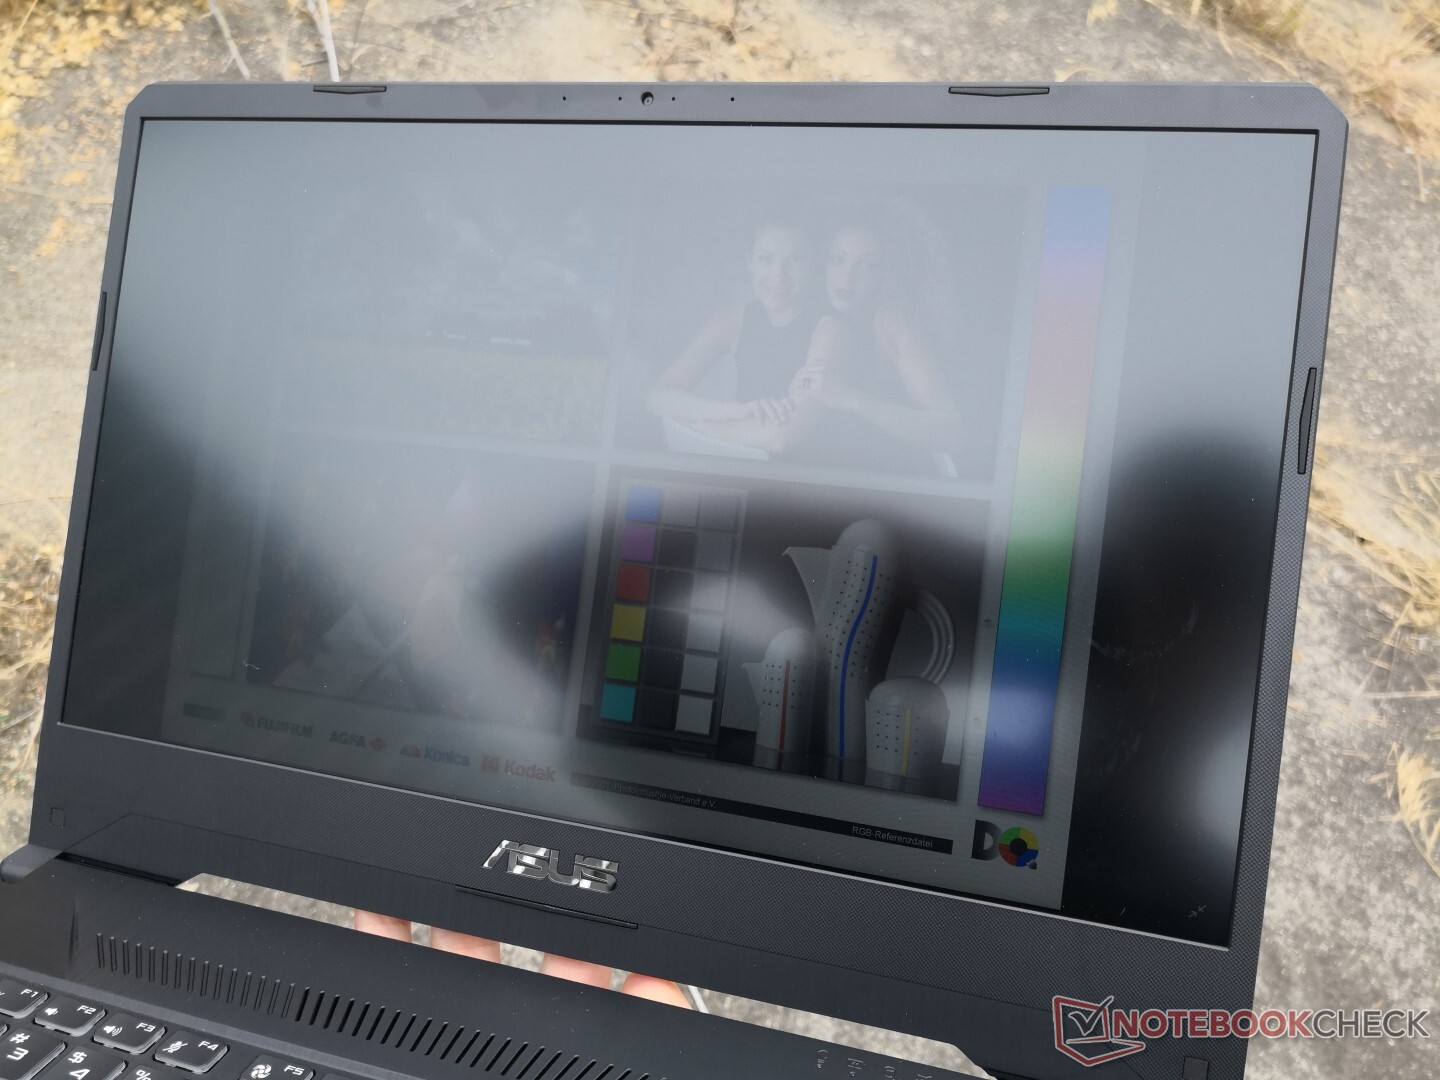
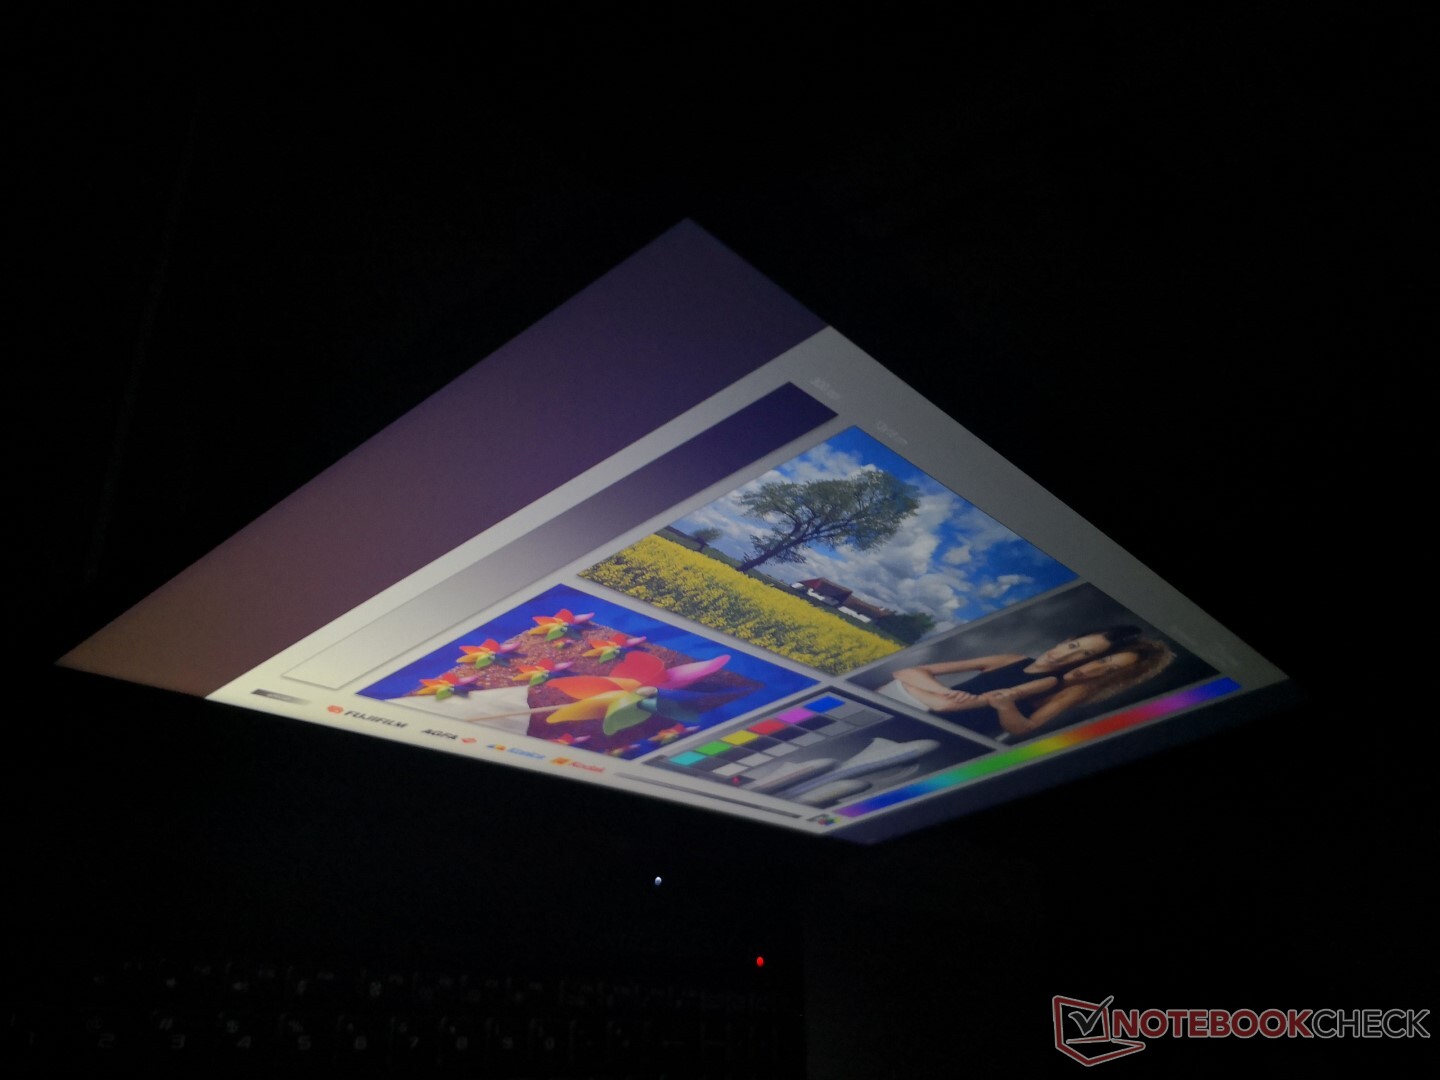
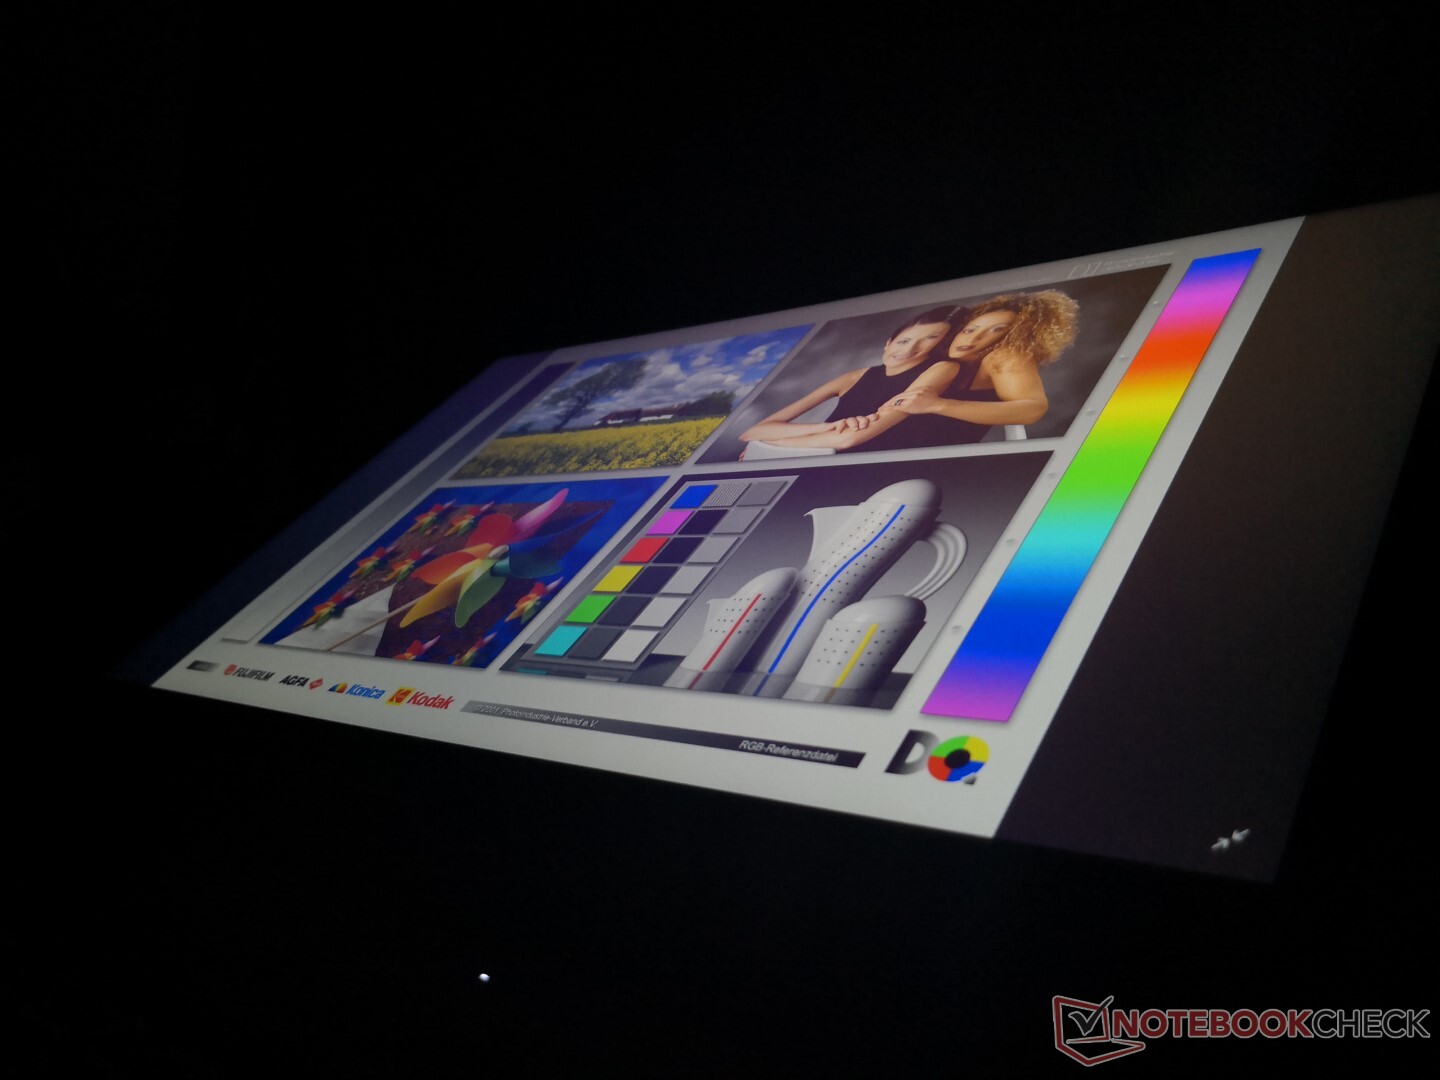
Outdoor visibility is better than on the FX505DY since the backlight is brighter, but it's still not bright enough to be used comfortably when under sunlight or on a bright day. As usual, we recommend working under shade if possible to avoid squinting and washed out colors. Viewing angles are wide yet again with noticeable contrast and color changes only if viewing from extreme or atypically wide angles.
Performance
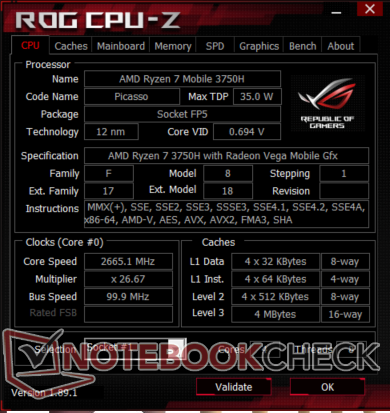
The quad-core Ryzen 5 3550H and Ryzen 7 3750H are designed to compete directly with quad-core Intel Core H-series CPUs like the Skylake Core i7-7700HQ, Coffee Lake 8th gen Core i5-8300H, or 9th gen Core i5-9300H. For a budget gaming laptop, a Core i5-like CPU is sufficient since the target audience will generally not be aiming for super-fast frame rates above 60 FPS. Nevertheless, our benchmarks below will show that the difference between AMD's mobile Ryzen 5 and mobile Ryzen 7 is minimal at best.
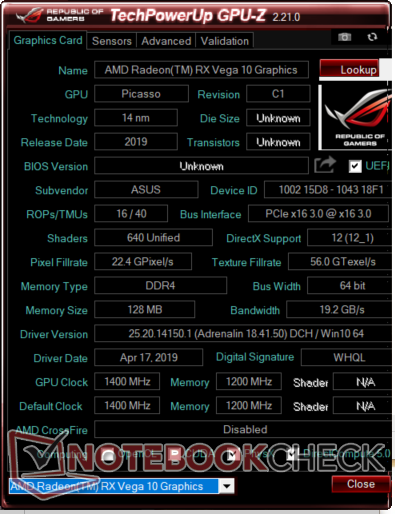
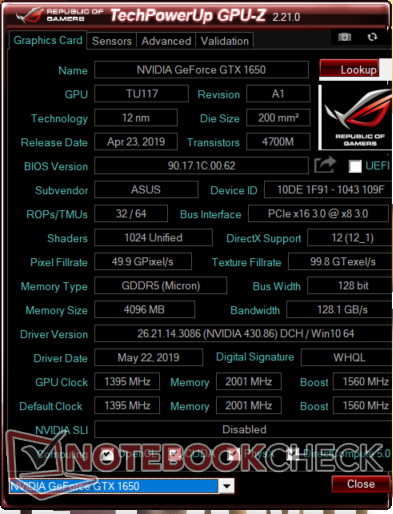
Graphics options include the GTX 1050 with 3 GB of VRAM (FX505DD), GTX 1650 with 4 GB of VRAM (FX505DT), and GTX 1660 Ti with 6 GB of VRAM (FX505DU). Optimus comes standard no matter the option to automatically precludes any G-Sync features from the series.
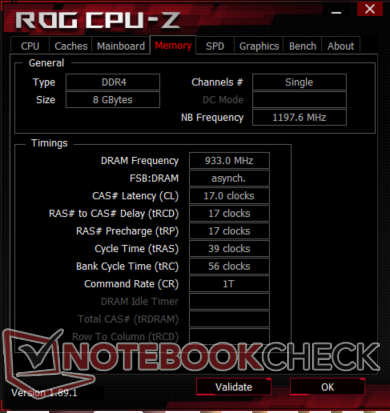
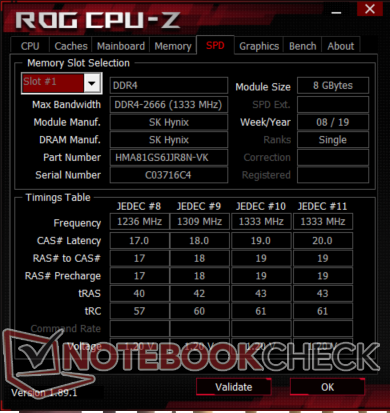
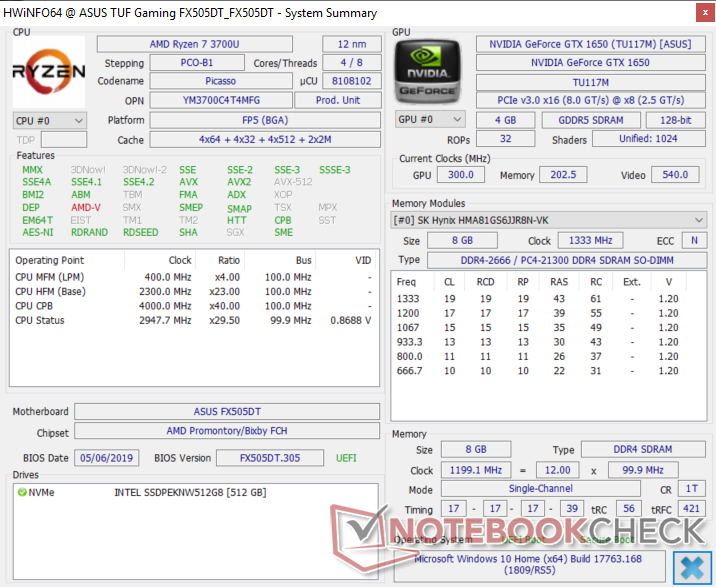
Keep in mind that our configuration comes equipped with just 8 GB of single-channel DDR4 RAM whereas most gaming laptops have at least 16 GB of dual-channel RAM. This will impact our benchmark results slightly.
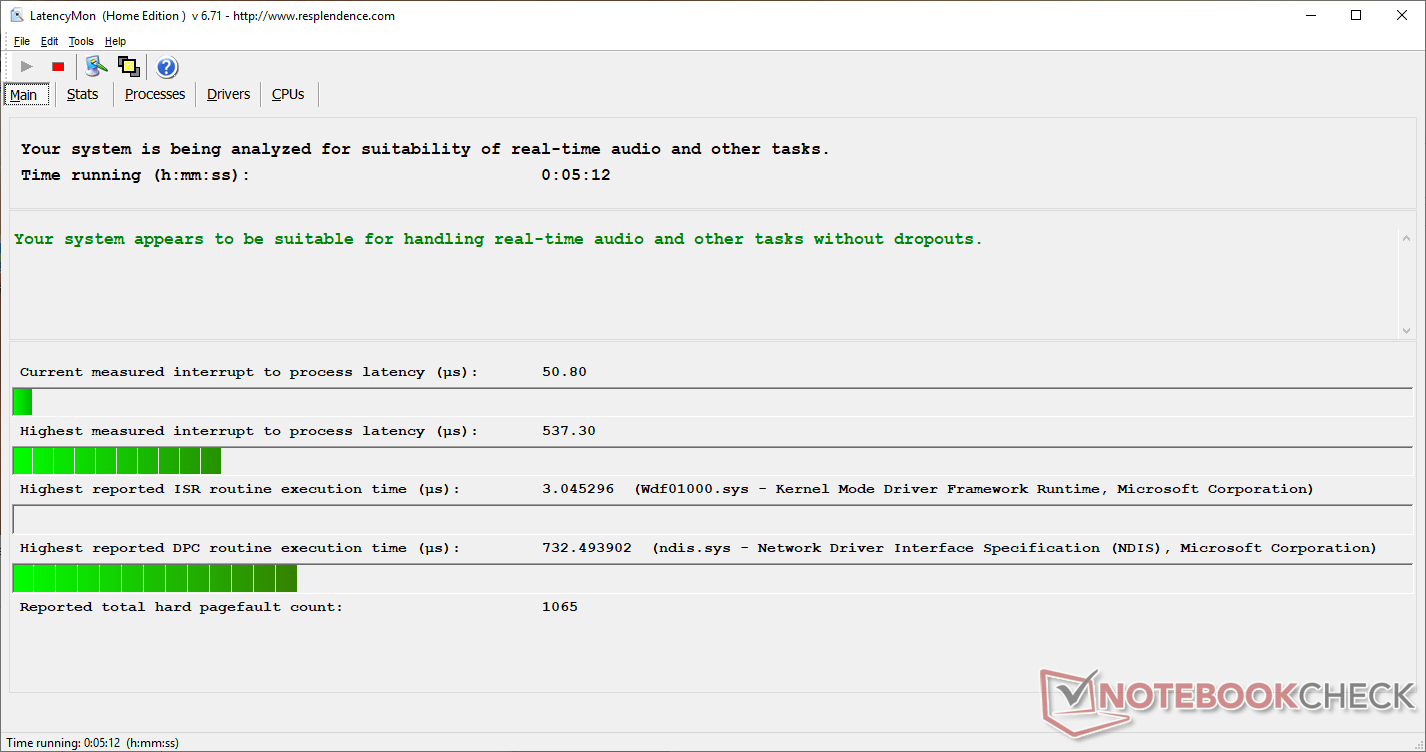
Latencymon shows no issues with real-time audio recording even when the WLAN is enabled.
Processor
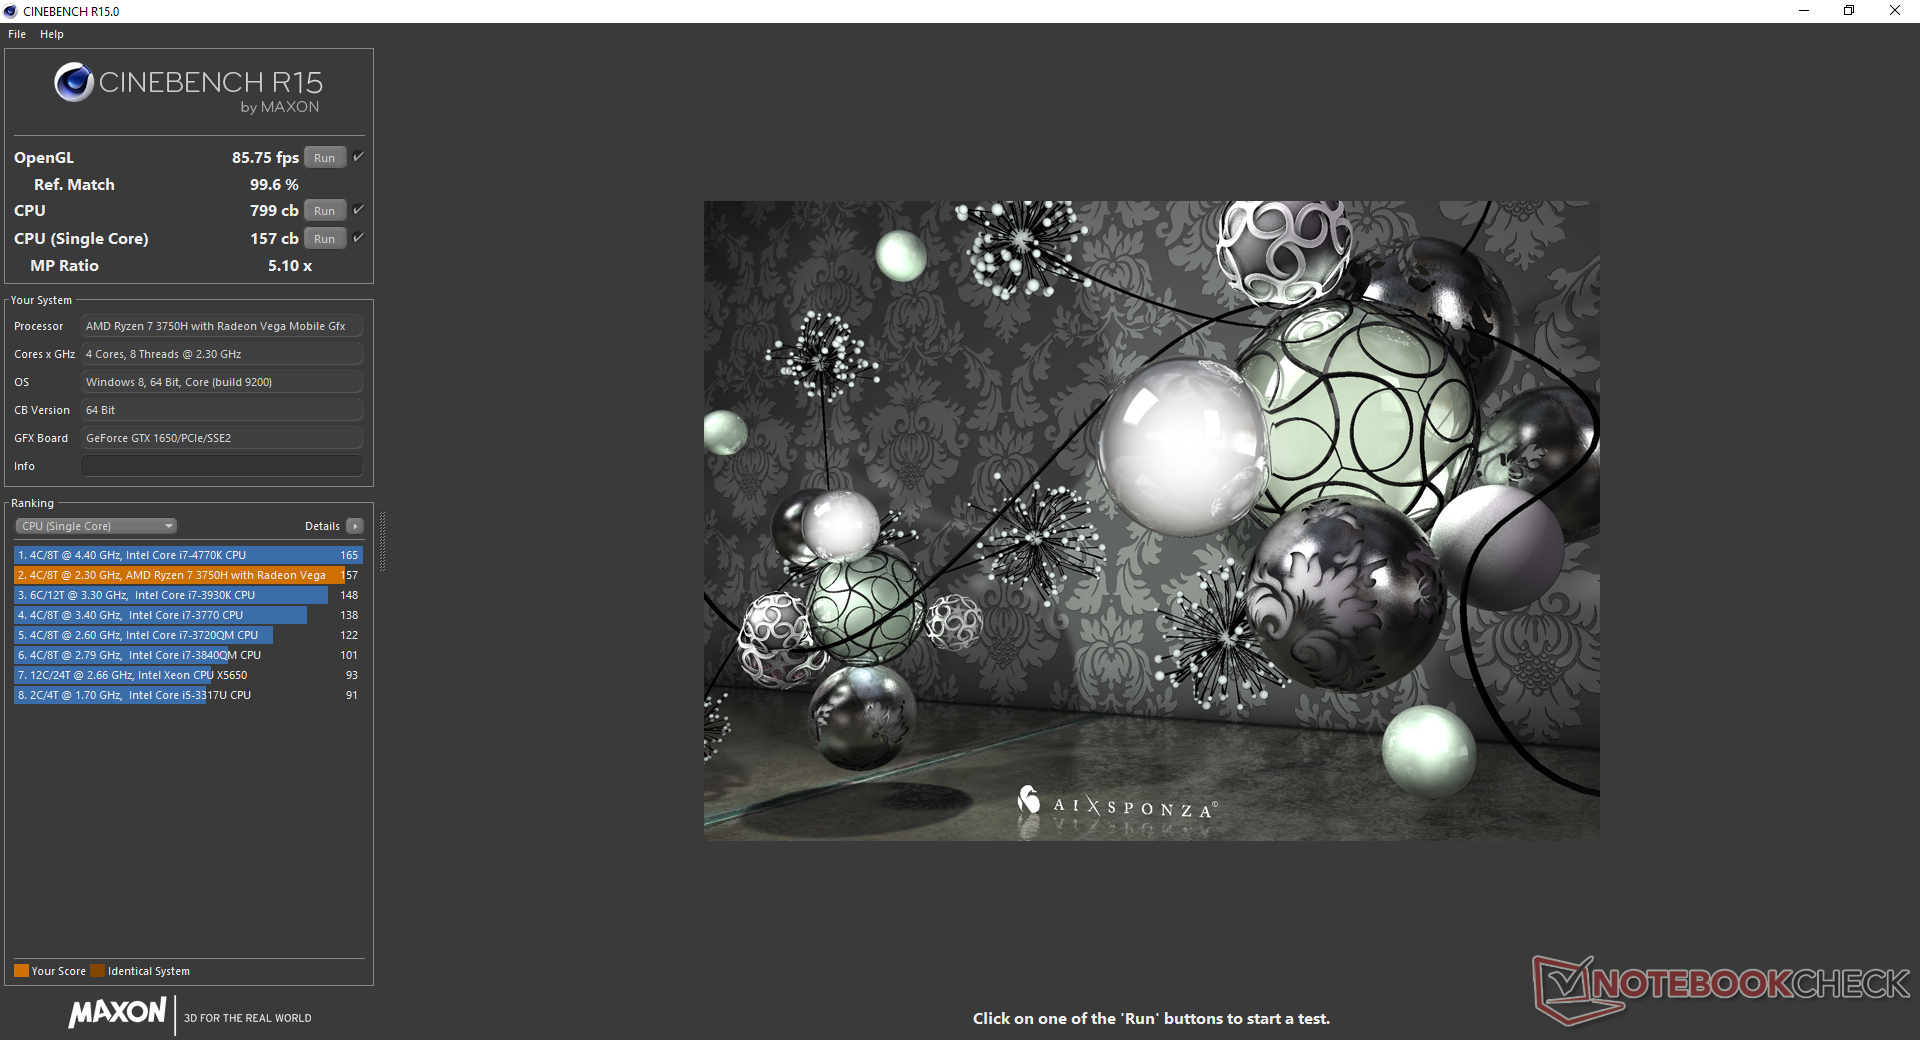
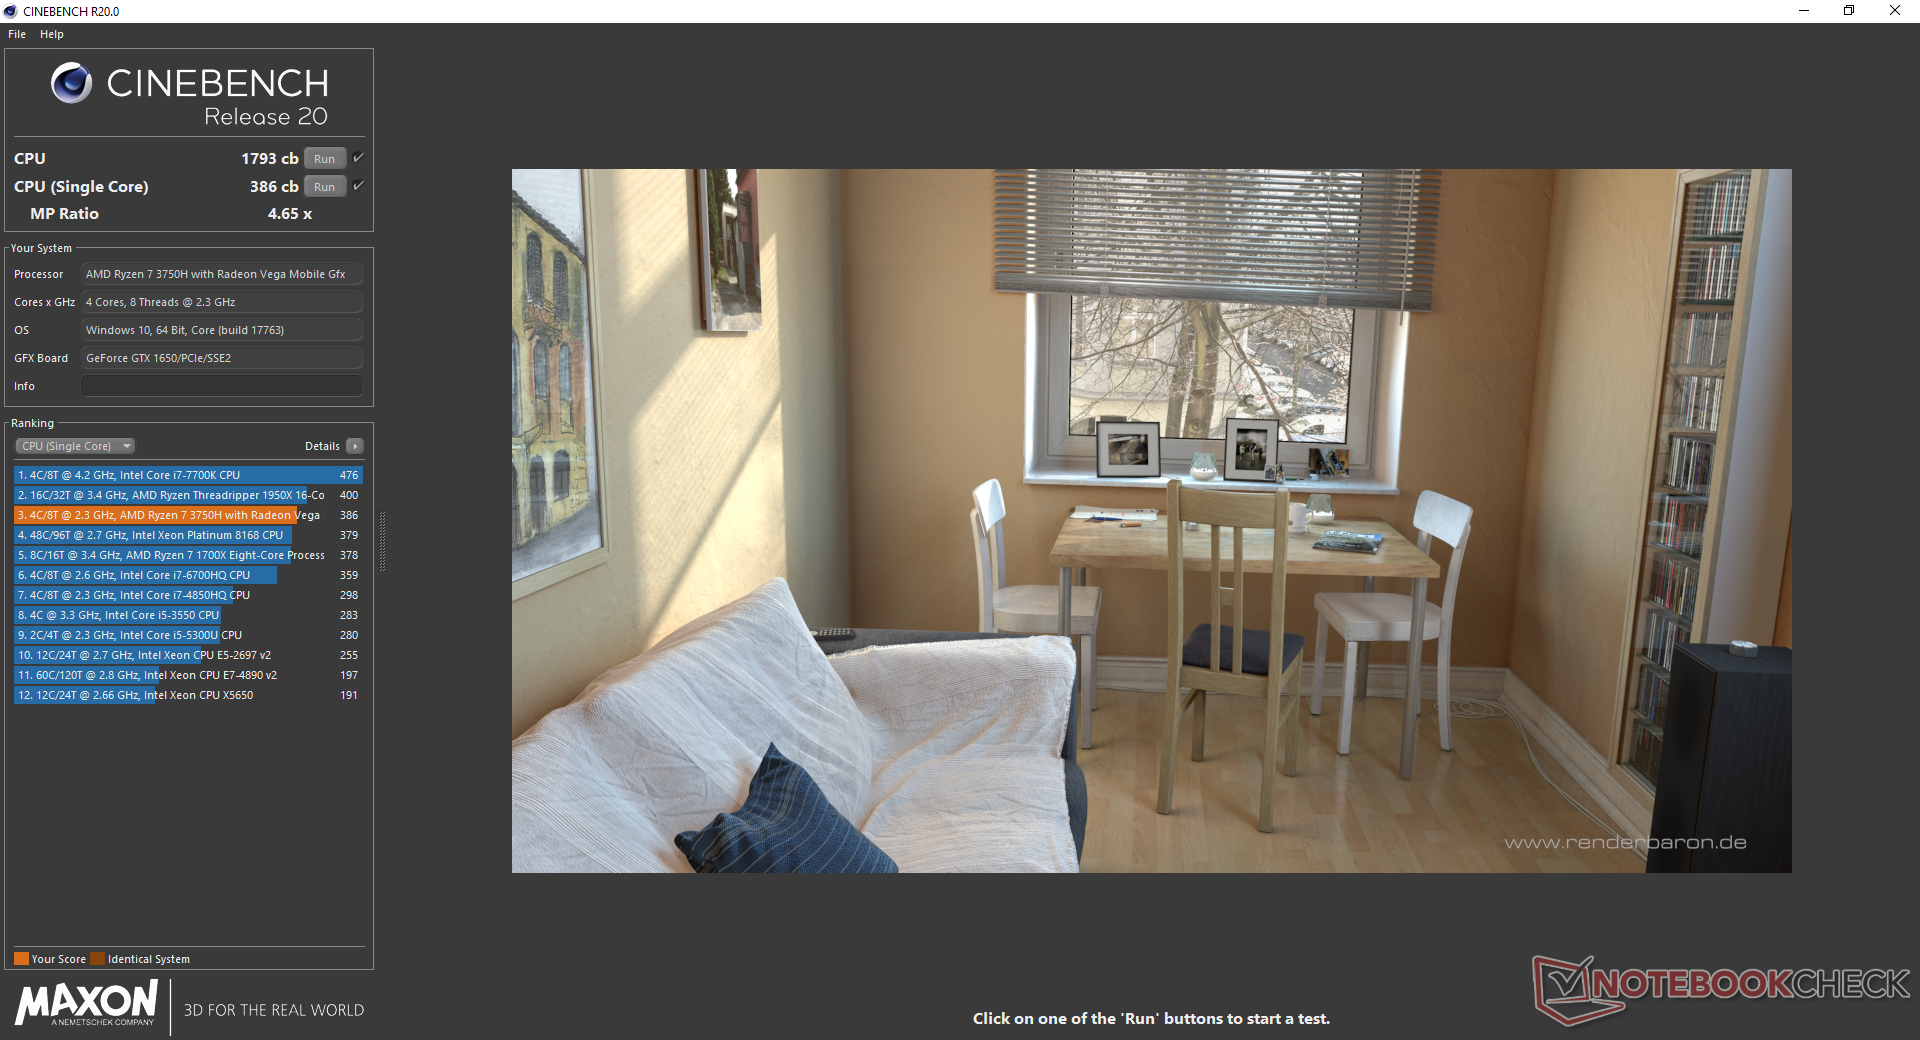
Unlike the jump from the quad-core Core i5 to hexa-core Core i7, core count between the quad-core Ryzen 5 3550H and Ryzen 7 3750H is the same. The CPU performance difference between a Ryzen 5 and Ryzen 7 gaming laptop is therefore much narrower than what you would get if choosing between a Core i5 or Core i7 gaming laptop. CineBench benchmarks rank our Ryzen 7 3750H only 4 to 8 percent faster than the Ryzen 5 3550H in the TUF FX505DY. The marginal benefits are not enough to propel it to the level of a Core i7 despite what its name may otherwise suggest. Much like the Ryzen 5 3550H, overall performance is thus closer to the Core i5-8300H or Core i5-9300H.
Running CineBench R15 Multi-Thread in a loop results in very similar behavior to the Ryzen 5 3550H in the FX505DY but just 2 to 4 percent faster after accounting for throttling as shown by our graph below. In truth, the performance difference is so small that it becomes tough to recommend the Ryzen 7 over the Ryzen 5 since real-world applications will run at about the same speed between them. To its credit, the FX505DT is marginally better at maintaining Turbo clock rates for longer than most budget gaming laptops powered by an Intel Core CPU.
See our dedicated page on the Ryzen 7 3750H for more technical information and benchmarks.
System Performance
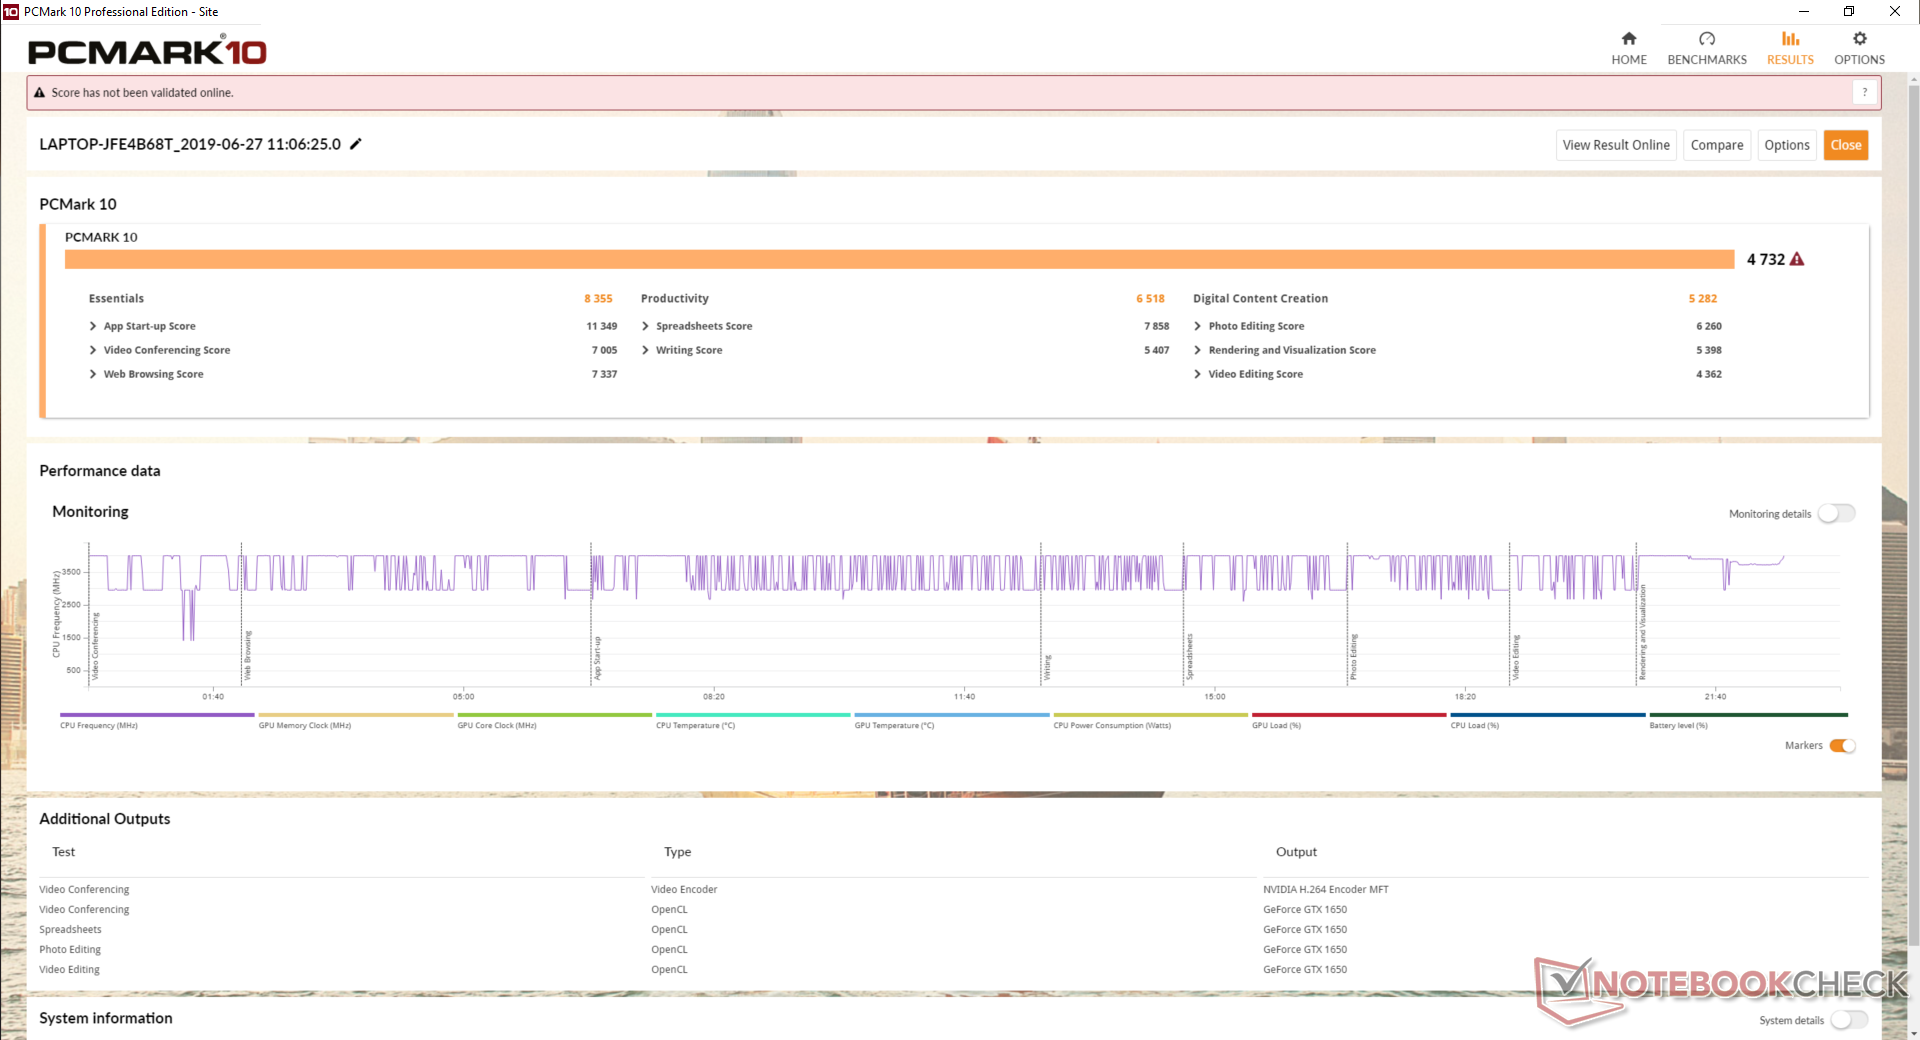
The FX505DT is on relatively equal footing with budget Intel gaming laptops including the Acer Nitro 5 and Lenovo Legion Y730. Results are consistently ahead of the FX505DY as well likely due to the combination of a faster CPU, GPU, and storage solution. Higher-end gaming laptops with hexa-core Intel CPUs and RTX graphics will still handily outscore our inexpensive Asus.
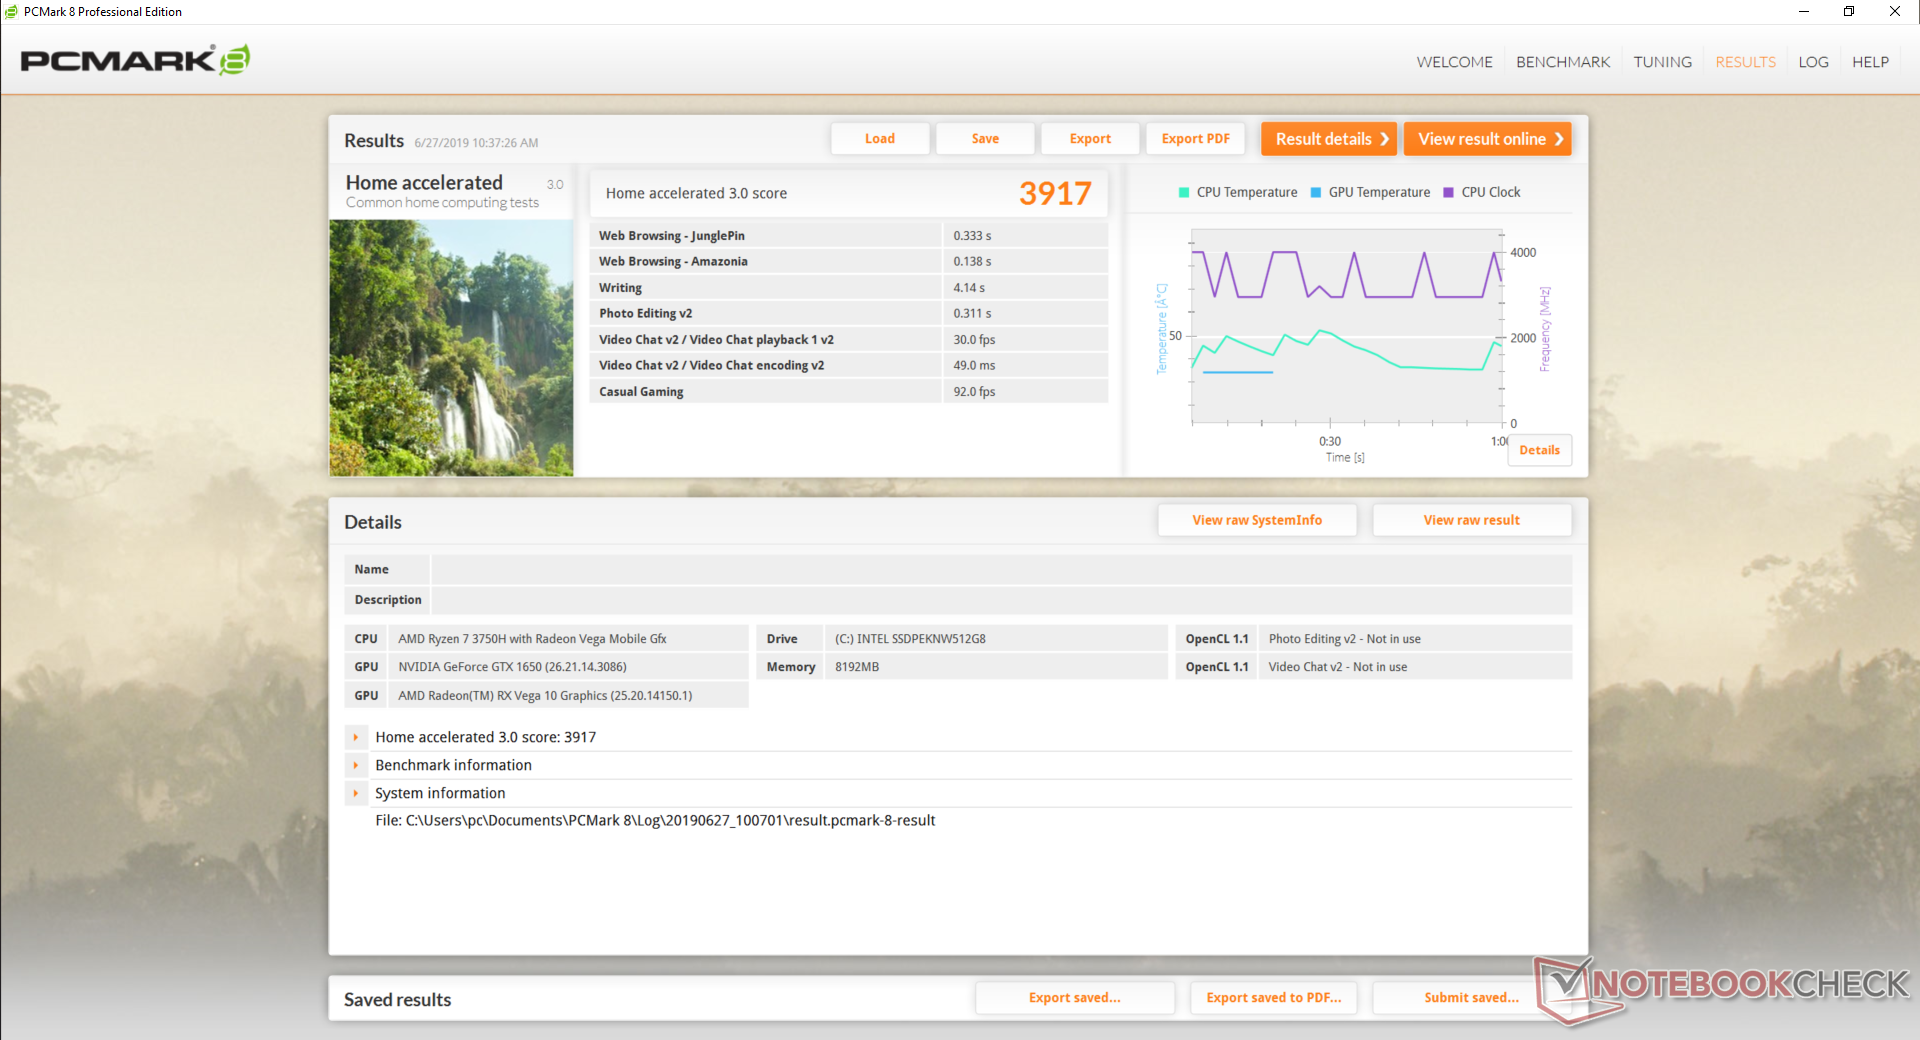
We experienced no software or hardware issues during our time with the unit. Note, however, that system performance is tied to the pre-installed Asus Armoury Crate software and not the regular Windows Power Profile settings. This is not very obvious because there are no icons to launch Armoury Crate and so many users will be left unaware of the software.
| PCMark 8 | |
| Home Score Accelerated v2 | |
| Average of class Gaming (n=1last 2 years) | |
| Asus TUF FX505DY | |
| Lenovo Legion Y730-15ICH i5-8300H | |
| Asus TUF FX505DT-EB73 | |
| Asus FX504GD | |
| Work Score Accelerated v2 | |
| Asus TUF FX505DY | |
| Lenovo Legion Y730-15ICH i5-8300H | |
| Asus FX504GD | |
| Asus TUF FX505DT-EB73 | |
| Average of class Gaming (n=1last 2 years) | |
| PCMark 8 Home Score Accelerated v2 | 3917 points | |
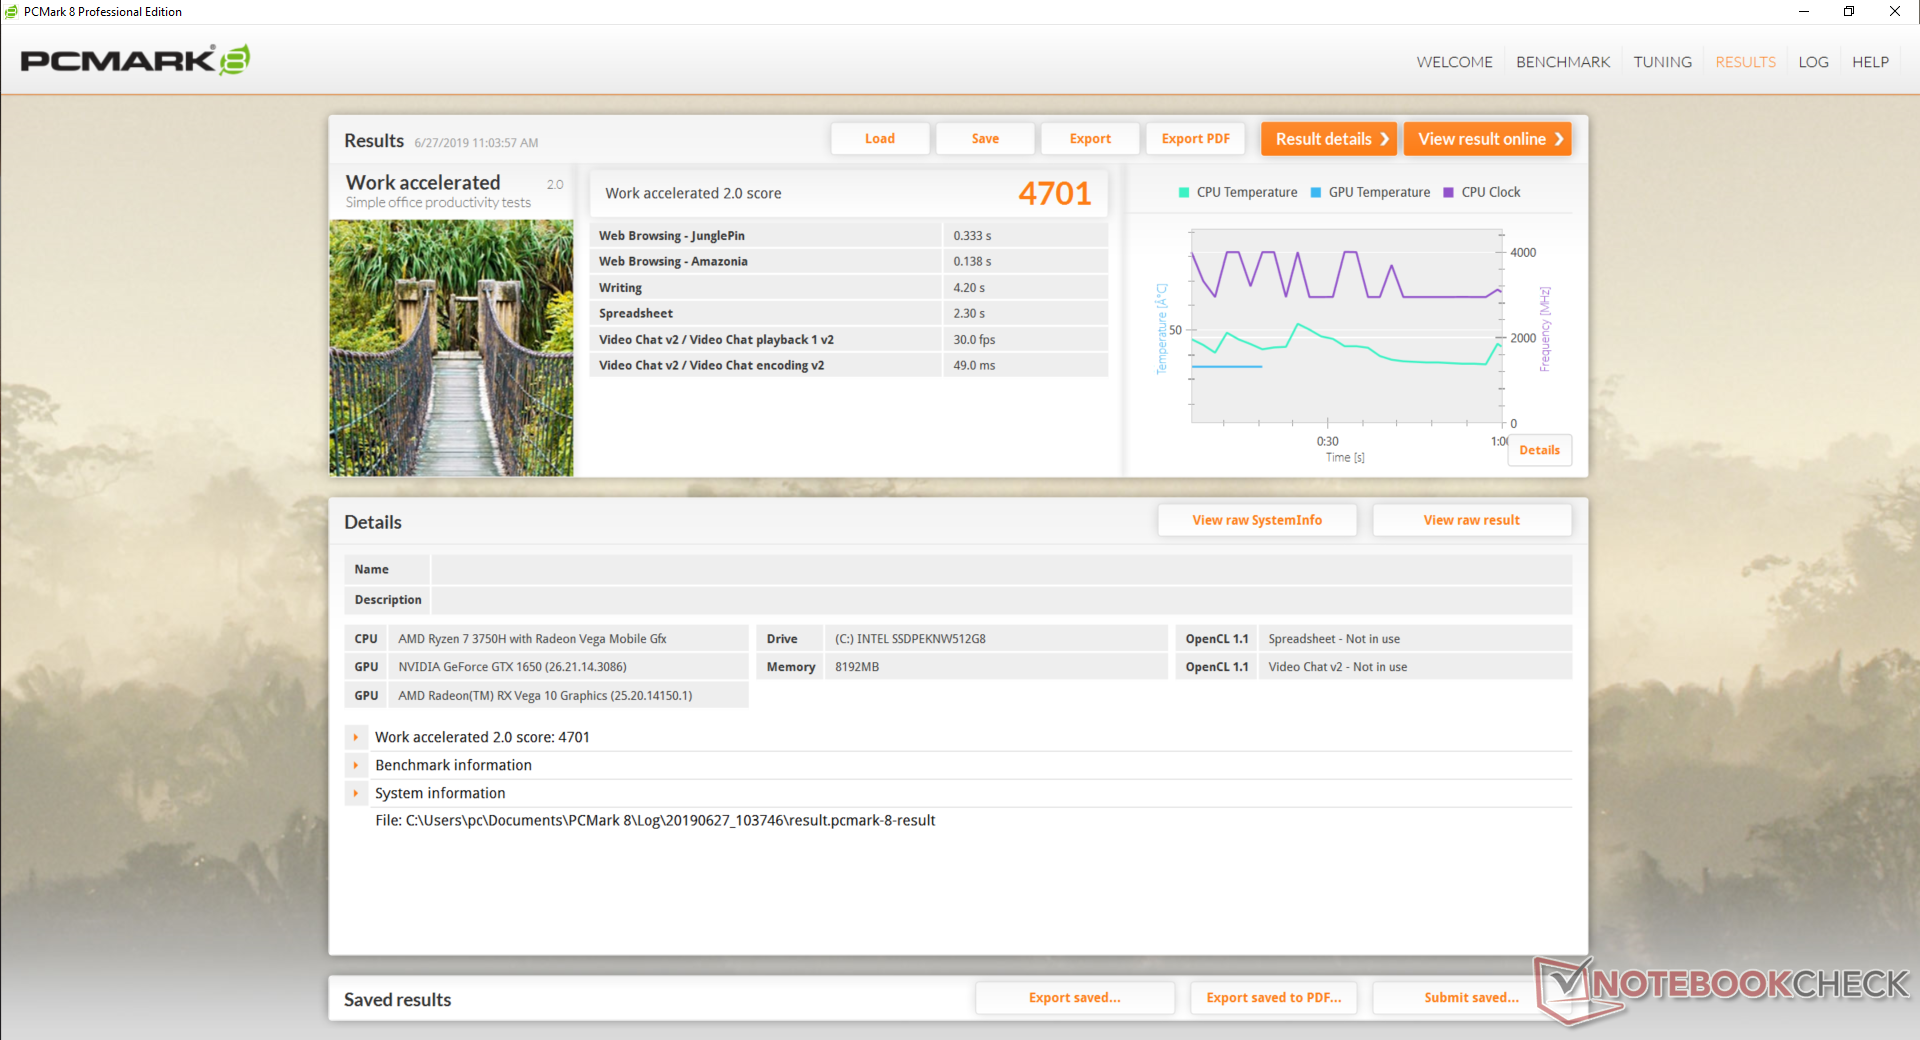
| PCMark 8 Work Score Accelerated v2 | 4701 points | |
| PCMark 10 Score | 4732 points | |
Help | ||
Storage Devices
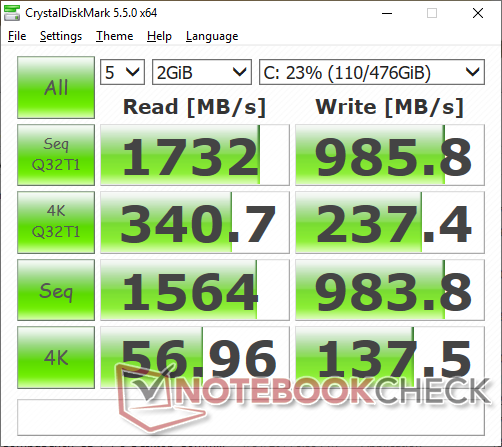
Users have the option to choose between M.2 PCIe storage, 2.5-inch SATA III storage, or both. Our particular unit comes equipped with a 512 GB Intel 660p PCIe SSD in contrast to the 256 GB Western Digital SN520 NVMe SSD on the older FX505DY. Performance is otherwise quite similar between these two entry-level SSDs with sequential read and write rates averaging about 900 to 1000 MB/s each. Higher-end gaming laptops tend to ship with the pricier Samsung PM981 instead for significantly faster transfer rates. For the target budget gamer, however, even "slow" NVMe SSDs will be more than sufficient.
See our table of HDDs and SSDs for more benchmark comparisons.
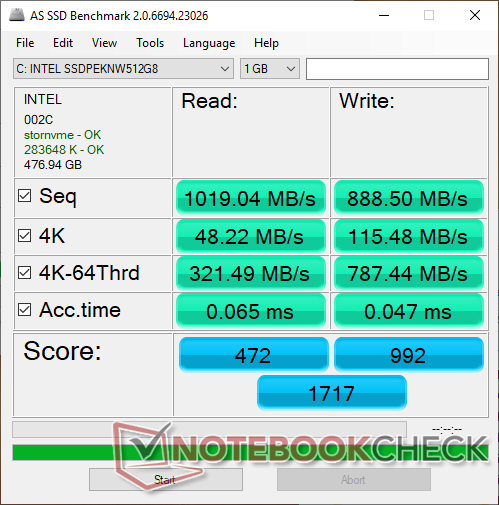
| Asus TUF FX505DT-EB73 Intel SSD 660p SSDPEKNW512G8 | Asus TUF FX505DY WDC PC SN520 SDAPNUW-256G | Lenovo Legion Y530-15ICH Samsung SSD PM981 MZVLB256HAHQ | Acer Aspire 5 A515-52G-53PU Micron 1100 MTFDDAV256TBN | Razer Blade Stealth i7-8565U Lite-On CA3-8D256-Q11 | |
|---|---|---|---|---|---|
| AS SSD | 7% | 11% | -53% | 5% | |
| Seq Read (MB/s) | 1019 | 1059 4% | 1808 77% | 490.6 -52% | 1617 59% |
| Seq Write (MB/s) | 889 | 1180 33% | 1429 61% | 390.2 -56% | 1017 14% |
| 4K Read (MB/s) | 48.22 | 37.55 -22% | 46.1 -4% | 19.47 -60% | 40.03 -17% |
| 4K Write (MB/s) | 115.5 | 110.6 -4% | 97 -16% | 72.2 -37% | 103.4 -10% |
| 4K-64 Read (MB/s) | 321.5 | 619 93% | 536 67% | 236.2 -27% | 477.3 48% |
| 4K-64 Write (MB/s) | 787 | 502 -36% | 273.6 -65% | 276.7 -65% | 281.5 -64% |
| Access Time Read * (ms) | 0.065 | 0.087 -34% | 0.085 -31% | 0.069 -6% | |
| Access Time Write * (ms) | 0.047 | 0.034 28% | 0.038 19% | 0.063 -34% | 0.063 -34% |
| Score Read (Points) | 472 | 762 61% | 763 62% | 305 -35% | 679 44% |
| Score Write (Points) | 992 | 730 -26% | 514 -48% | 388 -61% | 487 -51% |
| Score Total (Points) | 1717 | 1899 11% | 1663 -3% | 850 -50% | 1495 -13% |
| Copy ISO MB/s (MB/s) | 942 | 1166 24% | 321.3 -66% | 1595 69% | |
| Copy Program MB/s (MB/s) | 444.5 | 507 14% | 141.7 -68% | 485.8 9% | |
| Copy Game MB/s (MB/s) | 867 | 480.3 -45% | 239.4 -72% | 1029 19% |
* ... smaller is better

GPU Performance
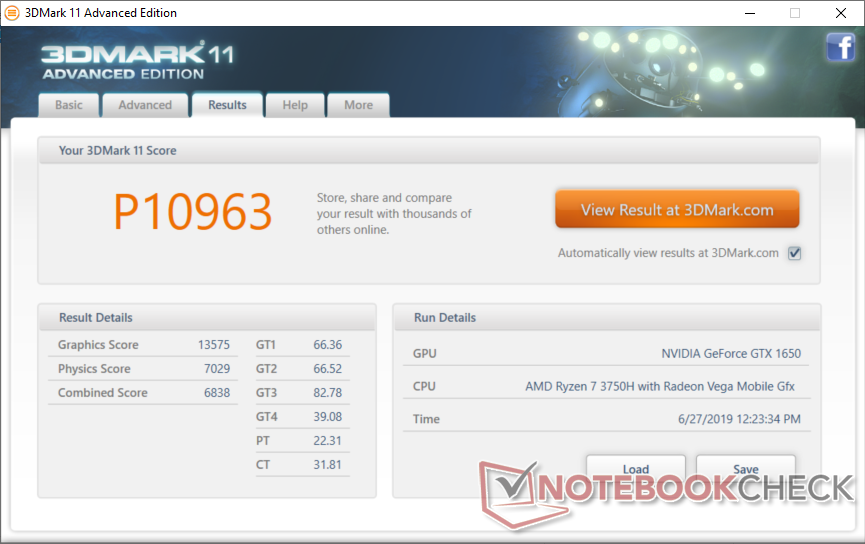
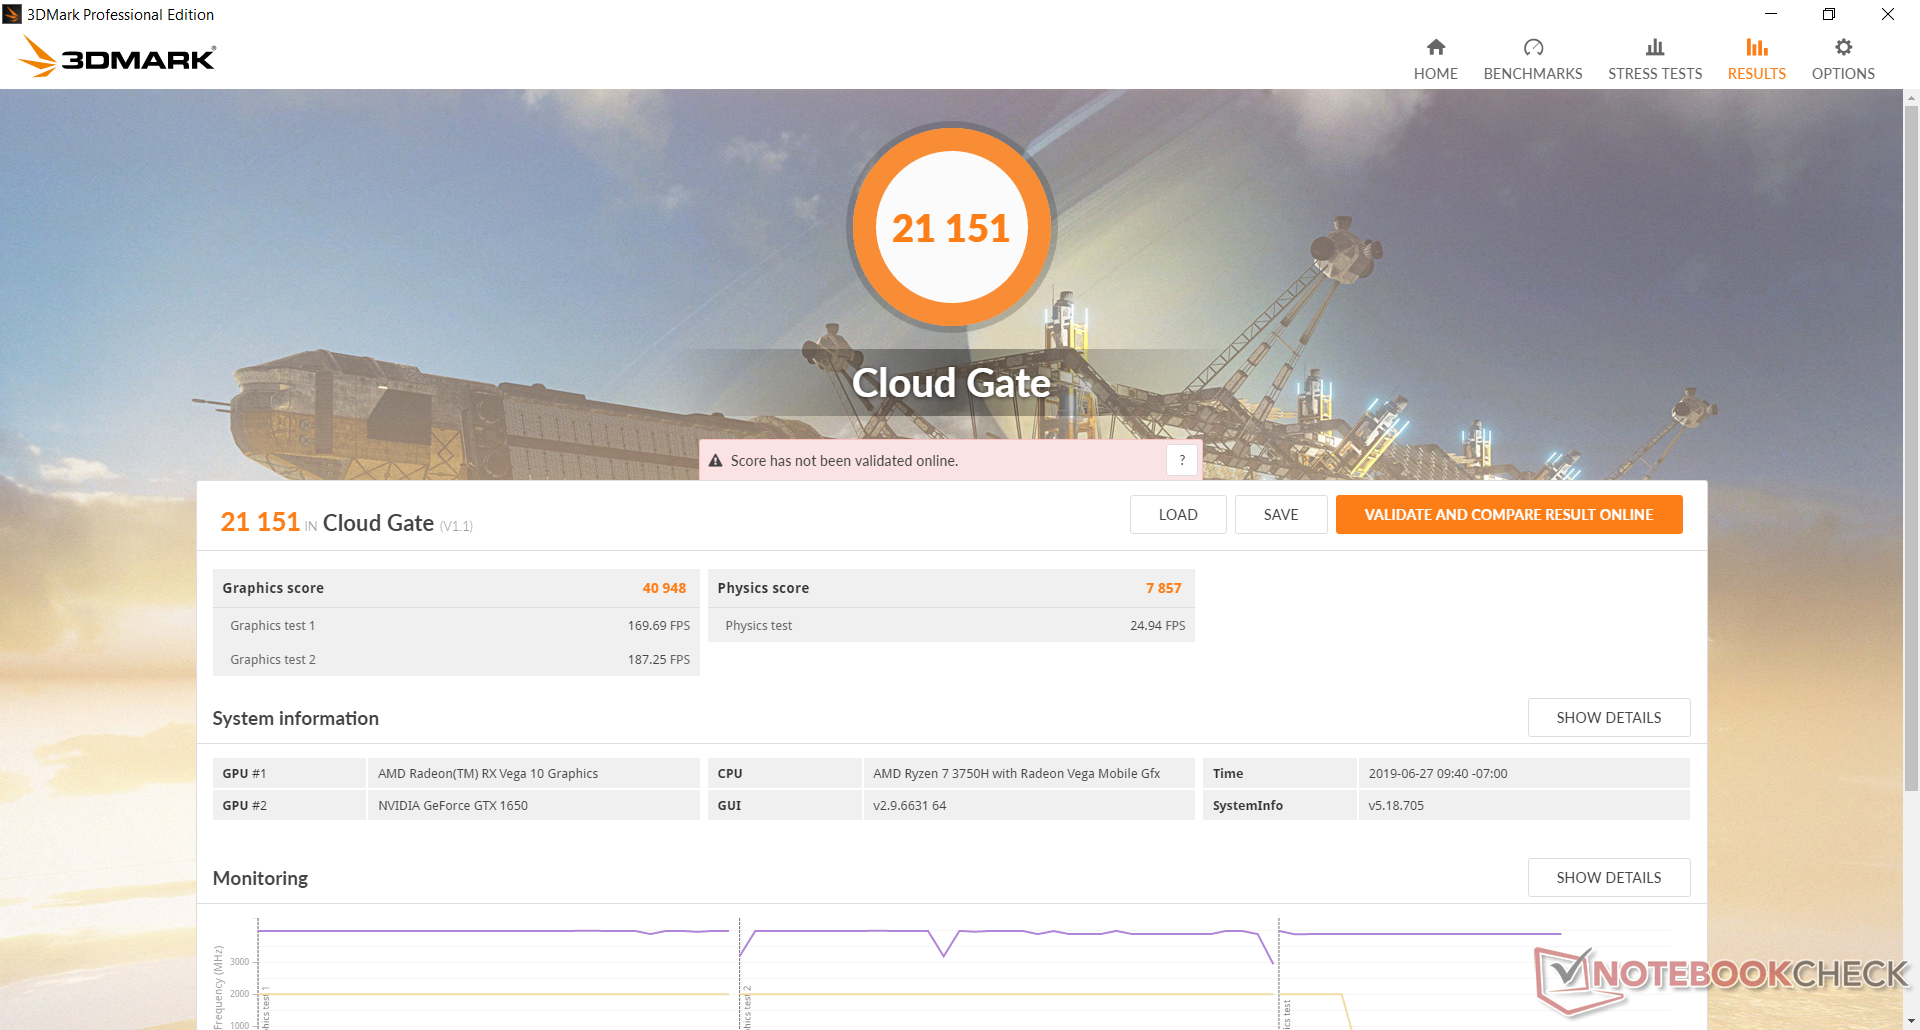
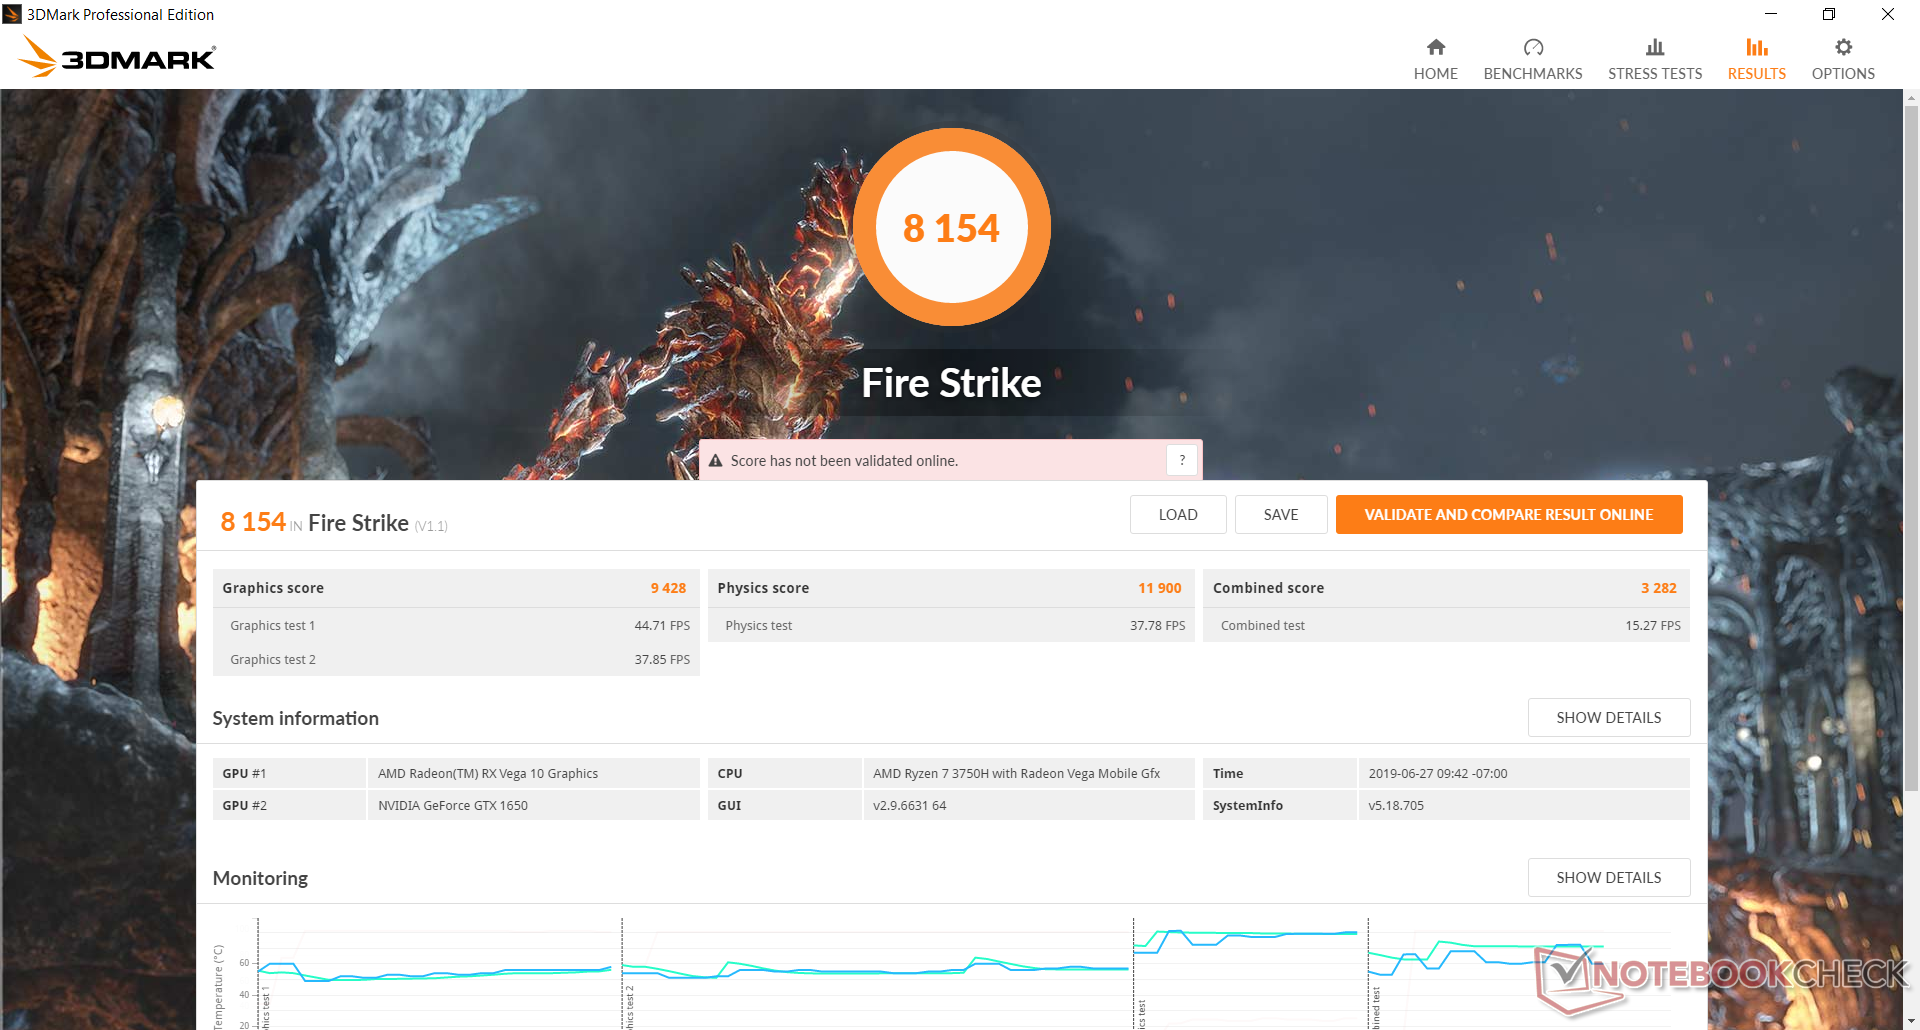
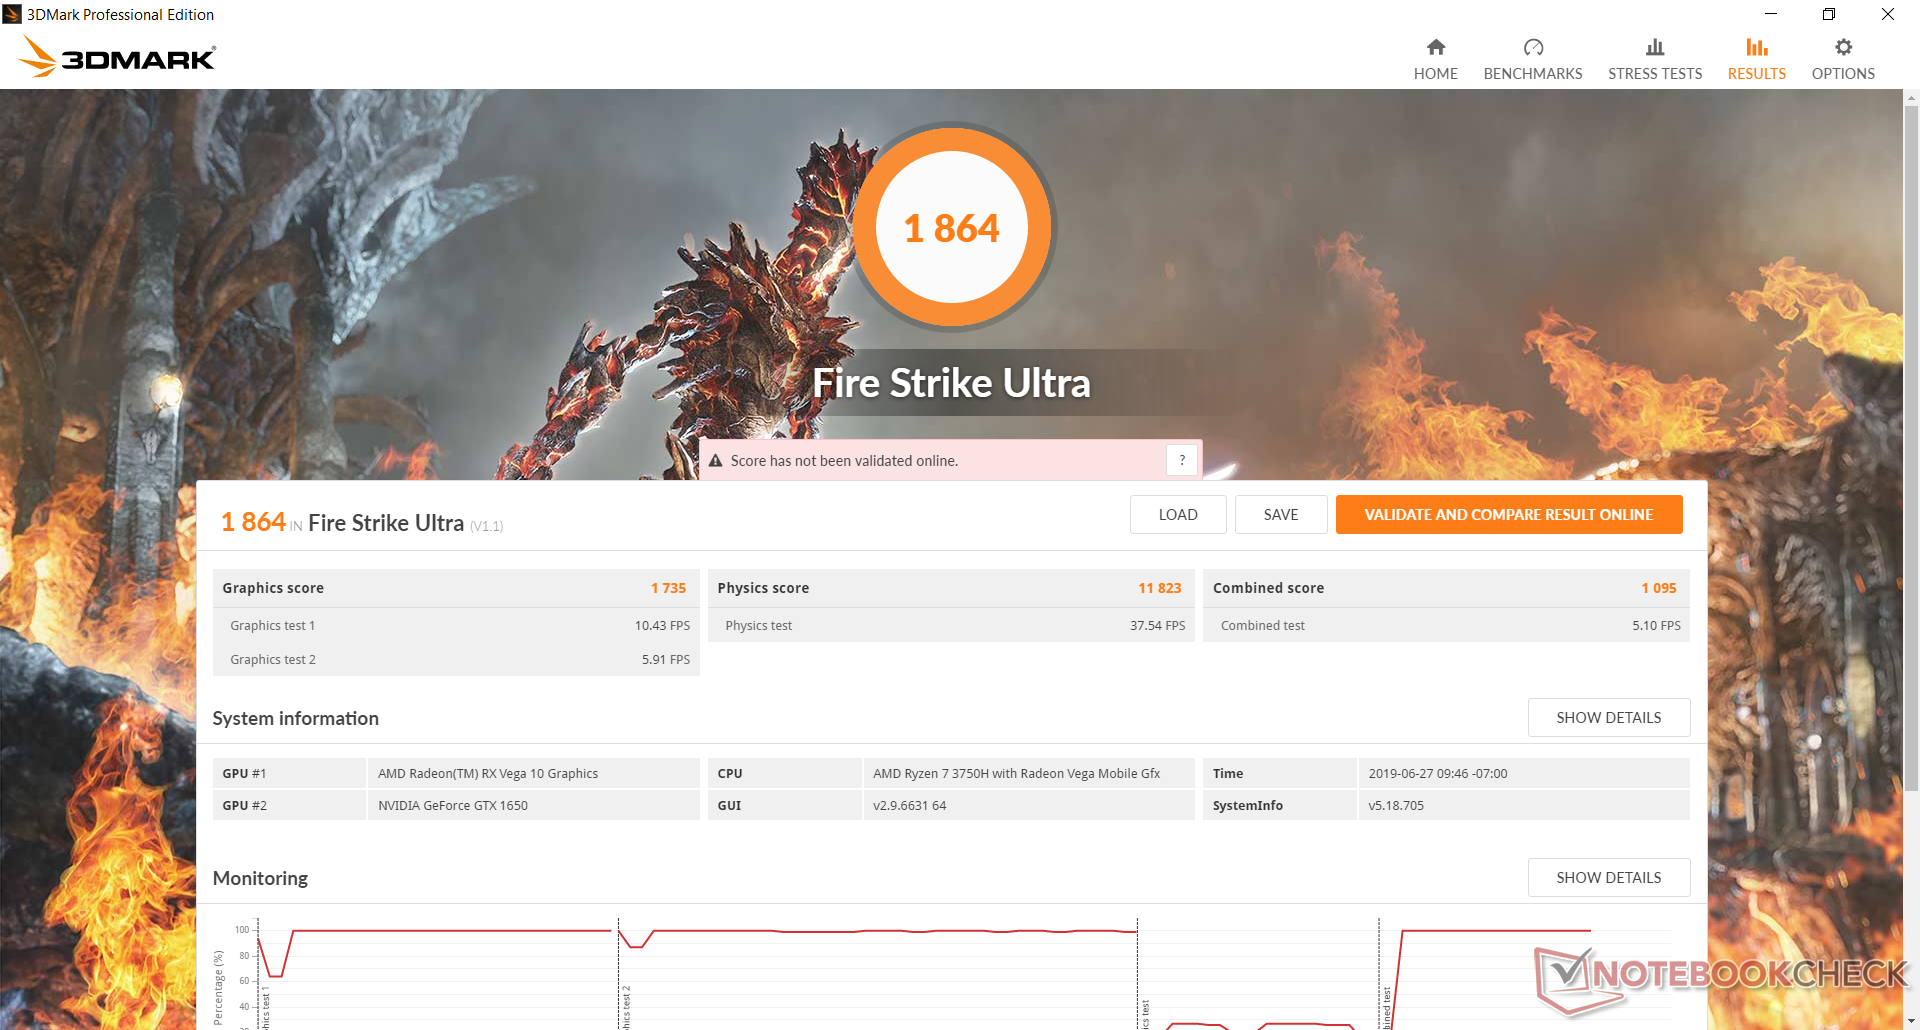
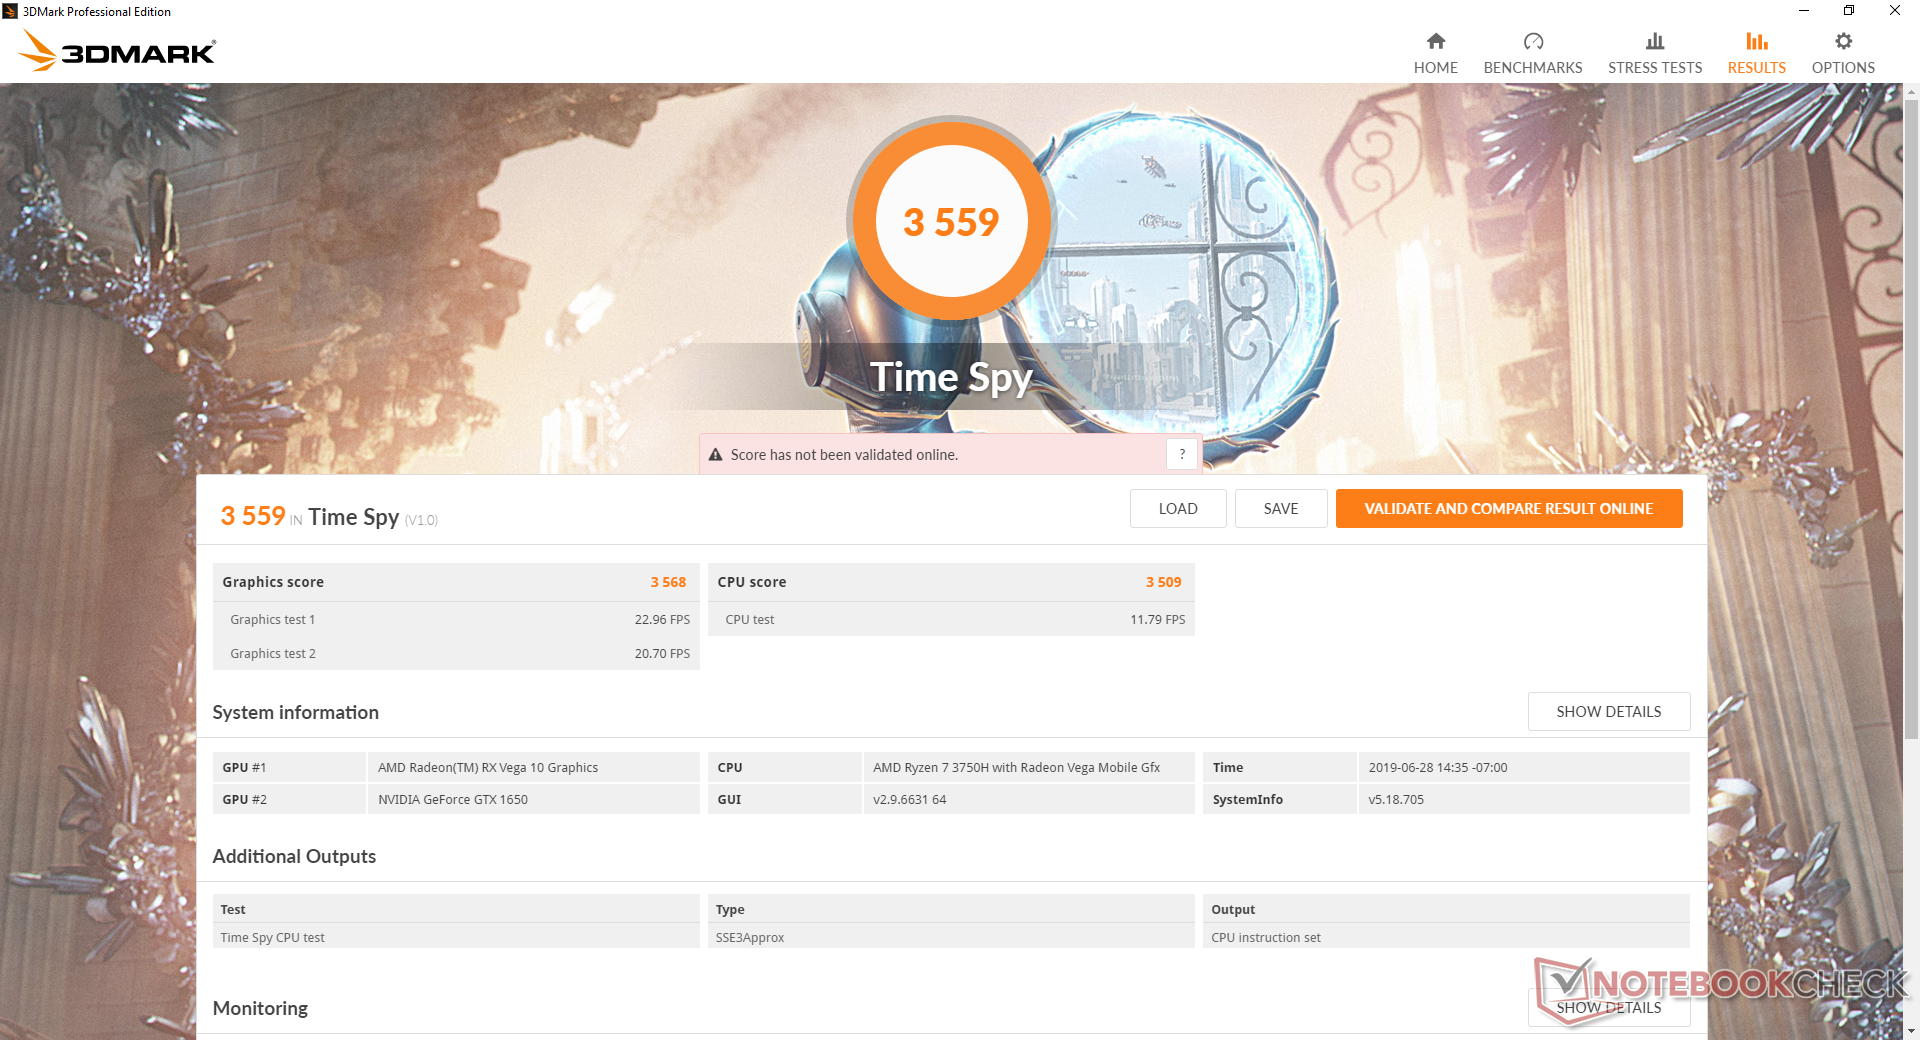
Thank goodness Asus dropped the Radeon RX 560X in favor of the GTX 1650. Raw graphics performance is approximately 50 percent and 100 percent faster in DX11 and DX12 titles, respectively, over the ancient AMD Polaris GPU. Turing GPUs benefit greatly from DX12 over previous generations and so the performance delta is much wider on DX12-enabled games. Impressively, 3DMark benchmarks rank the mobile GTX 1650 to be within 2 to 3 percent of our desktop GTX 1650 reference. Users who want the GTX 1660 Ti SKU (FX505DU) will see up to a 60 percent gain over the GTX 1650.
| 3DMark | |
| 1920x1080 Fire Strike Graphics | |
| MSI RTX 2060 Gaming Z 6G | |
| Aorus 15 W9 | |
| Aorus 15-SA | |
| Asus ROG Zephyrus G15 GA502DU | |
| Asus FX503VM-EH73 | |
| Asus TUF FX505DT-EB73 | |
| Gainward GeForce GTX 1650 4 GB | |
| Average NVIDIA GeForce GTX 1650 Mobile (7741 - 9810, n=32) | |
| Asus TUF FX705GE-EW096T | |
| Asus FX504GD | |
| Asus TUF FX505DY | |
| Asus Zenbook 14 UX433FN-A6023T | |
| 2560x1440 Time Spy Graphics | |
| MSI RTX 2060 Gaming Z 6G | |
| Aorus 15 W9 | |
| Aorus 15-SA | |
| Asus ROG Zephyrus G15 GA502DU | |
| Asus FX503VM-EH73 | |
| Asus TUF FX505DT-EB73 | |
| Gainward GeForce GTX 1650 4 GB | |
| Average NVIDIA GeForce GTX 1650 Mobile (2900 - 3700, n=31) | |
| Asus TUF FX705GE-EW096T | |
| Asus TUF FX505DY | |
| Asus FX504GD | |
| Asus Zenbook 14 UX433FN-A6023T | |
| 3DMark 11 | |
| 1280x720 Performance GPU | |
| MSI RTX 2060 Gaming Z 6G | |
| Aorus 15-SA | |
| Aorus 15 W9 | |
| Asus ROG Zephyrus G15 GA502DU | |
| Asus FX503VM-EH73 | |
| Gainward GeForce GTX 1650 4 GB | |
| Asus TUF FX505DT-EB73 | |
| Average NVIDIA GeForce GTX 1650 Mobile (10885 - 13575, n=30) | |
| Asus TUF FX705GE-EW096T | |
| Asus TUF FX505DY | |
| Asus FX504GD | |
| Asus Zenbook 14 UX433FN-A6023T | |
| 1280x720 Performance Combined | |
| MSI RTX 2060 Gaming Z 6G | |
| Aorus 15-SA | |
| Gainward GeForce GTX 1650 4 GB | |
| Aorus 15 W9 | |
| Average NVIDIA GeForce GTX 1650 Mobile (5870 - 12662, n=28) | |
| Asus TUF FX705GE-EW096T | |
| Asus FX503VM-EH73 | |
| Asus FX504GD | |
| Asus TUF FX505DT-EB73 | |
| Asus ROG Zephyrus G15 GA502DU | |
| Asus TUF FX505DY | |
| Asus Zenbook 14 UX433FN-A6023T | |
| 3DMark 11 Performance | 10963 points | |
| 3DMark Cloud Gate Standard Score | 21151 points | |
| 3DMark Fire Strike Score | 8154 points | |
| 3DMark Time Spy Score | 3559 points | |
Help | ||
Gaming Performance
Real-world performance in games is a mixed bag. First, the good: the FX505DT performs nearly as well as the Acer Nitro 5 with the Core i5-9300H and same GTX 1650 GPU on High 1080p settings. Shadow of the Tomb Raider is 7 percent slower on the Asus while results are neck-to-neck when running Witcher 3.
When running games on lower resolutions and settings, however, performance becomes slower than expected. As an example, running Shadow of the Tomb Raider at 720p on the lowest graphical settings averages 62 FPS compared to 63 FPS on the Asus TUF FX705GE with the Core i7-8750H and slower GTX 1050 Ti graphics. In contrast, running this same game at 1080p Ultra settings shows the FX505DT outperforming the FX705GE by 32 percent. Even a Ryzen 7 2700U laptop manages to average 54 FPS at 720p on the lowest settings. This suggests a CPU bound scenario which will make reaching a stable 120 FPS more difficult on the Ryzen-powered FX505DT.
It's important to remember that you don't have to reach a stable 120 FPS when gaming to take advantage of a 120 Hz display. While that would be ideal, users can still game in lower frame rates with reduced tearing because of the faster refresh rate. Engaging v-sync at 40 FPS in particular will be possible without any tearing on a 120 Hz display in contrast to only 30 FPS or 60 FPS on a 60 Hz display.
The resolution setting 1366 x 768 is disabled by default on this machine. Users will have to force the resolution through the GPU or just use 1280 x 720 instead.
See our dedicated page on the GeForce GTX 1650 for more technical information and benchmarks. Running Witcher 3 shows no recurring dip in frame rates to suggest no interrupting background activity when gaming.
| Shadow of the Tomb Raider | |
| 1920x1080 Highest Preset AA:T | |
| MSI RTX 2060 Gaming Z 6G | |
| Alienware 17 R4 | |
| CUK Model Z GK5CQ7Z | |
| Zotac GeForce GTX 1660 Ti 6 GB | |
| MSI GL73 8SE-010US | |
| Asus ROG Zephyrus G15 GA502DU | |
| Acer Aspire Nitro 5 AN515-54-53Z2 | |
| Average NVIDIA GeForce GTX 1650 Mobile (34 - 47, n=15) | |
| Asus TUF FX505DT-EB73 | |
| Asus TUF FX705GE-EW096T | |
| Asus GL753VD | |
| Acer Nitro 5 AN515-42-R6V0 | |
| 1280x720 Lowest Preset | |
| CUK Model Z GK5CQ7Z | |
| MSI RTX 2060 Gaming Z 6G | |
| Zotac GeForce GTX 1660 Ti 6 GB | |
| Alienware 17 R4 | |
| Average NVIDIA GeForce GTX 1650 Mobile (57 - 128, n=13) | |
| MSI GL73 8SE-010US | |
| Asus GL753VD | |
| Asus TUF FX705GE-EW096T | |
| Asus ROG Zephyrus G15 GA502DU | |
| Asus TUF FX505DT-EB73 | |
| Acer Nitro 5 AN515-42-R6V0 | |
| low | med. | high | ultra | |
|---|---|---|---|---|
| BioShock Infinite (2013) | 183.9 | 73.9 | ||
| The Witcher 3 (2015) | 146.4 | 62.7 | 36.2 | |
| Batman: Arkham Knight (2015) | 88 | 67 | 44 | |
| Rise of the Tomb Raider (2016) | 117.8 | 64.4 | 54.4 | |
| Ashes of the Singularity (2016) | 40 | 36 | ||
| Overwatch (2016) | 165.2 | 133.2 | 86.4 | |
| Rocket League (2017) | 213.9 | 162.5 | 127.5 | |
| Shadow of the Tomb Raider (2018) | 62 | 52 | 45 | 41 |
Emissions
System Noise
The cooling solution remains identical to the FX505DY. Fan noise is slightly quieter in general but still loud overall. When running Witcher 3, fan noise tends to pulse between 43 dB(A) and 47 dB(A) even when Armoury Crate is set to Turbo mode. A constant RPM is always preferred to be less noticeable or bothersome when gaming. Fan noise is nowhere near as loud as the more powerful Zephyrus S GX502GW when under similar gaming loads.
The system is silent when idling on desktop. However, be sure to set Armoury Crate to Silent mode when word processing, browsing, or video streaming to limit fan noise to 33.3 dB(A). The fans become much more sensitive to onscreen loads when on Balanced mode or higher.
We can notice slight coil whine or electronic noise from our test unit when placing an ear near the keyboard in a silent room. This is thankfully easy to ignore during more real-world conditions.
| Asus TUF FX505DT-EB73 GeForce GTX 1650 Mobile, R7 3750H, Intel SSD 660p SSDPEKNW512G8 | Asus Zephyrus S GX502GW GeForce RTX 2070 Mobile, i7-9750H, 2x Intel SSD 660p SSDPEKNW512G8 (RAID 0) | Asus FX504GD GeForce GTX 1050 Mobile, i5-8300H, Seagate Mobile HDD 1TB ST1000LX015-1U7172 | Acer Aspire Nitro 5 AN515-54-53Z2 GeForce GTX 1650 Mobile, i5-9300H, WDC PC SN520 SDAPNUW-512G | MSI GF63 8RC GeForce GTX 1050 Mobile, i5-8300H, Seagate BarraCuda Pro Compute 1TB ST1000LM049 | Asus TUF FX505DY Radeon RX 560X (Laptop), R5 3550H, WDC PC SN520 SDAPNUW-256G | Lenovo Legion Y530-15ICH GeForce GTX 1060 Mobile, i7-8750H, Samsung SSD PM981 MZVLB256HAHQ | |
|---|---|---|---|---|---|---|---|
| Noise | -15% | 1% | -6% | -4% | -1% | -2% | |
| off / environment * (dB) | 28.2 | 30 -6% | 28.1 -0% | 30 -6% | 28 1% | 28.2 -0% | 30.2 -7% |
| Idle Minimum * (dB) | 28.2 | 31 -10% | 29 -3% | 30 -6% | 33.8 -20% | 28.2 -0% | 30.9 -10% |
| Idle Average * (dB) | 28.2 | 33 -17% | 29.2 -4% | 31 -10% | 34 -21% | 28.2 -0% | 30.9 -10% |
| Idle Maximum * (dB) | 31.4 | 38 -21% | 29.7 5% | 33 -5% | 34.2 -9% | 28.2 10% | 31.6 -1% |
| Load Average * (dB) | 39.8 | 50 -26% | 44.3 -11% | 46 -16% | 37.3 6% | 43.9 -10% | 42.3 -6% |
| Witcher 3 ultra * (dB) | 47 | 53 -13% | 40.7 13% | 46 2% | 43.4 8% | 49 -4% | |
| Load Maximum * (dB) | 50.2 | 56 -12% | 47.7 5% | 49 2% | 46 8% | 50.6 -1% | 40 20% |
* ... smaller is better
Noise level
| Idle |
| 28.2 / 28.2 / 31.4 dB(A) |
| Load |
| 39.8 / 50.2 dB(A) |
 | ||
30 dB silent 40 dB(A) audible 50 dB(A) loud |
||
min: | ||
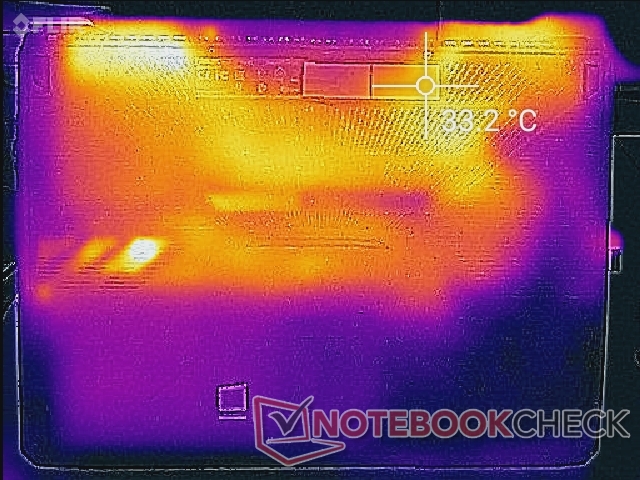
Temperature
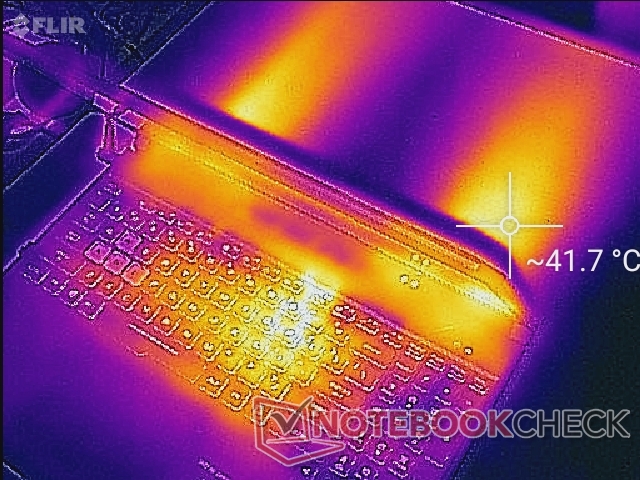
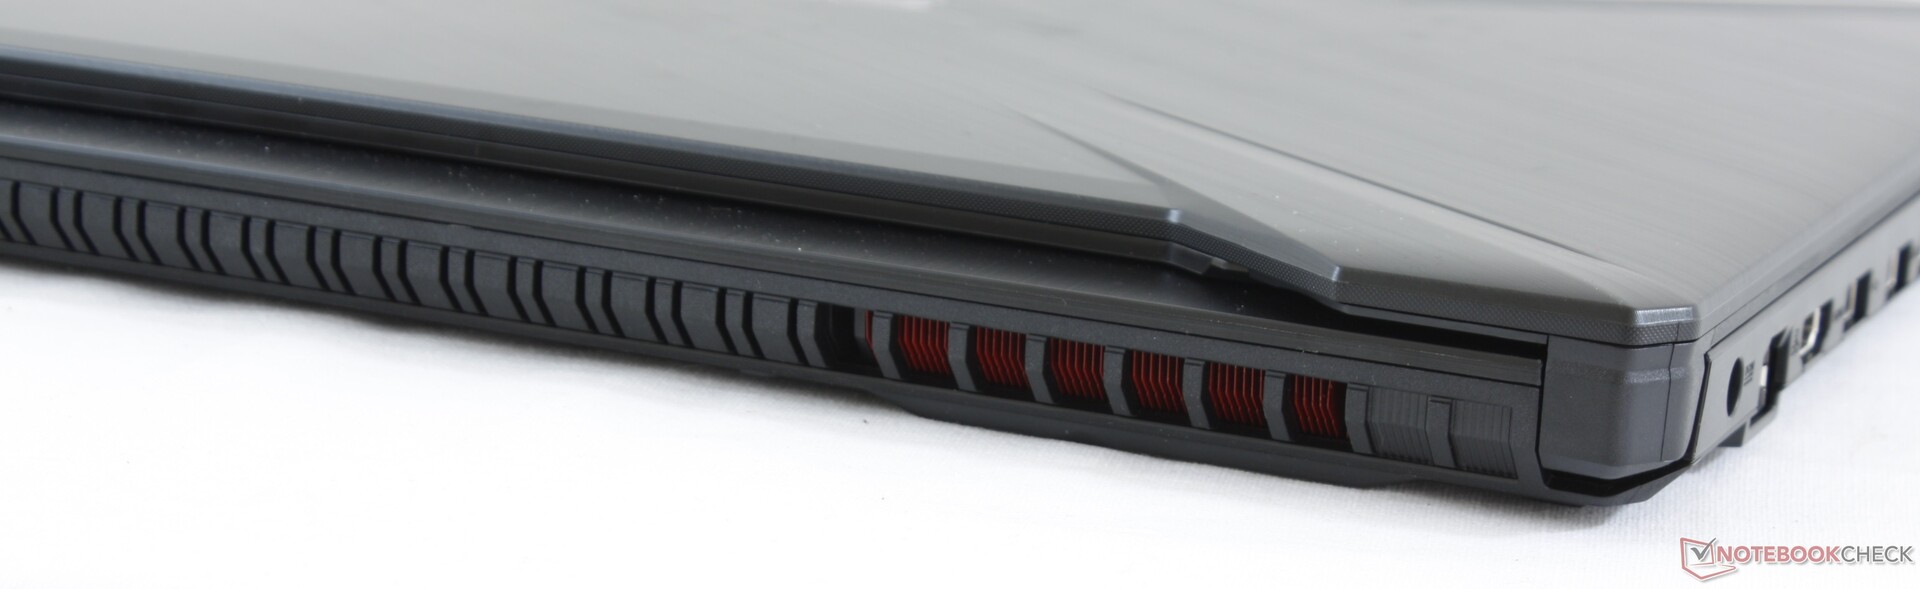
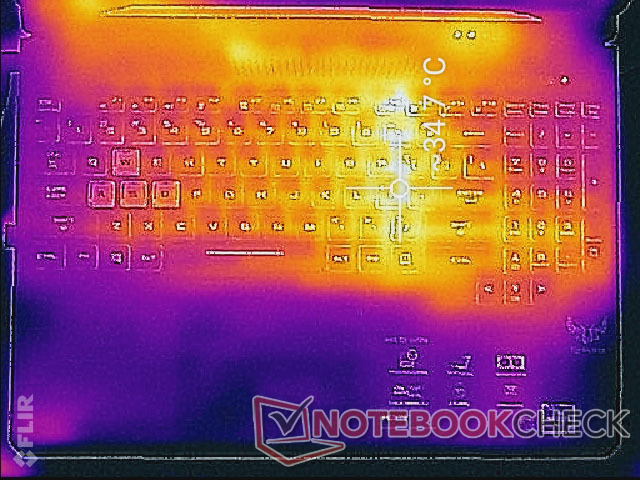
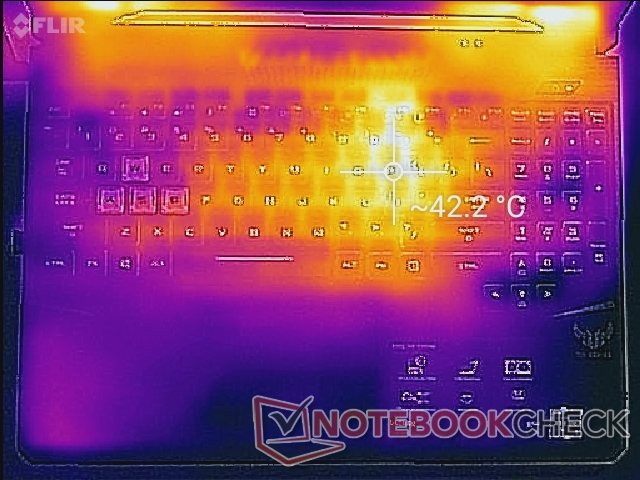
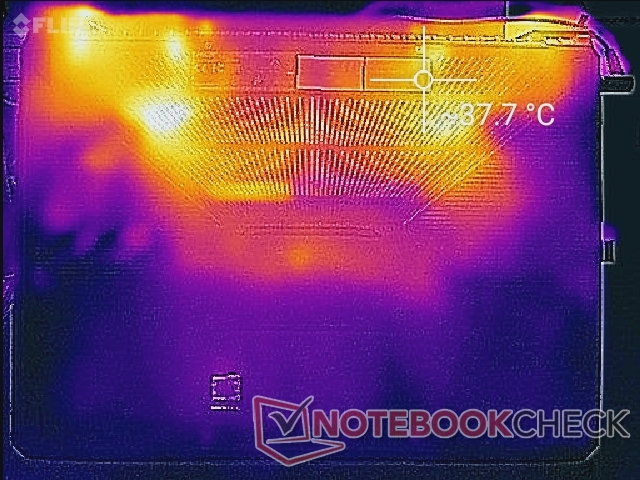
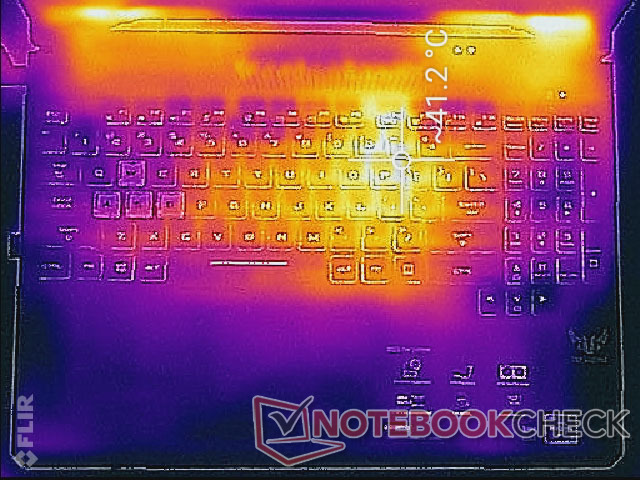
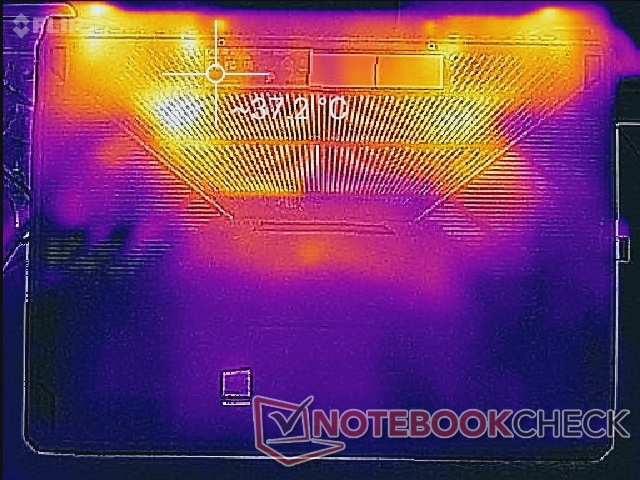
Surface temperatures when idling or during low loads are actually warmer on our FX505DT when compared to the FX505DY. When gaming or running very high loads, temperatures start to become more similar between them. The hot spot closest to the letter "P" reaches 42 C to be much cooler than the thinner Zephyrus G GA502DU with faster GTX 1660 Ti Max-Q graphics. We suspect that the pricier FX505DU SKU with the GTX 1660 Ti will have warmer surface temperatures than what we've recorded here since it is a more power-hungry GPU.
Thankfully, the system never becomes uncomfortably warm to game on because the WASD keys, NumPad keys, and palm rests remain relatively cool no matter the onscreen load. The general hot spot is on the section of the keyboard where most games do not frequently utilize.
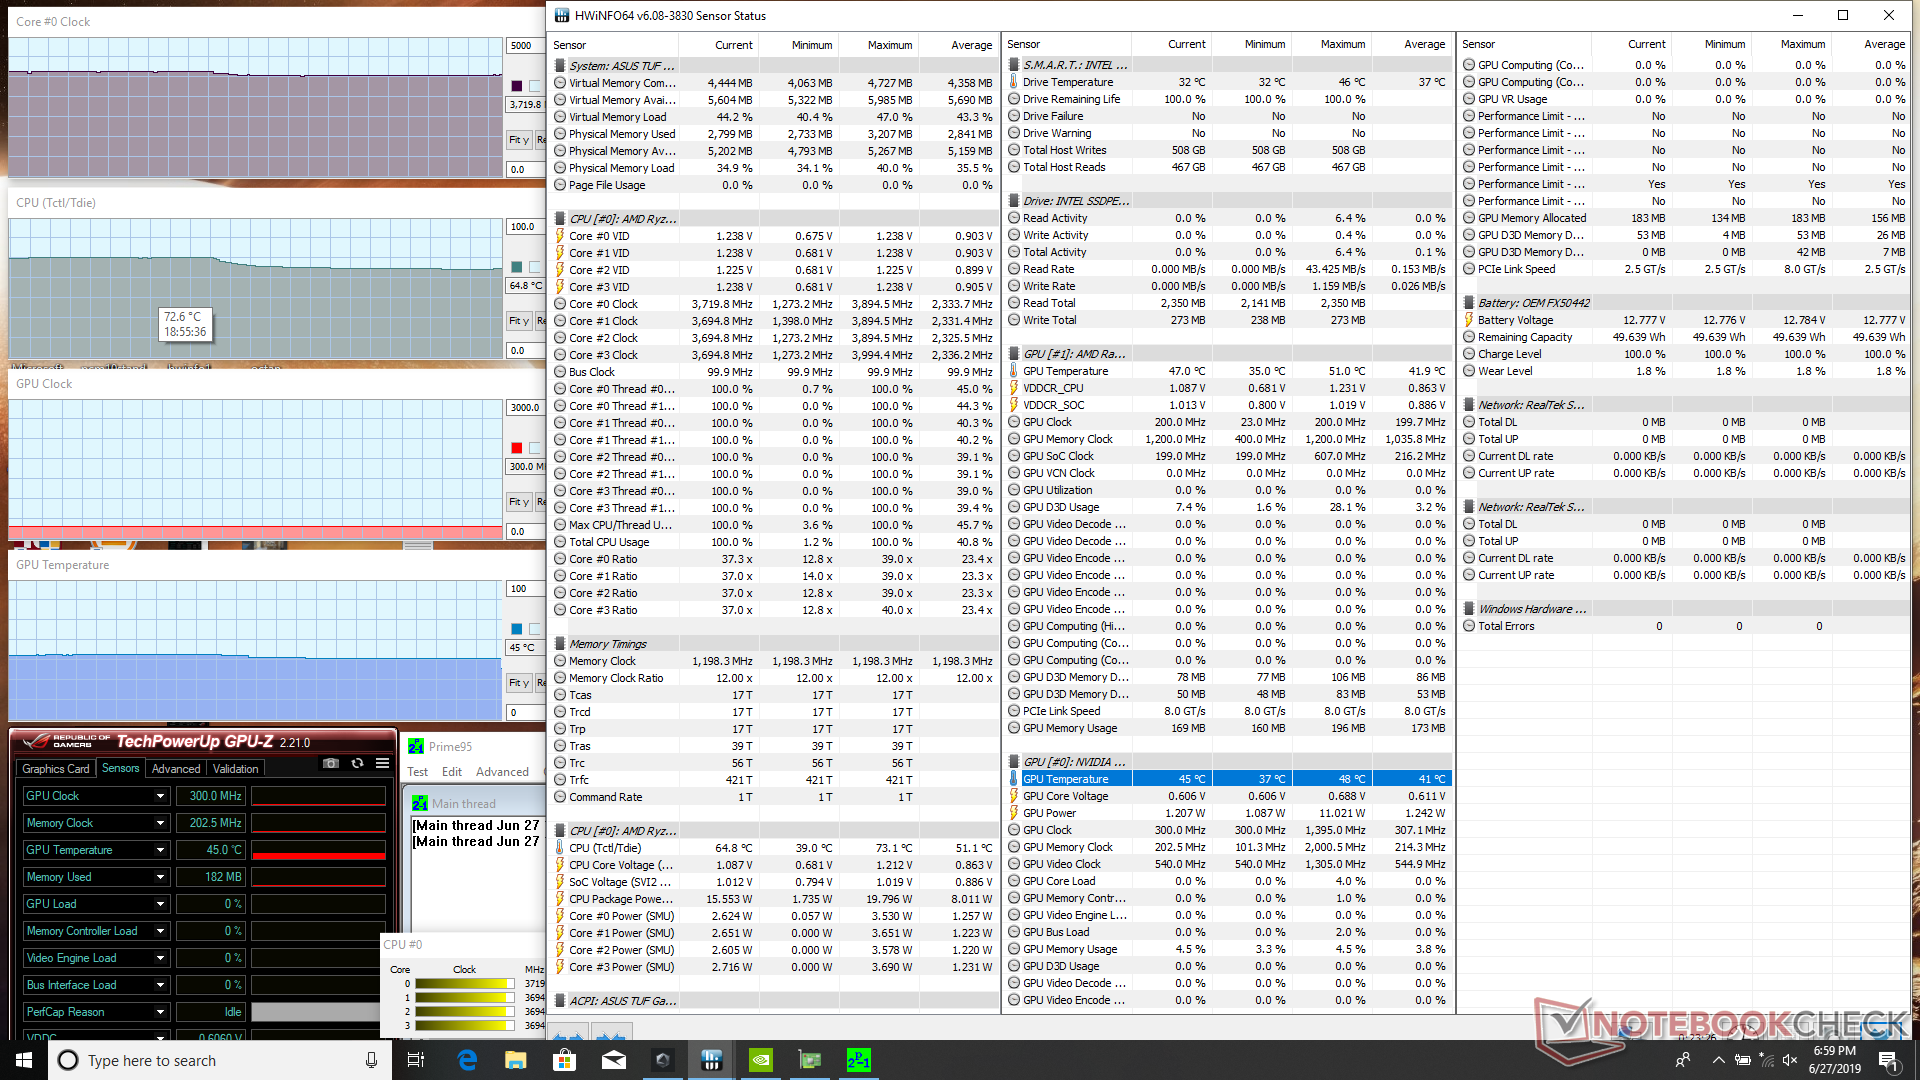
Stress Test
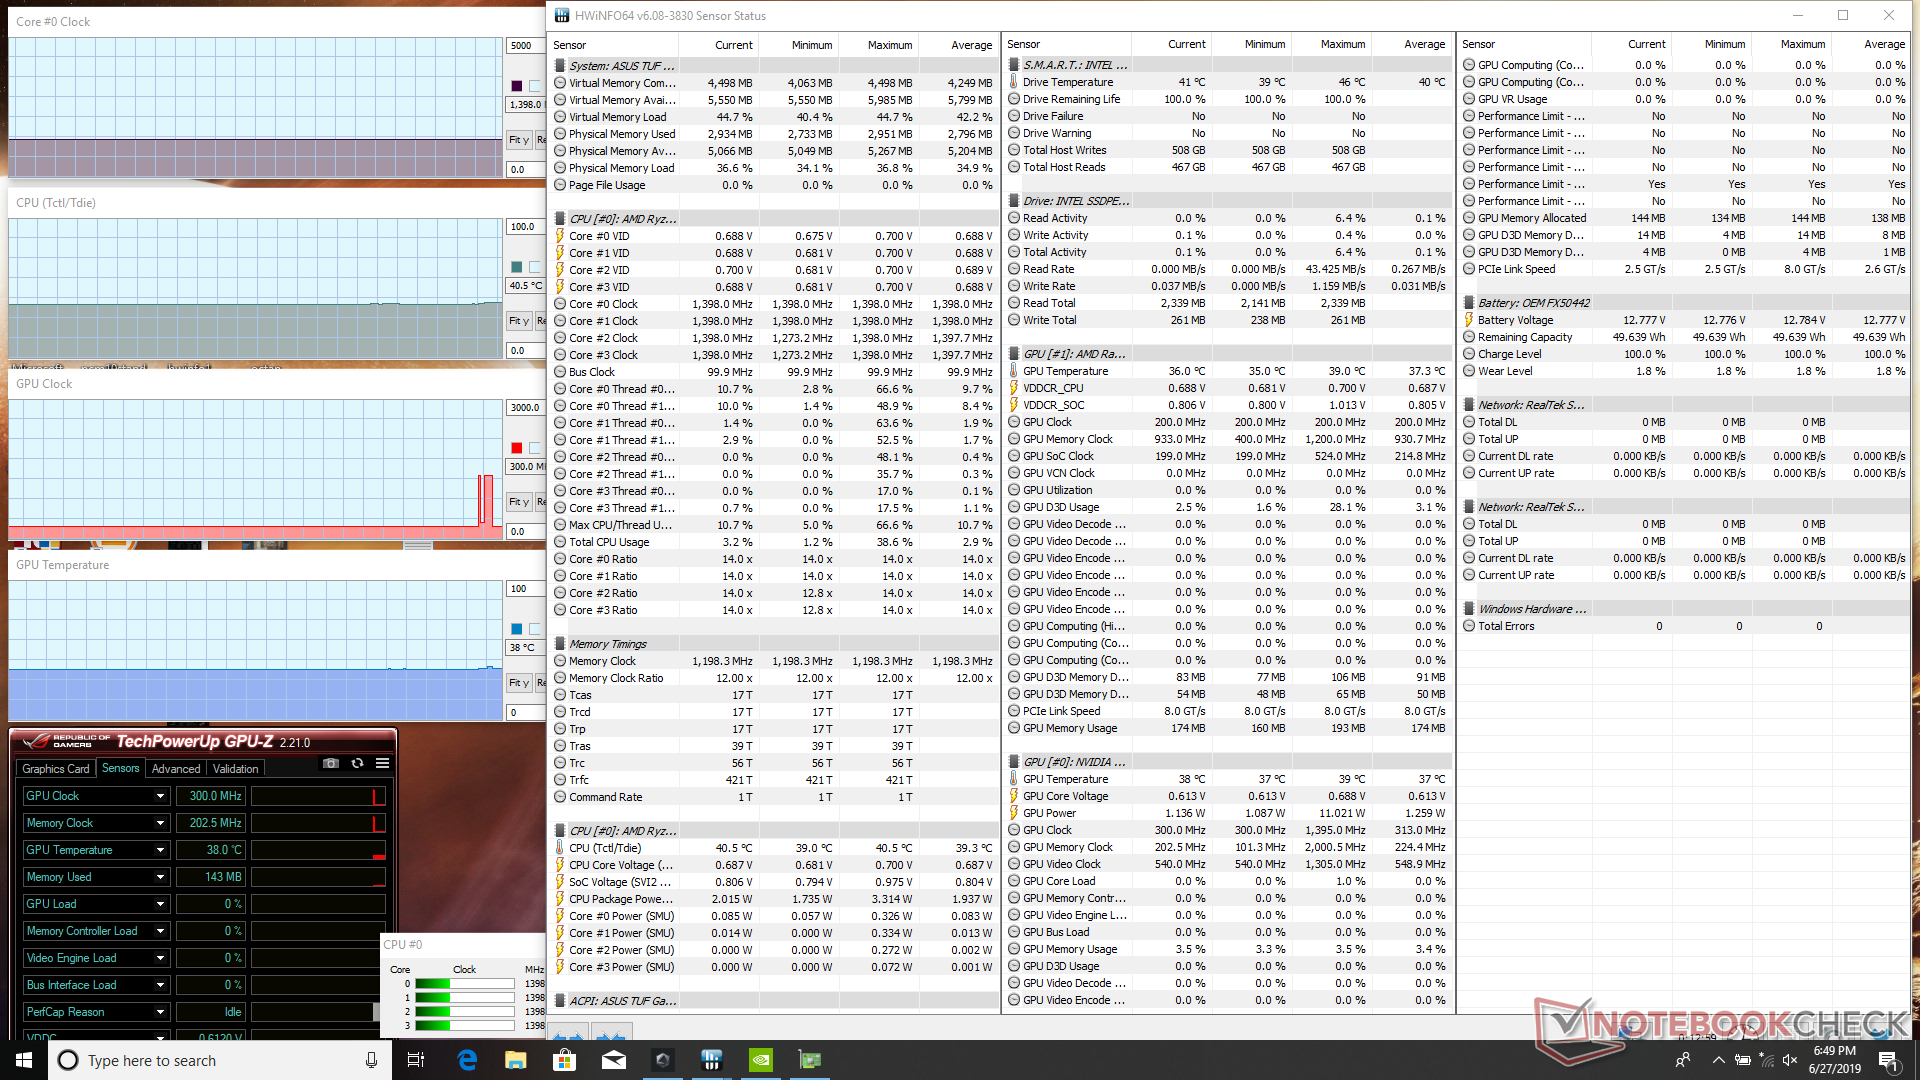
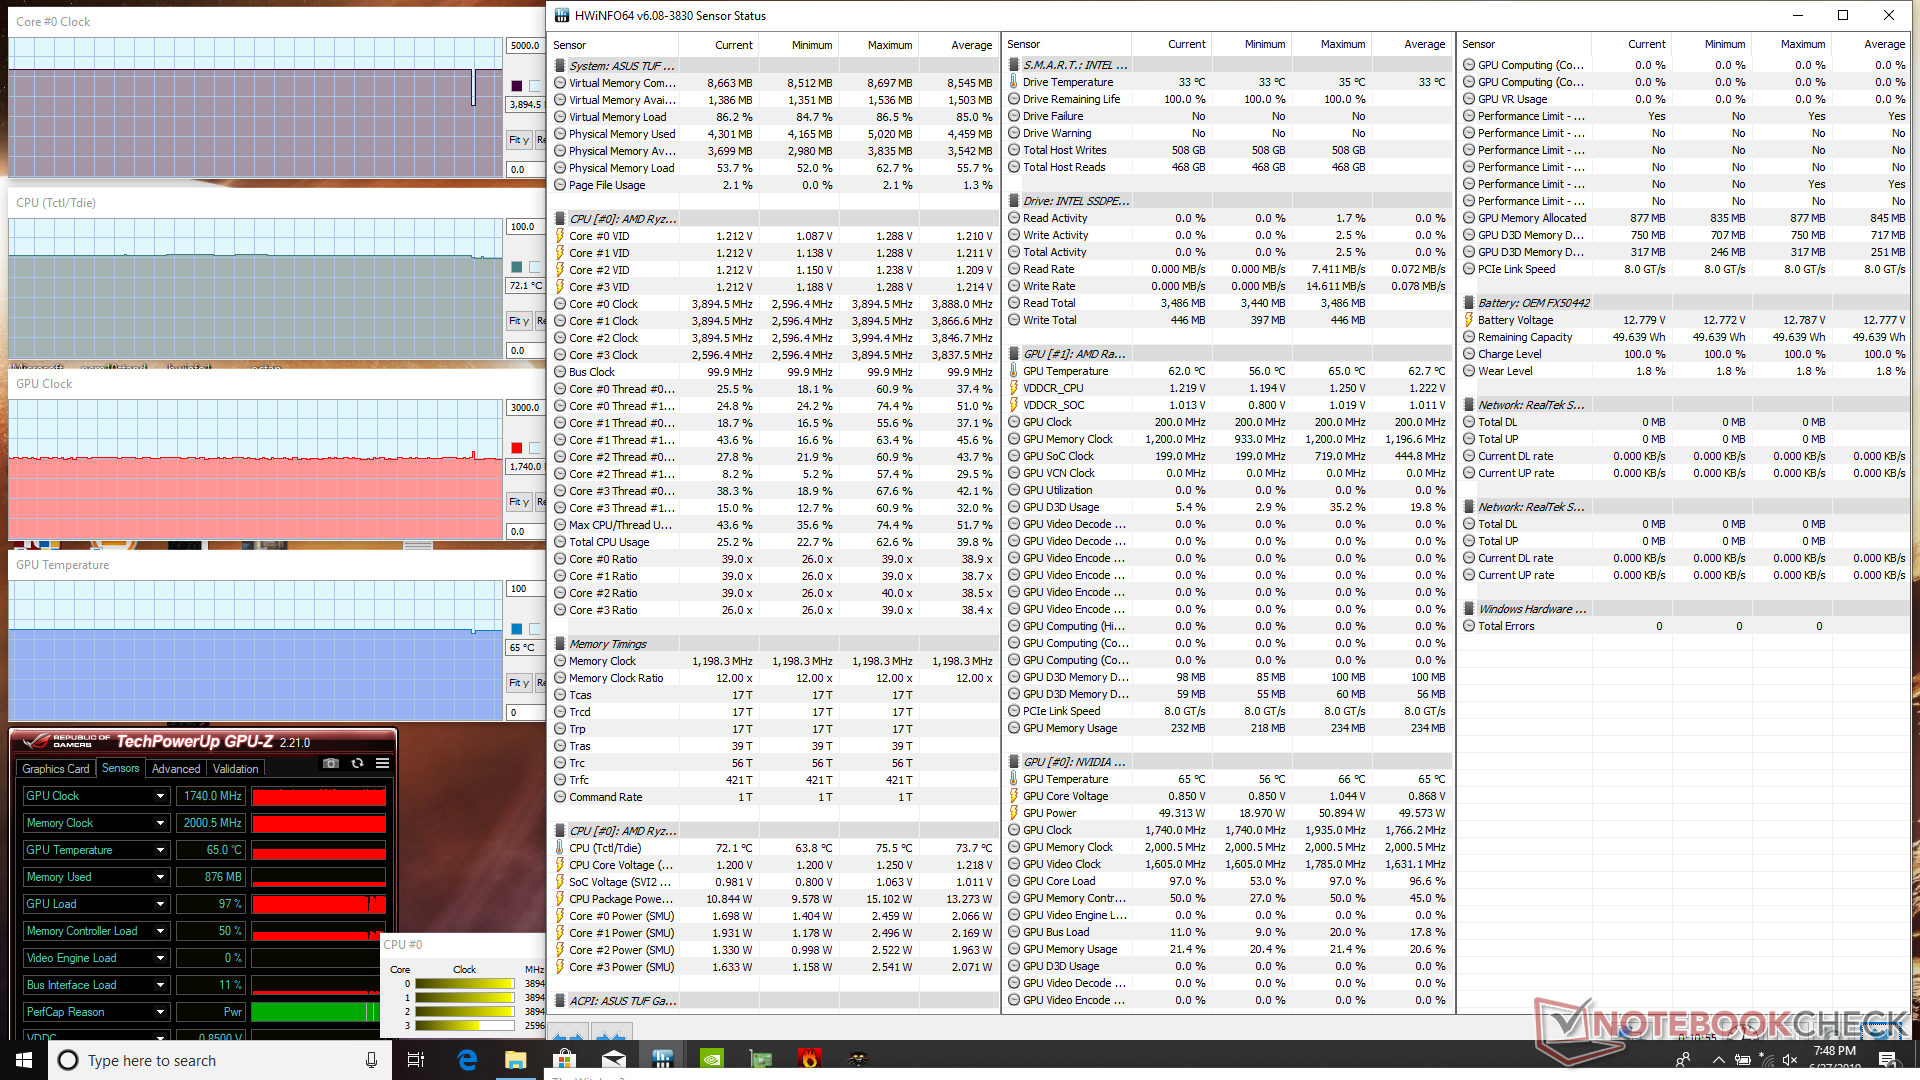
We stress the system with synthetic loads to identify for any potential throttling or stability issues. When running Prime95, the CPU can be observed running as high as 3.9 GHz before steadily dropping to maintain 3.7 GHz and a core temperature of 65 C. Since the base clock rate of the Ryzen 7 3750H is 2.3 GHz, it's able to maintain a decent level of Turbo for extended periods albeit not as high as on the Zephyrus G GA502. Running both Prime95 and FurMark simultaneously will cause CPU and GPU temperatures to stabilize at 83 C and 69 C, respectively.
Running Witcher 3 is more representative of real-world gaming loads. The CPU and GPU reach 72 C and 65 C, respectively, which is relatively cool as far as gaming laptops go. Results are actually just a few degrees warmer than the Acer Nitro 5 with the same GPU and Zephyrus G GA502 with the faster GTX 1660 Ti Max-Q.
Running on battery power will limit performance. A Fire Strike run on batteries returns Physics and Graphics scores of 7953 and 3068 points, respectively, compared to 11900 and 9428 points when on mains.
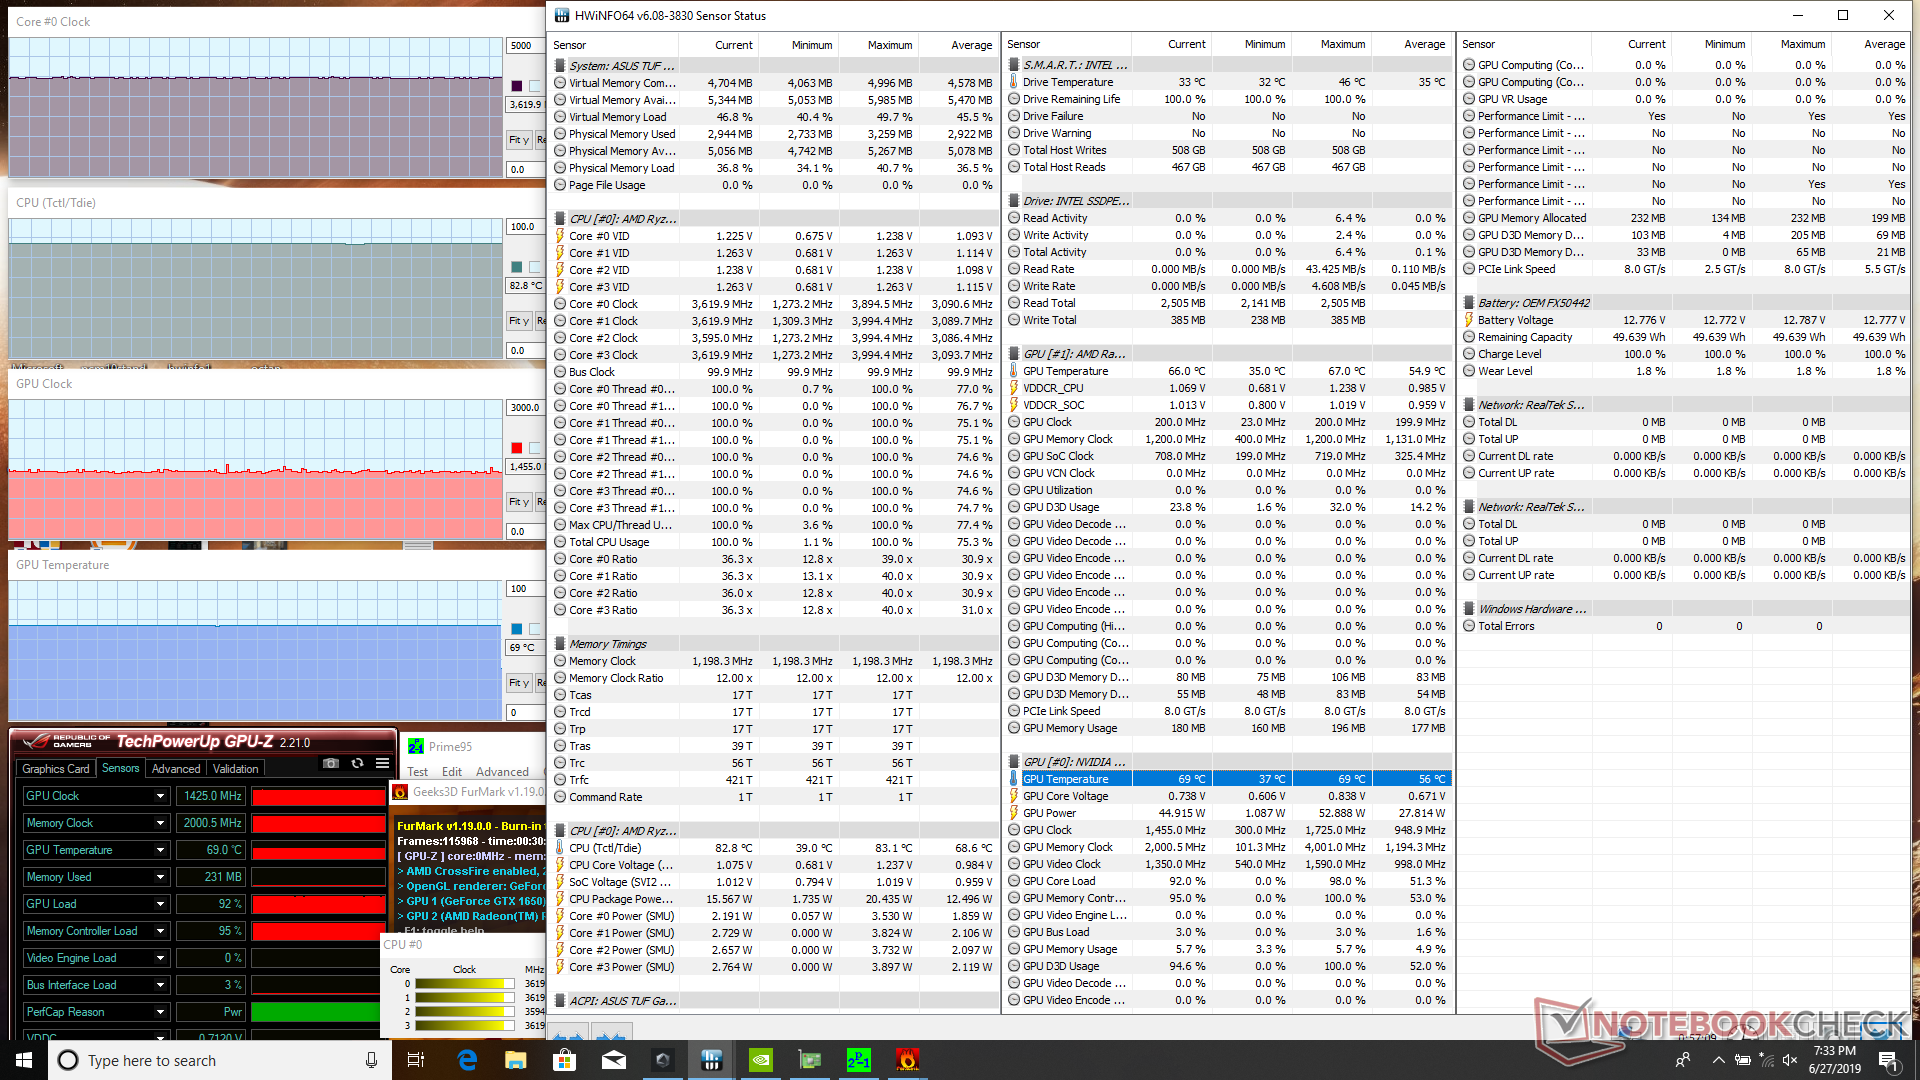
| CPU Clock (GHz) | GPU Clock (MHz) | Average CPU Temperature (°C) | Average GPU Temperature (°C) | |
| System Idle | -- | -- | 41 | 38 |
| Prime95 Stress | 3.7 | -- | 65 | -- |
| Prime95 + FurMark Stress | 3.6 | 1425 | 83 | 69 |
| Witcher 3 Stress | 3.9 | 1740 | 72 | 65 |
(±) The maximum temperature on the upper side is 41.2 °C / 106 F, compared to the average of 40.4 °C / 105 F, ranging from 21.2 to 68.8 °C for the class Gaming.
(±) The bottom heats up to a maximum of 40 °C / 104 F, compared to the average of 43.2 °C / 110 F
(+) In idle usage, the average temperature for the upper side is 30.7 °C / 87 F, compared to the device average of 33.9 °C / 93 F.
(±) Playing The Witcher 3, the average temperature for the upper side is 32.4 °C / 90 F, compared to the device average of 33.9 °C / 93 F.
(+) The palmrests and touchpad are cooler than skin temperature with a maximum of 28.2 °C / 82.8 F and are therefore cool to the touch.
(±) The average temperature of the palmrest area of similar devices was 28.8 °C / 83.8 F (+0.6 °C / 1 F).
Speakers


Asus TUF FX505DT-EB73 audio analysis
(±) | speaker loudness is average but good (79.3 dB)
Analysis not possible as minimum curve is missing or too high
Apple MacBook 12 (Early 2016) 1.1 GHz audio analysis
(+) | speakers can play relatively loud (83.6 dB)
Bass 100 - 315 Hz
(±) | reduced bass - on average 11.3% lower than median
(±) | linearity of bass is average (14.2% delta to prev. frequency)
Mids 400 - 2000 Hz
(+) | balanced mids - only 2.4% away from median
(+) | mids are linear (5.5% delta to prev. frequency)
Highs 2 - 16 kHz
(+) | balanced highs - only 2% away from median
(+) | highs are linear (4.5% delta to prev. frequency)
Overall 100 - 16.000 Hz
(+) | overall sound is linear (10.2% difference to median)
Compared to same class
» 7% of all tested devices in this class were better, 2% similar, 90% worse
» The best had a delta of 5%, average was 18%, worst was 53%
Compared to all devices tested
» 5% of all tested devices were better, 1% similar, 94% worse
» The best had a delta of 4%, average was 23%, worst was 134%
Energy Management
Power Consumption
When idling, power consumption ranges from 7 W to 12 W depending on the brightness and power profile to be similar to other entry-level gaming laptops. When running 3DMark 06, the FX505DT consumes 20 W less on average than the older FX504GD and Acer Nitro 5 equipped with GTX 1050 and GTX 1650 graphics, respectively, to show how much more variable the performance of the Ryzen CPU can be in response to onscreen loads.
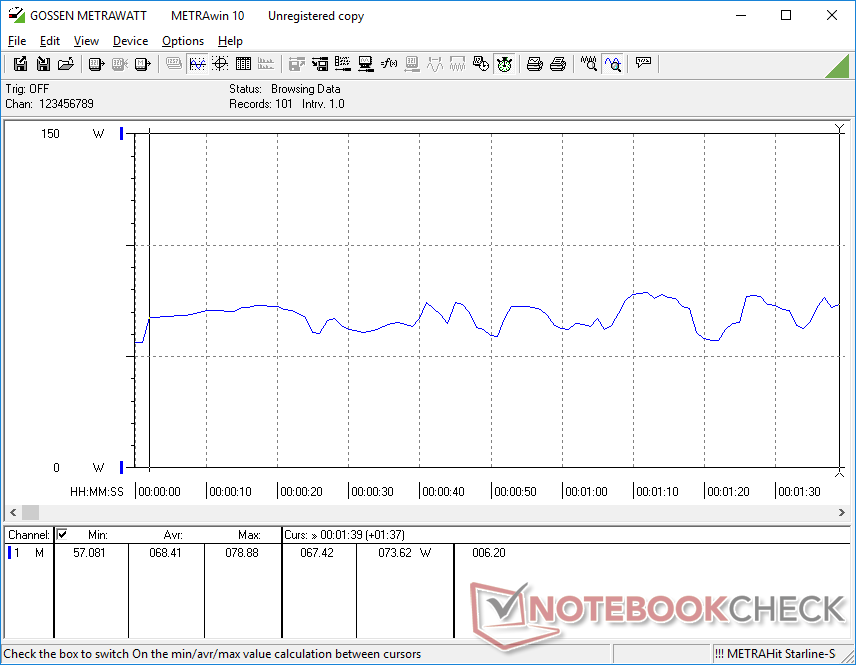
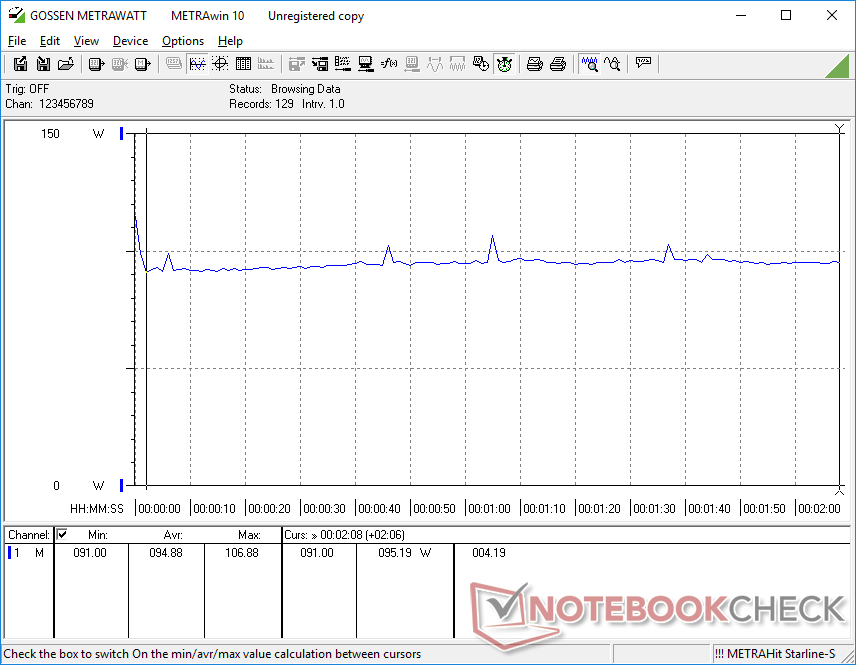
Running Witcher 3 is more representative of real-world gaming loads. The FX505DT consumes about 95 W on average compared to 90 W on the outgoing FX505DY with Radeon RX 560X graphics when under the same conditions. Keep in mind that the GTX 1650 can offer up to 100 percent faster graphics performance than the Radeon RX 560X while consuming just 5 percent more power for immensely superior performance-per-Watt. Consumption is also very similar to the aforementioned FX504GD or Acer Aspire Nitro 5 when gaming to demonstrate Ryzen's proportionate efficiency to Intel Core i5 laptops.
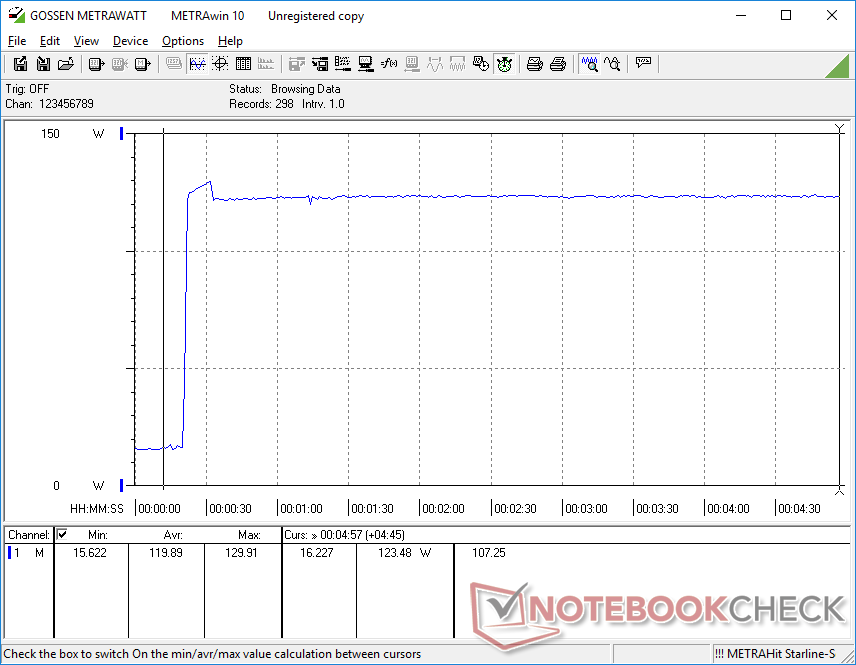
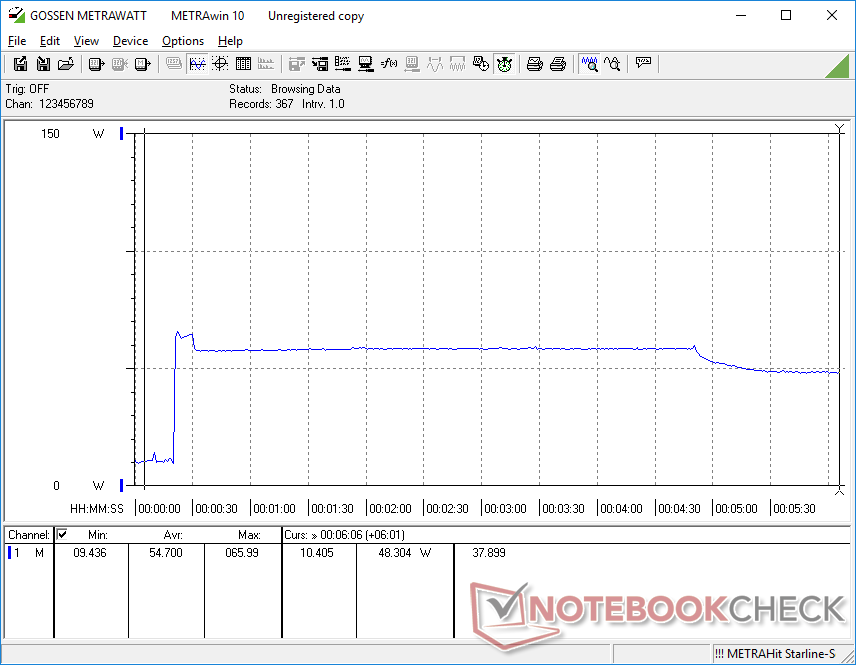
When running Prime95, consumption jumps to 66 W for the first few seconds before falling to 58.2 W. This lasts for approximately four minutes before consumption falls again to 48 W. The timing and behavior of these power consumption changes mirror our Prime95 stress test observations above where clock rates spike to 3.9 GHz at the beginning before falling to 3.8 GHz and then 3.7 GHz.
We're able to record a maximum consumption of 130.9 W from the relatively small (~13.7 x 6.8 x 2.4 cm) 150 W AC adapter. Thus, it's possible to simultaneously recharge the system while playing games.
| Off / Standby | |
| Idle | |
| Load |
|
Key:
min: | |
| Asus TUF FX505DT-EB73 R7 3750H, GeForce GTX 1650 Mobile, Intel SSD 660p SSDPEKNW512G8, IPS, 1920x1080, 15.6" | Asus Zephyrus S GX502GW i7-9750H, GeForce RTX 2070 Mobile, 2x Intel SSD 660p SSDPEKNW512G8 (RAID 0), IPS, 1920x1080, 15.6" | Asus FX504GD i5-8300H, GeForce GTX 1050 Mobile, Seagate Mobile HDD 1TB ST1000LX015-1U7172, TN LED, 1920x1080, 15.6" | Acer Aspire Nitro 5 AN515-54-53Z2 i5-9300H, GeForce GTX 1650 Mobile, WDC PC SN520 SDAPNUW-512G, IPS, 1920x1080, 15.6" | Asus TUF FX505DY R5 3550H, Radeon RX 560X (Laptop), WDC PC SN520 SDAPNUW-256G, IPS, 1920x1080, 15.6" | Lenovo Legion Y7000P-1060 i7-8750H, GeForce GTX 1060 Mobile, Samsung SSD PM981 MZVLB256HAHQ, IPS, 1920x1080, 15.6" | |
|---|---|---|---|---|---|---|
| Power Consumption | -138% | -2% | 7% | 13% | -19% | |
| Idle Minimum * (Watt) | 7 | 24 -243% | 7.2 -3% | 5 29% | 5.2 26% | 4.9 30% |
| Idle Average * (Watt) | 9.9 | 27 -173% | 10.2 -3% | 7 29% | 7.5 24% | 8.1 18% |
| Idle Maximum * (Watt) | 12 | 33 -175% | 10.9 9% | 11 8% | 9.4 22% | 16.5 -38% |
| Load Average * (Watt) | 68.4 | 129 -89% | 93.3 -36% | 89 -30% | 73 -7% | 109.2 -60% |
| Witcher 3 ultra * (Watt) | 94.9 | 176 -85% | 95.8 -1% | 90 5% | 90 5% | 124.6 -31% |
| Load Maximum * (Watt) | 130.9 | 216 -65% | 102.5 22% | 132 -1% | 120.7 8% | 175.2 -34% |
* ... smaller is better
Battery Life
We're able to record 4.5 hours of real-world WLAN use compared to 5.5 hours on the FX505DY when set to the same Balanced profile. We're unsure why there is a wide runtime discrepancy between the two systems other than the possibility of automatic activity running in the background. Either way, results are merely average when compared to the competing Intel-powered Acer Aspire Nitro 5 equipped with the same GTX 1650 GPU where WLAN runtimes can reach over 8 hours. The 48 Wh internal battery is on the small side especially for a gaming laptop.
Charging from empty to full capacity takes 1.5 to 2 hours.
| Asus TUF FX505DT-EB73 R7 3750H, GeForce GTX 1650 Mobile, 48 Wh | Asus Zephyrus S GX502GW i7-9750H, GeForce RTX 2070 Mobile, 76 Wh | Asus FX504GD i5-8300H, GeForce GTX 1050 Mobile, 48 Wh | Acer Aspire Nitro 5 AN515-54-53Z2 i5-9300H, GeForce GTX 1650 Mobile, 57 Wh | MSI GF63 8RC i5-8300H, GeForce GTX 1050 Mobile, 51 Wh | Asus TUF FX505DY R5 3550H, Radeon RX 560X (Laptop), 48 Wh | |
|---|---|---|---|---|---|---|
| Battery runtime | -27% | -22% | 64% | -1% | 11% | |
| Reader / Idle (h) | 7.8 | 5.9 -24% | 7.5 -4% | 17.4 123% | 9.5 22% | 8.7 12% |
| WiFi v1.3 (h) | 4.8 | 3.7 -23% | 3.7 -23% | 8.1 69% | 5.5 15% | 5.5 15% |
| Load (h) | 1.5 | 1 -33% | 0.9 -40% | 1.5 0% | 0.9 -40% | 1.6 7% |
Pros
Cons
Verdict

As with most PCs powered by AMD, a major advantage of the Asus TUF FX505DT is its price. This $900 system comes equipped with a 120 Hz display and a 512 GB NVMe SSD whereas a similarly-priced alternative with a Core i5-9300H CPU and same GTX 1650 GPU would have only a standard 60 Hz display and just half the SSD storage capacity. You get more features for the money without sacrificing much gaming performance and the benefits of a native 120 Hz refresh rate are tangible even if most games can't reach a stable 120 FPS.
Performance at lower resolutions or graphical settings could be better as games become CPU bound far faster on the Ryzen 7 than on an equivalent Core i5. We recommend aiming for 30 FPS or 60 FPS in order to make the most of the Ryzen 7 and GeForce GTX 1650 pairing. If very high frame rates are a priority, then you would be better off with a standard Intel Core i7 and GeForce PC.
As for the chassis itself, Asus could definitely improve upon the pulsing fans when gaming, average battery life, sticky clickpad, or flexible lid. G-Sync would have been a great option here especially since the GTX 1650 tends to run newer games in the 40 to 60 FPS range where G-Sync is at its best. Even with these drawbacks in mind, the FX505DT is still a lightweight and very balanced gaming machine for its budget category not unlike the Zephyrus G GA502DU. Just be sure to avoid the FX505DY at all cost!
Prior to the launch of Ryzen, it was hard to recommend any AMD-powered gaming laptop to even casual gamers. The Asus TUF FX505DT and even Zephyrus G GA502 have made AMD laptops real options again for gamers on smaller budgets.
Asus TUF FX505DT-EB73
- 07/04/2019 v6 (old)
Allen Ngo
Price comparison
