Asus FX503VM (7700HQ, GTX 1060, FHD) Laptop Review

We reviewed the FX502VM last March and found it to be a balanced system with a relatively low price tag. That machine was something of a more affordable ROG GL502VM with some small sacrifices. The Asus FX503VM is essentially the same machine wrapped in a different package. The FX503VM is a plastic thin-and-light that boasts mid-range specs at a budget price (currently USD $1180). In this review, we'll examine whether or not the FX503VM presents a good value for the money.
So what sets the FX503VM apart from its brother, the FX502VM? The case, for one. The FX503VM has an aggressive styling that reflects the higher-end GL503 line. However, the plastic build is the first cut made to bring the budget down. Otherwise, the FX503VM is a sensible update to last year's FX502VM and improves on the look and feel while retaining the same mid-tier internals. Other notebooks that compare to the FX503VM include the Acer Aspire VX15 and V15 Nitro, HP's Omen 15, the Dell Inspiron 15 7577, and the Lenovo Legion Y520. All of these machines have similar components and similar prices.
Asus sells three SKUs of the FX503VM, each of which differs only in its display. One version has a TN panel with similar color properties, while the other (more expensive) model has a 120 Hz IPS display with a wider color gamut. We'll be looking at the "middle-of-the-road" model with a 60 Hz IPS display. Let's dive in.
Case
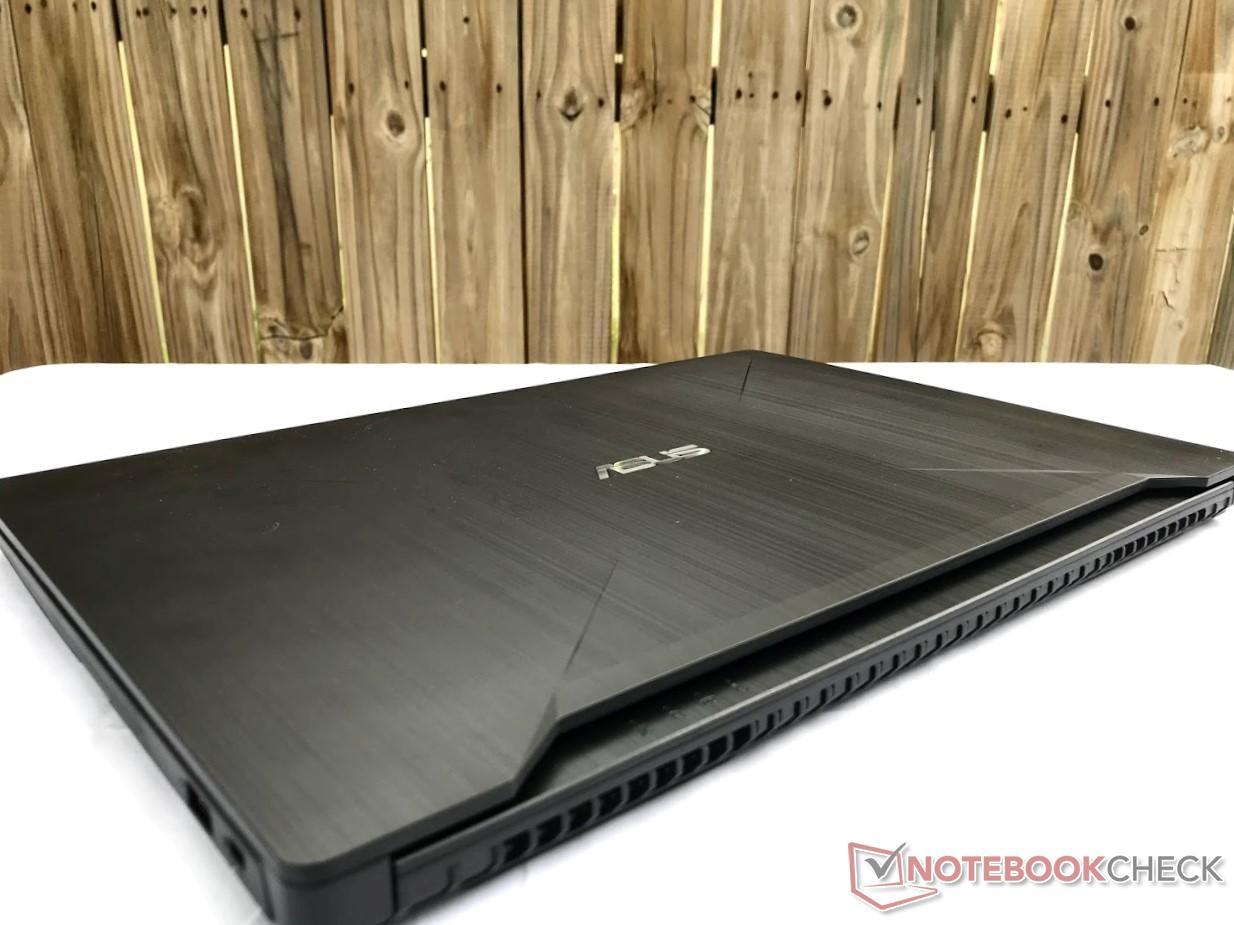
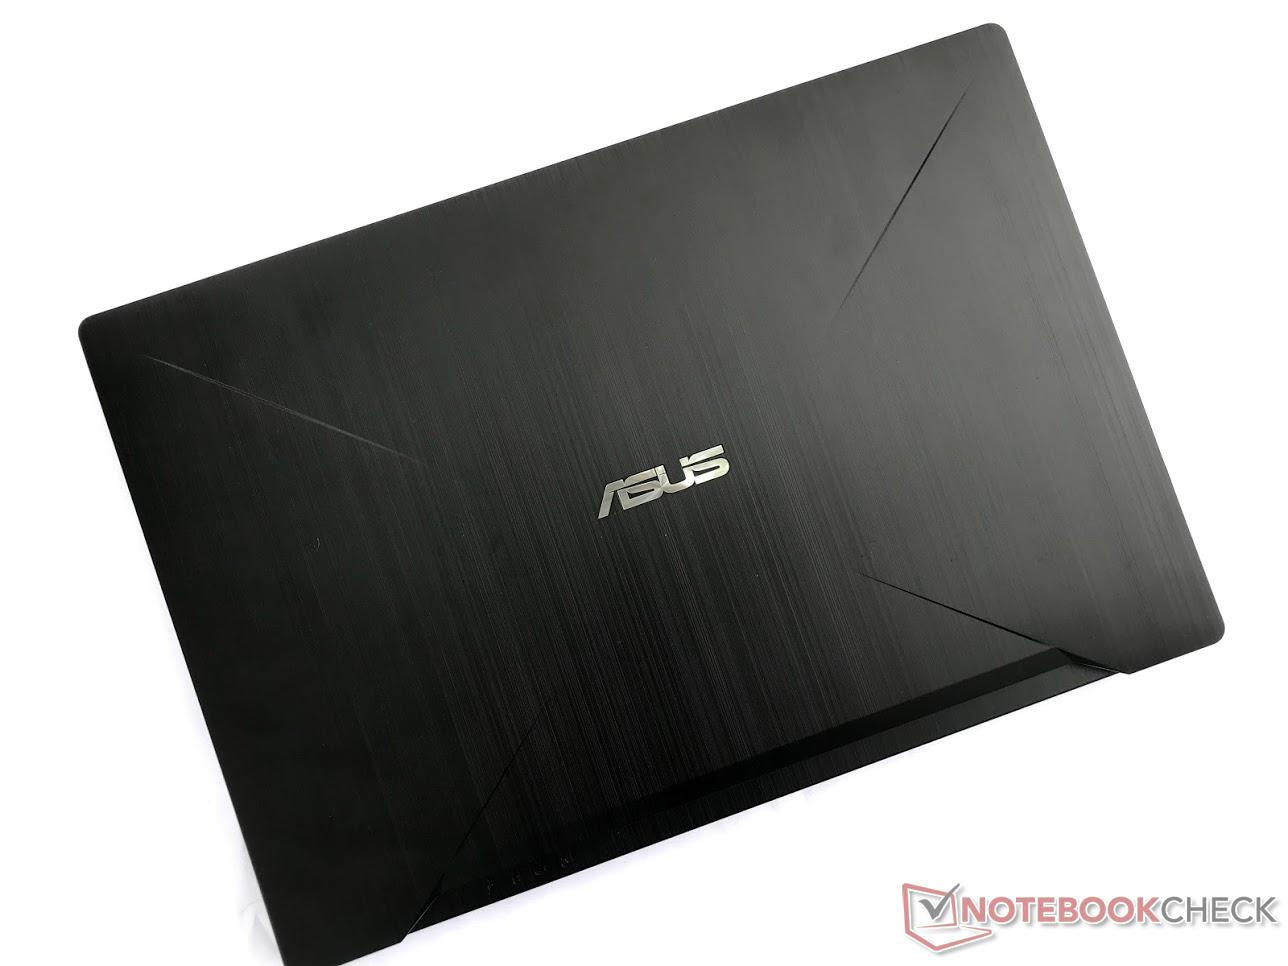
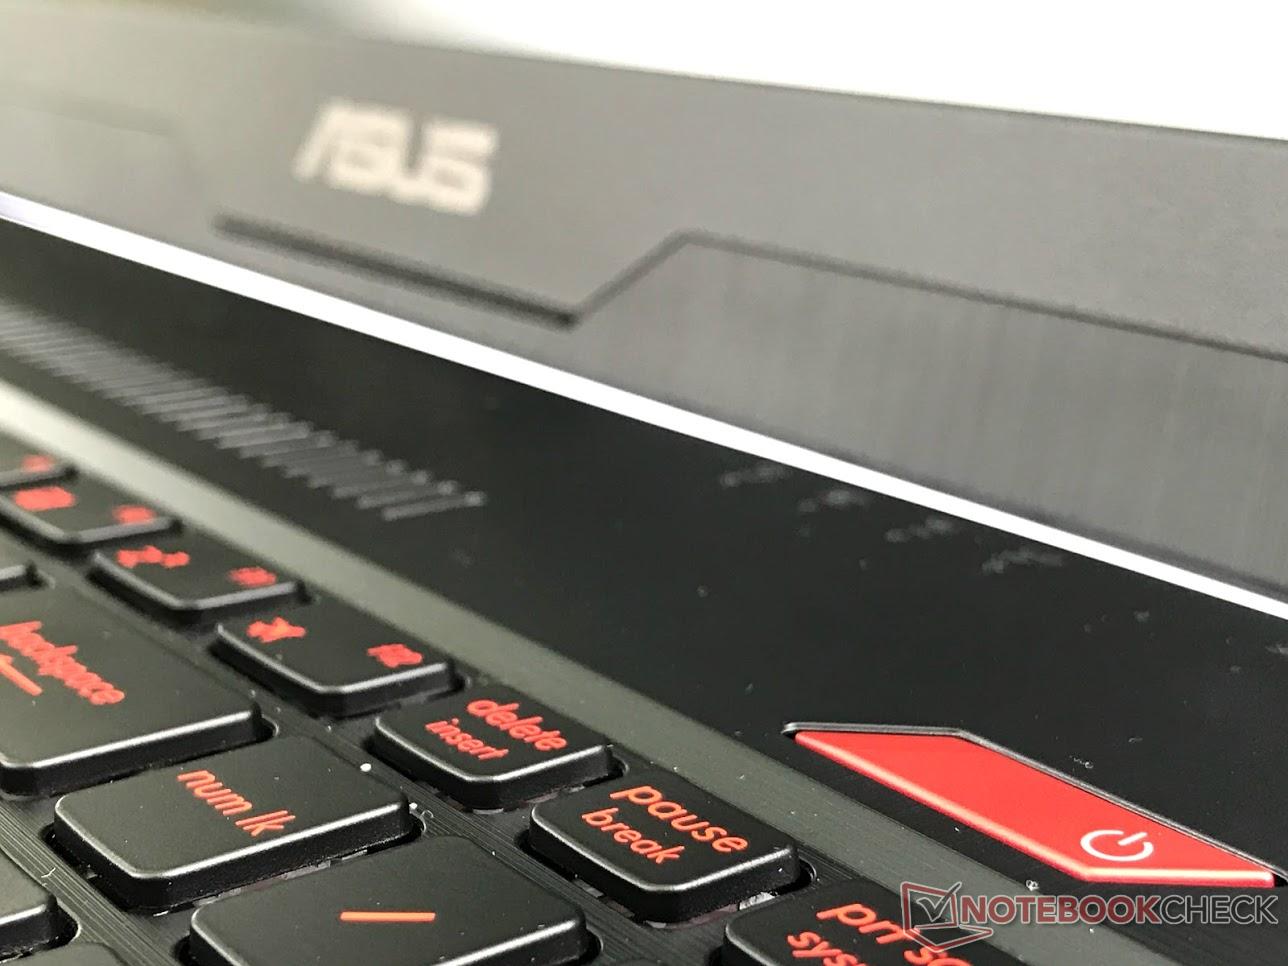
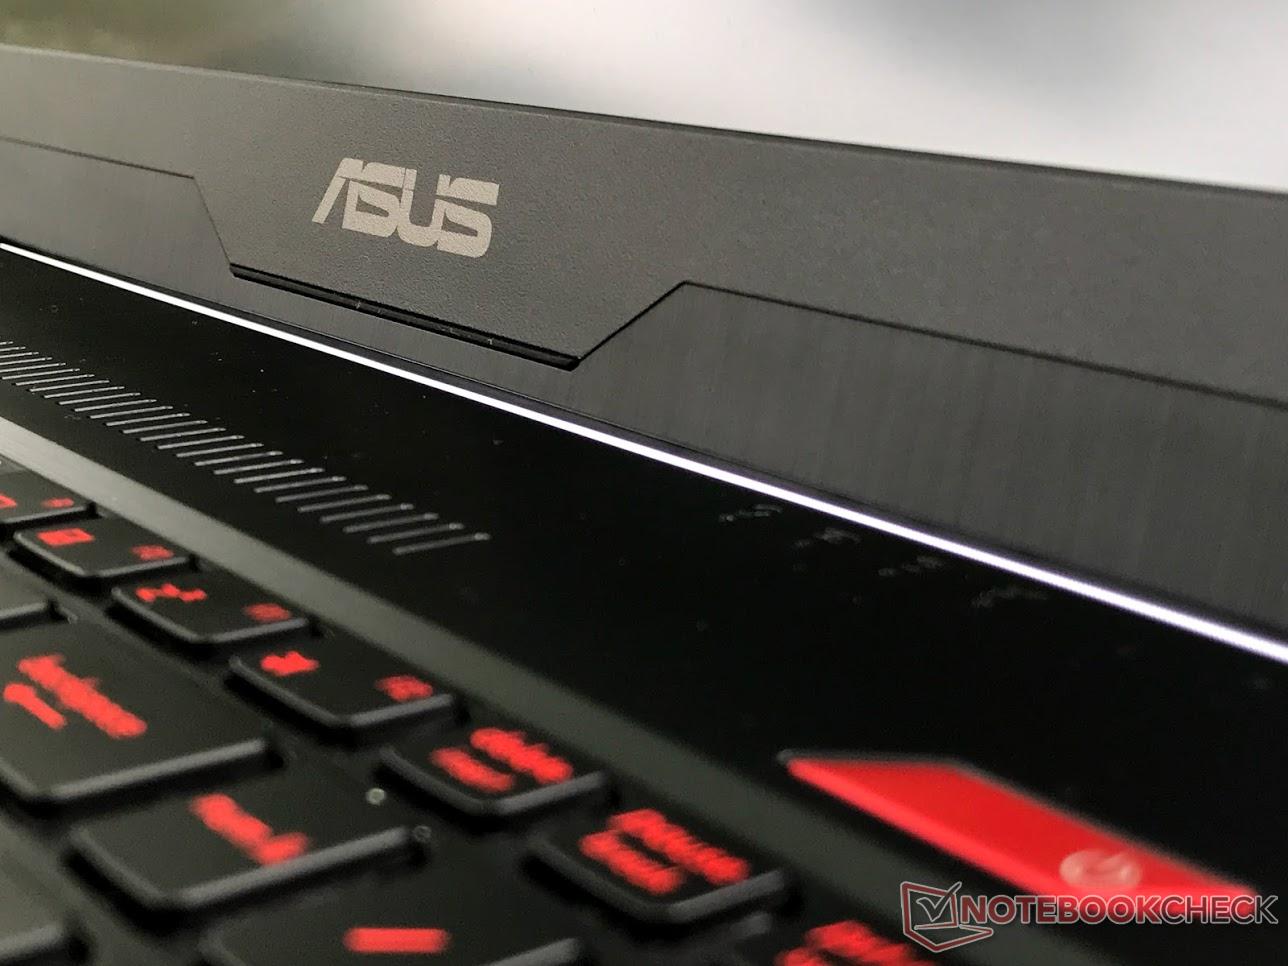
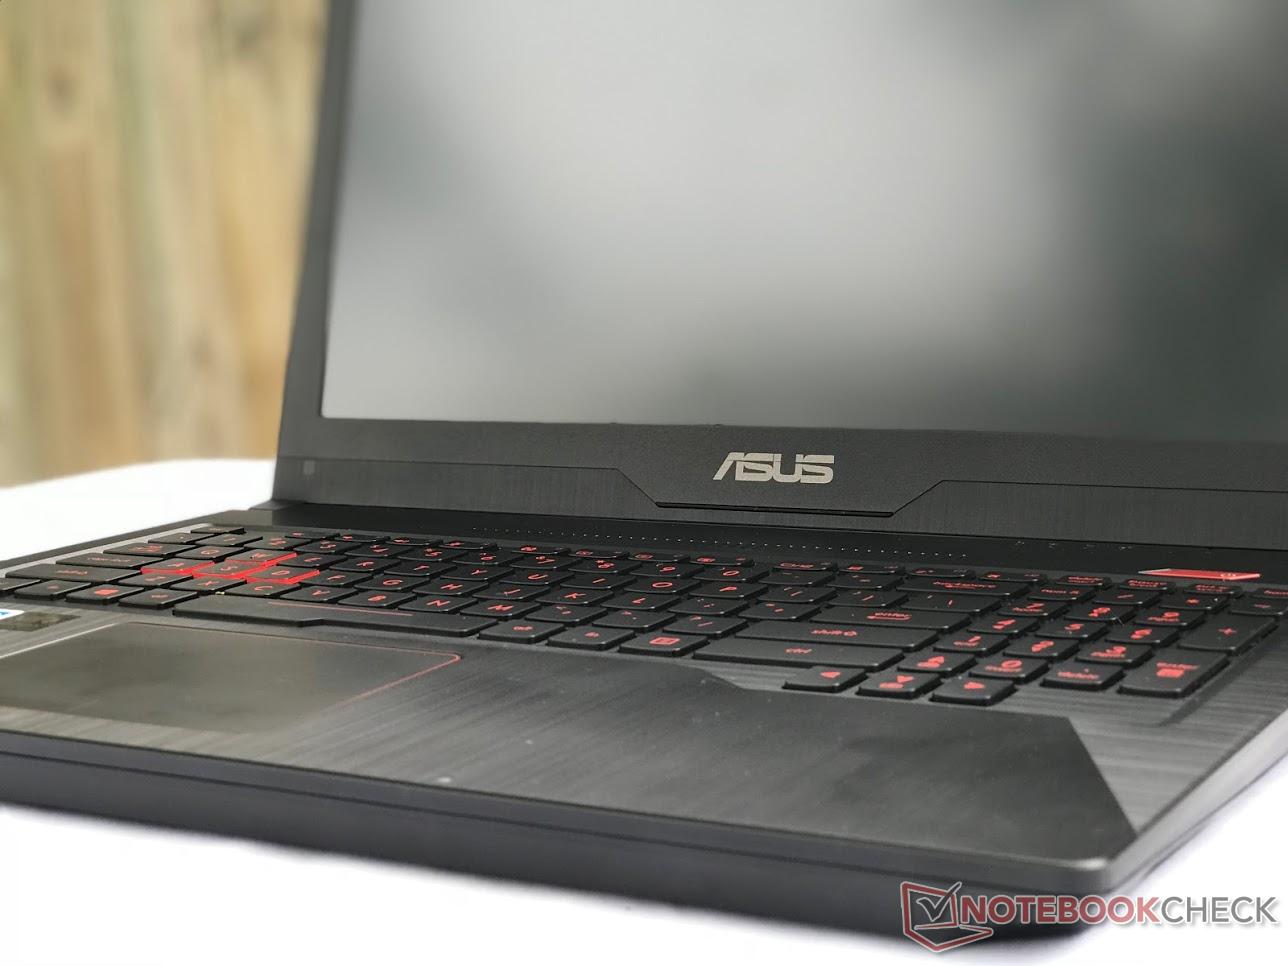
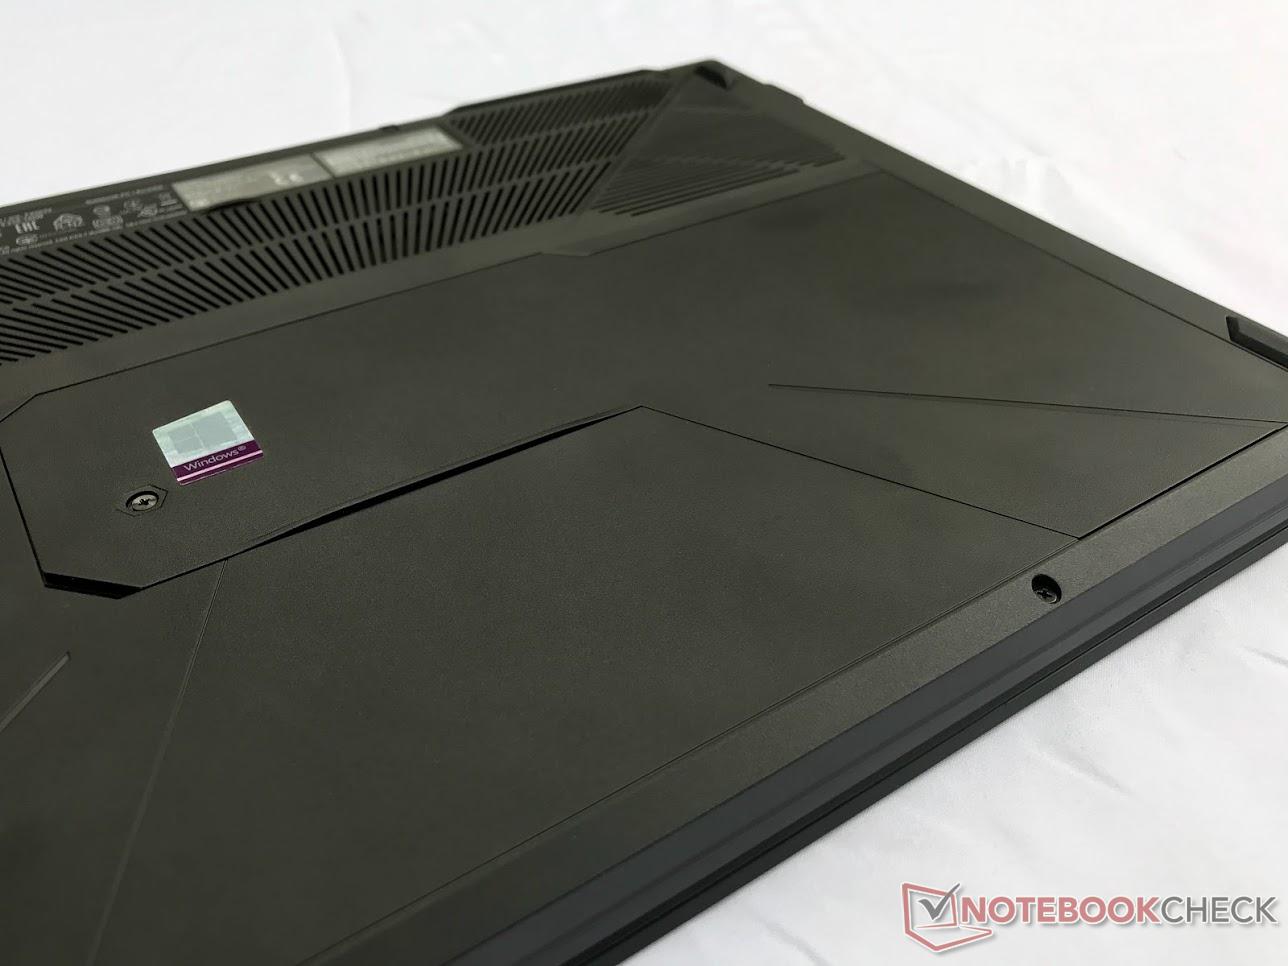
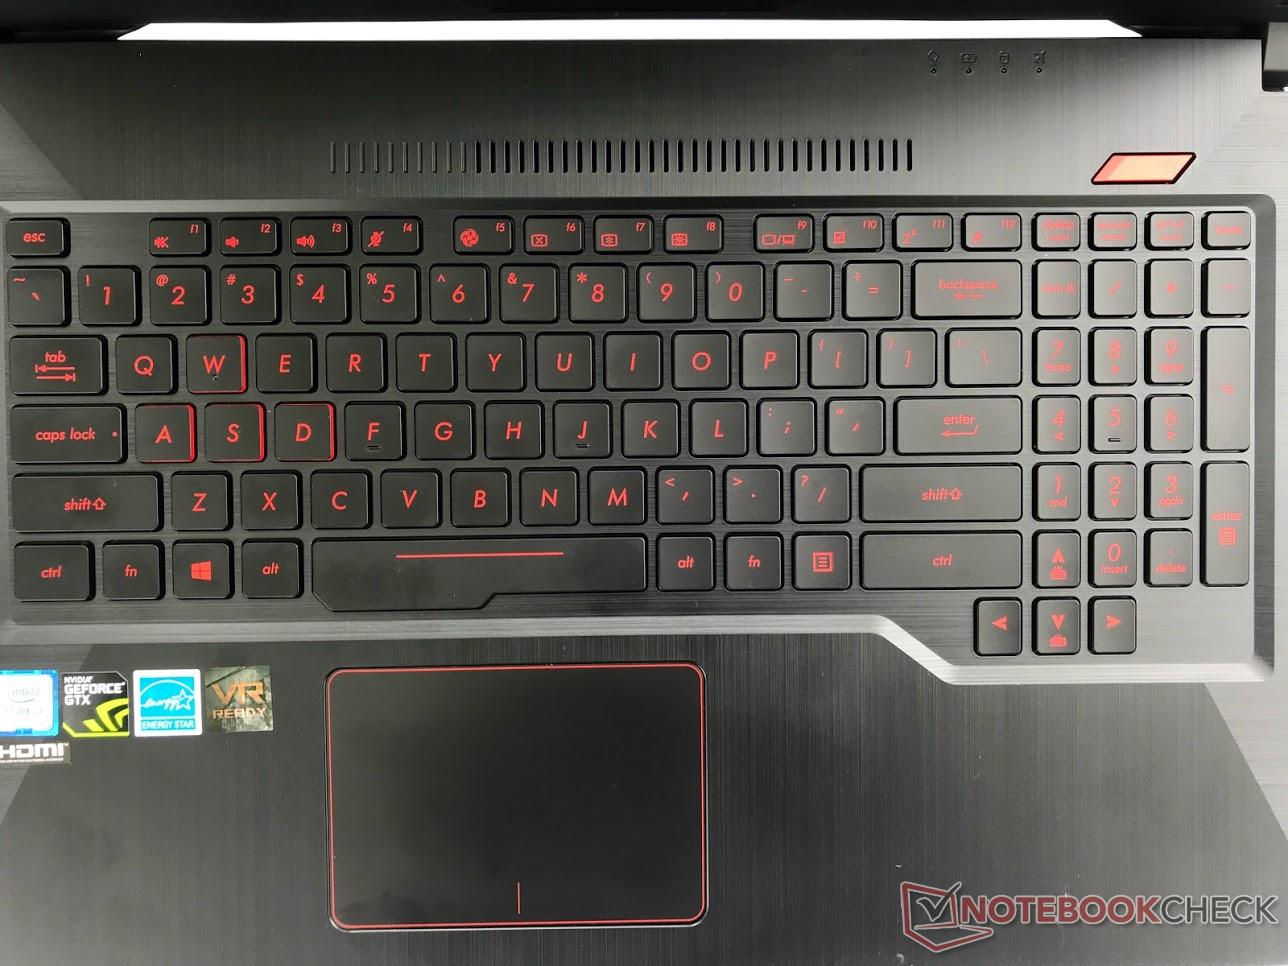
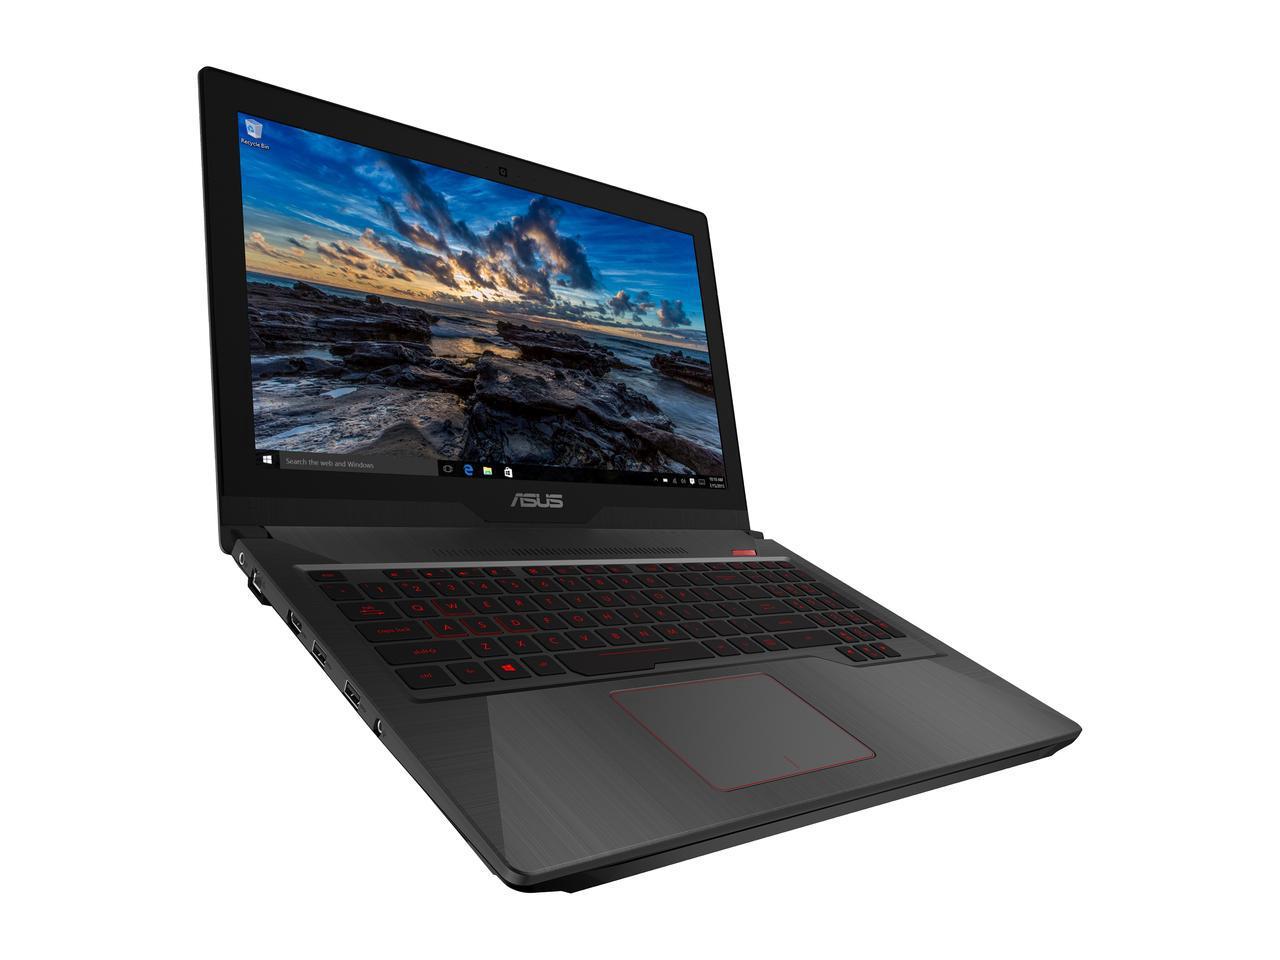
The Asus FX503VM is unapologetically plastic. To that end, the case has a faux-brushed metal finish to it that looks striking and works well to hide the plastic build from a distance. One thing it cannot hide, however, is fingerprints. Smudges can easily mar the matte black color but can be wiped away easily with a cloth. The lid has two small 45°-angled bevels pointing into the upper left and right corners that give the device a subtle bit of flair and are highly reminiscent of the ROG Zephyrus. The interior continues this design language with changes in the direction of the brushed finish and a sunken keyboard deck. The overall effect looks nice without being too overblown; the FX503VM is subtle, yet attractive.
Owing to plastic shell, the case itself is somewhat pliable. There is some minor flex across the keyboard deck that occurs under direct pressure and isn't present while typing. The bottom of the case likewise will only bend under intentional strain. The display lid, however, is thin and can easily be twisted and warped. On the plus side, the hinges are well-tuned: one-handed opening is possible, and the screen stays in place while typing. The lid can be opened to about 135°.Seams around the chassis are even, save for the area around the power and Ethernet connections. The display bezels are also not entirely flush with the panel, especially in the middle of the bottom side.
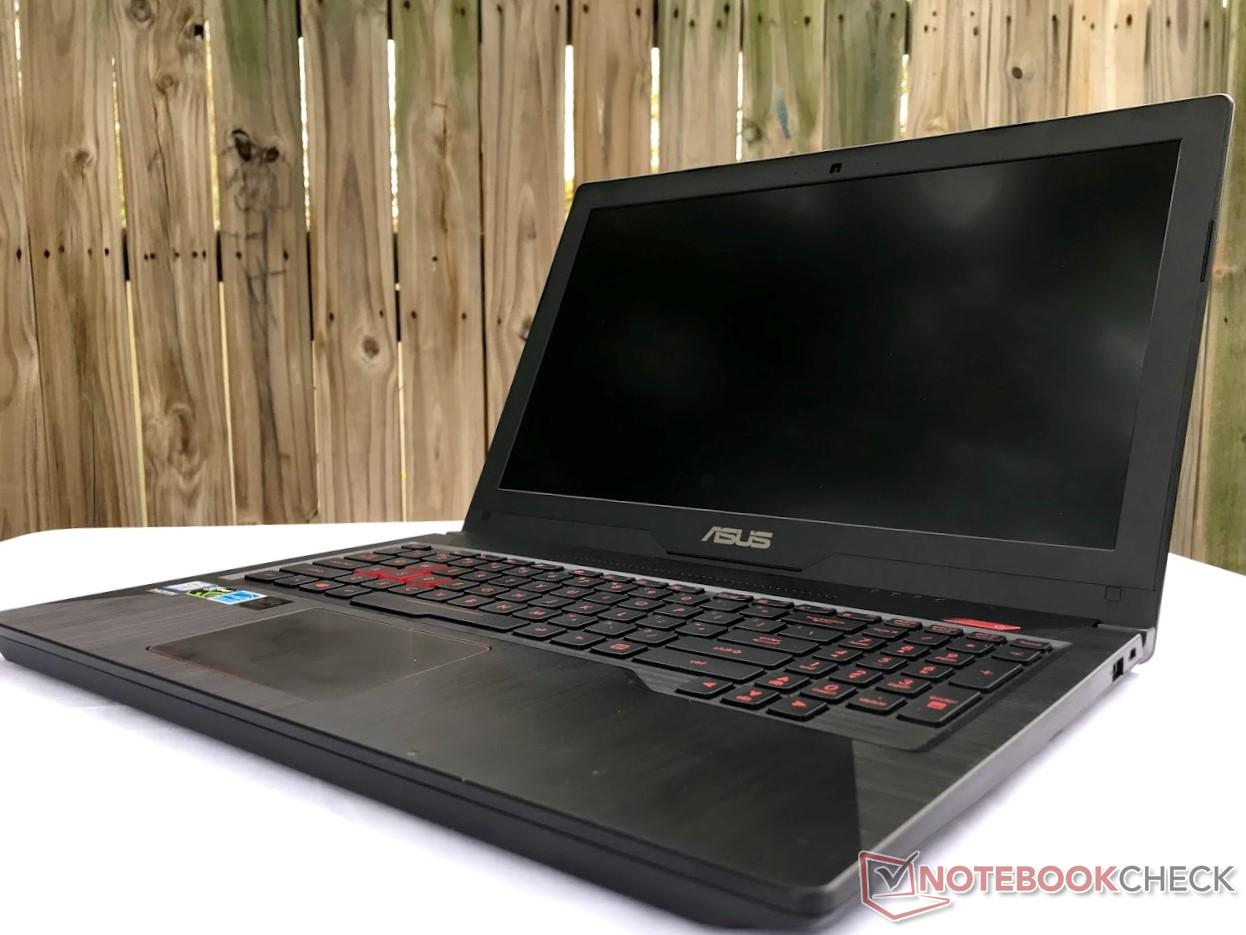
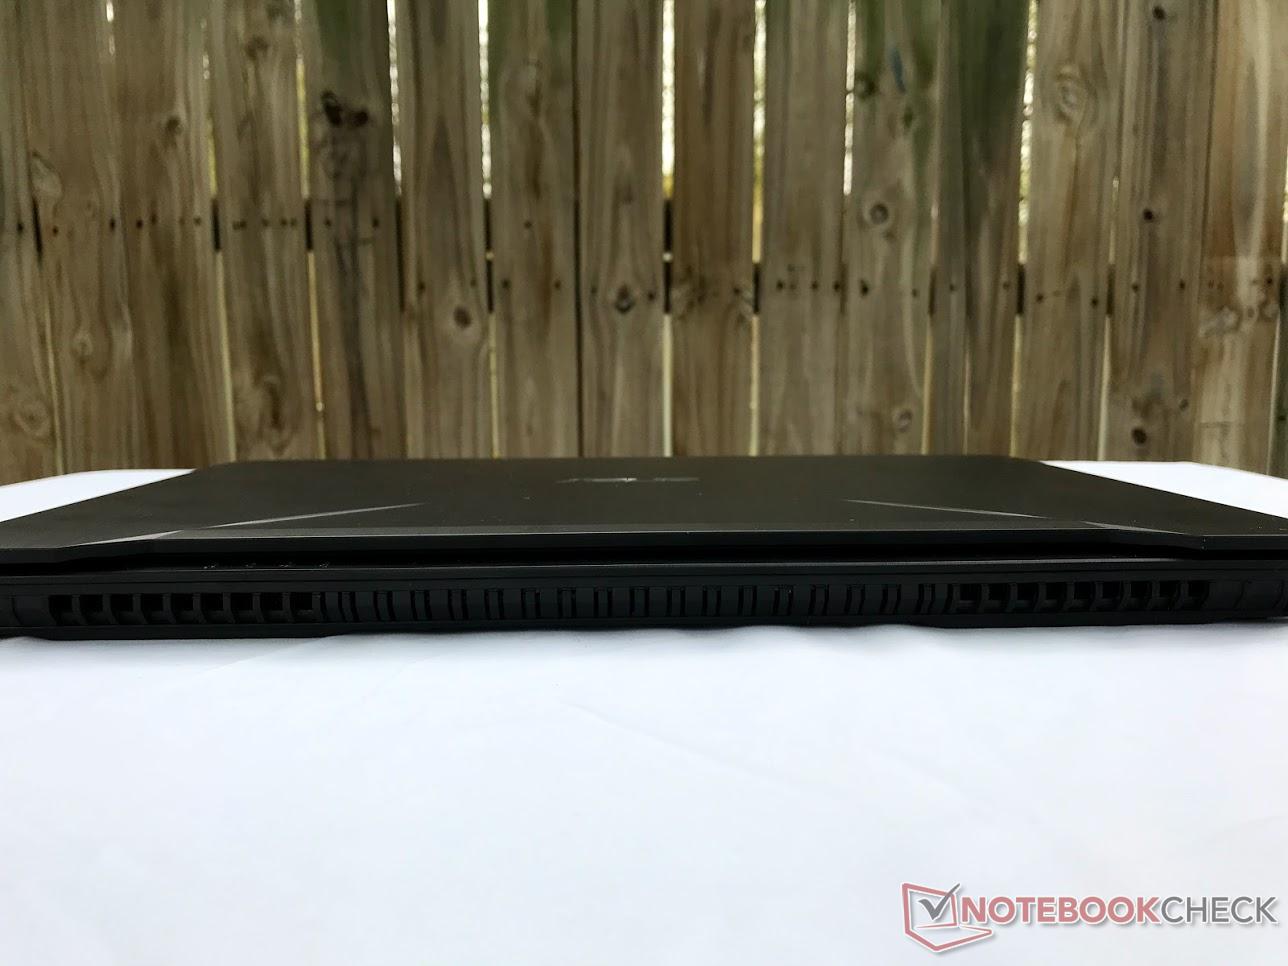
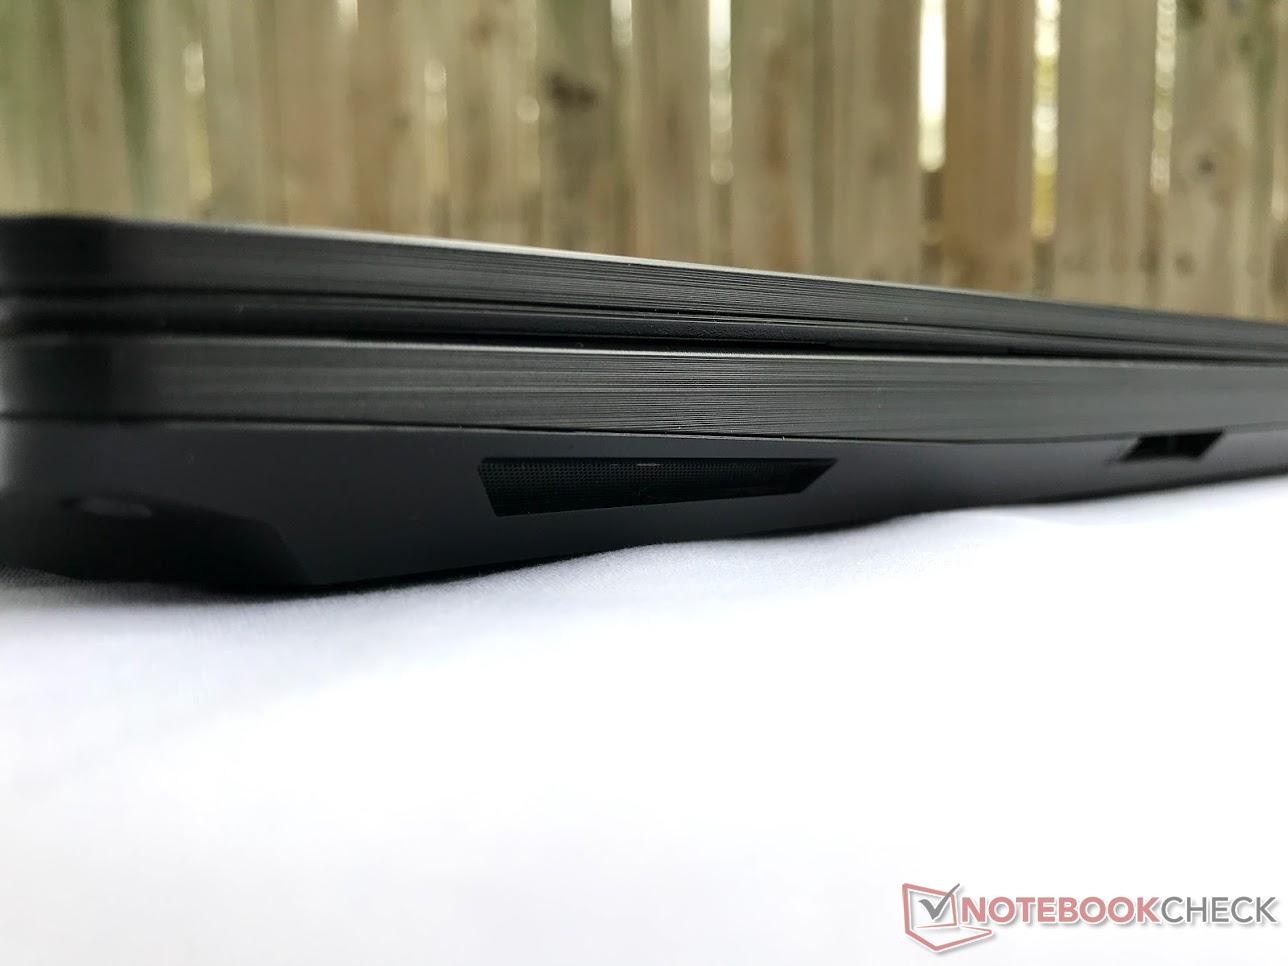
At 24 mm thick, the FX503VM can easily be considered a thin-and-light notebook. Our review machine also has a smaller footprint than most competing devices and is one of the lightest laptops in this category. The final result attempts to bridge the gap between price and portability and mostly succeeds. However, as we will see later in the review, the thin profile comes at the cost of increased heat and fan noise.
Connectivity
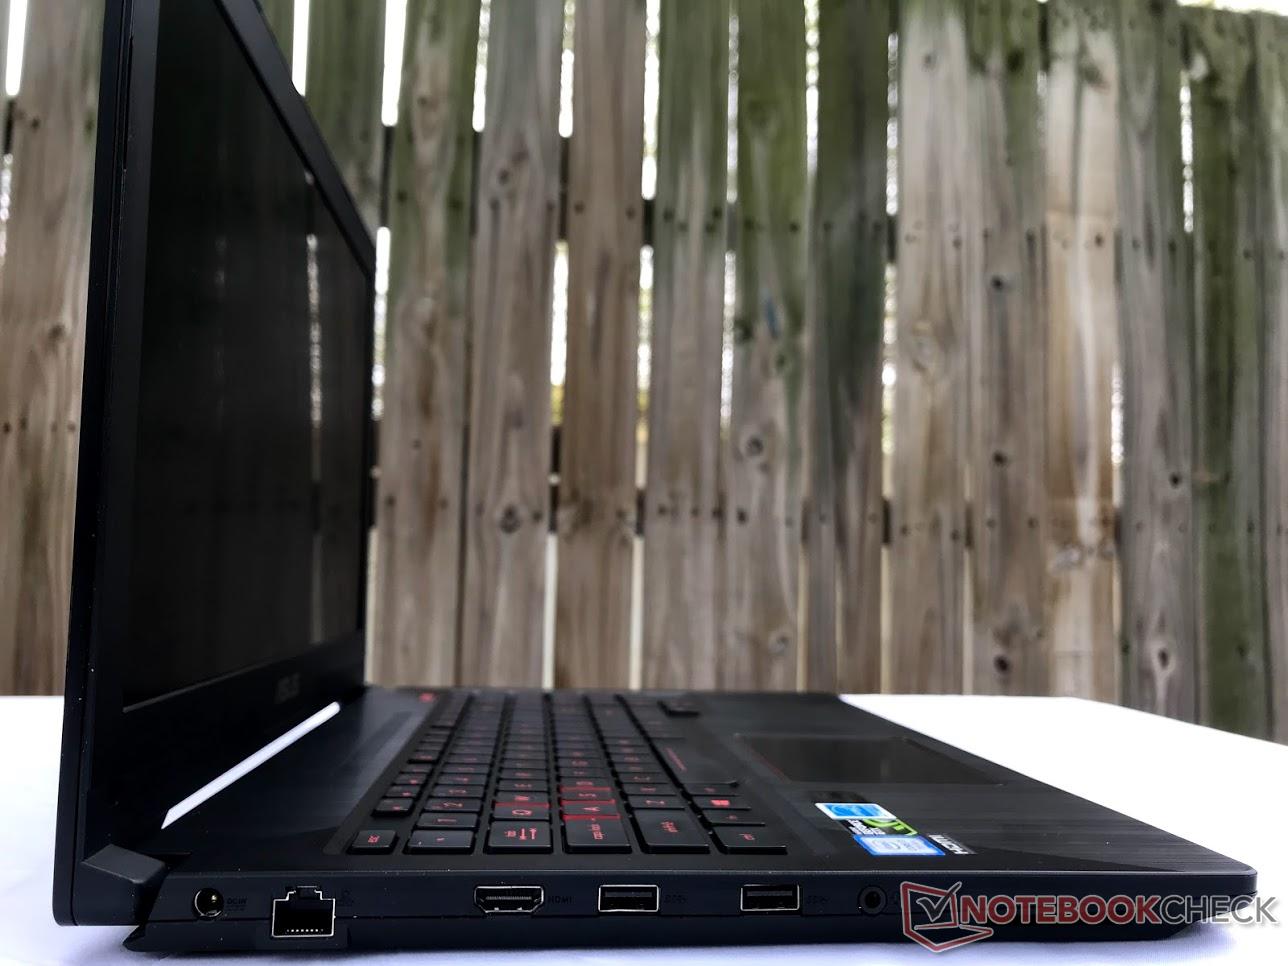
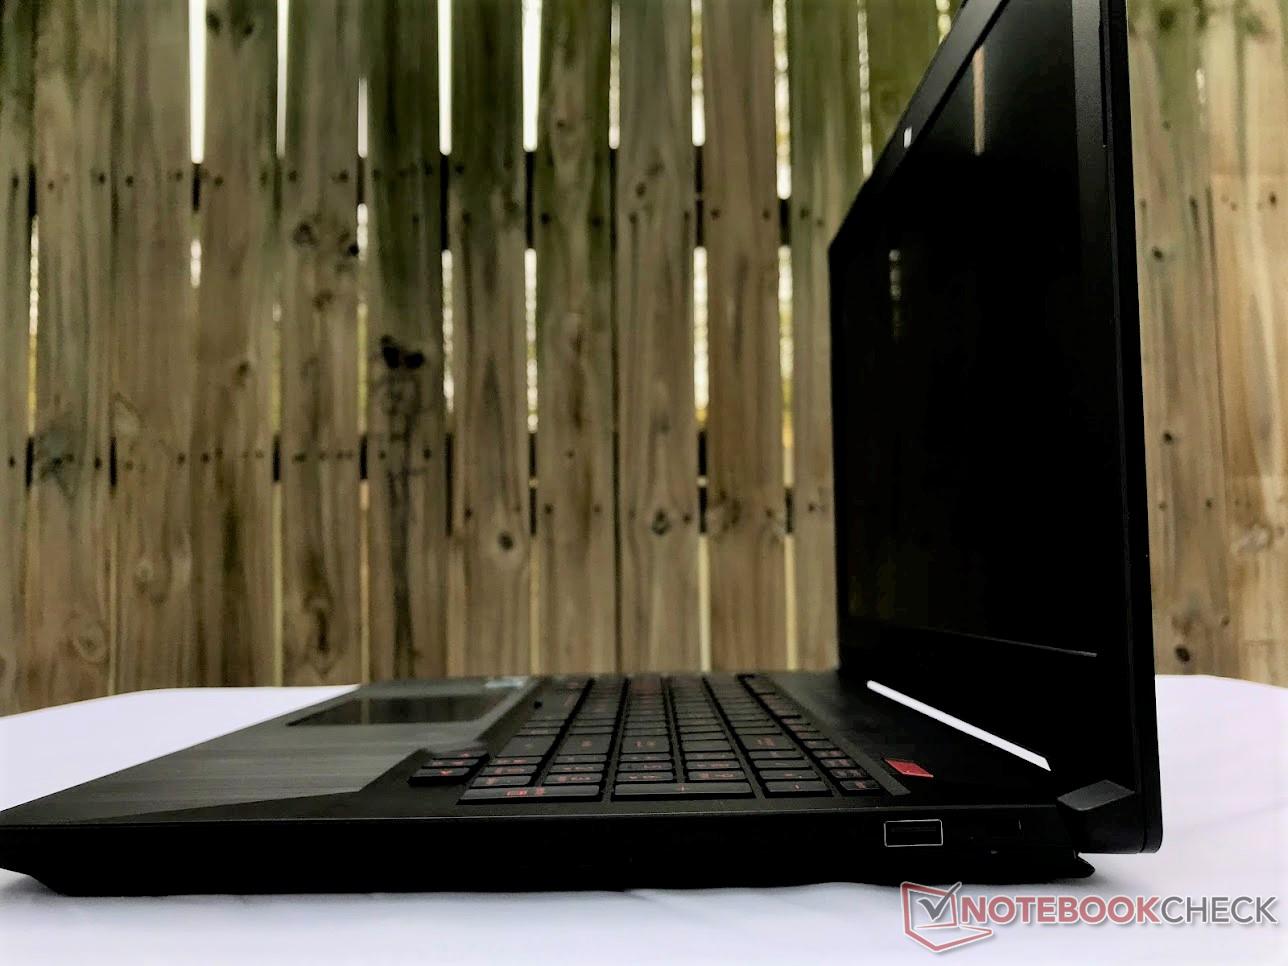
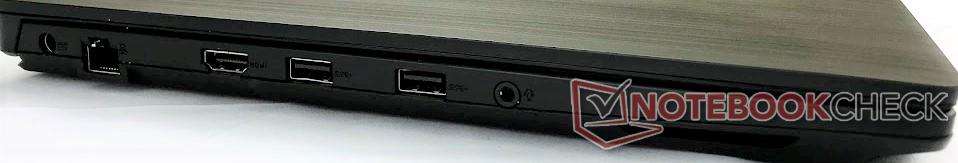
Port selection is standard. Gigabit Ethernet, two USB 3.0 Type-A ports, an HDMI 2.0 port, and a combo audio in/out port sit on the left side. On the right sits a single USB 3.0 Type-A port and the SD card reader. USB Type-C is sadly absent, and with it, Thunderbolt 3. Most modern gaming laptops now include at least a single USB Type-C port. However, the basics are here, and users should find I/O adequate.

SD Card Reader
The performance of the SD card reader matches that of the older FX502VM and is about average for a mid-tier gaming notebook. In our JPG copy test, the Toshiba Exceria Pro SDXC 64 GB UHS-II averaged about 77 MB/s, which should be adequate for most users. The slot is full-sized, allowing for complete insertion, and there is a spring mechanism for easy extrication.
| SD Card Reader | |
| average JPG Copy Test (av. of 3 runs) | |
| Average of class Gaming (20.9 - 210, n=54, last 2 years) | |
| Asus FX502VM-AS73 (Toshiba Exceria Pro SDXC 64 GB UHS-II) | |
| HP Omen 15-ce002ng (Toshiba Exceria Pro SDXC 64 GB UHS-II) | |
| Asus FX503VM-EH73 (Toshiba Exceria Pro SDXC 64 GB UHS-II) | |
| Dell Inspiron 15 7000 7577 (Toshiba Exceria Pro SDXC 64 GB UHS-II) | |
| Acer Aspire VX5-591G-75C4 VX15 | |
| Acer Aspire VN7-593G-73HP V15 Nitro BE | |
| maximum AS SSD Seq Read Test (1GB) | |
| Average of class Gaming (25.5 - 261, n=51, last 2 years) | |
| HP Omen 15-ce002ng (Toshiba Exceria Pro SDXC 64 GB UHS-II) | |
| Asus FX502VM-AS73 (Toshiba Exceria Pro SDXC 64 GB UHS-II) | |
| Asus FX503VM-EH73 (Toshiba Exceria Pro SDXC 64 GB UHS-II) | |
| Dell Inspiron 15 7000 7577 (Toshiba Exceria Pro SDXC 64 GB UHS-II) | |
| Acer Aspire VX5-591G-75C4 VX15 | |
| Acer Aspire VN7-593G-73HP V15 Nitro BE | |
Communication
Wireless speeds echo those of the SD card reader: average but adequate. Transmit and receive speeds are in line with most devices at this price point. Most users will find no complaint with the wireless performance of the FX503VM, and the inclusion of a Gigabit Ethernet jack is a good bonus for those that may need faster speeds. Wireless signals were reliable during our testing period with no dropped connections or other unwarranted hiccups.
Maintenance & Warranty
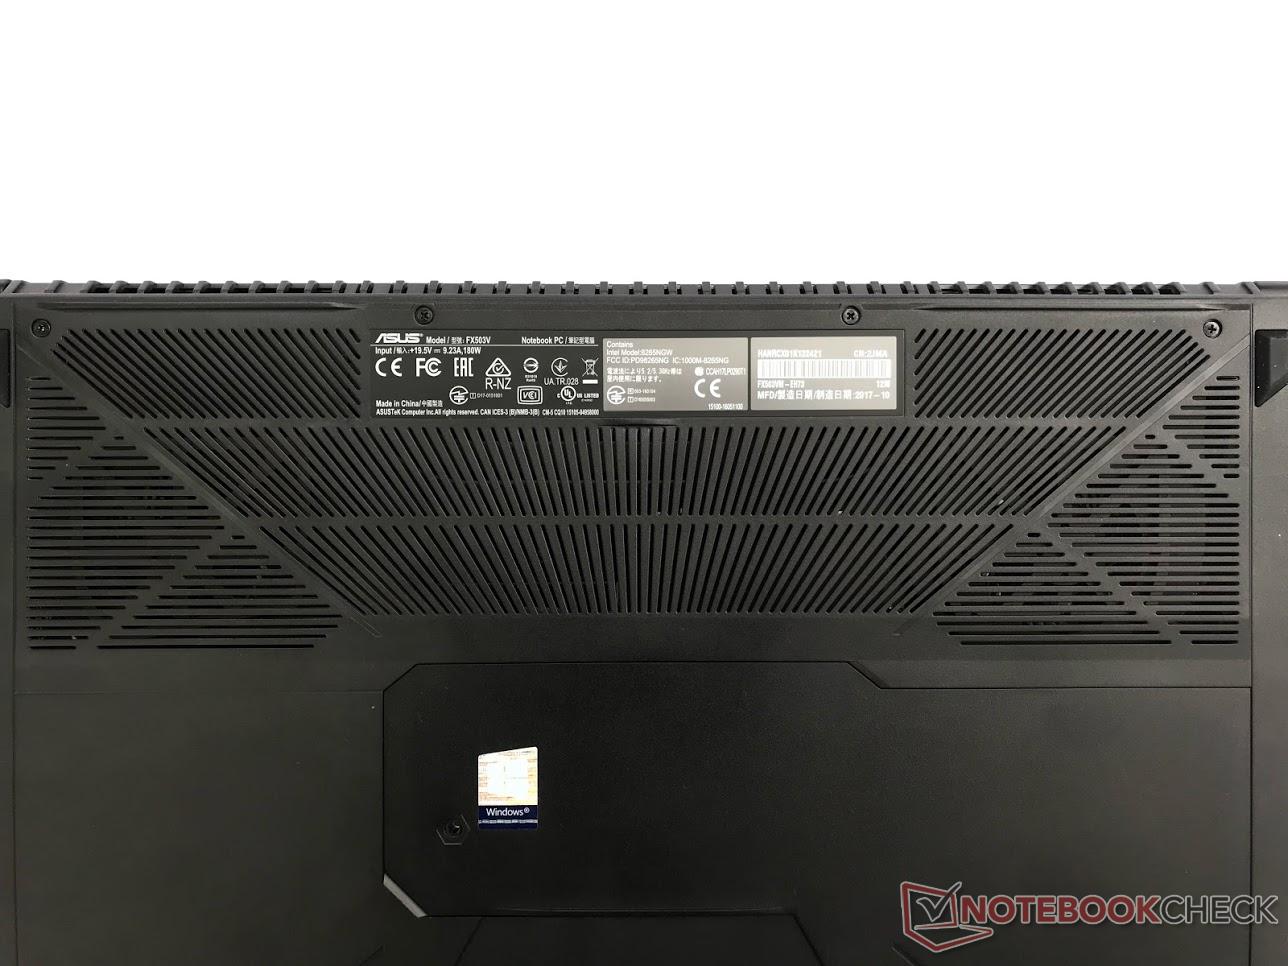
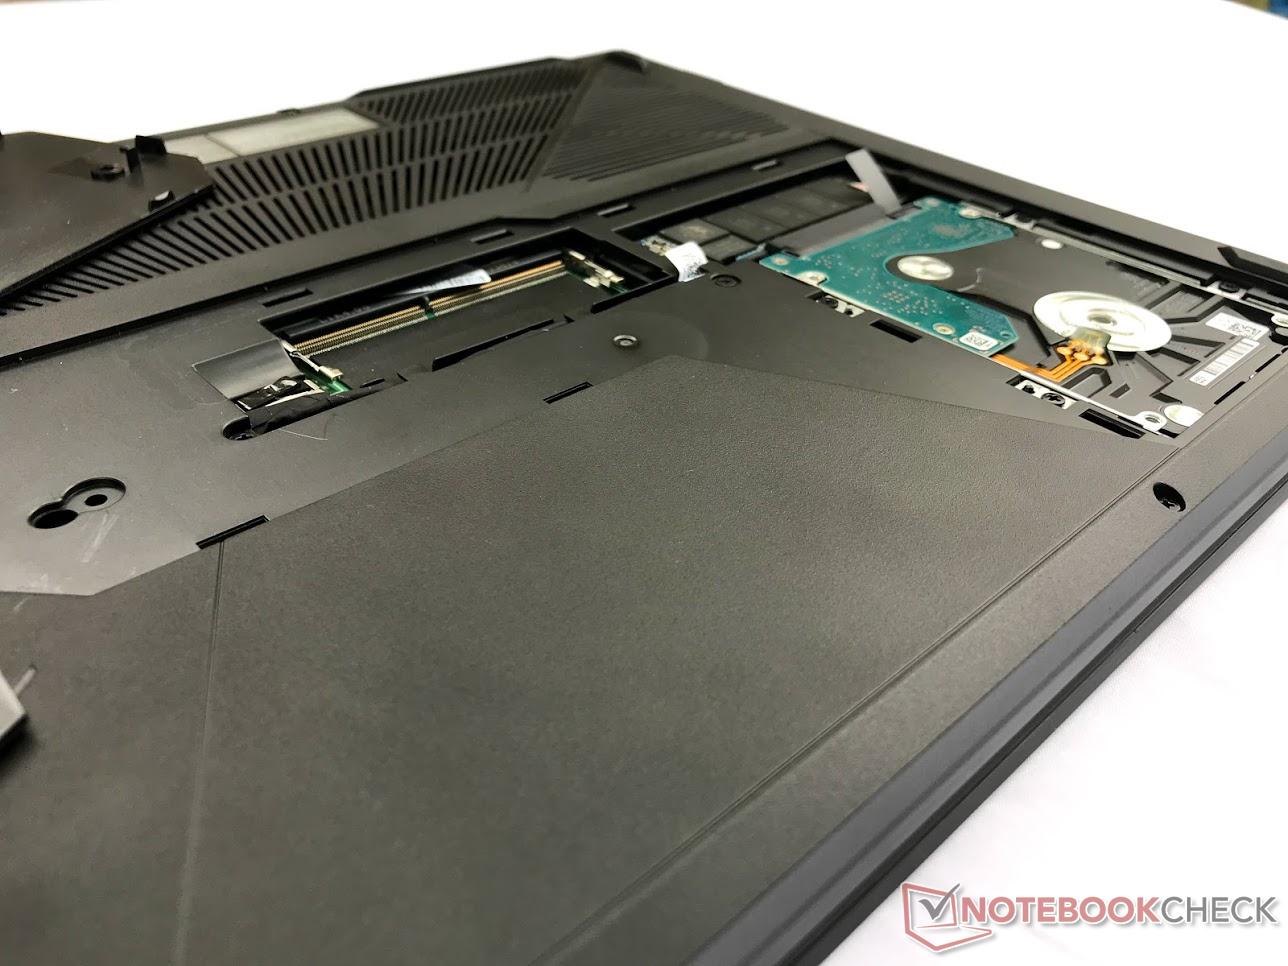
The FX503VM takes several design cues from Asus's higher-end GL503, and this extends to maintenance options as well. There is a dedicated access hatch held on by a single screw that can be easily pried off. Once inside, users can swap out the 2.5-inch drive, m.2 SSD, and one of the two RAM DIMMs. The rest of the bottom panel can come off after removing nine more screws and unfastening several tight plastic clips. This process will test patience and isn't worth the effort; once inside, there's not much more that can be reached.
The FX503VM comes with a one-year limited warranty from Asus, which is standard at this price range.
Input Devices
Keyboard
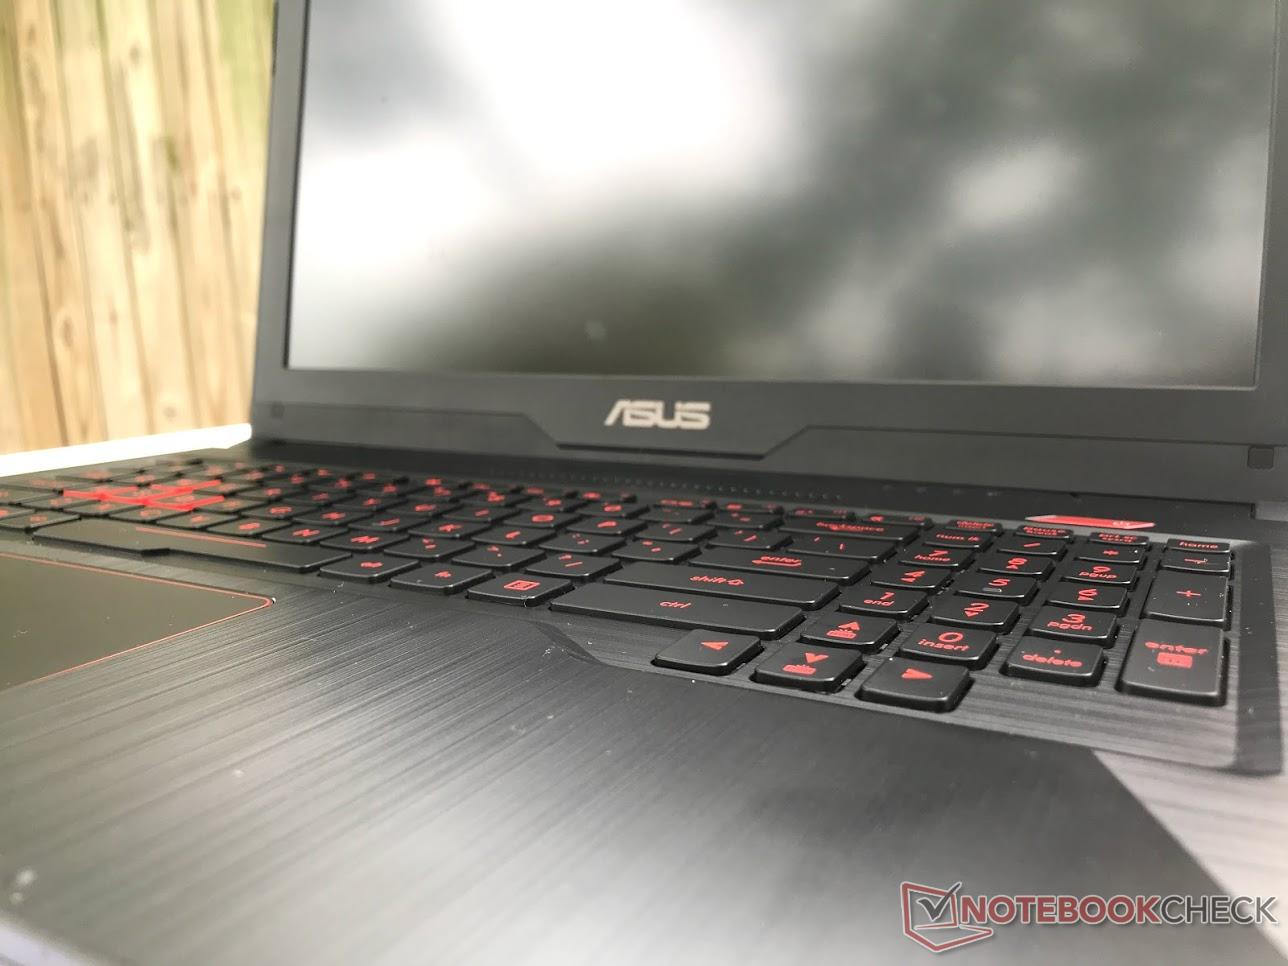
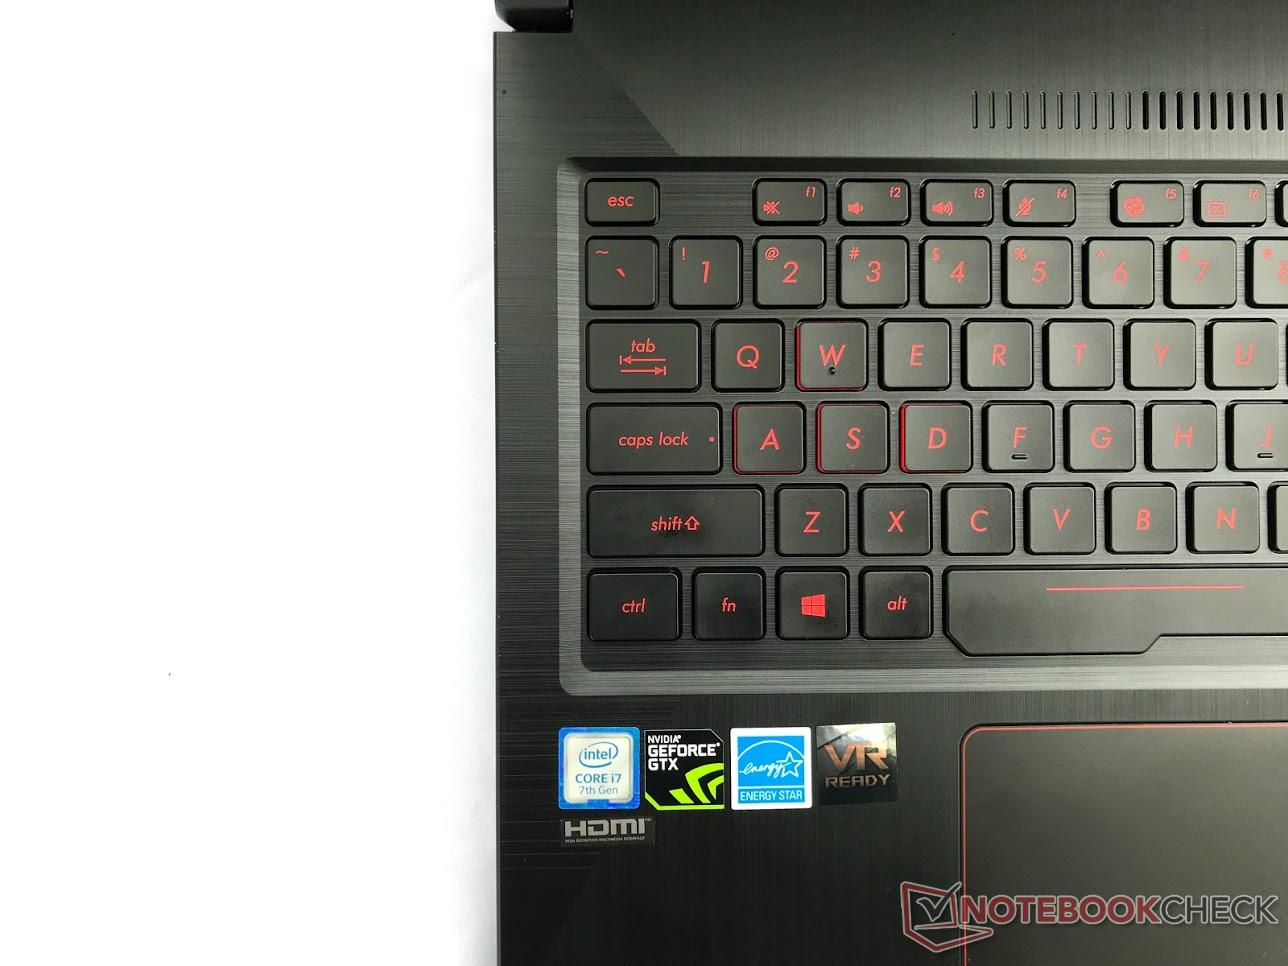
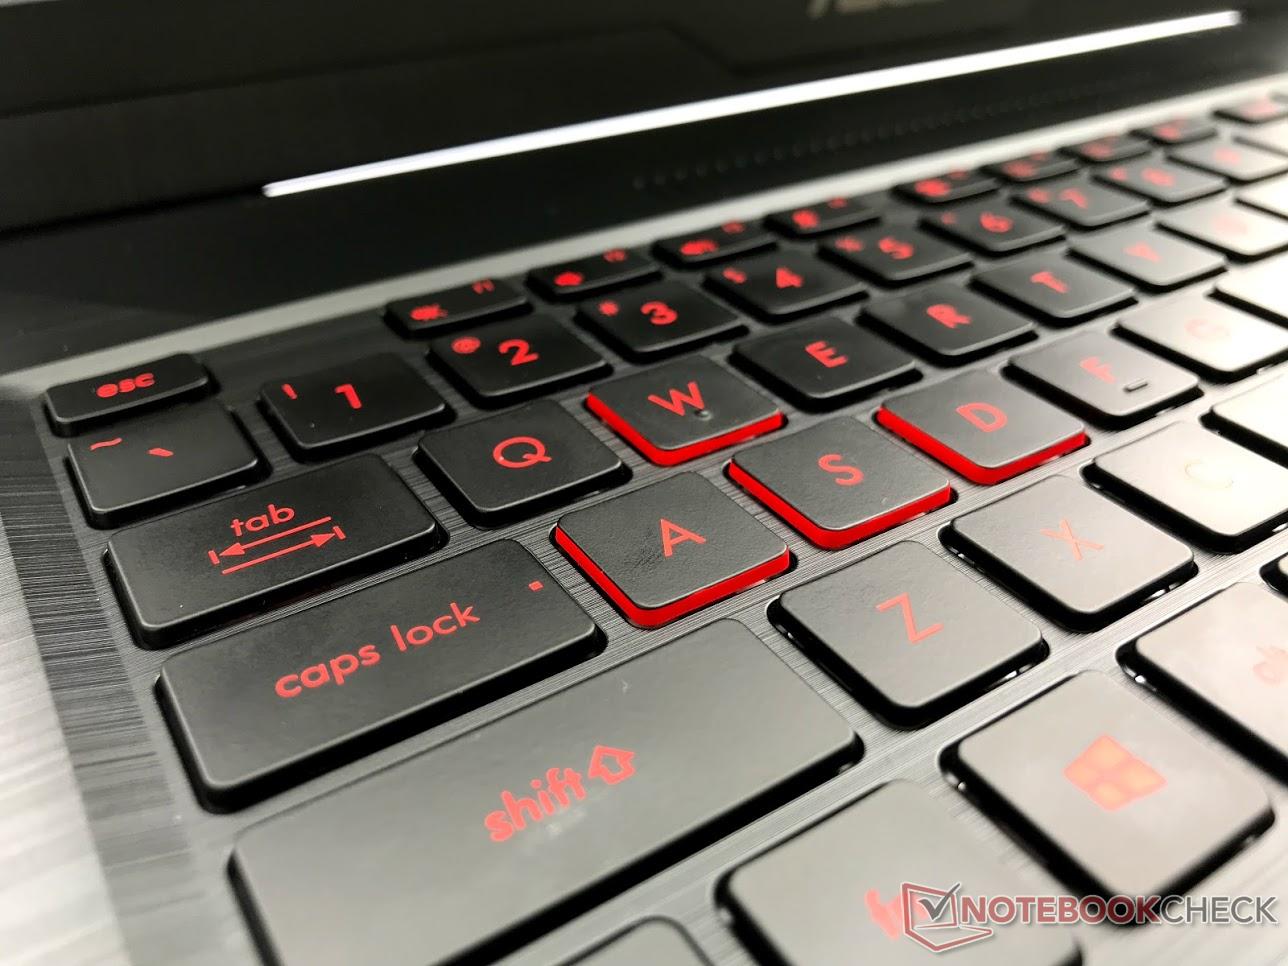
One of the FX503VM's stronger points is its keyboard. Once again, the device is reminiscent of the GL503 line. Travel is good at 1.8 mm and key presses are responsive. Feedback is a tad on the spongy side but not enough so to ruin the overall typing experience. The keycaps are quiet and create virtually no clatter, save for the space bar which emits a small squeak from time to time, mostly if it is hit off-center. Compared to MSI laptops, which are often lauded for their excellent keyboards, the FX503VM falls short. The keyboards of the GS63VR and GF62VR are notable examples of firm feedback that lends to a desirable typing experience, and this Asus device just can't keep up.
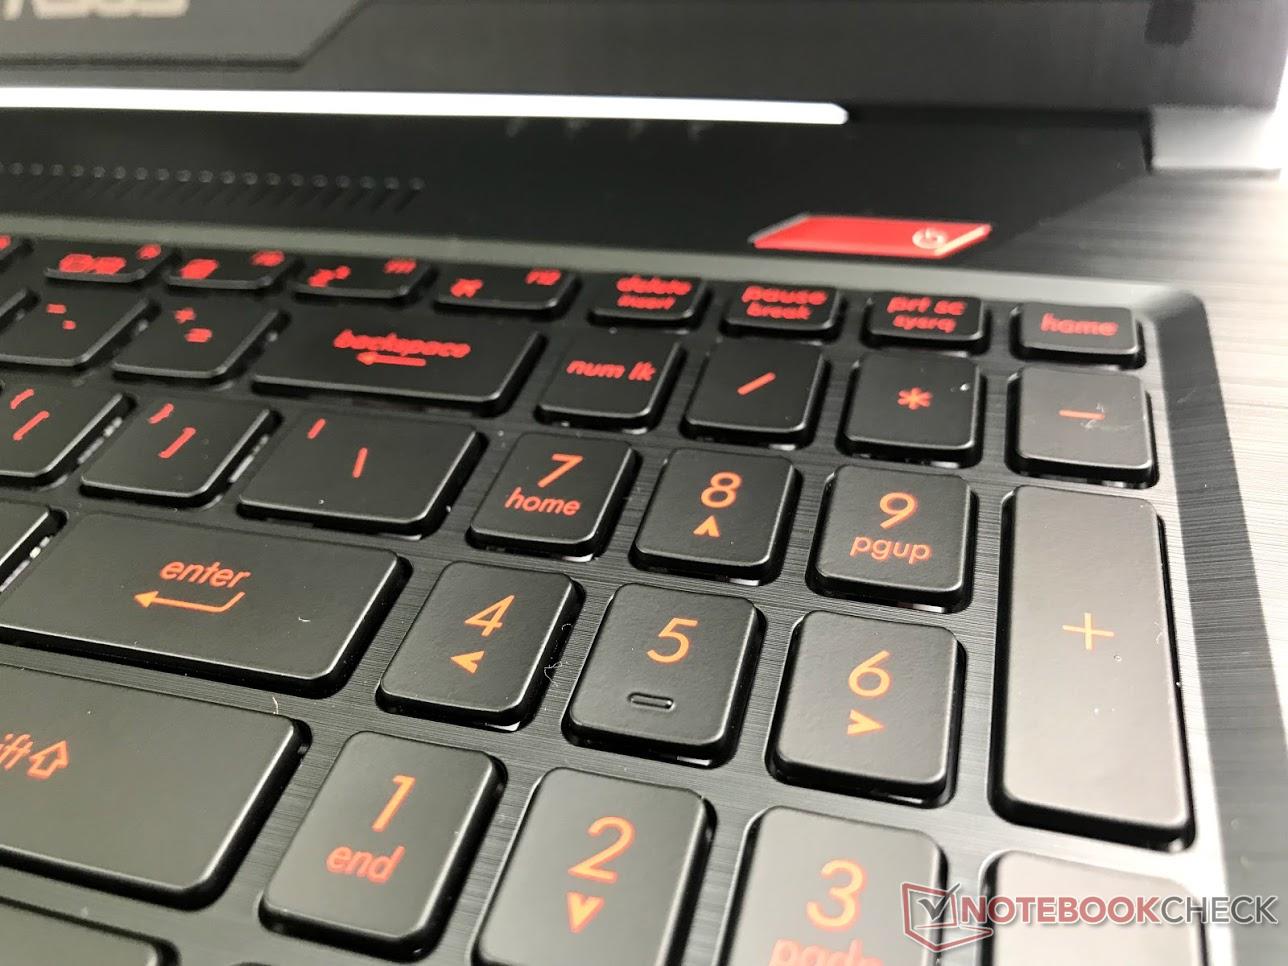
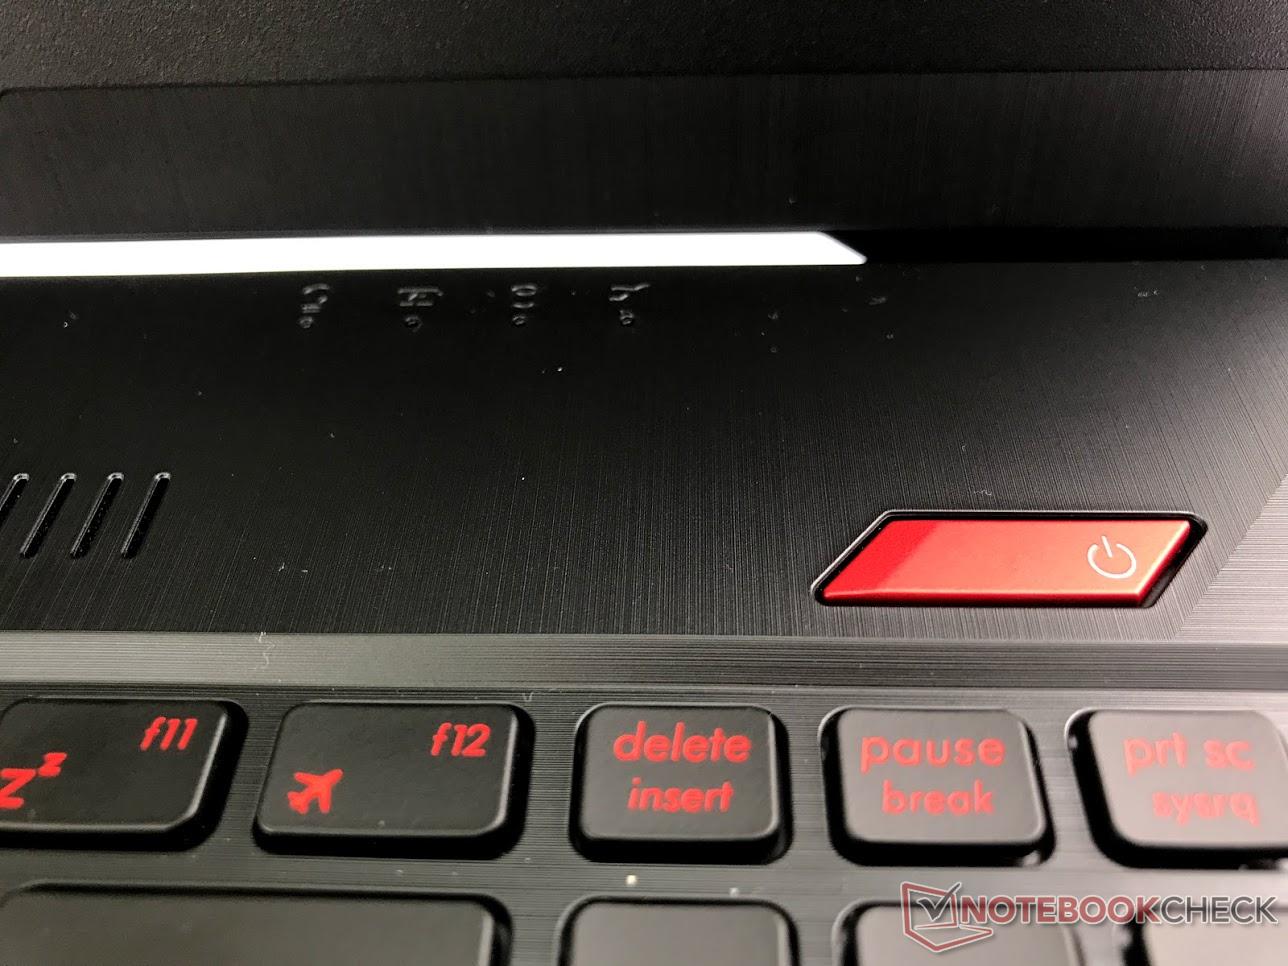
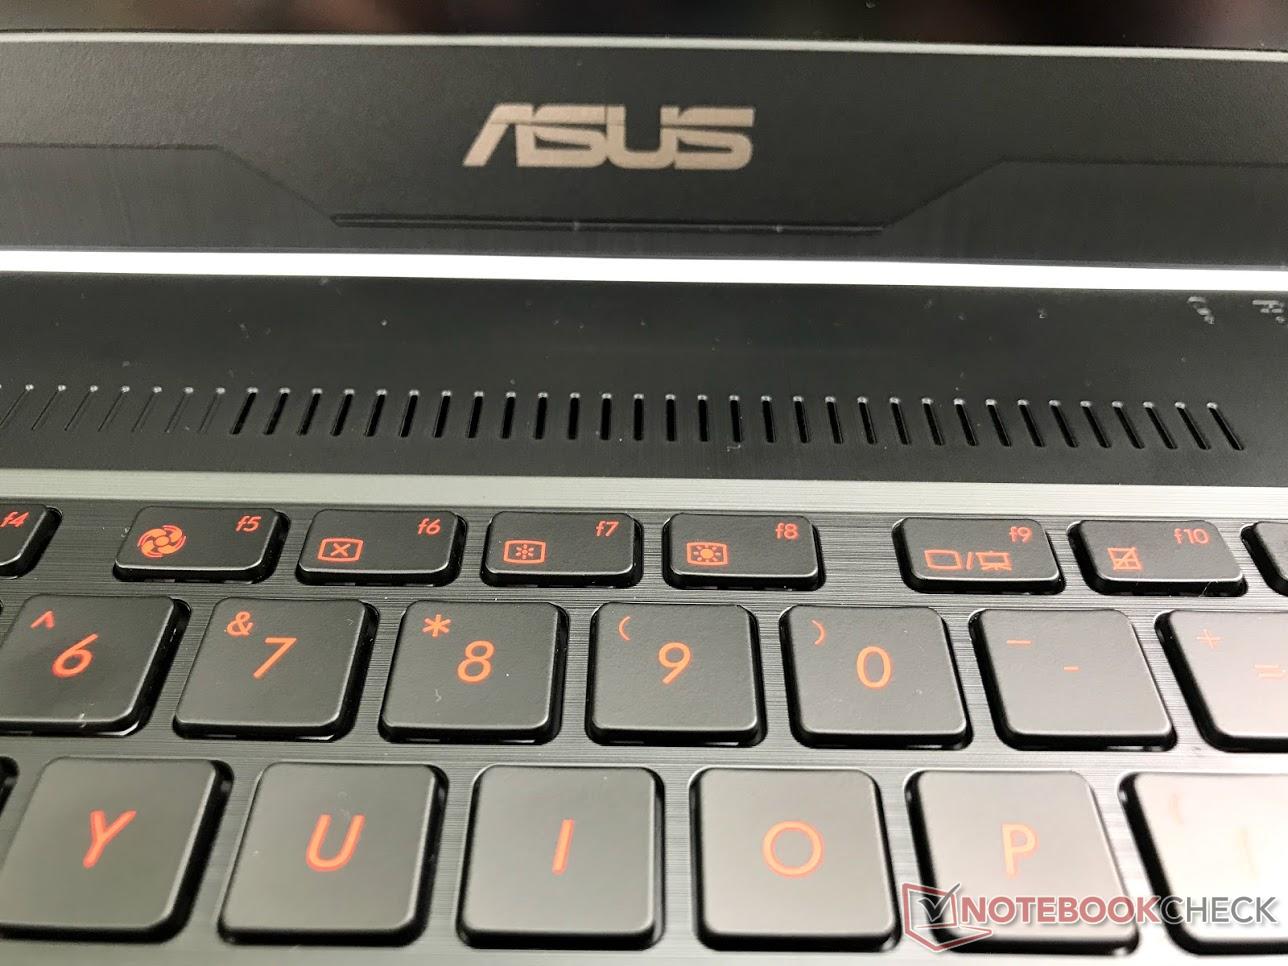
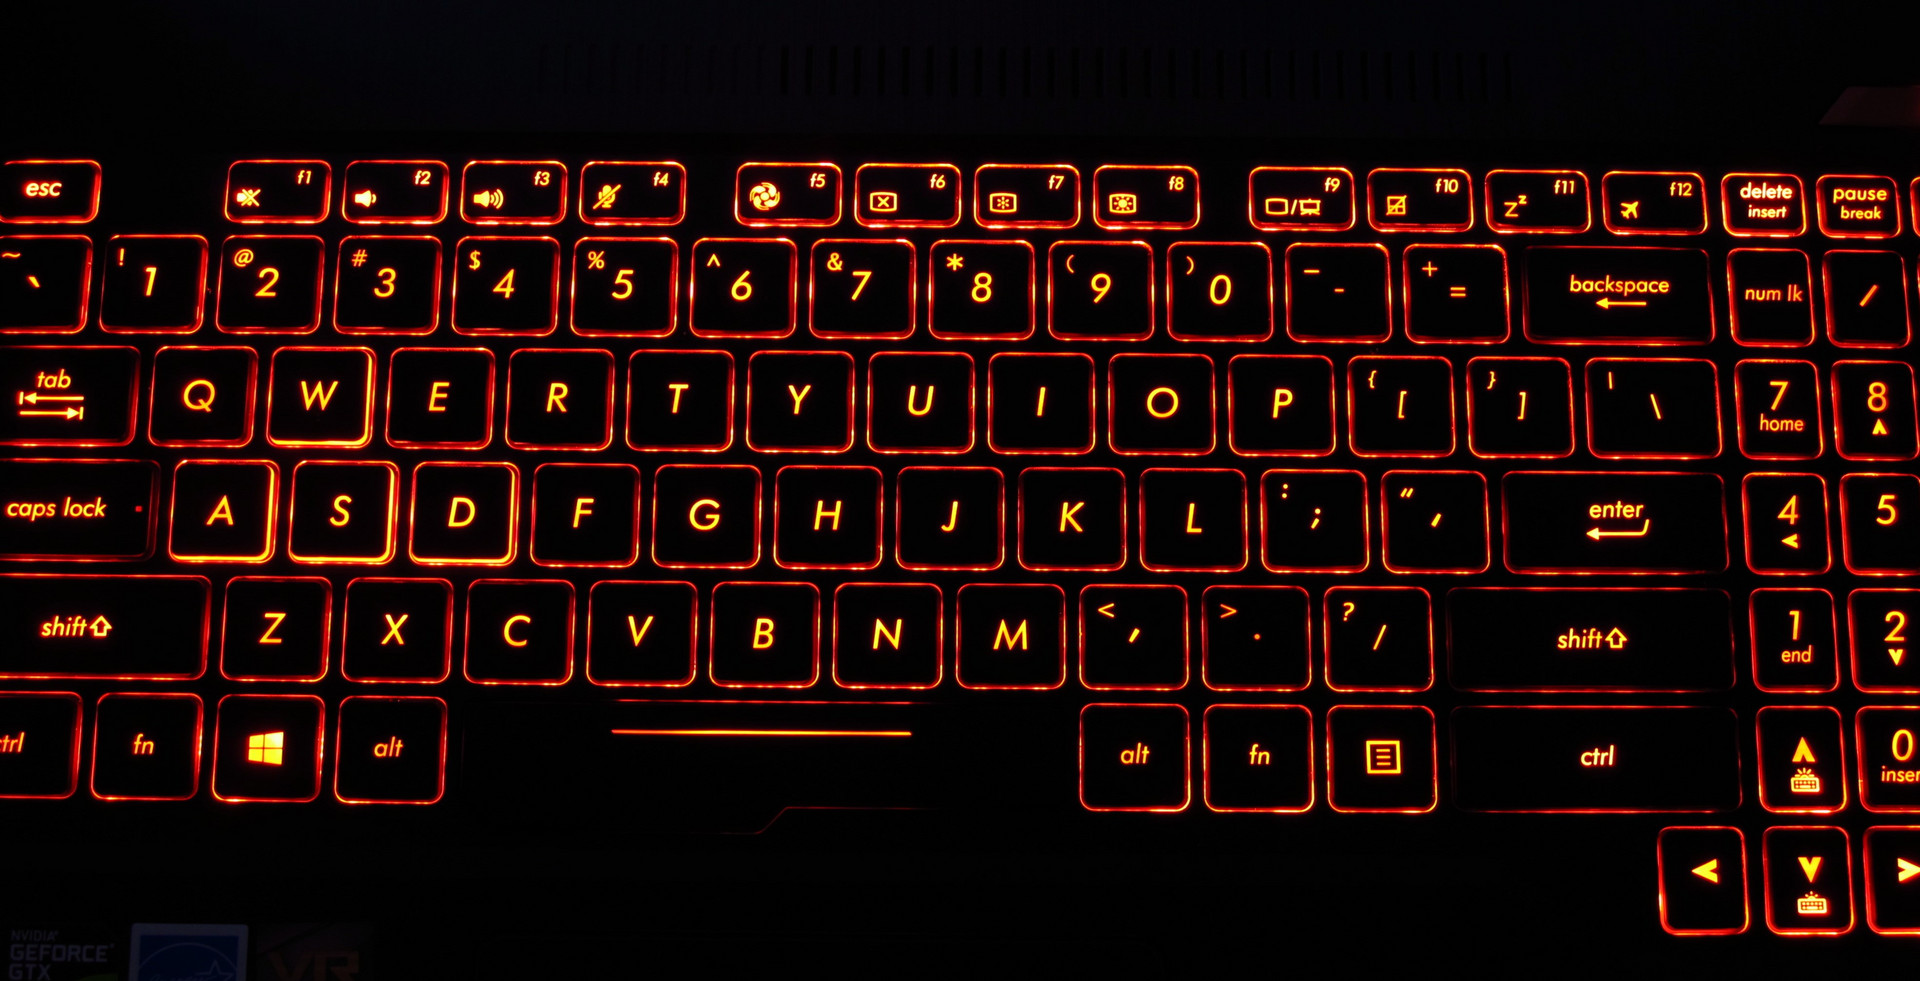
The FX503VM's red keyboard backlight is similar to those of older ROG laptops (prior to the "RGB revolution"). There are three levels of brightness that can be controlled via the Fn key and either the up or down arrows. The keyboard has the usual smattering of special keys, including volume and screen brightness controls, but the lack of dedicated macro keys is a sore spot. The power button is intentionally offset from the rest of the keyboard, which resolves a complaint we had with previous Asus FX laptops.
Touchpad
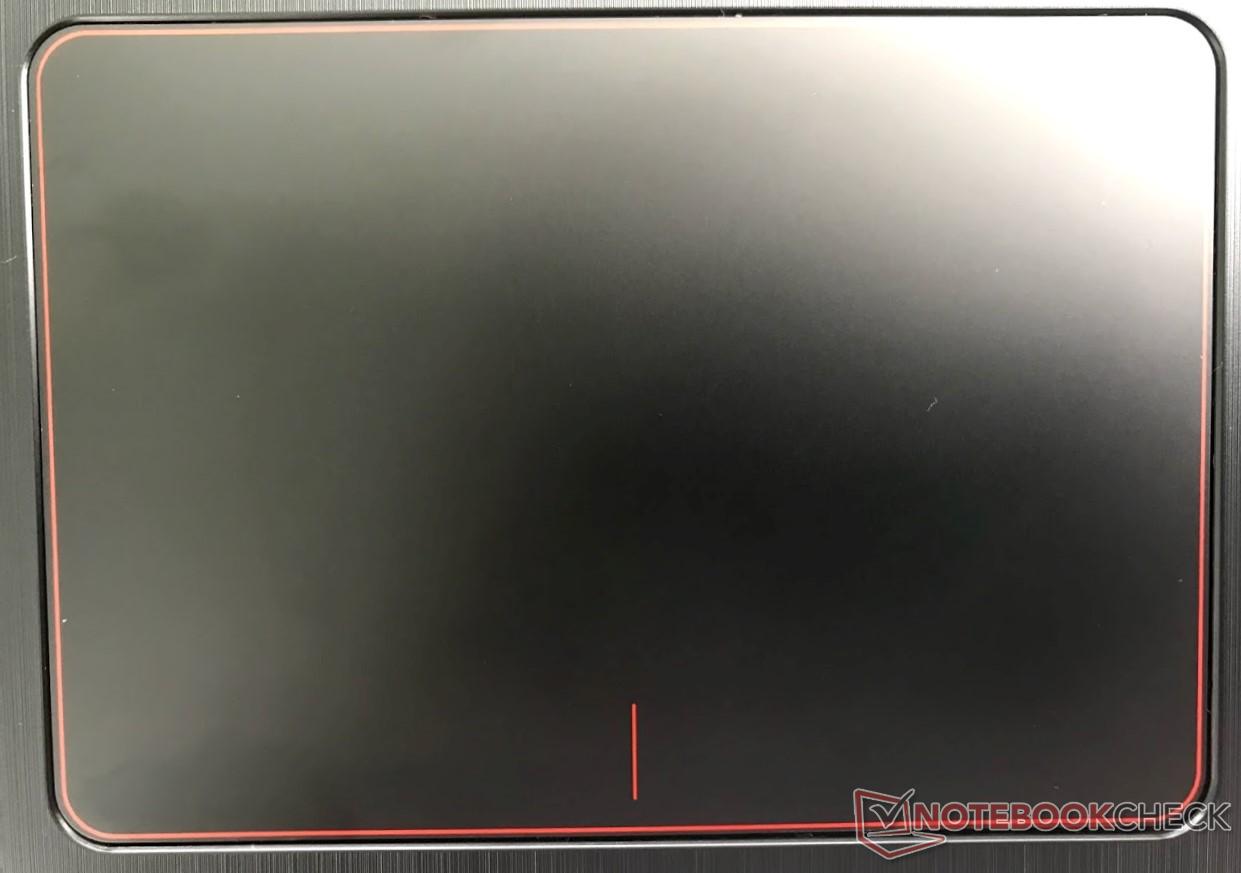
The touchpad (103 mm x 73 mm) is typical notebook fare. While the surface is smooth with an easy glide and the pad itself is responsive, the clicking mechanism (using the bottom half of the pad) is a bit spongy. The click is hollow and feels cheap, and the pad easily bends under further pressure. Tracking is possible over the button markings. The matte finish is also a magnet for oils and dust and will need to be cleaned regularly.
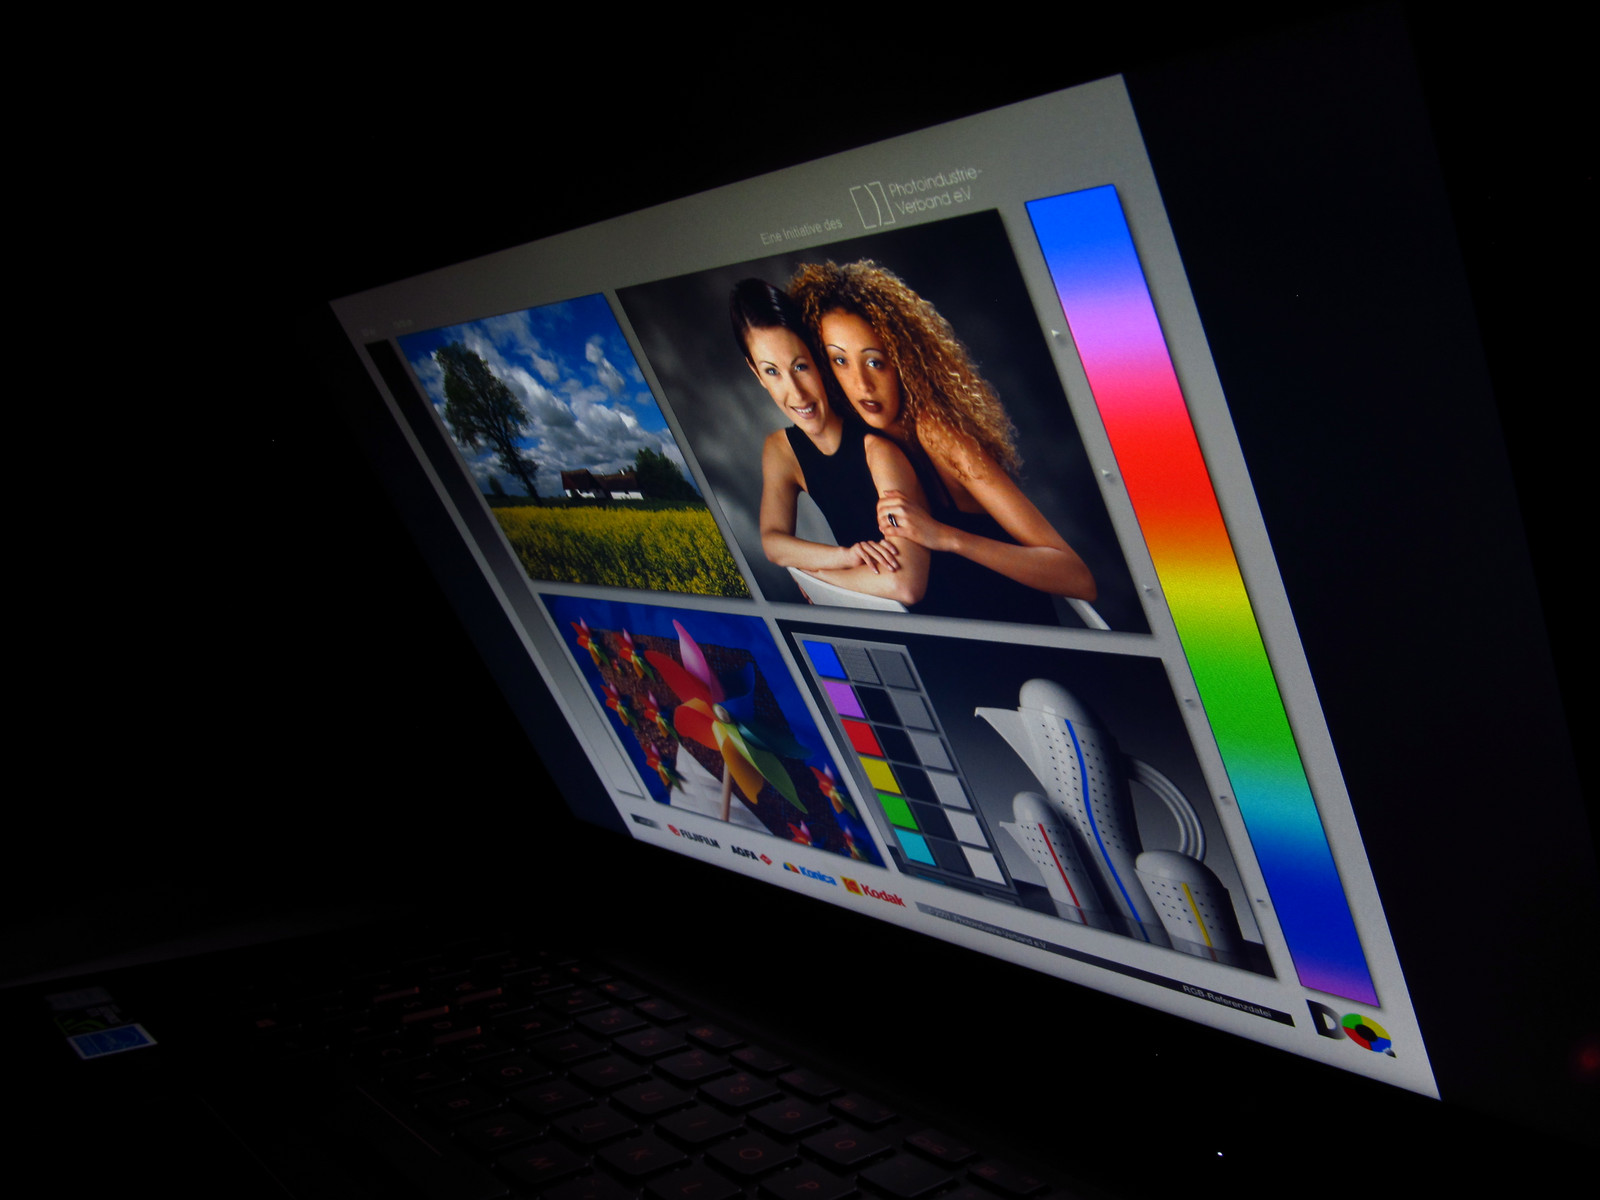
Display
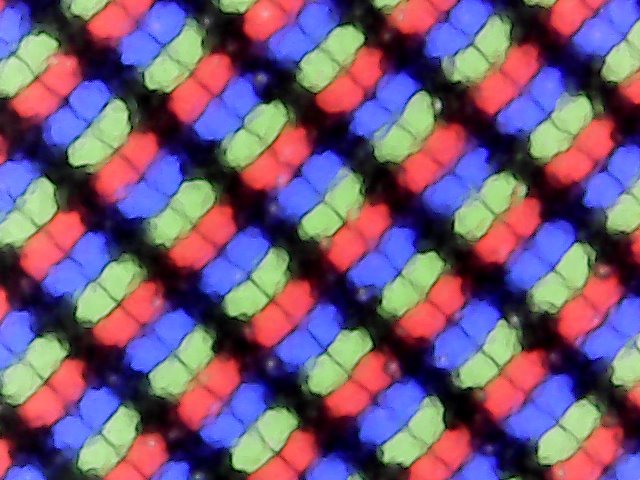
The 1920x1080 AU Optronics display is passable, if uninspiring. Response times are acceptable for an IPS panel, and PWM is completely absent. The panel's biggest weakness is brightness, which is lackluster at about 235 nits. This is low even for a budget gaming laptop; the screens Legion Y520, Omen 15, and V15 Nitro each hover just below 300 nits. On the plus side, brightness distribution is good, as is contrast (~1400:1).
Anecdotally, the screen is decent but does nothing to stand out. Overall, the display tries to be a jack of all trades and, subsequently, is a master of none. Asus advertises a model with a 120 Hz refresh rate display, but this model may be difficult to find on the market. The higher refresh rate could be a boon for competitive gamers or players of League of Legends or other popular multiplayer games. Our review unit only has a 60 Hz refresh rate.
| |||||||||||||||||||||||||
Brightness Distribution: 91 %
Center on Battery: 235.9 cd/m²
Contrast: 874:1 (Black: 0.27 cd/m²)
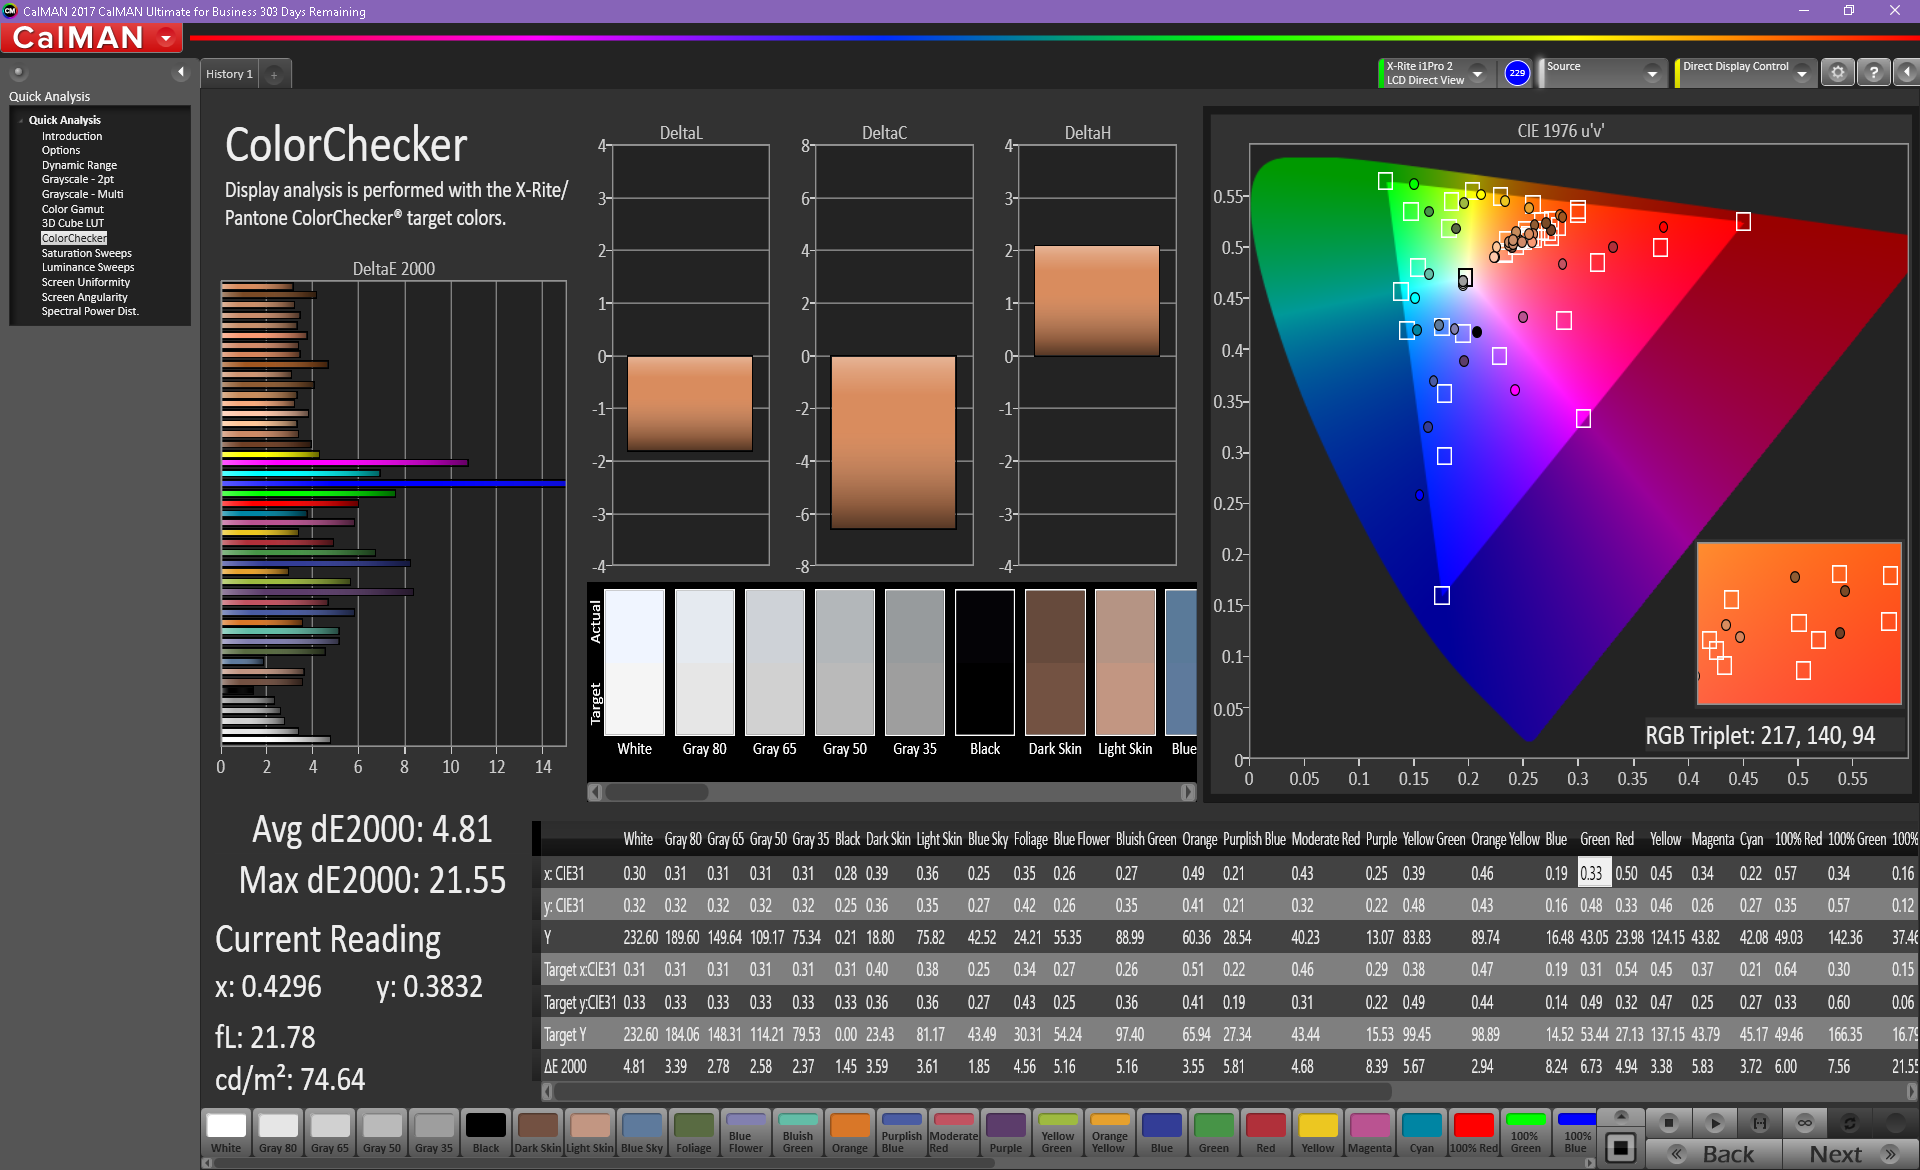
ΔE ColorChecker Calman: 4.81 | ∀{0.5-29.43 Ø4.73}
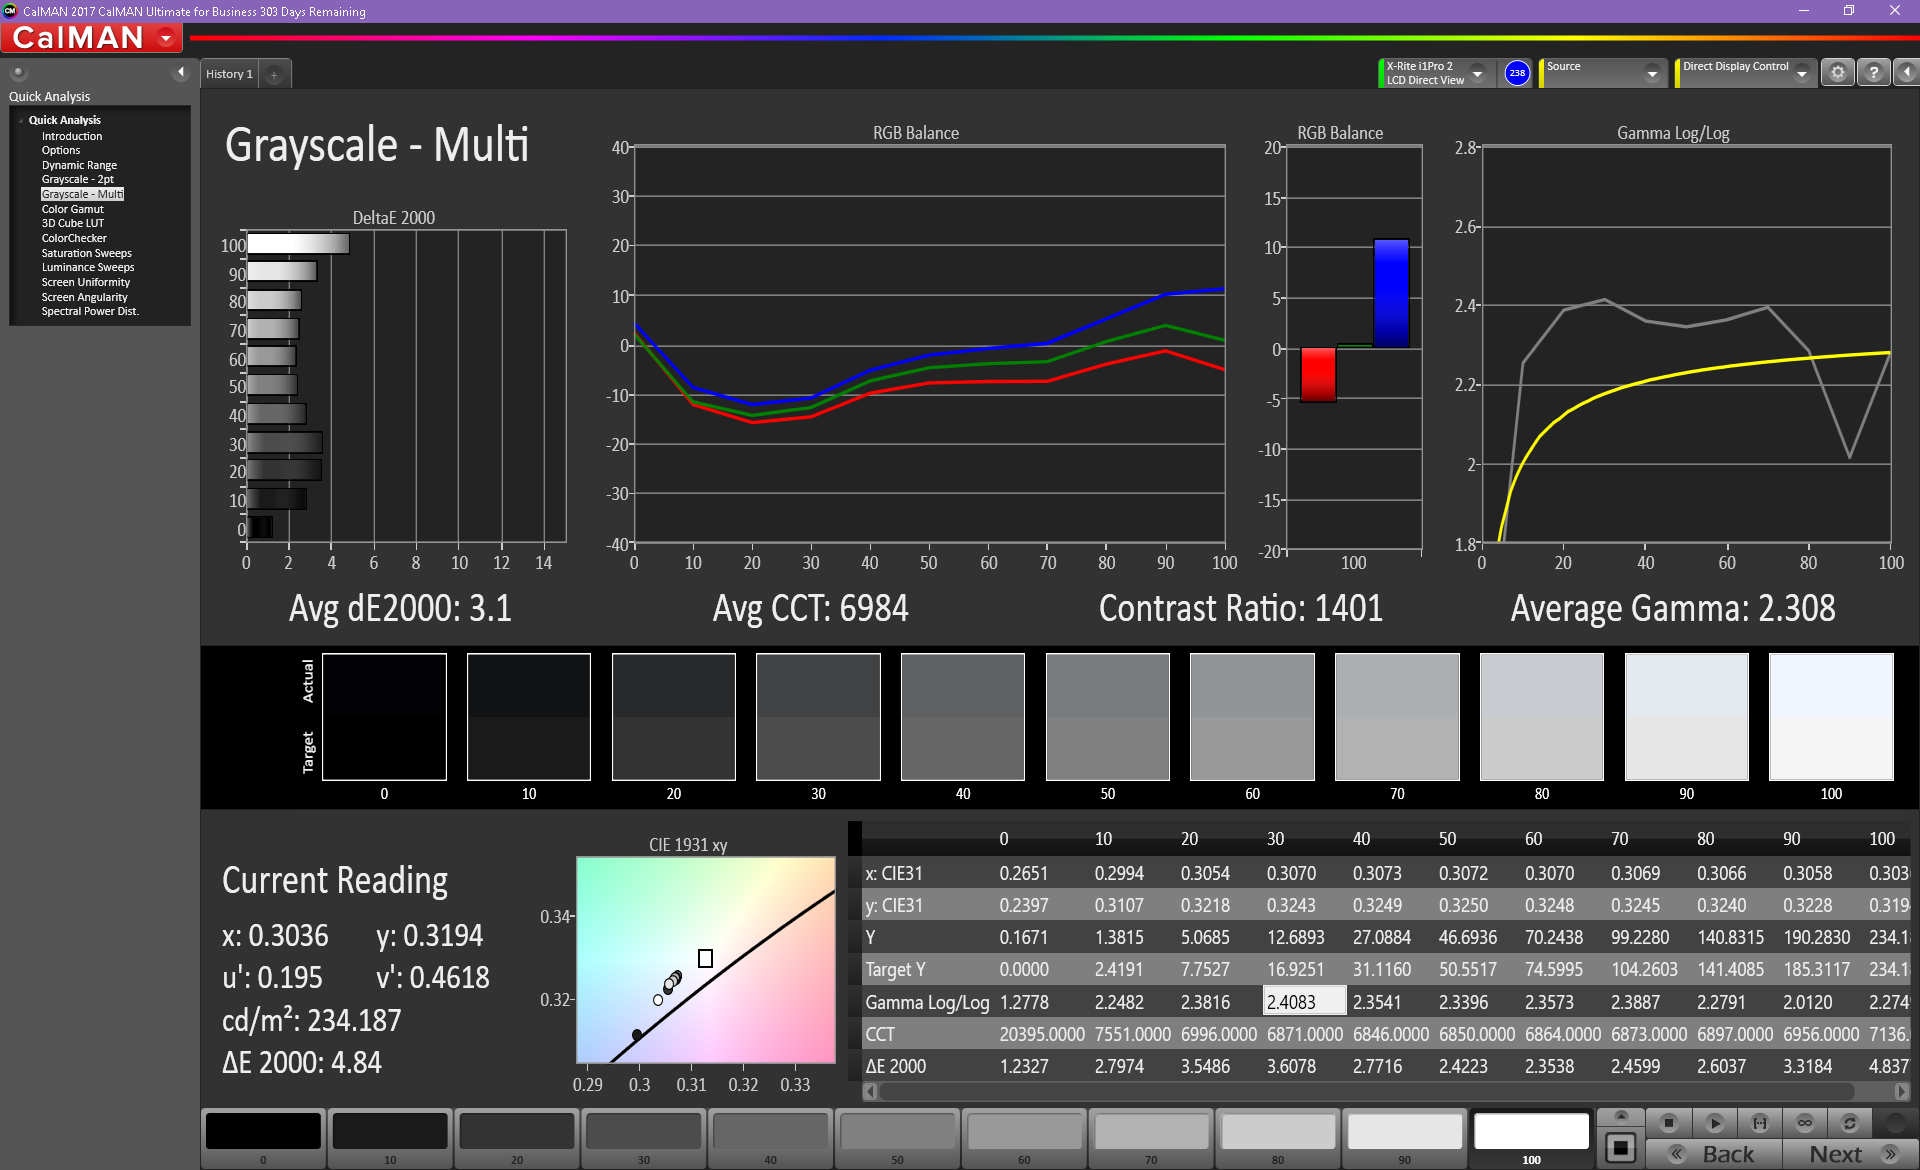
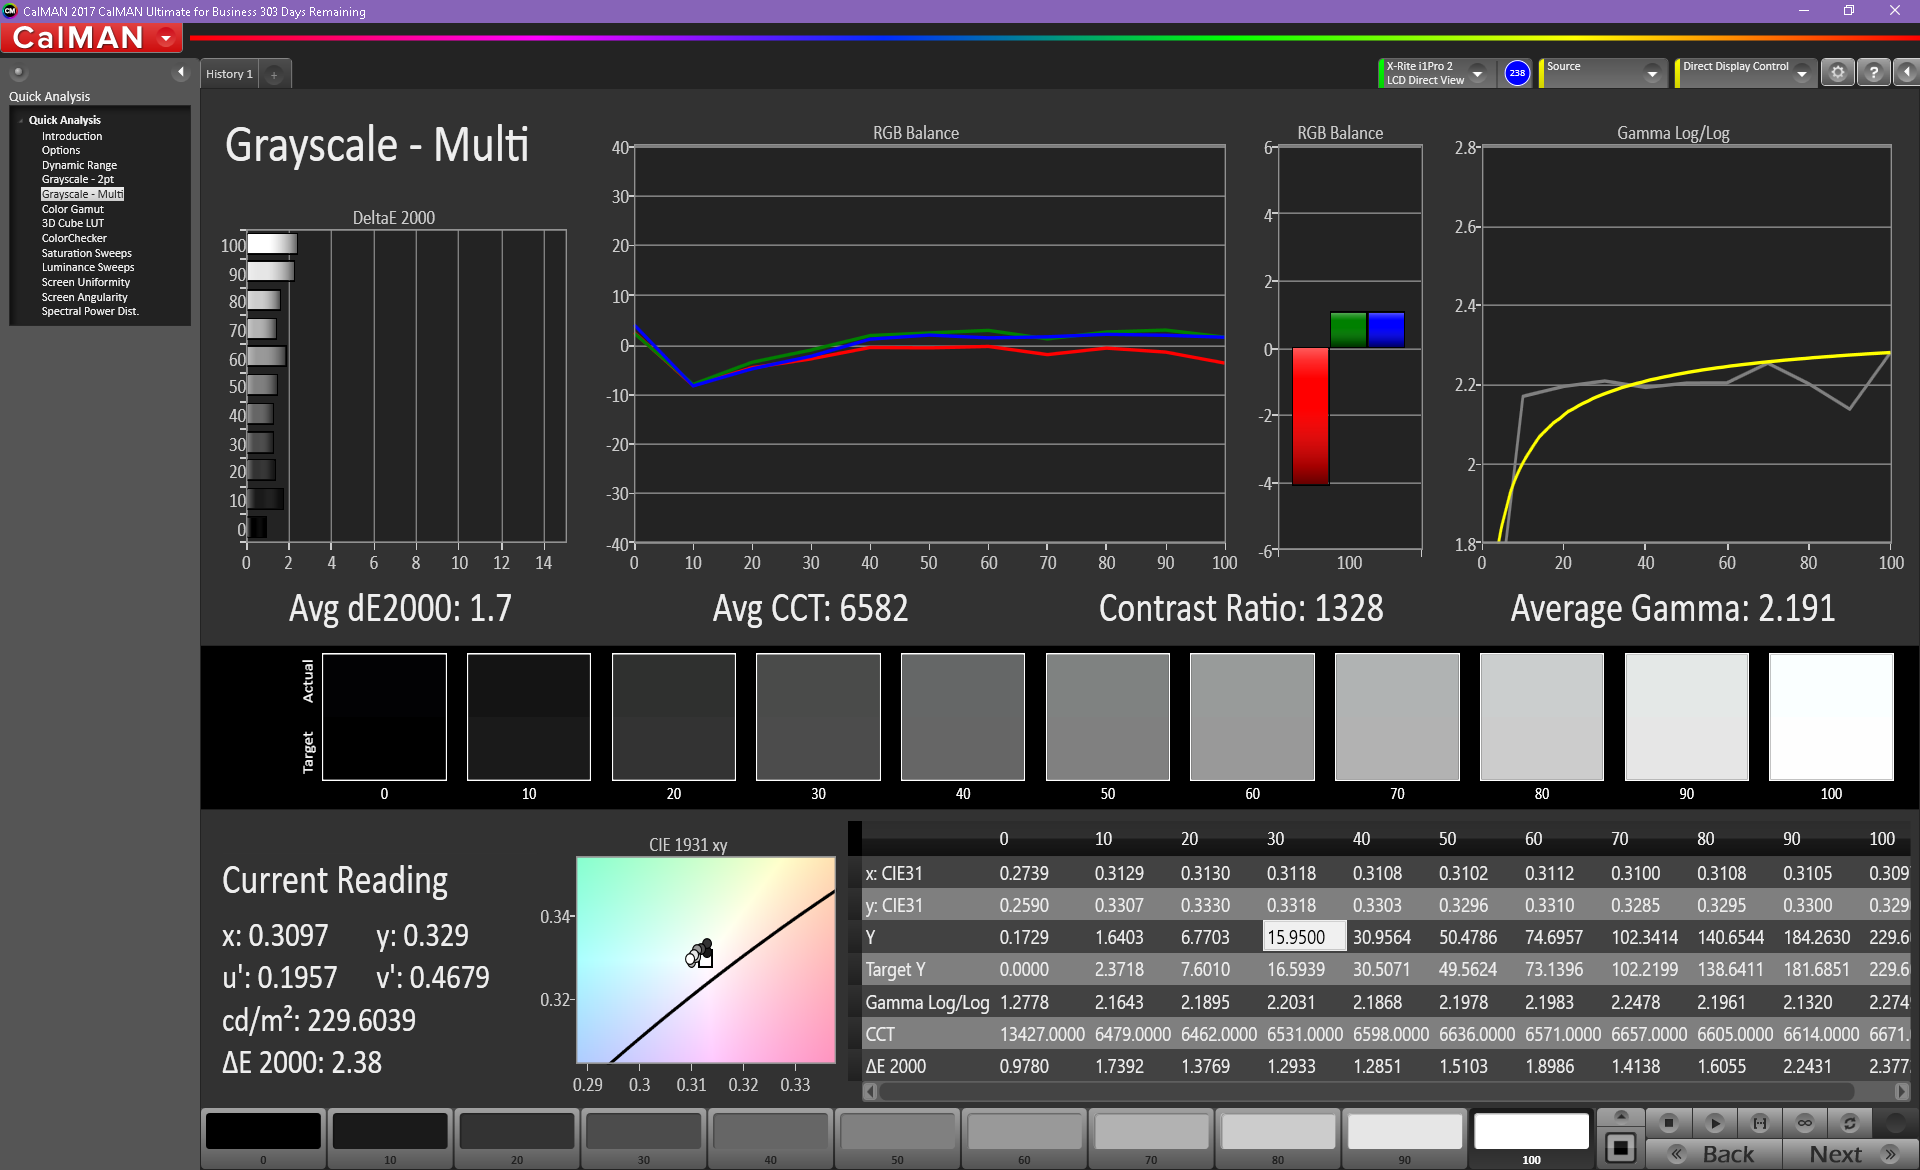
ΔE Greyscale Calman: 3.1 | ∀{0.09-98 Ø4.97}
56% sRGB (Argyll 1.6.3 3D)
36% AdobeRGB 1998 (Argyll 1.6.3 3D)
38.72% AdobeRGB 1998 (Argyll 3D)
56.3% sRGB (Argyll 3D)
37.48% Display P3 (Argyll 3D)
Gamma: 2.31
CCT: 6984 K
| Asus FX503VM-EH73 AU Optronics B156HAN06.1, IPS, 15.6", 1920x1080 | Asus FX502VM-AS73 TN LED, 15.6", 1920x1080 | Dell Inspiron 15 7000 7577 ID: LG Philips LGD053F, Name: 156WF6, Dell P/N: 4XK13, IPS, 15.6", 1920x1080 | HP Omen 15-ce002ng AUO42ED, IPS, 15.6", 1920x1080 | Acer Aspire VN7-593G-73HP V15 Nitro BE LG Display LP156WF6-SPP1, AH-IPS, Normally Black, Transmissive, 15.6", 1920x1080 | Acer Nitro 5 AN515-51-788E LG Philips LP156WF6-SPK6, IPS, 15.6", 1920x1080 | Acer Aspire VX5-591G-75C4 VX15 LG Philips LGD0550 / LP156WF6-SPK4, IPS, 15.6", 1920x1080 | |
|---|---|---|---|---|---|---|---|
| Display | 2% | -1% | 70% | 63% | 11% | 4% | |
| Display P3 Coverage (%) | 37.48 | 38.28 2% | 37.07 -1% | 65.8 76% | 65.8 76% | 41.7 11% | 38.88 4% |
| sRGB Coverage (%) | 56.3 | 56.9 1% | 55.6 -1% | 90.9 61% | 85.1 51% | 62.2 10% | 58.2 3% |
| AdobeRGB 1998 Coverage (%) | 38.72 | 39.47 2% | 38.32 -1% | 66.5 72% | 62.2 61% | 43.17 11% | 40.2 4% |
| Response Times | 26% | 8% | -8% | -10% | 18% | 34% | |
| Response Time Grey 50% / Grey 80% * (ms) | 36.8 ? | 28.4 ? 23% | 35.6 ? 3% | 43.2 ? -17% | 41 ? -11% | 35 ? 5% | 22 ? 40% |
| Response Time Black / White * (ms) | 31.6 ? | 22.4 ? 29% | 27.6 ? 13% | 31.2 ? 1% | 34 ? -8% | 22 ? 30% | 23 ? 27% |
| PWM Frequency (Hz) | |||||||
| Screen | -19% | -4% | 33% | 22% | 3% | 1% | |
| Brightness middle (cd/m²) | 235.9 | 209.5 -11% | 235.4 0% | 304 29% | 322 36% | 276 17% | 281 19% |
| Brightness (cd/m²) | 235 | 205 -13% | 223 -5% | 289 23% | 297 26% | 265 13% | 257 9% |
| Brightness Distribution (%) | 91 | 92 1% | 91 0% | 86 -5% | 86 -5% | 91 0% | 85 -7% |
| Black Level * (cd/m²) | 0.27 | 0.69 -156% | 0.28 -4% | 0.26 4% | 0.31 -15% | 0.25 7% | 0.32 -19% |
| Contrast (:1) | 874 | 304 -65% | 841 -4% | 1169 34% | 1039 19% | 1104 26% | 878 0% |
| Colorchecker dE 2000 * | 4.81 | 4.7 2% | 5.6 -16% | 3.46 28% | 4.73 2% | 5.06 -5% | 5.16 -7% |
| Colorchecker dE 2000 max. * | 21.55 | 19.7 9% | 20.3 6% | 7.72 64% | 12.37 43% | 10.13 53% | 9.09 58% |
| Greyscale dE 2000 * | 3.1 | 1.8 42% | 3.6 -16% | 2.46 21% | 2.99 4% | 6.25 -102% | 4.57 -47% |
| Gamma | 2.31 95% | 2.23 99% | 2.23 99% | 2.38 92% | 2.32 95% | 1.76 125% | 2.59 85% |
| CCT | 6984 93% | 6975 93% | 7214 90% | 6915 94% | 6905 94% | 6873 95% | 6931 94% |
| Color Space (Percent of AdobeRGB 1998) (%) | 36 | 36.2 1% | 35.2 -2% | 59 64% | 56 56% | 40 11% | 37 3% |
| Color Space (Percent of sRGB) (%) | 56 | 56.6 1% | 55.4 -1% | 91 63% | 85 52% | 62 11% | 58 4% |
| Total Average (Program / Settings) | 3% /
-9% | 1% /
-2% | 32% /
35% | 25% /
26% | 11% /
7% | 13% /
6% |
* ... smaller is better
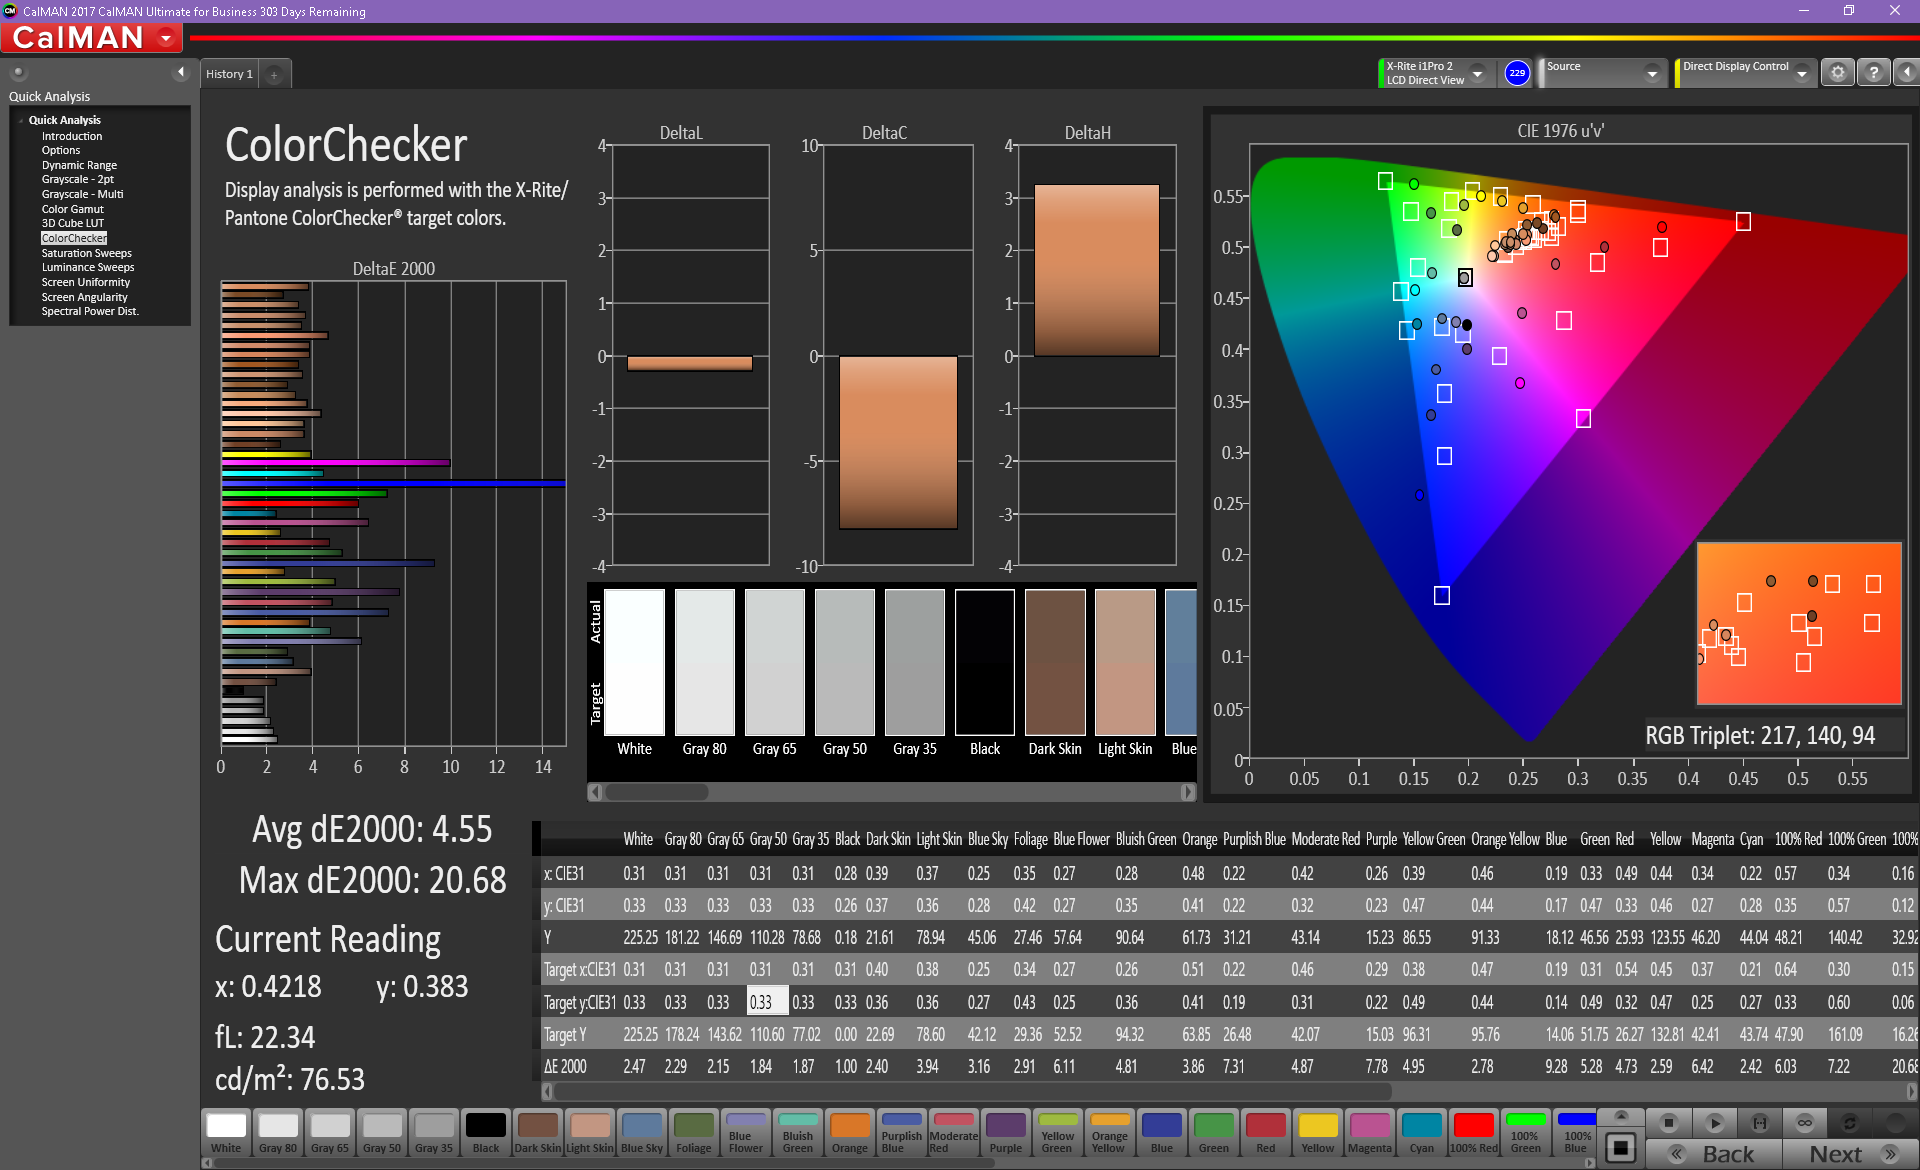
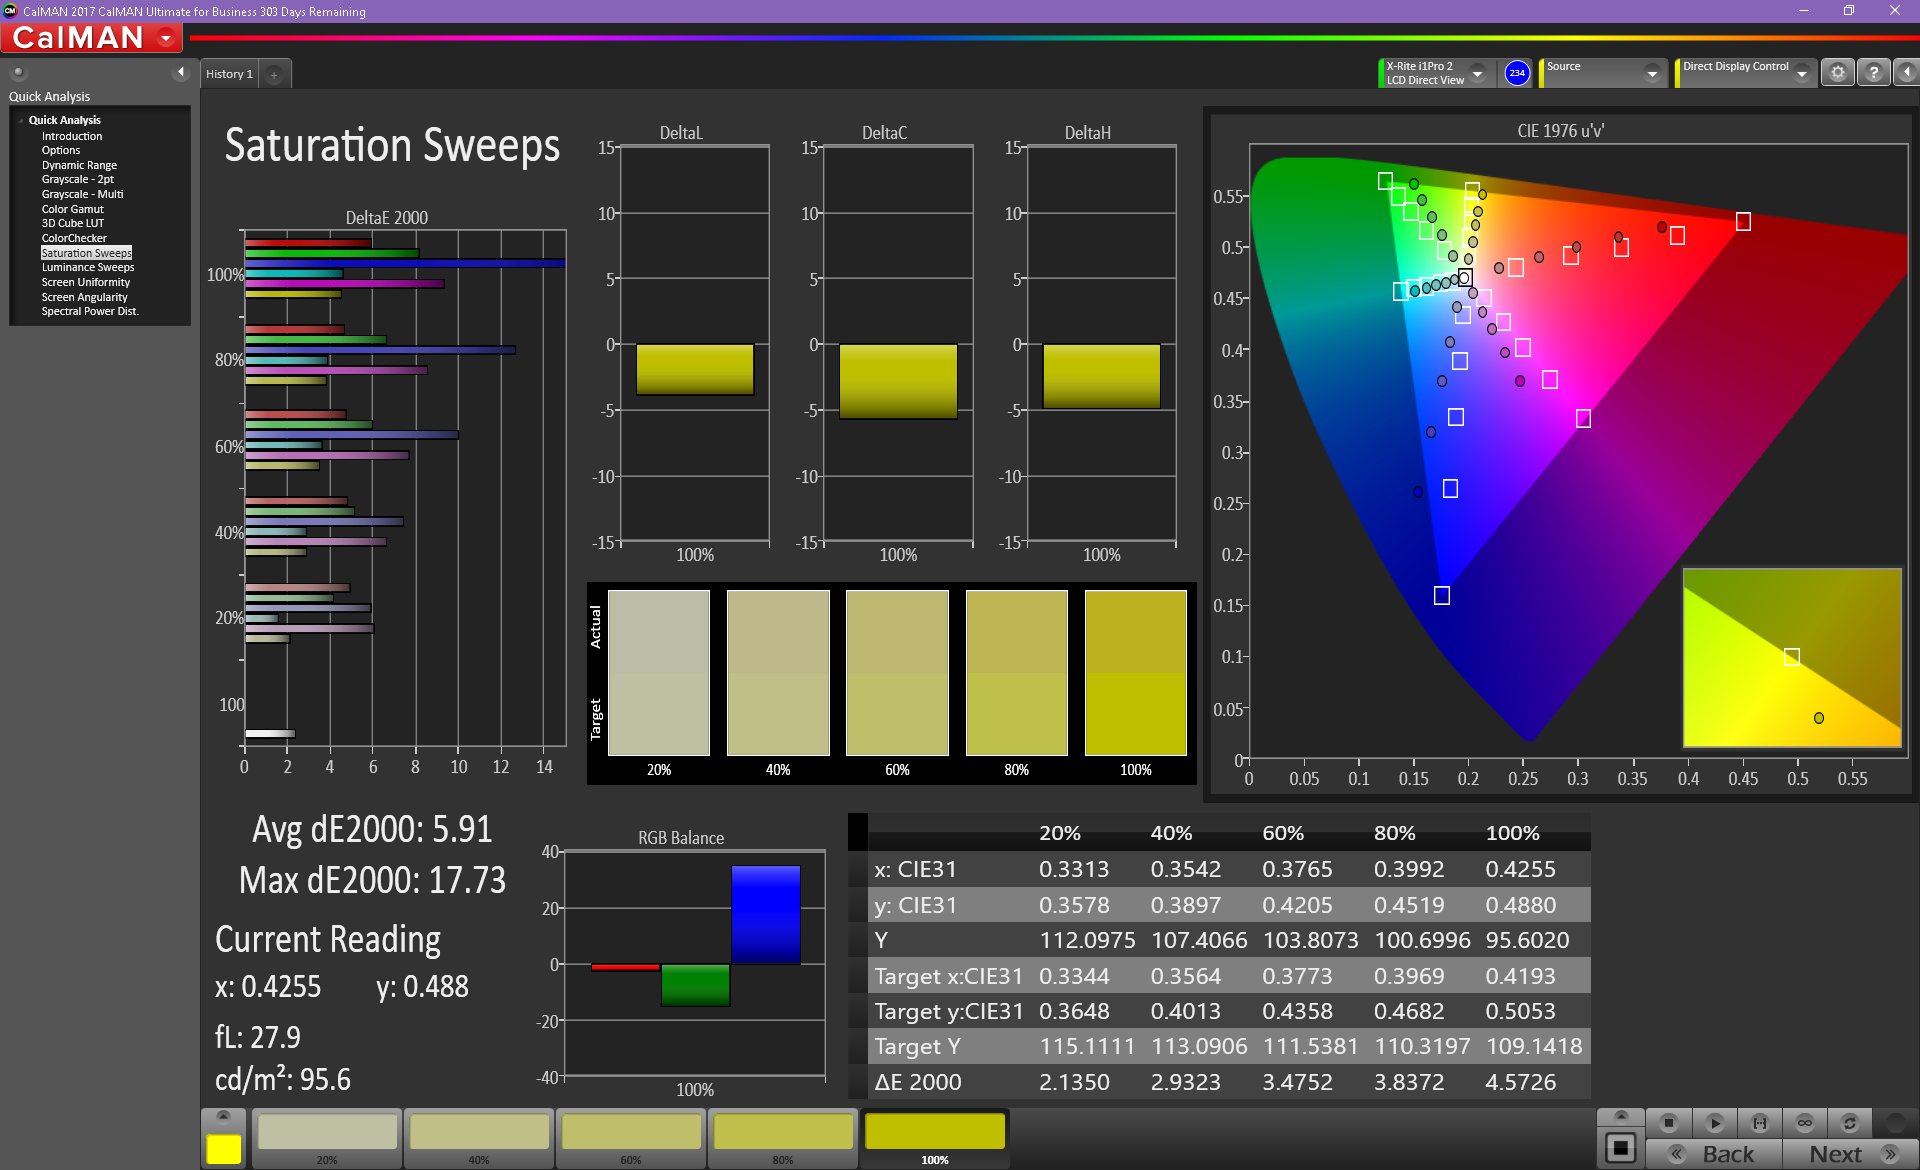
Colors are a weak spot for the FX503VM. Out of the box, the average DeltaE2000 for colors is 4.81. This metric by itself is average for a mid-tier gaming notebook, but the maximum DeltaE2000 swings widely up to 21.55. The end result is a wide variance in color reproduction with some colors (particularly blues) sitting far from the "true" color. For example, a "pure" blue comes across as indigo with a slight violet hue. During normal use and gameplay, this doesn't present much of a problem and isn't detrimental to the overall experience. However, professional color workers will notice this difference; as such, this notebook should be passed over by those that rely on a color-accurate display for their work. Calibration doesn't improve the situation much. Grays and blacks, on the other hand, are fairly good: the DeltaE for grayscale sits just over 3 (a common professional threshold for accuracy). With calibration, this number drops to 1.7. Gamma and color temperature are also on the better side of average and level out with calibration, although a pink hue remains on white backgrounds.
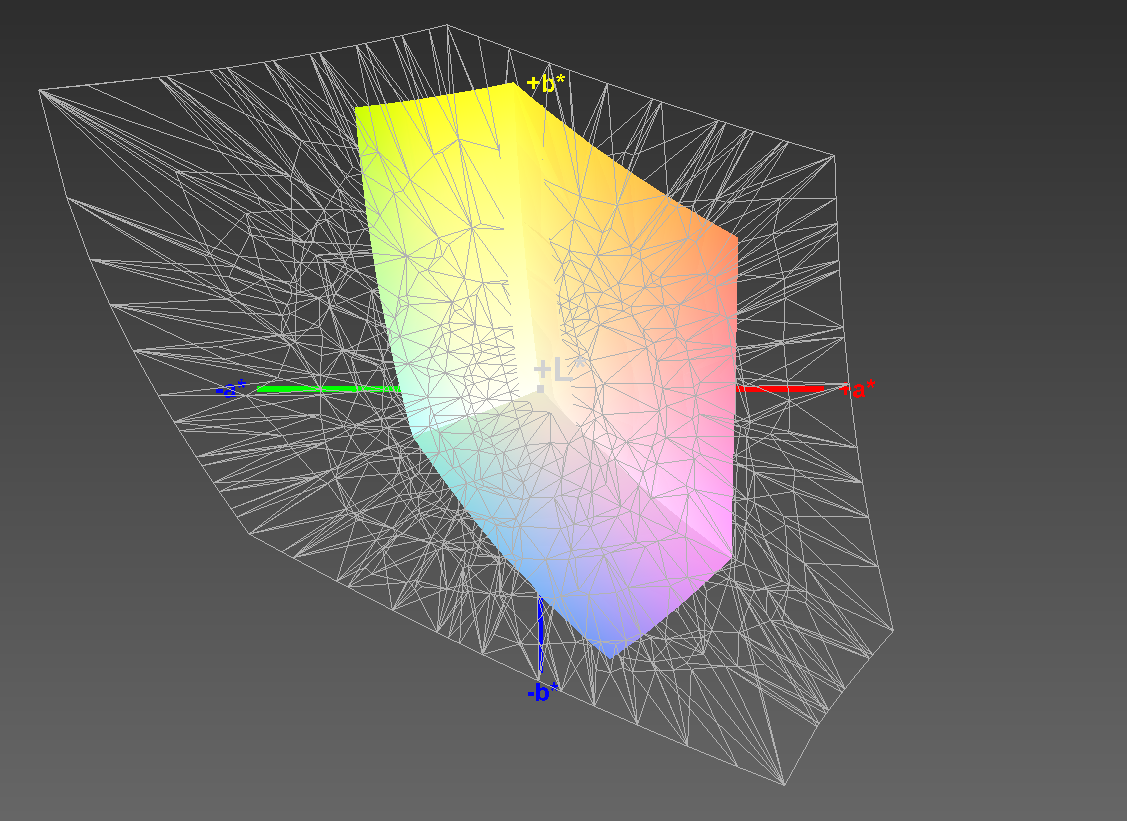
The biggest point of contention is the limited color space coverage. The FX503VM's panel covers a mere 56% of the sRGB gamut and a paltry 36% of the AdobeRGB gamut. These are lackluster numbers for an IPS panel. The HP Omen 15 and Acer V15 Nitro's displays cover a significantly larger amount of these color spaces. As is the case with color accuracy, this doesn't negatively impact gaming or daily use, but video and photo editors will be left wanting.


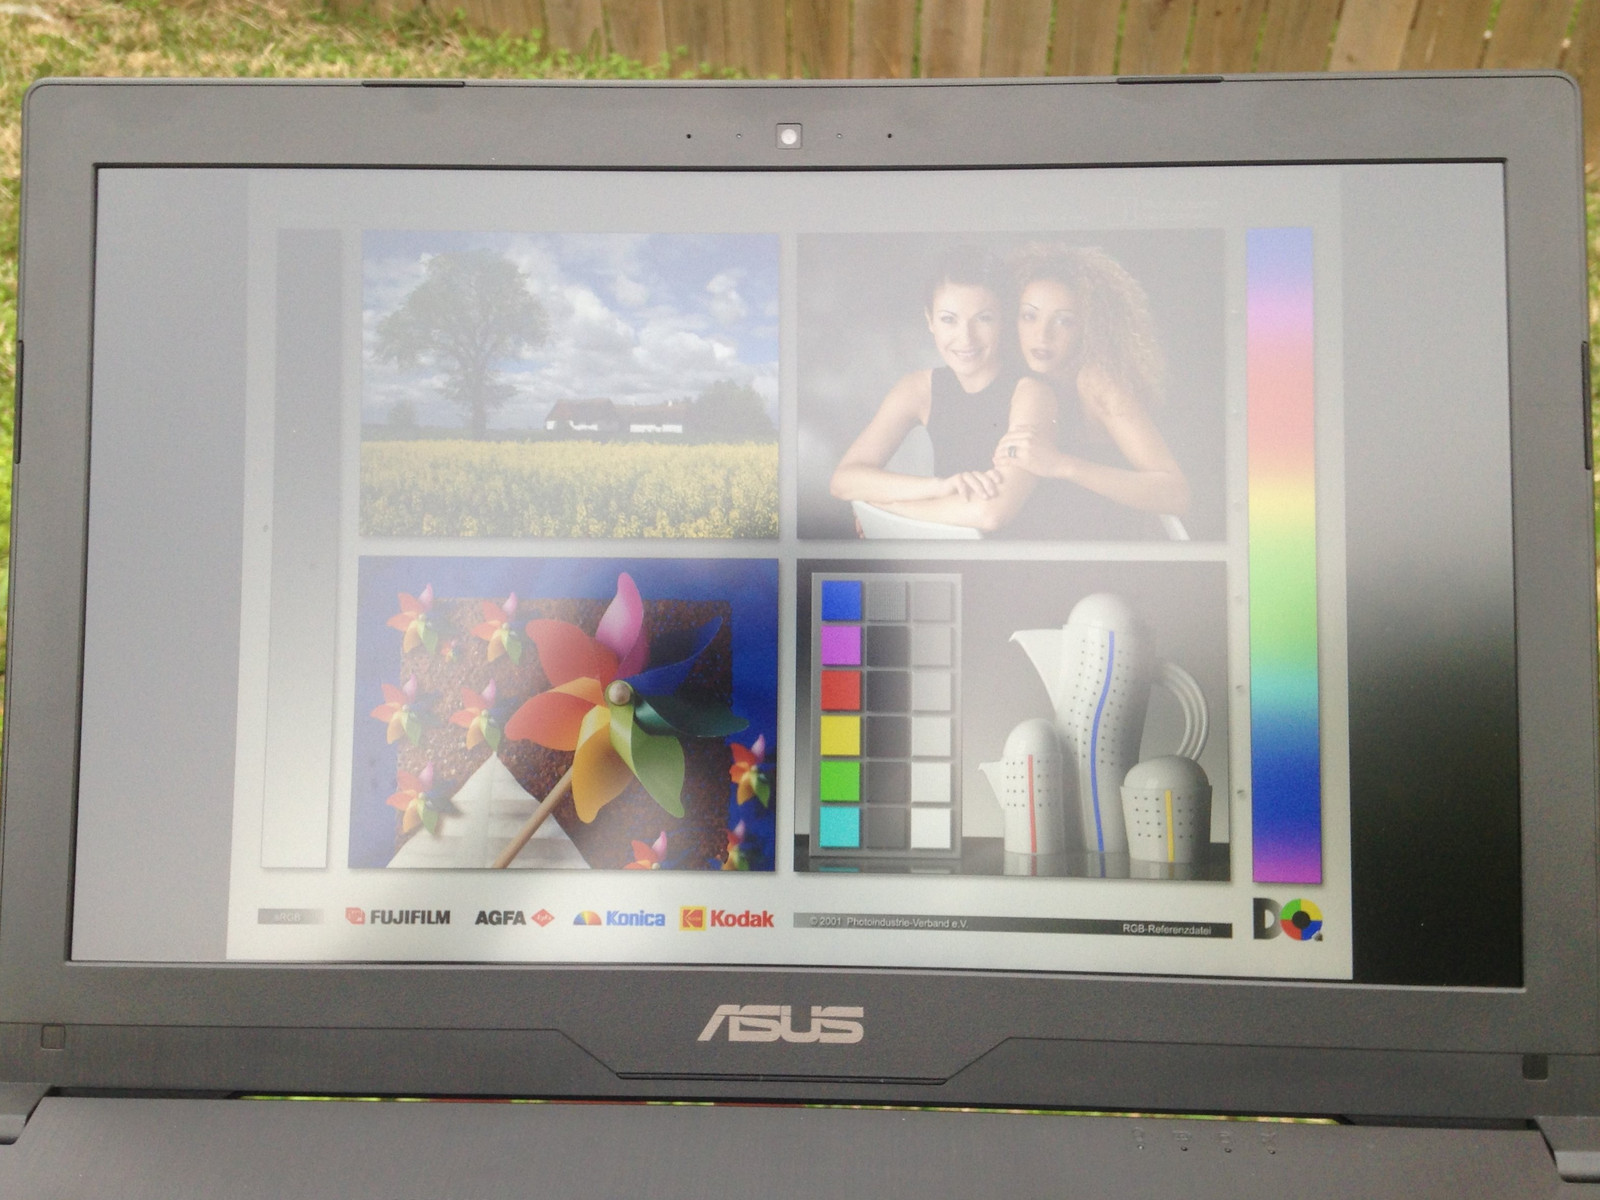
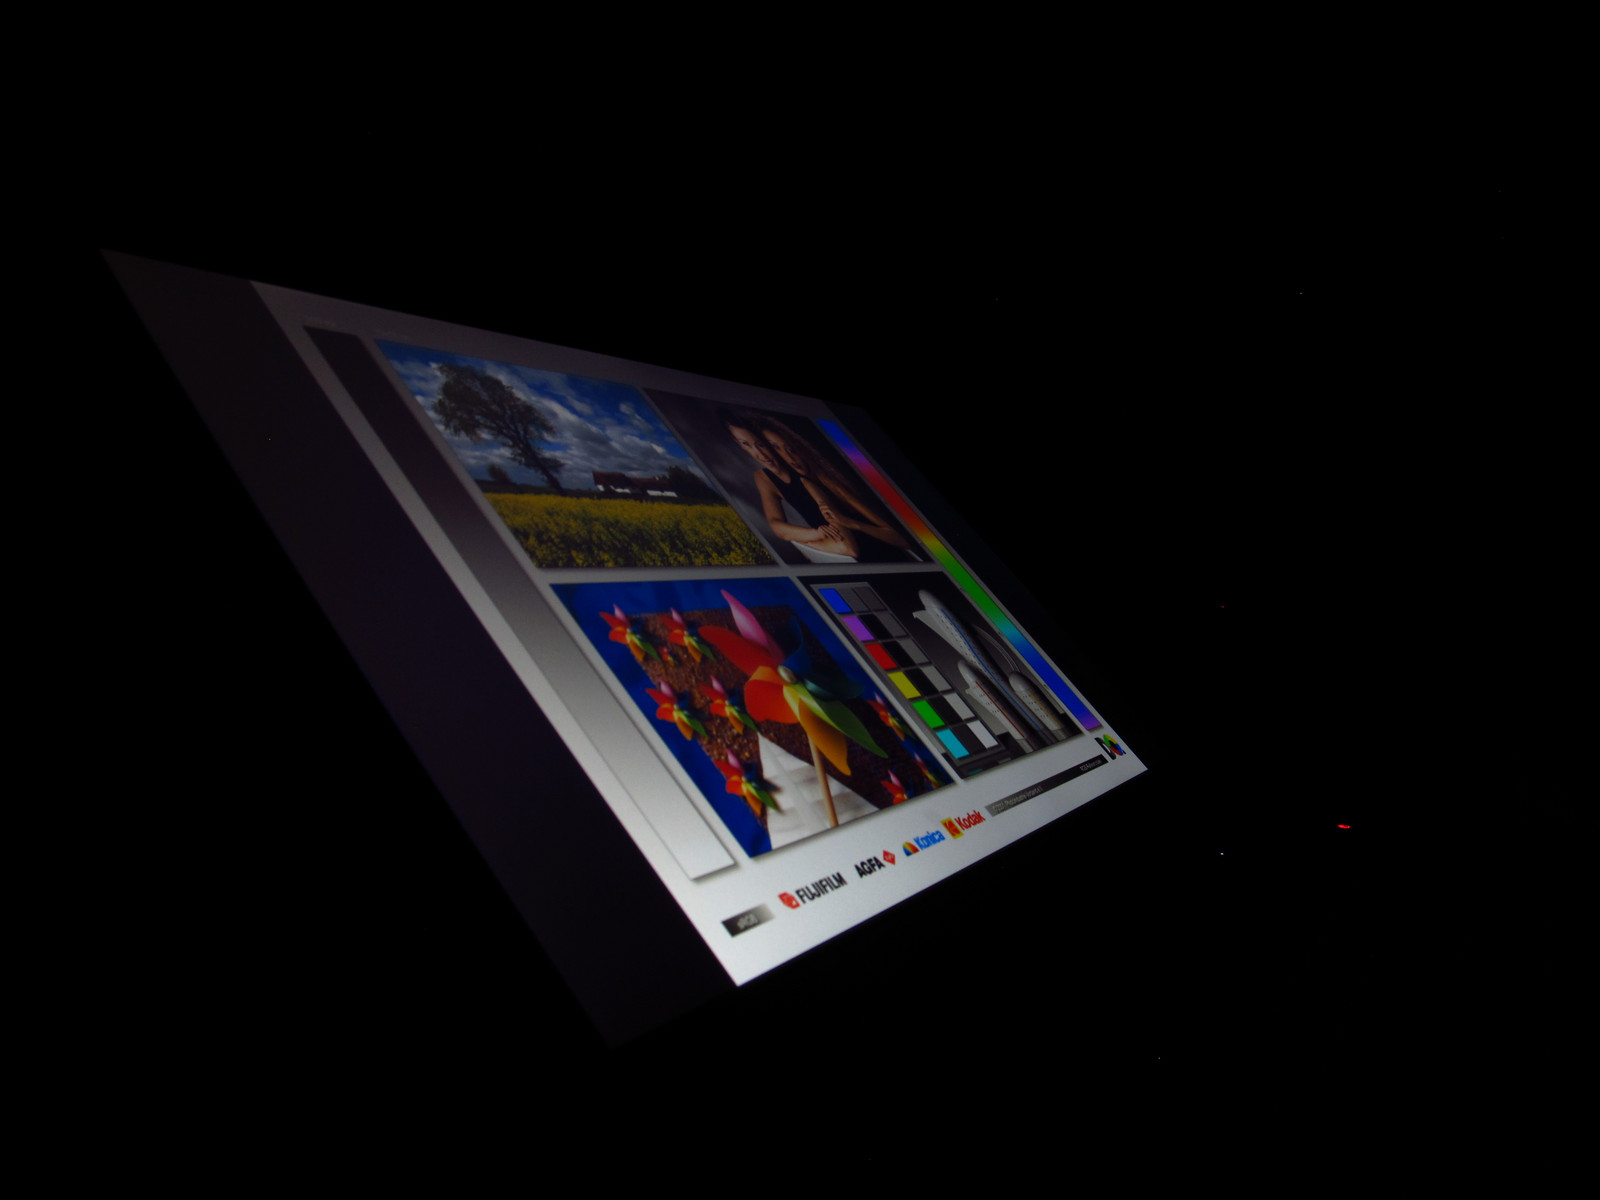
The IPS panel has excellent viewing angles (as is expected). Images, colors, and text remain stable and clear at angles past 45°, but the screen dims a bit at these offsets. Backlight bleed is a problem as well; it seems that the display bezel isn't flush against the panel, allowing the backlight to shine through along the bottom and top.
The matte finish across the display works well to counteract reflections. Unfortunately, the screen is too dim for easy outdoor use. If shade is available, working outside is possible, but direct sunlight will kill all productivity.


Display Response Times
| ↔ Response Time Black to White | ||
|---|---|---|
| 31.6 ms ... rise ↗ and fall ↘ combined | ↗ 18.4 ms rise | 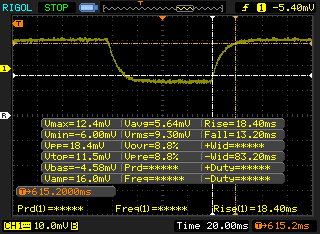 |
| ↘ 13.2 ms fall | ||
| The screen shows slow response rates in our tests and will be unsatisfactory for gamers. In comparison, all tested devices range from 0.1 (minimum) to 240 (maximum) ms. » 85 % of all devices are better. This means that the measured response time is worse than the average of all tested devices (19.9 ms). | ||
| ↔ Response Time 50% Grey to 80% Grey | ||
| 36.8 ms ... rise ↗ and fall ↘ combined | ↗ 19.6 ms rise | 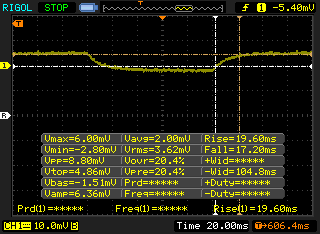 |
| ↘ 17.2 ms fall | ||
| The screen shows slow response rates in our tests and will be unsatisfactory for gamers. In comparison, all tested devices range from 0.165 (minimum) to 636 (maximum) ms. » 53 % of all devices are better. This means that the measured response time is worse than the average of all tested devices (31.1 ms). | ||
Screen Flickering / PWM (Pulse-Width Modulation)
| Screen flickering / PWM not detected | 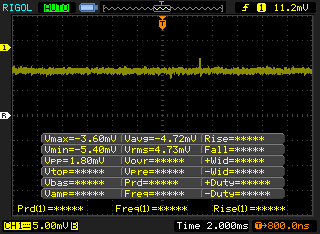 | ||
In comparison: 52 % of all tested devices do not use PWM to dim the display. If PWM was detected, an average of 7798 (minimum: 5 - maximum: 343500) Hz was measured. | |||
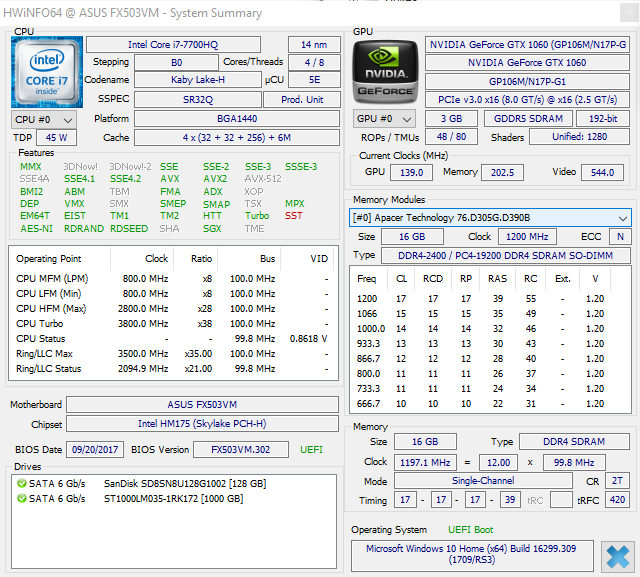
Performance
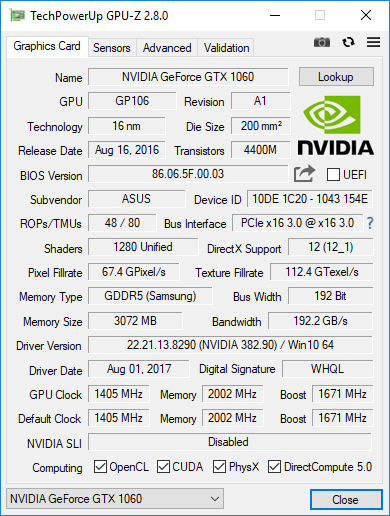
The combination of Intel's Core i7-7700HQ and Nvidia's GeForce GTX 1060 is perhaps the most popular method of powering gaming laptops. While these components are common among gaming notebooks, they have proved their worth time after time. The FX503VM is a bit different than most mid-tier gaming devices in that it uses the 3 GB model of the GTX 1060 rather than the more prolific 6 GB variant. Does this reduction in VRAM have a negative impact on games? Let's take a look.
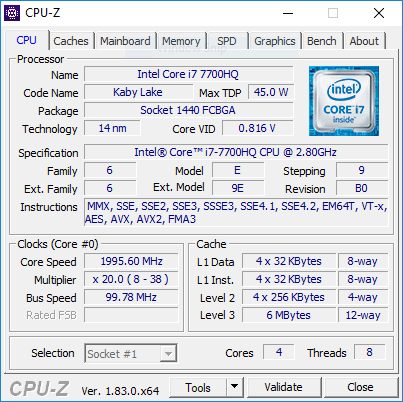
Processor
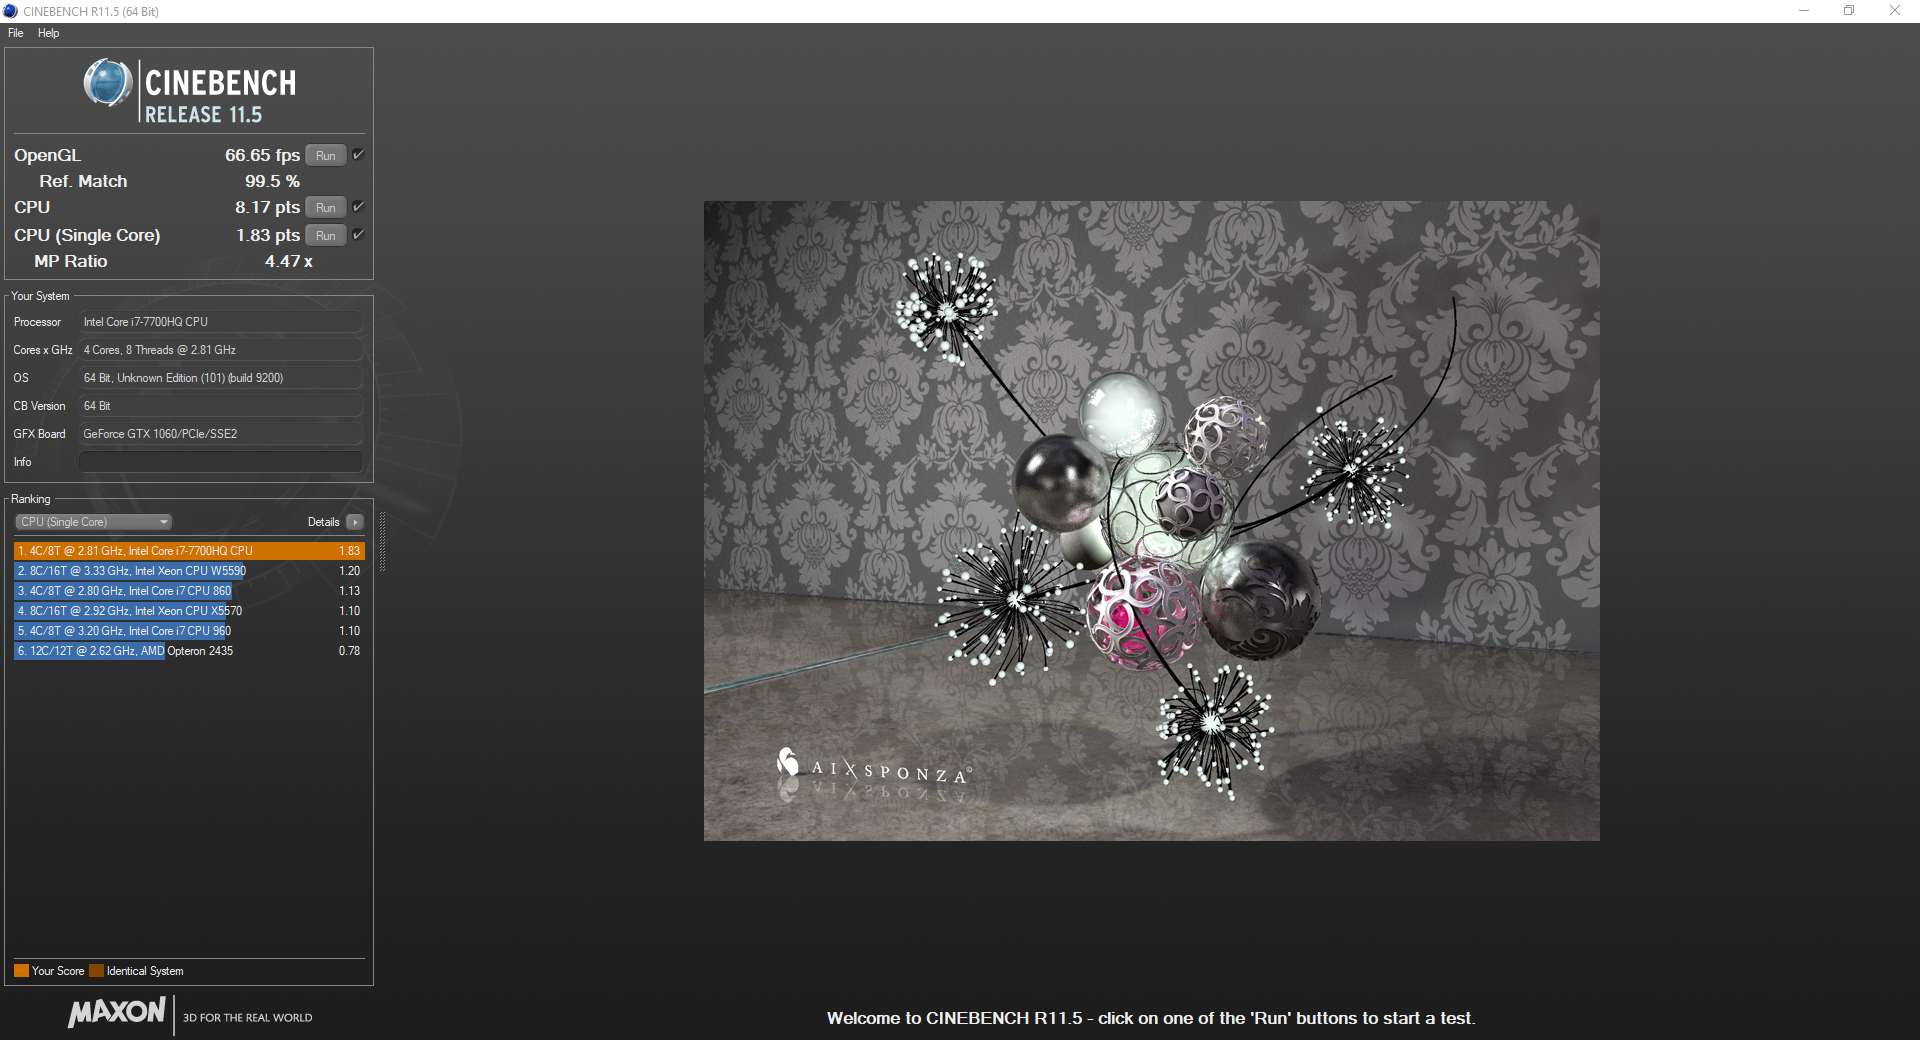
The Intel Core i7-7700HQ is a very capable quad-core hyperthreaded CPU that we've seen dozens (if not hundreds) of times over the past year. Rated at 45 Watts, the 7700HQ is clocked at 2.8 GHz with a 3.8 GHz boost. During our Cinebench testing, the 7700HQ in our FX503VM performed as expected. This CPU is about 40-45% faster than other gaming notebooks that opt for the Intel Core i5-7300HQ in multi-threaded tests, which is due to the latter's lack of hyperthreading.
Over long-term testing, the 7700HQ hovers around 710 CB. This is about 97% of its single-pass performance, so longer workloads won't have a major impact on performance. On battery, the FX503VM can manage about 90-95% of its processor performance when plugged in.


* ... smaller is better
System Performance
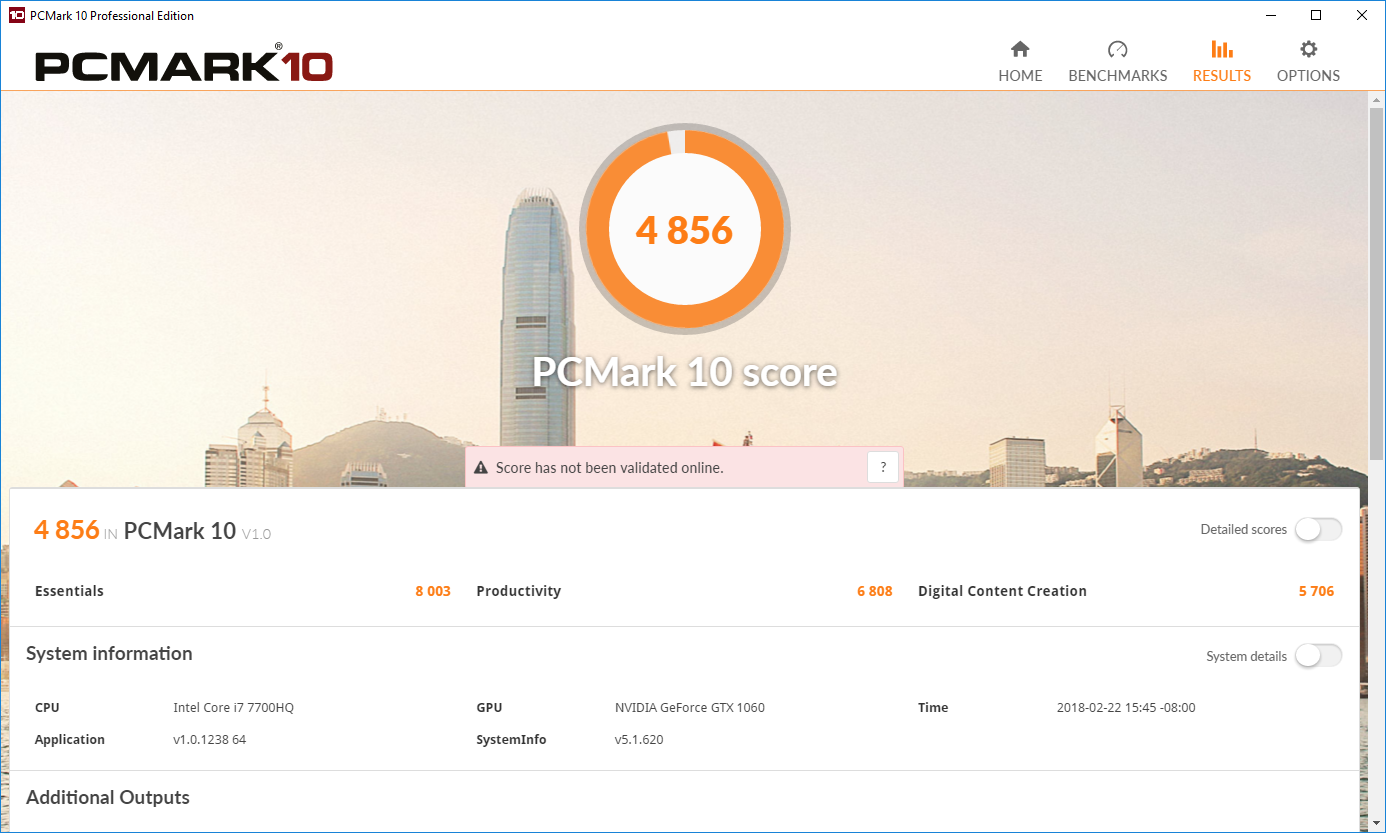
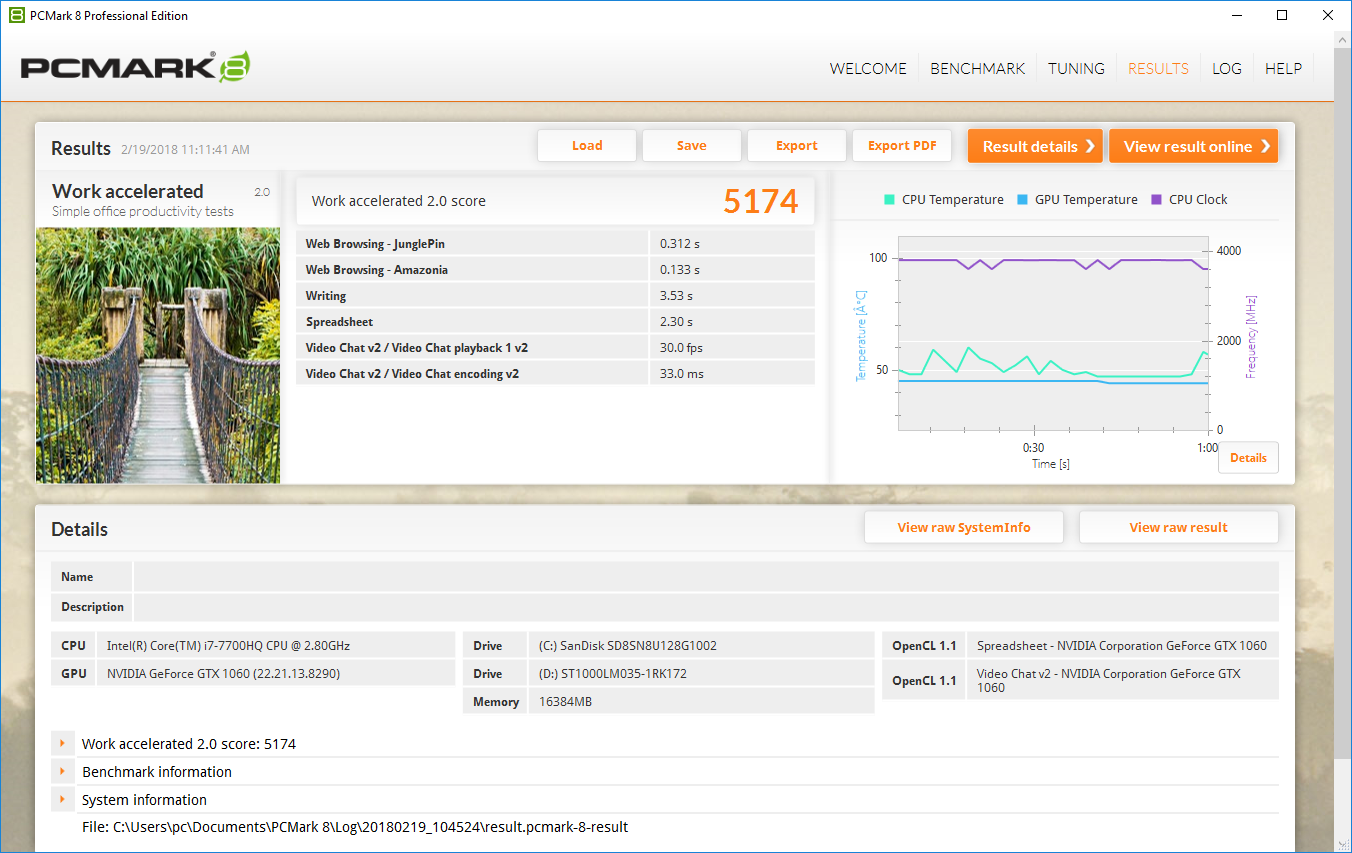
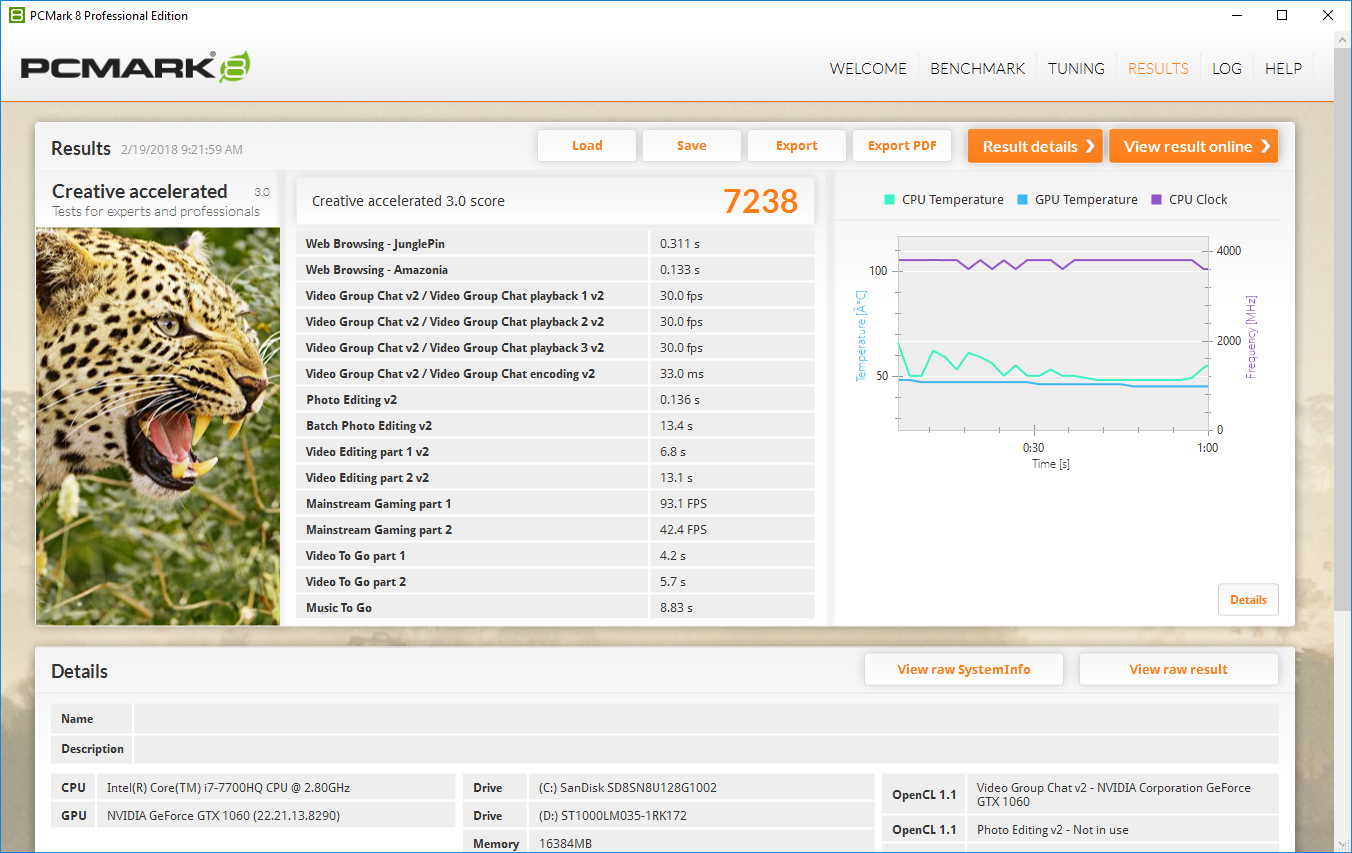
Overall system performance causes no complaint. PCMark 8 scores lead the pack in our roundup and are a bit higher than expected. Subjectively, everyday workloads are buttery smooth. Programs open quickly. Overall, the FX503VM should be quick enough for most users but lags a small bit behind the blinding speed of higher-tiered notebooks that use NVMe drives.
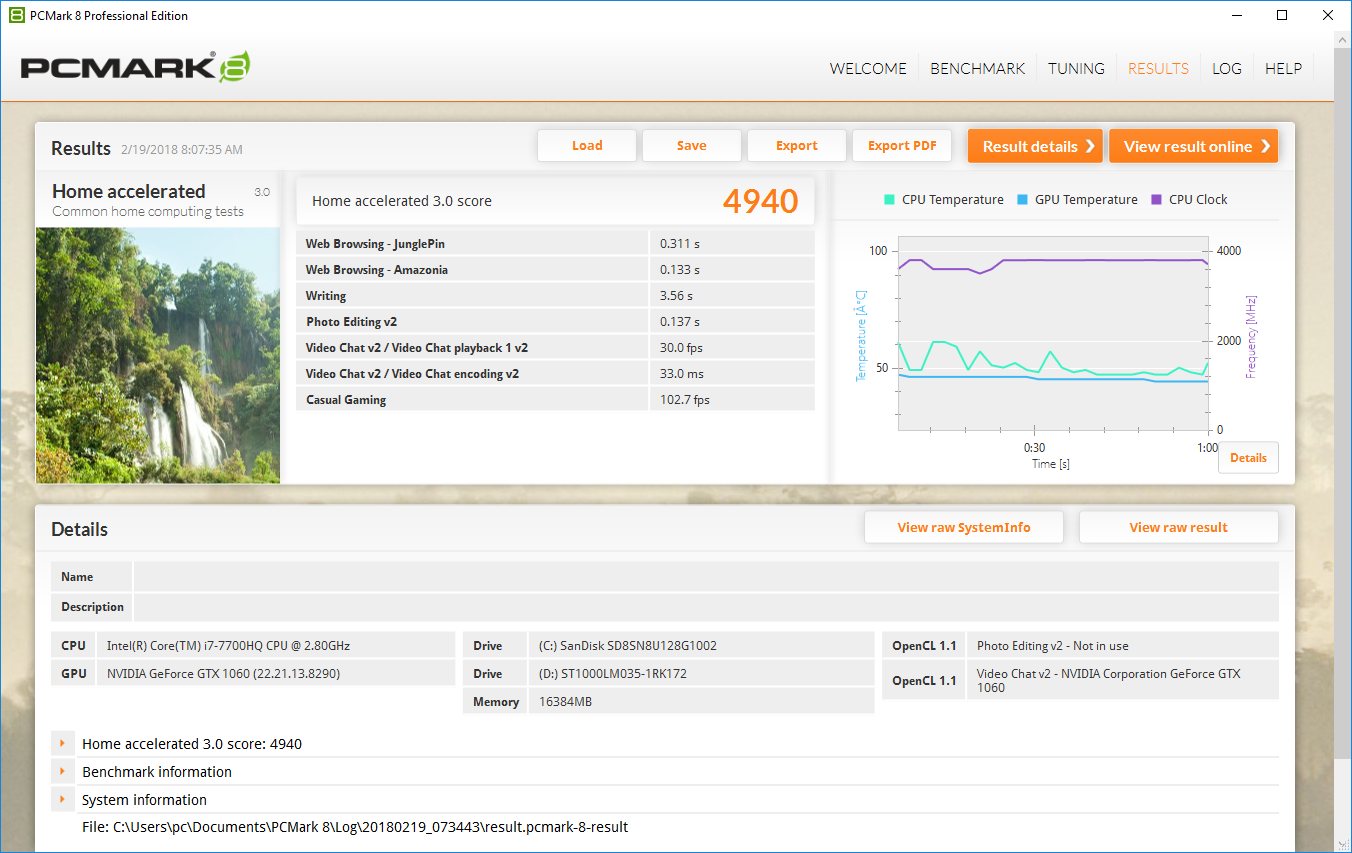
| PCMark 8 Home Score Accelerated v2 | 4940 points | |
| PCMark 8 Creative Score Accelerated v2 | 7238 points | |
| PCMark 8 Work Score Accelerated v2 | 5174 points | |
| PCMark 10 Score | 4856 points | |
Help | ||
Storage Devices
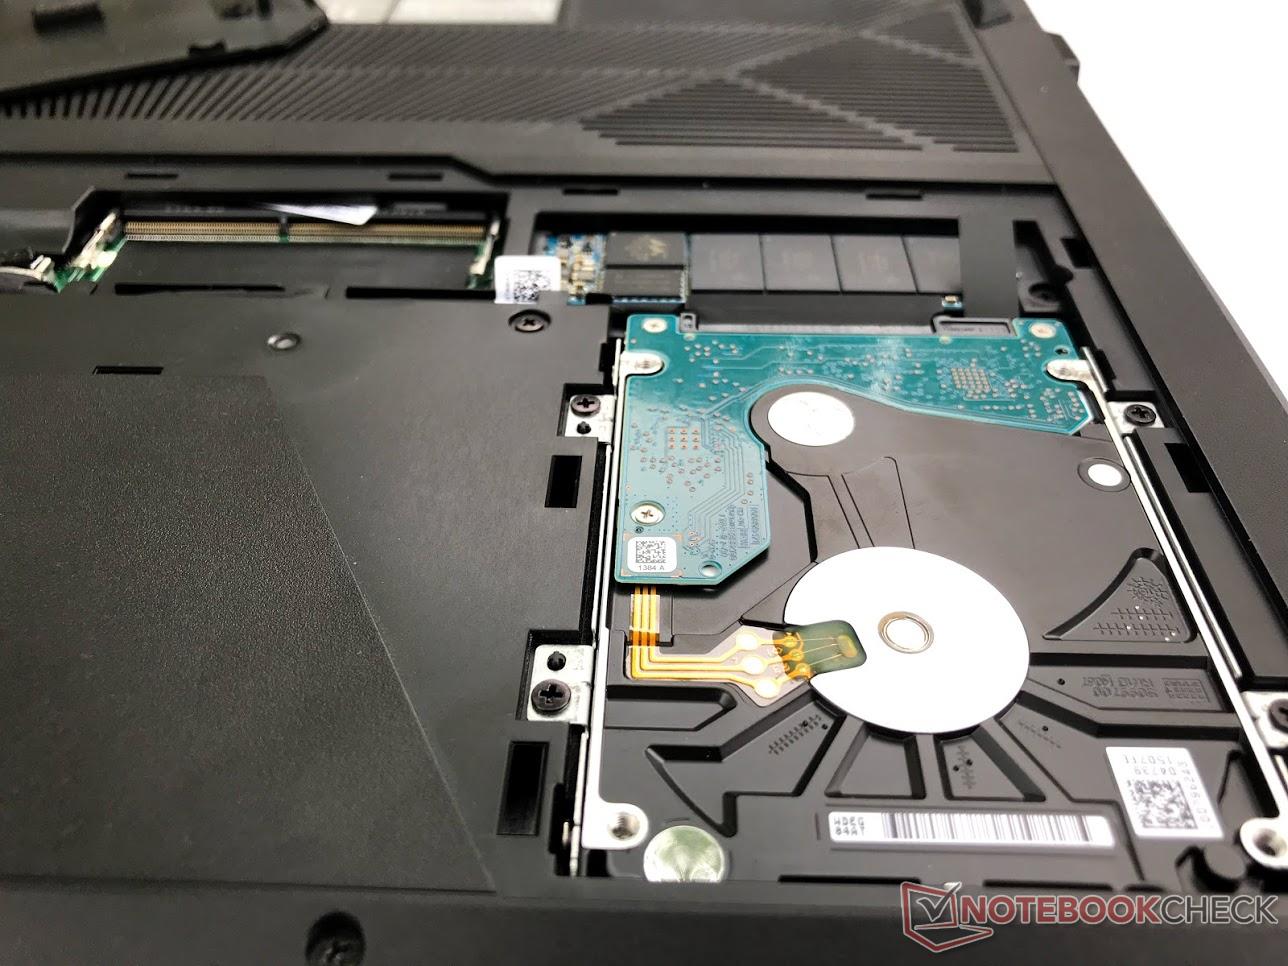
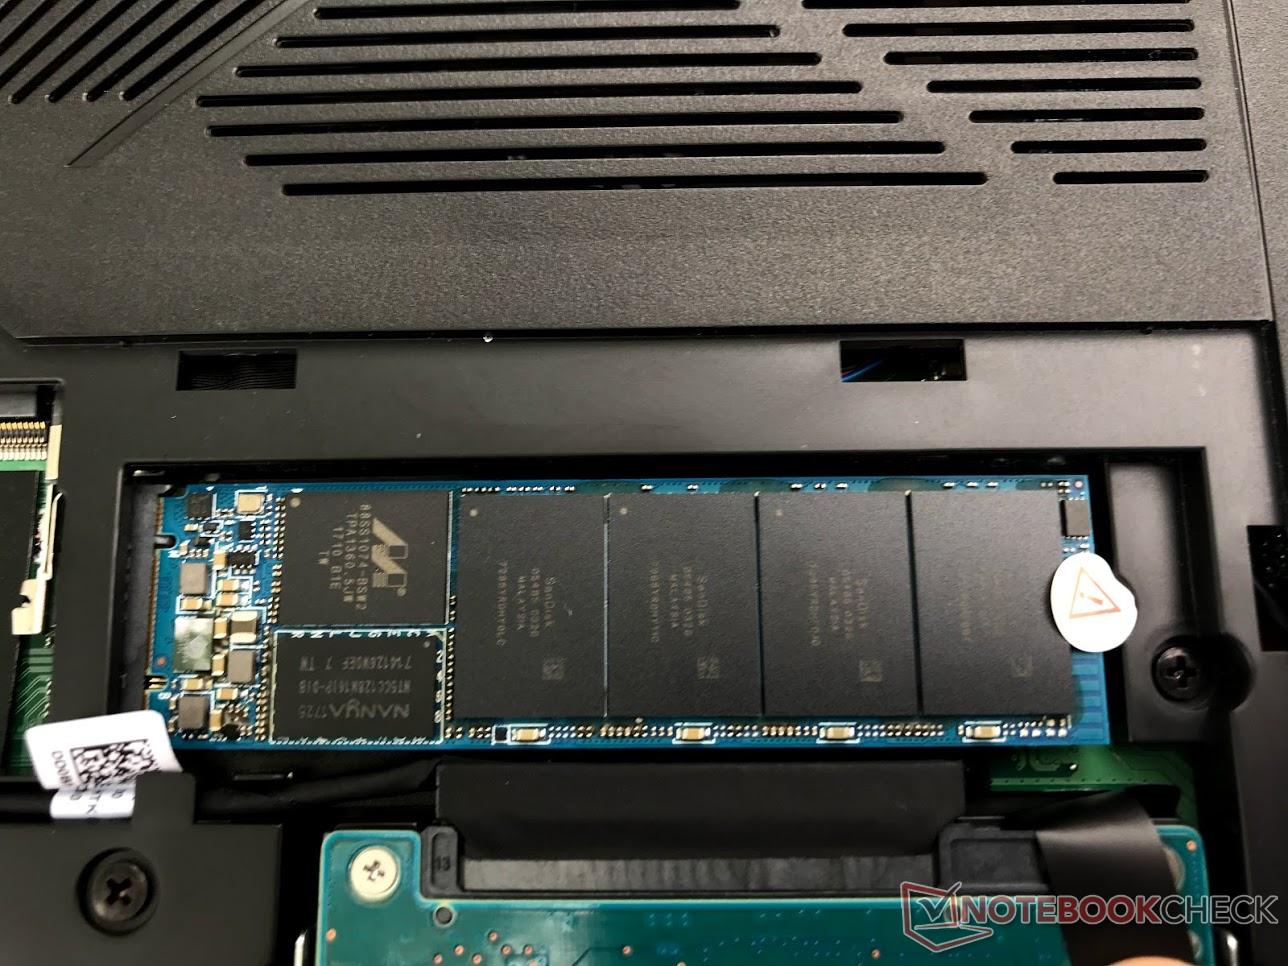
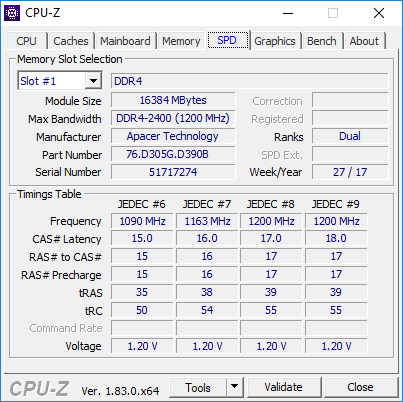
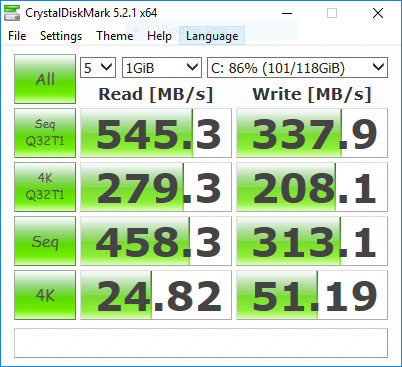
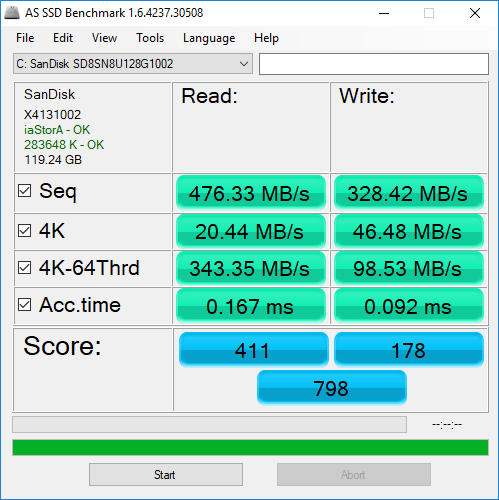
The FX503VM uses a SATA SSD (M.2 form factor) for the OS and a mechanical HDD for mass storage. This is a common configuration, but the SSD leaves a lot of room for improvement. In CrystalDiskMark, the SSD only manages 545 MB/s and 337 MB/s read and write speeds, respectively. This is at the lower range of SATA SSD drives and may be a point of frustration for some users that frequently move large files around. Smaller reads and writes (as measured by the 4K scores in CDM 5 and AS SSD) are also below average and may cause some small hiccups in load times. Devices equipped with the Samsung PM961, like the Dell Inspiron 15 7577, can more than double these speeds.
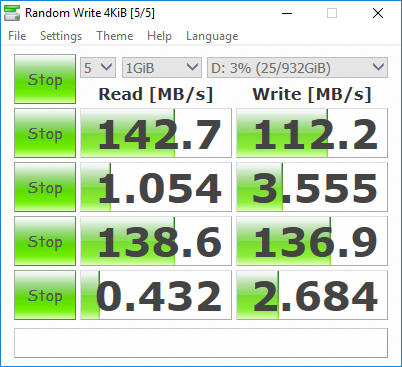
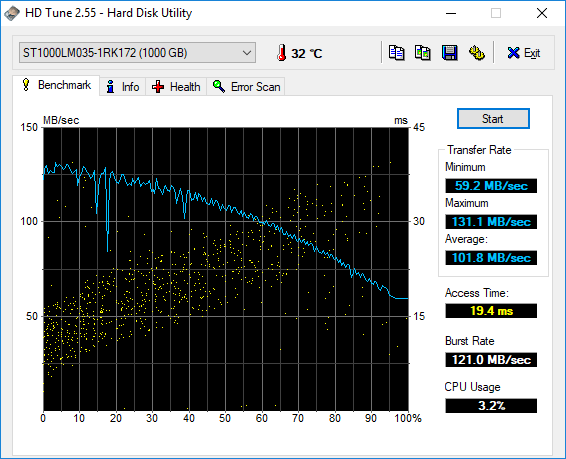
The mechanical HDD operates within expectation with no jarring spikes in access times.
| Asus FX503VM-EH73 SanDisk SD8SN8U128G1002 | Asus FX502VM-AS73 SK Hynix HFS256G39TND-N210A | Dell Inspiron 15 7000 7577 Samsung PM961 MZVLW256HEHP | Lenovo Legion Y520-15IKBM 80YY001APB ADATA SX7000NP 256 GB | Acer Nitro 5 AN515-51-788E Intel SSD 600p SSDPEKKW256G7 | |
|---|---|---|---|---|---|
| AS SSD | -9% | 199% | 60% | 41% | |
| Copy Game MB/s (MB/s) | 155.3 | 382.5 | 708 | ||
| Copy Program MB/s (MB/s) | 120.7 | 274.8 | 225.8 | ||
| Copy ISO MB/s (MB/s) | 202.2 | 814 | 1076 | ||
| Score Total (Points) | 798 | 822 3% | 2405 201% | 898 13% | 984 23% |
| Score Write (Points) | 178 | 200 12% | 594 234% | 291 63% | 344 93% |
| Score Read (Points) | 411 | 418 2% | 1241 202% | 409 0% | 446 9% |
| Access Time Write * (ms) | 0.09 | 0.266 -196% | 0.037 59% | 0.033 63% | 0.231 -157% |
| Access Time Read * (ms) | 0.17 | 0.104 39% | 0.058 66% | 0.069 59% | 0.129 24% |
| 4K-64 Write (MB/s) | 95.5 | 123.8 30% | 375.8 294% | 100.7 5% | 217.1 127% |
| 4K-64 Read (MB/s) | 343.4 | 342.3 0% | 929 171% | 255.9 -25% | 278 -19% |
| 4K Write (MB/s) | 46.48 | 63.6 37% | 100.2 116% | 110.6 138% | 75 61% |
| 4K Read (MB/s) | 20.44 | 26.01 27% | 46.95 130% | 30.9 51% | 27.86 36% |
| Seq Write (MB/s) | 328.4 | 130 -60% | 1181 260% | 795 142% | 521 59% |
| Seq Read (MB/s) | 476.3 | 492.6 3% | 2652 457% | 1221 156% | 1404 195% |
* ... smaller is better

GPU Performance
One of the defining factors in the Asus FX503VM is its Nvidia GeForce GTX 1060. While the GPU is common, this particular flavor is not. The FX503VM's GPU has 3 GB of VRAM onboard, which is half that of most other 1060-specced notebooks. Otherwise, everything else is similar to other laptops. Clock speeds, bus width, and the number of CUDA cores remains the same.
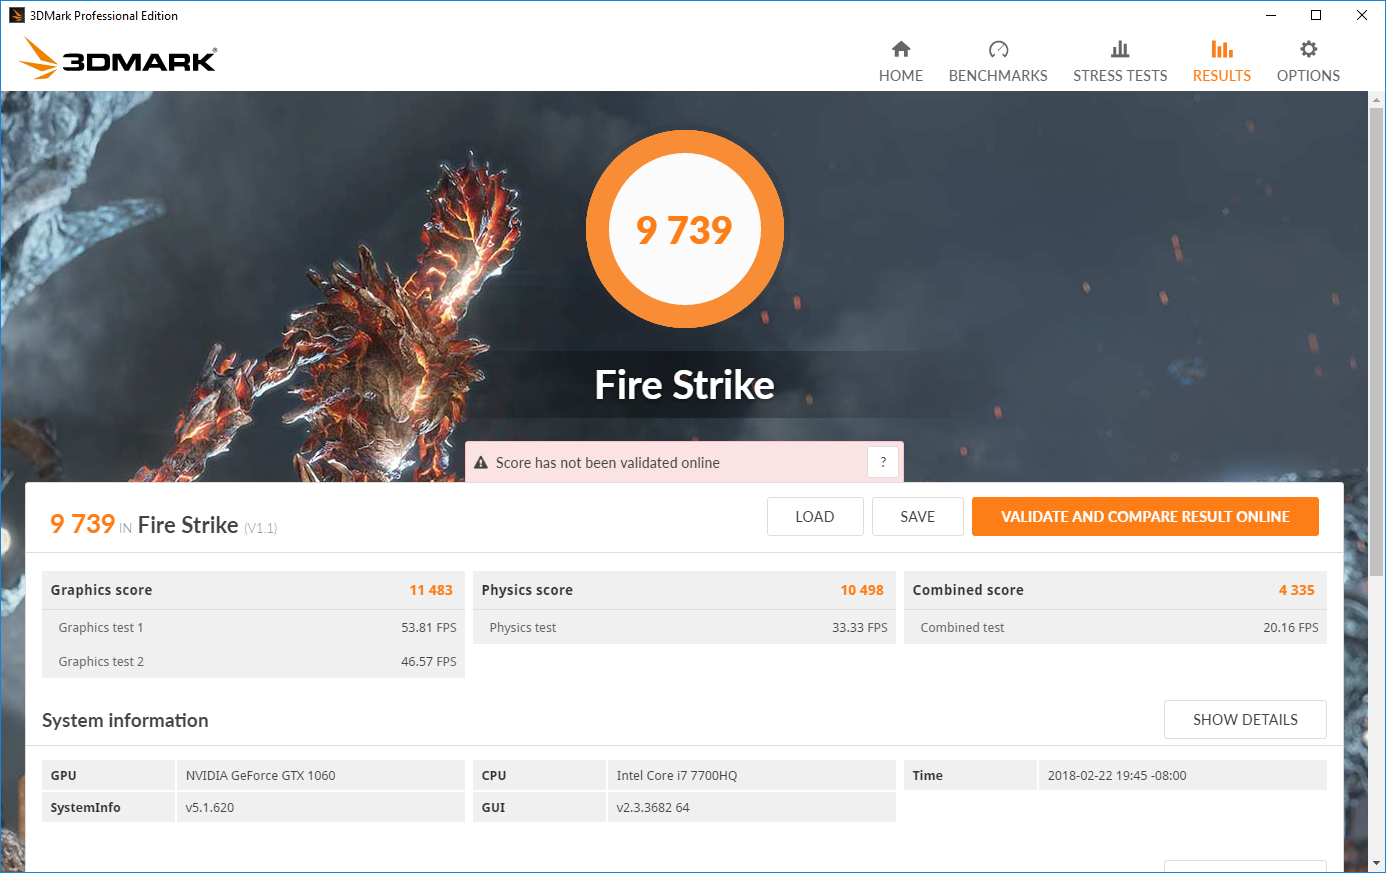
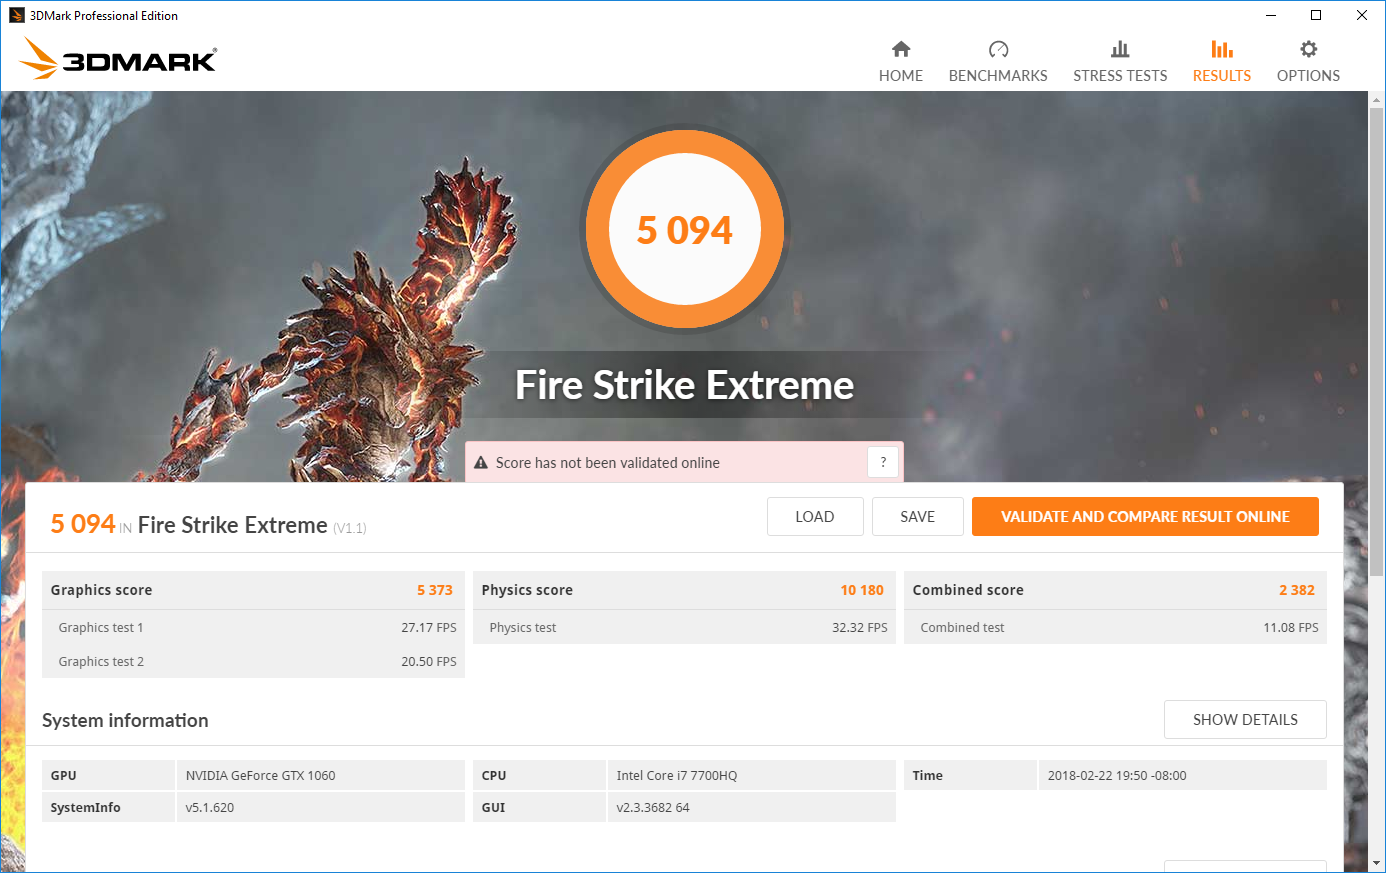
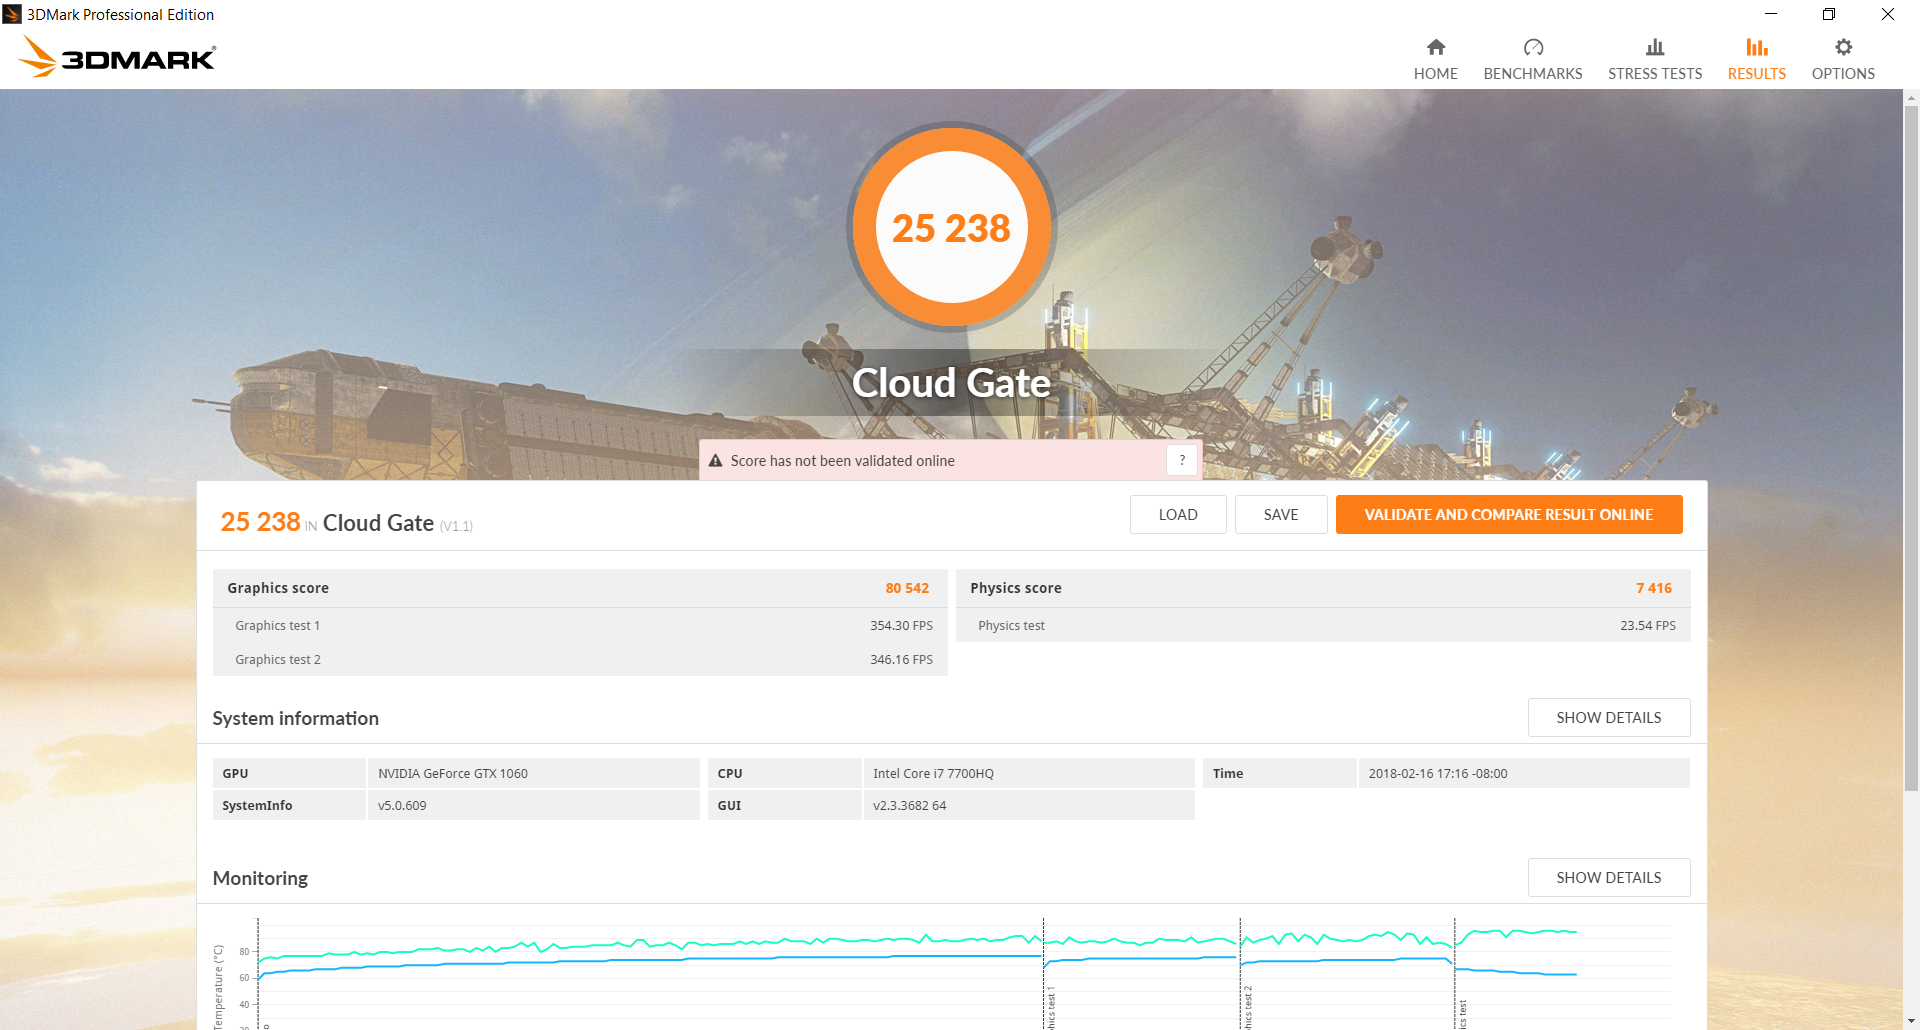
To that end, the limited VRAM should only present a problem at higher resolutions (1440p or higher) and some settings in certain games. This is indeed the case. In 3DMark's Fire Strike, the FX503VM lands just above average. However, scores for Fire Strike Extreme (which is rendered at 2560x1440) are below the average for other GTX 1060 laptops. The deficit is not terribly significant, and repeating testing sees the gap sit between 1-4%. Most games will run smoothly at high or ultra settings, but some more intensive settings that require more dedicated VRAM (like volumetric smoke) may be entirely unavailable. G-Sync is also not supported by any variant of the FX503VM.
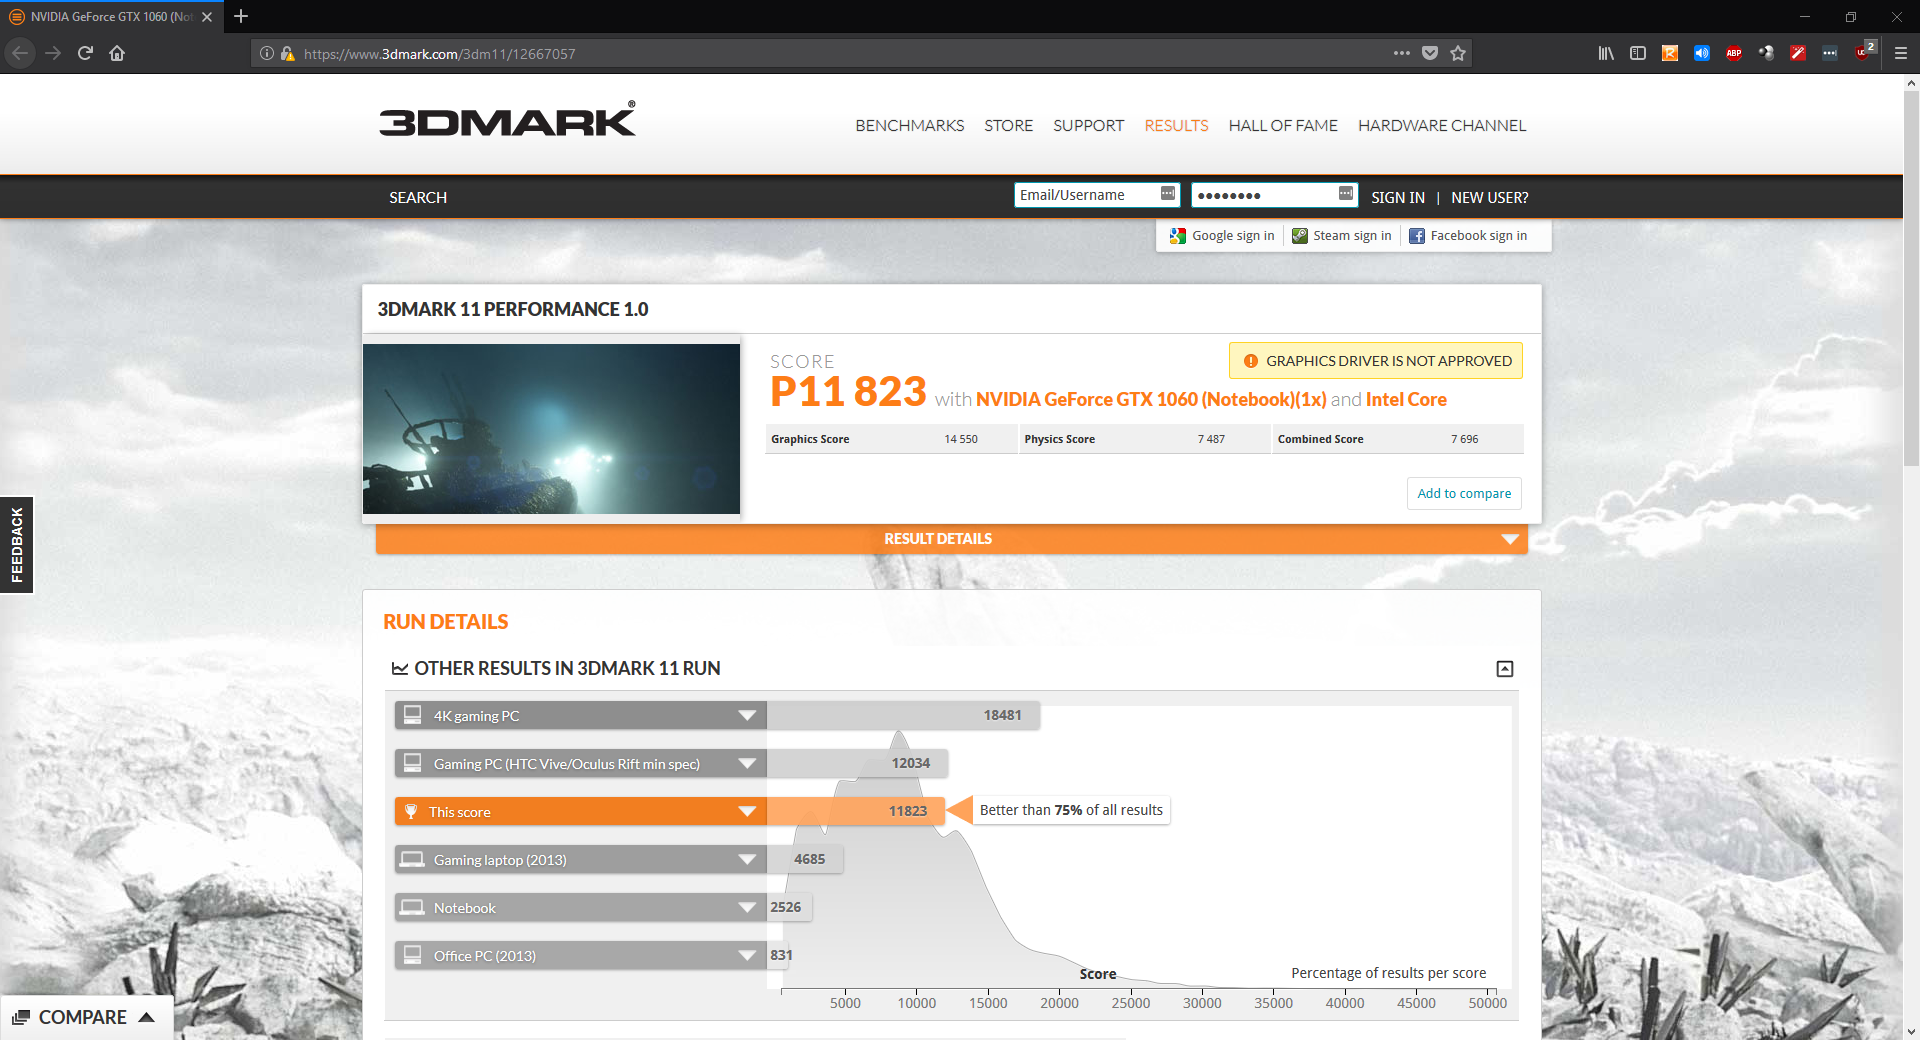
| 3DMark 11 Performance | 11823 points | |
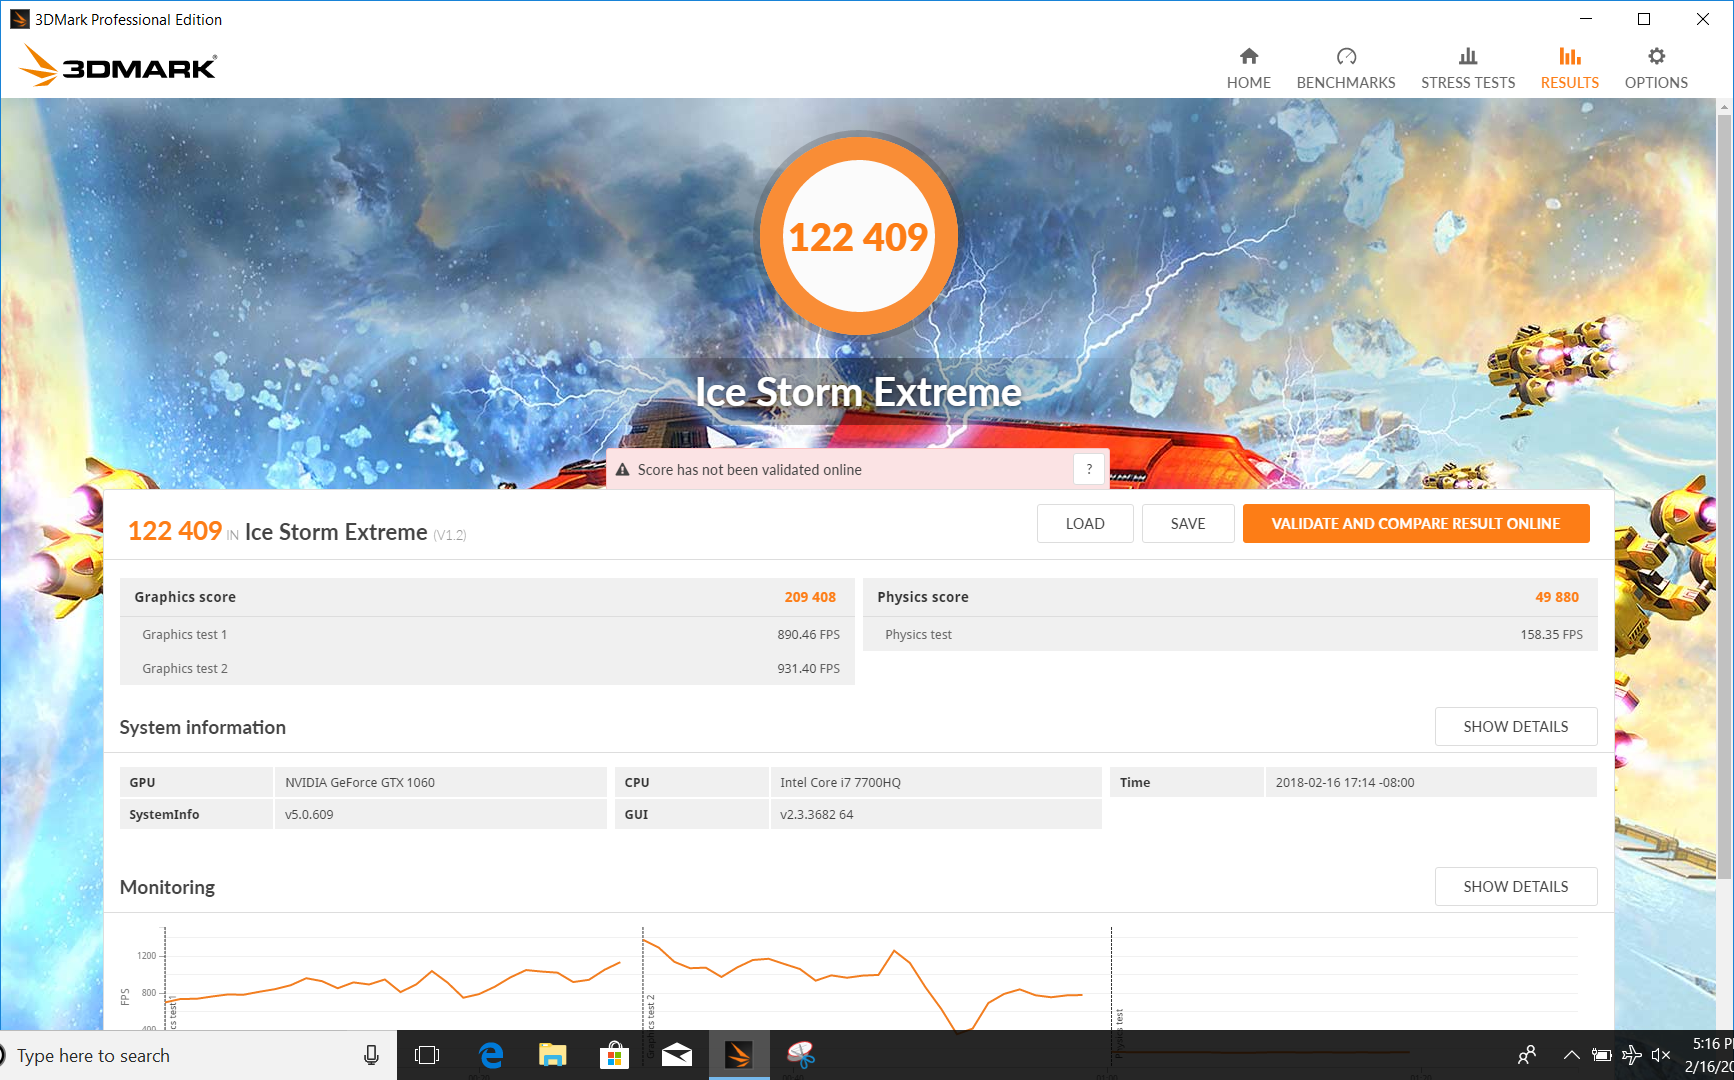
| 3DMark Ice Storm Standard Score | 132724 points | |
| 3DMark Cloud Gate Standard Score | 25238 points | |
| 3DMark Fire Strike Score | 9739 points | |
| 3DMark Fire Strike Extreme Score | 5094 points | |
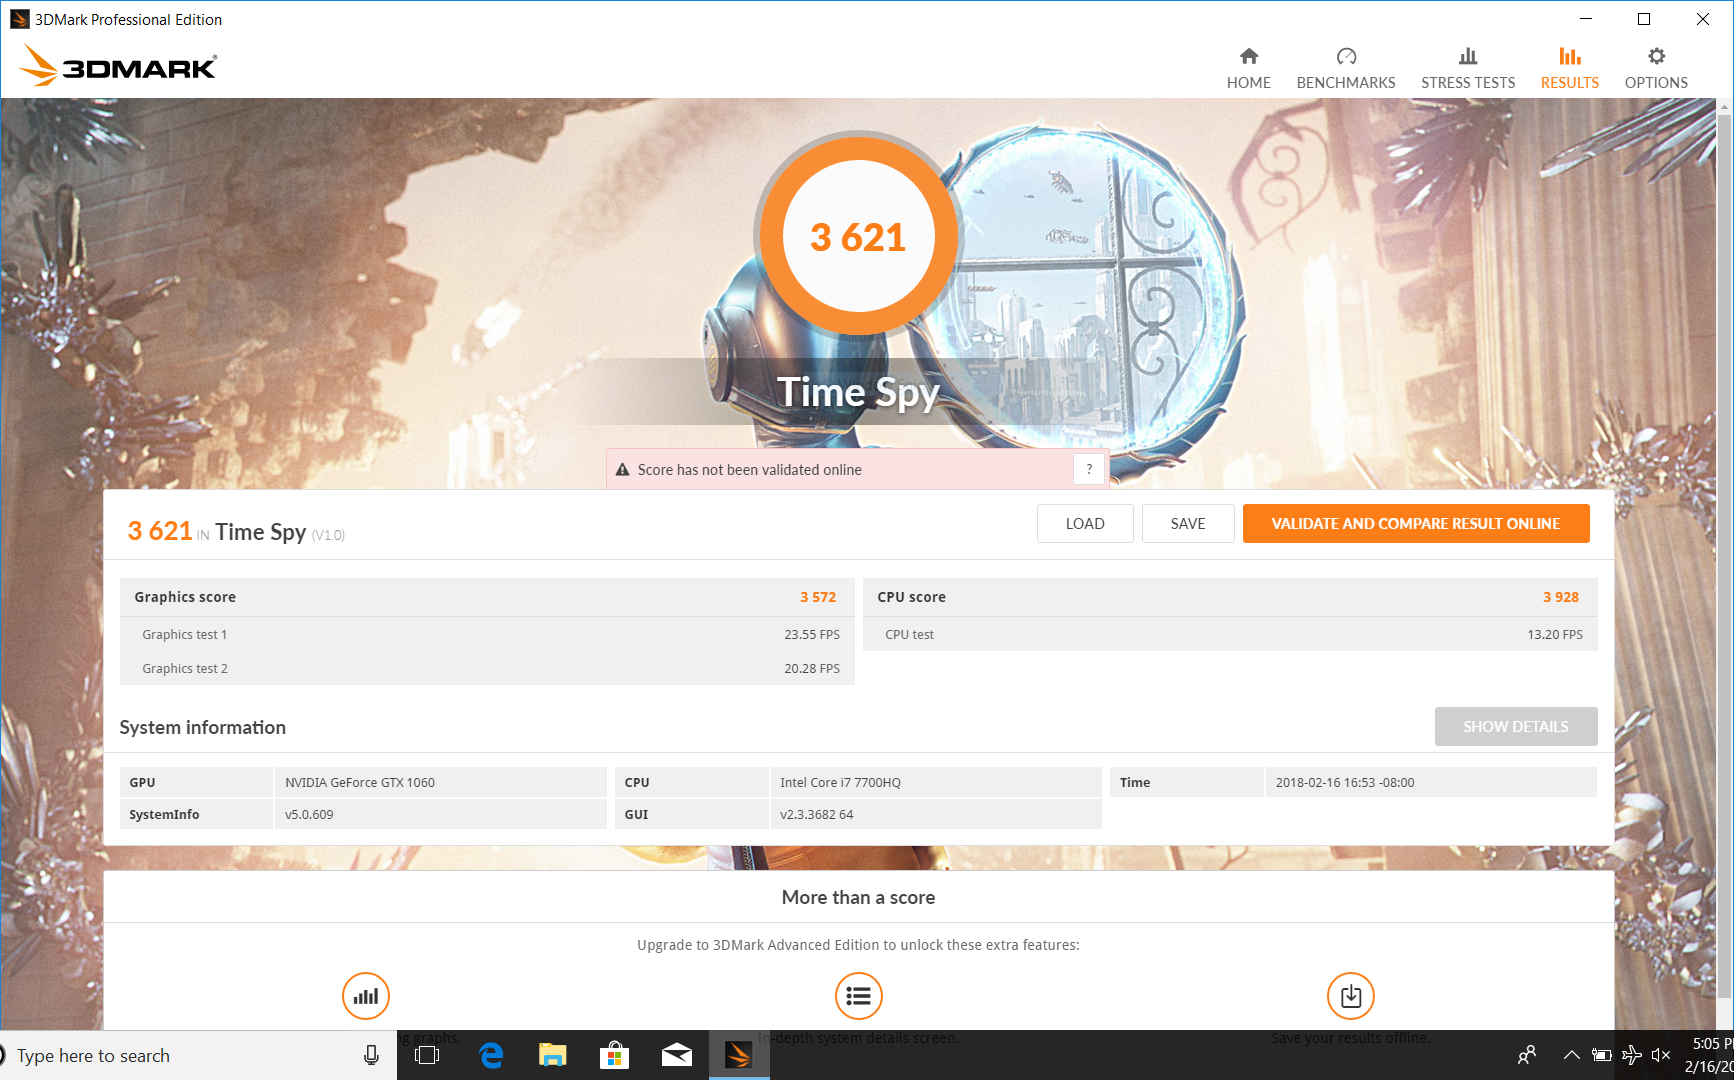
| 3DMark Time Spy Score | 3621 points | |
Help | ||
Gaming Performance
As mentioned, games run well at FHD/Ultra settings. Most modern AAA titles manage to hit or exceed 60 fps, but more demanding titles will need to be played at High settings or lower to reach this threshold. Lighter titles (like Rocket League or League of Legends) can easily be played at higher framerates (in excess of 120 fps); the 120 Hz display option may be enticing to competitive gamers.
| The Witcher 3 - 1920x1080 Ultra Graphics & Postprocessing (HBAO+) (sort by value) | |
| Asus FX503VM-EH73 | |
| Dell Inspiron 15 7000 7577 | |
| Lenovo Legion Y520-15IKBM 80YY001APB | |
| HP Omen 15-ce002ng | |
| Acer Aspire VN7-593G-73HP V15 Nitro BE | |
| Acer Nitro 5 AN515-51-788E | |
| Acer Aspire VX5-591G-75C4 VX15 | |
| MSI GE63VR 7RF Raider | |
| Gigabyte Aero 15X | |
| Aorus X5 v7 | |
| Average NVIDIA GeForce GTX 1060 Mobile (24 - 42.3, n=60) | |
| Average of class Gaming (95 - 240, n=8, last 2 years) | |
| Fallout 4 - 1920x1080 Ultra Preset AA:T AF:16x (sort by value) | |
| Asus FX503VM-EH73 | |
| Asus FX502VM-AS73 | |
| Dell Inspiron 15 7000 7577 | |
| Average NVIDIA GeForce GTX 1060 Mobile (57.1 - 77, n=17) | |
| Rise of the Tomb Raider - 1920x1080 Very High Preset AA:FX AF:16x (sort by value) | |
| Asus FX503VM-EH73 | |
| Asus FX502VM-AS73 | |
| Dell Inspiron 15 7000 7577 | |
| HP Omen 15-ce002ng | |
| Acer Aspire VN7-593G-73HP V15 Nitro BE | |
| MSI GE63VR 7RF Raider | |
| Aorus X5 v7 | |
| Acer Nitro 5 Spin NP515-51-86CX | |
| Average NVIDIA GeForce GTX 1060 Mobile (51 - 68.8, n=37) | |
| Hitman 2016 - 1920x1080 Ultra / On AA:SM AF:16x (sort by value) | |
| Asus FX503VM-EH73 | |
| Average NVIDIA GeForce GTX 1060 Mobile (46 - 61, n=7) | |
| Doom - 1920x1080 Ultra Preset AA:SM (sort by value) | |
| Asus FX503VM-EH73 | |
| Asus FX502VM-AS73 | |
| HP Omen 15-ce002ng | |
| Aorus X5 v7 | |
| Average NVIDIA GeForce GTX 1060 Mobile (66 - 103.3, n=17) | |
| Deus Ex Mankind Divided - 1920x1080 Ultra Preset AA:2xMS AF:8x (sort by value) | |
| Asus FX503VM-EH73 | |
| HP Omen 15-ce002ng | |
| Acer Aspire VN7-593G-73HP V15 Nitro BE | |
| MSI GE63VR 7RF Raider | |
| Average NVIDIA GeForce GTX 1060 Mobile (26.9 - 39, n=11) | |
| Civilization 6 - 1920x1080 Ultra Preset AA:4xMS (sort by value) | |
| Asus FX503VM-EH73 | |
| Average NVIDIA GeForce GTX 1060 Mobile (42.8 - 71, n=5) | |
| Prey - 1920x1080 Very High Preset AA:2TX SM AF:16x (sort by value) | |
| Asus FX503VM-EH73 | |
| Dell Inspiron 15 7000 7577 | |
| HP Omen 15-ce002ng | |
| Acer Nitro 5 AN515-51-788E | |
| Average NVIDIA GeForce GTX 1060 Mobile (97 - 110.3, n=7) | |
| Rocket League - 1920x1080 High Quality AA:High FX (sort by value) | |
| Asus FX503VM-EH73 | |
| HP Omen 15-ce002ng | |
| Acer Nitro 5 AN515-51-788E | |
| Average NVIDIA GeForce GTX 1060 Mobile (136 - 181, n=7) | |
| Playerunknown's Battlegrounds (PUBG) - 1920x1080 High Preset (sort by value) | |
| Asus FX503VM-EH73 | |
| Acer Nitro 5 AN515-51-788E | |
| Average NVIDIA GeForce GTX 1060 Mobile (61 - 69.4, n=4) | |
| Middle-earth: Shadow of War - 1920x1080 Ultra Preset AA:T (sort by value) | |
| Asus FX503VM-EH73 | |
| Dell Inspiron 15 7000 7577 | |
| Gigabyte Aero 15X | |
| Average NVIDIA GeForce GTX 1060 Mobile (52 - 54, n=5) | |
| Kingdom Come: Deliverance - 1920x1080 Ultra High Preset (sort by value) | |
| Asus FX503VM-EH73 | |
| Average NVIDIA GeForce GTX 1060 Mobile (36 - 45.2, n=5) | |
| low | med. | high | ultra | |
|---|---|---|---|---|
| The Witcher 3 (2015) | 37 | |||
| Fallout 4 (2015) | 73 | |||
| Rise of the Tomb Raider (2016) | 57 | |||
| Hitman 2016 (2016) | 61 | |||
| Doom (2016) | 92 | |||
| Deus Ex Mankind Divided (2016) | 39 | |||
| Civilization 6 (2016) | 71 | |||
| Prey (2017) | 97 | |||
| Rocket League (2017) | 145 | |||
| Playerunknown's Battlegrounds (PUBG) (2017) | 61 | |||
| Middle-earth: Shadow of War (2017) | 52 | |||
| Kingdom Come: Deliverance (2018) | 38 |
Stress Test
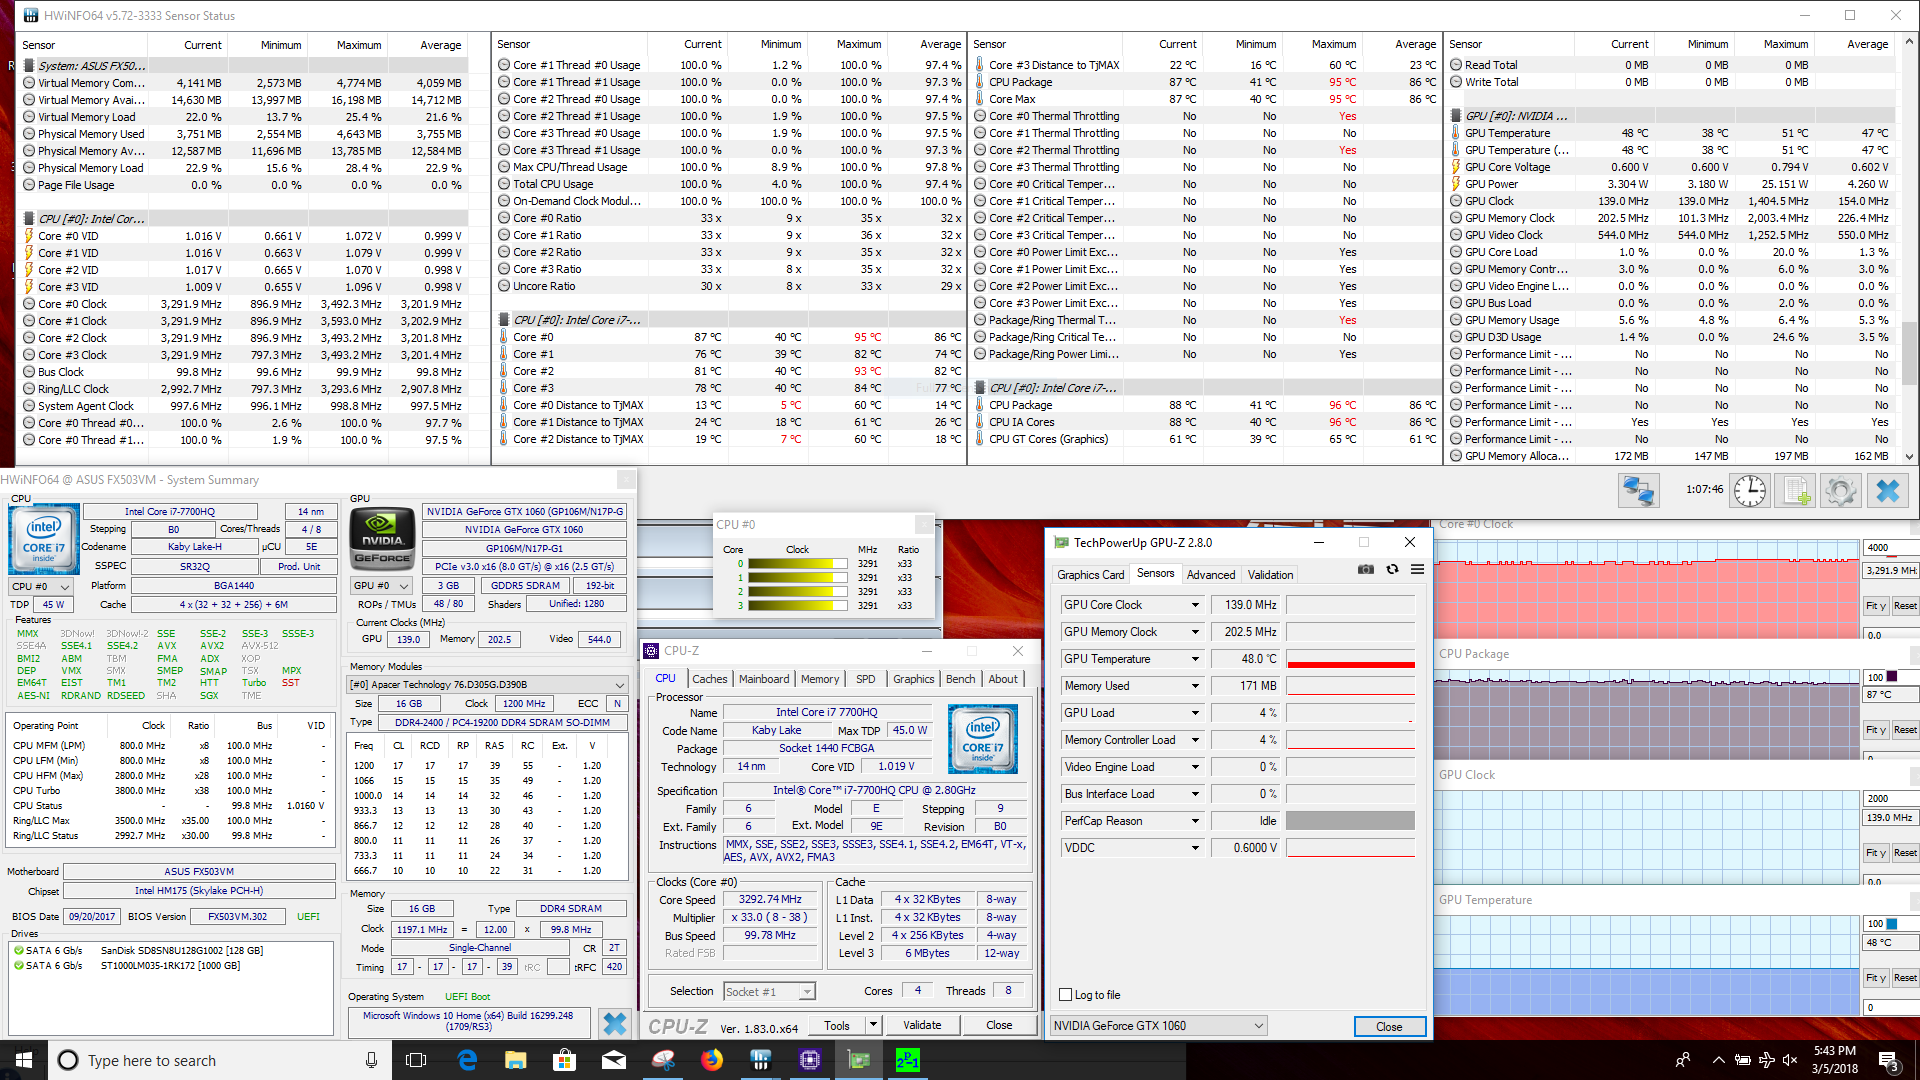
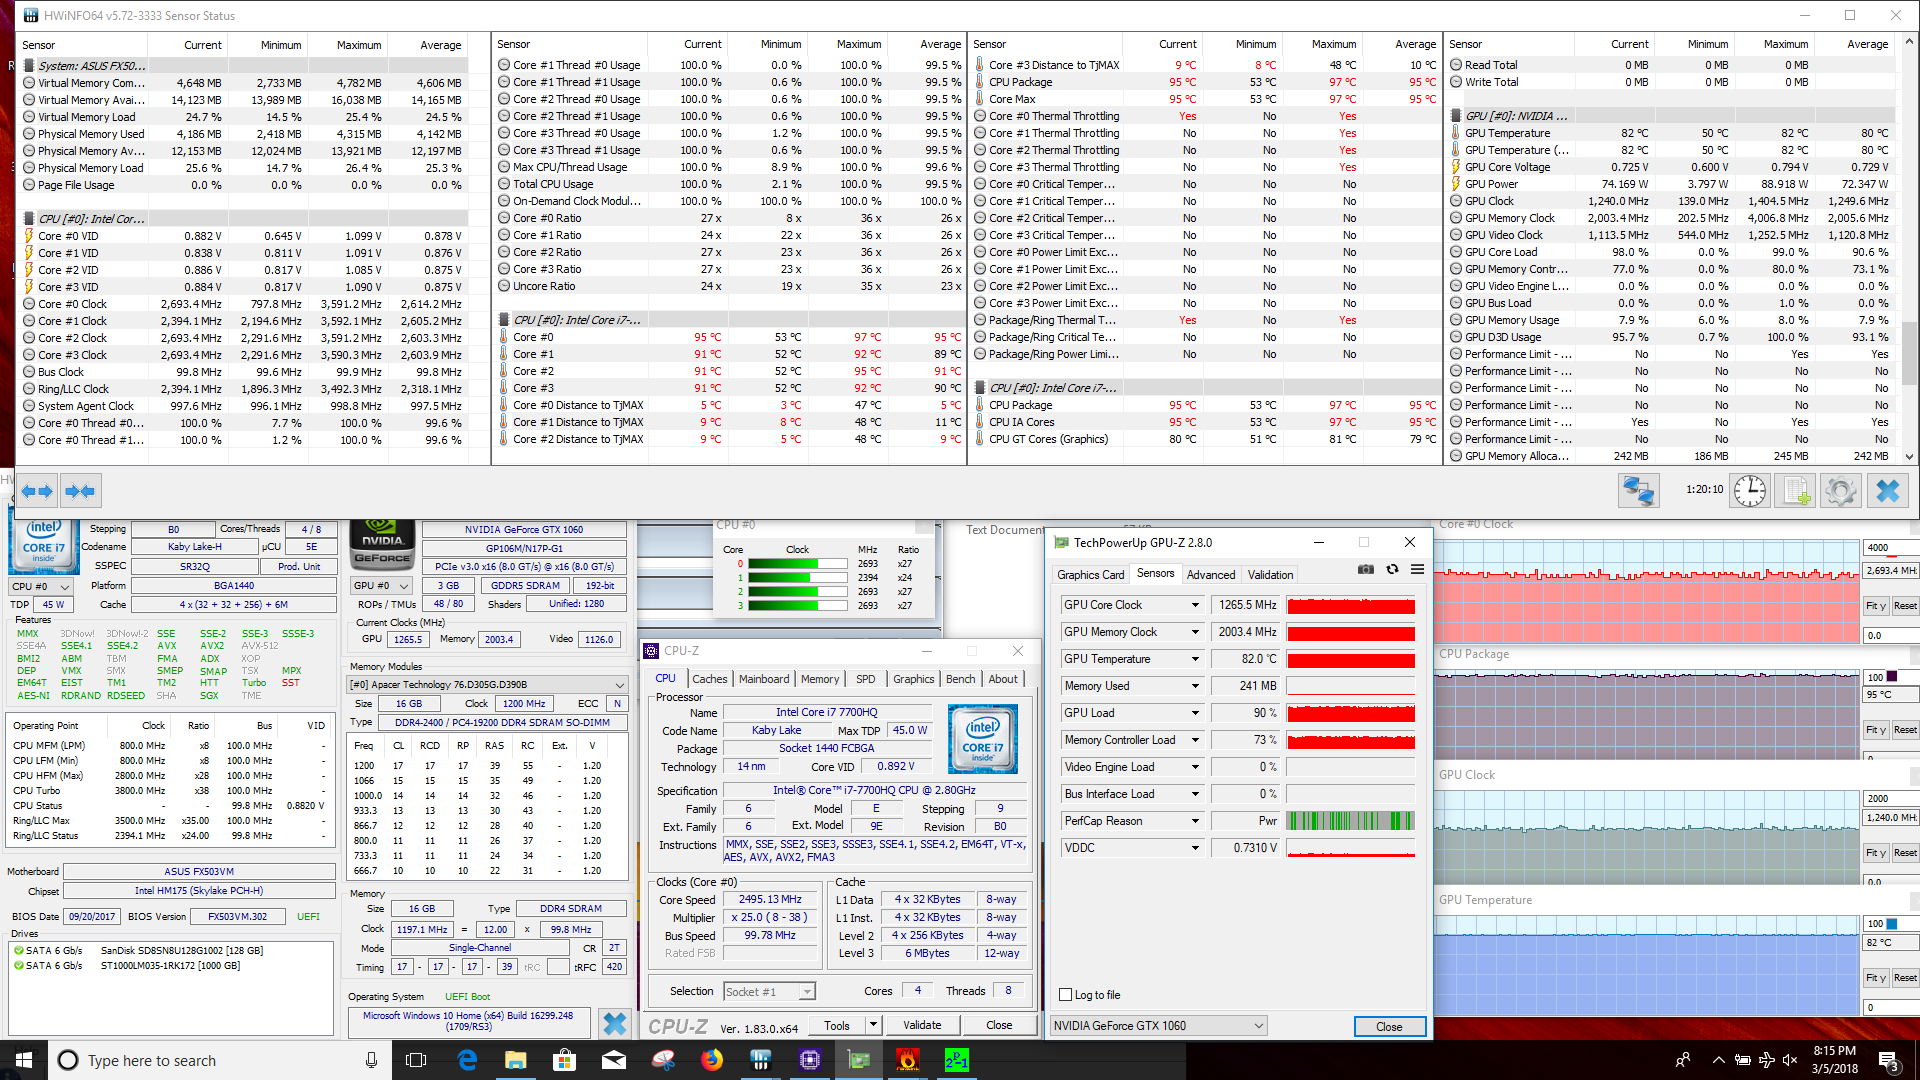
The FX503VM performs well under stress, but synthetic tests push the laptop to its limits. Under Prime95 alone, the CPU manages an average clock of 3.2 GHz and intermittently boosts to 3.6 GHz across all four cores. Temperatures remain borderline reasonable (for a gaming laptop) at 86° C. FurMark by itself presents little problem for the machine as well; the GPU manages to maintain a 1250 MHz clock at 75° C. Running both stress tests concurrently, however, is problematic for the CPU in particular. The 7700HQ is able to boost to 3.6 GHz on all cores but is forced to throttle down to 2.6 GHz due to high temperatures (average of 95° C). Keep in mind that these tests are designed to fully stress every part of the CPU and GPU; users are unlikely to encounter such heavy workloads.
Gaming stress is well-managed. During an hour-long session of The Witcher 3, the CPU bursts when needed to 3.8 GHz and otherwise hangs back at a lower clock. The result is a comparatively cool core temperature, which averages about 73° C. The GPU also performs admirably, hitting about 1600 MHz while keeping fairly cool at 77° C.

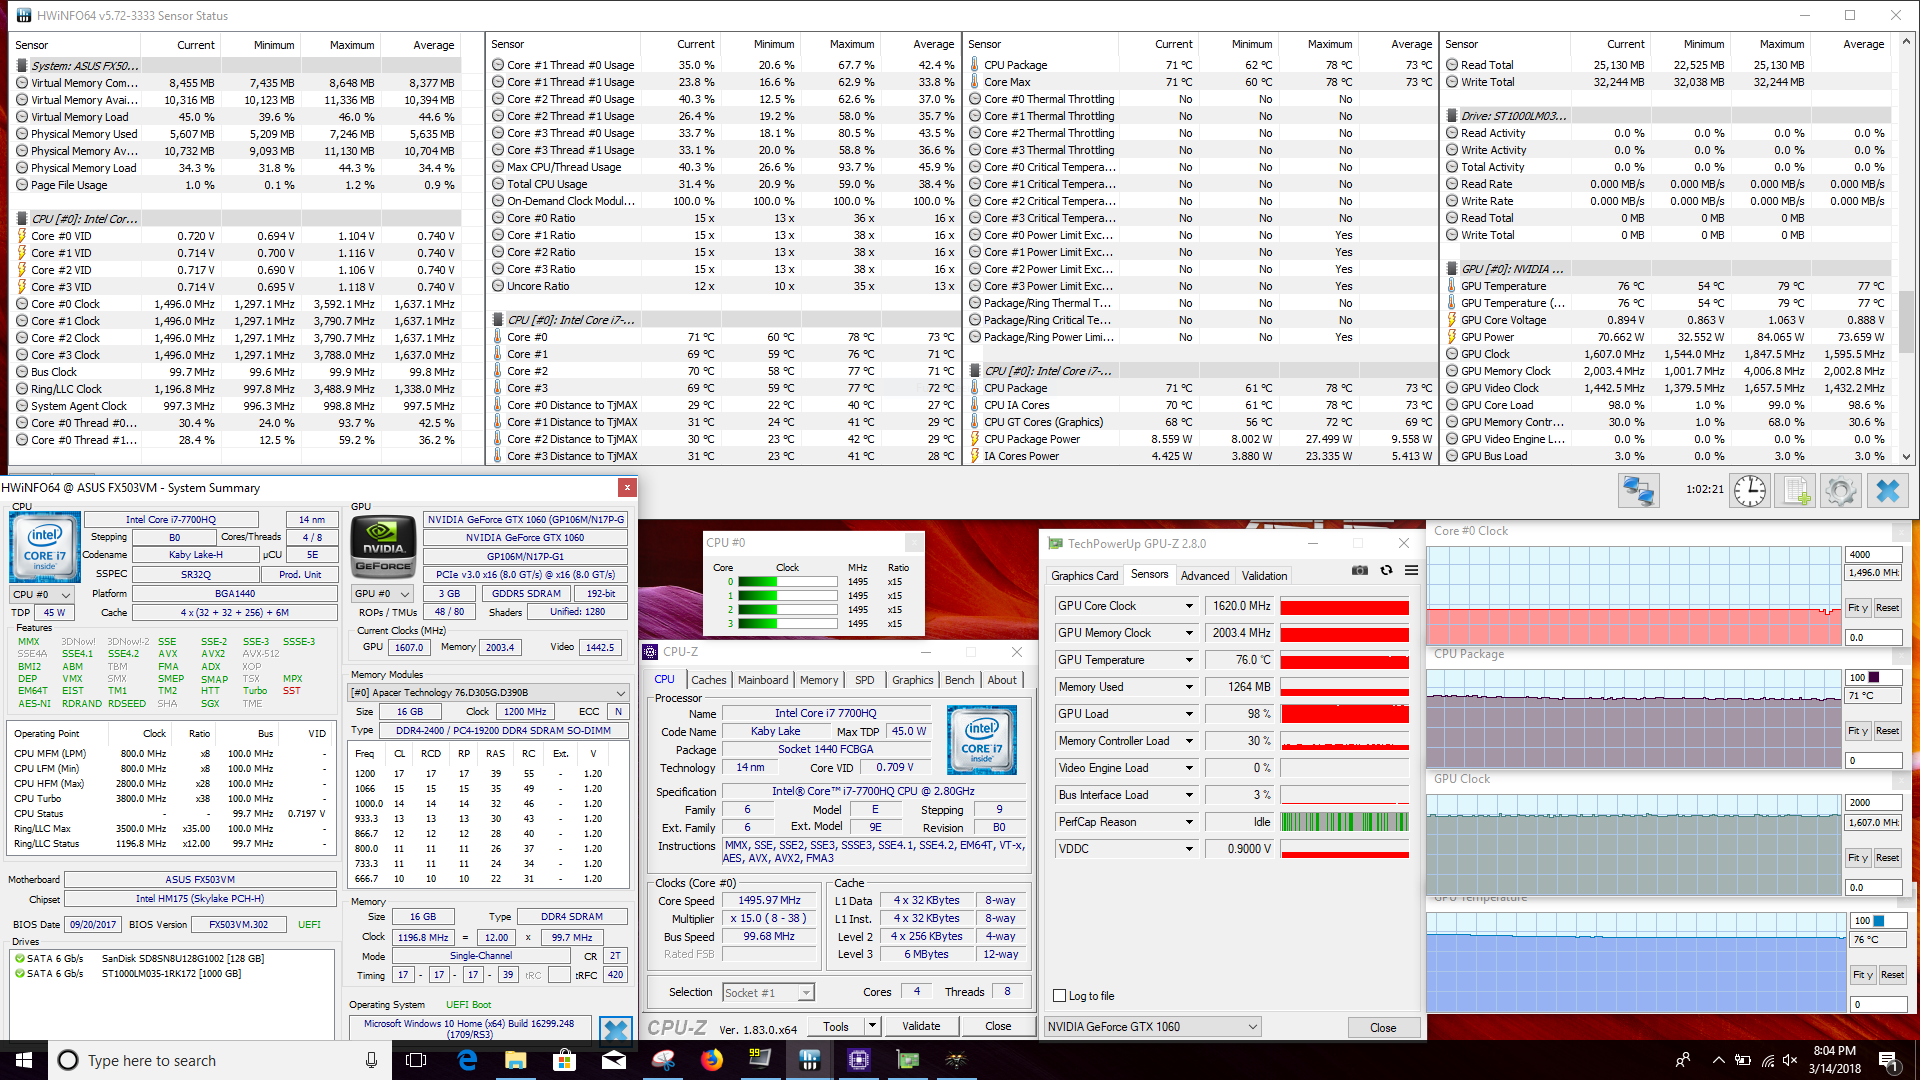
| CPU Clock (GHz) | GPU Clock (MHz) | Average CPU Temperature (°C) | Average GPU Temperature (°C) | |
| Prime95 Stress | 3.2 | - | 86 | - |
| FurMark Stress | 3.5 | 73 | 1251 | 75 |
| Prime95 + FurMark Stress | 2.6 | 95 | 1250 | 80 |
| Witcher 3 Stress | 1.6 | 73 | 1596 | 77 |
Emissions
System Noise
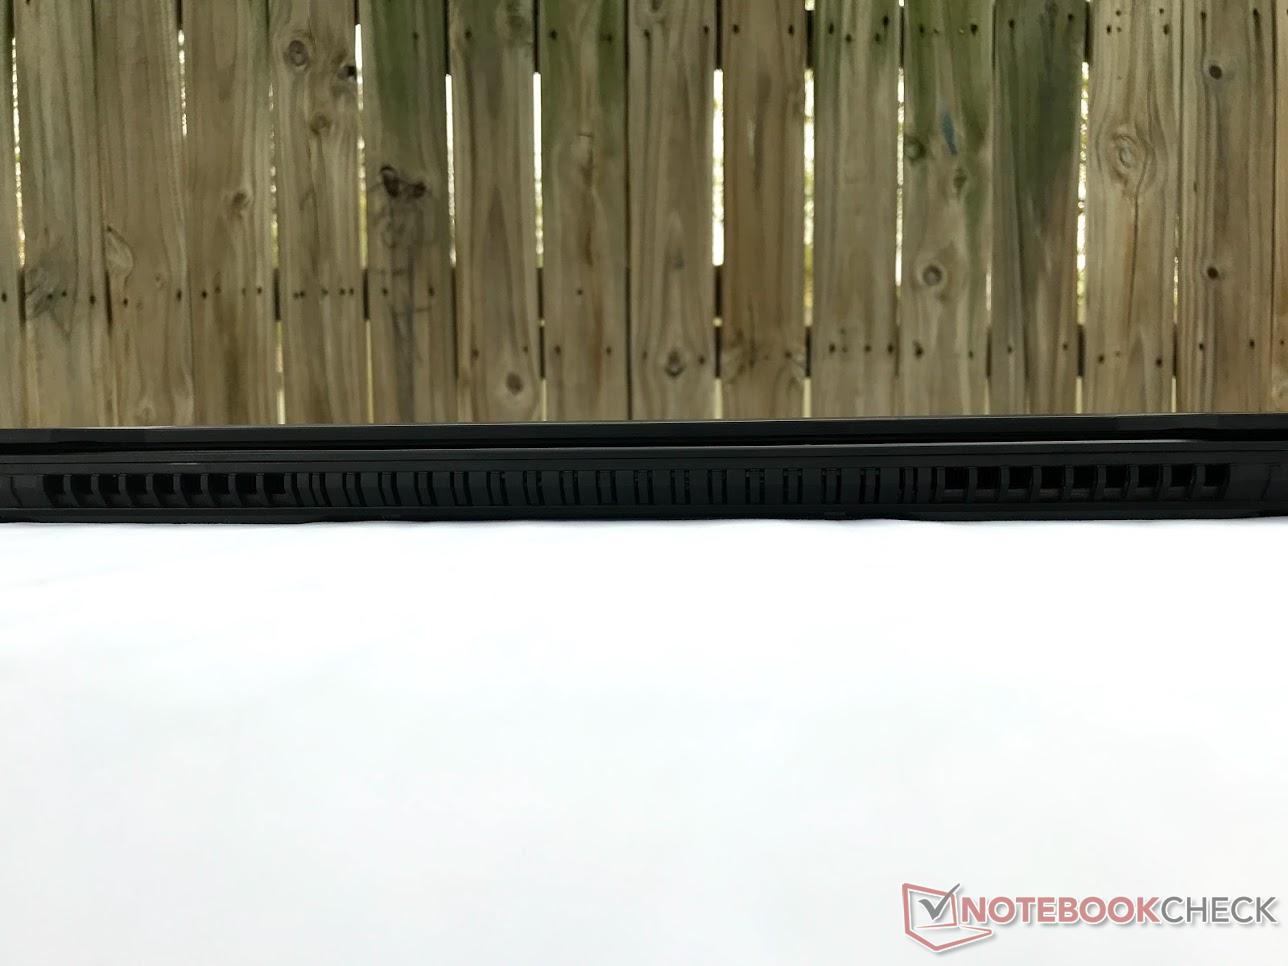
While the fans do a good job of dumping waste heat when under load, they do so at the cost of noise. During gameplay sessions, the fans ramp up to about 50 dB(A) in under 5 minutes. This is louder than competitors, which typically average 40-45 dB(A). However, it should be noted that the chassis of the FX503VM is a fair bit thinner than these other devices. As such, airflow is more restricted and will generate more force (and noise) when exhausted. The fans' high pitch doesn't do the device any favors, either. Headphones are highly recommended when gaming. During normal use (word processing, web browsing), the fans spin slowly and are near silent.
Noise level
| Idle |
| 29.6 / 29.6 / 29.6 dB(A) |
| Load |
| 37.3 / 53.7 dB(A) |
 | ||
30 dB silent 40 dB(A) audible 50 dB(A) loud |
||
min: | ||
| Asus FX503VM-EH73 GeForce GTX 1060 Mobile, i7-7700HQ, SanDisk SD8SN8U128G1002 | Asus FX502VM-AS73 GeForce GTX 1060 Mobile, i7-7700HQ, SK Hynix HFS256G39TND-N210A | Dell Inspiron 15 7000 7577 GeForce GTX 1060 Max-Q, i5-7300HQ, Samsung PM961 MZVLW256HEHP | Lenovo Legion Y520-15IKBM 80YY001APB GeForce GTX 1060 Max-Q, i5-7300HQ, ADATA SX7000NP 256 GB | HP Omen 15-ce002ng GeForce GTX 1060 Max-Q, i7-7700HQ, Samsung PM961 MZVLW256HEHP | Acer Aspire VN7-593G-73HP V15 Nitro BE GeForce GTX 1060 Mobile, i7-7700HQ, Seagate Mobile HDD 1TB ST1000LM035 | Acer Nitro 5 AN515-51-788E GeForce GTX 1050 Ti Mobile, i7-7700HQ, Intel SSD 600p SSDPEKKW256G7 | Acer Aspire VX5-591G-75C4 VX15 GeForce GTX 1050 Ti Mobile, i7-7700HQ, Toshiba MQ01ABD100 | |
|---|---|---|---|---|---|---|---|---|
| Noise | -6% | 10% | -4% | -5% | -1% | -0% | -1% | |
| off / environment * (dB) | 27.8 | 28.7 -3% | 28 -1% | 30 -8% | 30.4 -9% | 30.6 -10% | 30.4 -9% | |
| Idle Minimum * (dB) | 29.6 | 30.6 -3% | 28 5% | 30.5 -3% | 30 -1% | 30.9 -4% | 30.6 -3% | 31.4 -6% |
| Idle Average * (dB) | 29.6 | 30.6 -3% | 28 5% | 33 -11% | 33 -11% | 30.9 -4% | 30.7 -4% | 31.4 -6% |
| Idle Maximum * (dB) | 29.6 | 31 -5% | 28 5% | 36.1 -22% | 37 -25% | 31.5 -6% | 30.7 -4% | 31.4 -6% |
| Load Average * (dB) | 37.3 | 46.2 -24% | 30.3 19% | 39.4 -6% | 41 -10% | 40.7 -9% | 43 -15% | 36.8 1% |
| Witcher 3 ultra * (dB) | 49.8 | 39.5 21% | 42 16% | 45.5 9% | 39.7 20% | |||
| Load Maximum * (dB) | 53.7 | 52.3 3% | 46.5 13% | 41.5 23% | 50 7% | 43.9 18% | 45.8 15% | 41.3 23% |
* ... smaller is better
Temperature
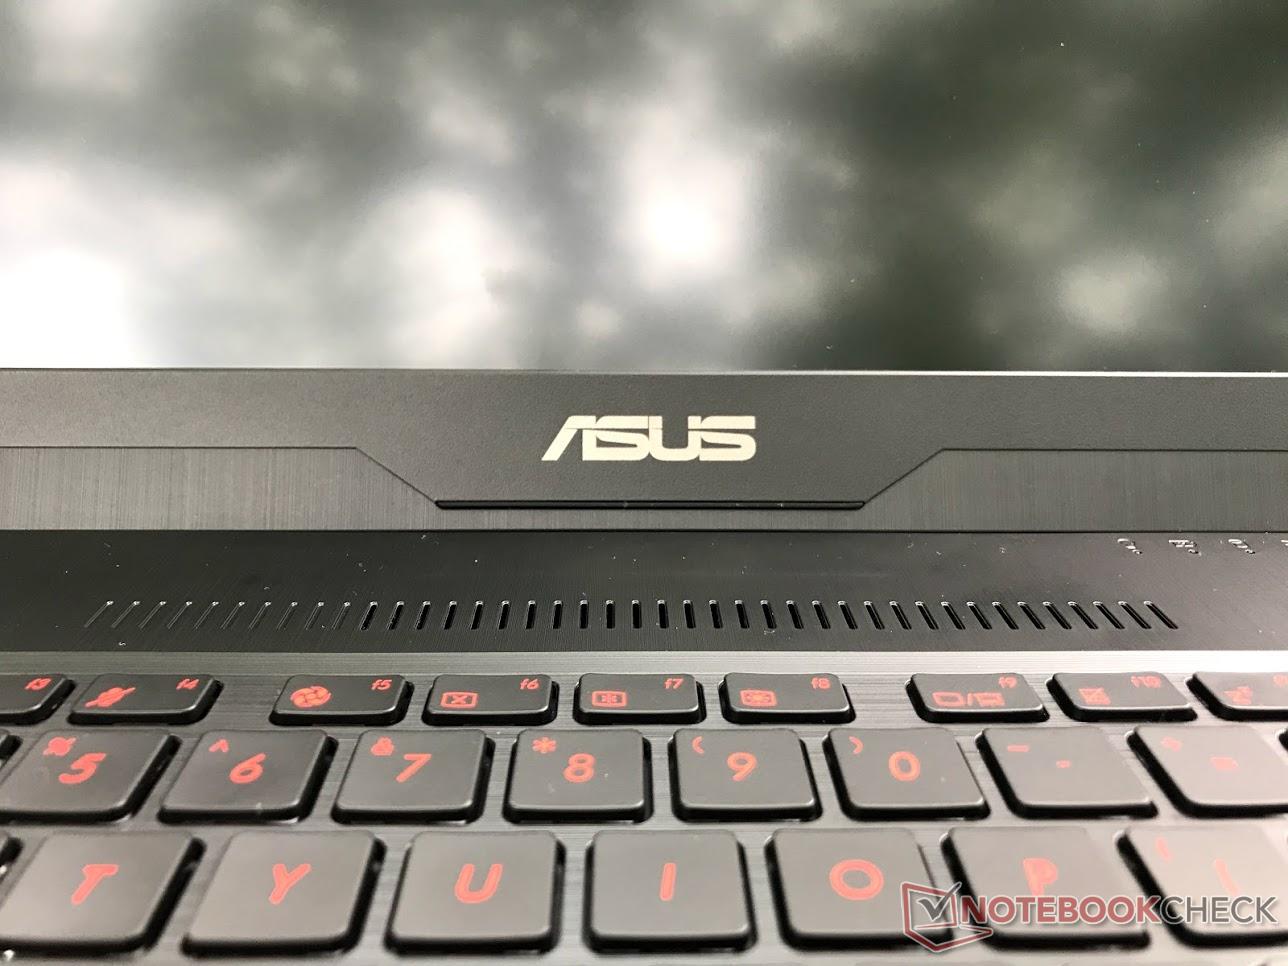
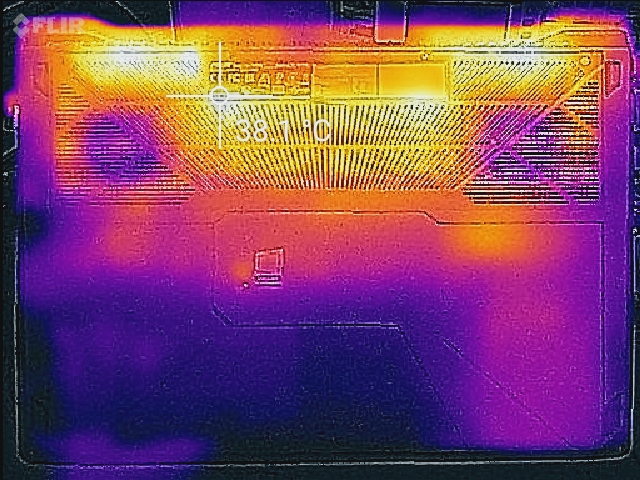
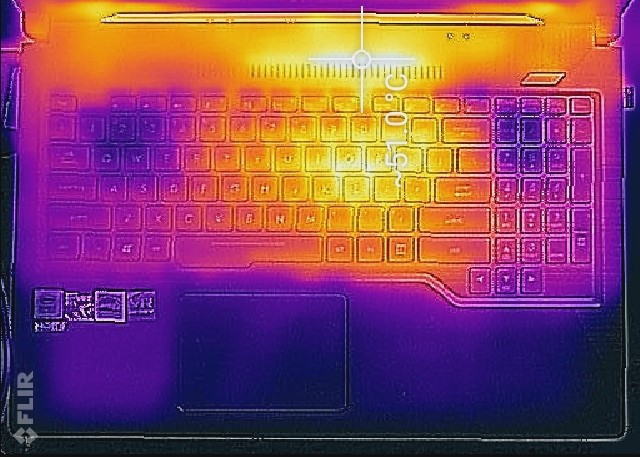
Asus has done a good job in managing the flow of heat. The rear vents get hot to the touch (about 50-52° C), but the keyboard remains cool. There is a vent directly above the middle of the function row that feels warm when the device is under load, but users' hands shouldn't regularly touch this section. The middle of the keyboard is the warmest section but doesn't get uncomfortable.
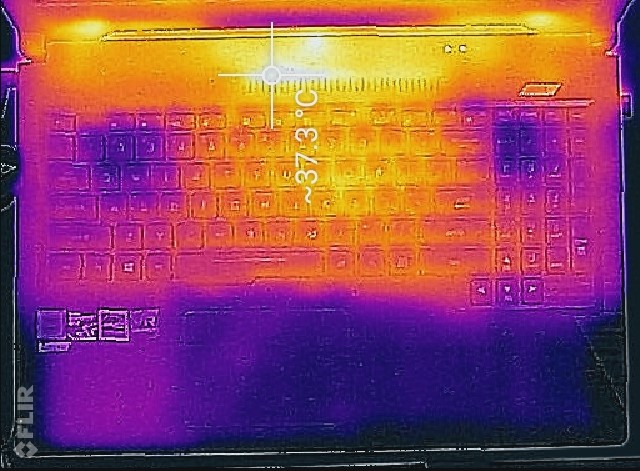
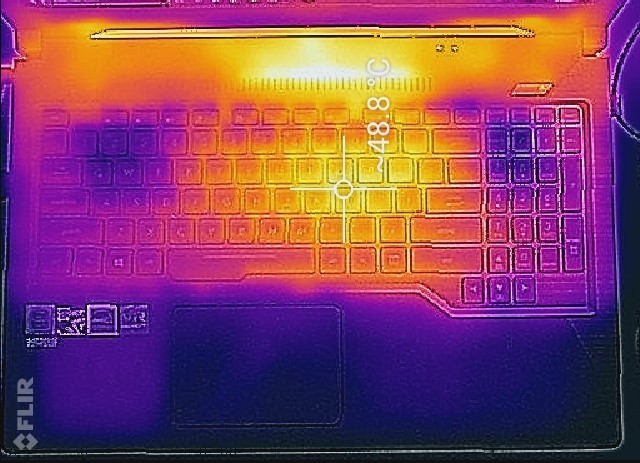
(-) The maximum temperature on the upper side is 59.6 °C / 139 F, compared to the average of 40.4 °C / 105 F, ranging from 21.2 to 68.8 °C for the class Gaming.
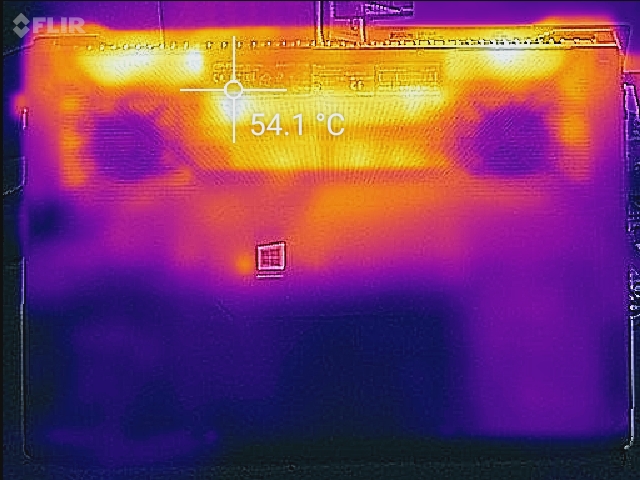
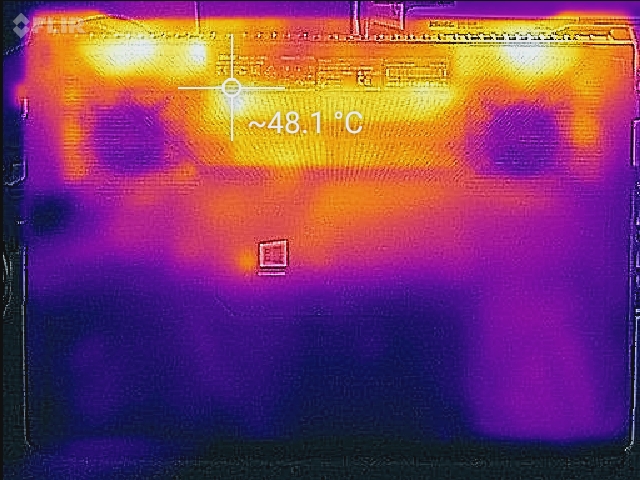
(-) The bottom heats up to a maximum of 56 °C / 133 F, compared to the average of 43.2 °C / 110 F
(+) In idle usage, the average temperature for the upper side is 28.3 °C / 83 F, compared to the device average of 33.9 °C / 93 F.
(±) Playing The Witcher 3, the average temperature for the upper side is 33.5 °C / 92 F, compared to the device average of 33.9 °C / 93 F.
(+) The palmrests and touchpad are cooler than skin temperature with a maximum of 25.2 °C / 77.4 F and are therefore cool to the touch.
(+) The average temperature of the palmrest area of similar devices was 28.8 °C / 83.8 F (+3.6 °C / 6.4 F).
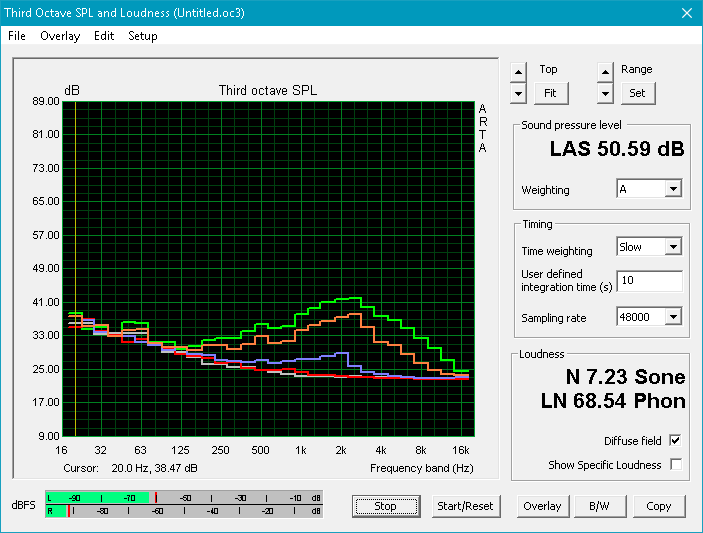
Speakers

The stereo speakers fall short of excellence. Peak volume is just shy of 70 dB, which is about average for laptop speakers. Mids and highs are well balanced. Bass, while present, is low; the result is more akin to a slap than a full-bodied thump. The addition of a subwoofer would go a long way in making the overall aural experience spectacular. As it stands, the speakers are thin and not suitable for most music. Asus includes an AudioWizard sound program that allows users to select one of five different sound profiles.
Asus FX503VM-EH73 audio analysis
(-) | not very loud speakers (68.2 dB)
Bass 100 - 315 Hz
(±) | reduced bass - on average 11.5% lower than median
(±) | linearity of bass is average (14.8% delta to prev. frequency)
Mids 400 - 2000 Hz
(+) | balanced mids - only 1.9% away from median
(+) | mids are linear (6.7% delta to prev. frequency)
Highs 2 - 16 kHz
(+) | balanced highs - only 4.2% away from median
(±) | linearity of highs is average (7.6% delta to prev. frequency)
Overall 100 - 16.000 Hz
(±) | linearity of overall sound is average (19.4% difference to median)
Compared to same class
» 67% of all tested devices in this class were better, 7% similar, 26% worse
» The best had a delta of 6%, average was 18%, worst was 132%
Compared to all devices tested
» 48% of all tested devices were better, 7% similar, 45% worse
» The best had a delta of 4%, average was 24%, worst was 134%
Asus FX502VM-AS73 audio analysis
(-) | not very loud speakers (67.7 dB)
Bass 100 - 315 Hz
(±) | reduced bass - on average 14% lower than median
(±) | linearity of bass is average (12.6% delta to prev. frequency)
Mids 400 - 2000 Hz
(+) | balanced mids - only 2.7% away from median
(±) | linearity of mids is average (11.5% delta to prev. frequency)
Highs 2 - 16 kHz
(+) | balanced highs - only 4.9% away from median
(±) | linearity of highs is average (11.4% delta to prev. frequency)
Overall 100 - 16.000 Hz
(±) | linearity of overall sound is average (29.9% difference to median)
Compared to same class
» 95% of all tested devices in this class were better, 2% similar, 3% worse
» The best had a delta of 6%, average was 18%, worst was 132%
Compared to all devices tested
» 88% of all tested devices were better, 3% similar, 9% worse
» The best had a delta of 4%, average was 24%, worst was 134%
Dell Inspiron 15 7000 7577 audio analysis
(±) | speaker loudness is average but good (80.9 dB)
Bass 100 - 315 Hz
(±) | reduced bass - on average 13% lower than median
(+) | bass is linear (6.8% delta to prev. frequency)
Mids 400 - 2000 Hz
(+) | balanced mids - only 2.7% away from median
(+) | mids are linear (5.3% delta to prev. frequency)
Highs 2 - 16 kHz
(±) | higher highs - on average 8% higher than median
(±) | linearity of highs is average (10.6% delta to prev. frequency)
Overall 100 - 16.000 Hz
(±) | linearity of overall sound is average (18.9% difference to median)
Compared to same class
» 63% of all tested devices in this class were better, 8% similar, 29% worse
» The best had a delta of 6%, average was 18%, worst was 132%
Compared to all devices tested
» 44% of all tested devices were better, 8% similar, 48% worse
» The best had a delta of 4%, average was 24%, worst was 134%
Frequency Comparison (Checkbox selectable!)
Graph 1: Pink Noise 100% Vol.; Graph 2: Audio off
Energy Management
Power Consumption
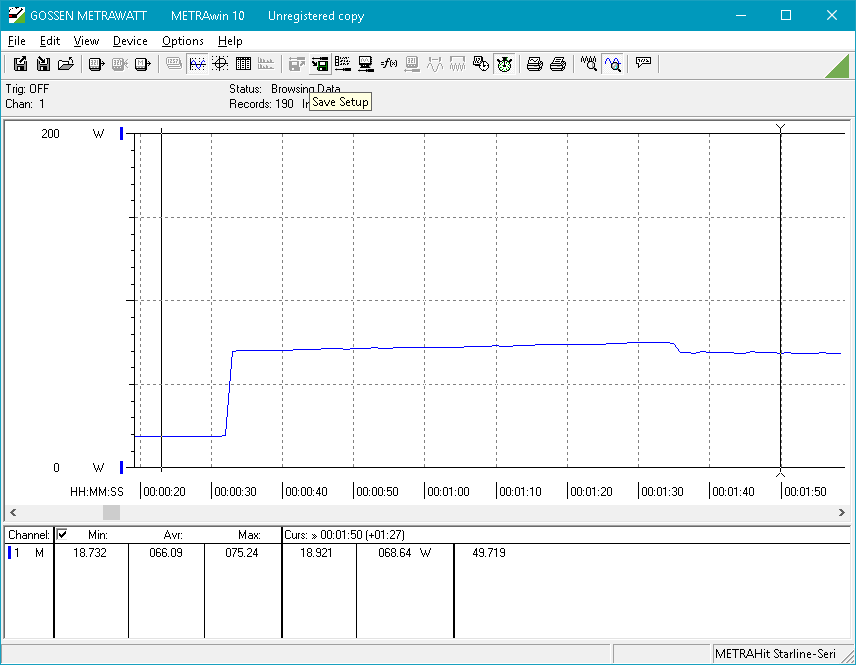
Power consumption is average. Compared to similarly-specced notebooks, power draw under load is low at 78 Watts, but gaming loads are within expectations. Users can expect the device to pull about 110 Watts from the wall when playing games. Power draw should also be steady, as evidenced by the device's behavior when running Prime95.
The 180 W power adapter is similar to those of other Asus laptops and should supply more than enough to the laptop. At its peak, the FX503VM requires 144 Watts, which is about 80% of the capacity of the power adapter.
| Off / Standby | |
| Idle | |
| Load |
|
Key:
min: | |
| Asus FX503VM-EH73 i7-7700HQ, GeForce GTX 1060 Mobile, SanDisk SD8SN8U128G1002, IPS, 1920x1080, 15.6" | Asus FX502VM-AS73 i7-7700HQ, GeForce GTX 1060 Mobile, SK Hynix HFS256G39TND-N210A, TN LED, 1920x1080, 15.6" | Dell Inspiron 15 7000 7577 i5-7300HQ, GeForce GTX 1060 Max-Q, Samsung PM961 MZVLW256HEHP, IPS, 1920x1080, 15.6" | Lenovo Legion Y520-15IKBM 80YY001APB i5-7300HQ, GeForce GTX 1060 Max-Q, ADATA SX7000NP 256 GB, IPS, 1920x1080, 15.6" | HP Omen 15-ce002ng i7-7700HQ, GeForce GTX 1060 Max-Q, Samsung PM961 MZVLW256HEHP, IPS, 1920x1080, 15.6" | Acer Aspire VN7-593G-73HP V15 Nitro BE i7-7700HQ, GeForce GTX 1060 Mobile, Seagate Mobile HDD 1TB ST1000LM035, AH-IPS, Normally Black, Transmissive, 1920x1080, 15.6" | Acer Nitro 5 AN515-51-788E i7-7700HQ, GeForce GTX 1050 Ti Mobile, Intel SSD 600p SSDPEKKW256G7, IPS, 1920x1080, 15.6" | Acer Aspire VX5-591G-75C4 VX15 i7-7700HQ, GeForce GTX 1050 Ti Mobile, Toshiba MQ01ABD100, IPS, 1920x1080, 15.6" | |
|---|---|---|---|---|---|---|---|---|
| Power Consumption | -10% | 34% | 21% | -31% | 8% | 28% | 20% | |
| Idle Minimum * (Watt) | 12.8 | 14.9 -16% | 7.1 45% | 3.9 70% | 18 -41% | 7.2 44% | 4.1 68% | 7 45% |
| Idle Average * (Watt) | 15.4 | 15.1 2% | 7.6 51% | 10.7 31% | 23 -49% | 10.5 32% | 6.9 55% | 10.2 34% |
| Idle Maximum * (Watt) | 15.9 | 15.2 4% | 8.6 46% | 11.2 30% | 30 -89% | 16 -1% | 9.5 40% | 14 12% |
| Load Average * (Watt) | 78 | 105.8 -36% | 59.5 24% | 111.5 -43% | 85 -9% | 82 -5% | 83 -6% | 78 -0% |
| Witcher 3 ultra * (Watt) | 107.3 | 89 17% | 96 11% | 124 -16% | 108 -1% | |||
| Load Maximum * (Watt) | 143.4 | 148.8 -4% | 112.8 21% | 115.5 19% | 158 -10% | 155 -8% | 126 12% | 127 11% |
* ... smaller is better
Battery Life
The 64 Wh battery is unchanged from the older FX502VM, and battery life is subsequently similar. The lack of Nvidia's Optimus technology is another unfortunate holdover from the older machine. WiFi surfing times suffer accordingly; the FX503VM only manages four and a half hours of web browsing while on battery. Optimus plays a huge role in longer battery life, as evidenced by the Acer Nitro 5; despite it's much smaller battery (45 W), it is able to last over 50% longer in our WiFi battery test. Users will need to pack the power adapter with them.
| Asus FX503VM-EH73 i7-7700HQ, GeForce GTX 1060 Mobile, 64 Wh | Asus FX502VM-AS73 i7-7700HQ, GeForce GTX 1060 Mobile, 64 Wh | Dell Inspiron 15 7000 7577 i5-7300HQ, GeForce GTX 1060 Max-Q, 56 Wh | HP Omen 15-ce002ng i7-7700HQ, GeForce GTX 1060 Max-Q, 70 Wh | Acer Aspire VN7-593G-73HP V15 Nitro BE i7-7700HQ, GeForce GTX 1060 Mobile, 69 Wh | Acer Nitro 5 AN515-51-788E i7-7700HQ, GeForce GTX 1050 Ti Mobile, 48 Wh | Acer Aspire VX5-591G-75C4 VX15 i7-7700HQ, GeForce GTX 1050 Ti Mobile, 52.5 Wh | |
|---|---|---|---|---|---|---|---|
| Battery runtime | 2% | 63% | -12% | 65% | 69% | 10% | |
| Reader / Idle (h) | 5.7 | 6.1 7% | 11 93% | 4.3 -25% | 8.4 47% | 14.9 161% | 5.4 -5% |
| WiFi v1.3 (h) | 4.6 | 4.6 0% | 6.9 50% | 3.3 -28% | 6 30% | 6.7 46% | 5 9% |
| Load (h) | 1.1 | 1.1 0% | 1.6 45% | 1.3 18% | 2.4 118% | 1.1 0% | 1.4 27% |
Pros
Cons
Verdict

The FX503VM tries to mix the style of a high-end gaming notebook with the price of a mid-tier laptop and, for the most part, succeeds. There are several things to like about the FX503VM, including its good keyboard, excellent system performance, and subtle (yet striking) design. However, there are some sacrifices to endure as well, like the flimsy touchpad and cheap-feeling case. The absence of G-Sync support (even on the high-refresh rate version) stings as well.
Compared to other mid-tier gaming notebooks, the FX503VM excels at some points while faltering on others. Compared to the GL503 that it imitates, though, the FX503VM offers similar performance and upgrade options with a fairly close look at a much lower price. For about $500 less, the FX503VM maintains the same thin profile and performance while sacrificing the more premium build. The optional 120 Hz display is just icing on the cake. Gamers in search of an attractive but pragmatic gaming notebook will find a lot to like in the FX503VM. The machine is beginning to grow in scarcity at retailers. If it can be found on sale, it's a heck of a deal.
All said, the FX503VM brings excellent gaming performance at a reasonable price and wraps in an attractive package. The machine is subjectively miles ahead in design than other similarly-priced gaming notebooks without sacrificing much in the way of gaming performance. What the FX503VM does sacrifice, however, should be considered. The display lid is flimsy, the 3 GB of VRAM limits some game settings and resolutions compared to other notebooks with 6 GB, and the color inaccuracies can be distracting. Fan noise is also rather high, even for a gaming notebook.
Most gaming notebooks in this price point look cheap and plastic. The FX503VM manages something they miss: it brings a sense of style to lower-priced mid-tier gaming notebooks. If you're looking for a thin-and-light gaming notebook on a tighter budget, this is the machine to hunt.
Asus FX503VM-EH73
- 03/24/2018 v6 (old)
Sam Medley
Price comparison
