Gigabyte Aero 15X (i7-7700HQ, GTX 1070 Max-Q, FHD) Laptop Review
For the original German review, see here.
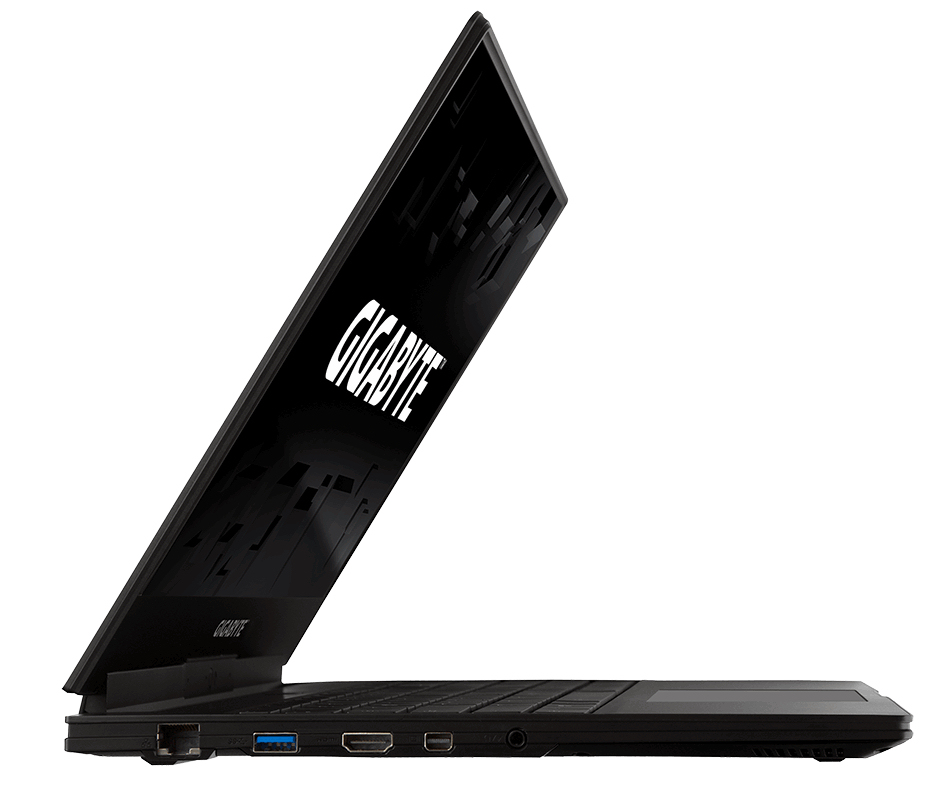
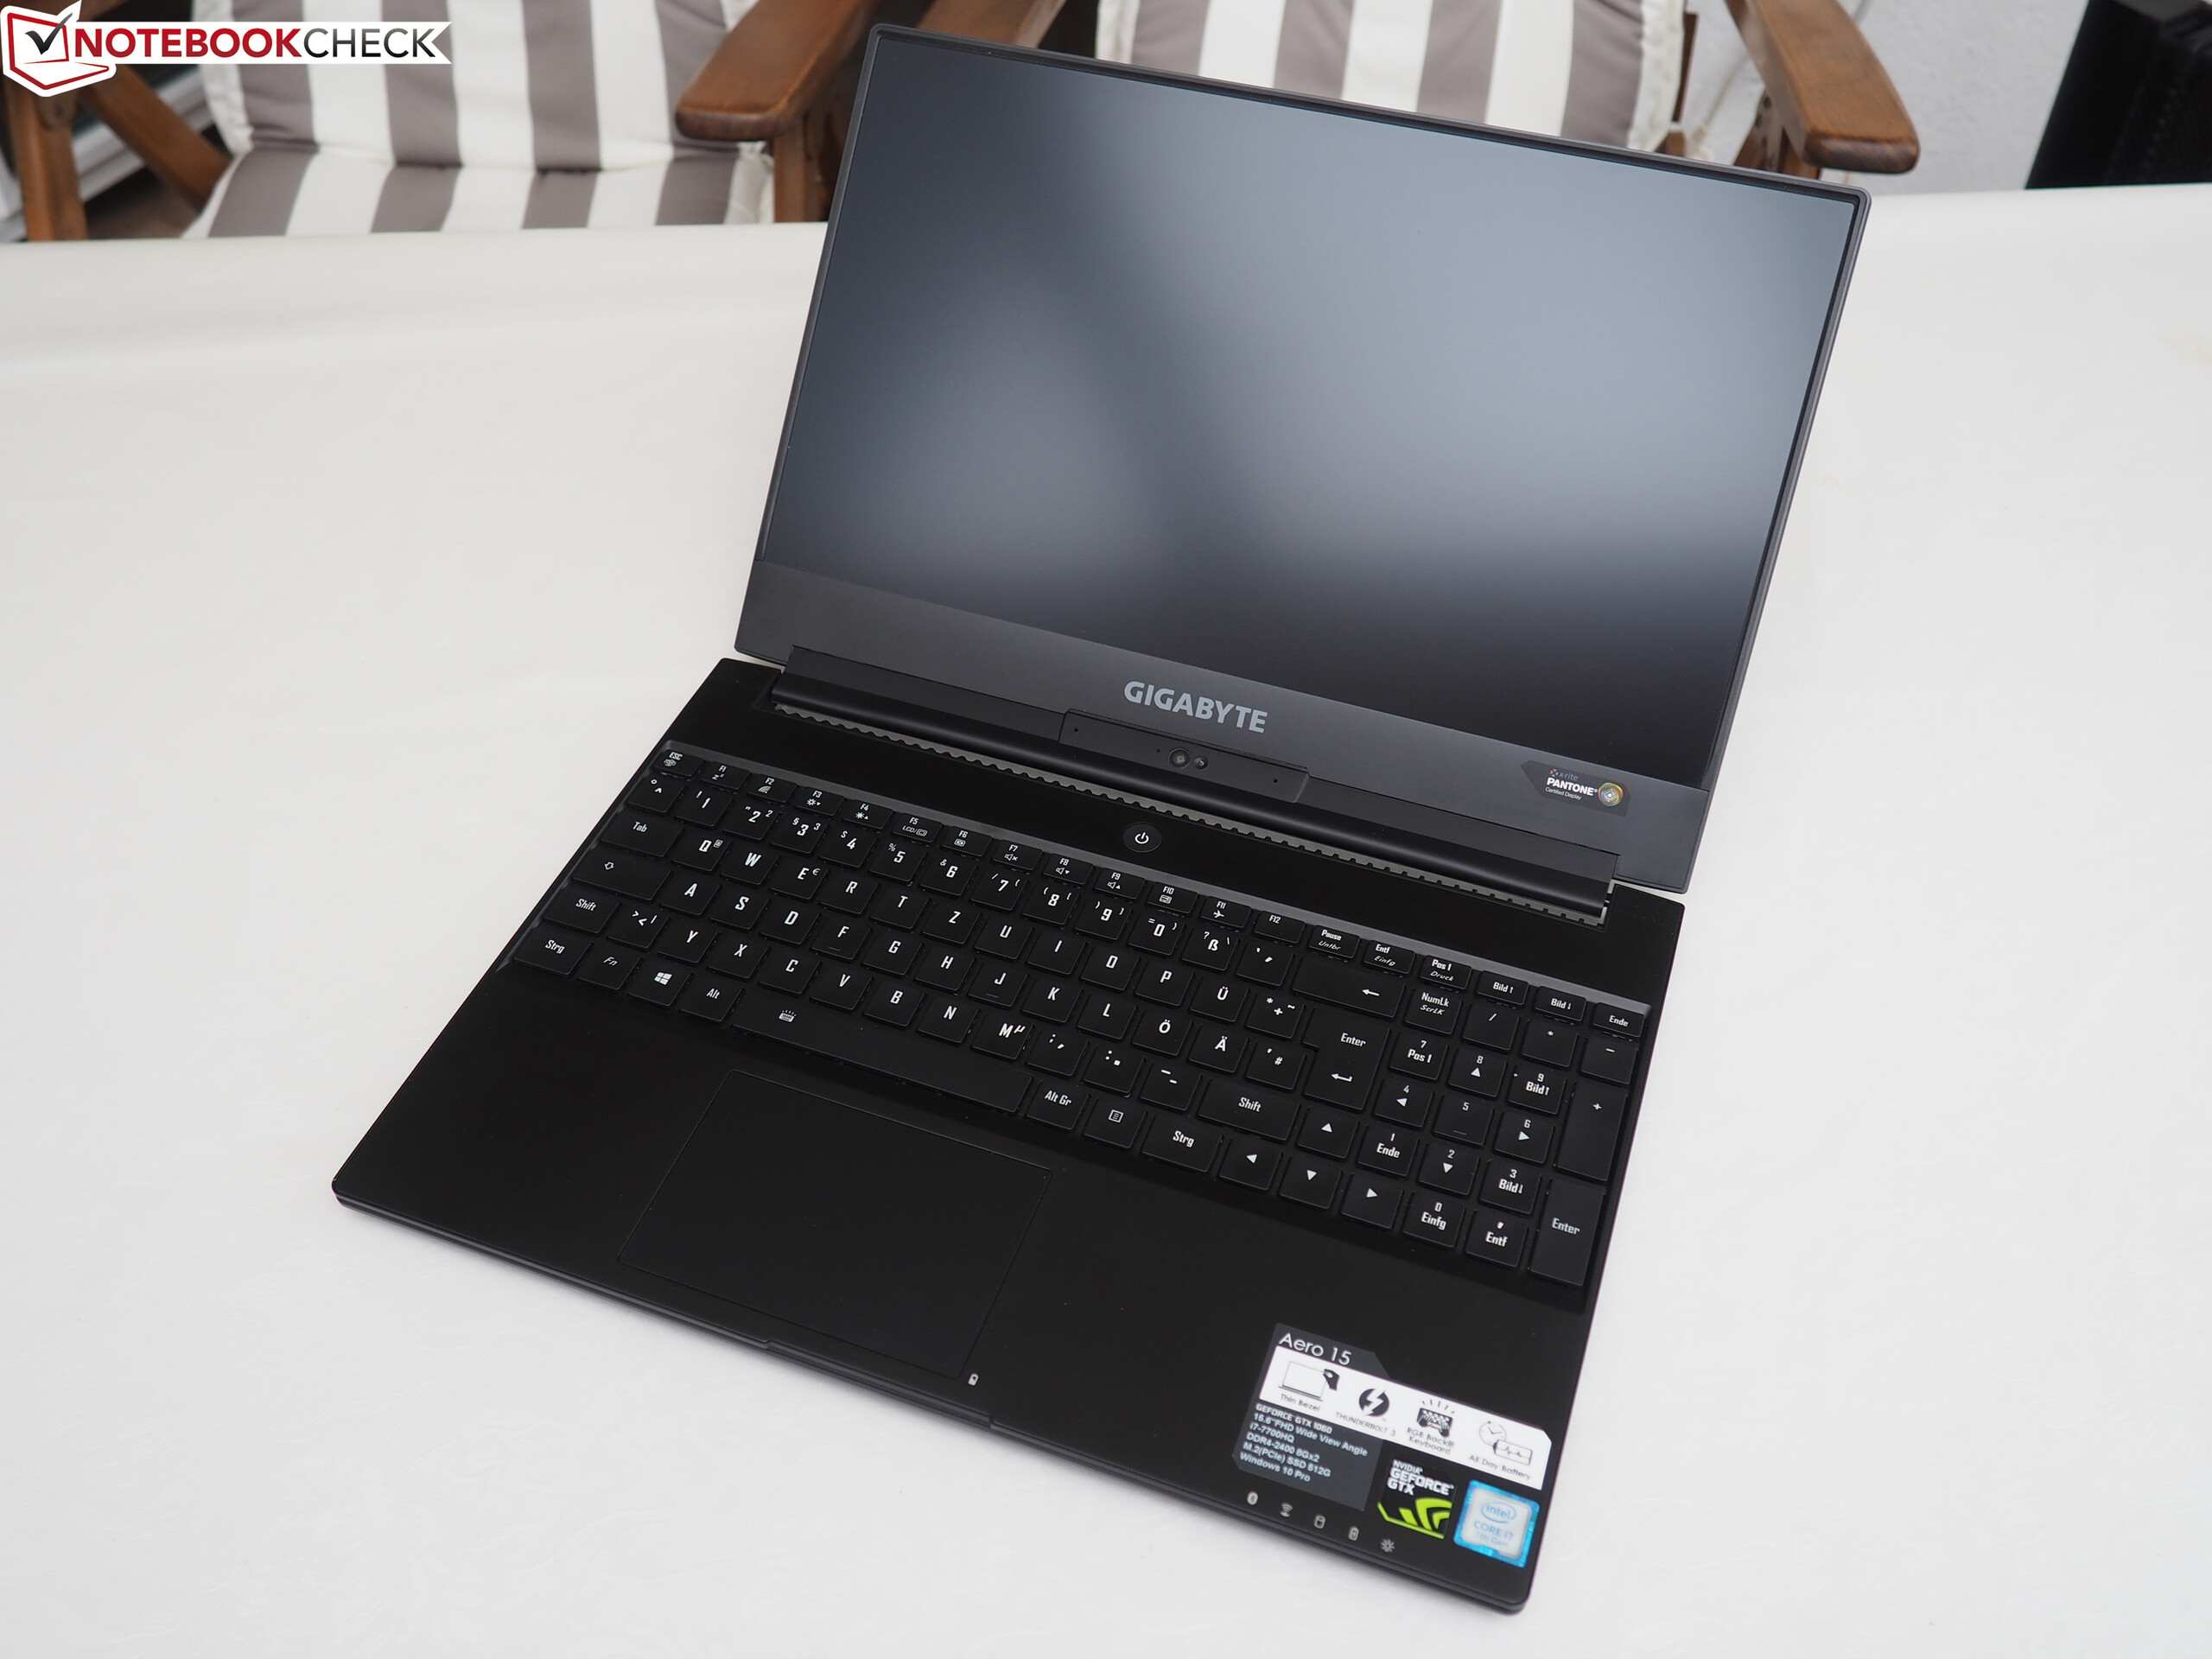
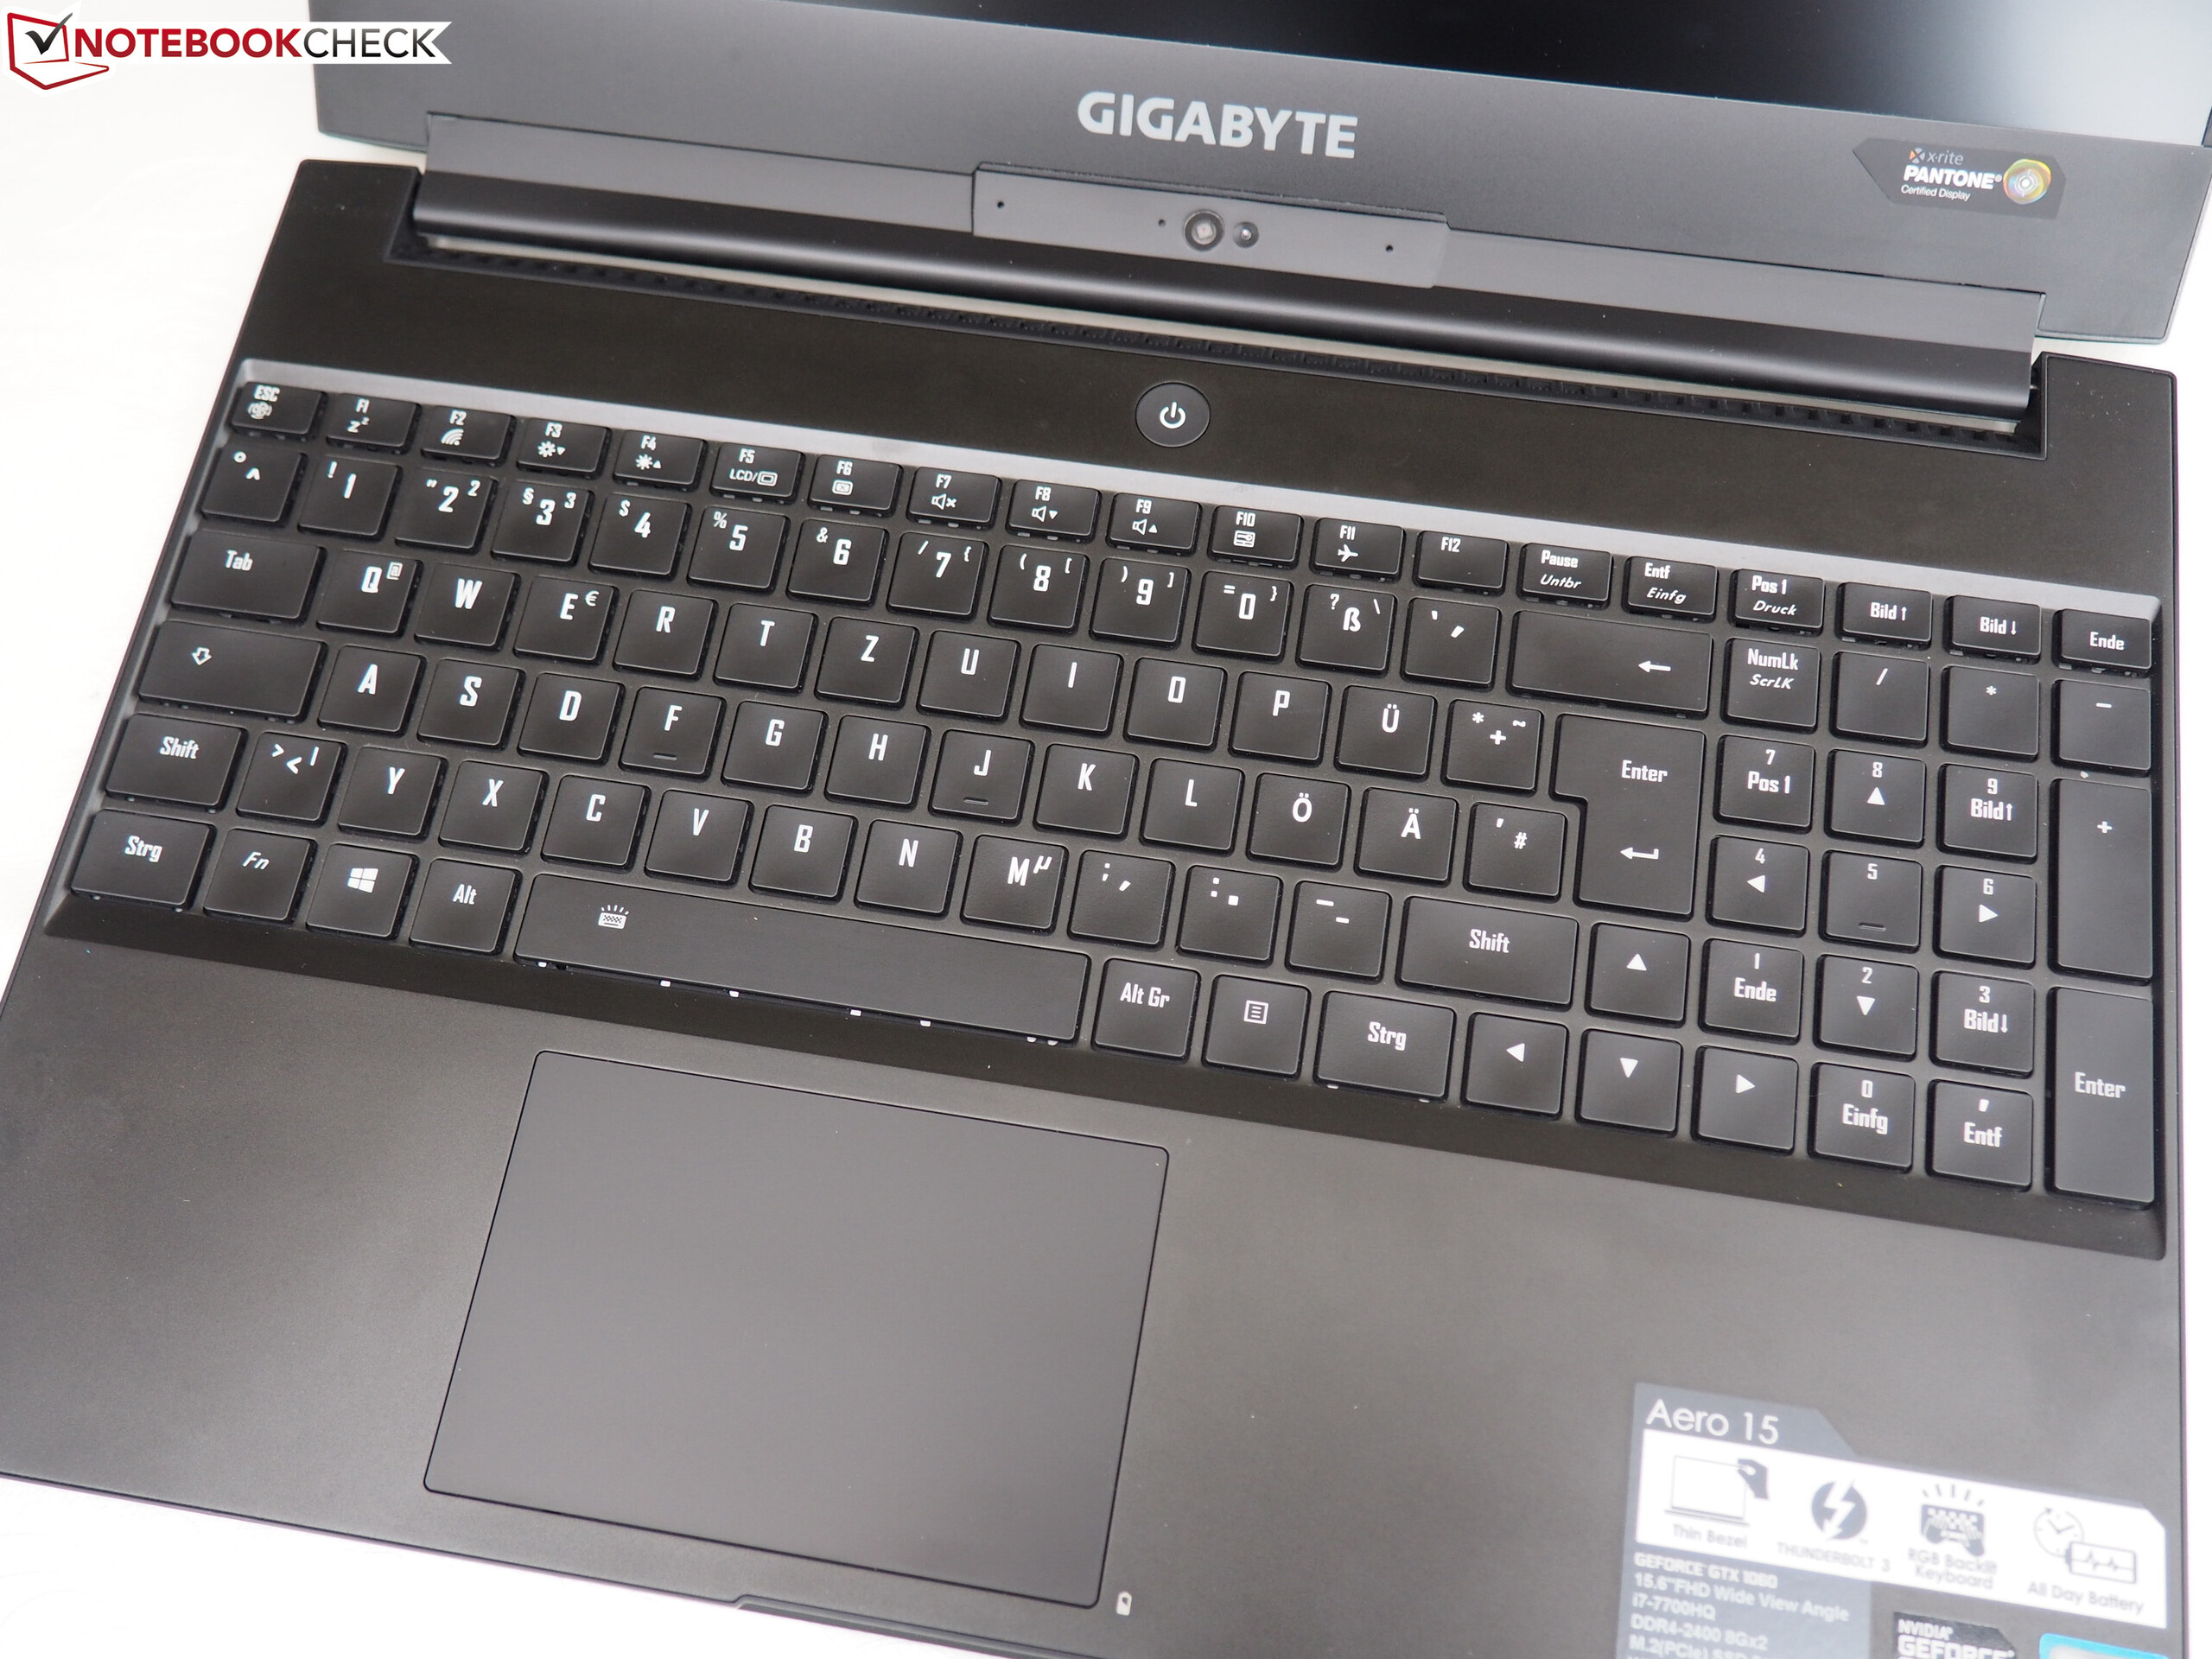
The Aero 15X’s svelte case very effectively hides the fact that this is indeed a very powerful multimedia/gaming notebook equipped with a Kaby Lake quad-core processor and a GeForce GTX 1070 Max-Q GPU. The notebook is not entirely new to us since we have already had the chance to acquaint ourselves with its GTX-1060-equipped sibling a few months ago. Its main competitors are the Asus Zephyrus GX501VS, the MSI GS63VR 7RF-228US, and the Eurocom Q5.
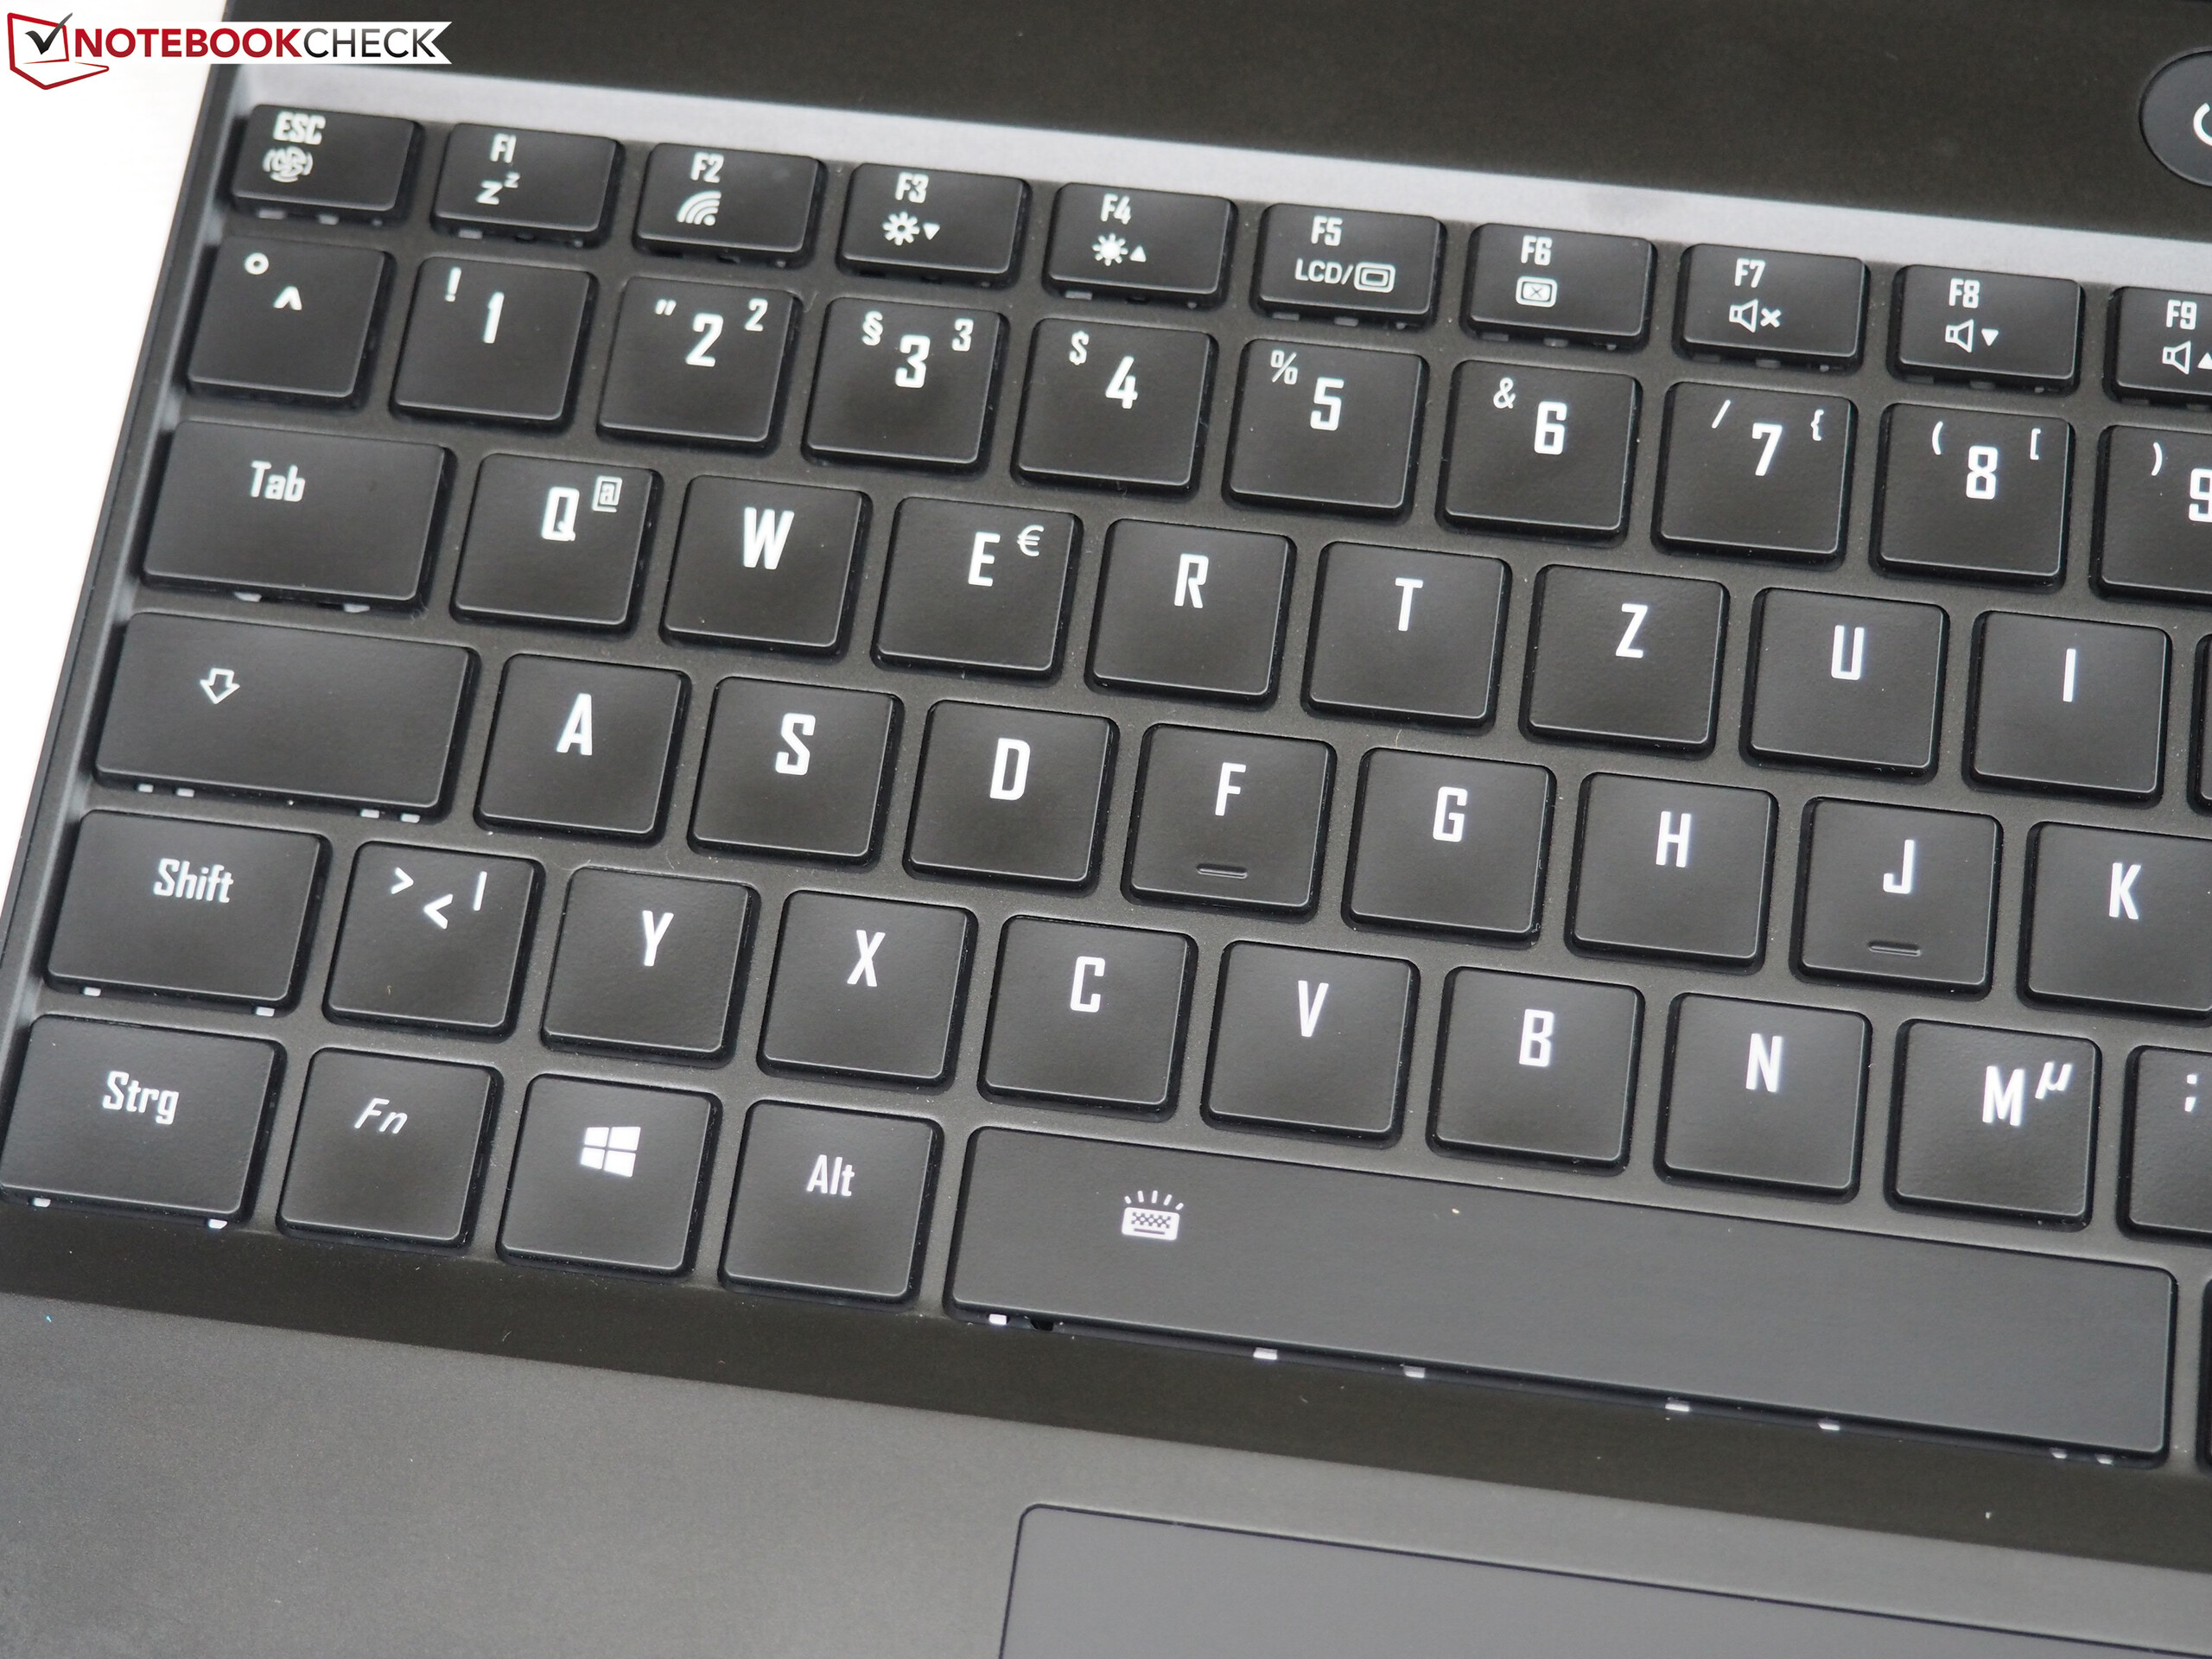
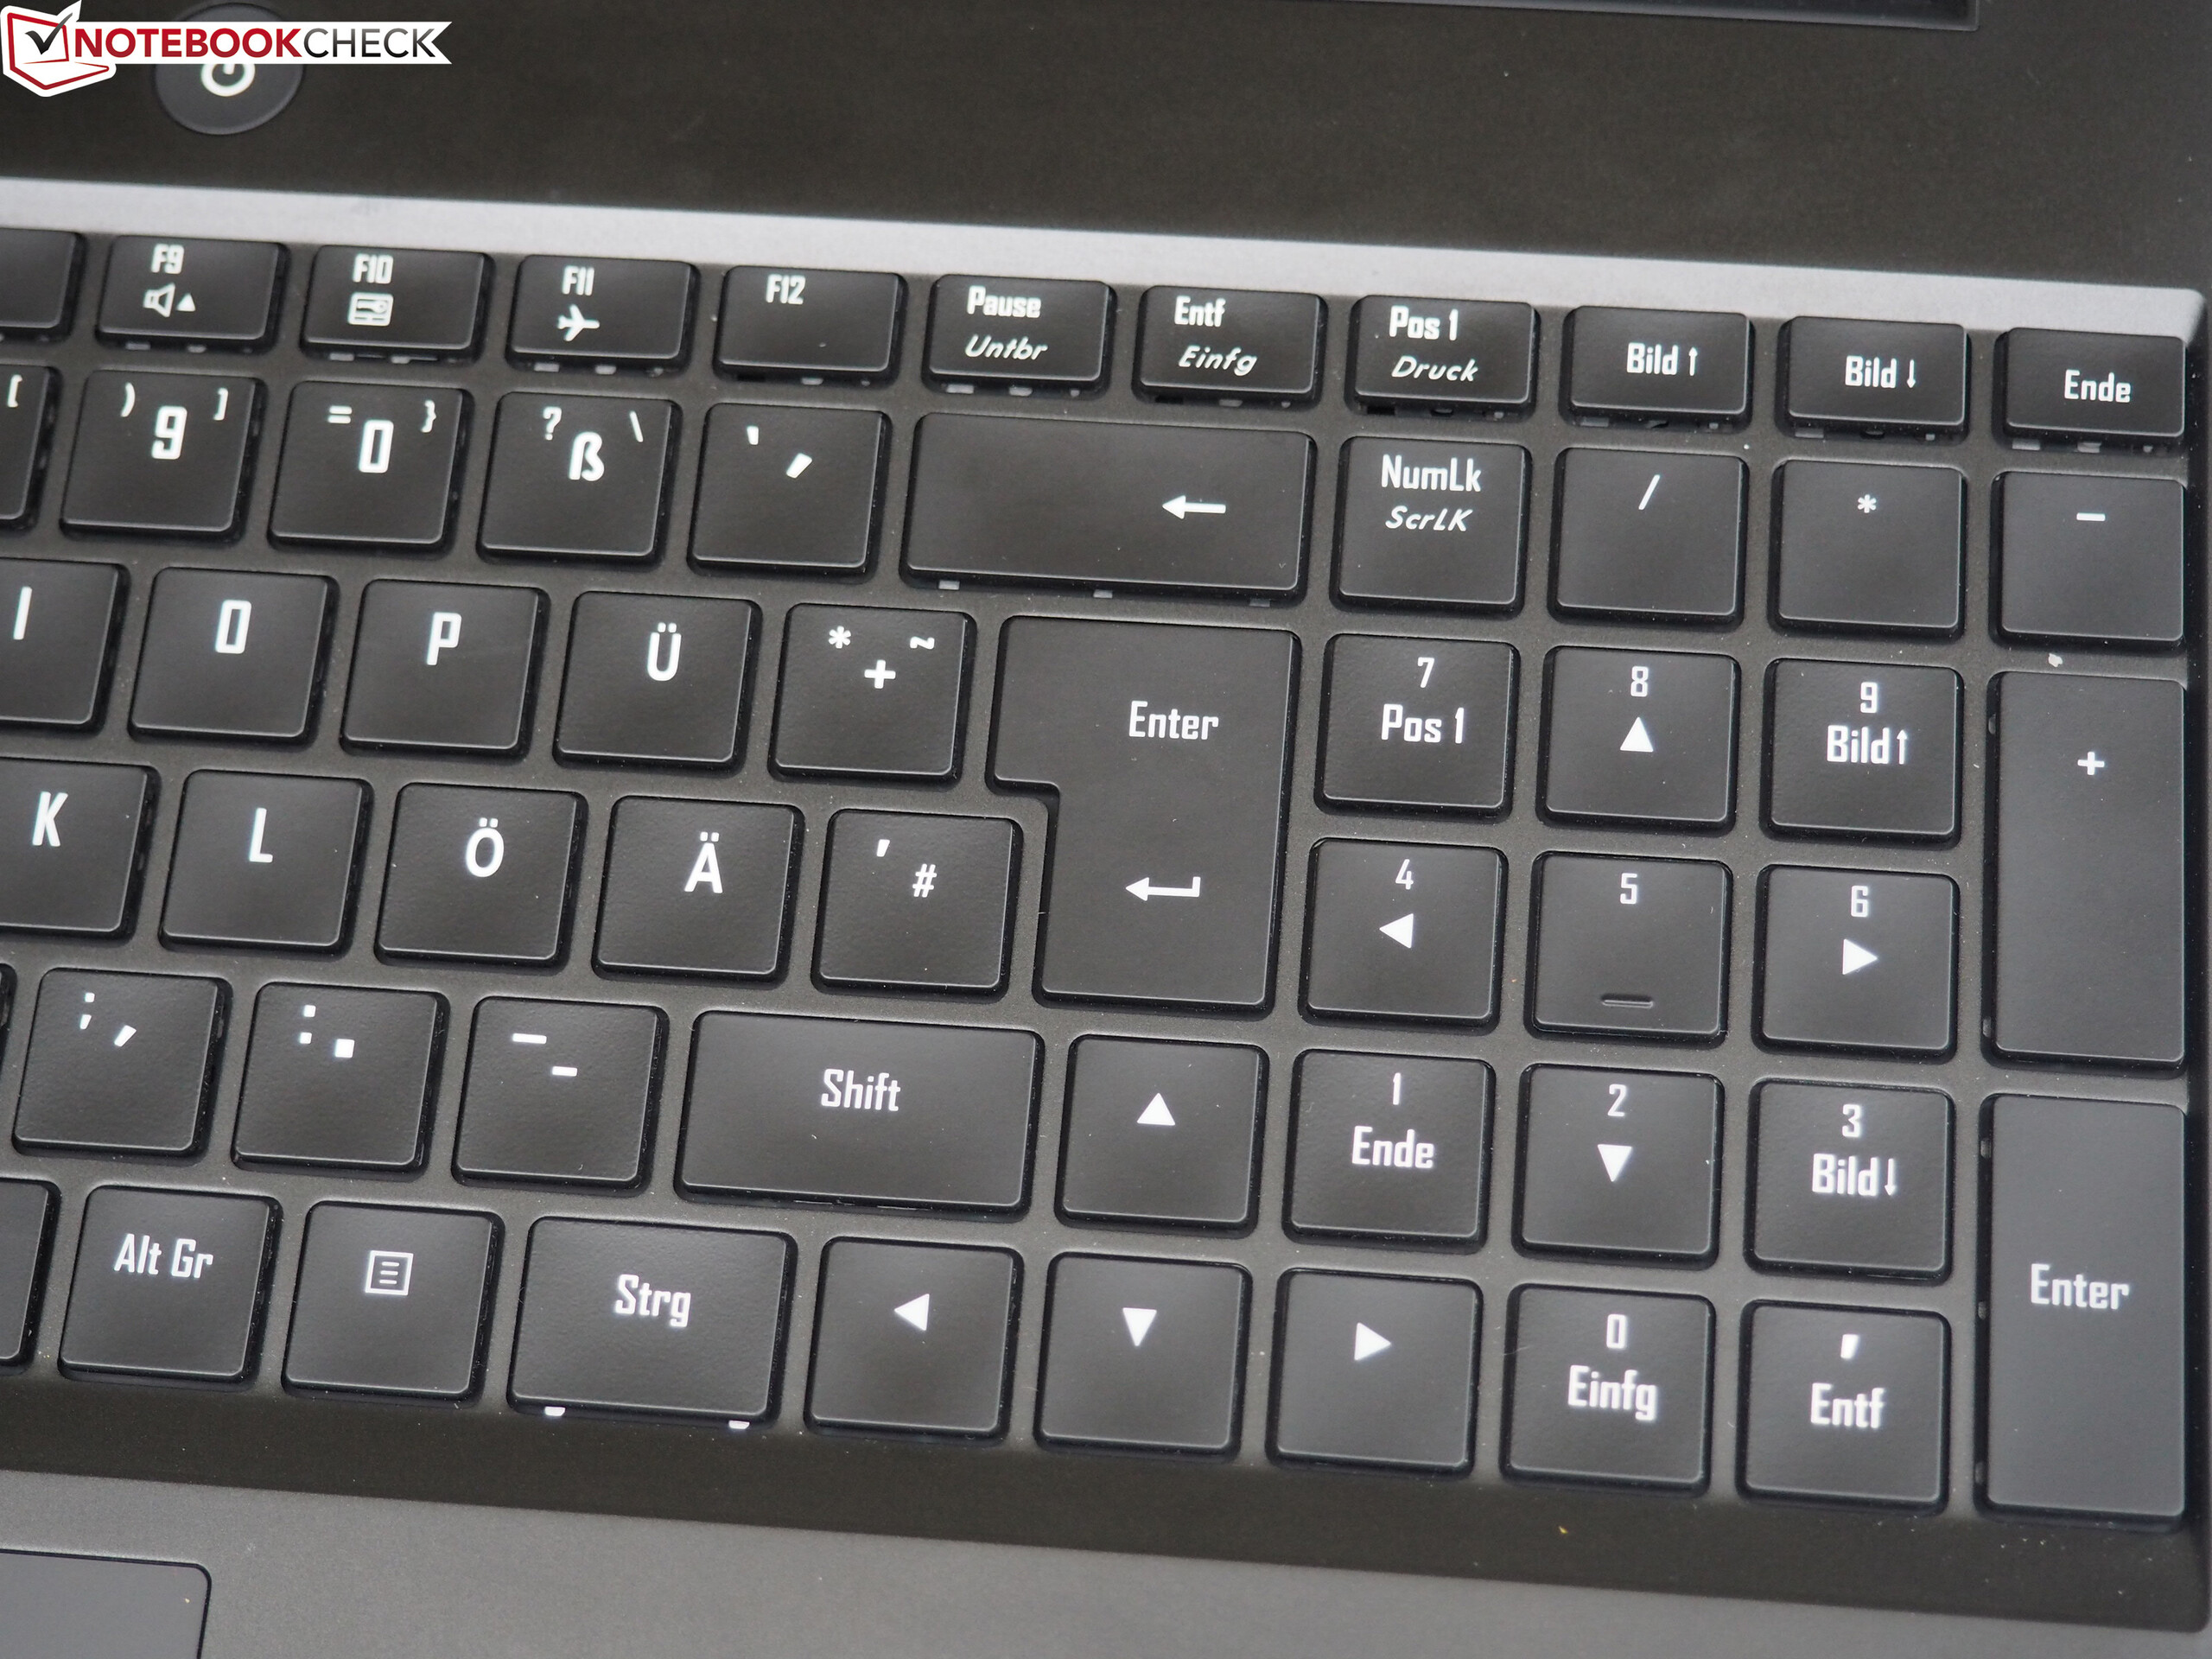
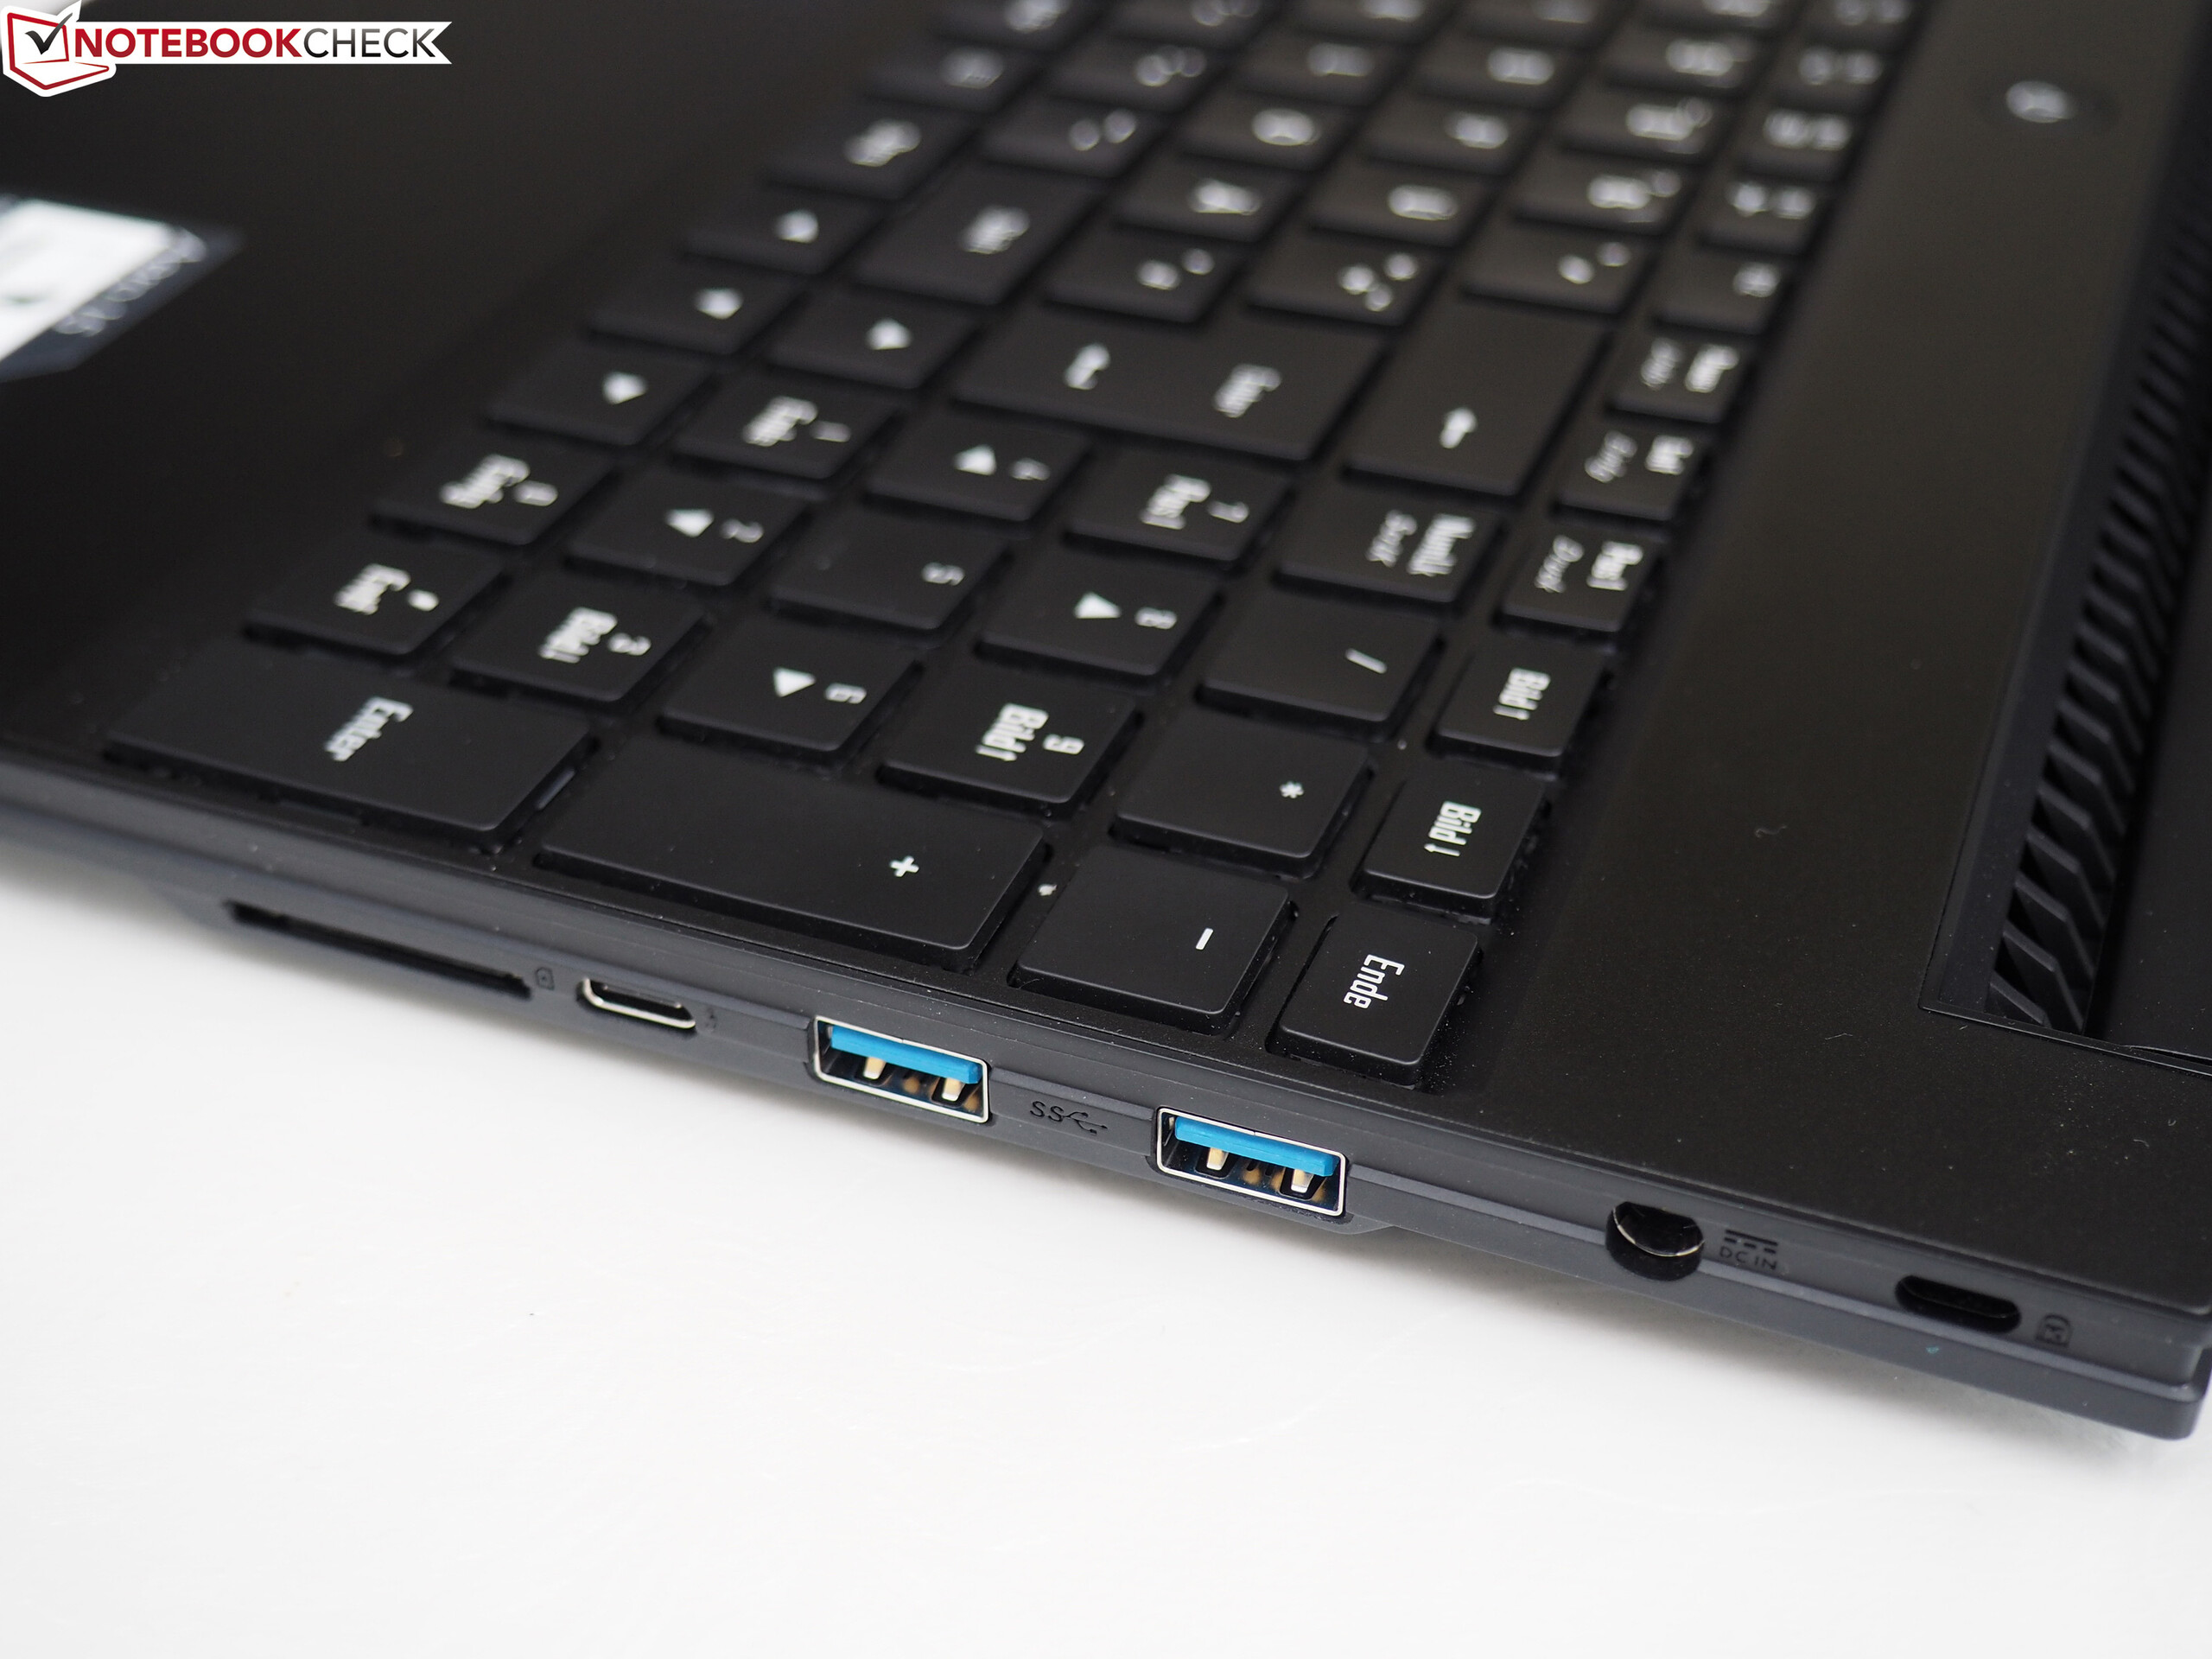
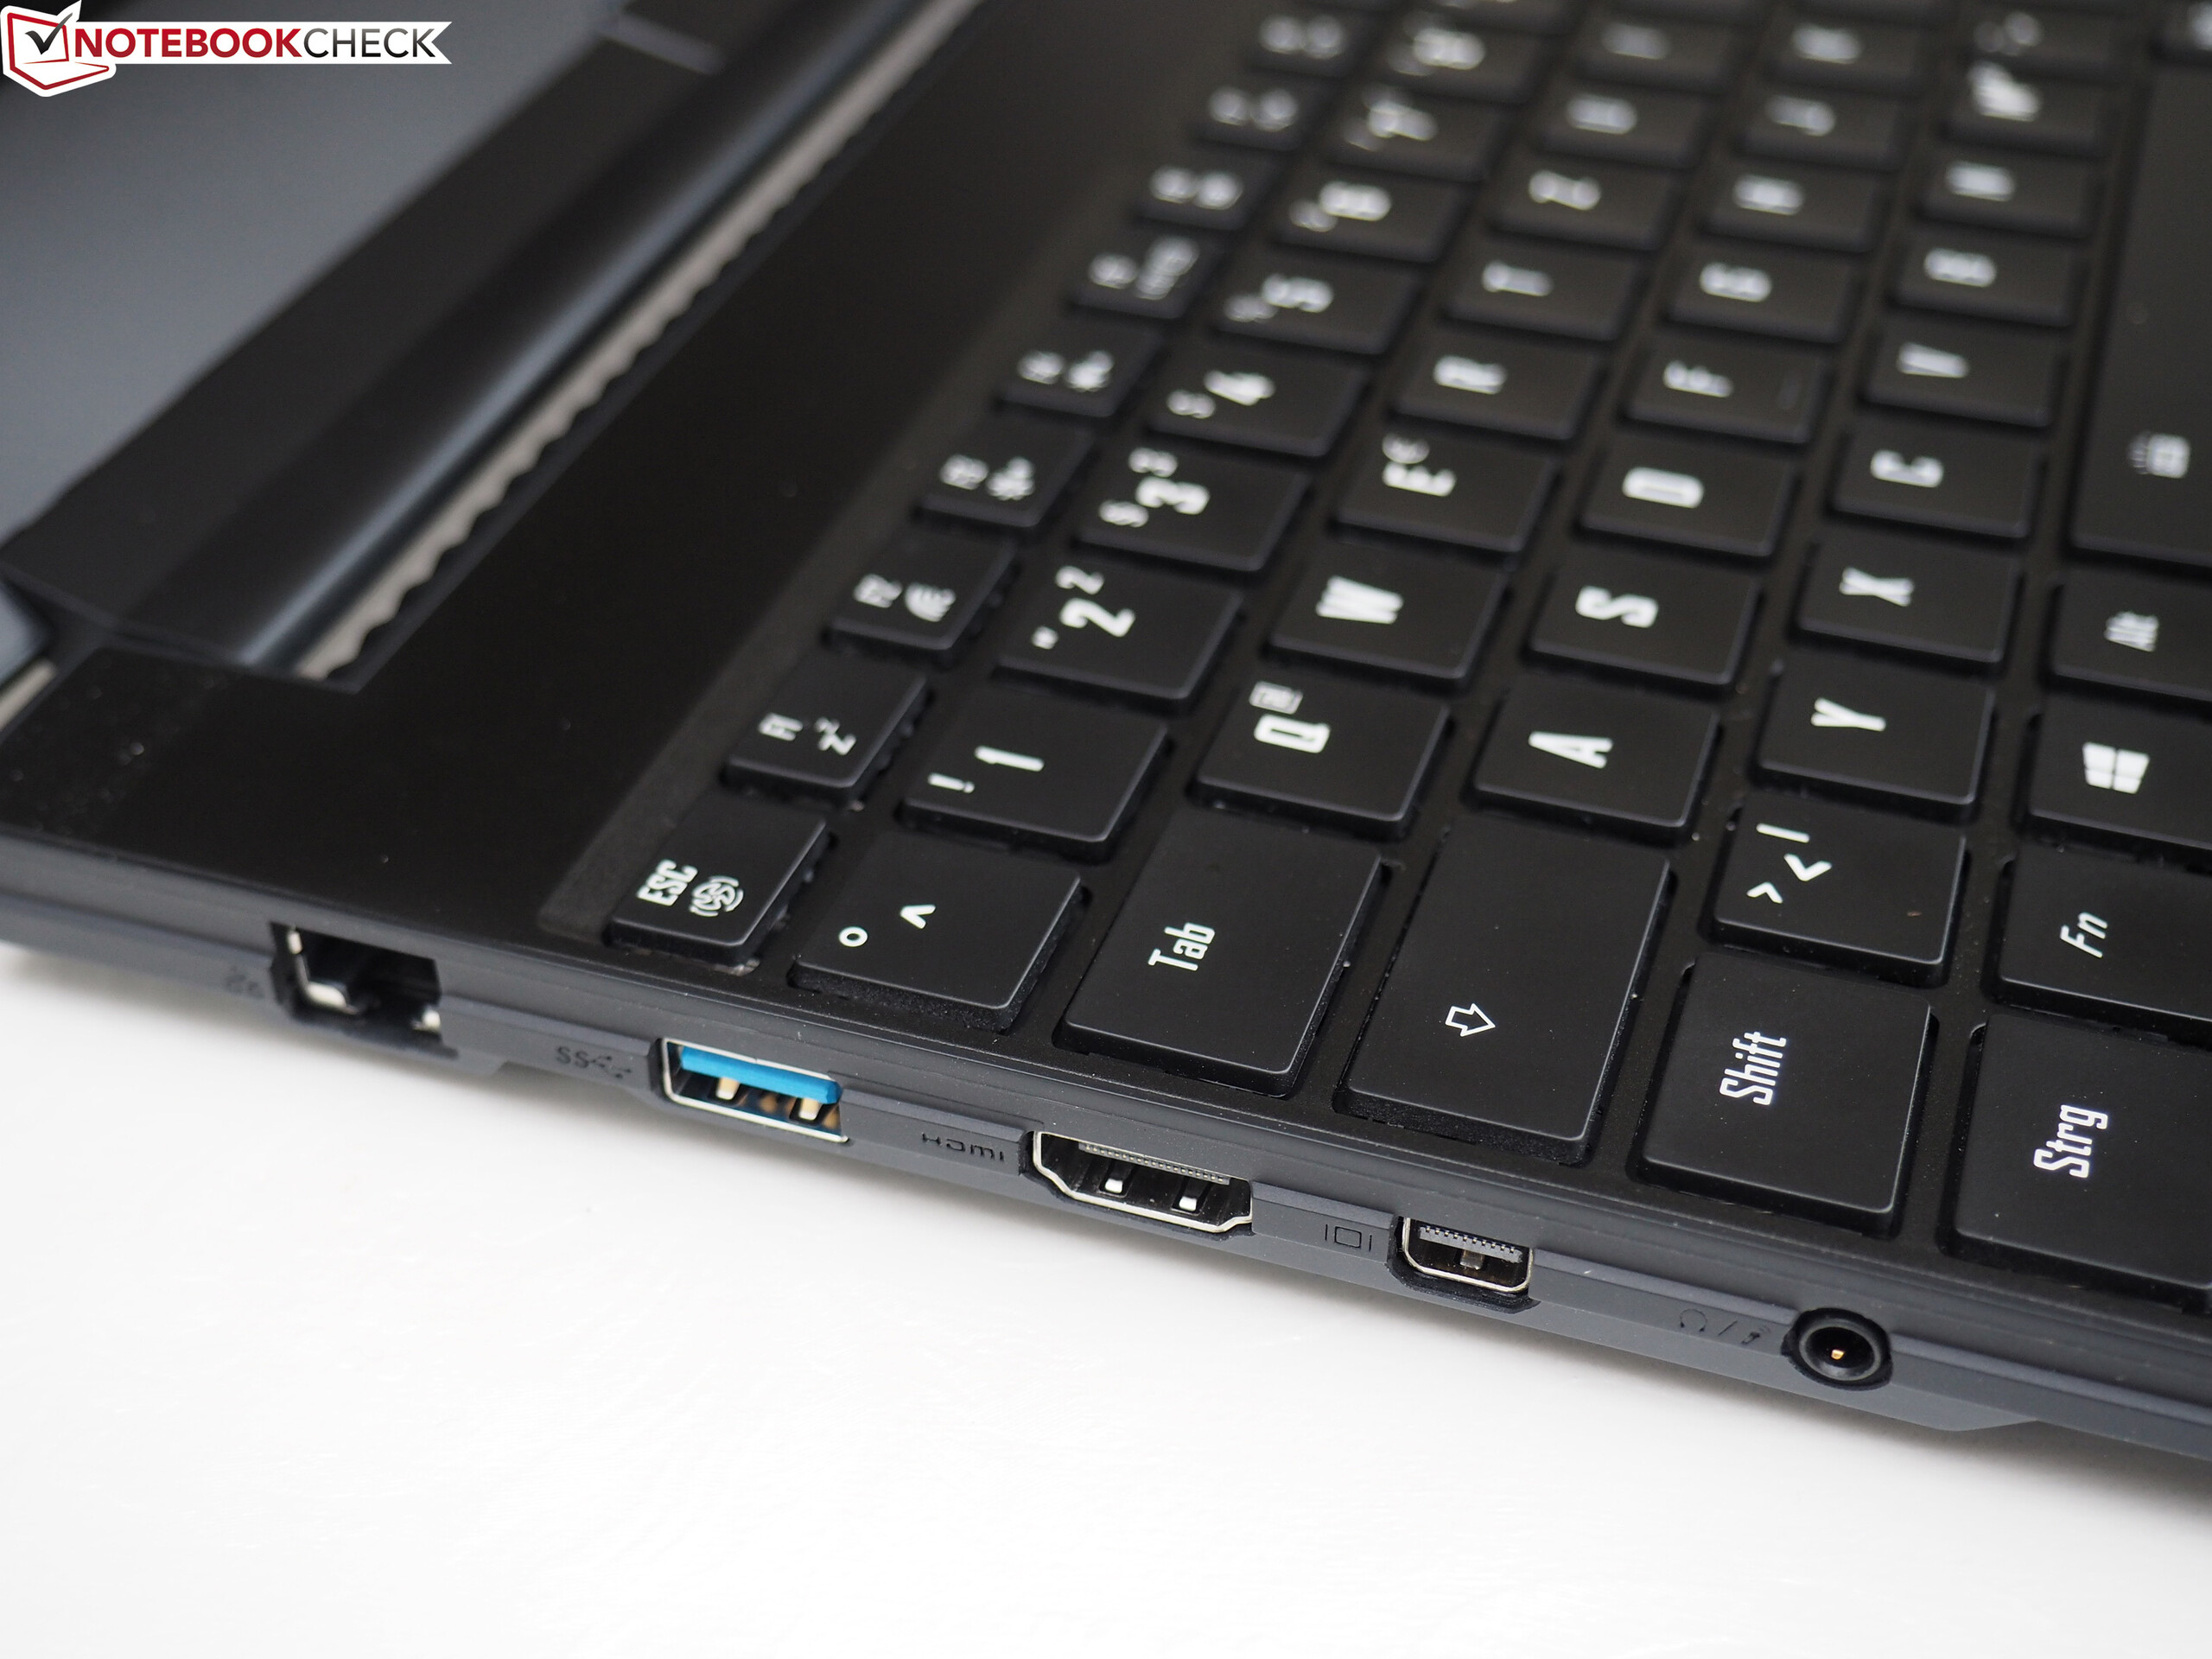
Given that both Aero 15 models are identically constructed, we will skip reviewing case, connectivity, input devices, display, and speakers in detail. See our full review of the other Aero 15 for further details.

| SD Card Reader | |
| average JPG Copy Test (av. of 3 runs) | |
| Eurocom Q5 | |
| Gigabyte Aero 15X (Toshiba Exceria Pro SDXC 64 GB UHS-II) | |
| Gigabyte Aero 15 (Toshiba Exceria Pro SDXC 64 GB UHS-II) | |
| MSI GS63VR 7RF-228US (Toshiba Exceria Pro SDXC 64 GB UHS-II) | |
| maximum AS SSD Seq Read Test (1GB) | |
| Eurocom Q5 | |
| Gigabyte Aero 15 (Toshiba Exceria Pro SDXC 64 GB UHS-II) | |
| Gigabyte Aero 15X (Toshiba Exceria Pro SDXC 64 GB UHS-II) | |
| MSI GS63VR 7RF-228US (Toshiba Exceria Pro SDXC 64 GB UHS-II) | |
| Networking | |
| iperf3 transmit AX12 | |
| MSI GS63VR 7RF-228US | |
| Eurocom Q5 | |
| Asus Zephyrus GX501VS | |
| Gigabyte Aero 15X | |
| Gigabyte Aero 15 | |
| iperf3 receive AX12 | |
| Gigabyte Aero 15X | |
| Gigabyte Aero 15 | |
| Eurocom Q5 | |
| MSI GS63VR 7RF-228US | |
| Asus Zephyrus GX501VS | |
Display
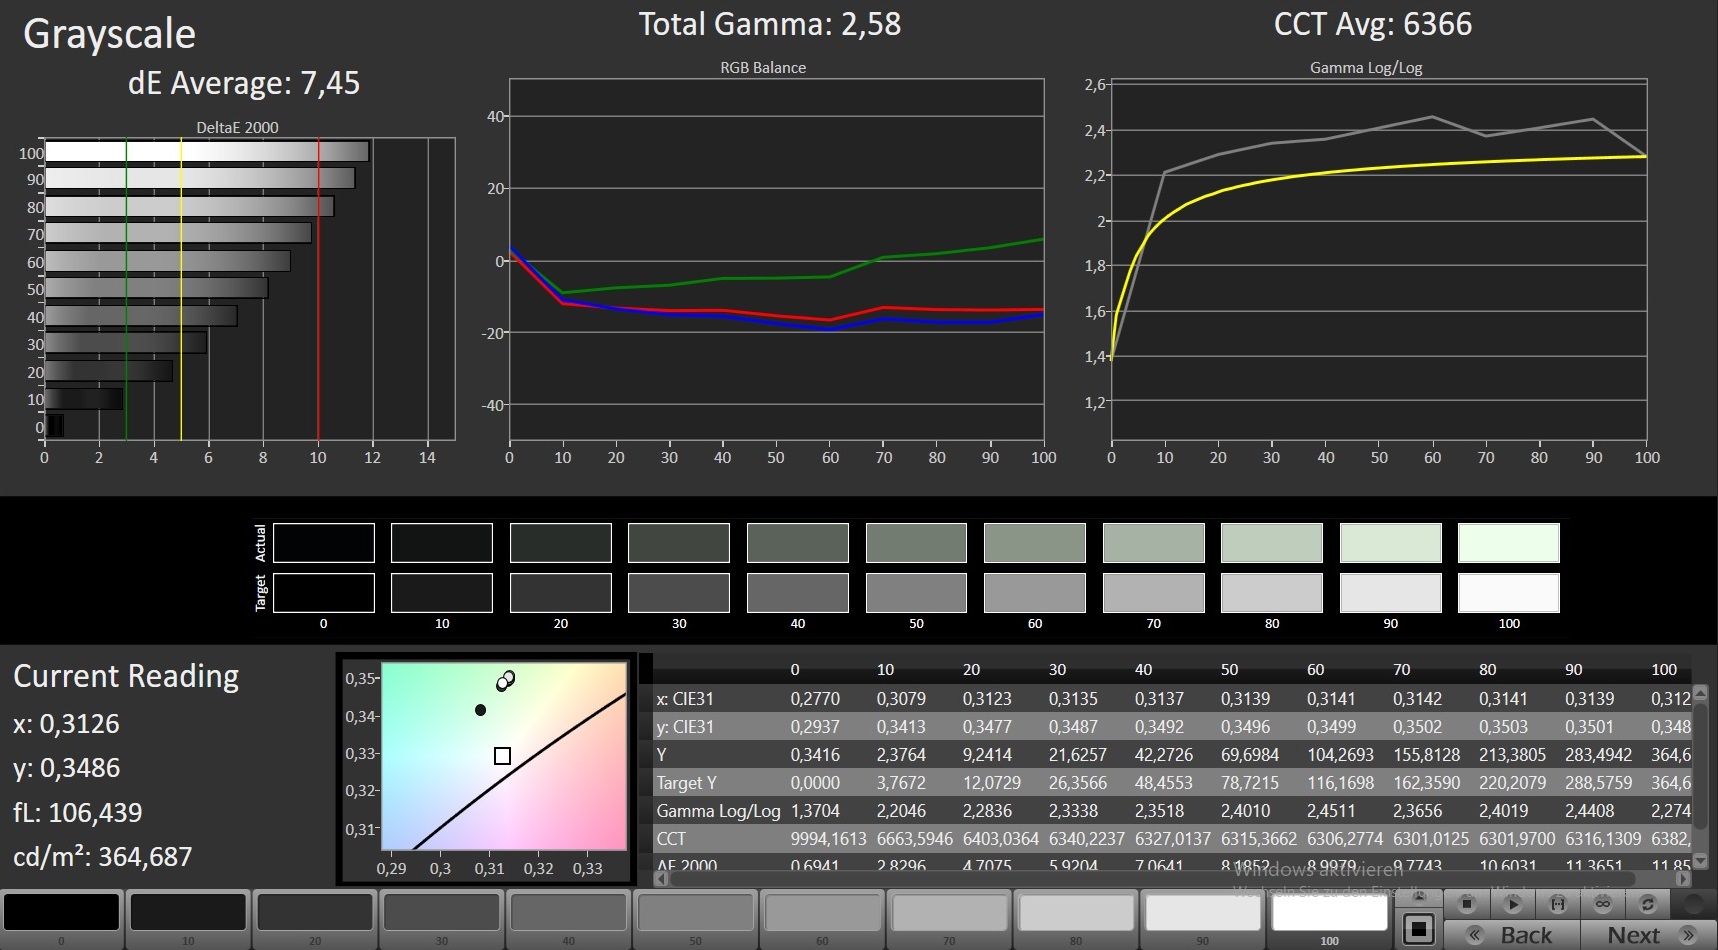
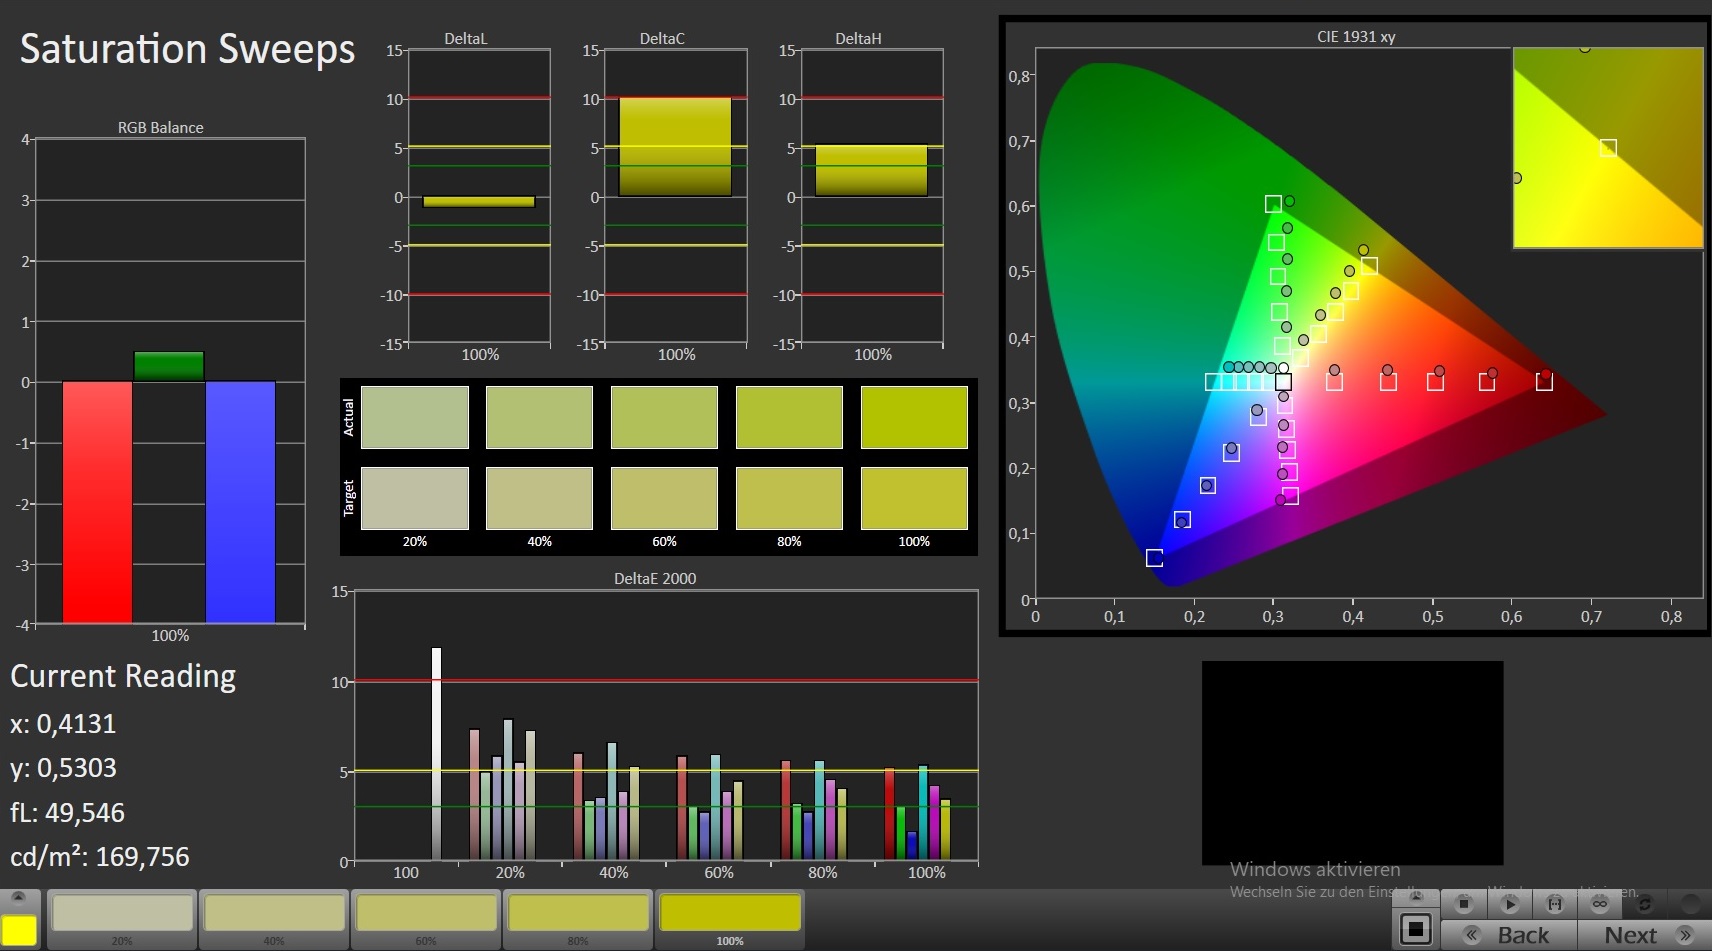
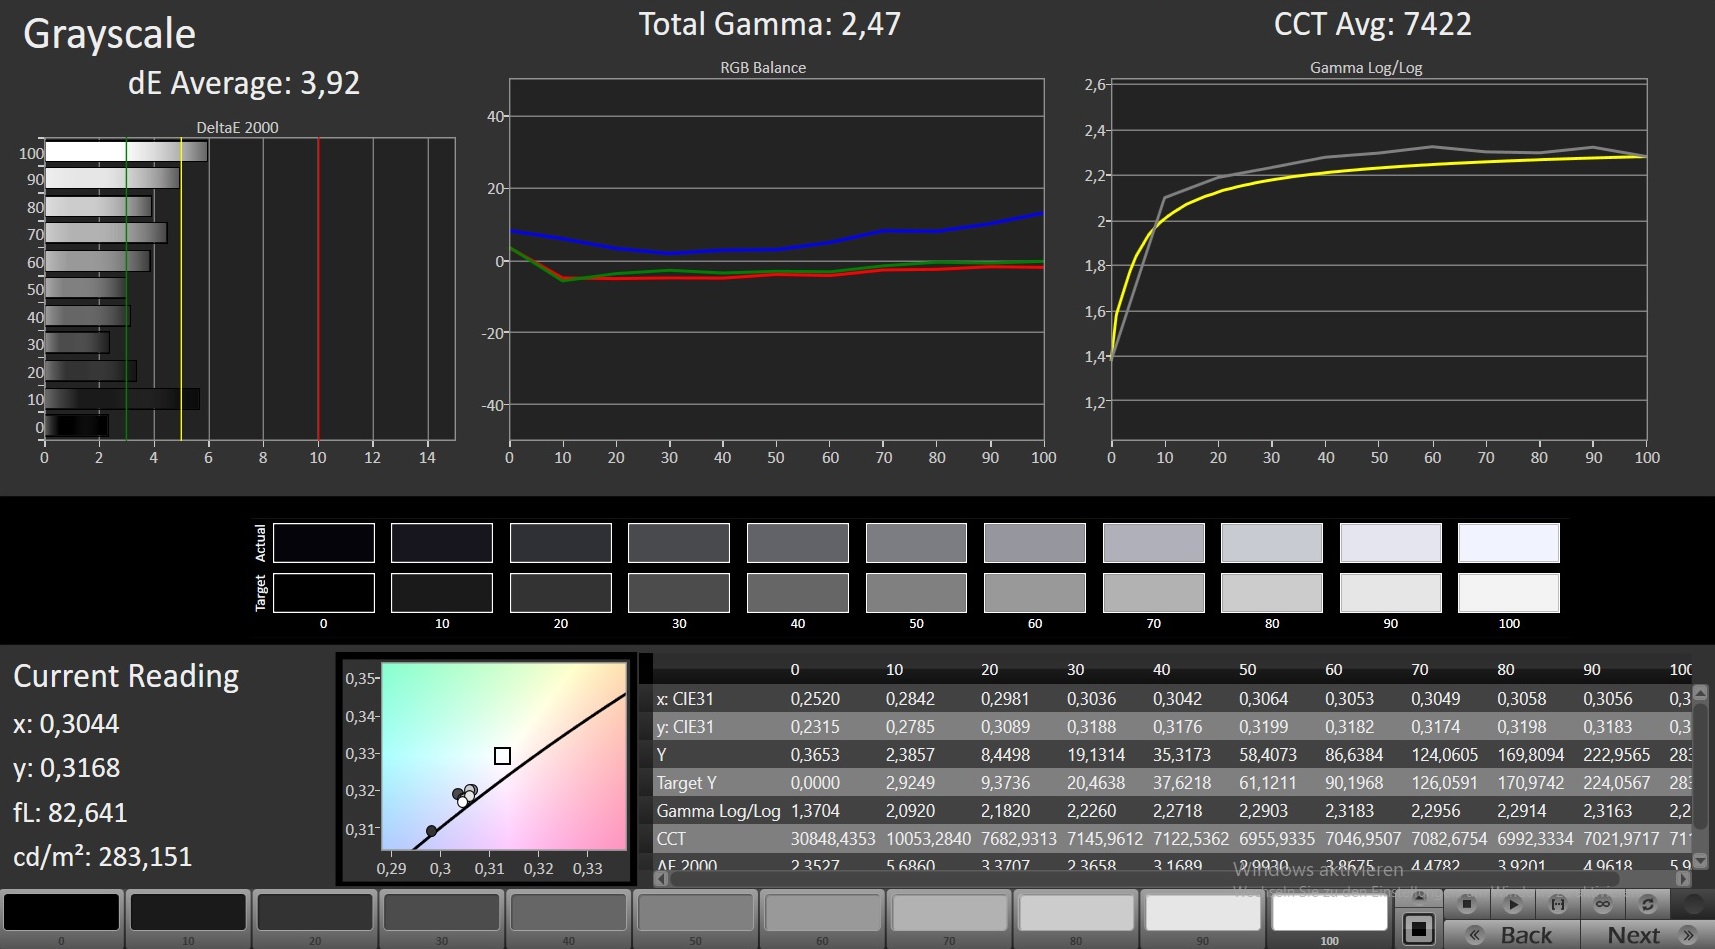
The Aero 15X’s matte IPS display is identical to its namesake. Decent viewing angles, a very good contrast ratio, and sufficiently high brightness are its main characteristics. The two panels differ ever so slightly, which is expected: two seemingly identical panels are never truly 100% identical.
Unfortunately, at brightness levels of 20% and below we were able to detect PMW flickering. On the plus side at 26,000 Hz the frequency high enough to spare even the most sensitive users headaches and sore eyes.
| |||||||||||||||||||||||||
Brightness Distribution: 88 %
Center on Battery: 338 cd/m²
Contrast: 994:1 (Black: 0.34 cd/m²)
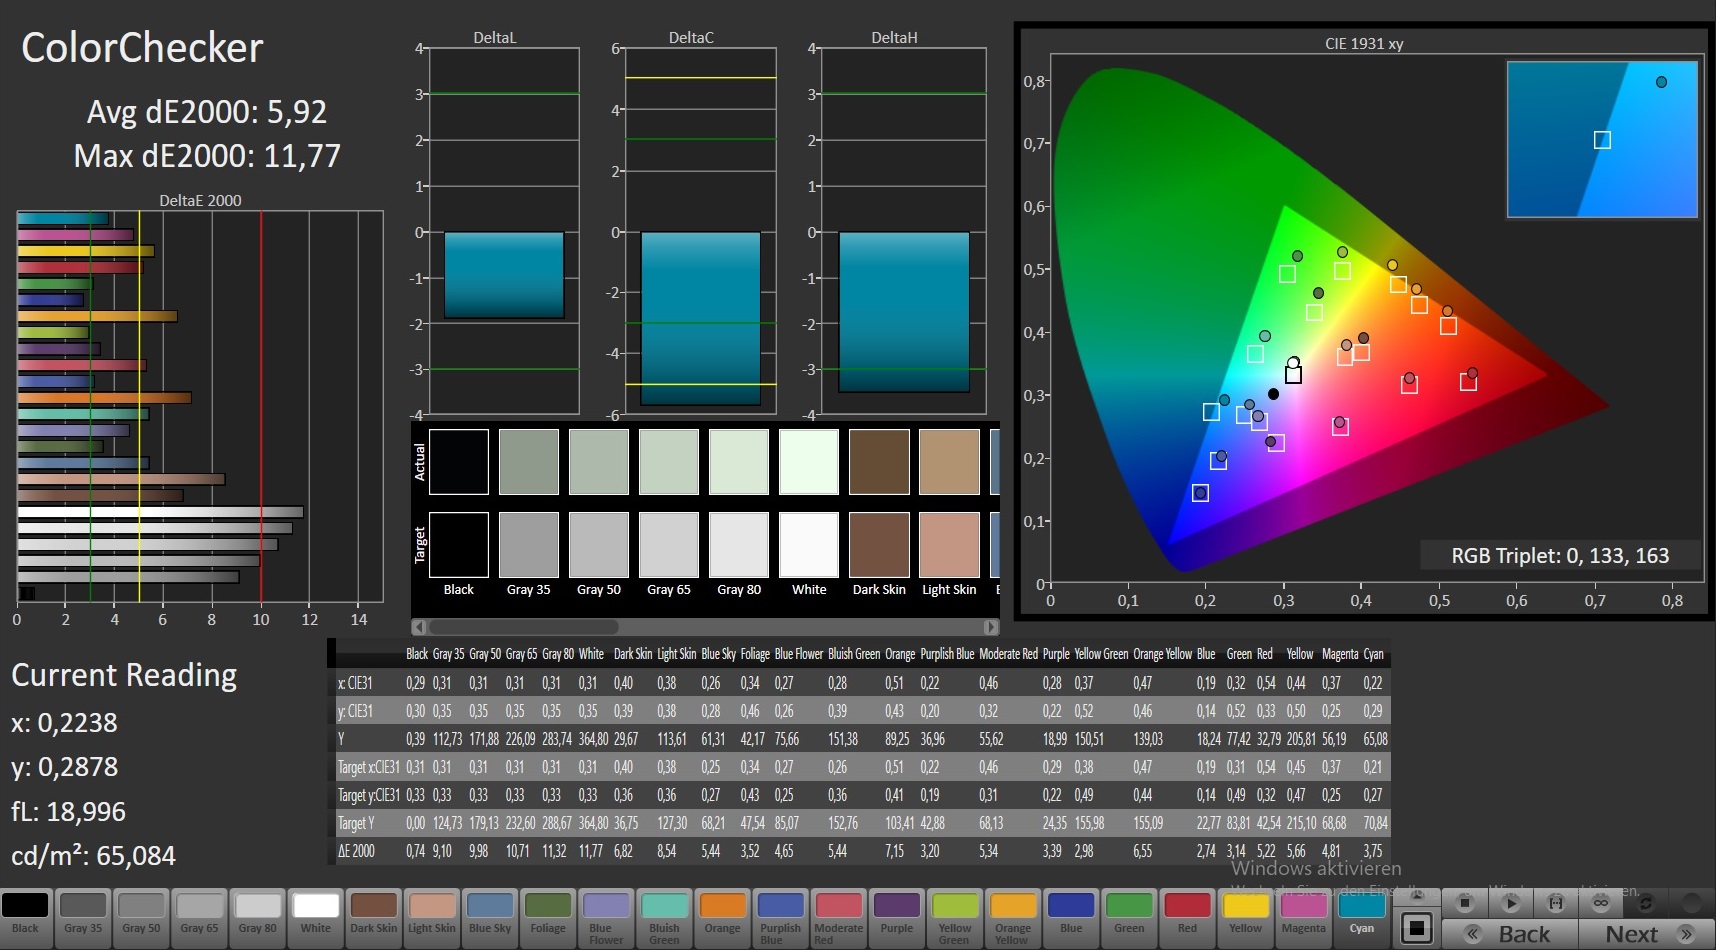
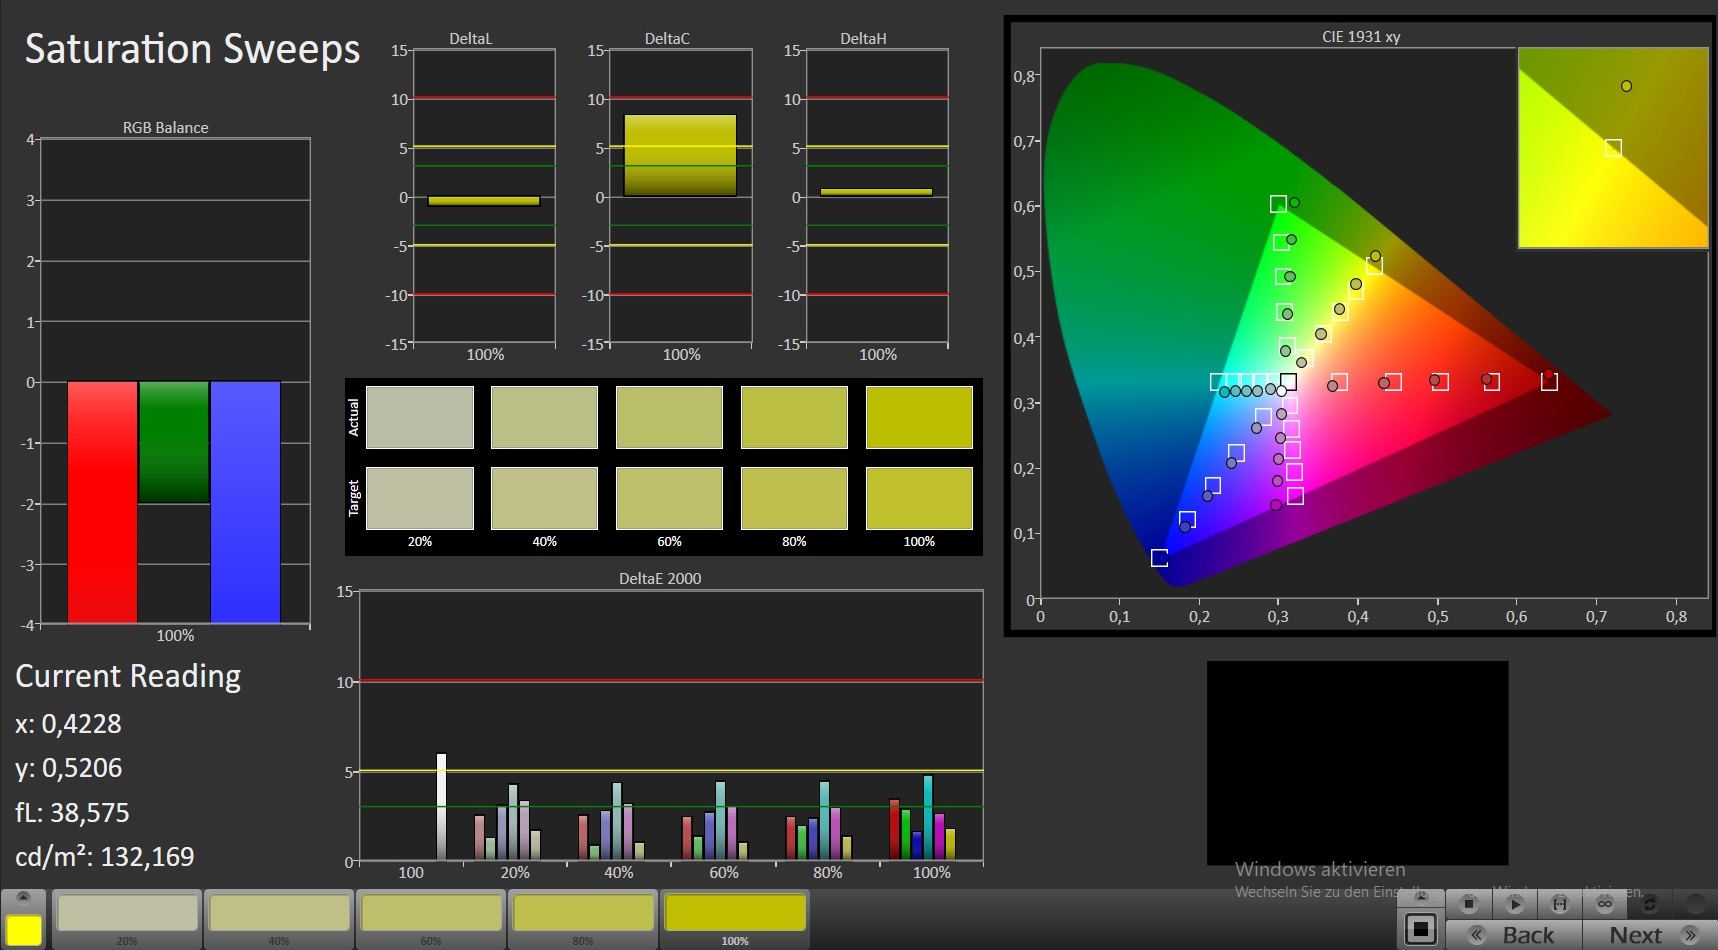
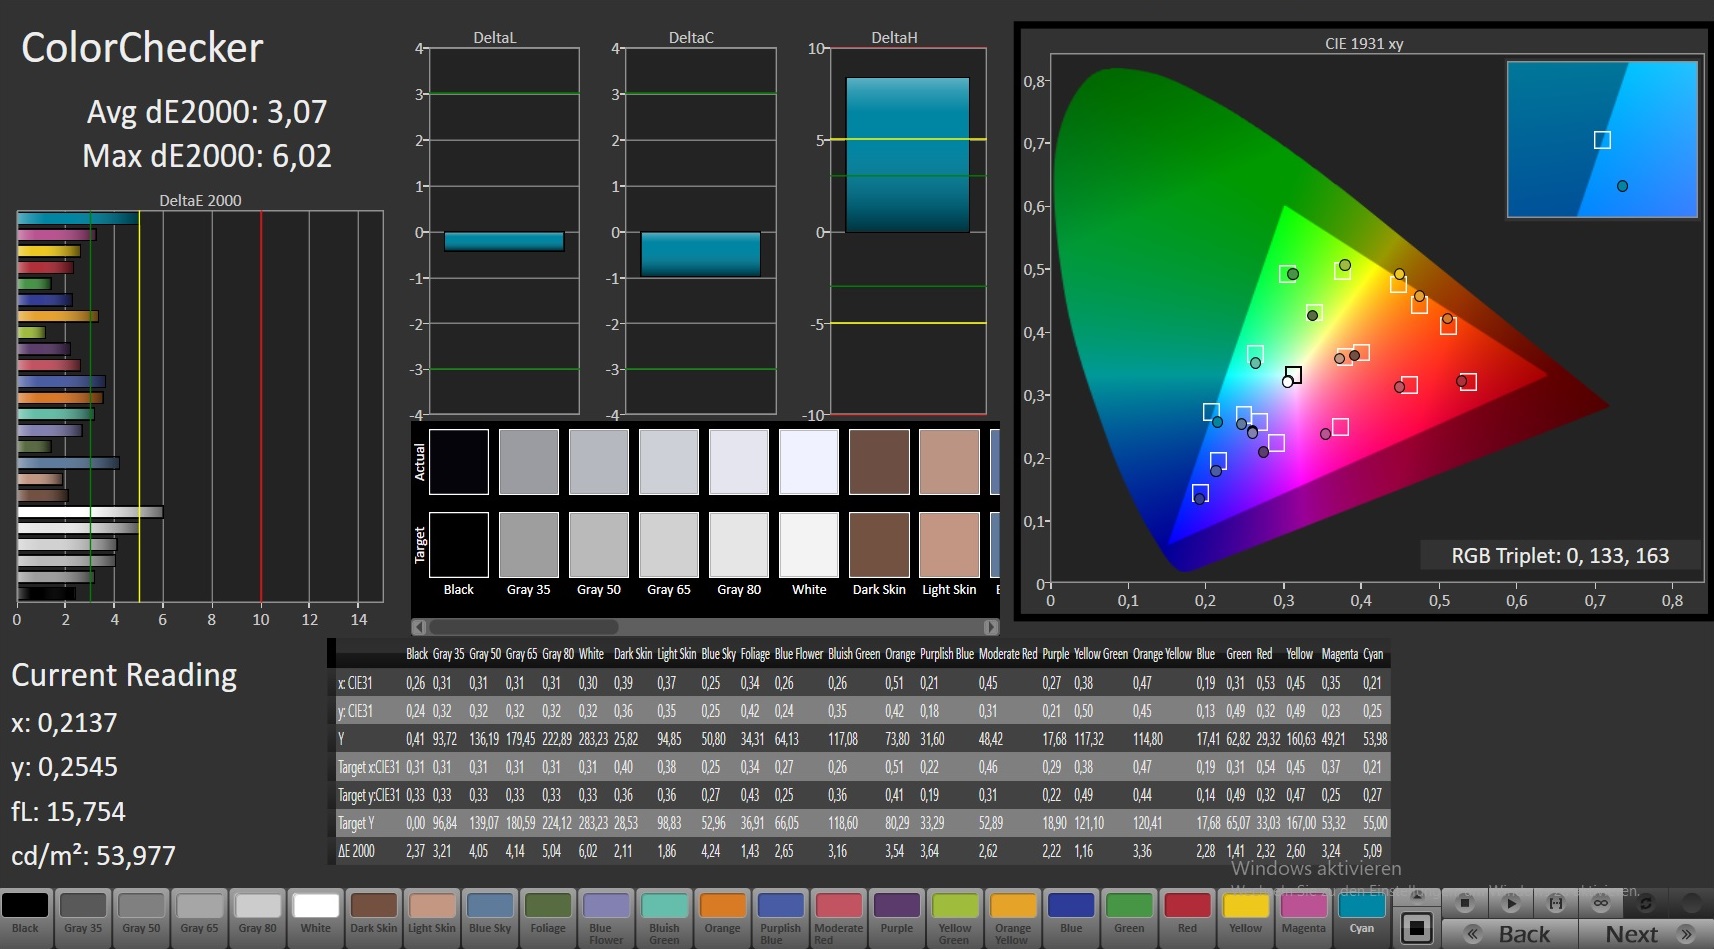
ΔE ColorChecker Calman: 5.92 | ∀{0.5-29.43 Ø4.73}
ΔE Greyscale Calman: 7.45 | ∀{0.09-98 Ø4.97}
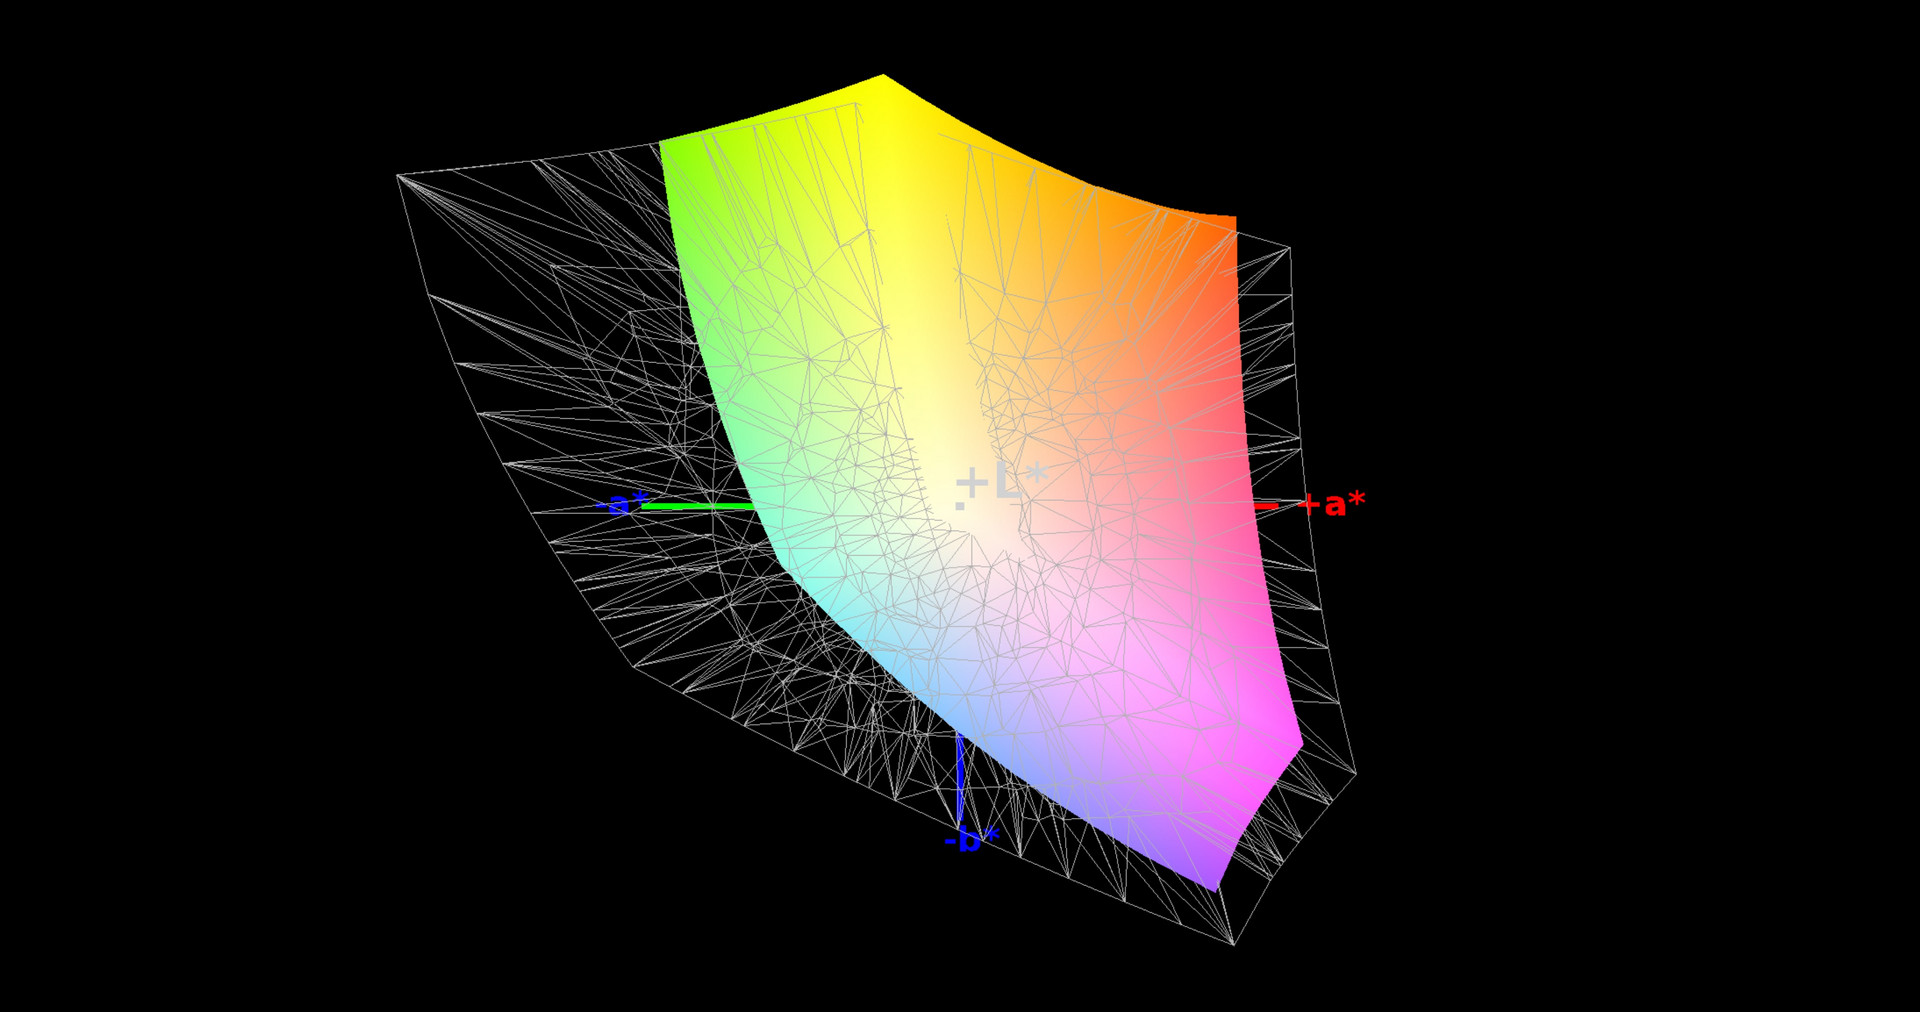
90% sRGB (Argyll 1.6.3 3D)
59% AdobeRGB 1998 (Argyll 1.6.3 3D)
65.7% AdobeRGB 1998 (Argyll 3D)
90.4% sRGB (Argyll 3D)
64.7% Display P3 (Argyll 3D)
Gamma: 2.58
CCT: 6366 K
| Gigabyte Aero 15X Chi Mei N156HCA-EA1 (CMN15D7), 1920x1080, 15.6" | MSI GS63VR 7RF-228US 3840x2160, 15.6" | Gigabyte Aero 15 N156HCA-EA1 (CMN15D7), 1920x1080, 15.6" | Asus Zephyrus GX501VS ID: AUO42ED, Name: AU Optronics B156HAN04.2, 1920x1080, 15.6" | Eurocom Q5 ID: LGD04D4, Name: LG Philips LP156UD1-SPB1, 3840x2160, 15.6" | |
|---|---|---|---|---|---|
| Display | -23% | 1% | -5% | -1% | |
| Display P3 Coverage (%) | 64.7 | 48.21 -25% | 65.2 1% | 62.1 -4% | 63 -3% |
| sRGB Coverage (%) | 90.4 | 72.6 -20% | 92.5 2% | 85.6 -5% | 92.7 3% |
| AdobeRGB 1998 Coverage (%) | 65.7 | 49.81 -24% | 66.5 1% | 62.4 -5% | 64.4 -2% |
| Response Times | 26% | -6% | 12% | 12% | |
| Response Time Grey 50% / Grey 80% * (ms) | 43.2 ? | 28 ? 35% | 42.8 ? 1% | 33.2 ? 23% | 32.4 ? 25% |
| Response Time Black / White * (ms) | 28.4 ? | 23.6 ? 17% | 32 ? -13% | 28 ? 1% | 28.8 ? -1% |
| PWM Frequency (Hz) | 26000 ? | 1351 ? | 26000 ? | ||
| Screen | -22% | 4% | 11% | -9% | |
| Brightness middle (cd/m²) | 338 | 274.2 -19% | 320 -5% | 307.1 -9% | 287.5 -15% |
| Brightness (cd/m²) | 324 | 263 -19% | 316 -2% | 309 -5% | 279 -14% |
| Brightness Distribution (%) | 88 | 92 5% | 90 2% | 86 -2% | 87 -1% |
| Black Level * (cd/m²) | 0.34 | 0.44 -29% | 0.36 -6% | 0.35 -3% | 0.65 -91% |
| Contrast (:1) | 994 | 623 -37% | 889 -11% | 877 -12% | 442 -56% |
| Colorchecker dE 2000 * | 5.92 | 8 -35% | 4.62 22% | 3.4 43% | 4.5 24% |
| Colorchecker dE 2000 max. * | 11.77 | 14.6 -24% | 9.75 17% | 8.2 30% | 8.9 24% |
| Greyscale dE 2000 * | 7.45 | 9.1 -22% | 6 19% | 1.4 81% | 4.6 38% |
| Gamma | 2.58 85% | 2.24 98% | 2.46 89% | 2.19 100% | 2.39 92% |
| CCT | 6366 102% | 5020 129% | 6761 96% | 6558 99% | 7393 88% |
| Color Space (Percent of AdobeRGB 1998) (%) | 59 | 45.7 -23% | 60 2% | 55.6 -6% | 59 0% |
| Color Space (Percent of sRGB) (%) | 90 | 72.1 -20% | 92 2% | 85 -6% | 92.3 3% |
| Total Average (Program / Settings) | -6% /
-16% | -0% /
2% | 6% /
8% | 1% /
-4% |
* ... smaller is better
Screen Flickering / PWM (Pulse-Width Modulation)
| Screen flickering / PWM detected | 26000 Hz | ≤ 20 % brightness setting | 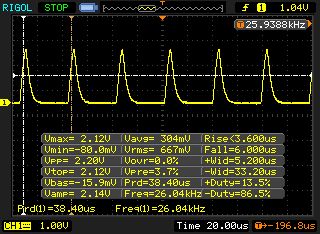 |
The display backlight flickers at 26000 Hz (worst case, e.g., utilizing PWM) Flickering detected at a brightness setting of 20 % and below. There should be no flickering or PWM above this brightness setting. The frequency of 26000 Hz is quite high, so most users sensitive to PWM should not notice any flickering. In comparison: 52 % of all tested devices do not use PWM to dim the display. If PWM was detected, an average of 7794 (minimum: 5 - maximum: 343500) Hz was measured. | |||

Display Response Times
| ↔ Response Time Black to White | ||
|---|---|---|
| 28.4 ms ... rise ↗ and fall ↘ combined | ↗ 15.6 ms rise | 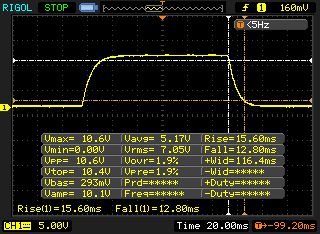 |
| ↘ 12.8 ms fall | ||
| The screen shows relatively slow response rates in our tests and may be too slow for gamers. In comparison, all tested devices range from 0.1 (minimum) to 240 (maximum) ms. » 75 % of all devices are better. This means that the measured response time is worse than the average of all tested devices (19.9 ms). | ||
| ↔ Response Time 50% Grey to 80% Grey | ||
| 43.2 ms ... rise ↗ and fall ↘ combined | ↗ 22.8 ms rise | 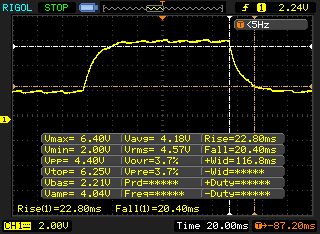 |
| ↘ 20.4 ms fall | ||
| The screen shows slow response rates in our tests and will be unsatisfactory for gamers. In comparison, all tested devices range from 0.165 (minimum) to 636 (maximum) ms. » 72 % of all devices are better. This means that the measured response time is worse than the average of all tested devices (31.1 ms). | ||
Performance
Gigabyte’s Aero 15X is a portable yet elegant 15.6-inch multimedia/gaming notebook. It manages to run all current games smoothly and has no trouble with other demands as well. Our review unit sells for around $2,200 in the US, and around 2,400 Euros in Europe. Several differently equipped SKUs are available.
Test Conditions
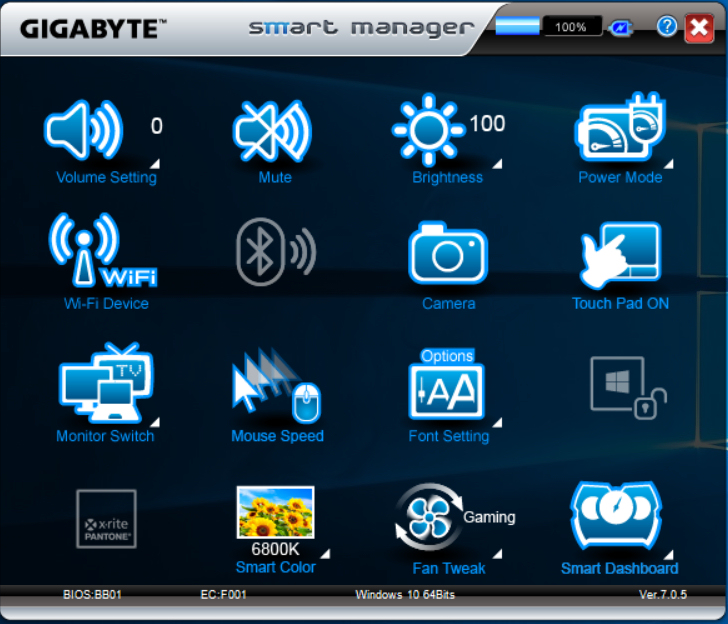
The preloaded “SmartManager” tool enables users to select from various fan control presets. While performing our benchmarks, we chose the profile “Gaming” save for the battery tests, where we reverted to “Normal”.
Processor
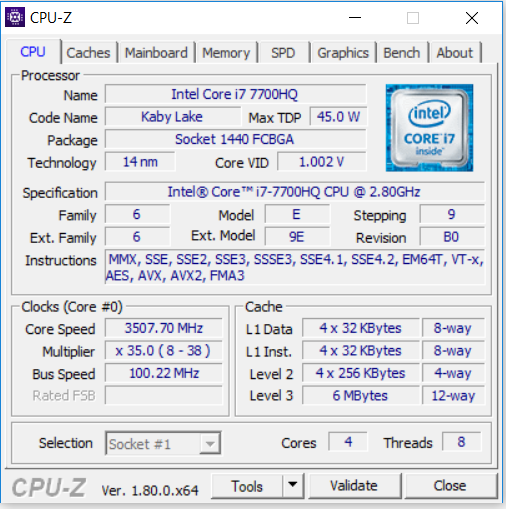
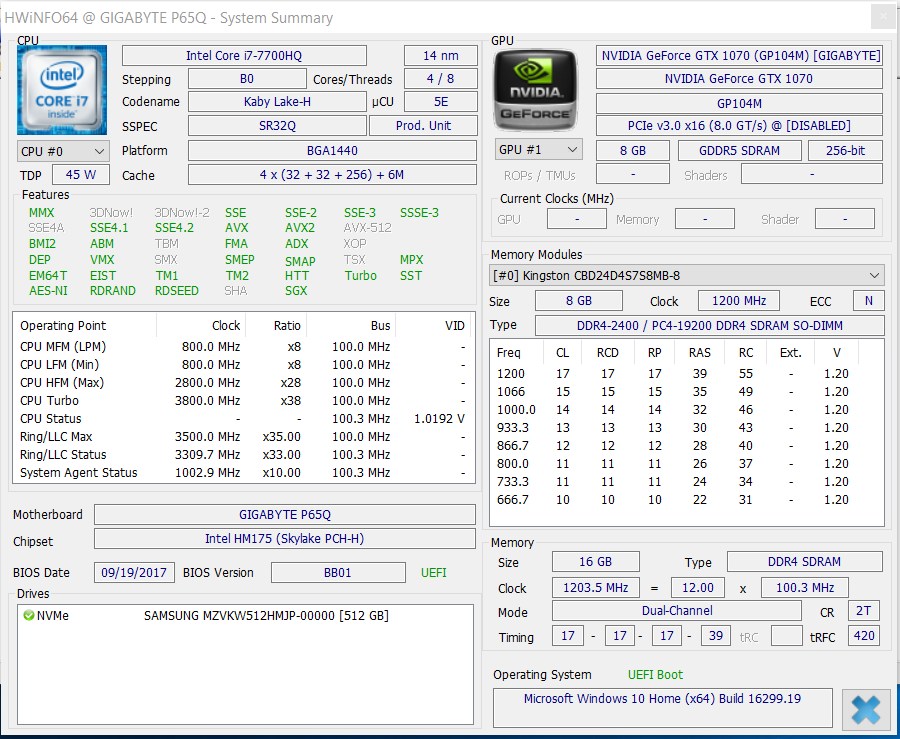
Like most gaming notebooks the Aero 15X is equipped with Intel’s Core i7-7700HQ quad-core Kaby Lake CPU. Given this microprocessor’s raw computing power combined with its comparatively moderate energy consumption this came as little surprise. With its base clock speed of 2.8 GHz it offers a turbo boost of up to 3.4 GHz on four, 3.6 GHz on two, or 3.8 GHz on a single core. Turbo boost is only applied on mains. In our tests, the CPU ran at full boost between 3.4 and 3.8 GHz in the single thread and 3.4 GHz in the multithread benchmarks. On battery, the firmware reduced the CPU’s frequency to just 2.6 GHz.
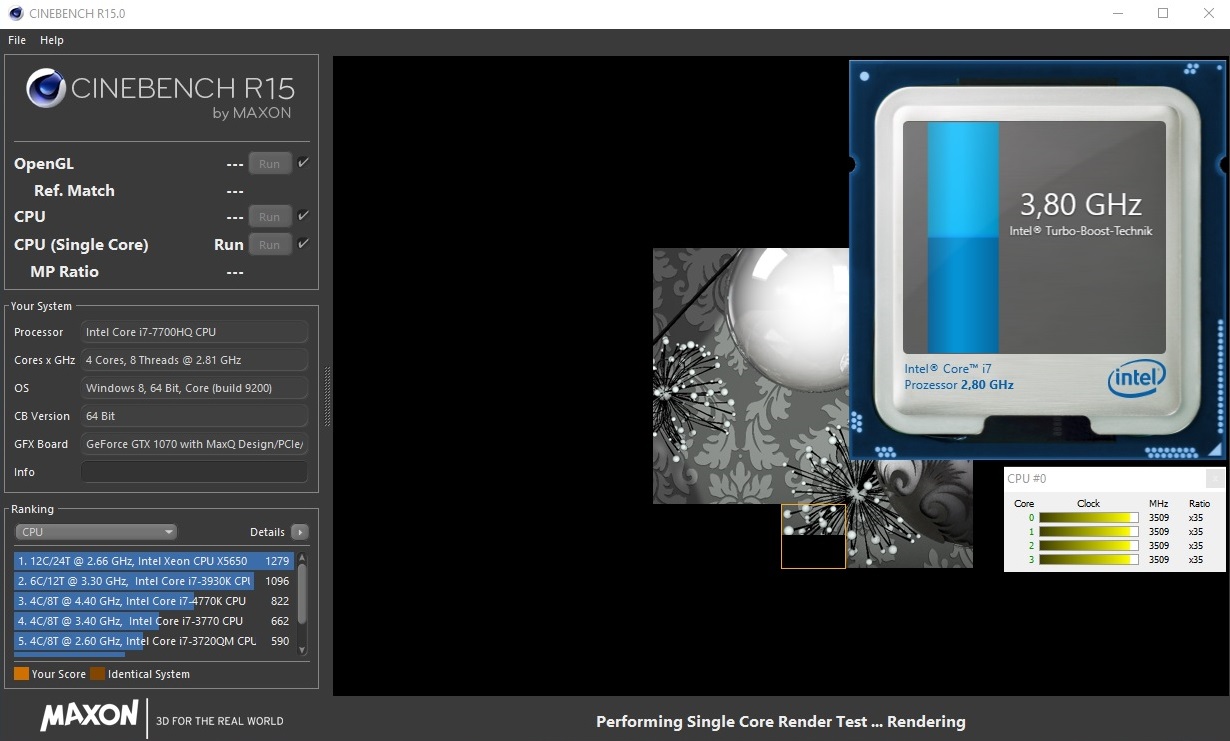
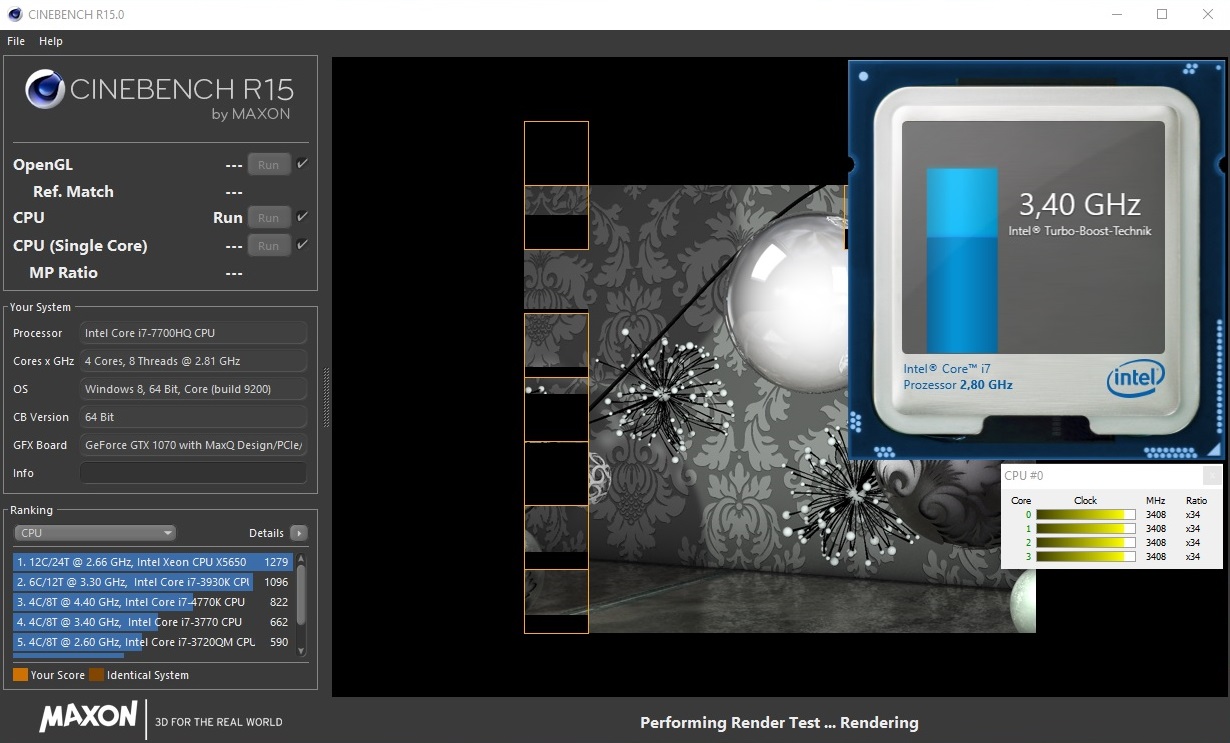
Whether or not a notebook is capable of maintaining its turbo boost for periods of sustained load is determined by our 30-minute Cinebench R15 multithread loop. The Aero 15X’s scores did not drop after the first few iterations or later on, and scores remained consistently high throughout the entire test.
CPU benchmark scores were at eye level with other comparatively equipped notebooks.
| Cinebench R10 | |
| Rendering Single 32Bit | |
| Gigabyte Aero 15X | |
| HP Omen 15-ce002ng | |
| Eurocom Q5 | |
| Asus Zephyrus GX501VS | |
| MSI GS63VR 7RF-228US | |
| MSI GS63VR 7RG | |
| Rendering Multiple CPUs 32Bit | |
| Gigabyte Aero 15X | |
| Asus Zephyrus GX501VS | |
| HP Omen 15-ce002ng | |
| MSI GS63VR 7RF-228US | |
| Eurocom Q5 | |
| MSI GS63VR 7RG | |
| Geekbench 3 | |
| 32 Bit Multi-Core Score | |
| Gigabyte Aero 15X | |
| 32 Bit Single-Core Score | |
| Gigabyte Aero 15X | |
| Geekbench 4.0 | |
| 64 Bit Multi-Core Score | |
| Gigabyte Aero 15X | |
| 64 Bit Single-Core Score | |
| Gigabyte Aero 15X | |
| Geekbench 4.4 | |
| 64 Bit Multi-Core Score | |
| Gigabyte Aero 15X | |
| 64 Bit Single-Core Score | |
| Gigabyte Aero 15X | |
| JetStream 1.1 - 1.1 Total | |
| Gigabyte Aero 15X (Edge 41) | |
| Eurocom Q5 (Edge 40.15063.0.0) | |
| MSI GS63VR 7RF-228US (Edge 38.14393.0.0) | |
| Acer Aspire VN7-593G-73HP V15 Nitro BE | |
| Asus Zephyrus GX501VS (Edge 40.15063.0.0) | |
System Performance
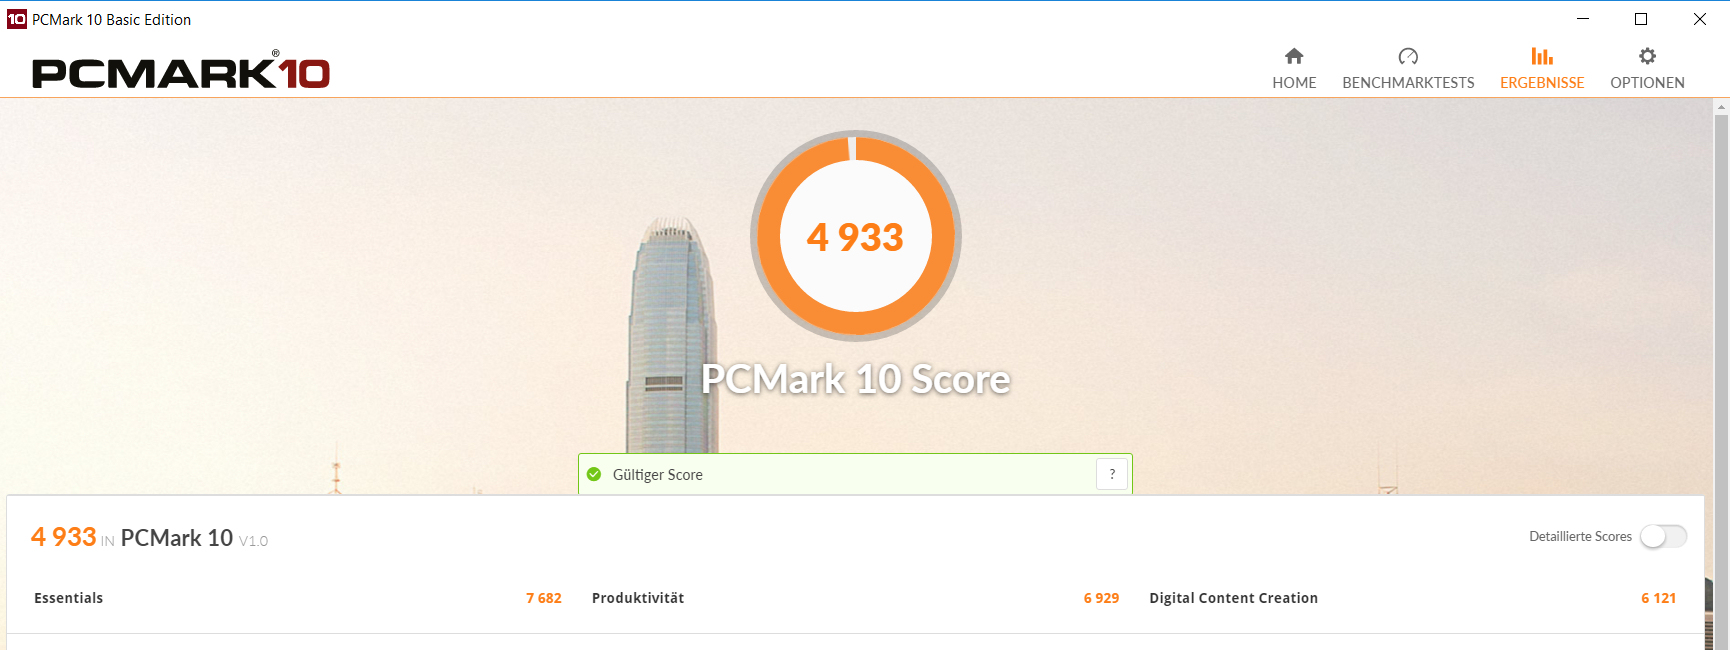
System performance was top-notch, as can be seen in PCMark’s excellent benchmark scores. Again, this came as little surprise given the notebook’s powerful hardware. During our entire review period, we have not experienced any issues with the device whatsoever. Further improvements are all but impossible; Gigabyte has already maxed this notebook out.
| PCMark 7 Score | 6288 points | |
| PCMark 8 Home Score Accelerated v2 | 4394 points | |
| PCMark 8 Creative Score Accelerated v2 | 5546 points | |
| PCMark 8 Work Score Accelerated v2 | 5195 points | |
| PCMark 10 Score | 4933 points | |
Help | ||
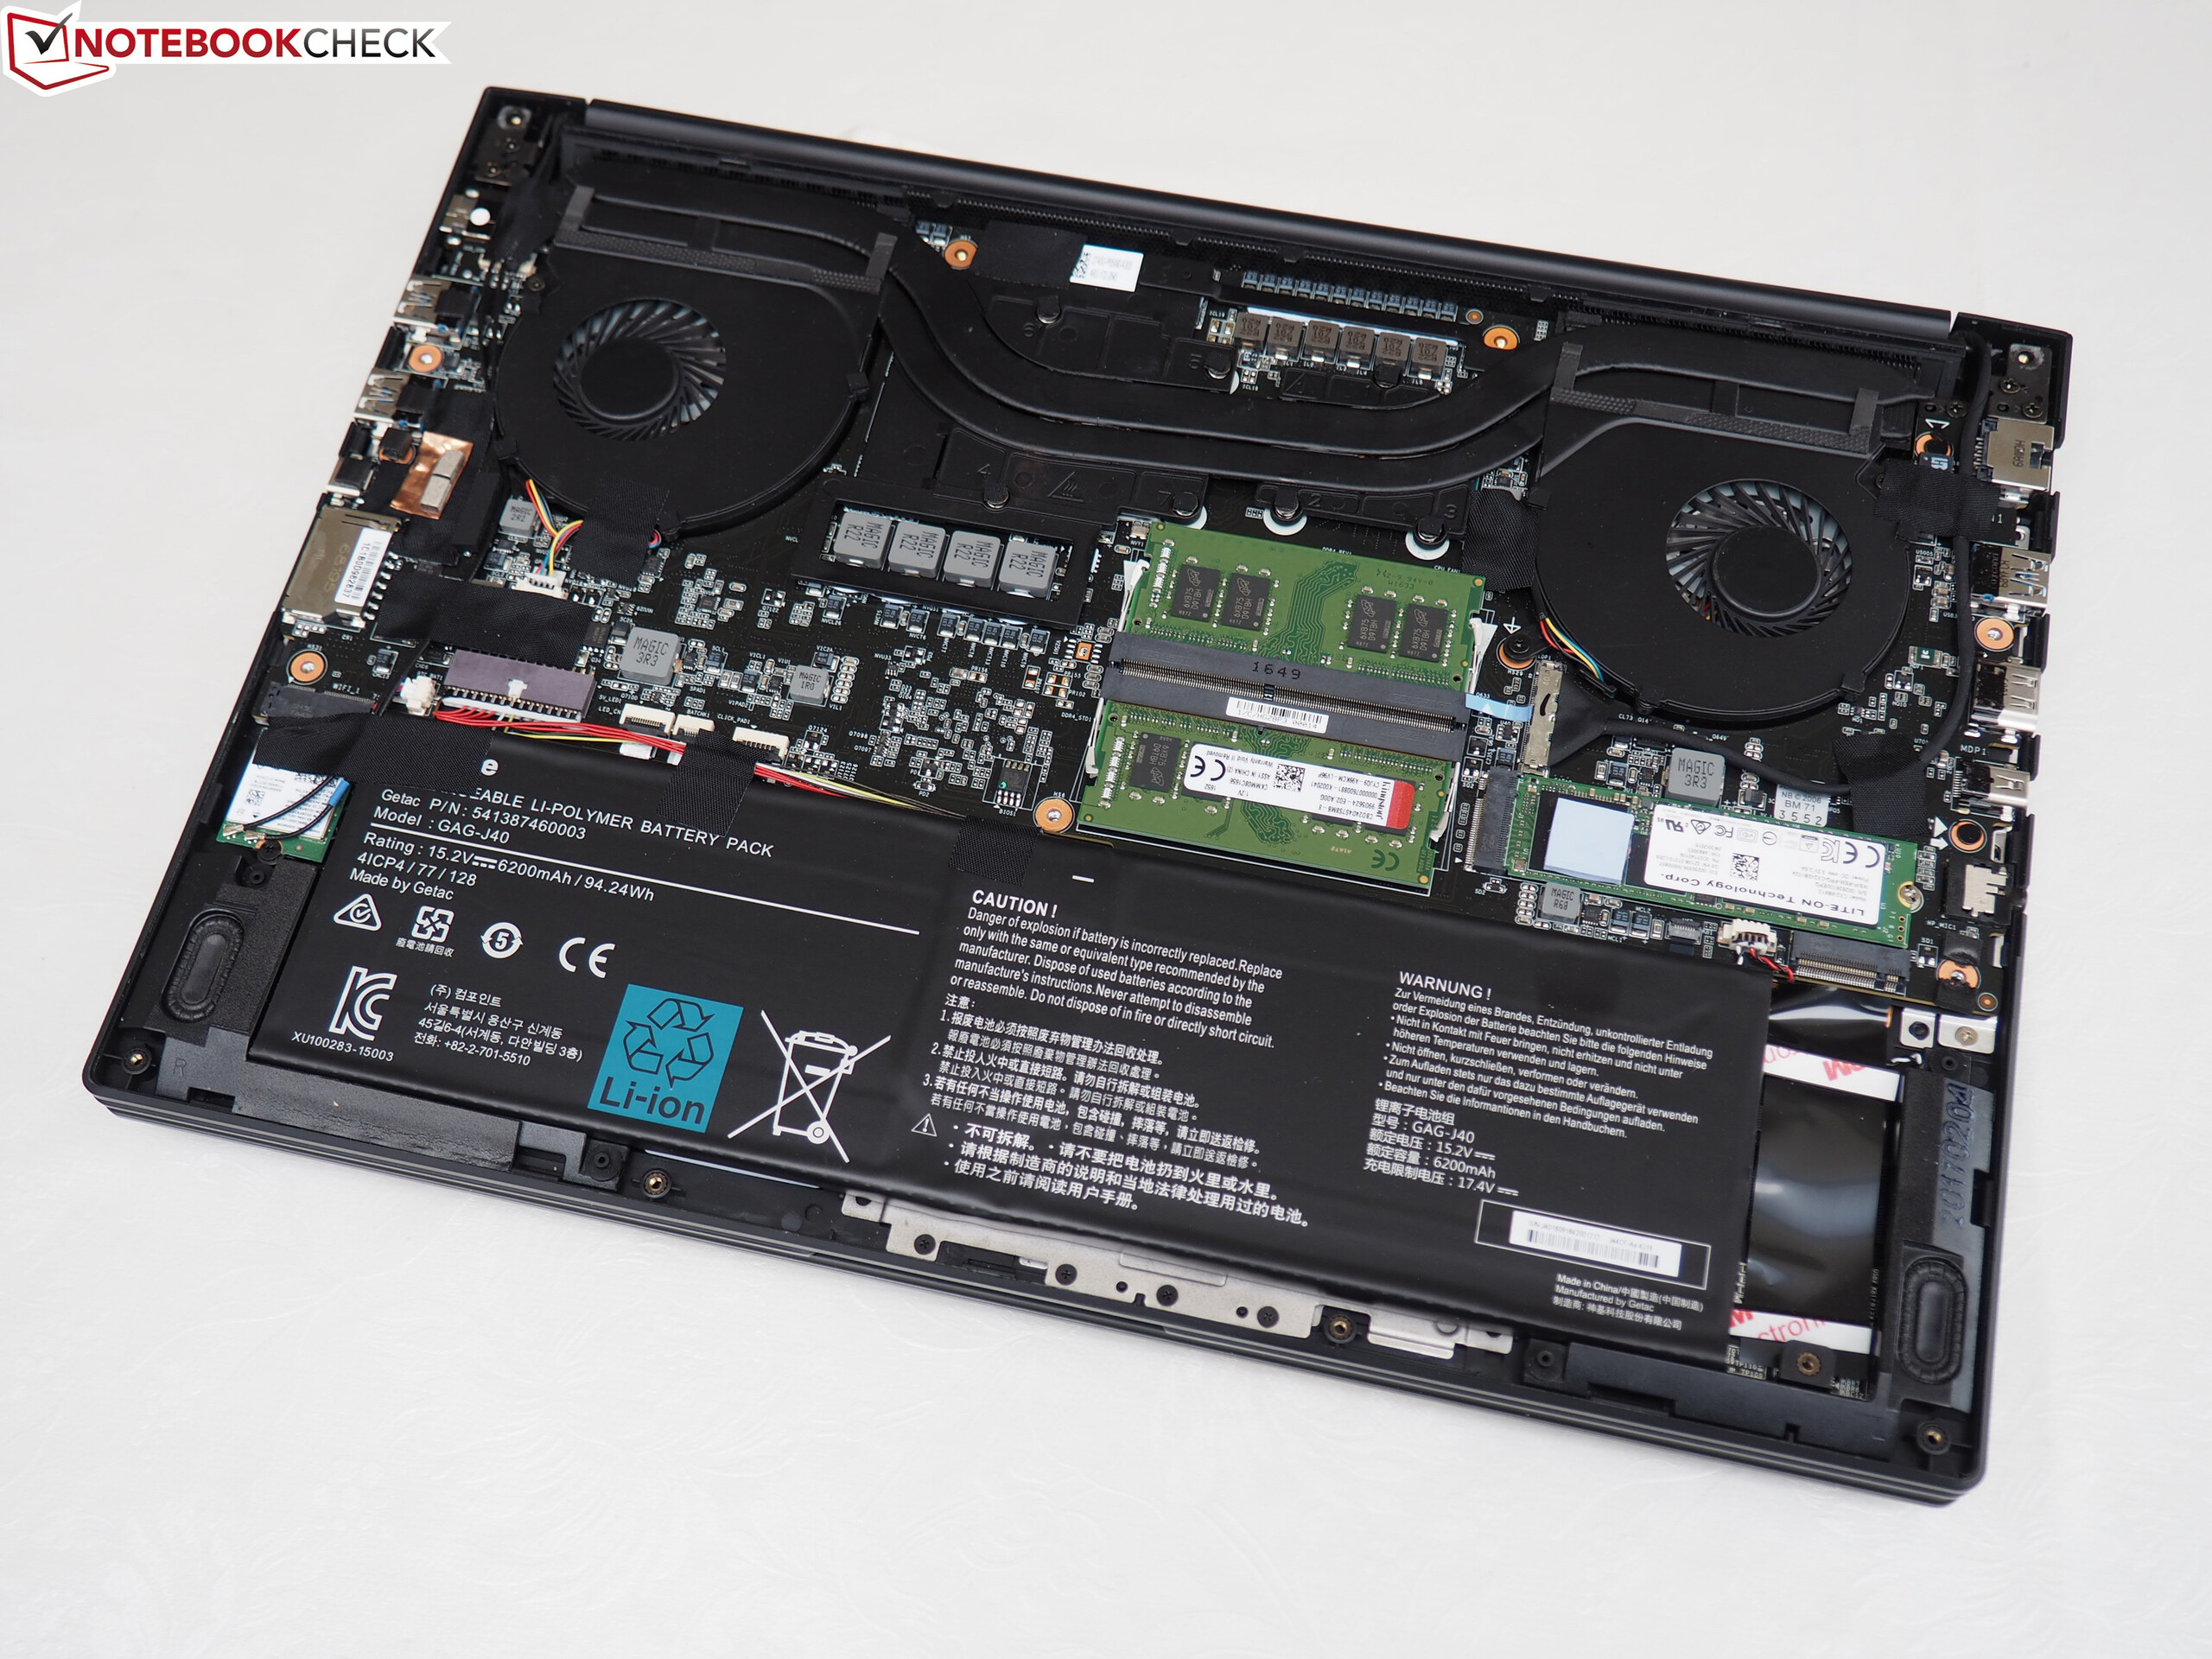
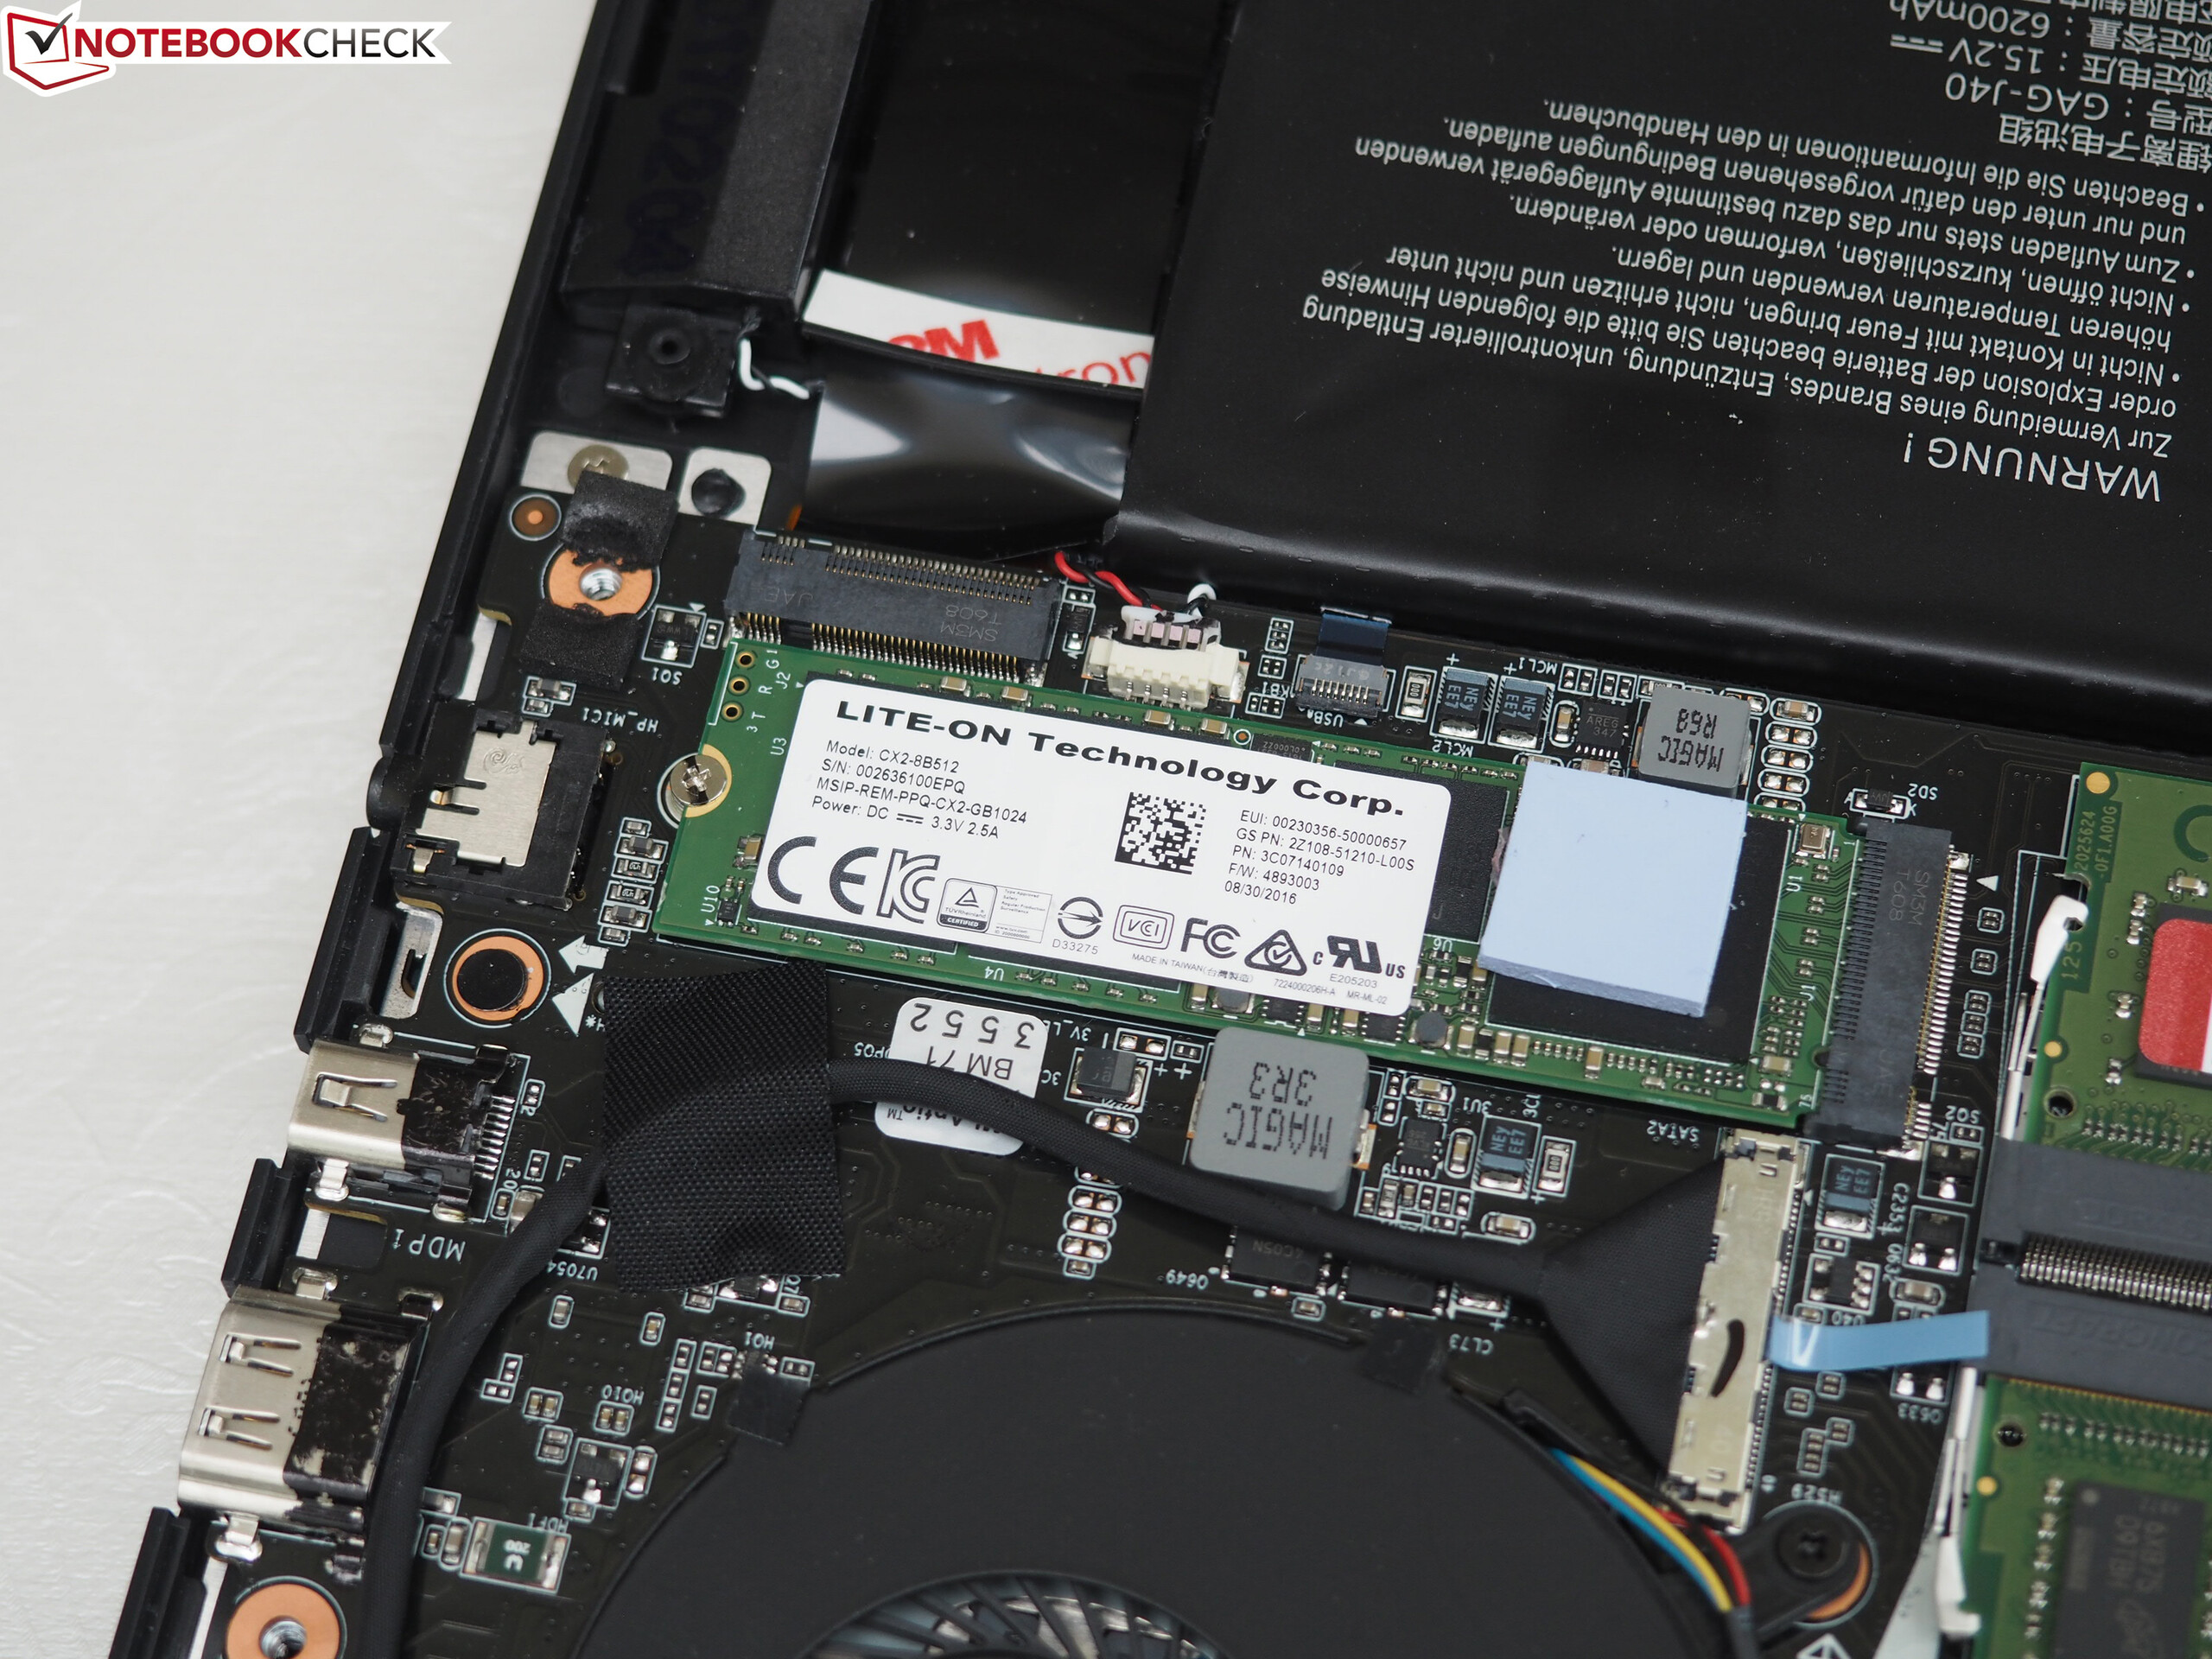
Storage Devices
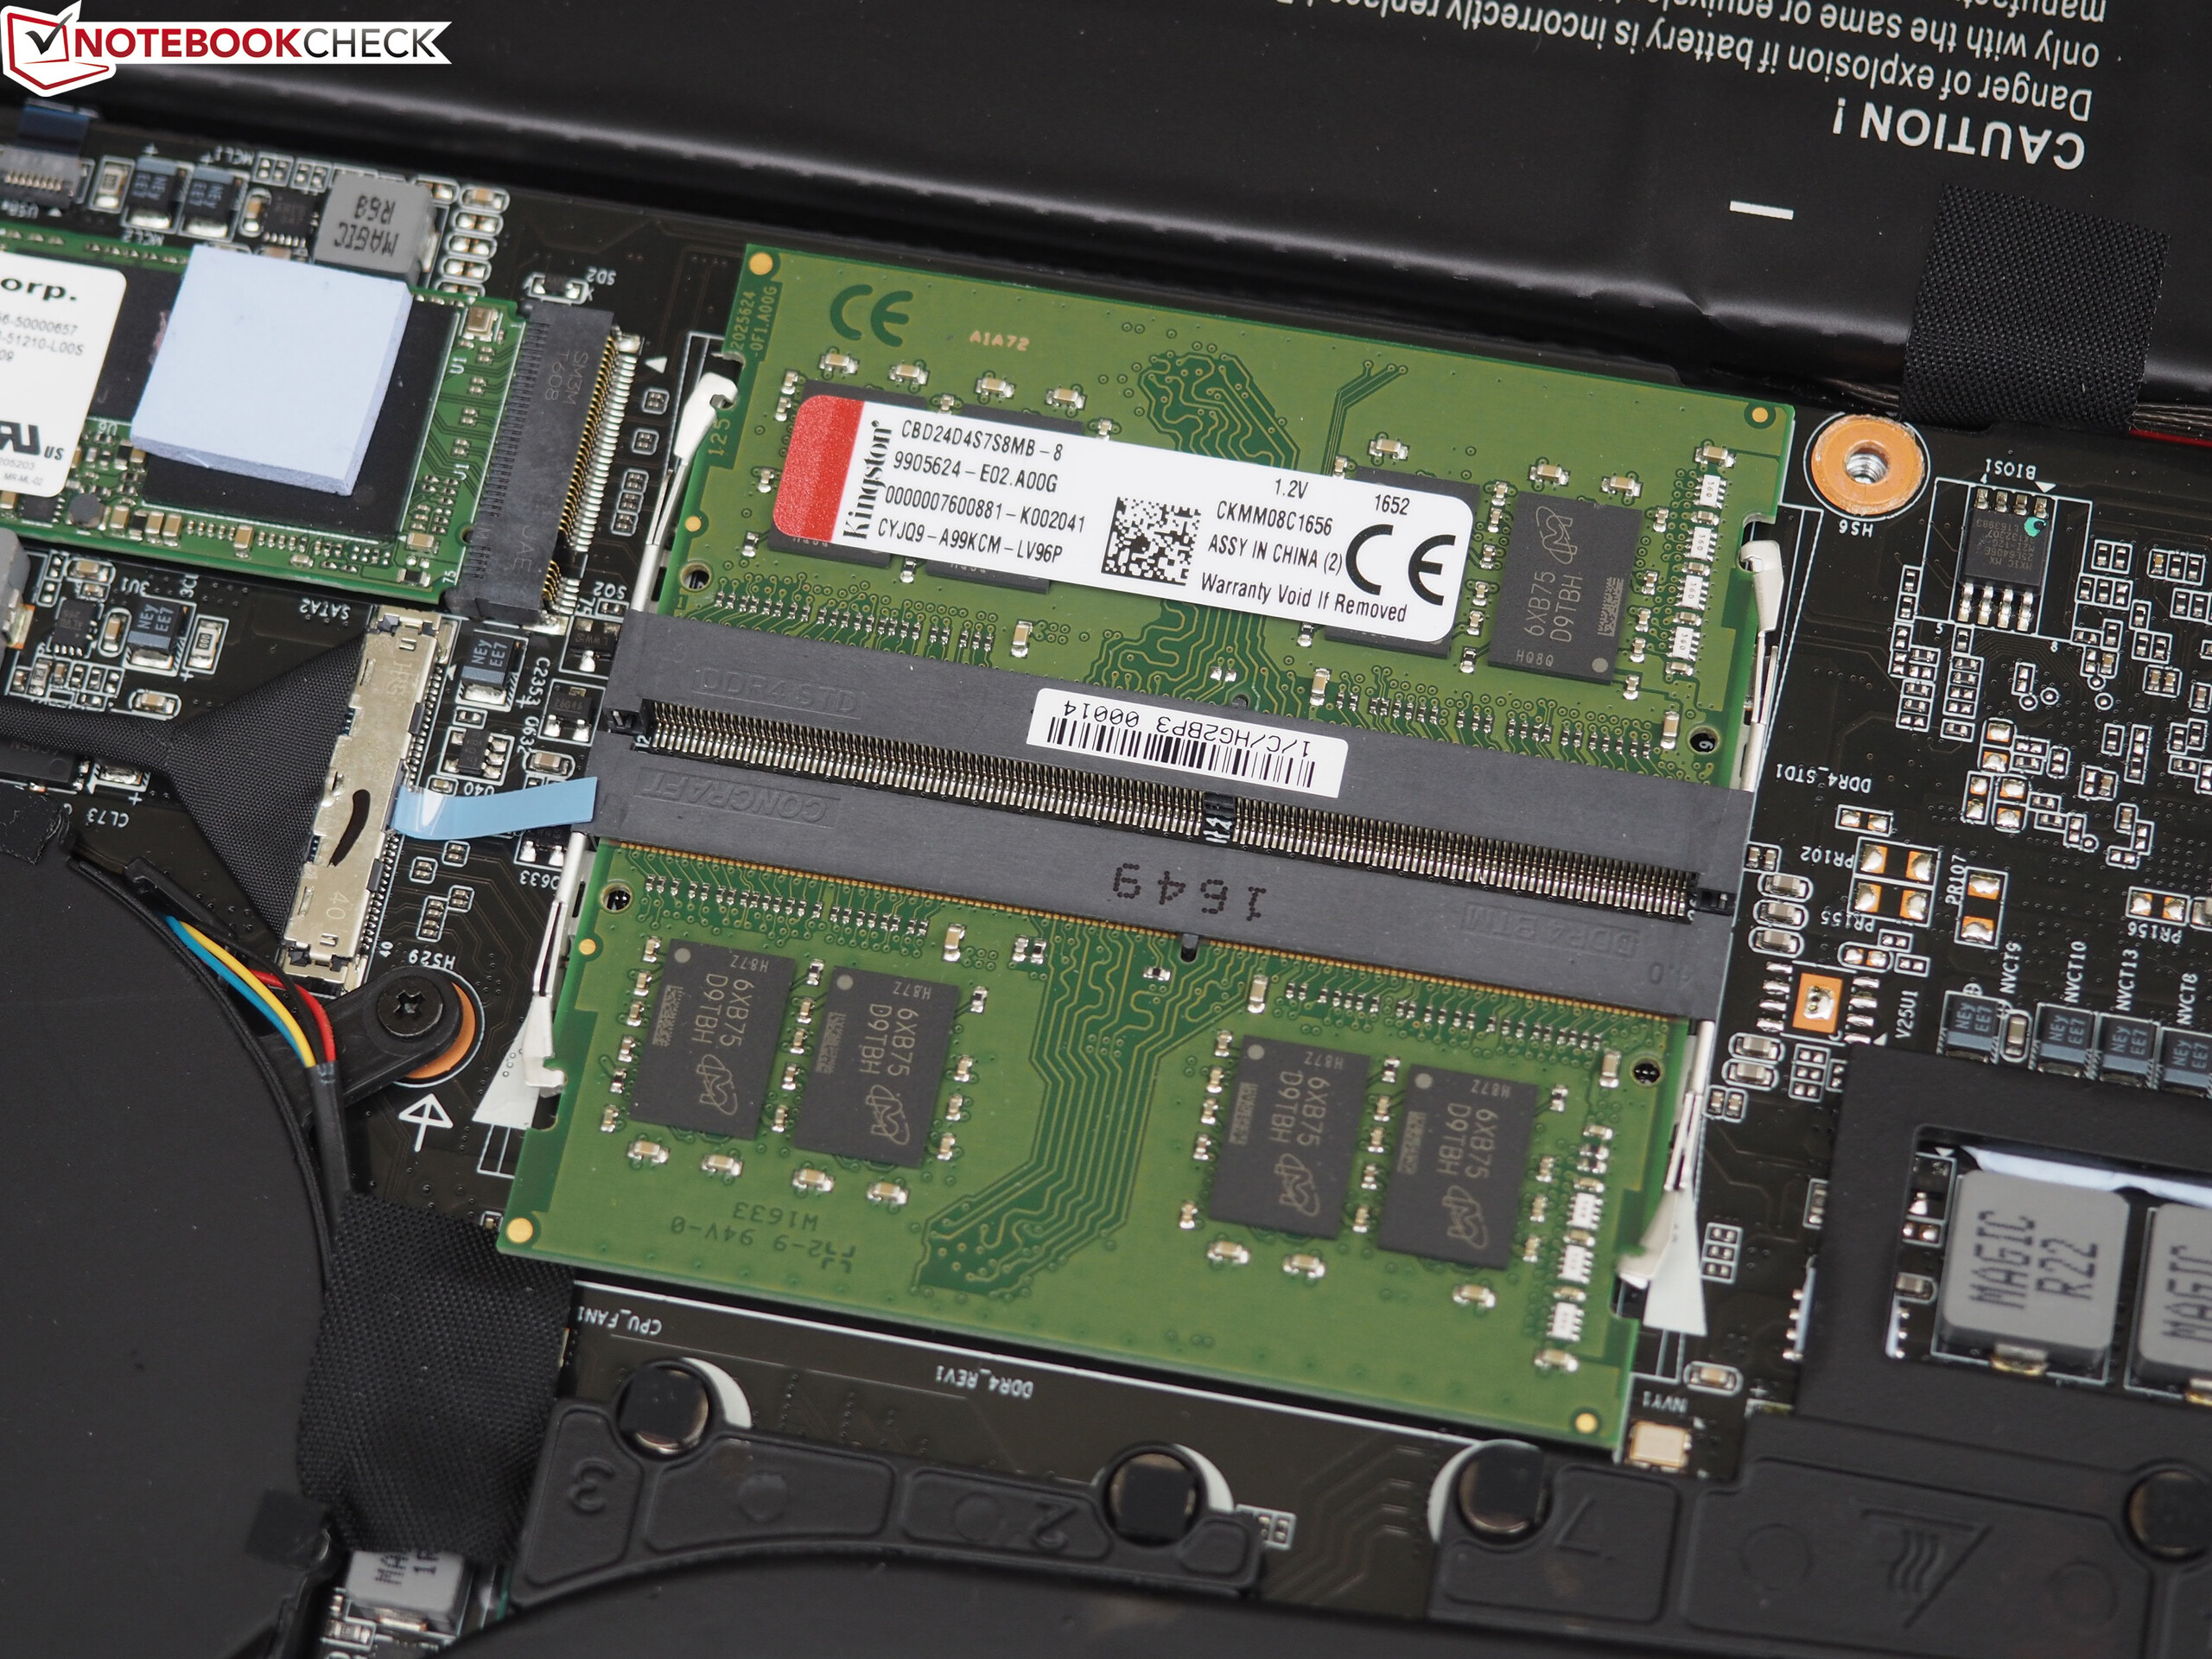
The 512 GB large M.2-2280 NVMe-SSD is made by Samsung. Out of the box, around 430 GB are available with the rest being gobbled up by the operating system and the recovery partition. The SSD is connected to the system via PCIe 3.0 x4, which allows for much higher transfer speeds than the usual SATA III connection, and as expected, the SSD’s transfer speeds were excellent. Installing Samsung’s NVMe driver did not improve upon storage performance.
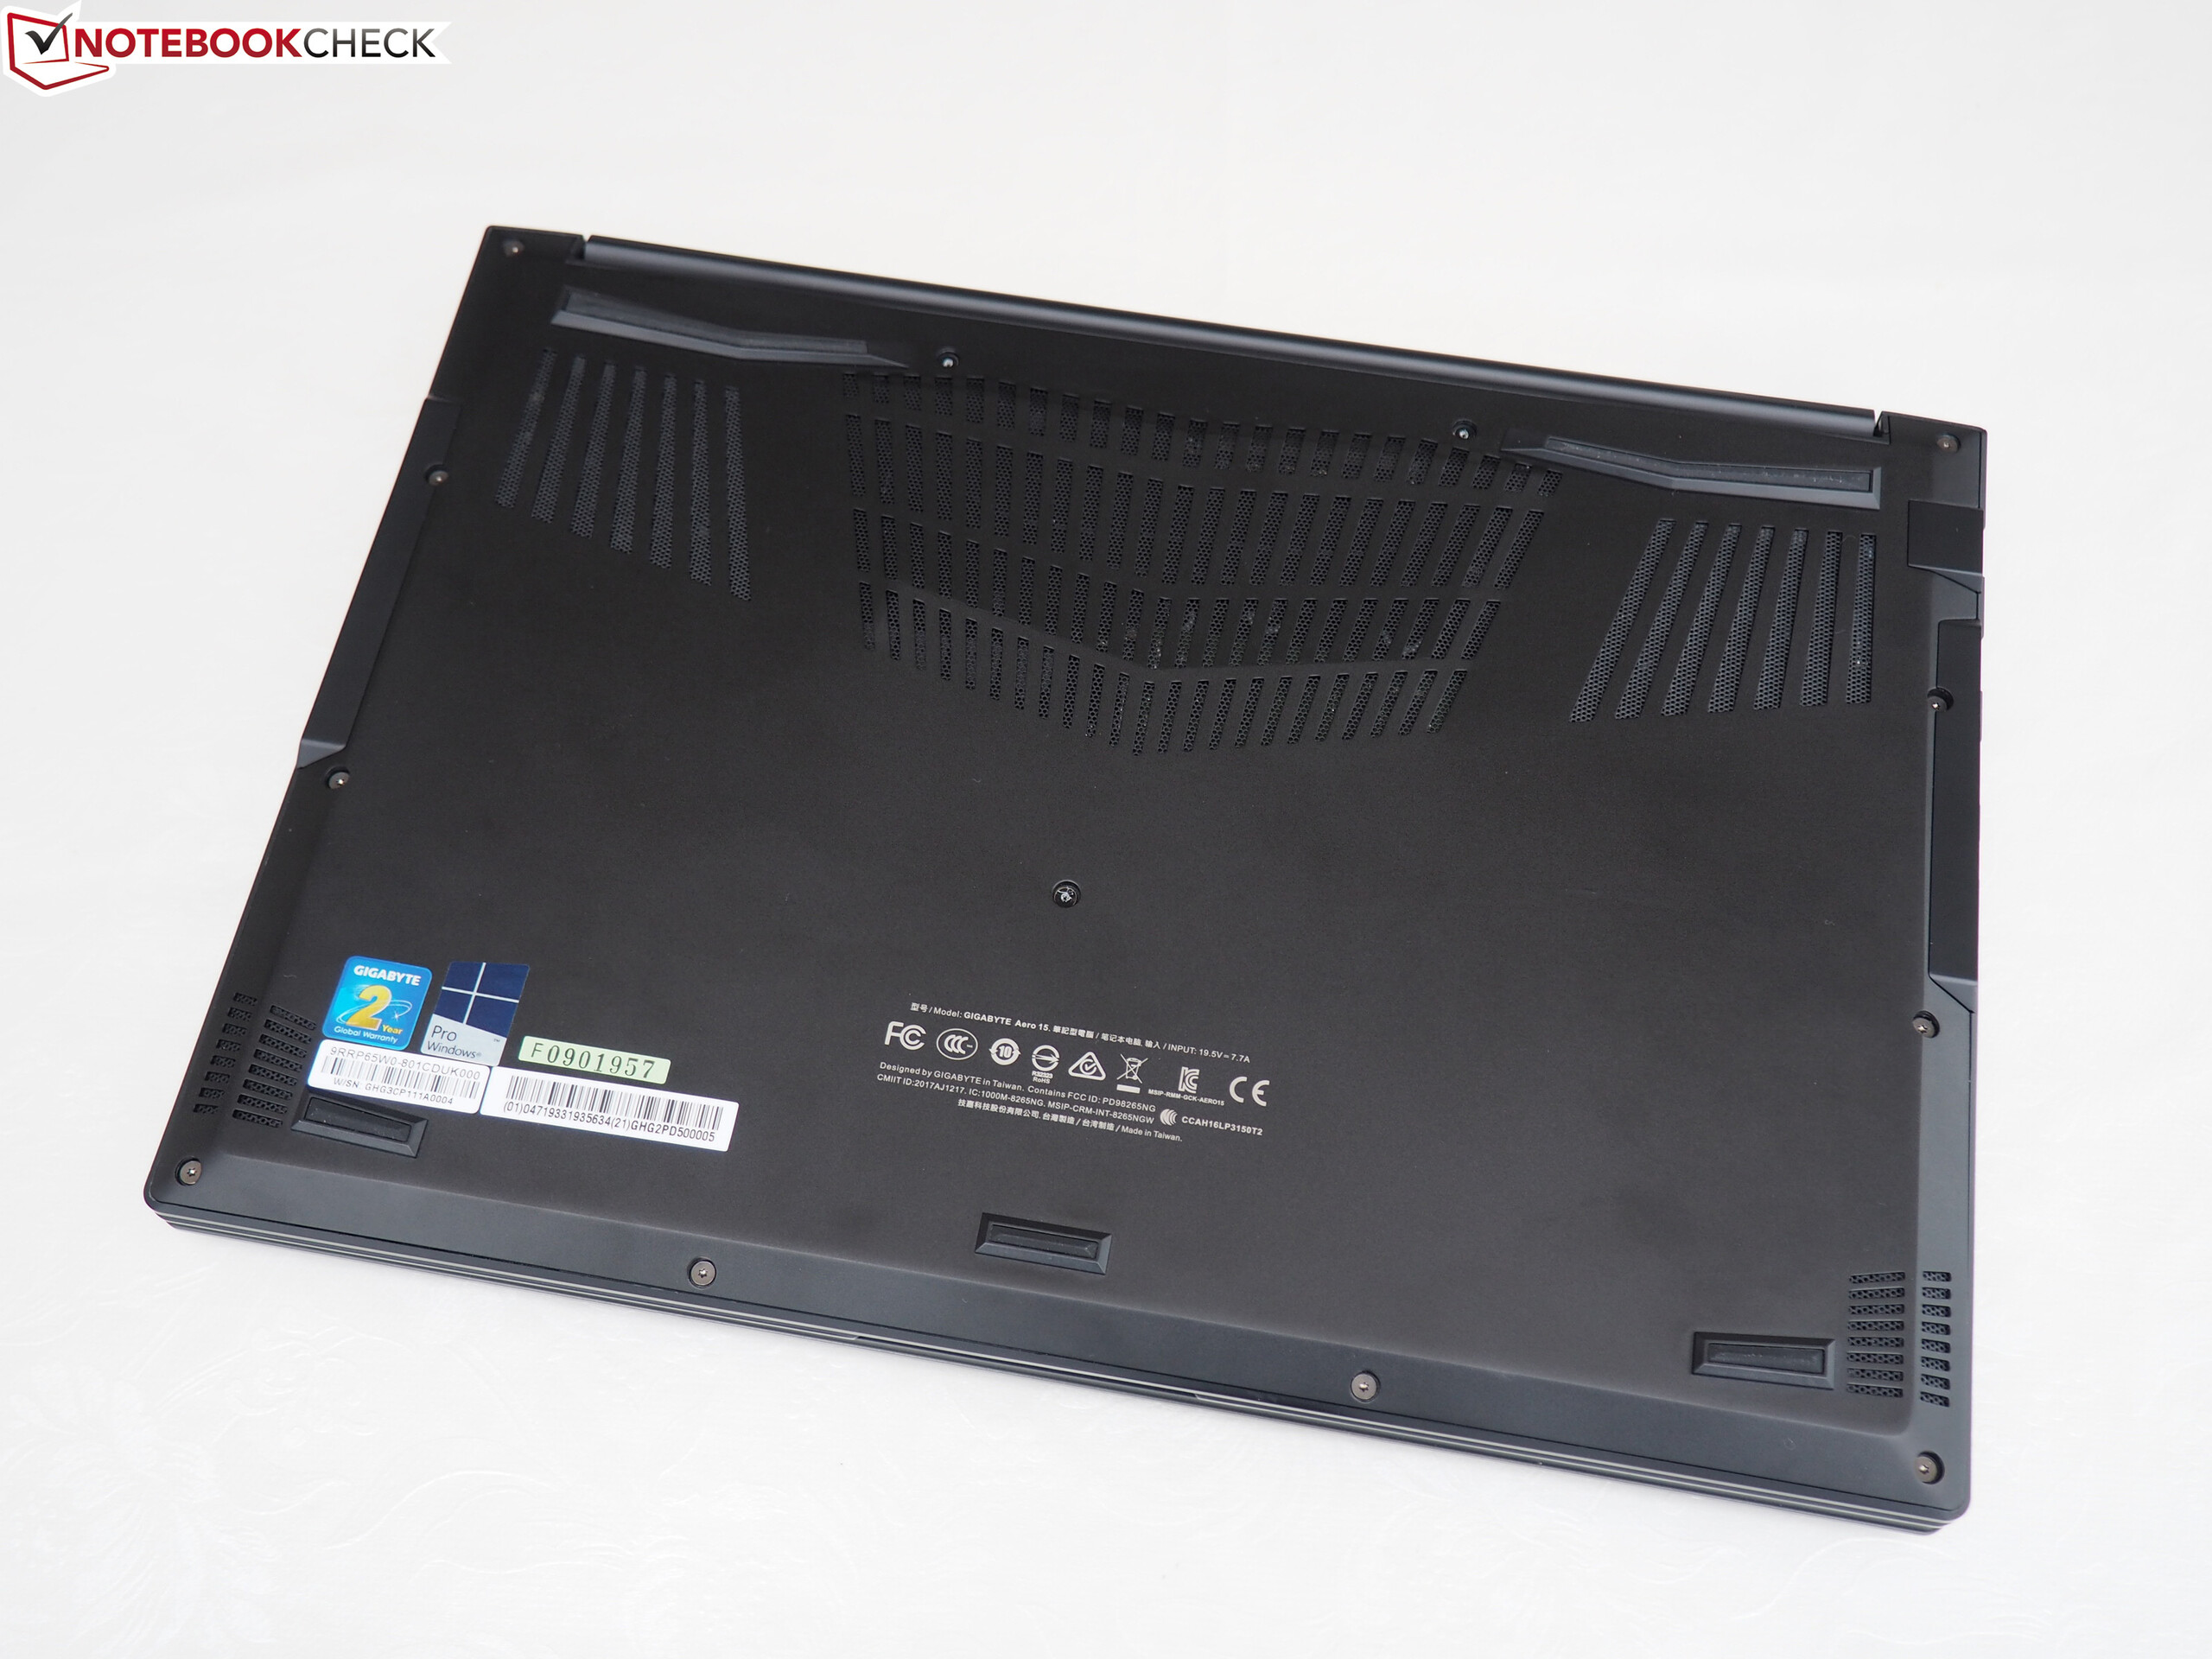
The notebook is also equipped with an extra M.2-2280 slot that can be used for installing a second M.2 SSD.

| Gigabyte Aero 15X Samsung SM961 MZVKW512HMJP m.2 PCI-e | MSI GS63VR 7RF-228US Samsung SM961 MZVKW512HMJP m.2 PCI-e | Gigabyte Aero 15 Lite-On CX2-8B512-Q11 | |
|---|---|---|---|
| CrystalDiskMark 3.0 | 19% | 13% | |
| Read Seq (MB/s) | 1381 | 2141 55% | 1769 28% |
| Write Seq (MB/s) | 1546 | 1621 5% | 1133 -27% |
| Read 512 (MB/s) | 418 | 499.7 20% | 891 113% |
| Write 512 (MB/s) | 1277 | 1531 20% | 1069 -16% |
| Read 4k (MB/s) | 51.3 | 54.2 6% | 44.7 -13% |
| Write 4k (MB/s) | 131 | 158.2 21% | 123.3 -6% |
| Read 4k QD32 (MB/s) | 544 | 632 16% | 645 19% |
| Write 4k QD32 (MB/s) | 480.2 | 527 10% | 490.5 2% |
GPU Performance
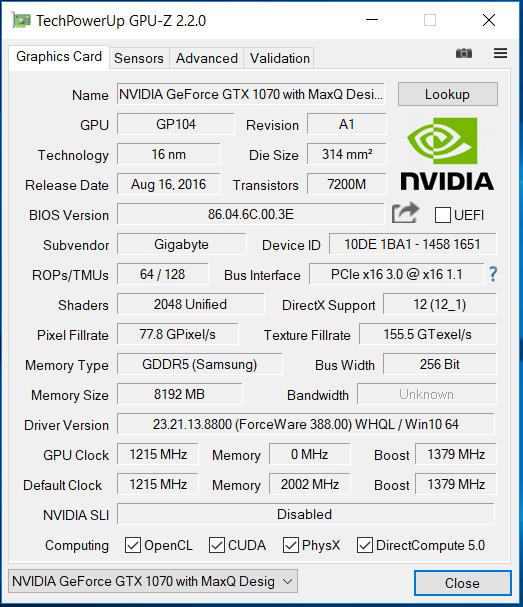
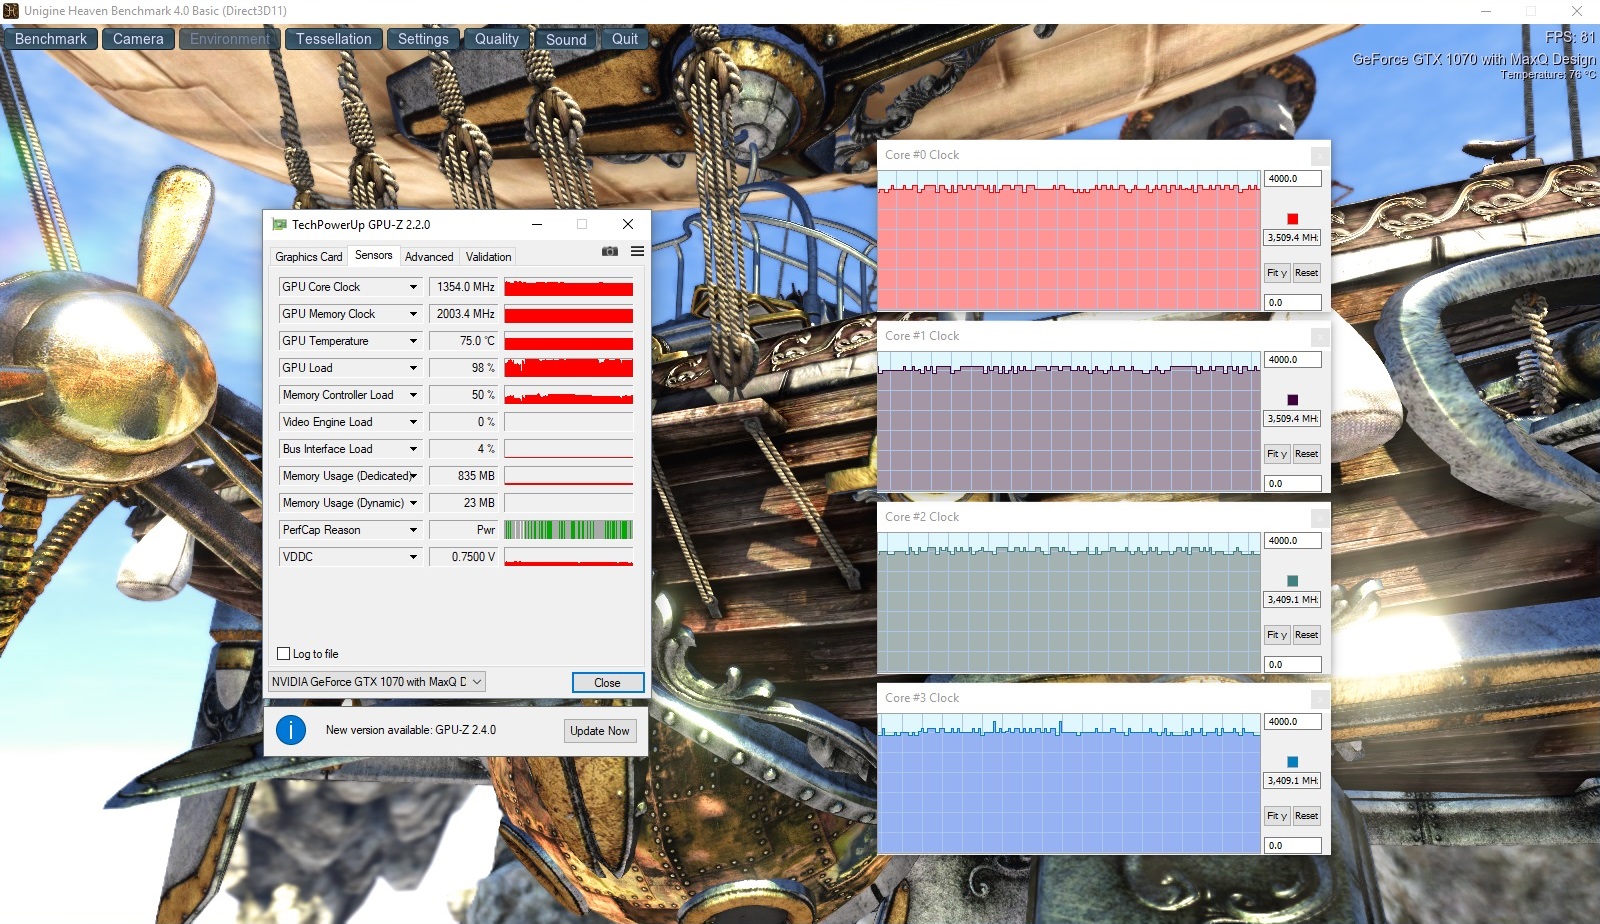
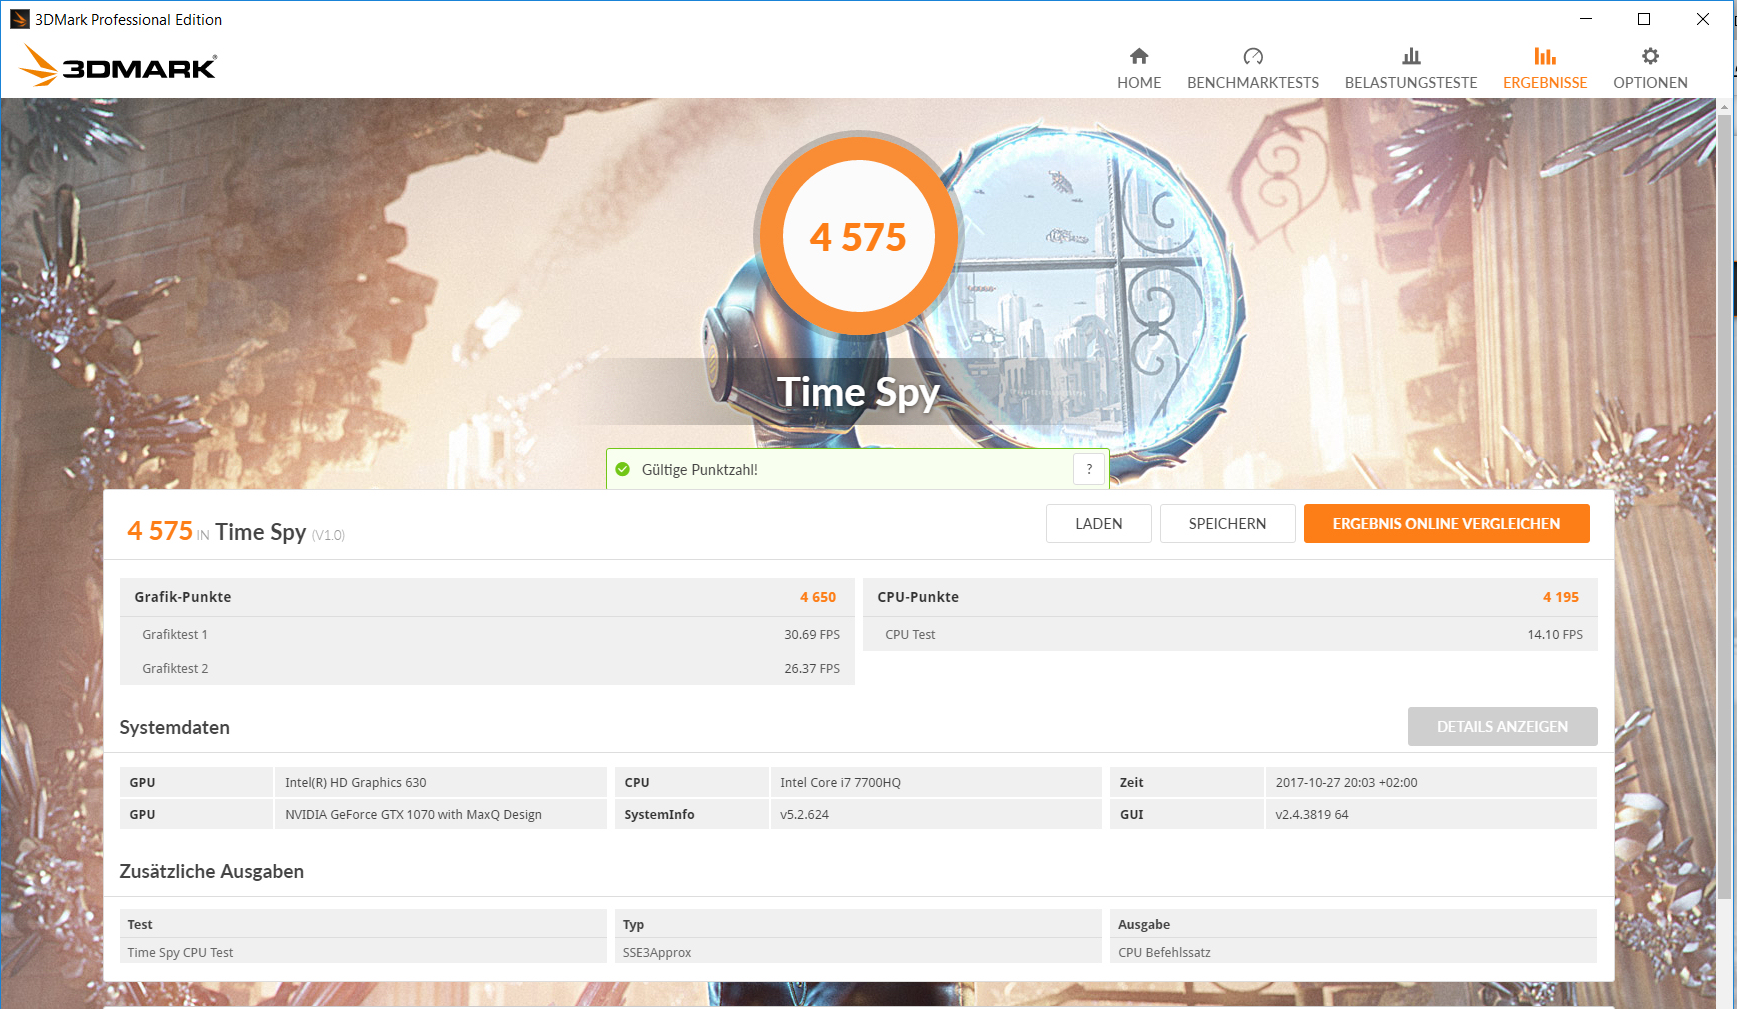
Our review unit was equipped with Nvidia’s GeForce GTX 1070 Max-Q GPU, a more power efficient equivalent to the regular GTX 1070 designed specifically for thin and light notebooks. It runs at 1,215 MHz and can boost up to 1,544 MHz, however, this cannot be maintained for long periods. During our benchmarks, we found the GPU to be running around 1,350 MHz most of the time. The GPU has access to 8 GB of fast GDDR5 video RAM.
Compared to the identically equipped Zephyrus, the Gigabyte Aero 15X fell behind slightly in 3DMark. It is possible that the Asus Zephyrus GX501VS's GPU was capable of maintaining higher clock speeds.
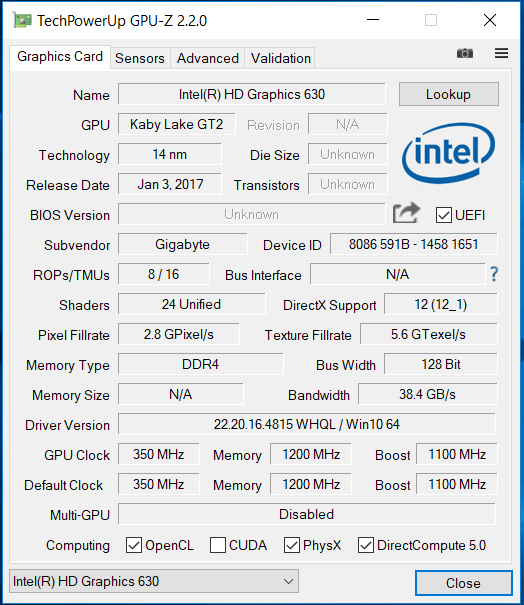
The notebook supports switching between the GeForce GPU and Intel’s integrated HD Graphics 630 GPU automatically and on-demand thanks to Nvidia Optimus.
| 3DMark 06 Standard Score | 27822 points | |
| 3DMark 11 Performance | 14847 points | |
| 3DMark Ice Storm Standard Score | 130556 points | |
| 3DMark Cloud Gate Standard Score | 27624 points | |
| 3DMark Fire Strike Score | 12166 points | |
| 3DMark Fire Strike Extreme Score | 6378 points | |
| 3DMark Time Spy Score | 4575 points | |
Help | ||
Gaming Performance
Its powerful hardware allows the thin 15.6-inch powerhouse to run all current games smoothly with high or maximum details at FHD resolution. Frame rates were at eye level with other GTX 1070 Max-Q equipped notebooks.
In order to determine whether frame rates remain consistent over long periods we run Witcher 3 in a loop for around 60 minutes with maximum details at FHD resolution (1920x1080). The avatar remains stationary throughout the entire test. Frame rates drop from around 51-52 FPS to 49-50 FPS after a few minutes. Consequently, we can assert that sustained gaming load does not result in performance drops.
| BioShock Infinite - 1920x1080 Ultra Preset, DX11 (DDOF) | |
| Asus G752VS-BA338T | |
| MSI GE73VR 7RF Raider | |
| Asus Zephyrus GX501VS | |
| Eurocom Q5 | |
| Gigabyte Aero 15X | |
| MSI GS63VR 7RF-228US | |
| Acer Aspire VN7-593G-73HP V15 Nitro BE | |
| Ghost Recon Wildlands - 1920x1080 Ultra Preset AA:T AF:16x | |
| Asus G752VS-BA338T | |
| MSI GS63VR 7RG | |
| Gigabyte Aero 15X | |
| Gigabyte Aero 15 | |
| HP Omen 15-ce002ng | |
| low | med. | high | ultra | |
|---|---|---|---|---|
| Tomb Raider (2013) | 478.7 | 439.3 | 371.5 | 185.2 |
| BioShock Infinite (2013) | 249 | 210.1 | 194.4 | 123.9 |
| The Witcher 3 (2015) | 232.8 | 164.8 | 94.5 | 52.4 |
| For Honor (2017) | 203.9 | 128.6 | 122.7 | 96 |
| Ghost Recon Wildlands (2017) | 148.4 | 86 | 78.6 | 43.7 |
| Middle-earth: Shadow of War (2017) | 132 | 114 | 90 | 69 |
| The Evil Within 2 (2017) | 88.5 | 53.3 | 54 | 53.8 |
| ELEX (2017) | 122.5 | 107.3 | 86.7 | 66.6 |
Emissions
System Noise
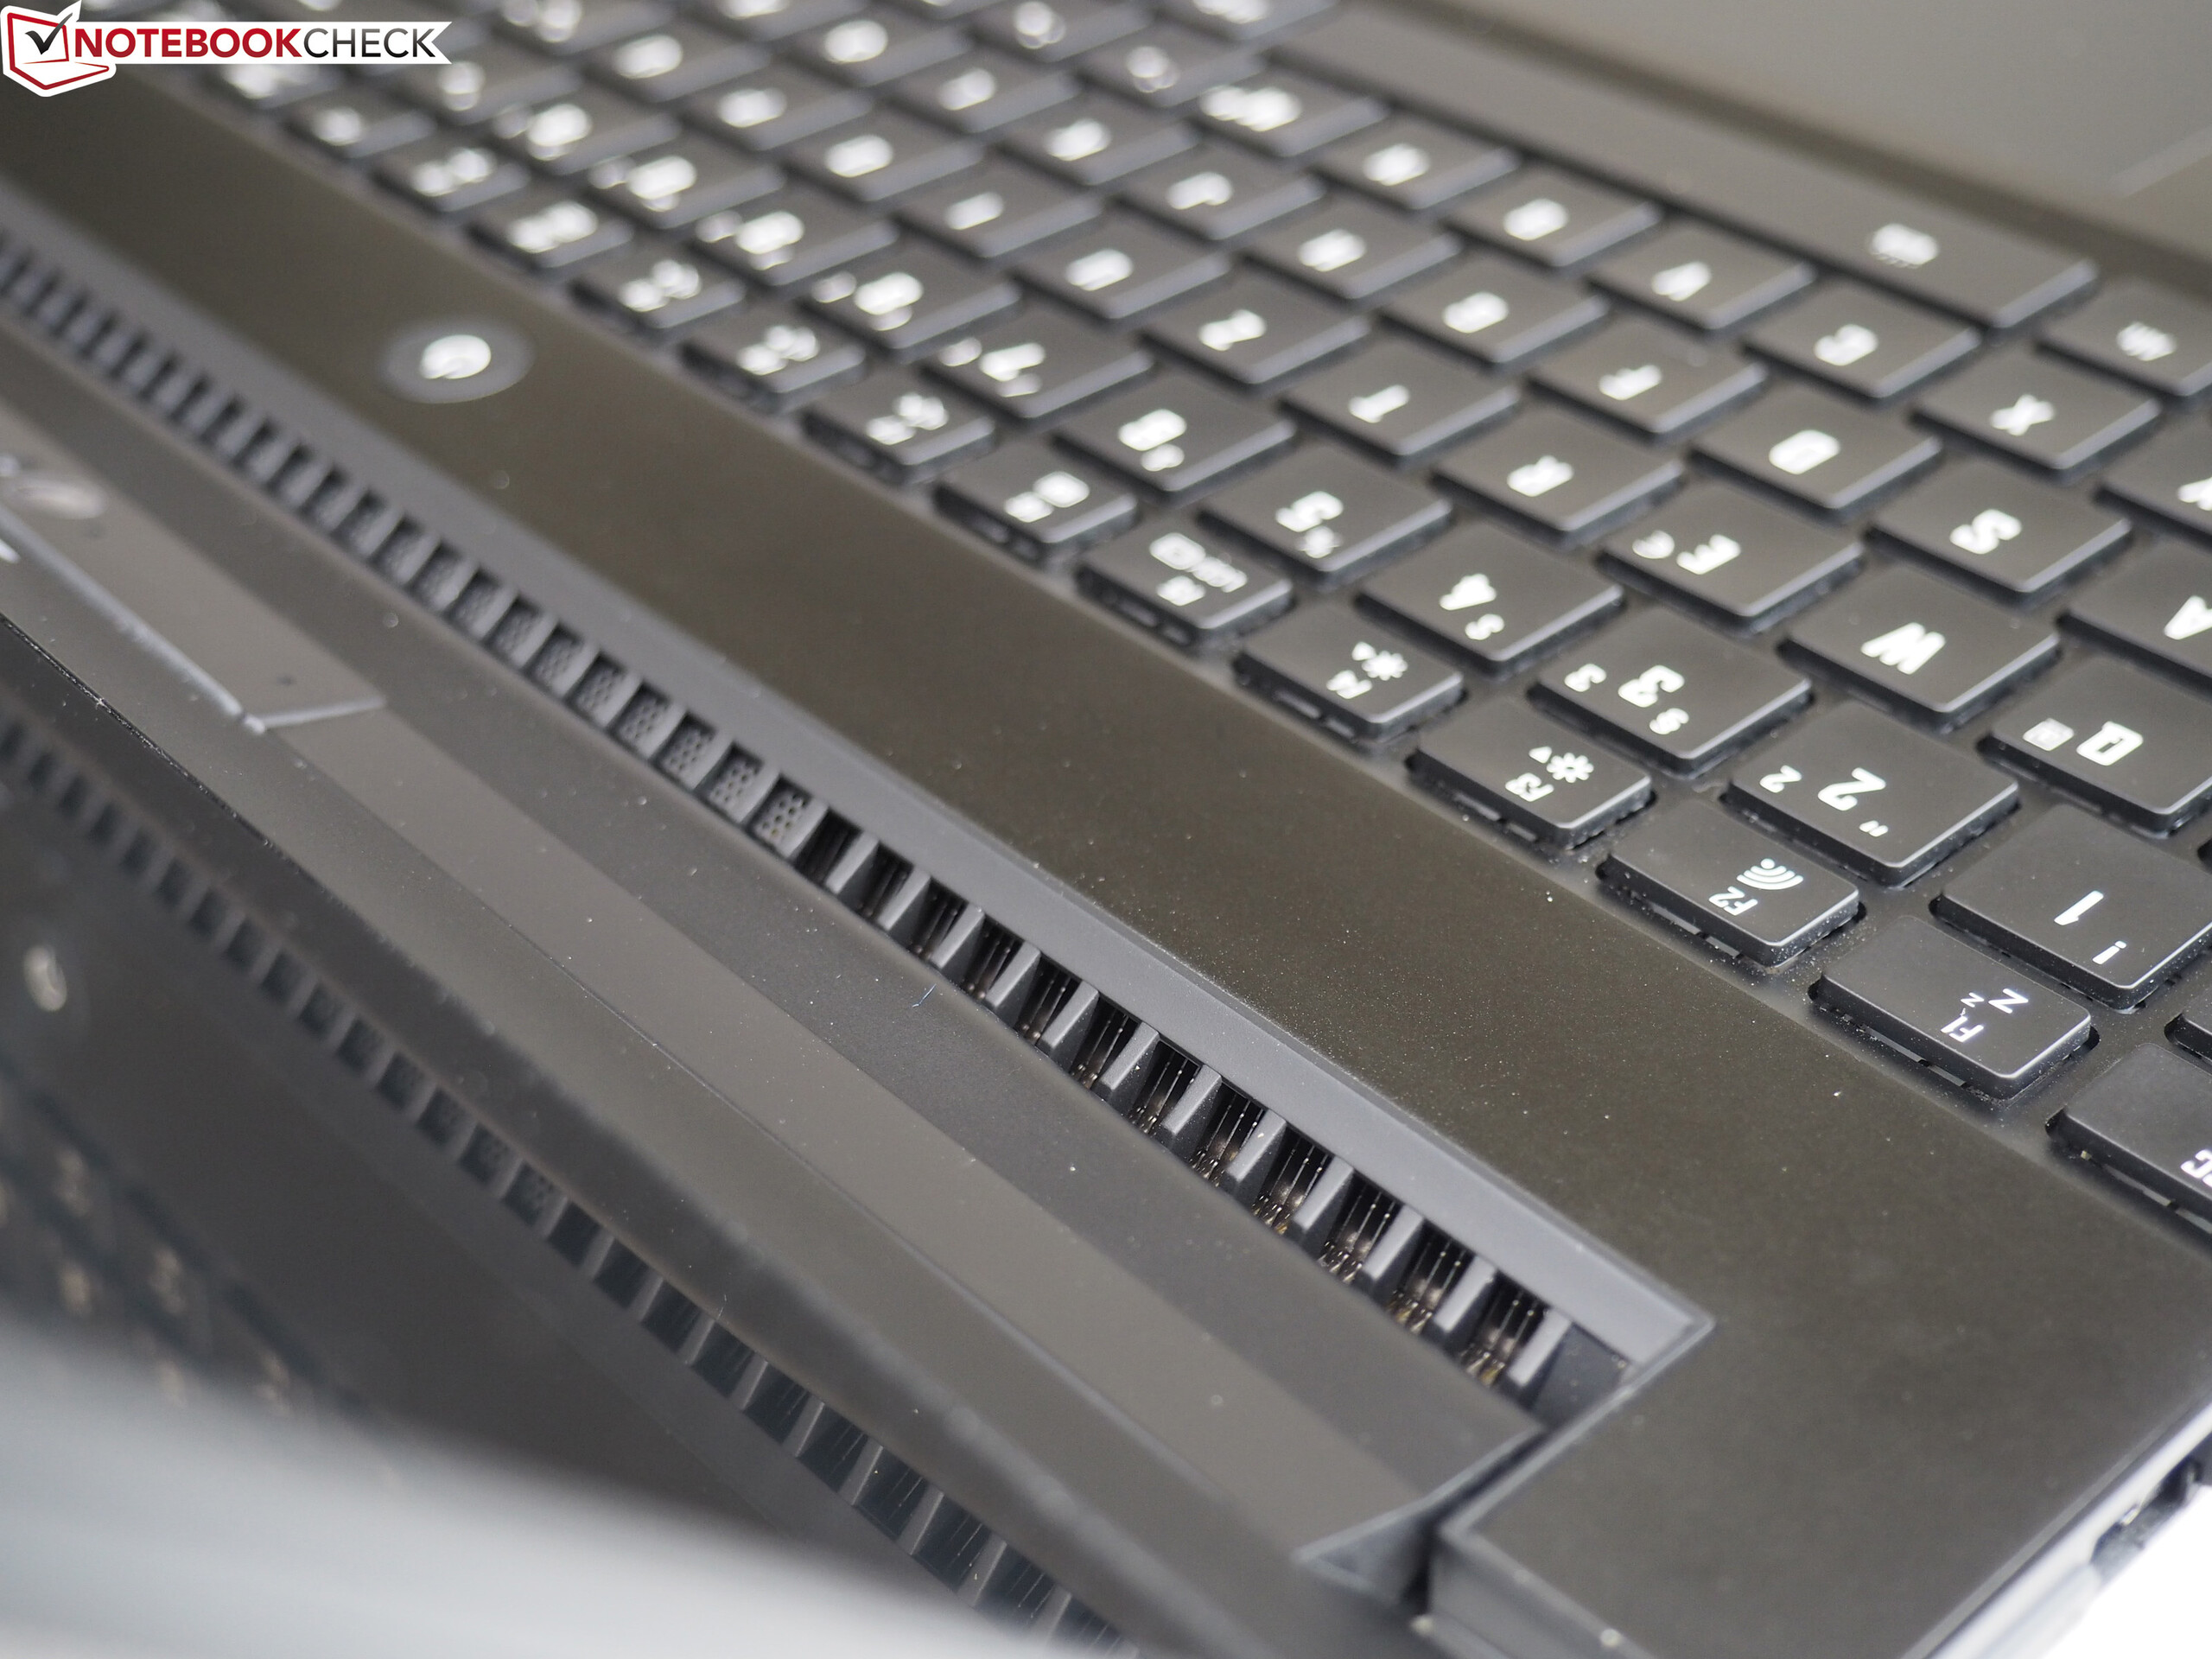
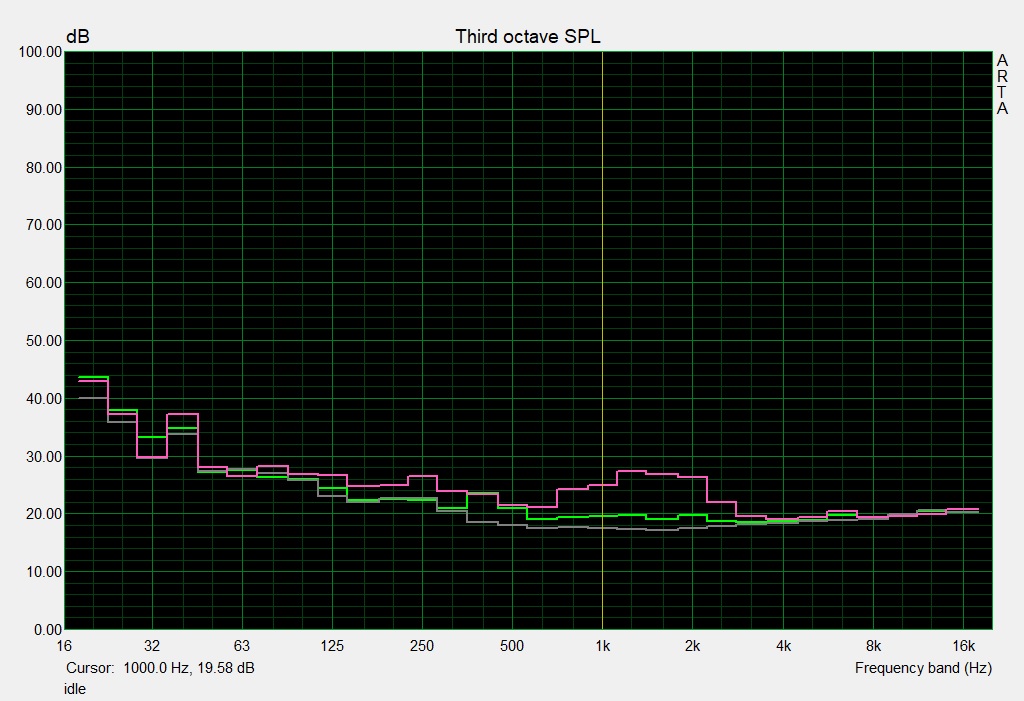
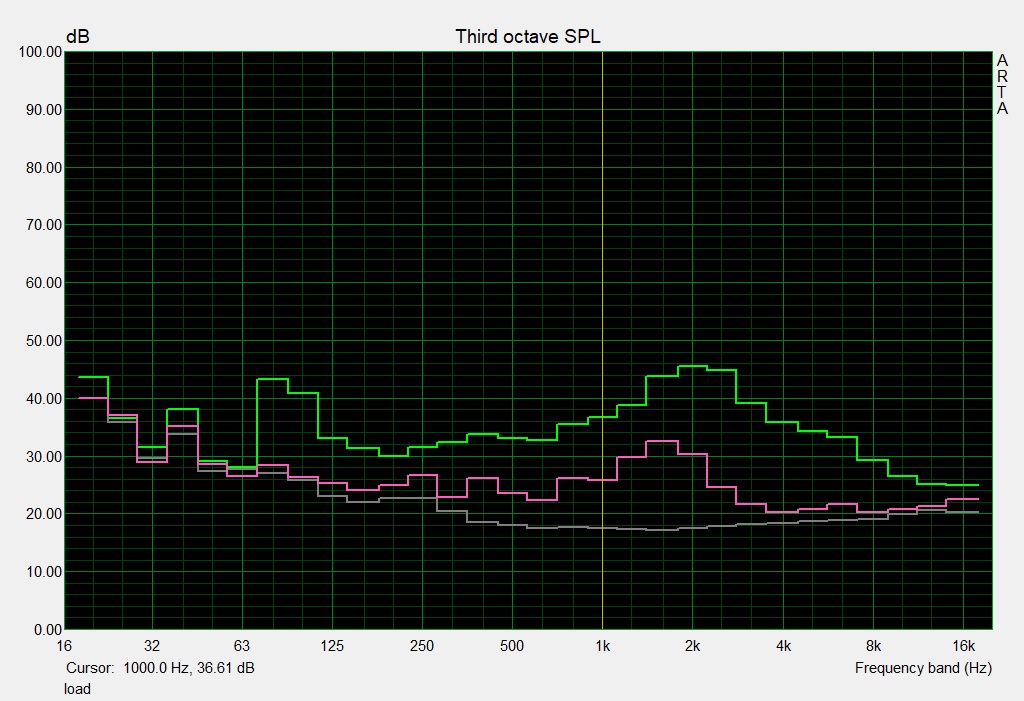
The fans are spinning with very low revs when idle, and are mostly quiet at this level. If you wish for a noiseless work environment, the “Quiet” fan control preset in SmartManager is the method of choice. The fans do not speed up or pulsate in low load scenarios, only during startup did we notice a short and sudden speed burst. Under load, however, they can become quite bothersome. We have measured a very loud sound pressure level of 52 dB(A) during our stress test. Fortunately, the gaming noise level was somewhat lower between 33 and 44 dB(A) with an average of 39 dB(A).
Noise level
| Idle |
| 31 / 32 / 36 dB(A) |
| Load |
| 39 / 52 dB(A) |
 | ||
30 dB silent 40 dB(A) audible 50 dB(A) loud |
||
min: | ||
| Gigabyte Aero 15X i7-7700HQ, GeForce GTX 1070 Max-Q | MSI GS63VR 7RF-228US i7-7700HQ, GeForce GTX 1060 Mobile | HP Omen 15-ce002ng i7-7700HQ, GeForce GTX 1060 Max-Q | Gigabyte Aero 15 i7-7700HQ, GeForce GTX 1060 Mobile | Asus Zephyrus GX501VS i7-7700HQ, GeForce GTX 1070 Max-Q | MSI GE63VR 7RF Raider i7-7700HQ, GeForce GTX 1070 Mobile | Aorus X5 v7 i7-7820HK, GeForce GTX 1070 Mobile | Gigabyte P56XT i7-7700HQ, GeForce GTX 1070 Mobile | |
|---|---|---|---|---|---|---|---|---|
| Noise | 1% | 0% | 0% | 9% | -10% | -9% | -4% | |
| off / environment * (dB) | 30 | 28.8 4% | 30 -0% | 31 -3% | 28.5 5% | 30 -0% | 30 -0% | 30 -0% |
| Idle Minimum * (dB) | 31 | 33.1 -7% | 30 3% | 32 -3% | 28.5 8% | 33 -6% | 35 -13% | 34 -10% |
| Idle Average * (dB) | 32 | 33.1 -3% | 33 -3% | 33 -3% | 28.5 11% | 35 -9% | 36 -13% | 35 -9% |
| Idle Maximum * (dB) | 36 | 34 6% | 37 -3% | 34 6% | 30.1 16% | 40 -11% | 40 -11% | 39 -8% |
| Load Average * (dB) | 39 | 37.2 5% | 41 -5% | 39 -0% | 35.2 10% | 48 -23% | 43 -10% | 39 -0% |
| Witcher 3 ultra * (dB) | 44 | 46.1 -5% | 42 5% | 43 2% | 41.7 5% | 50 -14% | 49 -11% | 48 -9% |
| Load Maximum * (dB) | 52 | 47.1 9% | 50 4% | 50 4% | 48.8 6% | 55 -6% | 55 -6% | 49 6% |
* ... smaller is better
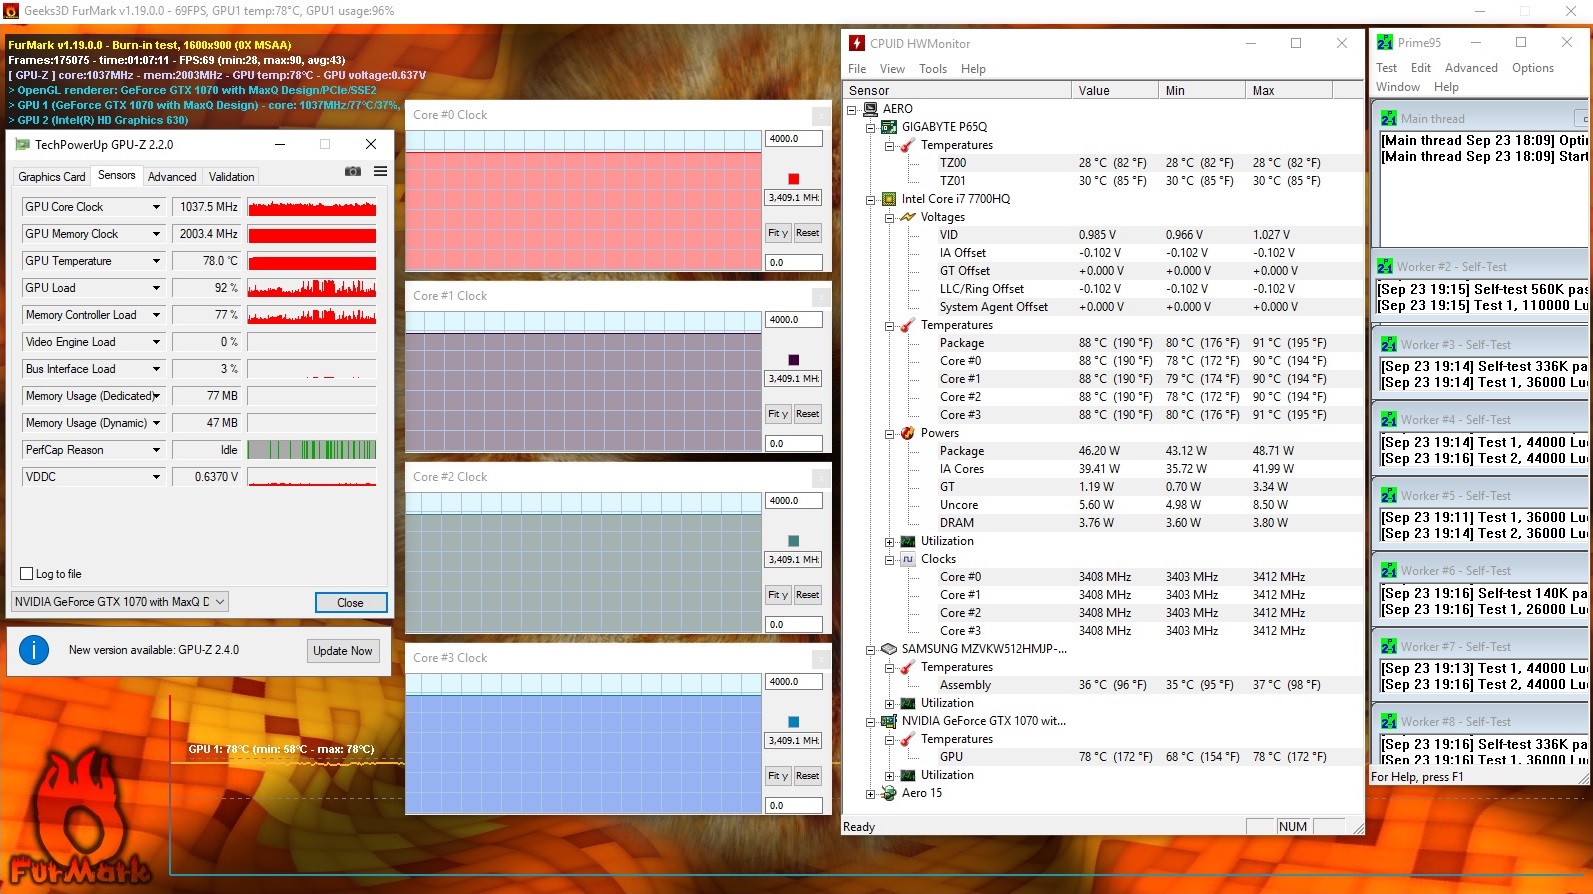
Temperature
The notebook behaved differently on battery and on mains while performing our stress test (Prime95 + FurMark for at least a full hour). In both cases, the GPU was running at around 1,000 MHz. However, the CPU went from 3.4 GHz on mains to just 2.5 GHz on battery.
Considering the notebook’s very powerful hardware, surface temperatures were fairly low. The case reached more than 50 °C (122 °F) at several spots during our regular stress test, and it got even slightly warmer during our Witcher 3 stress test (1 hour at FHD resolution and maximum details).
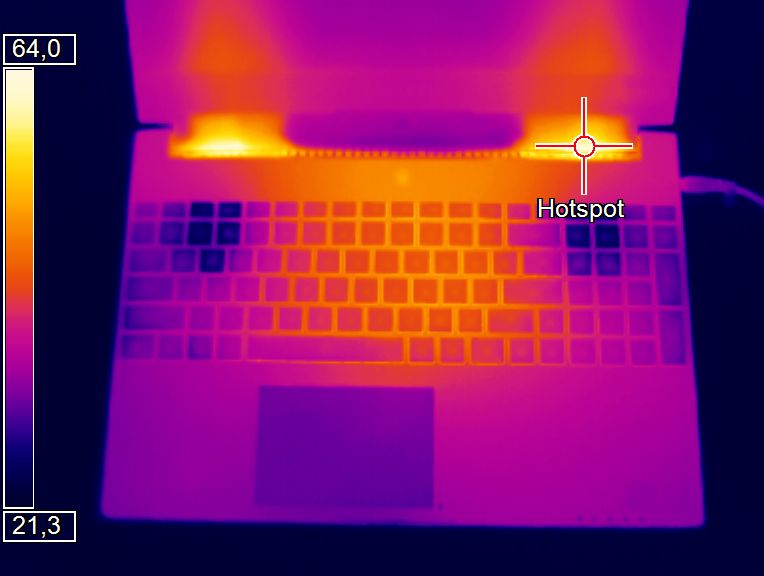
(-) The maximum temperature on the upper side is 51 °C / 124 F, compared to the average of 40.4 °C / 105 F, ranging from 21.2 to 68.8 °C for the class Gaming.
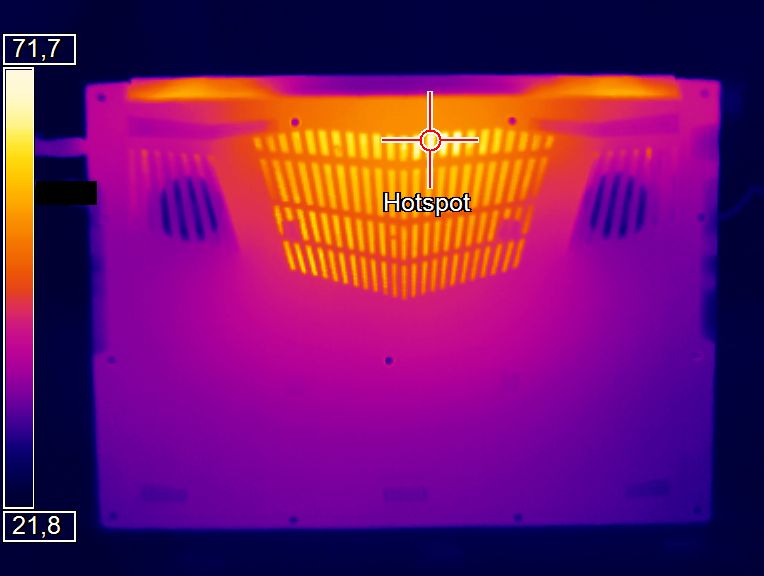
(-) The bottom heats up to a maximum of 58 °C / 136 F, compared to the average of 43.2 °C / 110 F
(+) In idle usage, the average temperature for the upper side is 24 °C / 75 F, compared to the device average of 33.9 °C / 93 F.
(-) Playing The Witcher 3, the average temperature for the upper side is 42.9 °C / 109 F, compared to the device average of 33.9 °C / 93 F.
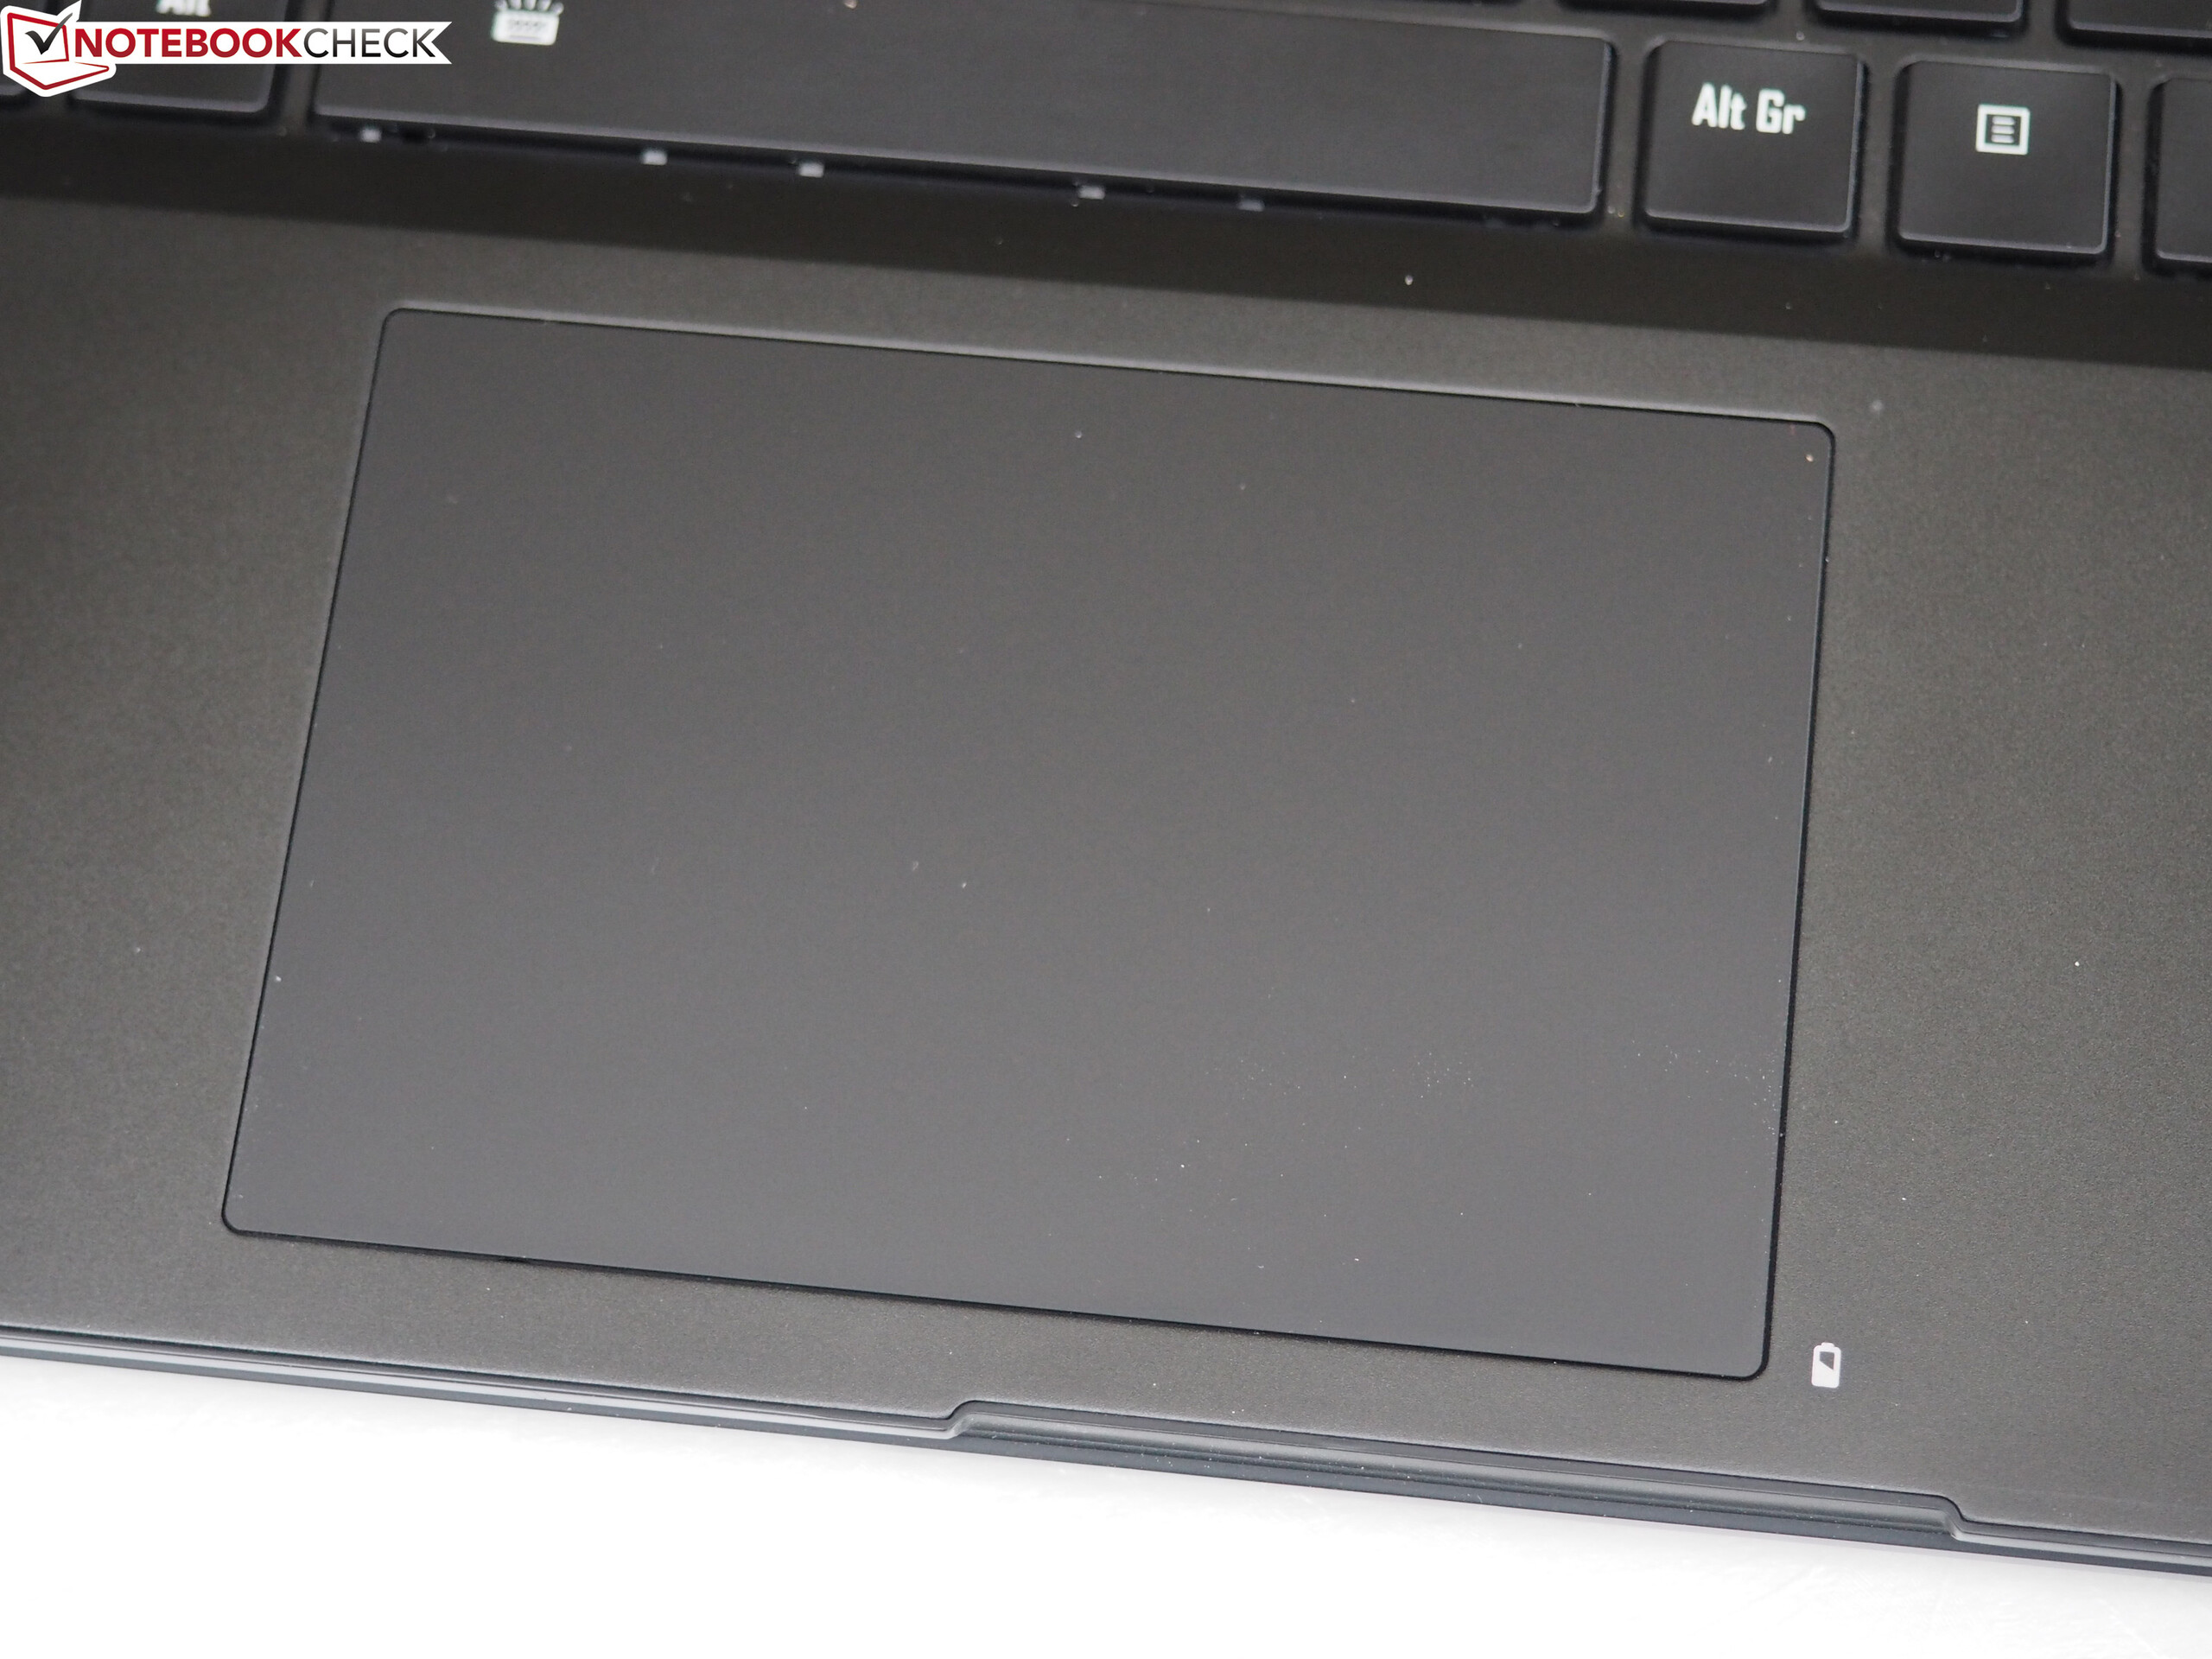
(±) The palmrests and touchpad can get very hot to the touch with a maximum of 39 °C / 102.2 F.
(-) The average temperature of the palmrest area of similar devices was 28.8 °C / 83.8 F (-10.2 °C / -18.4 F).
| Gigabyte Aero 15X i7-7700HQ, GeForce GTX 1070 Max-Q | MSI GS63VR 7RF-228US i7-7700HQ, GeForce GTX 1060 Mobile | HP Omen 15-ce002ng i7-7700HQ, GeForce GTX 1060 Max-Q | Gigabyte Aero 15 i7-7700HQ, GeForce GTX 1060 Mobile | Asus Zephyrus GX501VS i7-7700HQ, GeForce GTX 1070 Max-Q | MSI GE63VR 7RF Raider i7-7700HQ, GeForce GTX 1070 Mobile | Aorus X5 v7 i7-7820HK, GeForce GTX 1070 Mobile | Gigabyte P56XT i7-7700HQ, GeForce GTX 1070 Mobile | |
|---|---|---|---|---|---|---|---|---|
| Heat | -16% | -22% | -3% | -3% | -6% | -15% | -27% | |
| Maximum Upper Side * (°C) | 51 | 47 8% | 56 -10% | 54.4 -7% | 48 6% | 64 -25% | 65 -27% | |
| Maximum Bottom * (°C) | 58 | 54 7% | 61 -5% | 41.2 29% | 47 19% | 56 3% | 71 -22% | |
| Idle Upper Side * (°C) | 25 | 28.4 -14% | 36 -44% | 25 -0% | 31.2 -25% | 29 -16% | 29 -16% | 35 -40% |
| Idle Bottom * (°C) | 25 | 29.6 -18% | 40 -60% | 24 4% | 27.6 -10% | 33 -32% | 30 -20% | 30 -20% |
* ... smaller is better
Speakers
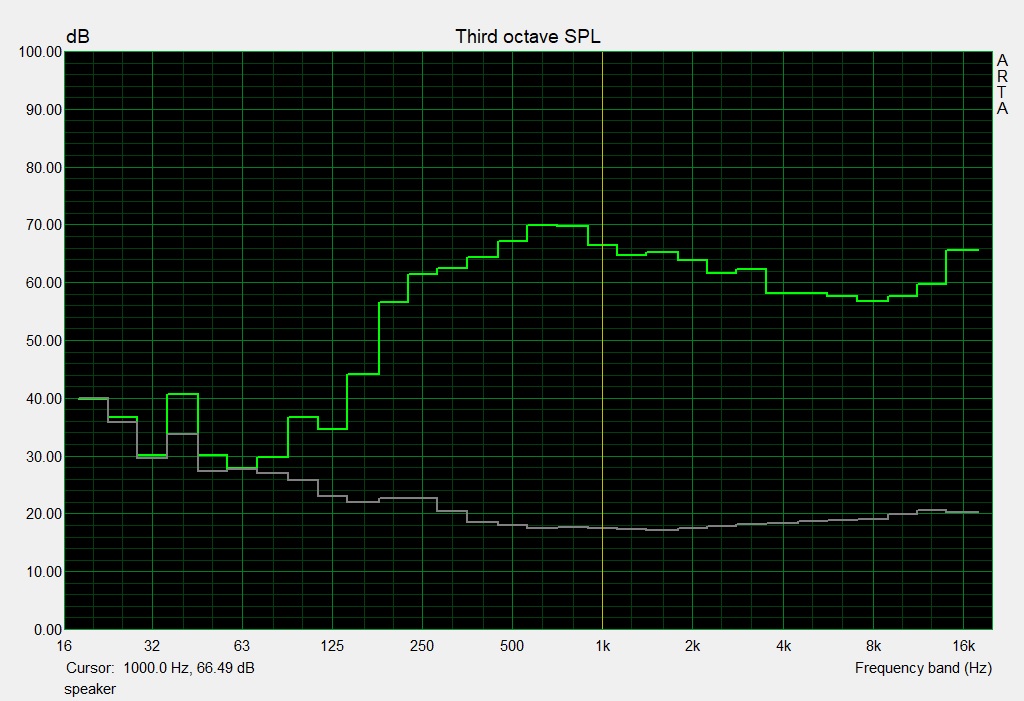
Gigabyte Aero 15X audio analysis
(±) | speaker loudness is average but good (76 dB)
Bass 100 - 315 Hz
(±) | reduced bass - on average 12.6% lower than median
(±) | linearity of bass is average (14.3% delta to prev. frequency)
Mids 400 - 2000 Hz
(+) | balanced mids - only 4.8% away from median
(+) | mids are linear (4.1% delta to prev. frequency)
Highs 2 - 16 kHz
(+) | balanced highs - only 3% away from median
(+) | highs are linear (3.1% delta to prev. frequency)
Overall 100 - 16.000 Hz
(±) | linearity of overall sound is average (16.6% difference to median)
Compared to same class
» 43% of all tested devices in this class were better, 7% similar, 50% worse
» The best had a delta of 6%, average was 18%, worst was 132%
Compared to all devices tested
» 29% of all tested devices were better, 6% similar, 66% worse
» The best had a delta of 4%, average was 24%, worst was 134%
Asus Zephyrus GX501VS audio analysis
(-) | not very loud speakers (71.4 dB)
Bass 100 - 315 Hz
(-) | nearly no bass - on average 18.8% lower than median
(±) | linearity of bass is average (11.3% delta to prev. frequency)
Mids 400 - 2000 Hz
(+) | balanced mids - only 1.2% away from median
(+) | mids are linear (6.3% delta to prev. frequency)
Highs 2 - 16 kHz
(±) | higher highs - on average 6.5% higher than median
(+) | highs are linear (6.3% delta to prev. frequency)
Overall 100 - 16.000 Hz
(±) | linearity of overall sound is average (23.4% difference to median)
Compared to same class
» 85% of all tested devices in this class were better, 5% similar, 11% worse
» The best had a delta of 6%, average was 18%, worst was 132%
Compared to all devices tested
» 70% of all tested devices were better, 6% similar, 24% worse
» The best had a delta of 4%, average was 24%, worst was 134%
Frequency diagram (checkboxes selectable/deselectable!)
Energy Management
Power Consumption
Power consumption when idle was at around 20 W thanks to Nvidia Optimus. Without switchable graphics, the notebook would consume around 30 W. With 165 W during our stress test and 120 W during the Witcher 3 benchmark, power consumption was decent overall. The power supply is rated at 215 W.
| Off / Standby | |
| Idle | |
| Load |
|
Key:
min: | |
| Gigabyte Aero 15X i7-7700HQ, GeForce GTX 1070 Max-Q | MSI GS63VR 7RF-228US i7-7700HQ, GeForce GTX 1060 Mobile | HP Omen 15-ce002ng i7-7700HQ, GeForce GTX 1060 Max-Q | Gigabyte Aero 15 i7-7700HQ, GeForce GTX 1060 Mobile | Asus Zephyrus GX501VS i7-7700HQ, GeForce GTX 1070 Max-Q | MSI GE63VR 7RF Raider i7-7700HQ, GeForce GTX 1070 Mobile | Aorus X5 v7 i7-7820HK, GeForce GTX 1070 Mobile | Gigabyte P56XT i7-7700HQ, GeForce GTX 1070 Mobile | |
|---|---|---|---|---|---|---|---|---|
| Power Consumption | -18% | -32% | -5% | -28% | -24% | -81% | -22% | |
| Idle Minimum * (Watt) | 10 | 14.5 -45% | 18 -80% | 12 -20% | 19.1 -91% | 11 -10% | 26 -160% | 13 -30% |
| Idle Average * (Watt) | 13 | 17.3 -33% | 23 -77% | 15 -15% | 20.8 -60% | 16 -23% | 31 -138% | 17 -31% |
| Idle Maximum * (Watt) | 20 | 17.4 13% | 30 -50% | 20 -0% | 21.8 -9% | 21 -5% | 36 -80% | 22 -10% |
| Load Average * (Watt) | 79 | 93 -18% | 85 -8% | 82 -4% | 73.7 7% | 92 -16% | 93 -18% | 85 -8% |
| Witcher 3 ultra * (Watt) | 120 | 128.8 -7% | 96 20% | 111 7% | 130.2 -9% | 185 -54% | 176 -47% | 154 -28% |
| Load Maximum * (Watt) | 165 | 158 4% | 161 2% | 173.1 -5% | 224 -36% | 240 -45% | 208 -26% |
* ... smaller is better
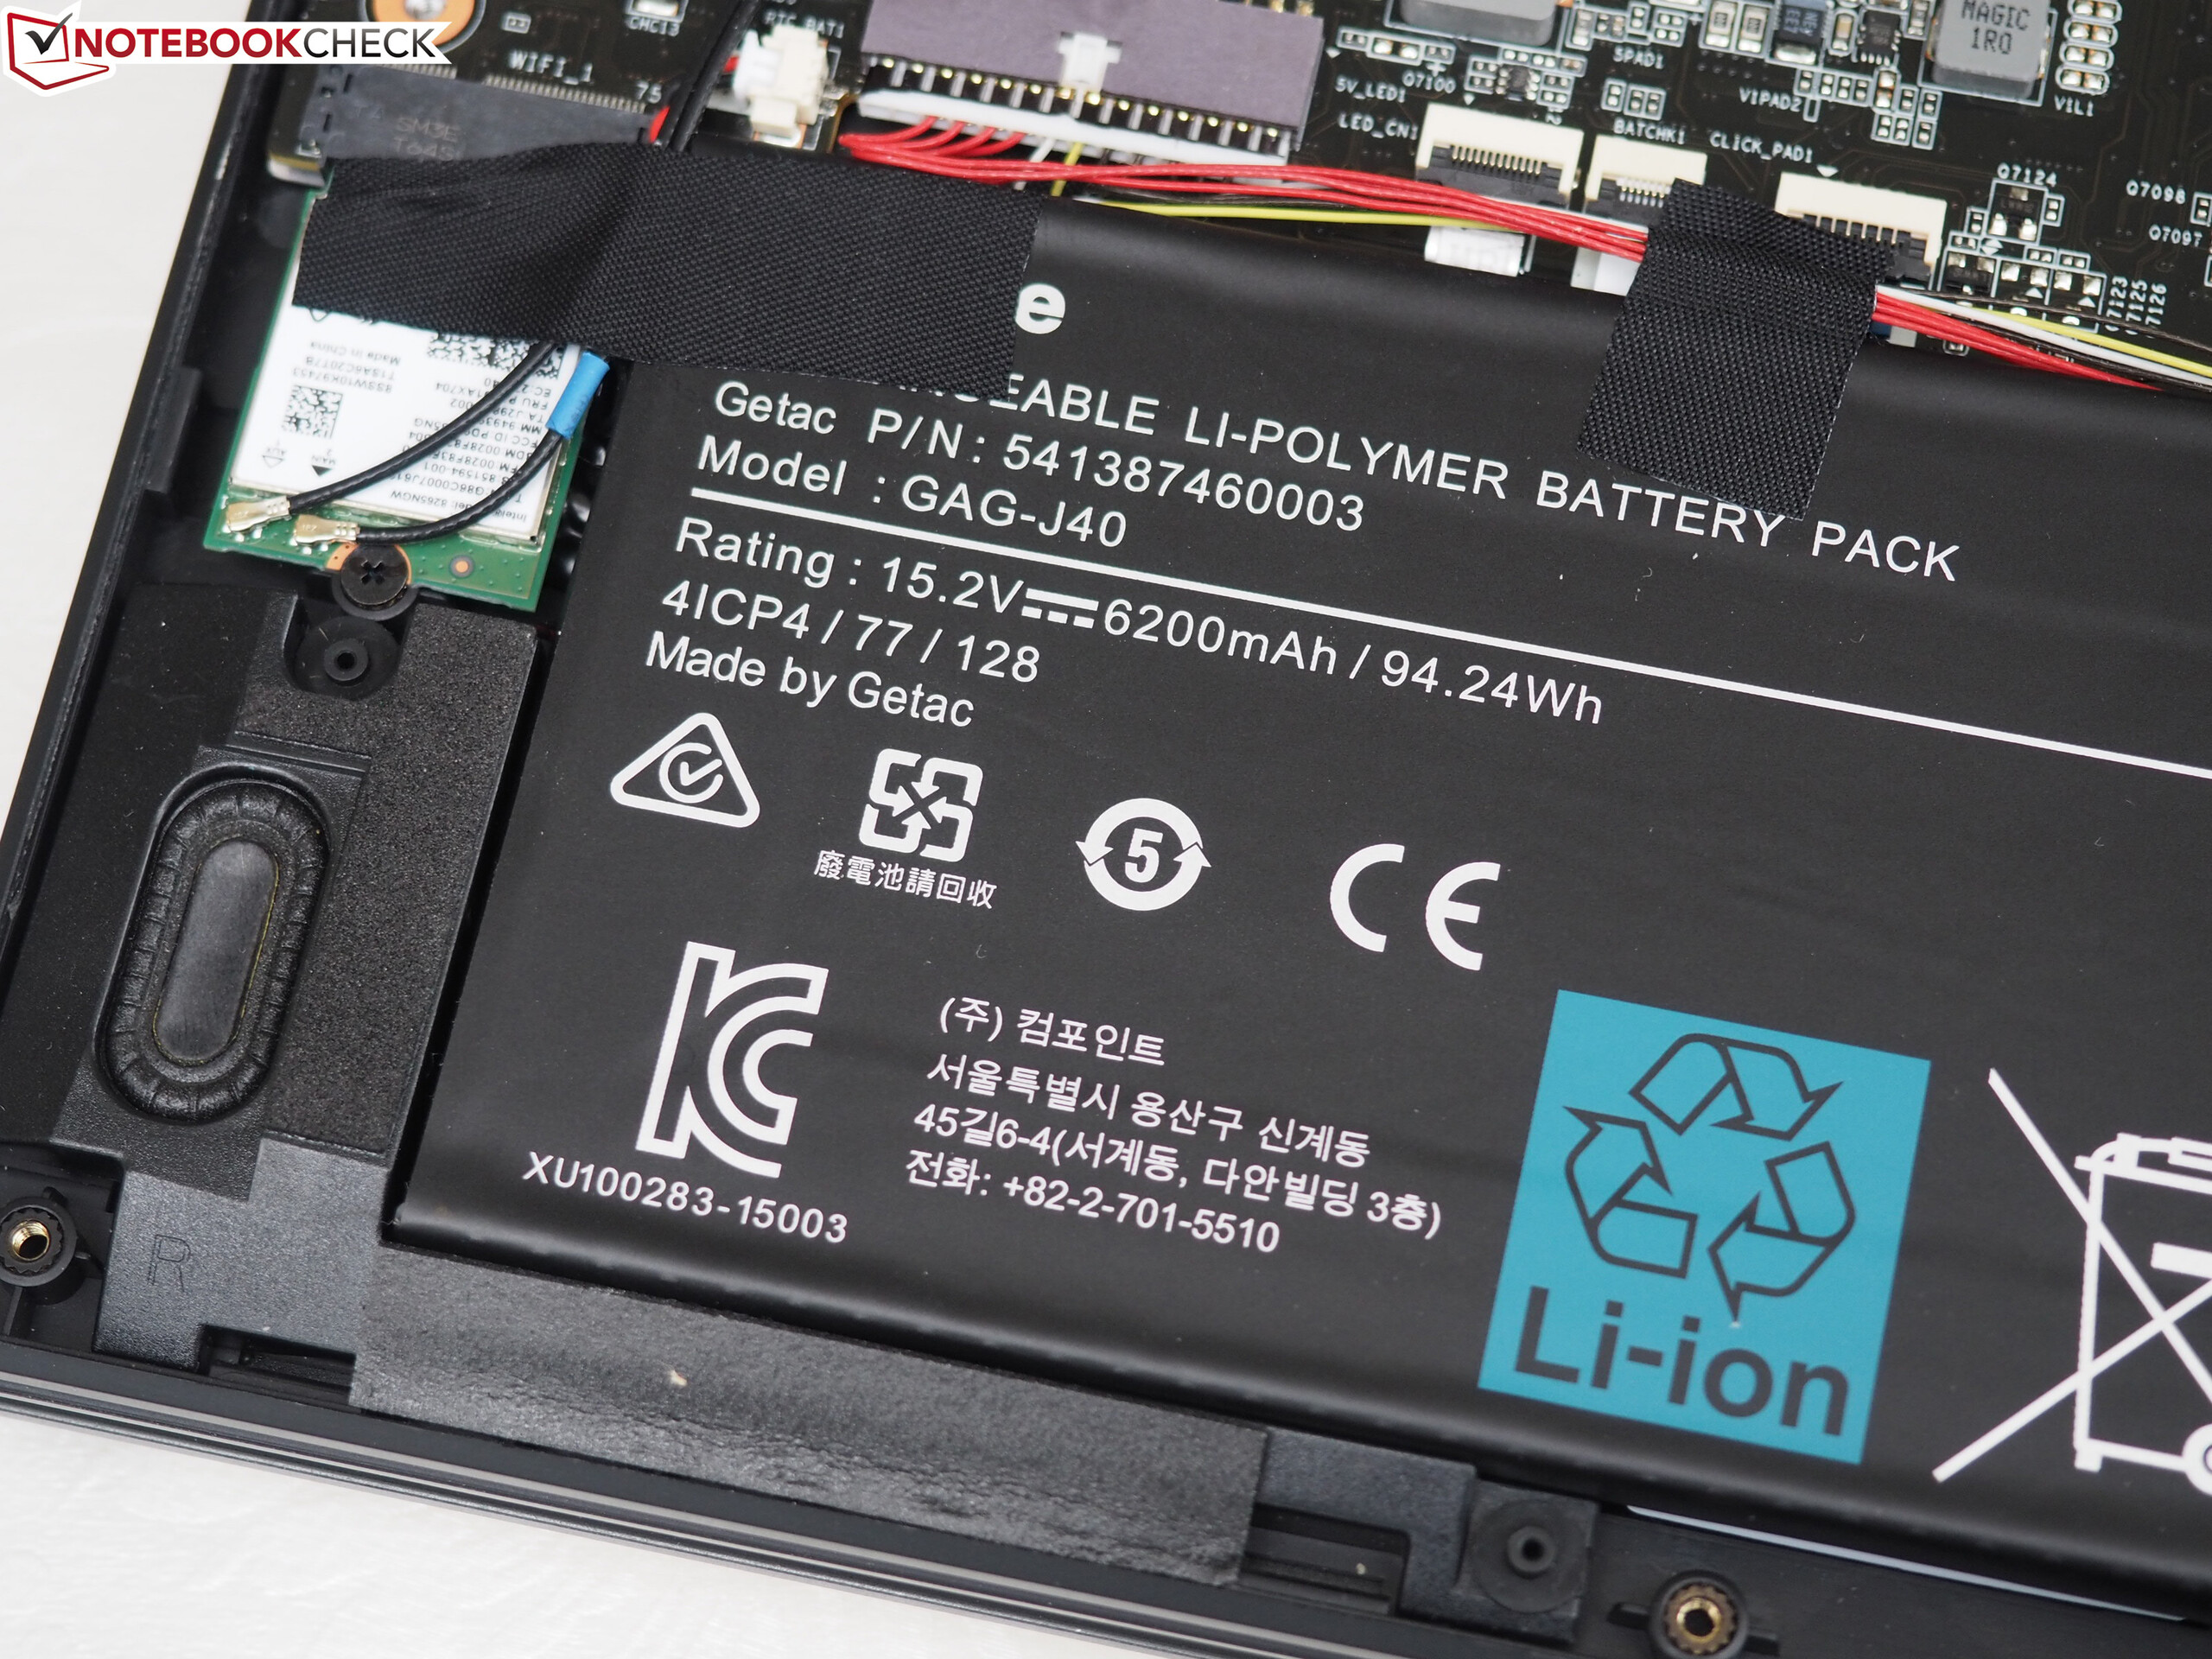
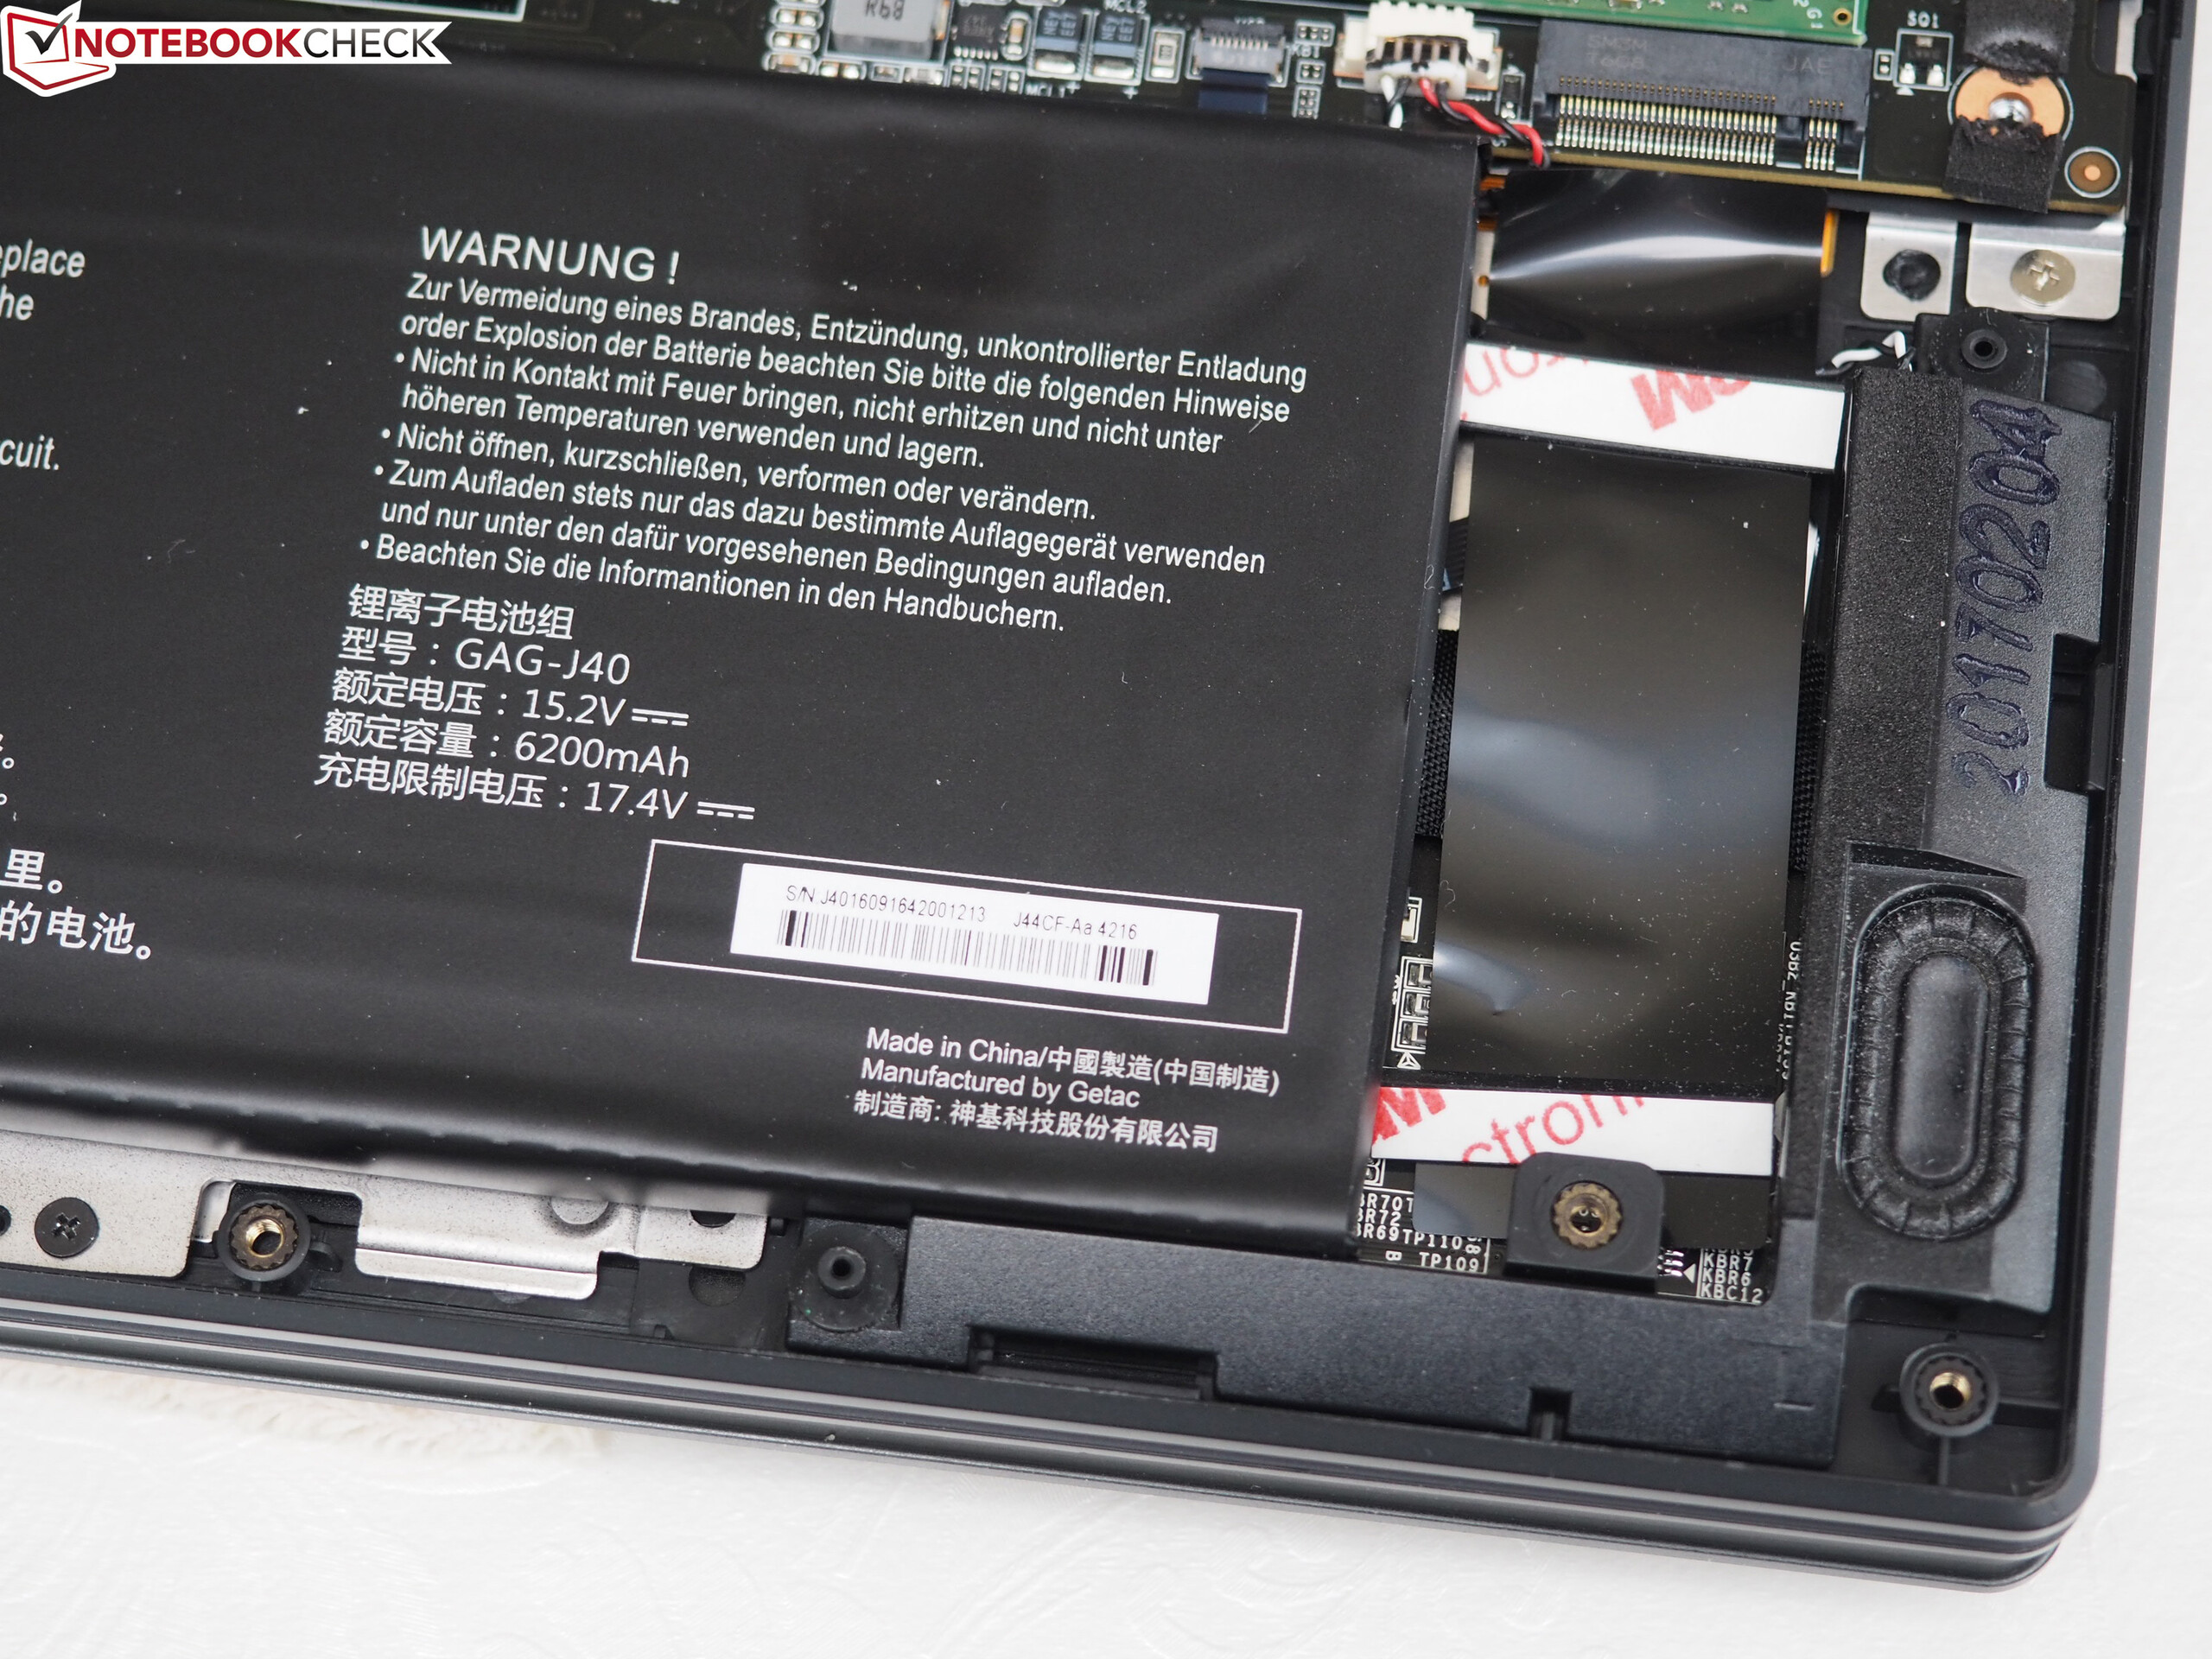
Battery Life
In our real-life Wi-Fi test the Aero 15X lasted for 8:11 hours. In this test we simulate the load most common for browsing the web by loading various websites via a script at a normalized display brightness of 150 nits and the “Balanced” power plan selected. In our video test, in which we run the Big Buck Bunny short film (FHD, h.264-encoded) with all communication modules and power saving features disabled and a normalized display brightness of 150 nits in a loop, the Aero 15X ran out of power after 7:36 hours.
Despite an identical battery, our review unit outlasted its GTX 1060 equipped sibling in every single battery test.
| Gigabyte Aero 15X i7-7700HQ, GeForce GTX 1070 Max-Q, 94.2 Wh | Acer Aspire VN7-593G-73HP V15 Nitro BE i7-7700HQ, GeForce GTX 1060 Mobile, 69 Wh | MSI GS63VR 7RF-228US i7-7700HQ, GeForce GTX 1060 Mobile, 65 Wh | Razer Blade (2017) i7-7700HQ, GeForce GTX 1060 Mobile, 70 Wh | HP Omen 15-ce002ng i7-7700HQ, GeForce GTX 1060 Max-Q, 70 Wh | Gigabyte Aero 15 i7-7700HQ, GeForce GTX 1060 Mobile, 94.24 Wh | Asus Zephyrus GX501VS i7-7700HQ, GeForce GTX 1070 Max-Q, 50 Wh | |
|---|---|---|---|---|---|---|---|
| Battery runtime | -23% | -51% | 11% | -57% | -15% | -70% | |
| Reader / Idle (h) | 13 | 8.4 -35% | 6.4 -51% | 4.3 -67% | 10.6 -18% | 3.8 -71% | |
| H.264 (h) | 7.6 | 3.7 -51% | 7.7 1% | ||||
| WiFi v1.3 (h) | 8.2 | 6 -27% | 3.9 -52% | 9.1 11% | 3.3 -60% | 7 -15% | 2.5 -70% |
| Load (h) | 2.6 | 2.4 -8% | 1.3 -50% | 1.3 -50% | 1.9 -27% | 0.8 -69% |
Verdict
Pros
Cons
Thanks to its powerful hardware, the thin and sleek Aero 15X manages to run all current games smoothly with high or even maximum details on its matte FHD display.
Despite powerful hardware, battery life is surprisingly decent.
Even though the Aero 15X is primarily a multimedia/gaming notebook Gigabyte has not forgotten everyday usage scenarios. Equipped with a decent keyboard the notebook is capable of noiseless operation, and it turned out to be surprisingly portable thanks to its high-capacity battery that managed to keep the notebook up and running for 8:11 hours in our real-world Wi-Fi test.
Overall system performance is very swift thanks to the device’s user-replaceable NVMe-SSD. Additional storage space can be installed in the second M.2 slot, however there is no room for a 2.5-inch hard drive. The matte FHD display offers decent viewing angles, adequate brightness, and a very good contrast ratio. Unfortunately, response times are on the slow side and could be a bit faster.
Gigabyte Aero 15X
- 11/01/2017 v6 (old)
Sascha Mölck
Price comparison

