MSI GS73VR 7RG (i7-7700HQ, GTX 1070 Max-Q, FHD) Laptop Review
The GS series is MSI's ambitious attempt to pack as much horsepower in as thin of a chassis as possible. It's unsurprisingly a natural fit for the Max-Q series as these GPUs are designed specifically for thin notebooks not unlike the Zephyrus, Aero 15 X, or our MSI.
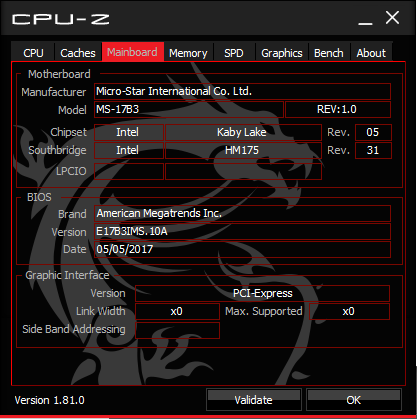
This latest refresh swaps out the Skylake i7-6700HQ CPU and GTX 1060 GPU on last year's GS73VR 6RF with the Kaby Lake i7-7700HQ and GTX 1070 Max-Q. In theory, the change should bring quieter fans and lower temperatures - two categories that the GS series has been infamously dreadful at - while simultaneously boosting graphics performance. Everything else about the notebook remains otherwise identical to the GS73VR 6RF and we recommend checking out our existing reviews below for more details on the chassis and its features. Direct competitors in the 17.3-inch gaming space has been steadily growing and now includes the recent Razer Blade Pro, Aorus X7 v7, HP Omen 17, Acer Aspire V17 Nitro, and others.
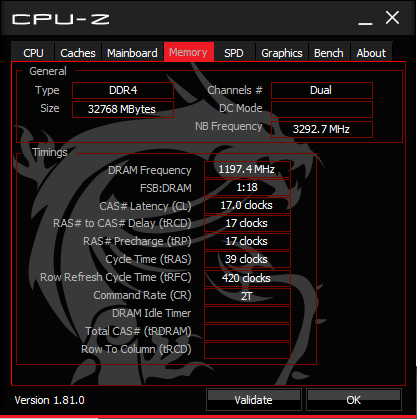
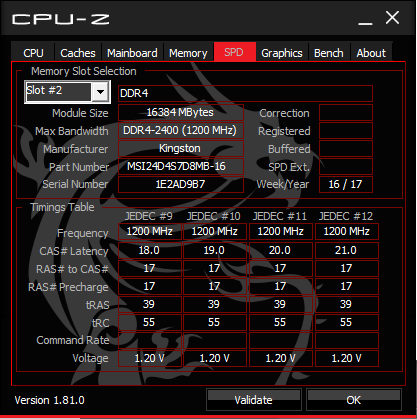
Our unit today comes courtesy of Xotic PC for a configuration price of $2500 USD with a 120 Hz FHD display, massive 32 GB of DDR4 RAM, and a primary 512 GB M.2 SSD plus secondary 1 TB HDD. The reseller has ensured us that the hardware has not been overclocked from stock speeds. Most of the MSI-specific software has been removed, however, including Dragon Center, True Color, and Nahimic audio controller for a more barebones experience. The data on this page reflects the system as-shipped without these software features installed.
Case
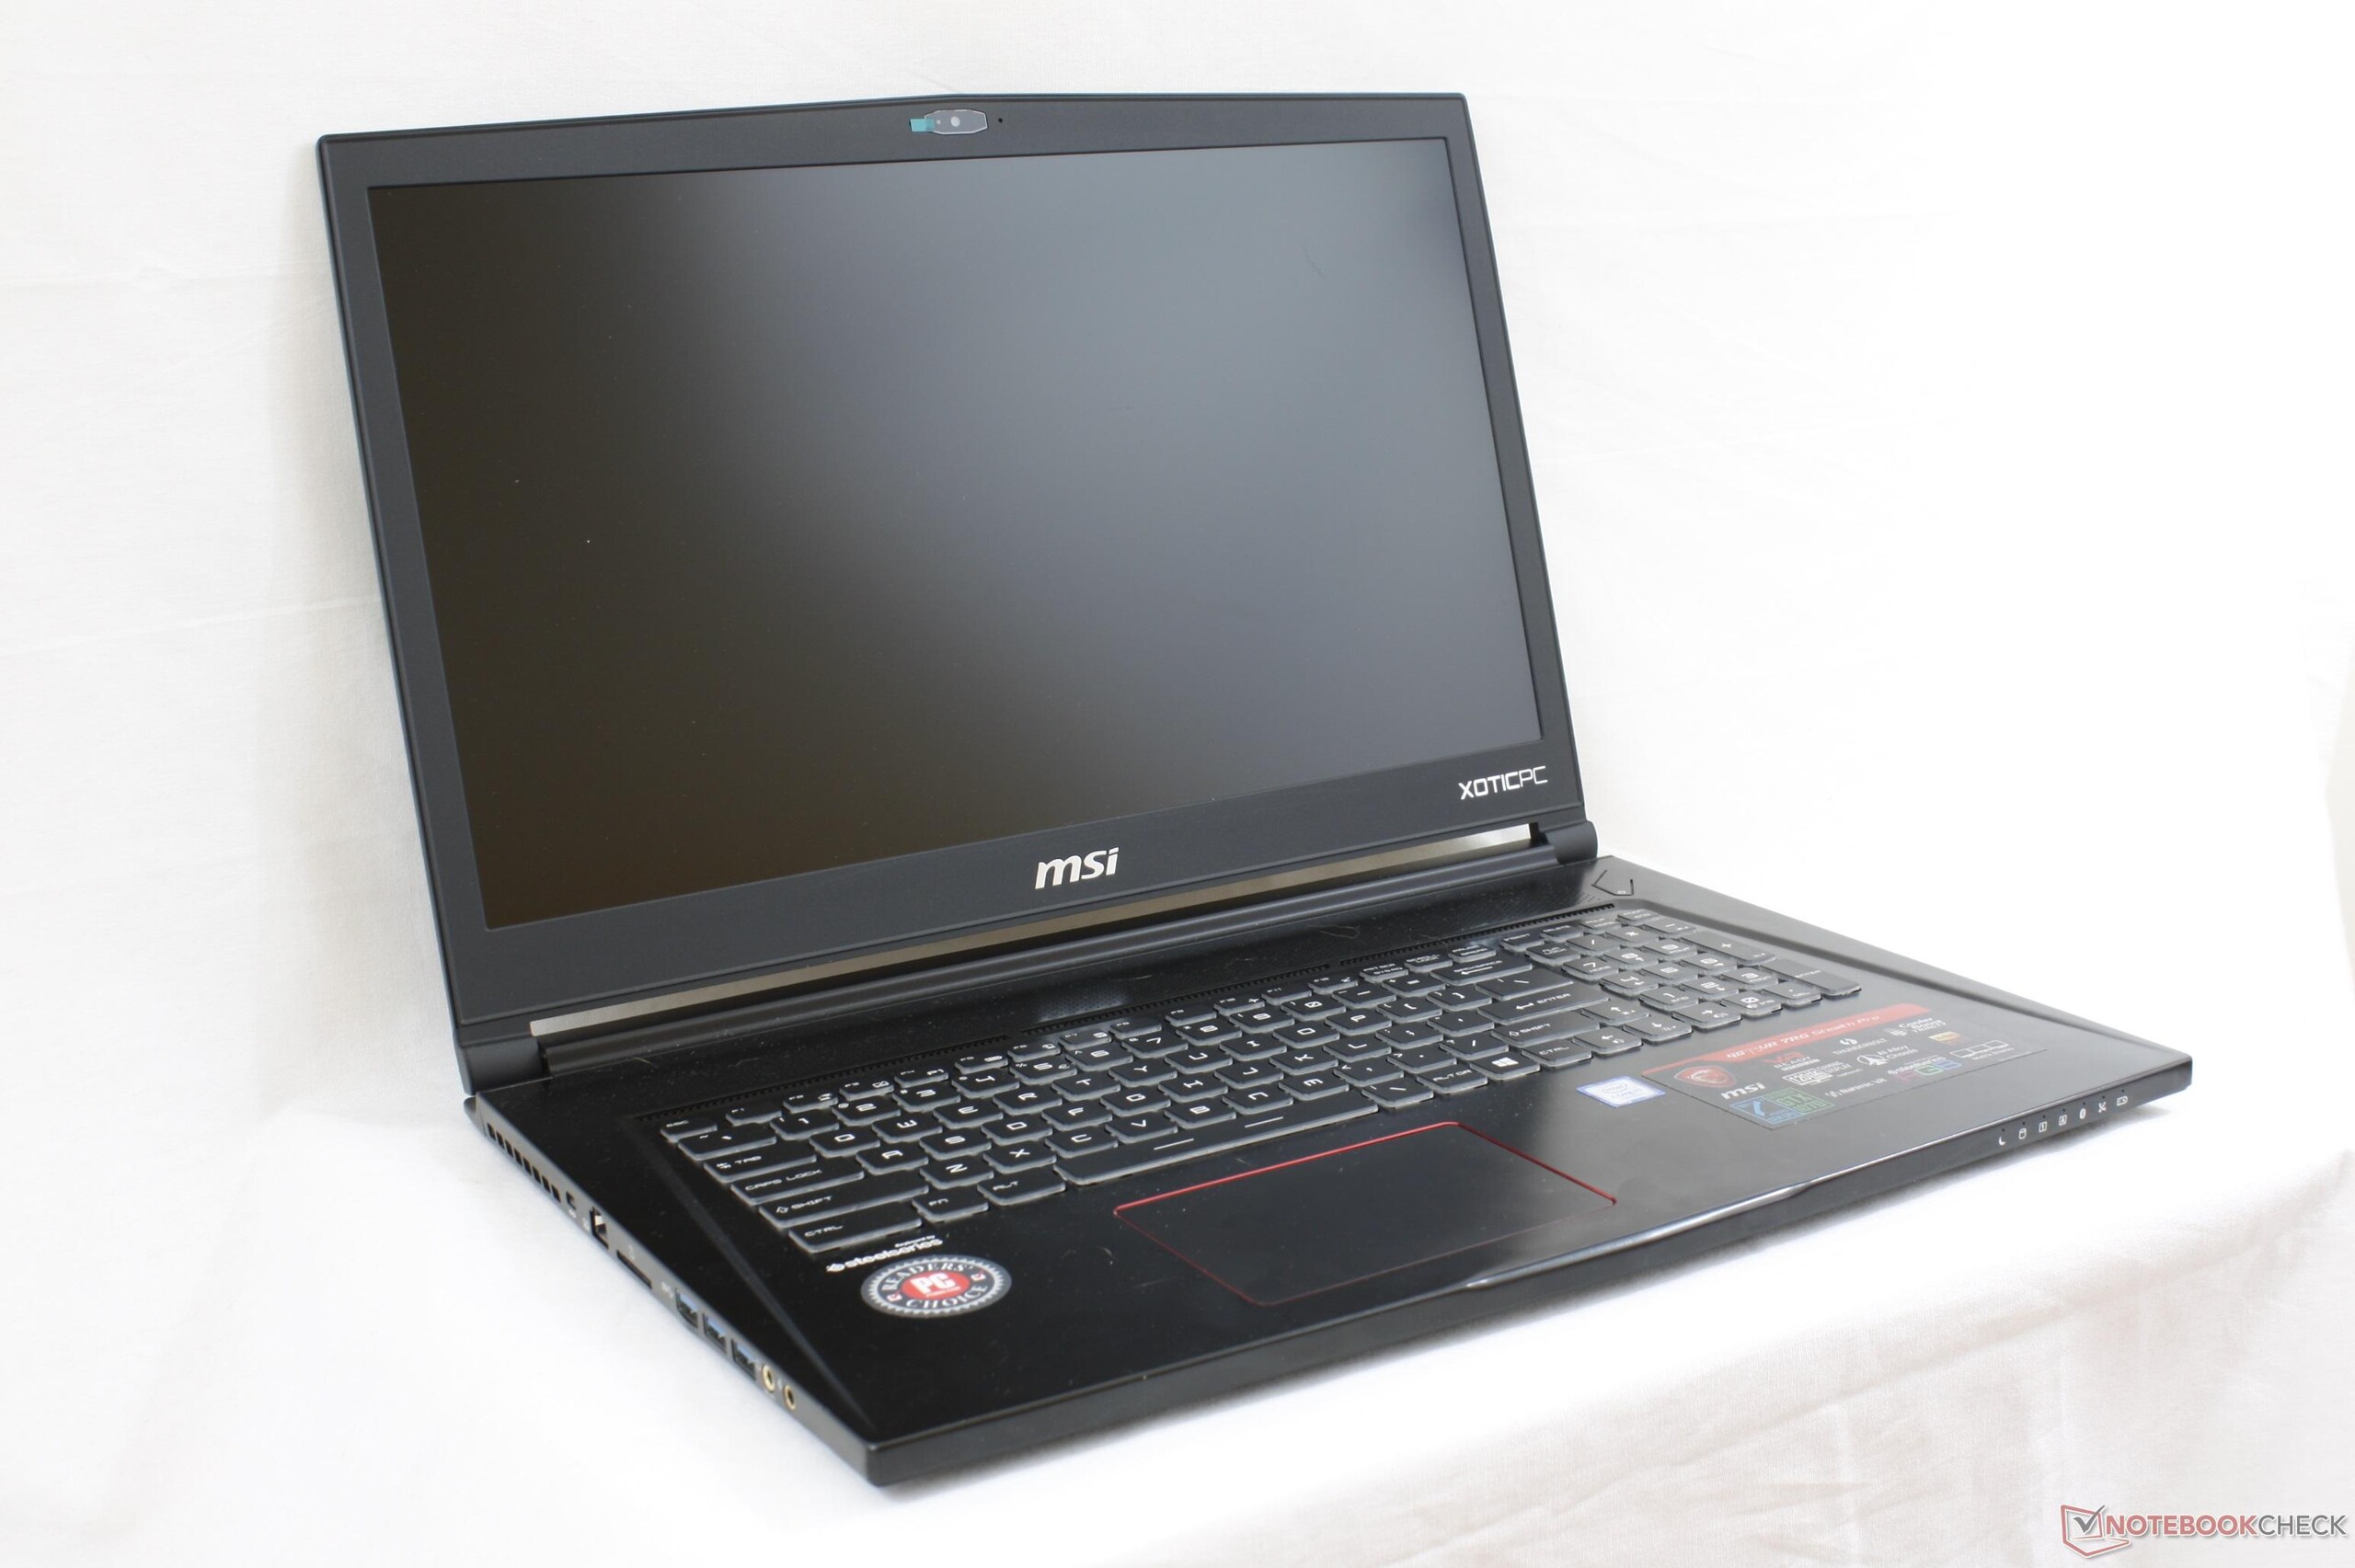
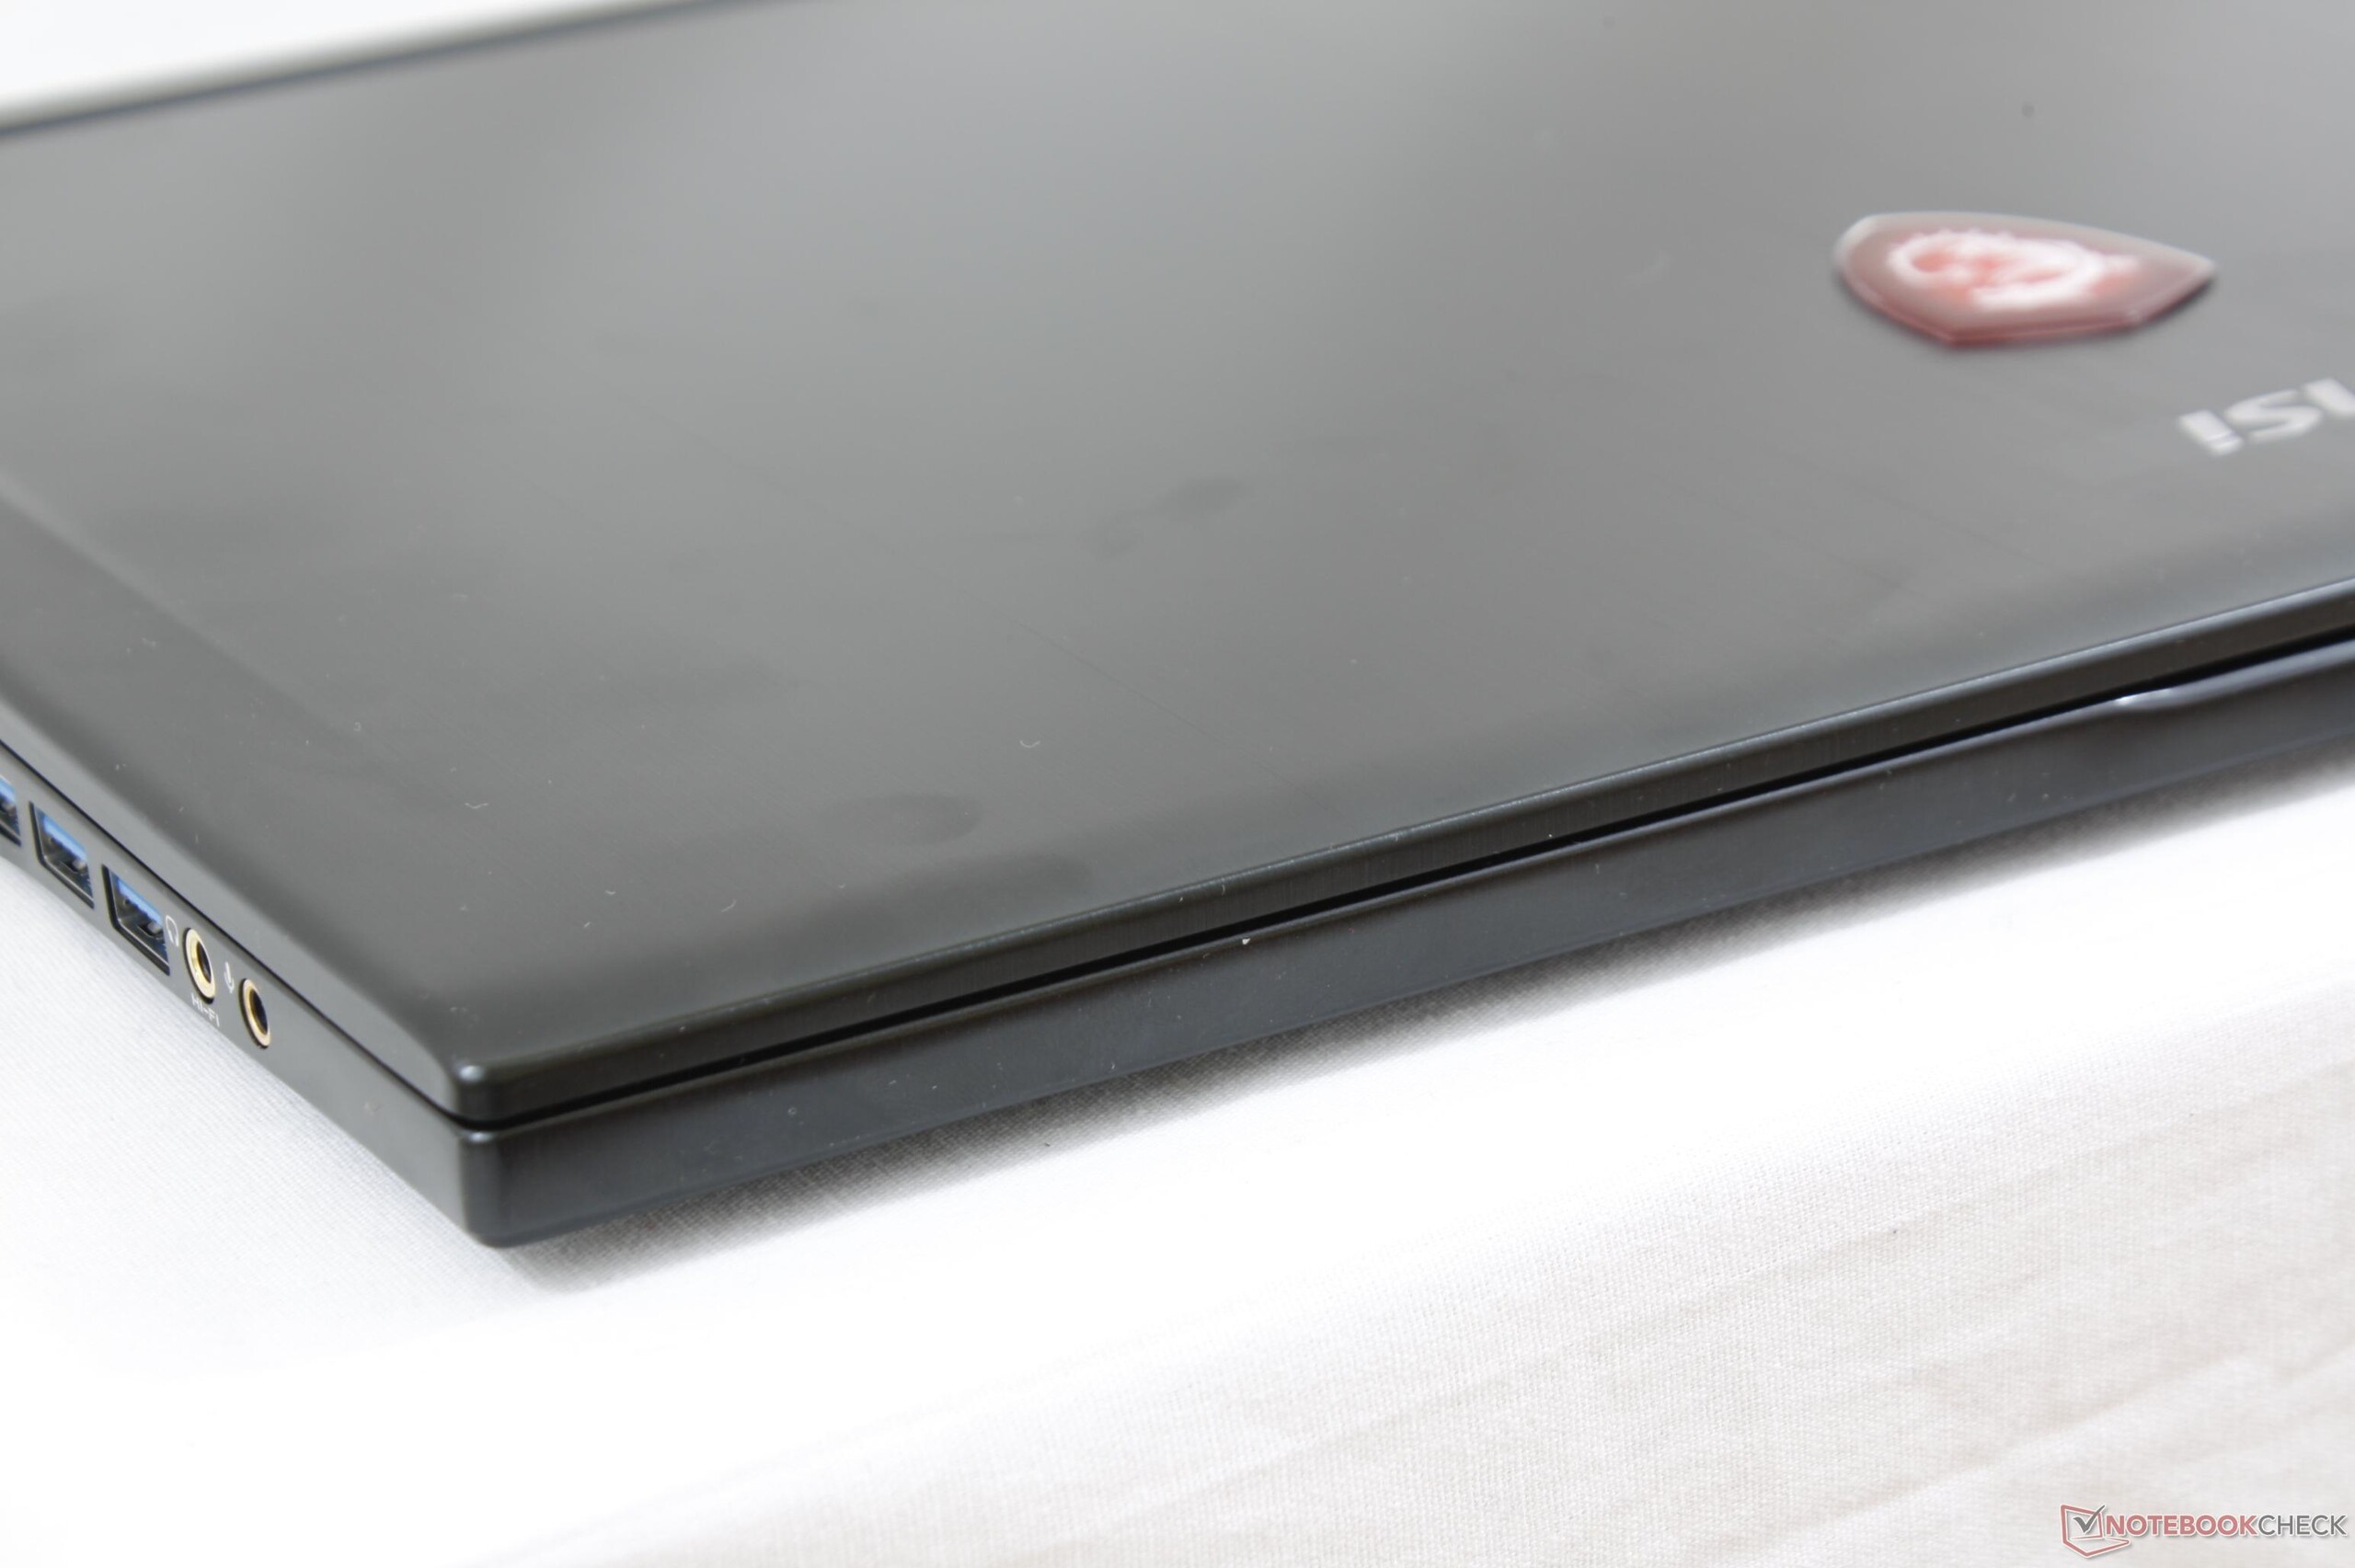
The thinness factor alone makes the GS73VR a sleeker alternative to larger 17.3-inch notebooks like the GT73VR series, the Asus ROG G7xx series, or the Alienware 17 series while its brushed aluminum surfaces are flashier than the duller matte appearances of the Aorus X7, Razer Blade Pro, and Gigabyte P57X. The overall design is very much the opposite of minimalism as the chassis is made up of several discrete pieces rather than a single slab of machined aluminum a la the MacBook Pro.
In terms of quality, however, the GS series sacrifices some rigidity for its thin looks and weight. Applying pressure around the keyboard and palm rests, for example, will visibly depress the surface more so than on the Aorus x7 or 15-inch Zephyrus. Attempting to twist the base from its two front corners will result in light creaking and bending as well. As portable as the system may be, there's no denying that it feels more flexible and prone to damage than its competitors. This is perhaps the price to pay when the MSI is a full kilogram lighter than the Aorus X7 and Gigabyte P57X.
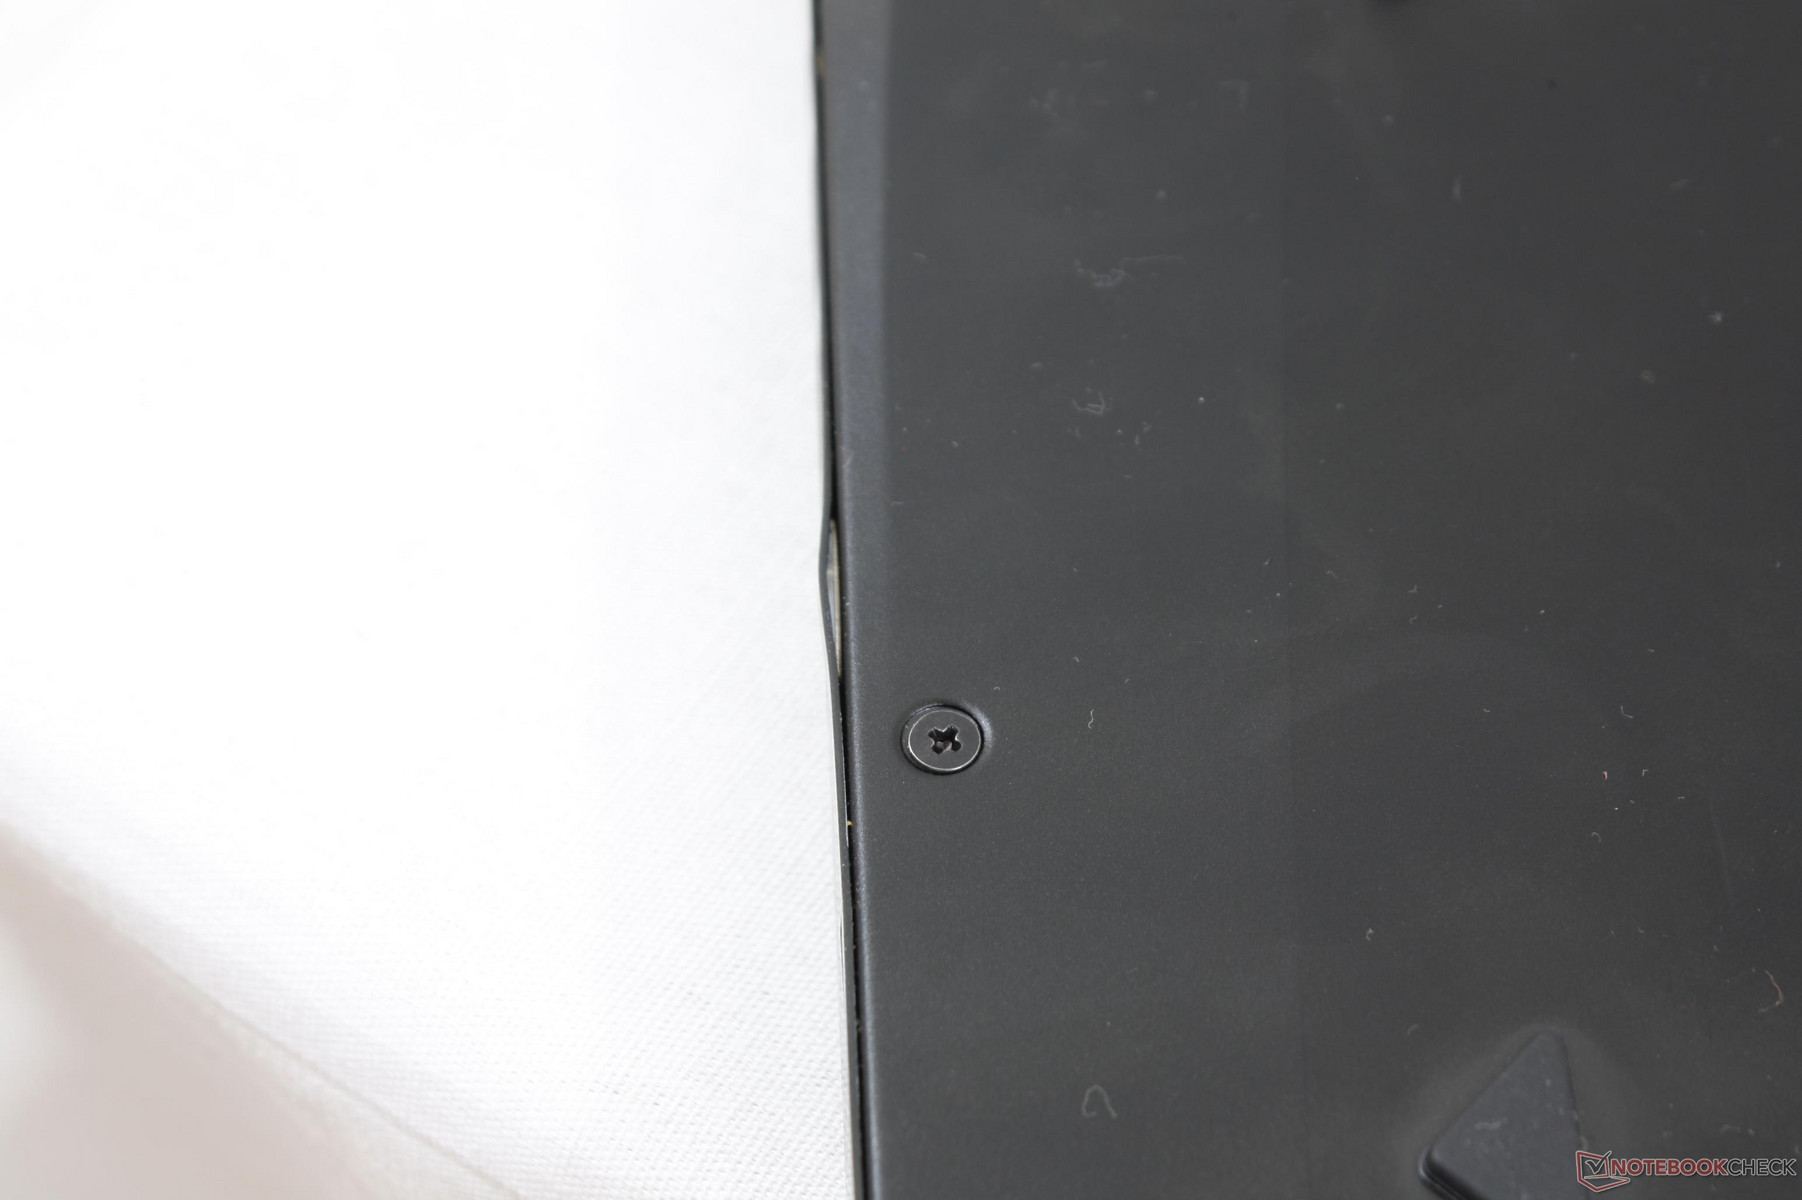
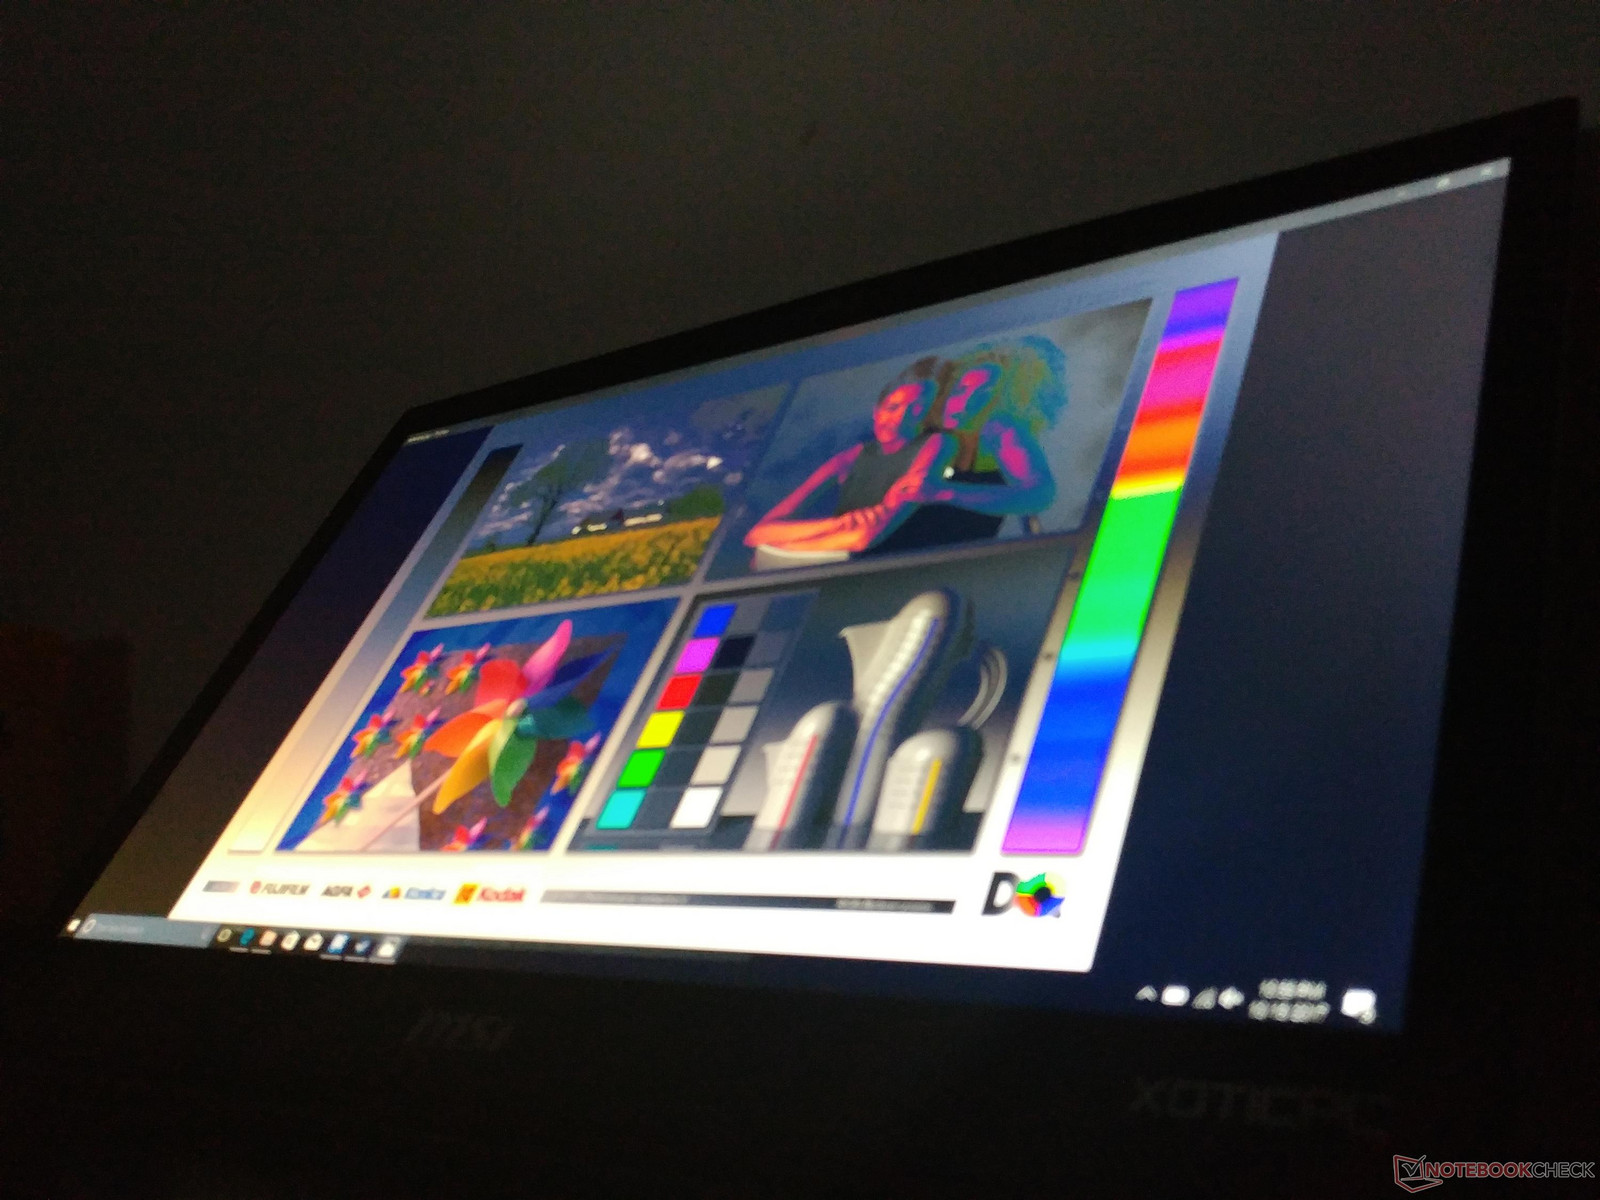
Construction quality is also not perfect. One of the disadvantages of a non-unibody approach is that there is greater potential for gaps, crevices, or bending between discrete materials. Our picture on the right shows a very slight superficial bend along one edge of the notebook. We would normally consider this a fluke that is specific to our test unit, but we observed a similar unevenness on our older GS73VR unit as well. It's recommended that owners double-check their systems for physical defects prior to purchasing or immediately after.
Connectivity
Available ports have not changed and thus exhibit the same advantages and disadvantages as on the GS73VR 6RF. Notably, port options are plentiful and easy to reach but suffer from tight positioning on both sides.


SD Card Reader
The older GS models are notorious for having one of the slowest SD card readers of any gaming notebook. This has finally been remedied on the GS73VR 7RG as we're able to record an average read rate of 212 MB/s with our Toshiba Exceria UHS-II SD card to be almost 8x faster than on the GS73VR 6RF. Transferring 1 GB worth of photos to desktop will take just under 6 seconds compared to 40 seconds on the older model. Certain Eurocom and Clevo systems carry even faster SD card readers.
The card reader is spring-loaded and a fully inserted SD card will still protrude by about one-fourth of its length.
| SD Card Reader | |
| average JPG Copy Test (av. of 3 runs) | |
| MSI GS73VR 7RG | |
| Eurocom Sky X7E2 | |
| MSI GS73VR 7RF | |
| maximum AS SSD Seq Read Test (1GB) | |
| Eurocom Sky X7E2 | |
| MSI GS73VR 7RG | |
| MSI GS73VR 7RF | |
Communication
The Intel 8265 provides 802.11ac and Bluetooth 4.2 connectivity. An option to upgrade to the Killer 1535 is available for more gaming-centric features as detailed in our review here. Otherwise, we experienced no connectivity issues with the default Intel 8265.
| Networking | |
| iperf3 transmit AX12 | |
| MSI GT73VR 7RF-296 | |
| Aorus X7 v7 | |
| MSI GS73VR 7RG | |
| iperf3 receive AX12 | |
| MSI GT73VR 7RF-296 | |
| MSI GS73VR 7RG | |
| Aorus X7 v7 | |
Accessories
Included extras are a Quick Start guide, warranty card, and velvet cloth. The large cloth is particularly useful as fingerprints are very visible on the glossy surfaces.
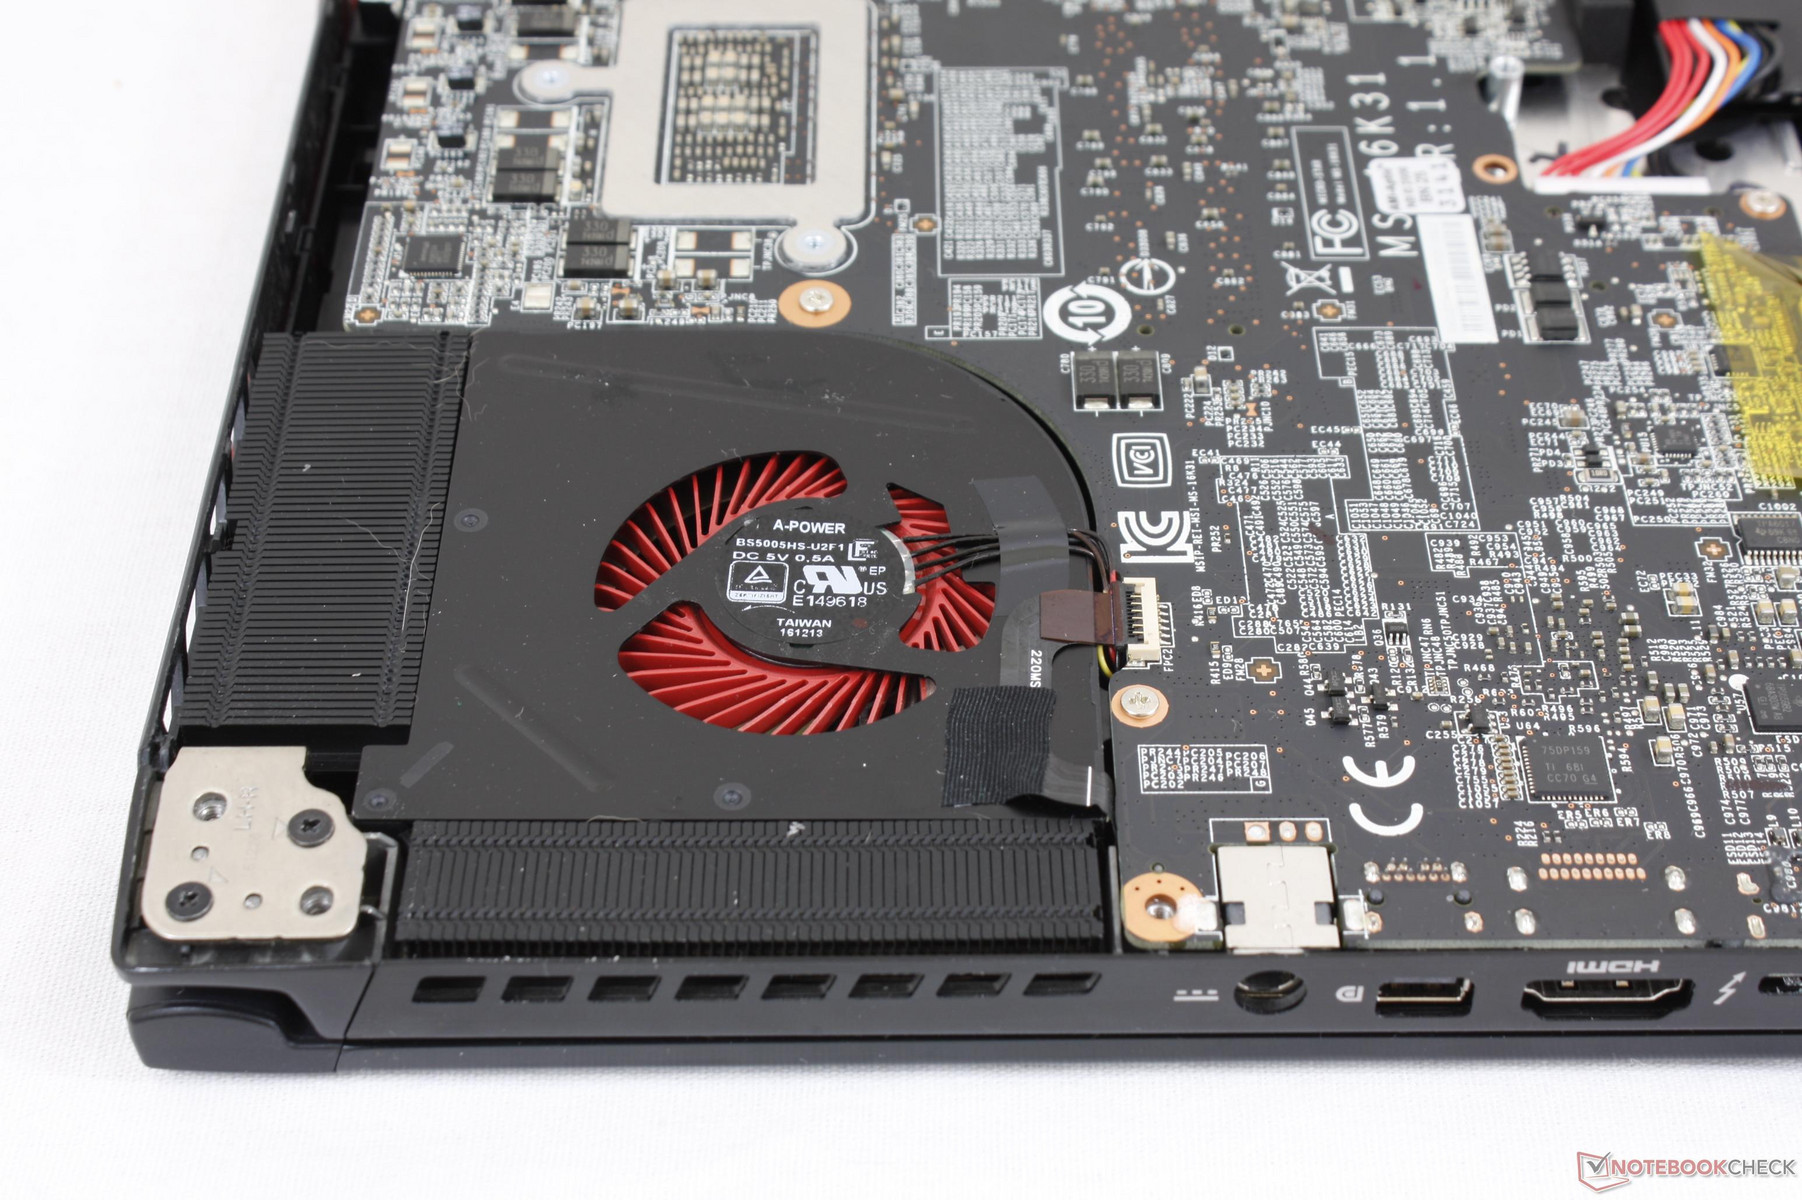
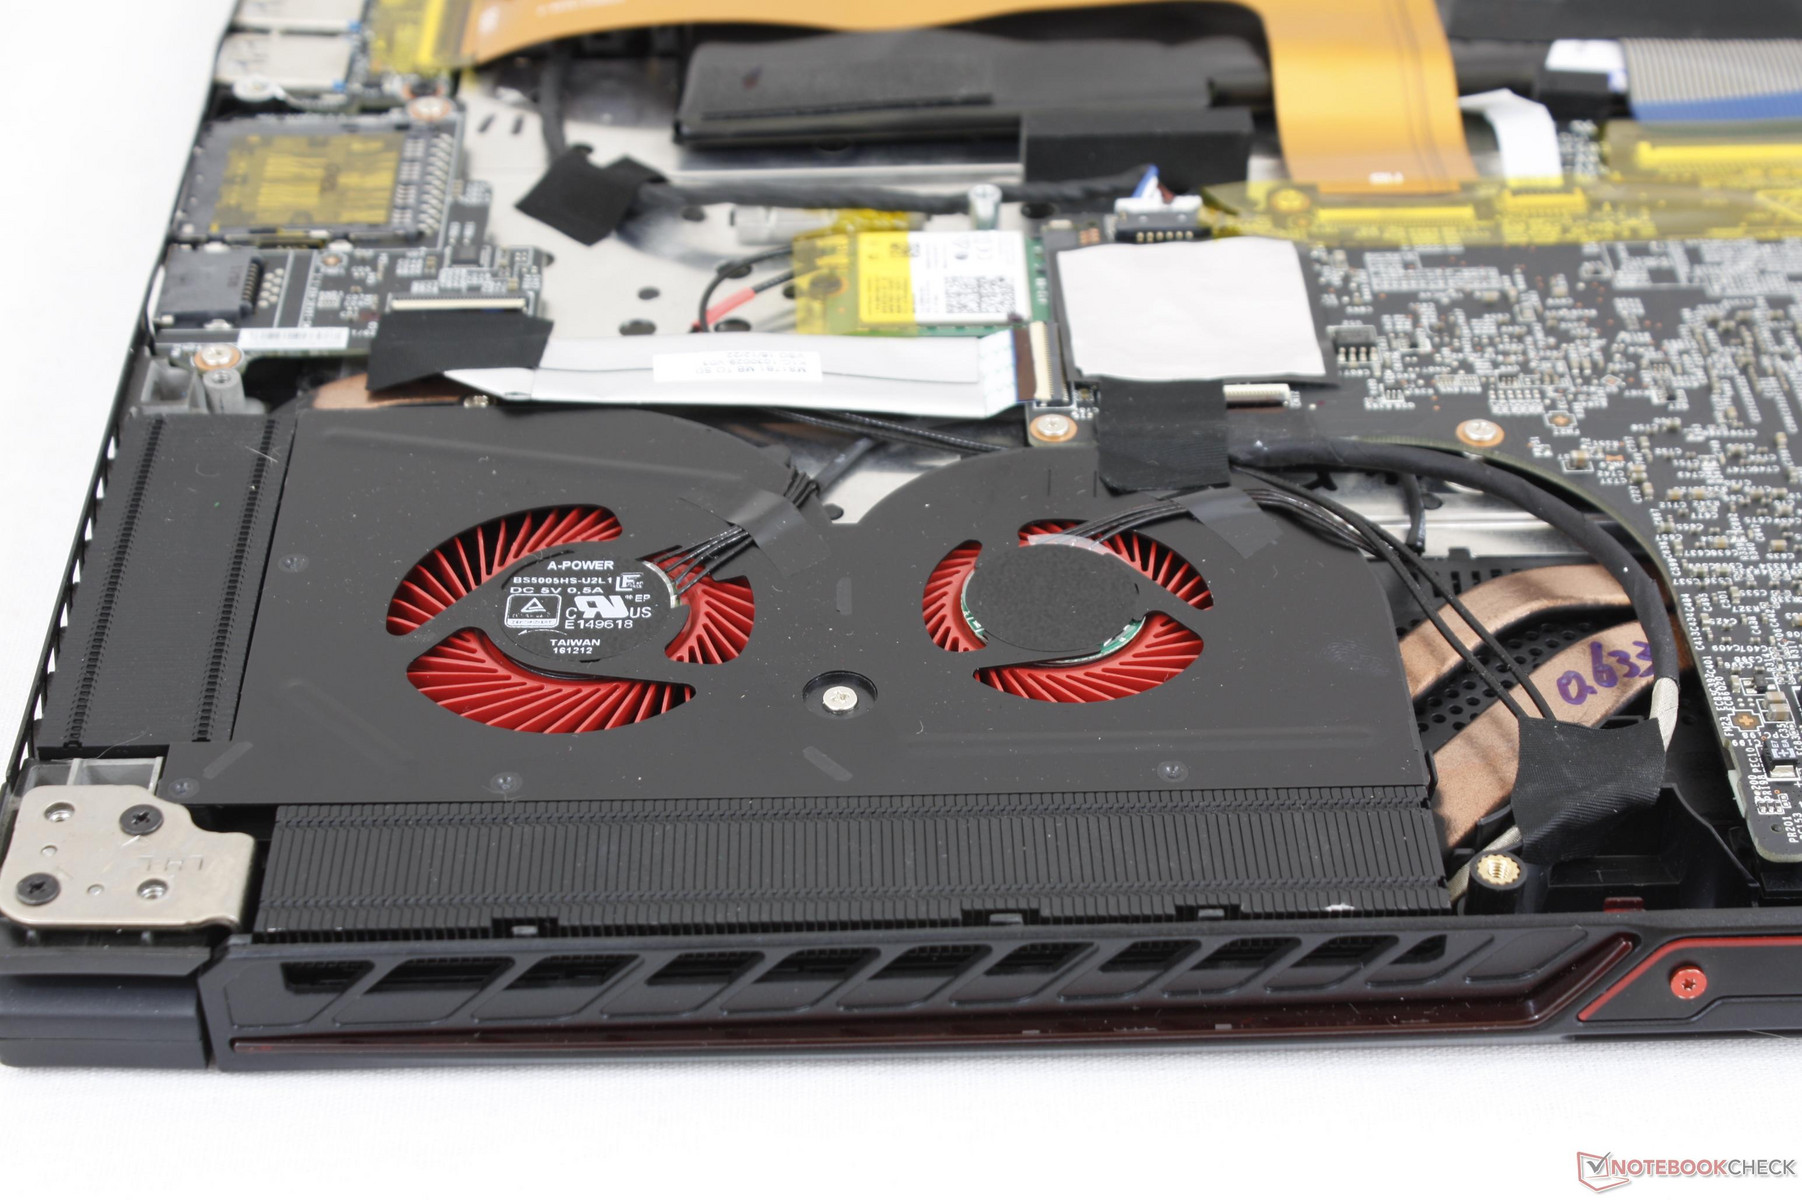
Maintenance
Serviceability is easy and requires only a Philips screwdriver. Unfortunately, simply removing the bottom panel will automatically void the warranty and is thus not recommend. Upgrades are rather limited because the M.2 and 2x SODIMM slots are on the opposite side of the motherboard and require additional disassembly to access.
The internals are otherwise essentially identical to the GS73VR 6RF.
Warranty
The standard one-year limited manufacturer warranty applies. Manufacturers like EVGA and Gigabyte offer two-year warranty as standard on some notebooks and we're hoping to see something similar from MSI in the future. Xotic PC provides optional extensions of up to three years if desired.
Please see our Guarantees, Return Policies & Warranties FAQ for country-specific information.
Input Devices
Keyboard and Touchpad
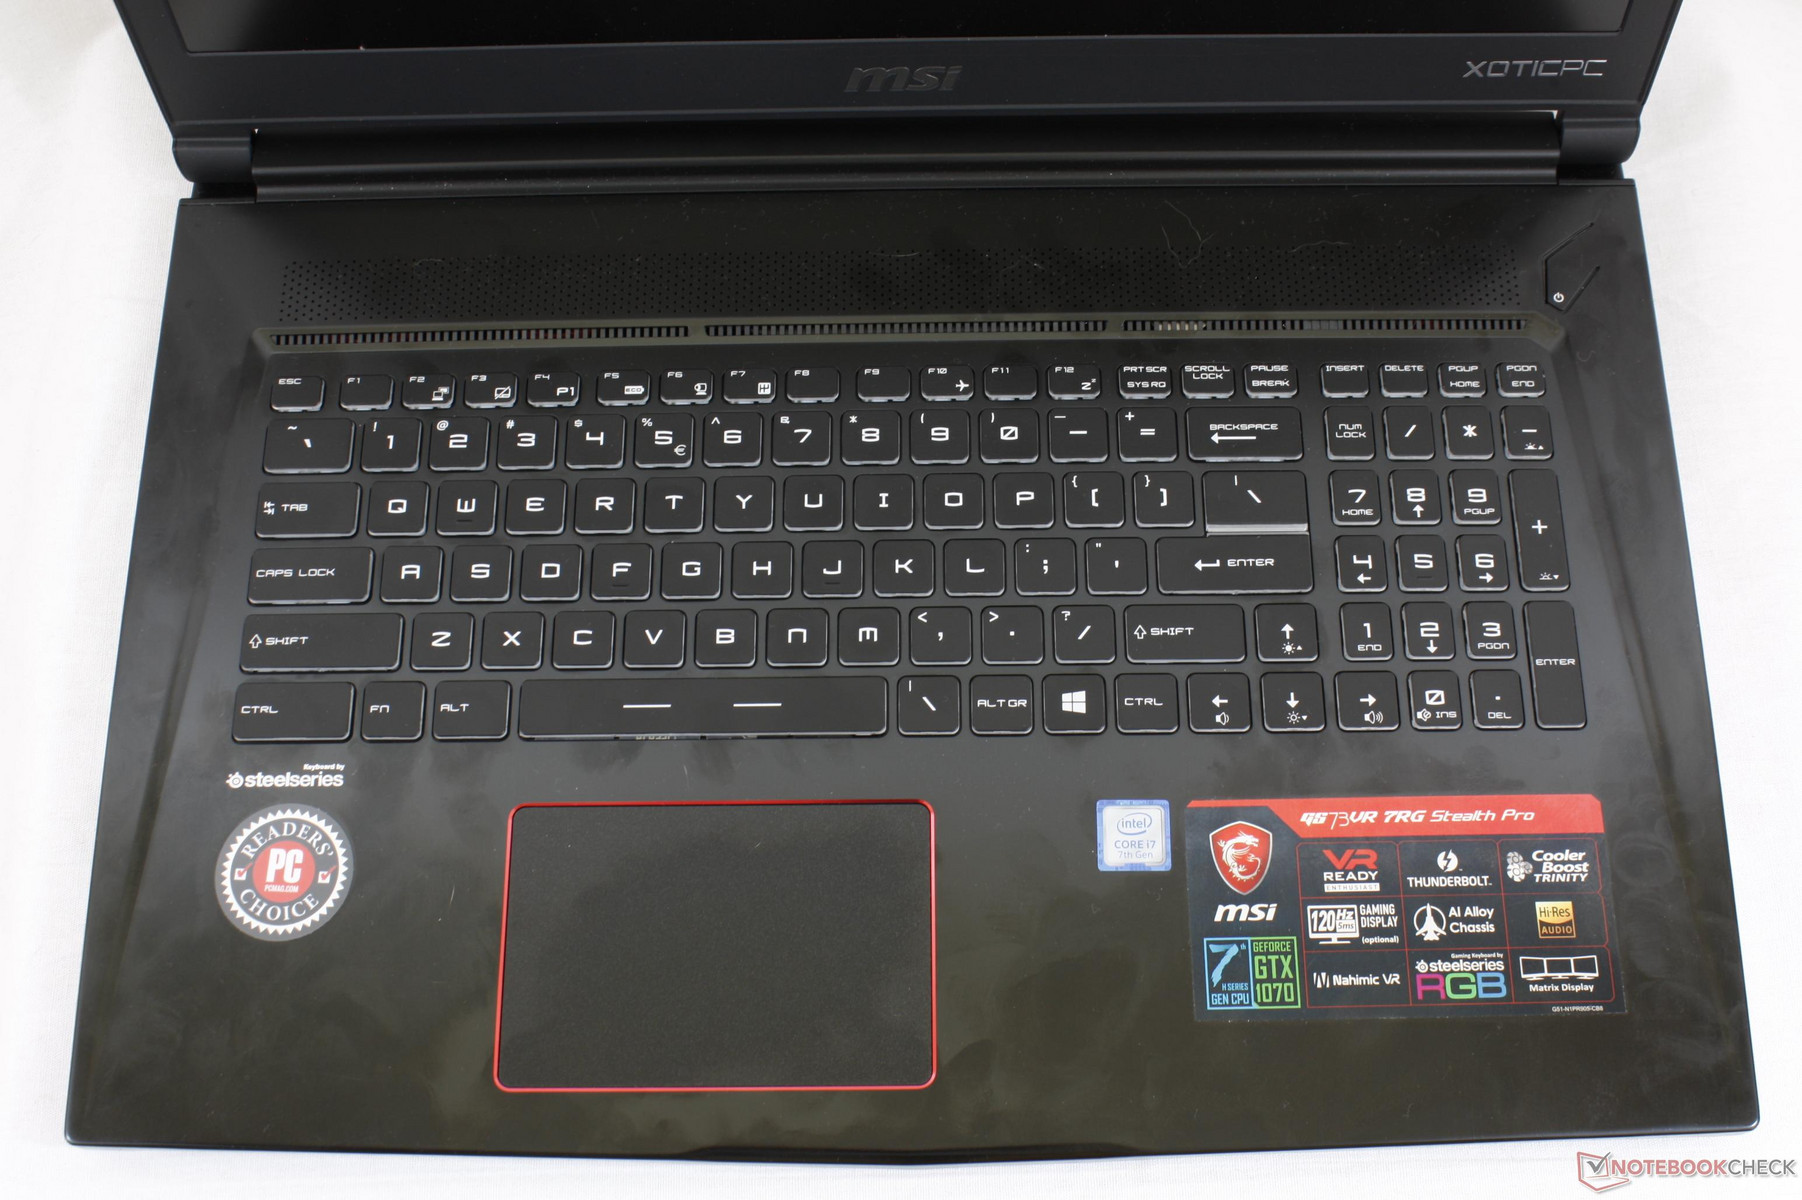
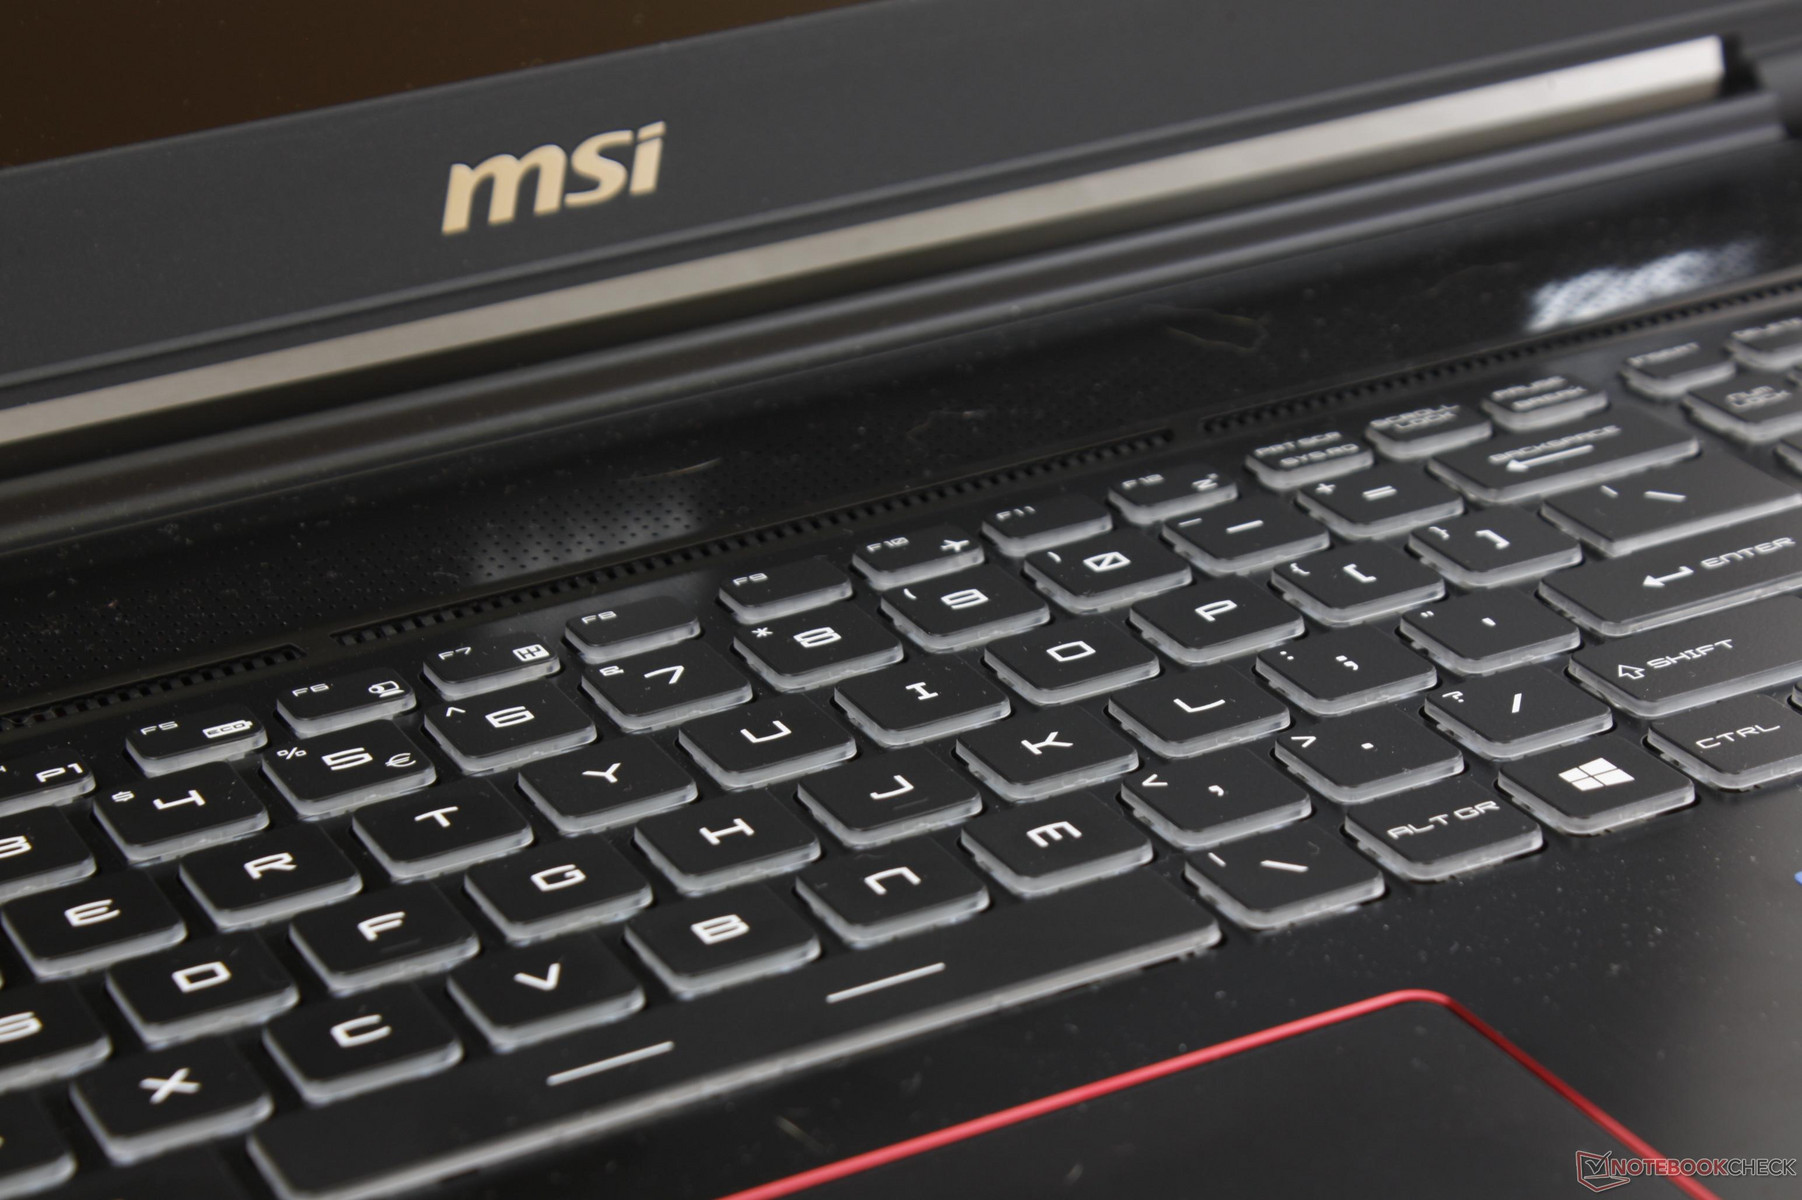
The same backlit Steelseries keyboard and chrome-trimmed trackpad (10.5 x 7.0 cm) with integrated mouse keys return. Clatter is relatively soft with ample travel that feels deeper than on the average Ultrabook. Aside from the smaller top row of function keys, feedback is more or less even across every other key including the NumPad keys and full-size Arrow keys. Meanwhile, the trackpad works reliably for cursor control with no jitters or dead zones. Its integrated mouse keys are soft, shallow in travel, and generally less comfortable to use than the dedicated mouse keys on the larger MSI GT series.
Display
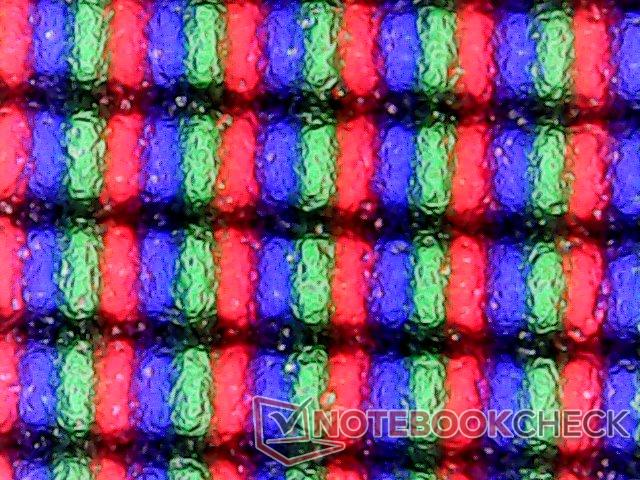
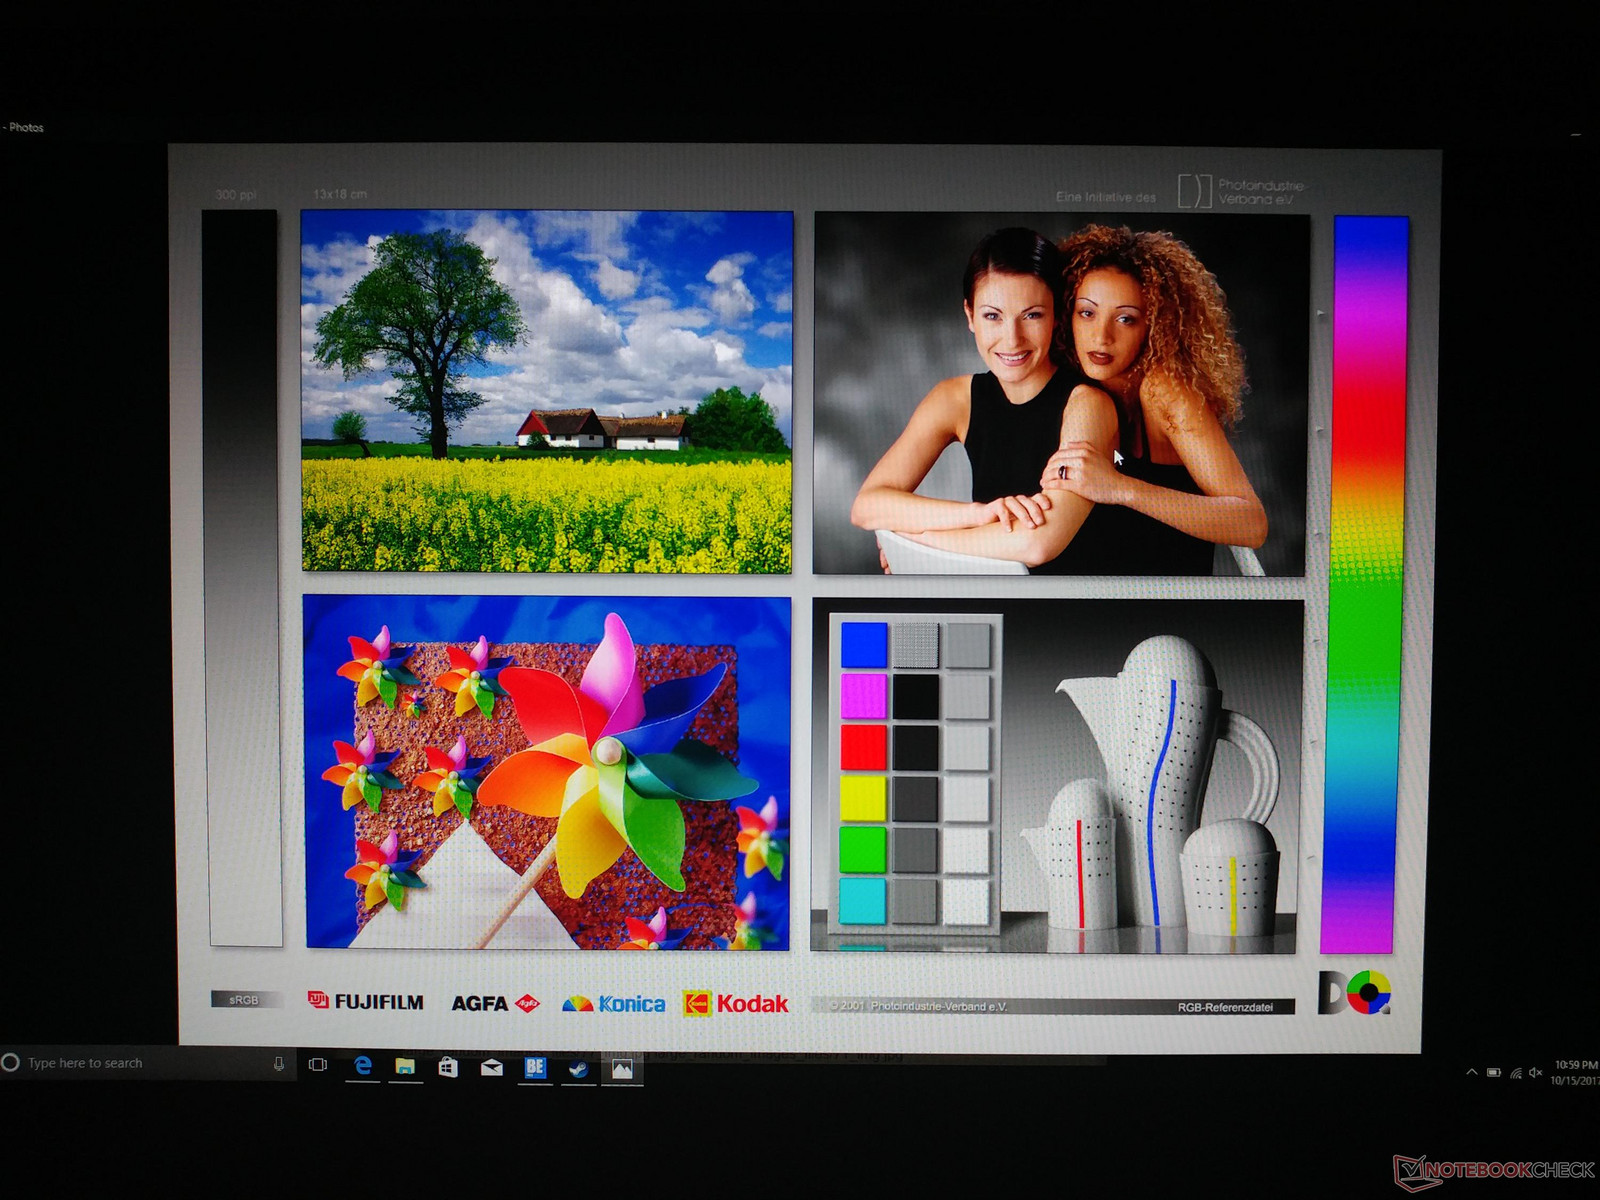
MSI has sourced the same high quality Chi Mei N173HHE-G32 TN panel for the 7RG as last year's 6RF SKU. In fact, this same panel also appears on other 17.3-inch MSI notebooks with 120 Hz options including on the GE72VR and GT72VR. Attributes like the high contrast, wide color space, fast response times, and the general viewing experience are thus quite similar between them.
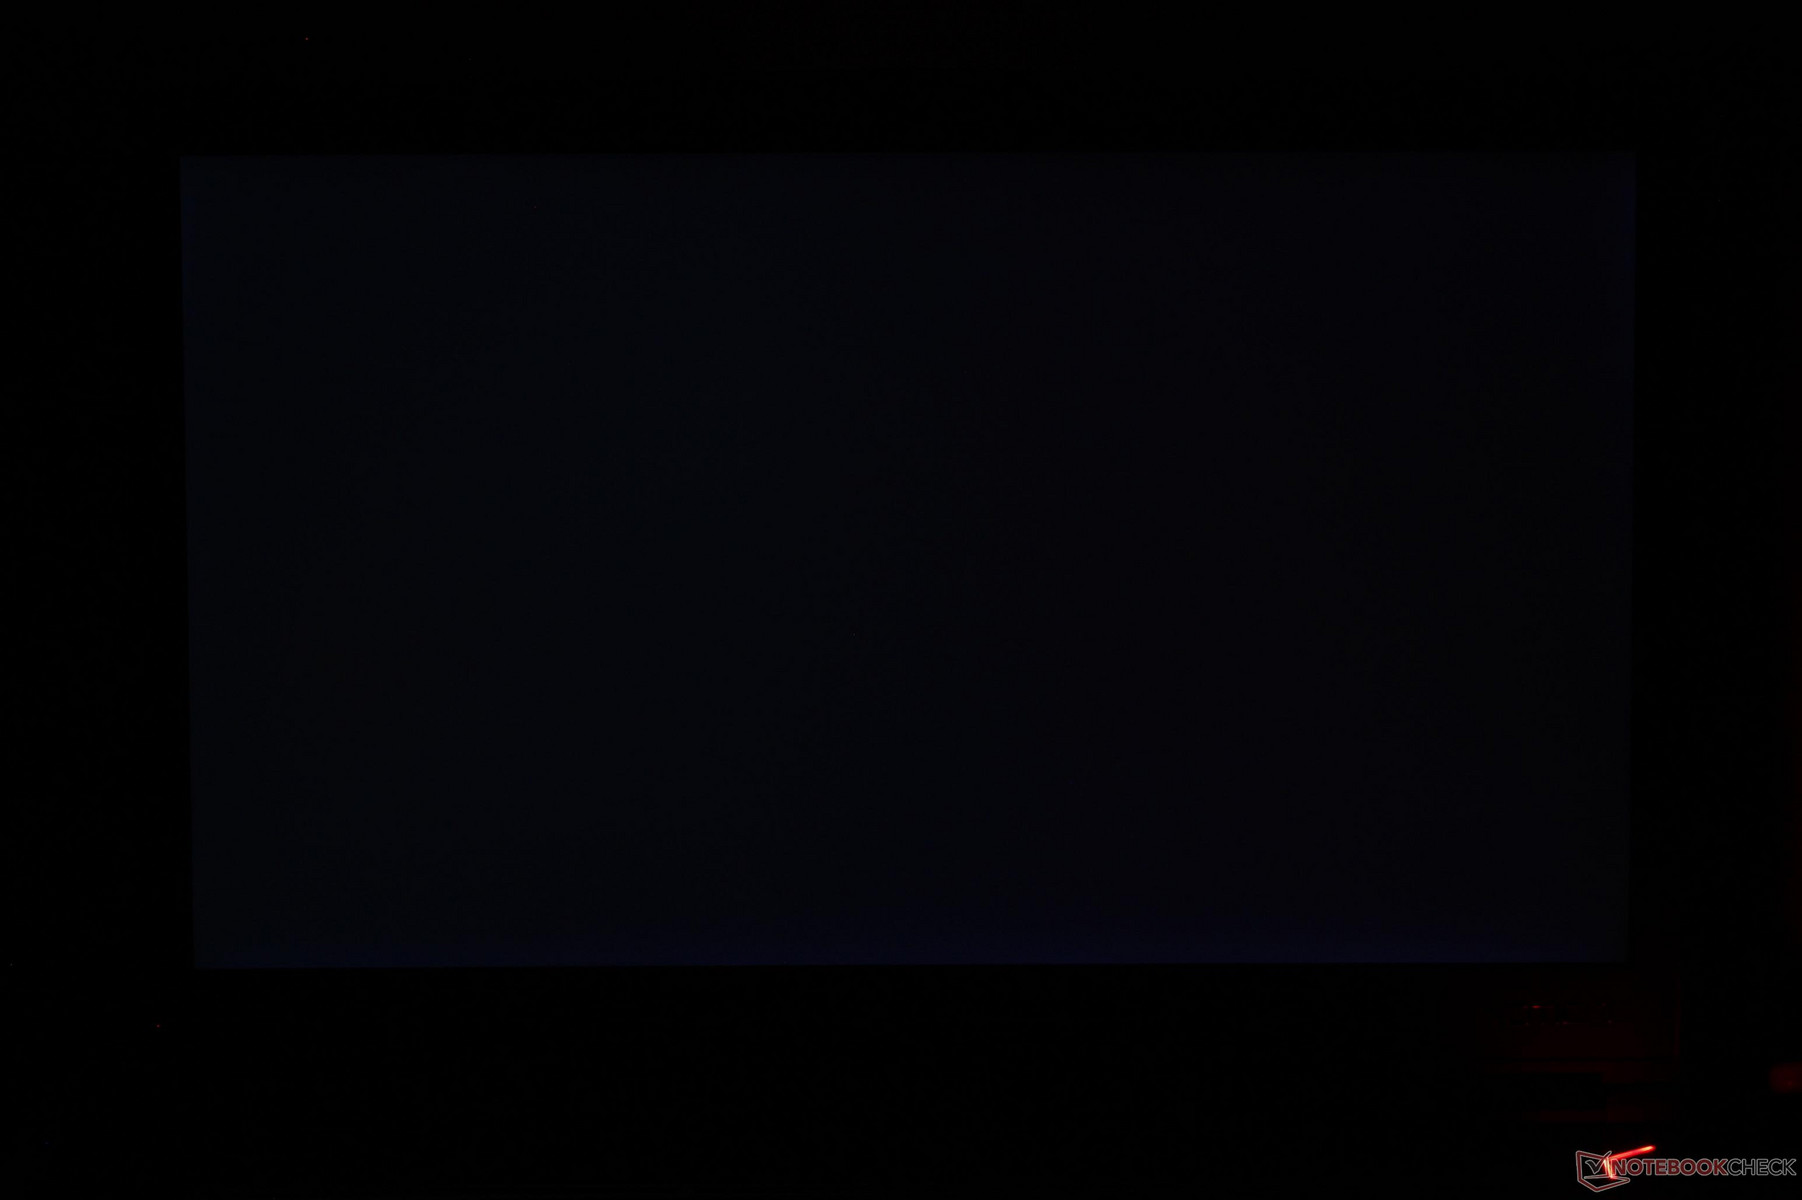
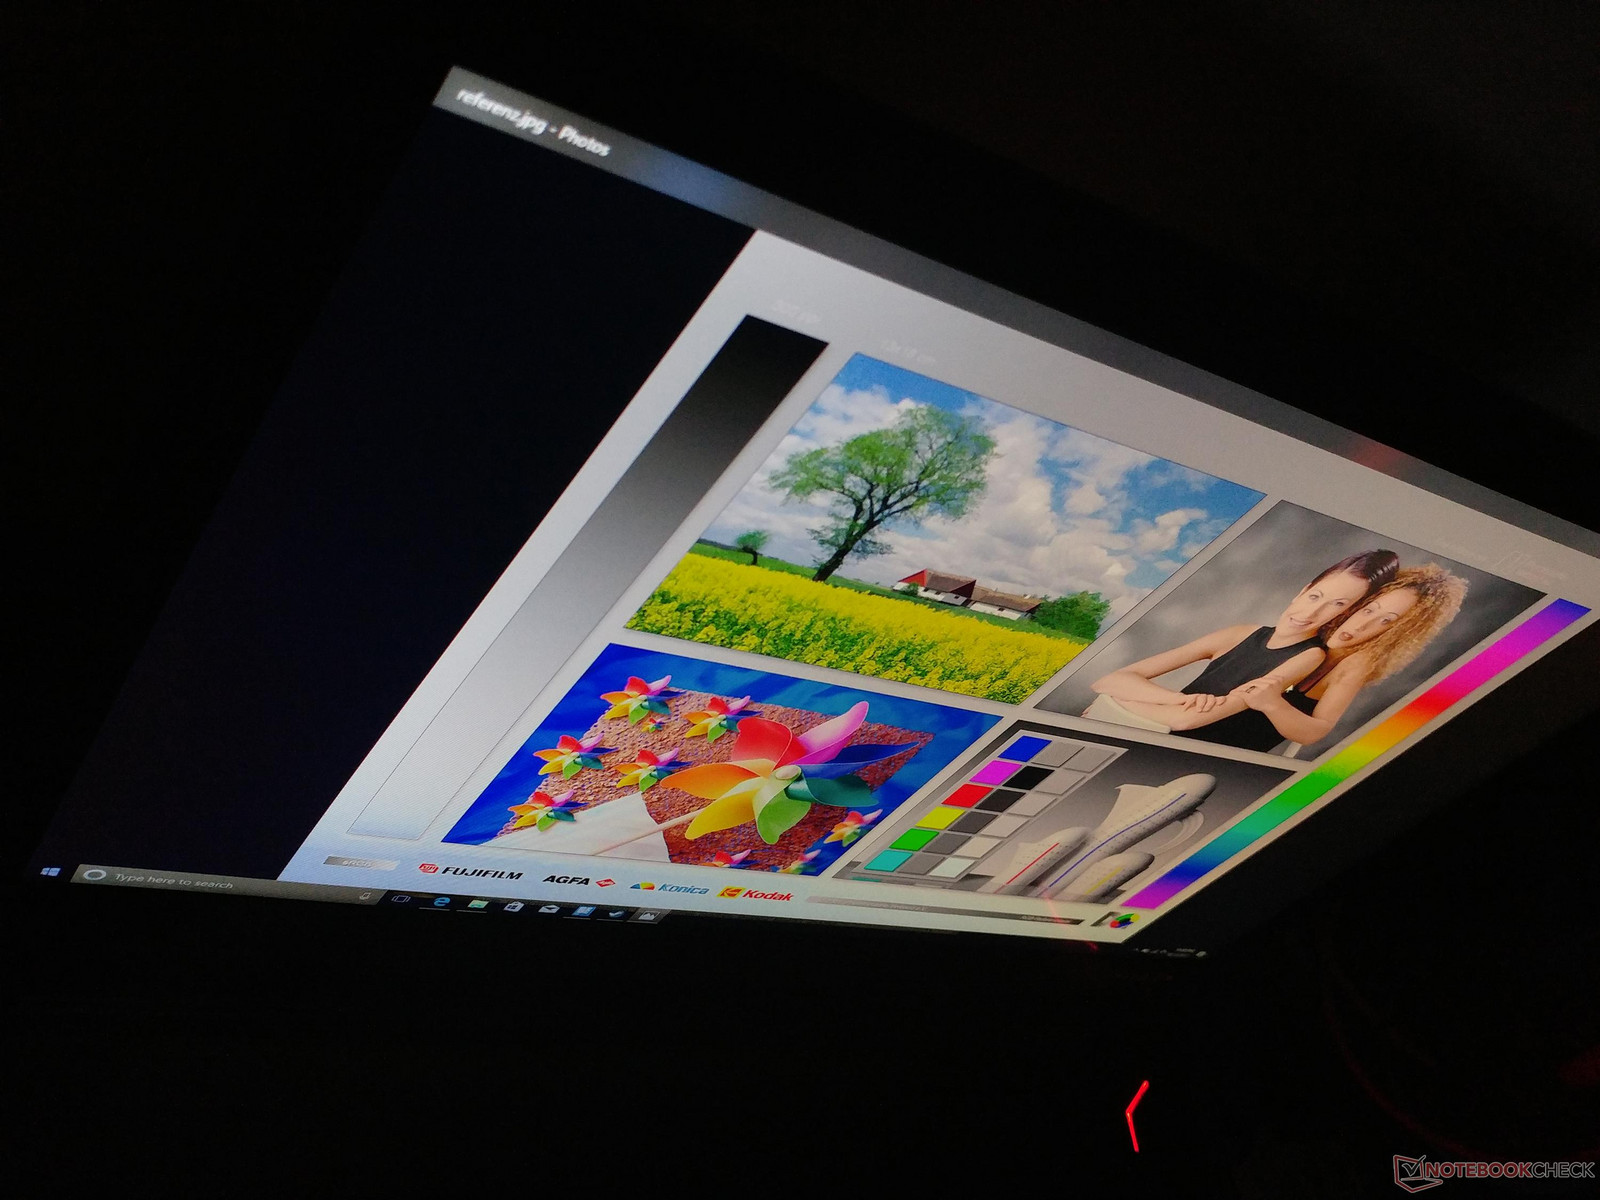
Subjectively, colors are deep and text is crisp with some slight graininess that is common on matte panels. The very fast refresh rate and black-white response times make for a visually smoother experience when compared to 60 Hz IPS panels as found on most Ultrabooks and lower-end gaming systems. Still, brightness distribution could be a little better; the center quadrant is measurably brighter than the edges and corners.
| |||||||||||||||||||||||||
Brightness Distribution: 79 %
Center on Battery: 350.9 cd/m²
Contrast: 1063:1 (Black: 0.33 cd/m²)
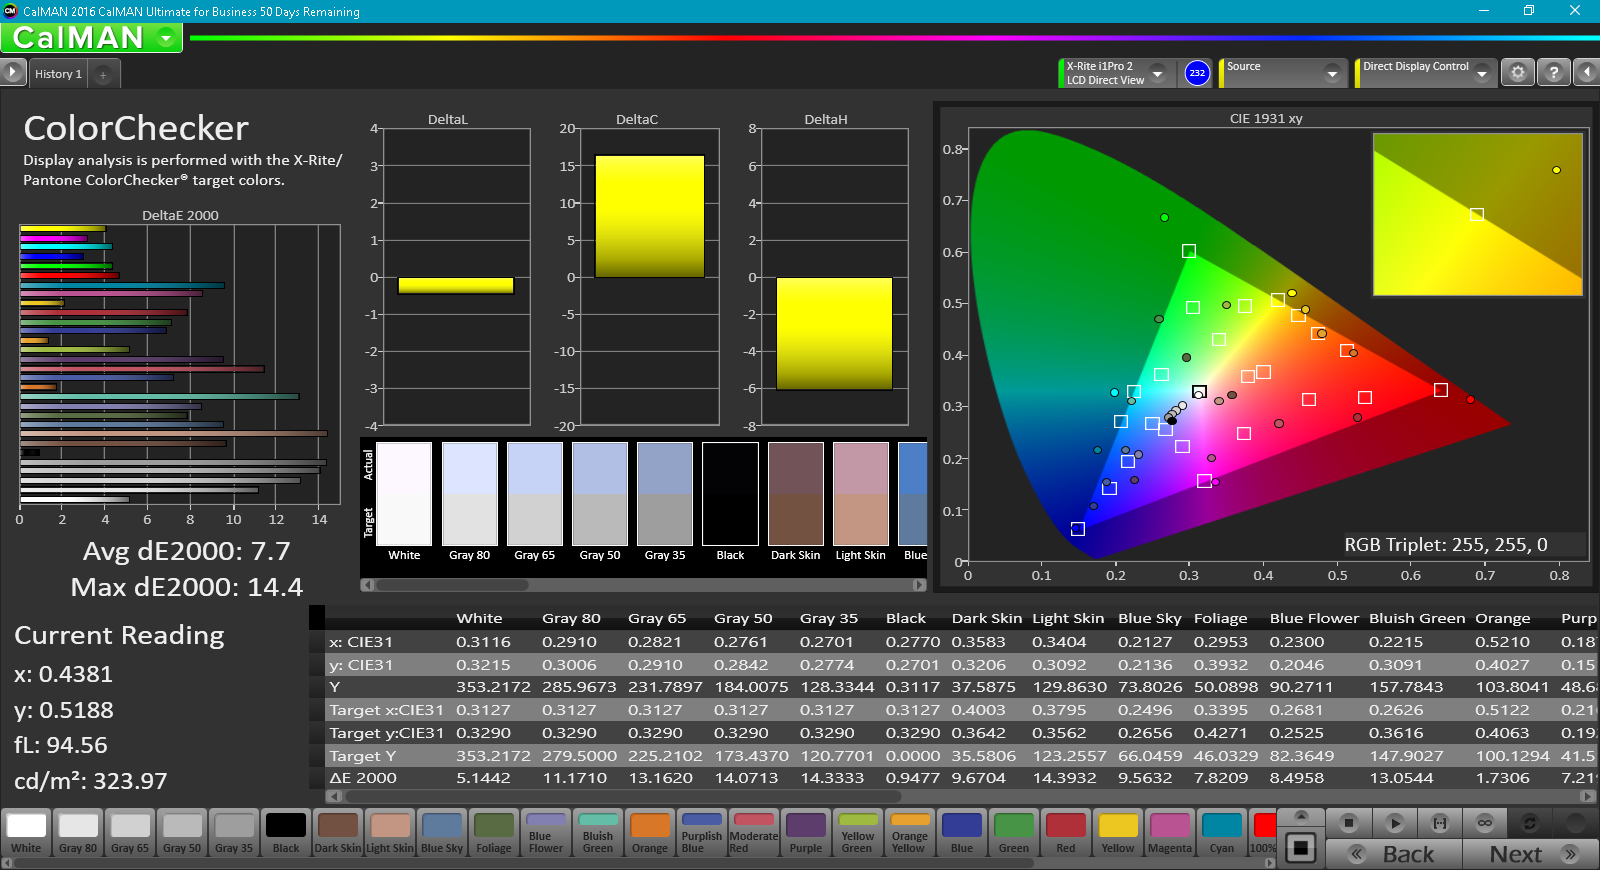
ΔE ColorChecker Calman: 7.7 | ∀{0.5-29.43 Ø4.71}
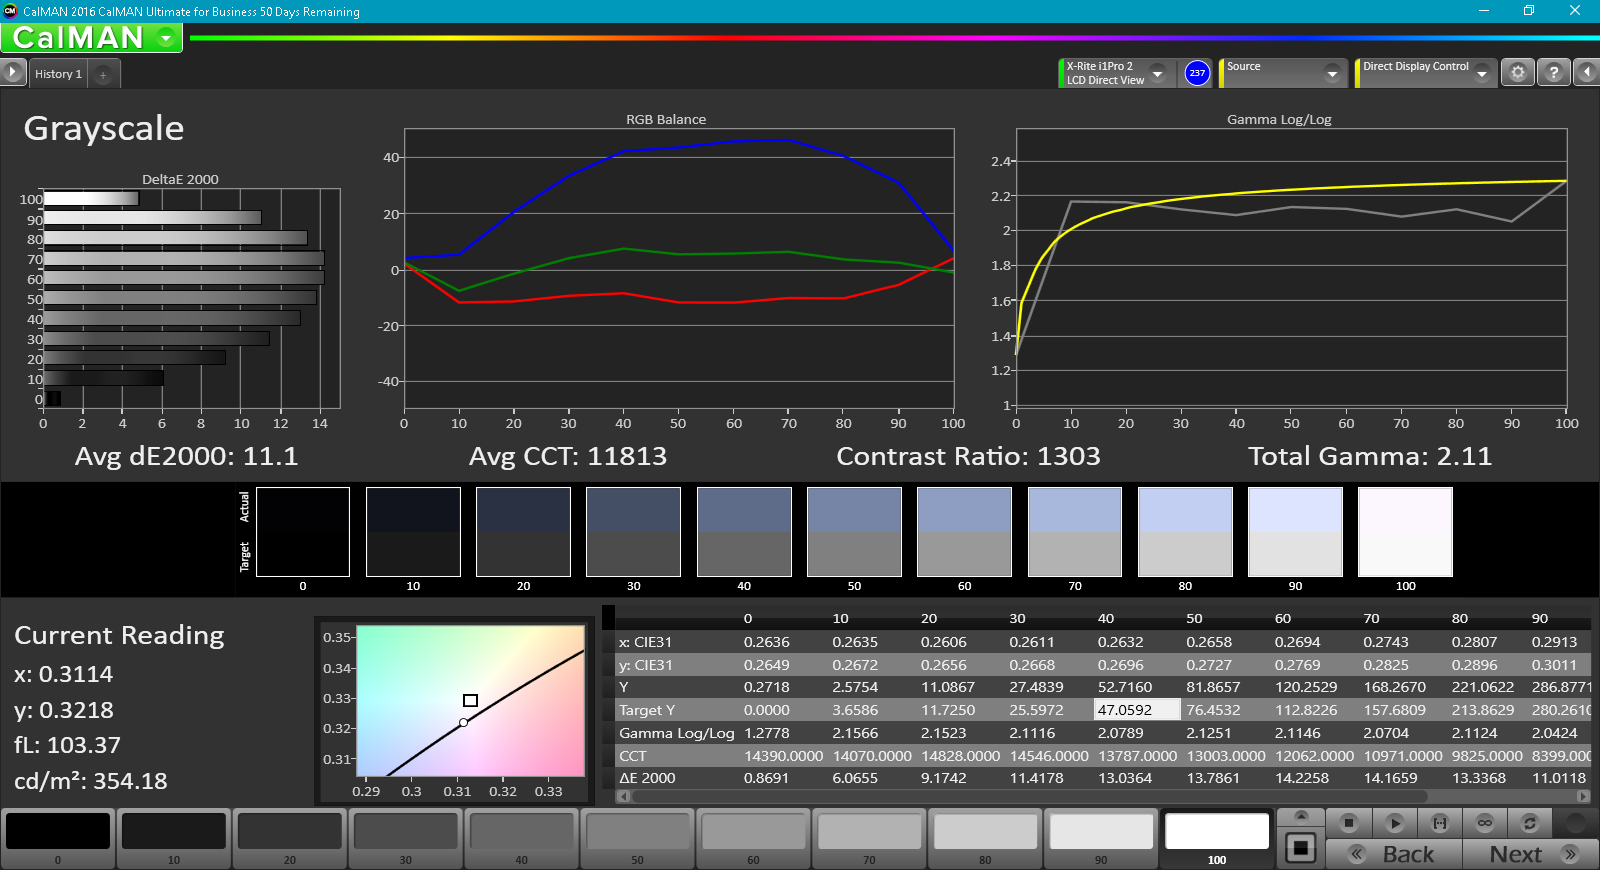
ΔE Greyscale Calman: 11.1 | ∀{0.09-98 Ø4.96}
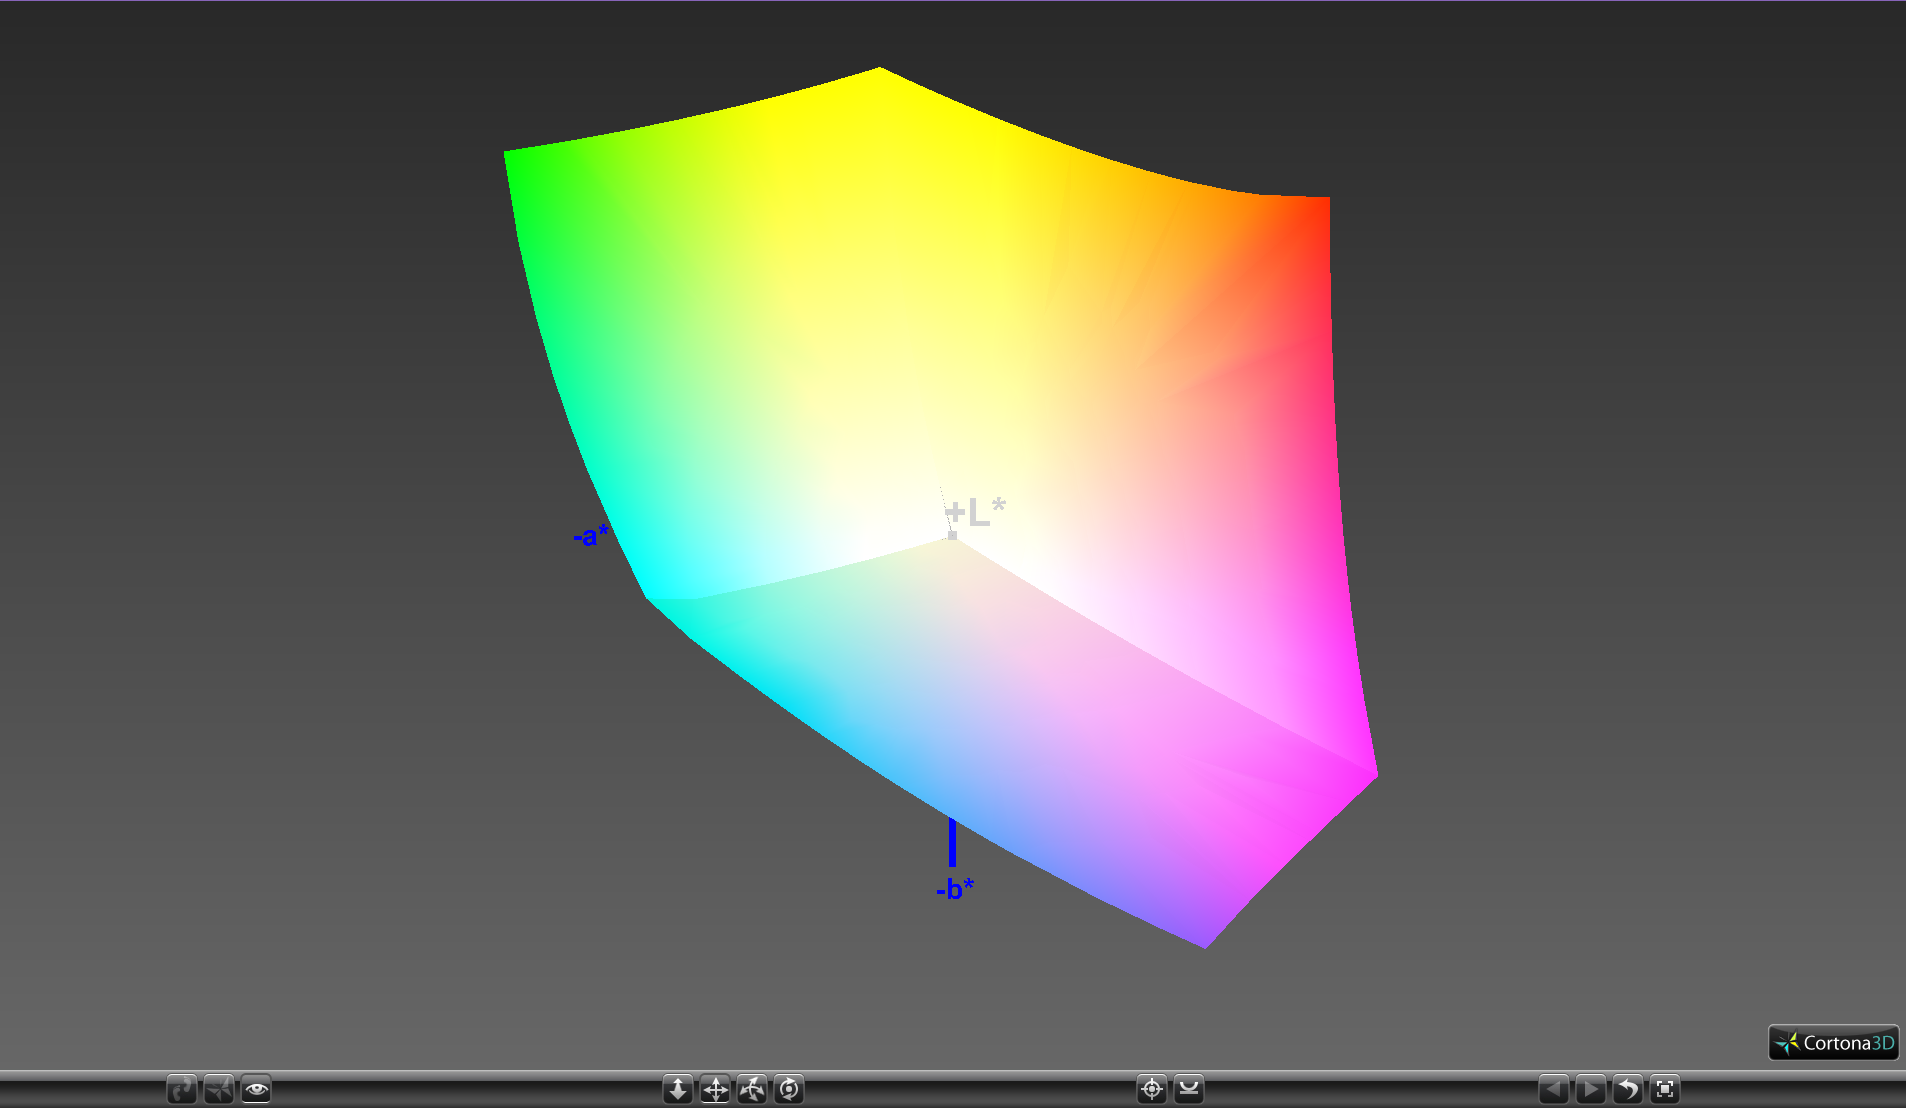
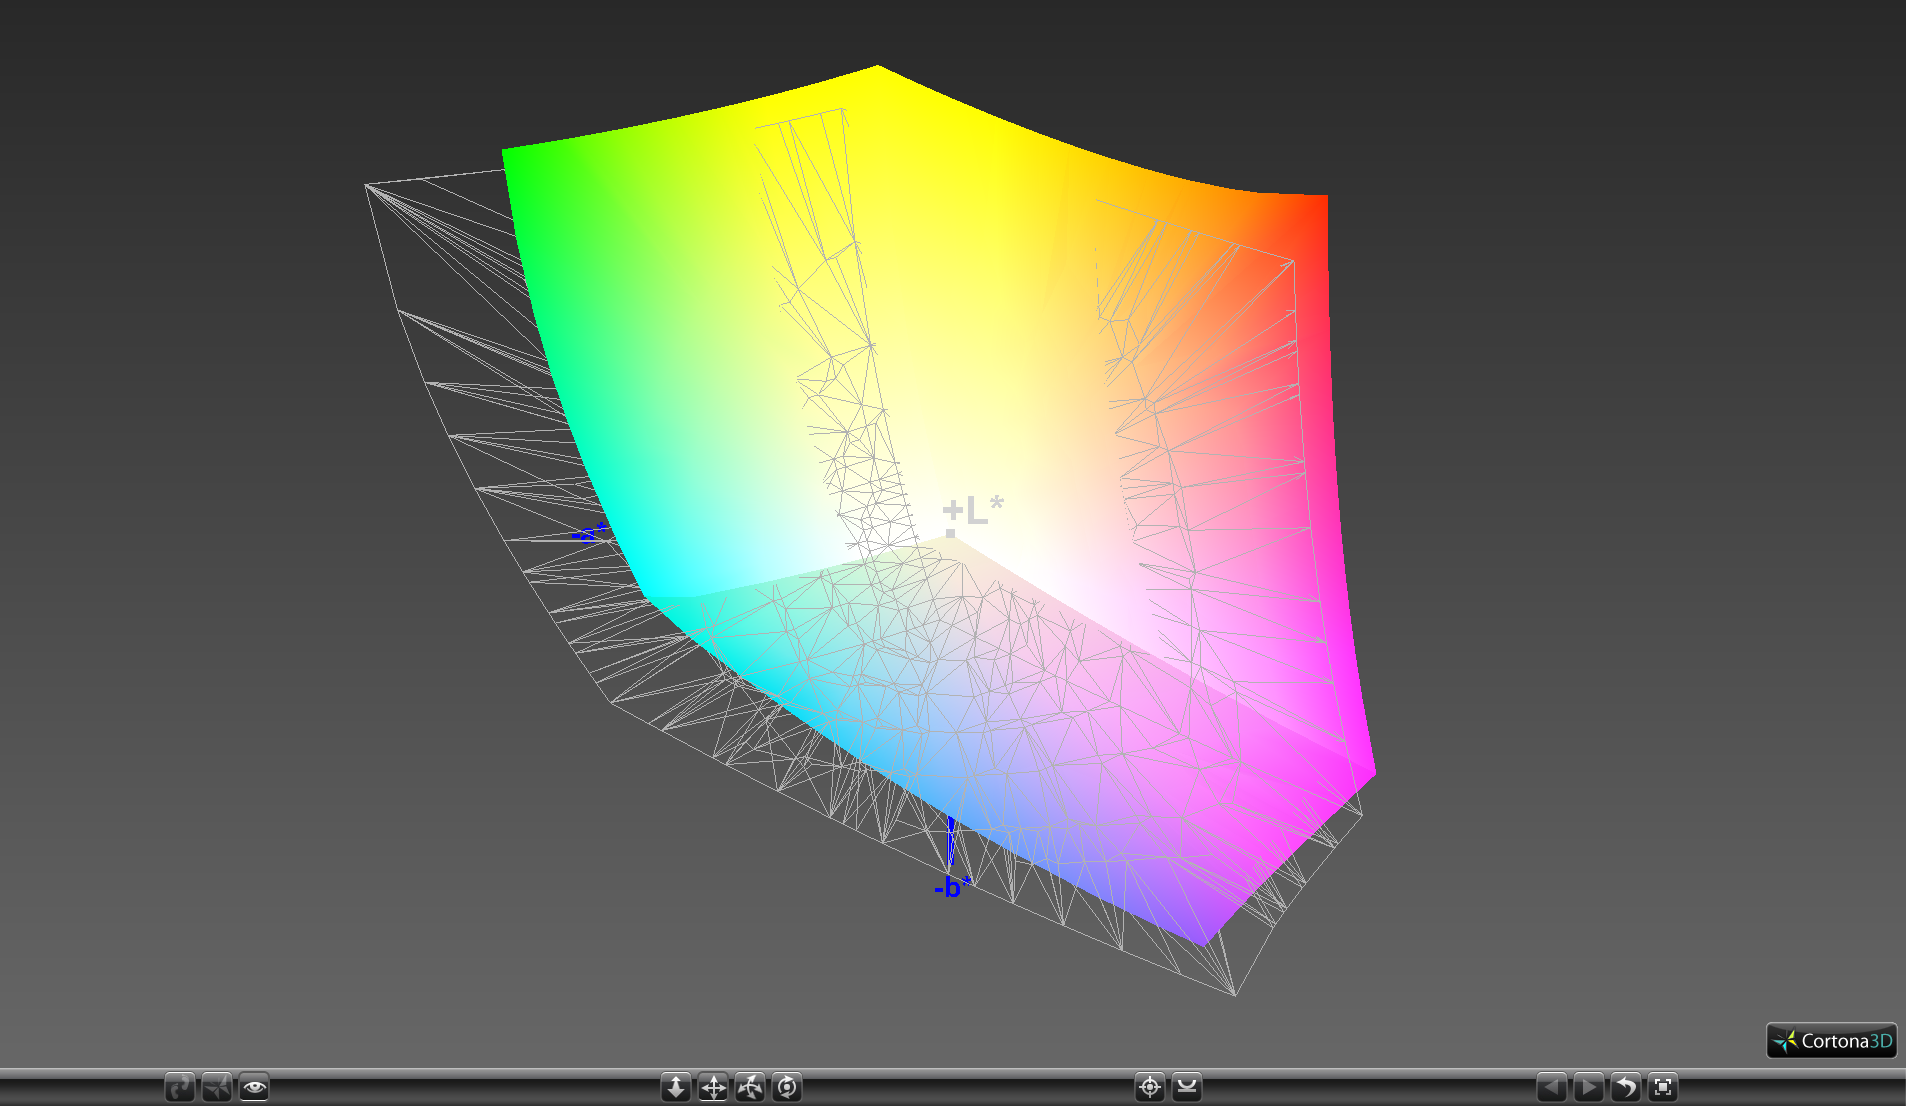
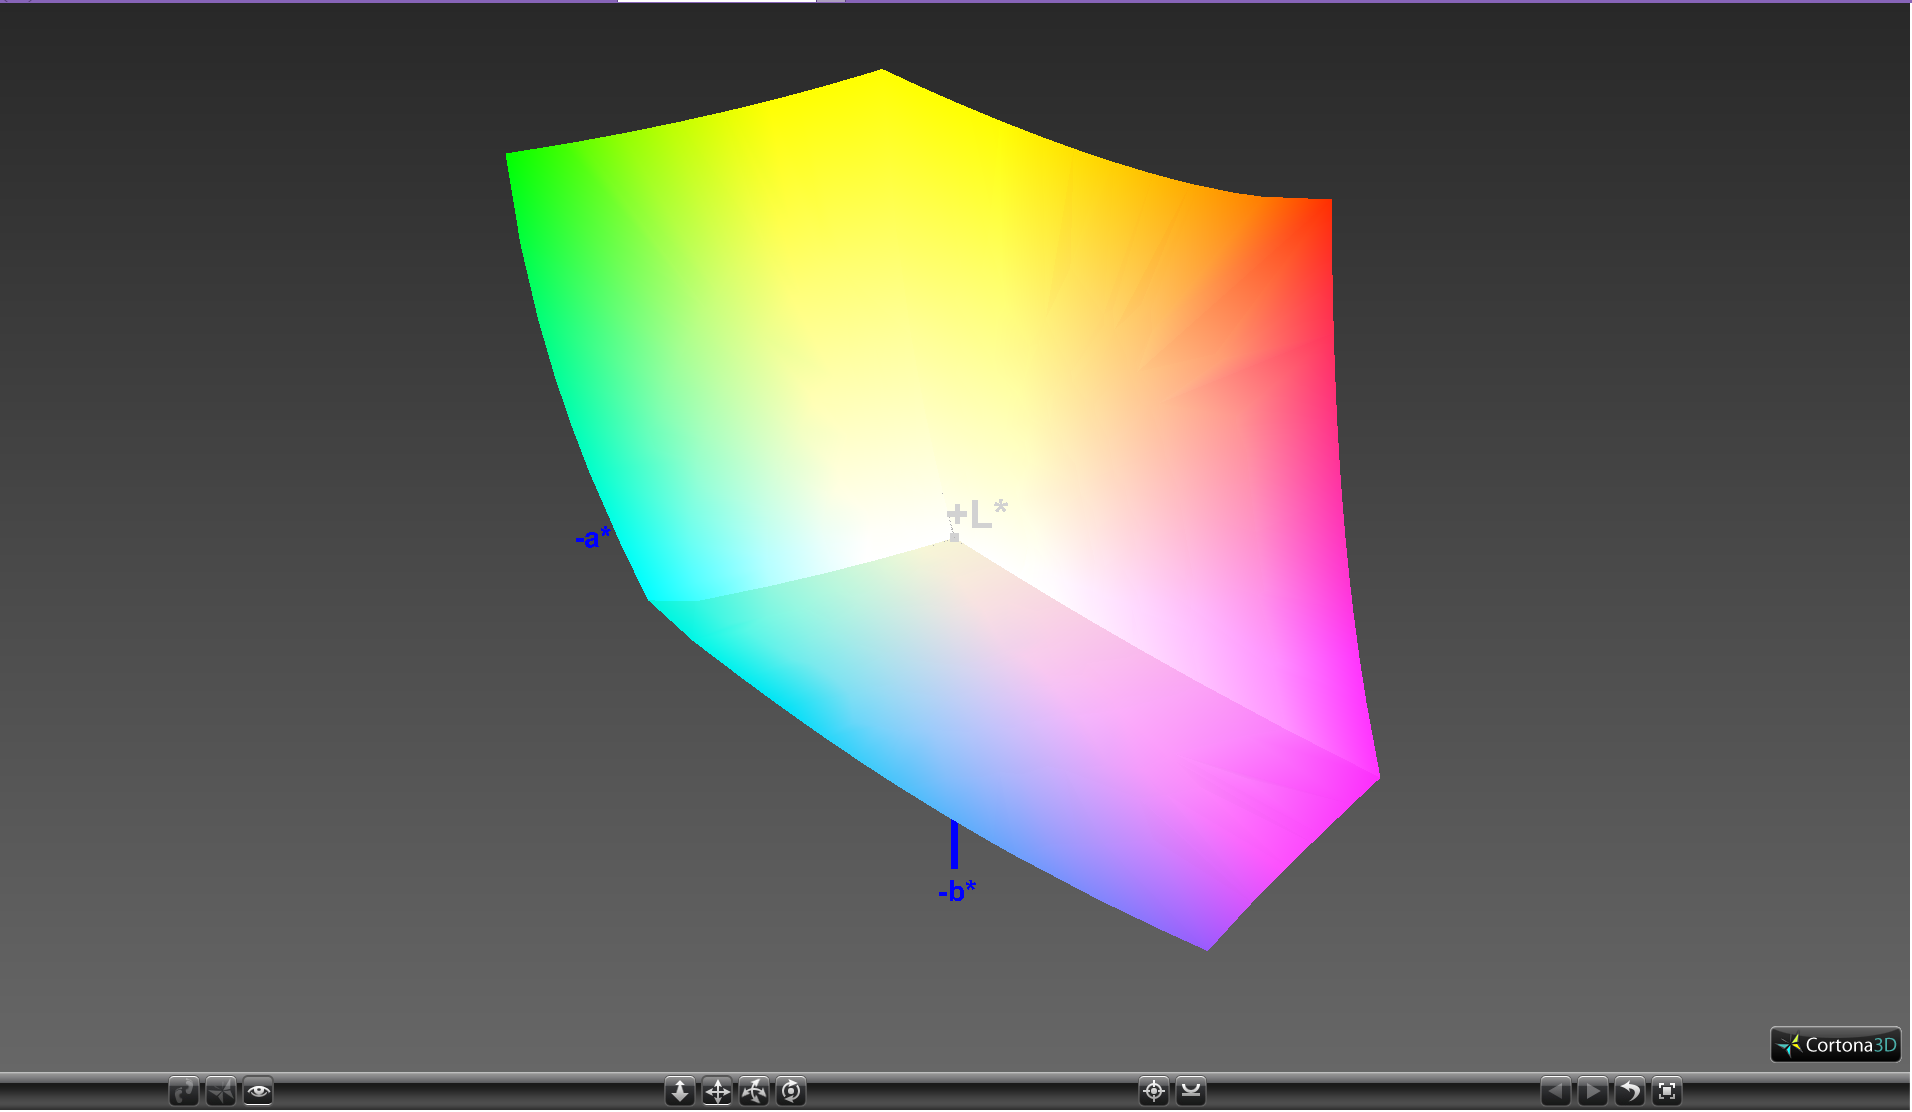
100% sRGB (Argyll 1.6.3 3D)
77.74% AdobeRGB 1998 (Argyll 1.6.3 3D)
86.9% AdobeRGB 1998 (Argyll 3D)
100% sRGB (Argyll 3D)
89.6% Display P3 (Argyll 3D)
Gamma: 2.11
CCT: 11813 K
| MSI GS73VR 7RG ID: CMN1747, Name: Chi Mei N173HHE-G32, TN LED, 17.3", 1920x1080 | Lenovo Legion Y920-17IKB LP173WF4-SPF5, IPS, 17.3", 1920x1080 | Aorus X7 v7 AU Optronics B173QTN01.4 (AUO1496), TN LED, 17.3", 2560x1440 | Gigabyte P57X v7 SHP145E, IPS, 17.3", 3840x2160 | EVGA SC17 GTX 1070 Sharp LQ173D1JW31, IPS, 17.3", 3840x2160 | |
|---|---|---|---|---|---|
| Display | -24% | -23% | 4% | 4% | |
| Display P3 Coverage (%) | 89.6 | 66.4 -26% | 63 -30% | 87.8 -2% | 87.3 -3% |
| sRGB Coverage (%) | 100 | 84 -16% | 87.1 -13% | 100 0% | 100 0% |
| AdobeRGB 1998 Coverage (%) | 86.9 | 61.4 -29% | 63.7 -27% | 98.9 14% | 98.8 14% |
| Response Times | -99% | 14% | -297% | -206% | |
| Response Time Grey 50% / Grey 80% * (ms) | 23.6 ? | 28.8 ? -22% | 24 ? -2% | 55.6 ? -136% | 45.6 ? -93% |
| Response Time Black / White * (ms) | 8.4 ? | 23.2 ? -176% | 6 ? 29% | 46.8 ? -457% | 35.2 ? -319% |
| PWM Frequency (Hz) | 26040 ? | 20000 | 1000 ? | 1042 ? | |
| Screen | 9% | -3% | 17% | 17% | |
| Brightness middle (cd/m²) | 350.9 | 422.3 20% | 375 7% | 441.3 26% | 399.1 14% |
| Brightness (cd/m²) | 311 | 378 22% | 353 14% | 408 31% | 360 16% |
| Brightness Distribution (%) | 79 | 81 3% | 85 8% | 86 9% | 81 3% |
| Black Level * (cd/m²) | 0.33 | 0.48 -45% | 0.58 -76% | 0.44 -33% | 0.4 -21% |
| Contrast (:1) | 1063 | 880 -17% | 647 -39% | 1003 -6% | 998 -6% |
| Colorchecker dE 2000 * | 7.7 | 4.4 43% | 6.06 21% | 5.1 34% | 4.78 38% |
| Colorchecker dE 2000 max. * | 14.4 | 9.2 36% | 10.54 27% | 9.8 32% | 7.65 47% |
| Greyscale dE 2000 * | 11.1 | 2.8 75% | 5.68 49% | 4.3 61% | 3.8 66% |
| Gamma | 2.11 104% | 2.22 99% | 2.3 96% | 2.08 106% | 2.03 108% |
| CCT | 11813 55% | 6403 102% | 7998 81% | 7345 88% | 7288 89% |
| Color Space (Percent of AdobeRGB 1998) (%) | 77.74 | 55 -29% | 57 -27% | 87 12% | 86.9 12% |
| Color Space (Percent of sRGB) (%) | 100 | 84 -16% | 87 -13% | 100 0% | 100 0% |
| Total Average (Program / Settings) | -38% /
-12% | -4% /
-5% | -92% /
-28% | -62% /
-15% |
* ... smaller is better
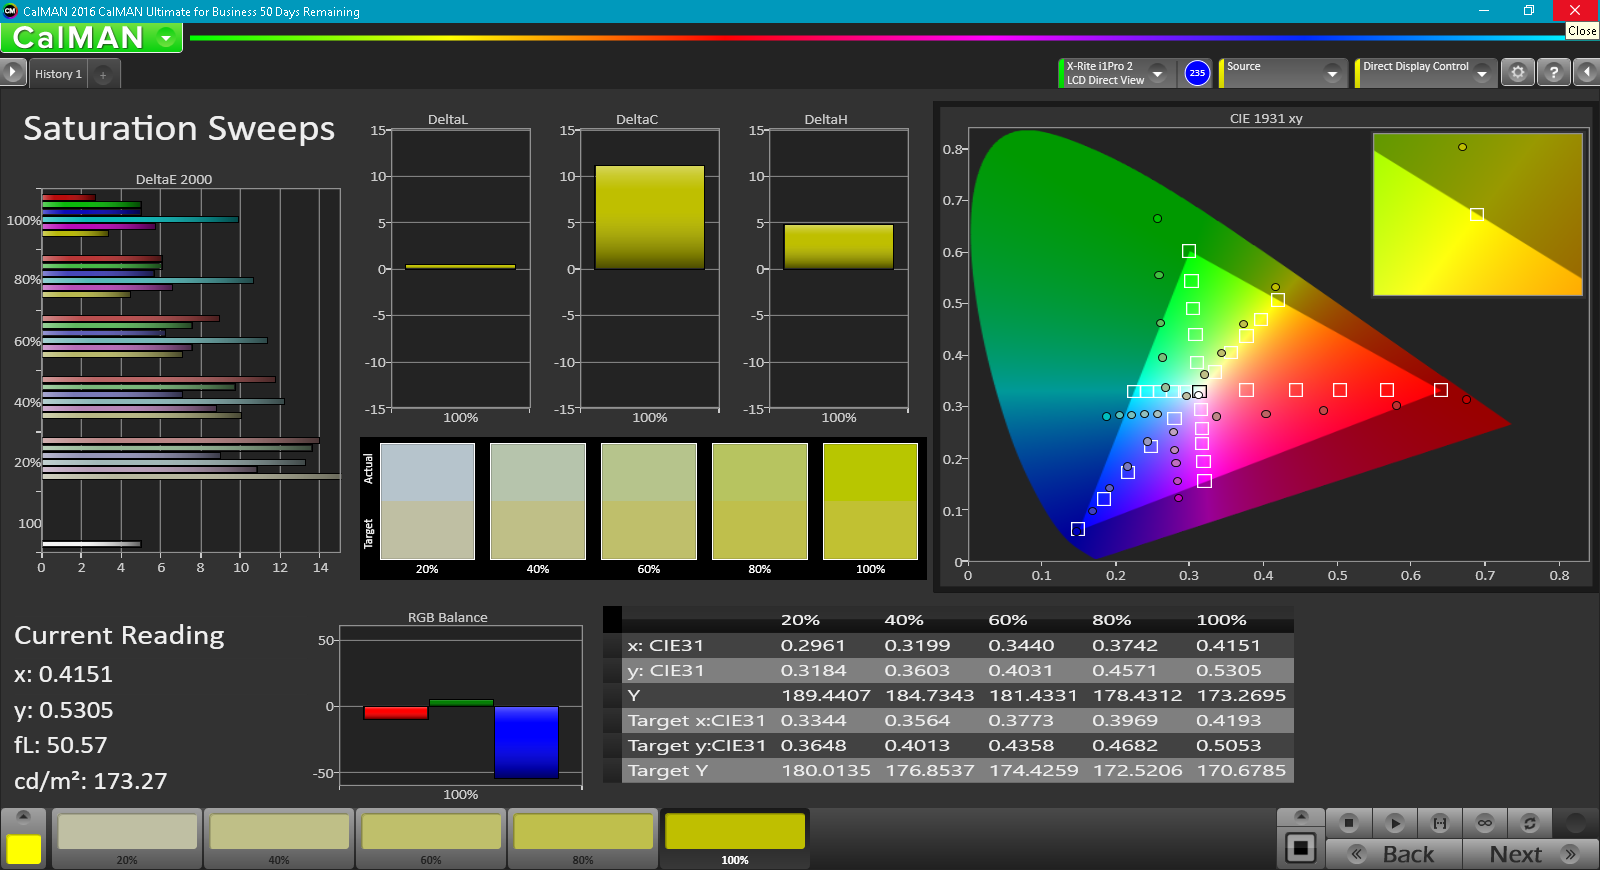
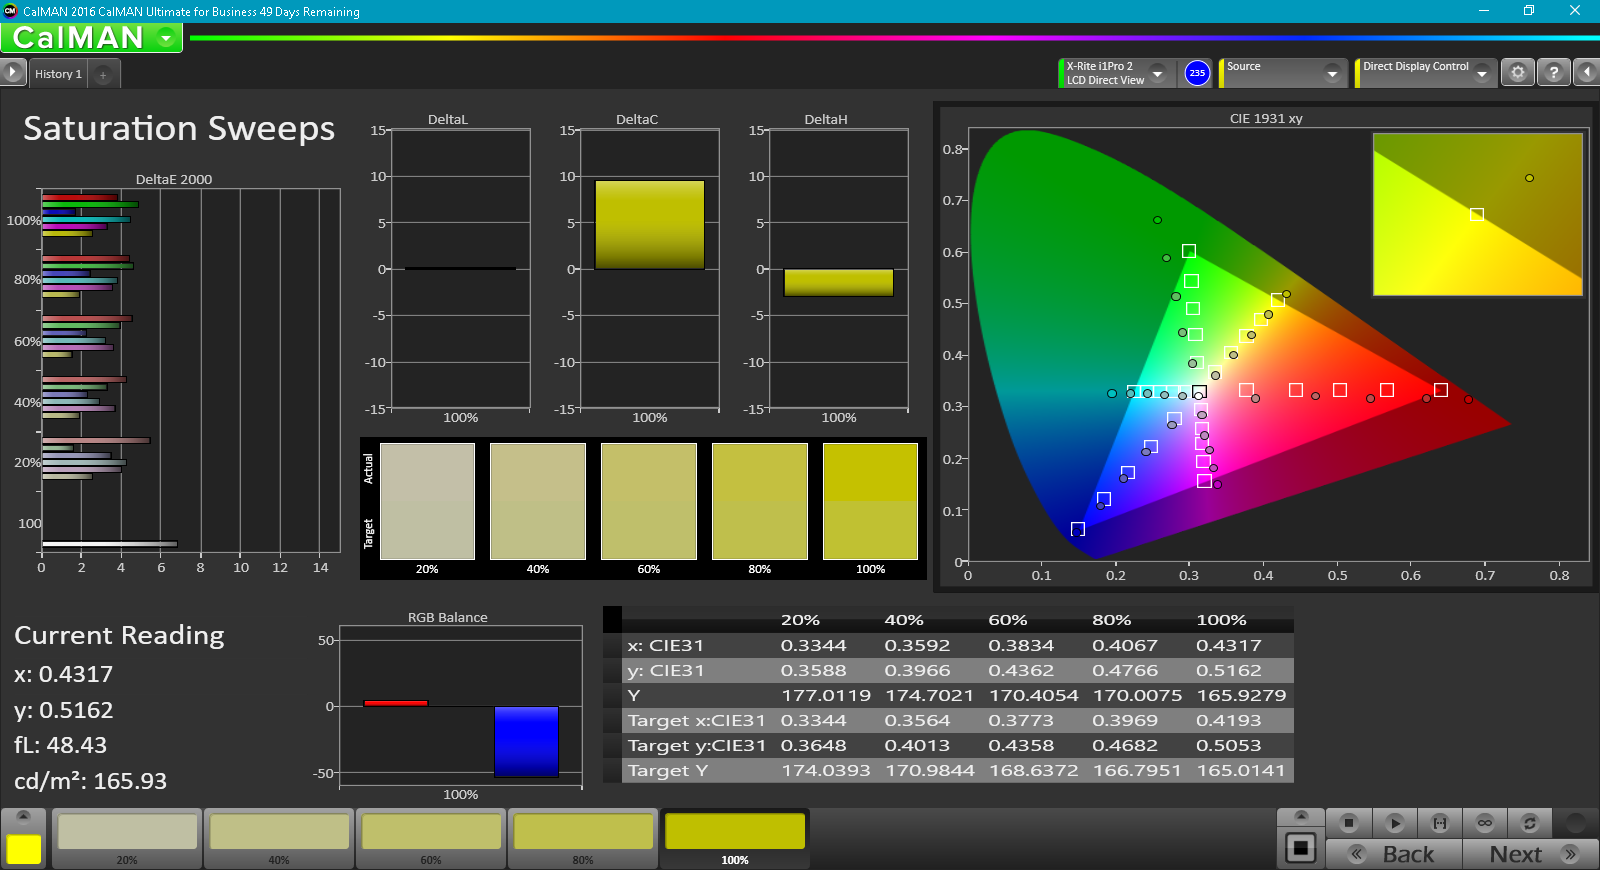
Color space extends beyond the full sRGB standard and roughly 78 percent of the wider AdobeRGB standard. The 4K UHD panels on the Gigabyte P57X and EVGA SC17 have even wider color spaces than our MSI, but their response times are significantly slower for more noticeable ghosting when gaming. Nonetheless, the full sRGB gamut is more than sufficient for gaming purposes and can potentially satisfy graphic artists.
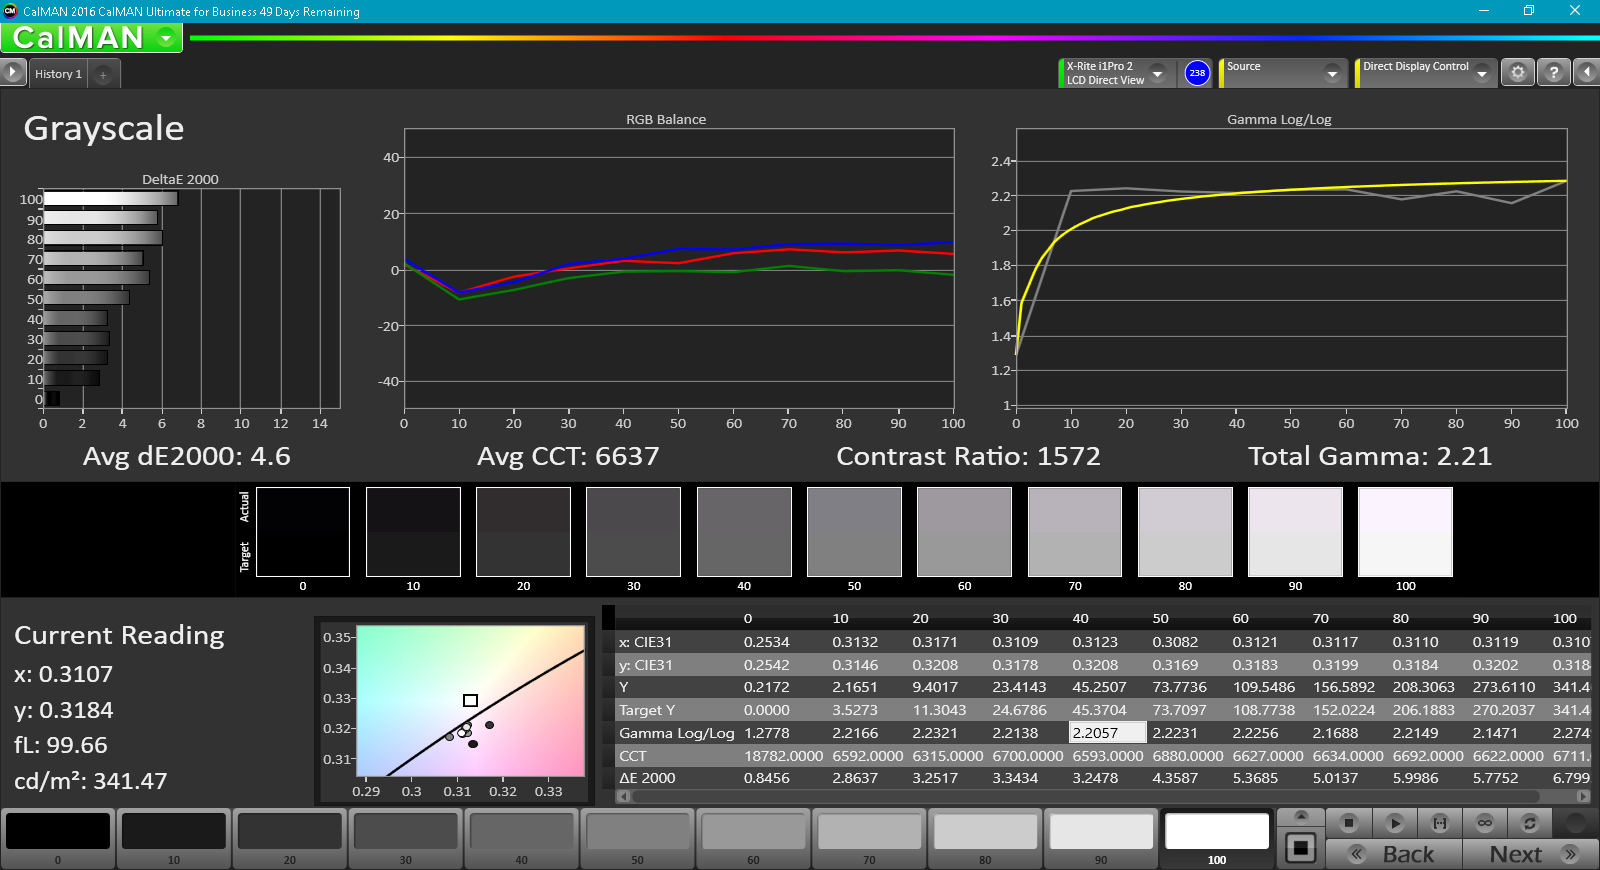
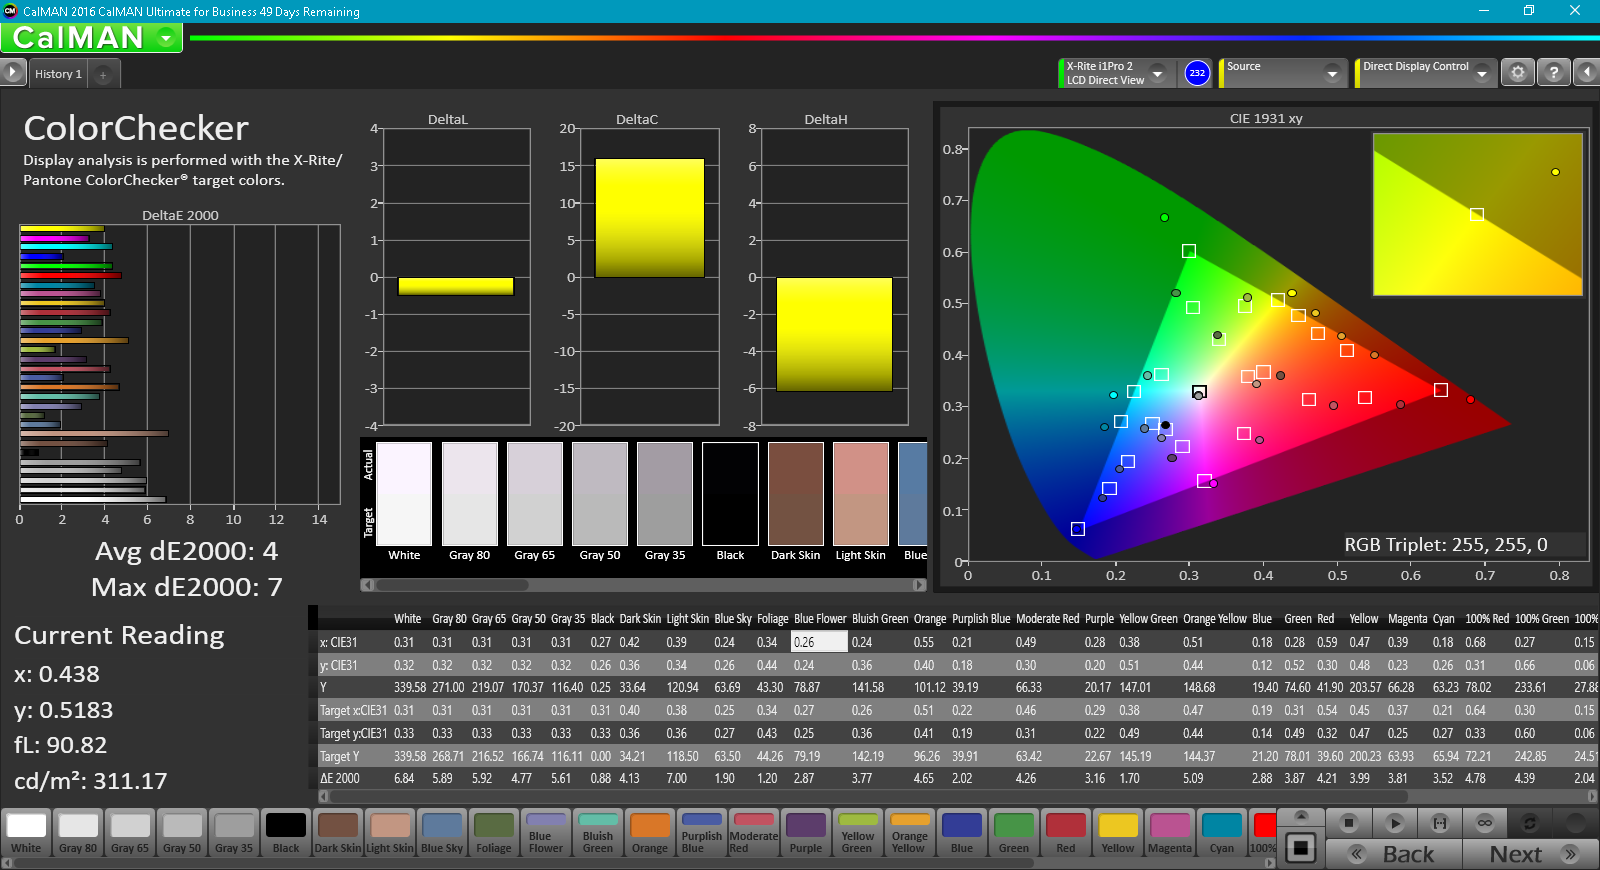
Further measurements with an X-Rite spectrophotometer reveal an overly cool color temperature and subsequently more inaccurate grayscale and colors than what one would expect from a high quality TN panel. Gigabyte has been addressing this issue directly by pre-calibrating each and every one of its Aero notebooks before shipping and we're hoping that MSI will take a similar approach sometime in the future. Until then, we recommend applying our ICC profile above for a viewing experience closer to the sRGB standard. Additional fine-tuning may be necessary in order to bring grayscale and colors to lower deltaE values.
Display Response Times
| ↔ Response Time Black to White | ||
|---|---|---|
| 8.4 ms ... rise ↗ and fall ↘ combined | ↗ 6 ms rise | 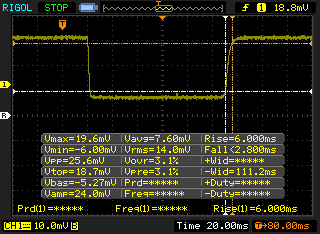 |
| ↘ 2.4 ms fall | ||
| The screen shows fast response rates in our tests and should be suited for gaming. In comparison, all tested devices range from 0.1 (minimum) to 240 (maximum) ms. » 24 % of all devices are better. This means that the measured response time is better than the average of all tested devices (19.8 ms). | ||
| ↔ Response Time 50% Grey to 80% Grey | ||
| 23.6 ms ... rise ↗ and fall ↘ combined | ↗ 13.6 ms rise |  |
| ↘ 10 ms fall | ||
| The screen shows good response rates in our tests, but may be too slow for competitive gamers. In comparison, all tested devices range from 0.165 (minimum) to 636 (maximum) ms. » 34 % of all devices are better. This means that the measured response time is better than the average of all tested devices (31 ms). | ||
Screen Flickering / PWM (Pulse-Width Modulation)
| Screen flickering / PWM detected | 26040 Hz | ≤ 10 % brightness setting | 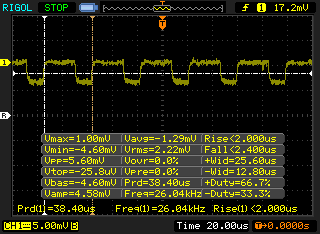 |
The display backlight flickers at 26040 Hz (worst case, e.g., utilizing PWM) Flickering detected at a brightness setting of 10 % and below. There should be no flickering or PWM above this brightness setting. The frequency of 26040 Hz is quite high, so most users sensitive to PWM should not notice any flickering. In comparison: 52 % of all tested devices do not use PWM to dim the display. If PWM was detected, an average of 7757 (minimum: 5 - maximum: 343500) Hz was measured. | |||
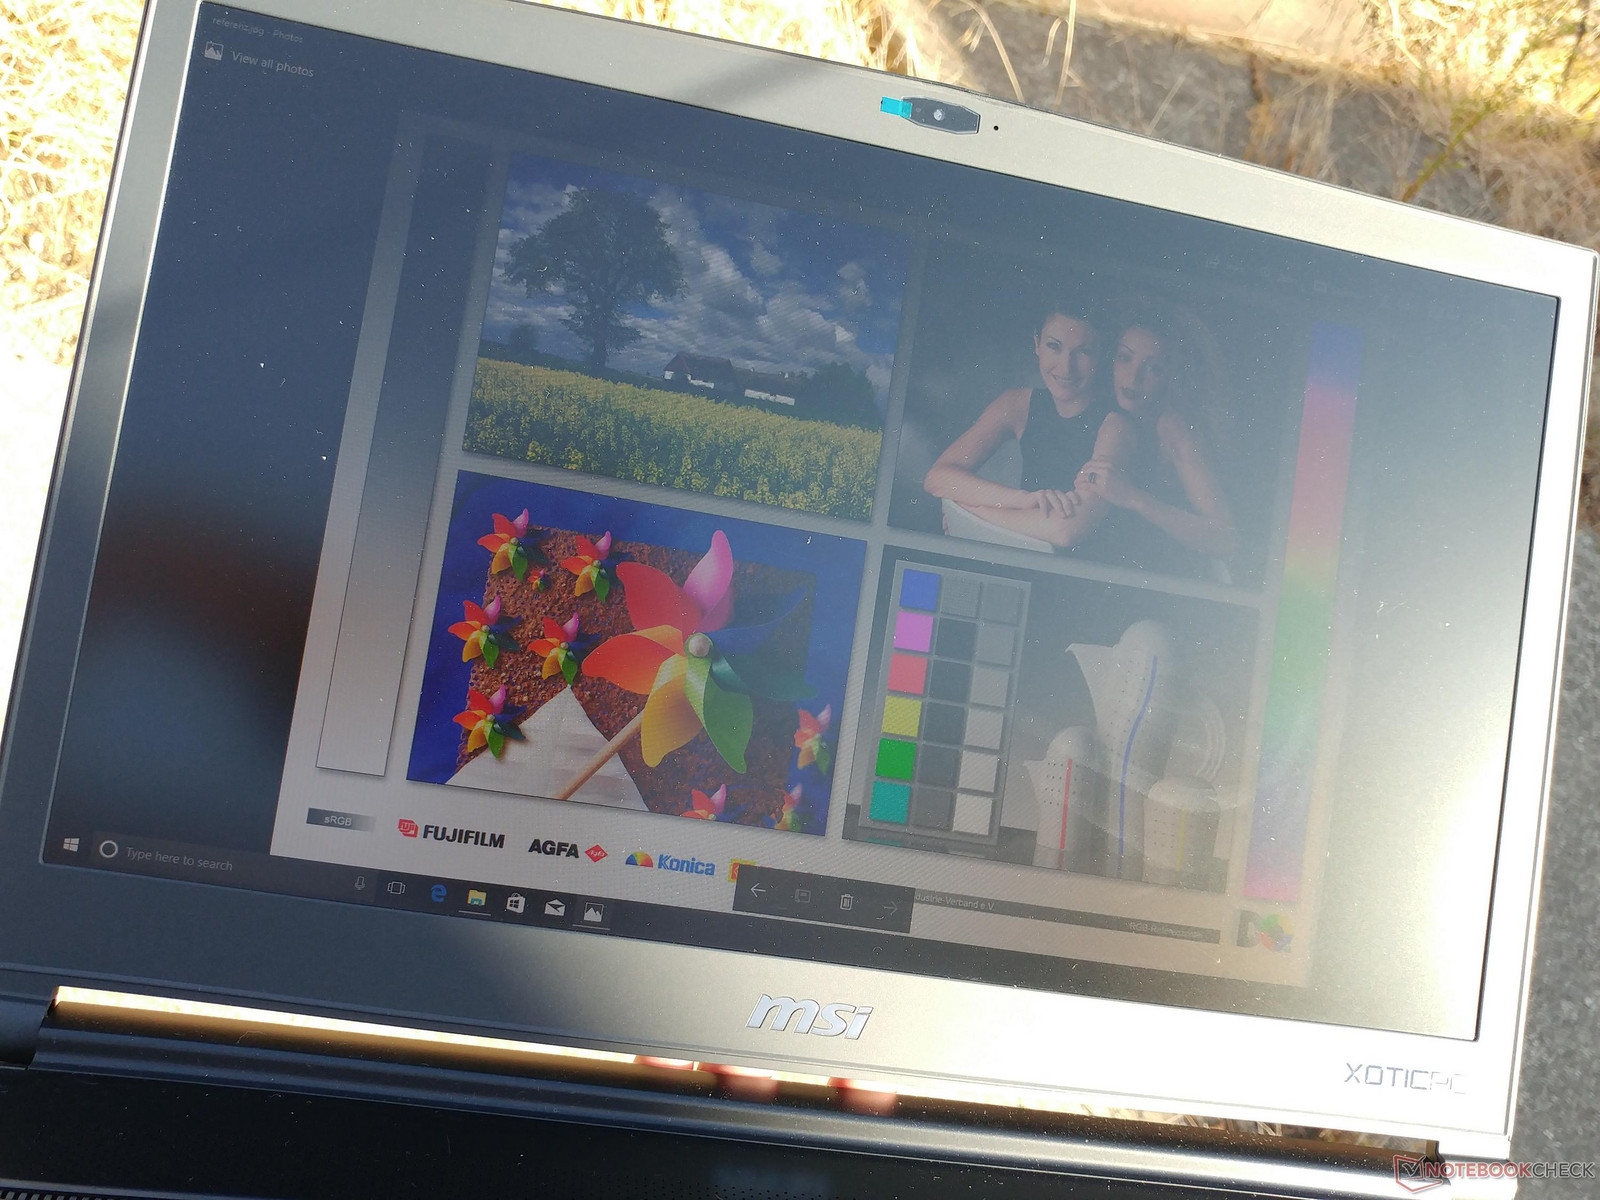
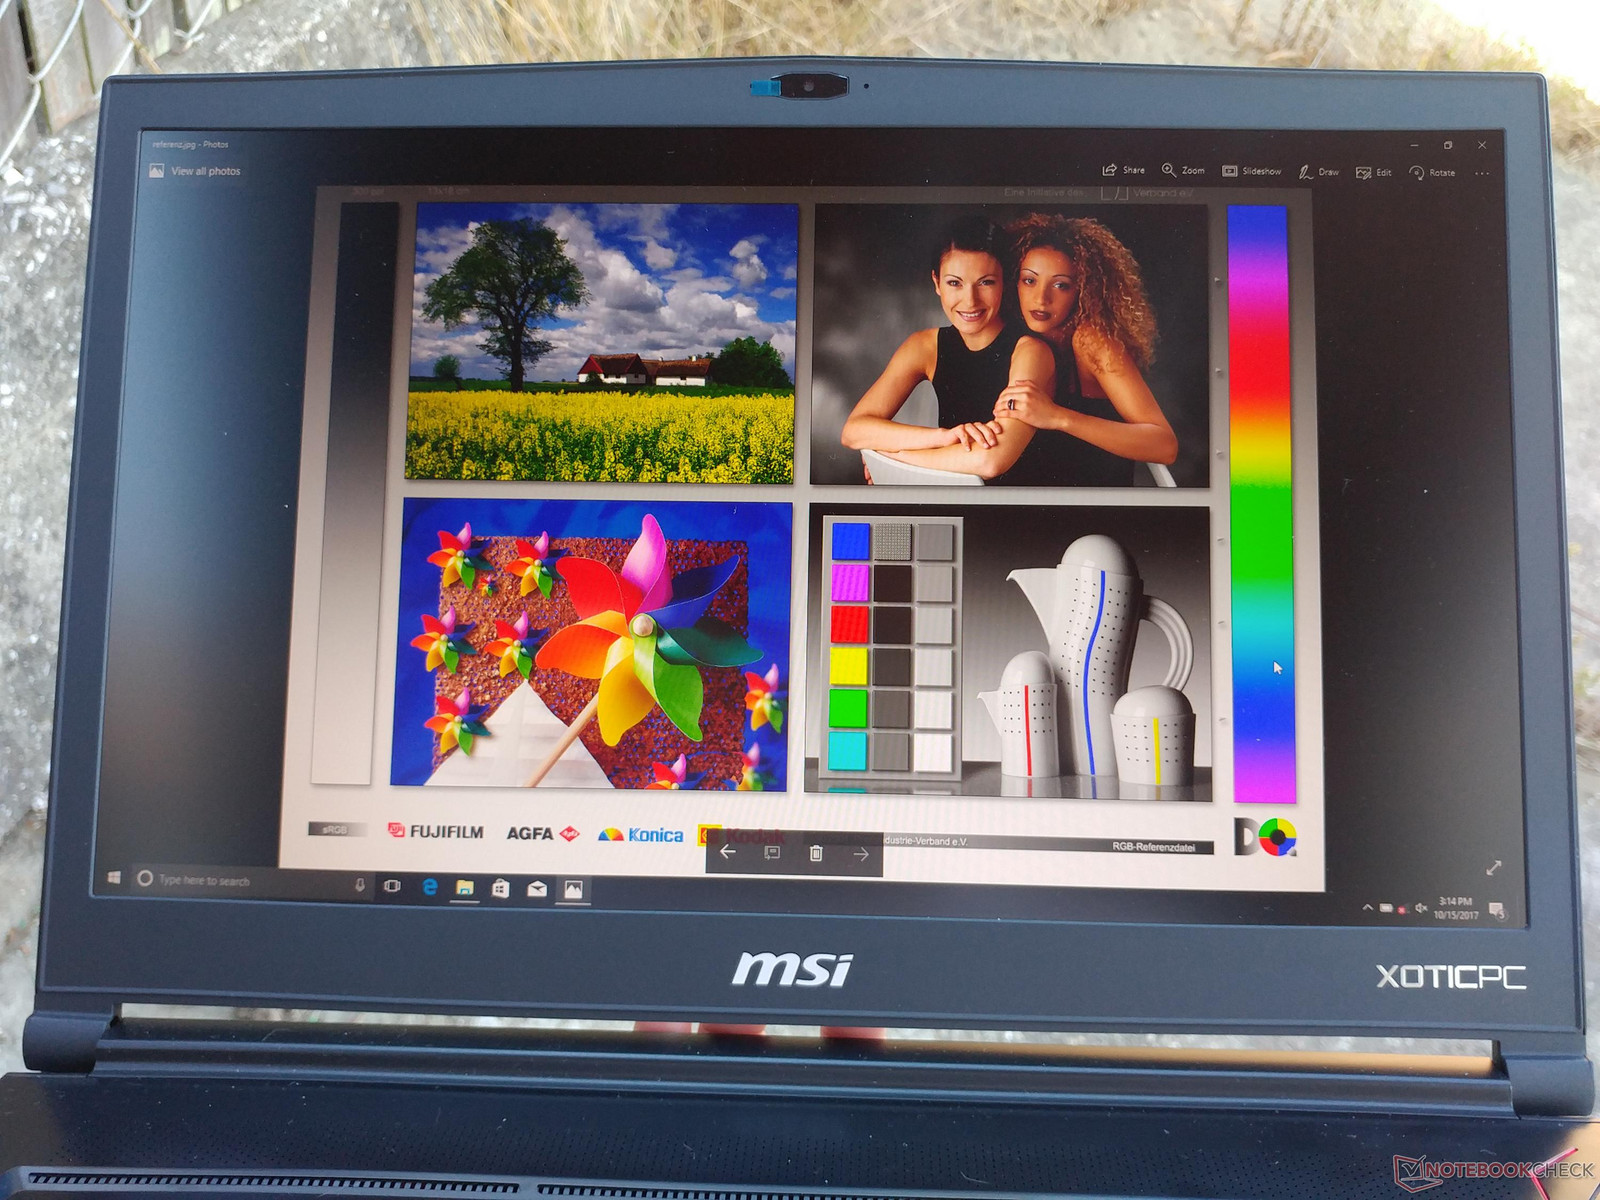
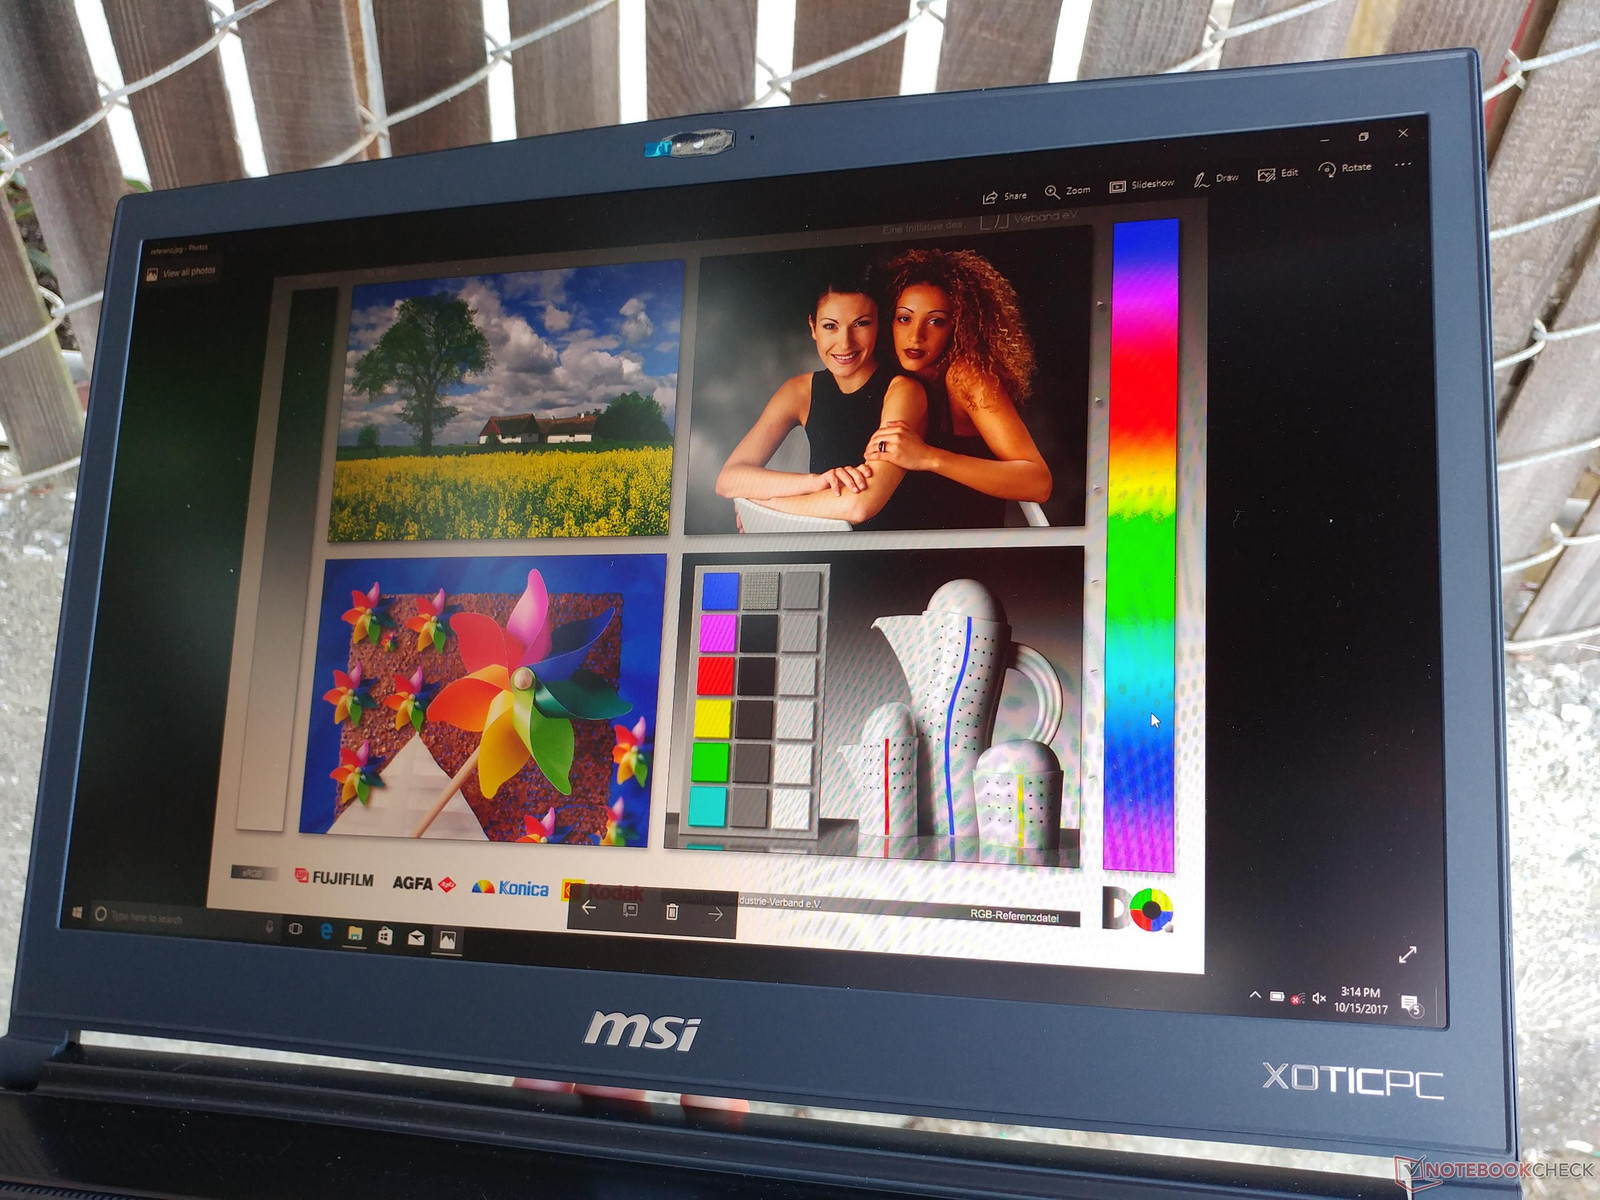
Outdoor visibility is decent if under shade and on the maximum brightness setting. The matte panel, high contrast ratio, and deep colors help to reduce glare. Brighter ambient conditions like direct sunlight or an overcast sky will instantly wash out onscreen content. Even though the GS73VR is one of the thinnest gaming notebooks available, competing models like the Gigabyte P57X have brighter display backlights and wider IPS viewing angles for better visibility.
Performance
There are no other CPU or GPU options other than what is included in this configuration. Interestingly, MSI has dropped the 4K UHD panel from last year's GS73VR in favor of two 120 Hz options with faster 3 ms or 5 ms response times. It's an understandable change given that 17-inch 120 Hz 4K panels with similar response time options are very limited in supply. Native 4K gaming on a GPU slower than a "true" GTX 1070 is also a tough sell for the target enthusiast gaming crowd.
Optimus is included for switching to the integrated HD Graphics 630 and G-Sync is consequently not supported on the internal display.
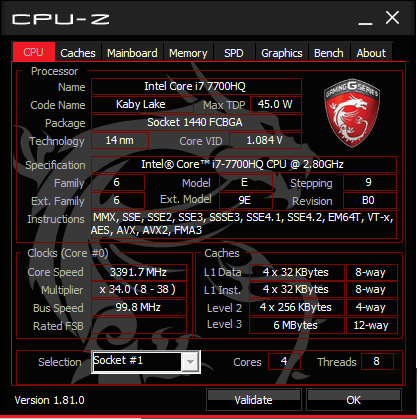
Processor
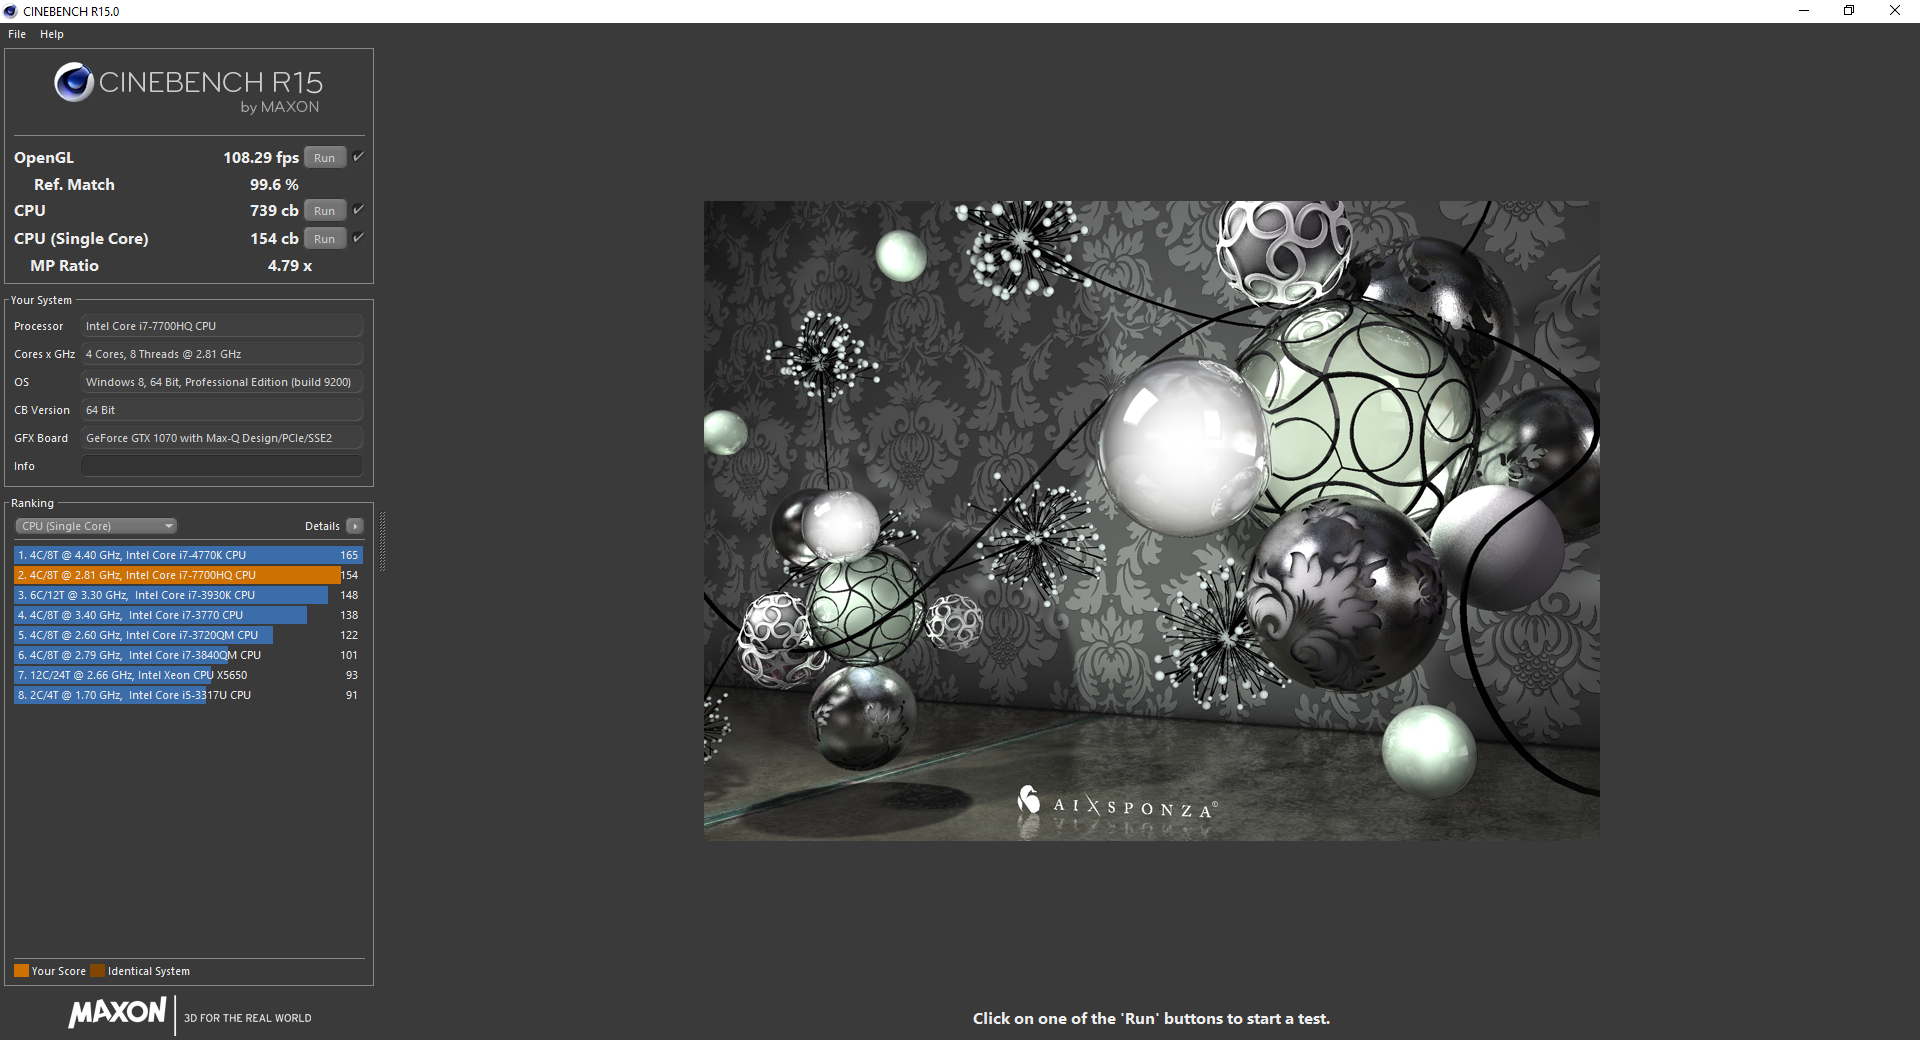
The common i7-7700HQ holds no surprises that we haven't already seen on other mainstream to high-end gaming notebooks. Raw performance is only marginally faster than the older generation Skylake i7-6700HQ or Broadwell i7-5700HQ to the point where most gamers will not notice any obvious benefits. The recent Coffee Lake i7-8700K provides a notable 90 percent boost in multi-thread performance due to its hexa-core design and we should hopefully see something similar come to the notebook gaming space once a proper successor to the i7-7700HQ becomes available.
Consistent CPU performance is essential for any gaming notebook. Thankfully, running CineBench Multi-Thread in a loop results in steady scores over time with no notable dips unlike on our older GS63VR sample. However, core temperature will plateau at a very warm 94 C as shown in our Stress Test section below. This is very close to hitting a temperature ceiling and initiating automatic throttling to prevent damaging the processor. It's imperative that users do not block any of the numerous ventilation grilles surrounding the notebook for the fans to operate efficiently.
See our dedicated Core i7-7700HQ CPU page for more technical information and benchmark comparisons.
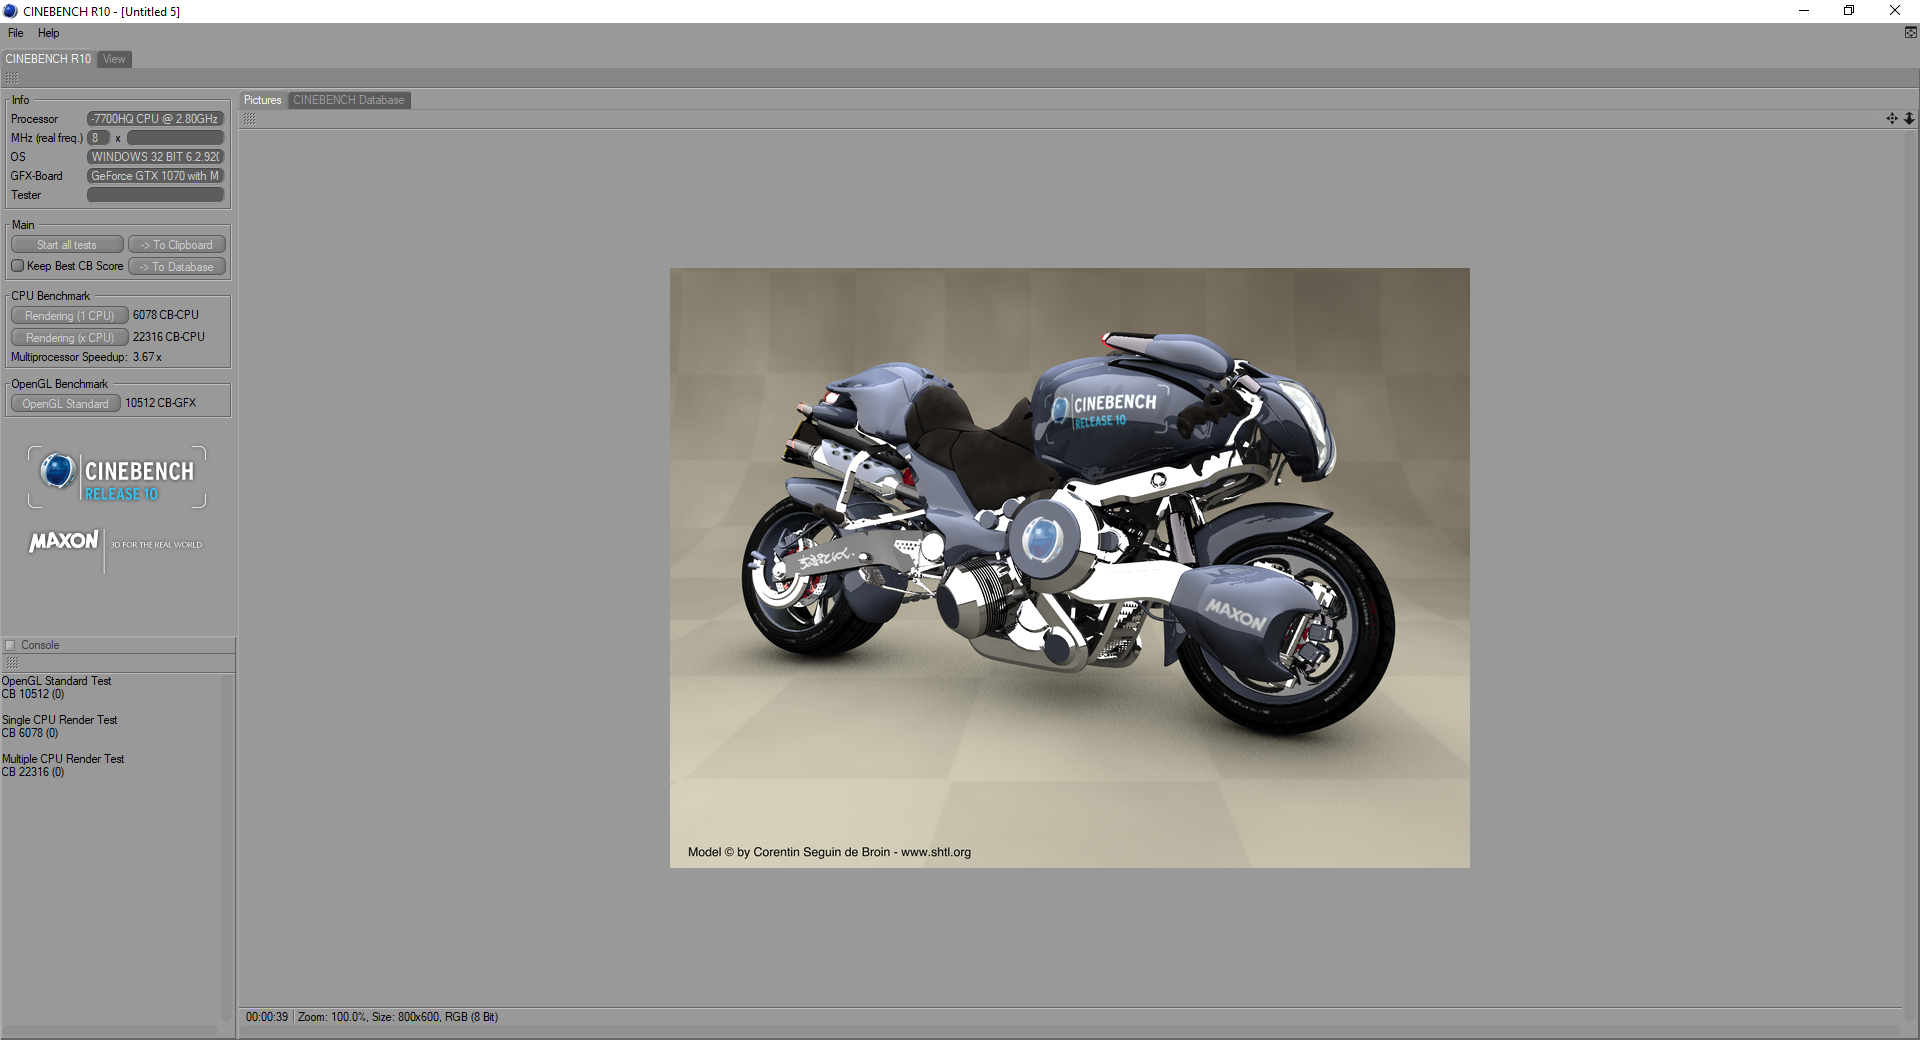
| Cinebench R10 | |
| Rendering Multiple CPUs 32Bit | |
| no name | |
| Coffee Lake: i7-8700K and i5-8400 Review | |
| Eurocom Tornado F5 | |
| MSI GS73VR 7RG | |
| Asus Zephyrus GX501VS | |
| MSI GT80 Titan SLI | |
| Razer Blade (2016) FHD | |
| Asus GL552JX-CN154H | |
| Rendering Single 32Bit | |
| no name | |
| Eurocom Tornado F5 | |
| Coffee Lake: i7-8700K and i5-8400 Review | |
| MSI GS73VR 7RG | |
| Asus Zephyrus GX501VS | |
| MSI GT80 Titan SLI | |
| Razer Blade (2016) FHD | |
| Asus GL552JX-CN154H | |
| wPrime 2.10 - 1024m | |
| Asus Zephyrus GX501VS | |
| MSI GS73VR 7RG | |
| Coffee Lake: i7-8700K and i5-8400 Review | |
| Eurocom Tornado F5 | |
| no name | |
* ... smaller is better
System Performance
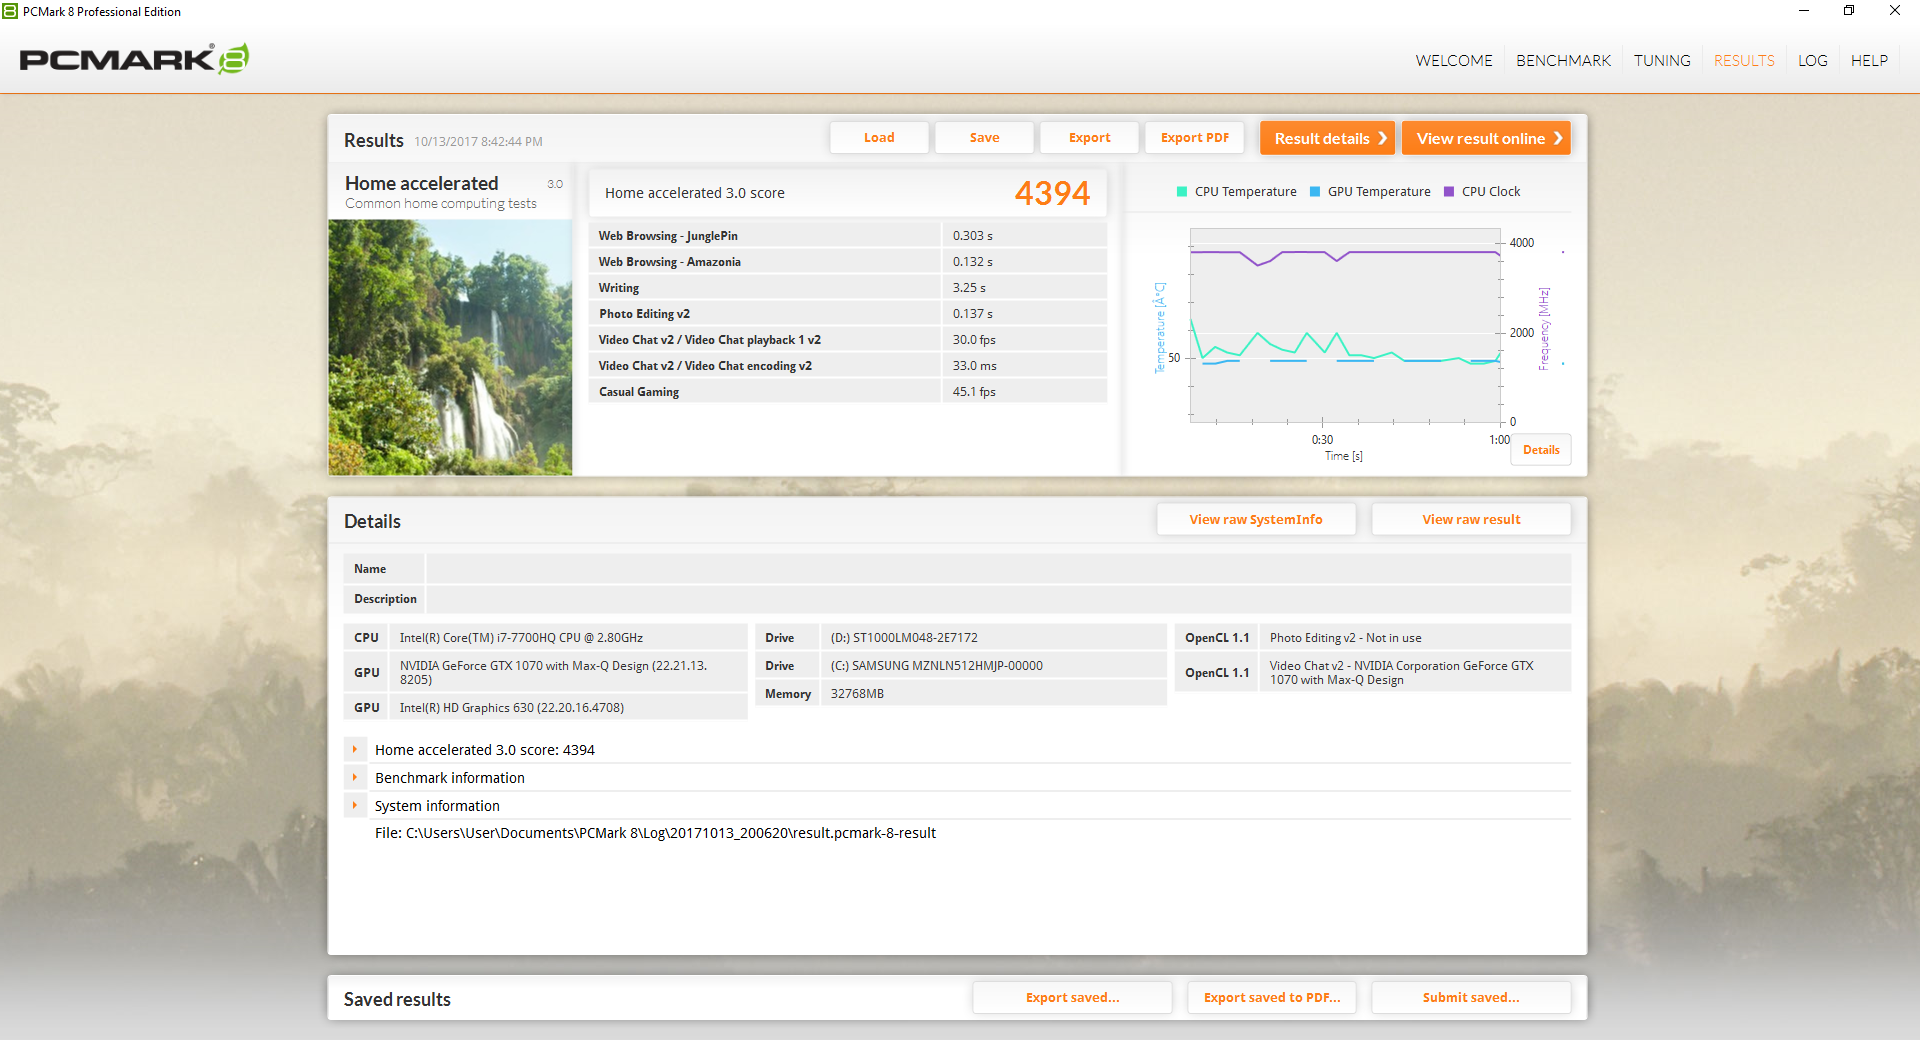
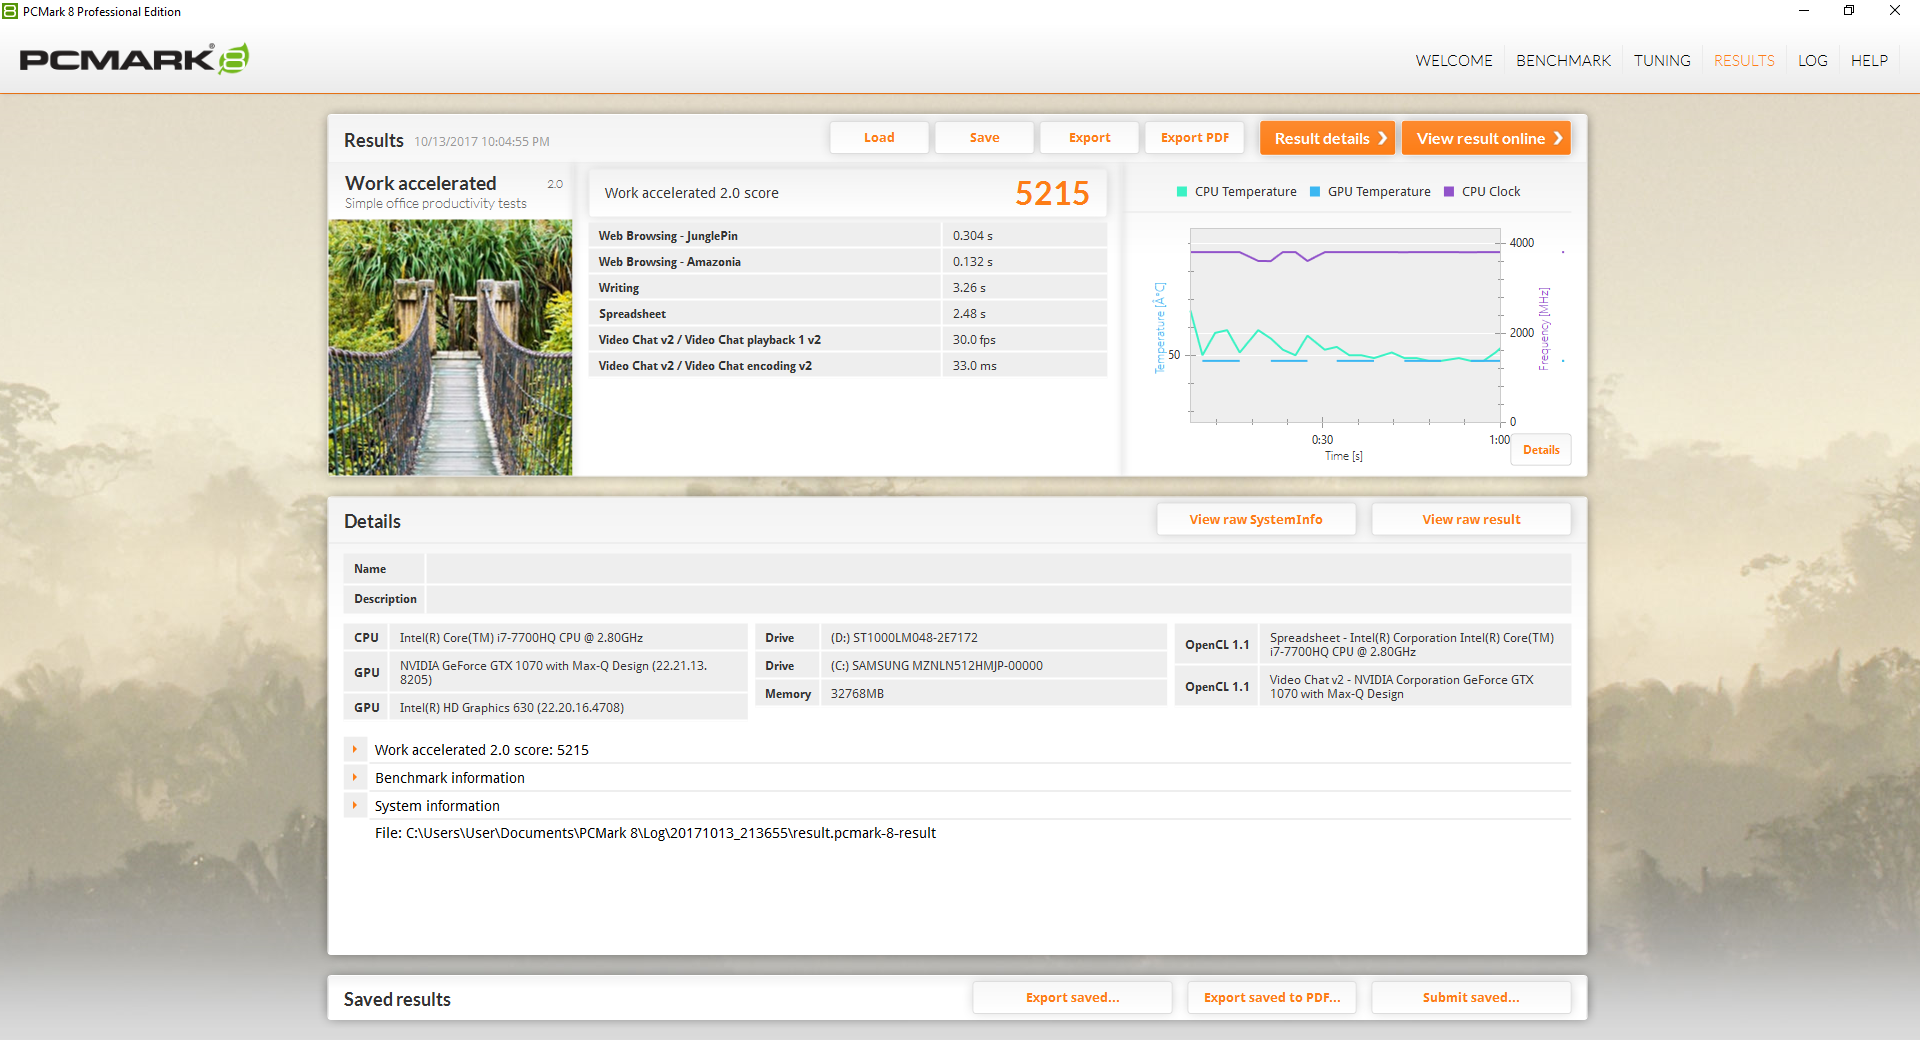
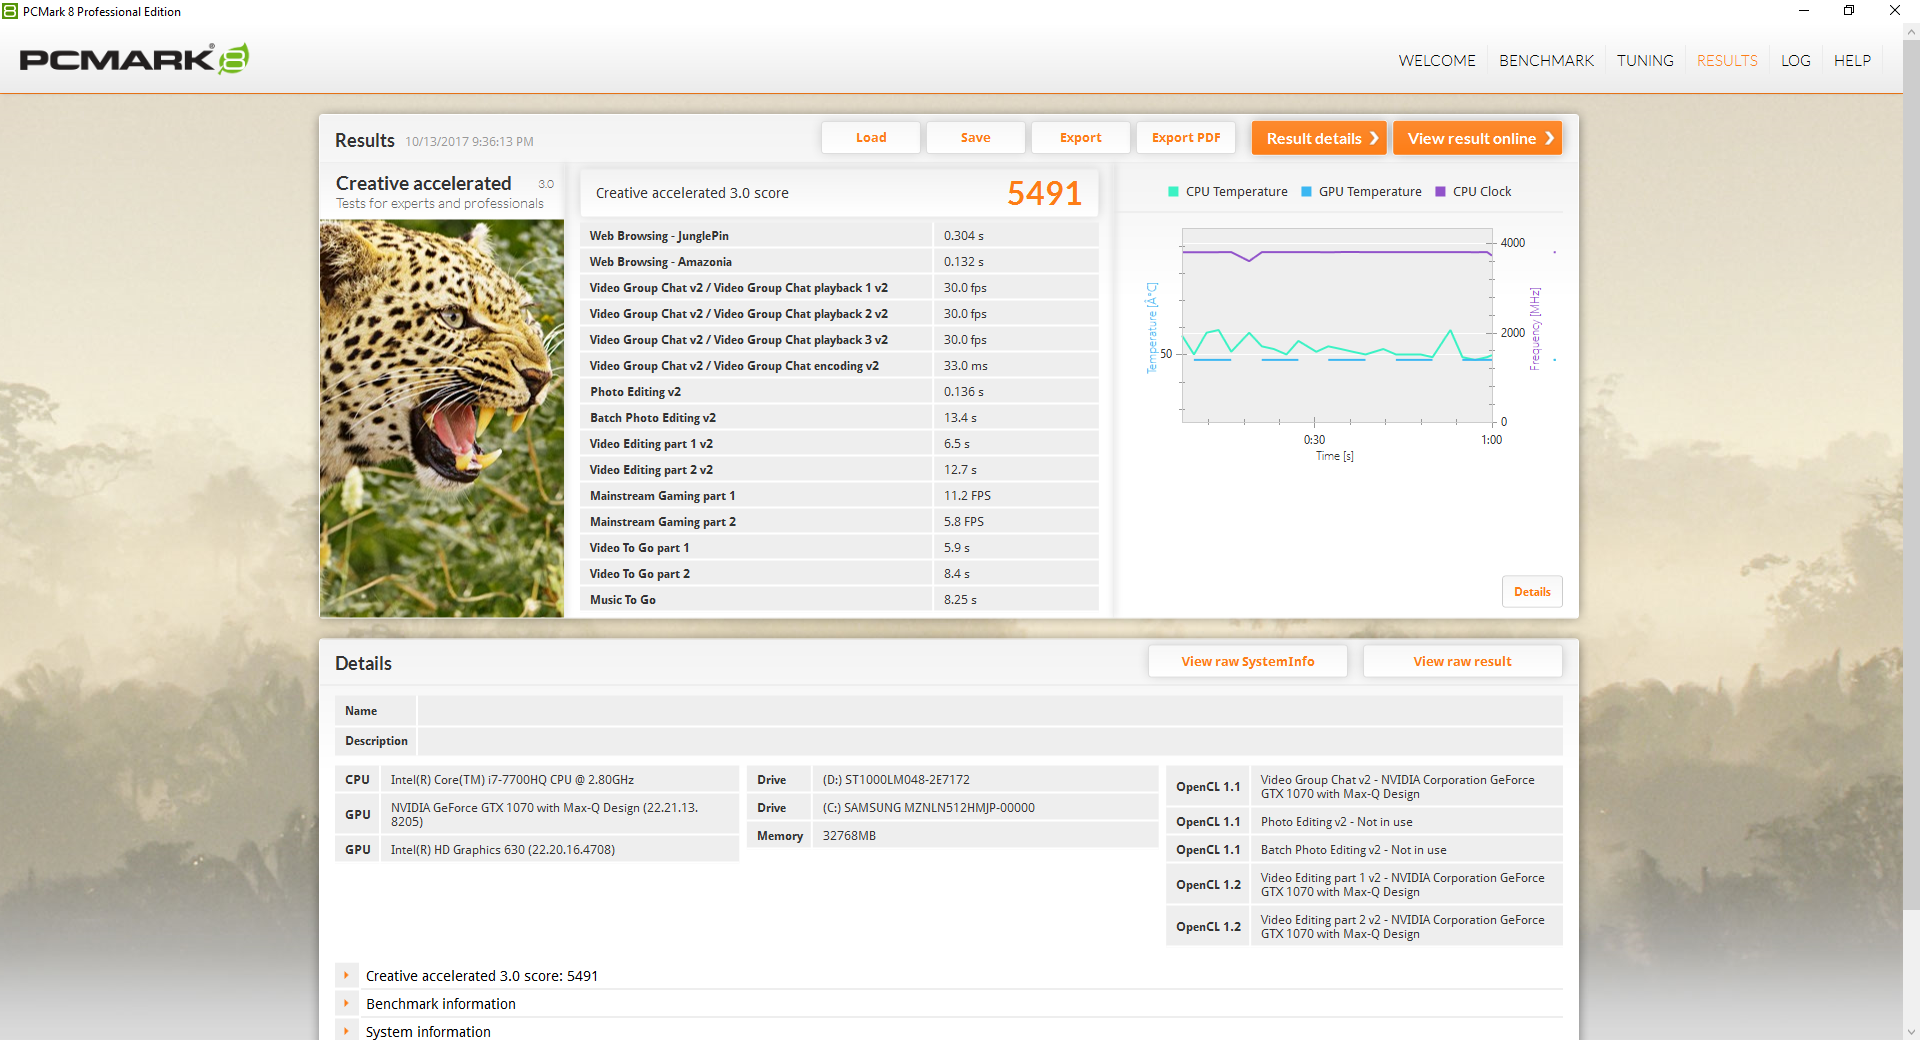
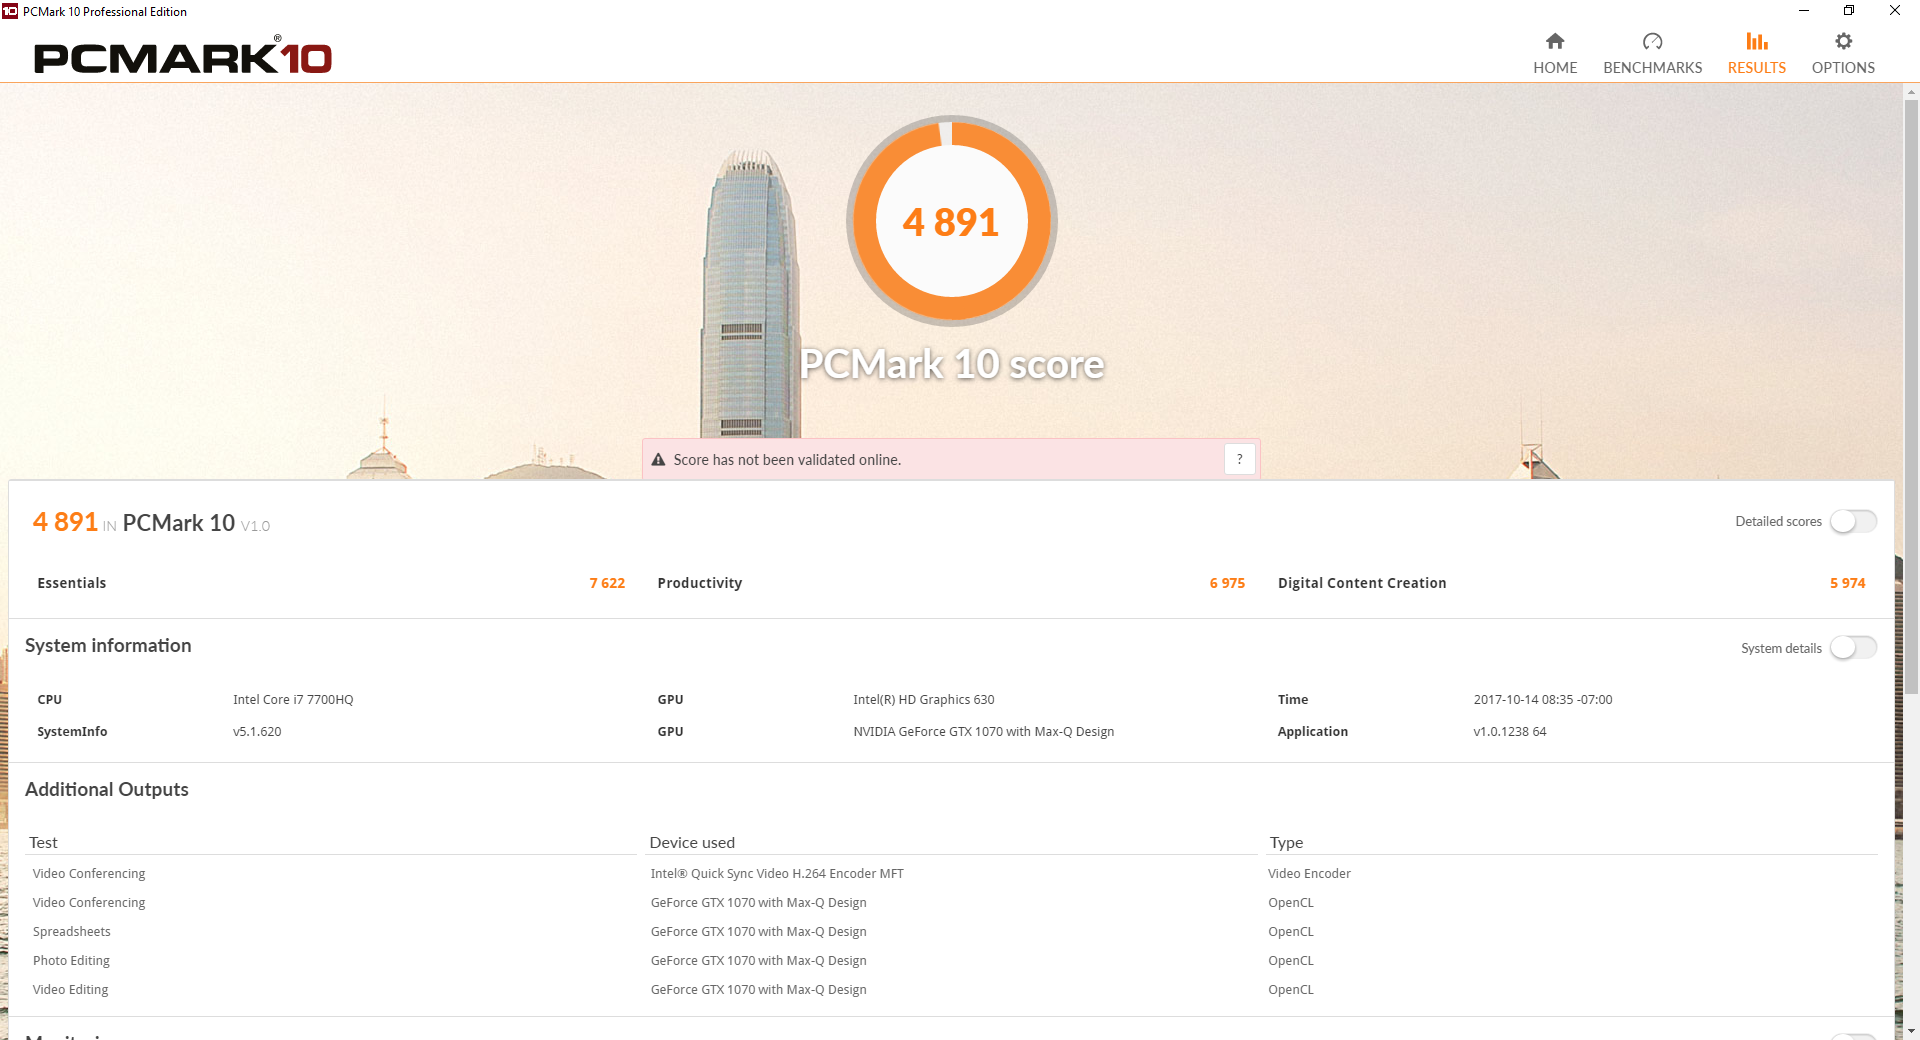
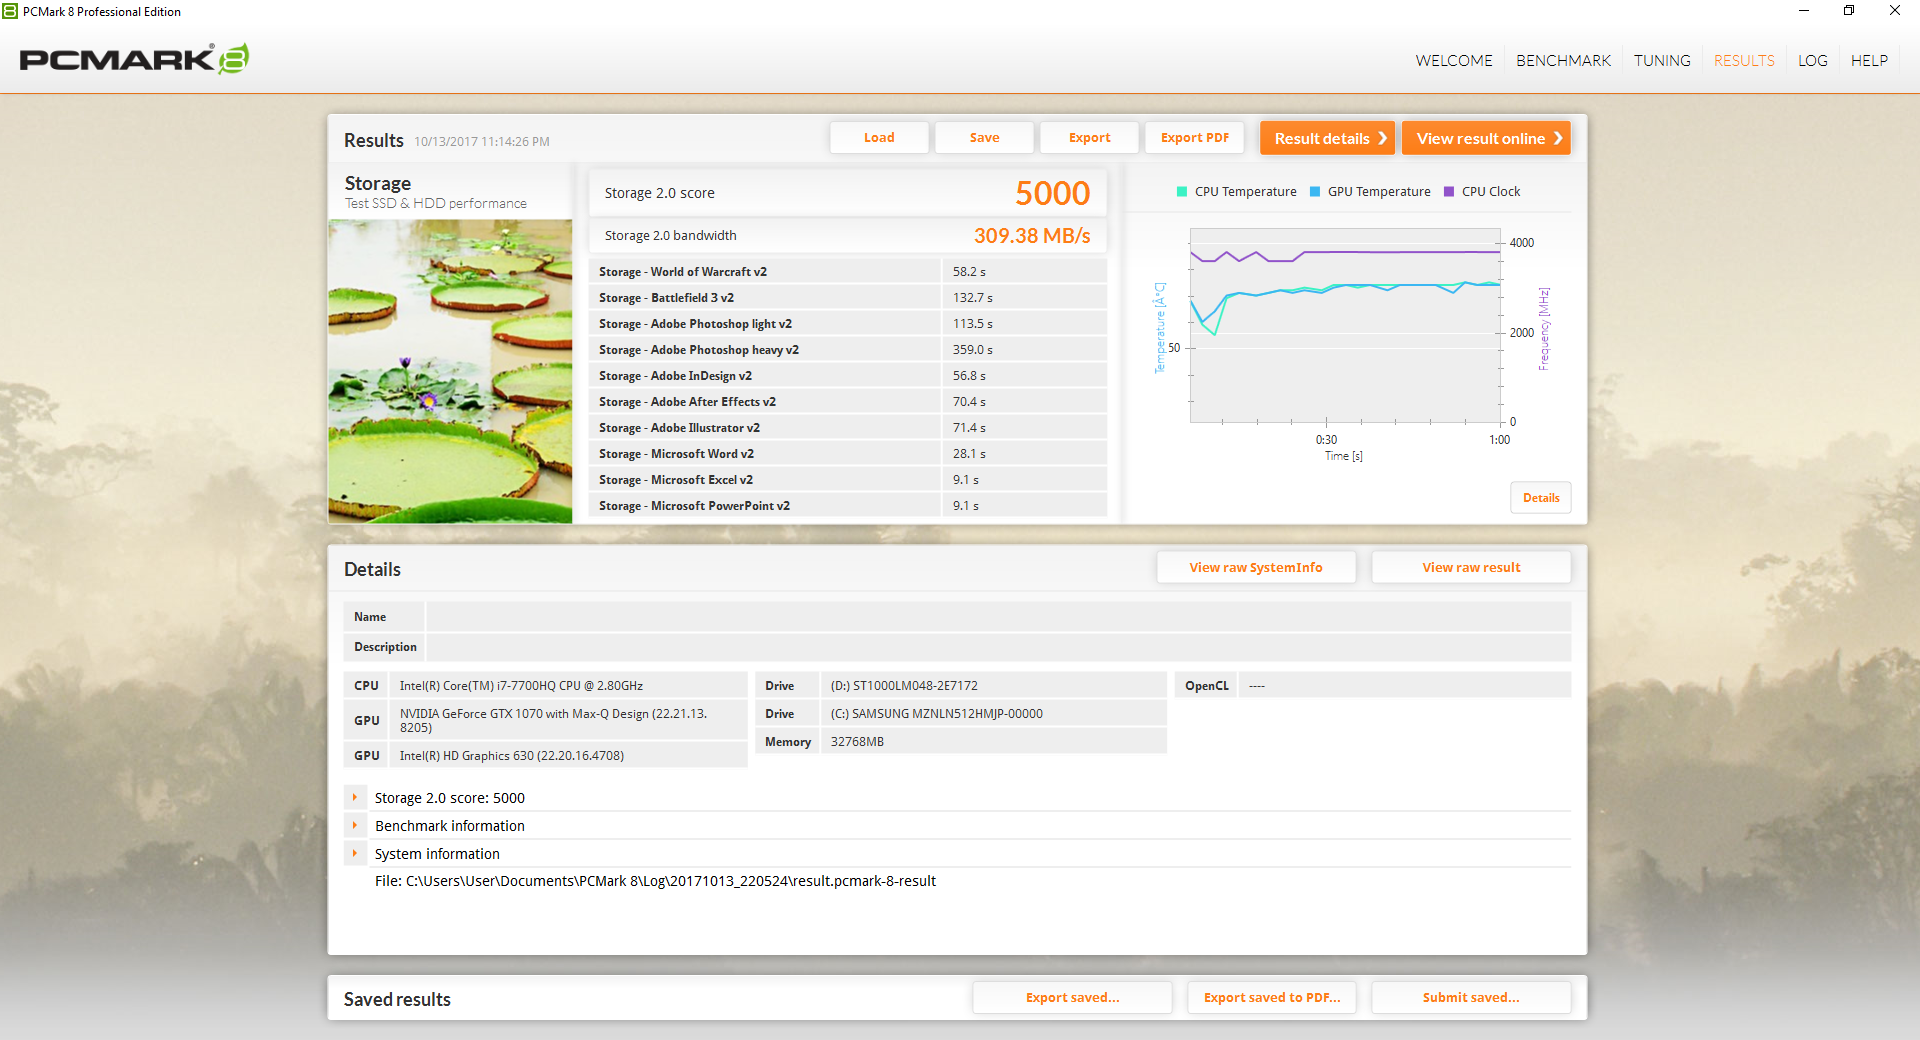
PCMark scores are consistently in between the Legion Y920 and GF72VR each with faster NVMe Samsung SSDs. Subjectively, we experienced no software-related issues during testing save for one system crash that we were unable to repeat.
| PCMark 8 | |
| Home Score Accelerated v2 | |
| Lenovo Legion Y920-17IKB | |
| EVGA SC17 GTX 1070 | |
| MSI GS73VR 7RG | |
| MSI GF72VR 7RF | |
| Work Score Accelerated v2 | |
| Lenovo Legion Y920-17IKB | |
| MSI GS73VR 7RG | |
| MSI GF72VR 7RF | |
| EVGA SC17 GTX 1070 | |
| Creative Score Accelerated v2 | |
| Lenovo Legion Y920-17IKB | |
| EVGA SC17 GTX 1070 | |
| MSI GS73VR 7RG | |
| MSI GF72VR 7RF | |
| PCMark 10 | |
| Digital Content Creation | |
| Lenovo Legion Y920-17IKB | |
| MSI GS73VR 7RG | |
| MSI GF72VR 7RF | |
| Productivity | |
| Lenovo Legion Y920-17IKB | |
| MSI GF72VR 7RF | |
| MSI GS73VR 7RG | |
| Essentials | |
| Lenovo Legion Y920-17IKB | |
| MSI GS73VR 7RG | |
| MSI GF72VR 7RF | |
| Score | |
| Lenovo Legion Y920-17IKB | |
| MSI GS73VR 7RG | |
| MSI GF72VR 7RF | |
| PCMark 8 Home Score Accelerated v2 | 4394 points | |
| PCMark 8 Creative Score Accelerated v2 | 5491 points | |
| PCMark 8 Work Score Accelerated v2 | 5215 points | |
| PCMark 10 Score | 4891 points | |
Help | ||
Storage Devices
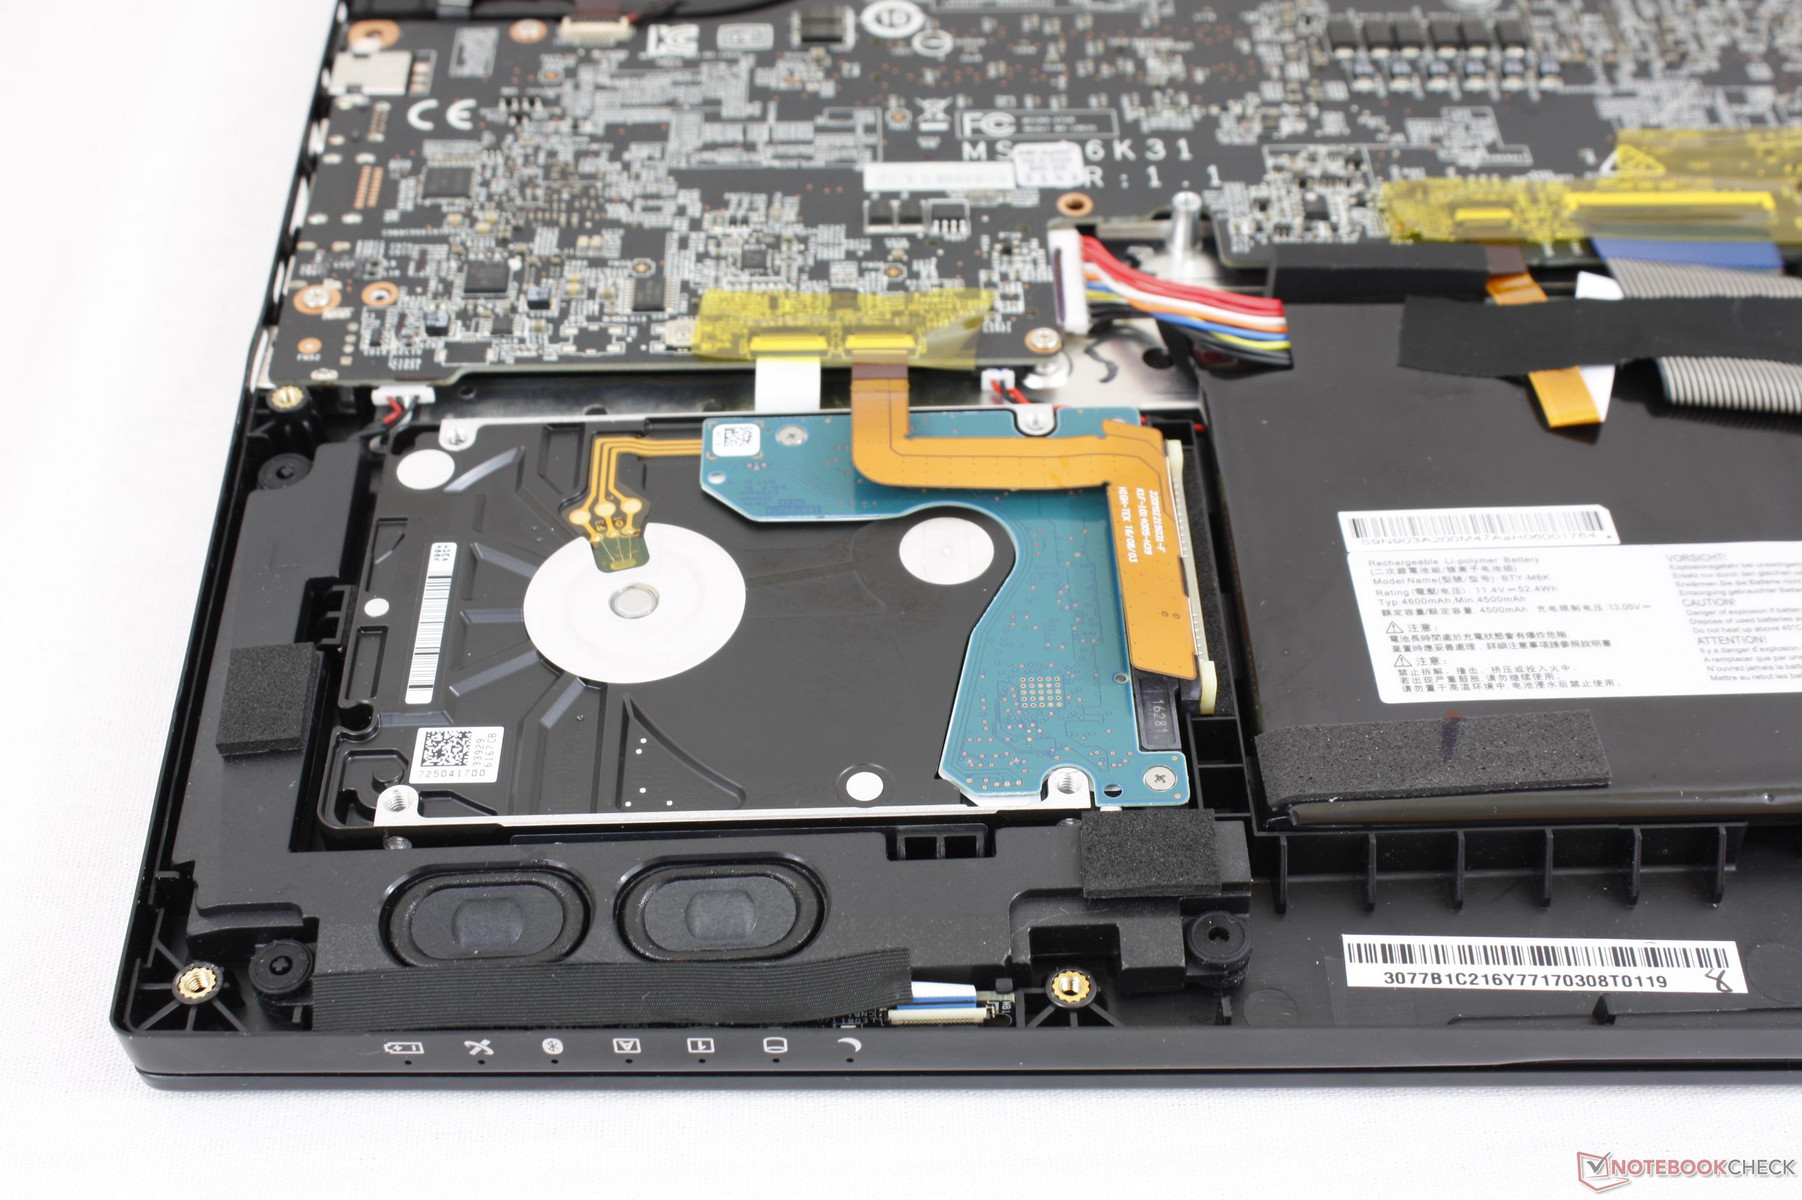
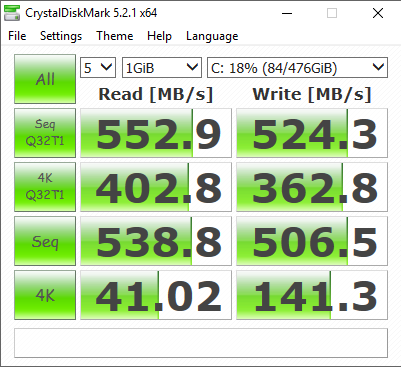
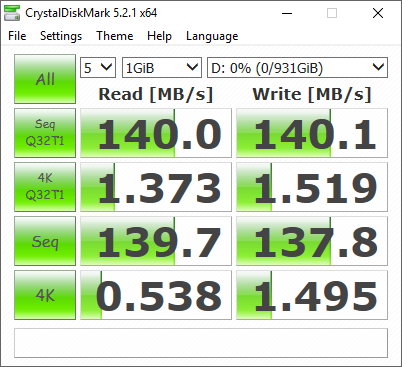
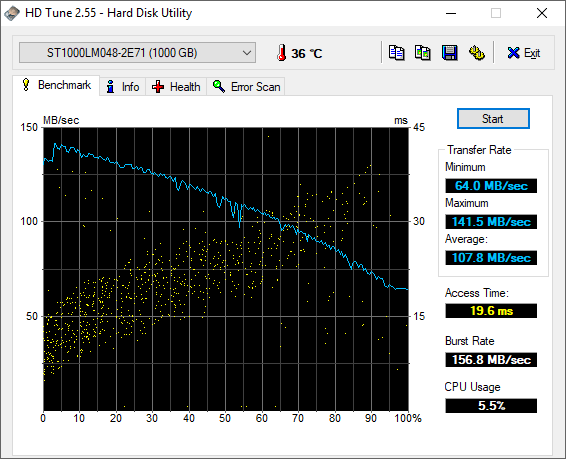
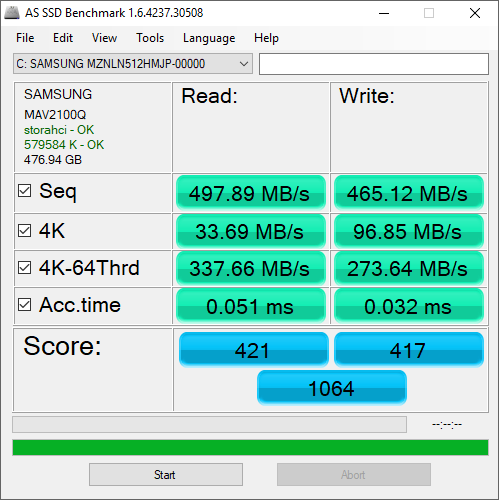
Internal storage bays include a single M.2 slot with support for NVMe (PCIe x4) and a secondary 2.5-inch SATA III bay. Our test unit shipped with a 512 GB SATA III Samsung PM871 SSD and a secondary 1 TB Seagate Barracuda ST1000LM048 HDD. If upgrading, a 7 mm HDD is recommended since space is tight.
Sequential read and write rates from the primary SSD are good for a SATA III drive at just over 500 MB/s according to CrystalDiskMark. While nowhere near as fast as NVMe SSDs, it's difficult to expect more from a single SSD limited by the SATA III controller. Meanwhile, the Seagate drive is actually quite fast for a 5400 RPM HDD with an average transfer rate of 107.8 MB/s. Many older Seagate drives like the Momentus Thin ST750LM022 would be slower than 90 MB/s when subjected to the same benchmark.
See our table of HDDs and SSDs for more benchmark comparisons.
| MSI GS73VR 7RG Samsung SSD PM871 MZNLN512HMJP | Lenovo Legion Y920-17IKB Samsung SM961 MZVKW512HMJP m.2 PCI-e | Gigabyte P57X v7 Transcend MTS800 256GB M.2 (TS256GMTS800) | EVGA SC17 GTX 1070 Samsung SM951 MZVPV256 m.2 | MSI GT73VR 7RF-296 2x Samsung SM951 MZVPV256HDGL (RAID 0) | |
|---|---|---|---|---|---|
| AS SSD | 179% | -34% | 107% | 184% | |
| Copy Game MB/s (MB/s) | 381.5 | 1117 193% | 389.8 2% | 1034 171% | |
| Copy Program MB/s (MB/s) | 229.8 | 407.8 77% | 206.1 -10% | 470 105% | |
| Copy ISO MB/s (MB/s) | 423.5 | 1975 366% | 392.2 -7% | 1337 216% | |
| Score Total (Points) | 1064 | 3080 189% | 721 -32% | 2328 119% | 3310 211% |
| Score Write (Points) | 417 | 1506 261% | 249 -40% | 487 17% | 1054 153% |
| Score Read (Points) | 421 | 1072 155% | 314 -25% | 1238 194% | 1511 259% |
| Access Time Write * (ms) | 0.032 | 0.029 9% | 0.055 -72% | 0.033 -3% | 0.03 6% |
| Access Time Read * (ms) | 0.051 | 0.044 14% | 0.11 -116% | 0.049 4% | 0.035 31% |
| 4K-64 Write (MB/s) | 273.6 | 1220 346% | 151.4 -45% | 260.9 -5% | 697 155% |
| 4K-64 Read (MB/s) | 337.7 | 747 121% | 241.4 -29% | 999 196% | 1165 245% |
| 4K Write (MB/s) | 96.8 | 127.1 31% | 72 -26% | 112.1 16% | 123.8 28% |
| 4K Read (MB/s) | 33.69 | 48.23 43% | 23.65 -30% | 45.64 35% | 46.75 39% |
| Seq Write (MB/s) | 465.1 | 1589 242% | 260.9 -44% | 1144 146% | 2332 401% |
| Seq Read (MB/s) | 497.9 | 2768 456% | 491.9 -1% | 1934 288% | 2988 500% |
* ... smaller is better

GPU Performance
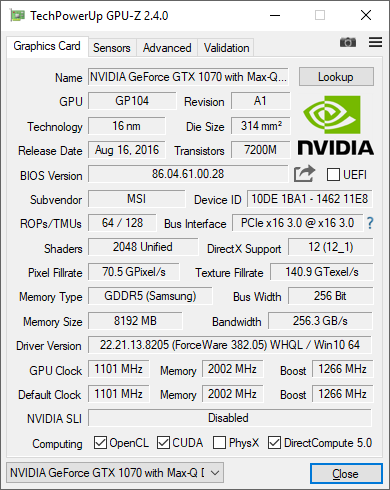
3DMark Fire Strike scores are 100 percent higher than the GTX 970M, 40 percent higher than the GTX 1060 Max-Q, and 20 percent slower than the GTX 1080 Max-Q. The 1070 Max-Q is only about 10 to 15 percent slower than the standard GTX 1070 for notebooks which we find to be an acceptable performance trim when targeting 1080p60.
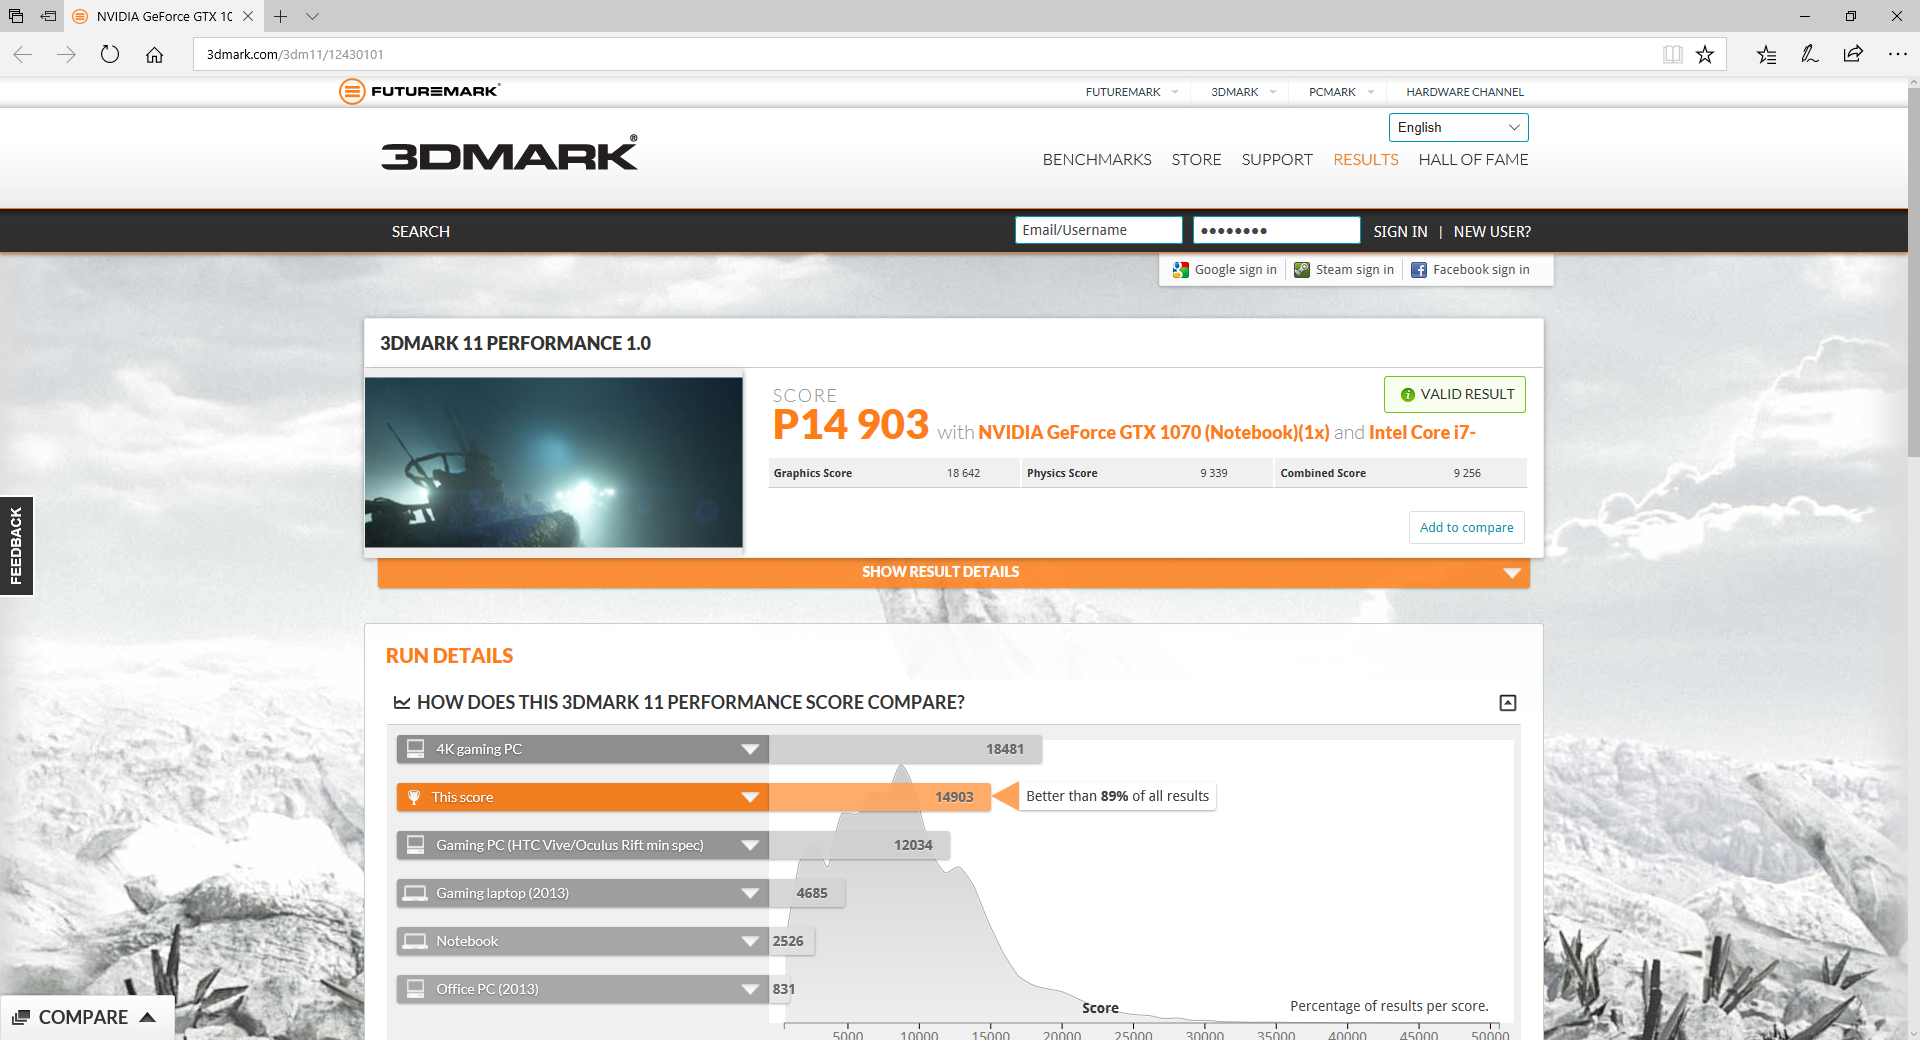
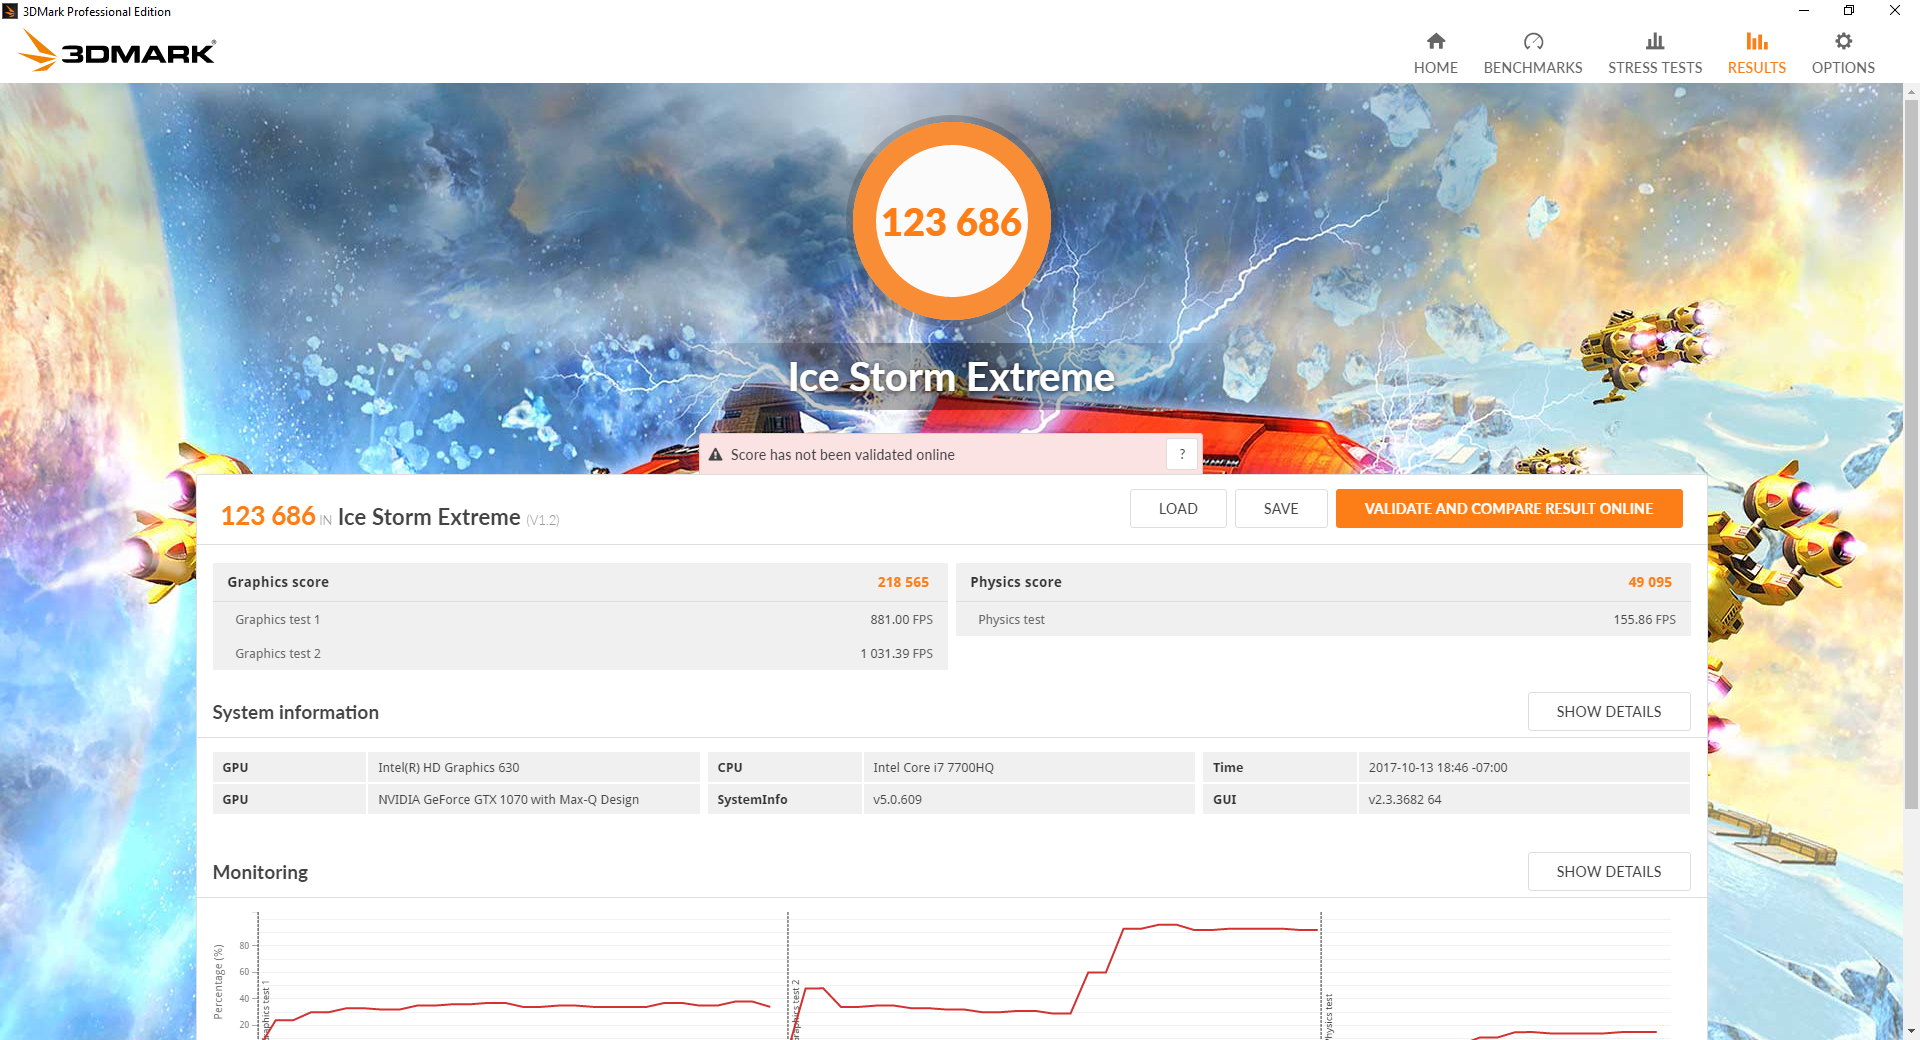
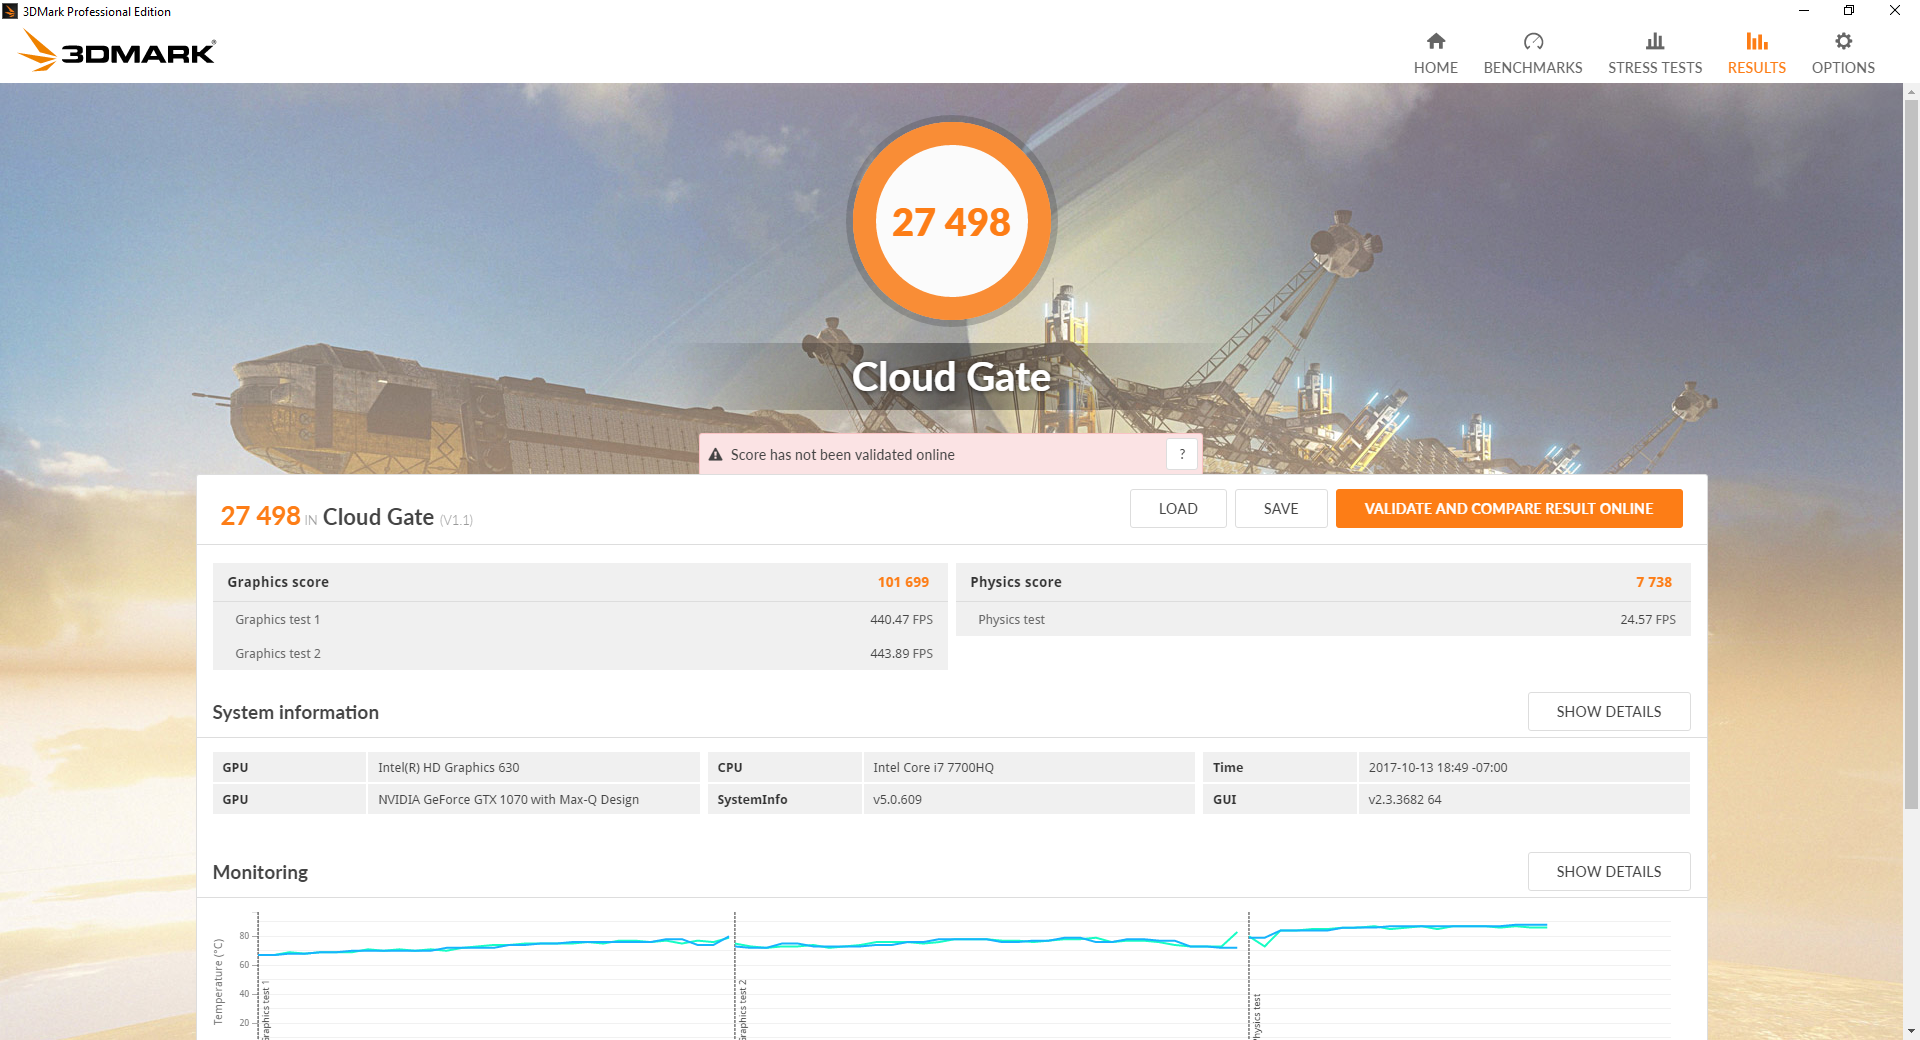
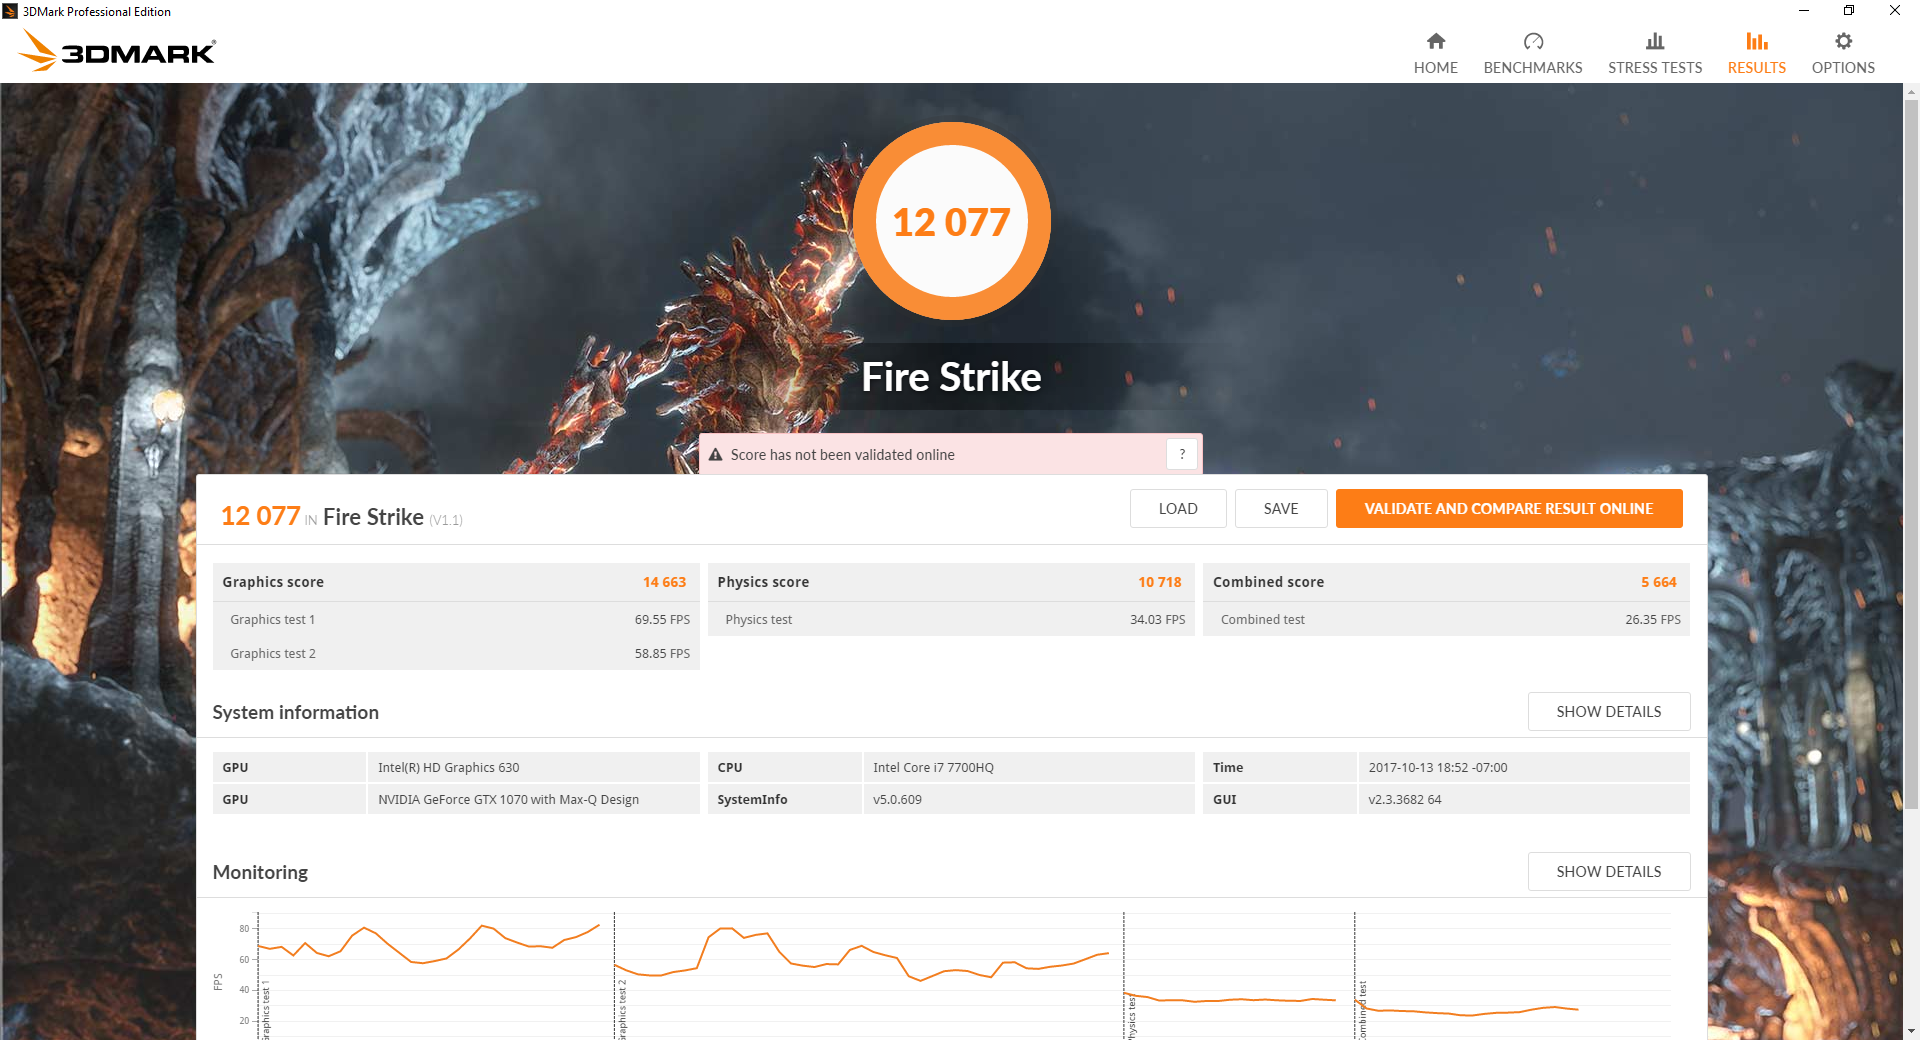
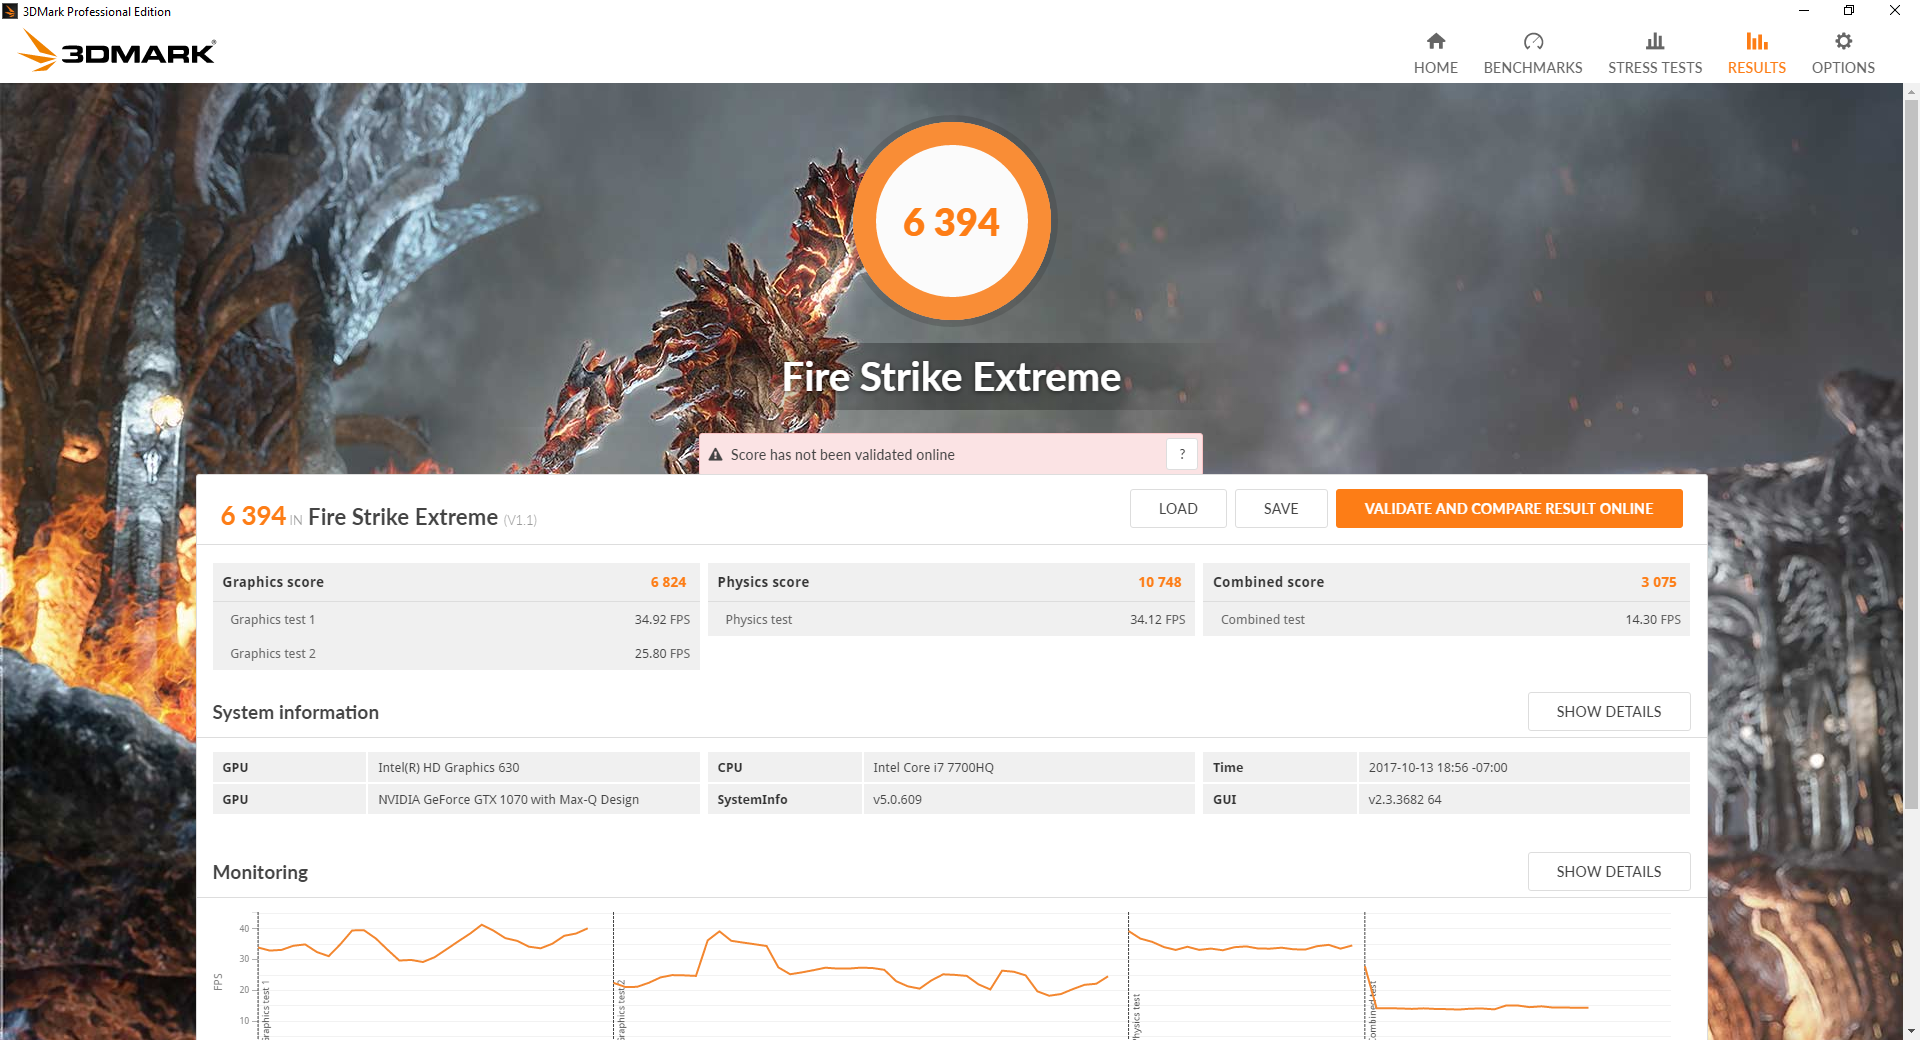
| 3DMark 11 Performance | 14903 points | |
| 3DMark Ice Storm Standard Score | 128787 points | |
| 3DMark Cloud Gate Standard Score | 27498 points | |
| 3DMark Fire Strike Score | 12077 points | |
| 3DMark Fire Strike Extreme Score | 6394 points | |
Help | ||
Gaming Performance
The 1070 Max-Q in the MSI is consistently outperforming the standard GTX 1060 by about 20 to 25 percent in our tested games. With the exception of titles that include heavy post processing filters like Witcher 3 or Batman Arkham Knight, most titles will have no issues maintaining 60 FPS at 1080p and on maximum settings. In order to take full advantage of the fast 120 Hz refresh rate, however, settings will need to be dialed down to medium or lower. A standard GTX 1070 desktop card can still outperform our GTX 1070 Max-Q by about 20 percent. It's a bummer that there are no GTX 1080 Max-Q options as the additional horsepower would be useful for pushing 1080p120.
See our dedicated page on the GTX 1070 Max-Q for more benchmark comparisons.
| Rise of the Tomb Raider - 1920x1080 Very High Preset AA:FX AF:16x | |
| Alienware 17 R4 | |
| Asus Zephyrus GX501 | |
| Nvidia GeForce GTX 1070 Founders Edition | |
| MSI GE73VR 7RF Raider | |
| Asus Zephyrus GX501VS | |
| MSI GS73VR 7RG | |
| MSI GS43VR 7RE-069US | |
| EVGA SC17 | |
| HP Omen 15-ce002ng | |
| Zotac ZBOX Magnus EN51050 | |
| BioShock Infinite - 1920x1080 Ultra Preset, DX11 (DDOF) | |
| Alienware 17 R4 | |
| Nvidia GeForce GTX 1070 Founders Edition | |
| MSI GE73VR 7RF Raider | |
| Asus Zephyrus GX501VS | |
| MSI GS73VR 7RG | |
| MSI GS43VR 7RE-069US | |
| EVGA SC17 | |
| Lenovo Legion Y520-15IKBN 80WK0042GE | |
| Zotac ZBOX Magnus EN51050 | |
| The Witcher 3 - 1920x1080 Ultra Graphics & Postprocessing (HBAO+) | |
| Alienware 17 R4 | |
| Nvidia GeForce GTX 1070 Founders Edition | |
| Asus Zephyrus GX501 | |
| MSI GE73VR 7RF Raider | |
| MSI GS73VR 7RG | |
| Asus Zephyrus GX501VS | |
| MSI GS43VR 7RE-069US | |
| HP Omen 15-ce002ng | |
| Lenovo Legion Y520-15IKBN 80WK0042GE | |
| Zotac ZBOX Magnus EN51050 | |
| low | med. | high | ultra | |
|---|---|---|---|---|
| BioShock Infinite (2013) | 127.6 | |||
| Metro: Last Light (2013) | 96.1 | |||
| Thief (2014) | 93.3 | |||
| The Witcher 3 (2015) | 98.2 | 51.3 | ||
| Batman: Arkham Knight (2015) | 106 | 56 | ||
| Metal Gear Solid V (2015) | 60 | 60 | ||
| Fallout 4 (2015) | 88.3 | |||
| Rise of the Tomb Raider (2016) | 97.7 | 83.5 | ||
| Ashes of the Singularity (2016) | 67.5 | 63.5 | ||
| Overwatch (2016) | 138.1 | |||
| Mafia 3 (2016) | 55.1 | |||
| Prey (2017) | 132 | |||
| Dirt 4 (2017) | 115.4 | 72.8 | ||
| F1 2017 (2017) | 125 | 81 |
Stress Test
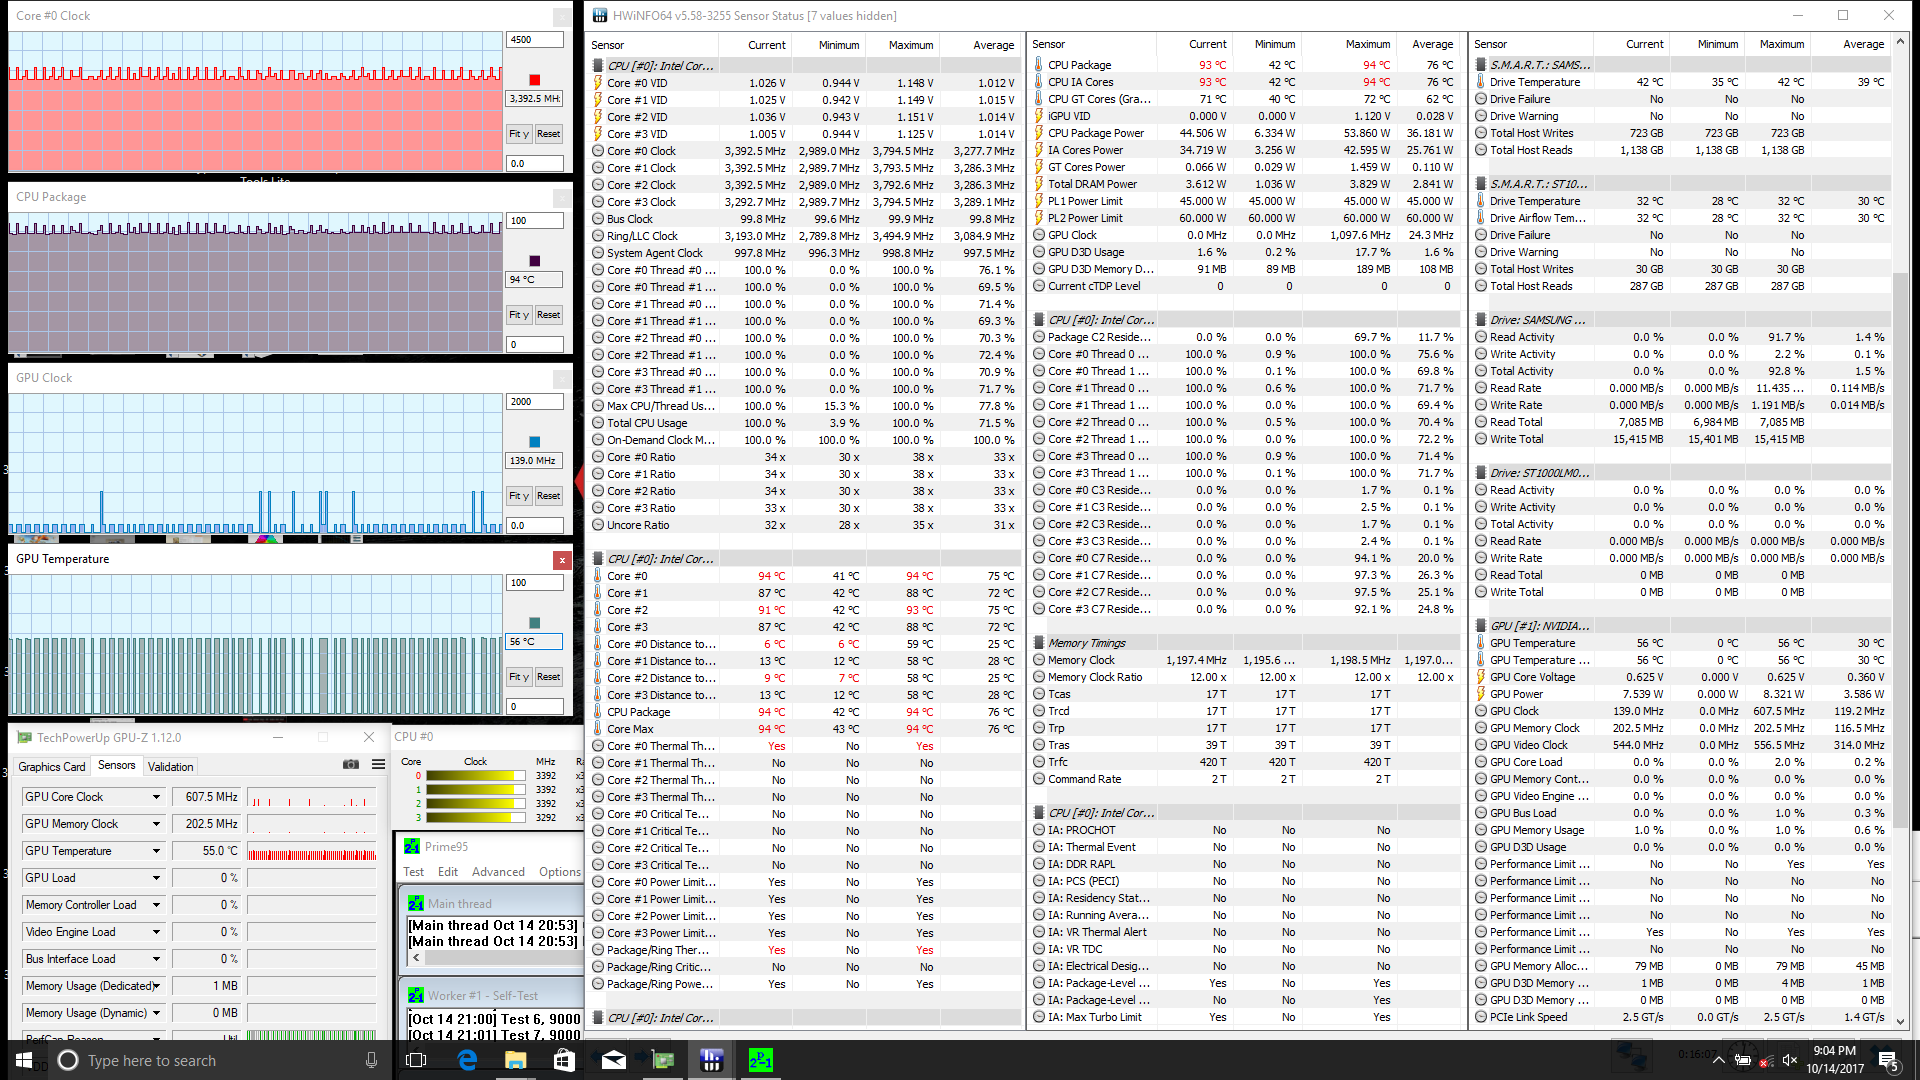
We stress the notebook with unrealistic loads to identify for any throttling or stability issues. When subjected to Prime95 stress, the CPU can be observed fluctuating between 3.0 and 3.4 GHz and 86 and 93 C rapidly. This is uncommon behavior as most notebooks would typically stabilize at a single clock rate and temperature or at least a much narrower operating range. Interestingly, the i7-6700HQ in last year's GS73VR 6RF would run cooler at a steady 77 C but with a slower steady clock rate of 2.9 GHz. Even so, clock rates never dip below the base when under stressed which is impressive for a superthin design.
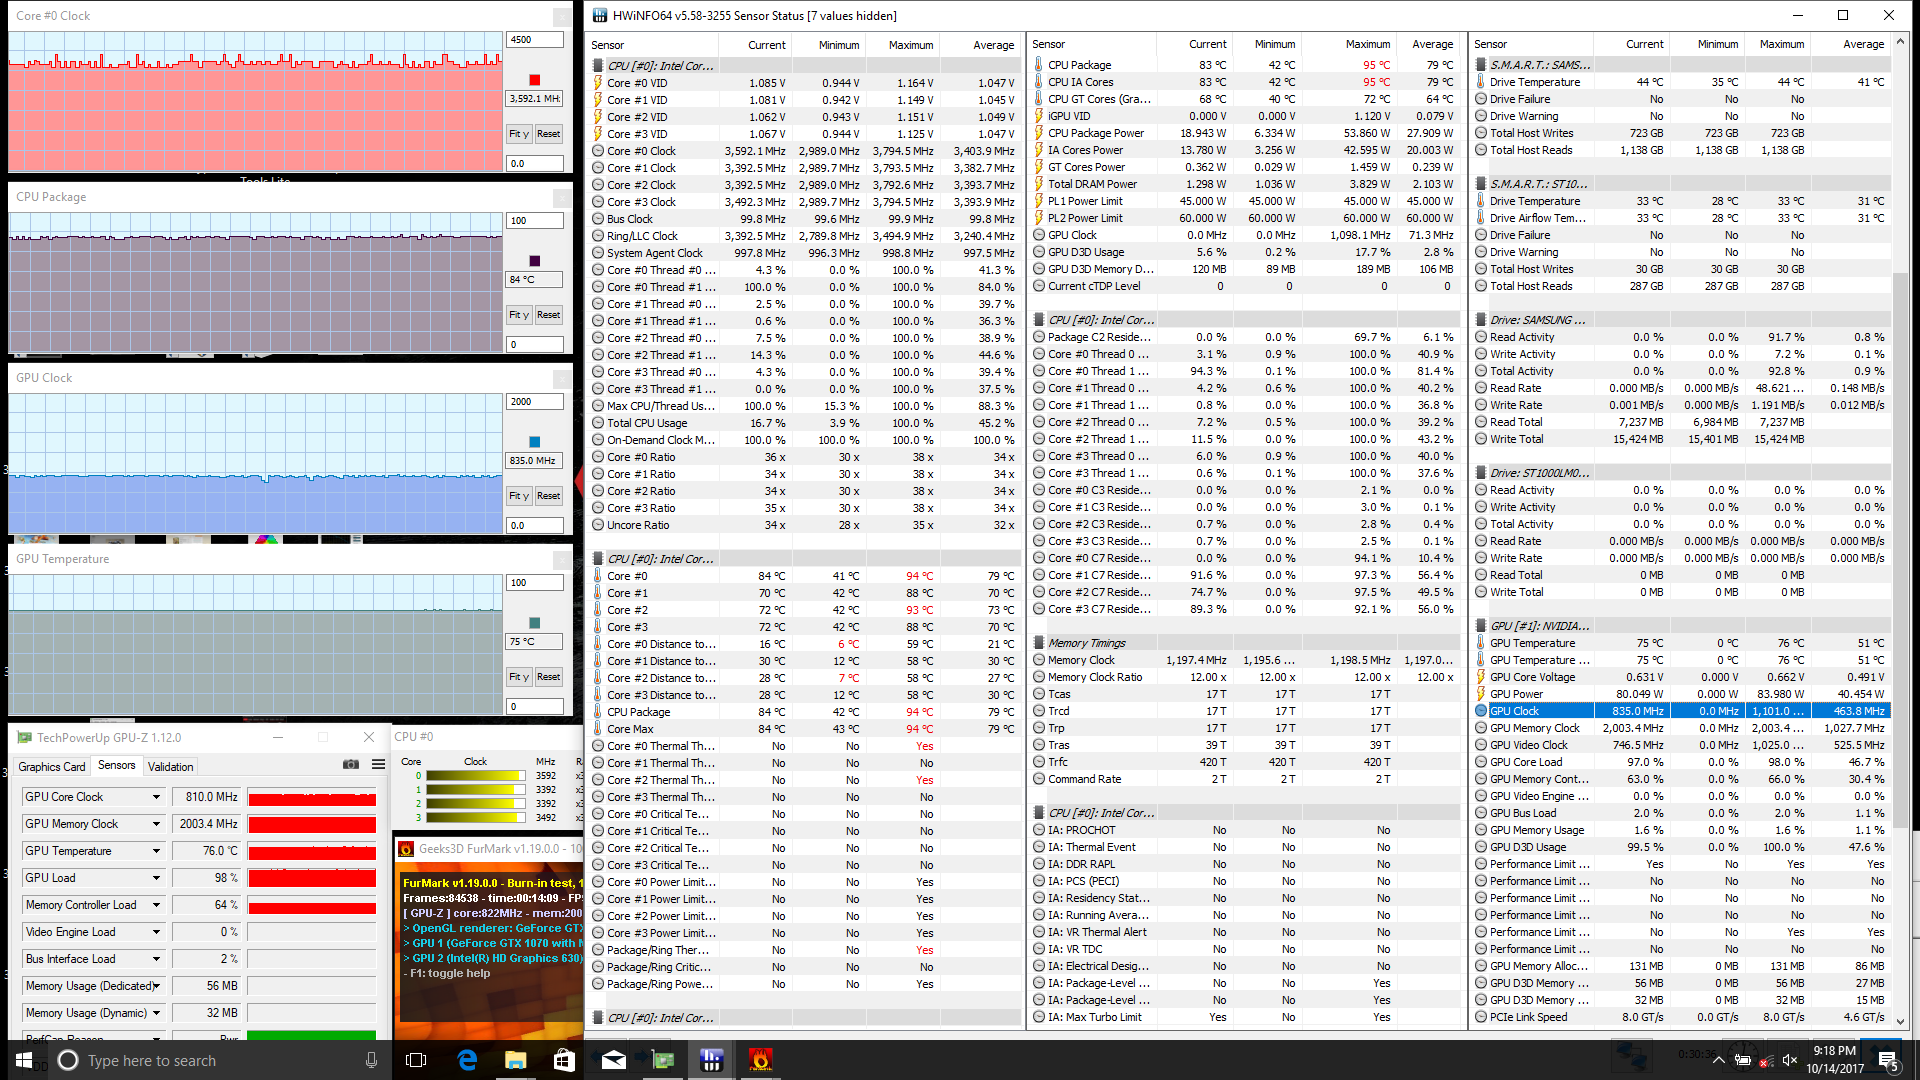
The drawback is the expected high core temperature. Running both Prime95 and FurMark simultaneously will bring the CPU to 95 C while knocking clock rates down to 2.8 GHz. The GPU runs comparatively cooler at all times in the mid 70 C range compared to the mid 80 C range for the GTX 1060 in the GS73VR 6RF. In this case, switching to a lower-clocked Max-Q GPU has been beneficial to core temperatures.
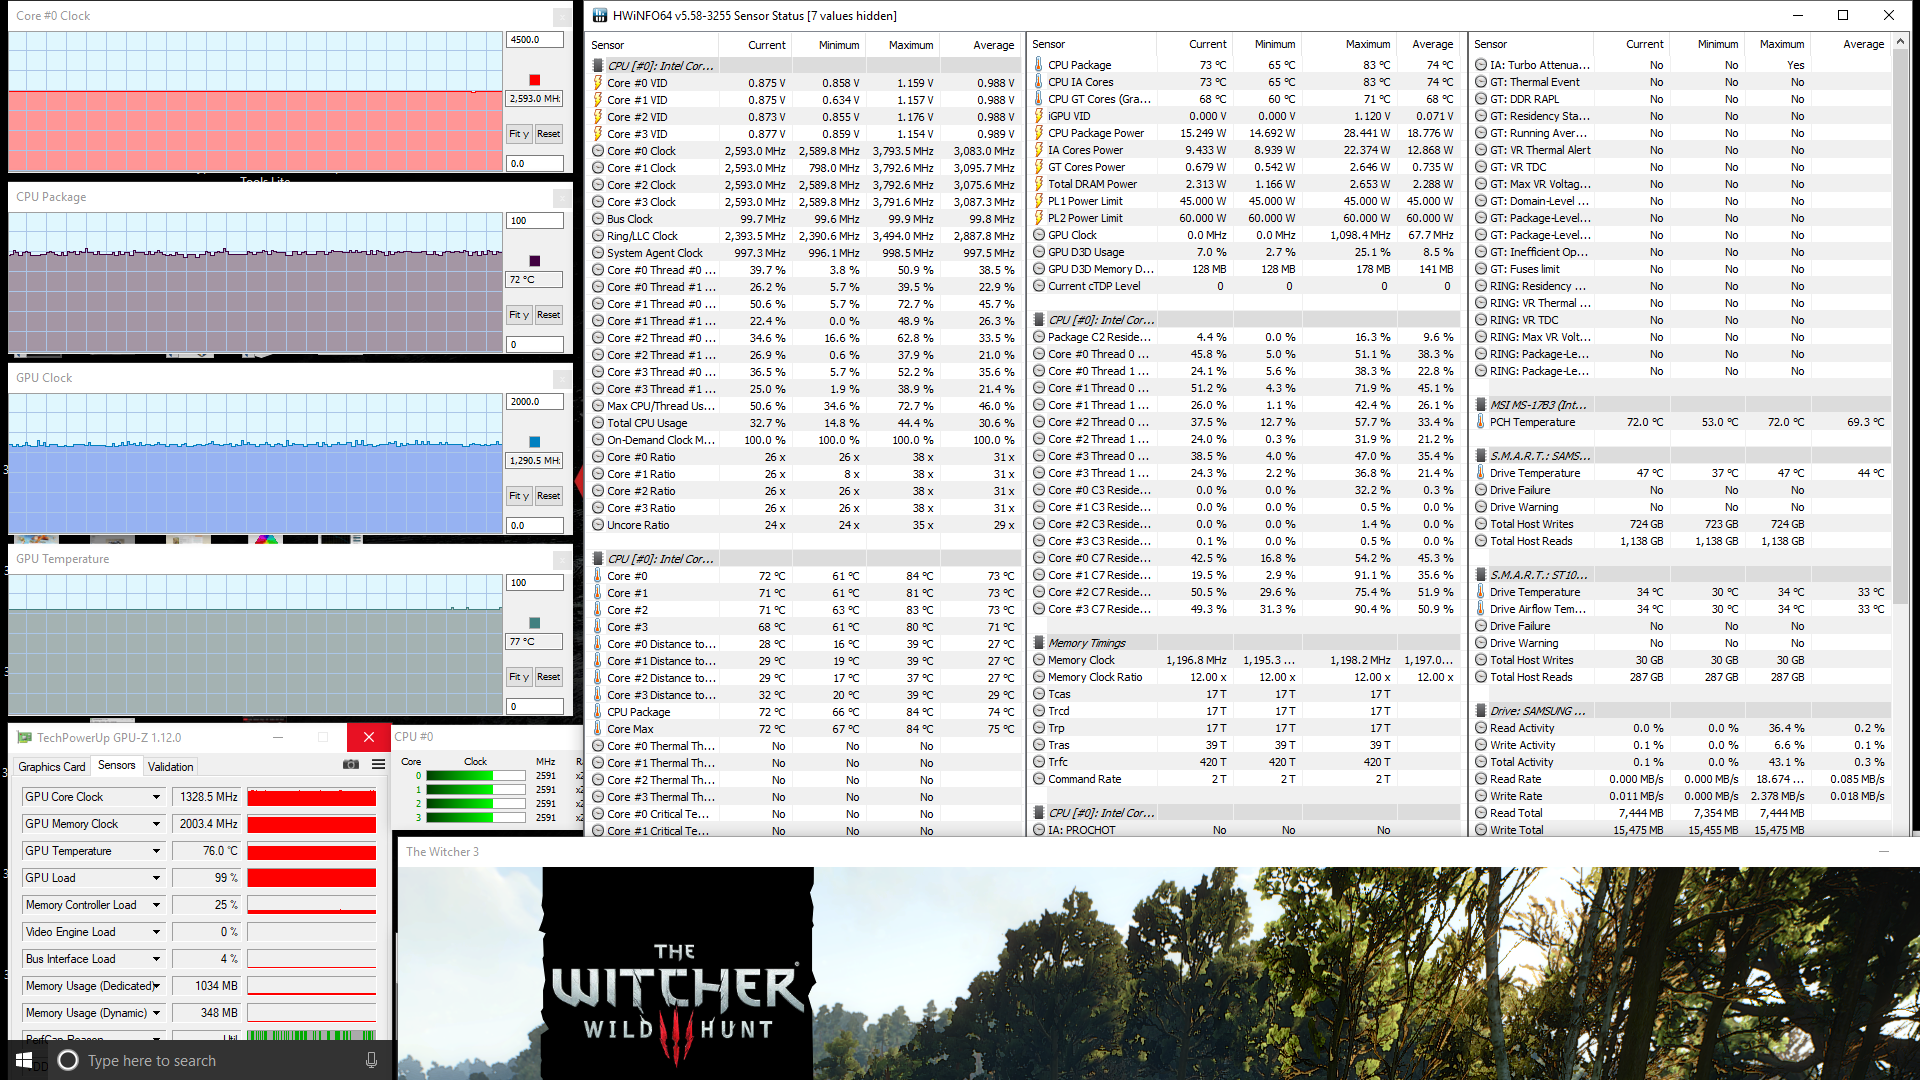
Running Witcher 3 is more representative of real-world gaming load. Both the CPU and GPU can be observed operating at respectable core temperatures of 72 C and 77 C, respectively. The GPU in particular clocks in at a reliable 1291 MHz (or 1329 MHz according to GPU-Z) compared to its base clock of 1101 MHz. Frame rates are also stable when idling on Witcher 3 with no recurring drops or throttling over time.
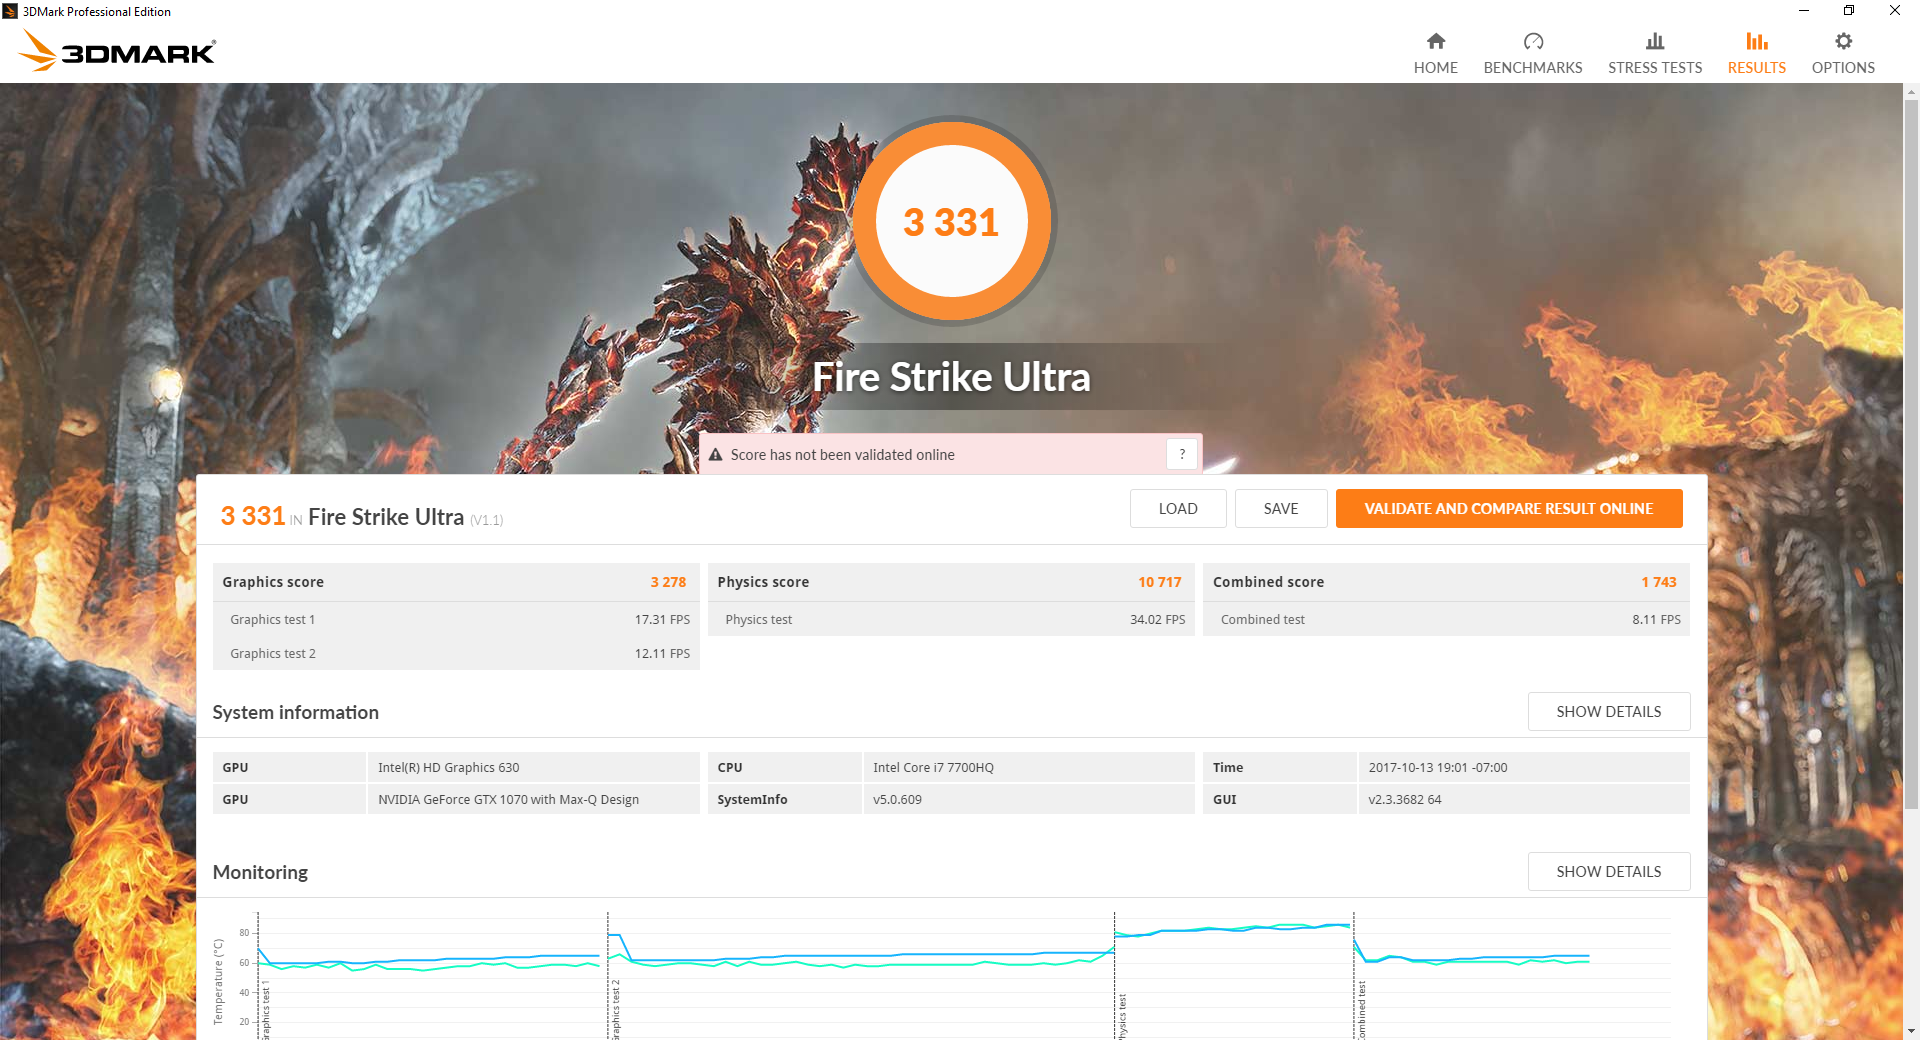
Running on battery power will limit overall performance. A Fire Strike run on batteries returns Physics and Graphics scores of 6913 and 5270 points, respectively, compared to 10718 and 14663 points when on mains.

| CPU Clock (GHz) | GPU Clock (MHz) | Average CPU Temperature (°C) | Average GPU Temperature (°C) | |
| Prime95 Stress | 3.0 - 3.4 | -- | 86 - 93 | -- |
| FurMark Stress | -- | 835 | -- | 75 |
| Prime95 + FurMark Stress | ~2.8 - 2.9 | ~1063 | 95 | 71 |
| Witcher 3 Stress (if applicable) | 2.6 | 1291 | 72 | 77 |
Emissions
System Noise
'Fan noise' and 'superthin gaming' have never been the best of friends. While the fans on the GS73VR 7RG are indeed quieter than on last year's GS73VR 6RF and many "standard" GTX gaming notebooks when under high loads, they are not as quiet as we were initially expecting. Nvidia dictates that all Max-Q notebooks should be aiming for "40 dB(A) or better" when sitting 25 cm away from the front of the notebook, but we are able to record a steady 45.8 dB(A) when running Witcher 3. Granted, our testing standards are not comparable to Nvidia's, but this MSI is still louder than other Max-Q notebooks we've tested including the Omen 15, Asus Zephyrus, and Acer Triton.
Fan noise when sitting idle on desktop has unfortunately not changed. At least one of the fans will always be active and will eventually pulsate to as high as 34 dB(A) during low loads like word processing, emailing, or streaming. If not gaming, we recommend running on Power Saver mode so the fans will pulsate less often.
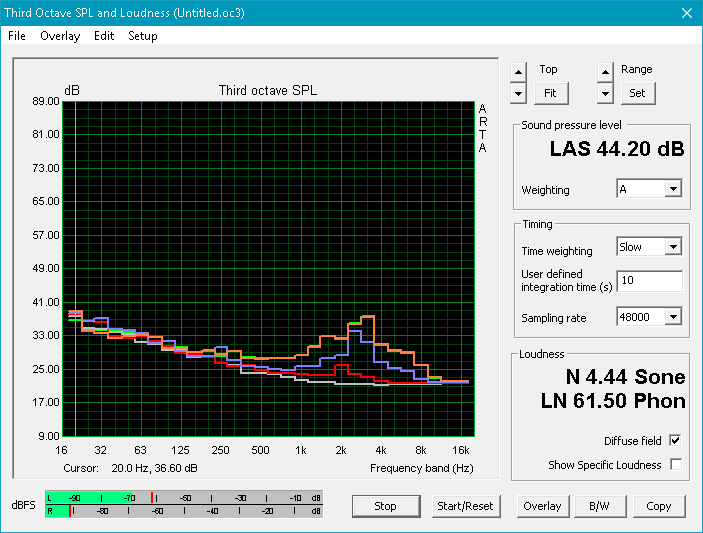
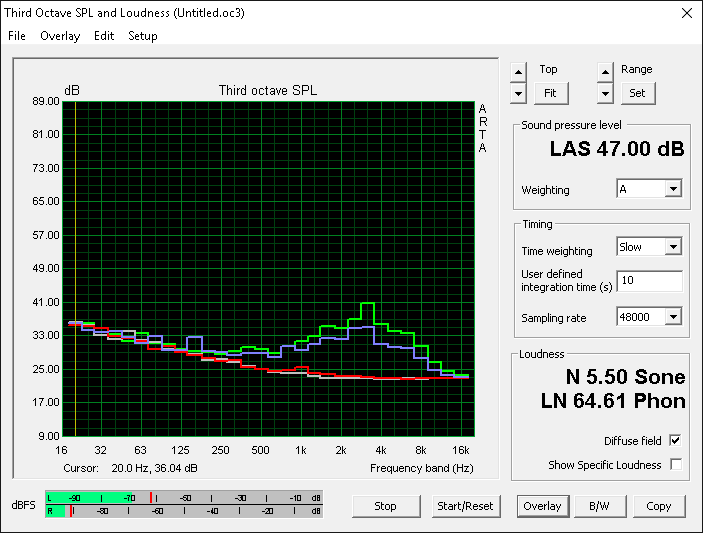
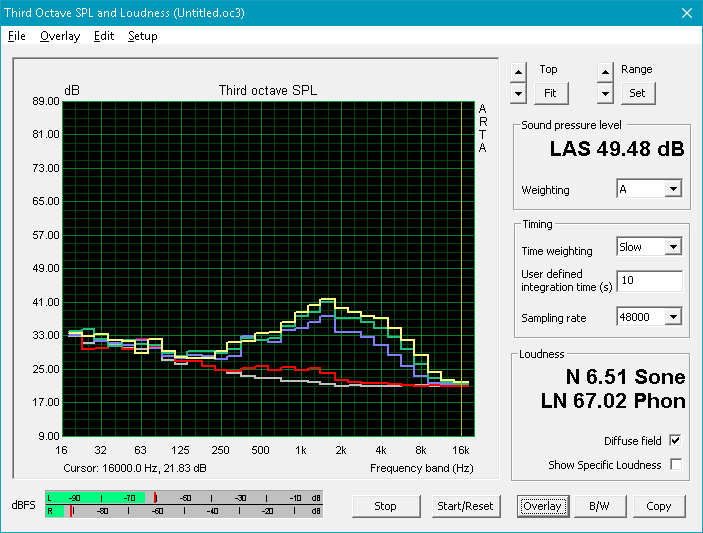
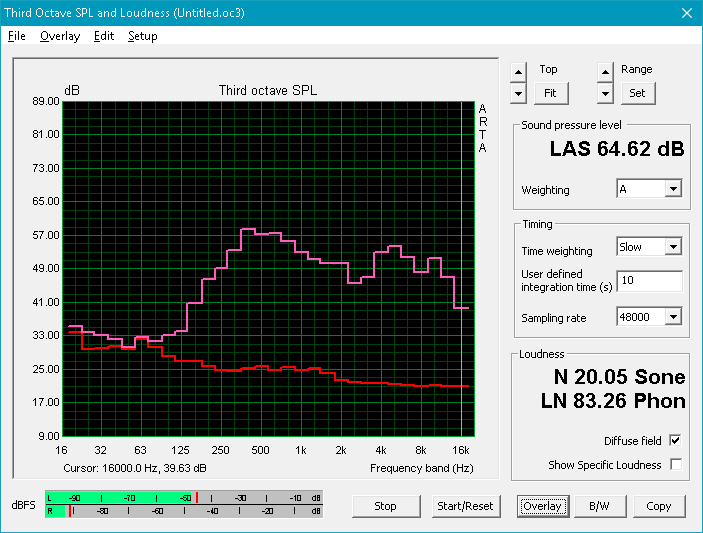
The high sound frequency of the small fans continues to be a unique disadvantage for the GS73VR series. As shown in our microphone data below, the noise curves have sharper peaks and are not as broad as on other bigger gaming notebooks like the EVGA SC17. Higher frequencies are more likely irritate and be noticeable when gaming.
Coil whine is not present on this particular test unit. Our last GS73VR exhibited noticeable electronic noise but we thankfully cannot say the same here.
Noise level
| Idle |
| 29.4 / 30.7 / 34 dB(A) |
| Load |
| 42 / 45.8 dB(A) |
 | ||
30 dB silent 40 dB(A) audible 50 dB(A) loud |
||
min: | ||
| MSI GS73VR 7RG GeForce GTX 1070 Max-Q, i7-7700HQ, Samsung SSD PM871 MZNLN512HMJP | MSI GS73VR 6RF GeForce GTX 1060 Mobile, 6700HQ, SanDisk SD8SN8U1T001122 | Gigabyte P57X v7 GeForce GTX 1070 Mobile, i7-7700HQ, Transcend MTS800 256GB M.2 (TS256GMTS800) | EVGA SC17 GTX 1070 GeForce GTX 1070 Mobile, 6820HK, Samsung SM951 MZVPV256 m.2 | Alienware 17 R4 GeForce GTX 1080 Mobile, i7-7820HK, SK Hynix PC300 NVMe 512 GB | HP Omen 15-ce002ng GeForce GTX 1060 Max-Q, i7-7700HQ, Samsung PM961 MZVLW256HEHP | |
|---|---|---|---|---|---|---|
| Noise | -6% | -5% | -8% | -12% | -3% | |
| off / environment * (dB) | 28 | 28.4 -1% | 29 -4% | 29.2 -4% | 28.2 -1% | 30 -7% |
| Idle Minimum * (dB) | 29.4 | 31.9 -9% | 30.4 -3% | 33.9 -15% | 35.6 -21% | 30 -2% |
| Idle Average * (dB) | 30.7 | 32 -4% | 32.1 -5% | 33.9 -10% | 35.6 -16% | 33 -7% |
| Idle Maximum * (dB) | 34 | 34 -0% | 32.1 6% | 33.9 -0% | 35.7 -5% | 37 -9% |
| Load Average * (dB) | 42 | 47 -12% | 45.6 -9% | 43.8 -4% | 50.2 -20% | 41 2% |
| Witcher 3 ultra * (dB) | 45.8 | 50.2 -10% | 42 8% | |||
| Load Maximum * (dB) | 45.8 | 49.4 -8% | 51.5 -12% | 53.4 -17% | 50.2 -10% | 50 -9% |
* ... smaller is better
Temperature
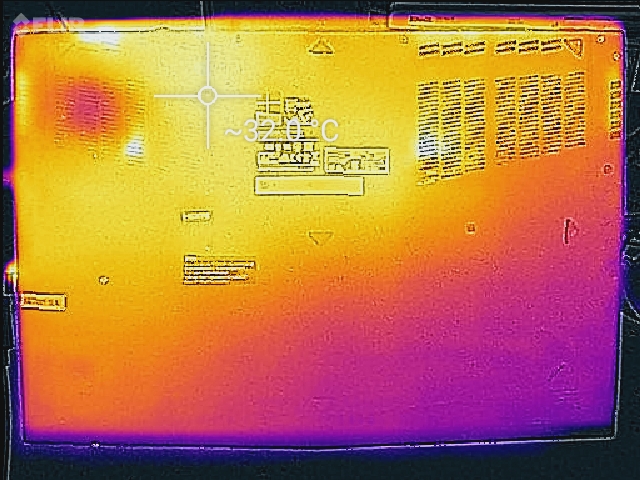
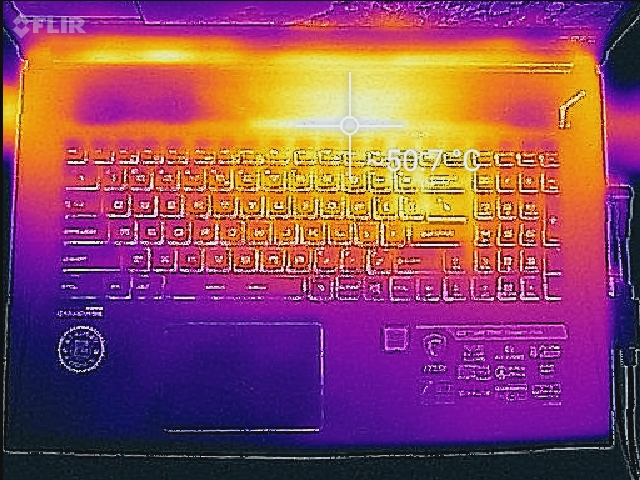
Surface temperatures are flat on both sides when idling with no uncomfortably warm hot spots. When gaming, the palm rests and trackpad remain relatively cool compared to the keyboard. The WASD keys in particular are always cooler than the rest of the keyboard for more comfortable gaming.
Our temperature maps below show a hot spot of over 50 C immediately above the 'F12' key where users are not likely to touch often during gameplay. In comparison, this same spot on the much larger GT73VR is only about 39 C when subjected to similar processing loads. The higher surface temperature is common on super-thin gaming notebooks like the Asus Zephyrus, Gigabyte P57, and Razer Blade and is only a tad cooler than on last year's GS73VR.
Heat escapes from four sets of ventilation grilles spread across the left, right, and rear edges with additional intake ventilation on the bottom panel and above the keyboard keys. The large number of holes is likely necessary to allow as much breathing room as possible for the tightly-packed innards.
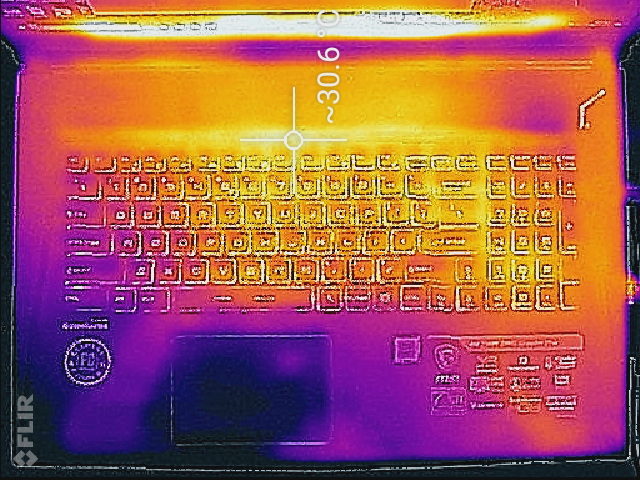
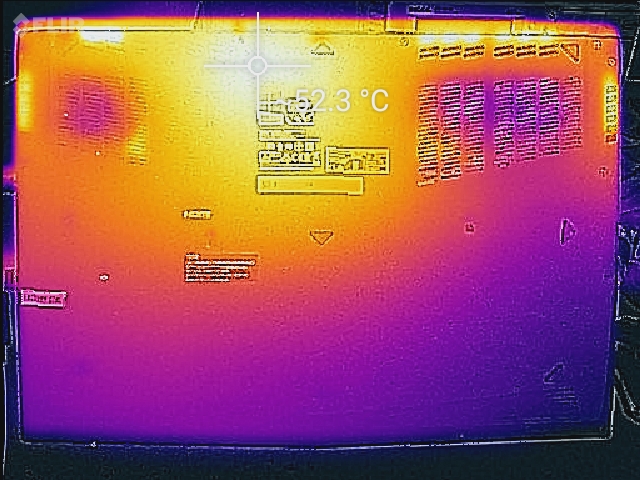
(-) The maximum temperature on the upper side is 52.2 °C / 126 F, compared to the average of 40.4 °C / 105 F, ranging from 21.2 to 68.8 °C for the class Gaming.
(-) The bottom heats up to a maximum of 46.6 °C / 116 F, compared to the average of 43.2 °C / 110 F
(+) In idle usage, the average temperature for the upper side is 28.7 °C / 84 F, compared to the device average of 33.9 °C / 93 F.
(-) Playing The Witcher 3, the average temperature for the upper side is 38.4 °C / 101 F, compared to the device average of 33.9 °C / 93 F.
(+) The palmrests and touchpad are reaching skin temperature as a maximum (33.6 °C / 92.5 F) and are therefore not hot.
(-) The average temperature of the palmrest area of similar devices was 28.8 °C / 83.8 F (-4.8 °C / -8.7 F).
Speakers

The quad speakers and subwoofer are not performing as well as they should considering that they are unchanged from the previous GS73VR 6RF. Our pink noise curve below shows inferior balance and bass on the newer 7RG SKU whereas a broader and flatter curve was recorded on the 6RF. This is likely due to differences in settings and the fact that the Nahimic audio software was not pre-installed on our 7RG test unit. In this case, it's recommended to install Nahimic in order to get the most out of the internal speakers and subwoofer.
Hi-res audio is once again present via the Sabre Audio DAC to support a 24-bit/192 kbps sampling rate. The GS notebooks are some of the few in its class to support the high impedance range of studio-grade earphones.
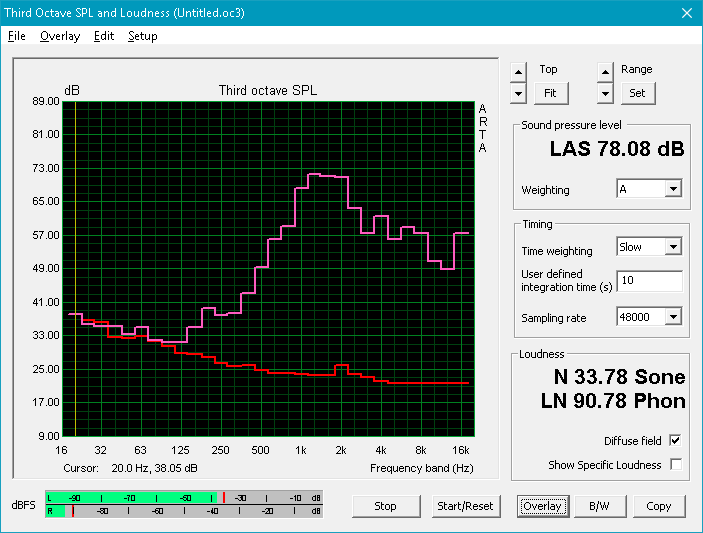
MSI GS73VR 7RG audio analysis
(-) | not very loud speakers (71.6 dB)
Bass 100 - 315 Hz
(-) | nearly no bass - on average 20.4% lower than median
(+) | bass is linear (5.7% delta to prev. frequency)
Mids 400 - 2000 Hz
(±) | higher mids - on average 10% higher than median
(±) | linearity of mids is average (13.2% delta to prev. frequency)
Highs 2 - 16 kHz
(+) | balanced highs - only 3.4% away from median
(±) | linearity of highs is average (14.9% delta to prev. frequency)
Overall 100 - 16.000 Hz
(-) | overall sound is not linear (34.7% difference to median)
Compared to same class
» 99% of all tested devices in this class were better, 1% similar, 1% worse
» The best had a delta of 6%, average was 18%, worst was 132%
Compared to all devices tested
» 93% of all tested devices were better, 1% similar, 6% worse
» The best had a delta of 4%, average was 23%, worst was 134%
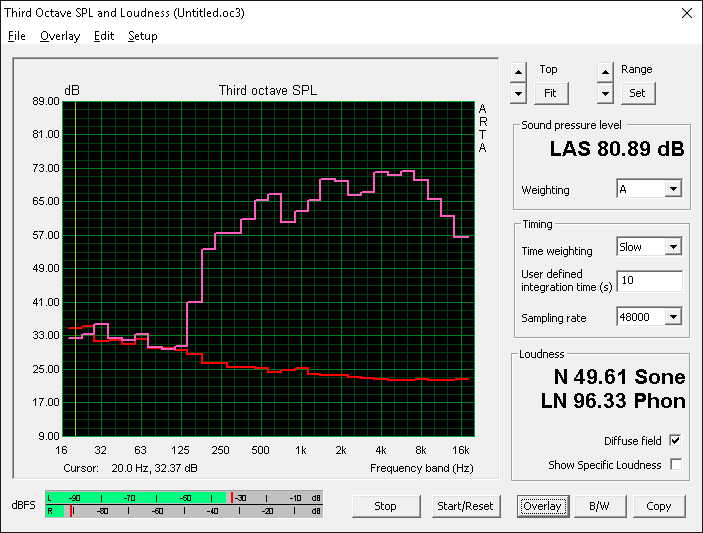
Apple MacBook 12 (Early 2016) 1.1 GHz audio analysis
(+) | speakers can play relatively loud (83.6 dB)
Bass 100 - 315 Hz
(±) | reduced bass - on average 11.3% lower than median
(±) | linearity of bass is average (14.2% delta to prev. frequency)
Mids 400 - 2000 Hz
(+) | balanced mids - only 2.4% away from median
(+) | mids are linear (5.5% delta to prev. frequency)
Highs 2 - 16 kHz
(+) | balanced highs - only 2% away from median
(+) | highs are linear (4.5% delta to prev. frequency)
Overall 100 - 16.000 Hz
(+) | overall sound is linear (10.2% difference to median)
Compared to same class
» 7% of all tested devices in this class were better, 2% similar, 90% worse
» The best had a delta of 5%, average was 18%, worst was 53%
Compared to all devices tested
» 5% of all tested devices were better, 1% similar, 94% worse
» The best had a delta of 4%, average was 23%, worst was 134%
Frequency Comparison (Checkbox selectable!)
Graph 1: Pink Noise 100% Vol.; Graph 2: Audio off
Energy Management
Power Consumption
The GTX 1070 Max-Q may be a 1070 by name, but overall power consumption levels are closer to that of a standard GTX 1060. When under medium (3DMark 06) and gaming loads, the GS73VR is nearly identical to the GTX 1060-powered GF72VR while being significantly more efficient than the GTX 1070-powered Aorus X7 v7 or MSI GE73VR Raider. Witcher 3, for example, will draw about 30 percent less power on the GS73VR 7RG for a comparatively small 10 percent drop in Fire Strike Graphics score.
Maximum load with both Prime95 and FurMark running simultaneously will draw about 161 W from a medium-sized 180 W power adapter (~17 x 8 x 2.5 cm). The system uses the exact same PSU from Chicony as does the Eurocom Q5.
| Off / Standby | |
| Idle | |
| Load |
|
Key:
min: | |
| MSI GS73VR 7RG i7-7700HQ, GeForce GTX 1070 Max-Q, Samsung SSD PM871 MZNLN512HMJP, TN LED, 1920x1080, 17.3" | MSI GF72VR 7RF i7-7700HQ, GeForce GTX 1060 Mobile, Samsung PM961 MZVLW256HEHP, TN LED, 1920x1080, 17.3" | Gigabyte Aero 15X i7-7700HQ, GeForce GTX 1070 Max-Q, Samsung SM961 MZVKW512HMJP m.2 PCI-e, IPS, 1920x1080, 15.6" | Alienware 17 R4 i7-7820HK, GeForce GTX 1080 Mobile, SK Hynix PC300 NVMe 512 GB, TN LED, 2560x1440, 17.3" | MSI GE73VR 7RF Raider i7-7700HQ, GeForce GTX 1070 Mobile, Toshiba HG6 THNSNJ256G8NY, TN WLED, 1920x1080, 17.3" | |
|---|---|---|---|---|---|
| Power Consumption | -13% | 8% | -102% | -20% | |
| Idle Minimum * (Watt) | 10.1 | 15.7 -55% | 10 1% | 37.5 -271% | 10 1% |
| Idle Average * (Watt) | 18.3 | 21.4 -17% | 13 29% | 37.6 -105% | 18 2% |
| Idle Maximum * (Watt) | 19.6 | 21.9 -12% | 20 -2% | 37.6 -92% | 26 -33% |
| Load Average * (Watt) | 87.6 | 83.9 4% | 79 10% | 122.4 -40% | 97 -11% |
| Witcher 3 ultra * (Watt) | 136.3 | 130.2 4% | 120 12% | 180.3 -32% | 183 -34% |
| Load Maximum * (Watt) | 160.7 | 159.6 1% | 165 -3% | 277.4 -73% | 230 -43% |
* ... smaller is better
Battery Life
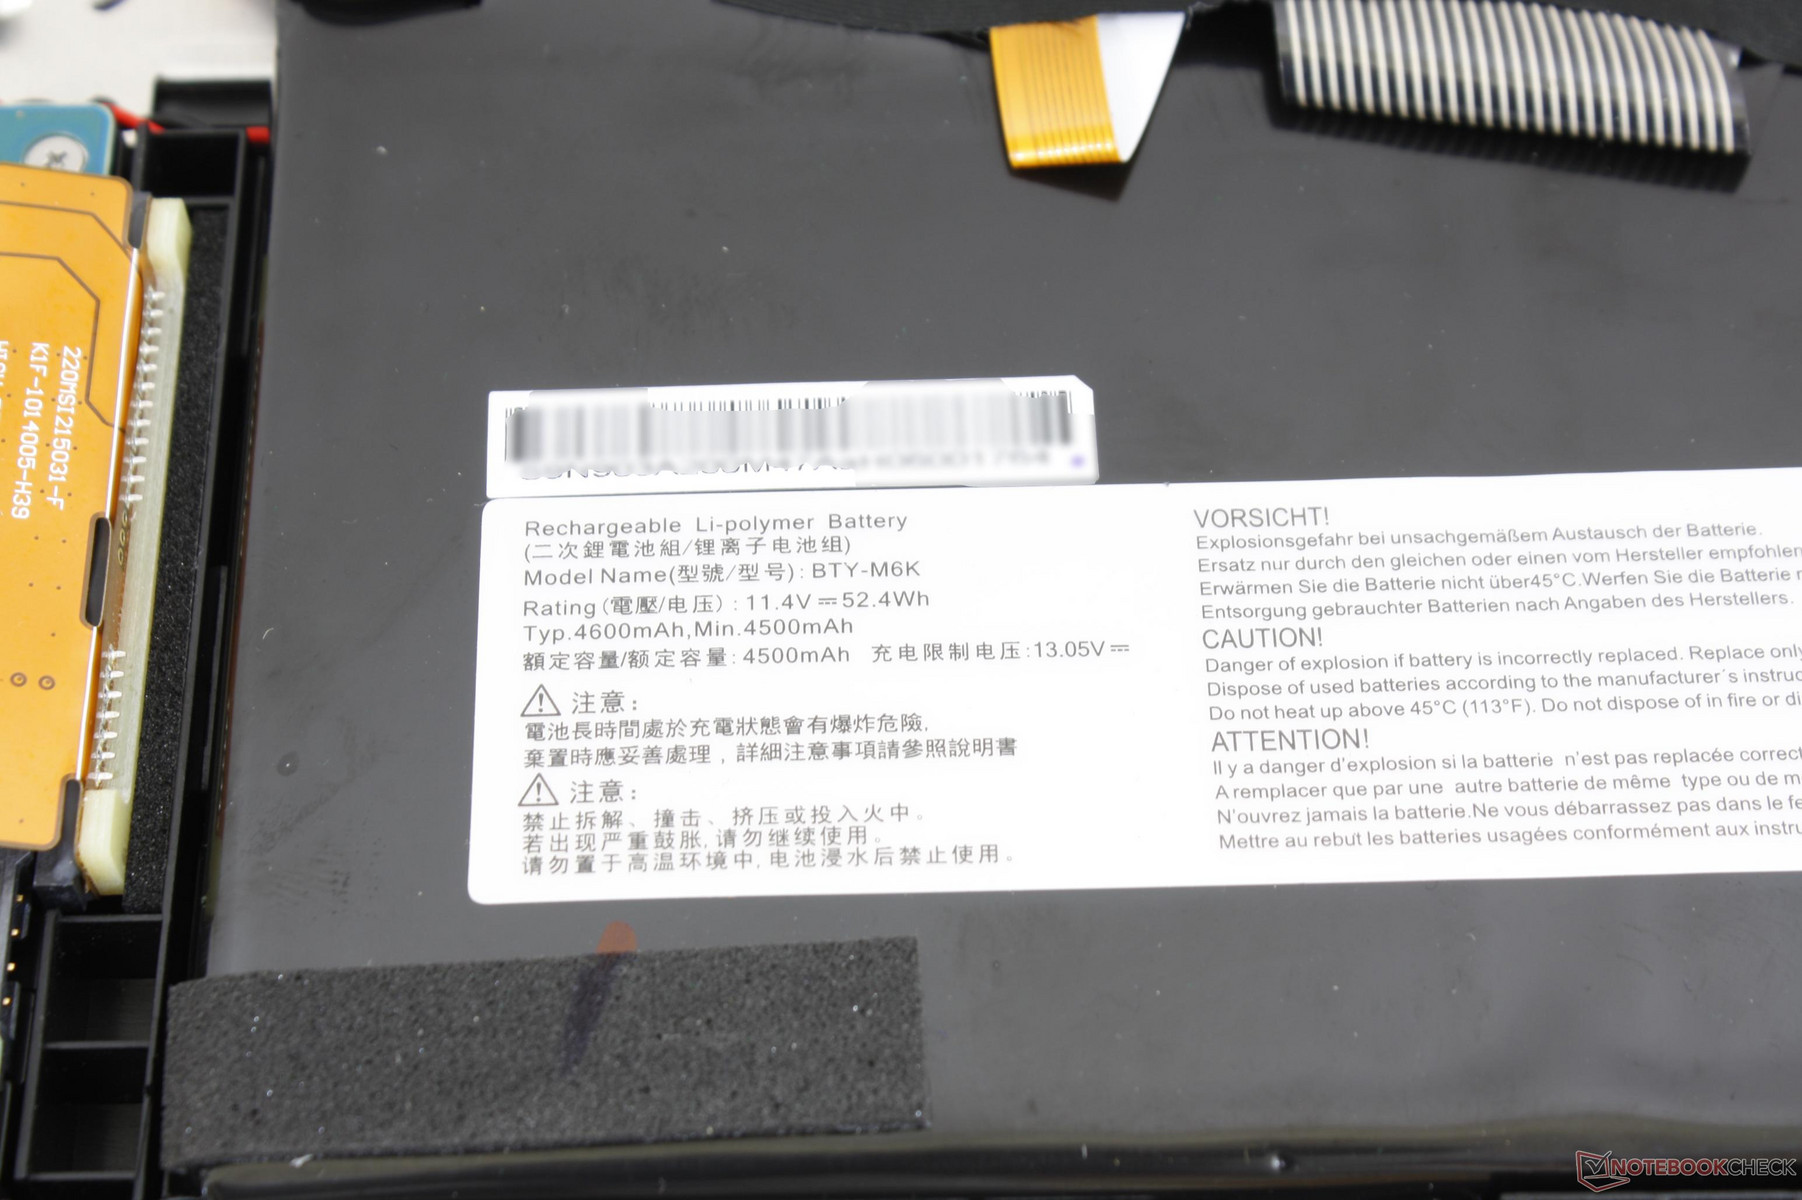
The internal 52 Wh battery is small in size compared to other 17-inch gaming notebooks where 90 Wh or larger batteries are common. The Razer Blade Pro, Aorus X7 v7, and Lenovo Legion Y920 are popular examples with much larger battery capacities than on even the MSI GT series.
Runtimes are typical of a gaming notebook at just over three hours of real-world WLAN use compared to almost five hours on the Legion Y920. Users will be lucky to hit six hours when idling on desktop on Power Saver mode with no background activity. While the increased efficiency of Max-Q is not advertised as a battery-boosting feature, we were still expecting slightly longer runtimes since the GS73VR includes Optimus.
A second GS73VR SKU (GS73VR Stealth Pro-060) includes a larger 65 Wh battery similar to the GS73VR 6RF. It's a bit disappointing that MSI isn't keeping the battery constant across its lineup.
Charging from near empty to full capacity will take just over two hours.
| MSI GS73VR 7RG i7-7700HQ, GeForce GTX 1070 Max-Q, 51 Wh | Aorus X7 v7 i7-7820HK, GeForce GTX 1070 Mobile, 94 Wh | MSI GF72VR 7RF i7-7700HQ, GeForce GTX 1060 Mobile, 43 Wh | Gigabyte Aero 15X i7-7700HQ, GeForce GTX 1070 Max-Q, 94.2 Wh | Alienware 17 R4 i7-7820HK, GeForce GTX 1080 Mobile, 99 Wh | Lenovo Legion Y920-17IKB i7-7820HK, GeForce GTX 1070 Mobile, 90 Wh | |
|---|---|---|---|---|---|---|
| Battery runtime | -1% | -32% | 147% | -2% | 50% | |
| Reader / Idle (h) | 5.8 | 3.7 -36% | 3.4 -41% | 13 124% | 4.6 -21% | 5.9 2% |
| WiFi v1.3 (h) | 3.2 | 3 -6% | 2.4 -25% | 8.2 156% | 3 -6% | 4.7 47% |
| Load (h) | 1 | 1.4 40% | 0.7 -30% | 2.6 160% | 1.2 20% | 2 100% |
Pros
Cons
Verdict

The GS73VR Max-Q refresh makes this the best iteration of the series yet. Not only does it perform faster than the older GTX 1060 SKU under a very similar power envelope, but it also runs quieter and cooler as well. These are exactly the kinds of steps the GS series ought to be taking in order to beat every other super-thin gaming notebook currently in the market.
Even though the GS73VR 7RG is noticeably improved over the GS73VR 7RF and 6RF, it still has a long way to go. The 7RG is one of the loudest Max-Q notebooks we've tested alongside the recent Eurocom Q5. It's not nearly as loud as say the full-size Alienware 17 or Eurocom Tornado F5, but it's straddling the line between "Max-Q GTX" and "standard GTX" a bit too comfortably for our liking. The Asus Zephyrus is a smaller notebook yet it is able to house and cool a GTX 1080 Max-Q at much quieter fan speeds.
Aside from the aforementioned improvements, all the pros and cons of the previous GS73VR iterations carry over. The chassis could be stiffer, the trackpad firmer, and overall construction quality may be imperfect around the edges. It still boggles us why removing the bottom panel will automatically void the warranty when simply swapping the HDD is actually a very easy process. The 120 Hz display and SteelSeries keyboard are otherwise hard not to like.
This is both the quietest and most powerful version of the GS73VR money can buy. Overall, however, there are more powerful and even quieter Max-Q notebooks out there particularly in the 15-inch space where the Zephyrus GX501 and Predator Triton currently reign supreme.
MSI GS73VR 7RG
- 10/19/2017 v6 (old)
Allen Ngo
Price comparison
