Coffee Lake: i7-8700K and i5-8400 Review
Coffee Lake
For the original German article, see here.
One of the many selling points of Intel’s eighth-generation Core processors named Coffee Lake is a 15% higher SysMark performance. However, we wouldn’t consider this to be its main selling point. Instead, that honor would go to the major restructuring that took place within Intel’s portfolio: the i7-8700(K), i7-8600K and i5-8400 are all equipped with six physical cores - a first for Intel, whose end-user processor line-up topped out at four cores until now. In addition to two extra cores, single-threaded performance is supposed to remain persistently high thanks to consistently high clock speeds.
Despite the fact that the underlying architecture remained mostly identical to its Kaby Lake predecessor, the new processors are incompatible with already existing Kaby Lake motherboards. Once again, Intel’s tick-tock model that once promised a new architecture roughly every three years does not apply anymore: Coffee Lake is the fourth generation of 14 nm microprocessors. The integrated graphics card has also remained almost identical to its predecessor despite the change of name. While the Intel UHD Graphics 630 now supports DisplayPort 1.2 as well as HDMI 2.0, the 50 MHz boost in frequency is negligible.
| Model | Cores - Threads | Base Frequency | Turbo Boost | L3-Cache | TDP | Street Price, (List Price) |
| Core i7-8700K | 6-12 | 3.7 GHz | 4.7 GHz | 12 MB | 95 Watts | 359 Dollars |
| Core i7-8700 | 6-12 | 3.2 GHz | 4.6 GHz | 12 MB | 65 Watts | 303 Dollars |
| Core i5-8600K | 6-6 | 3.6 GHz | 4.3 GHz | 9 MB | 95 Watts | 257 Dollars |
| Core i5-8400 | 6-6 | 2.8 GHz | 4.0 GHz | 9 MB | 65 Watts | 182 Dollars |
| Core i3-8350K | 4-4 | 4.0 GHz | - | 6 MB | 91 Watts | 168 Dollars |
| Core i3-8100 | 4-4 | 3.6 GHz | - | 6 MB | 65 Watts | 117 Dollars |
| Core i7-7740X | 4-8 | 4.3 GHz | 4.5 GHz | 8 MB | 112 Watts | 350 Euros |
| Core i7-7700K | 4-8 | 4.2 GHz | 4.5 GHz | 8 MB | 95 Watts | 330 Euros |
| Ryzen R7 1700X | 8-16 | 3.4 GHz | 3.8/3.5 GHz | 16 MB | 95 Watts | 360 Euros |
| Ryzen R5 1600 | 6-12 | 3.2 GHz | 3.6 GHz | 16 MB | 65 Watts | 210 Euros |
Core i7-8700K and i5-8400
Both Coffee Lake processors reviewed by us, the i7-8700K and the i5-8400, feature a total of six physical cores but differ in the number of simultaneous threads, cache size, clock speed, and obviously price: the i7-8700K is twice as expensive as the i5-8400.
Priced similarly as the Ryzen R7 1700X, the i7-8700K offers fewer cores but a higher clock speed than its main competitor. In-house competition is composed of the i7-7700K albeit with less cores and a lower clock speed. The i5-8400 is priced similarly to the Ryzen R5 1600, and although the latter offers a total of six cores and 12 threads its maximum turbo boost frequency is slightly lower.
Synthetic Benchmarks
Cinebench R15
This particular synthetic benchmark allows for a quick and easy quantification of raw computing power by measuring the time it takes to render a scene consisting of more than 2,000 objects and 300,000 polygons. Given that it supports multiple threads, the benchmark benefits not only from high clock speeds but also the number of cores and threads available. The single-thread test benefits greatly from high clock speeds and cache.
In theory, it is feasible that some processors are better suited for Cinebench’s computation requirements but from our experience this particular benchmark is very well suited for a quick comparison of theoretical maximum processing power.
What surprised us most was the Core i7-8700K’s single-thread performance - it equaled the i7-7700K’s excellent high score. AMD’s Ryzen CPUs fall at least 15% behind in this test.
Even the i5-8400 managed to outperform the Ryzen R7 1800X in this test, albeit only slightly. Its lead on the similarly priced 1700X is more pronounced yet still within acceptable margins. However, the gap between it and both Core i7-X700K models is enormous.
As expected, the i7-8700K outperformed its in-house competitors in the multithread benchmark with ease but was in turn overtaken by the slightly cheaper yet 9% faster Ryzen R7 1700X. Compared to its own predecessor, the i7-7700K, the difference was a staggering 45% - which pretty much reflects the difference in cores between these two.
The Core i5-8400 we will have to file under also-ran. Despite its two additional cores it fails to best the Core i7-7700K and is around 16% slower than its main competitor, the Ryzen R5 1600.
| Cinebench R15 | |
| CPU Single 64Bit | |
| Intel Core i7-7740X | |
| Intel Core i7-7700K | |
| Intel Core i7-8700K | |
| Intel Core i9-7900X | |
| Intel Core i5-7600K | |
| Intel Core i5-8400 | |
| AMD Ryzen 7 1800X | |
| AMD Ryzen 7 1700X | |
| AMD Ryzen 5 1500X | |
| Intel Core i7-7700HQ | |
| AMD Ryzen 7 1700 | |
| AMD Ryzen 5 1600 | |
| AMD Ryzen 5 1400 | |
| CPU Multi 64Bit | |
| Intel Core i9-7900X | |
| AMD Ryzen 7 1800X | |
| AMD Ryzen 7 1700X | |
| Intel Core i7-8700K | |
| AMD Ryzen 7 1700 | |
| AMD Ryzen 5 1600 | |
| Intel Core i7-7740X | |
| Intel Core i7-7700K | |
| Intel Core i5-8400 | |
| AMD Ryzen 5 1500X | |
| Intel Core i7-7700HQ | |
| AMD Ryzen 5 1400 | |
| Intel Core i5-7600K | |
TrueCrypt
TrueCrypt uses various encryption algorithms in order to determine processing power. Unlike Cinebench R15, this benchmark is much closer to real-world usage scenarios even though the implications regarding everyday performance are rather minor. The algorithms used in this benchmark are Serpent, Twofish, and Rijndael (more commonly known as AES).
It profits mainly from high clock speeds on all cores, which is why the i7-8700K manages to beat its own predecessor by a whopping 46%. That said, AMD’s Ryzen R7 1700X is yet another 10% faster. The cheaper i5-8400 is only around 10% slower than the roughly $100 more expensive i7-7700K, but like before the comparatively priced Ryzen R5 1600 is slightly faster once again.
| Performance rating - Percent | |
| Intel Core i9-7900X | |
| AMD Ryzen 7 1800X | |
| AMD Ryzen 7 1700X | |
| Intel Core i7-8700K | |
| AMD Ryzen 5 1600 | |
| AMD Ryzen 5 1600 | |
| Intel Core i7-7740X | |
| Intel Core i7-7700K | |
| Intel Core i5-8400 | |
| AMD Ryzen 5 1500X | |
| AMD Ryzen 5 1400 | |
| Intel Core i5-7600K | |
| TrueCrypt | |
| Serpent Mean 100MB | |
| Intel Core i9-7900X | |
| AMD Ryzen 7 1800X | |
| AMD Ryzen 7 1700X | |
| Intel Core i7-8700K | |
| AMD Ryzen 5 1600 | |
| AMD Ryzen 5 1600 | |
| Intel Core i7-7700K | |
| Intel Core i7-7740X | |
| Intel Core i5-8400 | |
| AMD Ryzen 5 1500X | |
| AMD Ryzen 5 1400 | |
| Intel Core i5-7600K | |
| Twofish Mean 100MB | |
| Intel Core i9-7900X | |
| AMD Ryzen 7 1800X | |
| AMD Ryzen 7 1700X | |
| Intel Core i7-8700K | |
| AMD Ryzen 5 1600 | |
| AMD Ryzen 5 1600 | |
| Intel Core i7-7740X | |
| Intel Core i7-7700K | |
| Intel Core i5-8400 | |
| AMD Ryzen 5 1500X | |
| AMD Ryzen 5 1400 | |
| Intel Core i5-7600K | |
| AES Mean 100MB | |
| Intel Core i9-7900X | |
| AMD Ryzen 7 1800X | |
| AMD Ryzen 7 1700X | |
| Intel Core i7-8700K | |
| AMD Ryzen 5 1600 | |
| Intel Core i7-7740X | |
| Intel Core i7-7700K | |
| AMD Ryzen 5 1600 | |
| Intel Core i5-8400 | |
| AMD Ryzen 5 1500X | |
| AMD Ryzen 5 1400 | |
| Intel Core i5-7600K | |
wPrime
wPrime uses Newton’s method for estimating functions in order to calculate square roots, verifying the results by squaring them and comparing the result with the original number. This synthetic benchmark uses all available cores.
As before, the Ryzen R7 1700X manages to easily outperform both Coffee Lake contenders by 9% (i7-8700K) and 76% (i5-8400), respectively. While the latter did score higher than the Ryzen R5 1500X in this benchmark, it was nowhere near the Ryzen R5 1600’s level of performance. In return, the i7-7700K was only around 11% faster.
| wPrime 2.10 | |
| 1024m | |
| Intel Core i5-7600K | |
| AMD Ryzen 5 1400 | |
| AMD Ryzen 5 1500X | |
| Intel Core i5-8400 | |
| Intel Core i7-7700K | |
| Intel Core i7-7740X | |
| Intel Core i7-8700K | |
| AMD Ryzen 7 1700X | |
| AMD Ryzen 7 1800X | |
| Intel Core i9-7900X | |
| 32m | |
| Intel Core i5-7600K | |
| AMD Ryzen 5 1400 | |
| AMD Ryzen 5 1500X | |
| Intel Core i5-8400 | |
| Intel Core i7-7700K | |
| Intel Core i7-7740X | |
| Intel Core i7-8700K | |
| AMD Ryzen 7 1700X | |
| AMD Ryzen 7 1800X | |
| Intel Core i9-7900X | |
* ... smaller is better
Other Synthetic Benchmarks
As usual, we would like to present you with additional synthetic benchmark results without commenting on them individually. The WinRAR benchmark results have to be taken with a grain of salt since they performed very oddly on Ryzen systems.
| Geekbench 4.0 | |
| 64 Bit Single-Core Score | |
| Intel Core i7-8700K | |
| Intel Core i7-8700K | |
| Intel Core i7-7740X | |
| Intel Core i7-7700K | |
| Intel Core i5-7600K | |
| Intel Core i5-8400 | |
| Intel Core i9-7900X | |
| AMD Ryzen 7 1800X | |
| AMD Ryzen 7 1700X | |
| Intel Core i7-7700HQ | |
| AMD Ryzen 7 1700 | |
| AMD Ryzen 5 1500X | |
| AMD Ryzen 5 1600 | |
| AMD Ryzen 5 1400 | |
| 64 Bit Multi-Core Score | |
| Intel Core i9-7900X | |
| Intel Core i7-8700K | |
| Intel Core i7-8700K | |
| AMD Ryzen 7 1800X | |
| AMD Ryzen 7 1700X | |
| AMD Ryzen 7 1700 | |
| Intel Core i5-8400 | |
| Intel Core i7-7740X | |
| AMD Ryzen 5 1600 | |
| Intel Core i7-7700K | |
| Intel Core i5-7600K | |
| AMD Ryzen 5 1500X | |
| Intel Core i7-7700HQ | |
| AMD Ryzen 5 1400 | |
| WinRAR - Result | |
| Intel Core i7-8700K | |
| Intel Core i7-8700K | |
| Intel Core i7-7740X | |
| Intel Core i9-7900X | |
| Intel Core i7-7700K | |
| Intel Core i5-8400 | |
| AMD Ryzen 7 1800X | |
| AMD Ryzen 7 1700X | |
| AMD Ryzen 5 1500X | |
| AMD Ryzen 5 1600 | |
| Intel Core i5-7600K | |
| AMD Ryzen 5 1400 | |
| X264 HD Benchmark 4.0 | |
| Pass 1 | |
| Intel Core i7-7740X | |
| Intel Core i7-8700K | |
| Intel Core i7-8700K | |
| Intel Core i7-7700K | |
| Intel Core i5-8400 | |
| Intel Core i5-7600K | |
| Intel Core i9-7900X | |
| AMD Ryzen 7 1800X | |
| AMD Ryzen 7 1700X | |
| AMD Ryzen 5 1600 | |
| AMD Ryzen 5 1500X | |
| AMD Ryzen 5 1400 | |
| Pass 2 | |
| Intel Core i9-7900X | |
| AMD Ryzen 7 1800X | |
| AMD Ryzen 7 1700X | |
| Intel Core i7-8700K | |
| Intel Core i7-8700K | |
| AMD Ryzen 5 1600 | |
| Intel Core i7-7740X | |
| Intel Core i7-7700K | |
| Intel Core i5-8400 | |
| AMD Ryzen 5 1500X | |
| Intel Core i5-7600K | |
| AMD Ryzen 5 1400 | |
| PCMark 8 | |
| Home Score Accelerated v2 | |
| Intel Core i7-7740X | |
| Intel Core i9-7900X | |
| Intel Core i7-7700K | |
| Intel Core i5-7600K | |
| AMD Ryzen 7 1800X | |
| Intel Core i7-8700K | |
| AMD Ryzen 5 1500X | |
| AMD Ryzen 7 1700X | |
| AMD Ryzen 7 1700 | |
| AMD Ryzen 5 1600 | |
| AMD Ryzen 5 1400 | |
| Intel Core i7-7700HQ | |
| Work Score Accelerated v2 | |
| Intel Core i9-7900X | |
| Intel Core i7-7700HQ | |
| Intel Core i7-7700K | |
| Intel Core i7-7740X | |
| Intel Core i7-8700K | |
| AMD Ryzen 5 1500X | |
| AMD Ryzen 7 1800X | |
| AMD Ryzen 7 1700X | |
| AMD Ryzen 5 1600 | |
| AMD Ryzen 7 1700 | |
| AMD Ryzen 5 1400 | |
| 3DMark | |
| 1920x1080 Fire Strike Physics | |
| Intel Core i9-7900X | |
| Intel Core i7-8700K | |
| AMD Ryzen 7 1800X | |
| AMD Ryzen 7 1700X | |
| AMD Ryzen 7 1700 | |
| AMD Ryzen 5 1600 | |
| Intel Core i7-7740X | |
| Intel Core i7-7700K | |
| Intel Core i5-8400 | |
| AMD Ryzen 5 1400 | |
| Intel Core i7-7700HQ | |
| Intel Core i5-7600K | |
| 2560x1440 Time Spy CPU | |
| Intel Core i9-7900X | |
| AMD Ryzen 7 1800X | |
| AMD Ryzen 7 1700X | |
| AMD Ryzen 7 1700X | |
| AMD Ryzen 7 1700 | |
| Intel Core i7-7740X | |
| AMD Ryzen 5 1600 | |
| Intel Core i5-8400 | |
| Intel Core i7-7700K | |
| Intel Core i7-7700HQ | |
| Intel Core i5-7600K | |
| AMD Ryzen 5 1500X | |
| AMD Ryzen 5 1400 | |
| 3DMark 11 - 1280x720 Performance Physics | |
| Intel Core i9-7900X | |
| AMD Ryzen 7 1800X | |
| AMD Ryzen 7 1700 | |
| Intel Core i7-7740X | |
| Intel Core i7-7700K | |
| AMD Ryzen 5 1600 | |
| AMD Ryzen 5 1500X | |
| Intel Core i7-7700HQ | |
| AMD Ryzen 5 1400 | |
| 3DMark 06 - CPU - CPU Score | |
| Intel Core i9-7900X | |
| Intel Core i7-8700K | |
| Intel Core i7-7740X | |
| Intel Core i7-7700K | |
| AMD Ryzen 7 1700 | |
| Intel Core i5-7600K | |
| AMD Ryzen 5 1600 | |
| Intel Core i7-7700HQ | |
| AMD Ryzen 5 1500X | |
| AMD Ryzen 5 1400 | |
Preliminary Recap
In synthetic benchmarks, the i7-8700K performed exceptionally well. Its single-core performance is comparable to the i7-7700K (which means that it outperforms the entire Ryzen line-up) yet it doesn’t fall too far behind in multi-core tests. The i7-8700K is thus a very decent combination of high single- and multi-core performance, a mix that AMD has failed to deliver so far.
In single-core benchmarks, the i5-8400 managed to best every single Ryzen CPU, but it failed to keep up with the Core i7-7700K despite its two extra cores due to its lower clock speeds and its lack of Hyper-Threading.
Gaming Benchmarks
Test System
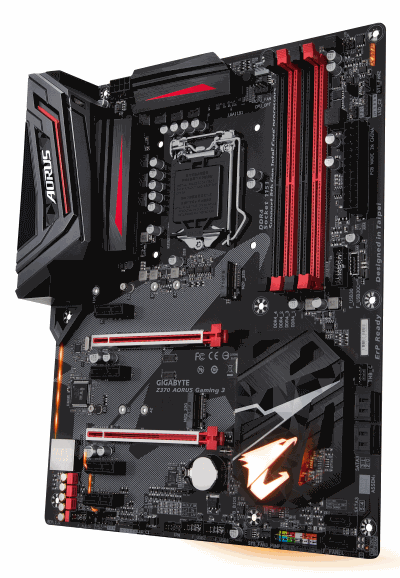
Powerful CPUs demand powerful GPUs, and we’ve chose a GeForce GTX 1080 Ti Founders Edition - one of the fastest currently available graphics cards - which we installed in an Aorus Z370 Ultra Gaming motherboard by Gigabyte accompanied by 16 GB of dual-channel DDR4-3000 RAM.
Further details regarding the specific motherboards for each of the other processors in this comparison can be found in the respective reviews thereof.
In order to determine the real effect of CPU performance on video games we had to eliminate the GPU as determining factor, and we were consequently forced to choose a rather unrealistic gaming scenario: low resolution and minimum details to achieve maximum CPU load.
Frame Rates
Average frame rates in For Honor were excellent for both Coffee Lake contestants, and they easily outperformed all available Ryzen CPUs. The i7-8700K was almost exactly as fast as the i7-7700K while the i5-8400 was 14% slower.
In The Witcher 3, our most frequently used and therefore also most important gaming benchmark, both Coffee Lake processors easily beat the entire Ryzen line-up at 1024x768 and low details once again. In this test, even the i5-8400 was at least as fast as the fastest Ryzen consumer CPU, the R7 1800X.
The i7-8700K achieved spectacular results in The Witcher 3. It was only slightly slower than the more than $1,000 expensive Intel Core i9-7900X, around 8% faster than the i7-7700K, and roughly 23% faster than the Ryzen 7 1800X.
| Farming Simulator 17 - 3840x2160 High Preset AA:2xMS AF:2x | |
| Intel Core i7-7740X | |
| Intel Core i5-7600K | |
| Intel Core i7-7700K | |
| Intel Core i9-7900X | |
| AMD Ryzen 5 1500X | |
| Intel Core i7-8700K | |
| Intel Core i5-8400 | |
| Intel Core i7-5960X | |
| AMD Ryzen 7 1800X | |
| AMD Ryzen 5 1600 | |
| AMD Ryzen 7 1700 | |
| AMD Ryzen 5 1400 | |
| The Witcher 3 | |
| 1920x1080 Ultra Graphics & Postprocessing (HBAO+) | |
| Intel Core i7-7740X | |
| Intel Core i7-8700K | |
| Intel Core i5-8400 | |
| Intel Core i7-7700K | |
| AMD Ryzen 7 1700 | |
| AMD Ryzen 7 1800X | |
| Intel Core i9-7900X | |
| AMD Ryzen 5 1500X | |
| AMD Ryzen 5 1400 | |
| AMD Ryzen 5 1600 | |
| 1024x768 Low Graphics & Postprocessing | |
| Intel Core i9-7900X | |
| Intel Core i7-8700K | |
| Intel Core i7-7740X | |
| Intel Core i7-7700K | |
| Intel Core i5-8400 | |
| AMD Ryzen 7 1800X | |
| AMD Ryzen 7 1700 | |
| AMD Ryzen 5 1600 | |
| AMD Ryzen 5 1500X | |
| AMD Ryzen 5 1400 | |
| For Honor | |
| 3840x2160 High Preset AA:T AF:8x | |
| Intel Core i7-7700K | |
| Intel Core i7-7740X | |
| AMD Ryzen 7 1700 | |
| Intel Core i9-7900X | |
| Intel Core i5-7600K | |
| AMD Ryzen 5 1500X | |
| AMD Ryzen 5 1400 | |
| Intel Core i5-8400 | |
| Intel Core i7-8700K | |
| AMD Ryzen 5 1600 | |
| AMD Ryzen 7 1800X | |
| Intel Core i7-5960X | |
| 1280x720 Low Preset | |
| Intel Core i7-7740X | |
| Intel Core i7-7700K | |
| Intel Core i7-8700K | |
| Intel Core i5-8400 | |
| AMD Ryzen 5 1500X | |
| Intel Core i5-7600K | |
| AMD Ryzen 5 1600 | |
| AMD Ryzen 5 1400 | |
| AMD Ryzen 7 1800X | |
| Intel Core i7-5960X | |
| AMD Ryzen 7 1700 | |
| Intel Core i9-7900X | |
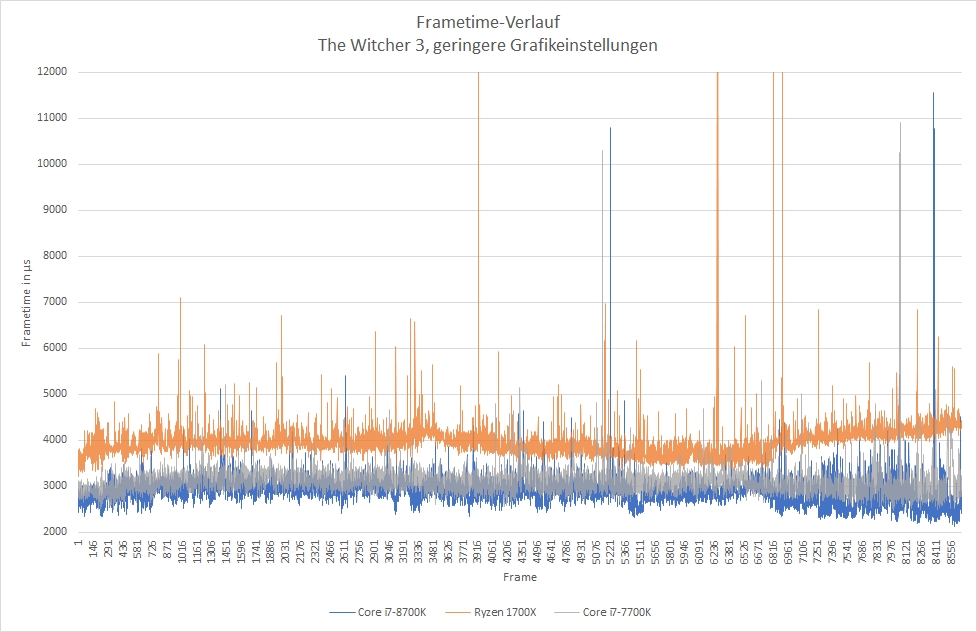
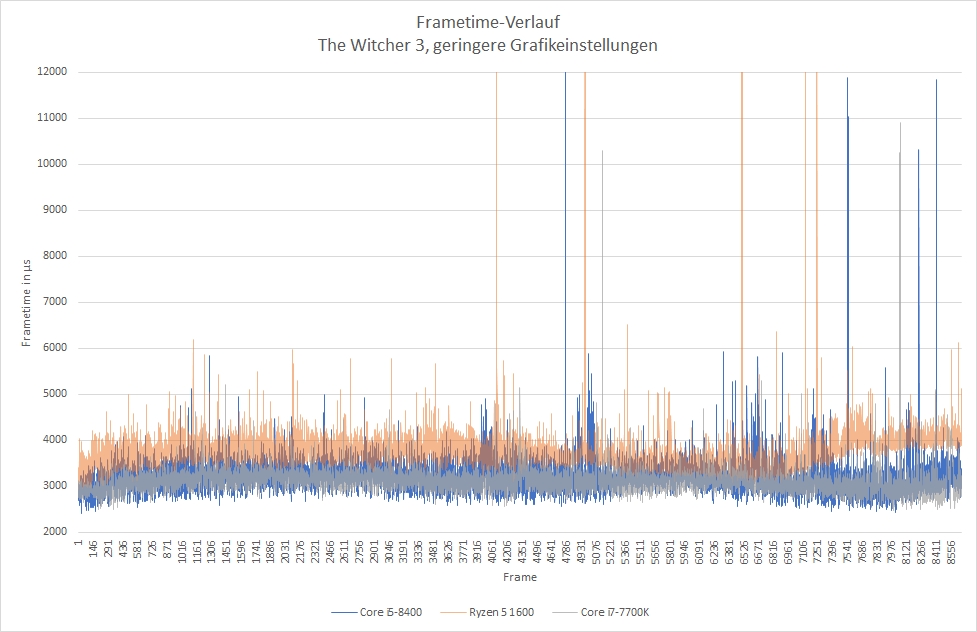
Frame Time Analysis
In our frame time analysis, the Core i7-8700K presented itself as an excellent choice for gamers. There are almost no spikes and outliers, and its base frame rate is better than the Ryzen 7 1700X’s or the Core i7-7700K’s.
While the i5-8400 offered lower frame rates overall, it was very consistent. It is worth noting that both the i7-8700K and the i5-8400 have a comparatively high number of minor frame time deviations, yet major deviations are much less common than on Ryzen processors. Given that the latter have a higher overall average frame time the difference is even more pronounced due to the higher margins.
| Model | Core i7-8700K | Core i5-8400 | Core i7-7700K | Core i7-7740X | Ryzen R7 1800X | Ryzen R7 1700 | Ryzen R5 1600 |
| Frame time (Median, in µs) | 2,953 | 3,269 | 3,169 | 3,032 | 3,525 | 3,823 | 3,840 |
| min. 20 % deviation | 1.963% | 3.789% | 1.555% | 1.891% | 0.473% | 1.129% | 1.104% |
| min. 50 % deviation | 0.186% | 0.263% | 0.187% | 0.266% | 0.141% | 0.213% | 0.176% |
| min. 100 % deviation | 0.056% | 0.052% | 0.049% | 0.091% | 0.068% | 0.066% | 0.047% |
| min. 300 % deviation | 0.010% | 0.000% | 0.000% | 0.032% | 0.018% | 0.053% | 0.020% |
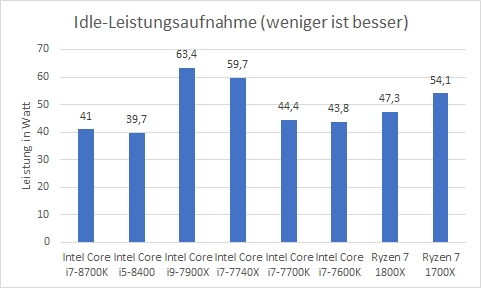
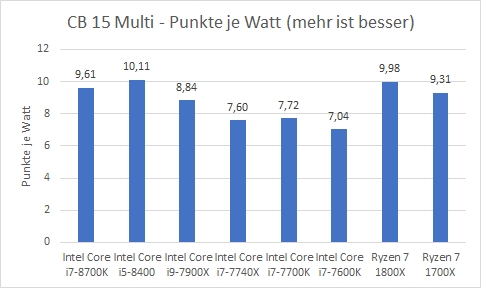
Energy Efficiency
Power consumption is measured at the outlet and is therefore the sum of all components. Accordingly, the significance in regard to microprocessor-specific power consumption is rather limited.
The upside to this is that we can present you with a much more realistic assessment of total power draw as a combination of motherboard, graphics card, and RAM. While conclusive statements regarding the energy efficiency of one specific processor are impossible to make in this scenario, we can at least draw indirect deductions from our measurements.
That said, both Coffee Lake processors were pretty low-key when idle but much less efficient per watt in Cinebench R15 than others.
Verdict
Whether or not we have to thank AMD for Intel’s quick turnaround on the availability of six-core consumer-grade CPUs we will never know for sure. However, it became very clear to us that the Core i7-8700K hits the sweet spot of multi-core performance almost on a par with Ryzen and a very high single-core performance to boot. Accordingly, it fares very well in video games and is therefore an extremely versatile microprocessor for professionals and consumers alike. The same can be said about the i5-8400: its gaming performance is exceptional when compared to AMD’s Ryzen, and it is therefore definitely highly recommendable for gamers.
Additional Benchmarks
Clevo, a well-known notebook distributor, has published additional Cinebench R15 results of various CPUs that we did not have at our disposal at the time of writing. According to that list, the i7-8700 scored 1,208/192 points (multi/single), the i5-8600K scored 1013/183 points, and the i3-8100 scored 590/154 points. This means that in single-thread performance, even the i3-8100 is almost as fast as AMD’s Ryzen R7 1800X. On the other hand, in multi-core it would be slower than the Ryzen 5 1400.
Review Samples
The review samples for this review have been provided by Intel (CPU) and AMD (Ryzen CPUs, Asus motherboard, memory, Noctua cooler). The motherboard was provided by Gigabyte.
