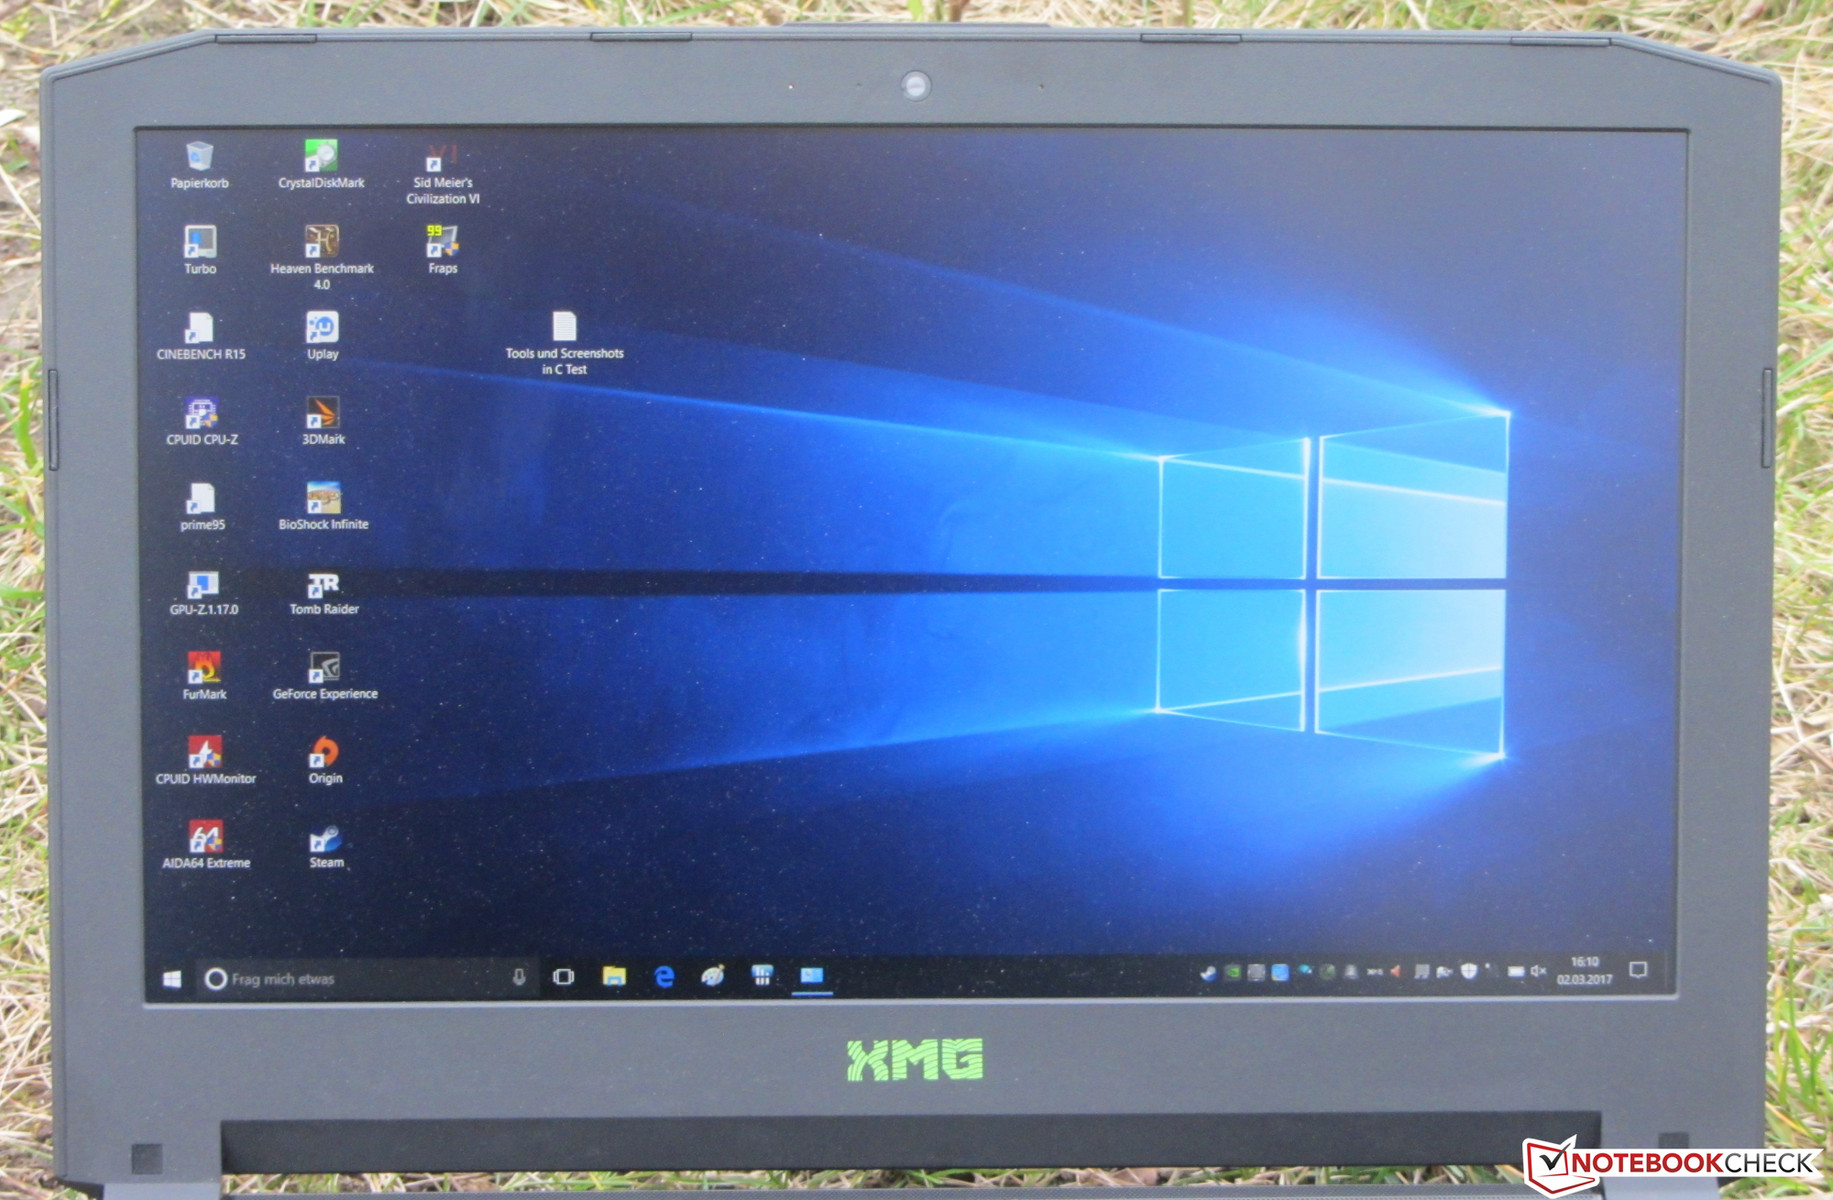
Schenker Technologies XMG P407 (Clevo P641HK1) Notebook Review
For the original German review, see here.
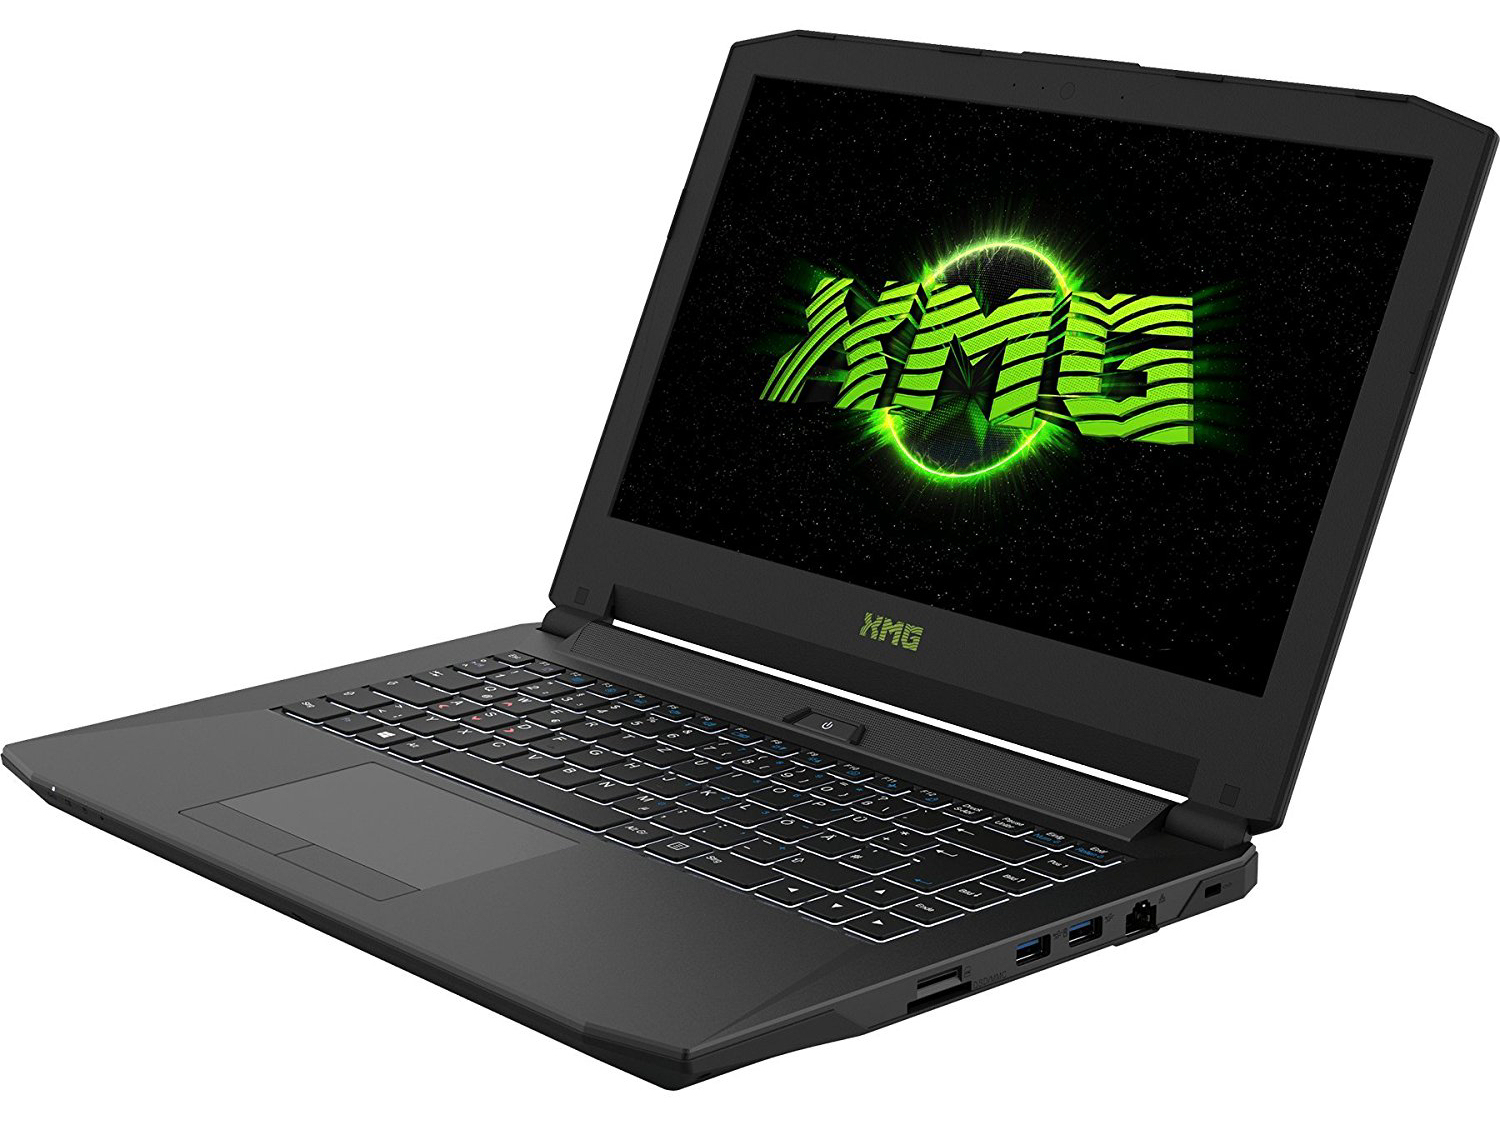
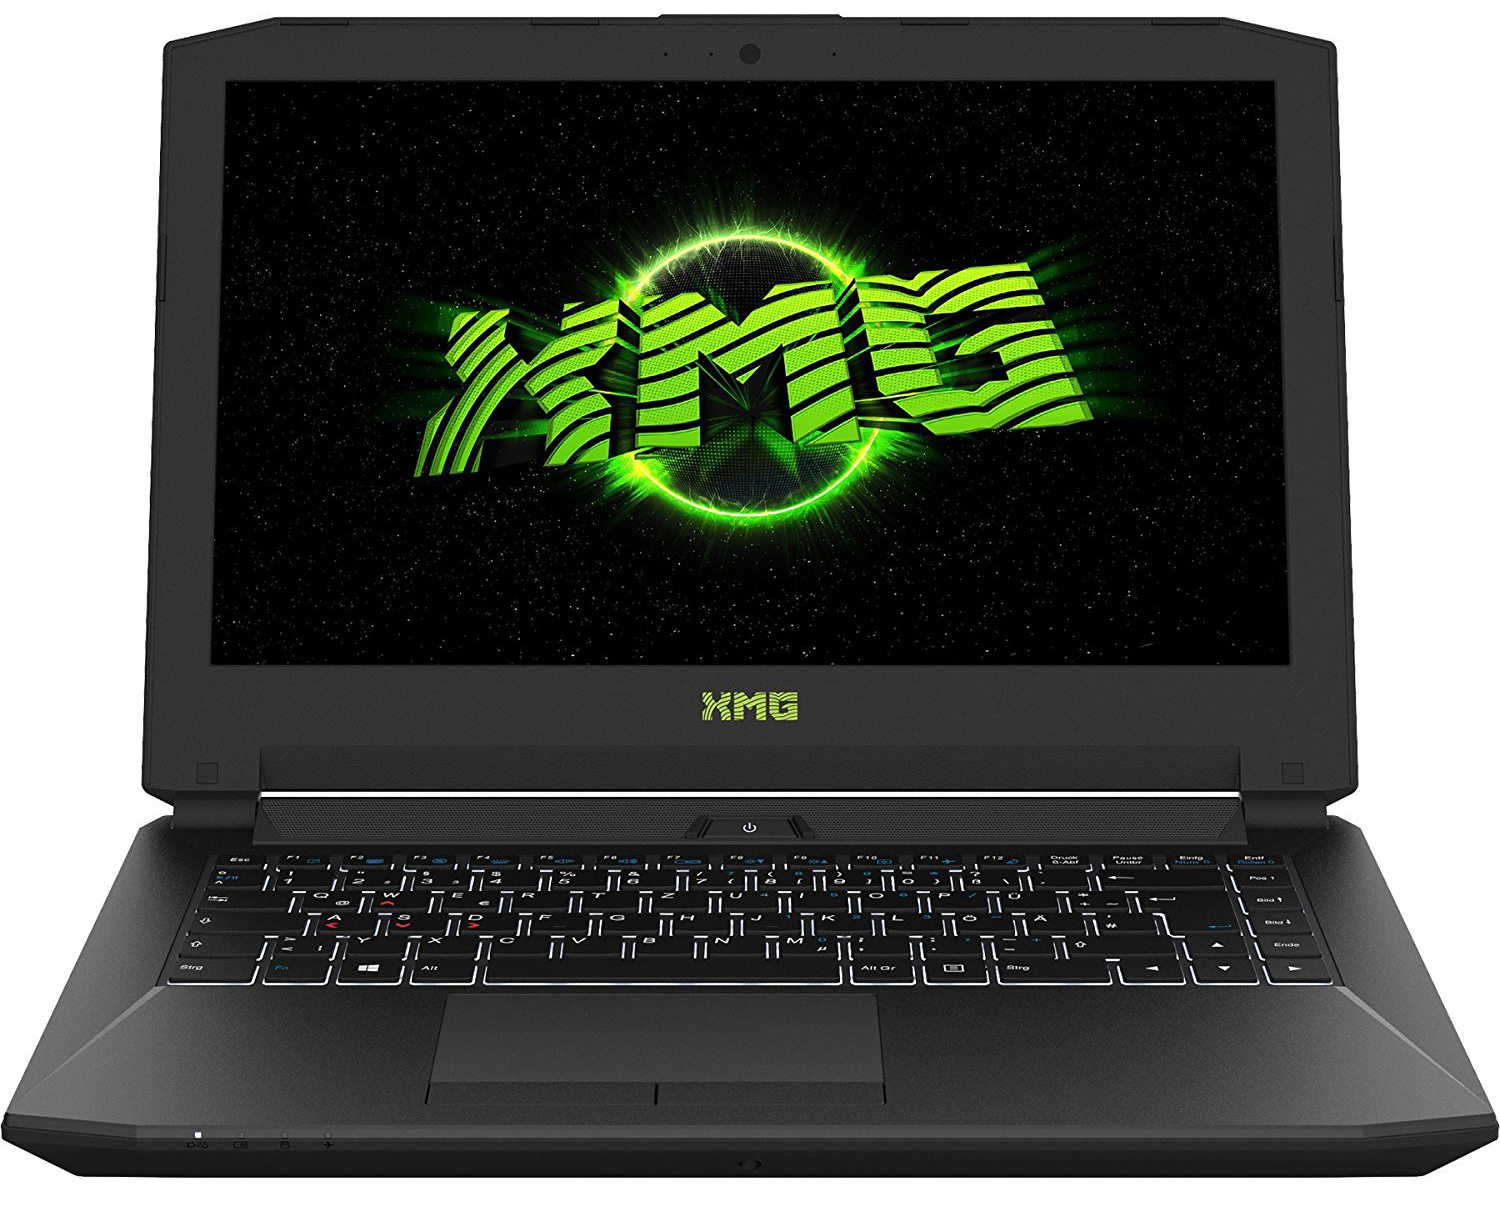
The Schenker XMG P407 is the successor of the XMG P406, which we have already reviewed. Externally, the two devices do not differ. Internally, quite a bit has changed. The XMG P407 carries an Intel Kaby Lake processor and an Nvidia Pascal graphics core. Our review reveals the effects of the new hardware generations. Due to the manageable number of 14-inch gaming notebooks, the XMG P407 does not have much competition. Two examples would be the Razer Blade (2016) and the Gigabyte P34W v5.
Connectivity
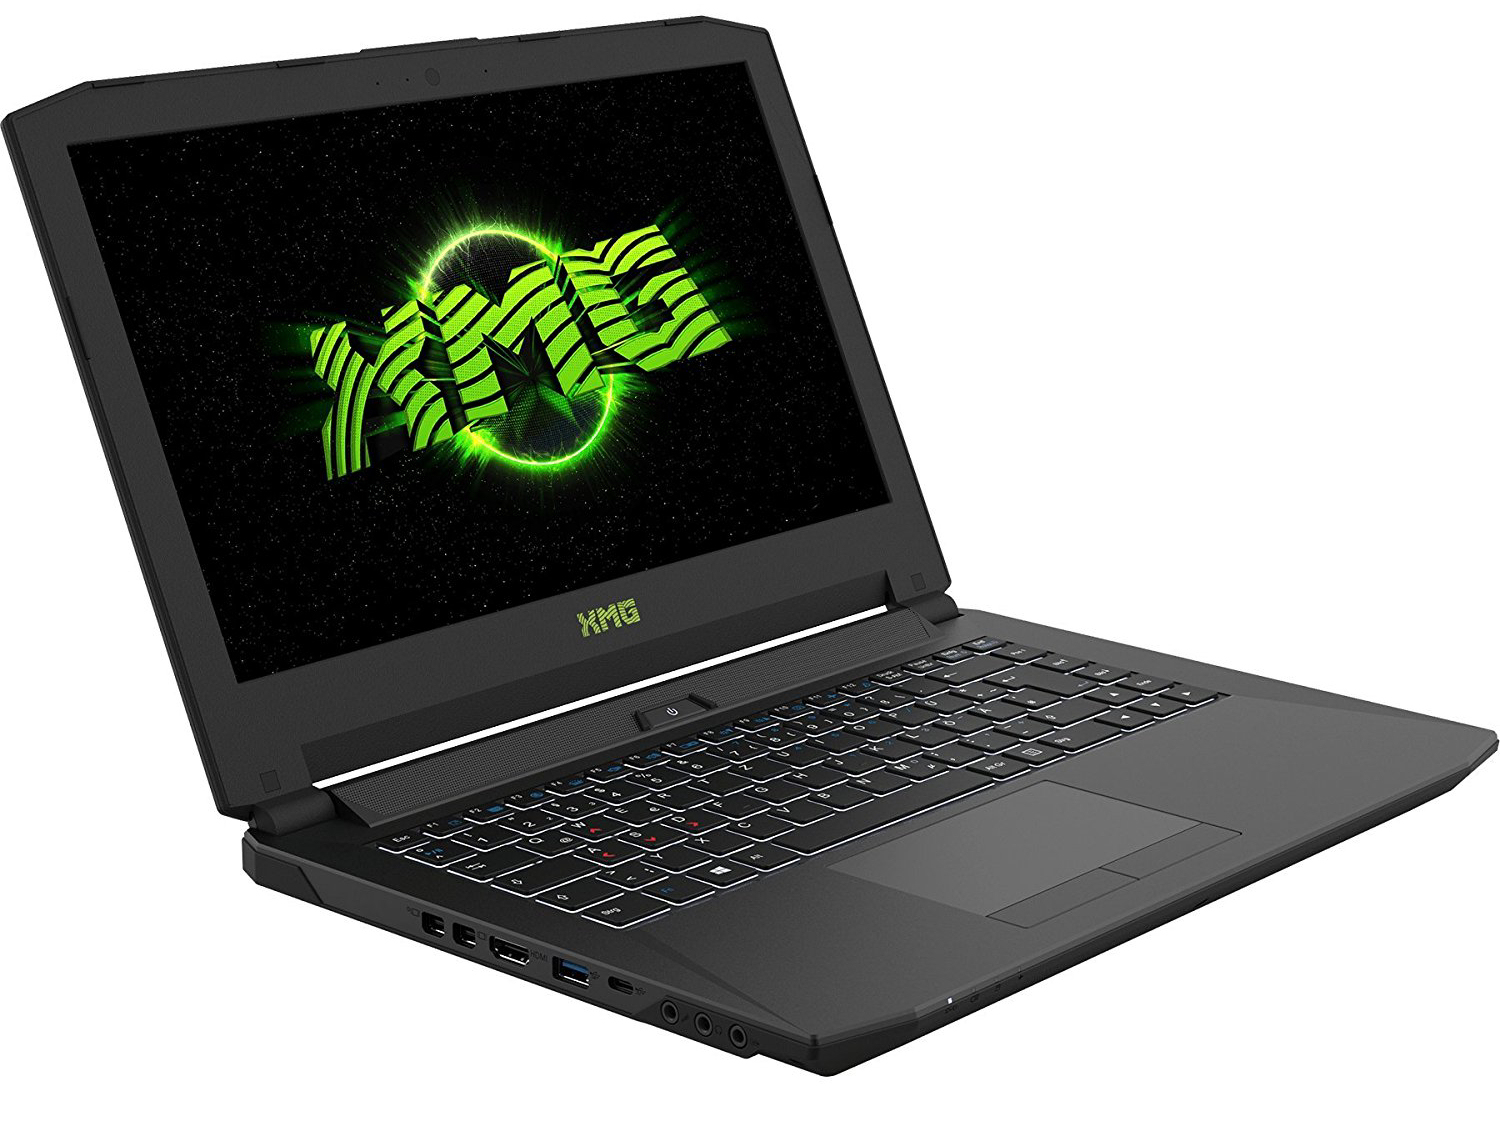
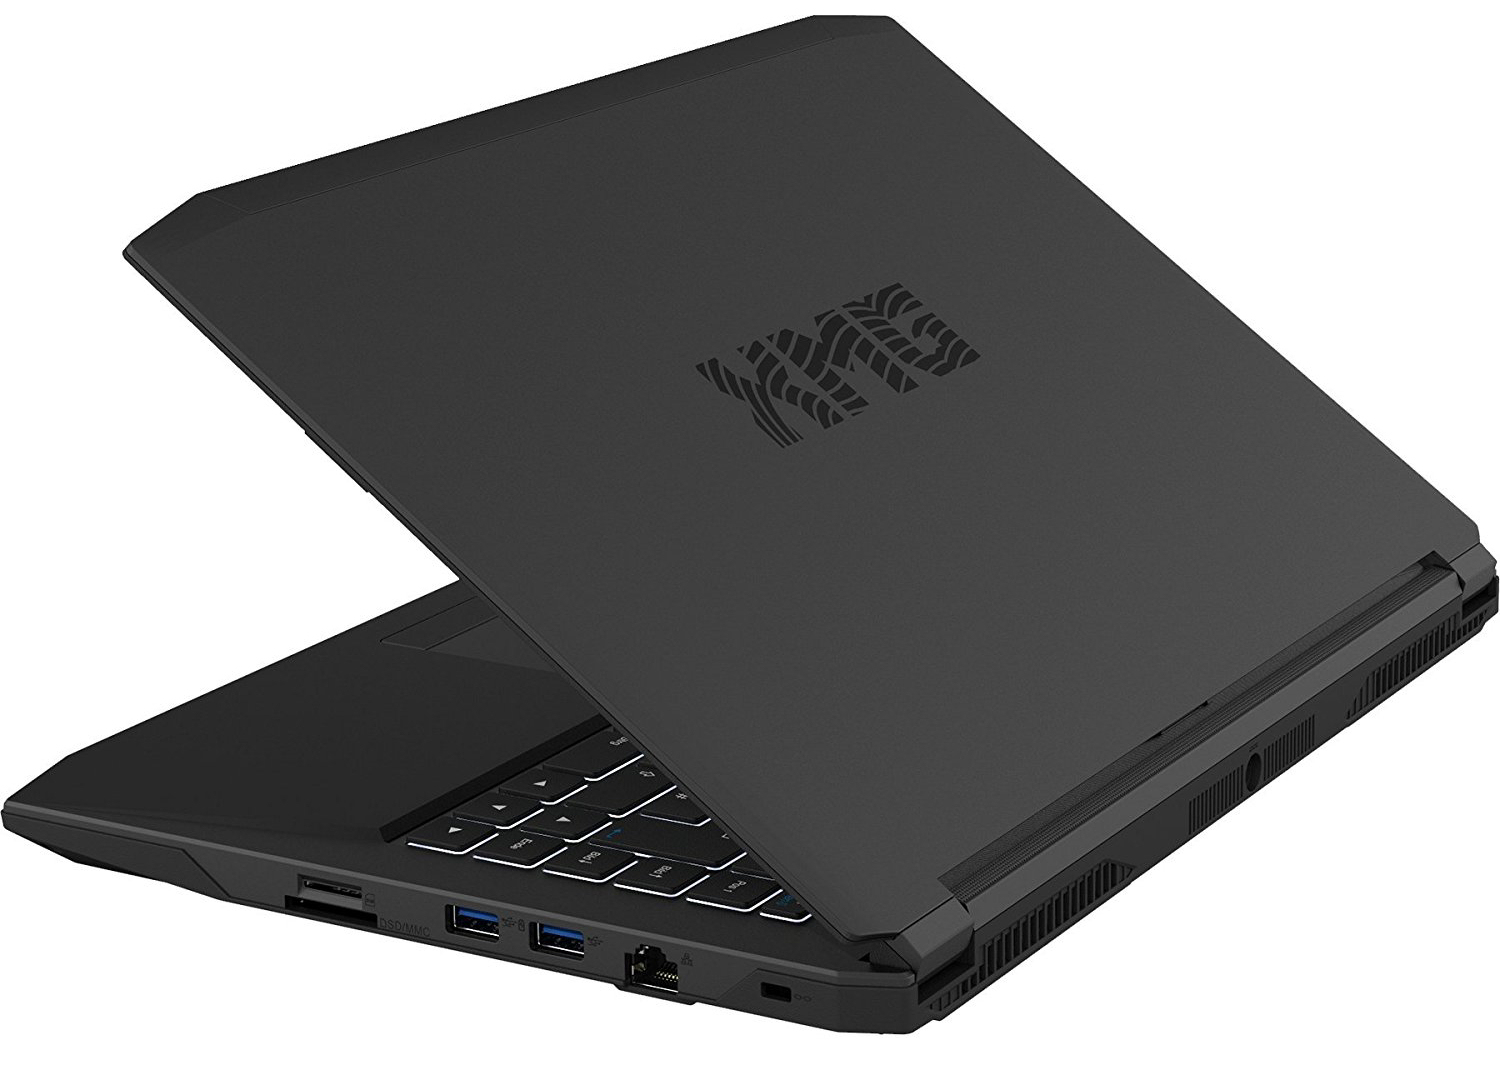
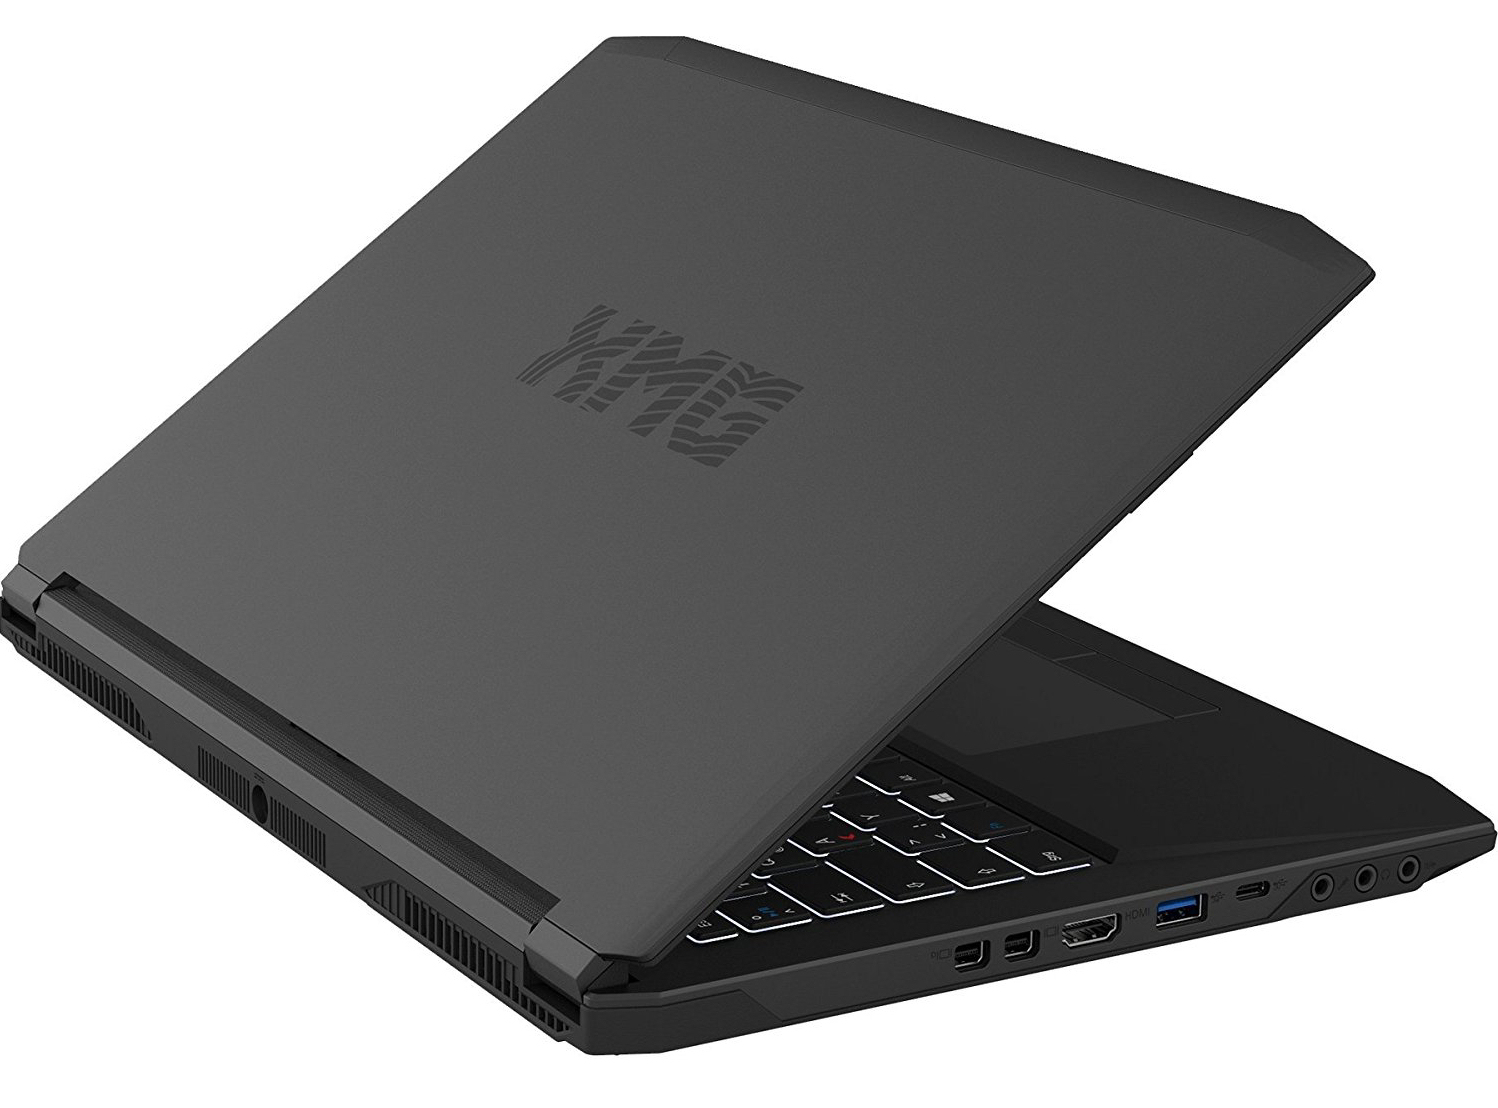
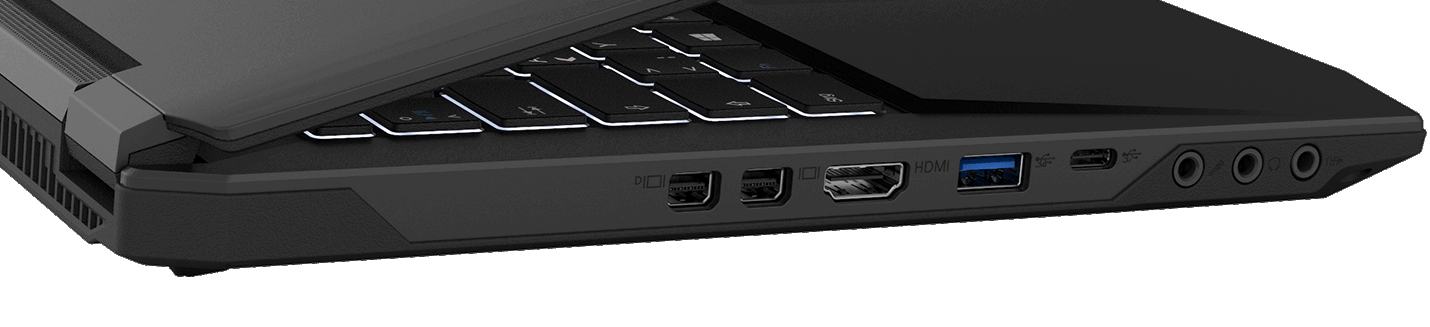
Regarding the ports, there are some upgrades to be announced compared to the XMG P406:
- One of the four USB 3.1 Type-A Gen-1 ports makes room for a USB 3.1 Type-C Gen-2 port.
- One of the two Mini DisplayPorts is upgraded to the 1.4 standard (XMG P406: 2x 1.2). This port supports monitors capable of G-Sync.
| SD Card Reader | |
| average JPG Copy Test (av. of 3 runs) | |
| Schenker XMG P406 | |
| Schenker XMG P407 | |
| MSI GL62M 7RD-077 | |
| maximum AS SSD Seq Read Test (1GB) | |
| Schenker XMG P407 | |
| Schenker XMG P406 | |
| MSI GL62M 7RD-077 | |
| Networking | |
| iperf3 transmit AX12 | |
| Razer Blade (2016) FHD | |
| Schenker XMG P407 | |
| MSI GL62M 7RD-077 (jseb) | |
| iperf3 receive AX12 | |
| Razer Blade (2016) FHD | |
| Schenker XMG P407 | |
| MSI GL62M 7RD-077 (jseb) | |
Display
The matte 14-inch display of the XMG P407 runs at a native resolution of 1920x1080 pixels. There are no other screen types available. The display offers good contrast (1104:1) and decent brightness (281.6 cd/m2), although the brightness level could be even higher. After all, Schenker demands considerably more than 1,000 Euros (~$1079) for the notebook. On a positive note, the screen never exhibits PWM-flickering.
| |||||||||||||||||||||||||
Brightness Distribution: 80 %
Center on Battery: 298 cd/m²
Contrast: 1104:1 (Black: 0.27 cd/m²)
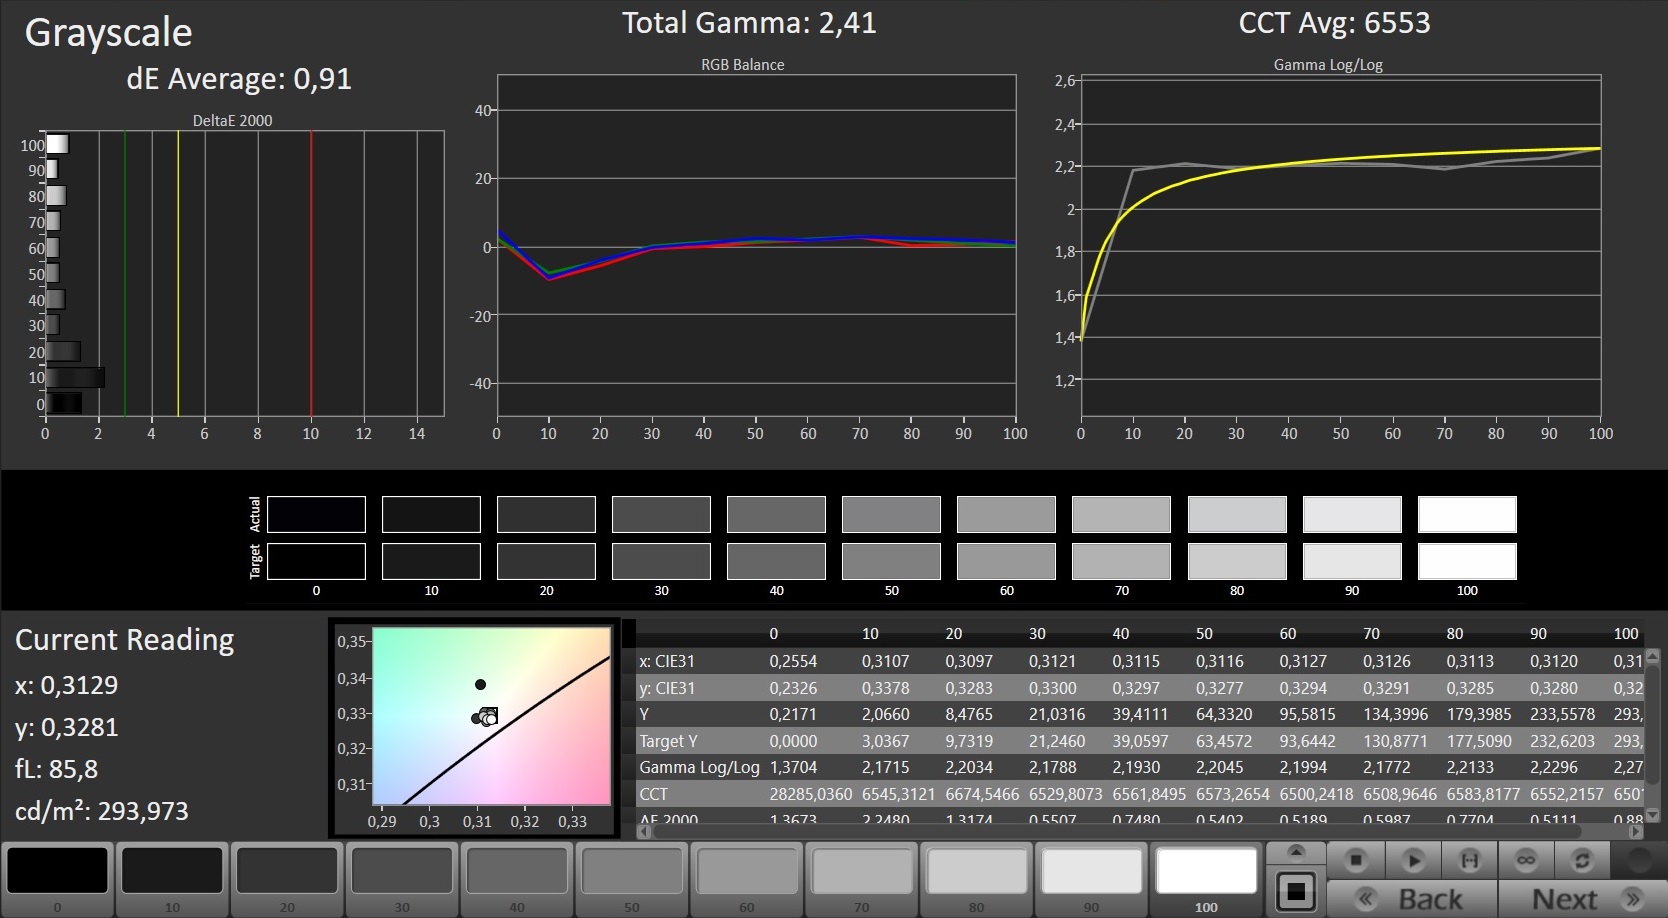
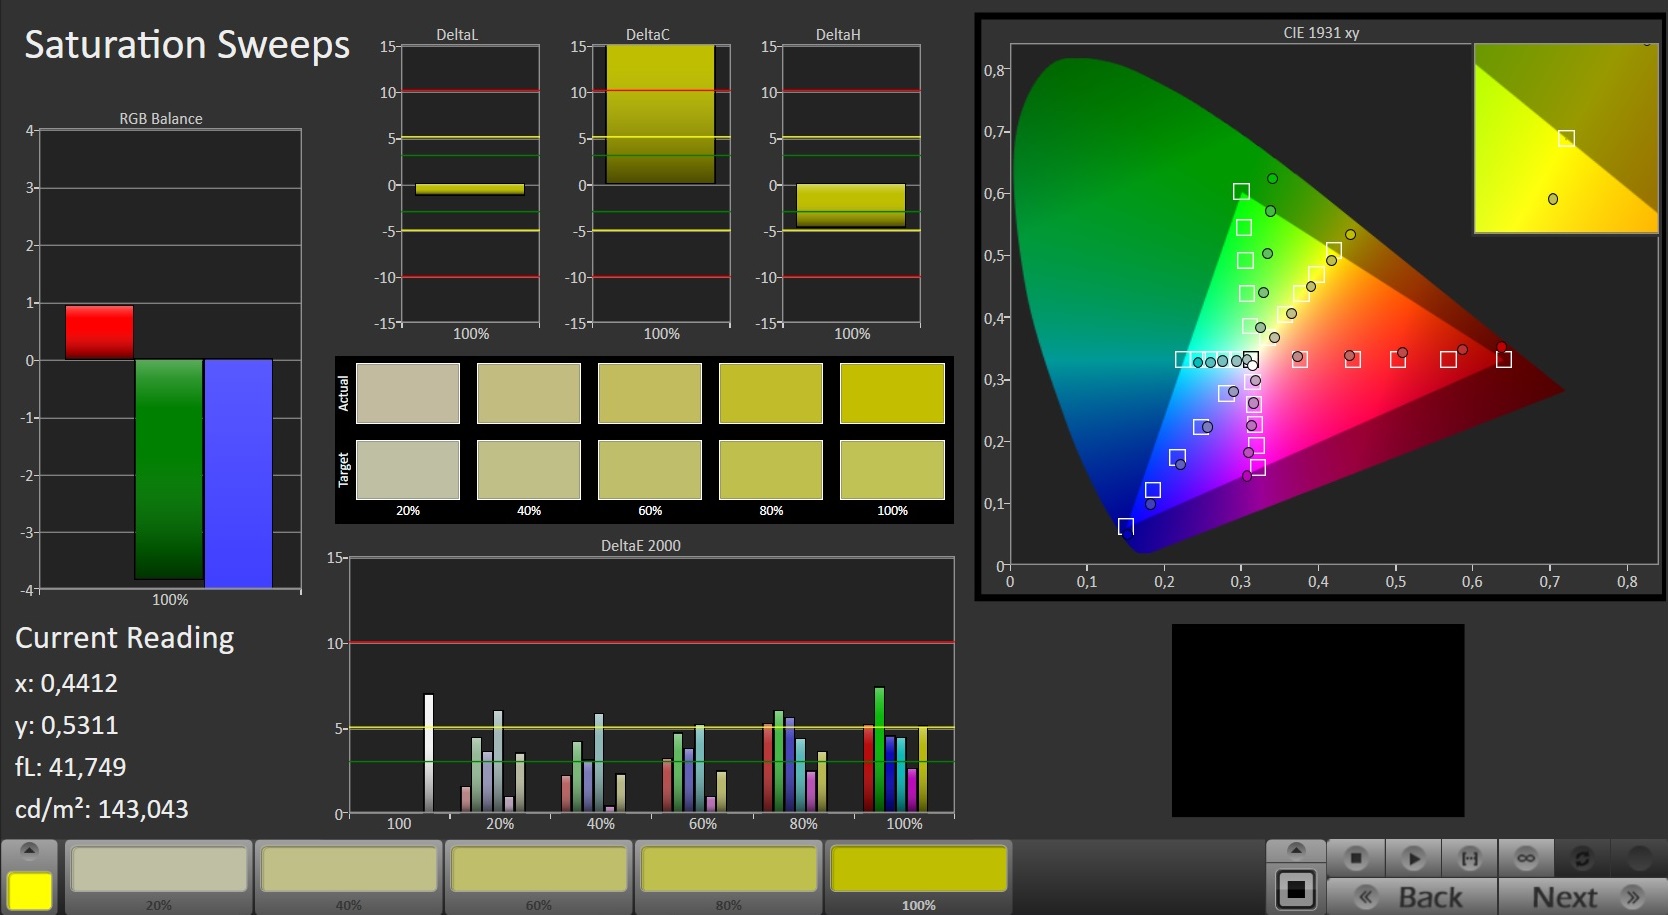
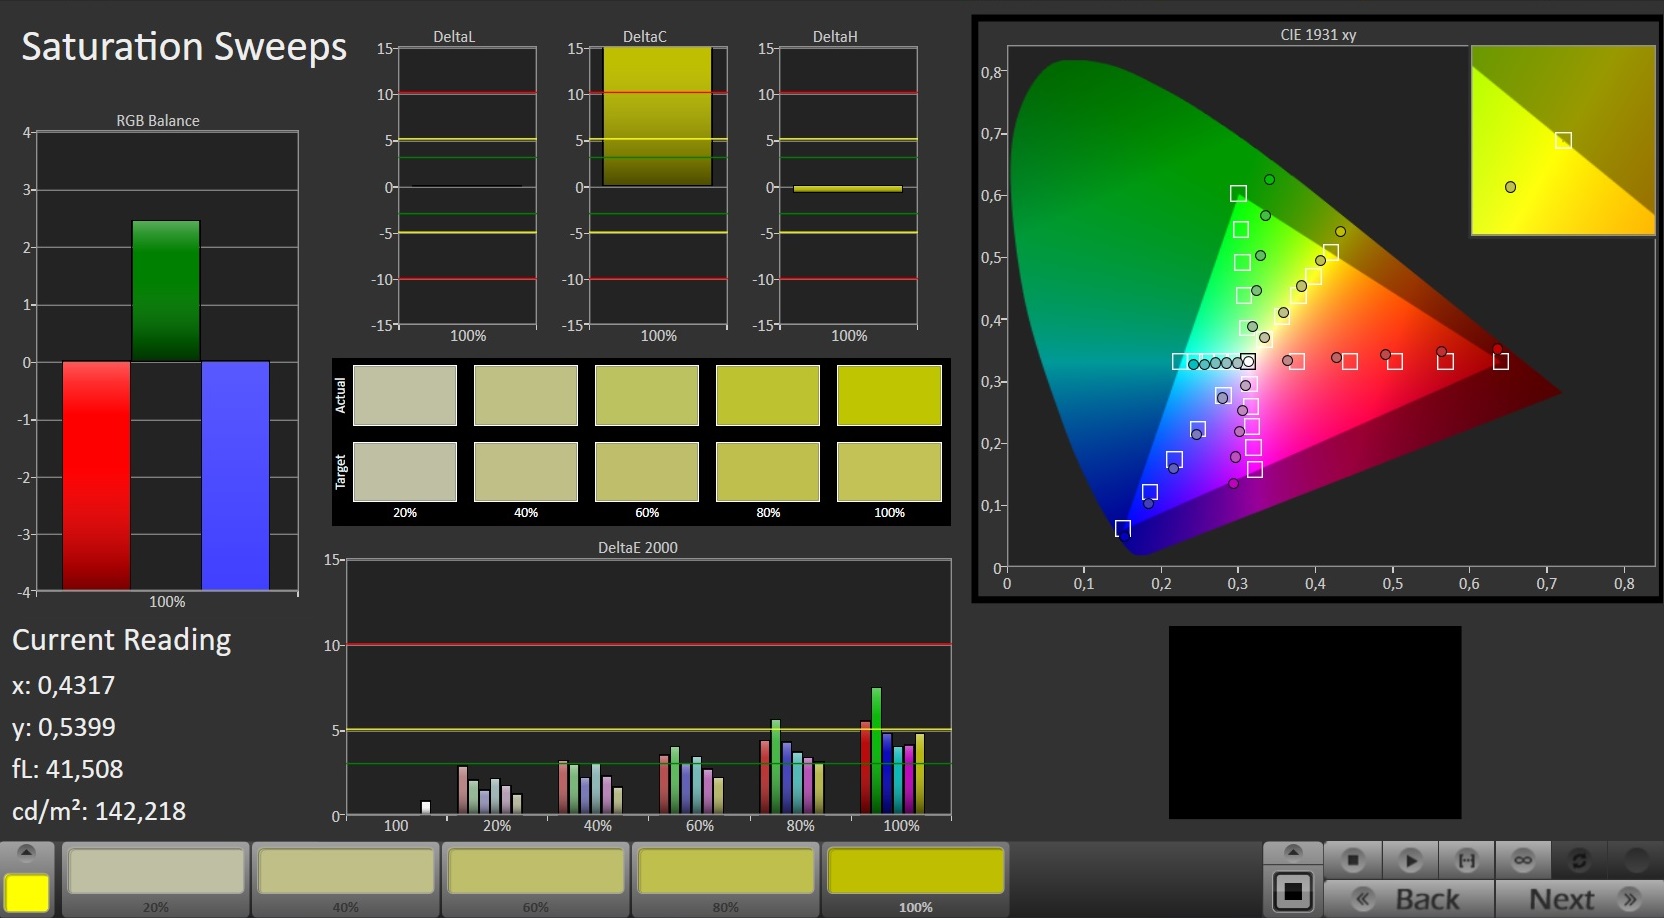
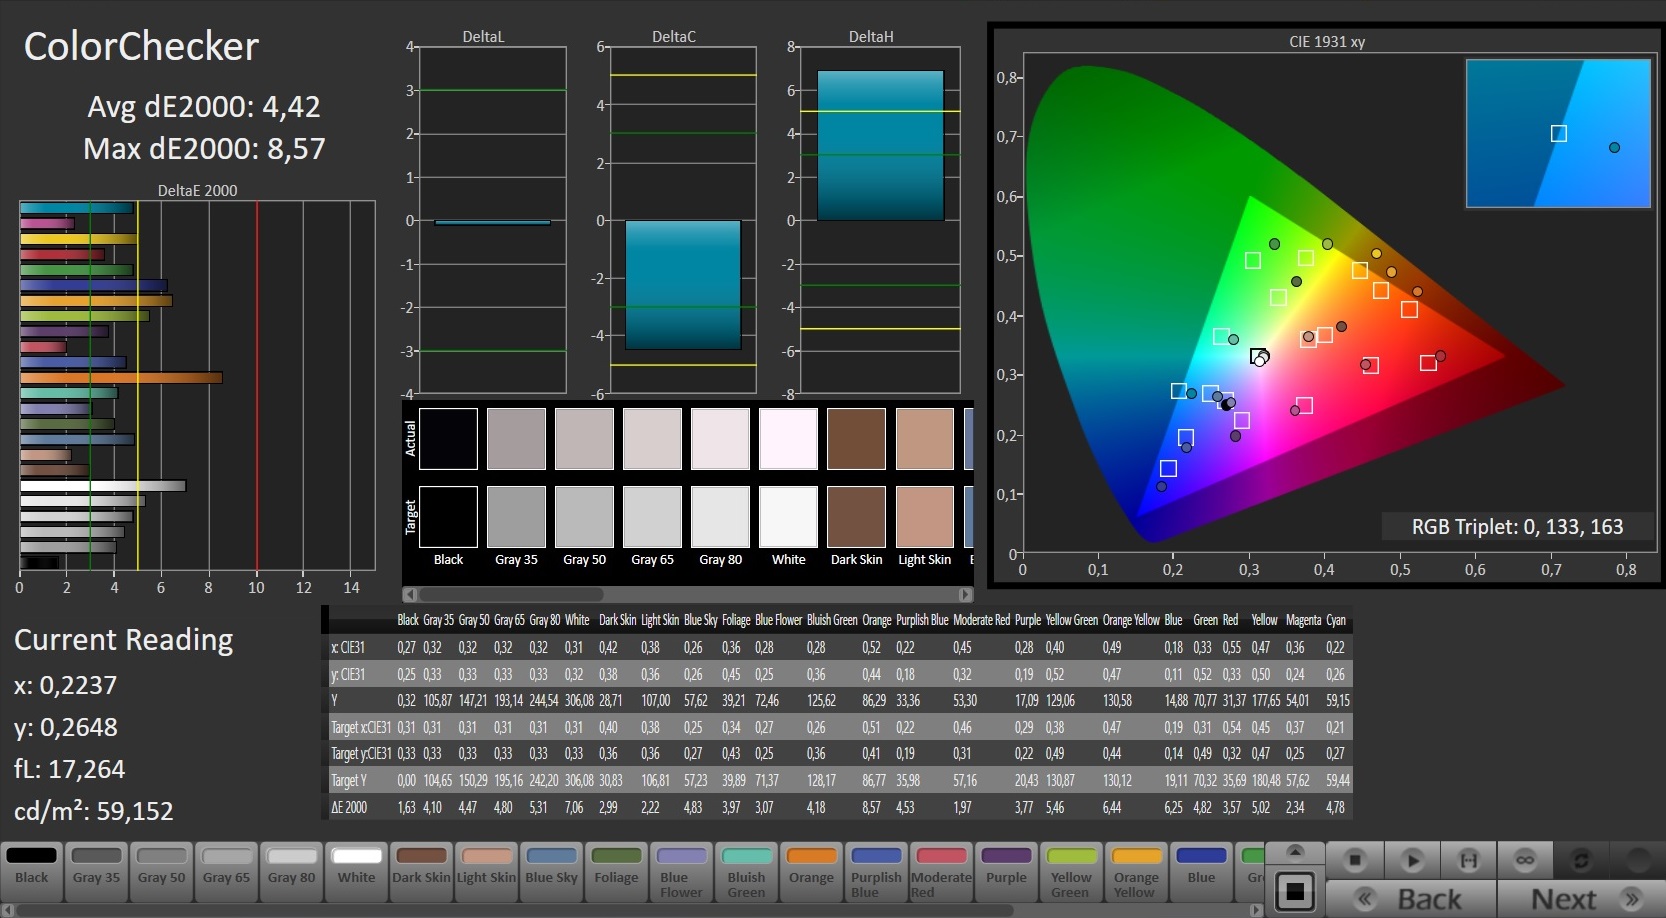
ΔE ColorChecker Calman: 4.42 | ∀{0.5-29.43 Ø4.73}
ΔE Greyscale Calman: 4.11 | ∀{0.09-98 Ø4.97}
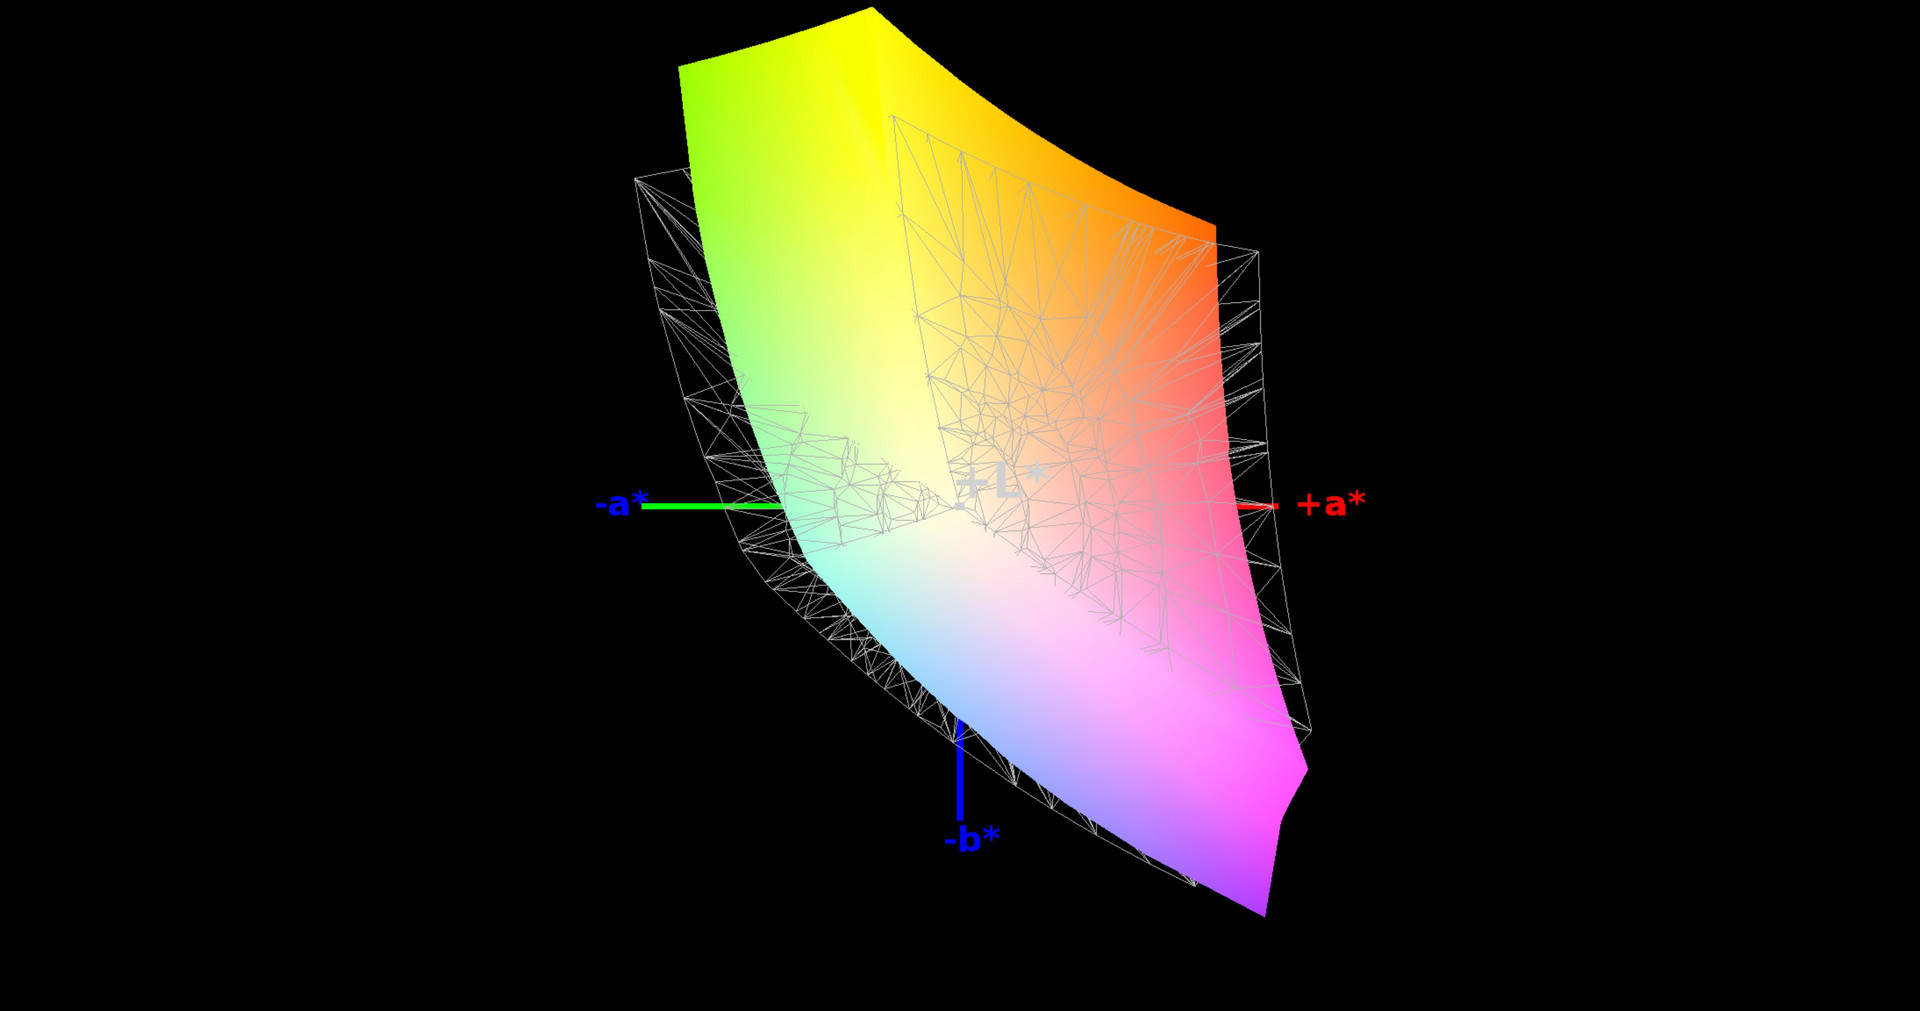
82% sRGB (Argyll 1.6.3 3D)
54% AdobeRGB 1998 (Argyll 1.6.3 3D)
60% AdobeRGB 1998 (Argyll 3D)
82.1% sRGB (Argyll 3D)
64.5% Display P3 (Argyll 3D)
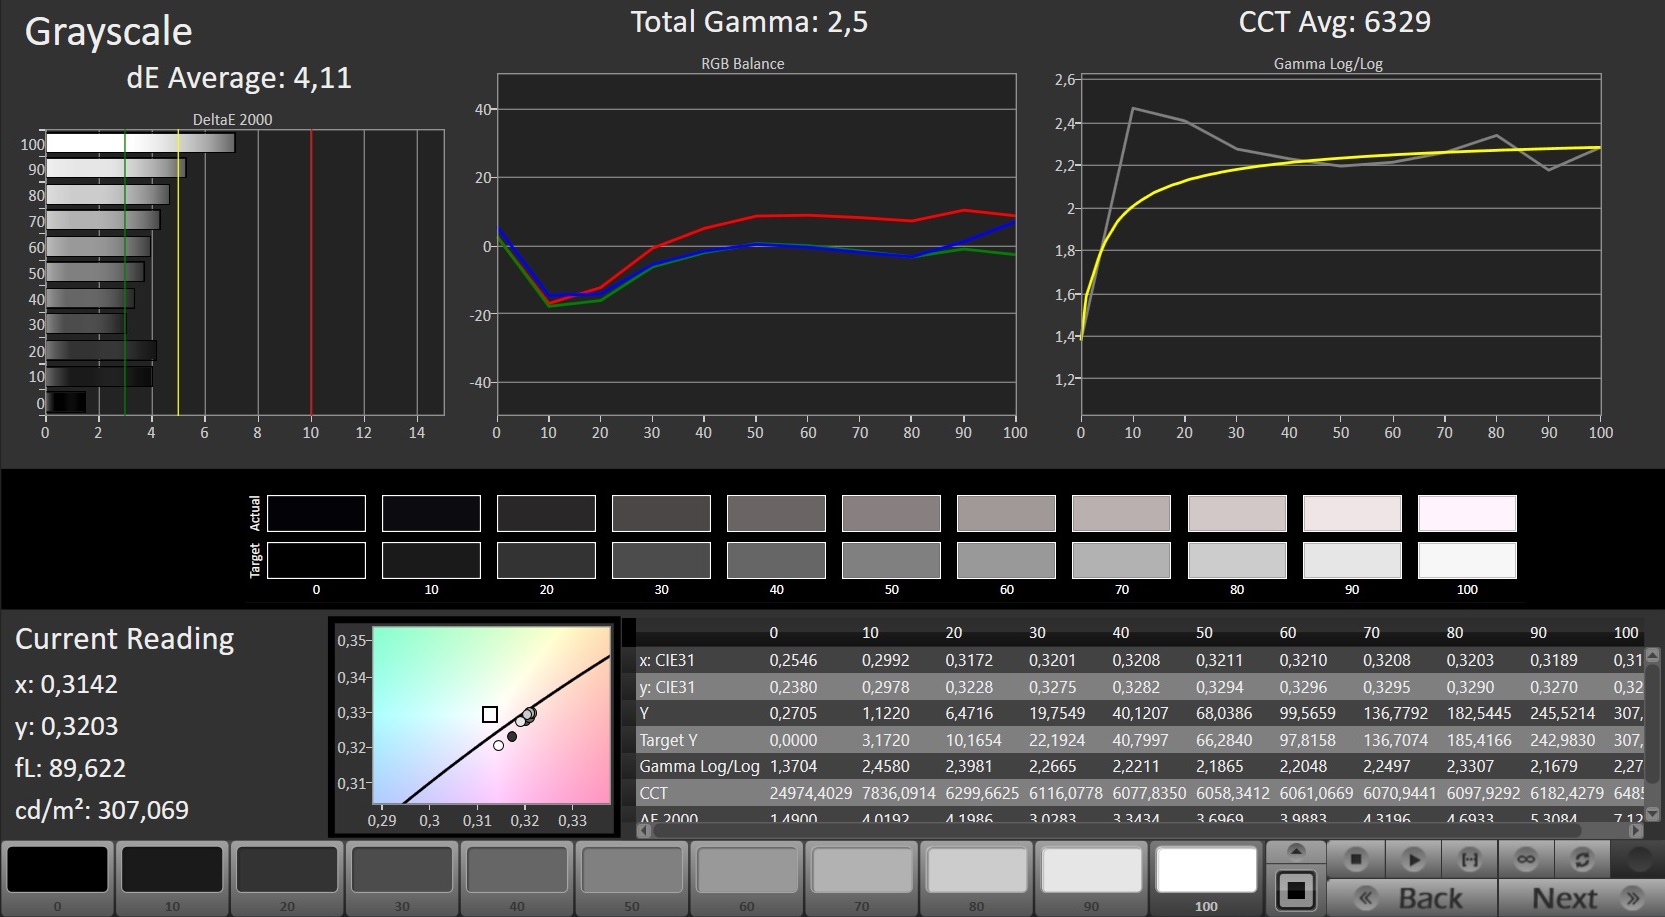
Gamma: 2.5
CCT: 6329 K
| Schenker XMG P407 LG Philips LP140WF3-SPD1 (LGD046D), 1920x1080, 14" | Schenker XMG P406 LG Philips 140WF1 (LGD040A), 1920x1080, 14" | Razer Blade (2016) FHD LG Philips LP140WF3-SPD1 (LGD046D), 1920x1080, 14" | Gigabyte P34W v5 2560x1440, 14" | MSI GL62M 7RD-077 Chi Mei N156HGE-EAL, 1920x1080, 15.6" | |
|---|---|---|---|---|---|
| Display | 2% | 1% | -13% | 31% | |
| Display P3 Coverage (%) | 64.5 | 66.2 3% | 65.2 1% | 51.4 -20% | 85.4 32% |
| sRGB Coverage (%) | 82.1 | 82.8 1% | 83.4 2% | 76.6 -7% | 100 22% |
| AdobeRGB 1998 Coverage (%) | 60 | 60.5 1% | 60.9 1% | 52.8 -12% | 83.8 40% |
| Response Times | -15% | 2% | 9% | -1% | |
| Response Time Grey 50% / Grey 80% * (ms) | 47 ? | 56 ? -19% | 47 ? -0% | 41.2 ? 12% | 44 ? 6% |
| Response Time Black / White * (ms) | 27 ? | 30 ? -11% | 26 ? 4% | 25.4 ? 6% | 29 ? -7% |
| PWM Frequency (Hz) | 198 ? | ||||
| Screen | -1% | -1% | 3% | -50% | |
| Brightness middle (cd/m²) | 298 | 282 -5% | 272 -9% | 277.8 -7% | 258 -13% |
| Brightness (cd/m²) | 282 | 266 -6% | 277 -2% | 270 -4% | 234 -17% |
| Brightness Distribution (%) | 80 | 81 1% | 84 5% | 83 4% | 79 -1% |
| Black Level * (cd/m²) | 0.27 | 0.22 19% | 0.26 4% | 0.38 -41% | 0.54 -100% |
| Contrast (:1) | 1104 | 1282 16% | 1046 -5% | 731 -34% | 478 -57% |
| Colorchecker dE 2000 * | 4.42 | 4.98 -13% | 4.59 -4% | 2.71 39% | 9.74 -120% |
| Colorchecker dE 2000 max. * | 8.57 | 10.2 -19% | 8.49 1% | 5.47 36% | 14.6 -70% |
| Greyscale dE 2000 * | 4.11 | 4.08 1% | 4.28 -4% | 2.11 49% | 11.59 -182% |
| Gamma | 2.5 88% | 2.51 88% | 2.23 99% | 2.19 100% | 2.19 100% |
| CCT | 6329 103% | 5877 111% | 6848 95% | 6314 103% | 11851 55% |
| Color Space (Percent of AdobeRGB 1998) (%) | 54 | 54 0% | 55 2% | 48.5 -10% | 76 41% |
| Color Space (Percent of sRGB) (%) | 82 | 83 1% | 83 1% | 76.9 -6% | 100 22% |
| Total Average (Program / Settings) | -5% /
-2% | 1% /
-0% | -0% /
0% | -7% /
-27% |
* ... smaller is better
Screen Flickering / PWM (Pulse-Width Modulation)
| Screen flickering / PWM not detected | 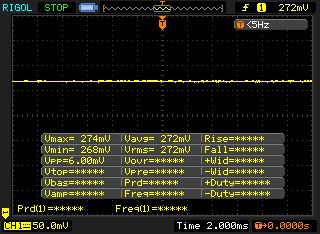 | ||
In comparison: 52 % of all tested devices do not use PWM to dim the display. If PWM was detected, an average of 7798 (minimum: 5 - maximum: 343500) Hz was measured. | |||
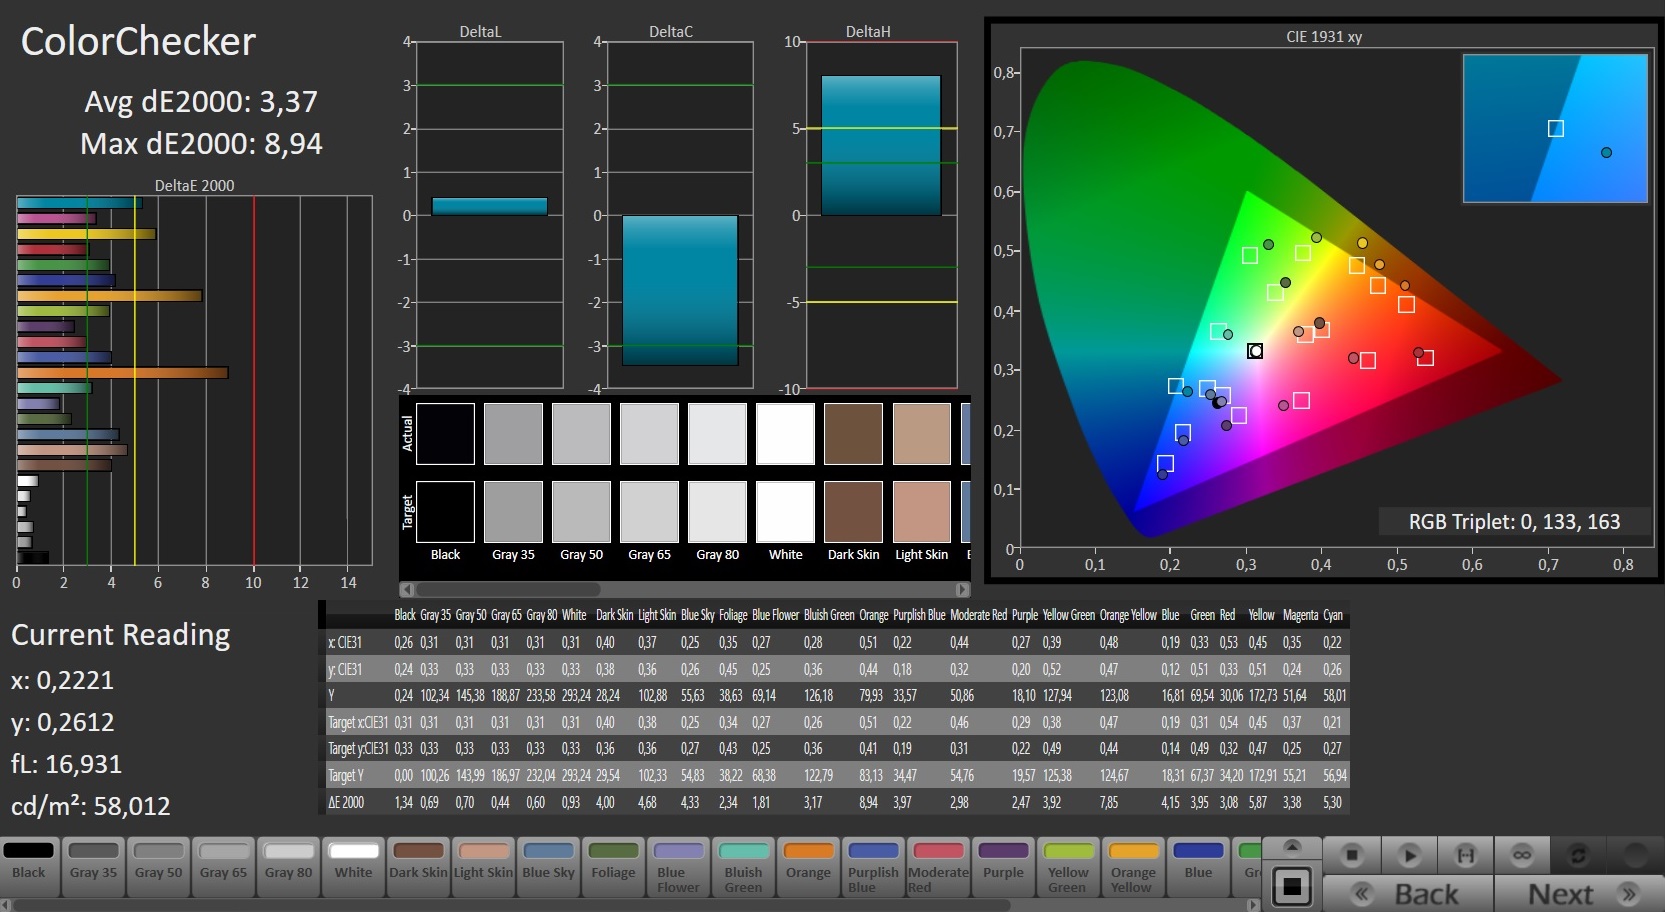
The display already has very decent color reproduction in factory default settings. We measure a DeltaE-2000 color deviation of 4.42, which is not far from the target value (DeltaE smaller than 3). The screen also does not suffer from a blue tint. Calibrating it can still offer some improvements: The color deviation drops to a value of 3.37, and the grayscales are more balanced. The color spaces AdobeRGB and sRGB cannot be displayed; the coverage rates amount to 82% (sRGB) and 54% (AdobeRGB).

Display Response Times
| ↔ Response Time Black to White | ||
|---|---|---|
| 27 ms ... rise ↗ and fall ↘ combined | ↗ 5 ms rise | 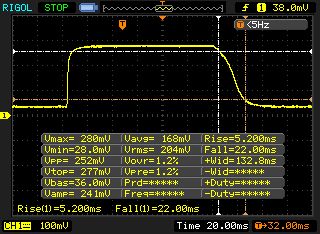 |
| ↘ 22 ms fall | ||
| The screen shows relatively slow response rates in our tests and may be too slow for gamers. In comparison, all tested devices range from 0.1 (minimum) to 240 (maximum) ms. » 67 % of all devices are better. This means that the measured response time is worse than the average of all tested devices (19.9 ms). | ||
| ↔ Response Time 50% Grey to 80% Grey | ||
| 47 ms ... rise ↗ and fall ↘ combined | ↗ 14 ms rise | 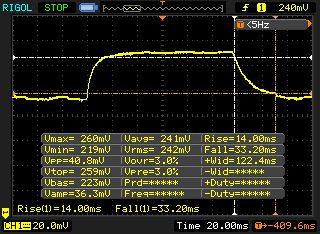 |
| ↘ 33 ms fall | ||
| The screen shows slow response rates in our tests and will be unsatisfactory for gamers. In comparison, all tested devices range from 0.165 (minimum) to 636 (maximum) ms. » 81 % of all devices are better. This means that the measured response time is worse than the average of all tested devices (31.1 ms). | ||
Schenker equips the P407 with an IPS panel with stable viewing angles, meaning that the display can be read from every position. The notebook could be used outdoors, but not in bright sunlight.

Performance
With the XMG P407, Schenker delivers a gaming notebook in the 14-inch format. It runs all current games smoothly and performs well in all other areas of application. Our test device can be purchased for around 1,500 Euros (~$1619). The P407 can be individually configured in the Schenker store. Alternatively, you can also choose a preconfigured model offered in various online shops.
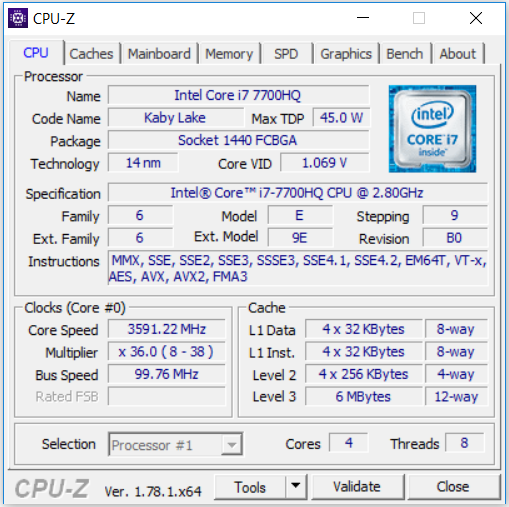
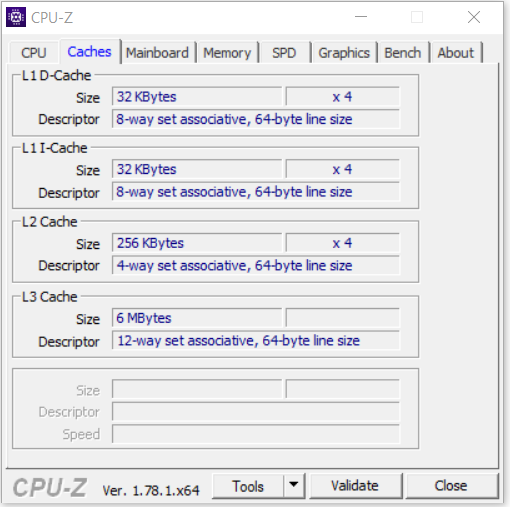
Processor
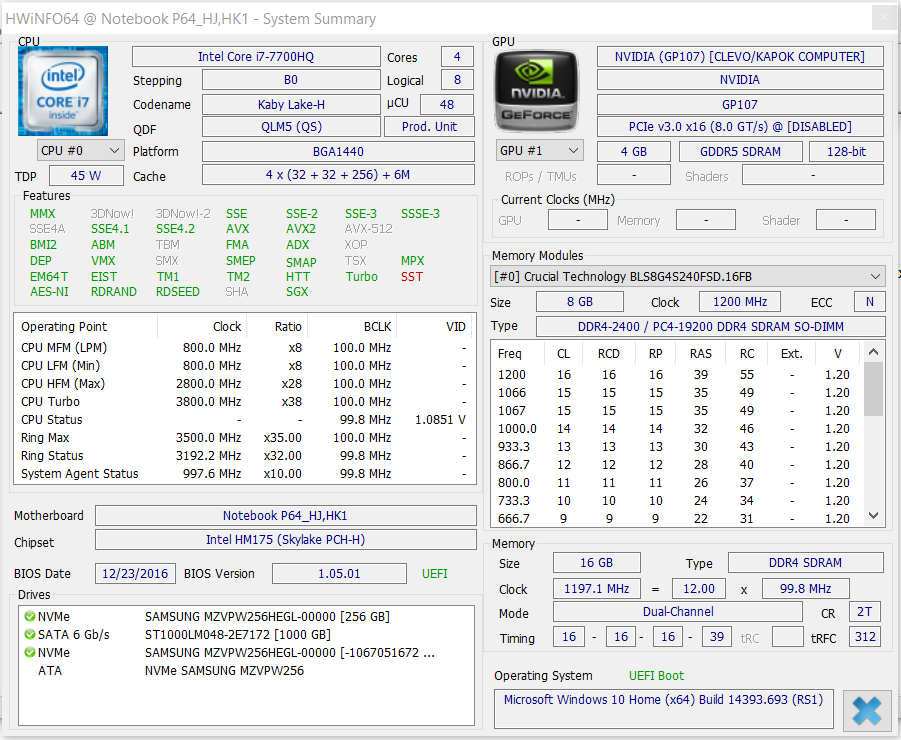
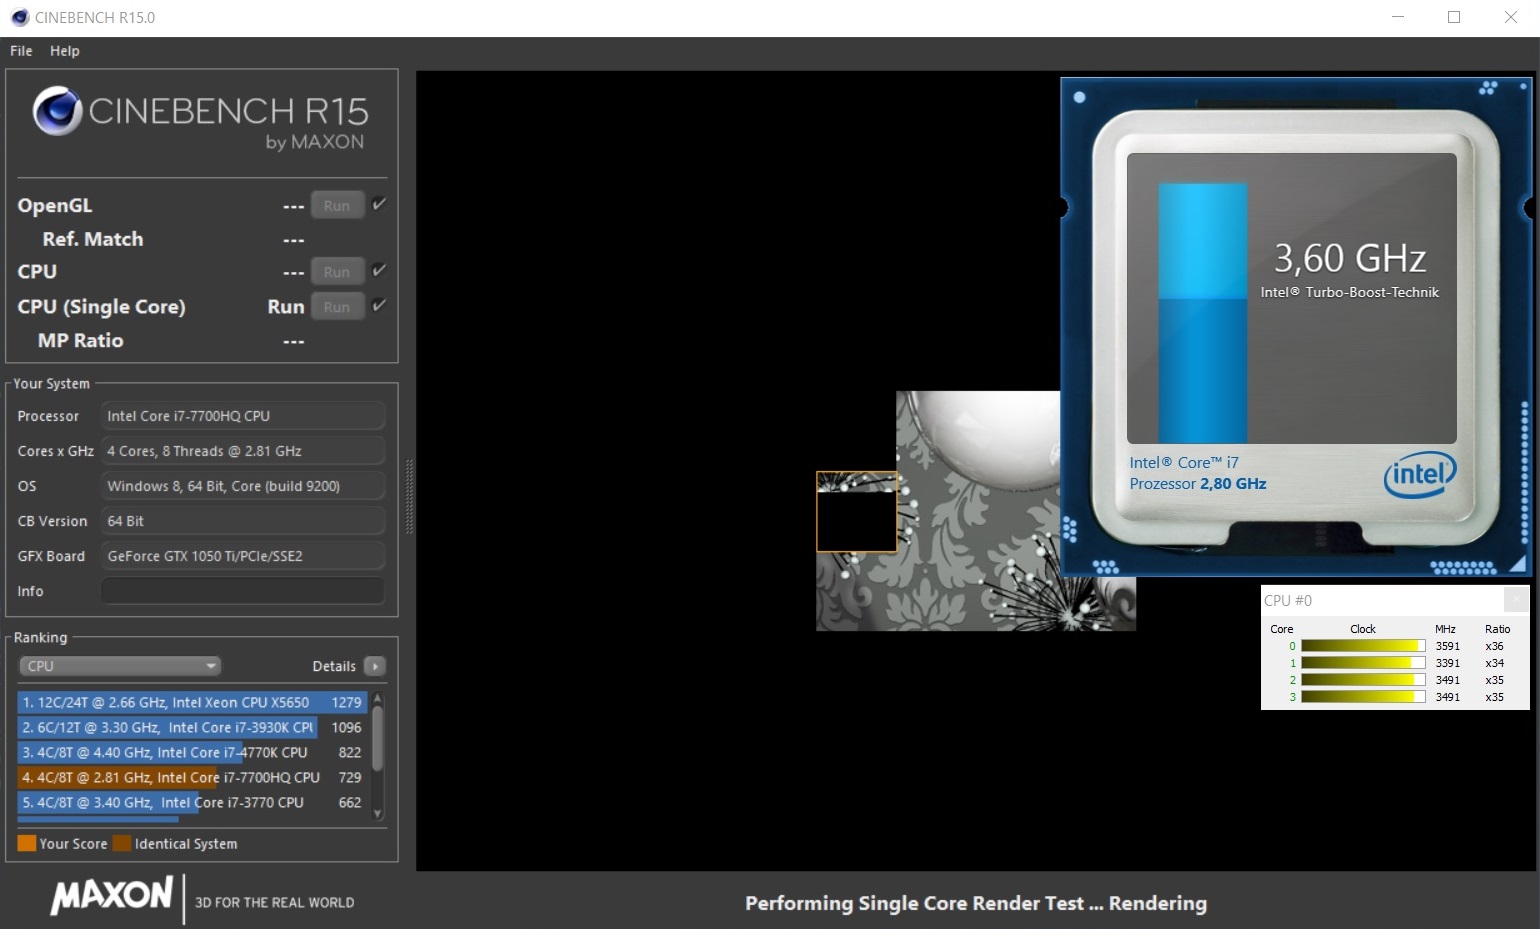
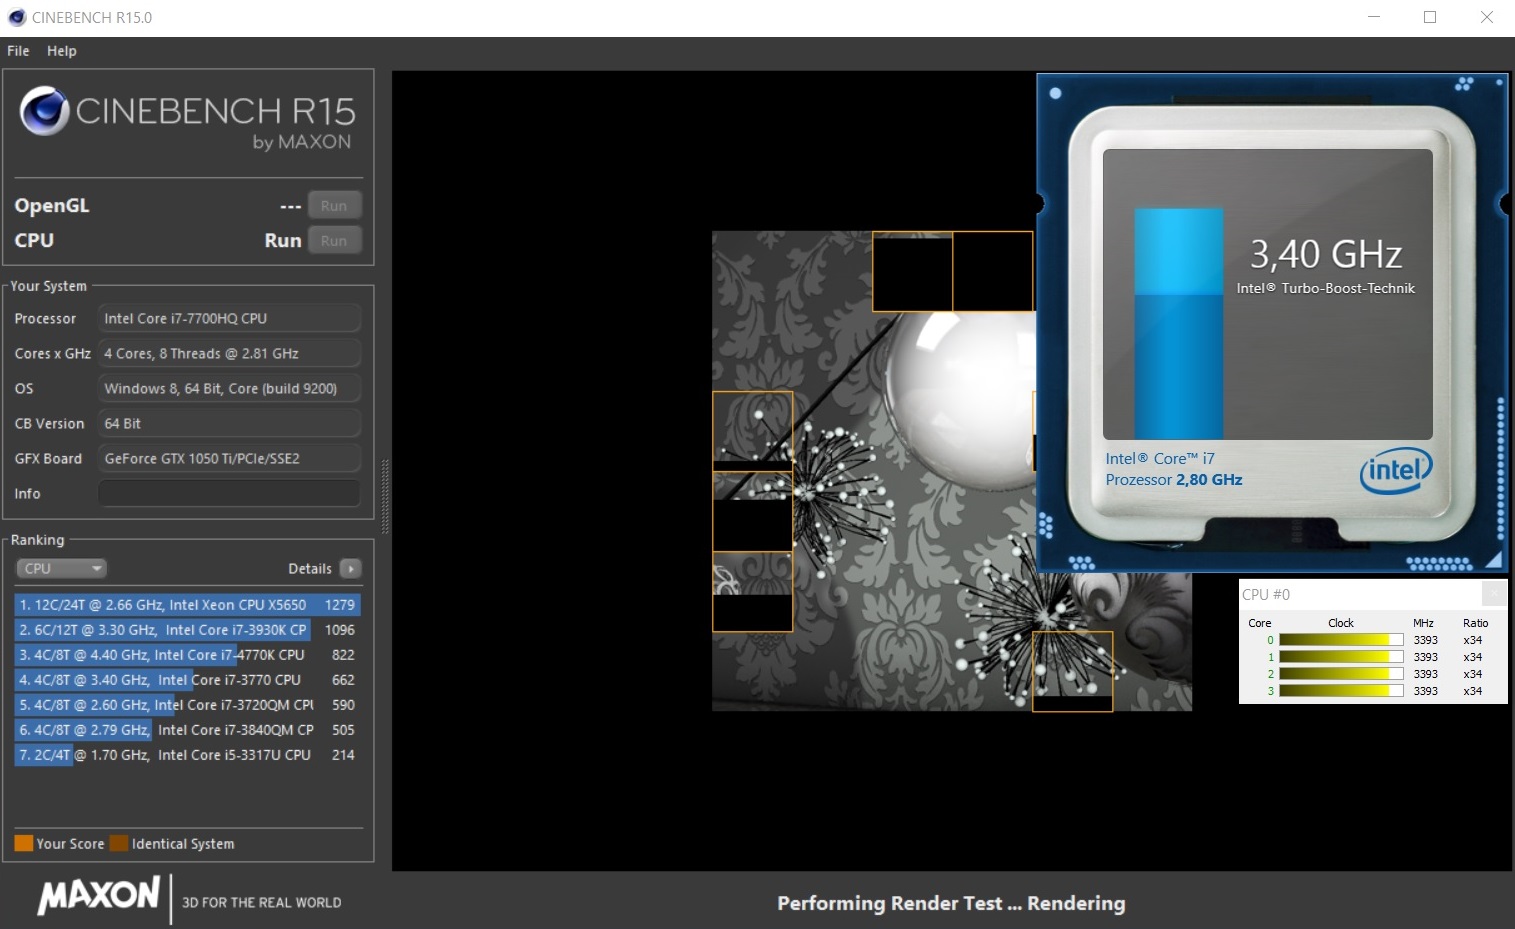
It should come as no surprise that Intel's Core i7-7700HQ (Kaby Lake) quad-core processor made its way into the XMG P407 as well. It constitutes a good compromise between processing power and energy consumption and is therefore ideally suited for (mobile) gaming notebooks. The CPU is clocked at a base speed of 2.8 GHz; this can be increased to 3.4 GHz (four cores), 3.6 GHz (two cores), or 3.8 GHz (one core) via Turbo. The processor thus consistently achieves higher speeds than its Skylake predecessor, the Core i7-6700HQ. This is also why the 7700HQ performs somewhat better in our CPU tests. On a technical level, Kaby Lake and Skylake are practically identical. The CPU handles our tests at 3.4 GHz (multithread) and 3.4 to 3.8 GHz (single-thread) when plugged in; in battery mode, the clock speed drops to a consistent 1.7 GHz.
Turbo is not as extensively used as it could be in single-thread applications, which is why the 7700HQ cannot pull ahead of its predecessor in the single-thread tests. By letting the Cinebench R15 multithread test run in a loop for around 30 minutes, we check whether Turbo is used persistently. The results of the P407 are invariably on the same level; performance drops are therefore not present.
| Cinebench R15 | |
| CPU Single 64Bit | |
| Razer Blade (2016) FHD | |
| Schenker XMG P407 | |
| MSI GL62M 7RD-077 | |
| Schenker XMG P406 | |
| Gigabyte P34W v5 | |
| CPU Multi 64Bit | |
| Schenker XMG P407 | |
| MSI GL62M 7RD-077 | |
| Gigabyte P34W v5 | |
| Schenker XMG P406 | |
| Razer Blade (2016) FHD | |
| Cinebench R11.5 | |
| CPU Multi 64Bit | |
| MSI GL62M 7RD-077 | |
| Schenker XMG P407 | |
| Gigabyte P34W v5 | |
| Razer Blade (2016) FHD | |
| Schenker XMG P406 | |
| CPU Single 64Bit | |
| Razer Blade (2016) FHD | |
| Schenker XMG P407 | |
| Gigabyte P34W v5 | |
| MSI GL62M 7RD-077 | |
| Schenker XMG P406 | |
| Cinebench R10 | |
| Rendering Multiple CPUs 32Bit | |
| Schenker XMG P407 | |
| MSI GL62M 7RD-077 | |
| Razer Blade (2016) FHD | |
| Schenker XMG P406 | |
| Gigabyte P34W v5 | |
| Rendering Single 32Bit | |
| Schenker XMG P407 | |
| MSI GL62M 7RD-077 | |
| Razer Blade (2016) FHD | |
| Gigabyte P34W v5 | |
| Schenker XMG P406 | |
| Geekbench 3 | |
| 32 Bit Single-Core Score | |
| Schenker XMG P407 | |
| Razer Blade (2016) FHD | |
| MSI GL62M 7RD-077 | |
| 32 Bit Multi-Core Score | |
| Schenker XMG P407 | |
| MSI GL62M 7RD-077 | |
| Razer Blade (2016) FHD | |
| Geekbench 4.0 | |
| 64 Bit Single-Core Score | |
| Razer Blade (2016) FHD | |
| Schenker XMG P407 | |
| MSI GL62M 7RD-077 | |
| 64 Bit Multi-Core Score | |
| Schenker XMG P407 | |
| Razer Blade (2016) FHD | |
| MSI GL62M 7RD-077 | |
| JetStream 1.1 - 1.1 Total | |
| MSI GL62M 7RD-077 | |
| Razer Blade (2016) FHD | |
| Schenker XMG P407 | |
System Performance
We did not encounter any problems: The system works smoothly and without hiccups, thanks to the combination of a powerful CPU and a fast NVMe SSD. Our subjective impression is reinforced by the very good results in the PCMark benchmarks. Schenker's 14-inch notebook can be used in any scenario where a lot of processing power is necessary - gaming, video editing, photo editing. It is not possible to increase the overall performance, as Schenker has already maxed out everything.
| PCMark 7 Score | 6266 points | |
| PCMark 8 Home Score Accelerated v2 | 4069 points | |
| PCMark 8 Creative Score Accelerated v2 | 5146 points | |
| PCMark 8 Work Score Accelerated v2 | 5234 points | |
Help | ||
| PCMark 8 | |
| Home Score Accelerated v2 | |
| Schenker XMG P407 | |
| Razer Blade (2016) FHD | |
| MSI GL62M 7RD-077 | |
| Gigabyte P34W v5 | |
| Schenker XMG P406 | |
| Work Score Accelerated v2 | |
| Schenker XMG P407 | |
| Schenker XMG P406 | |
| Razer Blade (2016) FHD | |
| MSI GL62M 7RD-077 | |
| Gigabyte P34W v5 | |
| PCMark 7 - Score | |
| Schenker XMG P407 | |
| Gigabyte P34W v5 | |
| Schenker XMG P406 | |
| Razer Blade (2016) FHD | |
| MSI GL62M 7RD-077 | |
Storage Devices
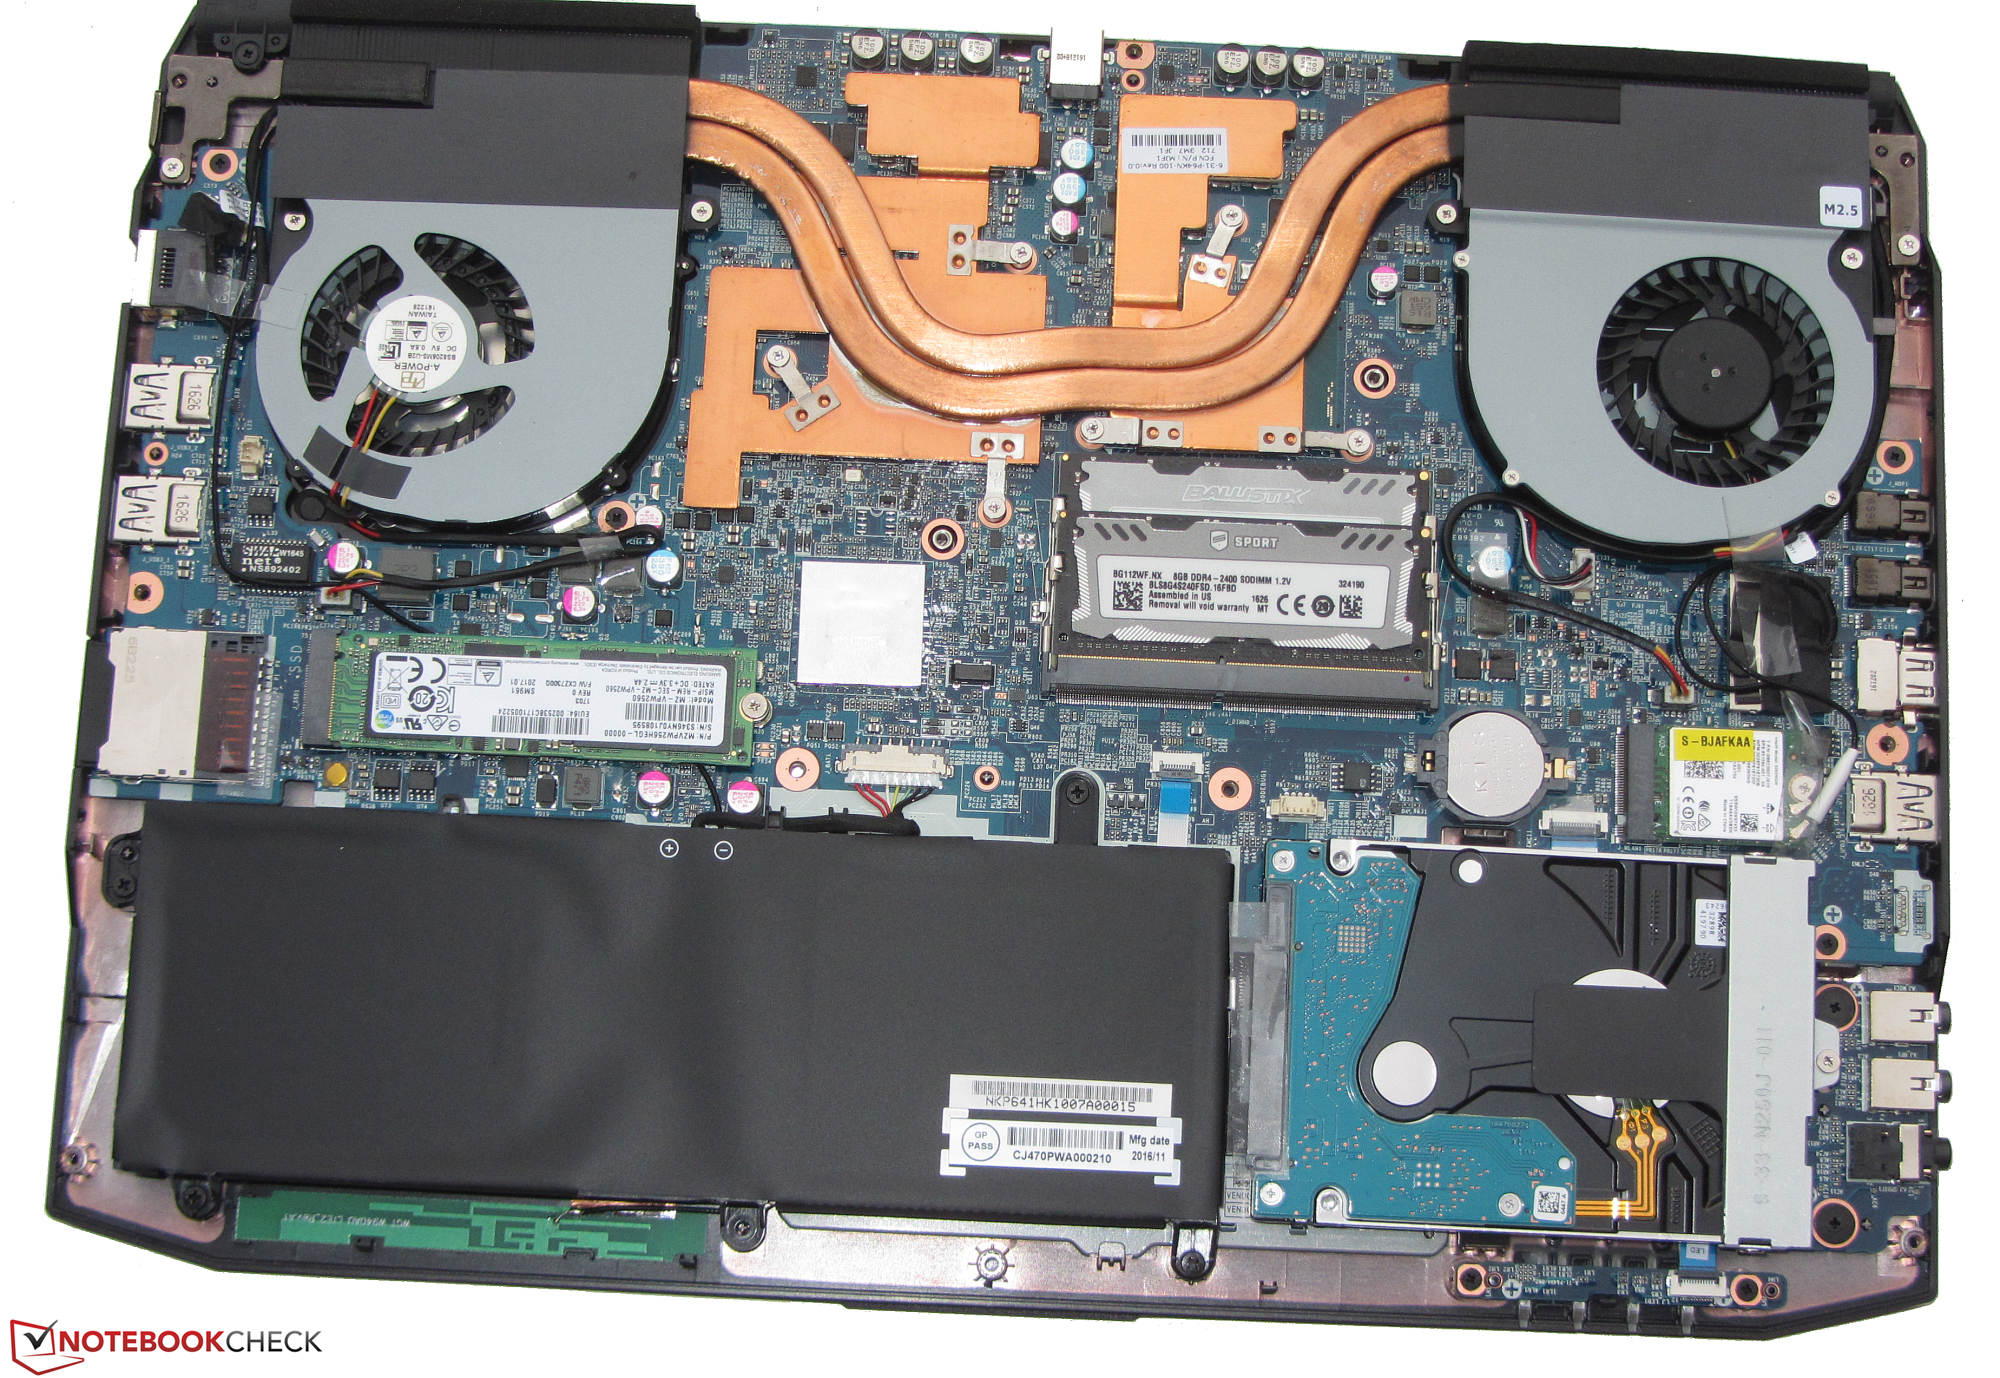
Schenker uses a Samsung SSD as the system drive. This M.2 model (SM961) offers a total capacity of 256 GB. Since this is an NVMe SSD, the transfer rates are excellent. NVMe drives are attached via PCI Express x4, which allows for much higher transfer speeds than a connection via SATA-III. The SSD's storage is usually not enough for a gaming notebook. This is why the XMG P407 also includes a common 2.5-inch hard drive (1 TB, 5,400 rpm).

| Schenker XMG P407 Samsung SM961 MZVPW256 m.2 PCI-e | Schenker XMG P406 Samsung SM951 MZHPV256HDGL m.2 PCI-e | Razer Blade (2016) FHD | Gigabyte P34W v5 Samsung SSD 950 Pro 512GB m.2 NVMe | MSI GL62M 7RD-077 HGST Travelstar 7K1000 HTS721010A9E630 | |
|---|---|---|---|---|---|
| CrystalDiskMark 3.0 | 14% | 20% | 31% | -96% | |
| Read Seq (MB/s) | 1345 | 1634 21% | 1977 47% | 2269 69% | 112.4 -92% |
| Write Seq (MB/s) | 1502 | 1290 -14% | 1668 11% | 1524 1% | 107.3 -93% |
| Read 512 (MB/s) | 320.3 | 1149 259% | 800 150% | 937 193% | 43.19 -87% |
| Write 512 (MB/s) | 1276 | 1285 1% | 1030 -19% | 1483 16% | 57 -96% |
| Read 4k (MB/s) | 58.9 | 43.82 -26% | 58.1 -1% | 53.8 -9% | 0.494 -99% |
| Write 4k (MB/s) | 171 | 110.3 -35% | 145.6 -15% | 167.3 -2% | 1.122 -99% |
| Read 4k QD32 (MB/s) | 625 | 320.5 -49% | 592 -5% | 622 0% | 1.088 -100% |
| Write 4k QD32 (MB/s) | 539 | 287.3 -47% | 508 -6% | 418.9 -22% | 1.234 -100% |
Graphics Card
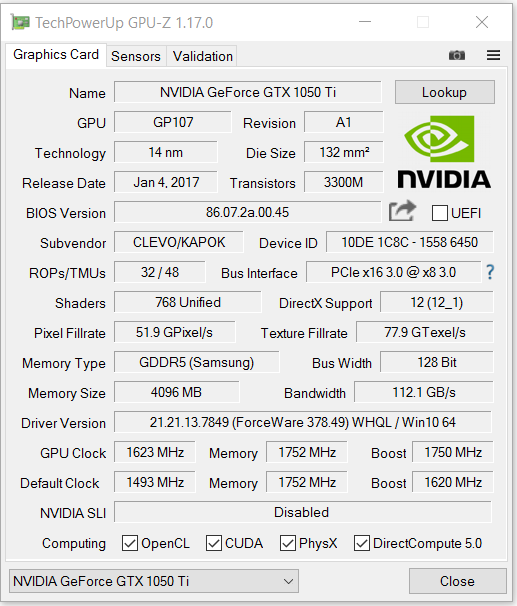
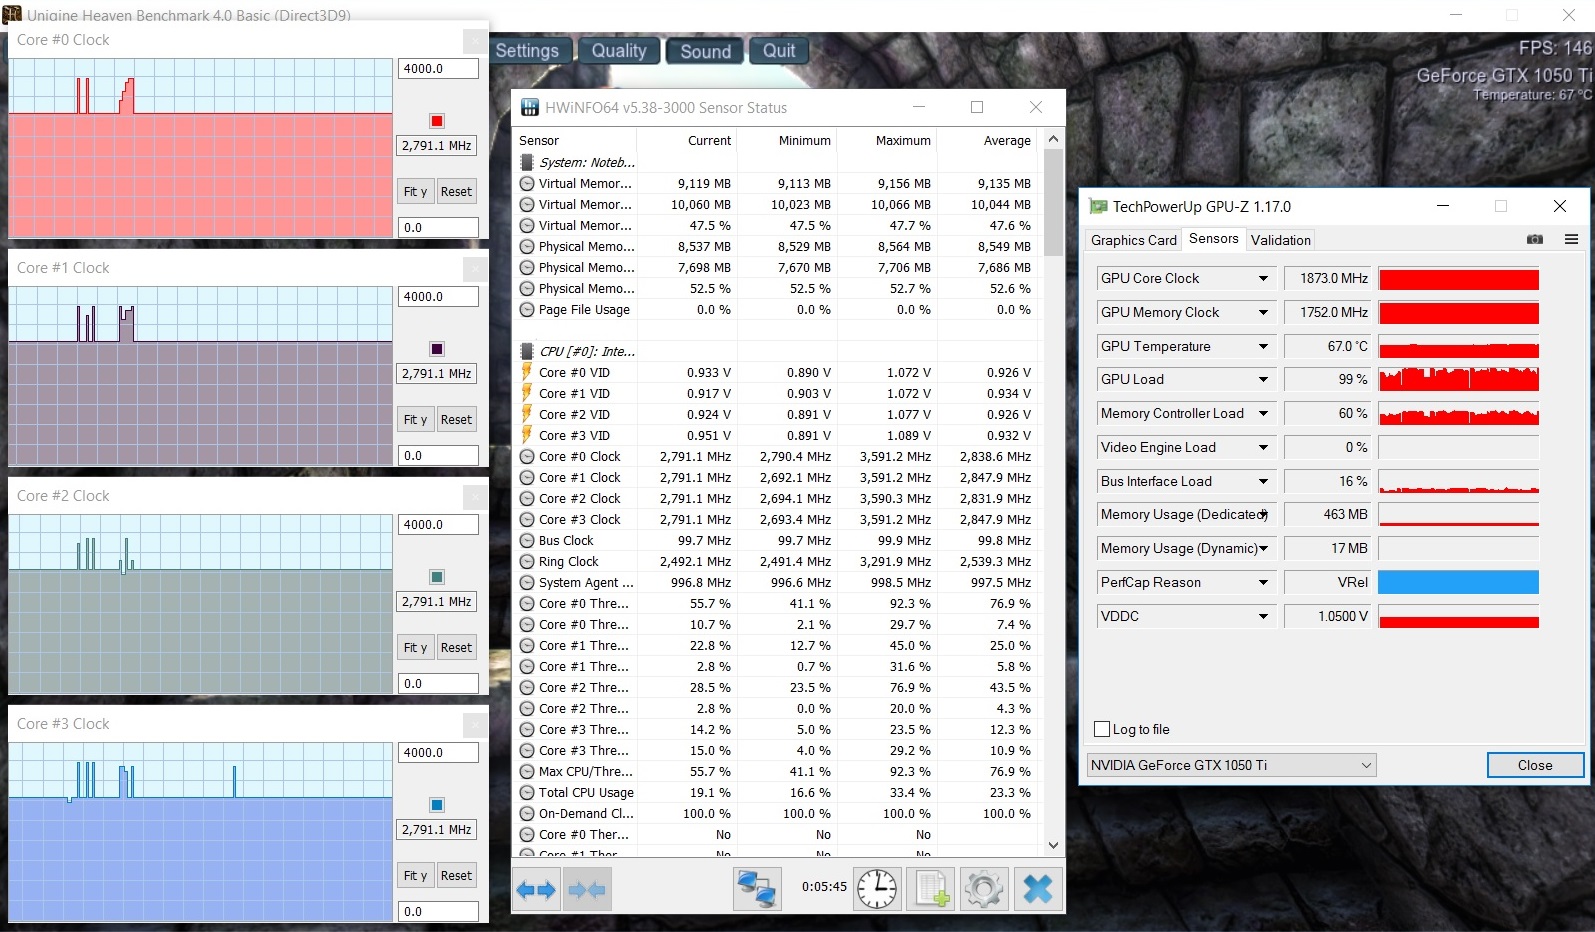
The XMG P407 is delivered with an active switchable graphics solution (Optimus). Intel's integrated HD Graphics 630 comes into action in everyday use and battery mode. Nvidia's GeForce GTX 1050 Ti is responsible for demanding applications such as computer games. The GTX 1050 Ti is an upper mid-range model based on Nvidia's Pascal architecture. The core supports DirectX 12 and achieves speeds of up to 1924 MHz. This value, however, is not consistently upheld; we observed an average clock frequency of 1870 MHz during our test. The GPU has access to 4096 MB of GDDR5 graphics memory. The results of the 3DMark benchmarks are at a good level for the built-in graphics core. The GeForce GTX 1050 Ti attains somewhat better results than the predecessor's GeForce GTX 970M.
| 3DMark 06 Standard Score | 26084 points | |
| 3DMark 11 Performance | 9921 points | |
| 3DMark Ice Storm Standard Score | 83626 points | |
| 3DMark Cloud Gate Standard Score | 22393 points | |
| 3DMark Fire Strike Score | 7194 points | |
| 3DMark Fire Strike Extreme Score | 3766 points | |
| 3DMark Time Spy Score | 2659 points | |
Help | ||
| 3DMark | |
| 1280x720 Cloud Gate Standard Graphics | |
| Asus Strix GL502VM-FY039T | |
| Razer Blade (2016) FHD | |
| Schenker XMG P407 | |
| Schenker XMG P406 | |
| Gigabyte P34W v5 | |
| Dell Inspiron 15 7000 7567 | |
| MSI GL62M 7RD-077 | |
| 1920x1080 Fire Strike Graphics | |
| Asus Strix GL502VM-FY039T | |
| Razer Blade (2016) FHD | |
| Schenker XMG P407 | |
| Dell Inspiron 15 7000 7567 | |
| Gigabyte P34W v5 | |
| Schenker XMG P406 | |
| MSI GL62M 7RD-077 | |
| 3DMark 11 - 1280x720 Performance GPU | |
| Asus Strix GL502VM-FY039T | |
| Razer Blade (2016) FHD | |
| Schenker XMG P407 | |
| Dell Inspiron 15 7000 7567 | |
| Gigabyte P34W v5 | |
| Schenker XMG P406 | |
| MSI GL62M 7RD-077 | |
Gaming Performance
The CPU-GPU combination in the XMG P407 brings all current computer games smoothly onto the display, usually in Full HD resolution and with high, sometimes maximum quality settings. Some games require lowering the resolution and/or quality settings, for example Mafia 3. As far as resolutions beyond Full HD are concerned, the built-in graphics core is not made for that; only a few games can be played with playable frame rates in 4K. For this, you should use a laptop with at least a GTX 1070 on-board.
| low | med. | high | ultra | |
|---|---|---|---|---|
| Tomb Raider (2013) | 360.1 | 258.1 | 199.2 | 98.9 |
| BioShock Infinite (2013) | 168.9 | 159.2 | 152.2 | 76.4 |
| Battlefield 4 (2013) | 178.6 | 174.9 | 145.7 | 71 |
| Ashes of the Singularity (2016) | 63.2 | 45.6 | 40.4 | |
| Deus Ex Mankind Divided (2016) | 99 | 74.7 | 39.8 | 20.3 |
| Battlefield 1 (2016) | 142.1 | 122.1 | 62.4 | 56.3 |
| Civilization 6 (2016) | 70.2 | 50.1 | 41.8 | 42.4 |
| Titanfall 2 (2016) | 143.7 | 136.5 | 68.5 | 58.6 |
| BioShock Infinite - 1920x1080 Ultra Preset, DX11 (DDOF) | |
| Asus Strix GL502VM-FY039T | |
| Razer Blade (2016) FHD | |
| Schenker XMG P407 | |
| Dell Inspiron 15 7000 7567 | |
| Gigabyte P34W v5 | |
| MSI GL62M 7RD-077 | |
| Tomb Raider - 1920x1080 Ultra Preset AA:FX AF:16x | |
| Asus Strix GL502VM-FY039T | |
| Razer Blade (2016) FHD | |
| Schenker XMG P407 | |
| Gigabyte P34W v5 | |
| MSI GL62M 7RD-077 | |
| Battlefield 4 - 1920x1080 Ultra Preset AA:4x MS | |
| Asus Strix GL502VM-FY039T | |
| Razer Blade (2016) FHD | |
| Schenker XMG P407 | |
| Schenker XMG P406 | |
| MSI GL62M 7RD-077 | |
| Battlefield 1 - 1920x1080 Ultra Preset AA:T | |
| Schenker XMG P407 | |
| Dell Inspiron 15 7000 7567 | |
| MSI GL62M 7RD-077 | |
| Ashes of the Singularity - 1920x1080 high | |
| Asus Strix GL502VM-FY039T | |
| Razer Blade (2016) FHD | |
| Schenker XMG P407 | |
| MSI GL62M 7RD-077 | |
| Titanfall 2 - 1920x1080 Very High (Insane Texture Quality) / Enabled AA:TS AF:16x | |
| Asus Strix GL502VM-FY039T | |
| Dell Inspiron 15 7000 7567 | |
| Schenker XMG P407 | |
| MSI GL62M 7RD-077 | |
| Civilization 6 - 1920x1080 Ultra Preset AA:4xMS | |
| Schenker XMG P407 | |
| MSI GL62M 7RD-077 | |
| Deus Ex Mankind Divided - 1920x1080 High Preset AF:4x | |
| Razer Blade (2016) FHD | |
| Schenker XMG P407 | |
| MSI GL62M 7RD-077 | |
Emissions
System Noise
The two fans of the XMG P407 frequently stand still when idling, leaving only the noise of the 2.5-inch hard drive. The CPU fan works occasionally. We criticized the predecessor model, the XMG P406, for having a fan that unexpectedly speeds up in idle mode and creates considerable noise. The P407 does not have this issue. The fans attain significant speeds and noise under load: During our stress test, we measure a sound pressure level of 48 dB(A); in everyday gaming situations, the noise level fluctuates between 39 and 43 dB(A).
The GPU fan (= on the right side from the user's point of view) of the notebook is a negative point. It rattles/wobbles slightly and produces more noise than necessary. However, the noise is primarily heard at low rotation speeds. After having opened the case of the P407, the cause of this rattling is quickly found: The fan is defective. The vane wheel is not firmly fixed and can be moved along the rotation axis, grinding slightly on the case of the fan. Hopefully, only our test device has a defective fan.
Noise level
| Idle |
| 31 / 32 / 36 dB(A) |
| HDD |
| 32 dB(A) |
| Load |
| 43 / 48 dB(A) |
 | ||
30 dB silent 40 dB(A) audible 50 dB(A) loud |
||
min: | ||
| Schenker XMG P407 i7-7700HQ, GeForce GTX 1050 Ti Mobile | Schenker XMG P406 6700HQ, GeForce GTX 970M | Razer Blade (2016) FHD 6700HQ, GeForce GTX 1060 Mobile | Gigabyte P34W v5 6700HQ, GeForce GTX 970M | MSI GL62M 7RD-077 i7-7700HQ, GeForce GTX 1050 Mobile | |
|---|---|---|---|---|---|
| Noise | -5% | -9% | -2% | 1% | |
| off / environment * (dB) | 29 | 31 -7% | 30.6 -6% | ||
| Idle Minimum * (dB) | 31 | 30 3% | 35 -13% | 31.6 -2% | 32.5 -5% |
| Idle Average * (dB) | 32 | 32 -0% | 36 -13% | 31.6 1% | 32.5 -2% |
| Idle Maximum * (dB) | 36 | 40 -11% | 37 -3% | 32.5 10% | 32.5 10% |
| Load Average * (dB) | 43 | 47 -9% | 43 -0% | 46.5 -8% | 36.4 15% |
| Load Maximum * (dB) | 48 | 51 -6% | 57 -19% | 52.5 -9% | 52.4 -9% |
* ... smaller is better
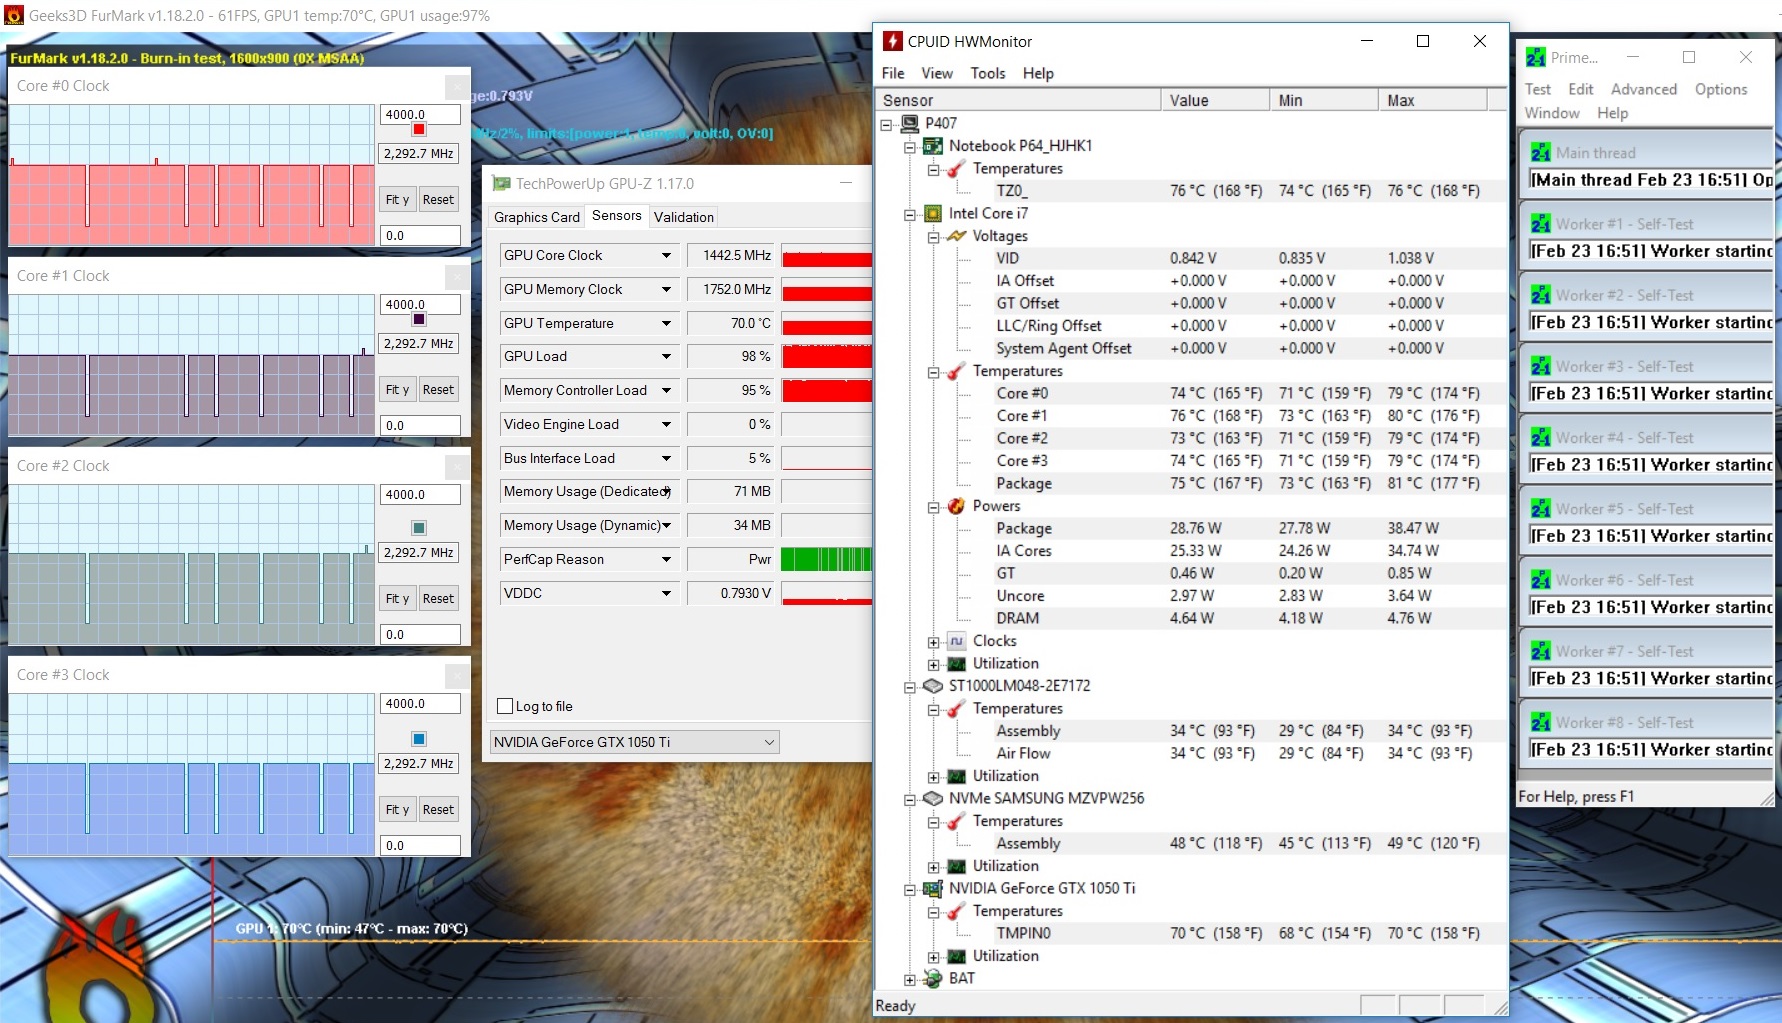
Temperature
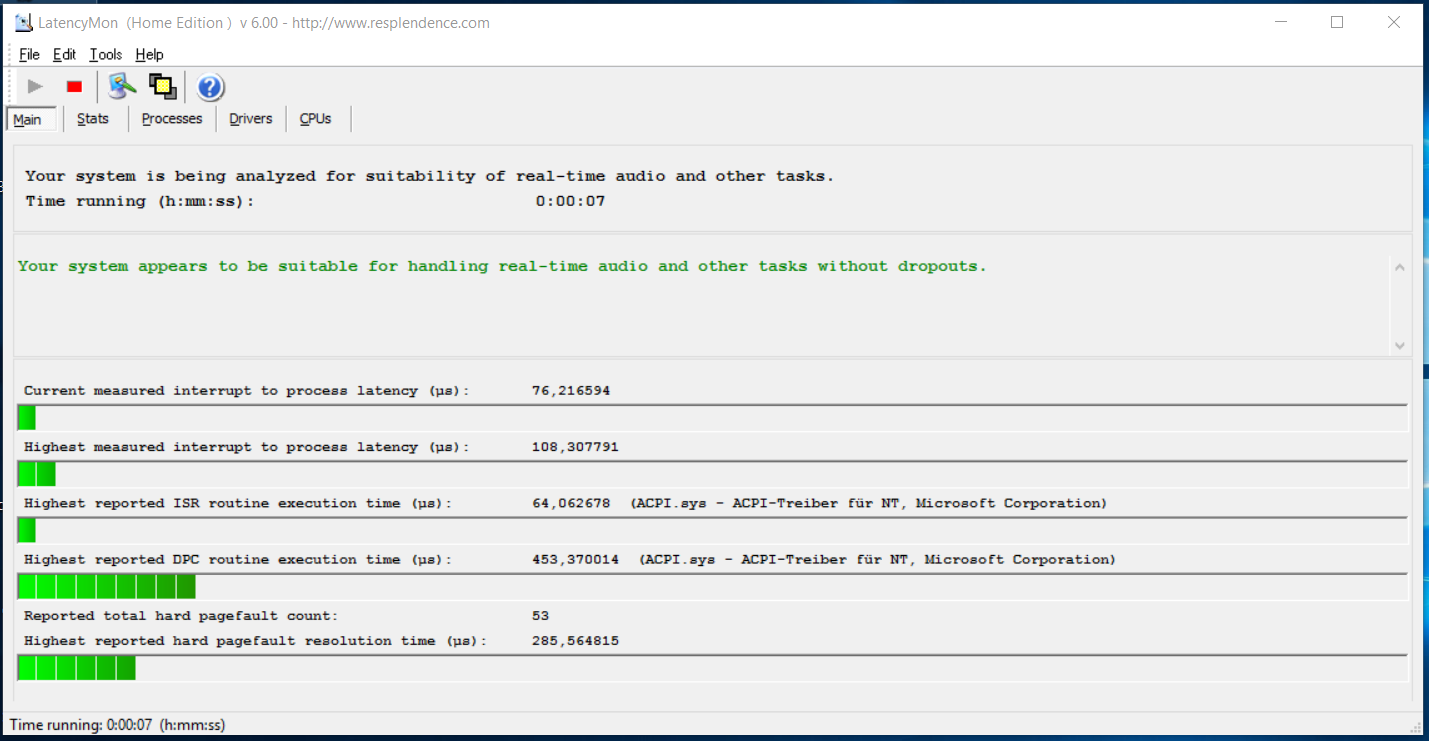
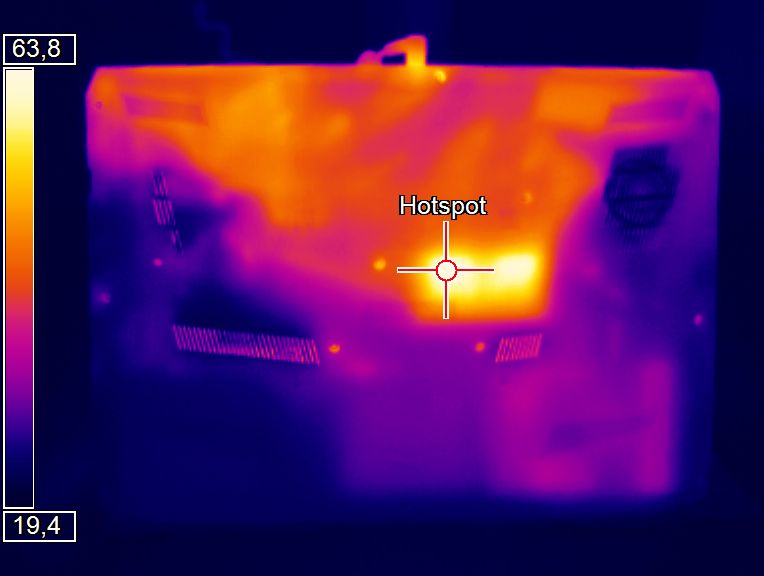
The P407 handles our stress test (Prime95 and FurMark run for at least an hour) differently in battery mode and when plugged in. In the latter case, the processor works at 2.3 GHz with occasional slowdowns to 550 MHz. The graphics core attains a frequency of approximately 1450 MHz. These values drop considerably when running on battery: The CPU clock speed jumps back and forth between 800 MHz and 1.7 GHz. The speed of the GPU keeps fluctuating in the range of 900 MHz to 1.9 GHz. The notebook's heat development is comparatively moderate; the temperature exceeds 50 °C only on one measuring point under full load.
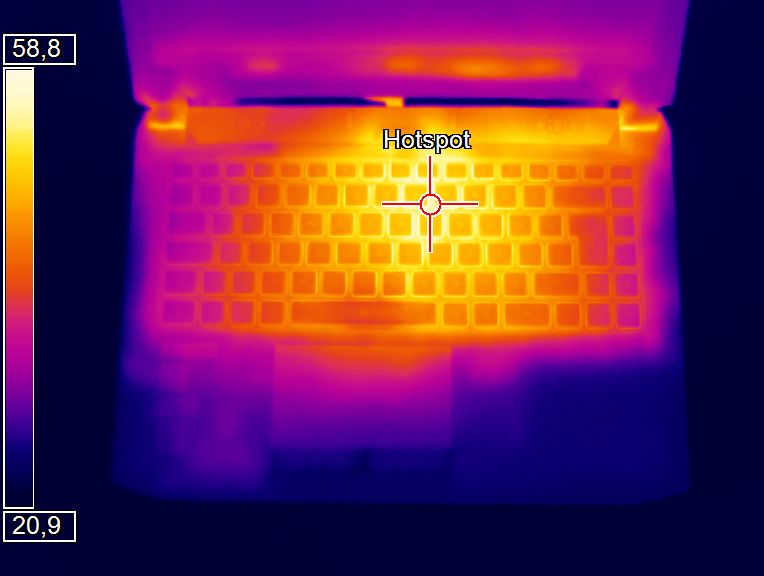
(-) The maximum temperature on the upper side is 49 °C / 120 F, compared to the average of 40.4 °C / 105 F, ranging from 21.2 to 68.8 °C for the class Gaming.
(-) The bottom heats up to a maximum of 50.8 °C / 123 F, compared to the average of 43.2 °C / 110 F
(+) In idle usage, the average temperature for the upper side is 23.5 °C / 74 F, compared to the device average of 33.9 °C / 93 F.
(±) The palmrests and touchpad can get very hot to the touch with a maximum of 36.4 °C / 97.5 F.
(-) The average temperature of the palmrest area of similar devices was 28.8 °C / 83.8 F (-7.6 °C / -13.7 F).
| Schenker XMG P407 i7-7700HQ, GeForce GTX 1050 Ti Mobile | Schenker XMG P406 6700HQ, GeForce GTX 970M | Razer Blade (2016) FHD 6700HQ, GeForce GTX 1060 Mobile | Gigabyte P34W v5 6700HQ, GeForce GTX 970M | MSI GL62M 7RD-077 i7-7700HQ, GeForce GTX 1050 Mobile | |
|---|---|---|---|---|---|
| Heat | -35% | -6% | -18% | 2% | |
| Maximum Upper Side * (°C) | 49 | 55 -12% | 54 -10% | 59.3 -21% | 44.9 8% |
| Maximum Bottom * (°C) | 50.8 | 58.7 -16% | 49.4 3% | 56.5 -11% | 38.2 25% |
| Idle Upper Side * (°C) | 26.3 | 36.9 -40% | 28 -6% | 27.8 -6% | 27.4 -4% |
| Idle Bottom * (°C) | 24.1 | 41.7 -73% | 26.8 -11% | 31.8 -32% | 29 -20% |
* ... smaller is better
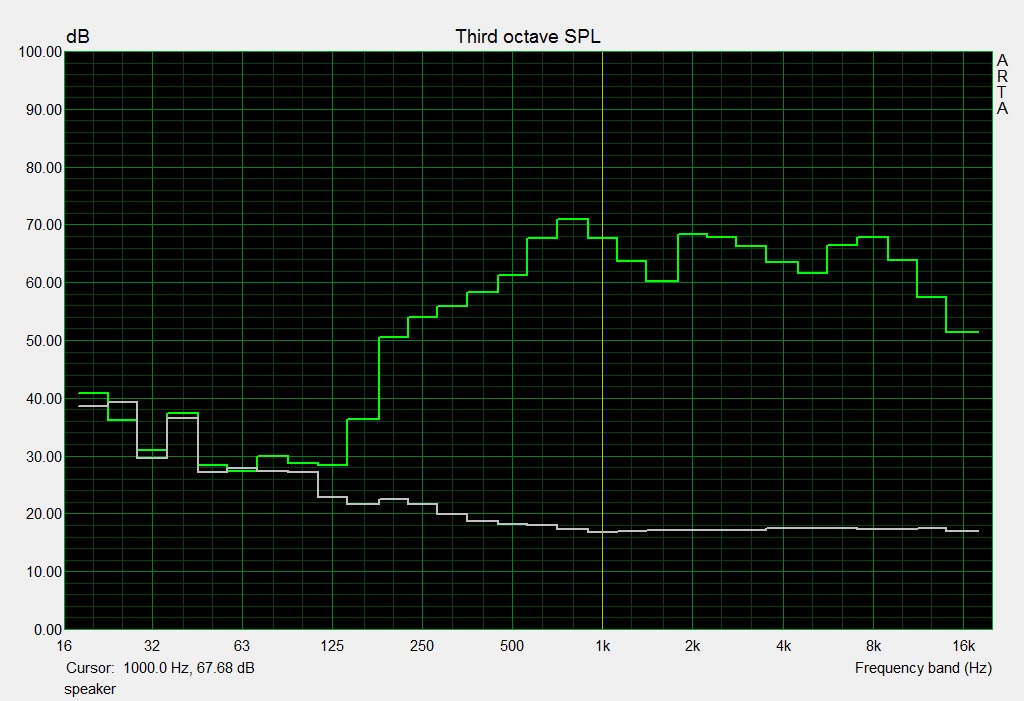
Speakers
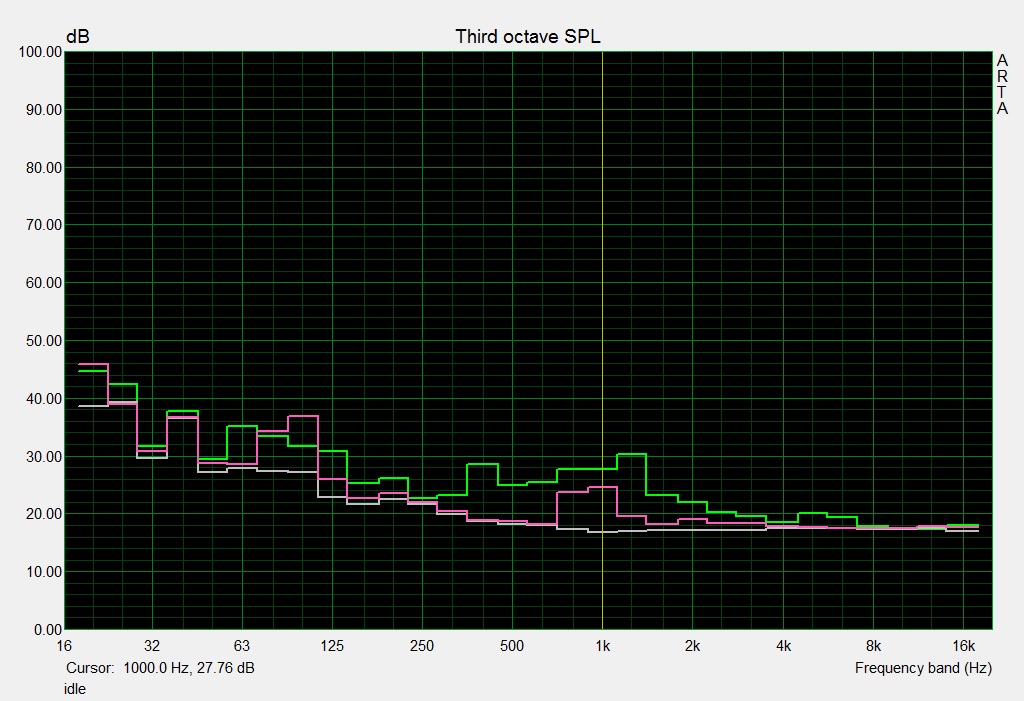
Schenker XMG P407 audio analysis
(±) | speaker loudness is average but good (78 dB)
Bass 100 - 315 Hz
(-) | nearly no bass - on average 19.2% lower than median
(±) | linearity of bass is average (11% delta to prev. frequency)
Mids 400 - 2000 Hz
(+) | balanced mids - only 4.4% away from median
(±) | linearity of mids is average (9.6% delta to prev. frequency)
Highs 2 - 16 kHz
(+) | balanced highs - only 3.7% away from median
(+) | highs are linear (5.5% delta to prev. frequency)
Overall 100 - 16.000 Hz
(±) | linearity of overall sound is average (20.5% difference to median)
Compared to same class
» 73% of all tested devices in this class were better, 5% similar, 22% worse
» The best had a delta of 6%, average was 18%, worst was 132%
Compared to all devices tested
» 54% of all tested devices were better, 8% similar, 38% worse
» The best had a delta of 4%, average was 24%, worst was 134%
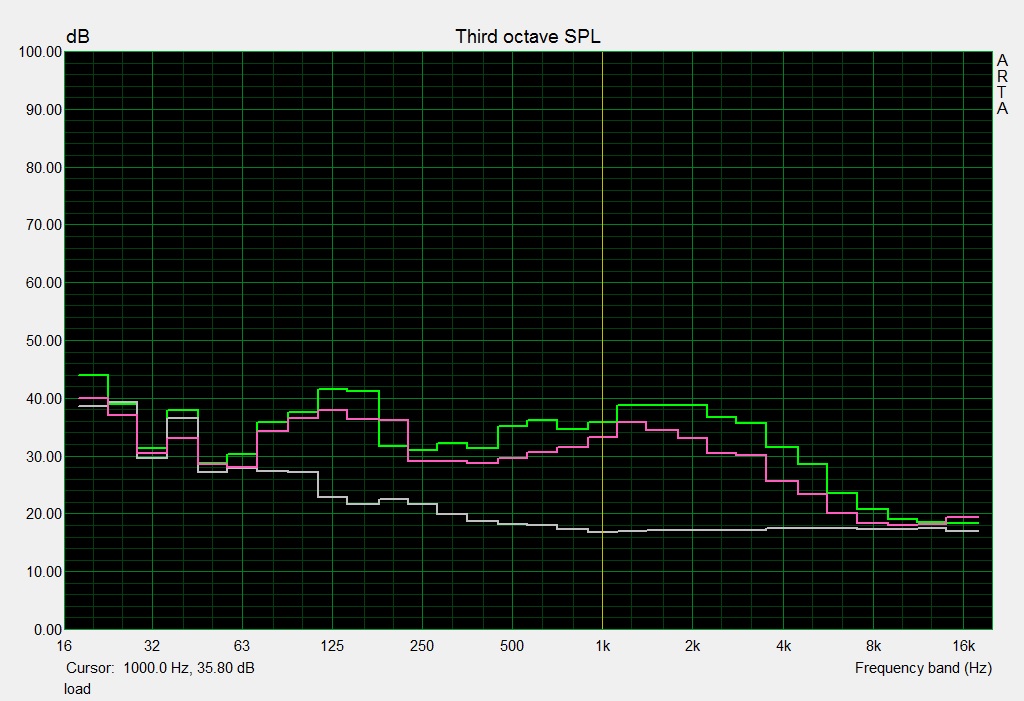
Razer Blade (2016) FHD audio analysis
(±) | speaker loudness is average but good (79 dB)
Bass 100 - 315 Hz
(±) | reduced bass - on average 10.6% lower than median
(±) | linearity of bass is average (12.4% delta to prev. frequency)
Mids 400 - 2000 Hz
(+) | balanced mids - only 4.3% away from median
(+) | mids are linear (3.9% delta to prev. frequency)
Highs 2 - 16 kHz
(+) | balanced highs - only 3.4% away from median
(+) | highs are linear (5.7% delta to prev. frequency)
Overall 100 - 16.000 Hz
(±) | linearity of overall sound is average (17.3% difference to median)
Compared to same class
» 47% of all tested devices in this class were better, 12% similar, 41% worse
» The best had a delta of 6%, average was 18%, worst was 132%
Compared to all devices tested
» 32% of all tested devices were better, 8% similar, 59% worse
» The best had a delta of 4%, average was 24%, worst was 134%
Frequency diagram comparison (checkboxes above are selectable/deselectable!)
Energy Management
Energy Consumption
In idle mode, we measure a maximum power consumption of 24 watts - a normal value for the hardware platform built into this notebook. The 120-watt power supply of the P407 reaches its limits during our stress test: We measure an energy consumption of 124 watts. Nevertheless, there is no need to worry, as our stress test is an extreme scenario that does not occur in everyday use. In an everyday gaming situation, the laptop's energy demand is somewhere around 82 watts (+/-20 watts).
| Off / Standby | |
| Idle | |
| Load |
|
Key:
min: | |
| Schenker XMG P407 i7-7700HQ, GeForce GTX 1050 Ti Mobile | Schenker XMG P406 6700HQ, GeForce GTX 970M | Razer Blade (2016) FHD 6700HQ, GeForce GTX 1060 Mobile | MSI GL62M 7RD-077 i7-7700HQ, GeForce GTX 1050 Mobile | |
|---|---|---|---|---|
| Power Consumption | -13% | -10% | 3% | |
| Idle Minimum * (Watt) | 10 | 12 -20% | 14 -40% | 10.6 -6% |
| Idle Average * (Watt) | 15 | 16 -7% | 18 -20% | 14.5 3% |
| Idle Maximum * (Watt) | 24 | 22 8% | 21 12% | 15 37% |
| Load Average * (Watt) | 82 | 90 -10% | 70 15% | 90 -10% |
| Load Maximum * (Watt) | 124 | 170 -37% | 146 -18% | 135 -9% |
* ... smaller is better
Battery Life
The P407 reaches a runtime of 4:01 h on one battery charge in our realistic WLAN test. For this, we simulate the workload of loading webpages using a script. The profile "Balanced" is active, the energy-saving functions are deactivated, and the screen brightness is lowered to around 150 cd/m². In our video test, Schenker's notebook ceases to work after only 3:33 h. In this case we let the short film Big Buck Bunny (H.264 codec, 1920x1080 pixels) run in a loop. The wireless modules as well as the energy-saving functions are deactivated, and the display brightness is set to around 150 cd/m².
| Schenker XMG P407 i7-7700HQ, GeForce GTX 1050 Ti Mobile, 45 Wh | Schenker XMG P406 6700HQ, GeForce GTX 970M, 45 Wh | Razer Blade (2016) FHD 6700HQ, GeForce GTX 1060 Mobile, 70 Wh | Gigabyte P34W v5 6700HQ, GeForce GTX 970M, 61 Wh | MSI GL62M 7RD-077 i7-7700HQ, GeForce GTX 1050 Mobile, 41 Wh | |
|---|---|---|---|---|---|
| Battery runtime | -25% | 40% | -20% | -18% | |
| Reader / Idle (h) | 7.4 | 4.6 -38% | 12.7 72% | 6.5 -12% | 6.5 -12% |
| H.264 (h) | 3.6 | 5.2 44% | 3.6 0% | ||
| WiFi v1.3 (h) | 4 | 3.3 -17% | 7.1 78% | 3.9 -2% | 3.8 -5% |
| Load (h) | 1.5 | 1.2 -20% | 1 -33% | 0.8 -47% | 0.7 -53% |
Verdict
Pros
Cons
On the outside, the XMG P407 is not different from its predecessor. That is why we shall focus on the new features, which are found primarily on the inside. The new Kaby Lake processor provides a slight performance increase. The fresh CPU also has a good, though modest, impact on battery life. The built-in GeForce GTX 1050 Ti core is in the upper middle range of Nvidia's current line-up, but it offers more performance than many top-range models of the previous generation. In other words: The GeForce GTX 970M chip built into the XMG P406 loses in 3DMark benchmarks as well as in real-world gaming.
The heat development under load can be described as moderate: The XMG P407 does not become as warm as its predecessor. The differences between the P406 and the P407 in terms of system noise are small. However, we notice some improvement: The CPU fan in the P406 likes to speed up unexpectedly and is then clearly perceptible. This behavior is apparently not present in the P407. The ports bear further updates: One of the four USB 3.1 Type-A Gen-1 ports makes way for a USB 3.1 Type-C Gen-2 port. In addition, one of the two Mini DisplayPorts is now equipped with the 1.4 standard.
With the XMG P407, Schenker delivers a well-rounded 14-inch gaming notebook.
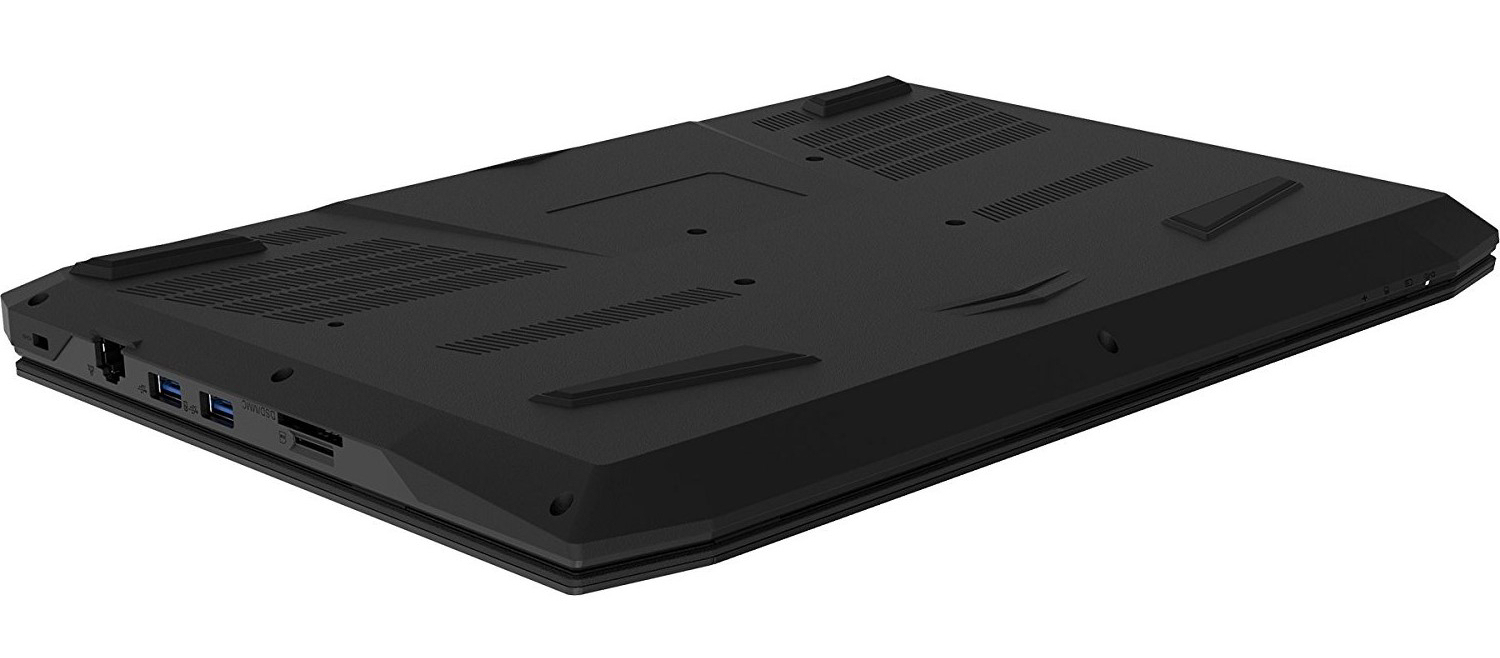
A lightning-quick NVMe SSD ensures a snappy system. The required storage space is provided by a 2.5-inch hard drive. Both drives can be exchanged, since the bottom plate of the base unit can be removed effortlessly. A good keyboard is also in the package. The matte IPS display has pleasantly wide viewing angles and good contrast. However, the display could offer more in terms of brightness. The switching times of the built-in display are only slightly better than those of the XMG P406.
Schenker XMG P407
- 03/06/2017 v6 (old)
Sascha Mölck
Price comparison
