Dell Inspiron 15 7000 7567 Gaming Notebook Review
For the original German review, see here.
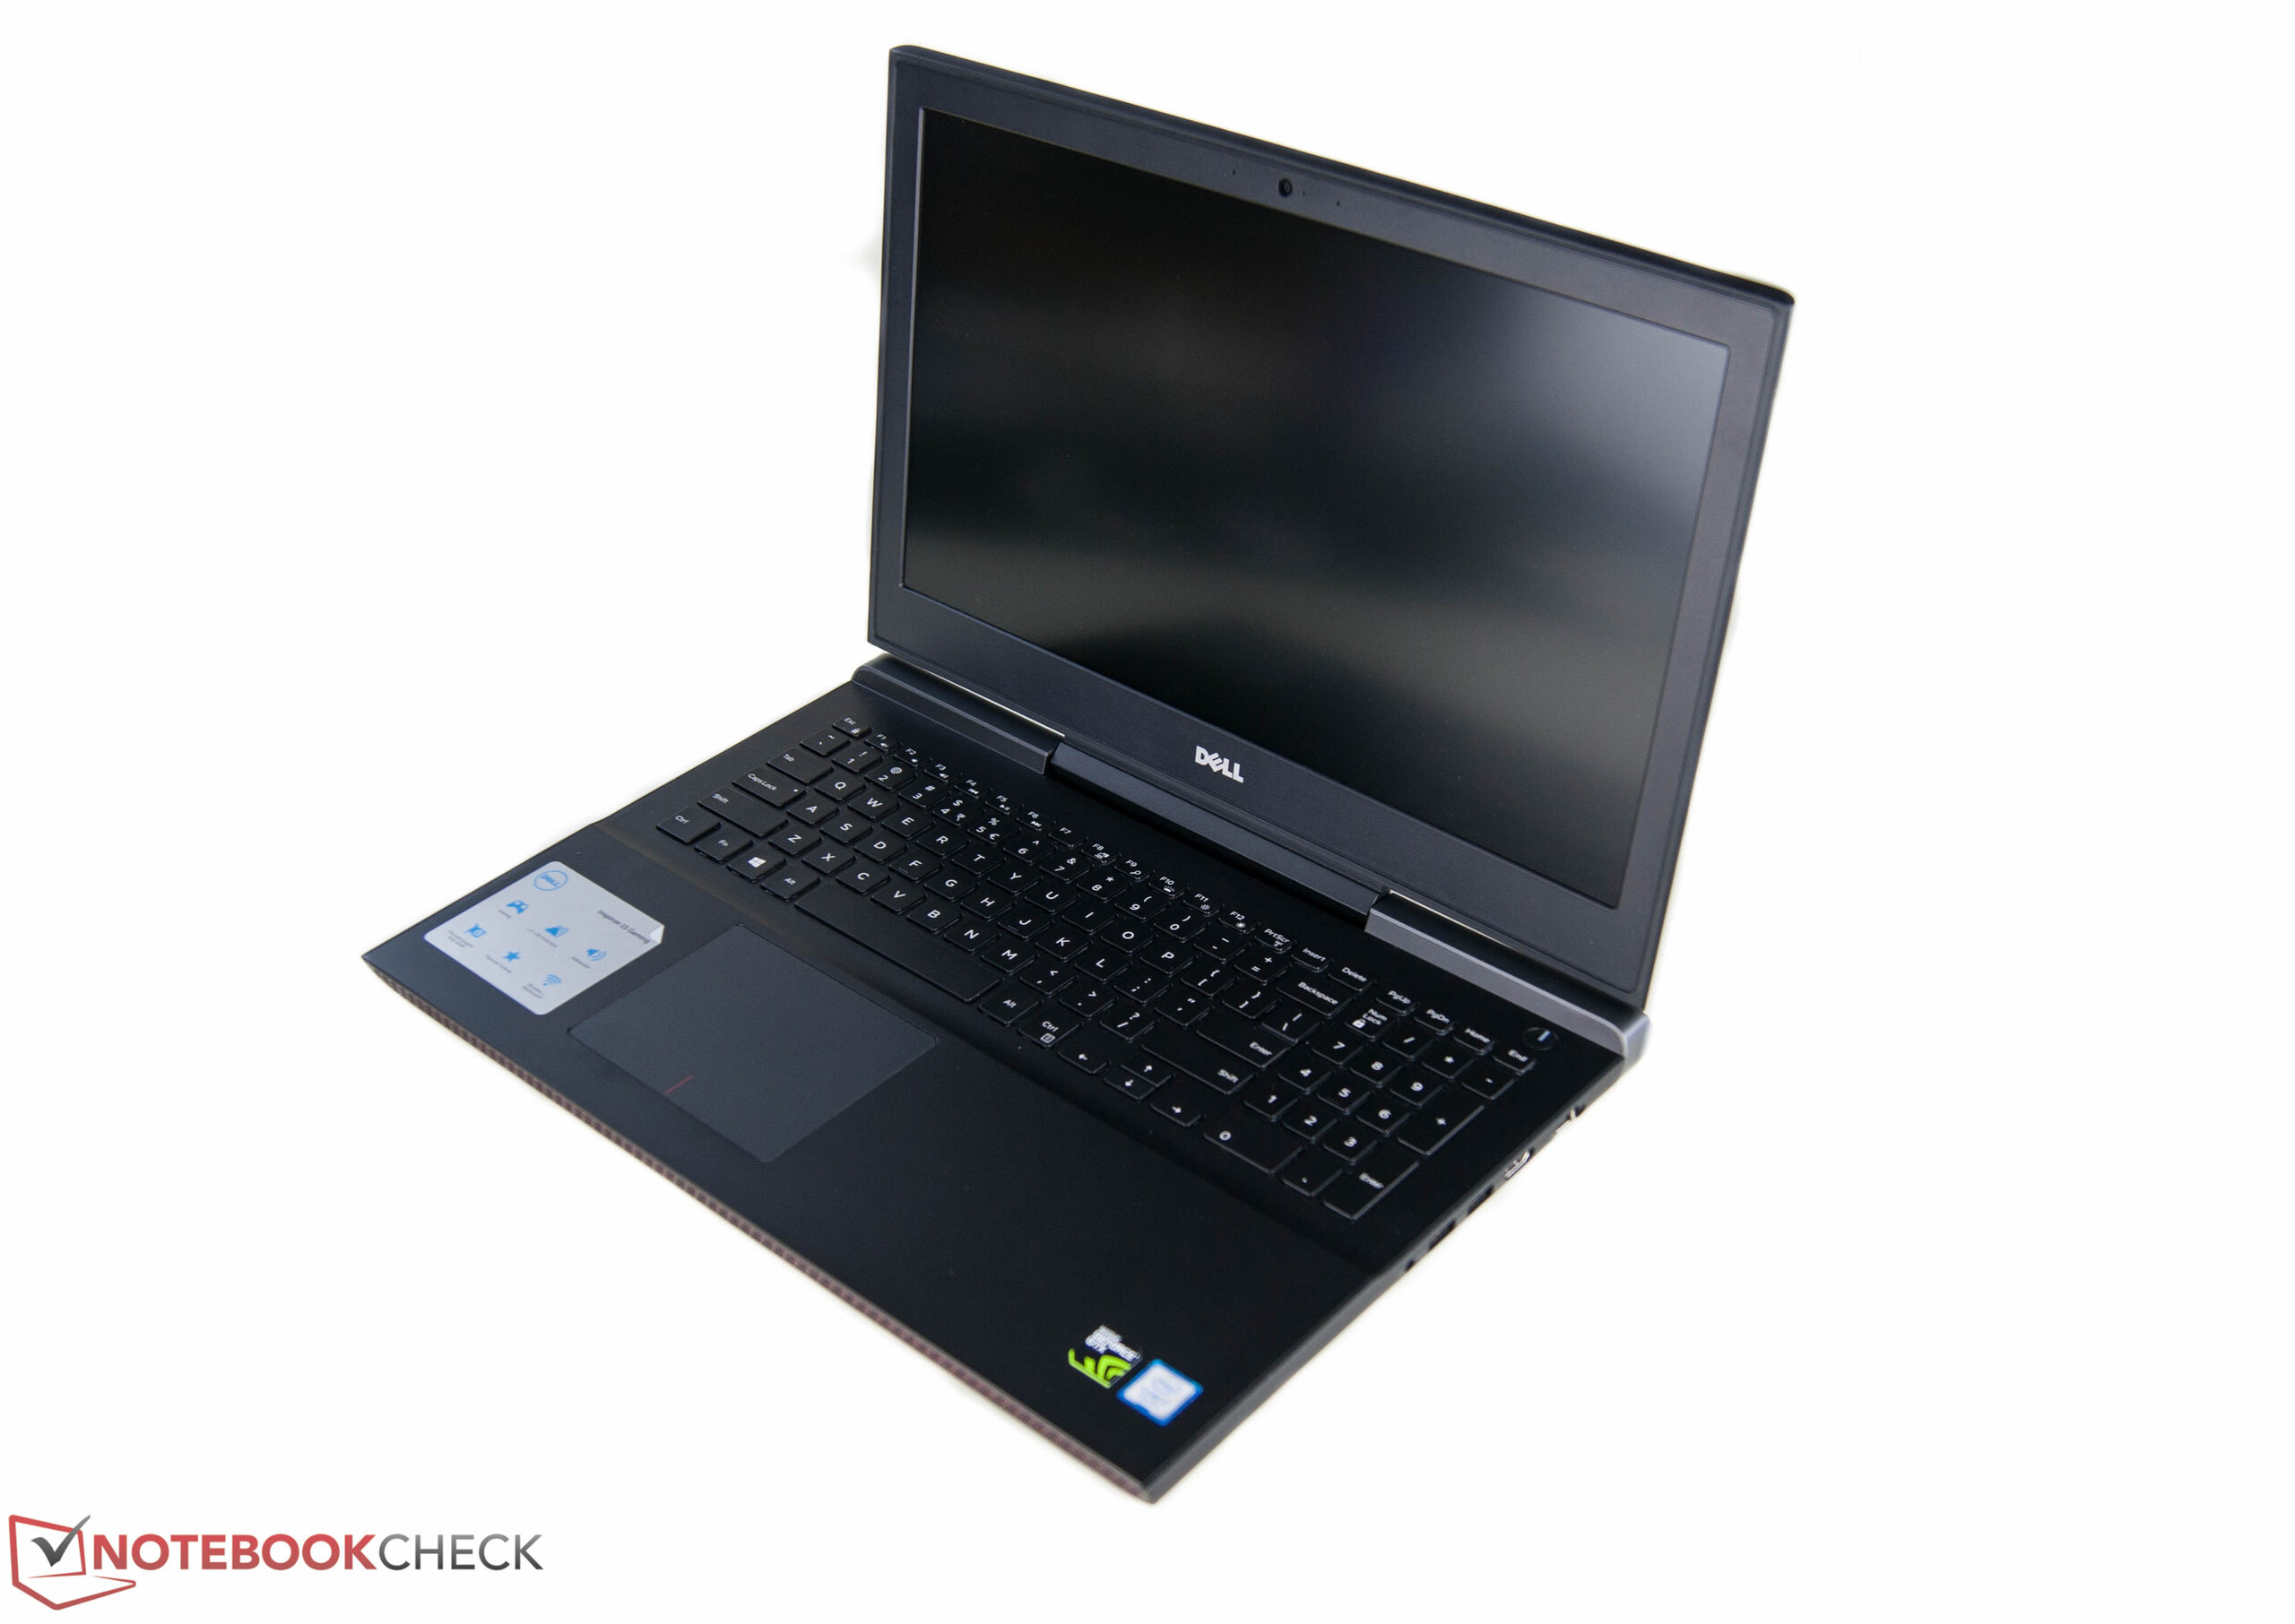
Dell has equipped its Inspiron 15 gaming series with a more powerful Nvidia Pascal graphics card and the latest Kaby Lake CPUs. This combination should also provide a satisfying gaming bundle for a medium budget. In this review, we will scrutinize one of the more powerful variants. It features an Intel Core i7-7700HQ processor, an Nvidia GeForce 1050 Ti, a 256 GB SSD, and a 1 TB HDD. Dell's US store lists it for $1100 (without VAT). This series starts from $800 and consists of five different base models. Only three models are offered in Germany for prices between 1000 Euros (~$1062) and 1480 Euros (~$1572).
Since Dell currently offers the predecessor of our test model up to 150 Euros (~$159) cheaper, we will include our test model of it in our comparison. In addition, we will compare it to notebooks with similar components including the Acer Aspire VX5 with equivalent hardware and the similarly equipped 17-inch MSI GE72. Depending on the variant, the Dell Inspiron either comes with an Nvidia GeForce GTX 1050 or an Nvidia GeForce GTX 1050 Ti. Real gamers might be interested how much better devices with an Nvidia GeForce GTX 1060 perform. Therefore, we have added the Asus Strix GL502VM to our comparisons.
Update 08-03-2017: We had the chance to review the Inspiron 15 7000 with matte Full HD IPS panel and added the results to the display section.
| Variant 1 | Variant 2 | Variant 3 | Test model (US-Model) | |
|---|---|---|---|---|
| Processor | Intel Core i5-7300HQ | Intel Core i7-7700HQ | Intel Core i7-7700HQ | Intel Core i7-7700HQ |
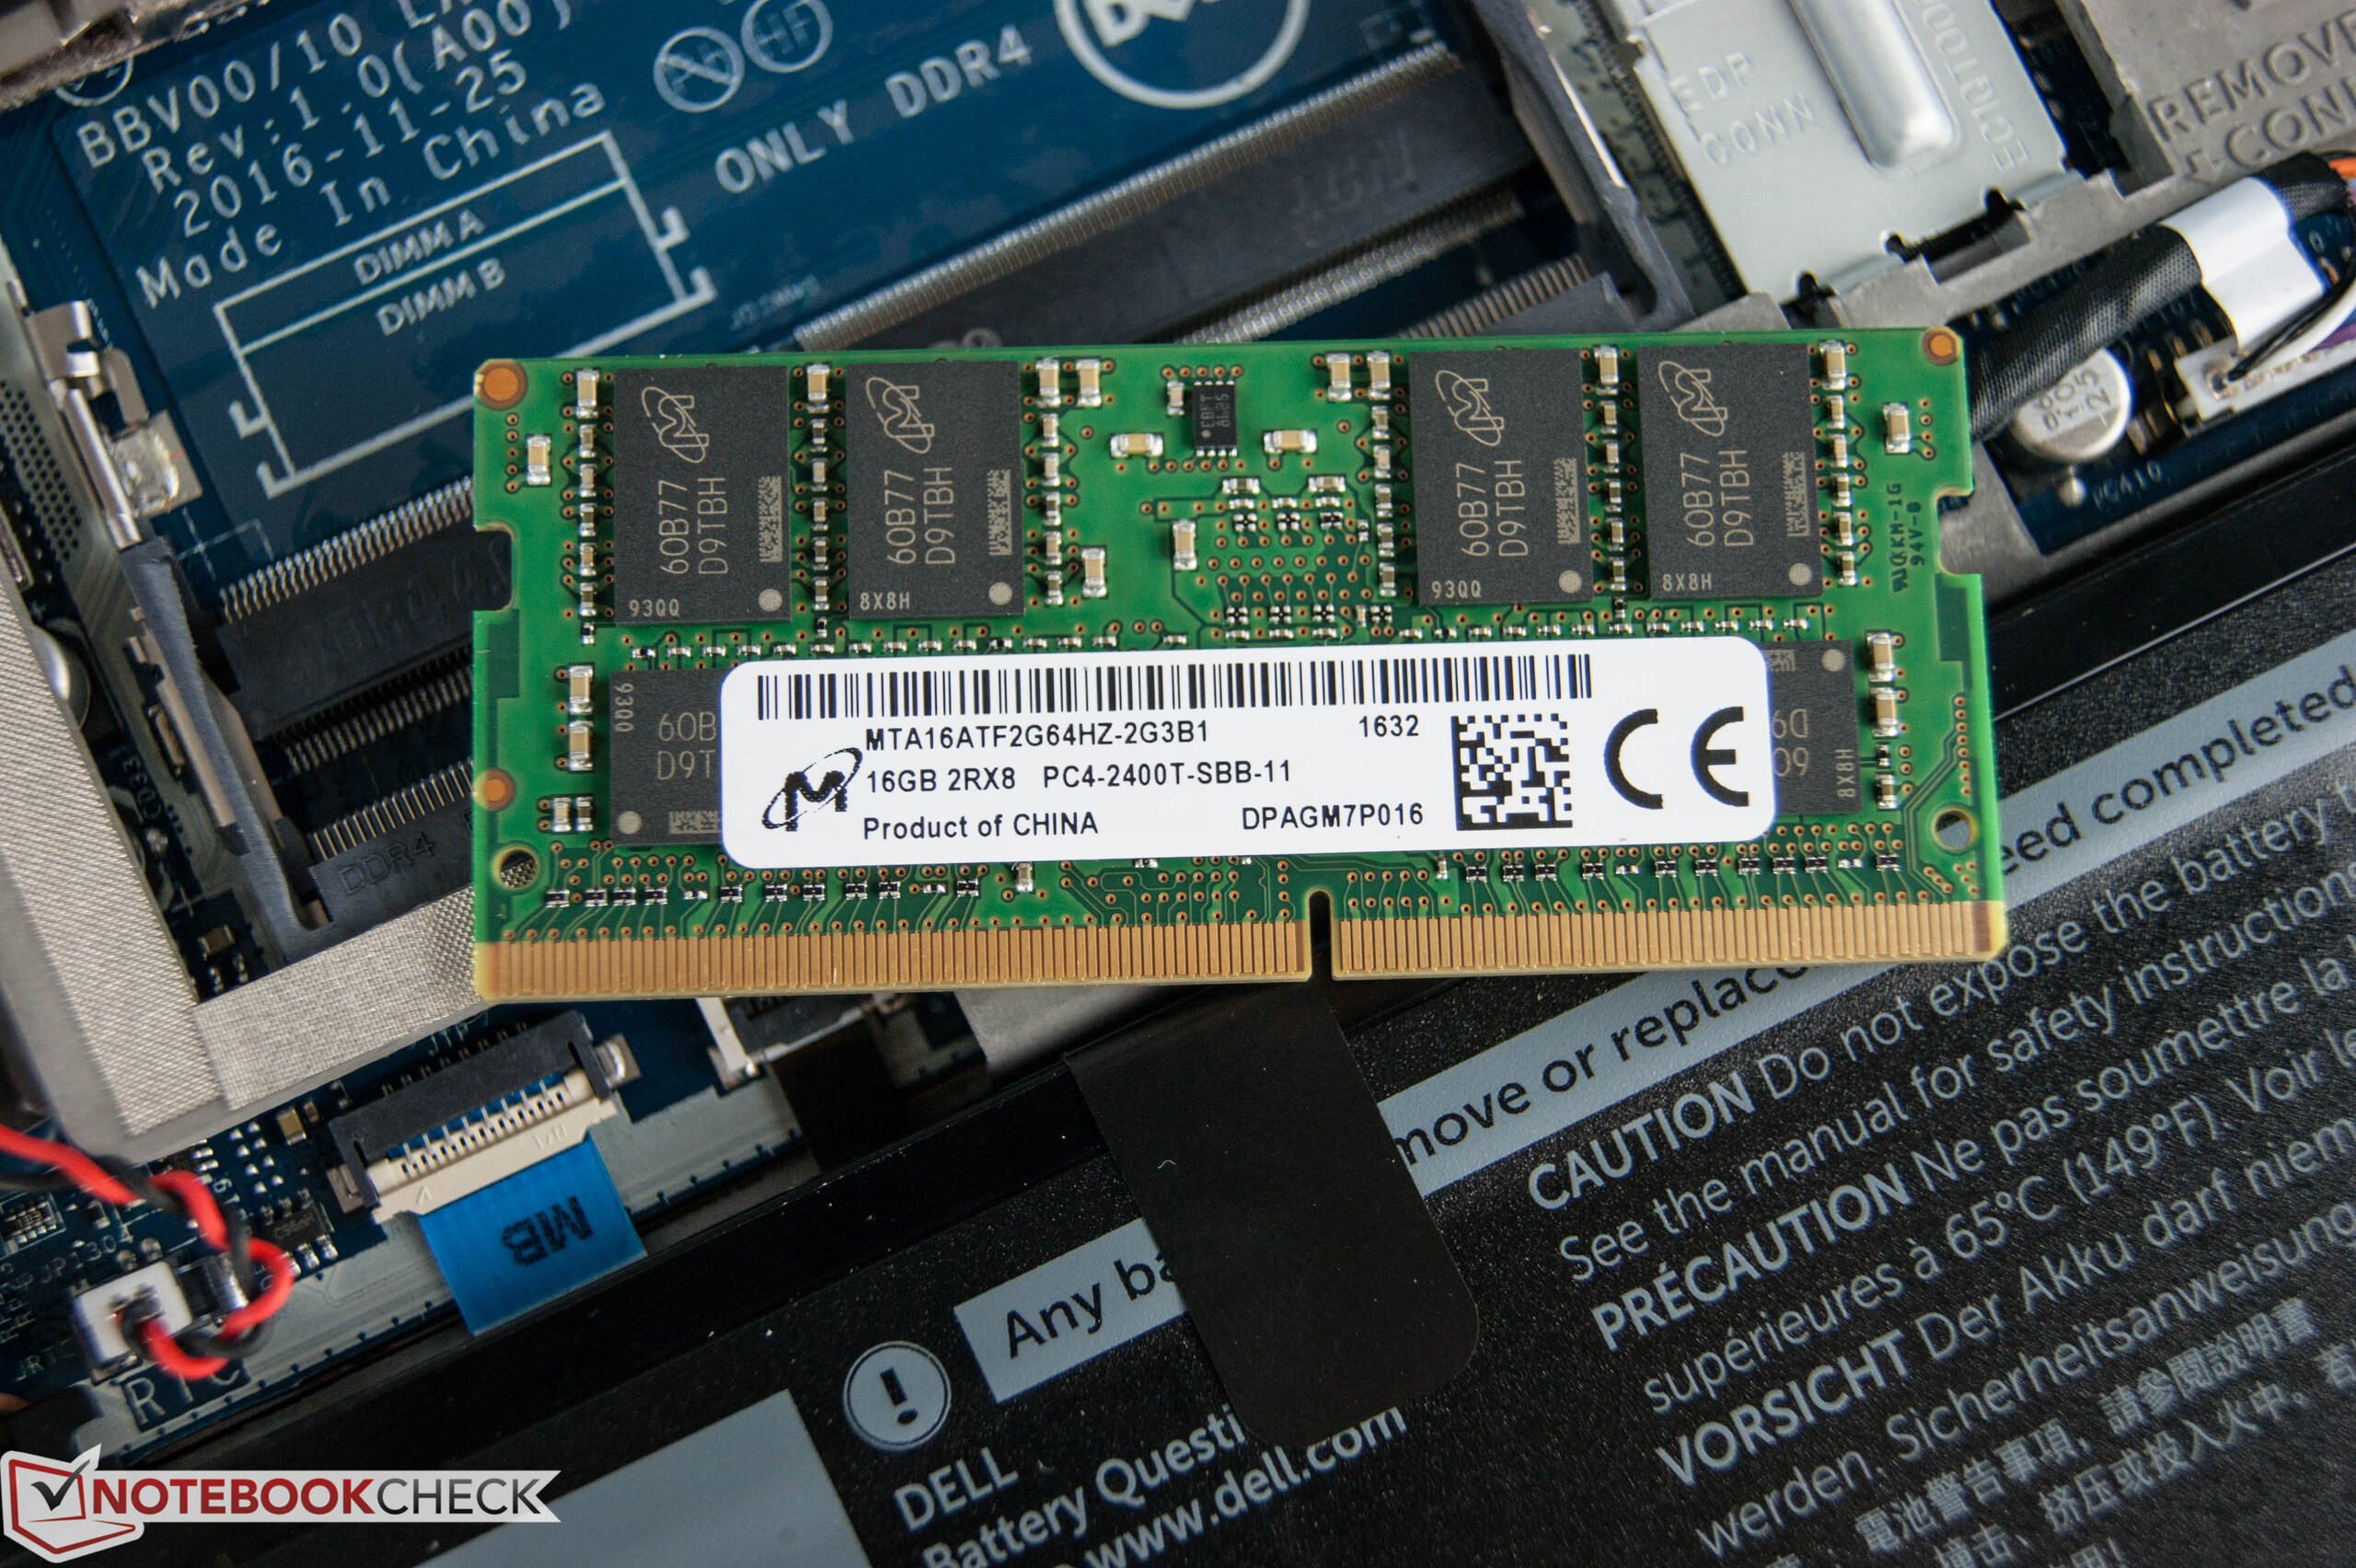
| RAM | 1x 8 GB DDR4 | 1x 16 GB DDR4 | 1x 16 GB DDR4 | 1x 16 GB DDR4 |
| Storage device(s) | 256 GB SSD | 1 TB HDD + 256 GB SSD | 512 GB SSD | 1 TB HDD + 256 GB SSD |
| Graphic card | Nvidia GeForce GTX 1050 | Nvidia GeForce GTX 1050 Ti | Nvidia GeForce GTX 1050 Ti | Nvidia GeForce GTX 1050 Ti |
| Display | FHD display | FHD display | UHD display IPS | FHD display TN |
| Price | 1000 Euros | 1200 Euros | 1480 Euros | 1100 Dollars (excl. VAT) |
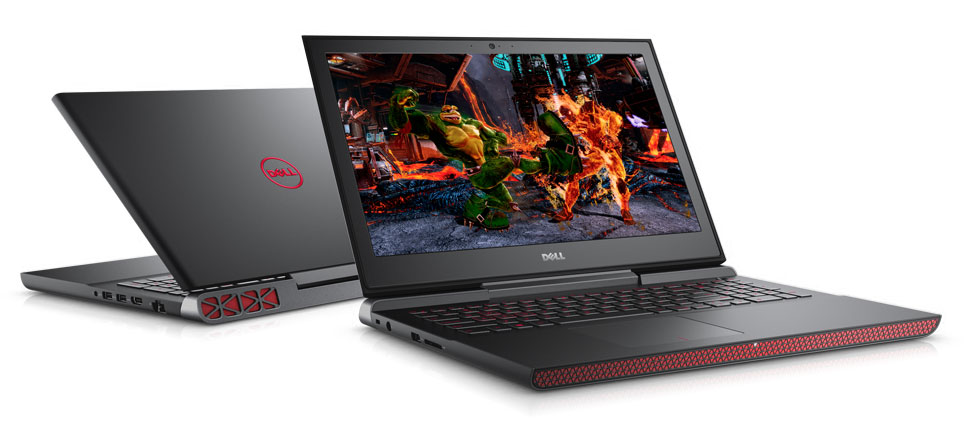
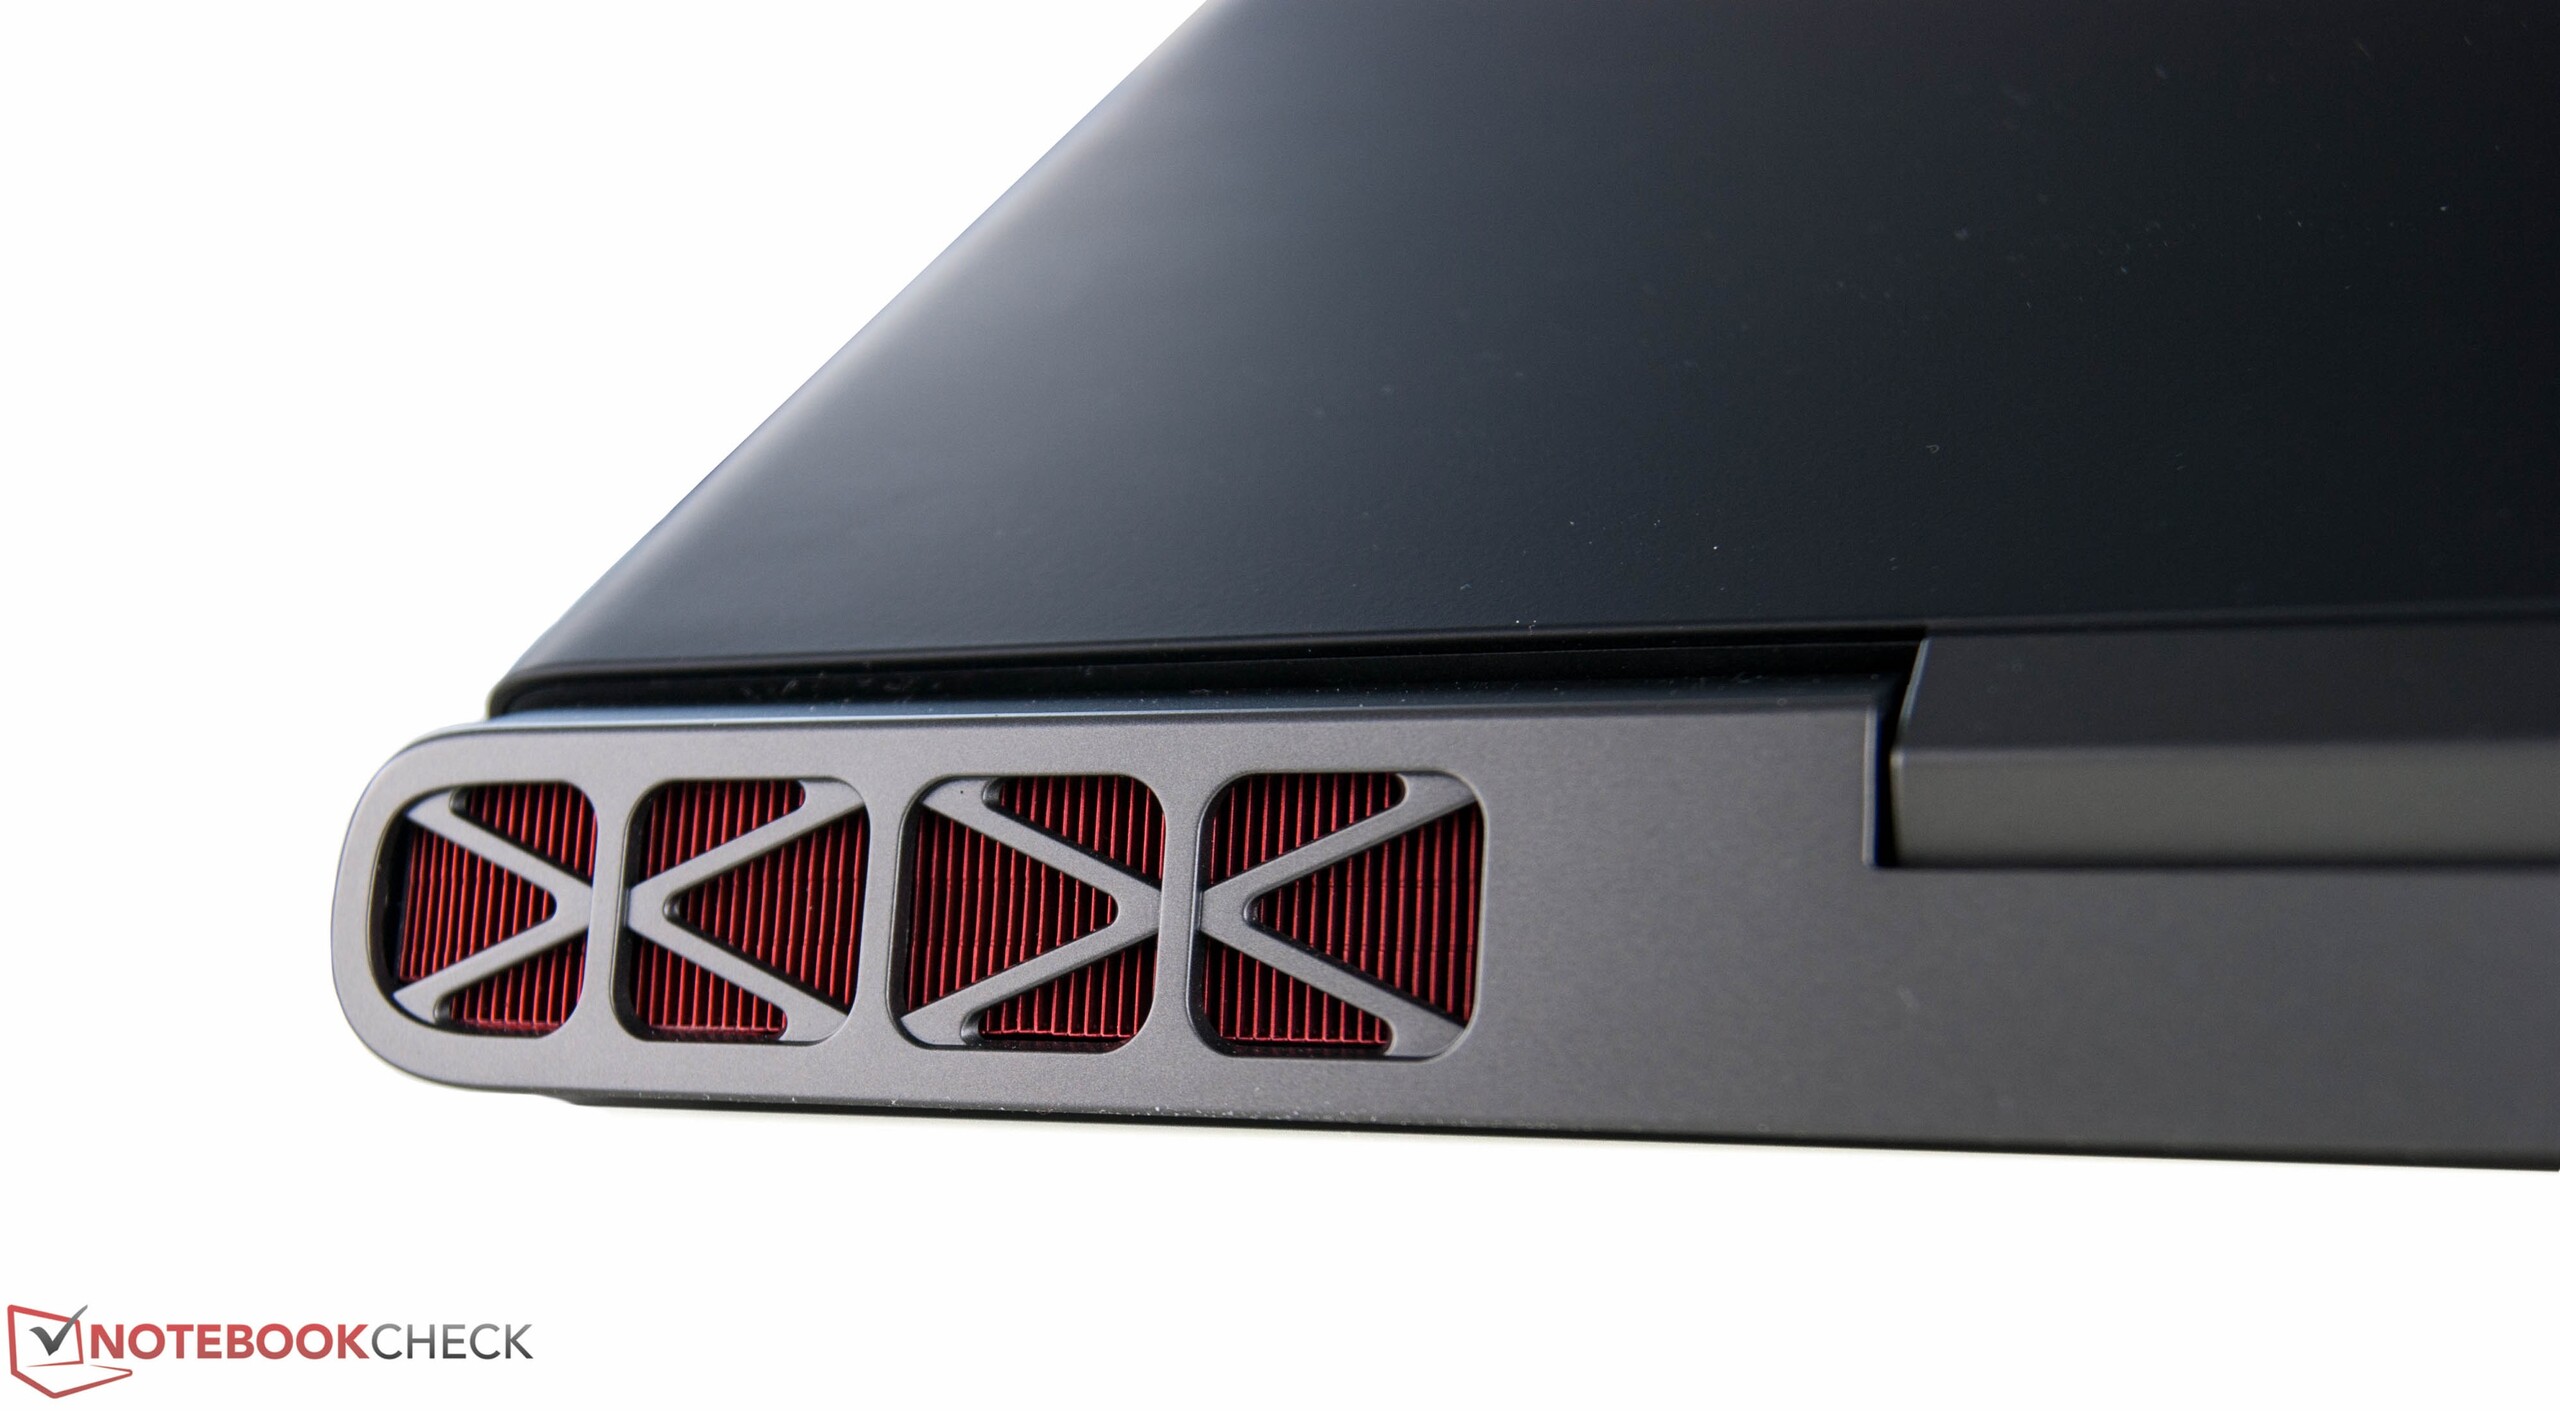
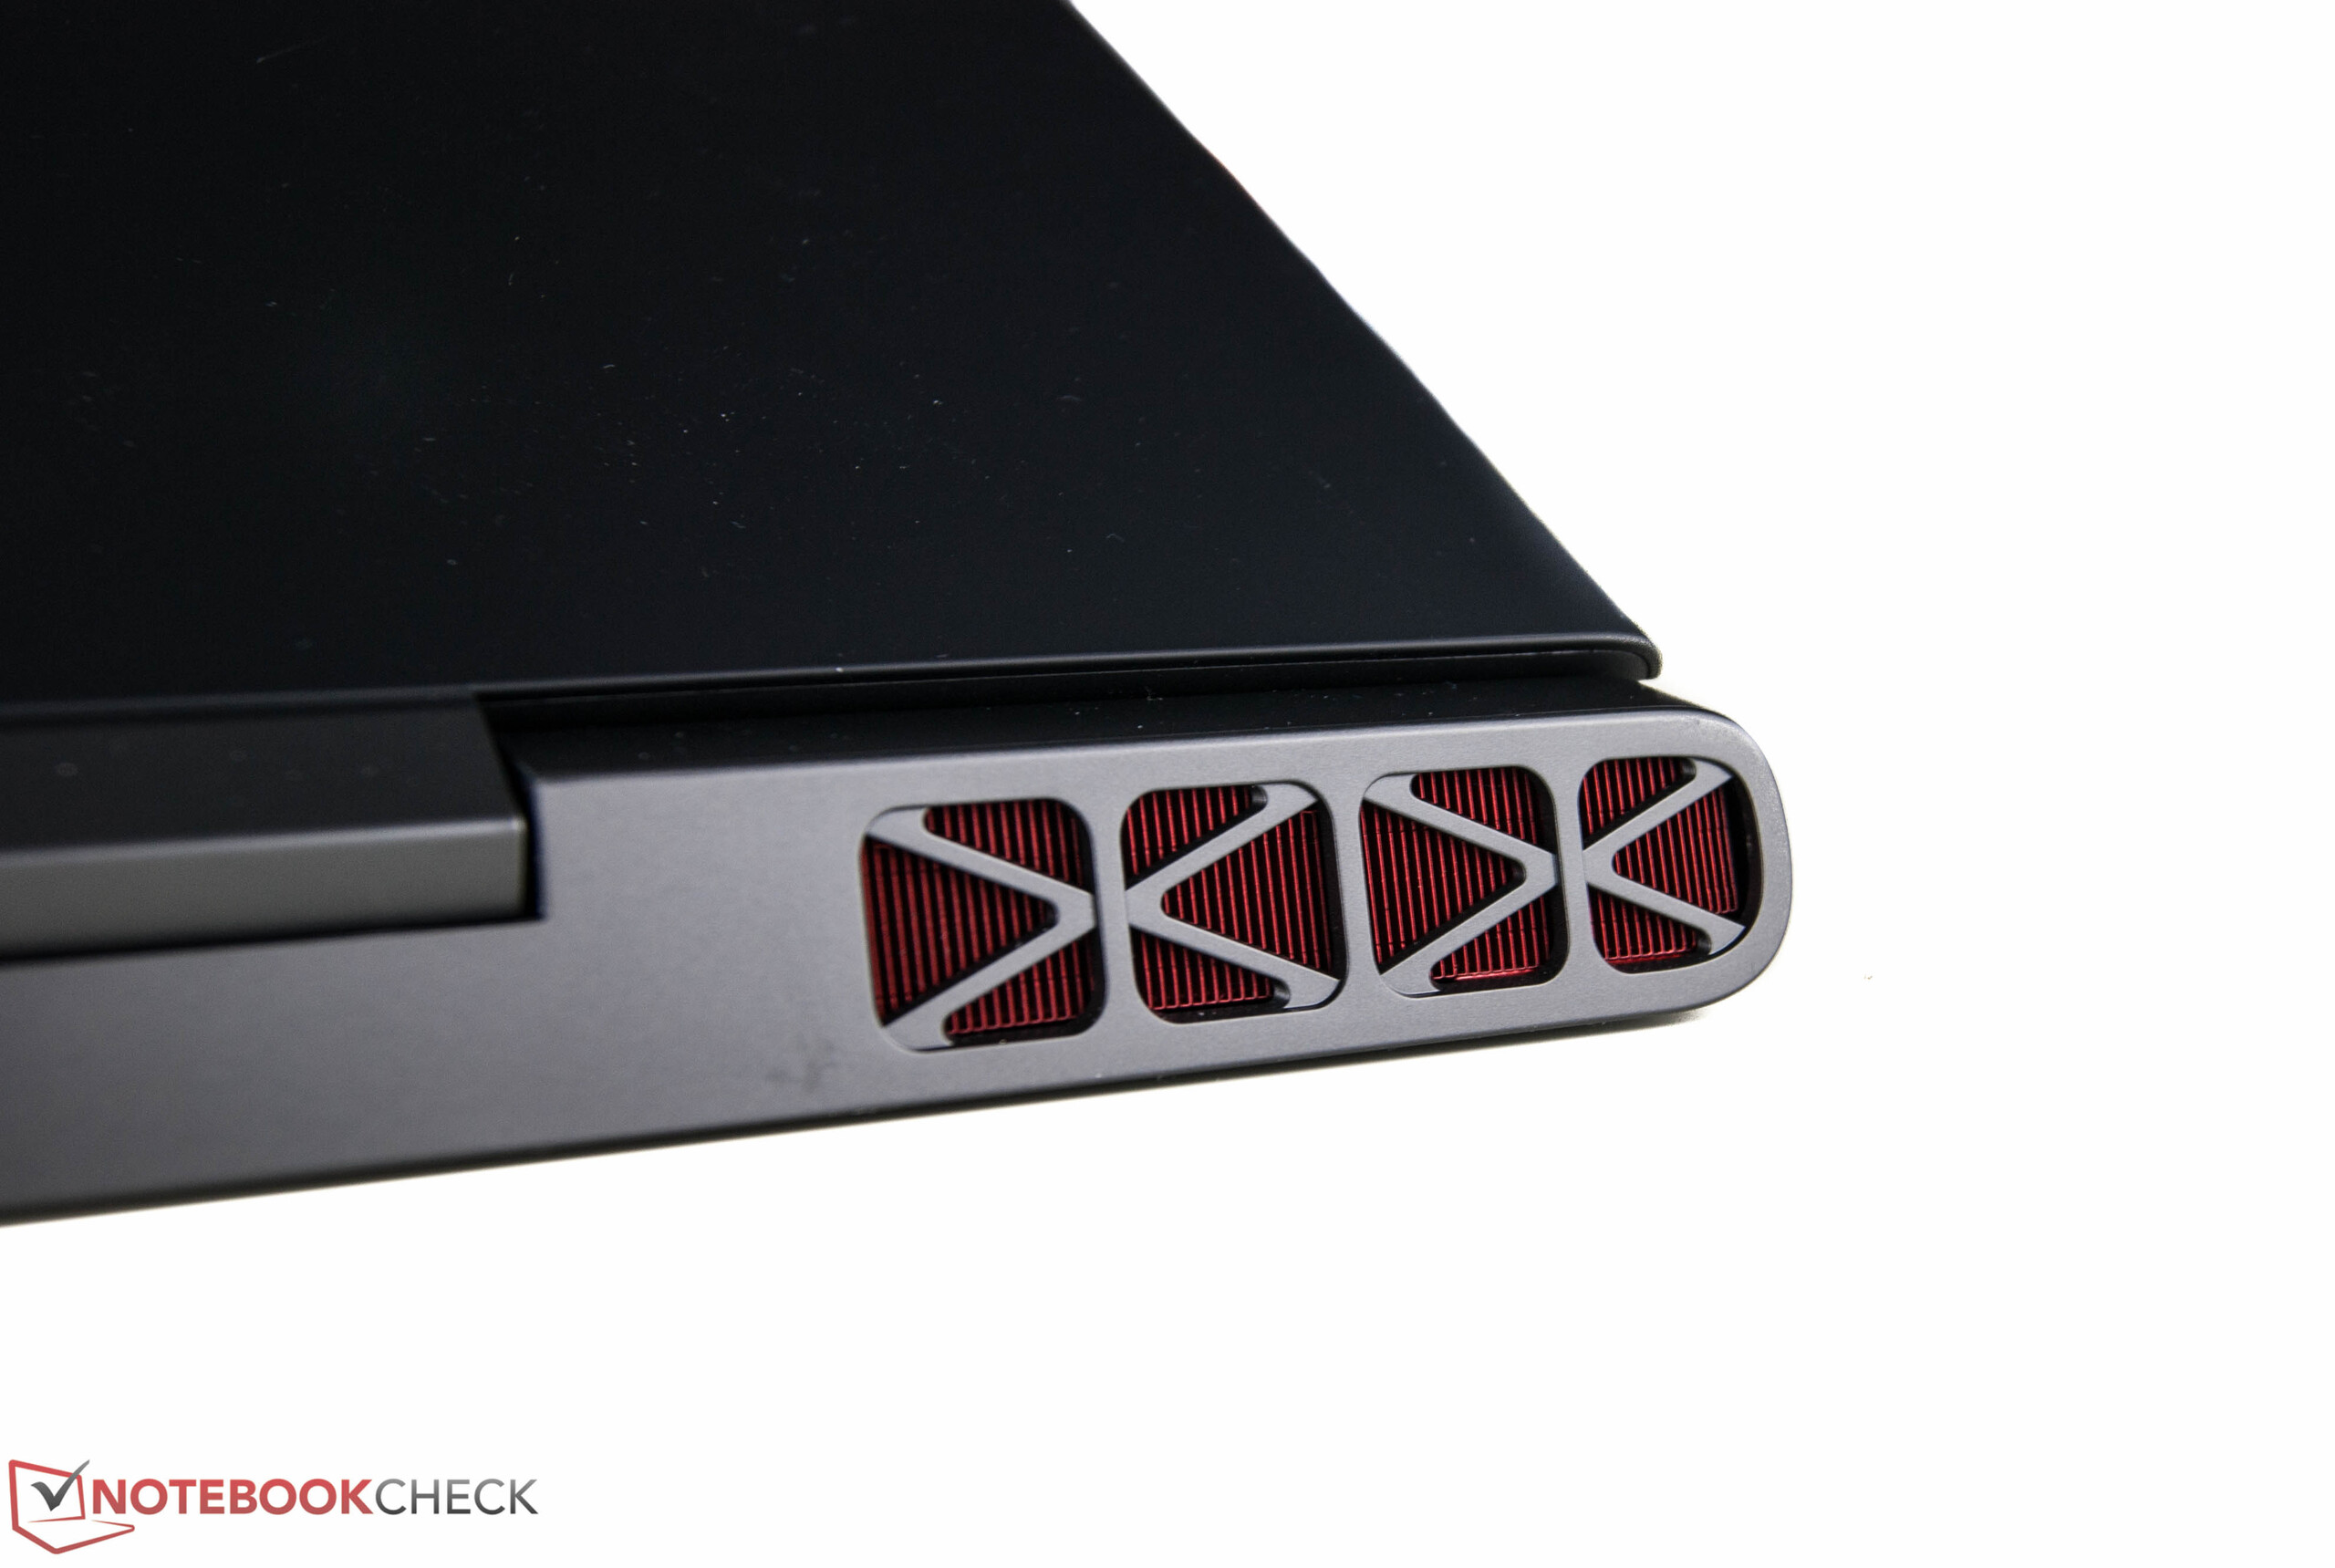
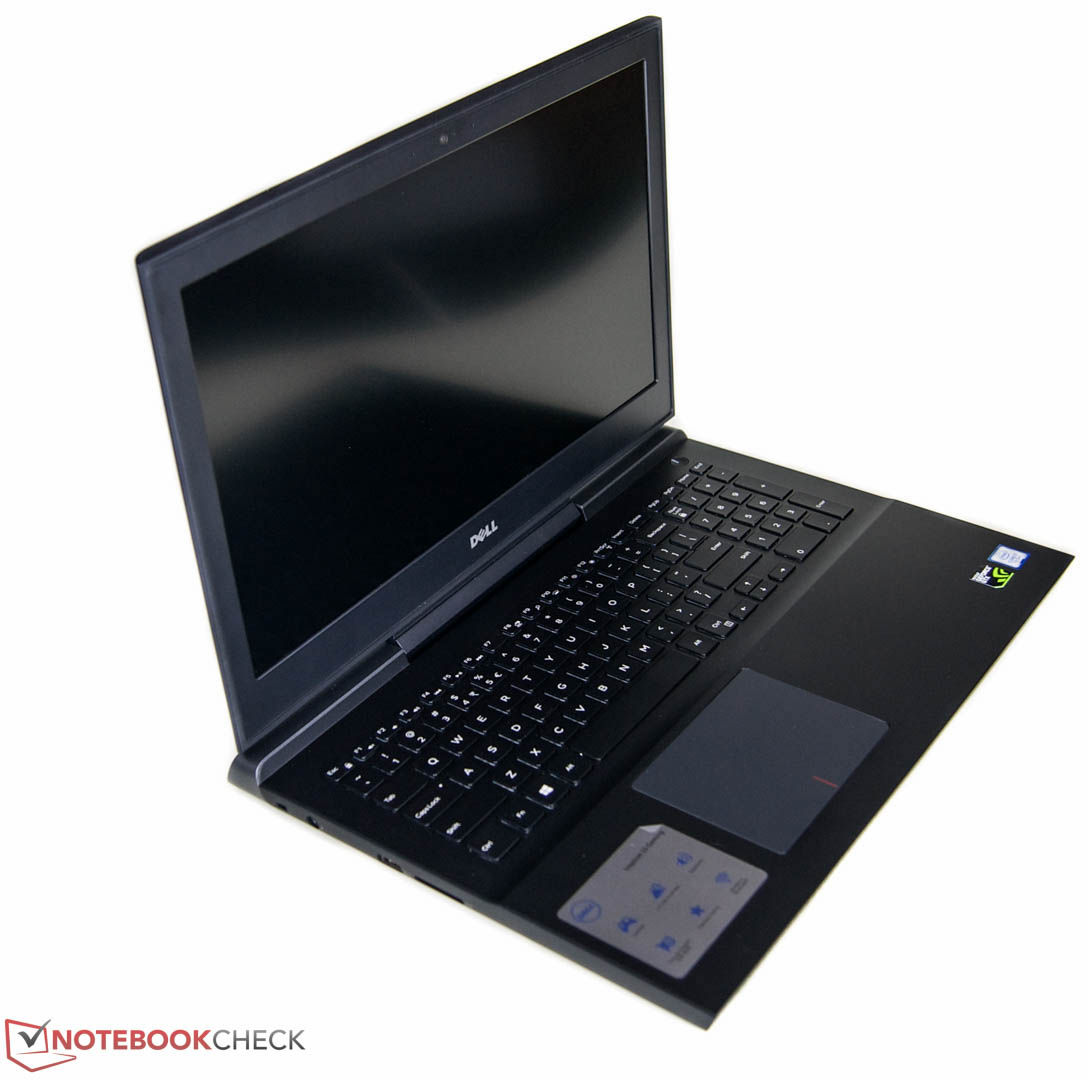
Case
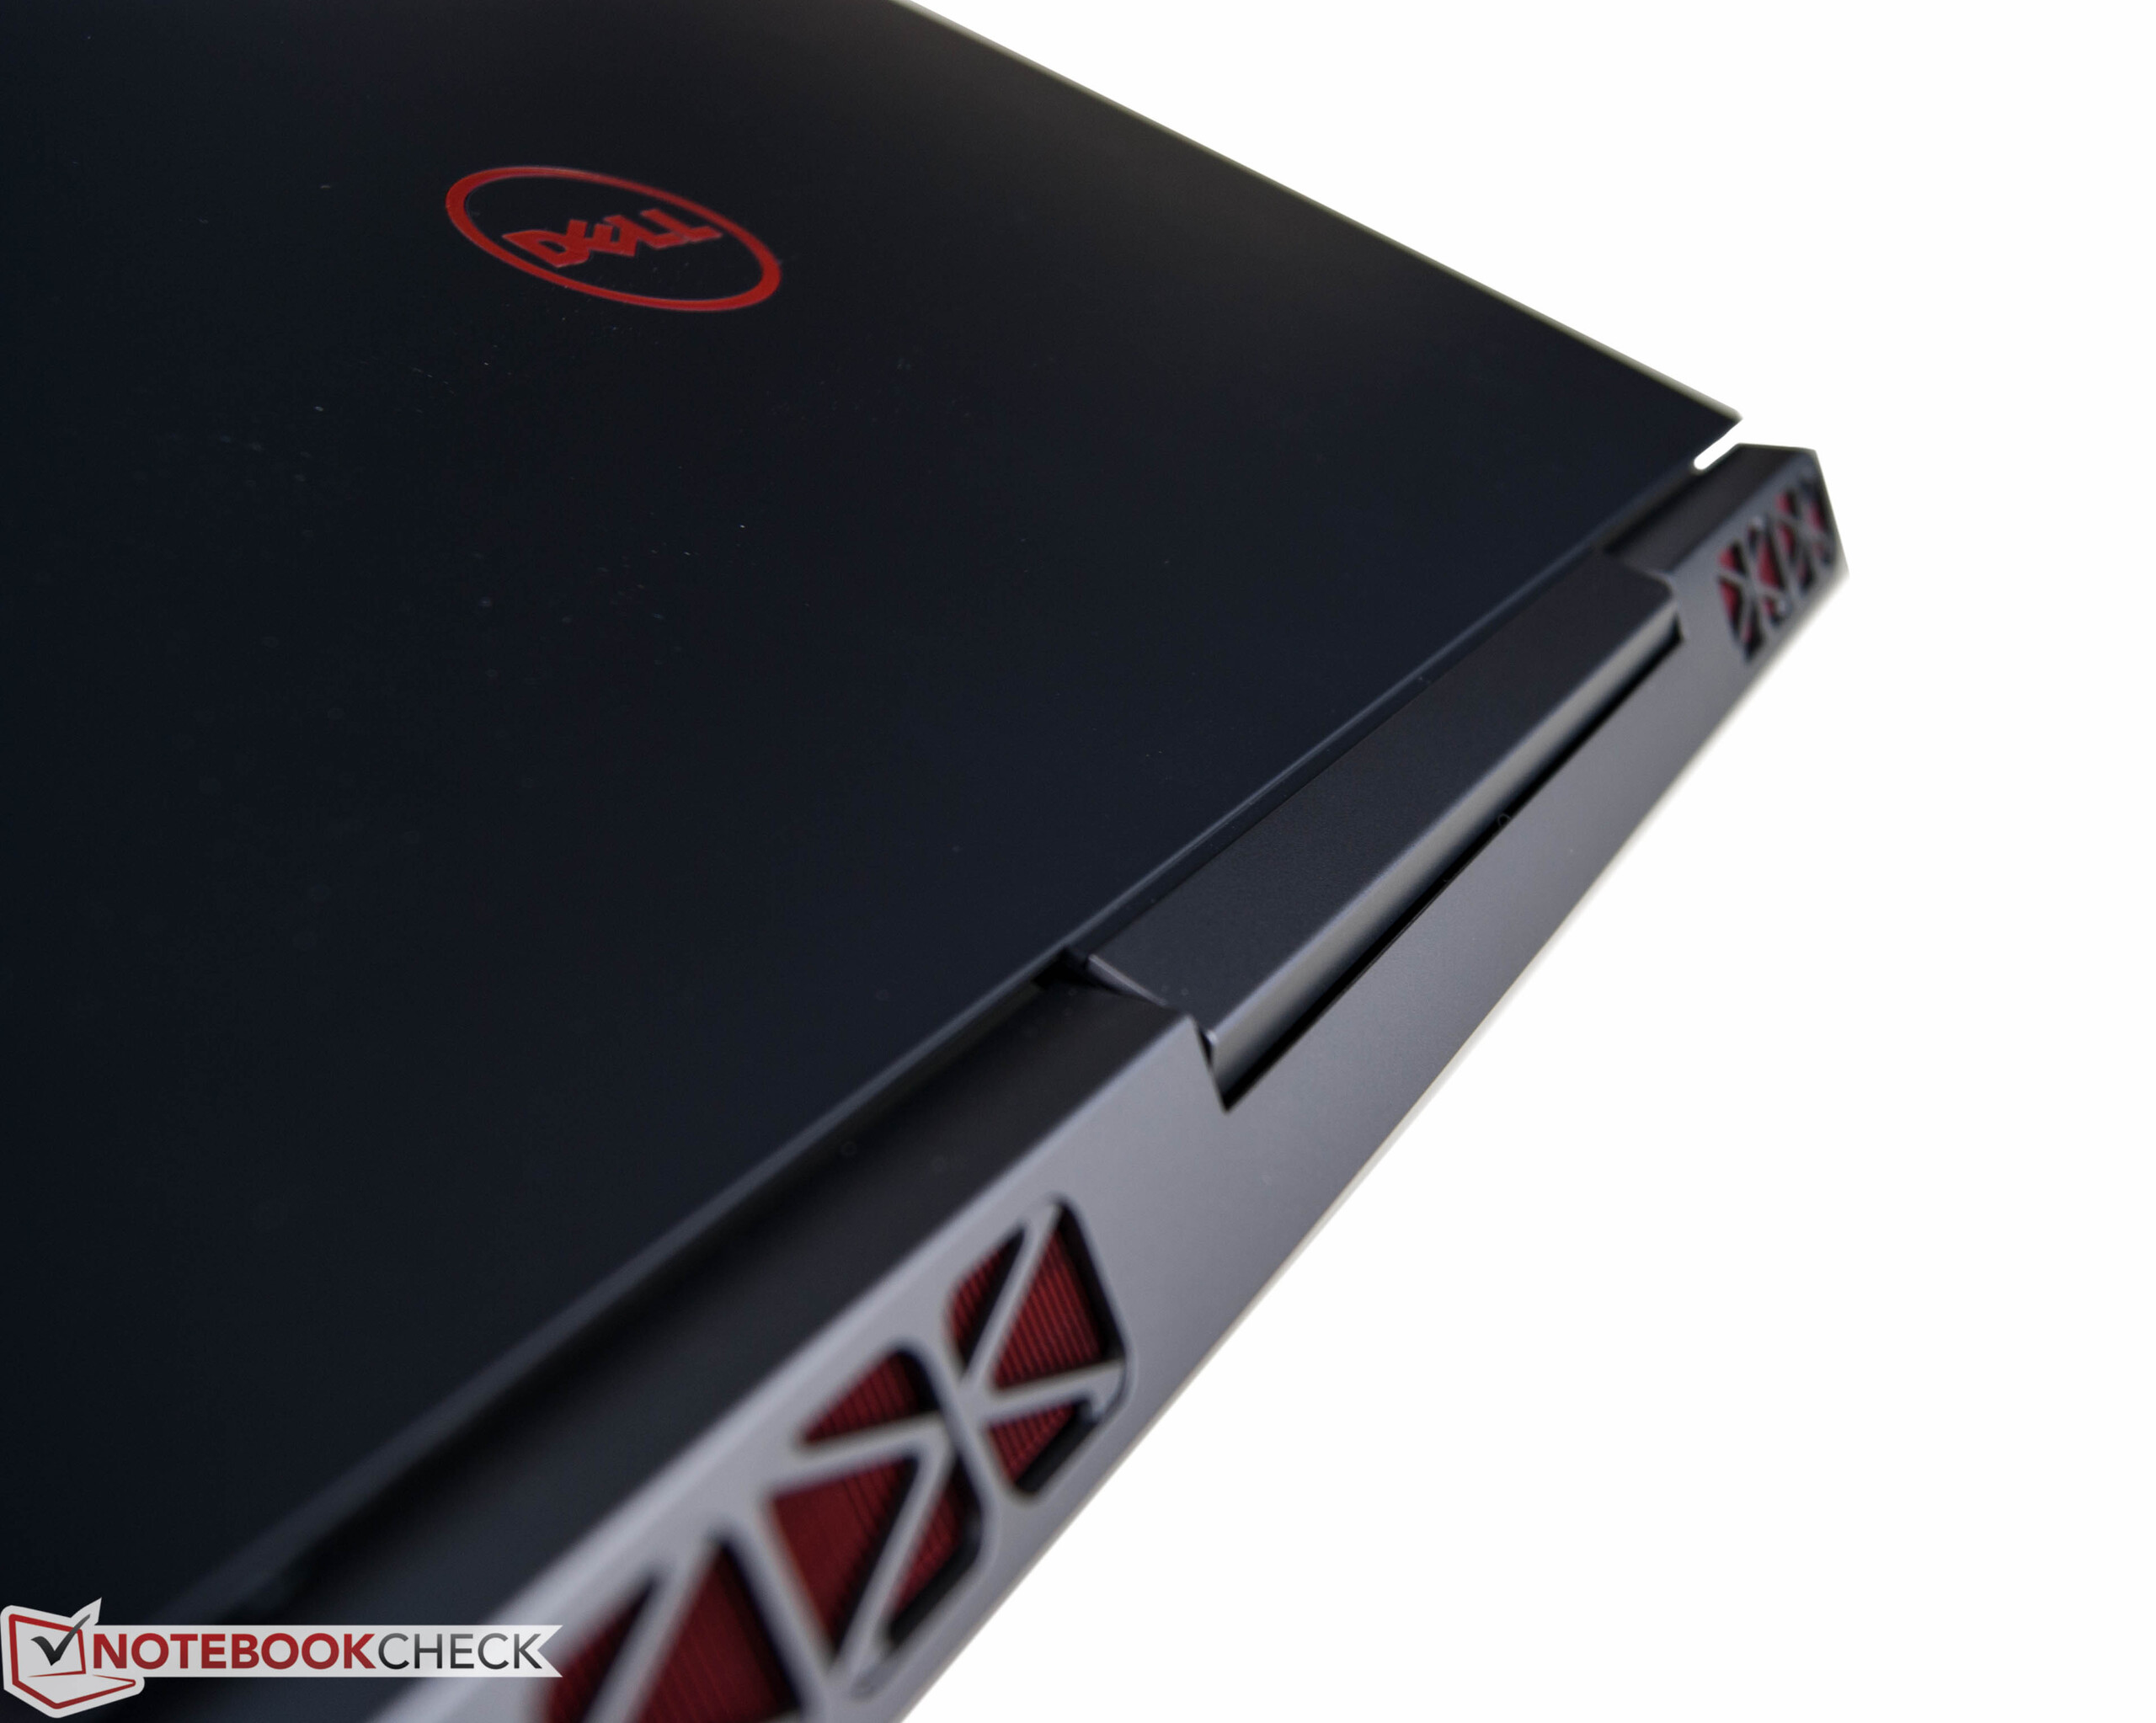
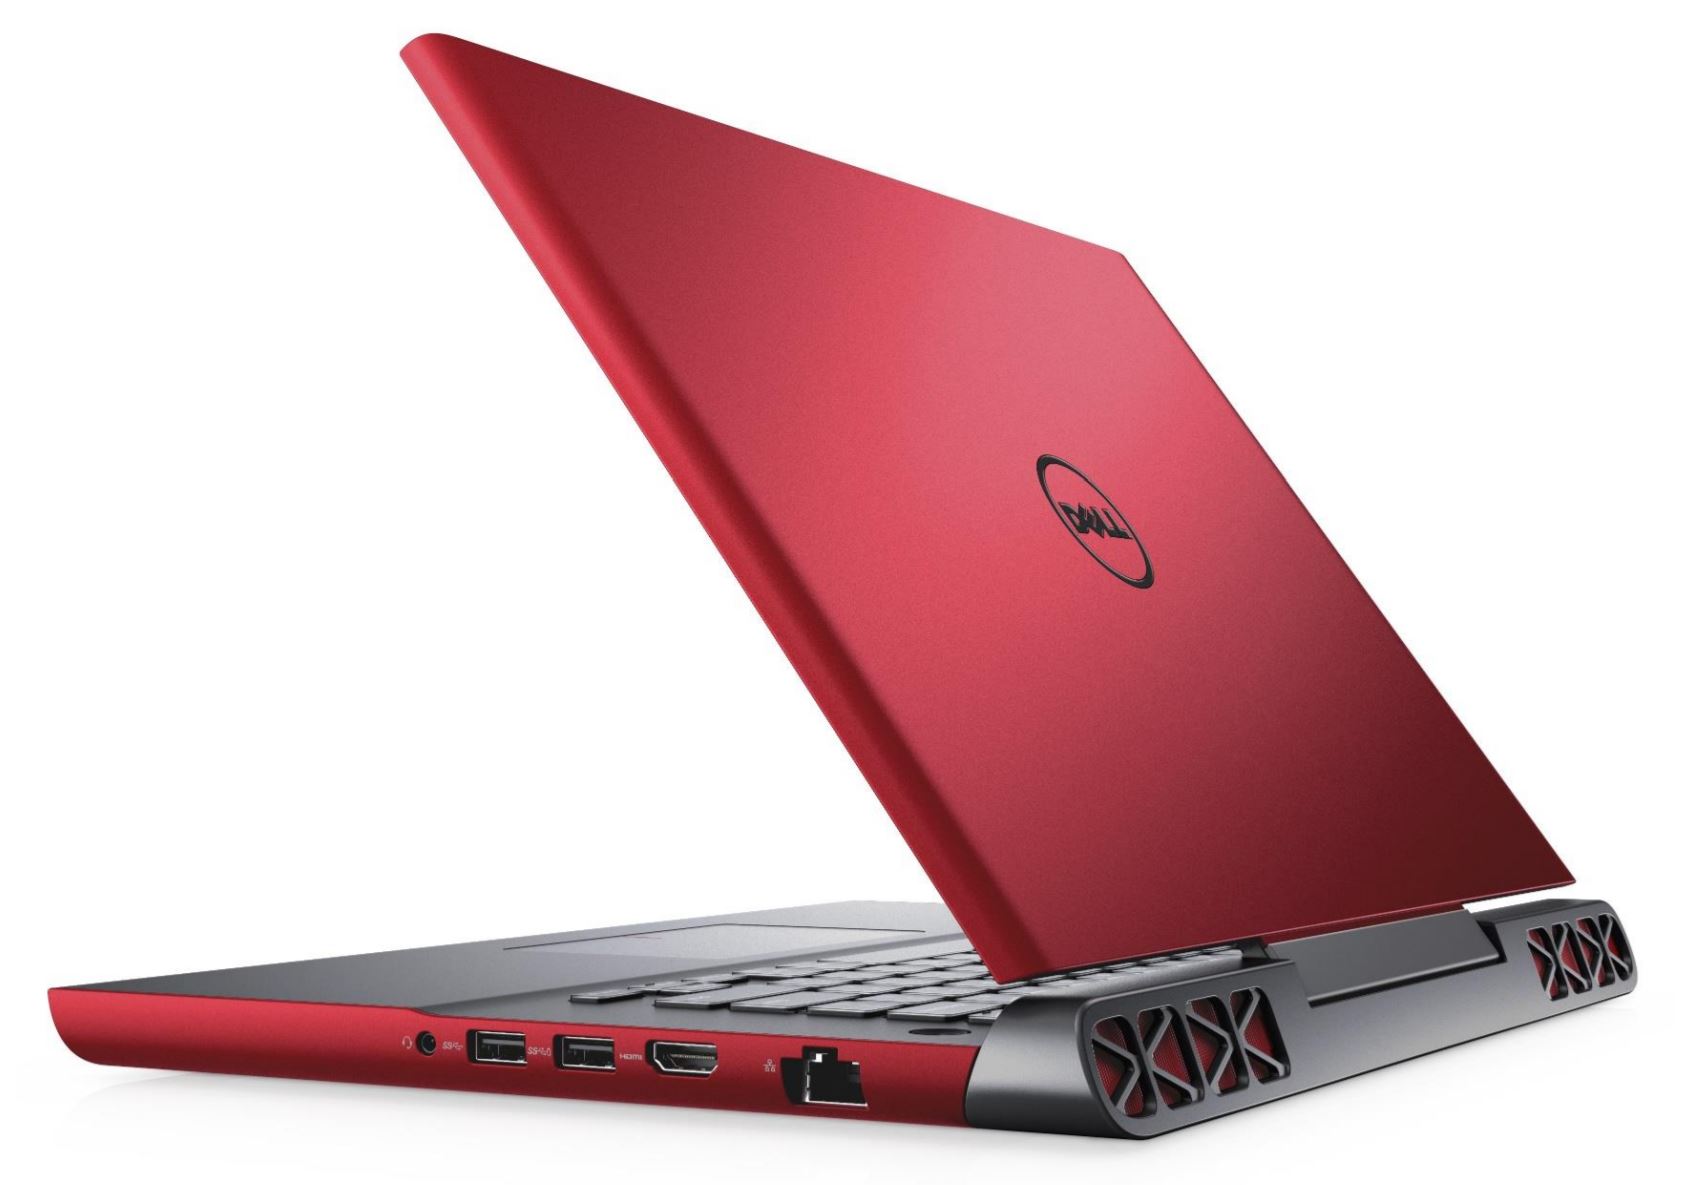
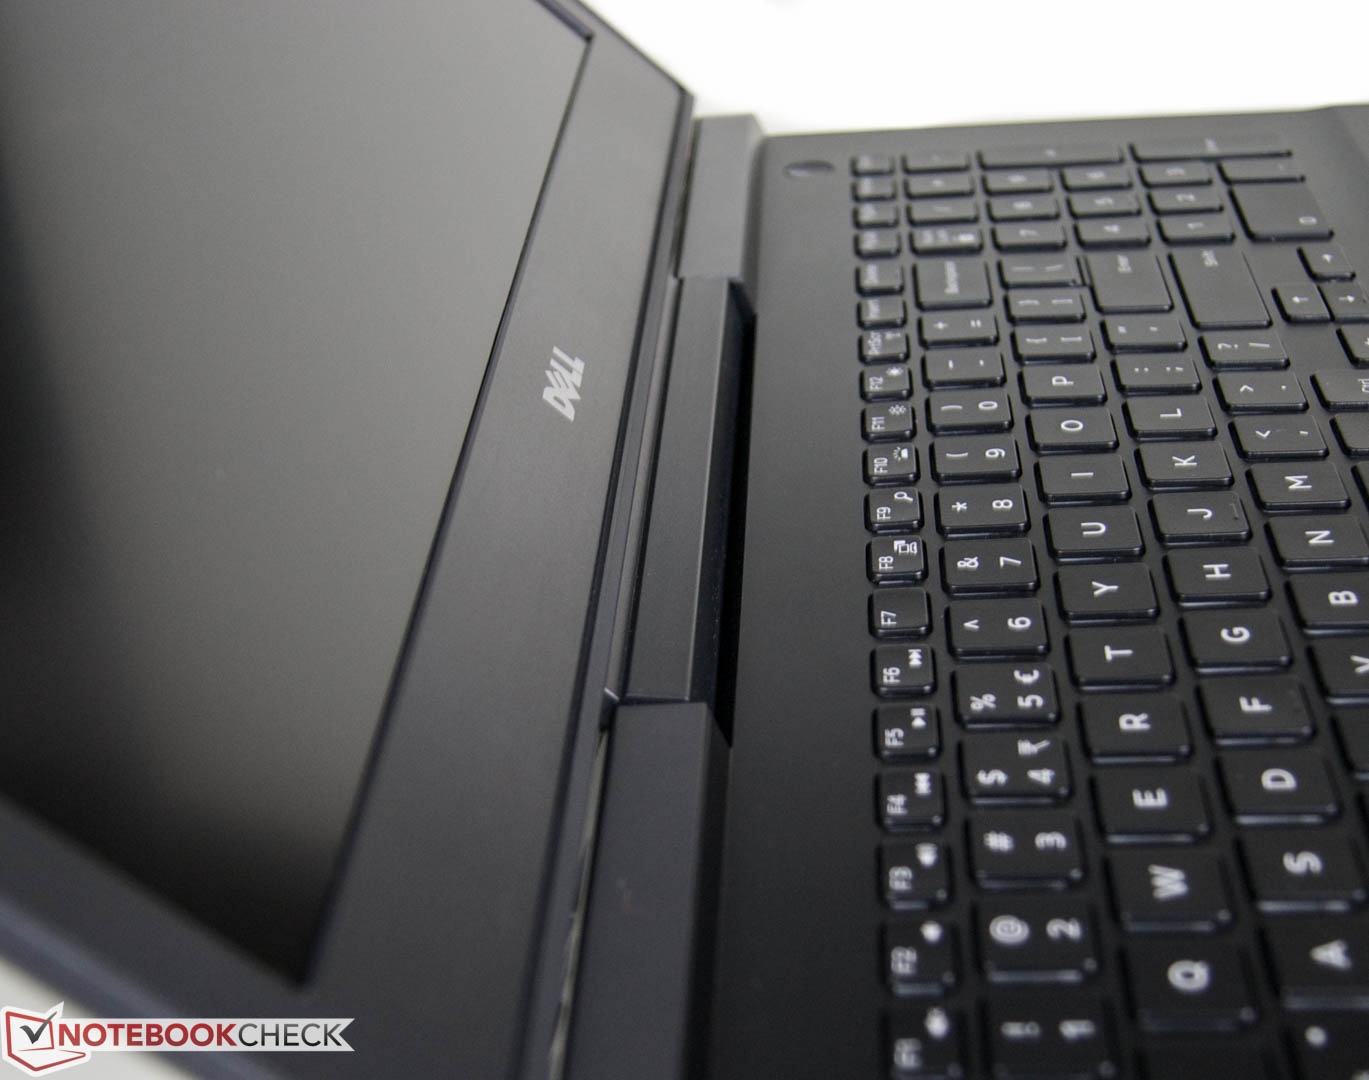
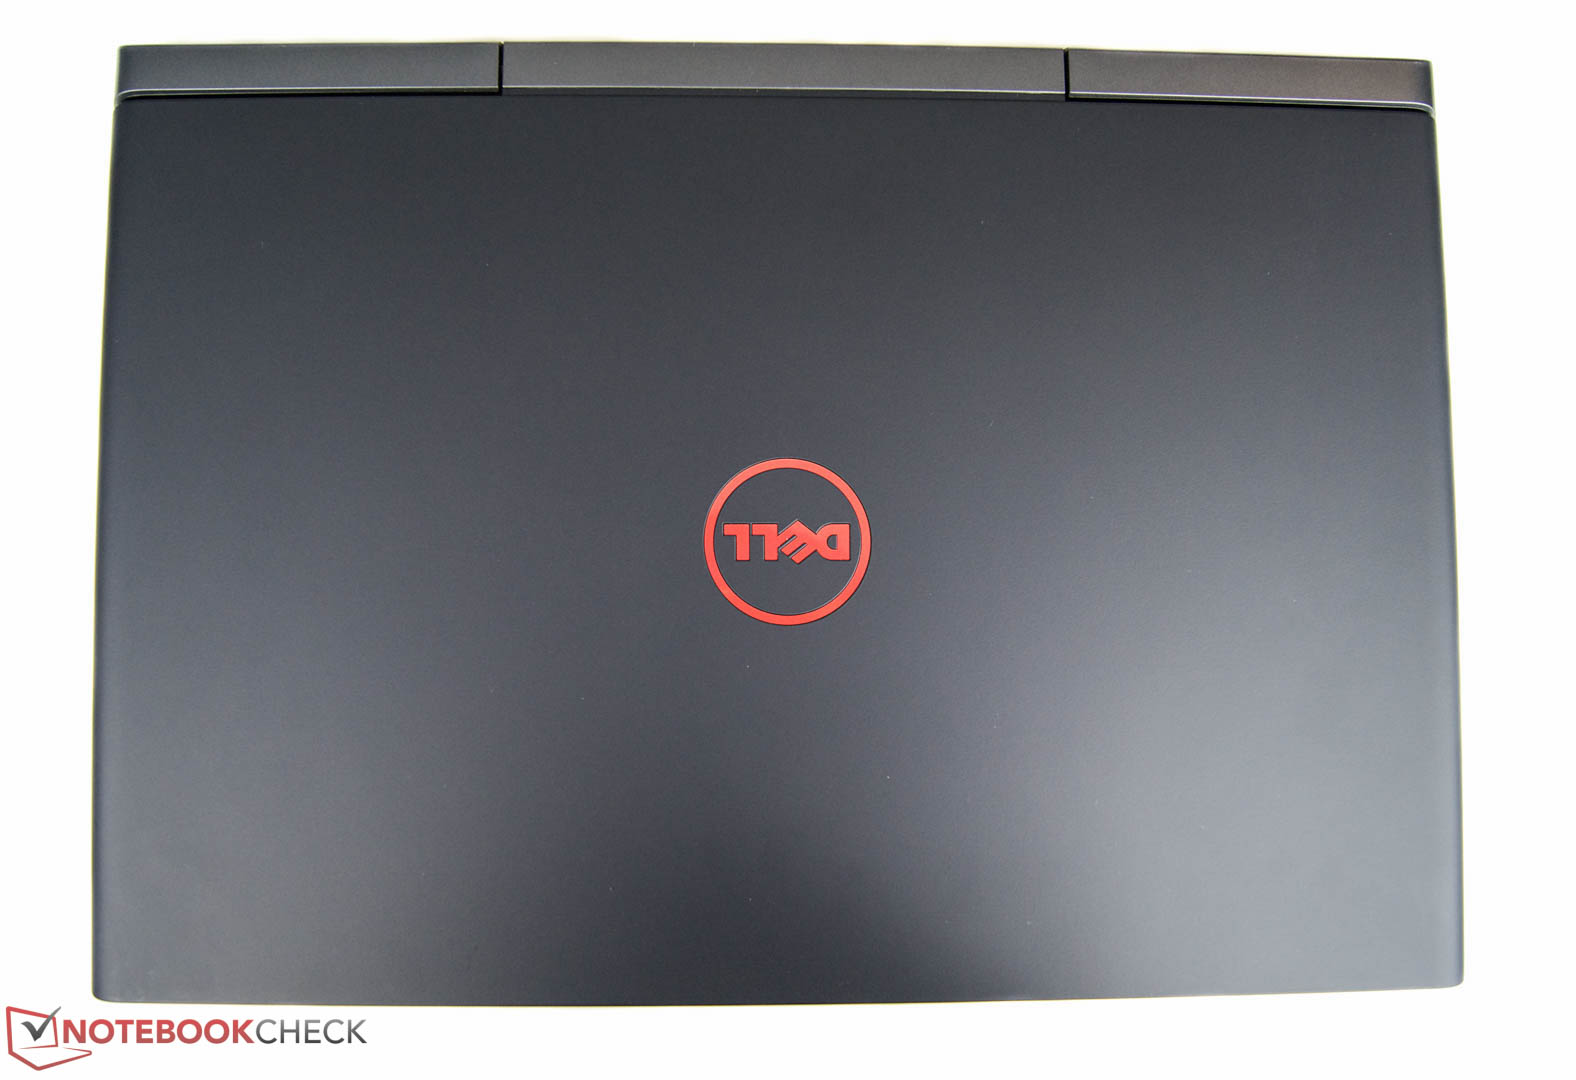
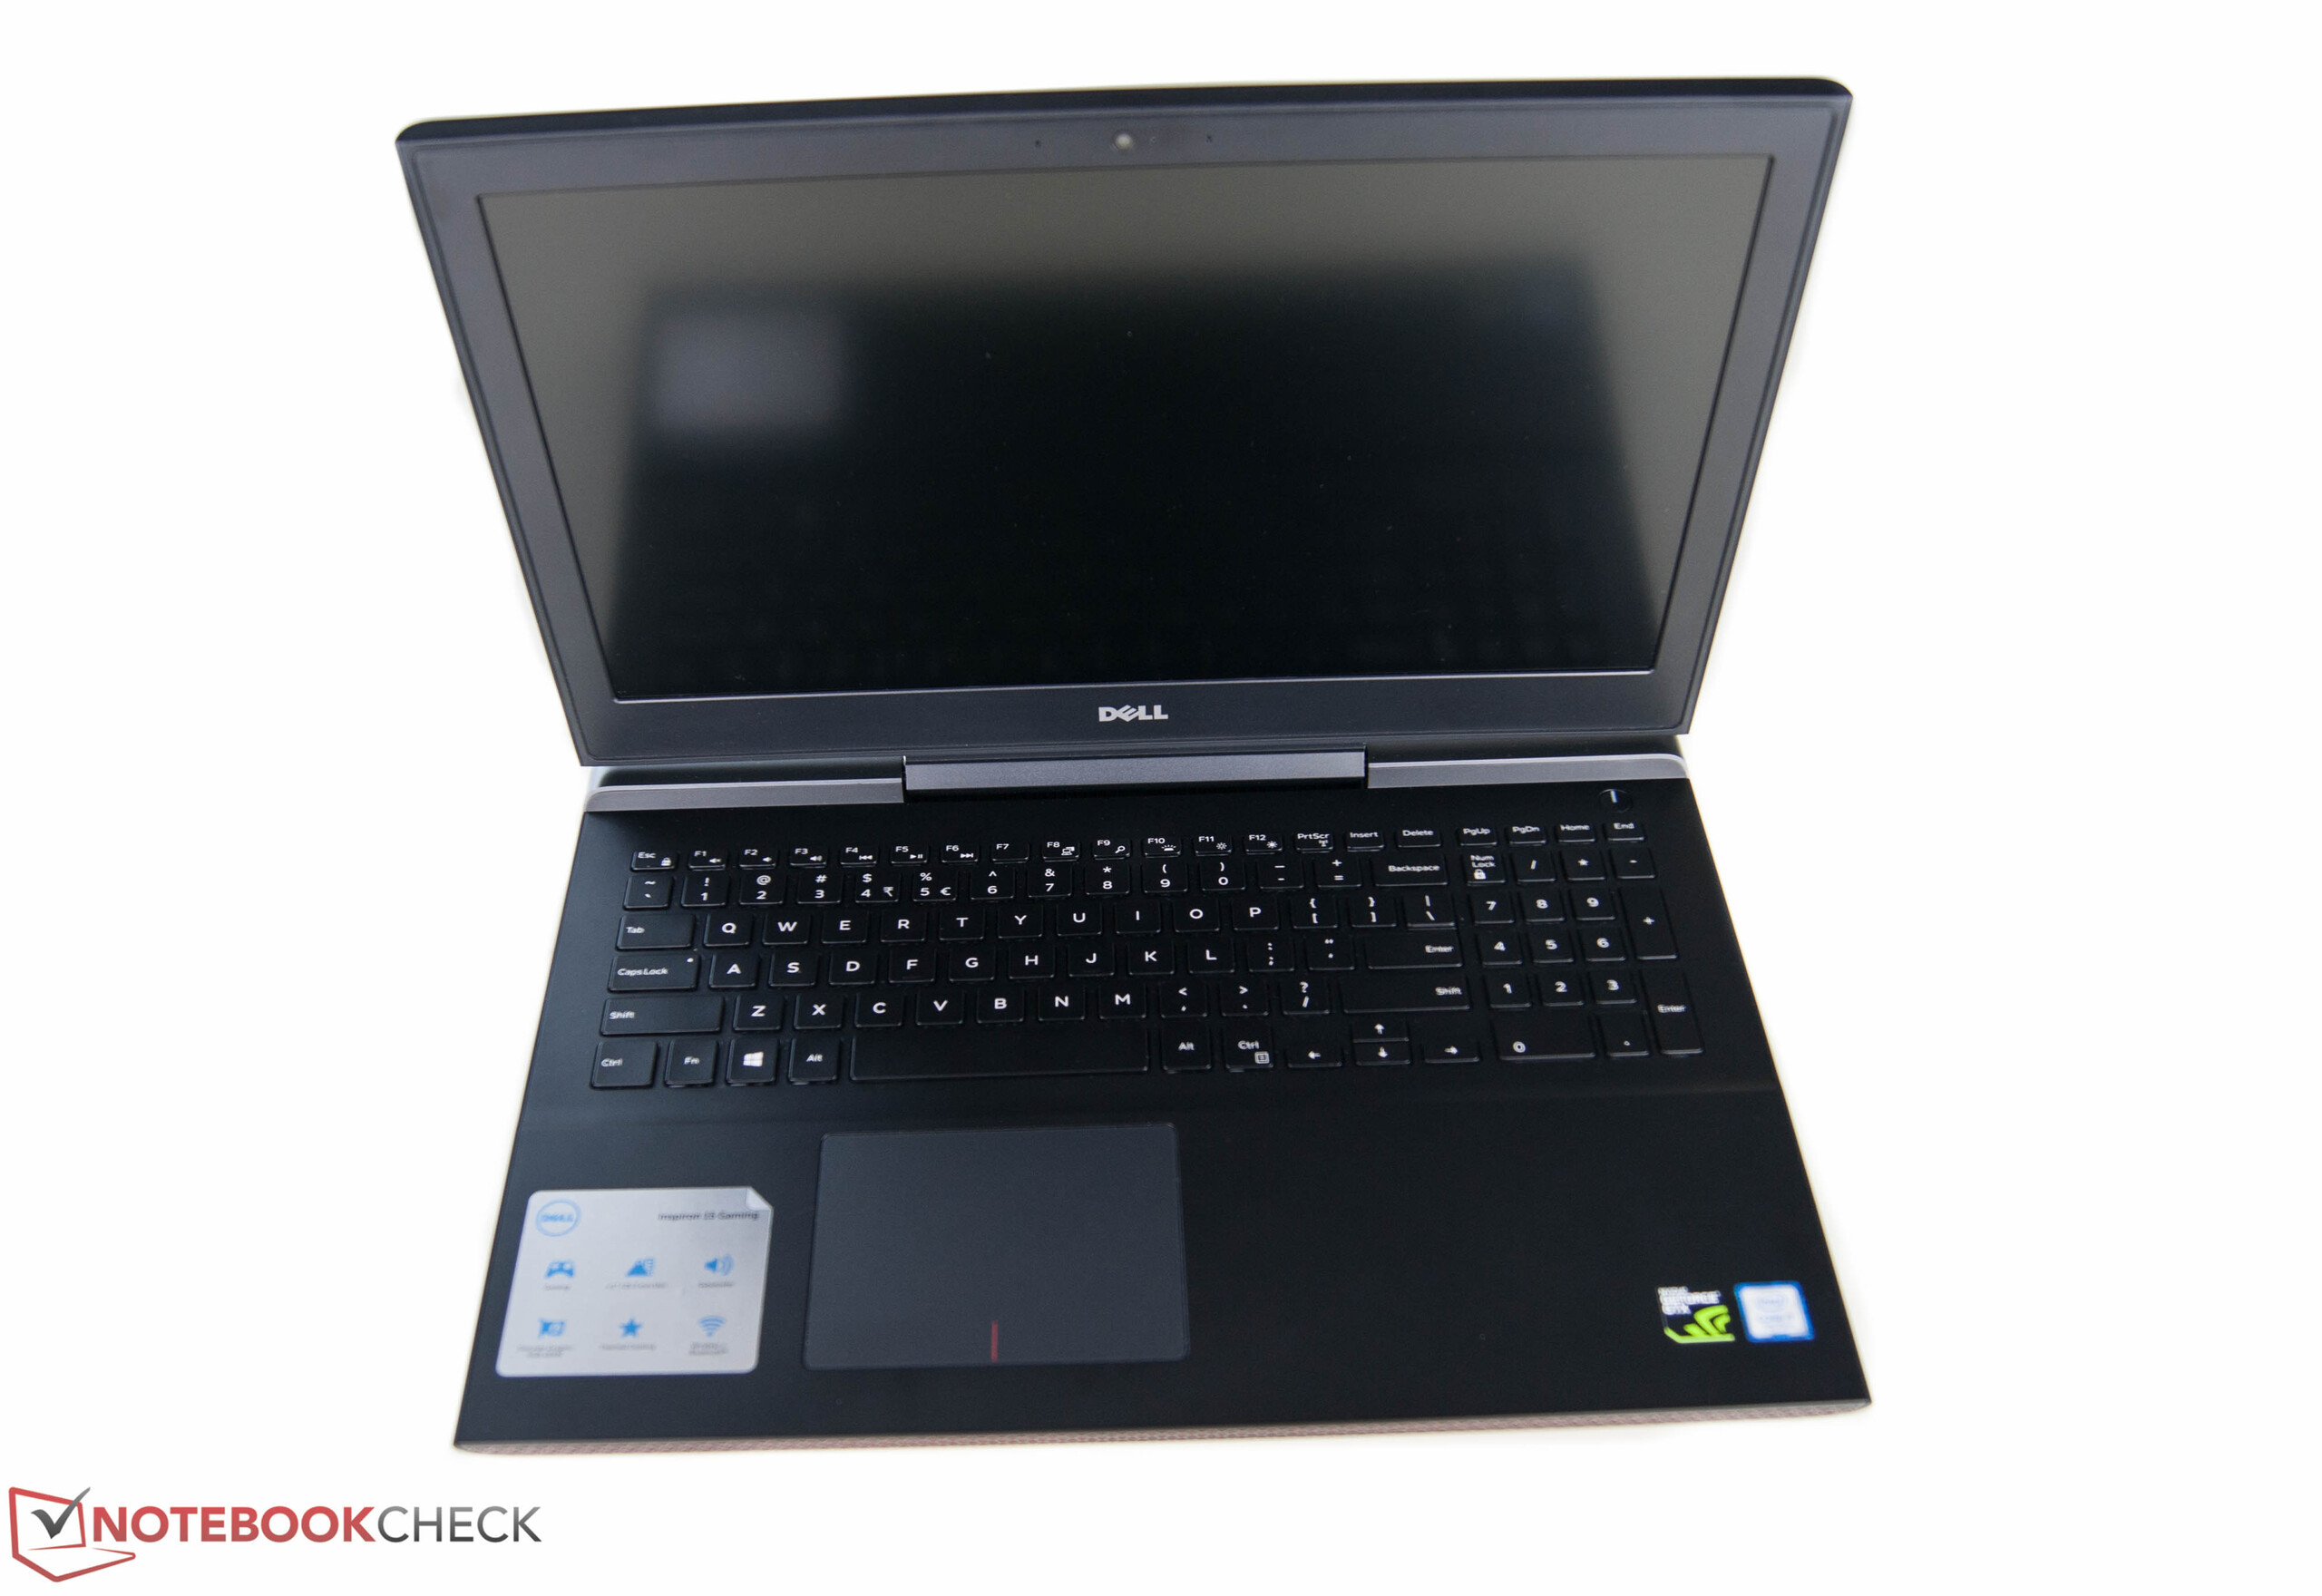
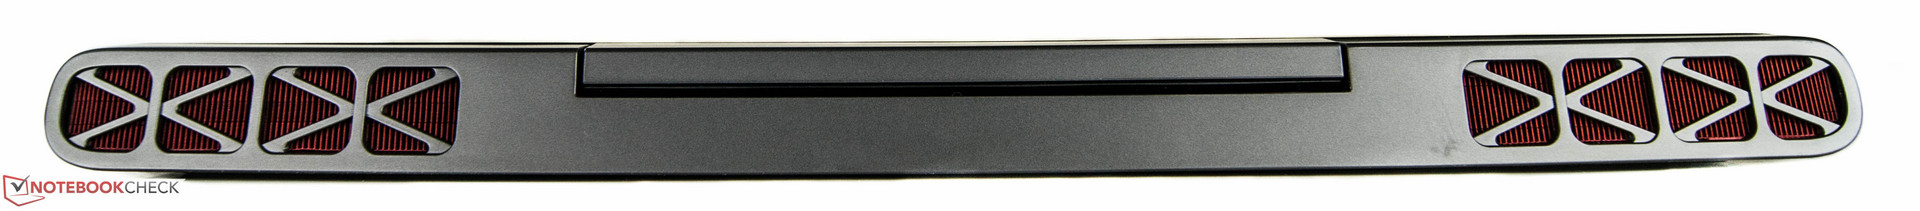
The matte black case of the new gaming notebook looks simple and inconspicuous at a first glance. First, the big red fan grilles with a dark silver grid hint at the power sleeping inside the 15-inch device. Among others the red lattice at the front edge is new. The red decorated Dell logo on the lid has been kept. When the notebook is opened, it becomes apparent that Dell has omitted the red border surrounding the touchpad and the red grid bar above the keyboard. Those who like Dell's design, but do not want to spend that much money and therefore buy the Inspiron predecessor do not have to bother: Dell uses the same case for it.
Thanks to many rounded parts and several rubberized surface textures, the laptop feels nice to the touch. In terms of build quality we could also only detect trifles: For example, the front parts of the base unit's left and right edges are slightly too sharp. As is known from most matte products, the surface is a fingerprint magnet. In addition, the lid can be depressed slightly too easily.
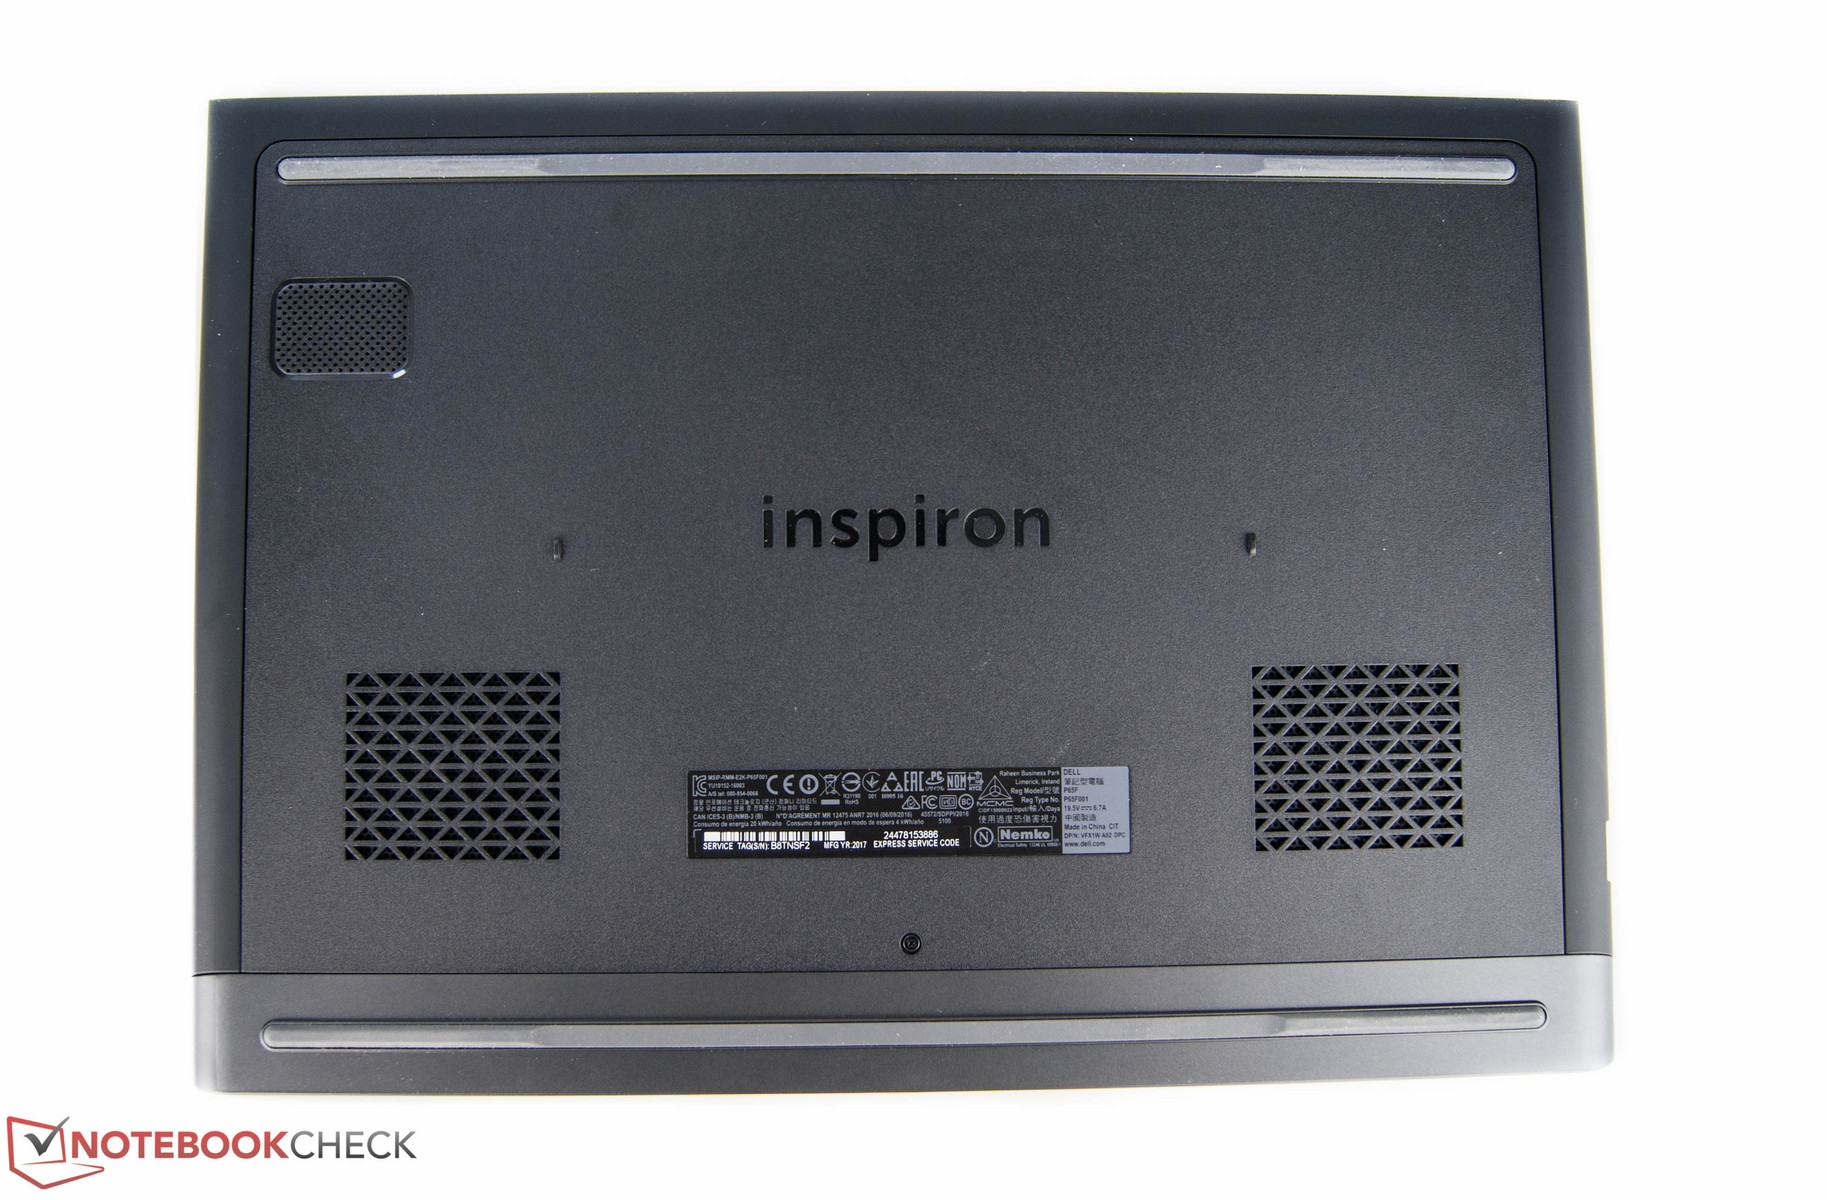
There is a maintenance hatch on the underside of the new Inspiron, which can be removed after loosening a single screw. It is not possible to replace the battery or get a glimpse of the inside without tools.

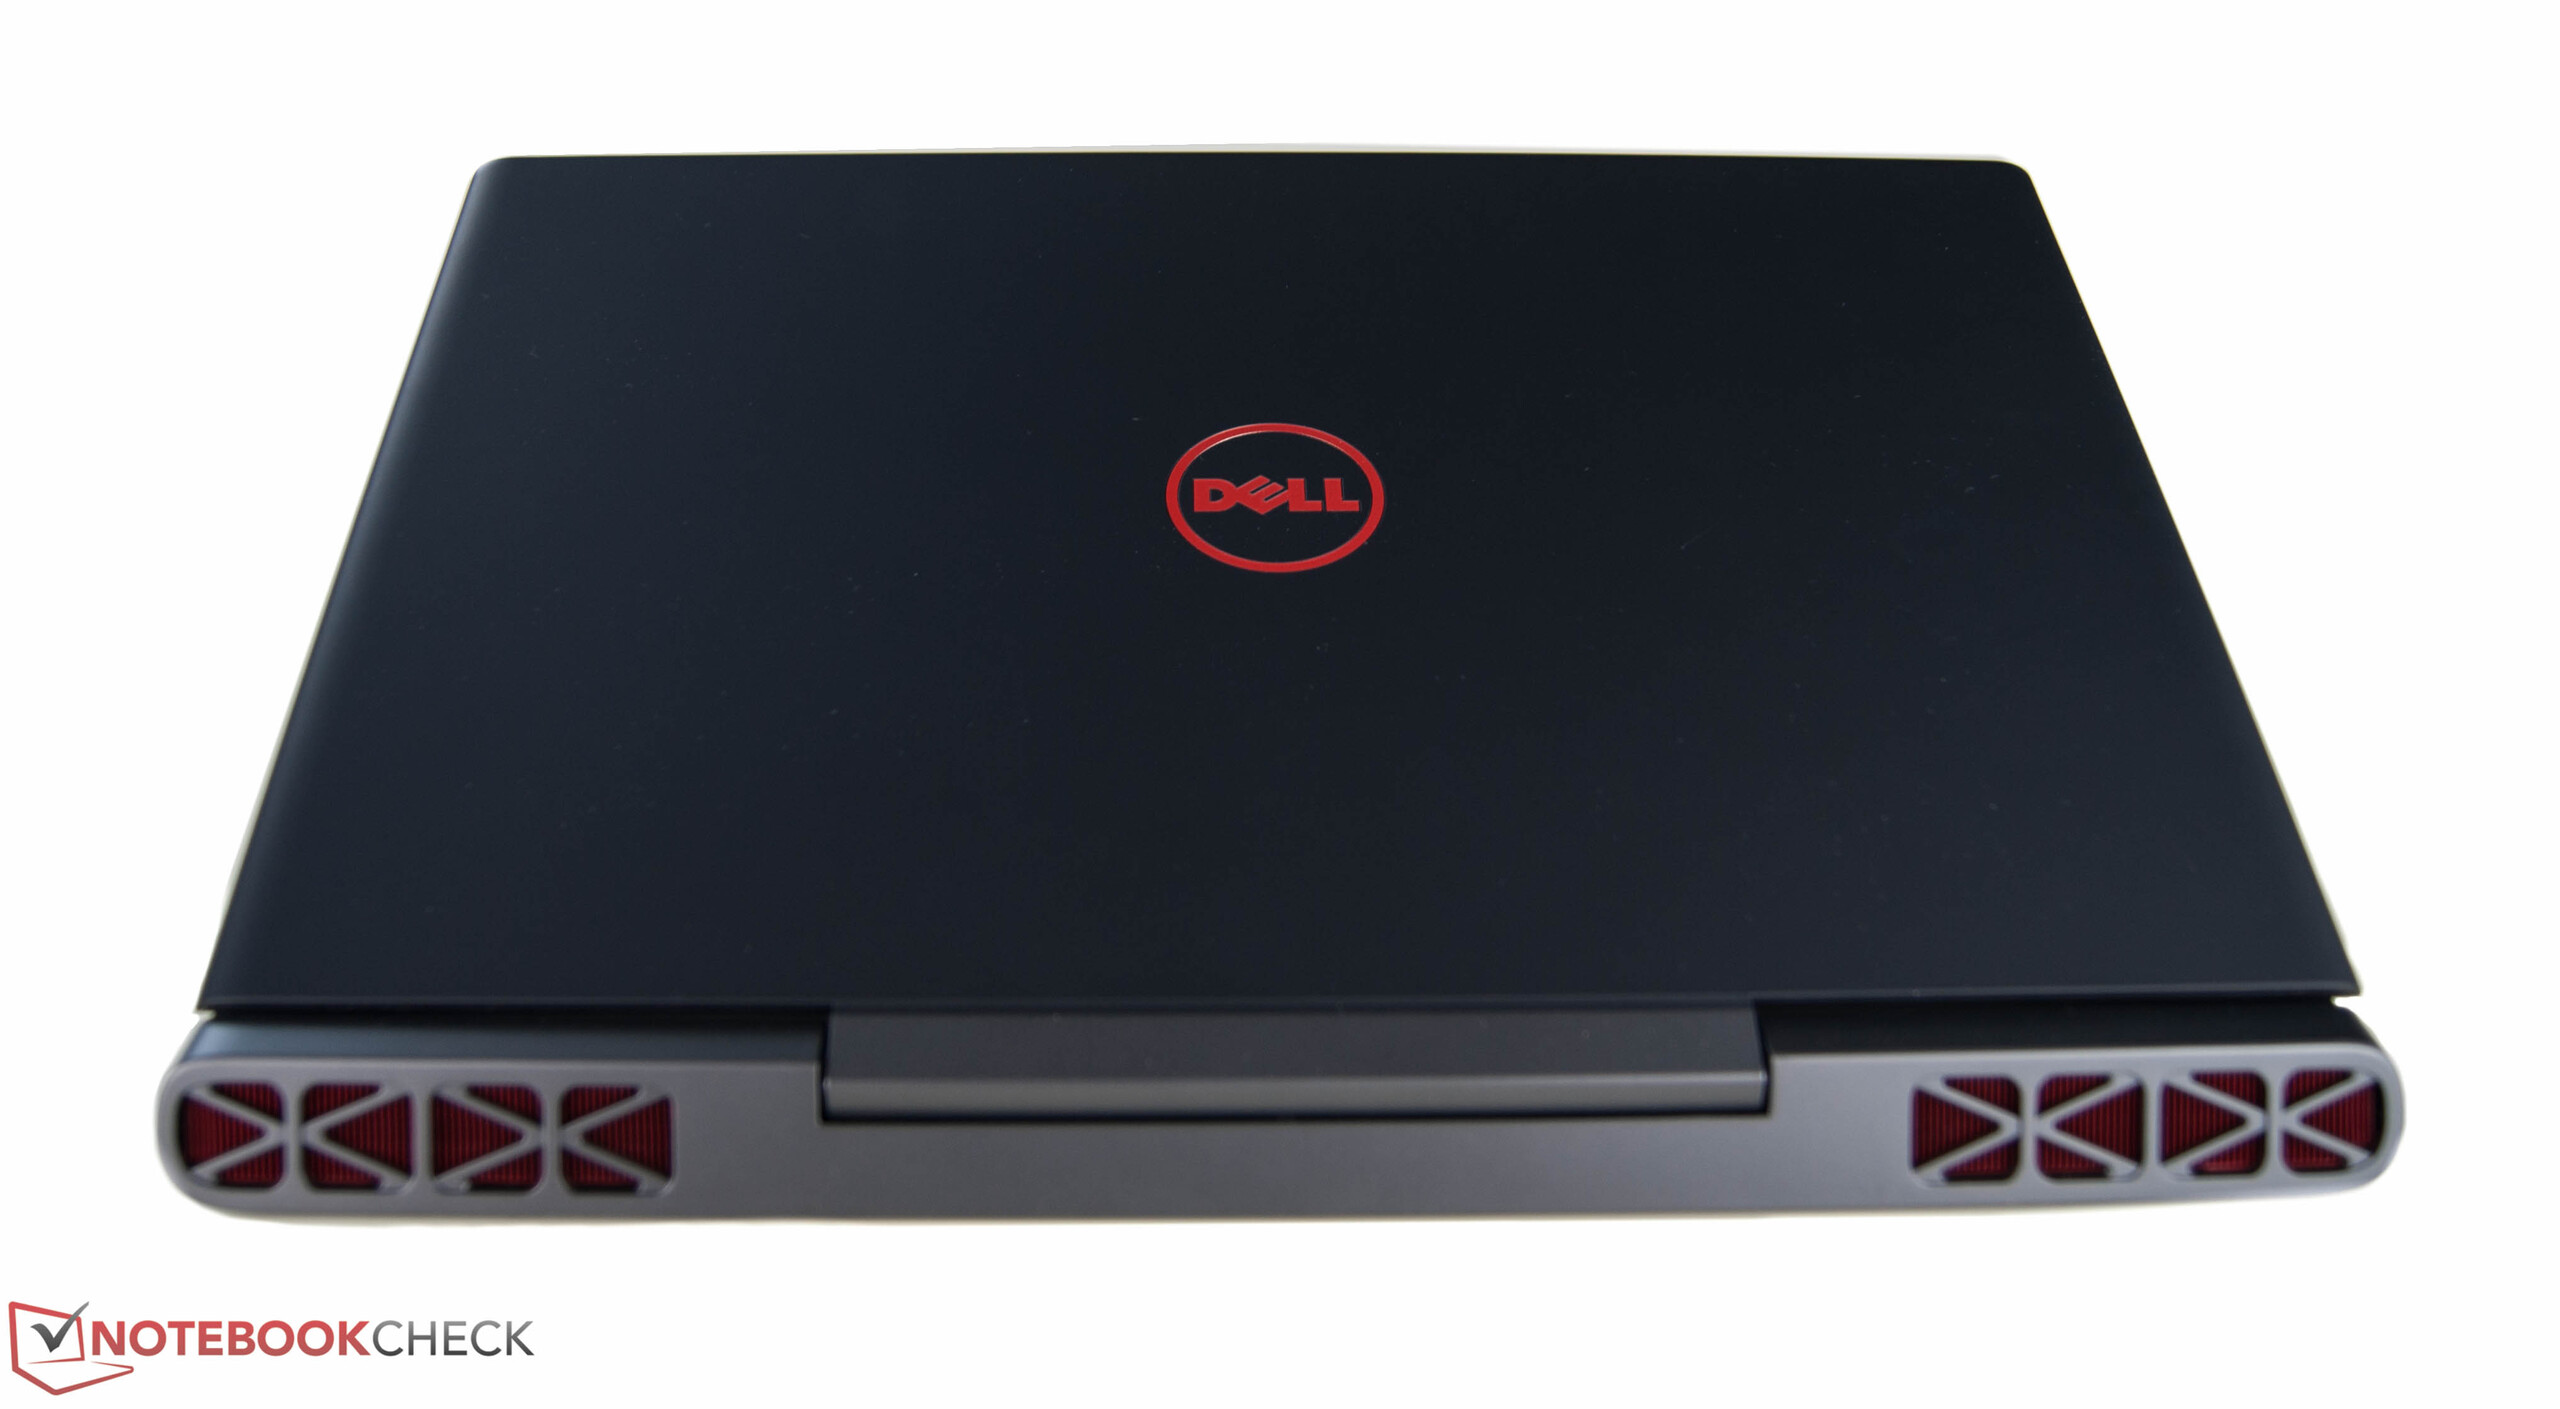
The weight of 2.6 kg measured by us is on par with the competitors'. The remarkable height of up to 26 mm is also normal for a gaming notebook. You should clarify whether a bag has enough stowage space before buying it.
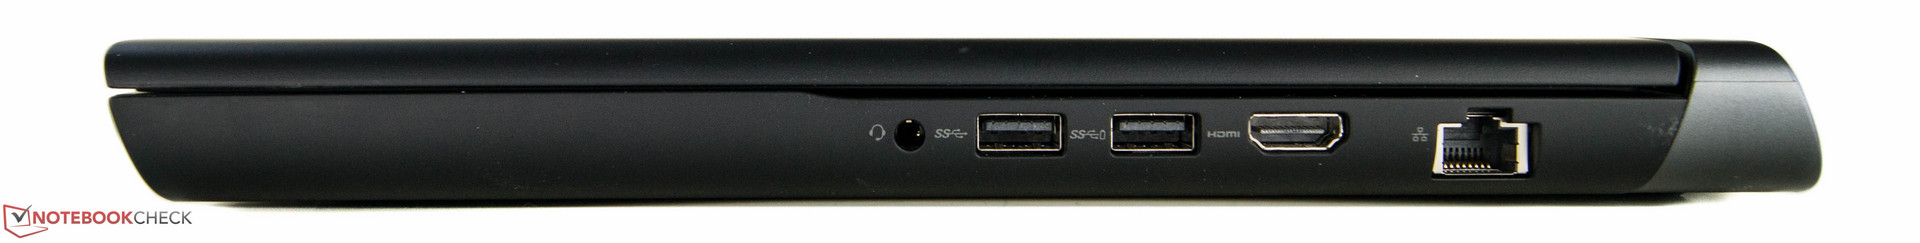
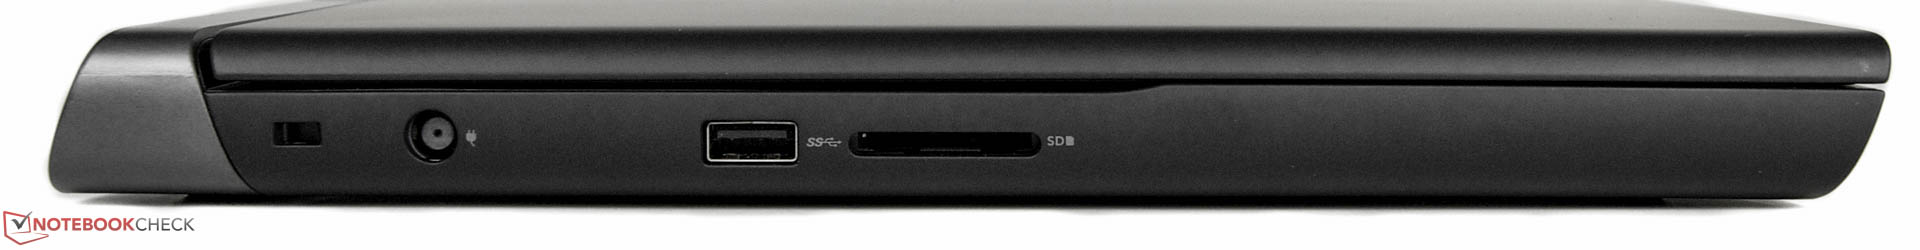
Connectivity
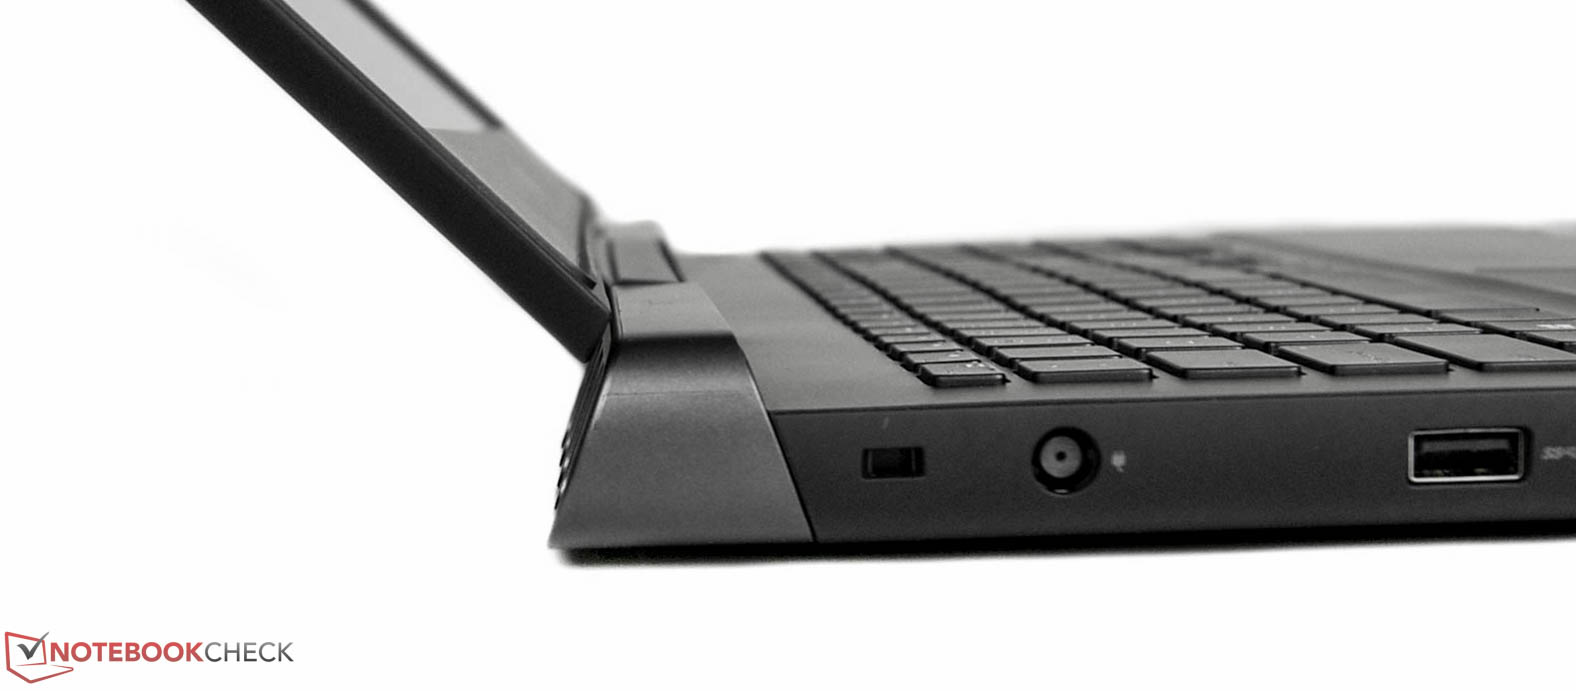
We are not absolutely happy with the connectivity of the new Inspiron 7000 series. In particular, it lacks diversity: Neither a USB Type-C port with Thunderbolt support nor many USB-3.0 ports are available. The interface layout is largely sophisticated. The Ethernet port and the HDMI-out are relatively far towards the back so that connected cables are not in the way.

SD-Card Reader
The transfer rates recorded with our Exceria Pro SDXC 64 GB UHS-II reference memory card from Toshiba are very slow. When copying JPG files (about 5 MB each) the average transfer rate is only about 22 MB/s. We have already found such poor values in the Acer Aspire VX5 and MSI GE72. If moving files to SD cards is important for you, you should consider a competitor such as the Asus Strix GL502. The Strix GL502VM achieved above 80 MB/s in our JPG test.
| SD Card Reader | |
| average JPG Copy Test (av. of 3 runs) | |
| Asus Strix GL502VM-DS74 | |
| Dell Inspiron 15 7559 | |
| MSI GE72 7RE-046 | |
| Acer Aspire VX5-591G-D0DD | |
| Dell Inspiron 15 7000 7567 | |
| maximum AS SSD Seq Read Test (1GB) | |
| Asus Strix GL502VM-DS74 | |
| Dell Inspiron 15 7559 | |
| Acer Aspire VX5-591G-D0DD | |
| MSI GE72 7RE-046 | |
| Dell Inspiron 15 7000 7567 | |
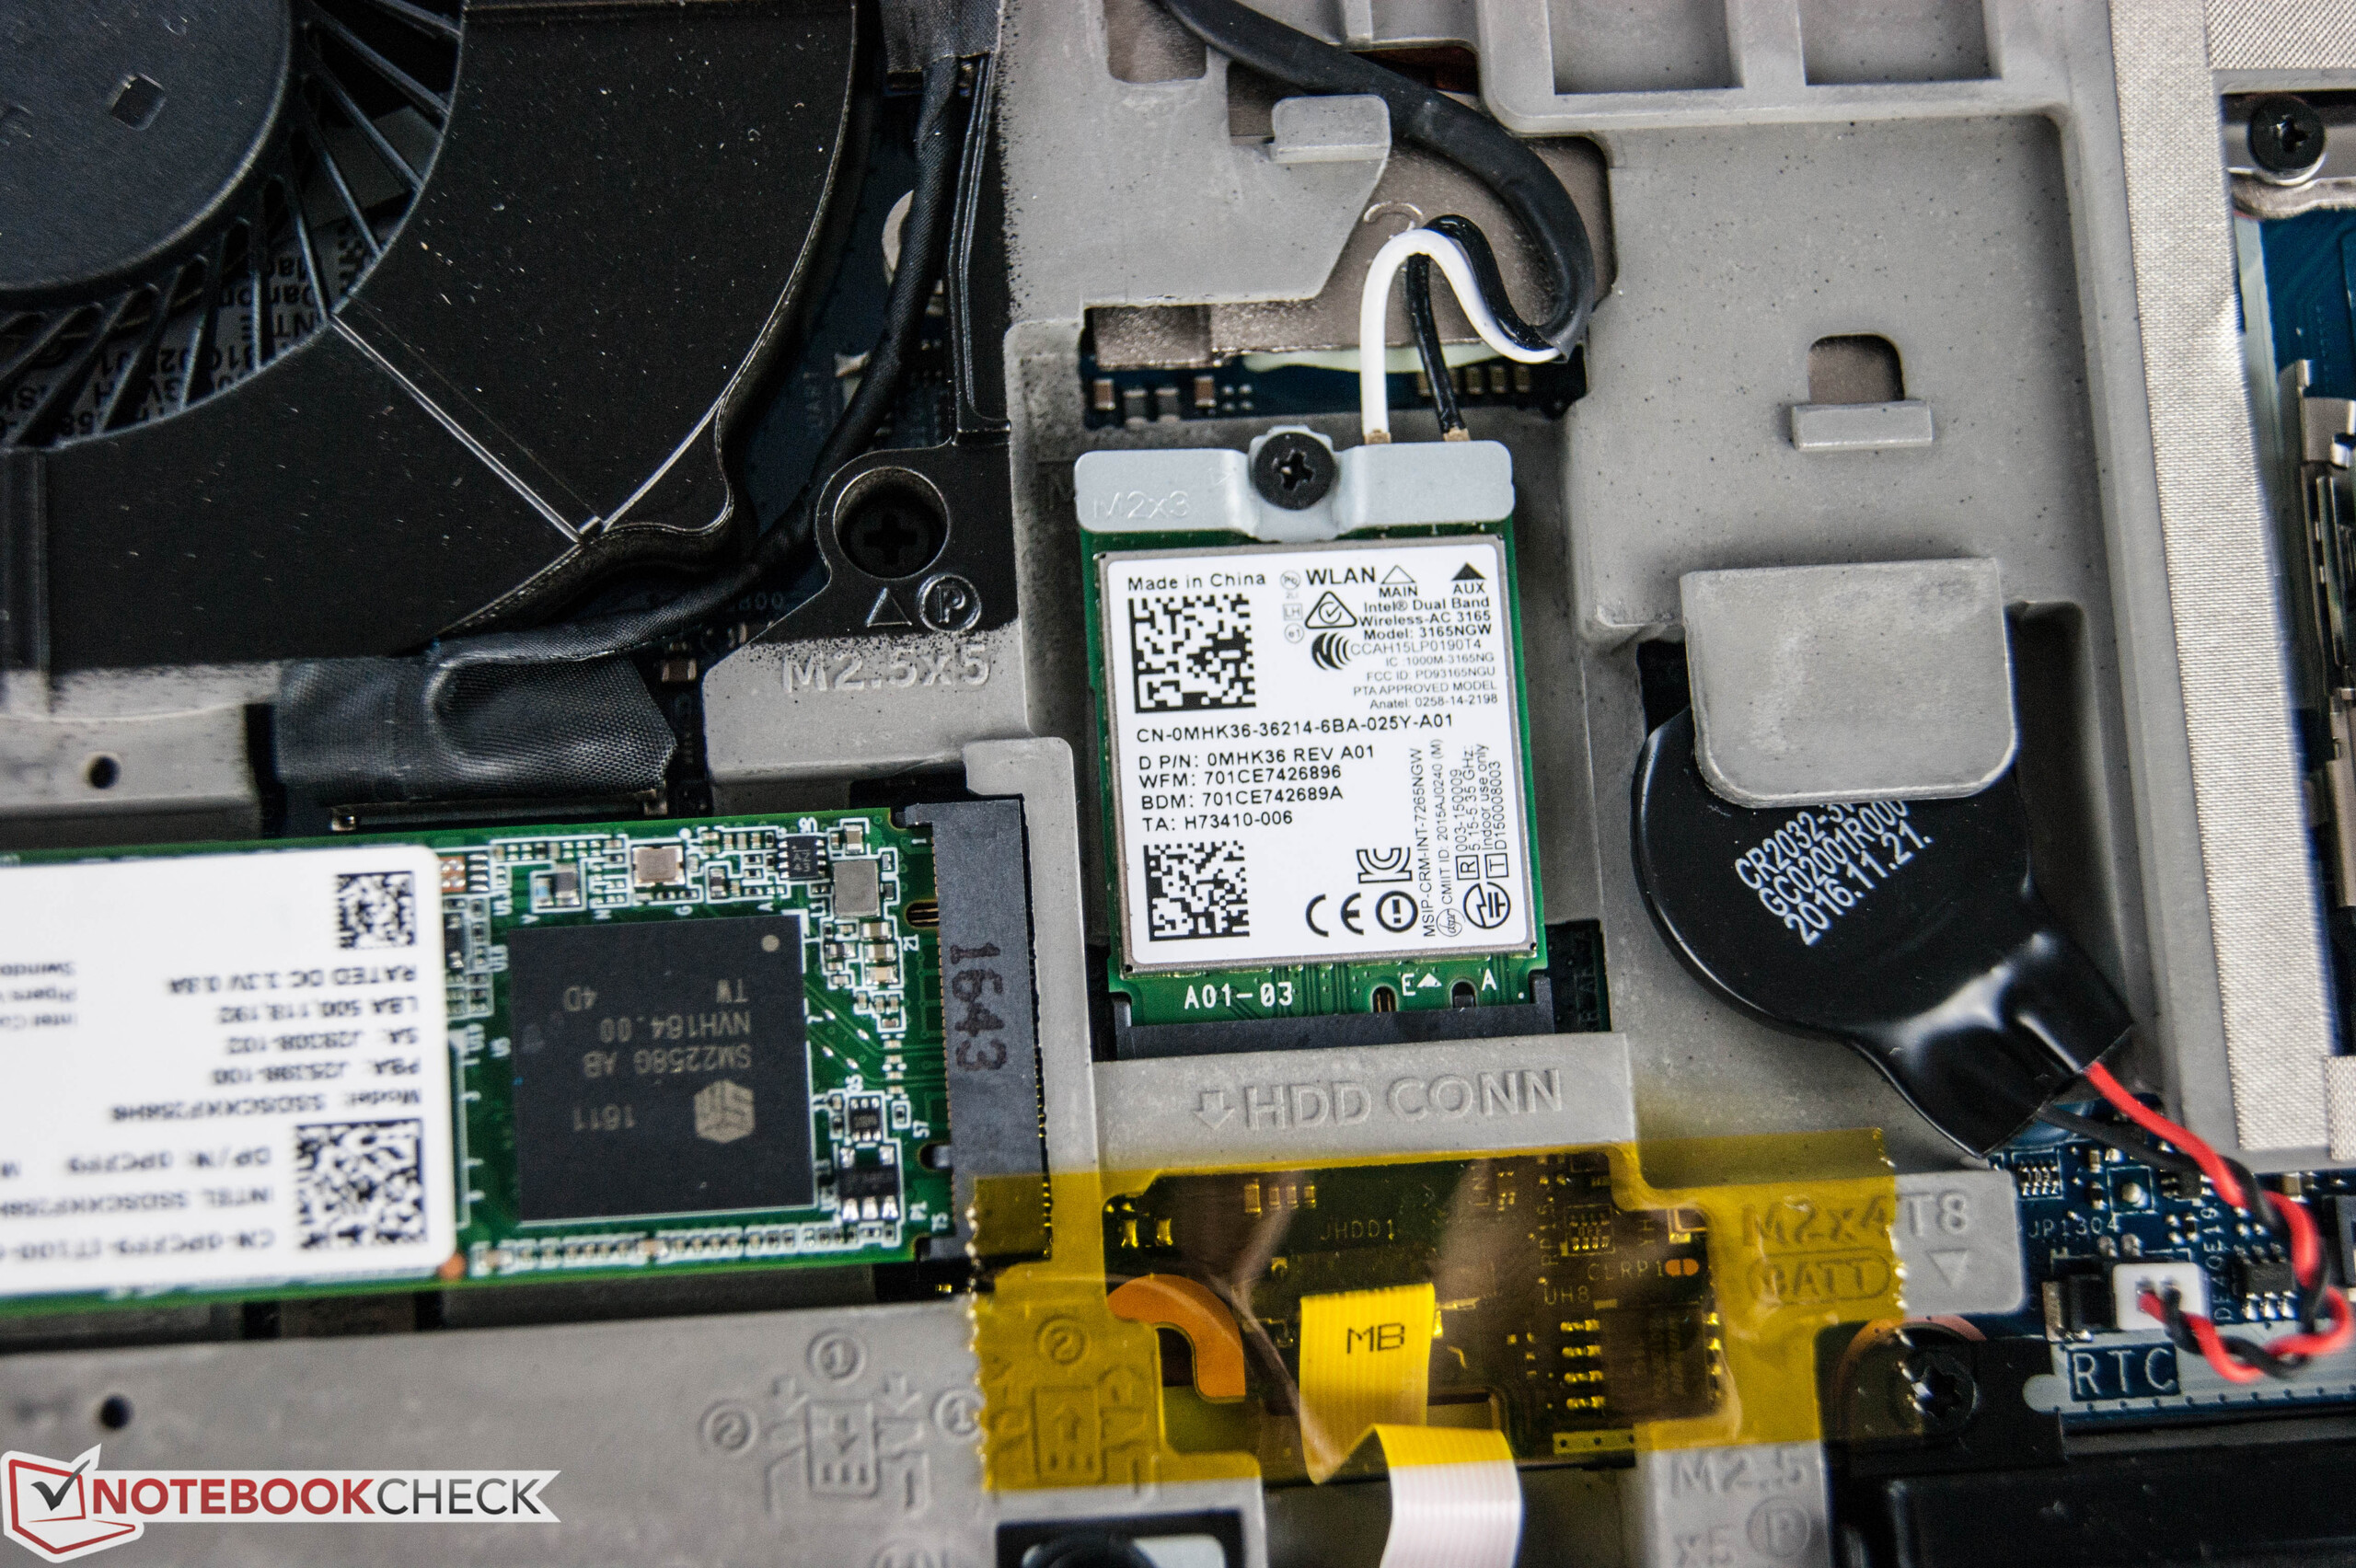
Communication
Dell has equipped the laptop with two communication solutions to allow users to dive into the world of online gaming: First of all an Intel Dual Band Wireless AC 3165 1x1 is used, which is supposed to achieve transfer rates of up to 433 MBit/s (gross). We have recorded a receiving rate of 246 MBit/s and a sending rate of 306 MBit/s. On the other hand, a Gigabit Ethernet adapter allows for stable connections via cable.
Dell's web-page for the Inspiron 7567 specifies Bluetooth version 4.0. However, the included data sheet lists Bluetooth 4.2.
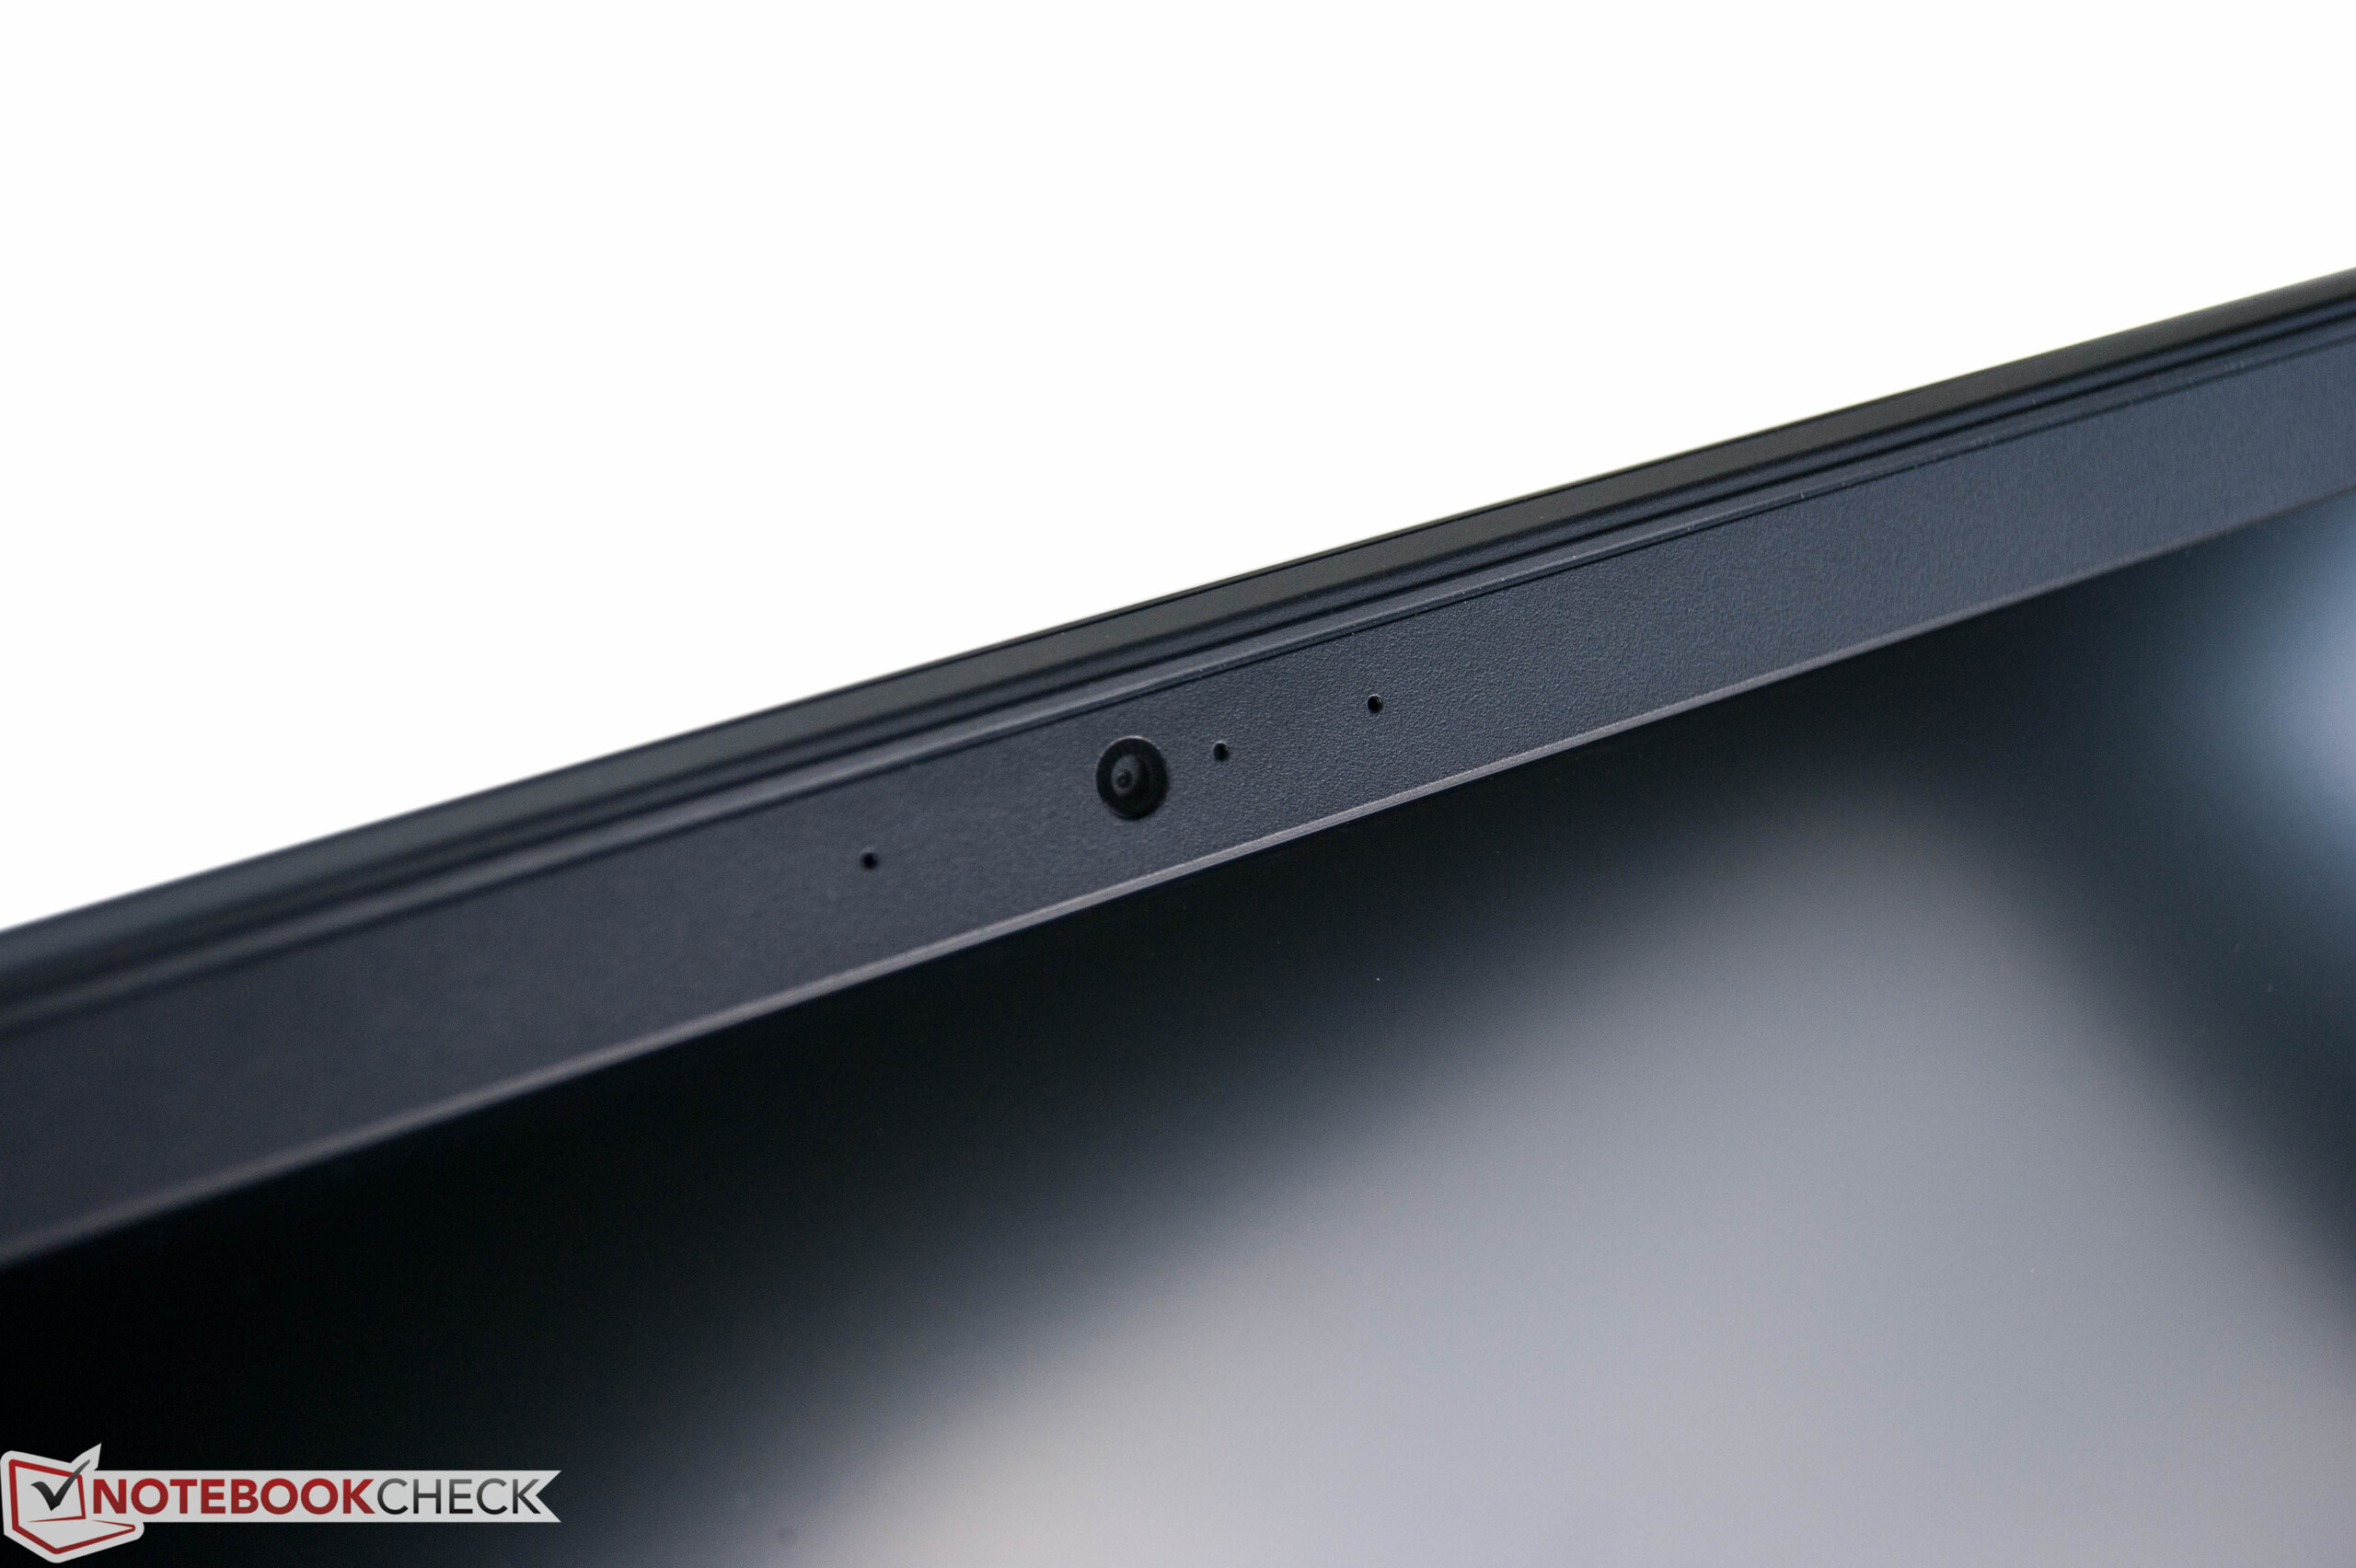
A 720p webcam can be used for video conferences. It produces acceptable pictures in good lighting conditions. However, you have to accept a slight noise and not absolutely precise colors.
| Networking | |
| iperf3 transmit AX12 | |
| Acer Aspire VX5-591G-D0DD | |
| Asus Strix GL502VM-DS74 | |
| Dell Inspiron 15 7000 7567 (jseb) | |
| MSI GE72 7RE-046 | |
| iperf3 receive AX12 | |
| Acer Aspire VX5-591G-D0DD | |
| MSI GE72 7RE-046 | |
| Asus Strix GL502VM-DS74 | |
| Dell Inspiron 15 7000 7567 (jseb) | |
Accessories
Unfortunately, the manufacturer does not include any accessories. Only several leaflets are in the box of our US notebook.
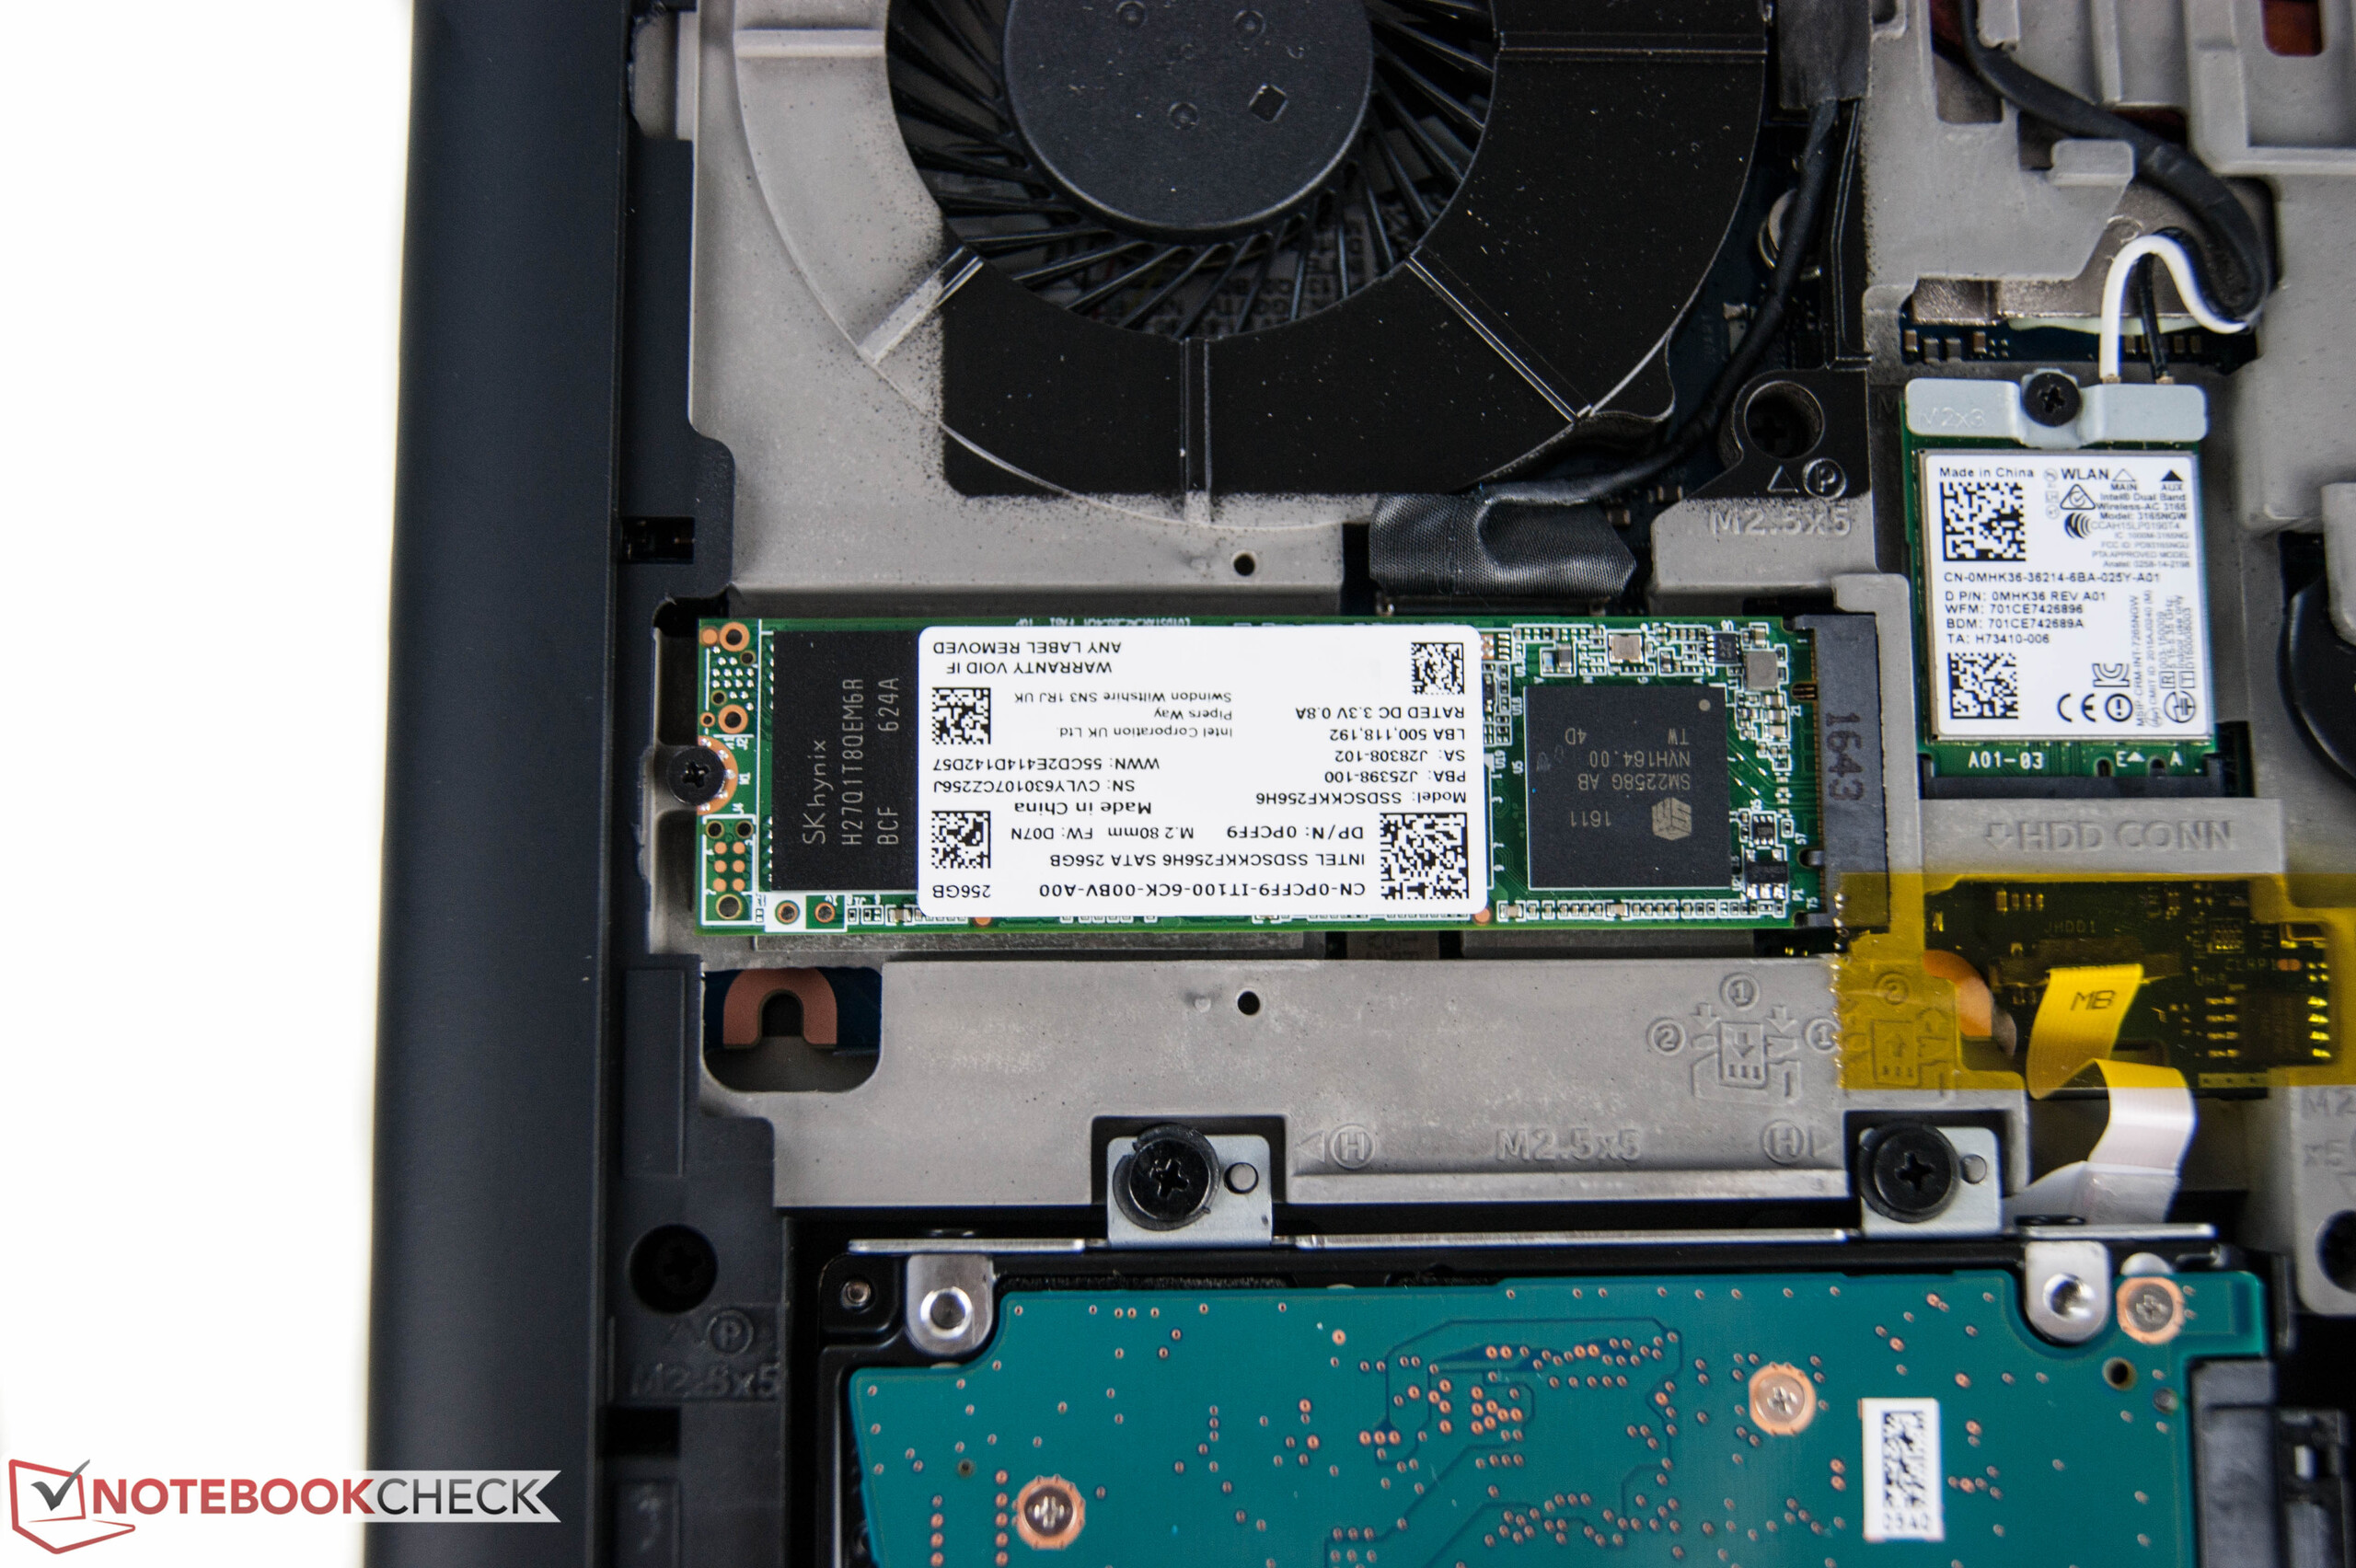
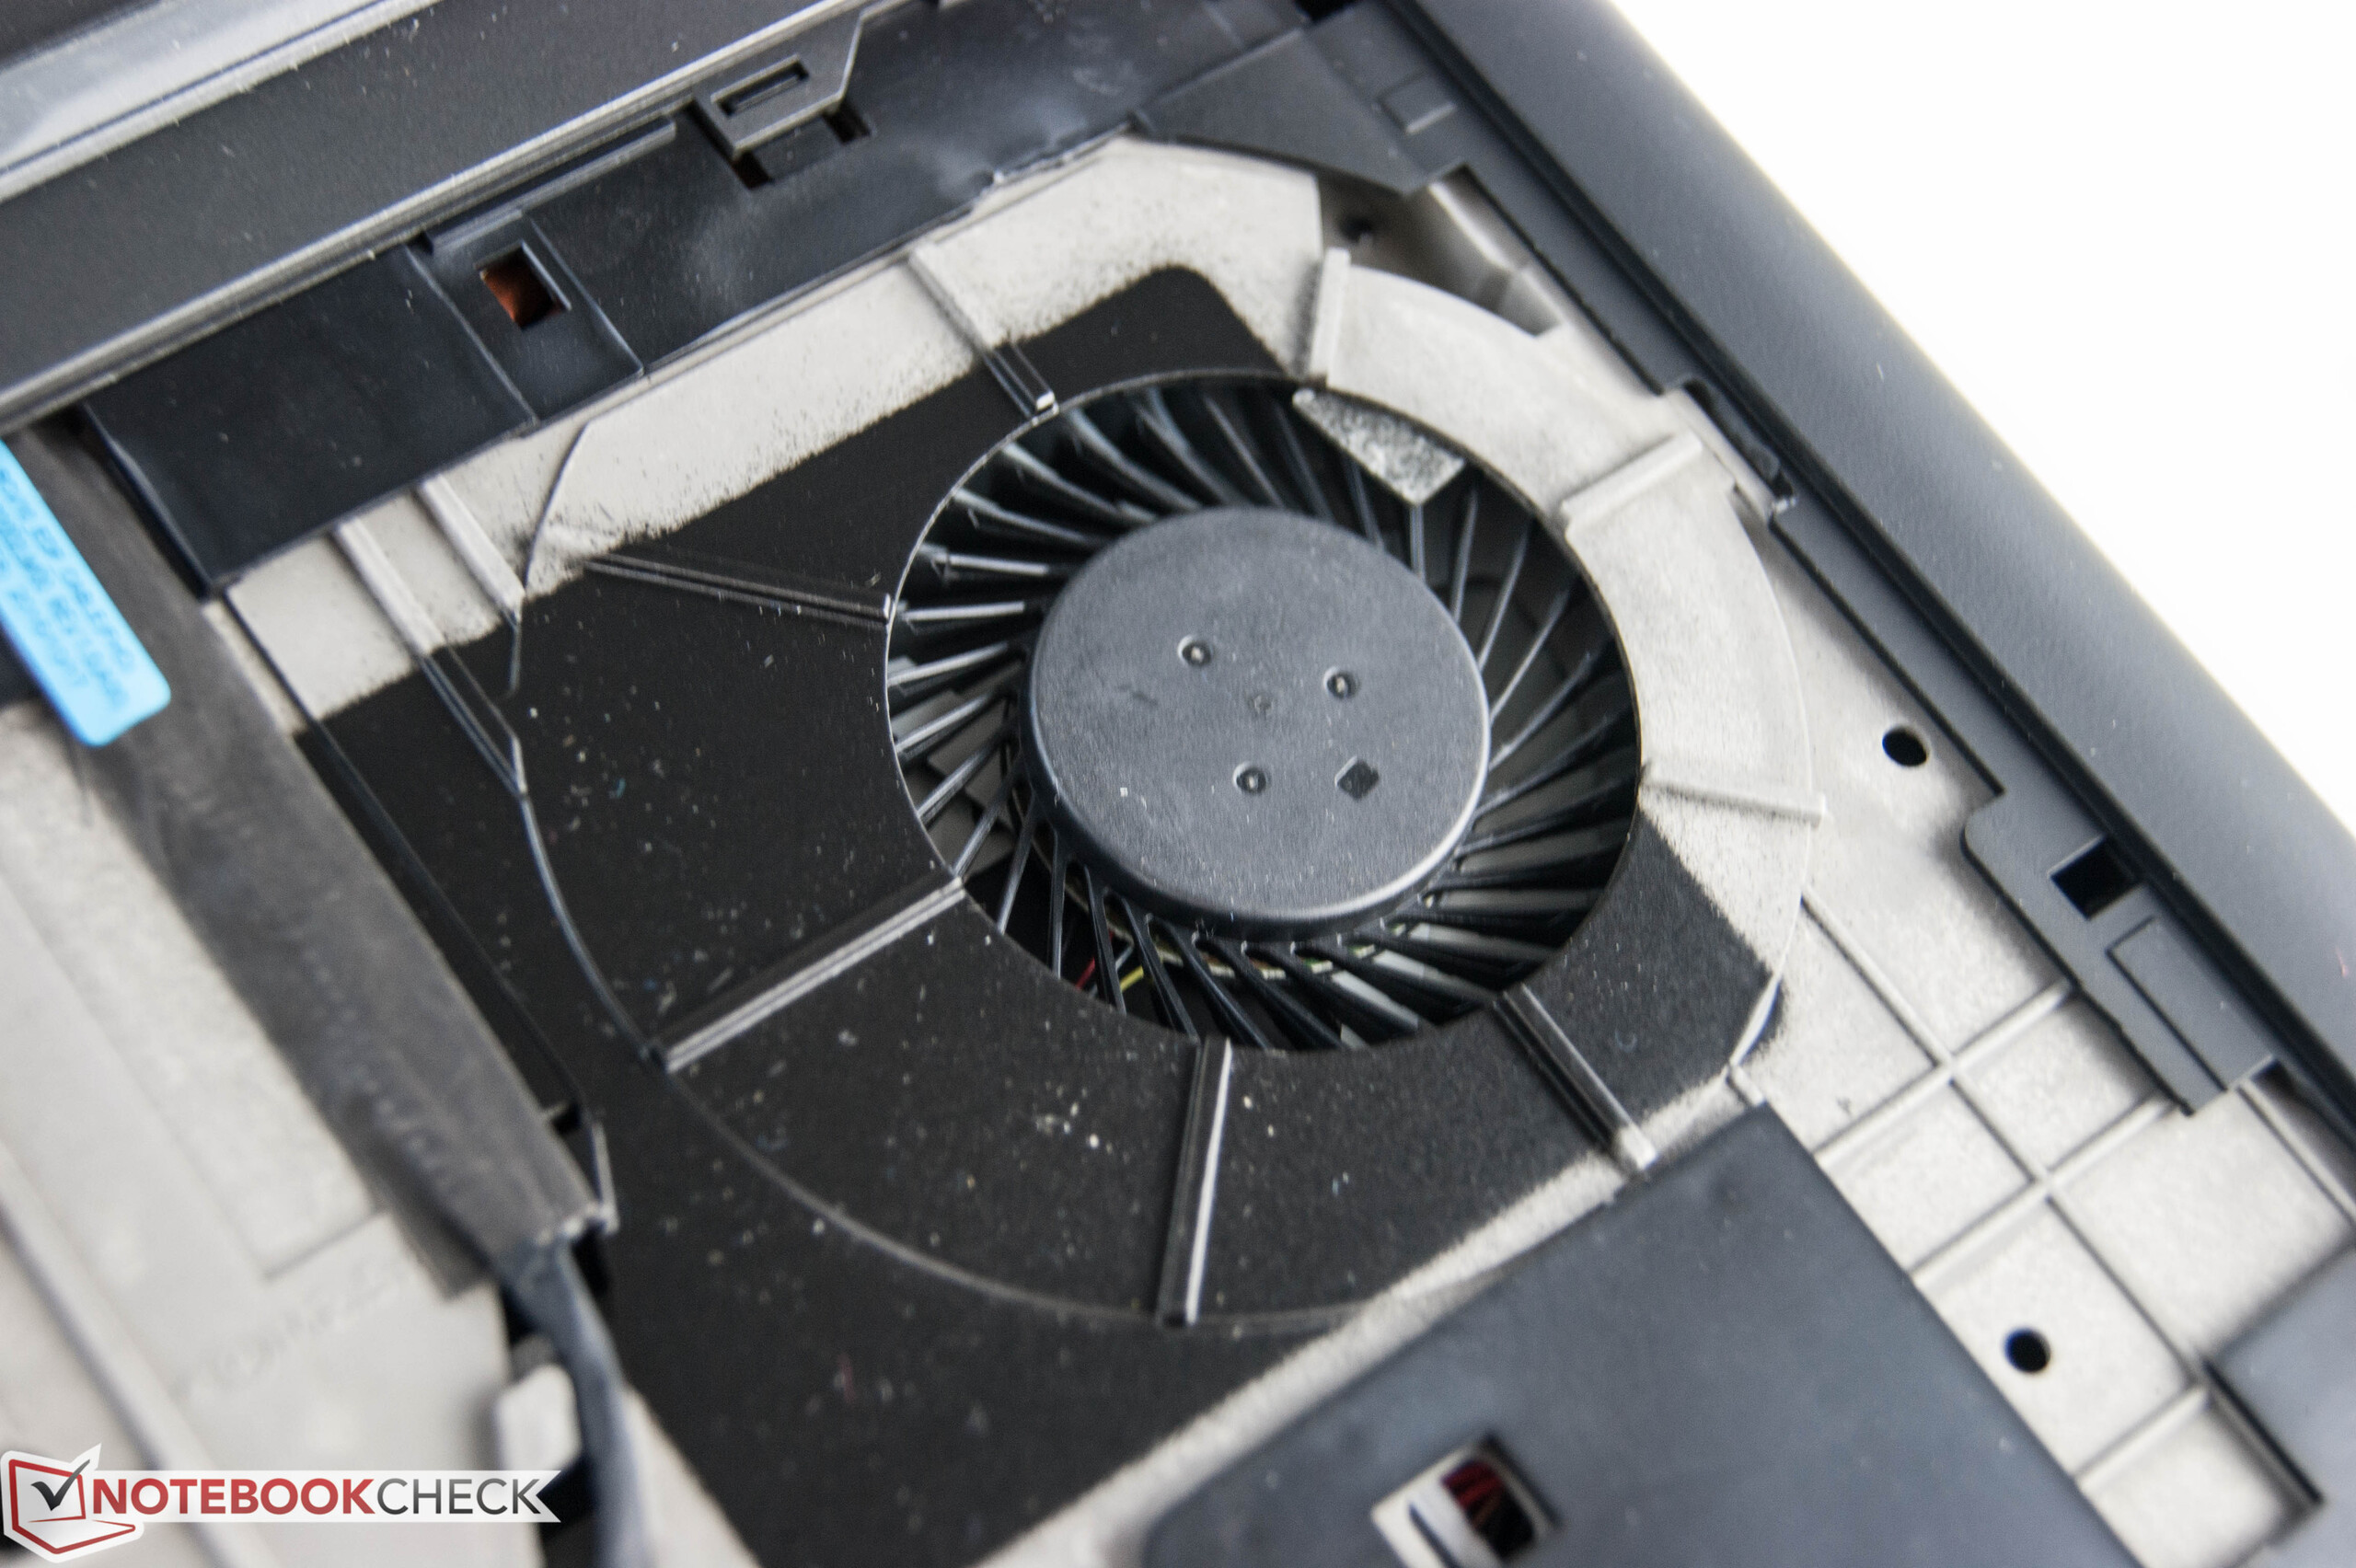
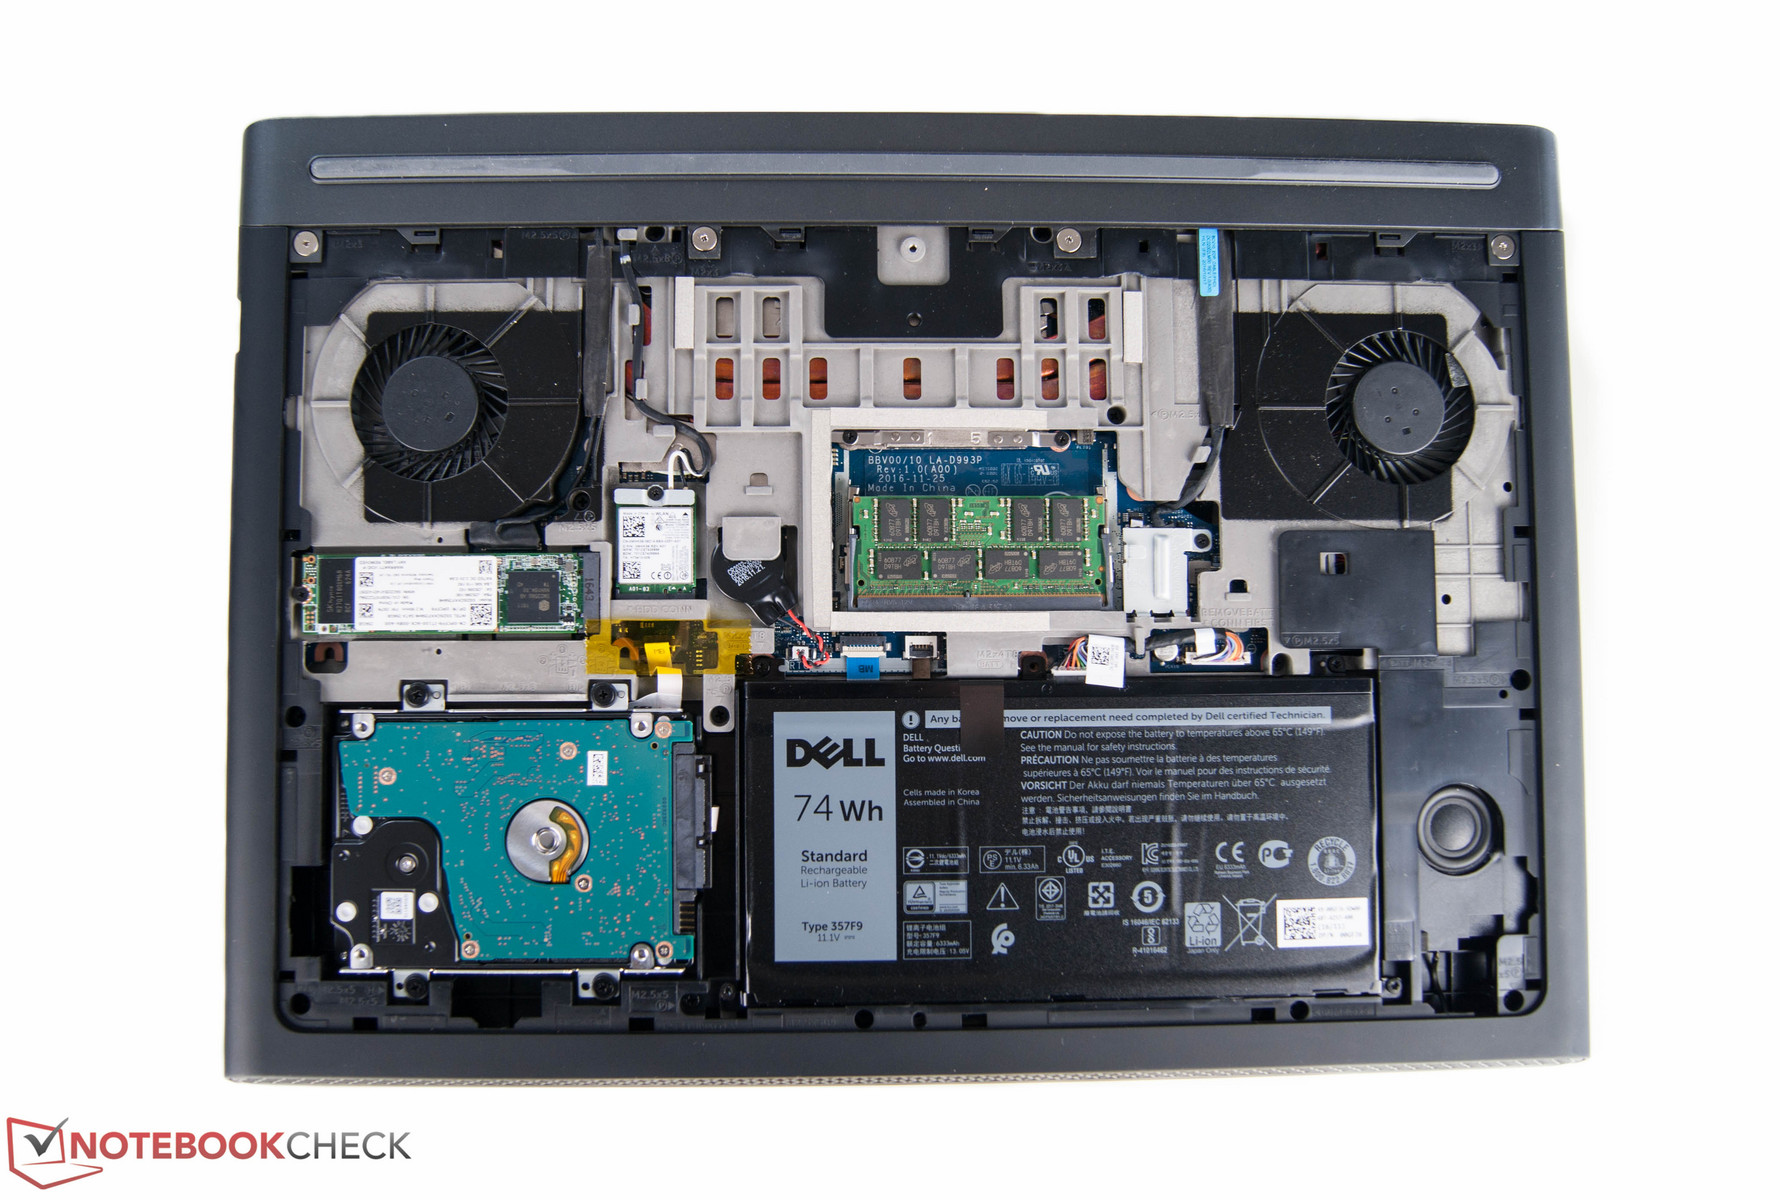
Maintenance
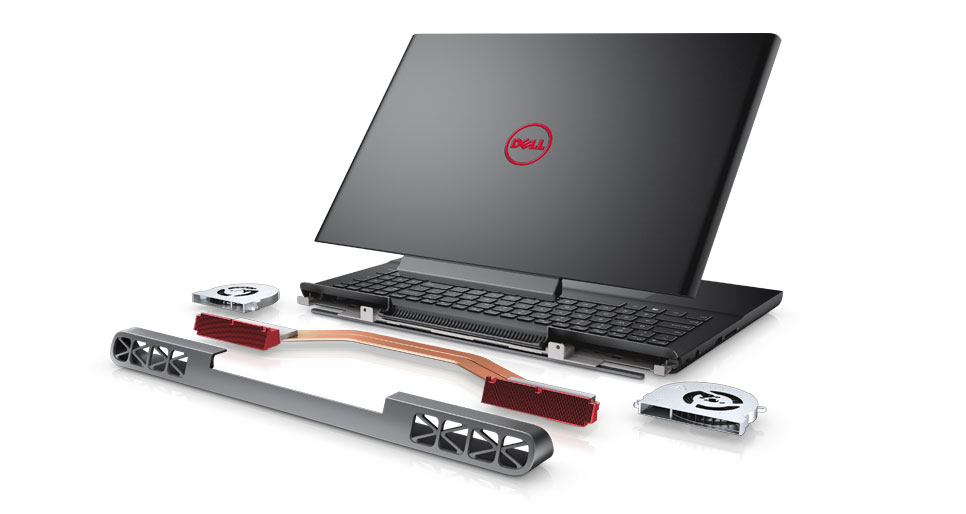
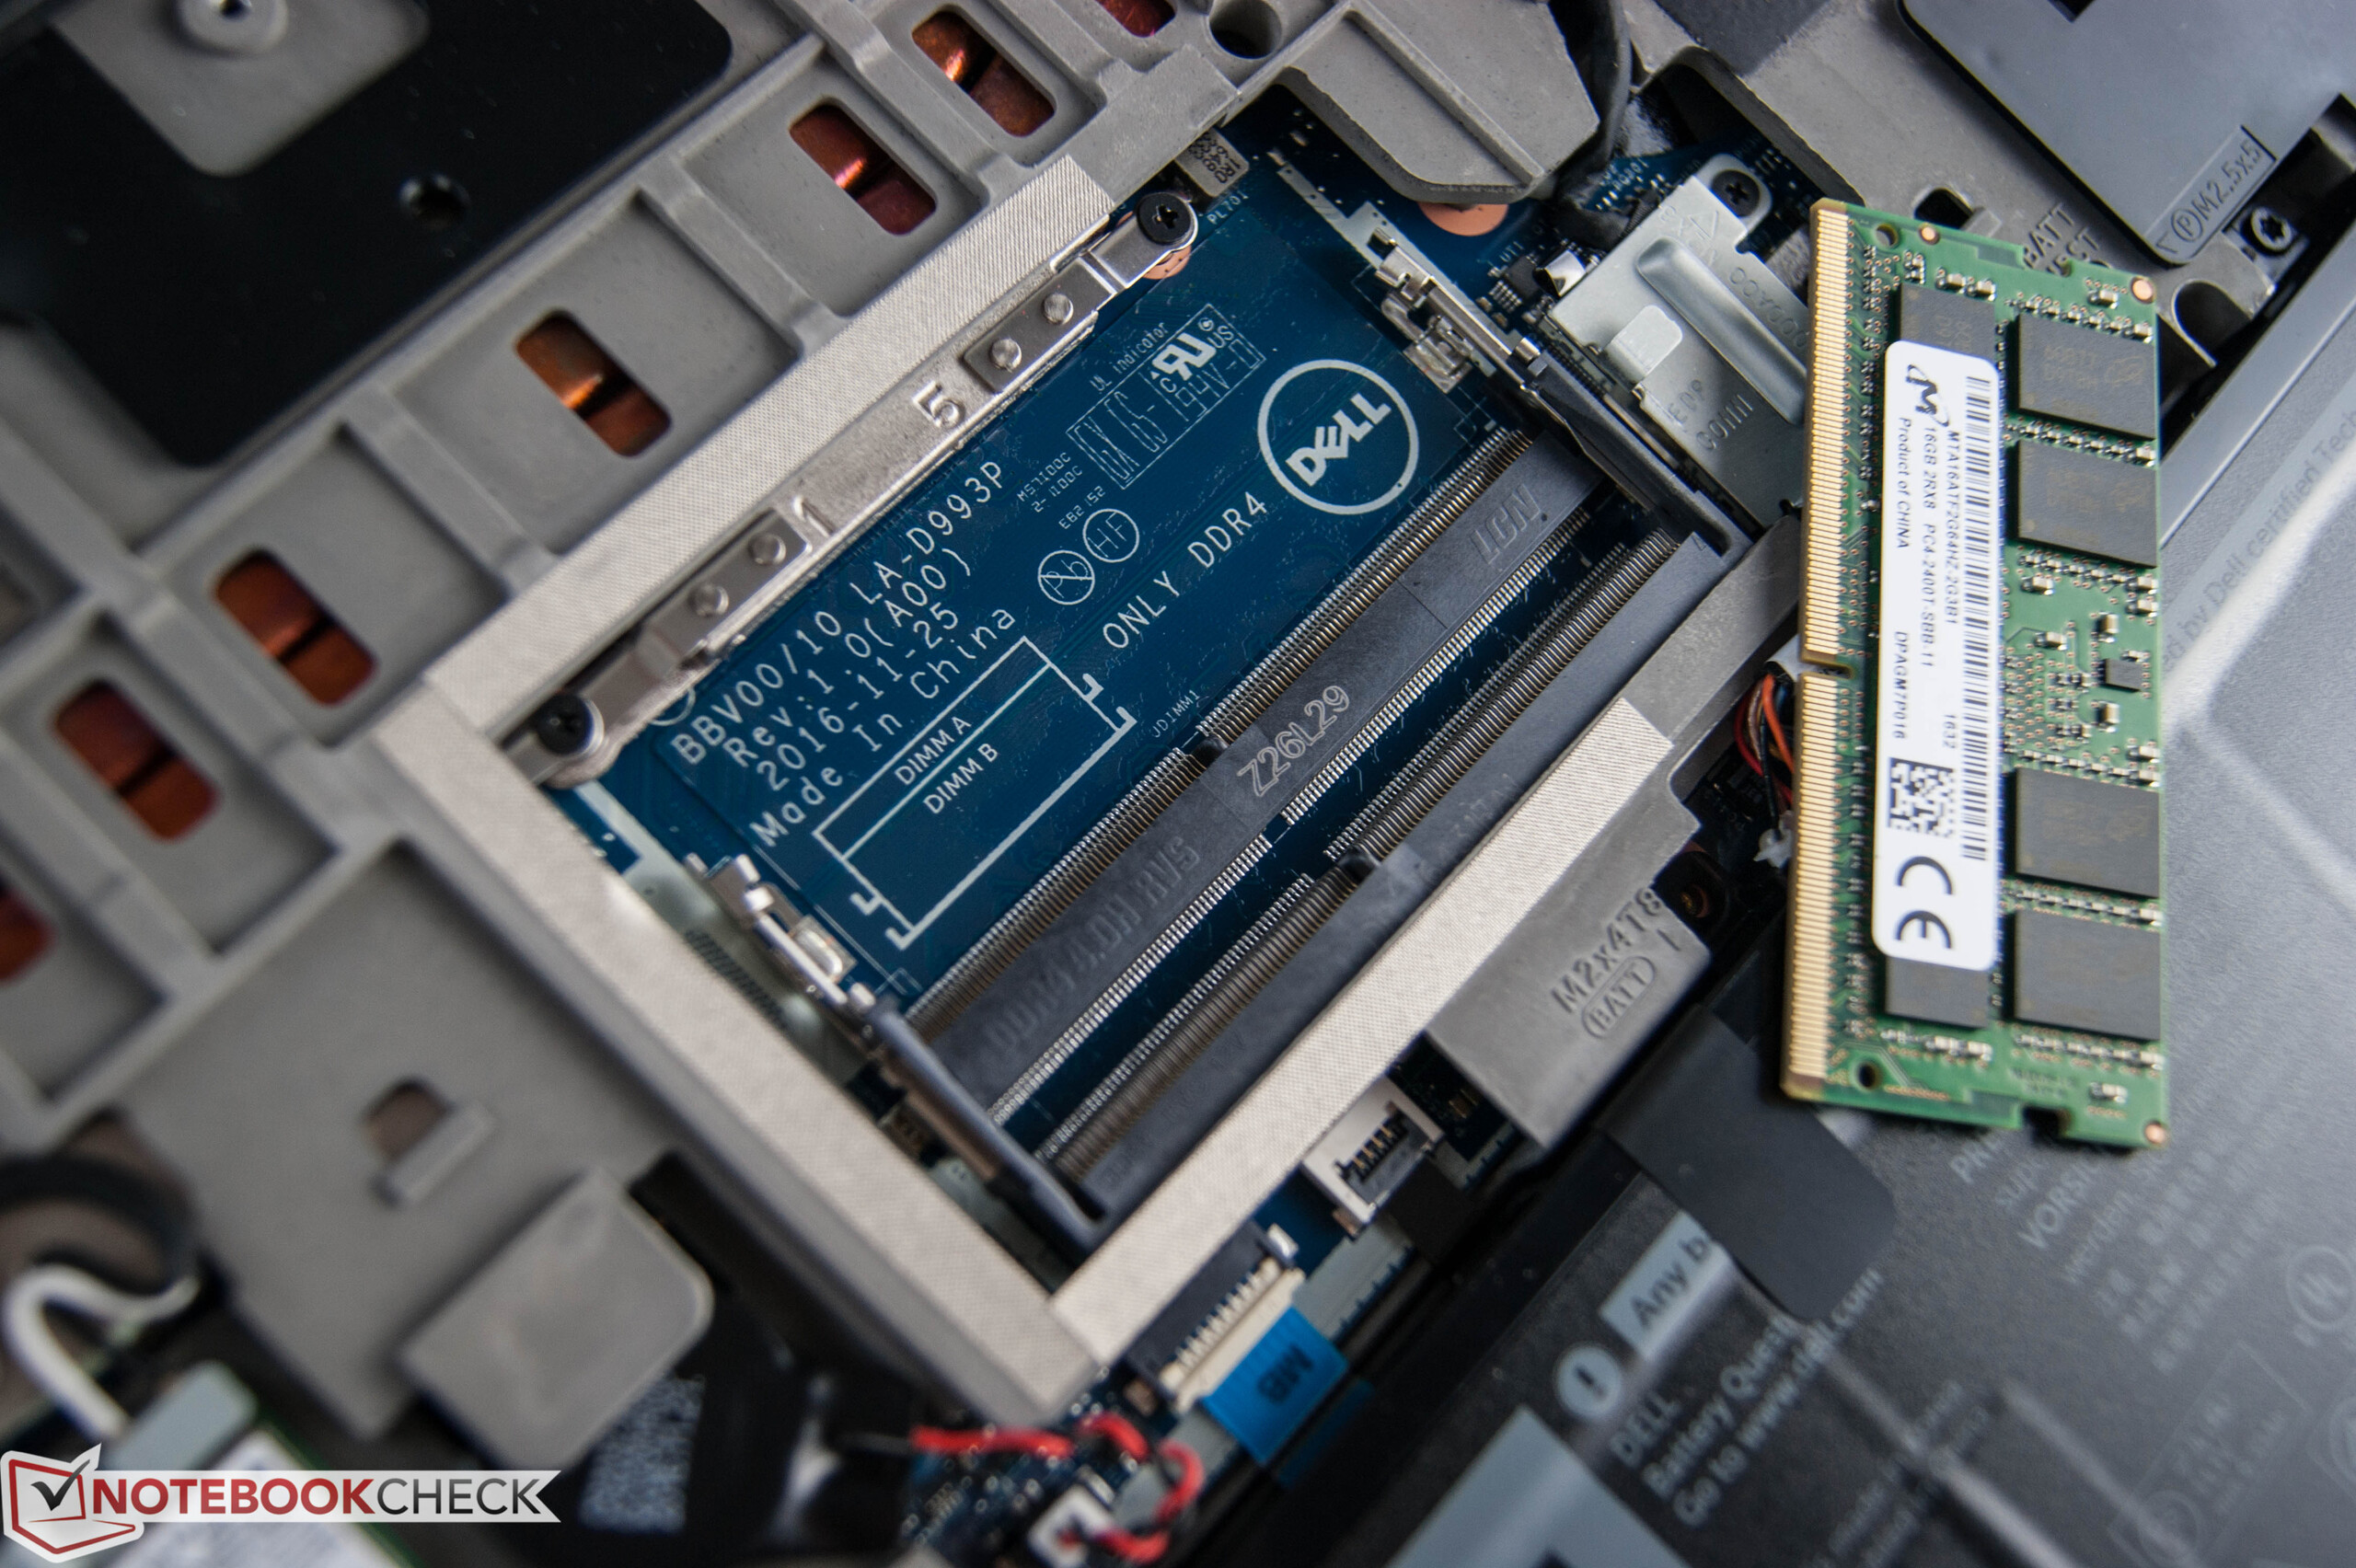
The easy maintenance is especially praiseworthy: In order to gain access to the inside, you only have to loosen a single screw. Afterwards, you can carefully detach the plastic panel. Take care not to break the click locks. Once done, you can reach the memory devices, the Wi-Fi-module, the CMOS battery, and the battery. In addition, it is easy to clean the fan.
Warranty
It is more or less common that Dell only includes a one-year warranty for new notebooks. The warranty includes pick-up, repair and hardware service. When ordering the device, the manufacturer offers a premium warranty in the online configuration. Among others, it includes 24 h service and software support. The minimum term of this extra service is one year (79 Euros, ~$83) and the maximum is four years (269 Euros, ~$285). Please see our Guarantees, Return Policies and Warranties FAQ for country-specific information.
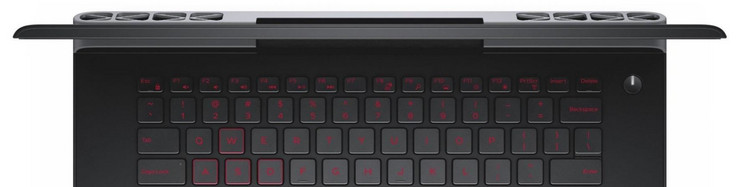
Input Devices
Keyboard
The used chiclet keyboard features a consistent and crisp pressure experience. However, the short travel could be slightly longer. In particular, inputs from the space bar feel spongy. Nevertheless, touch typists will get used to the keyboard after a while. It is pleasing to find that the Inspiron 7567 features a complete number pad. Another appreciated feature is the two-level backlight. However, we dislike the small arrow keys, which are too small for e.g. race games. Pros include the relatively quiet and muffled typing noise without disturbing clattering noise. In addition, the keyboard unit is splash-protected according to the manufacturer.
Touchpad
The 10.6 x 8 cm touchpad consists of a roughened plastic surface, which does not look especially high-end but is convincing in use: Inputs are translated flawlessly and quickly. Most inputs are also recognized reliably in the corners. The mouse buttons beneath the touchpad generate a very quiet, yet high-pitched clicking noise. The travel gets softer and longer towards the edges.
Display
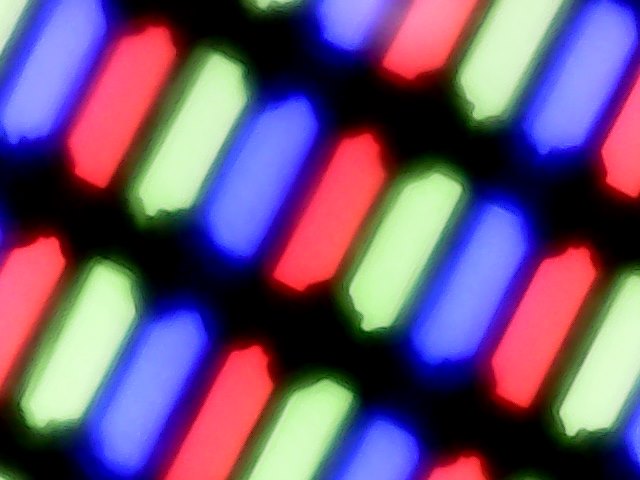
Our test model of the Dell Inspiron 7000 series uses a Full HD TN panel. Unfortunately, the shop page does not specify which display types are used by the offered variants. The included data sheet from Dell lists three different display types for this series: First of all, the Full HD TN panel used in our test model, secondly, a Full HD IPS panel and finally a glossy UHD IPS display. The UHD display is used in the most expensive variant (1479 Euros, ~$1571). It remains to be seen whether the Full HD IPS panel is actually used in any variant. Dell has not yet answered our request concerning this matter so far.
Let us turn to our test model's TN panel with a resolution of 1920x1020 pixels: It has an average brightness of 235 cd/m². This is especially striking as our test model of the Inspiron 15 predecessor performed 16% better. In this aspect, the expensive Asus Strix GL502VM takes the lead with about 300 cd/m².
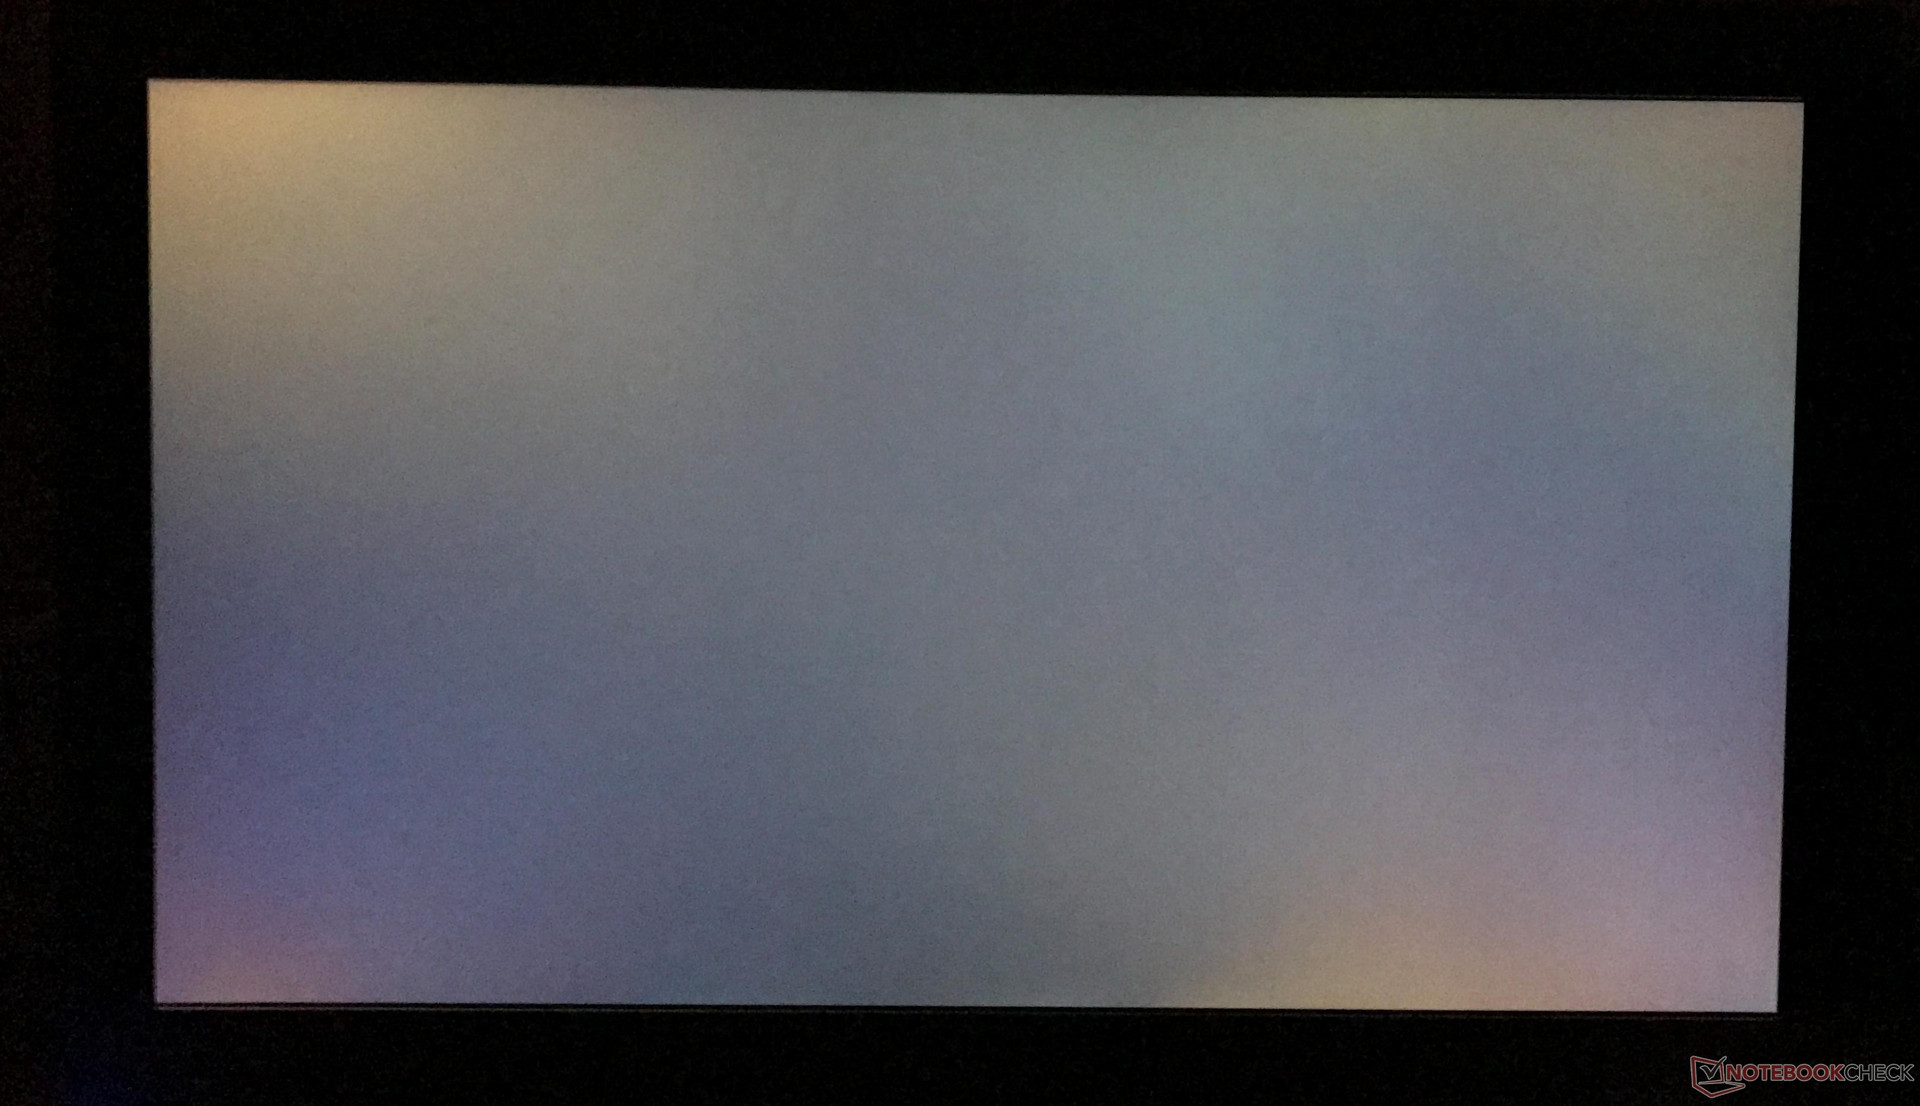
It is advantageous that screen bleeding/clouding is not noticeable.
Update:
We have got an answer from Dell regarding the display types: In the EMEA region, the Full HD variant will only be available with TN-type panel. Only the UHD option uses the IPS panel.
| |||||||||||||||||||||||||
Brightness Distribution: 75 %
Center on Battery: 286 cd/m²
Contrast: 447:1 (Black: 0.55 cd/m²)
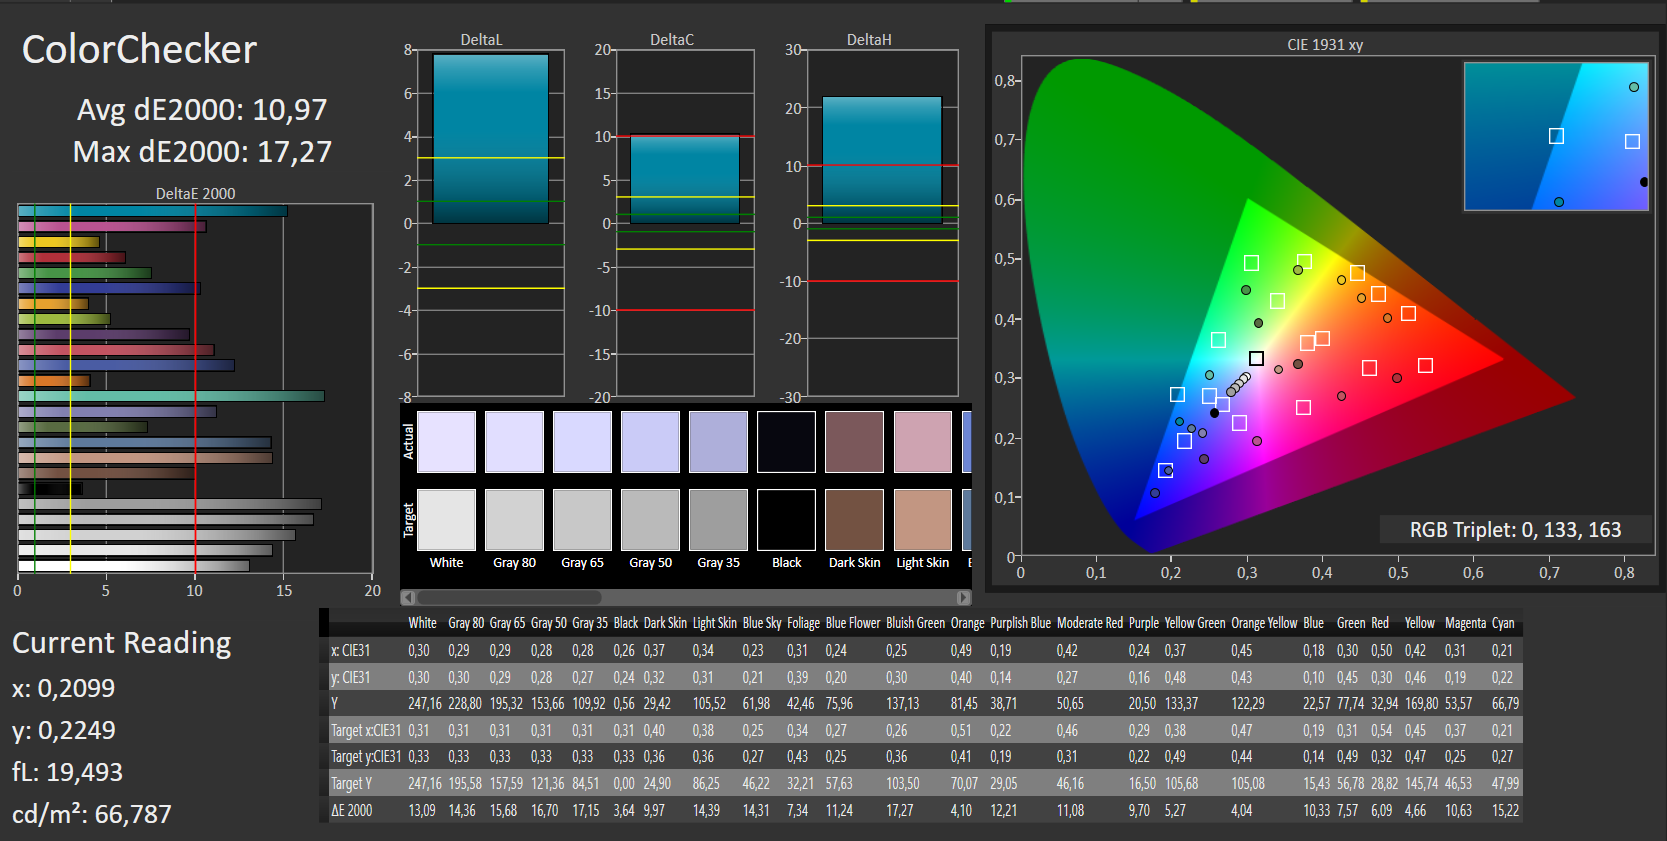
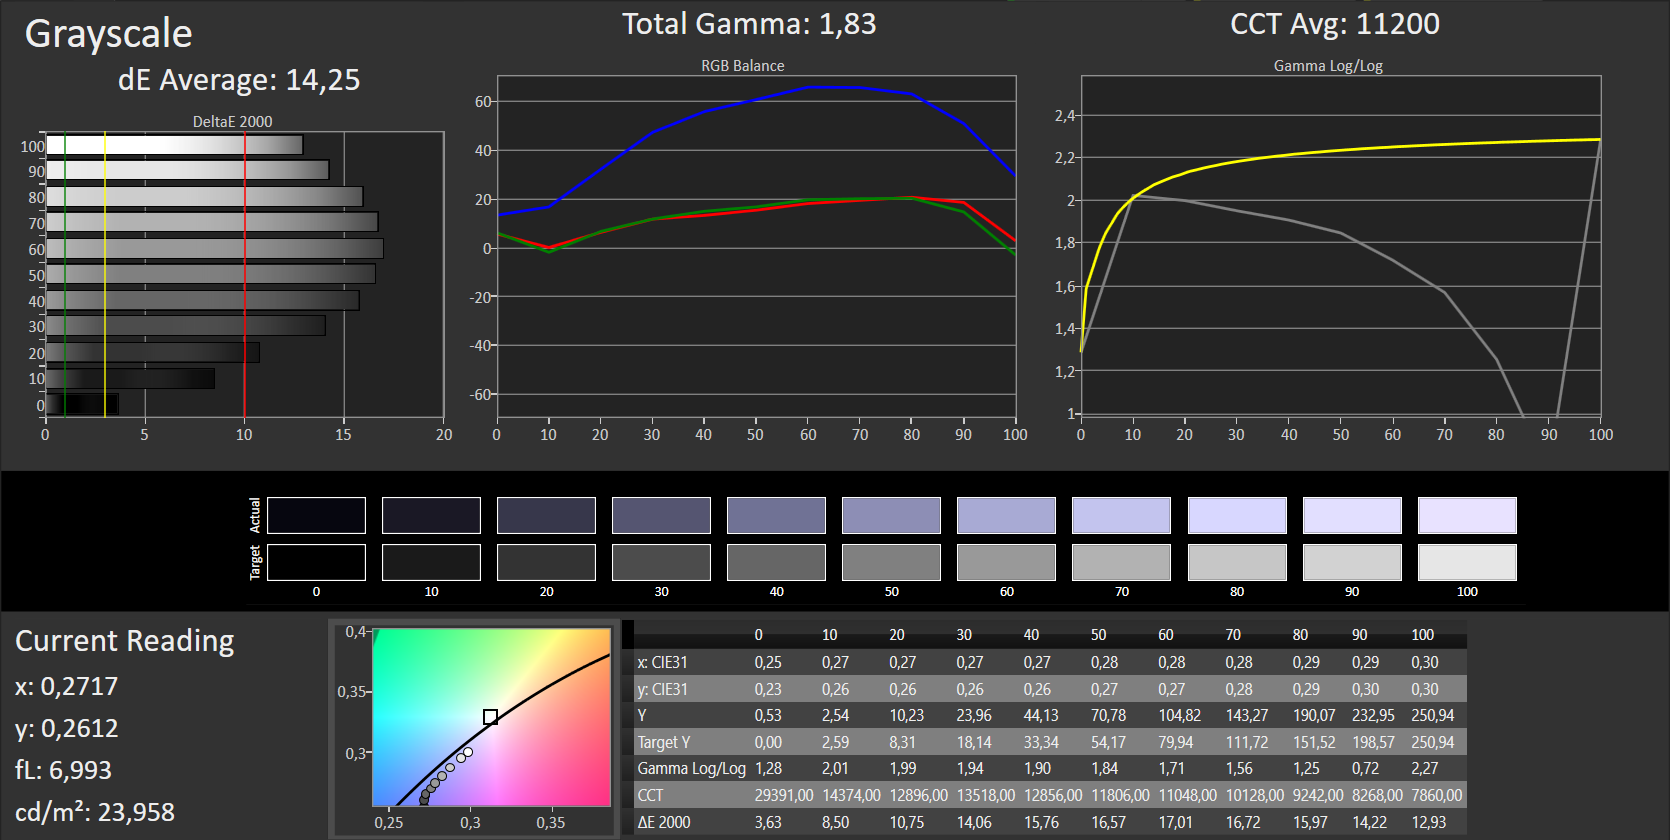
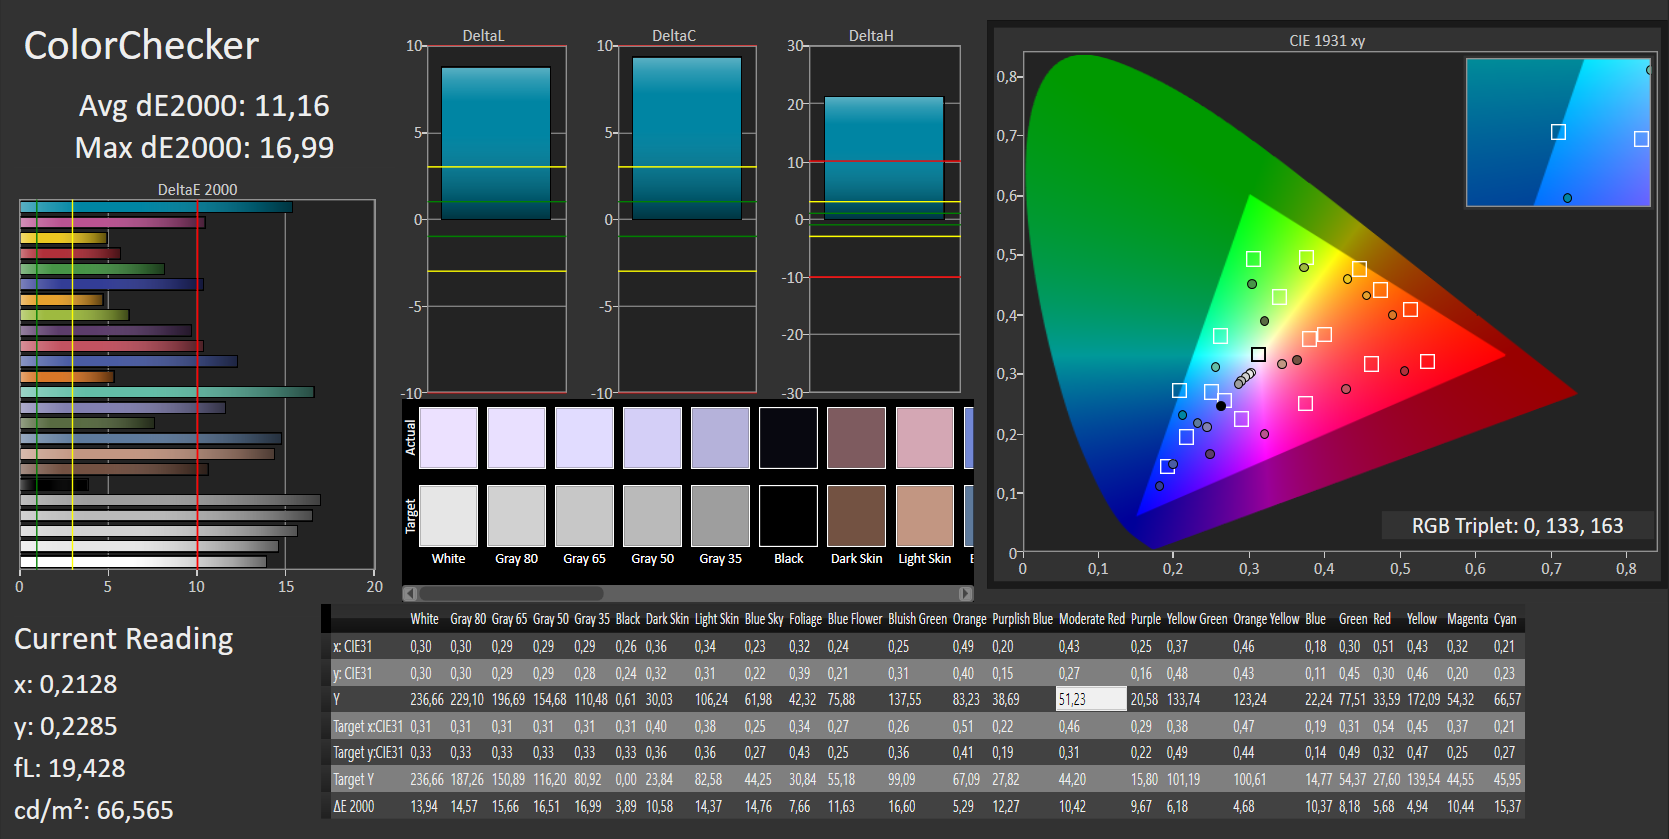
ΔE ColorChecker Calman: 10.97 | ∀{0.5-29.43 Ø4.72}
ΔE Greyscale Calman: 14.25 | ∀{0.09-98 Ø4.97}
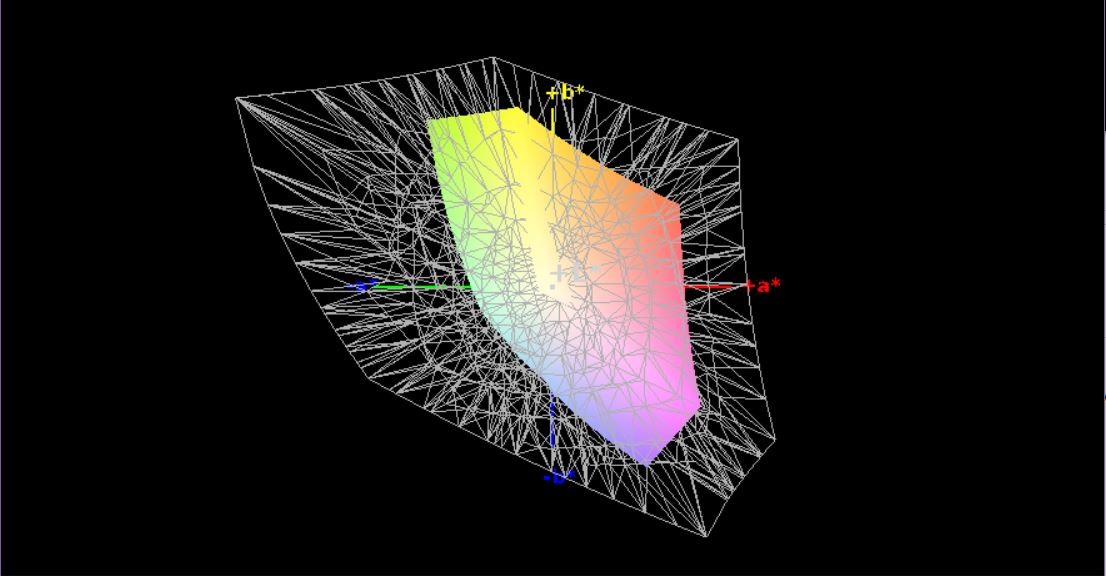
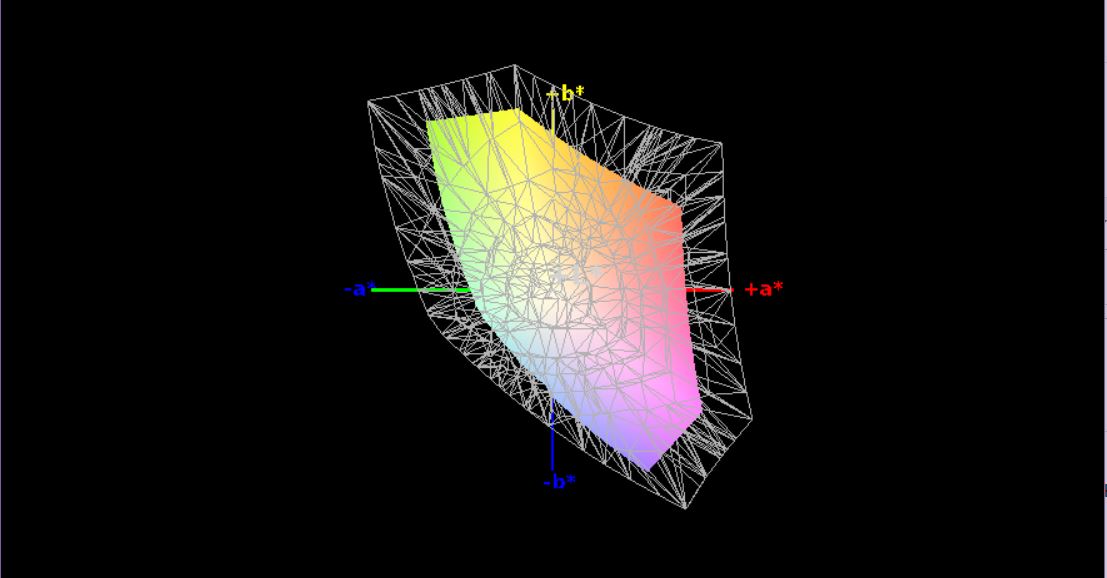
55% sRGB (Argyll 1.6.3 3D)
35% AdobeRGB 1998 (Argyll 1.6.3 3D)
37.62% AdobeRGB 1998 (Argyll 3D)
54.9% sRGB (Argyll 3D)
36.42% Display P3 (Argyll 3D)
Gamma: 1.83
CCT: 11200 K
| Dell Inspiron 15 7000 7567 AU Optronics AUO38ED B156HTN 28H80, , 1920x1080, 15.6" | MSI GE72 7RE-046 N173HHE-G32 (CMN1747), , 1920x1080, 17.3" | Dell Inspiron 15 7559 LG Philips LGD04D9 / 156UD2 / Dell P/N: 53FC4, , 3840x2160, 15.6" | Asus Strix GL502VM-DS74 1920x1080, 15.6" | |
|---|---|---|---|---|
| Display | 119% | 70% | 66% | |
| Display P3 Coverage (%) | 36.42 | 90.7 149% | 63.4 74% | 64.8 78% |
| sRGB Coverage (%) | 54.9 | 99.9 82% | 90 64% | 84.9 55% |
| AdobeRGB 1998 Coverage (%) | 37.62 | 85.2 126% | 64.6 72% | 62 65% |
| Response Times | 50% | 20% | -4% | |
| Response Time Grey 50% / Grey 80% * (ms) | 36 ? | 27 ? 25% | 32 ? 11% | 42 ? -17% |
| Response Time Black / White * (ms) | 36 ? | 9 ? 75% | 26 ? 28% | 32.8 ? 9% |
| PWM Frequency (Hz) | ||||
| Screen | 57% | 26% | 52% | |
| Brightness middle (cd/m²) | 246 | 253 3% | 276 12% | 307.8 25% |
| Brightness (cd/m²) | 235 | 230 -2% | 273 16% | 301 28% |
| Brightness Distribution (%) | 75 | 86 15% | 85 13% | 88 17% |
| Black Level * (cd/m²) | 0.55 | 0.24 56% | 0.78 -42% | 0.33 40% |
| Contrast (:1) | 447 | 1054 136% | 354 -21% | 933 109% |
| Colorchecker dE 2000 * | 10.97 | 5.01 54% | 4.05 63% | 4.5 59% |
| Greyscale dE 2000 * | 14.25 | 7.26 49% | 4.68 67% | 2.9 80% |
| Gamma | 1.83 120% | 2.09 105% | 2.55 86% | 2.22 99% |
| CCT | 11200 58% | 6329 103% | 6871 95% | 1136 572% |
| Color Space (Percent of AdobeRGB 1998) (%) | 35 | 76 117% | 58 66% | 55.4 58% |
| Color Space (Percent of sRGB) (%) | 55 | 100 82% | 90 64% | 84.8 54% |
| Colorchecker dE 2000 max. * | 10.4 | 10 | ||
| Total Average (Program / Settings) | 75% /
69% | 39% /
35% | 38% /
47% |
* ... smaller is better
Already the first contact with our Inspiron display is quite disappointing. We expect a contrast-rich display with great colors; especially in the gaming range. The test model cannot fulfill this wish. The black value of 0.55 cd/m² is too high.
The CalMAN analysis showed high color and grayscale shifts. It is especially annoying that the display is very bluish due to the high deviations. The IPS panels in the Dell Inspiron 15 7559 and the Asus Strix GL502VM perform significantly better in this aspect. The software TrueColor is supposed to slightly improve the colors in the new Inspiron. Unfortunately, the display remains bluish.
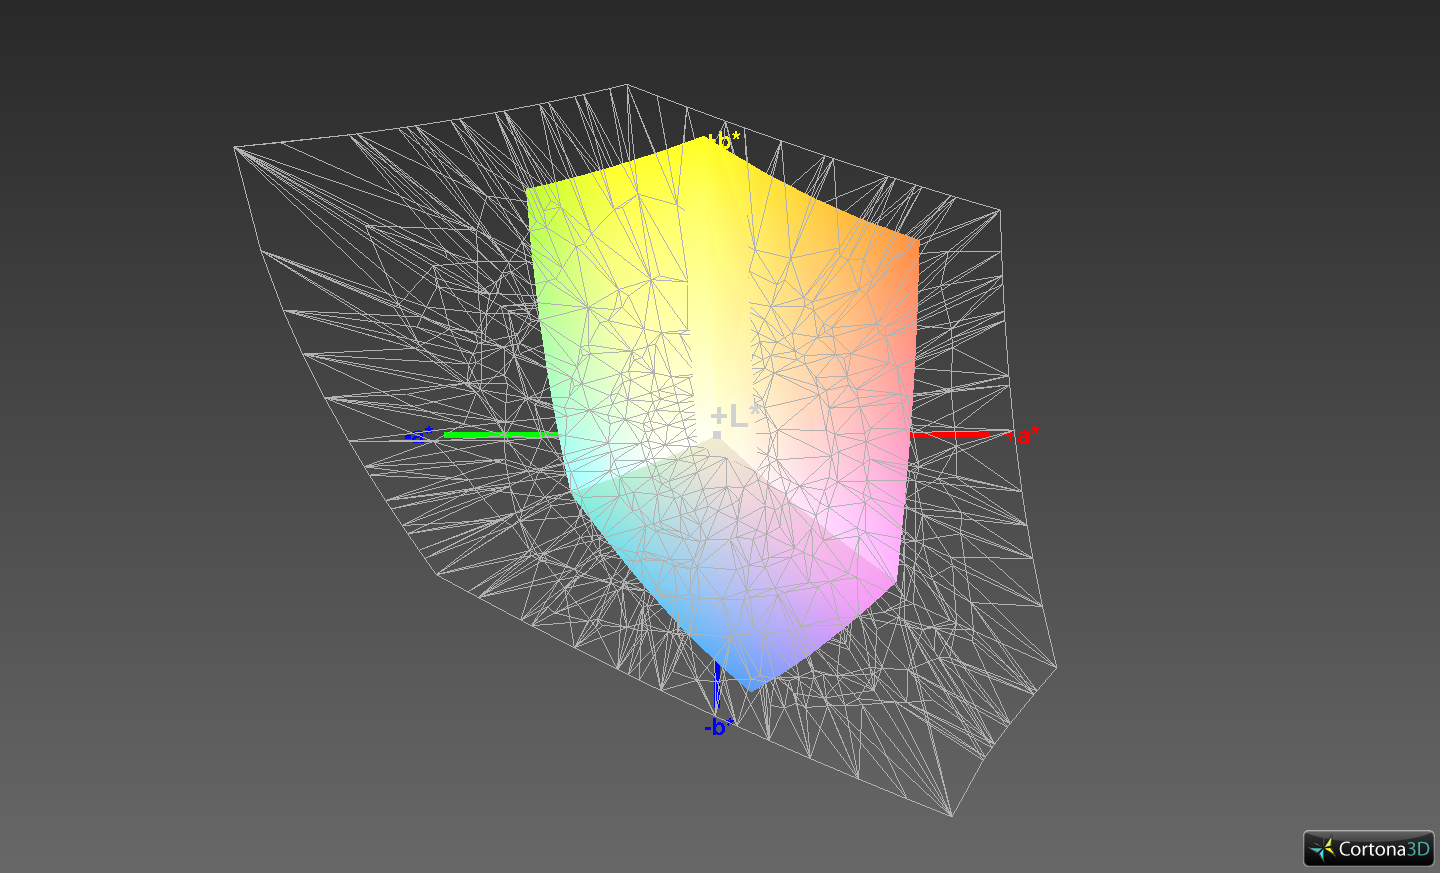
In addition, the color coverages, which are important for professional use, are not sufficient. The display covers 55% of sRGB and 35% of AdobeRGB.
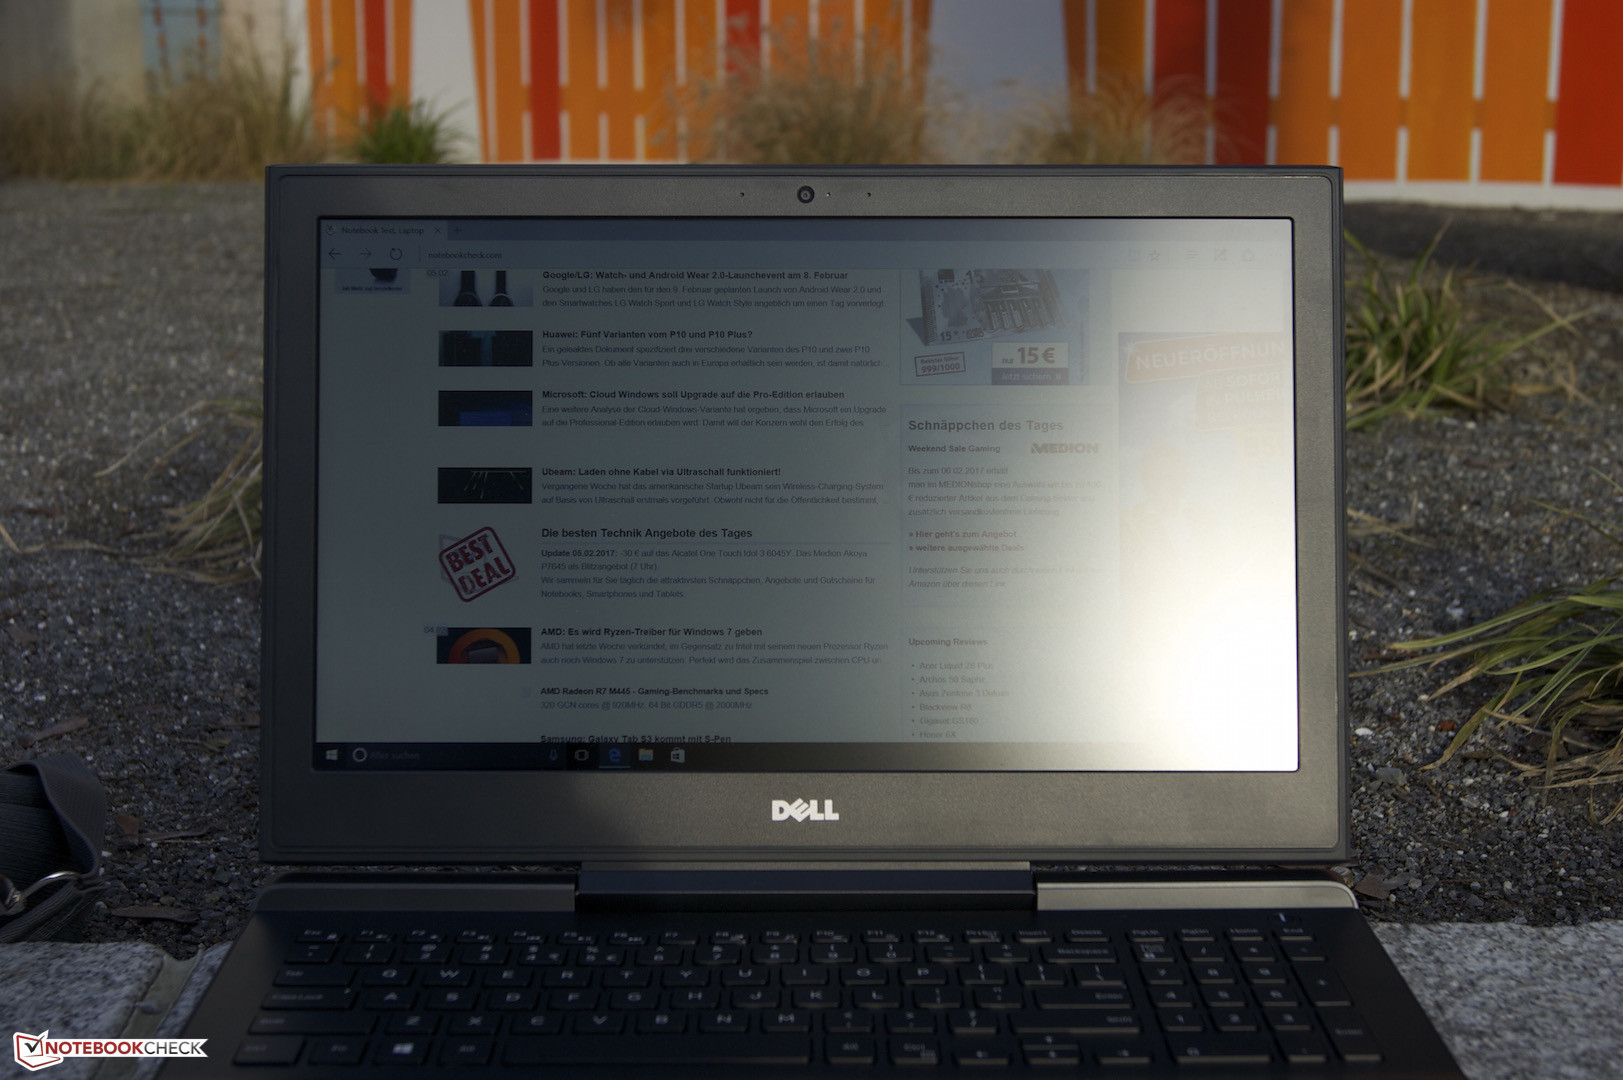
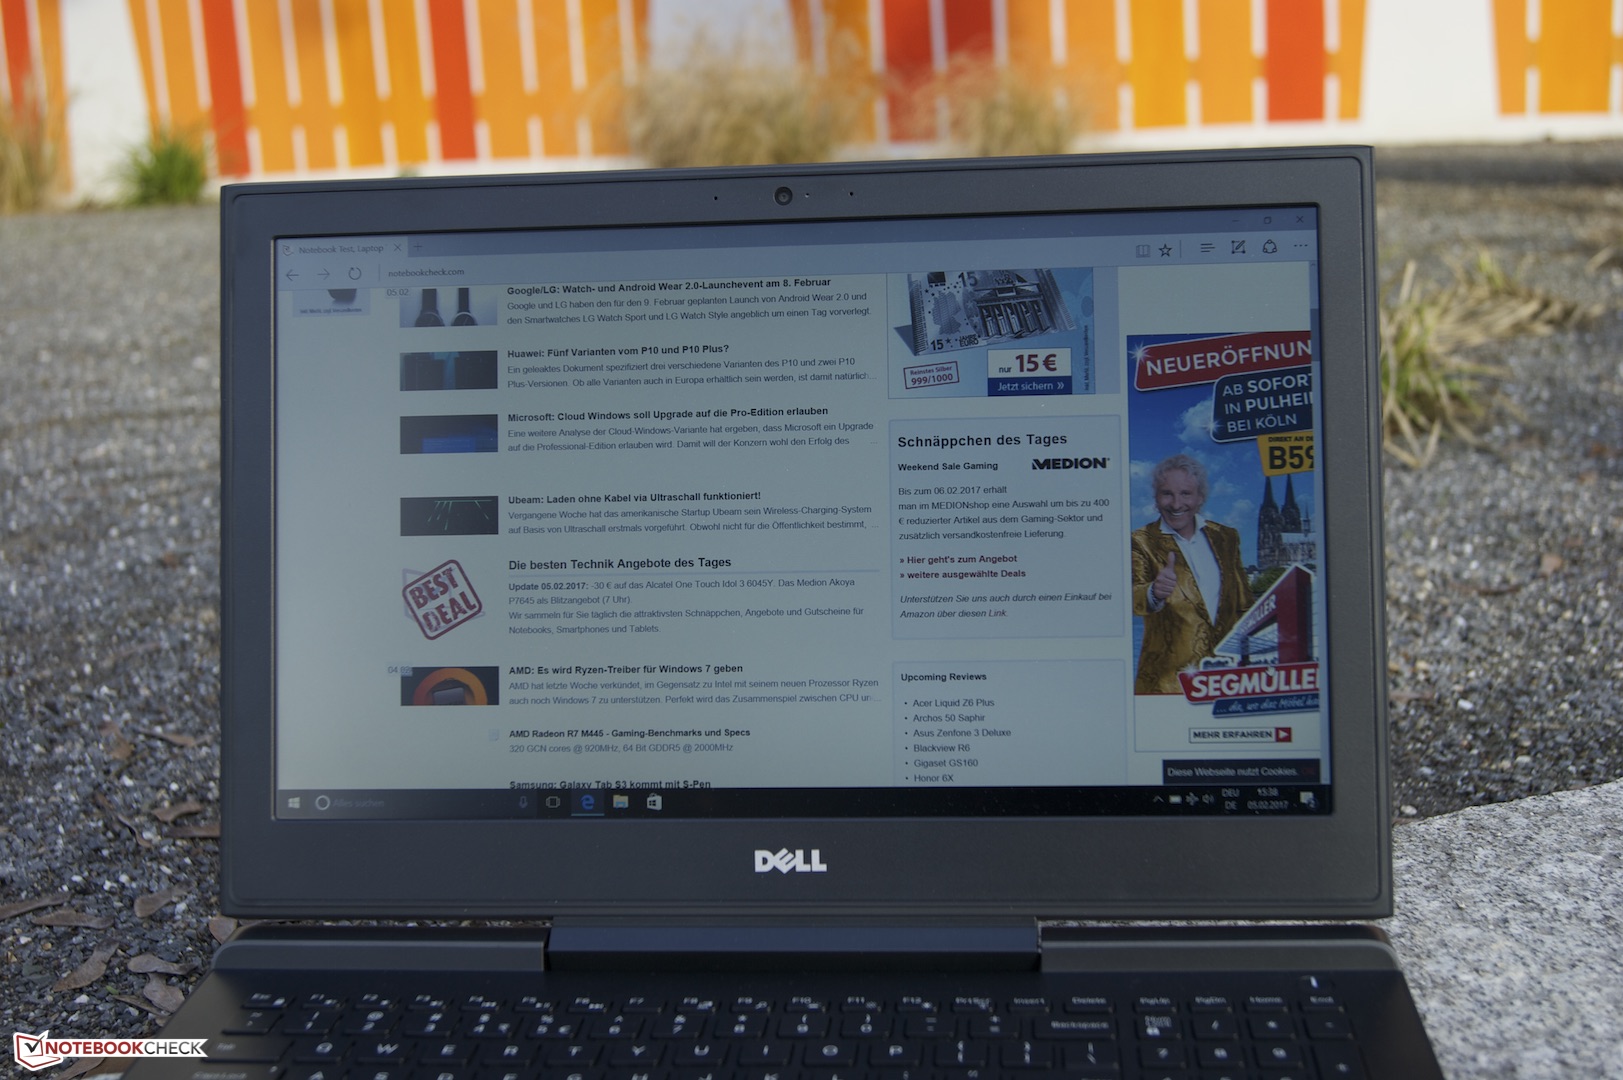
Finally, we want to cover the outdoor capabilities: Thanks to a matte panel, the brightness of 230 cd/m2 is sufficient for using the laptop in the shade.
Display Response Times
| ↔ Response Time Black to White | ||
|---|---|---|
| 36 ms ... rise ↗ and fall ↘ combined | ↗ 19 ms rise | 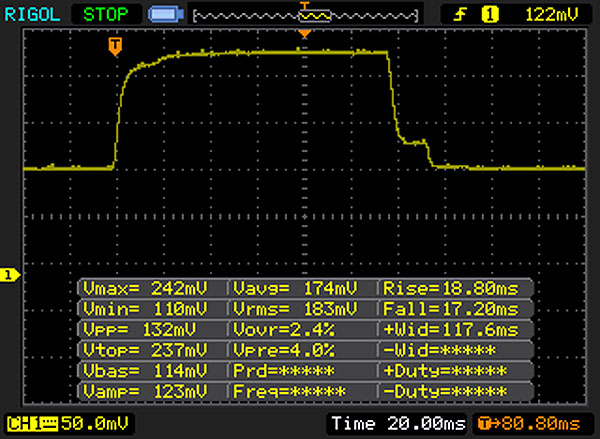 |
| ↘ 17 ms fall | ||
| The screen shows slow response rates in our tests and will be unsatisfactory for gamers. In comparison, all tested devices range from 0.1 (minimum) to 240 (maximum) ms. » 94 % of all devices are better. This means that the measured response time is worse than the average of all tested devices (19.8 ms). | ||
| ↔ Response Time 50% Grey to 80% Grey | ||
| 36 ms ... rise ↗ and fall ↘ combined | ↗ 17 ms rise | 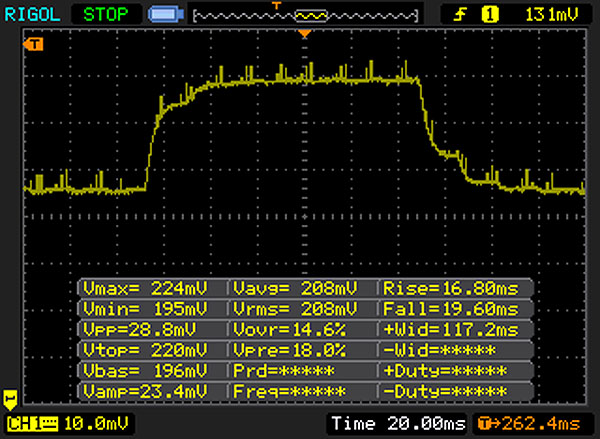 |
| ↘ 19 ms fall | ||
| The screen shows slow response rates in our tests and will be unsatisfactory for gamers. In comparison, all tested devices range from 0.165 (minimum) to 636 (maximum) ms. » 51 % of all devices are better. This means that the measured response time is worse than the average of all tested devices (31 ms). | ||
Screen Flickering / PWM (Pulse-Width Modulation)
| Screen flickering / PWM not detected | ||
In comparison: 52 % of all tested devices do not use PWM to dim the display. If PWM was detected, an average of 7747 (minimum: 5 - maximum: 343500) Hz was measured. | ||
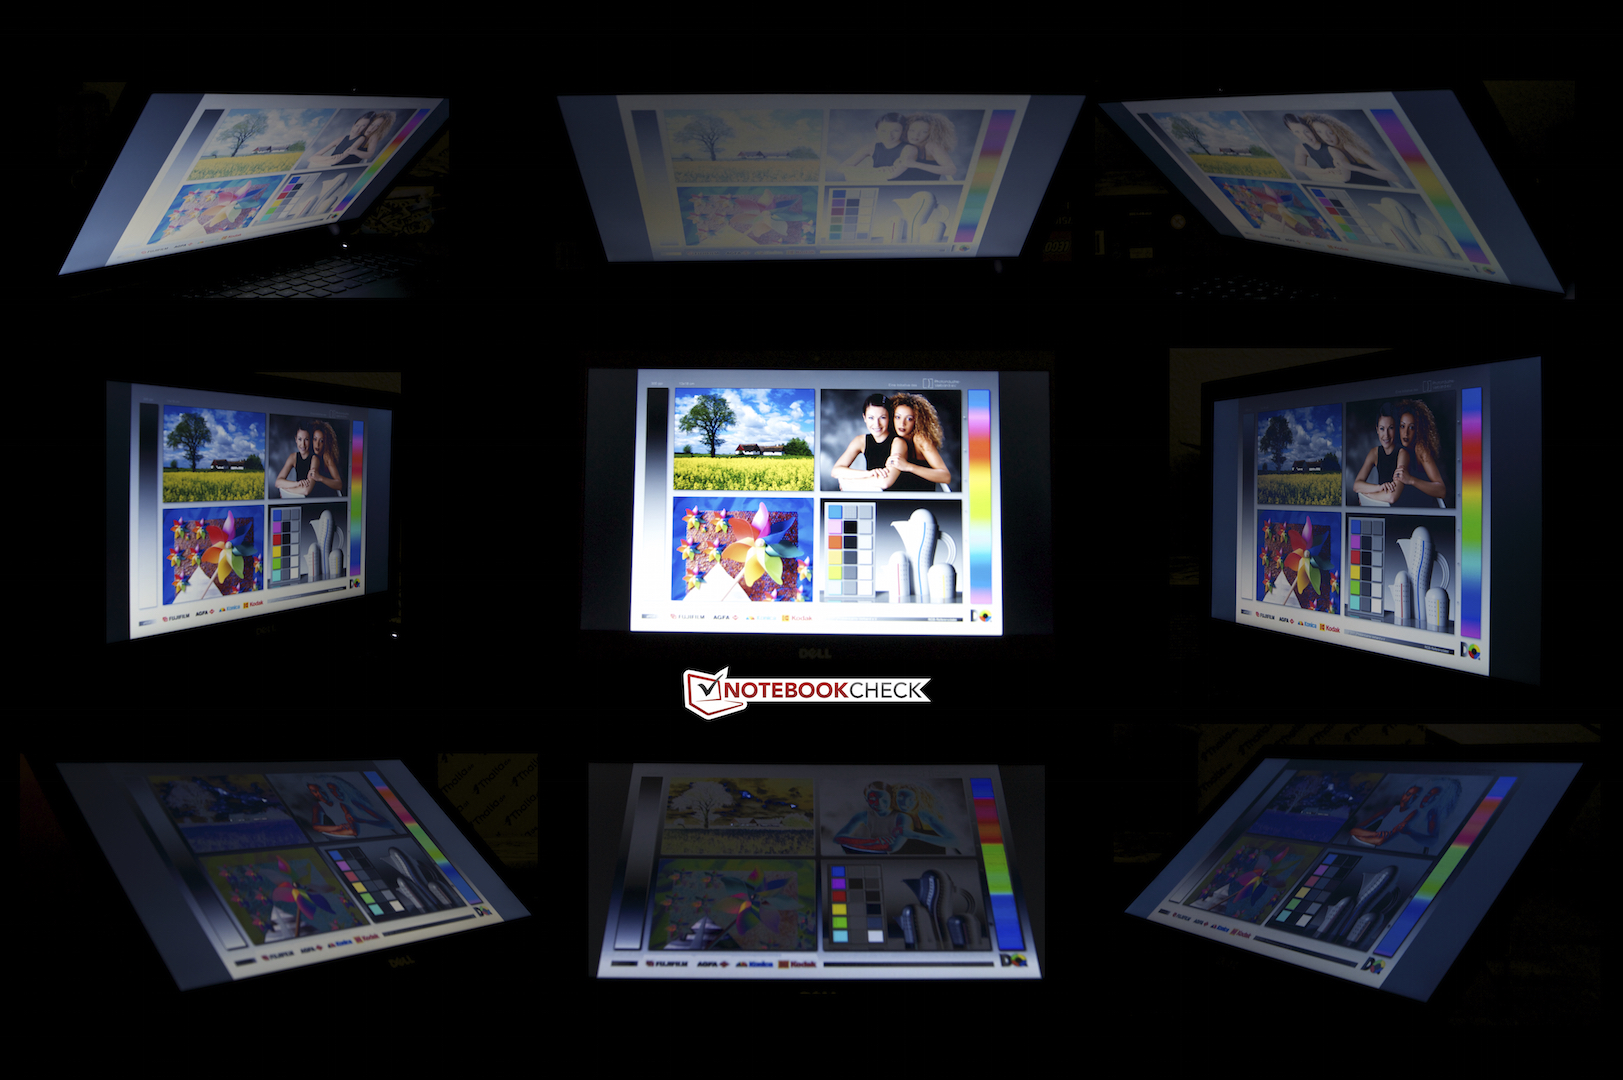
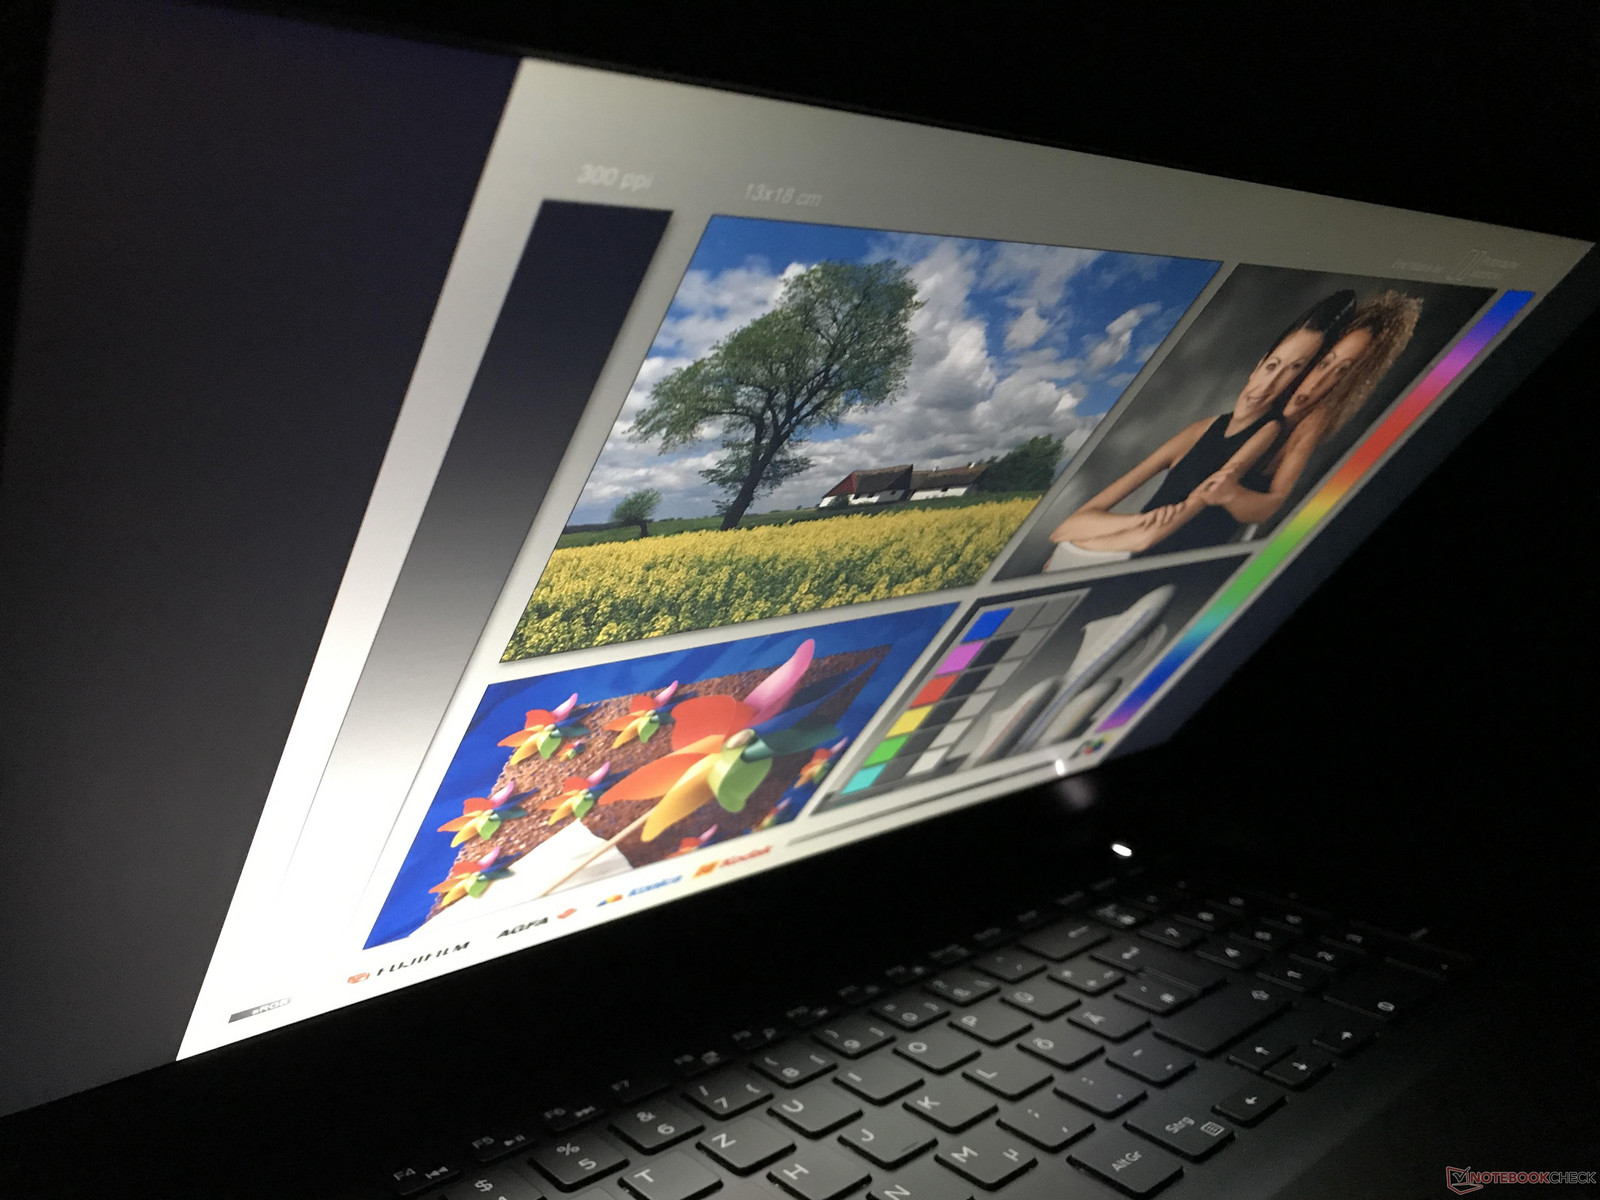
Since the display is a TN-type, colors and brightness change when moving the lid or viewing the display from the side. The test model's panel has very narrow viewing angles.
Update: Full-HD IPS-Display
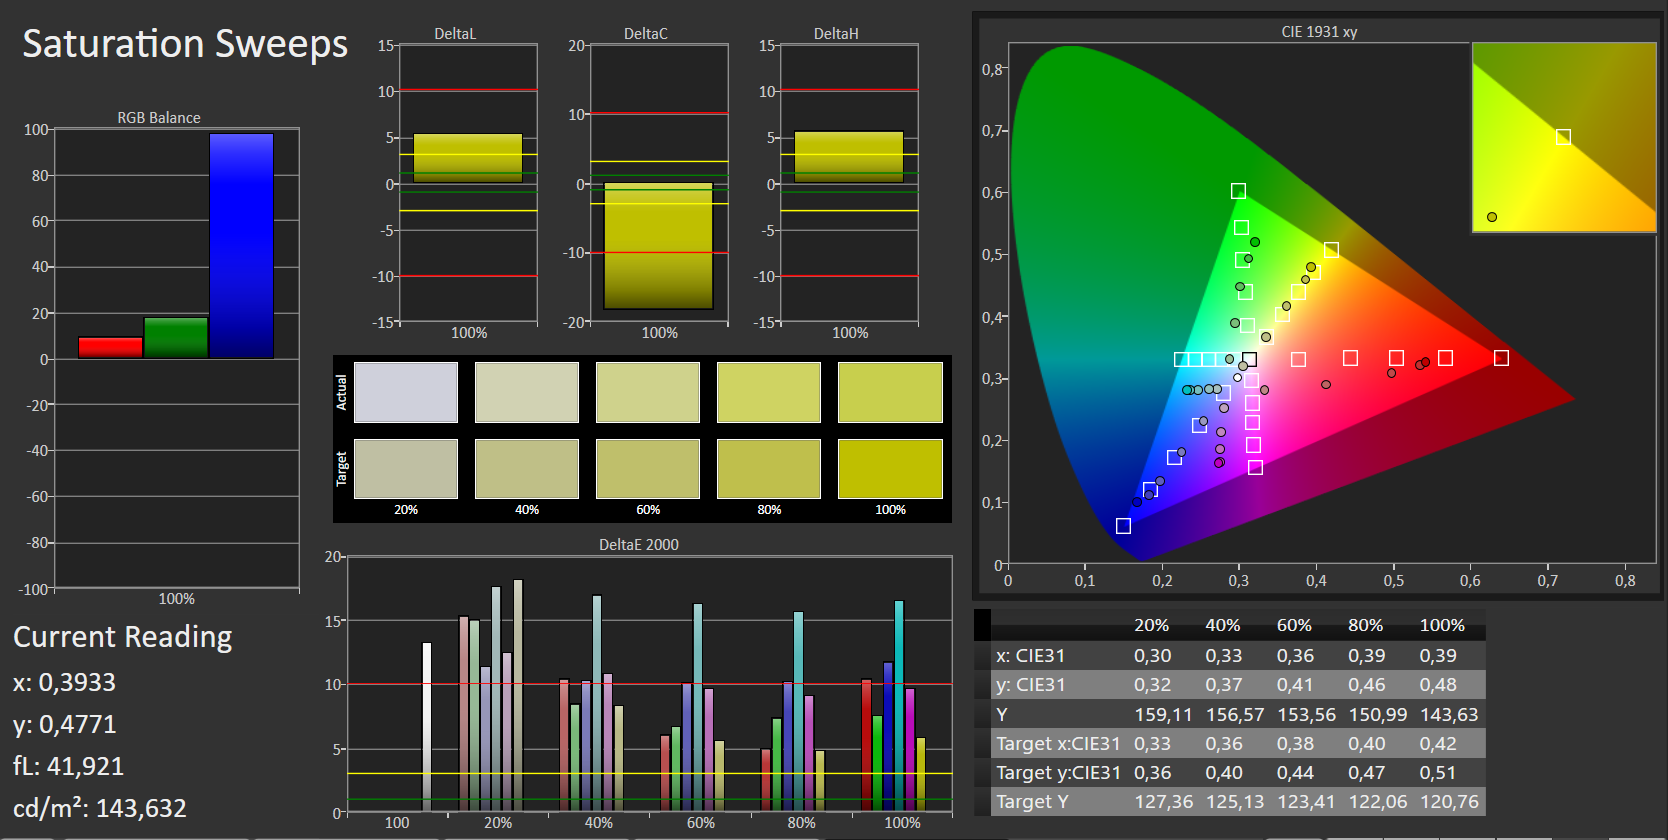
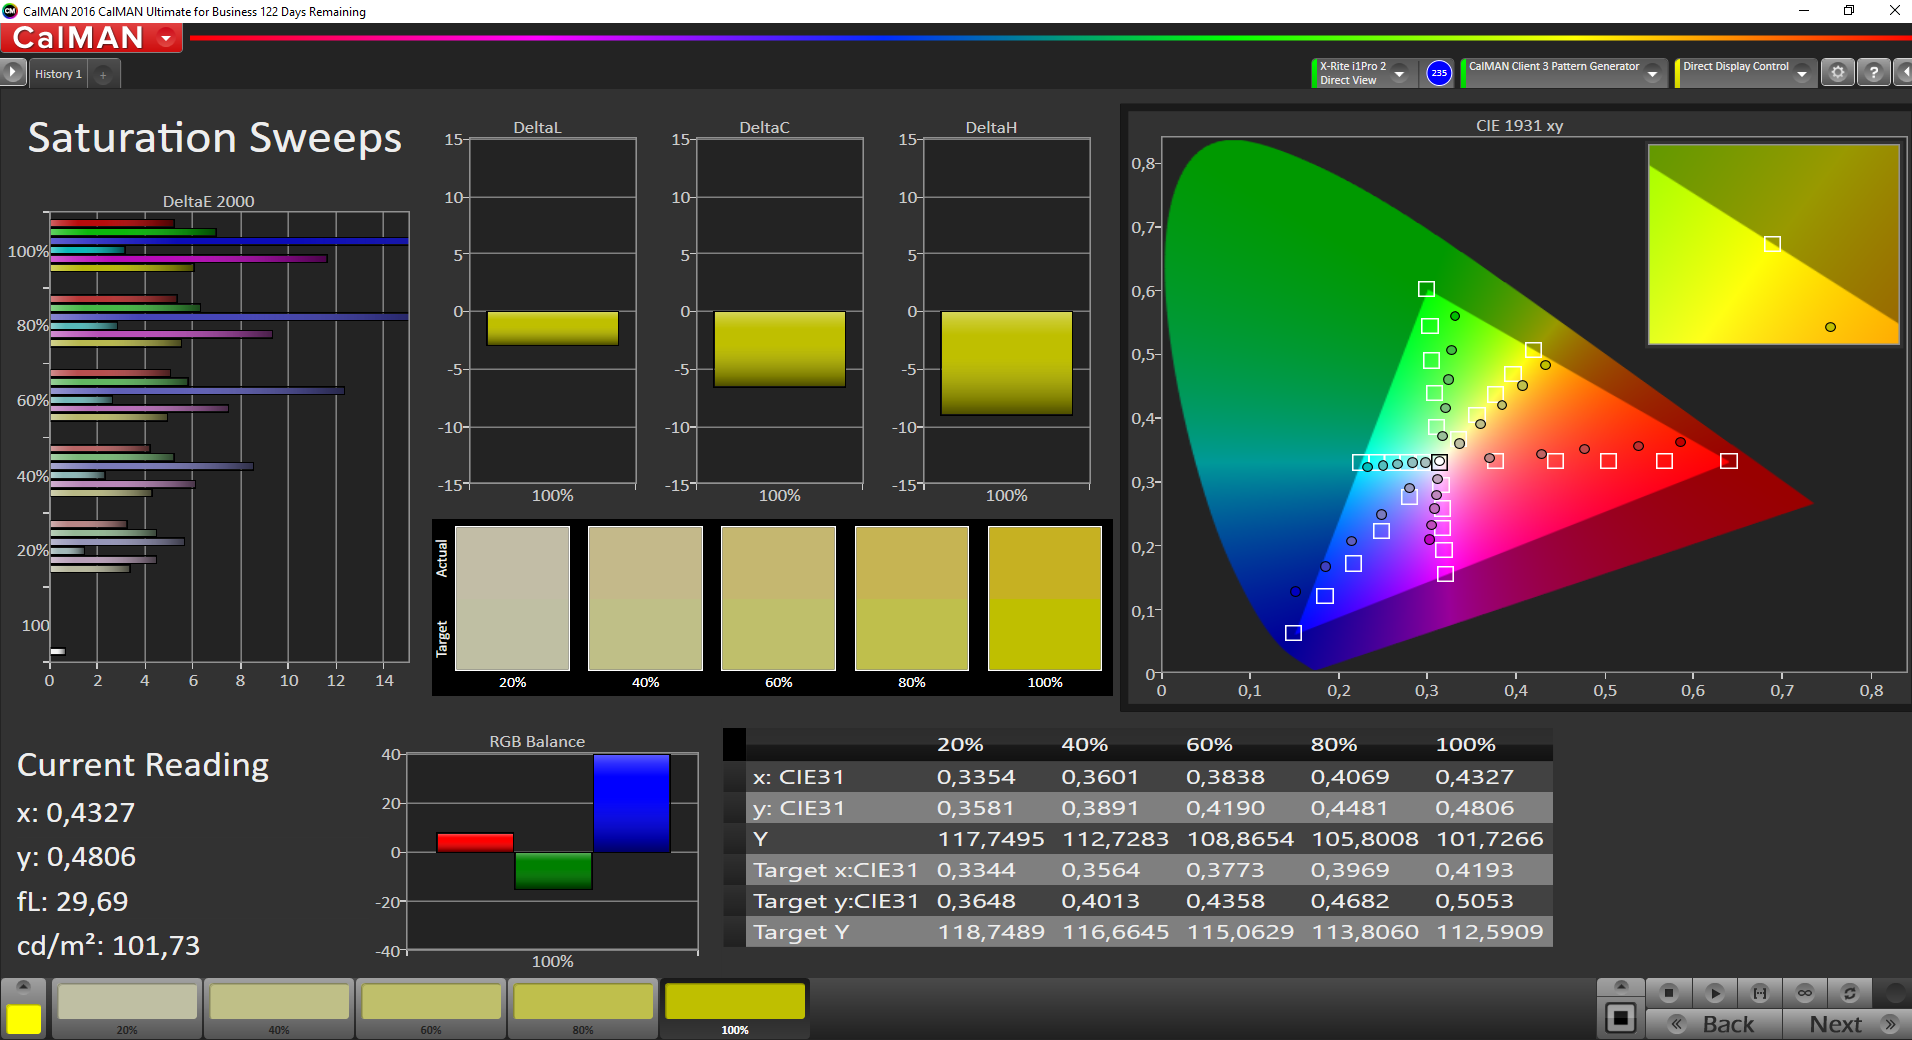
We had the chance to test the Inspiron 15 7000 with Full HD IPS display. It stems from LG Philips and is called LGD053F (156WF6). Subjectively, the image quality appears to be alright. Backlight bleeding is notable along the edges however. This is in particular slightly disturbing when dark content is displayed. Similar to MSI, Dell installs the TrueColor software and activates the "Vibrant" mode by default. We performed the display measurements in three different modes (TrueColor Vibrant, TrueColor Natural, and TrueColor deactivated). We definitely recommend deactivating or uninstalling the software.
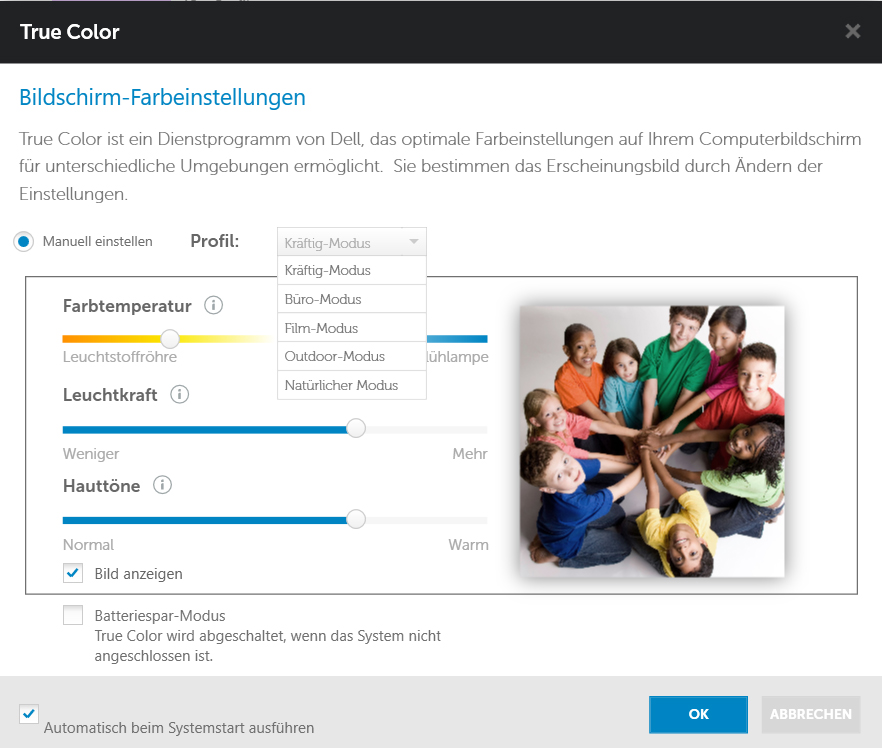
Both TrueColor modes show a significant yellow tint and are much too warm. In addition, brightness falls significantly (40-50 cd/m²) and colors get worse. We added the screenshots of our measurements below. With deactivated software, we recorded a maximum brightness of 272 cd/m² (average: 251 cd/m²). Therewith, the IPS panel performs only slightly better than the TN model. Lower black value and, so, higher contrast of almost 1200:1 are advantages. As a result, images appear much more vivid on the IPS panel. We could not detect PWM.
| |||||||||||||||||||||||||
Brightness Distribution: 85 %
Center on Battery: 269 cd/m²
Contrast: 1183:1 (Black: 0.23 cd/m²)
ΔE ColorChecker Calman: 6.7 | ∀{0.5-29.43 Ø4.72}
ΔE Greyscale Calman: 6.8 | ∀{0.09-98 Ø4.97}
61.4% sRGB (Argyll 1.6.3 3D)
39.5% AdobeRGB 1998 (Argyll 1.6.3 3D)
Gamma: 2.18
CCT: 6476 K
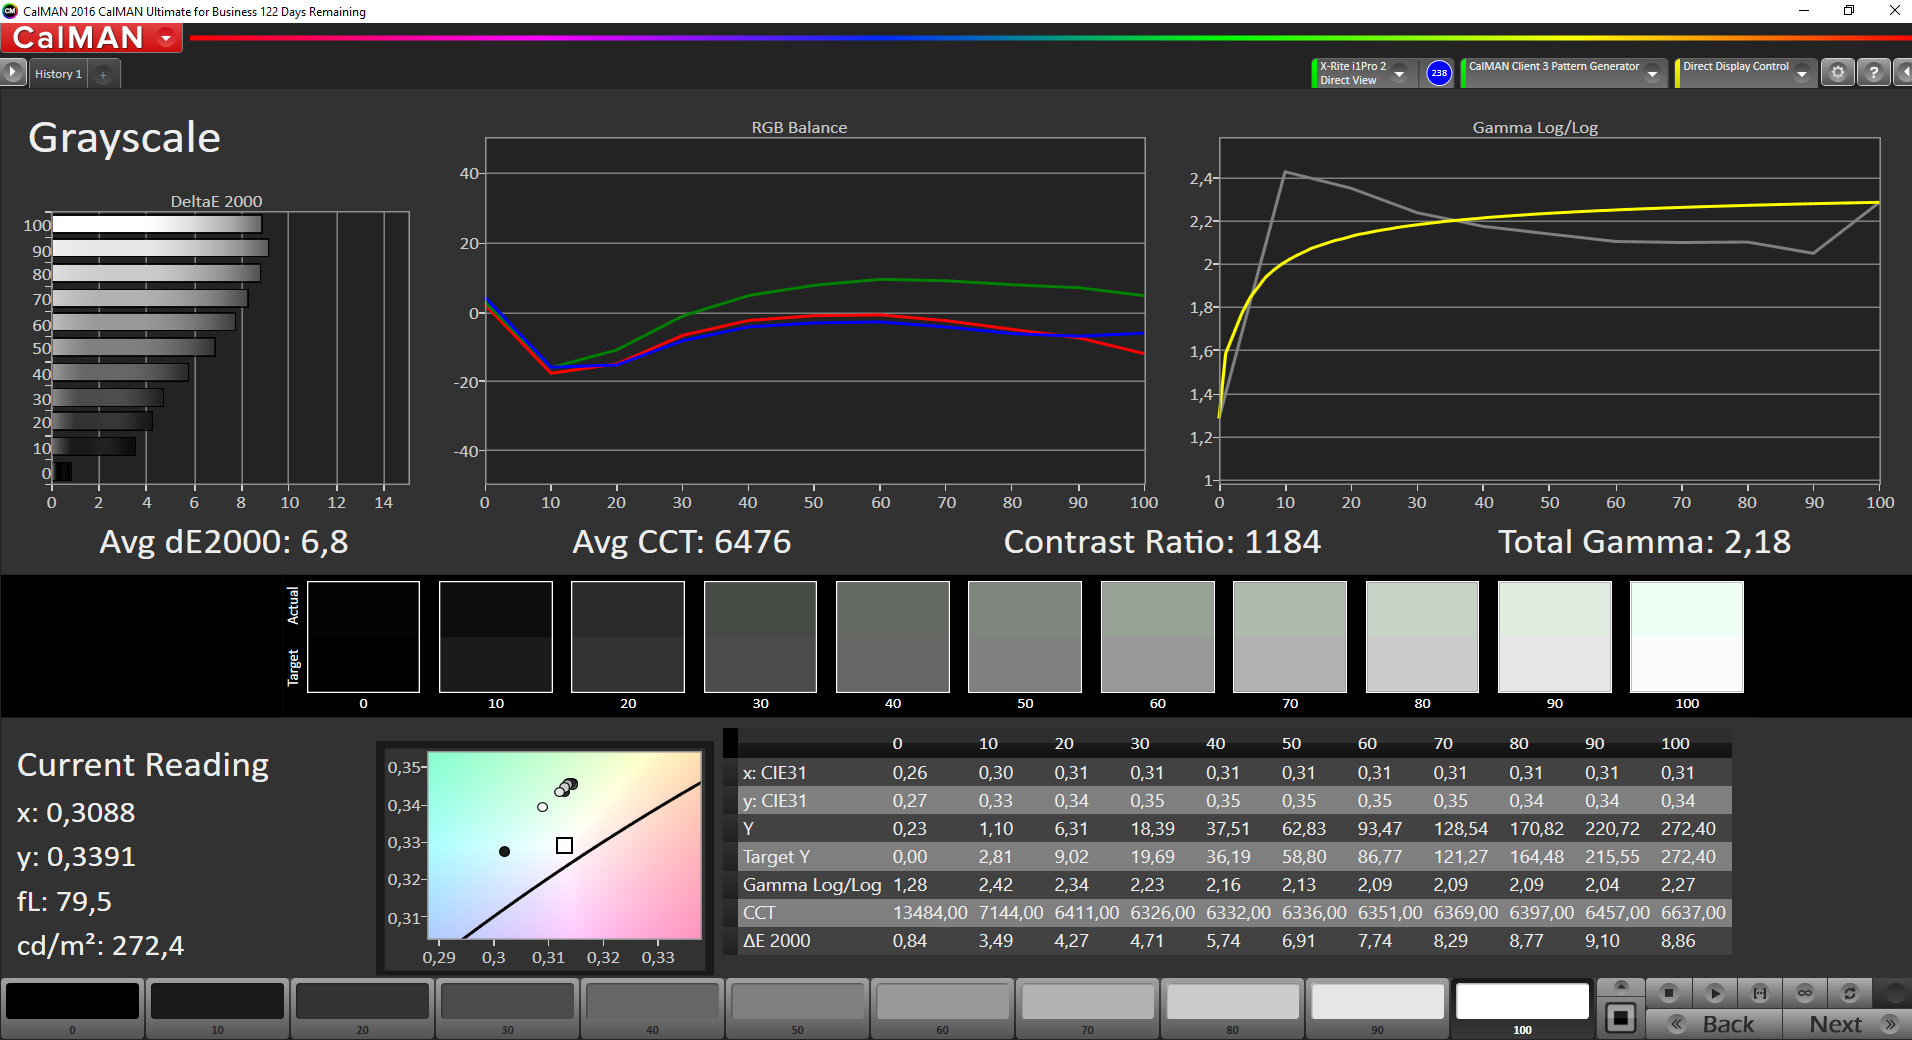
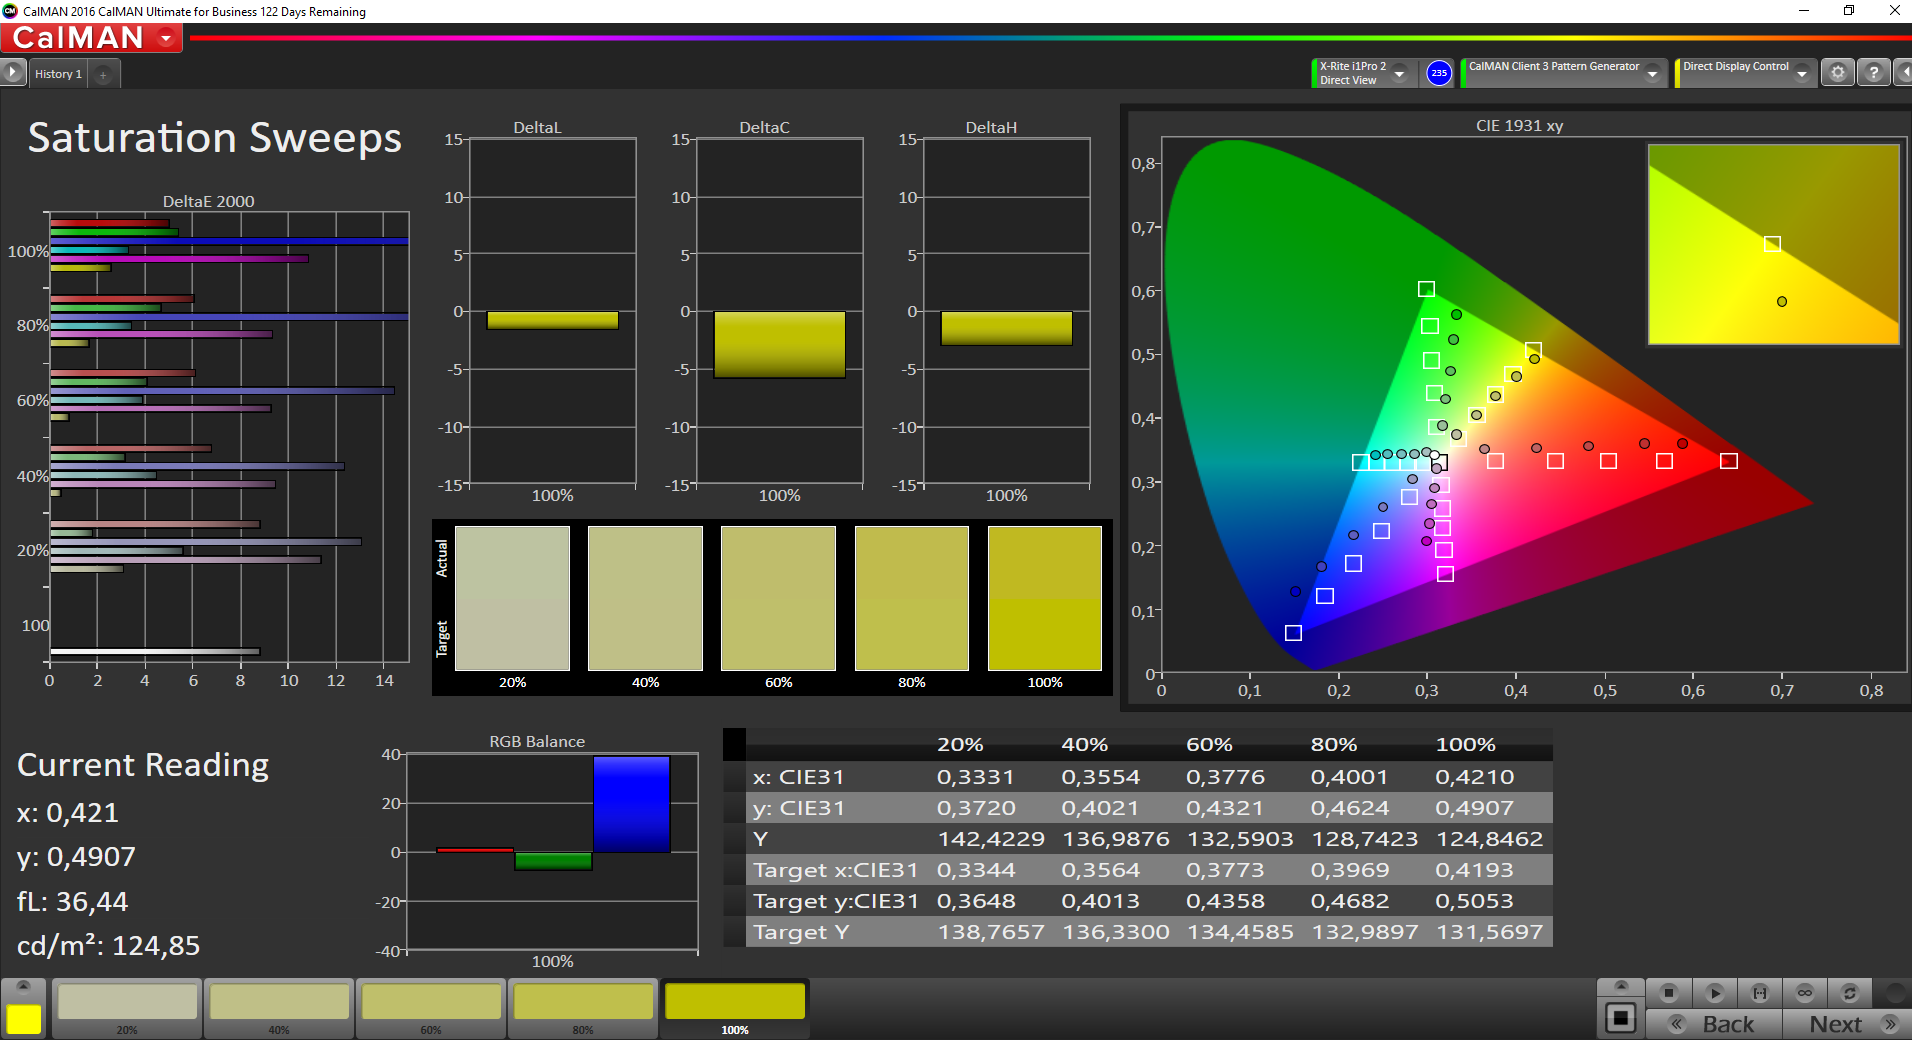


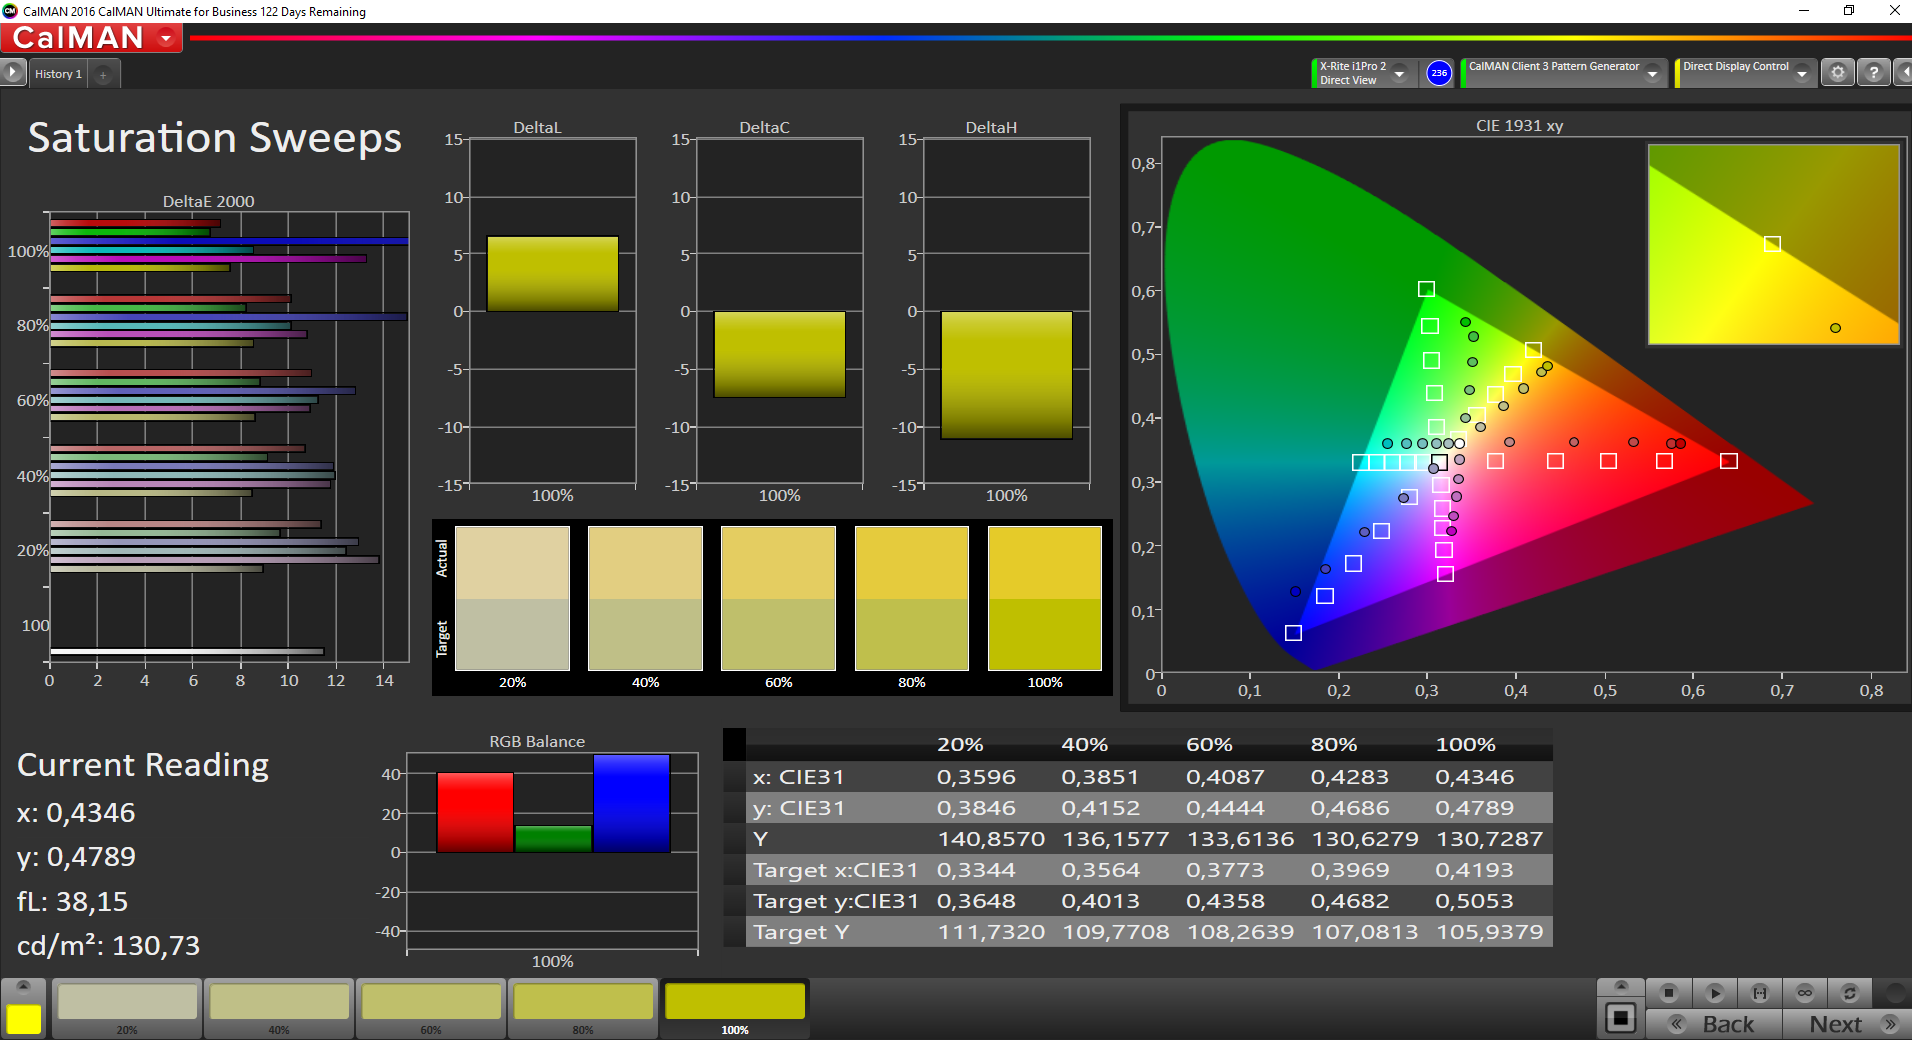


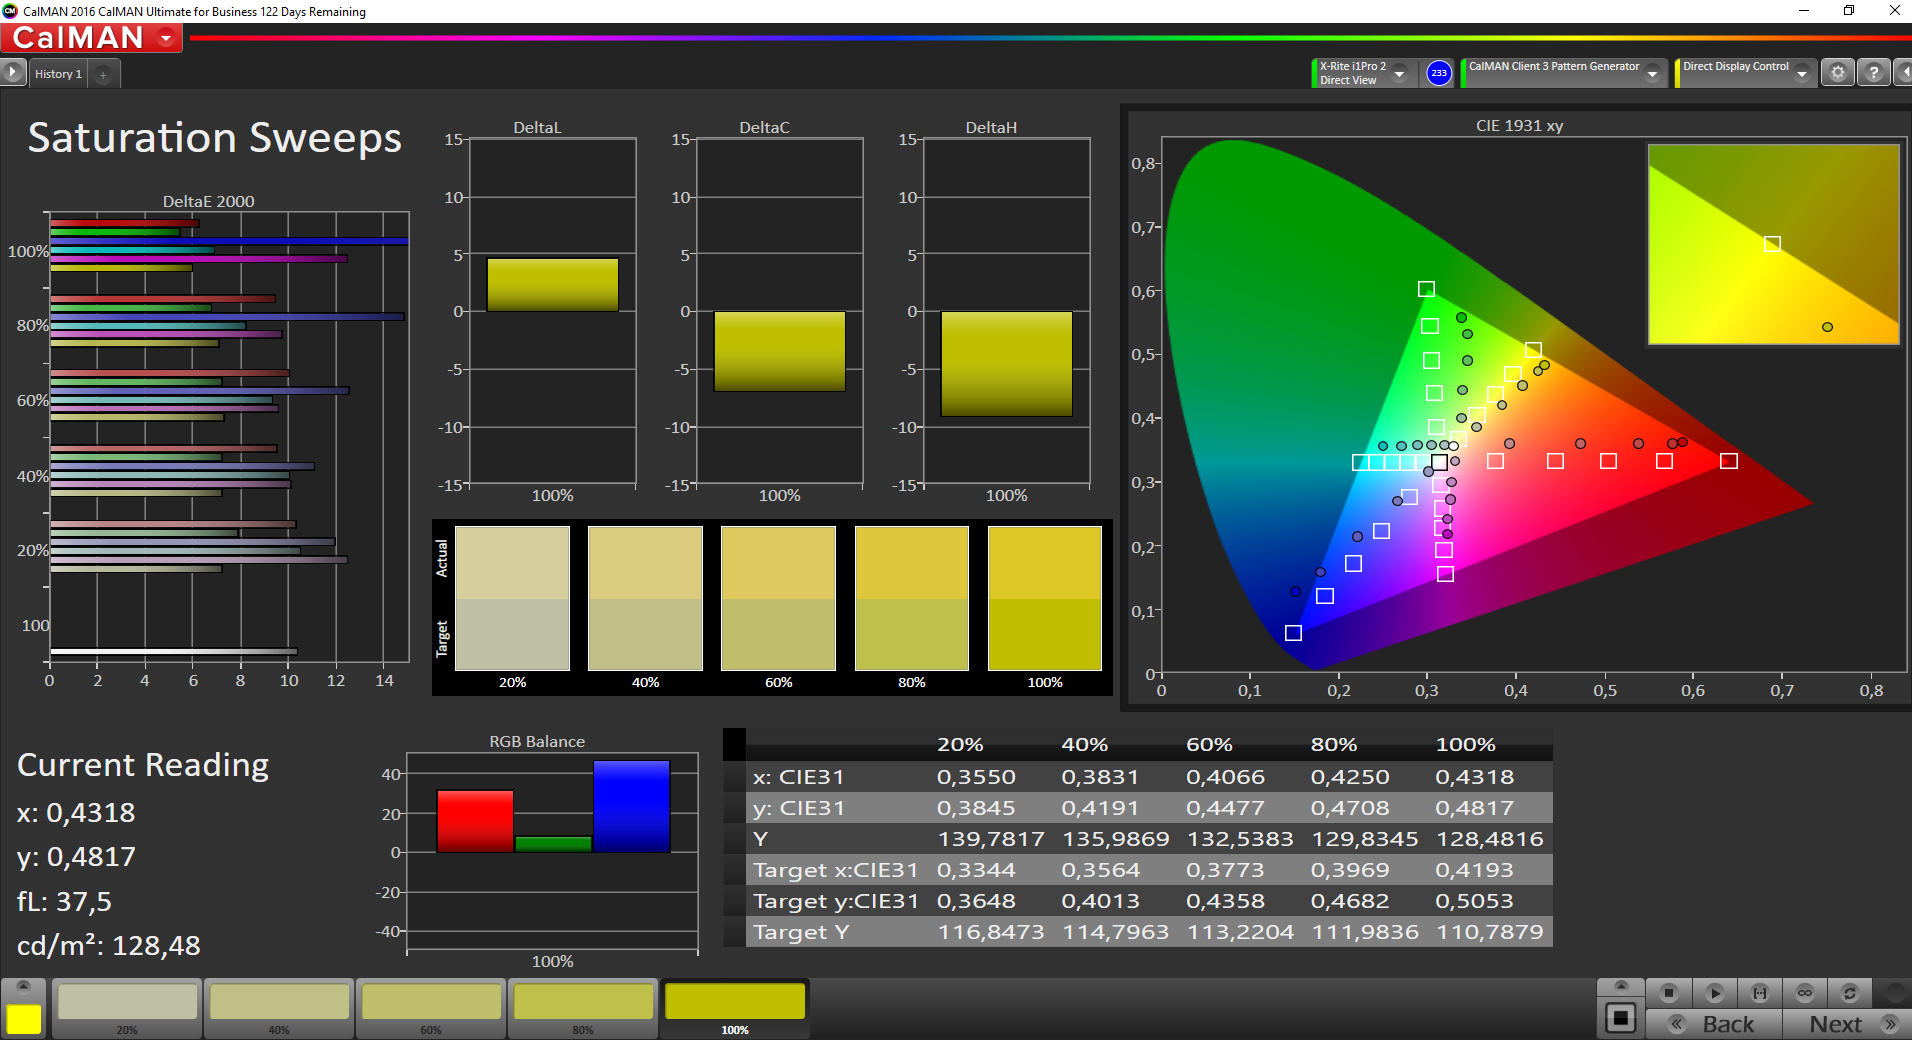

In factory state, the measurements show that the color temperature is better than the TN panel's. Nevertheless, this is not a high-end IPS display. Grayscales are slightly greenish, which is hardly notable in everyday use however. The screenshots of the two TrueColor modes show heavy deviations and much too warm colors however, which conforms to our subjective impressions.
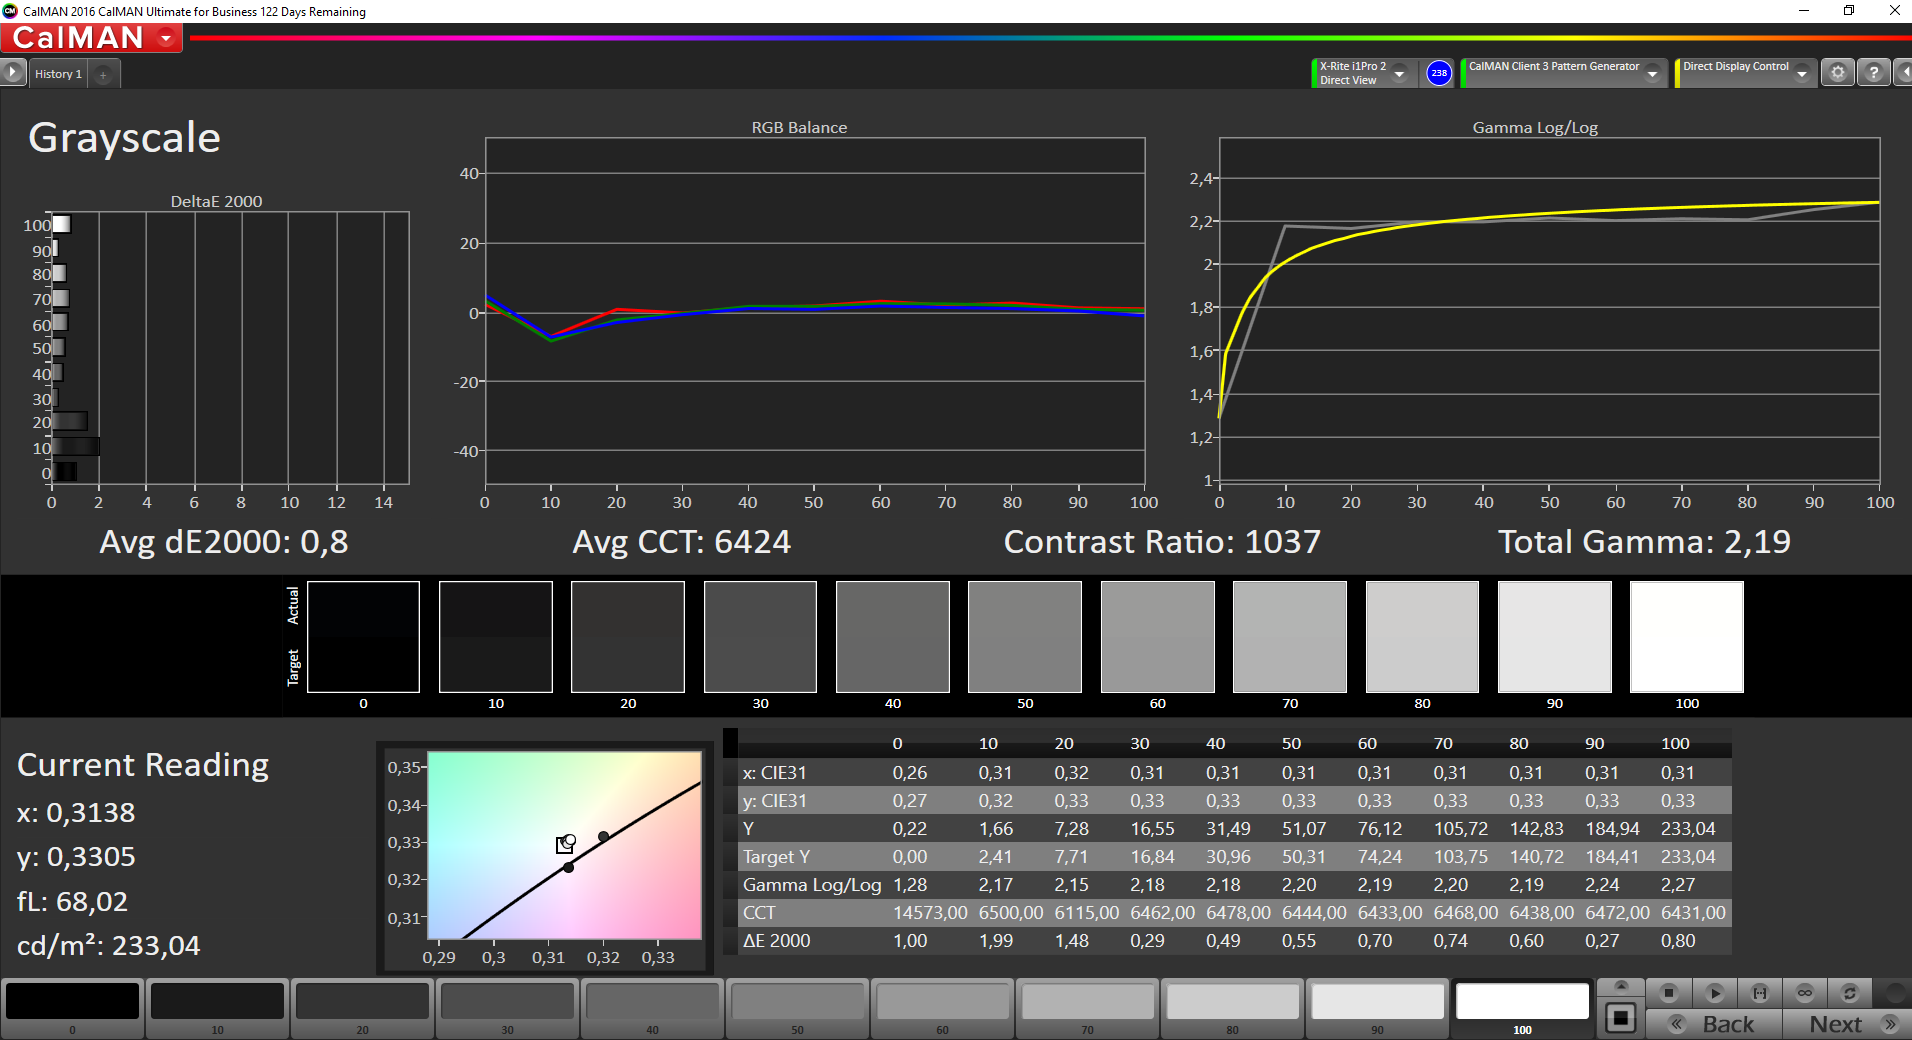
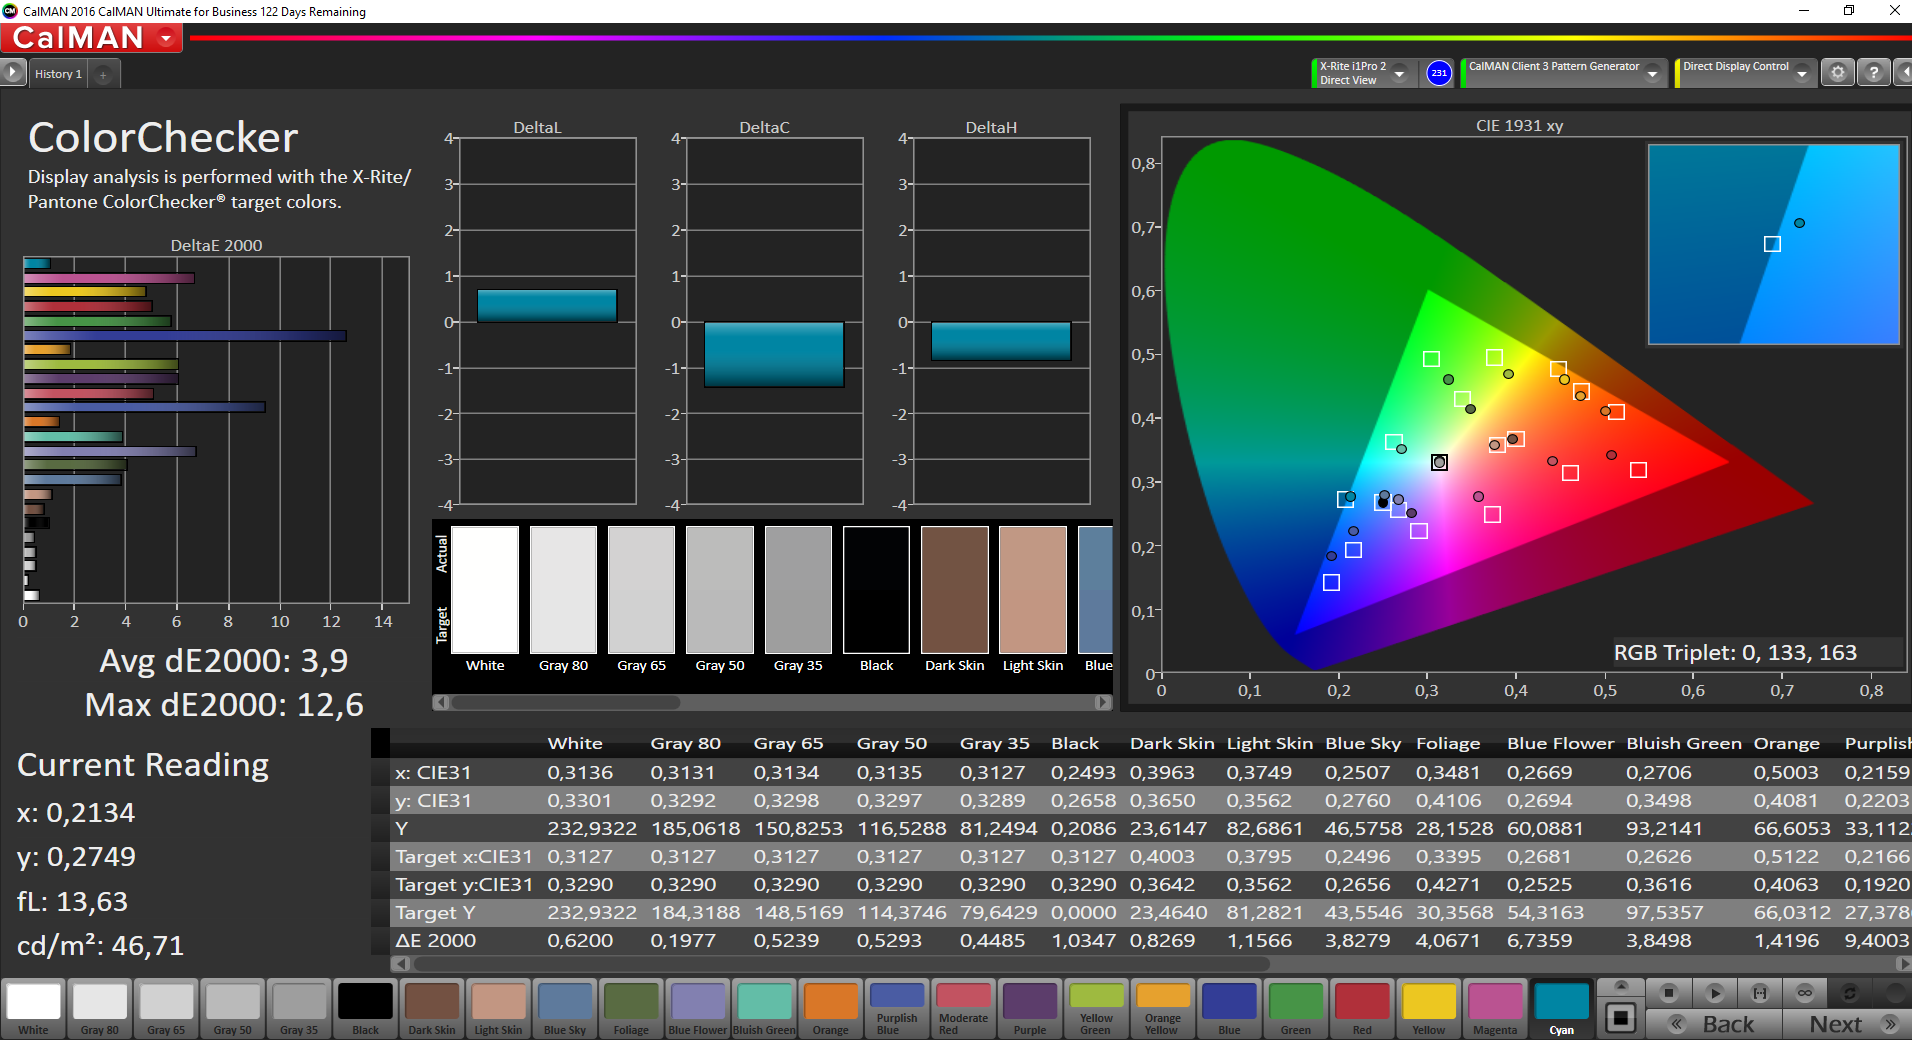
In particular grayscales profit from our calibration (icc-profile is linked in the box above). Moreover, the slight color tint disappeared. The high color deviations persist however.
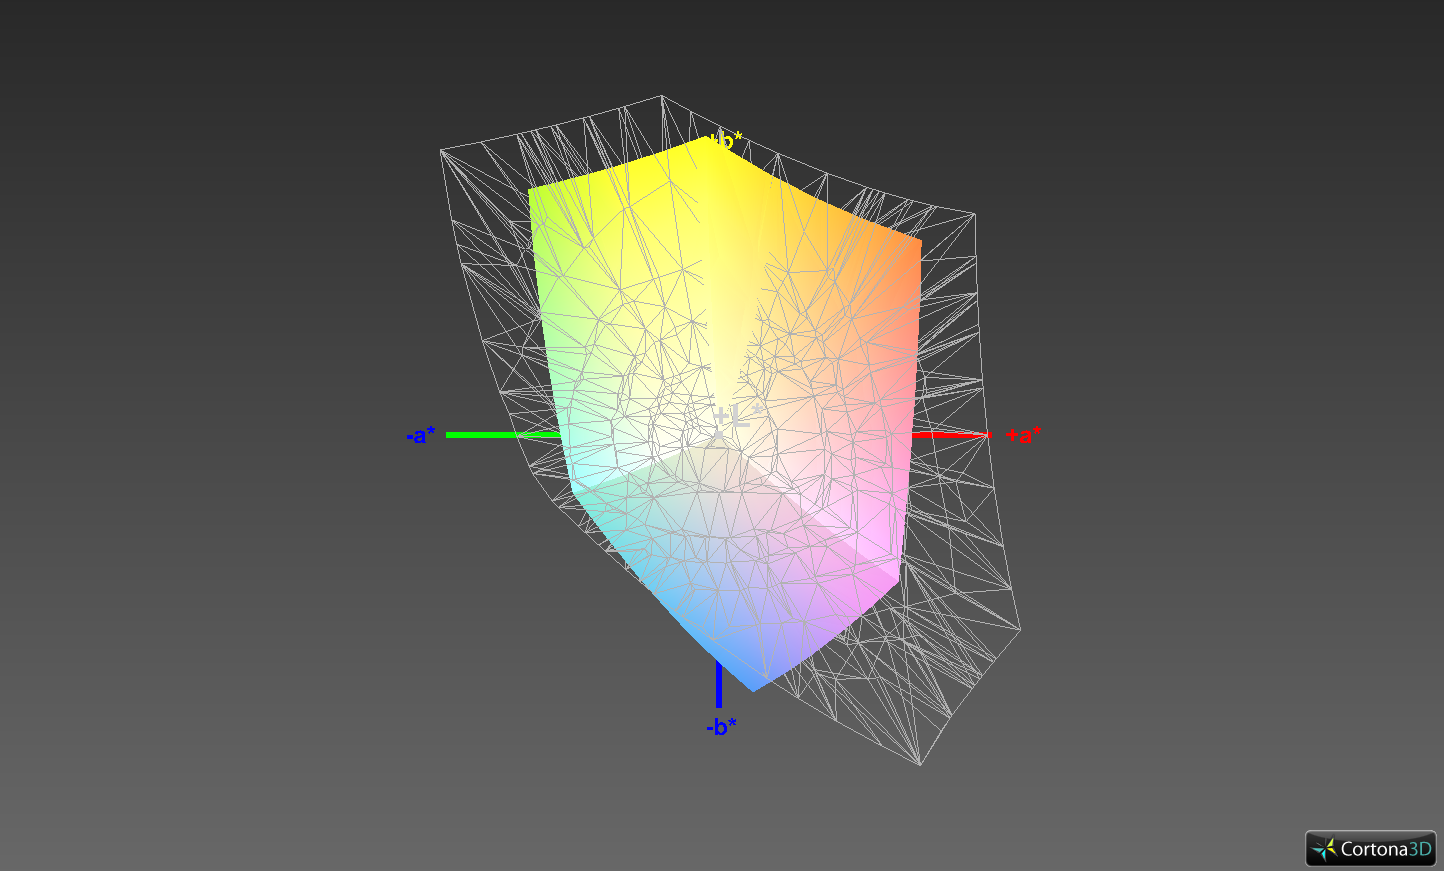
The color coverage also shows that it is a cheap IPS panel. This does not pose a big problem when playing games. However, you won't be happy with the Inspiron 15 7000 if you occasionally edit photos and videos.
Certainly, wider viewing angles are another big advantage of the IPS panel in comparison to the IPS panel. We have also seen better models in this respect, but it still performs significantly better than the TN model. You can move in front of the display much more freely without facing significant contrast loss or color inversions.
The IPS panel also performs slightly better in respect of response times.
Display Response Times
| ↔ Response Time Black to White | ||
|---|---|---|
| 28 ms ... rise ↗ and fall ↘ combined | ↗ 16.4 ms rise | 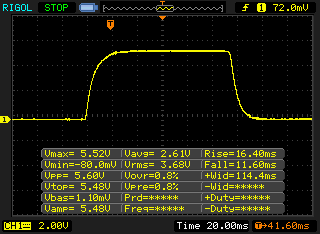 |
| ↘ 11.6 ms fall | ||
| The screen shows relatively slow response rates in our tests and may be too slow for gamers. In comparison, all tested devices range from 0.1 (minimum) to 240 (maximum) ms. » 71 % of all devices are better. This means that the measured response time is worse than the average of all tested devices (19.8 ms). | ||
| ↔ Response Time 50% Grey to 80% Grey | ||
| 37.6 ms ... rise ↗ and fall ↘ combined | ↗ 21.2 ms rise | 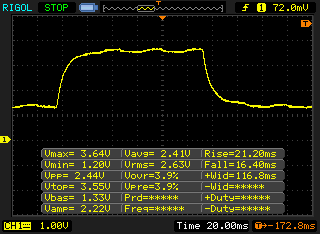 |
| ↘ 16.4 ms fall | ||
| The screen shows slow response rates in our tests and will be unsatisfactory for gamers. In comparison, all tested devices range from 0.165 (minimum) to 636 (maximum) ms. » 55 % of all devices are better. This means that the measured response time is worse than the average of all tested devices (31 ms). | ||
Screen Flickering / PWM (Pulse-Width Modulation)
| Screen flickering / PWM not detected |  | ||
In comparison: 52 % of all tested devices do not use PWM to dim the display. If PWM was detected, an average of 7747 (minimum: 5 - maximum: 343500) Hz was measured. | |||
Performance

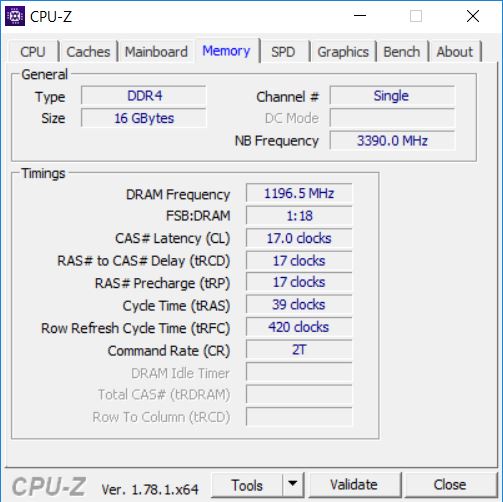
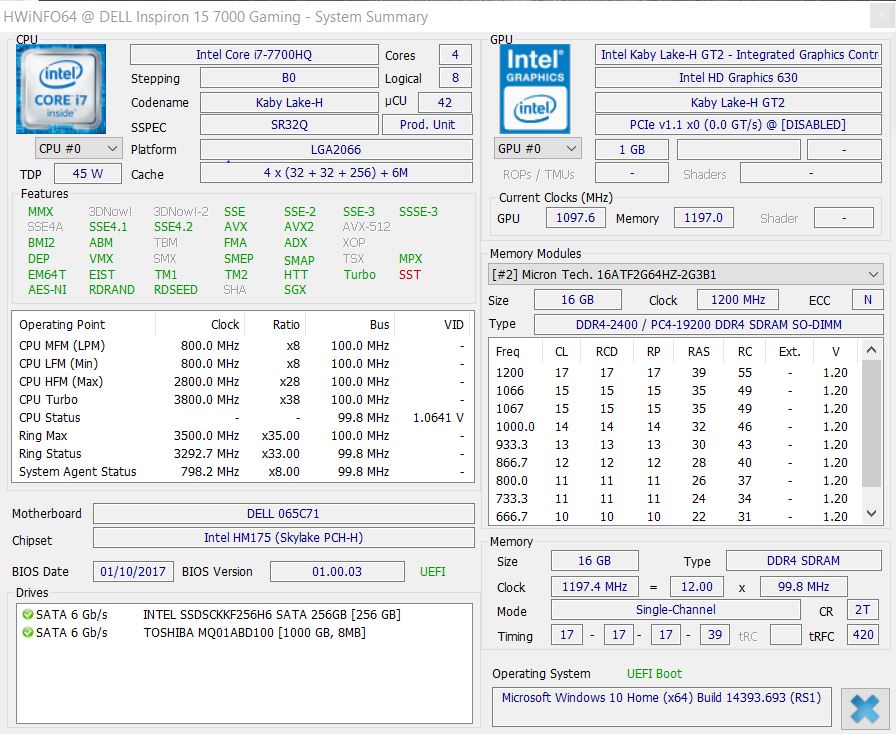
Already the name of the new Dell series suggests for which field of application it has been designed: Inspiron 15 7000 Gaming. In order to be fit for the gaming world, a cutting-edge Intel Core i7 processor and an Nvidia GeForce GTX 1050 Ti work inside. Unfortunately, the RAM with a capacity of 16 GB only works in single-channel mode. However, it is possible to change this by adding a module to the free RAM slot. Dell has incorporated two storage devices so that there is enough space for installing many games: First of all, there is a 1 TB HDD. There is also a responsive 256 GB SSD. Currently, Dell's US shop lists this model for $1100. The models available in Germany are listed in the introduction of this article.
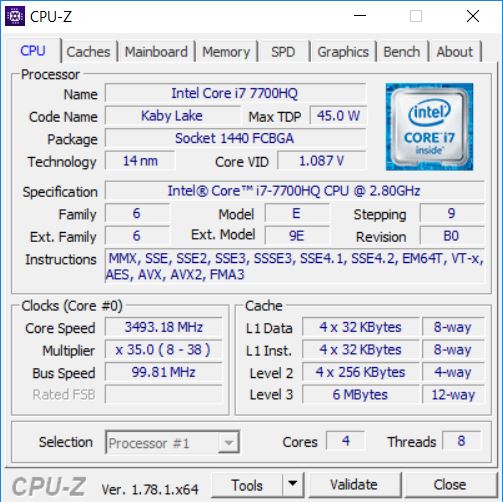

Processor
The core of our Inspiron test model is an Intel Core i7-7700HQ. The CPU features a base clock of 2.8 GHz and achieves a maximum Turbo clock of up to 3.8 GHz. Intel specifies a TDP of 45 W. We analyze the performance with Cinebench R15. In the multi-core test, the processor works at 3.4 GHz and achieves 724 points. The Acer Aspire VX5 performs significantly worse with 677 points. Once again, the Asus Strix GL502VM takes the lead with 743 points.
The CPU even clocks at 3.4 GHz after several runs. The Cinebench R15 result even remains at the same level on battery. Those who buy the i5 variant of the new Dell Inspiron 7000 series can expect a 30% lower performance.
Please refer to our benchmark list of current notebook processors for further comparisons and benchmarks to various mobile processors.
System Performance
The Inspiron 7567 meets the expectations on a gaming notebook: It is responsive. Thanks to powerful hardware and a fast SSD, software opens quickly and runs smoothly. We use PCMark 8 to confirm our subjective impression. Our test model performs about 1200 points (31%) better than the predecessor in the PCMark 8 Work benchmark. The Asus Strix GL502VM performs 8% better.
In the Home benchmark, our test model achieves 3850 points. That is about 150 points more than the similarly equipped Acer Aspire VX5. The predecessor reviewed by us only accomplished 2907 points.
| PCMark 8 Home Score Accelerated v2 | 3850 points | |
| PCMark 8 Work Score Accelerated v2 | 5068 points | |
Help | ||
Storage Device
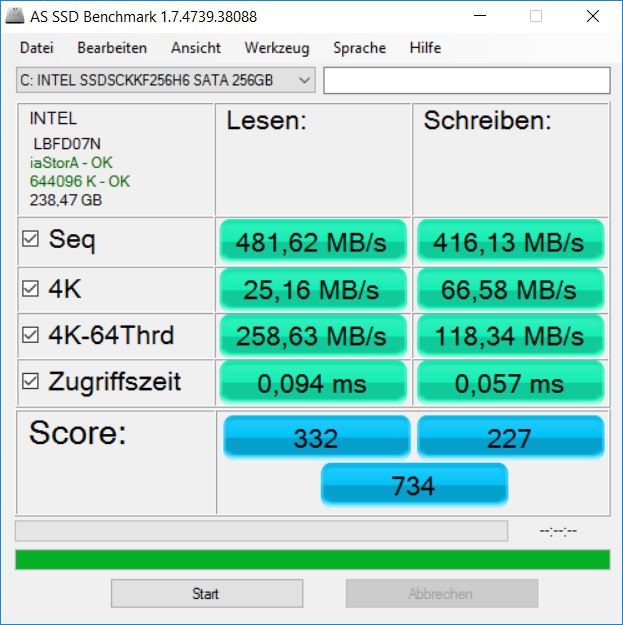
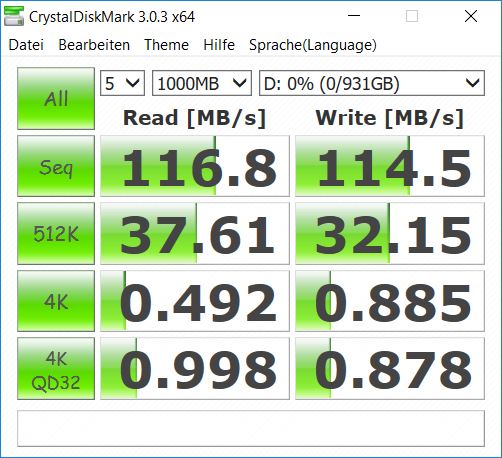
The Inspiron 7000 Gaming comes with two storage devices. The primary drive is an M.2 SSD with a capacity of 256 GB. It achieves decent read rates of 486 MB/s and write rates of 423 MB/s. The secondary drive is a 1 TB HDD operating at 5400 RPM. Transfer rates of about 115 MB/s can be expected from it.
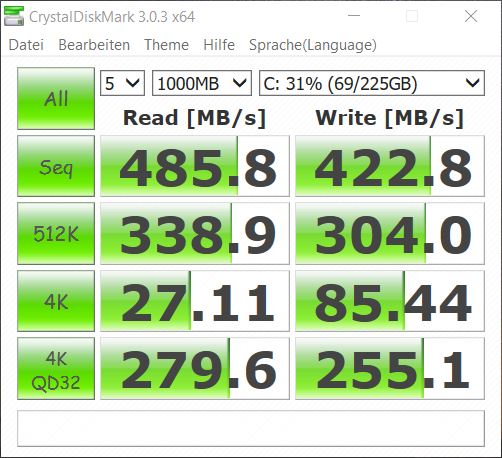
| Dell Inspiron 15 7000 7567 Intel SSDSCKKF256H6 | MSI GE72 7RE-046 Toshiba HG6 THNSNJ256G8NY | Dell Inspiron 15 7559 SK hynix SC300 M.2 | Asus Strix GL502VM-DS74 Samsung SSD 960 Evo 250GB m.2 NVMe | Acer Aspire VX5-591G-D0DD SK Hynix Canvas SC300 512GB M.2 (HFS512G39MND) | |
|---|---|---|---|---|---|
| CrystalDiskMark 3.0 | 19% | -11% | 171% | 3% | |
| Read Seq (MB/s) | 485.8 | 540 11% | 489.9 1% | 1747 260% | 494.2 2% |
| Write Seq (MB/s) | 422.8 | 495.7 17% | 205.1 -51% | 1477 249% | 449.6 6% |
| Read 512 (MB/s) | 338.9 | 455.1 34% | 354.3 5% | 863 155% | 348.1 3% |
| Write 512 (MB/s) | 304 | 481.4 58% | 211.5 -30% | 1115 267% | 418.2 38% |
| Read 4k (MB/s) | 27.11 | 22.7 -16% | 27.84 3% | 56.8 110% | 16.97 -37% |
| Write 4k (MB/s) | 85.4 | 112.9 32% | 68 -20% | 152.4 78% | 38.36 -55% |
| Read 4k QD32 (MB/s) | 279.6 | 372.5 33% | 348.2 25% | 652 133% | 394.9 41% |
| Write 4k QD32 (MB/s) | 255.1 | 212.9 -17% | 198.4 -22% | 542 112% | 317.4 24% |

Graphics Card
Gaming can first be fully enjoyed with a powerful dedicated graphics card. Dell uses an Nvidia GeForce GTX 1050 Ti in our test model. It belongs to the Nvidia Pascal architecture and has been available since early 2017. With a core clock of 1393 - 1620 MHz and 4 GB of GDDR5 VRAM, it is ready for the latest games. The performance is about on par with an Nvidia GeForce GTX 970M. According to Nvidia the targeted maximum power consumption is 70 W (Nvidia GeForce GTX 970: about 81 W). The cheapest model of the new Inspiron series does not use the Ti variant. This results in a significant performance difference.
We want to compare these two graphics units in order to show how big the difference actually is. For this purpose we use 3DMark 11. With almost 9700 points (GPU score), our test model exceeds the average result of an Nvidia GeForce GTX 1050 by as much as 1900 points. Currently, the cheapest variant of the new Inspiron costs about 150 Euros (~$159) less than the Ti variant. Hence, those who can afford it can profit from 25% higher GPU performance and a more powerful CPU. A comparison to the Nvidia GeForce GTX 1060 can also be interesting: Therefore, we have added the Asus Strix GL502VM to this comparison. The more powerful GTX 1060 performs almost 60% better.
Those who occasionally use the gaming notebook on battery have to accept a small performance loss. 3DMark reports 7638 points in this scenario.
Further benchmarks to various graphics cards are available in our article about current notebook graphics cards.
| 3DMark 11 Performance | 8992 points | |
| 3DMark Cloud Gate Standard Score | 21998 points | |
| 3DMark Fire Strike Score | 6709 points | |
Help | ||
Gaming Performance
The Nvidia GeForce GTX 1050 Ti allows smoothly running all current games with high or very high settings. Those who want to maximize the settings or expect at least 60 fps need a more powerful graphics card such as the Nvidia GeForce GTX 1060. Due to the performance difference between the Nvidia GeForce GTX 1050 in the cheapest Inspiron model and the GeForce GTX 1050 Ti, the latter can accomplish a few decisive frames per second more; especially at high settings. Those who do not need more than 30 fps for smooth gaming will be content with the GTX 1050.
Further gaming benchmarks of various graphics cards are available in our article Computer Games on Laptop Graphics Cards.
| Rise of the Tomb Raider | |
| 1920x1080 High Preset AA:FX AF:4x | |
| Asus Strix GL502VT-DS74 | |
| MSI GE72 7RE-046 | |
| Acer Aspire VX5-591G-D0DD | |
| Dell Inspiron 15 7000 7567 | |
| MSI GL62M 7RD-077 | |
| Asus Strix GL753VD-GC045T | |
| 1920x1080 Very High Preset AA:FX AF:16x | |
| Asus Strix GL502VM-DS74 | |
| Asus Strix GL502VT-DS74 | |
| MSI GE72 7RE-046 | |
| Acer Aspire VX5-591G-D0DD | |
| Dell Inspiron 15 7000 7567 | |
| MSI GL62M 7RD-077 | |
| Asus Strix GL753VD-GC045T | |
| BioShock Infinite | |
| 1366x768 High Preset | |
| MSI GL62M 7RD-077 | |
| Dell Inspiron 15 7000 7567 | |
| Asus Strix GL502VT-DS74 | |
| Dell Inspiron 15 7559 | |
| Lenovo IdeaPad Z50-75 | |
| 1920x1080 Ultra Preset, DX11 (DDOF) | |
| Asus Strix GL502VM-DS74 | |
| Dell Inspiron 15 7000 7567 | |
| Asus Strix GL502VT-DS74 | |
| MSI GL62M 7RD-077 | |
| Dell Inspiron 15 7559 | |
| Lenovo IdeaPad Z50-75 | |
| Titanfall 2 | |
| 1920x1080 High / Enabled AA:TS AF:8x | |
| Dell Inspiron 15 7000 7567 | |
| Acer Aspire VX5-591G-D0DD | |
| MSI GE72 7RE-046 | |
| Asus Strix GL753VD-GC045T | |
| MSI GL62M 7RD-077 | |
| Dell XPS 15 2017 9560 (7300HQ, Full-HD) | |
| 1920x1080 Very High (Insane Texture Quality) / Enabled AA:TS AF:16x | |
| Dell Inspiron 15 7000 7567 | |
| Acer Aspire VX5-591G-D0DD | |
| Asus Strix GL753VD-GC045T | |
| MSI GE72 7RE-046 | |
| Dell XPS 15 2017 9560 (7300HQ, Full-HD) | |
| MSI GL62M 7RD-077 | |
| low | med. | high | ultra | |
|---|---|---|---|---|
| BioShock Infinite (2013) | 182.1 | 154.1 | 147 | 72.8 |
| GTA V (2015) | 135 | 118.8 | 60.3 | 36.1 |
| Metal Gear Solid V (2015) | 60 | 60 | 60 | 60 |
| Rise of the Tomb Raider (2016) | 117.5 | 86.6 | 46.6 | 38.3 |
| Doom (2016) | 117 | 105.3 | 69.1 | 67.5 |
| Mafia 3 (2016) | 61.3 | 44.3 | 28.6 | |
| Battlefield 1 (2016) | 114.7 | 99.7 | 56.9 | 51.2 |
| Farming Simulator 17 (2016) | 169.8 | 148.5 | 124.6 | 116 |
| Titanfall 2 (2016) | 143.4 | 131.9 | 75.8 | 66.7 |
| Call of Duty Infinite Warfare (2016) | 113.8 | 102 | 67.8 | 59 |
| Dishonored 2 (2016) | 87.9 | 72.2 | 46.3 | 39.9 |
| Watch Dogs 2 (2016) | 82.5 | 74.3 | 44.5 | 31.4 |
| Resident Evil 7 (2017) | 245.5 | 126.8 | 68.5 | 25.6 |
Emissions
System Noise
The noise development of the new Inspiron is pleasing at first: The gaming notebook works silently in idle mode and during normal web-surfing most of the time. A rustling noise from the HDD is audible time and again. The fans only run infrequently and the generated noise remains pleasant. Under load the fans speed up quickly and produce a noise close to 47 dB(A). Headphones or speakers set to a loud volume are required in order to drown out the fan noise. The generated frequency is alright overall. However, we would wish for a less high-frequency noise in the future.
Noise level
| Idle |
| 30.9 / 30.9 / 31 dB(A) |
| HDD |
| 31.2 dB(A) |
| Load |
| 46.5 / 46.8 dB(A) |
 | ||
30 dB silent 40 dB(A) audible 50 dB(A) loud |
||
min: | ||
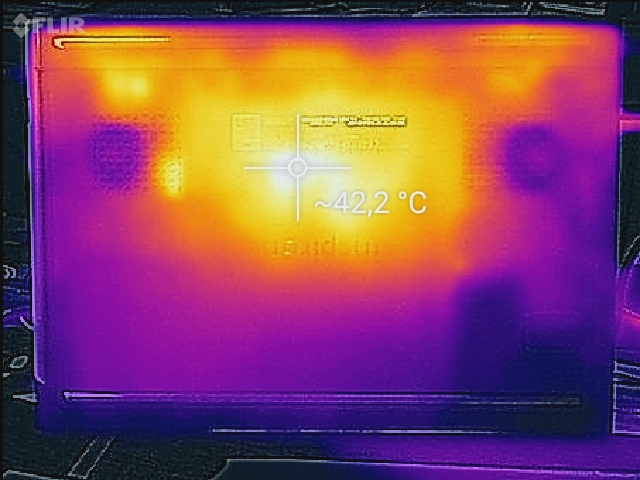
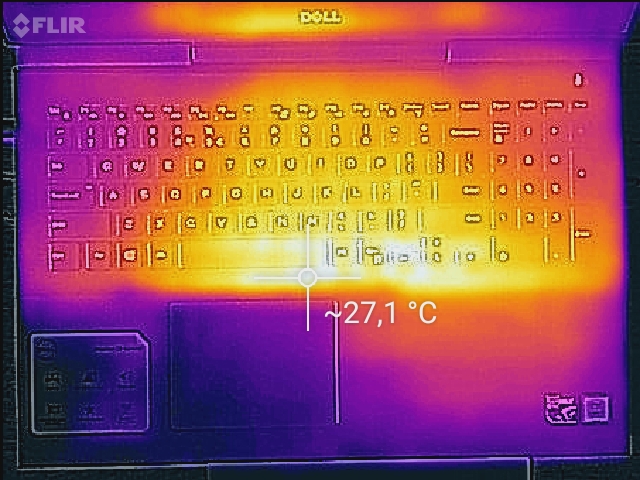
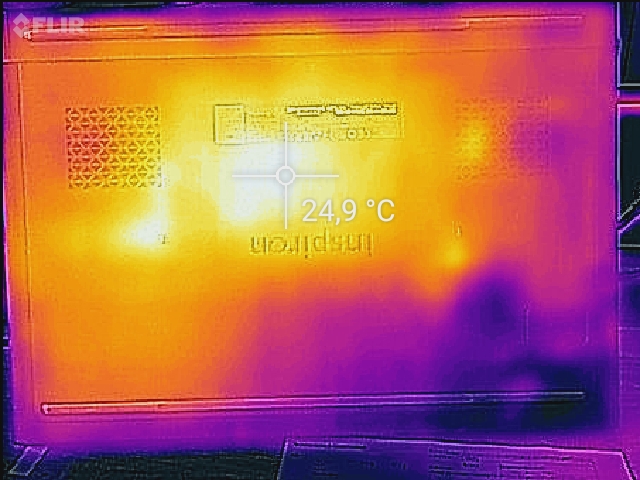
Temperature


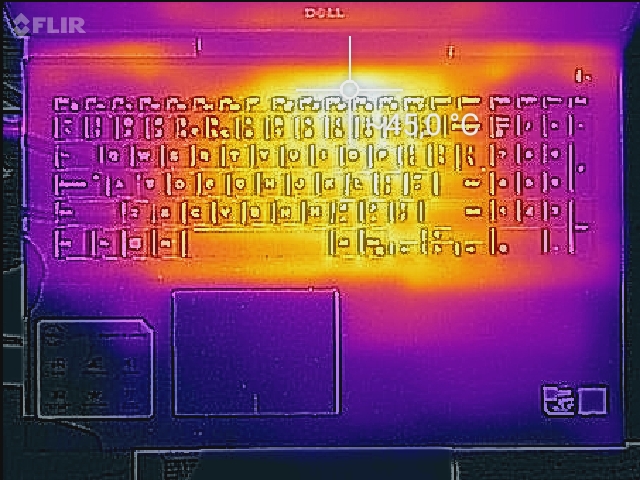
To put it briefly, the heat dissipation works flawlessly in the Inspiron 7000. In idle mode, a temperature increase is hardly noticeable at all. In addition, the temperature remains acceptable under load. The hot spot above the keyboard reaches 43.4 °C. We measured a temperature of 40 °C in the central part of the keyboard. This is noticeable when typing, but it is not disturbing. We could not detect a disturbing temperature increase during normal gaming and web-surfing.
The predecessor performed worse with 54 °C in the central part of the keyboard. Its temperature gradient was quite steep overall. The temperature management also does not appear sophisticated in the more powerful Asus ROG Strix FL502VM. We measured up to just under 65 °C on the top side and the underside.
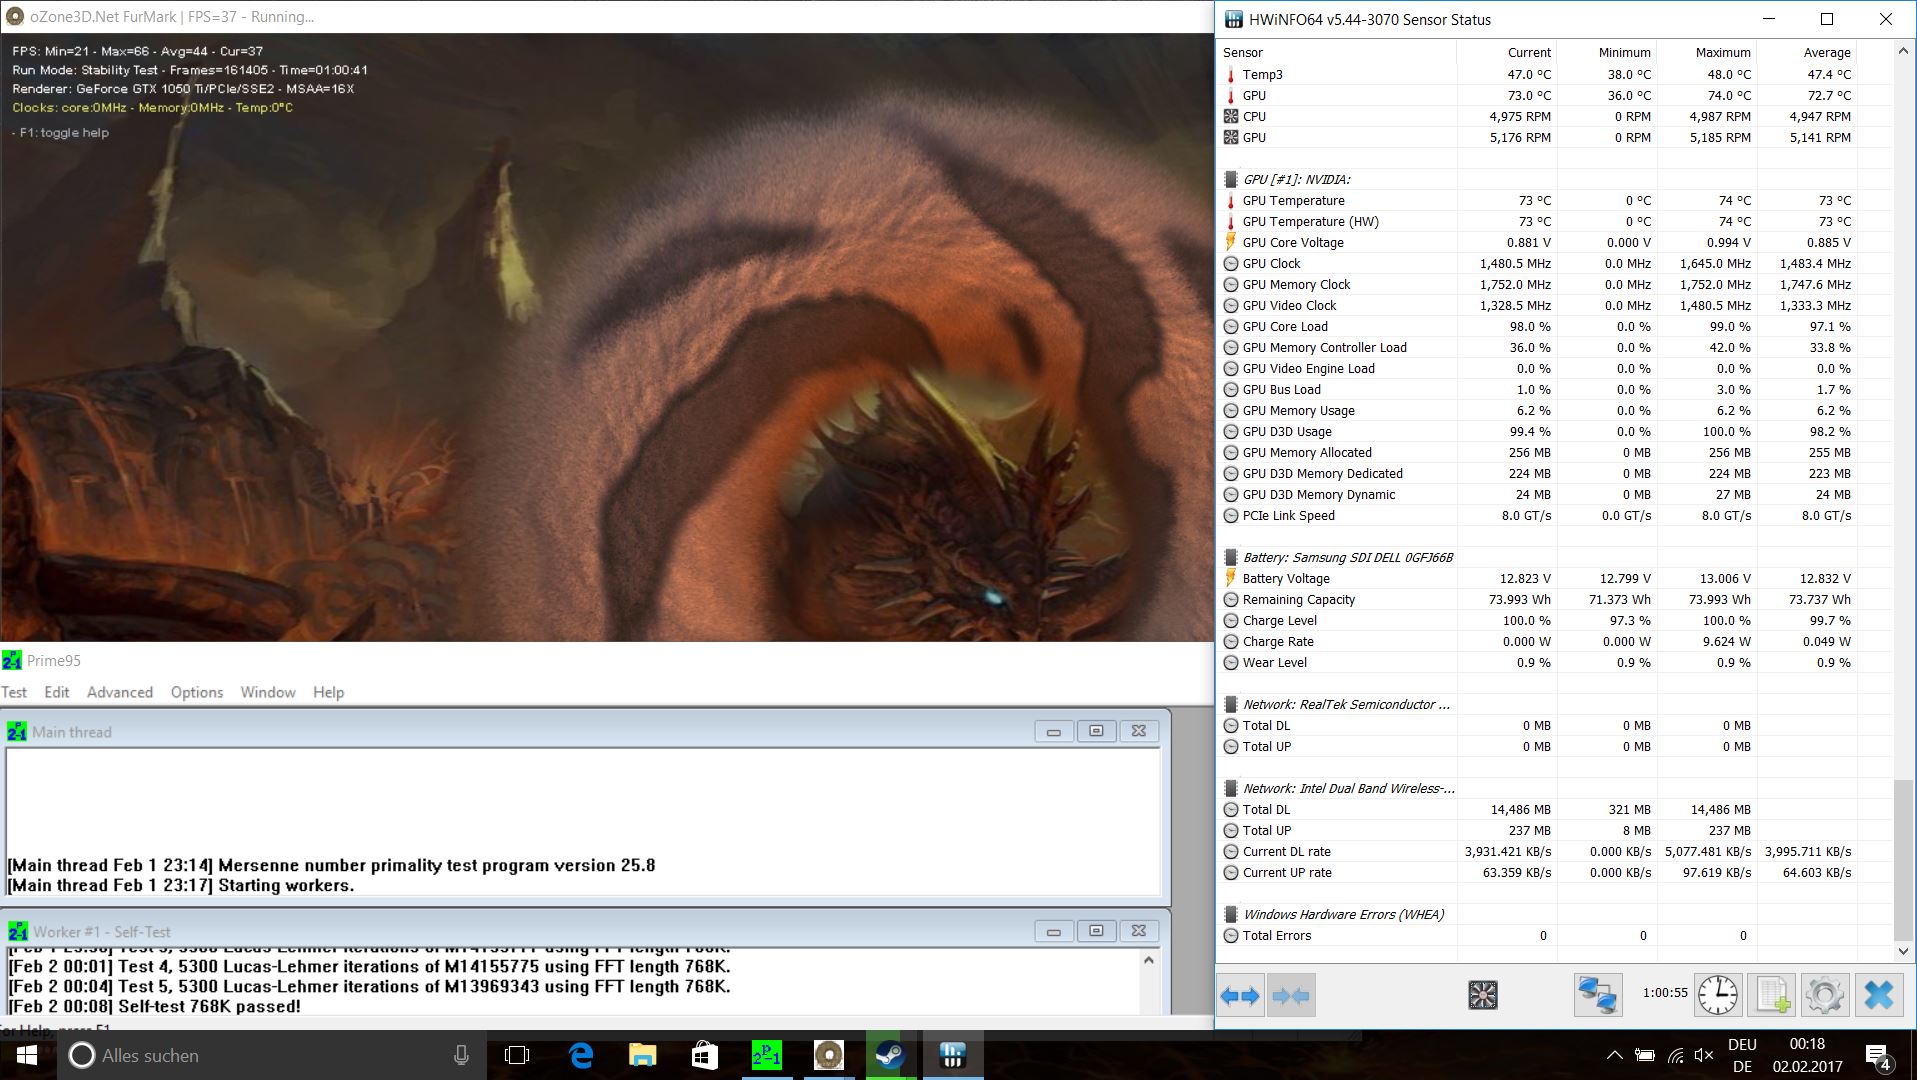
Finally, we want to check the core temperatures of the CPU. In our stress test, Prime95 and FurMark simulate maximum stress and we observe clock rates and core temperatures. After a while, the core temperature seriously increases. Since several cores exceed the 90 °C level by far, the test model has to throttle for a short time. However, this happens that infrequently that the CPU works at 3.4 GHz on average.
According to 3DMark 11, the Inspiron 7567 has its full performance available after the stress test has been stopped.
(±) The maximum temperature on the upper side is 43.4 °C / 110 F, compared to the average of 40.4 °C / 105 F, ranging from 21.2 to 68.8 °C for the class Gaming.
(+) The bottom heats up to a maximum of 37.7 °C / 100 F, compared to the average of 43.2 °C / 110 F
(+) In idle usage, the average temperature for the upper side is 23.1 °C / 74 F, compared to the device average of 33.9 °C / 93 F.
(+) The palmrests and touchpad are cooler than skin temperature with a maximum of 26.6 °C / 79.9 F and are therefore cool to the touch.
(+) The average temperature of the palmrest area of similar devices was 28.8 °C / 83.8 F (+2.2 °C / 3.9 F).
Speakers
The sound is decent, but it is lacking in bass. In addition, the volume is not overly high. With the WaveMaxxAudio software, we can get a high volume and some bass from the speakers. The stereo speakers can convince in occasional YouTube and video sessions.
Dell Inspiron 15 7000 7567 audio analysis
(±) | speaker loudness is average but good (74 dB)
Bass 100 - 315 Hz
(±) | reduced bass - on average 12.6% lower than median
(±) | linearity of bass is average (13.2% delta to prev. frequency)
Mids 400 - 2000 Hz
(+) | balanced mids - only 1.8% away from median
(+) | mids are linear (4.3% delta to prev. frequency)
Highs 2 - 16 kHz
(+) | balanced highs - only 4% away from median
(+) | highs are linear (3.9% delta to prev. frequency)
Overall 100 - 16.000 Hz
(+) | overall sound is linear (12% difference to median)
Compared to same class
» 12% of all tested devices in this class were better, 4% similar, 84% worse
» The best had a delta of 6%, average was 18%, worst was 132%
Compared to all devices tested
» 9% of all tested devices were better, 2% similar, 88% worse
» The best had a delta of 4%, average was 23%, worst was 134%
Apple MacBook 12 (Early 2016) 1.1 GHz audio analysis
(+) | speakers can play relatively loud (83.6 dB)
Bass 100 - 315 Hz
(±) | reduced bass - on average 11.3% lower than median
(±) | linearity of bass is average (14.2% delta to prev. frequency)
Mids 400 - 2000 Hz
(+) | balanced mids - only 2.4% away from median
(+) | mids are linear (5.5% delta to prev. frequency)
Highs 2 - 16 kHz
(+) | balanced highs - only 2% away from median
(+) | highs are linear (4.5% delta to prev. frequency)
Overall 100 - 16.000 Hz
(+) | overall sound is linear (10.2% difference to median)
Compared to same class
» 7% of all tested devices in this class were better, 2% similar, 90% worse
» The best had a delta of 5%, average was 18%, worst was 53%
Compared to all devices tested
» 5% of all tested devices were better, 1% similar, 94% worse
» The best had a delta of 4%, average was 23%, worst was 134%
Frequency diagram in comparison (checkboxes above can be turned on/off!)
Energy Management
Power Consumption
The very low energy demand in idle mode deserves praise. The new Inspiron Gaming notebook always remains below 9 W in this scenario, while the Asus Strix GL502VM with Nvidia GTX 1060 requires about 40 W here. The predecessor of the Inspiron also performs significantly worse with values between 9.4 - 15 W.
Under load, all components have to work hard and the energy demand increases heavily. Our test model reaches 82 W on average and a maximum of 127 W. This result is also not bad. In comparison with the Asus Strix GL502VM it becomes apparent that the more powerful Nvidia GTX 1060 needs more energy. The gaming competitor requires up to 156 W.
The power adapter of the Dell only provides 130 W. This might limit the actual performance due to production variance in the performance of the power adapter. In particular, the Inspiron variant with UHD display might have a higher energy demand.
In stand-by mode, the laptop has a low power consumption of 0.5 W. Turned off, but connected to the mains, the energy demand is about 0.3 W.
| Off / Standby | |
| Idle | |
| Load |
|
Key:
min: | |
| Dell Inspiron 15 7000 7567 i7-7700HQ, GeForce GTX 1050 Ti Mobile, Intel SSDSCKKF256H6, TN, 1920x1080, 15.6" | MSI GE72 7RE-046 i7-7700HQ, GeForce GTX 1050 Ti Mobile, Toshiba HG6 THNSNJ256G8NY, TN LED, 1920x1080, 17.3" | Dell Inspiron 15 7559 6700HQ, GeForce GTX 960M, SK hynix SC300 M.2, IPS, 3840x2160, 15.6" | Asus Strix GL502VM-DS74 i7-7700HQ, GeForce GTX 1060 Mobile, Samsung SSD 960 Evo 250GB m.2 NVMe, IPS, 1920x1080, 15.6" | |
|---|---|---|---|---|
| Power Consumption | -124% | -65% | -347% | |
| Idle Minimum * (Watt) | 4.4 | 14 -218% | 9.4 -114% | 38.3 -770% |
| Idle Average * (Watt) | 6.8 | 20 -194% | 14.4 -112% | 40.5 -496% |
| Idle Maximum * (Watt) | 8.3 | 25 -201% | 15 -81% | 42.2 -408% |
| Load Average * (Watt) | 81 | 82 -1% | 102 -26% | 110.4 -36% |
| Load Maximum * (Watt) | 127 | 135 -6% | 120 6% | 155.7 -23% |
* ... smaller is better
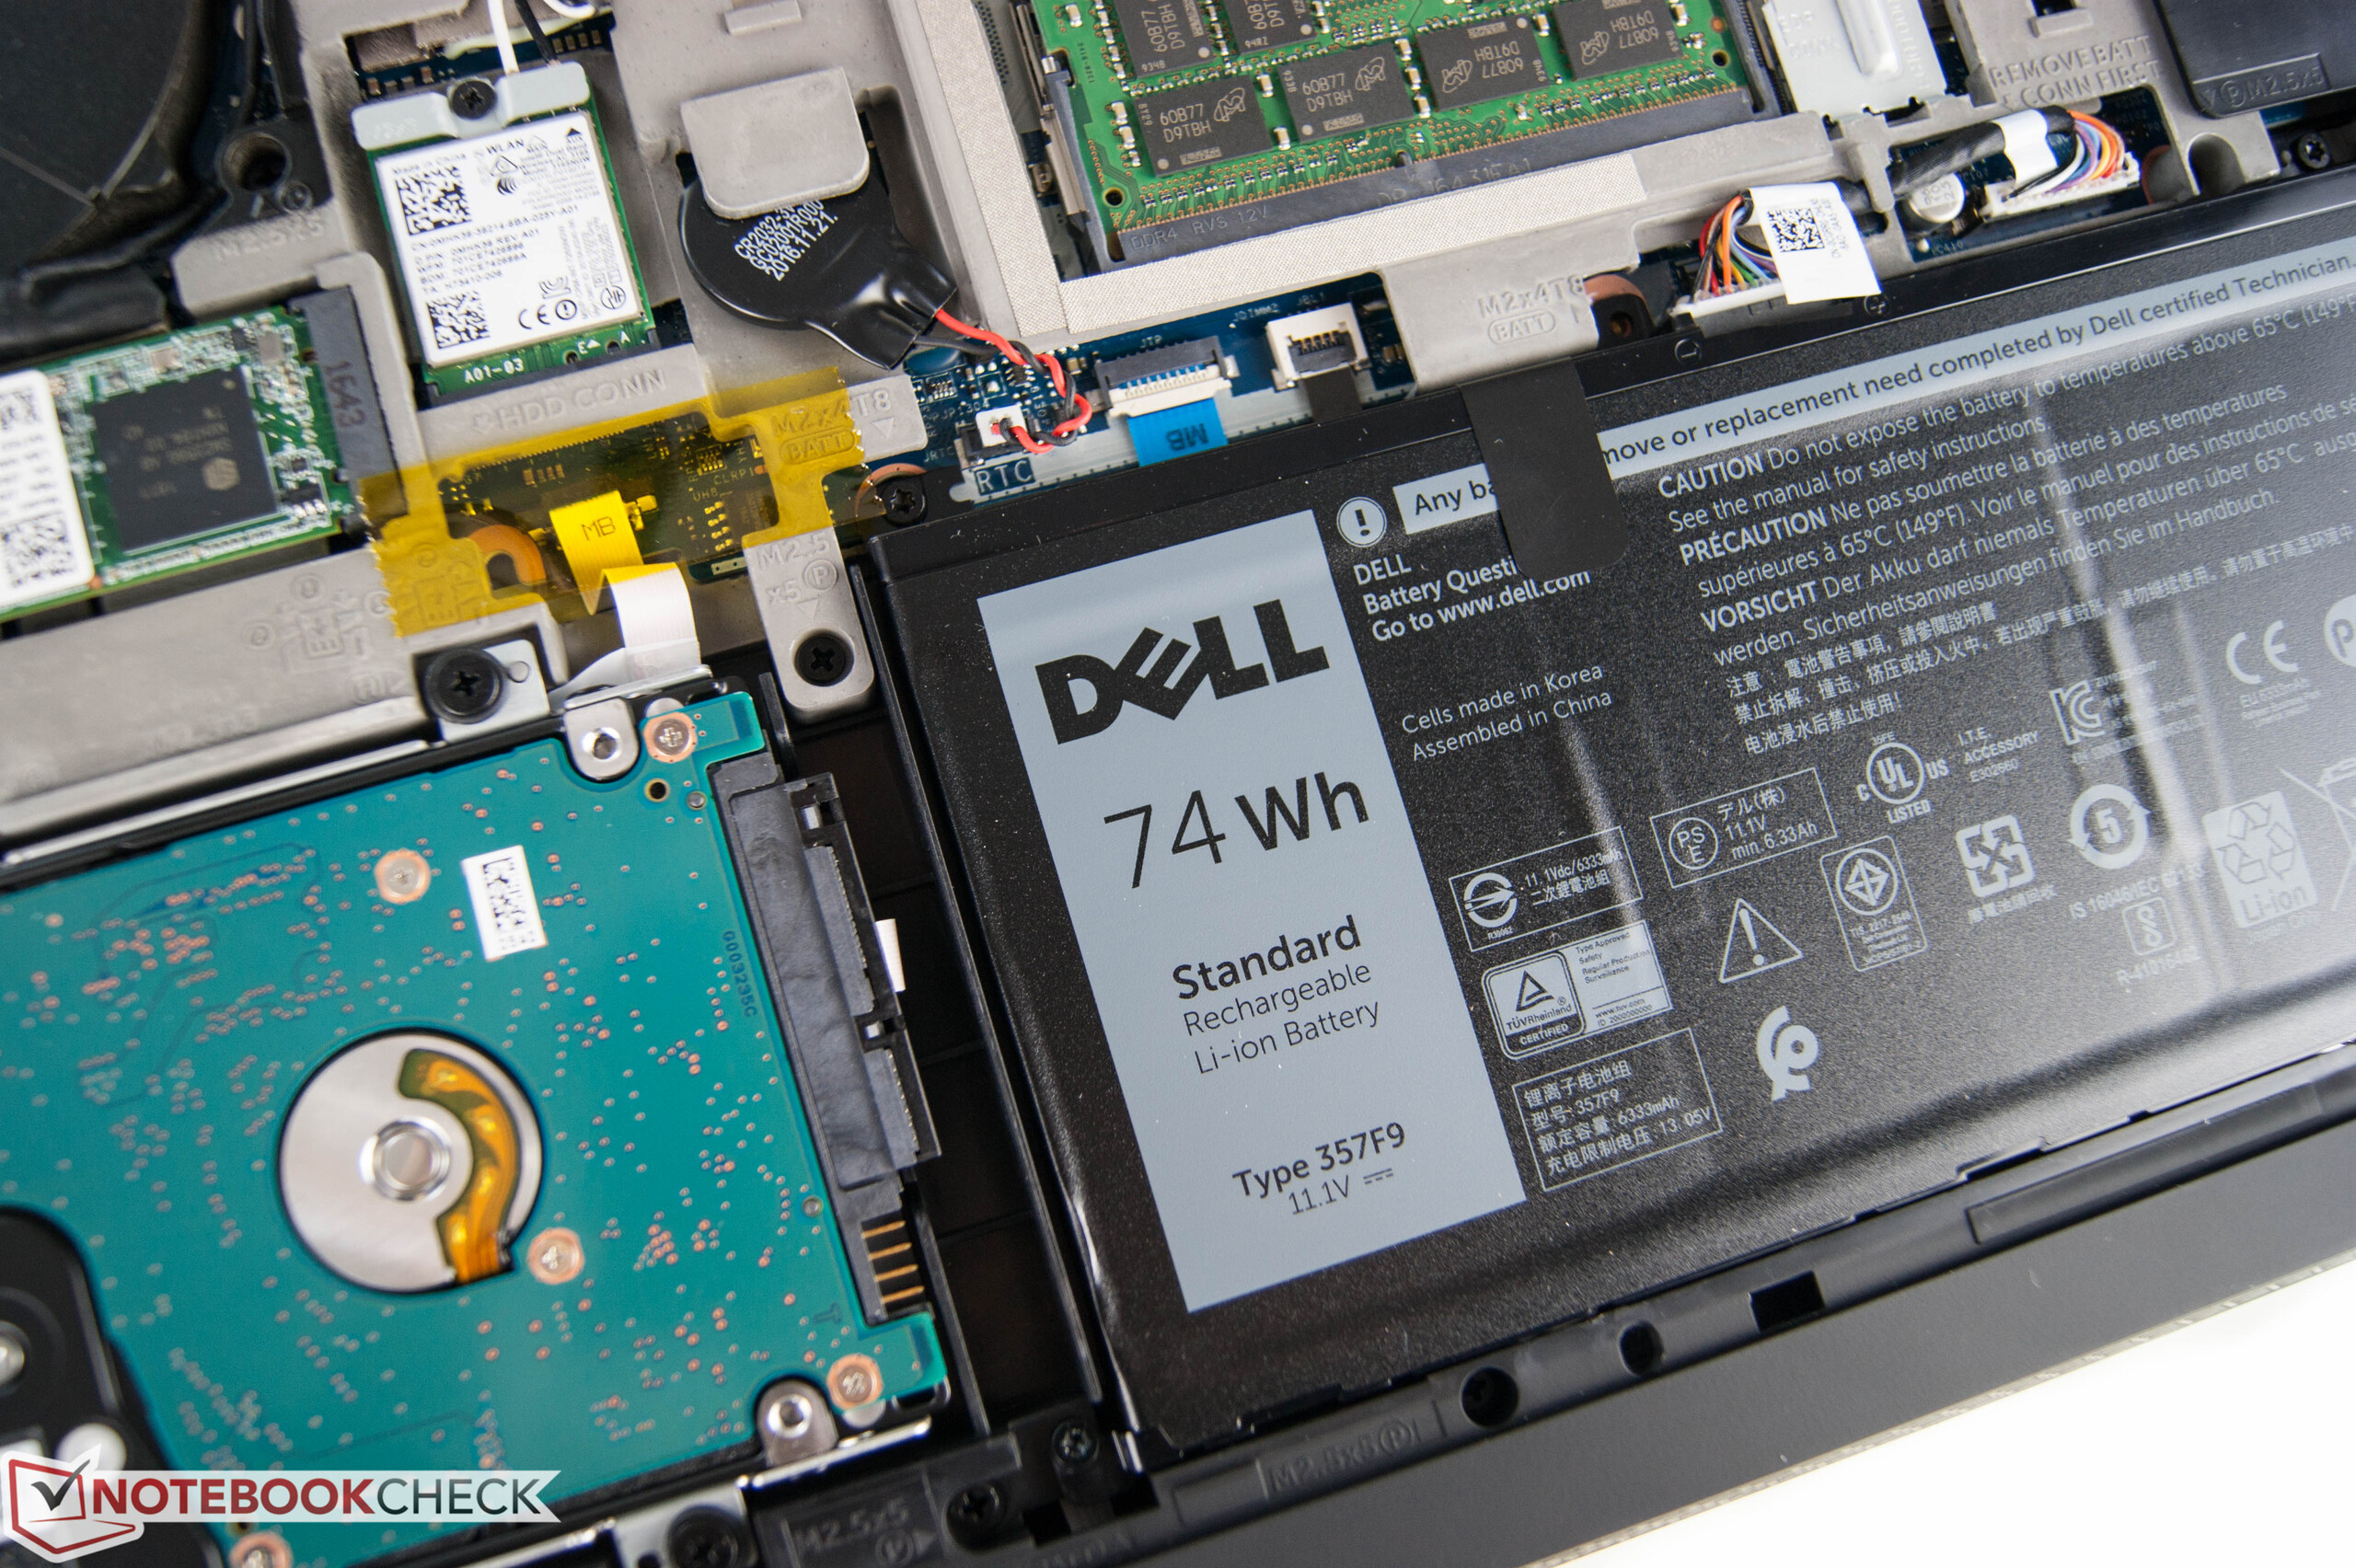
Battery Life
The Dell comes with a six-cell battery with a capacity of 74 Wh. We determine the runtimes in three different scenarios. The first test identifies the maximum runtime. We select the energy-saving profile, set the brightness to its minimum and start a reading script. The Inspiron achieves an impressive 19.5 hours here.
The Wi-Fi runtime is probably the most important scenario. It simulates web-surfing at a brightness of 150 cd/m². Once again, the new Dell Inspiron 7567 proves to be a runtime wonder. No other notebook in our comparison can last over 10 hours.
Finally, we test the minimum battery runtime. We start the Classic Test of the Battery Eater tool with the Windows energy profile "maximum performance" and maximum brightness. In this test, the test model achieves almost 1.5 hours. In comparison to the competitors, this is a very typical result.
| Dell Inspiron 15 7000 7567 i7-7700HQ, GeForce GTX 1050 Ti Mobile, 74 Wh | MSI GE72 7RE-046 i7-7700HQ, GeForce GTX 1050 Ti Mobile, 51.4 Wh | Dell Inspiron 15 7559 6700HQ, GeForce GTX 960M, 74 Wh | Asus Strix GL502VM-DS74 i7-7700HQ, GeForce GTX 1060 Mobile, 64 Wh | Acer Aspire VX5-591G-D0DD i7-7700HQ, GeForce GTX 1050 Ti Mobile, 52 Wh | |
|---|---|---|---|---|---|
| Battery runtime | -64% | -36% | -69% | -41% | |
| Reader / Idle (h) | 19.6 | 11.8 -40% | 1.7 -91% | ||
| H.264 (h) | 7.6 | 3.3 -57% | |||
| WiFi v1.3 (h) | 10.4 | 3.1 -70% | 3.9 -62% | 1.5 -86% | 6.1 -41% |
| Load (h) | 1.4 | 1.3 -7% | 1 -29% |
Pros
Cons
Verdict
A gaming notebook for everyday life. Dell's new Inspiron 15 of the 7000 series proved that it has a right to exist in the gaming-notebook world. First of all, it has a well-made case, which allows end-user maintenance. However, there are only a few interfaces for a 15-inch notebook. In addition, the performance of the SD-card reader is poor. In return, the manufacturer has incorporated acceptable input devices. The keyboard even features a backlight and a number block and is splash-proof. However, we did not like the small arrow keys, which are especially inconvenient in racing games. The only real disappointment of the Inspiron 15 is the Full HD TN panel, which not only has very narrow viewing angles but is also very bluish. Dell should at least offer customers an IPS display option.
In the further course of the test, Dell's newest gaming notebook can show its strength: The Intel Core i7 processor and the Nvidia GeForce GTX 1050 Ti are combined with a fast SSD and 16 GB DDR4 RAM. As a result, system and gaming performances are excellent. However, the Inspiron 15 also performs very well in other fields of application than gaming. During normal use, the fan is hardly audible and the temperature remains in an acceptable range in every scenario. Although, the gaming laptop might seldom be used as mobile companion because of its height and weight, its battery life makes it suitable for mobile use. Our test model shows higher stamina than several mobile subnotebooks.
Dell offers a superior gaming notebook for a price from 1000 Euros (~$1062), which does not even have to fear more expensive competitors.
Those who are put off by the display should consider the more expensive UHD variant. It remains to be seen whether the German models of the Inspiron 15 will use IPS panels. Nevertheless, the competitors should not be neglected. Those who wish for even higher gaming performance and an IPS panel should take a look at the Asus ROG Strix GL502VM.
Update 08-03-2017: The IPS panel outperforms the TN display in all respects and appears to be significantly better.
Dell Inspiron 15 7000 7567
- 02/07/2017 v6 (old)
Nino Ricchizzi
Price comparison
