Notebookcheck Logo

Rise of the Tomb Raider Notebook Benchmarks

Precision landing. After several rather poor PC ports (Batman Arkham Knight, Just Cause 3, Call of Duty Black Ops 3, etc.), the latest iteration of Tomb Raider finally leaves a better impression on the PC. We tested the action title on multiple notebook GPUs and checked the performance. Update: GT630M, HD 4000, M385X, Iris Pro 5200, 920M, M280X, Kaveri R7 added.
Rise of the Tomb Raider logo

For the original German article, see here.

Graphics

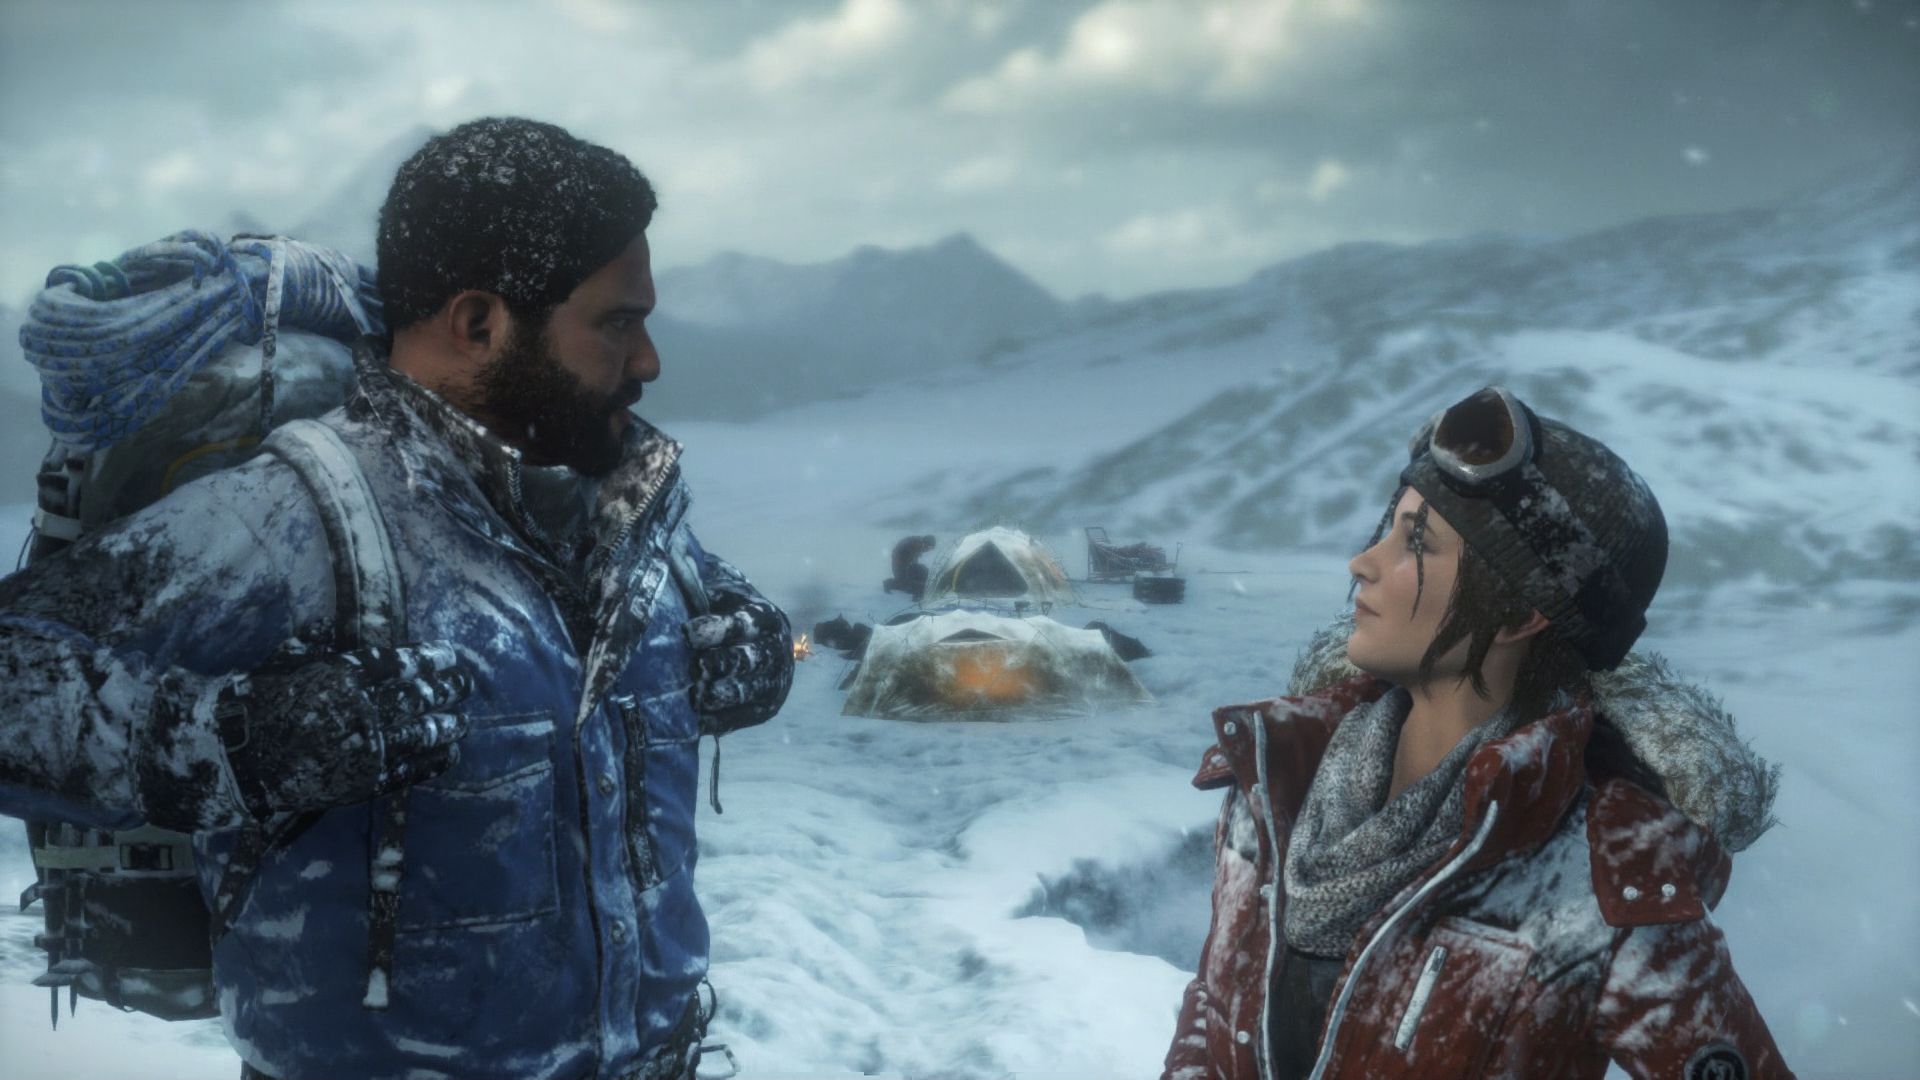
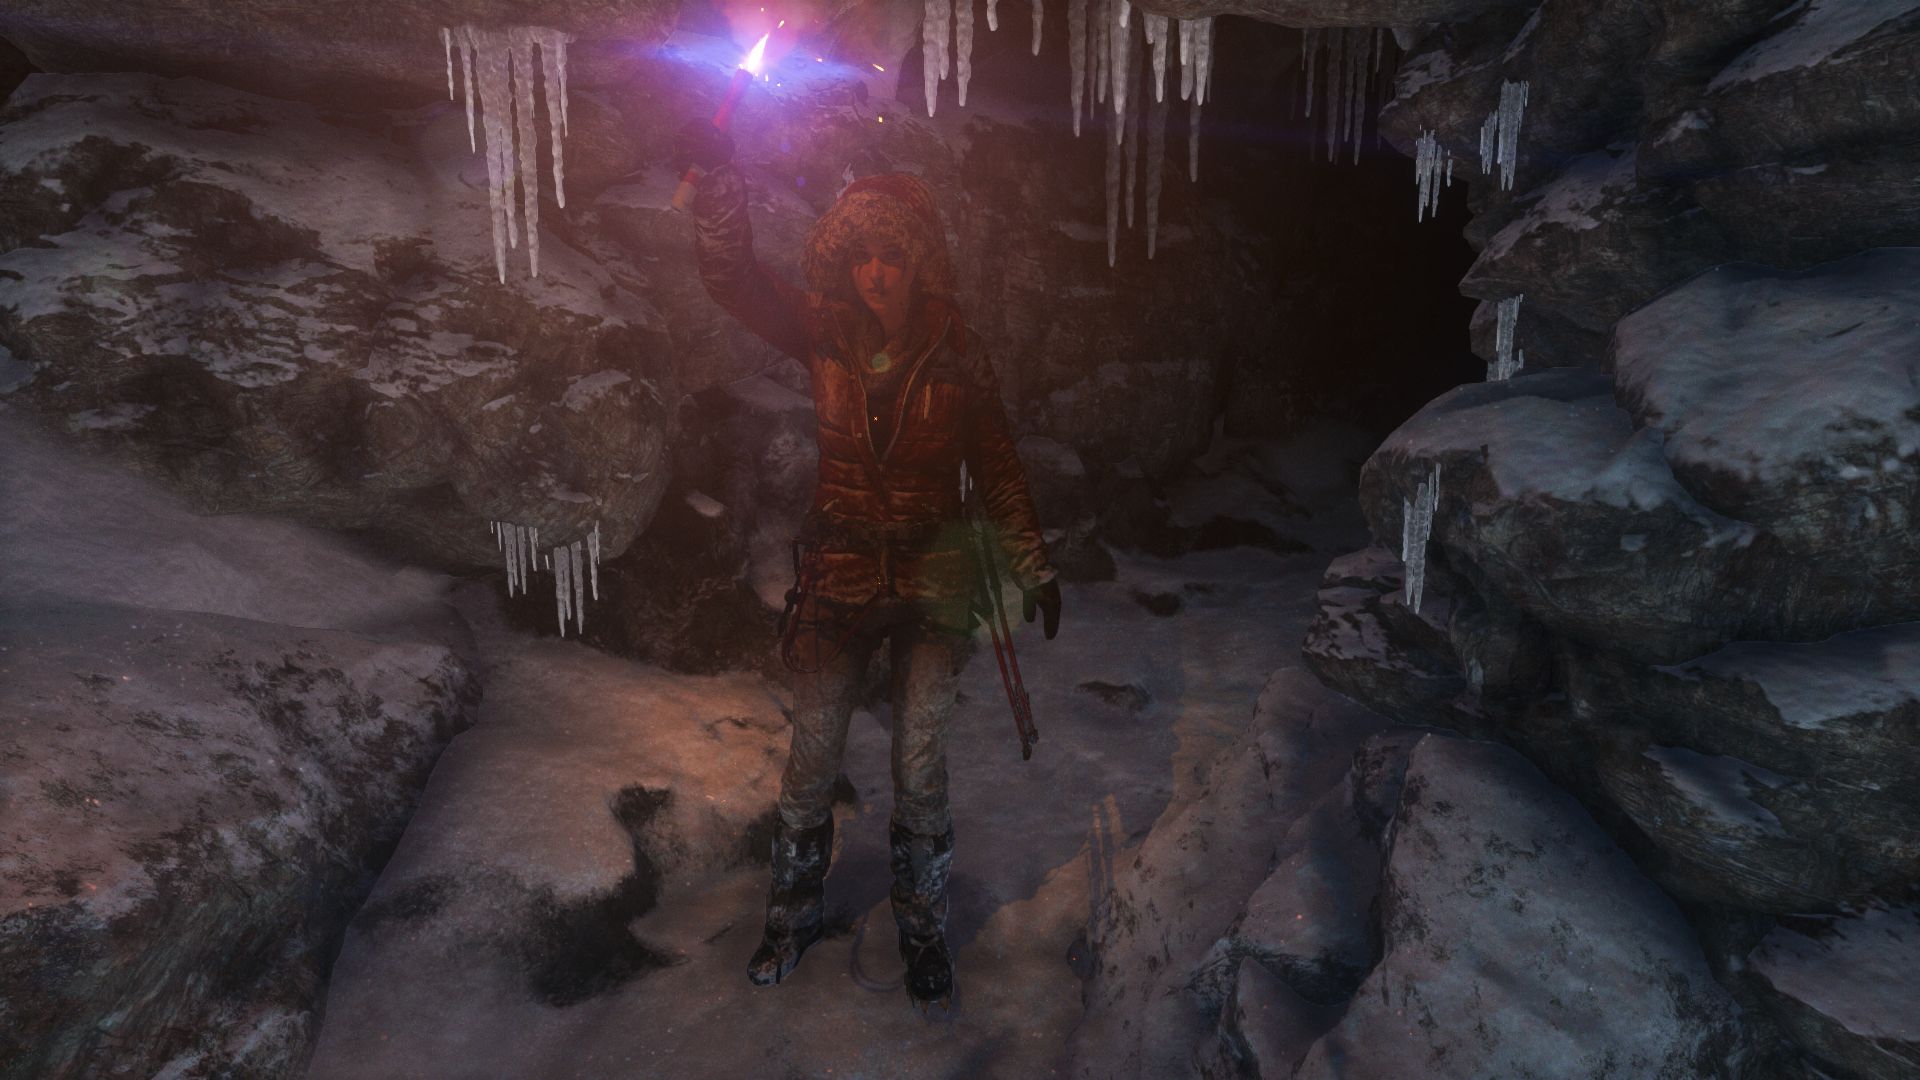
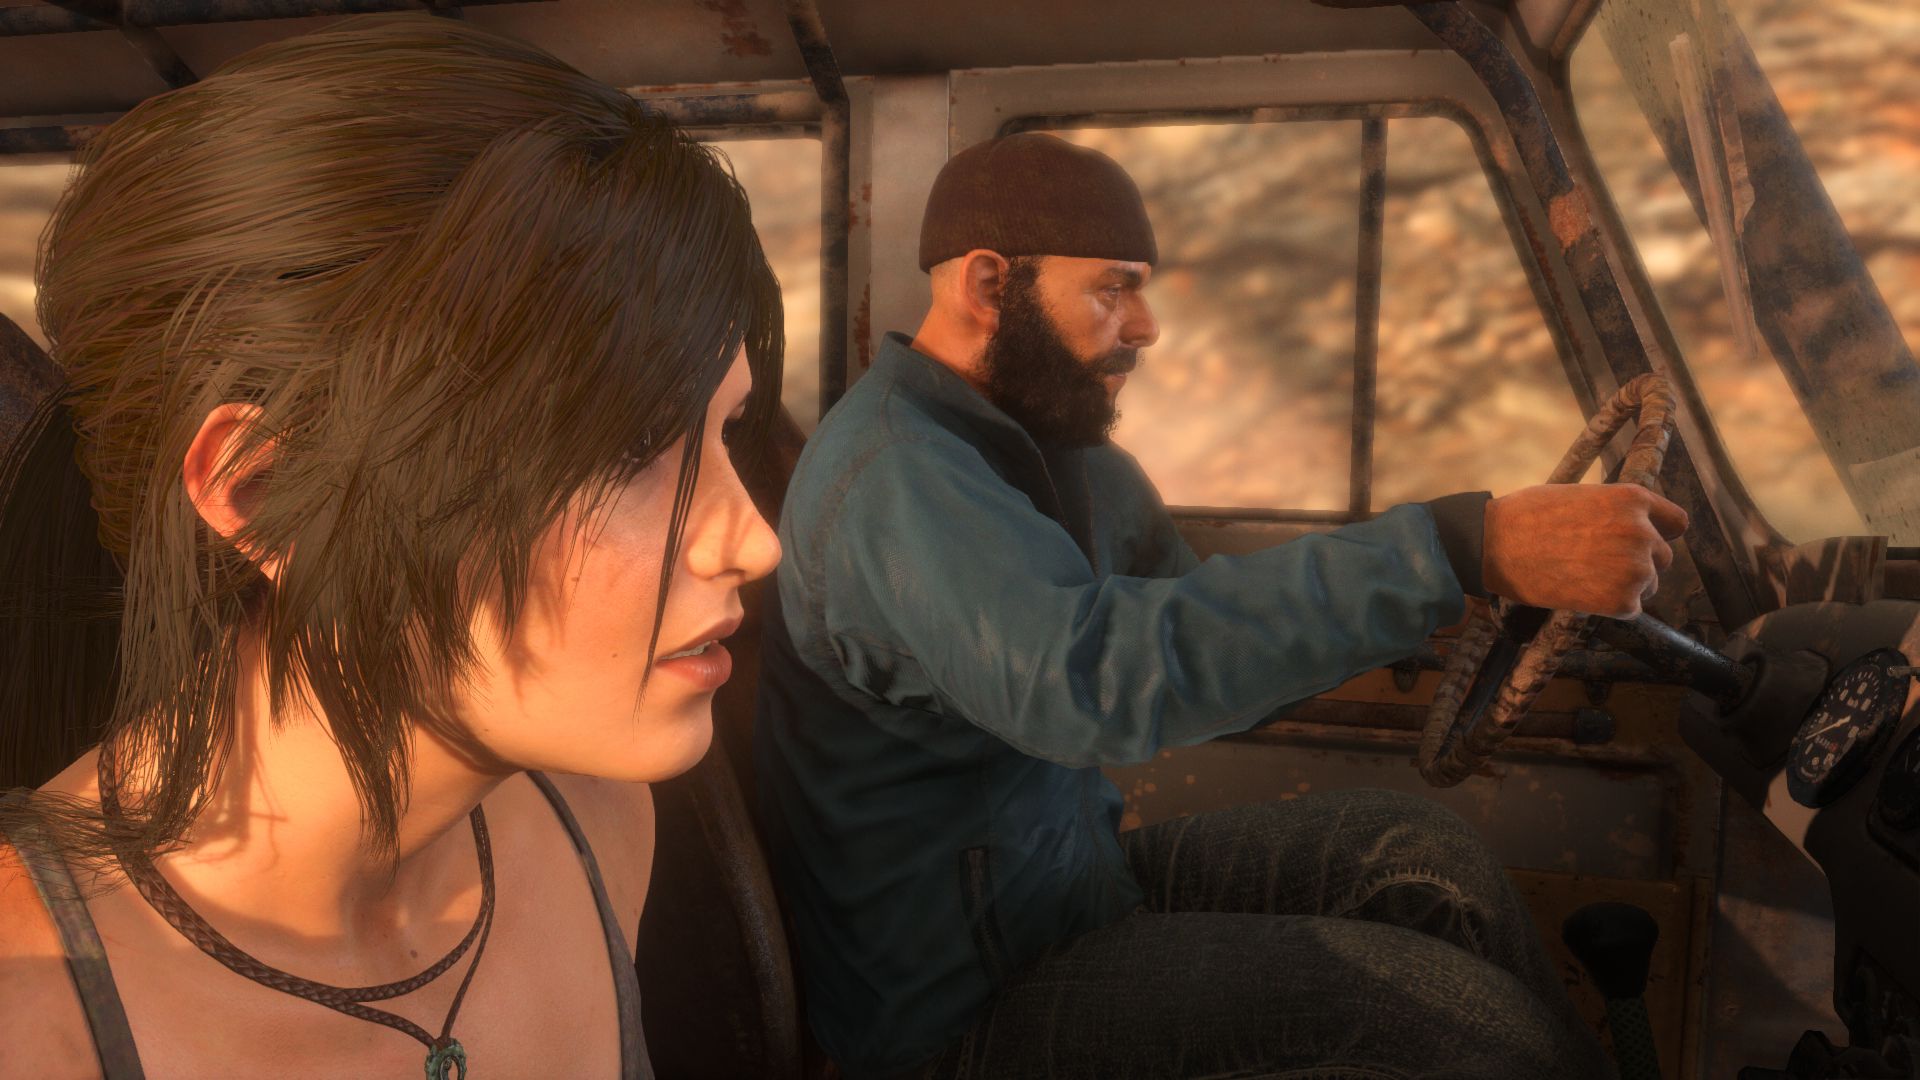
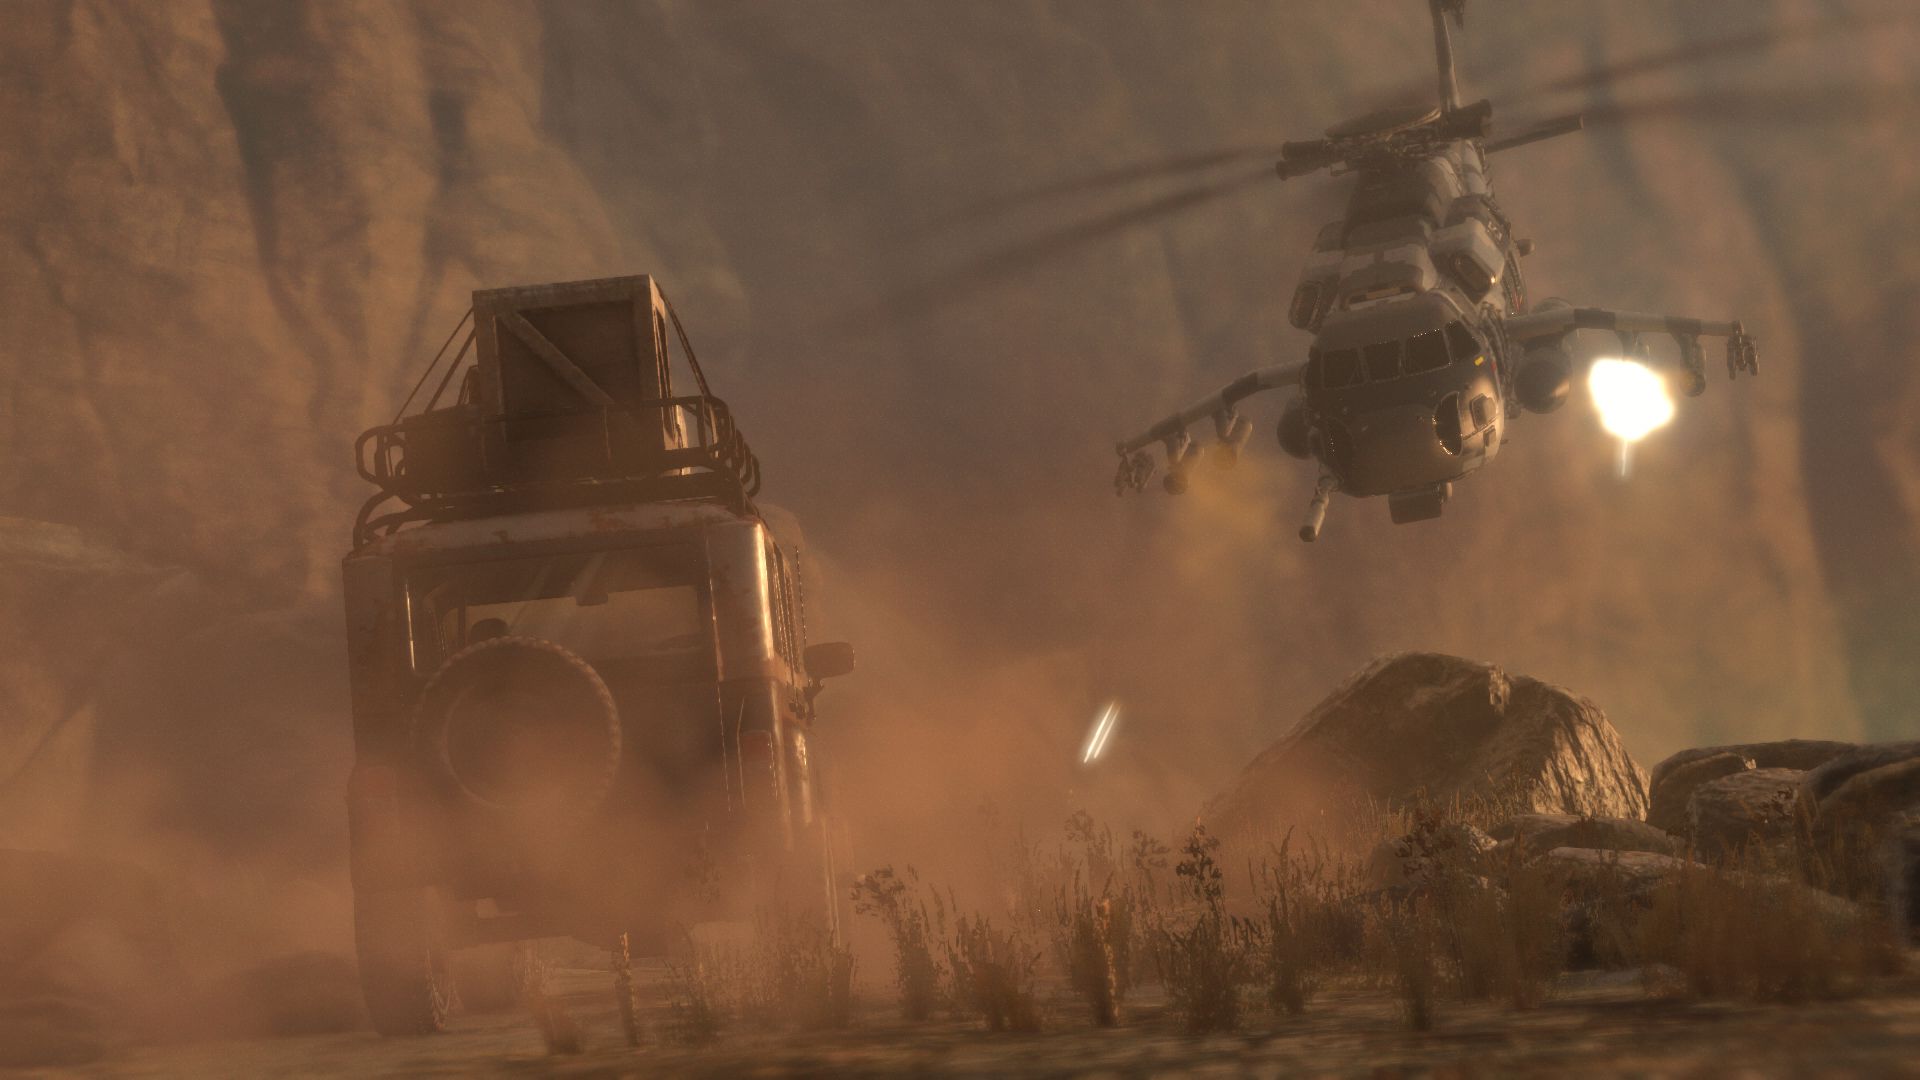
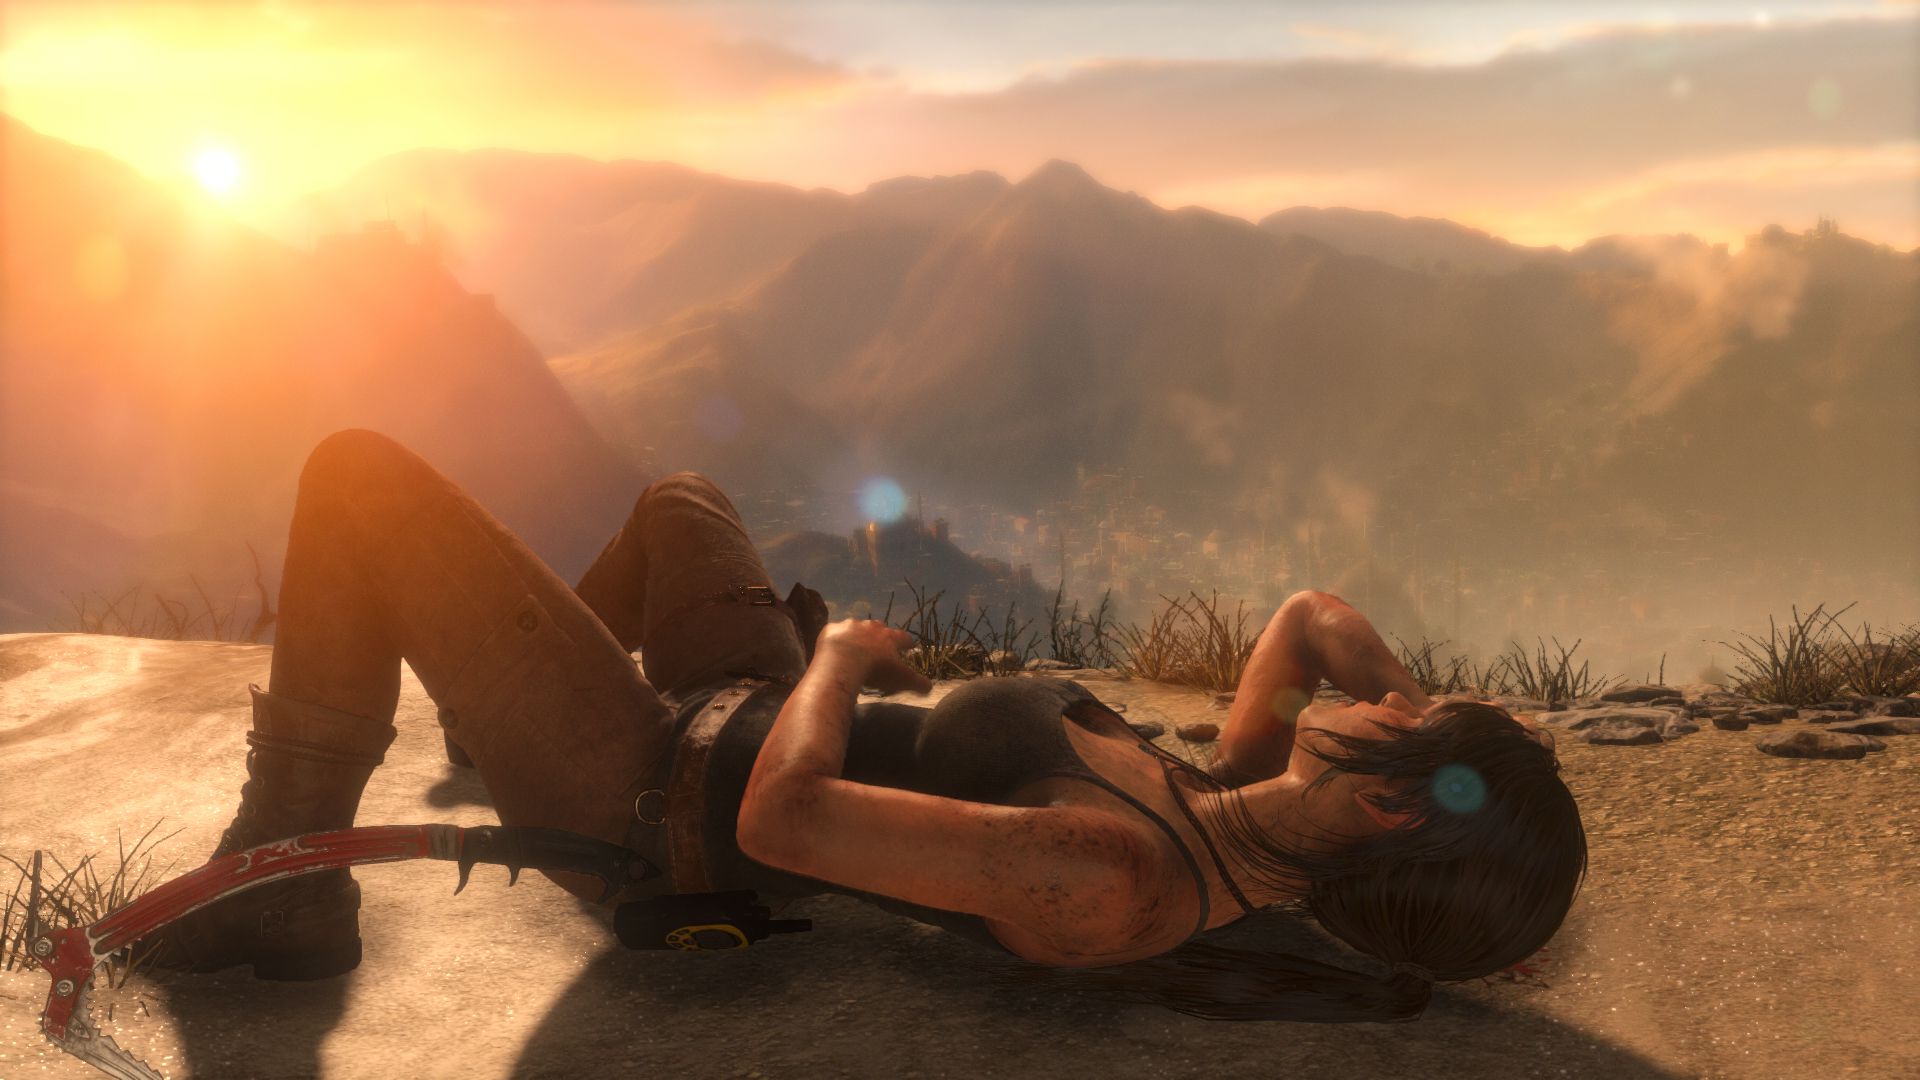
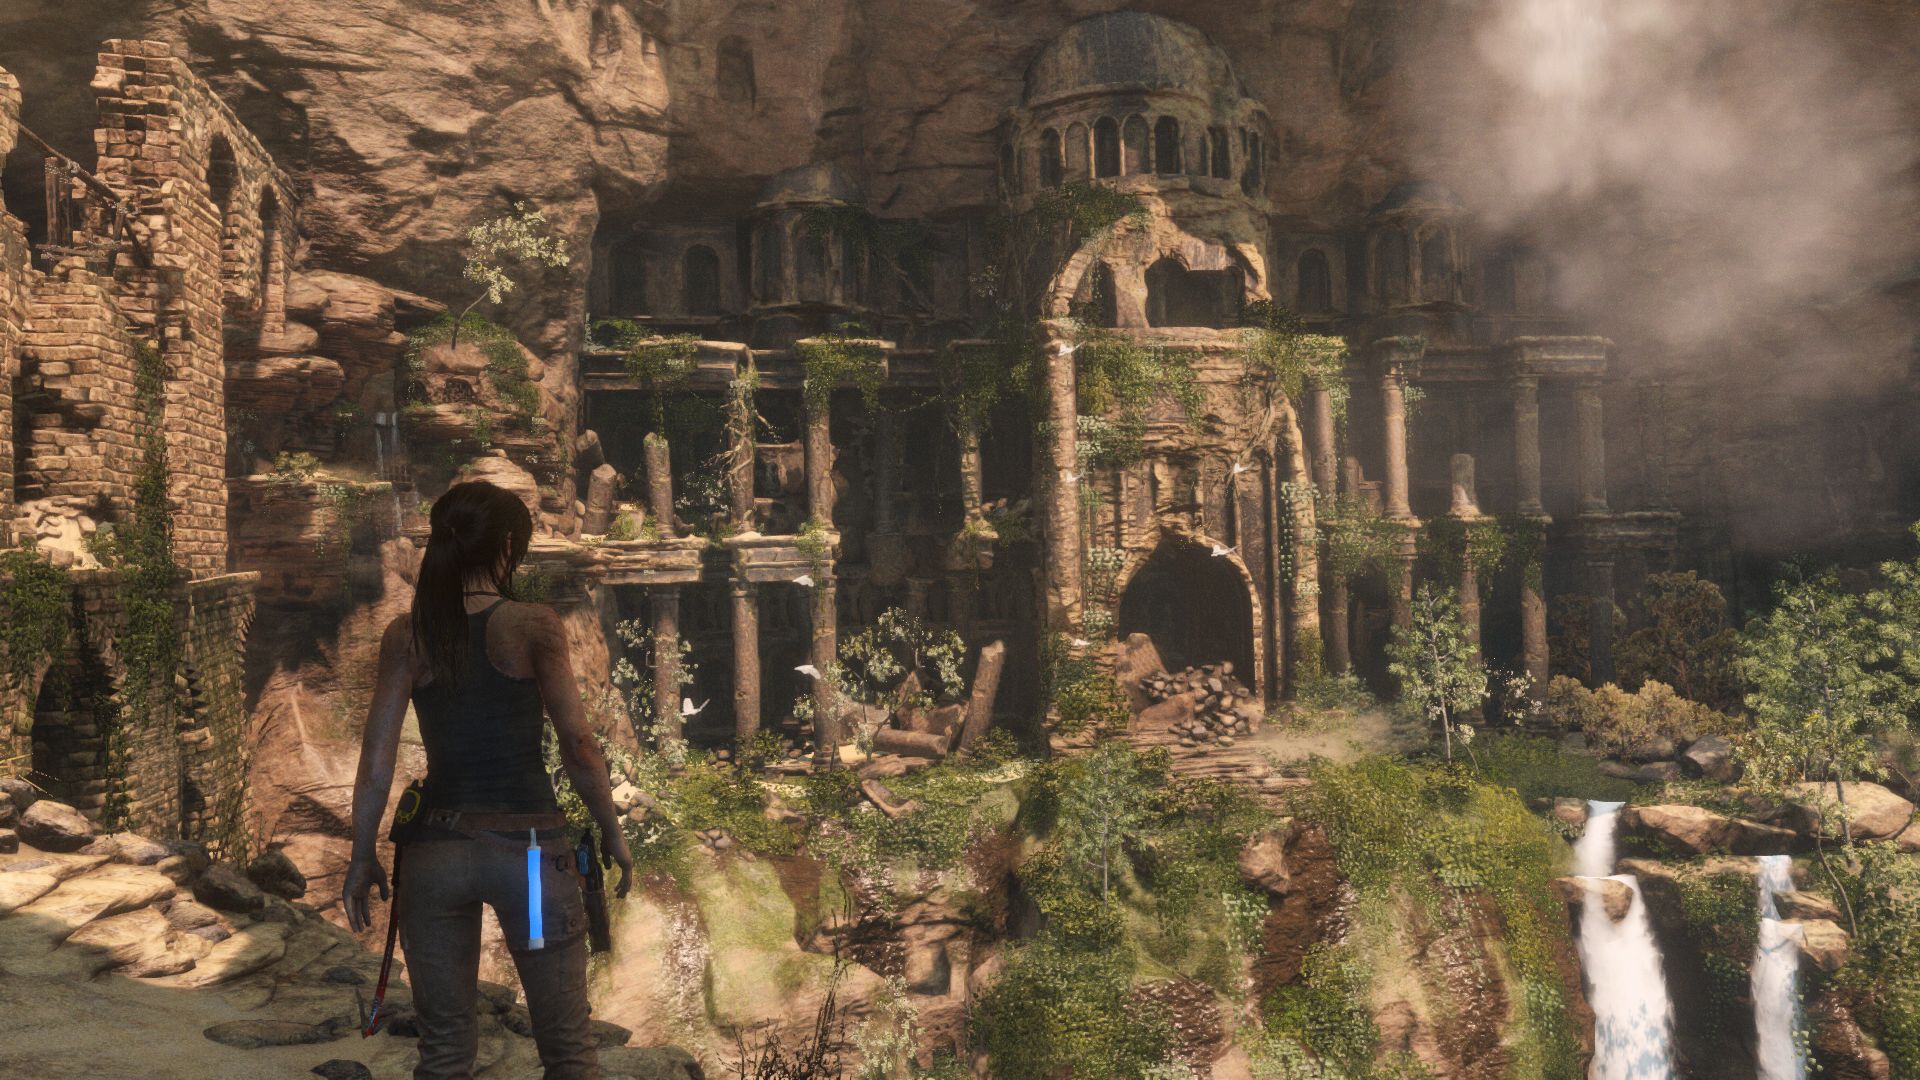
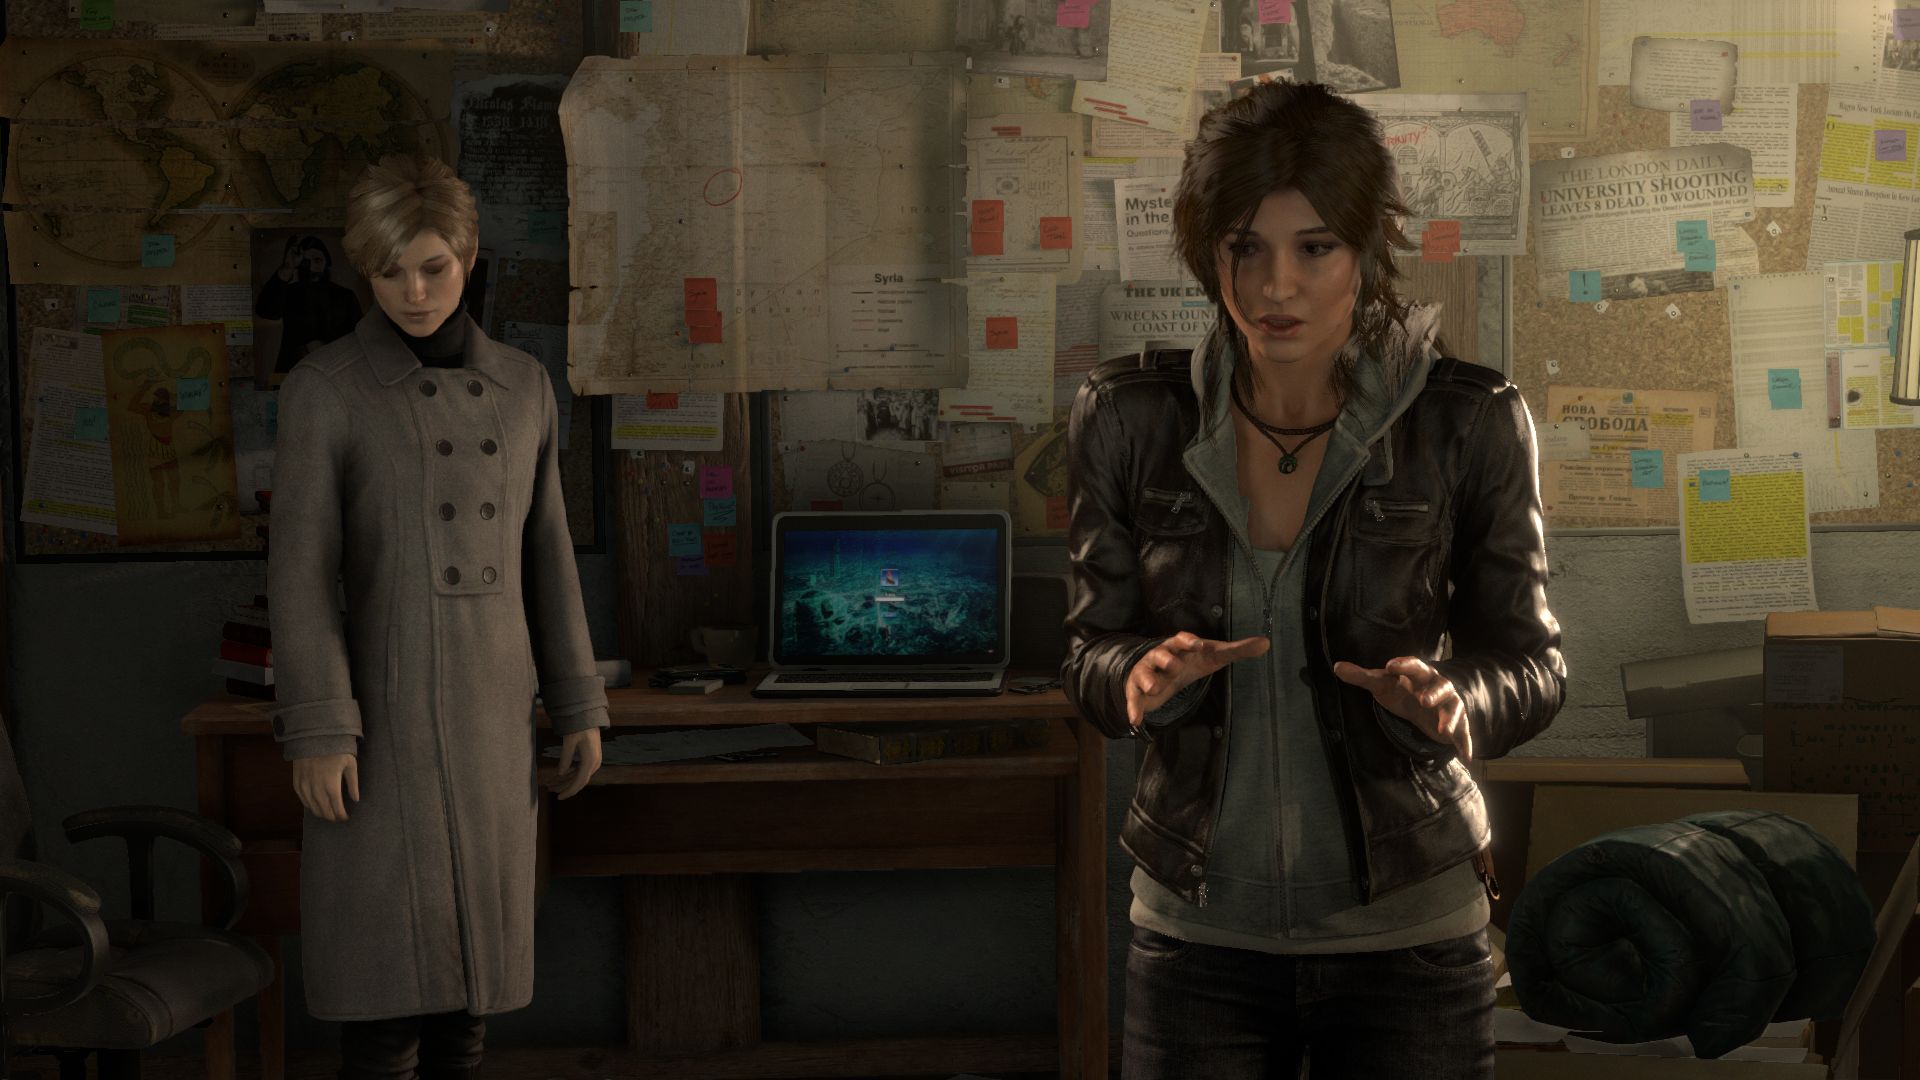
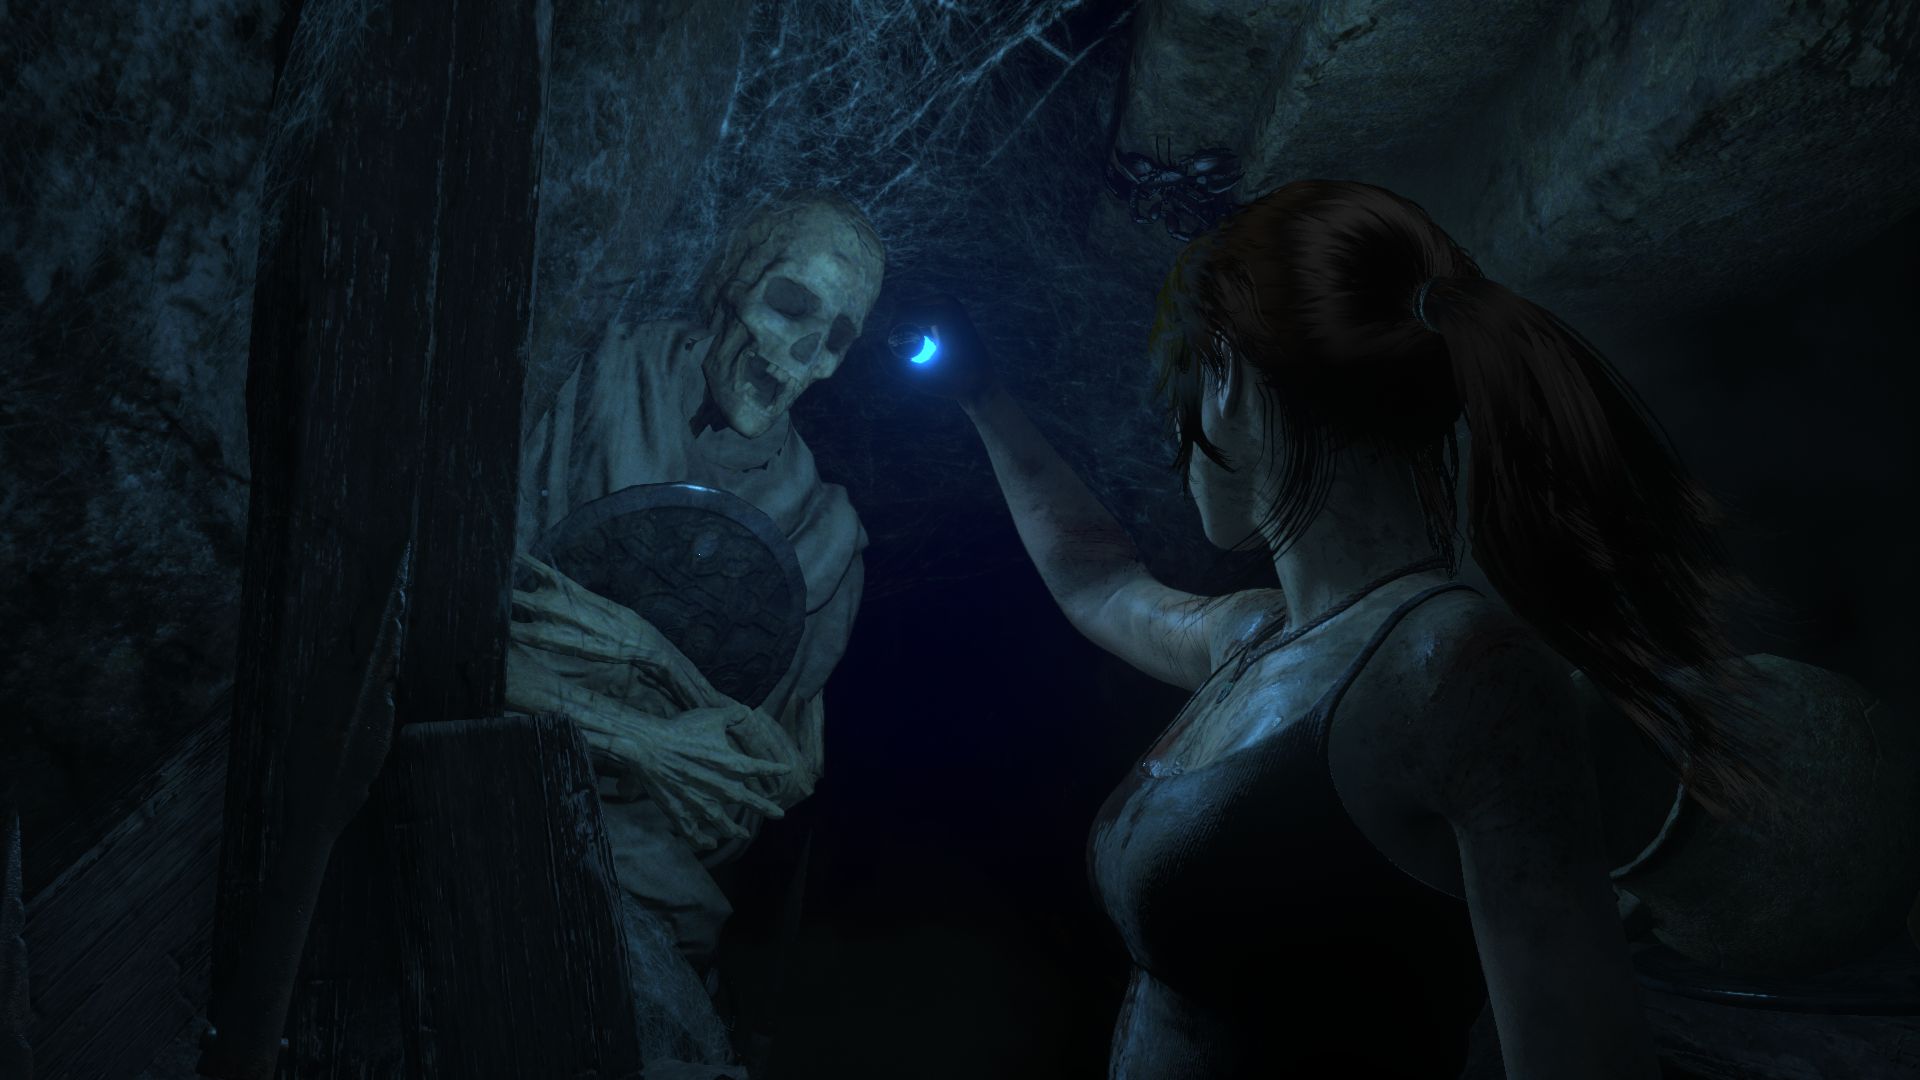
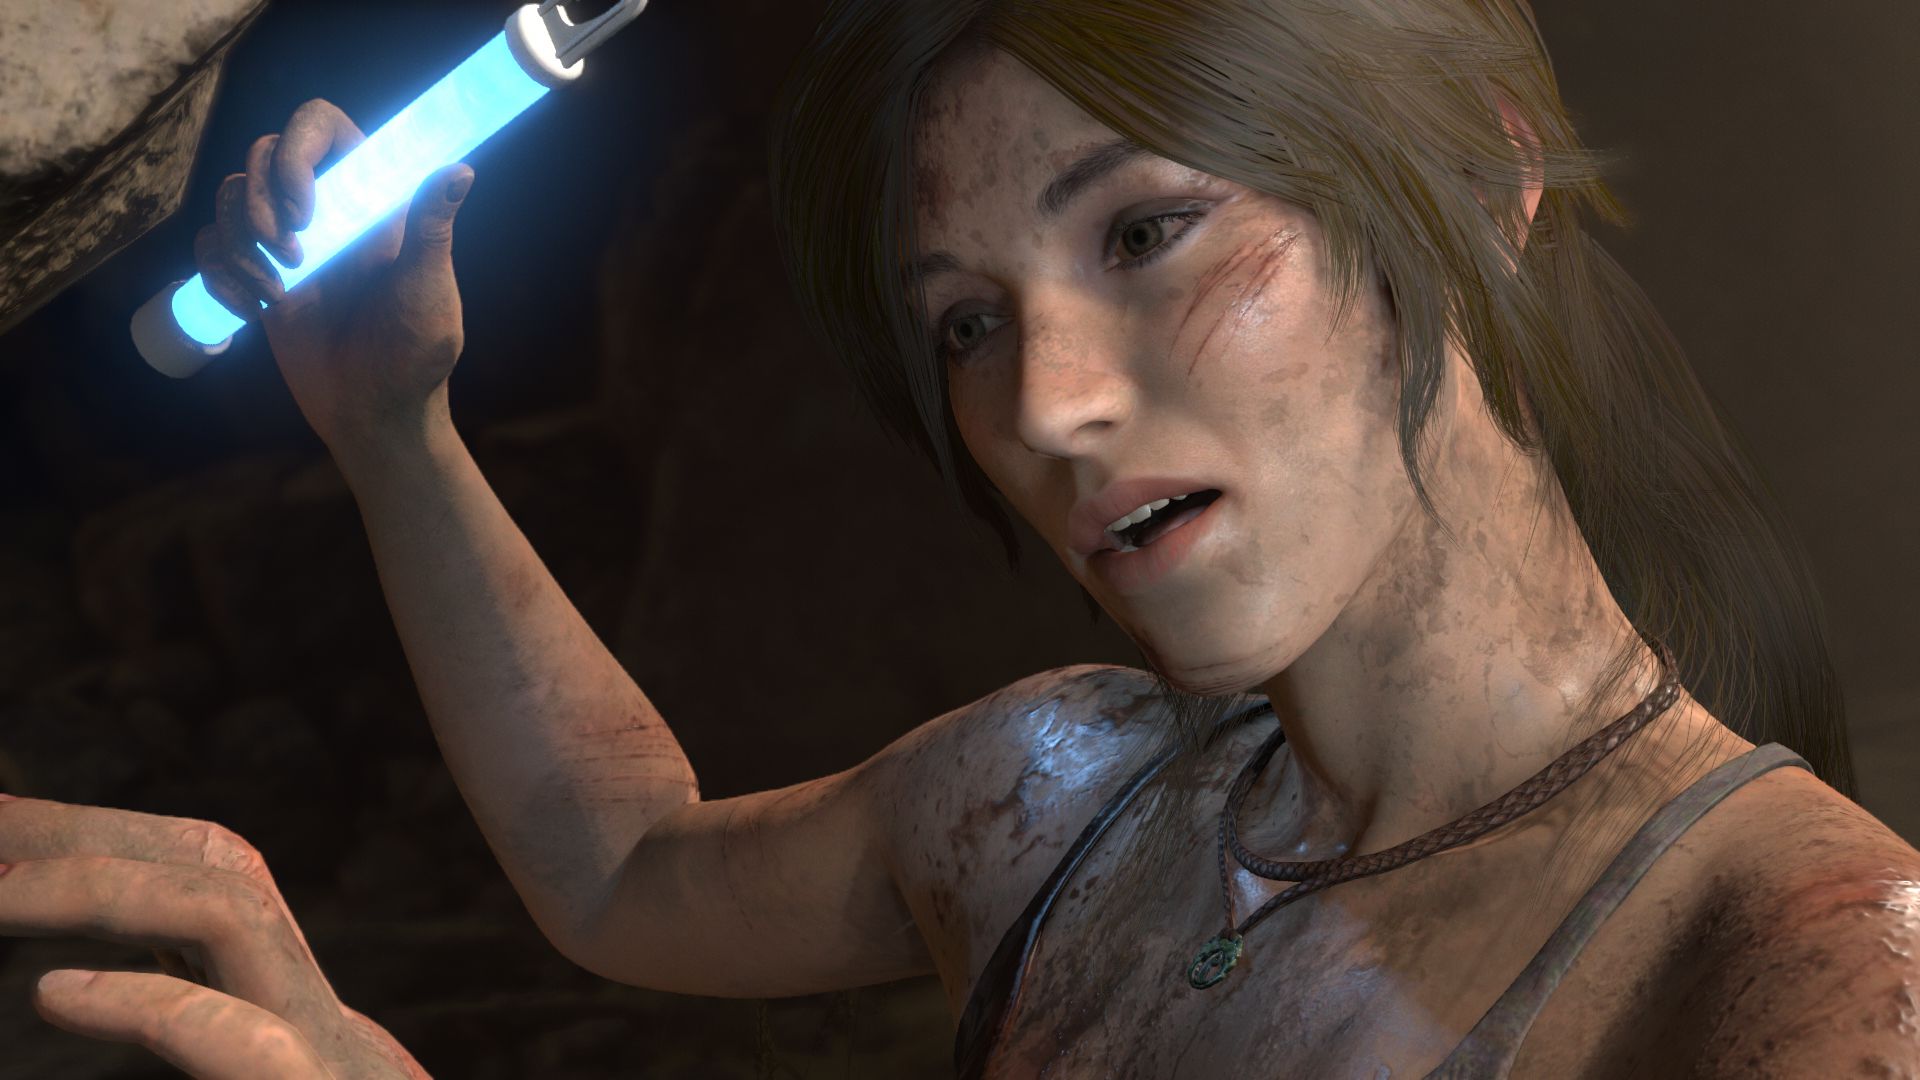
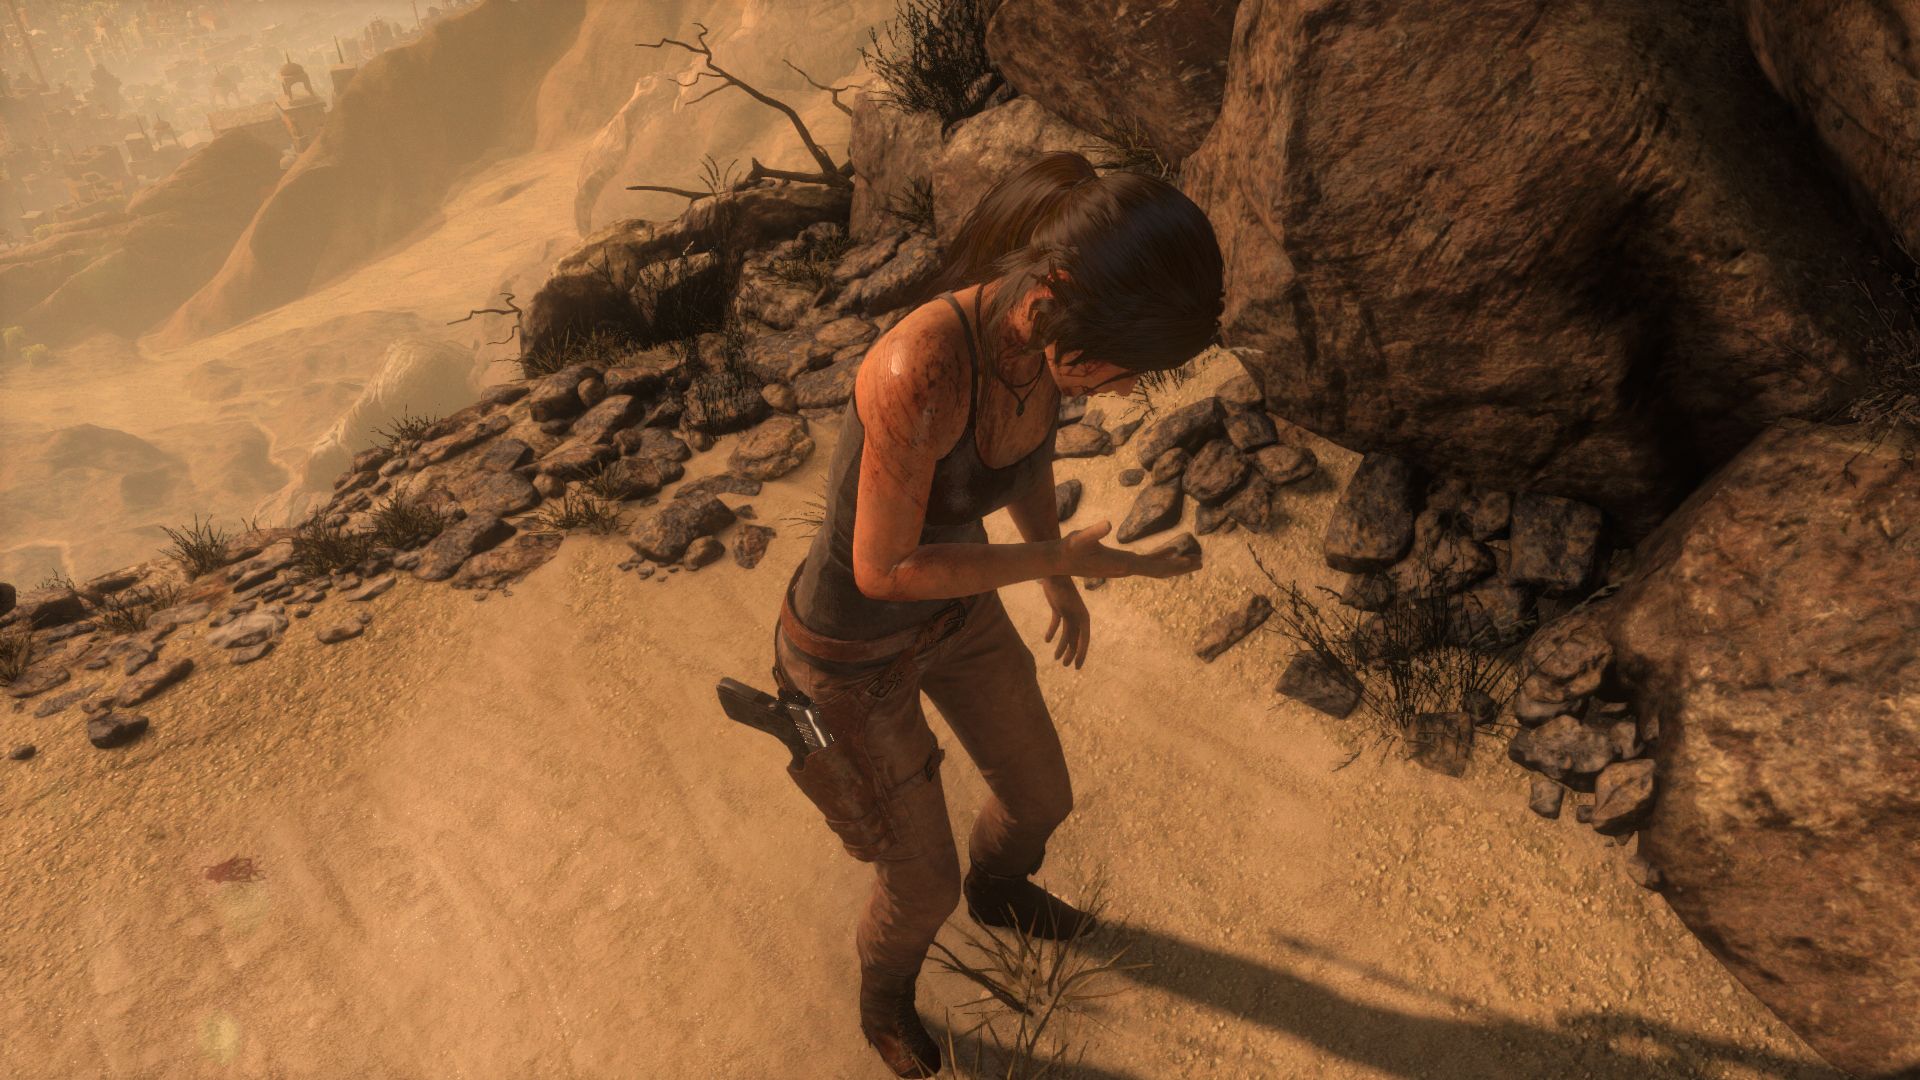
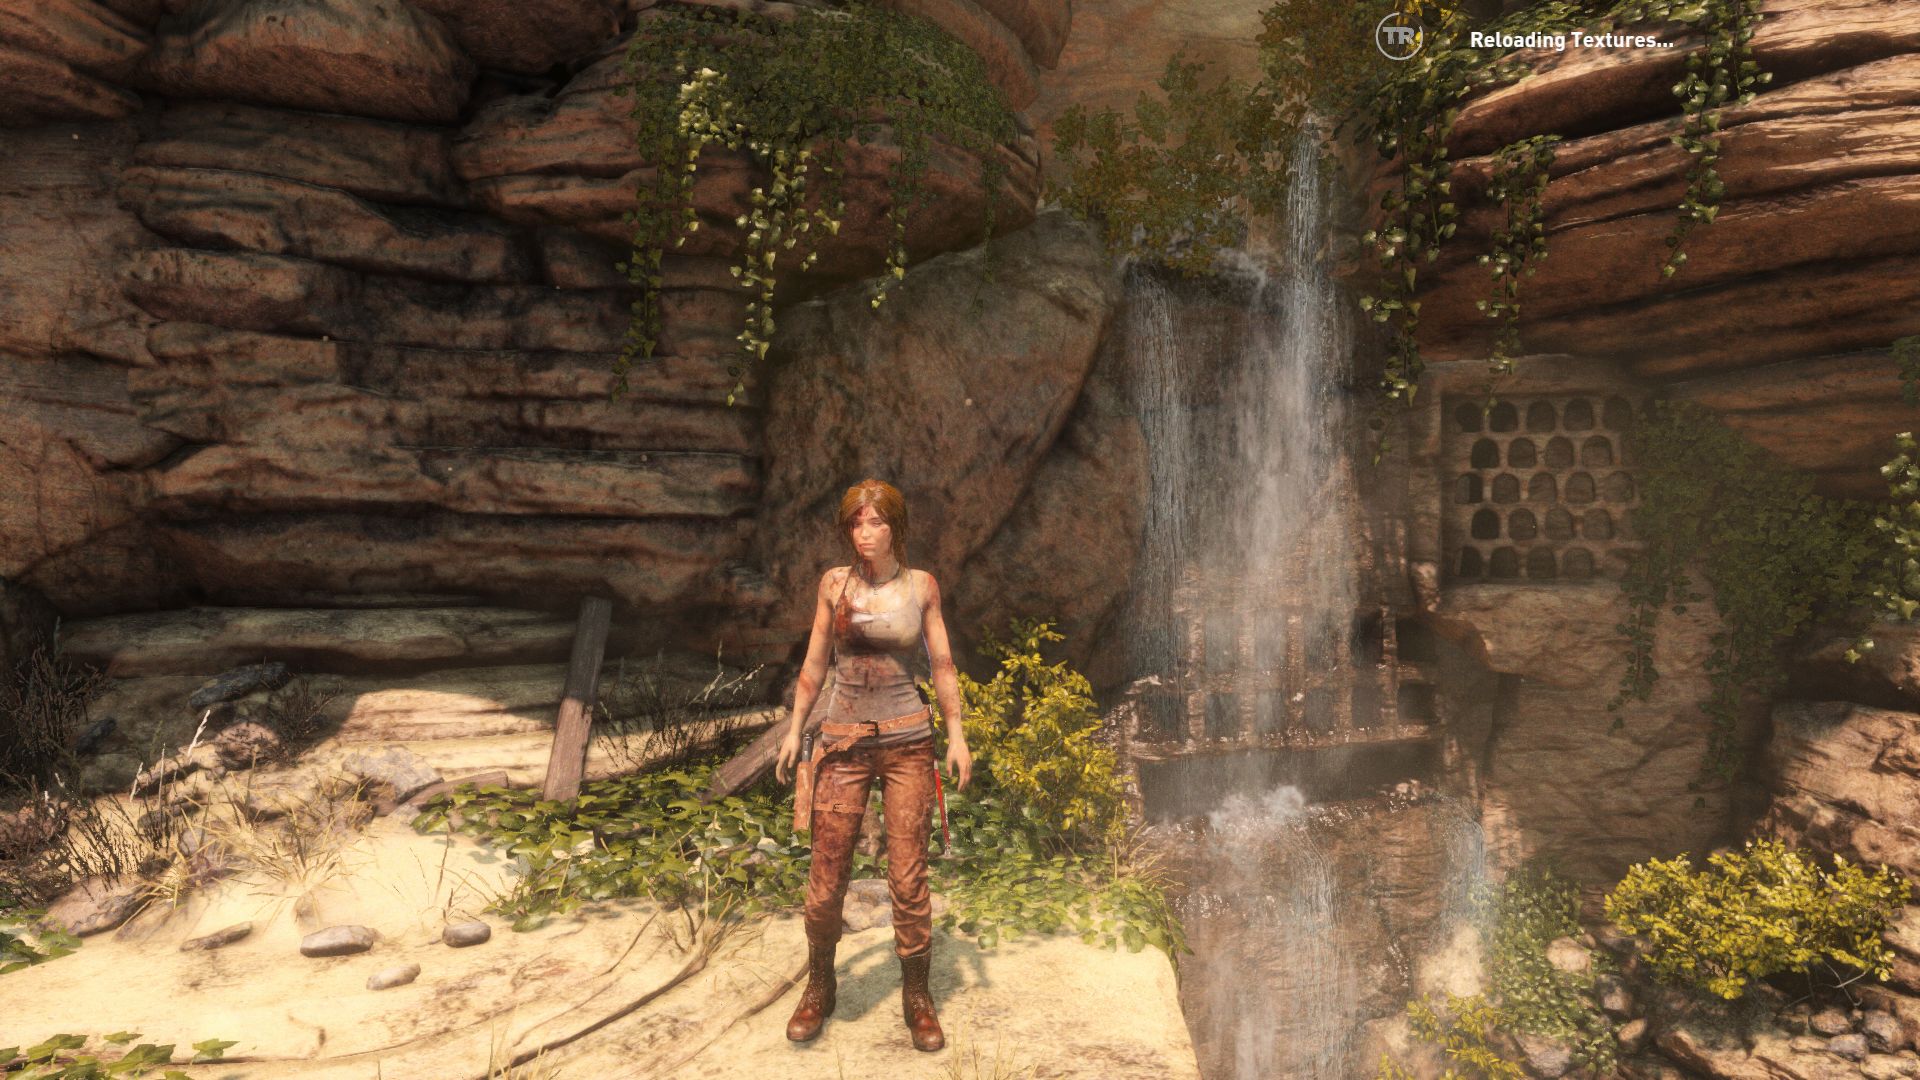
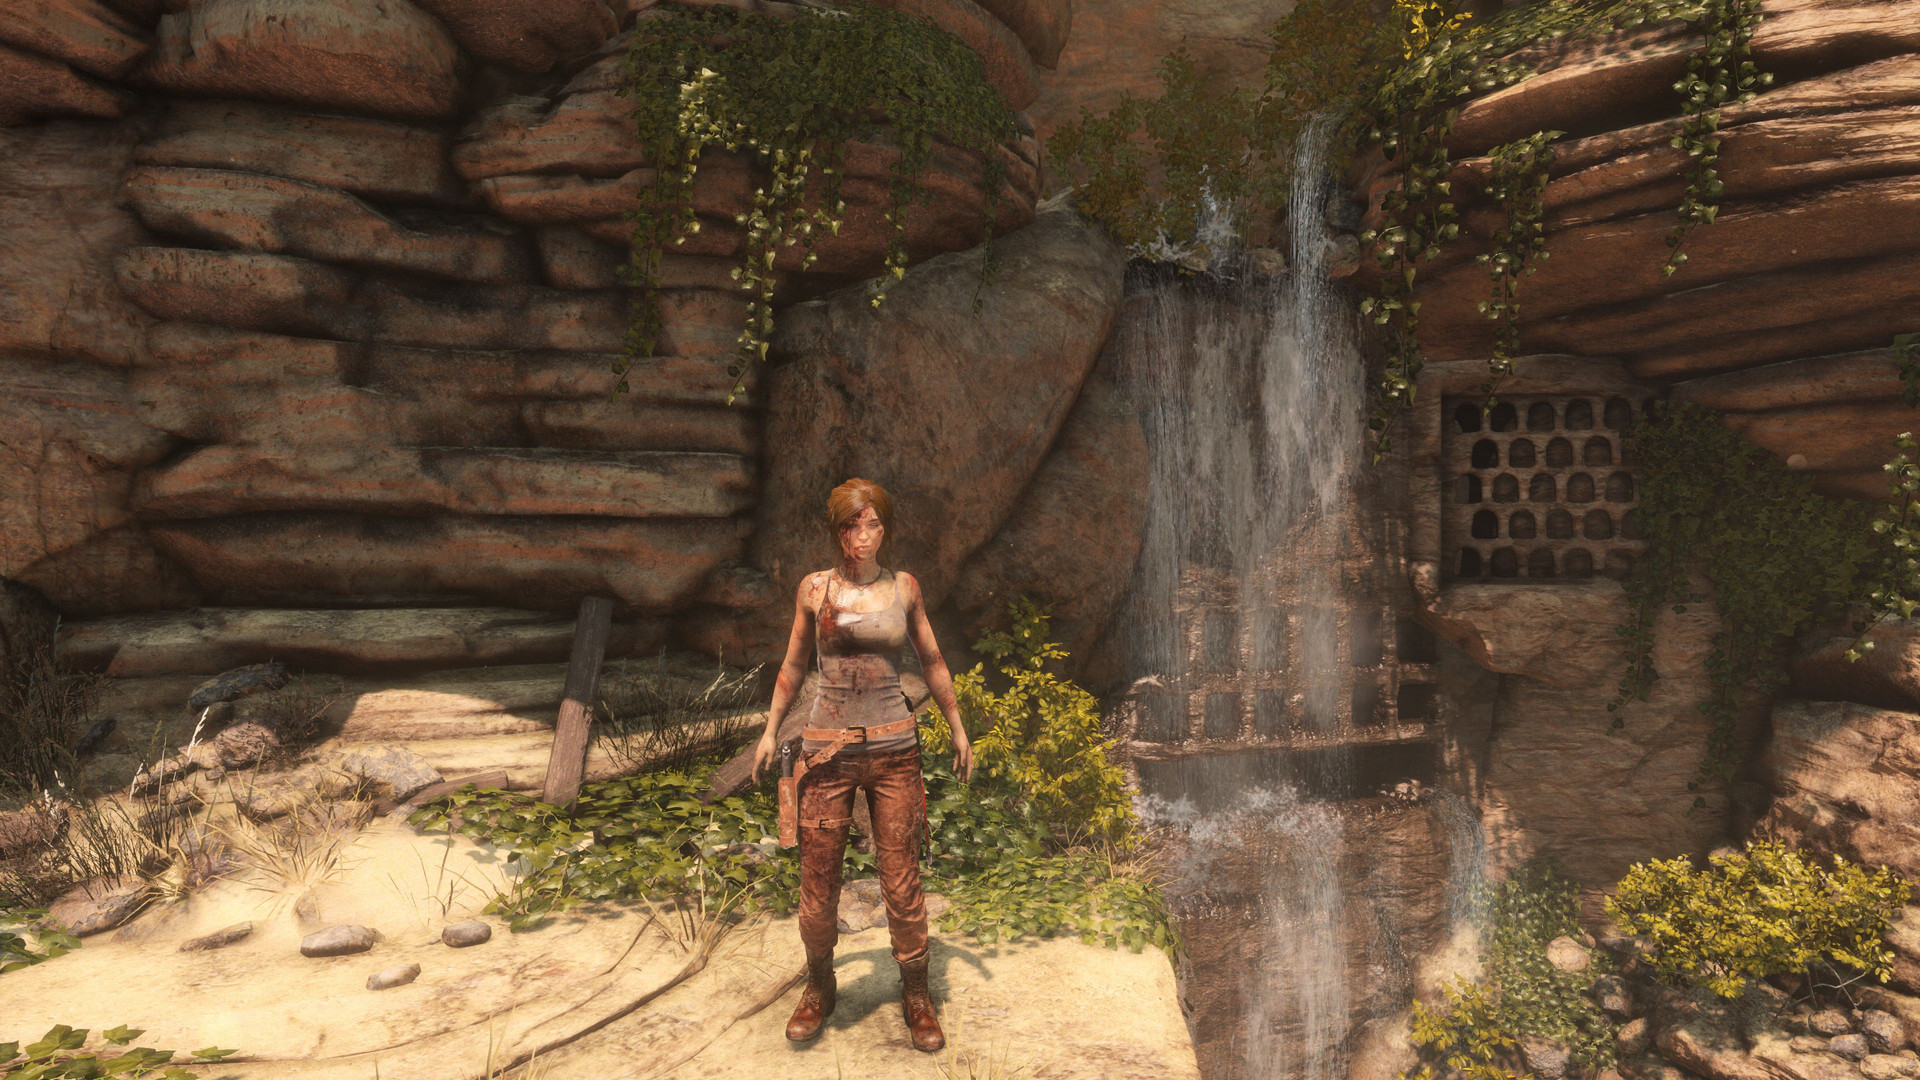
Rise of the Tomb Raider is based on the Foundation Engine, which was already used for the predecessor. However, the visuals changed a lot compared to the old title. Besides the textures, both the density of objects and particles can convince as well. This means the action adventure can create a great atmosphere, which is supported by diverse levels. You fight, climb and puzzle your way through icy caves, dusty canyons and dreamlike jungle areas during the first couple of hours of the game.

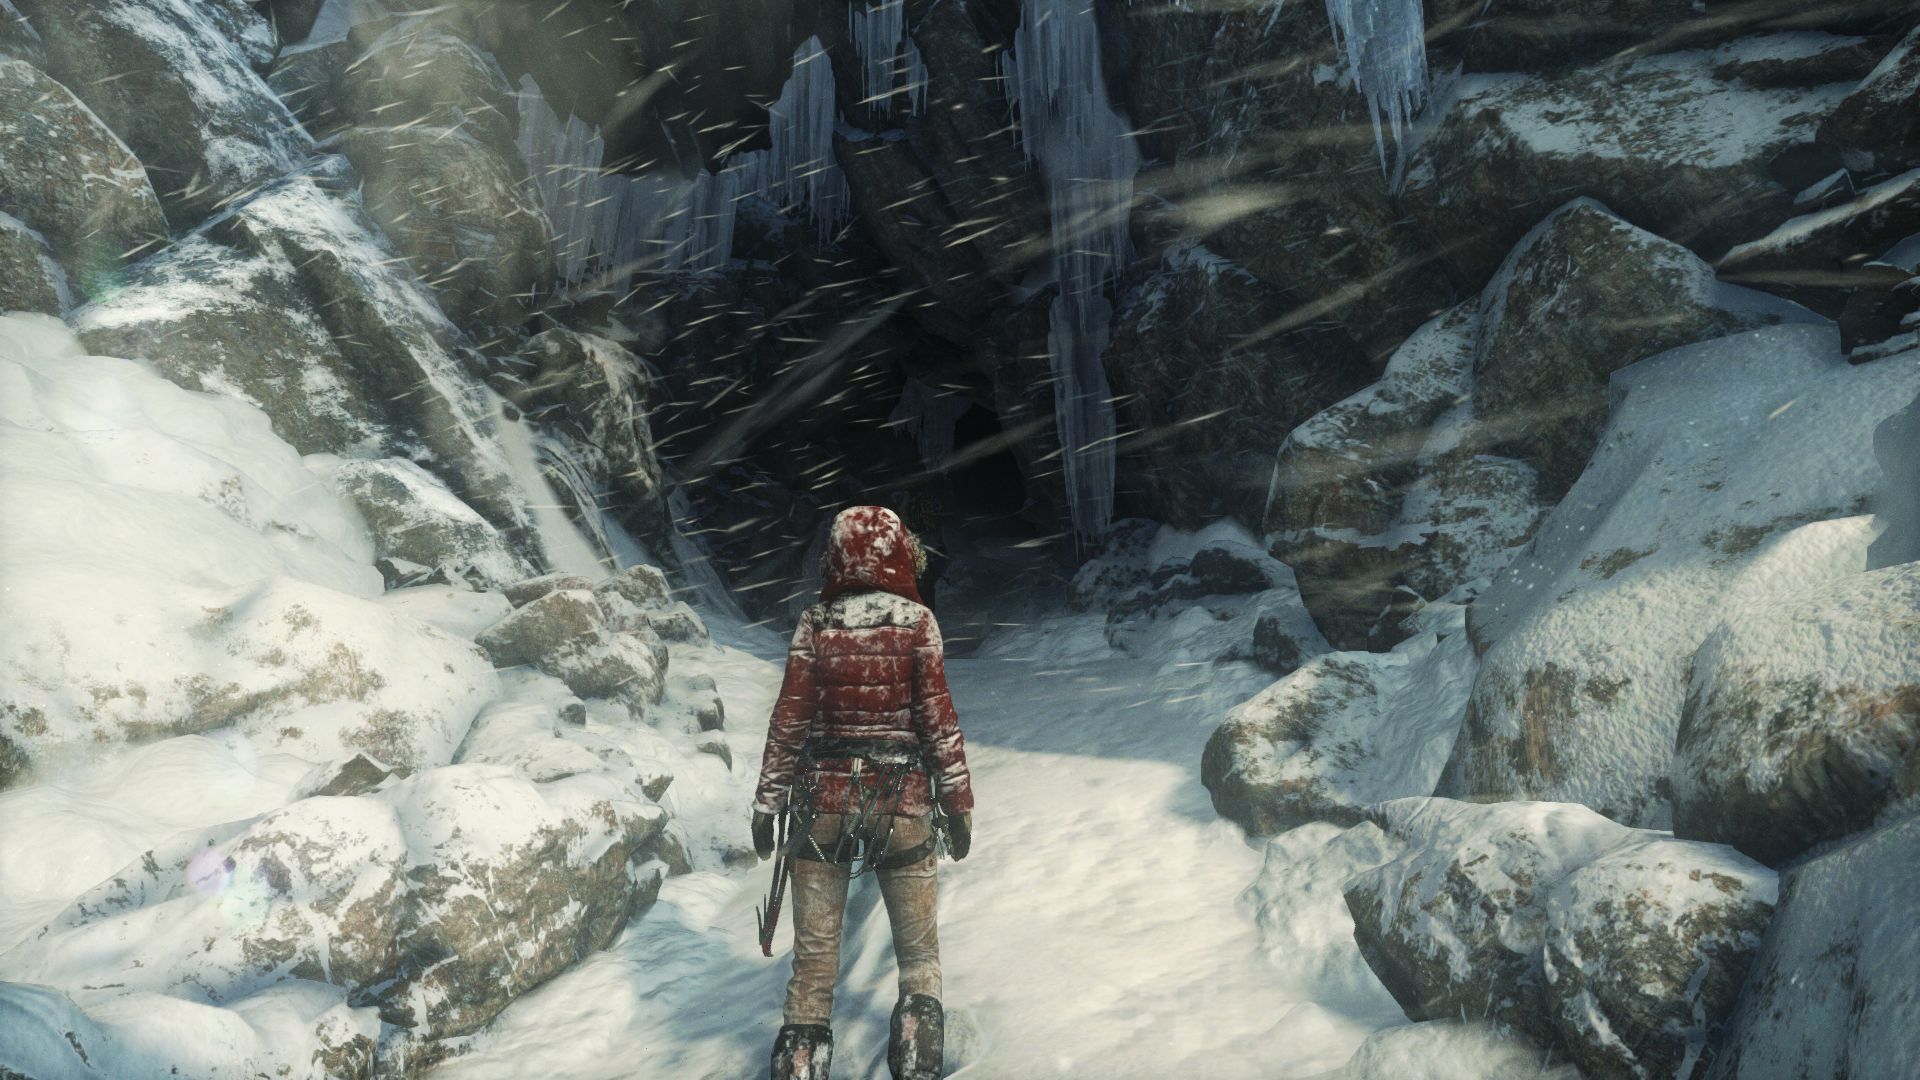
We were particularly impressed by two special effects, which have a very high quality, but do not require a lot of resources. Lara leaves huge traces when she wanders through the snow, which increases the credibility of the world and was not realized in such an efficient way in any previous game.

Rise of the Tomb Raider

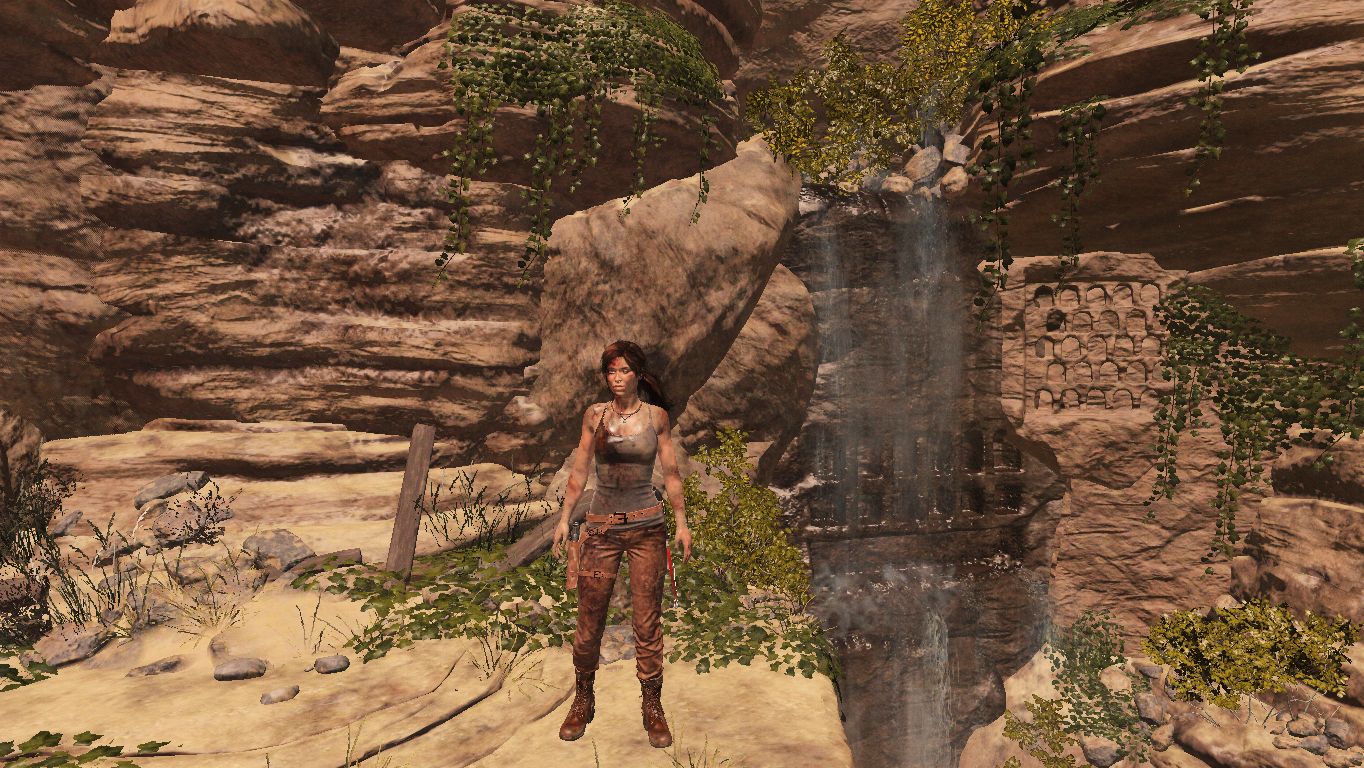
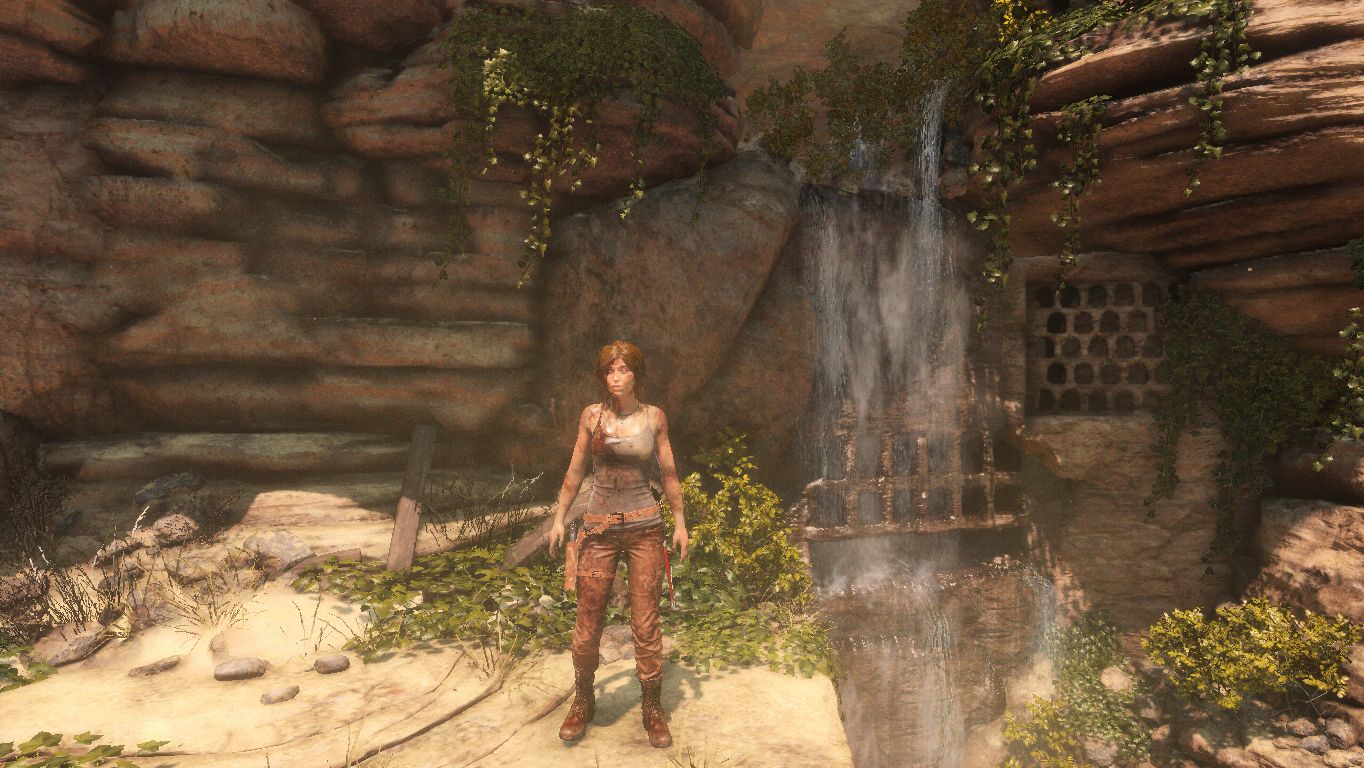
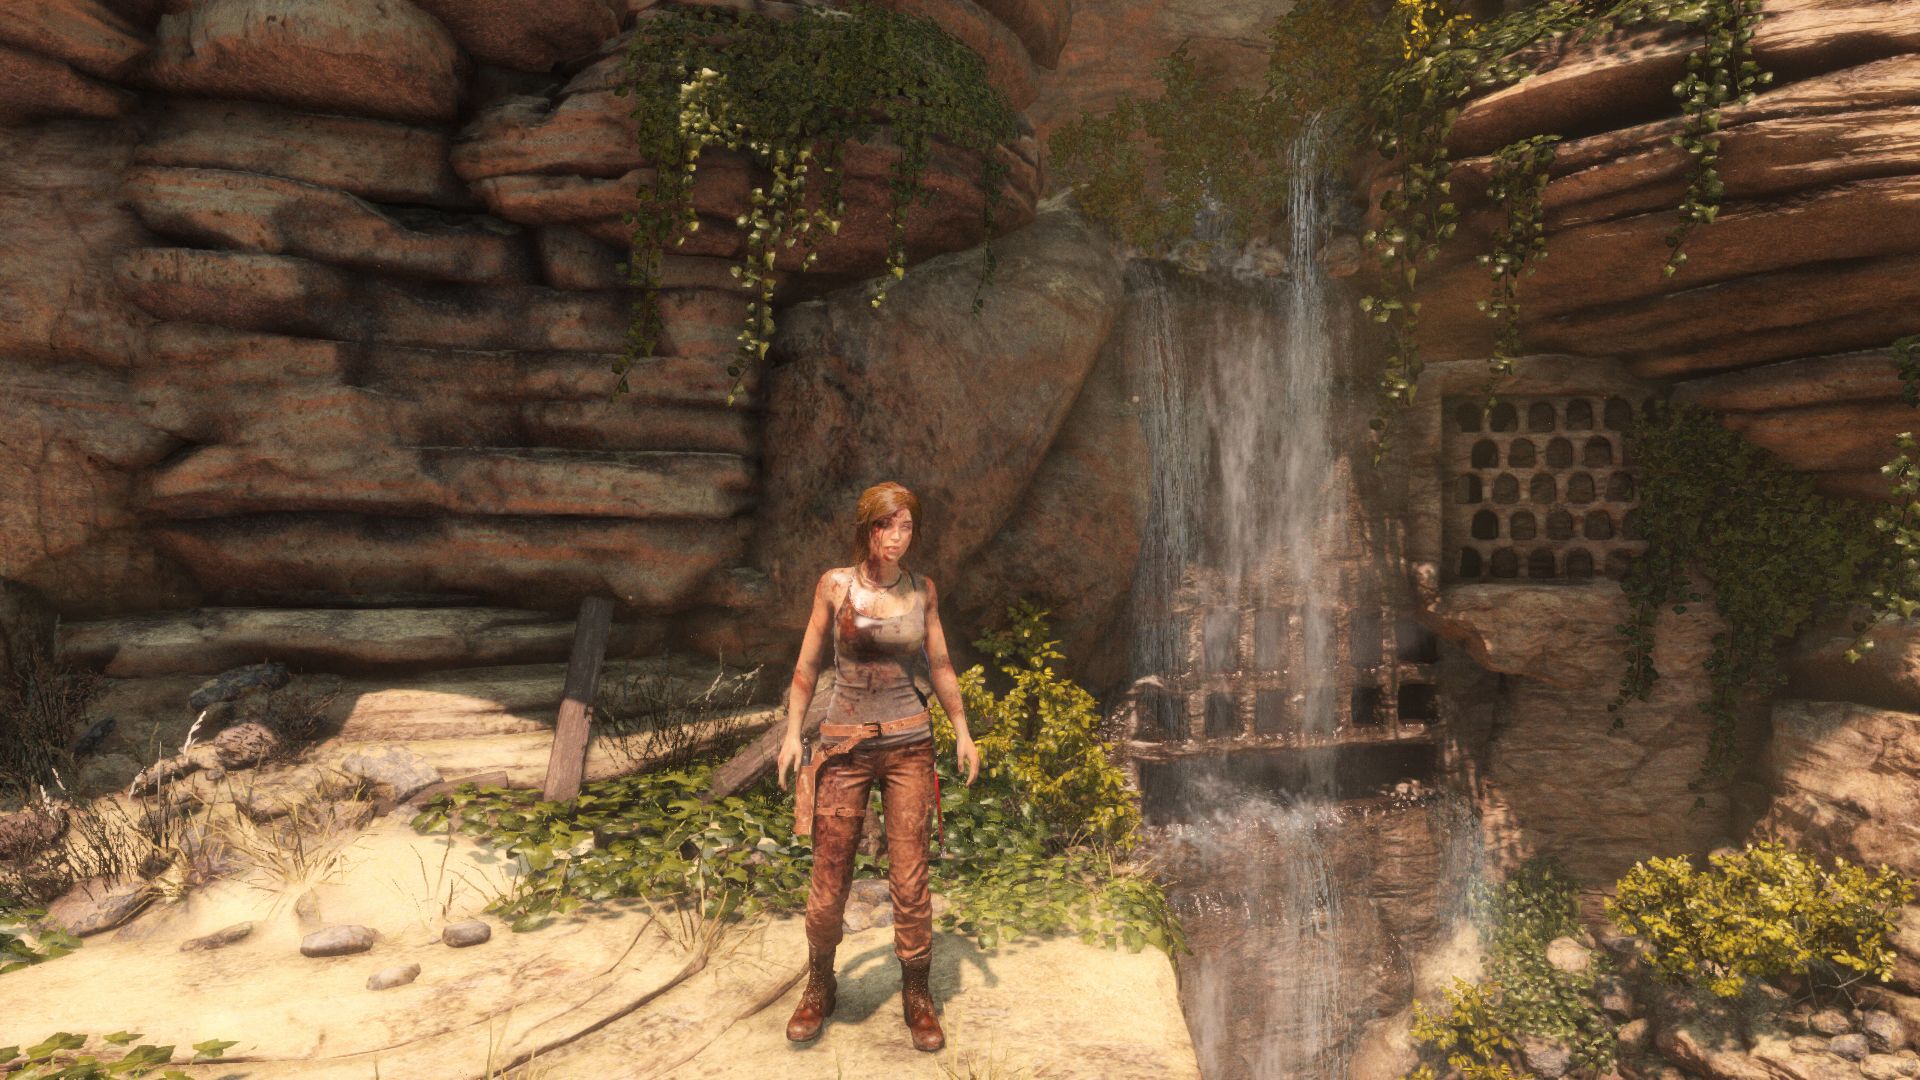
The biggest highlight in our opinion is the hair simulation PureHair, which originates from AMD's TressFX. While the technology of the predecessor still needed a lot of resources and was primarily designed for AMD GPUs, PureHair now runs much faster (also on Nvidia GPUs), and it appears much more authentic. Our pictures show that there is hardly a difference between the setting On and Very High, whereas the deactivation of PureHair has a big impact.

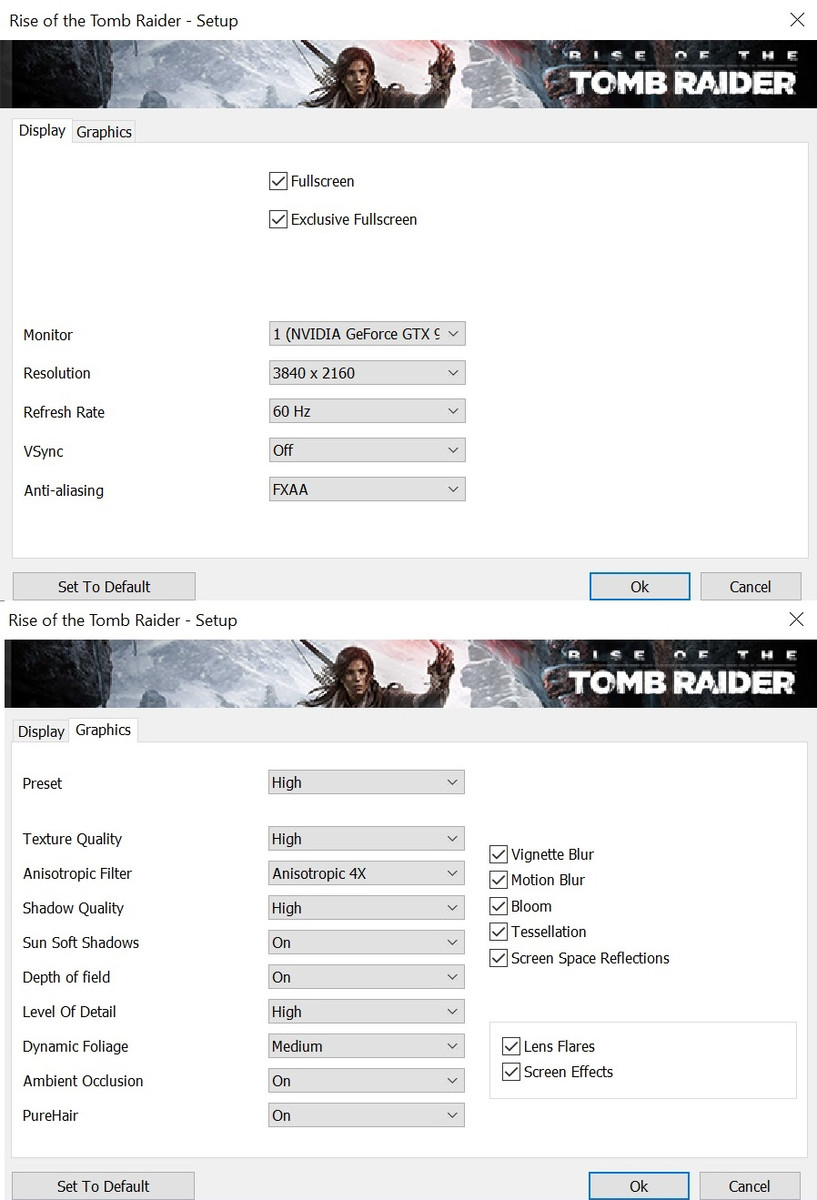
Speaking of settings: The PC port was once again handled by the studio Nixxes from the Netherlands, who – except for the pretty high requirements – did a very good job. Similar to the last Tomb Raider, you can adjust the settings outside and within the game. Great: Changes within the game do not require a restart, there is only a short transition period (reloading textures, etc.).

Rise of the Tomb Raider

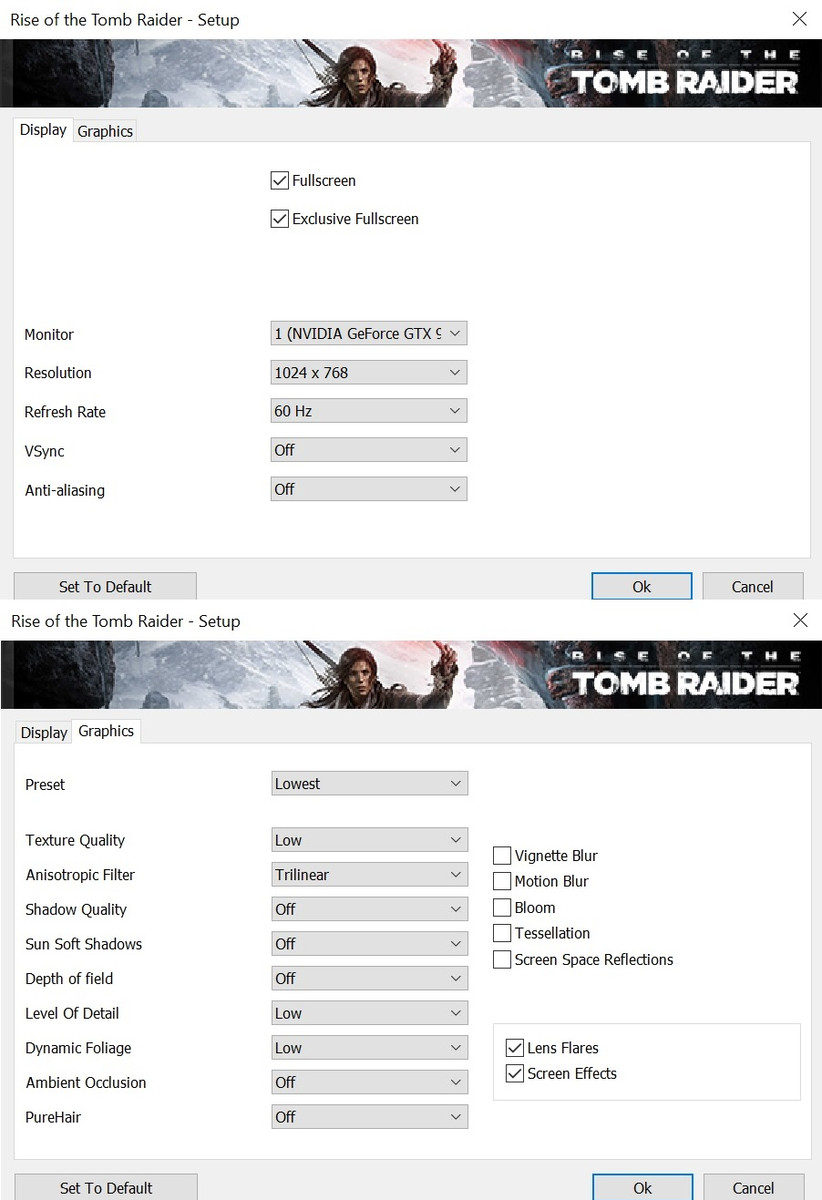
Another advantage is the large number of options, which were divided into two sub-menus. As usual, you can use Display to change the resolution and – when the option Exclusive Fullscreen is enabled – the refresh rate. A vertical synchronization is also available. The developers waived a general limitation of the frame rate. Otherwise, you can only adjust the anti-aliasing in the Display tab. While the post processing versions FXAA and SMAA do not deliver very good results (and can create a blurry picture), SSAA costs a lot of performance, so you should avoid it, at least when you use a notebook.

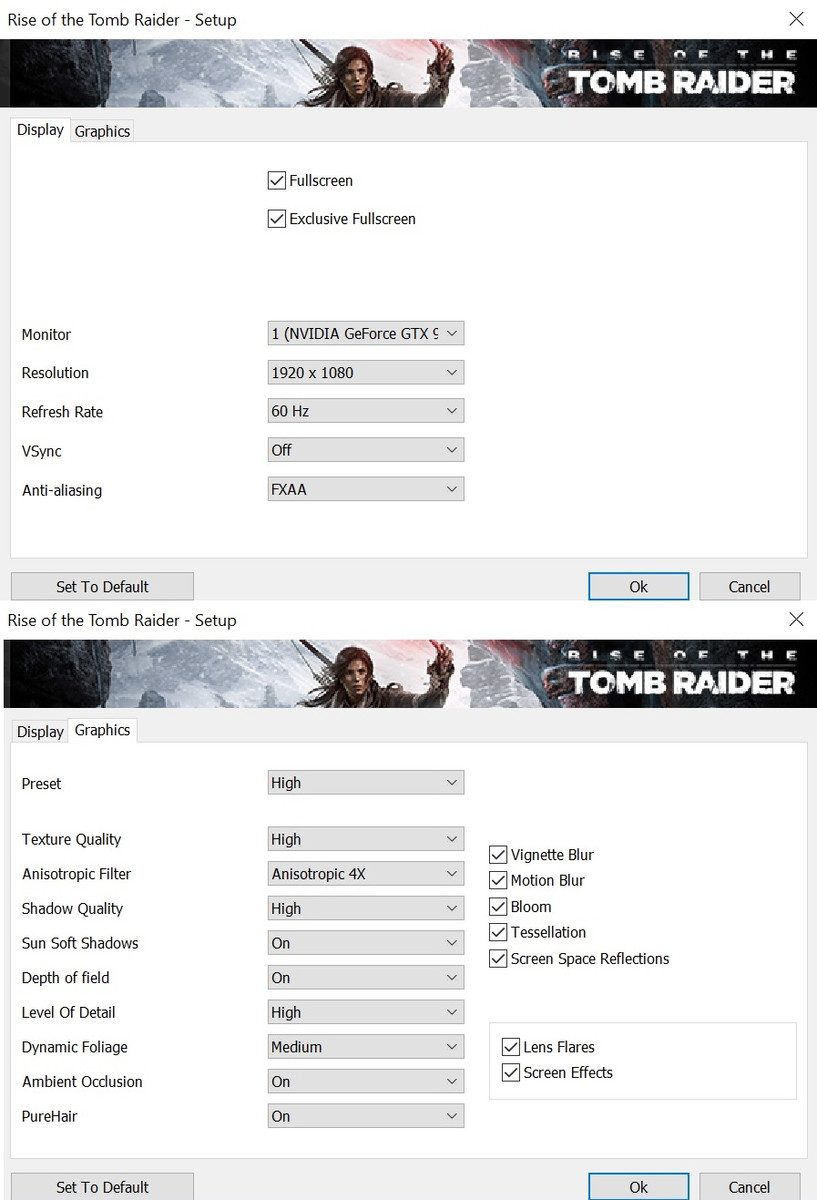
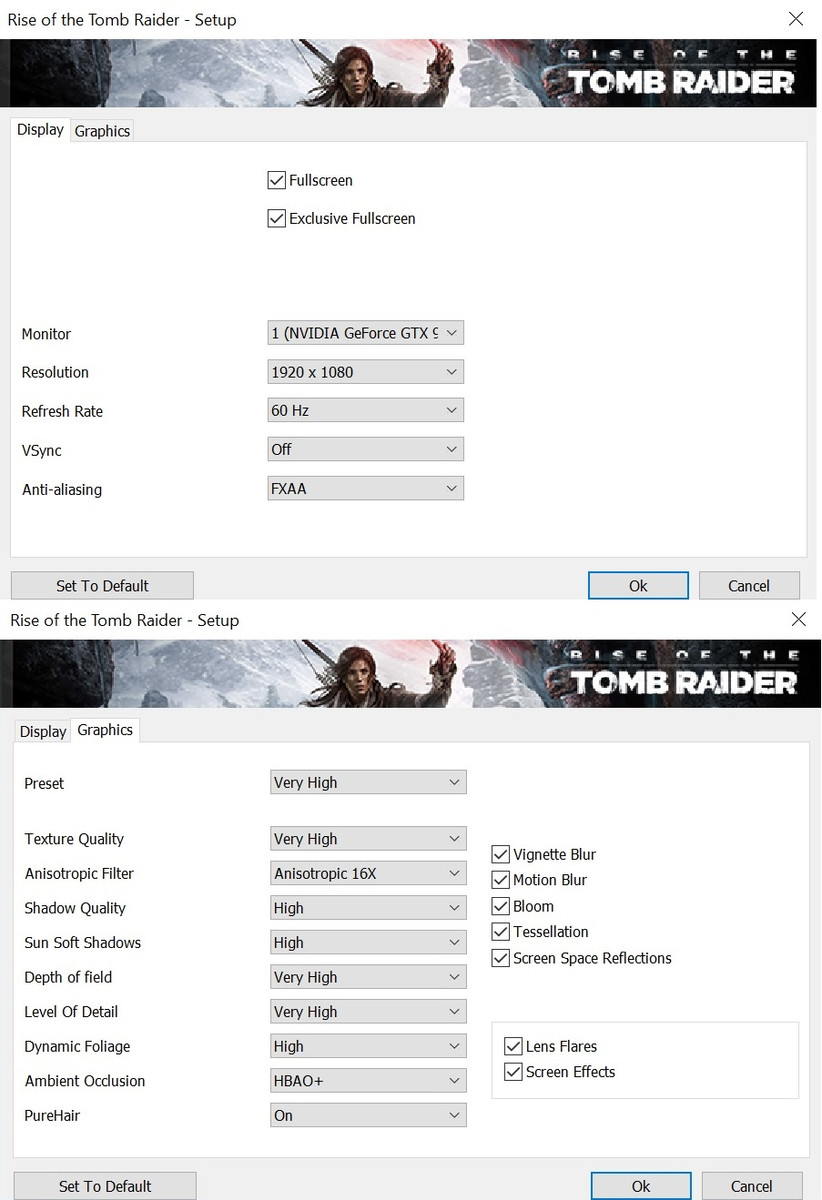
This leaves us with the Graphics menu, which includes dozens of settings. If you don't want to fiddle with all of them, you can also use one of five presets, which adjust the overall quality. You can argue about the presets though. Very High, for instance, does not always mean very high. If you want to experience Tomb Raider in the highest quality, you will have to adjust the settings by hand and select the highest options.

Rise of the Tomb Raider

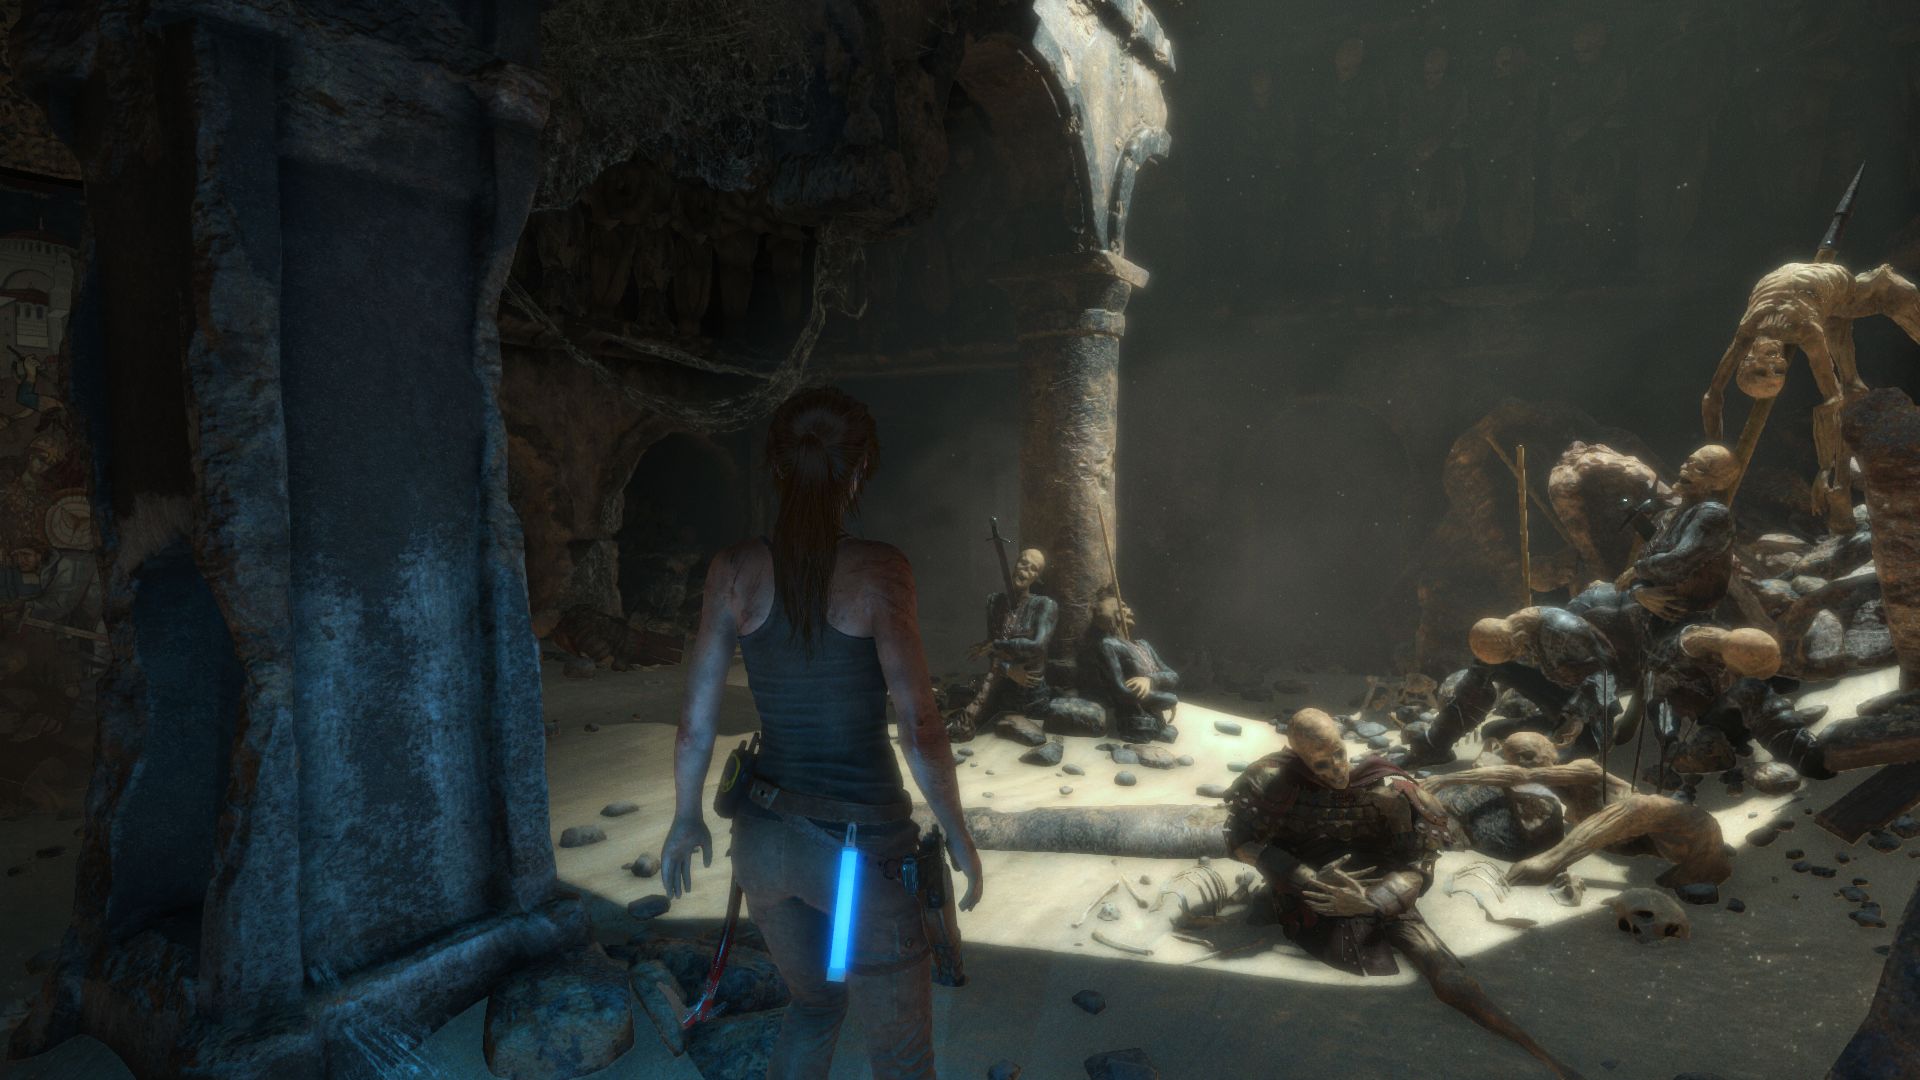
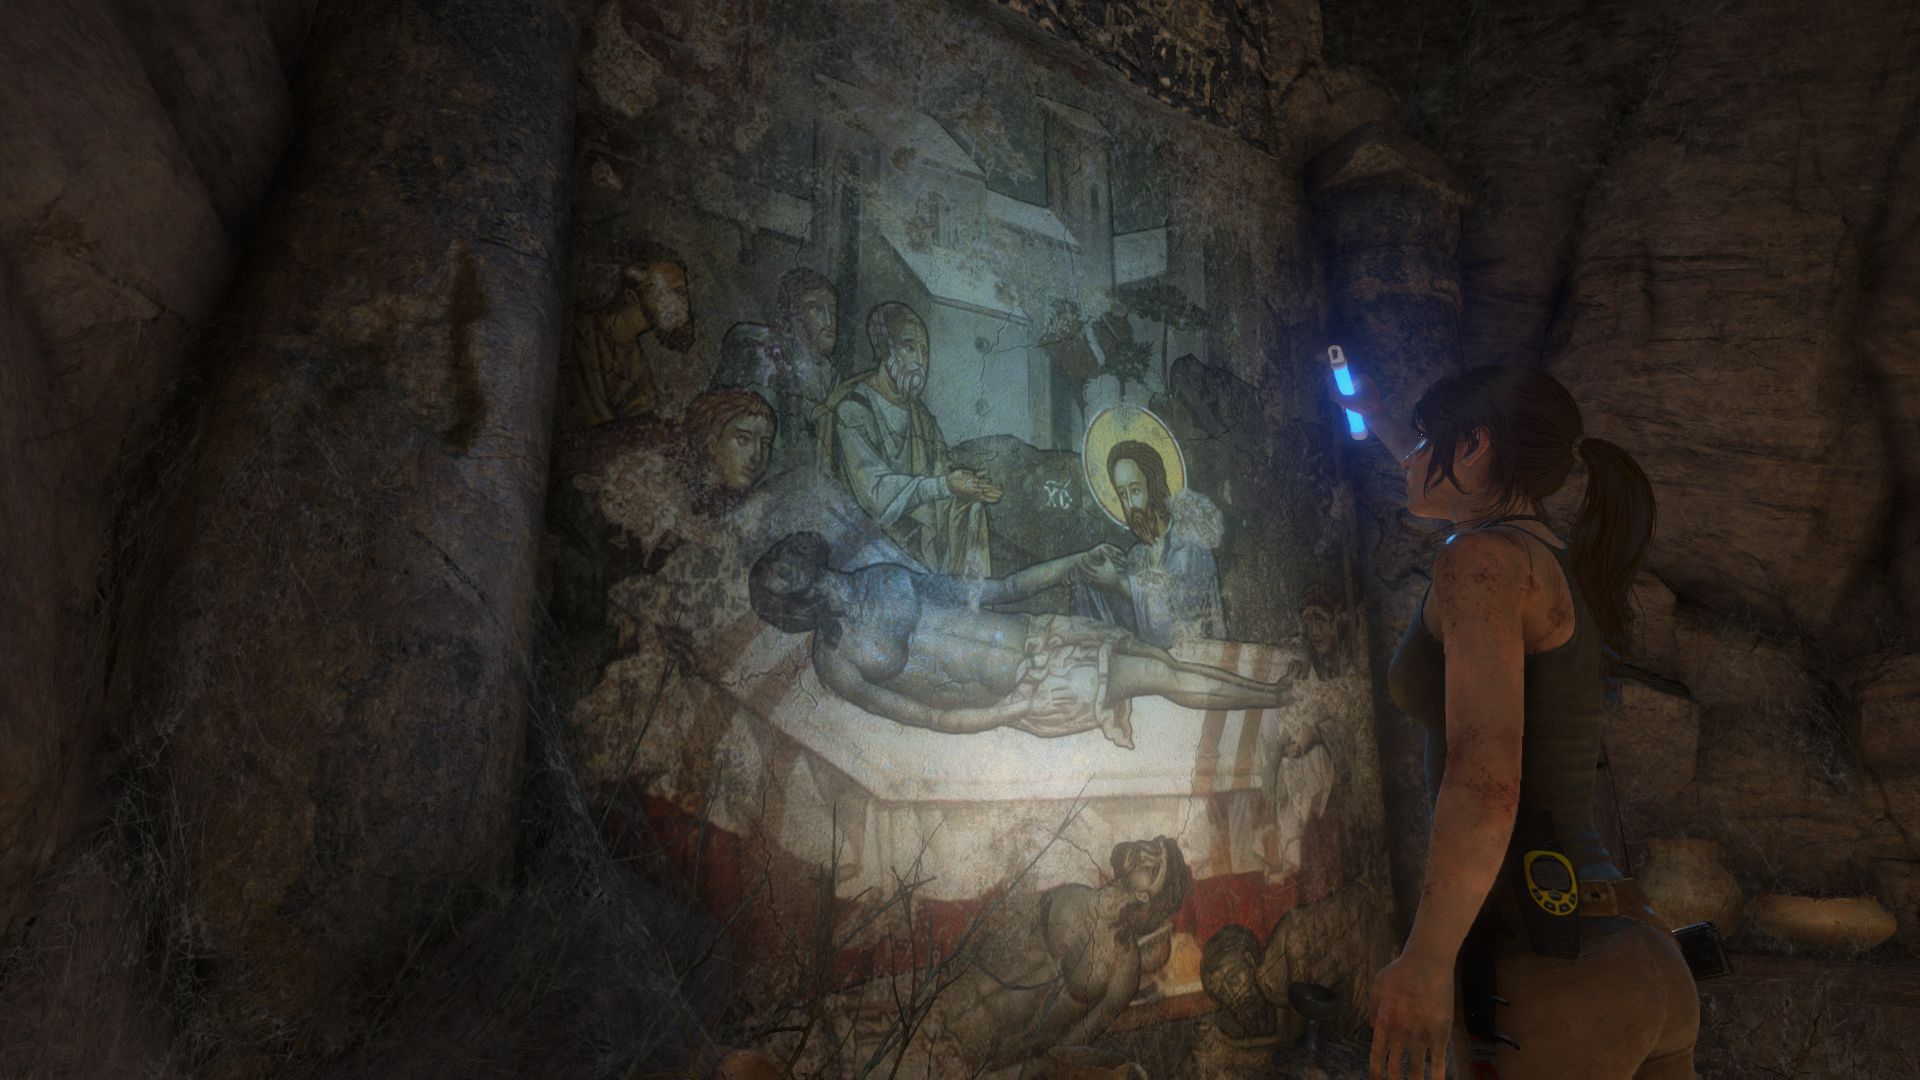
The third-person shooter supports numerous modern effects like HBAO+ and tessellation, some of which are exclusive on the PC. The game looks pretty good with Medium settings, even though the best graphics are obviously reserved for the High or Very High presets. You should avoid the preset Low if possible, because the missing shadows, the weak illumination and the blurry textures will affect the atmosphere significantly.

All things considered, we would call the PC version surprisingly good. This verdict is also supported by the short loading times and the moderate size of the game (almost 20 GB). The gameplay itself leaves a great impression as well: Staging, gameplay, story-telling, size and controls can easily compete with other games.

PureHair Off
PureHair Off
PureHair On
PureHair On
PureHair Very High
PureHair Very High
PureHair Off
PureHair Off
PureHair On
PureHair On
PureHair Very High
PureHair Very High

Benchmark

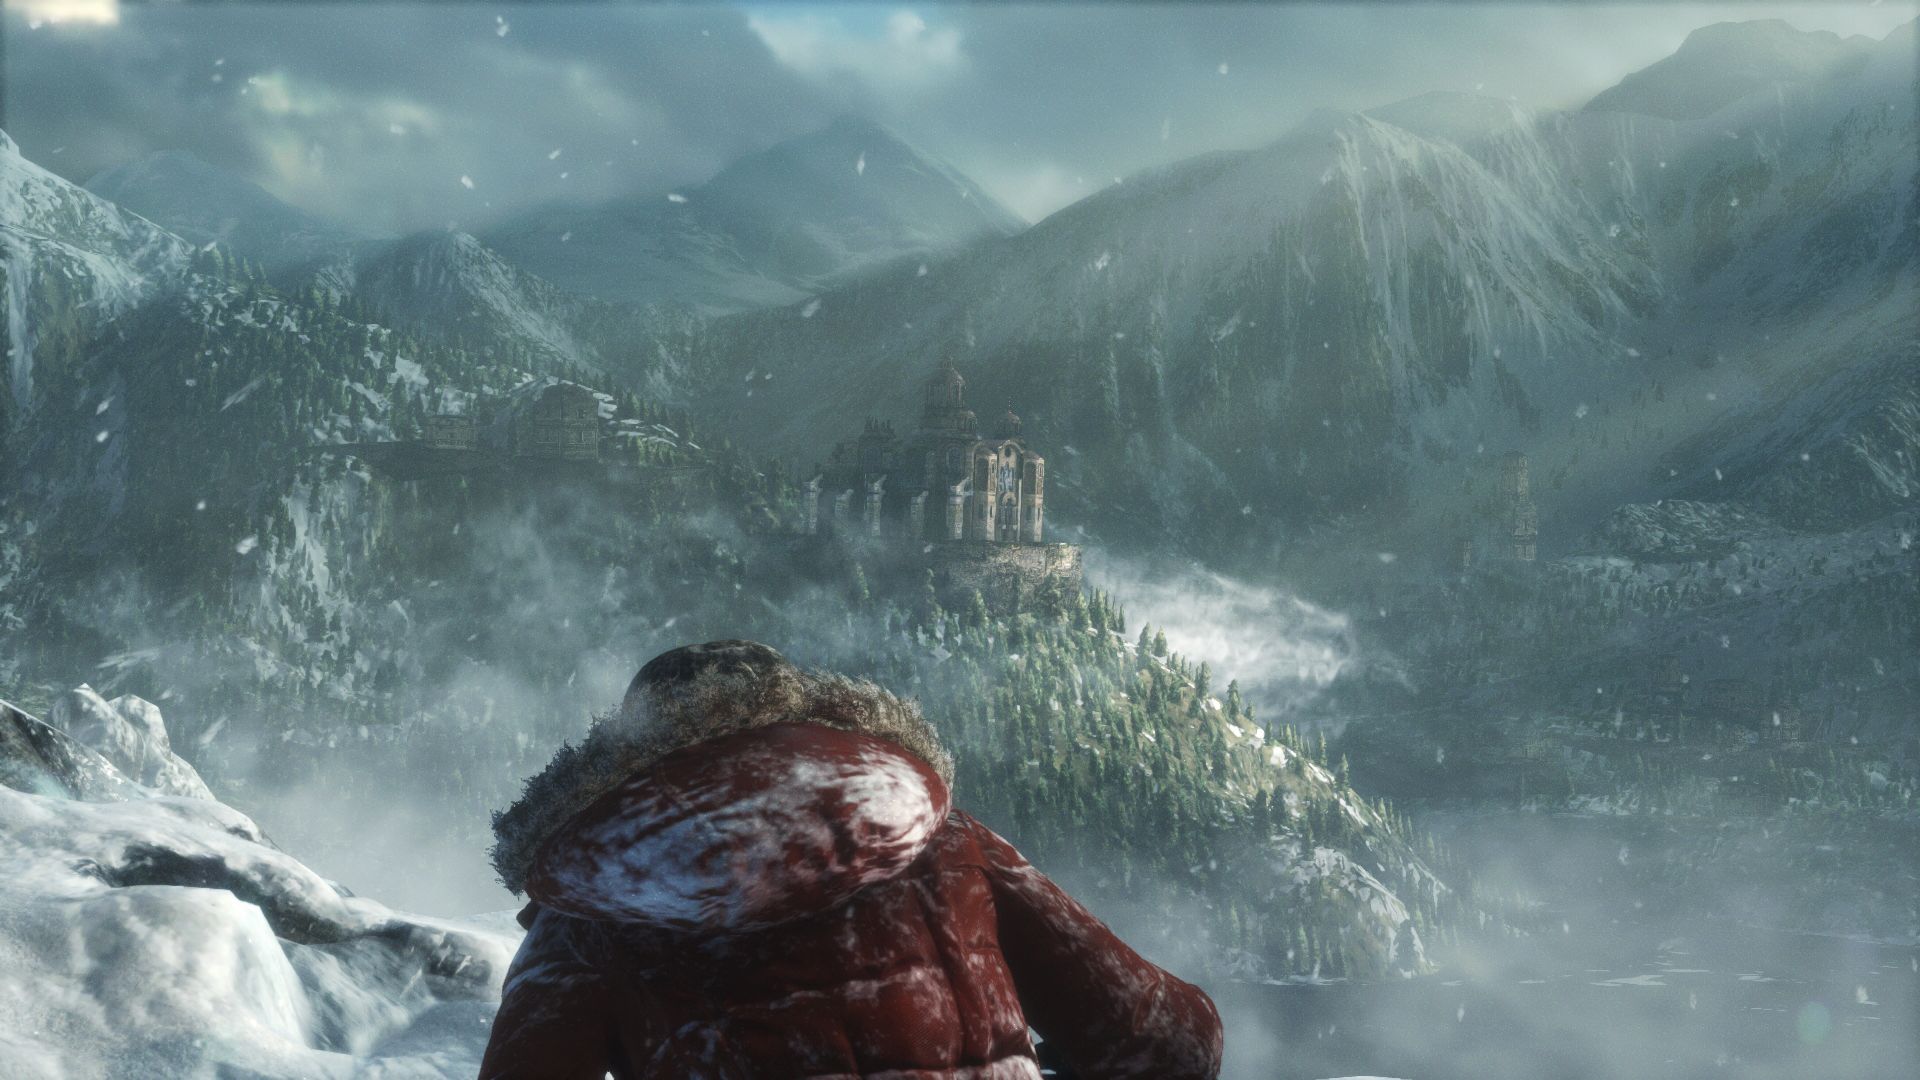
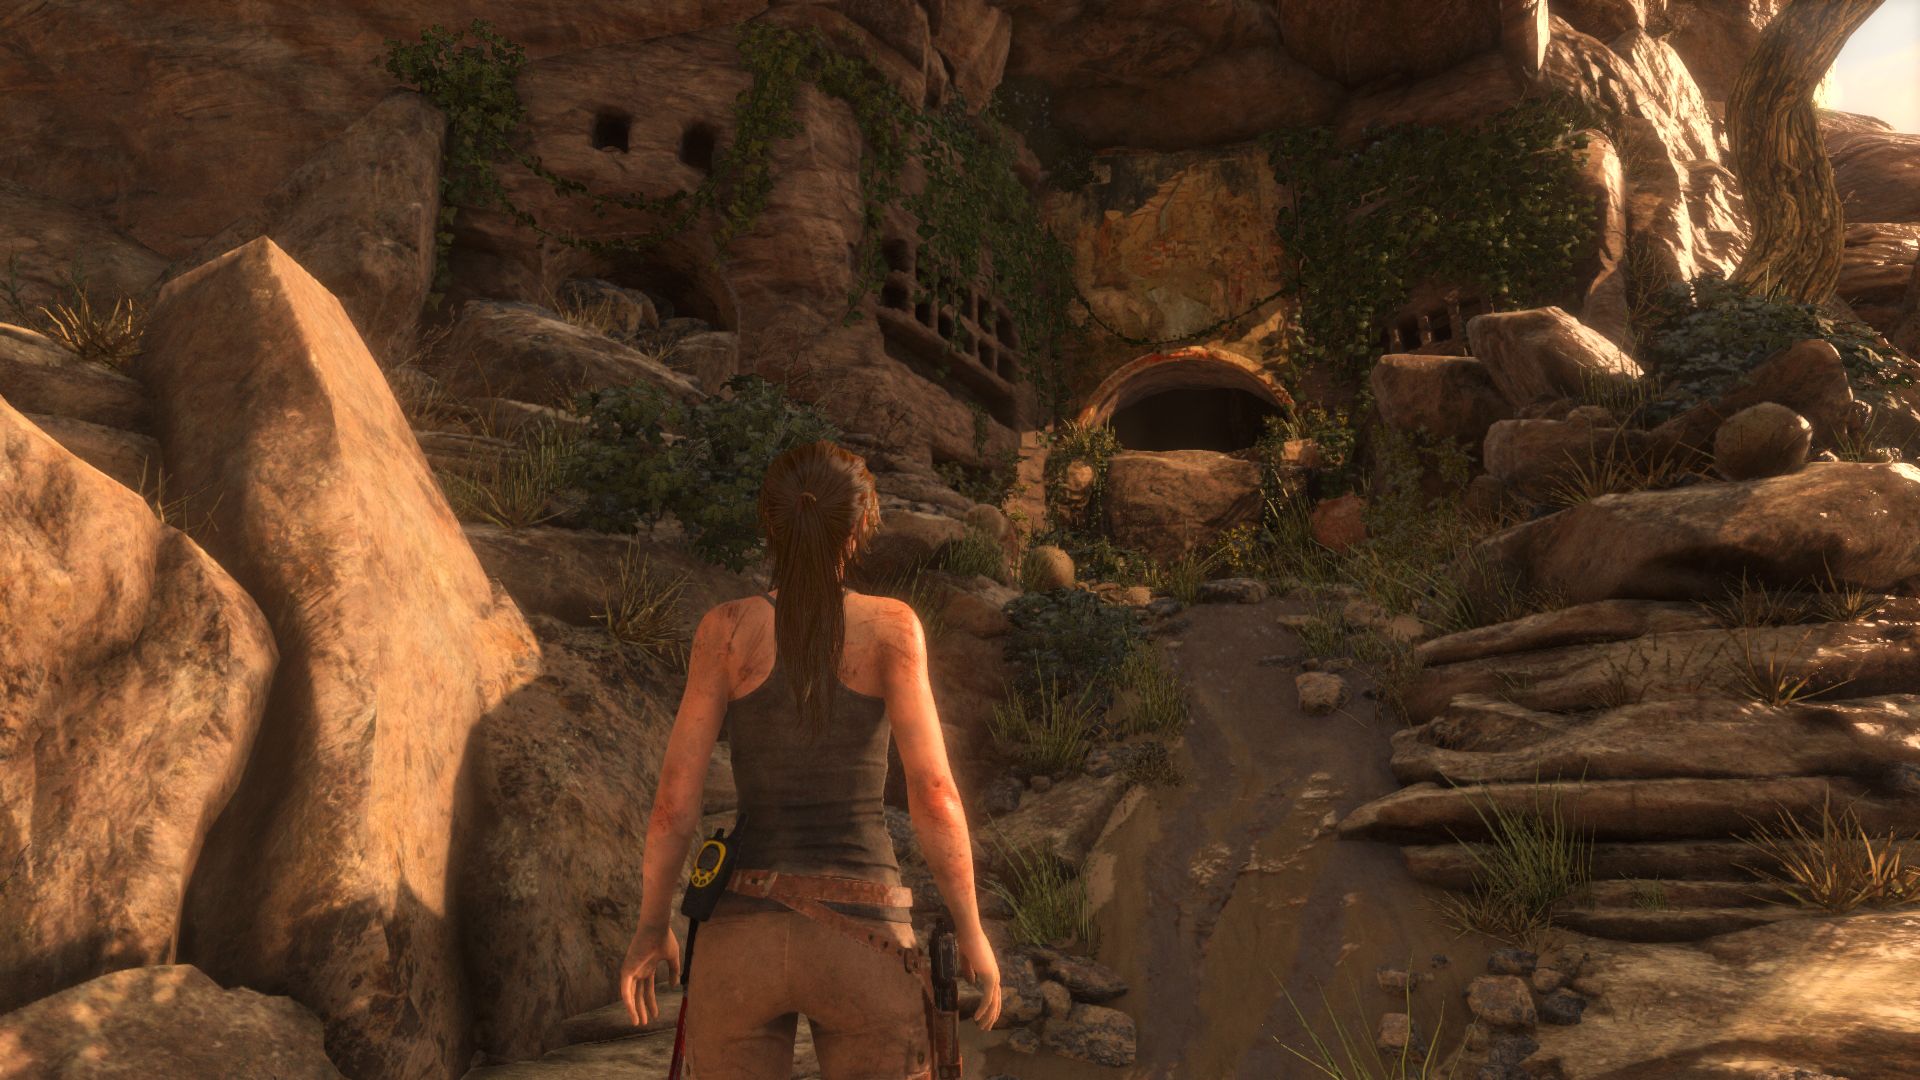
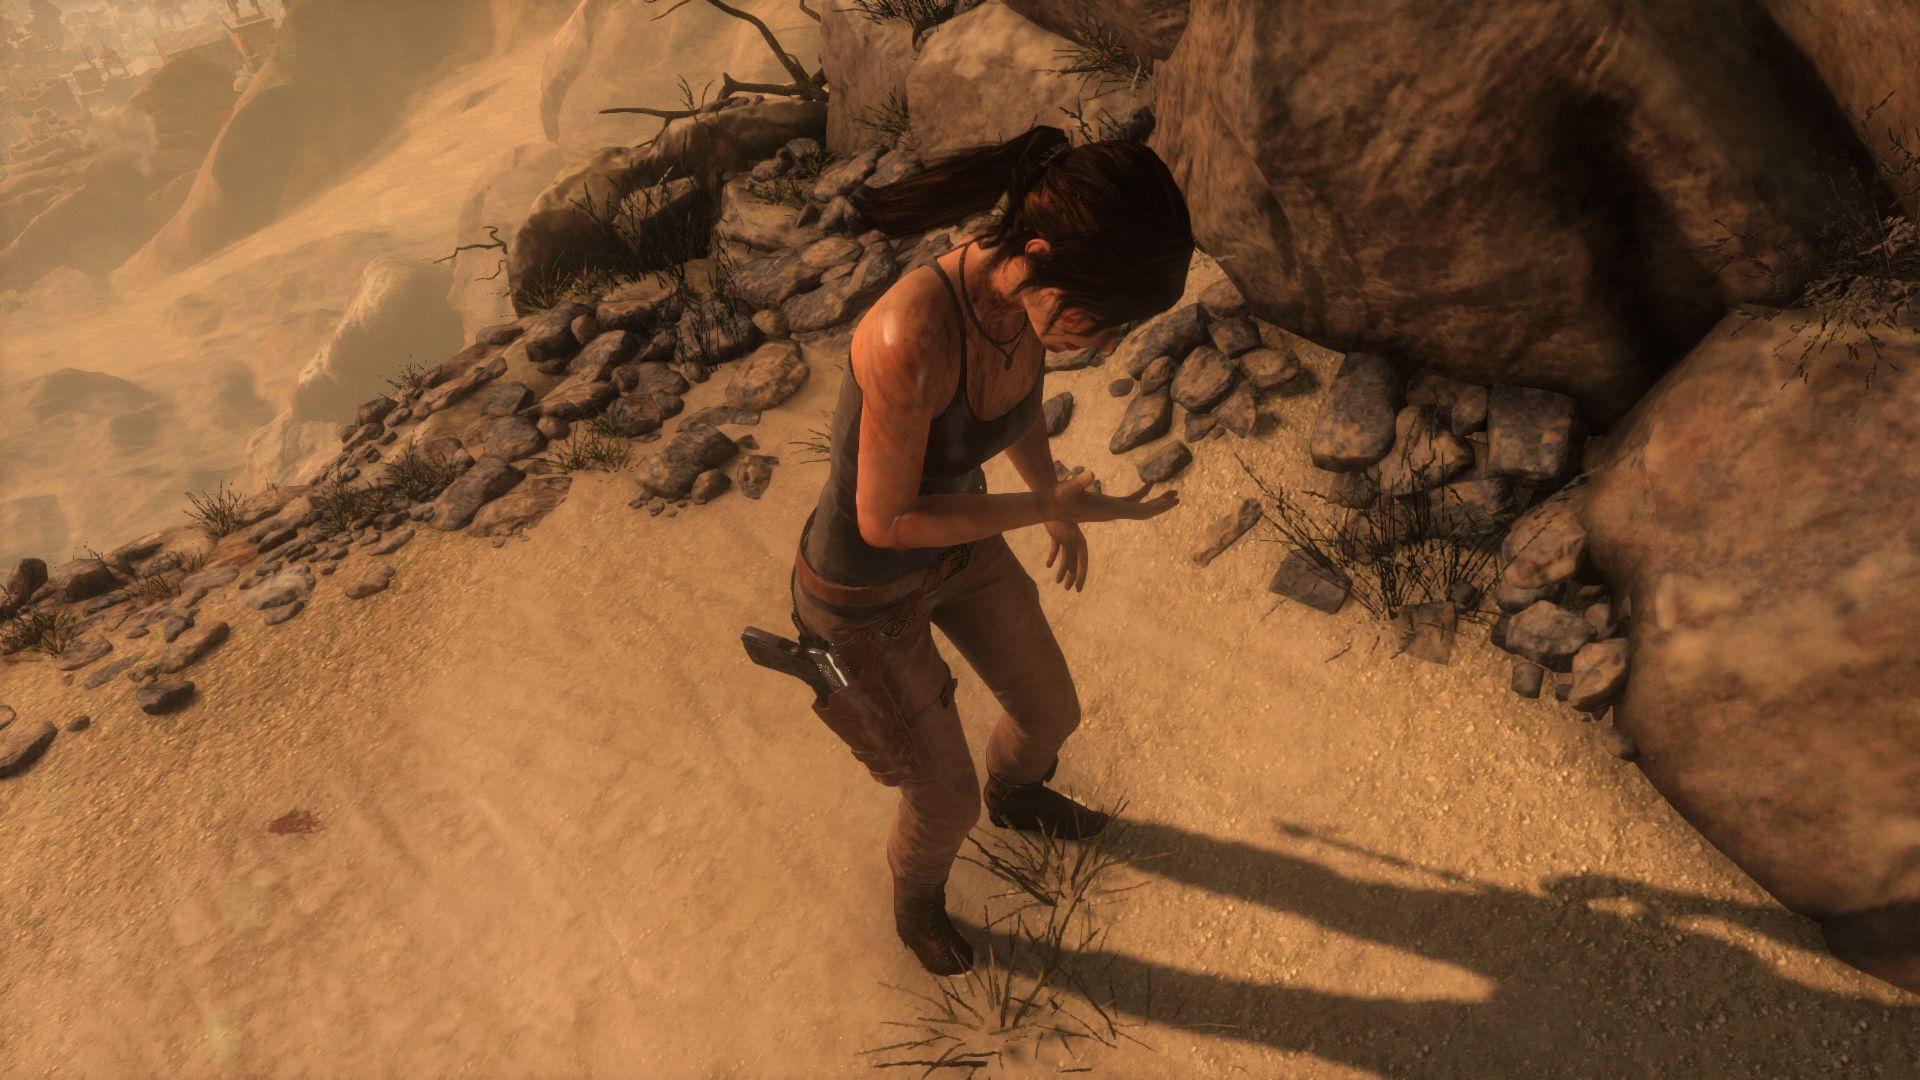
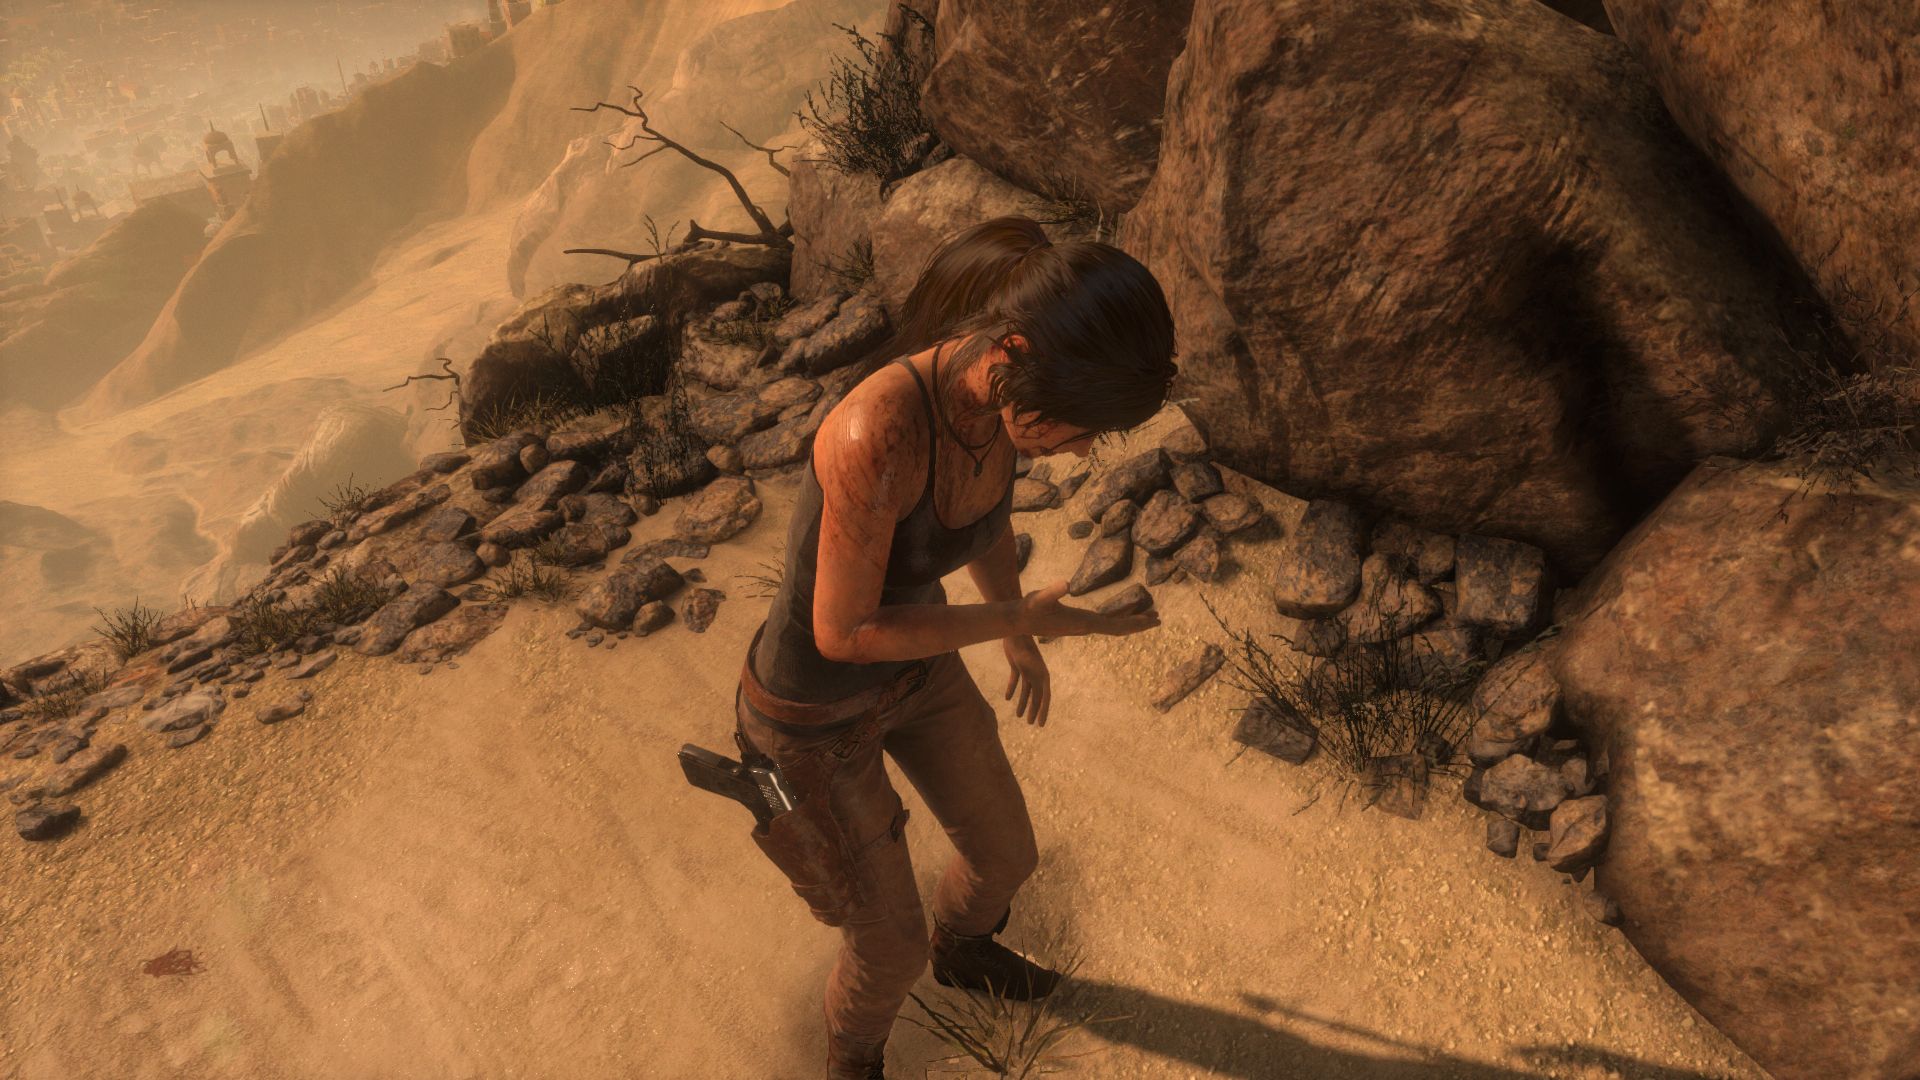
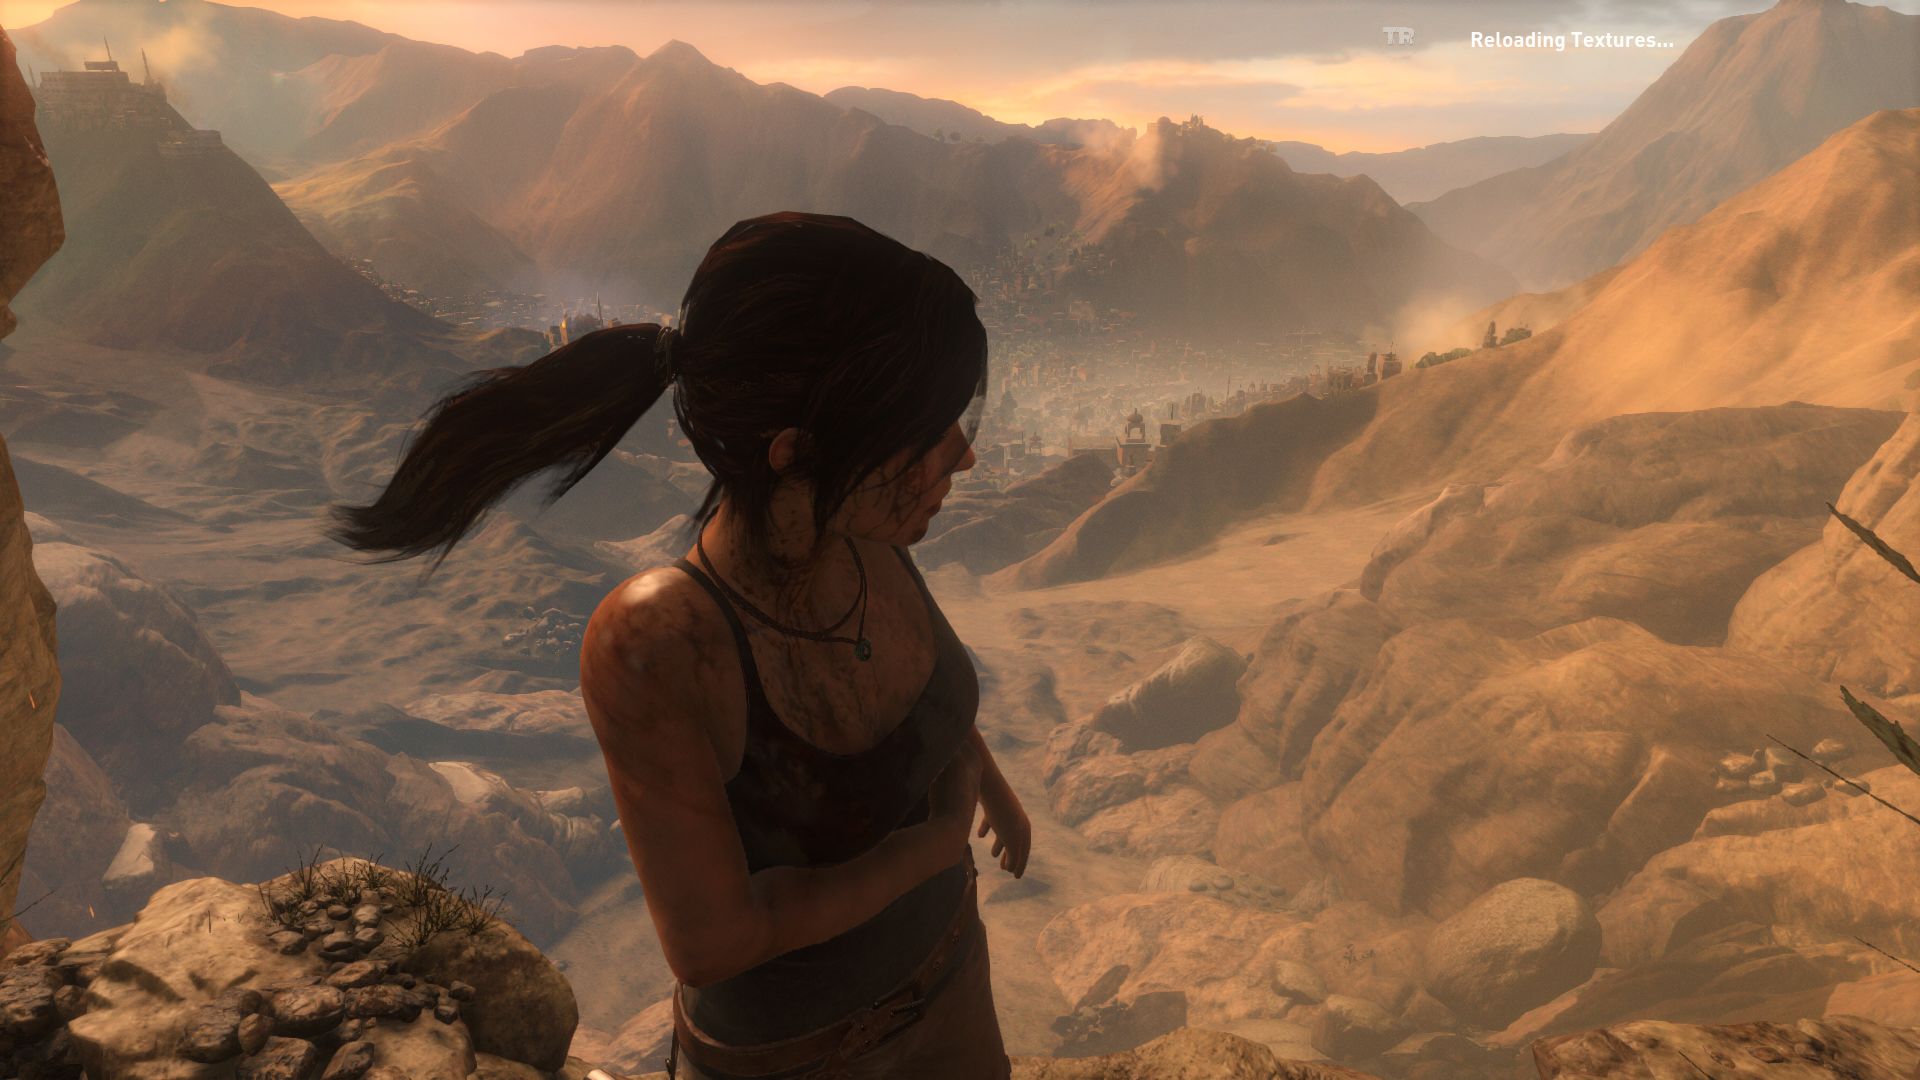
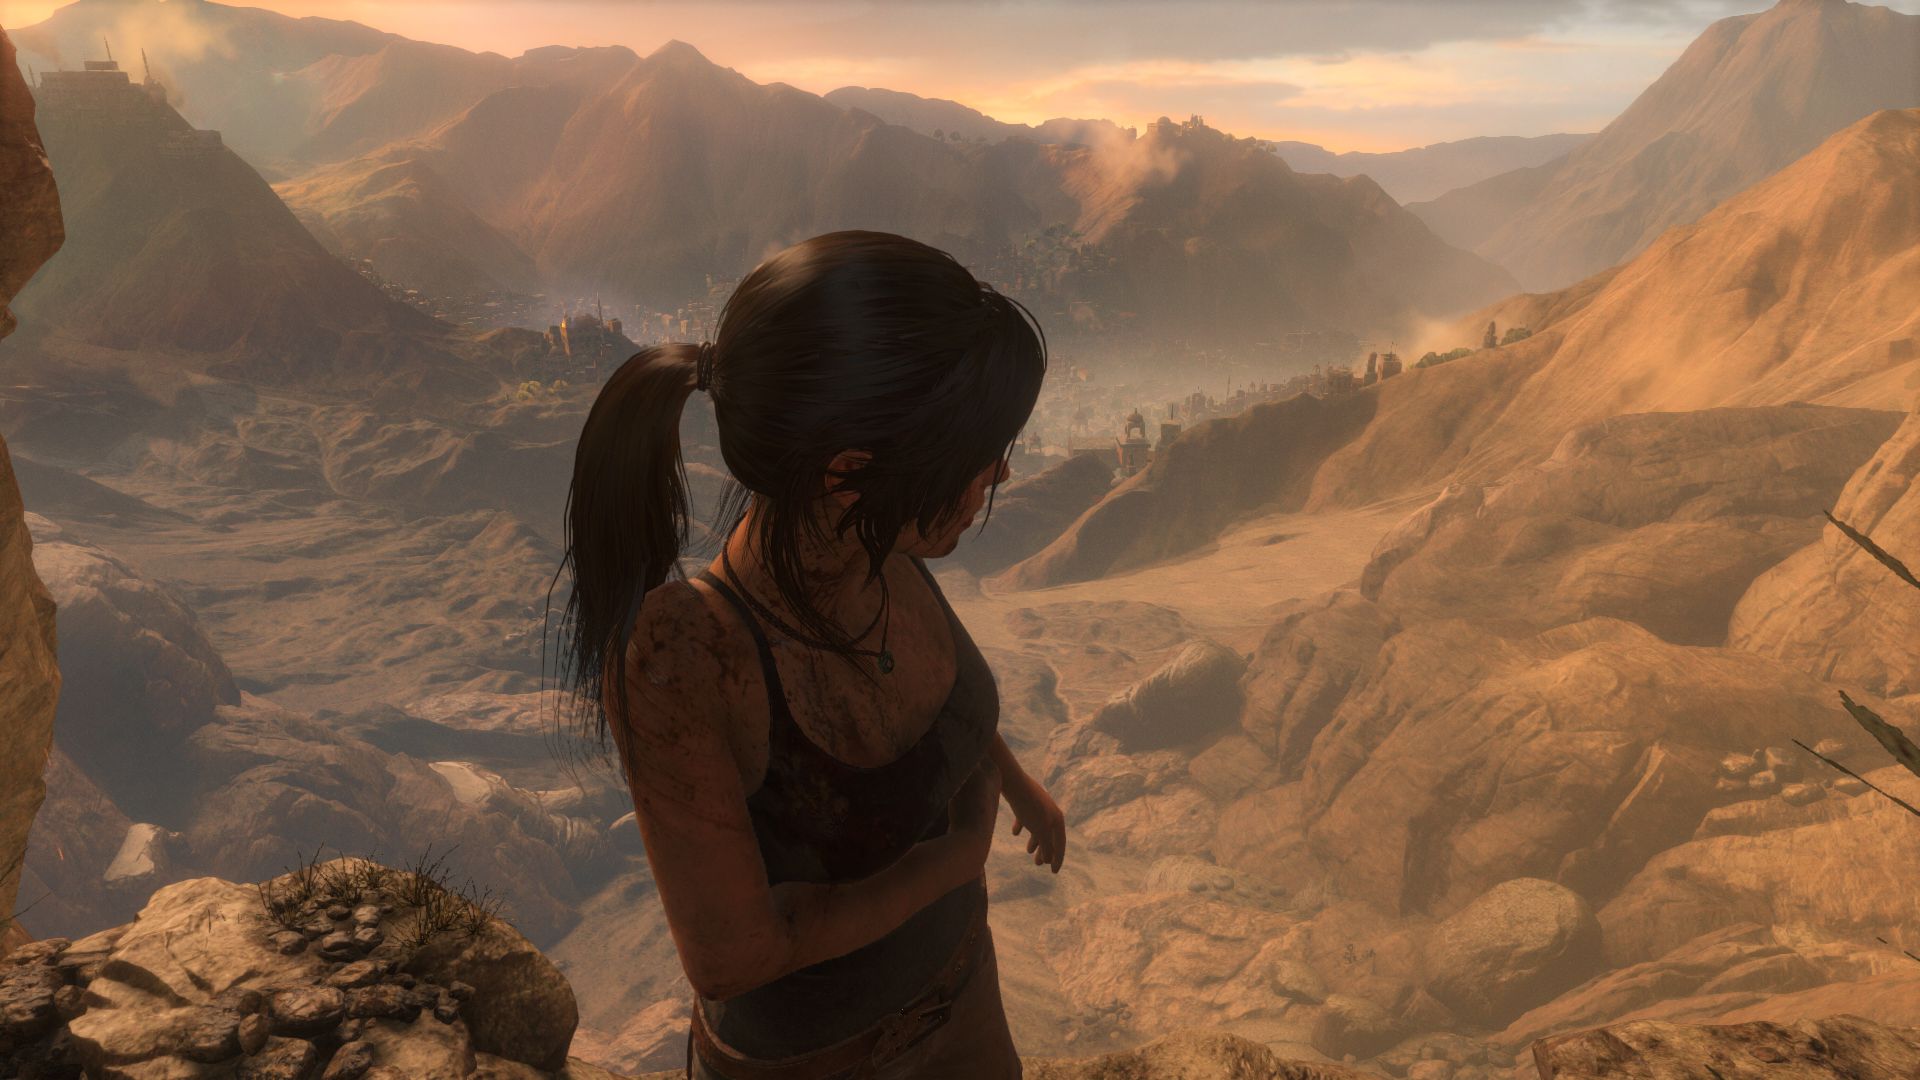
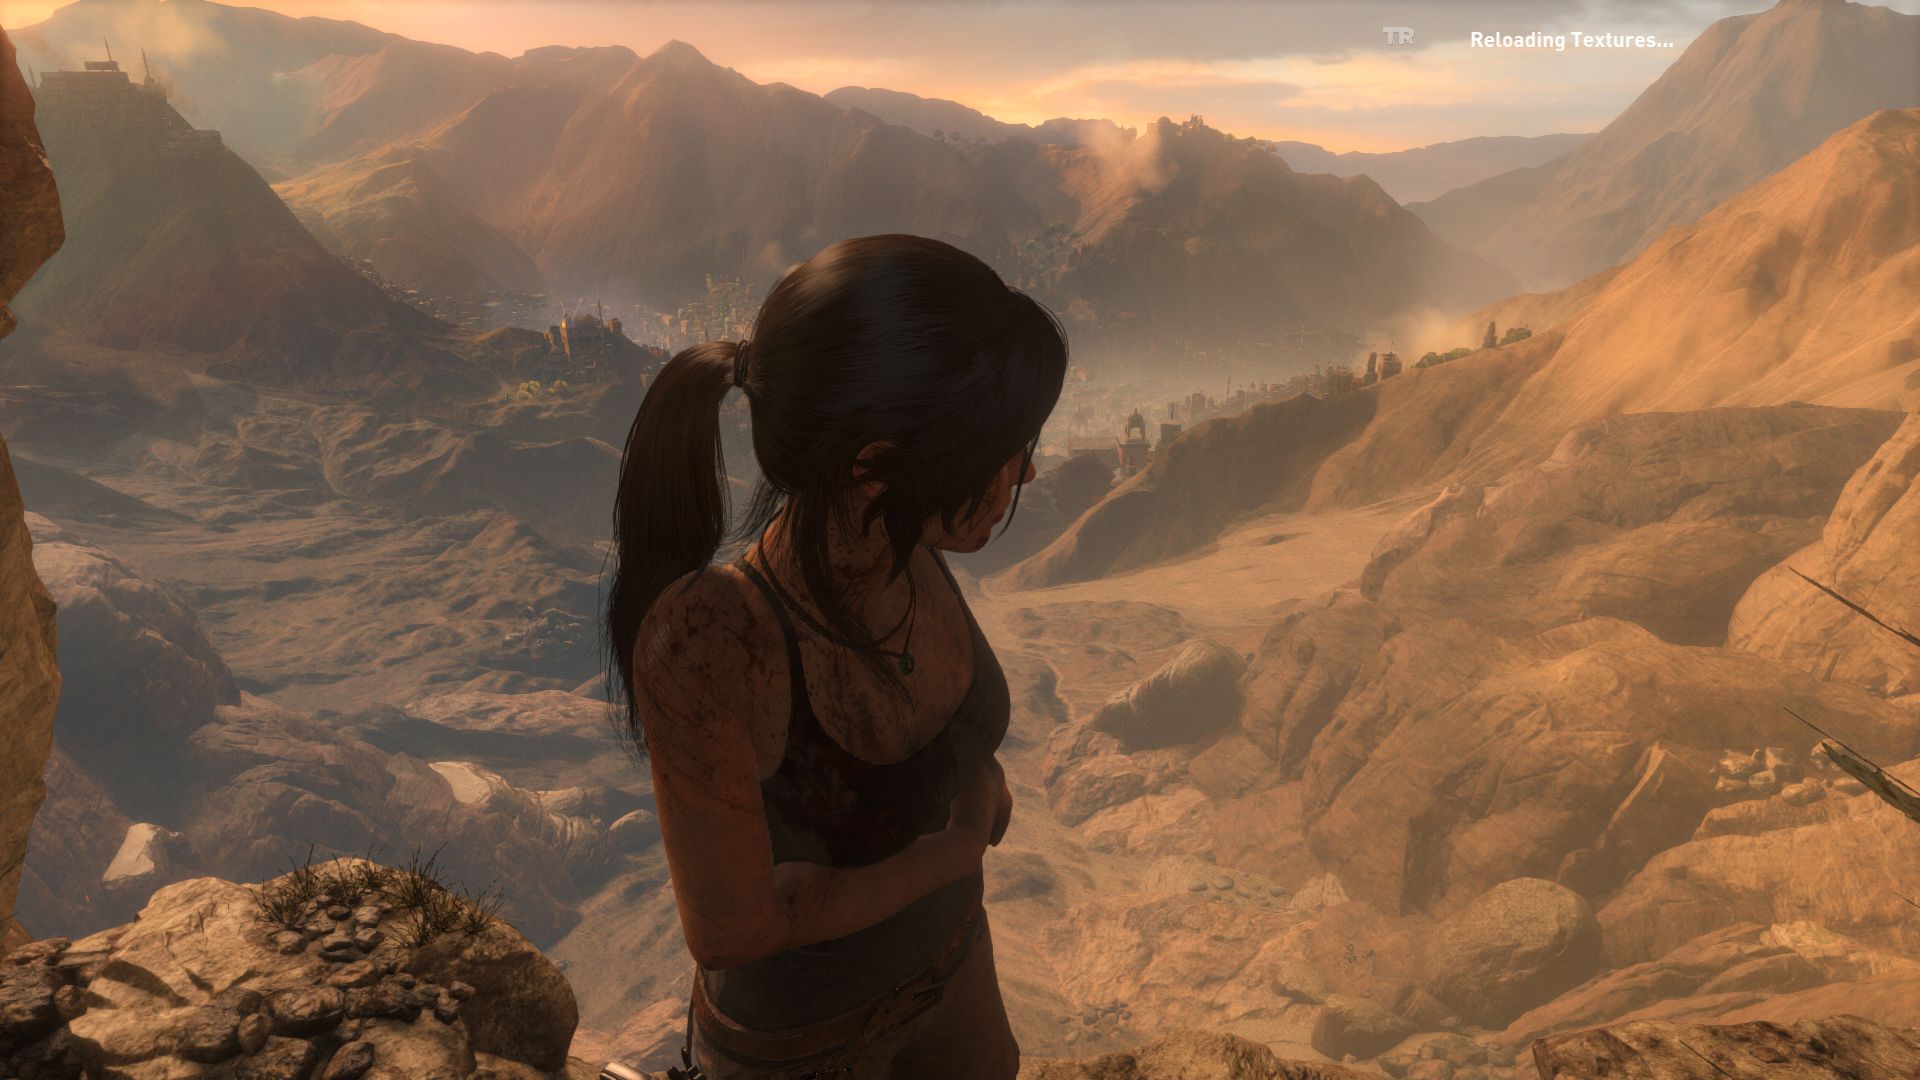
It is a bit unfortunate that Rise of the Tomb Raider does not feature an integrated benchmark, but the tutorial works pretty well for performance evaluations. After the first two intro videos, Lara walks along a mountain passage and is confronted with opulent effects and an immense sight, which create a lot of GPU load and represent very demanding or stressful passages, respectively.

The frame rates in Rise of the Tomb Raider can fluctuate heavily depending on the situation, so the hardware should have some headroom: At least 30-35 fps during our benchmark sequence (see video) indicates decent playability. A lower frame rate would often result in annoying stutters and lags. As far as we can say, the title is heavily limited by the GPU. The processor only has a small impact on the performance or none at all; even at low or medium settings (benchmarks for low-end CPUs are still missing).

Results

We already mentioned that the hardware requirements are pretty high. Considering the reference-like effects, however, we think that the requirements are somewhat justified. You will need at least a lower-mainstream GPU to play Rise of the Tomb Raider at all. Processor chips like the Intel HD Graphics 4600 and older multimedia or all-round chips like the GeForce GT 740M or GT 750M cannot even handle minimum details. 1024x768 pixels and the preset Low will require a more modern mid-range GPU like the GeForce 940M. Normal details and 1366x768 pixels are playable with a GeForce GTX 850M or better.

We recommend a "real" gaming chip for 1920x1080 pixels. The preset High will run smoothly on a GTX 965M; the preset Very High on a GTX 970M. None of the notebook GPUs are powerful enough for 4K at 3840x2160 pixels. But even powerful desktop GPUs like the Radeon R9 Fury and the GeForce GTX 980 will reach their limits. Only the fastest high-end models (GTX 980 Ti etc.) and some SLI configurations should be powerful enough. Note: AMD GPUs are currently slower compared to their Nvidia counterparts. Intel GPUs on the other hand have problems with crashes – independent of the settings.

Low Settings
Low Settings
Medium Settings
Medium Settings
High Settings
High Settings
Ultra Settings
Ultra Settings
4K Settings
4K Settings
Low Settings
Low Settings
Medium Settings
Medium Settings
High Settings
High Settings
Ultra Settings
Ultra Settings
4K Settings
4K Settings

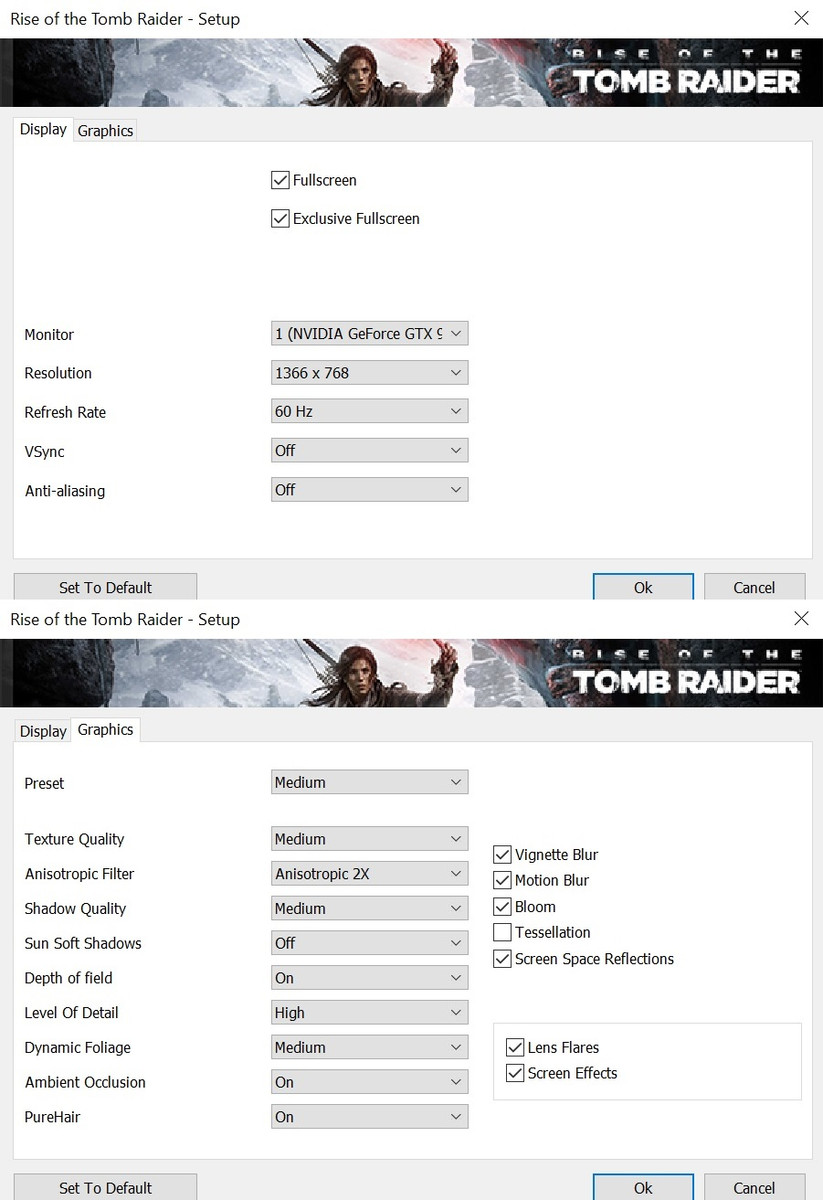
We also want to say a couple of words about the resolution debate on our forums. Because of the feedback, we decided to test medium details with 1920x1080 instead of 1366x768 pixels in 2016. However, we will only use the new scheme if there is a certain performance difference compared to the High preset (also 1920x1080 pixels). The performance between the presets Medium and High is almost identical in the case of Rise of the Tomb Raider. We therefore once again use 1366x768 pixels for an ideal frame rate gradation. As an example, we show the results of the GeForce GTX 950M (Iris Pro 5200):

  • 1024x768 + Lowest preset = 60 fps (26.6 fps) ... 100% (100%)
  • 1366x768 + Medium preset = 38 fps (14.8 fps) ... 63% (56%)
  • 1920x1080 + Medium preset = 25 fps (10 fps) ... 42% (38%)
  • 1920x1080 + High preset = 21 fps (7.8 fps) ... 35% (29%)
  • 1920x1080 + Very High preset = 17 fps ... 28%
Rise of the Tomb Raider
    3840x2160 High Preset AA:FX AF:4x     1920x1080 Very High Preset AA:FX AF:16x     1920x1080 High Preset AA:FX AF:4x     1366x768 Medium Preset AF:2x     1024x768 Lowest Preset
NVIDIA GeForce GTX 980, 6700K
Desktop PC
27.9 (25min) fps ∼7%
71.3 (64min) fps ∼15%
80.5 (76min) fps ∼16%
135 (130min) fps ∼27%
205 (194min) fps ∼25%
AMD Radeon R9 Fury, 4790K
XFX Radeon R9 Fury Pro
32.4 (29min) fps ∼8%
57 (46min) fps ∼12%
72 (62min) fps ∼15%
110 (104min) fps ∼22%
159 (147min) fps ∼19%
AMD Radeon R9 290X, 4790K
Sapphire Radeon R9 290X Tri-X OC
27.2 (23min) fps ∼7%
50.5 (47min) fps ∼11%
65 (60min) fps ∼13%
102 (97min) fps ∼20%
149 (140min) fps ∼18%
NVIDIA GeForce GTX 980M, 4700MQ
Schenker W504
20.8 (19min) fps ∼5%
47.9 (45min) fps ∼10%
56.4 (52min) fps ∼12%
93.9 (83min) fps ∼19%
139 (116min) fps ∼17%
NVIDIA GeForce GTX 970M, 4700MQ
Schenker W504
16.8 (15min) fps ∼4%
38 (35min) fps ∼8%
44.9 (43min) fps ∼9%
74.8 (68min) fps ∼15%
115 (97min) fps ∼14%
NVIDIA GeForce GTX 880M, 4700MQ
Schenker W504
14.6 (13min) fps ∼4%
32.3 (30min) fps ∼7%
36.3 (33min) fps ∼7%
55.9 (53min) fps ∼11%
84.9 (81min) fps ∼10%
NVIDIA GeForce GTX 950, 6700K
Desktop PC
13 (11min) fps ∼3%
30.6 (28min) fps ∼6%
38.8 (35min) fps ∼8%
66.3 (63min) fps ∼13%
105 (99min) fps ∼13%
NVIDIA GeForce GTX 965M, 6700HQ
MSI GE72 965M Ti
11.9 (11min) fps ∼3%
30.4 (26min) fps ∼6%
37.7 (35min) fps ∼8%
66 (58min) fps ∼13%
106 (95min) fps ∼13%
AMD Radeon R7 370, 4790K
MSI Gaming R7 370 2GB
13.3 (11min) fps ∼3%
27.3 (24min) fps ∼6%
35.5 (33min) fps ∼7%
61 (58min) fps ∼12%
94 (88min) fps ∼11%
NVIDIA GeForce GTX 870M, 4700MQ
Schenker W504
11.3 (10min) fps ∼3%
25.8 (24min) fps ∼5%
30 (28min) fps ∼6%
47.4 (45min) fps ∼9%
71.9 (68min) fps ∼9%
NVIDIA GeForce GTX 960M, 4720HQ
Schenker XMG A505
8.7 (7min) fps ∼2%
20.1 (18min) fps ∼4%
26.4 (24min) fps ∼5%
46.8 (44min) fps ∼9%
74 (70min) fps ∼9%
NVIDIA GeForce GTX 860M, 4700MQ
Schenker W504
7.9 (7min) fps ∼2%
19.6 (18min) fps ∼4%
22 (20min) fps ∼5%
36 (34min) fps ∼7%
57 (54min) fps ∼7%
NVIDIA GeForce GTX 950M, 6700HQ
MSI PE60 2QD
17.2 (15min) fps ∼4%
21 (19min) fps ∼4%
37.5 (35min) fps ∼7%
60 (57min) fps ∼7%
NVIDIA GeForce GTX 850M, 4340M
Schenker M504
6.9 (6min) fps ∼2%
17 (16min) fps ∼4%
20.9 (19min) fps ∼4%
37.2 (35min) fps ∼7%
59.6 (56min) fps ∼7%
AMD Radeon R9 M280X, FX-7600P
Asus N551ZU-CN007H
16.6 (15min) fps ∼3%
21.4 (19min) fps ∼4%
37.7 (35min) fps ∼7%
52 (48min) fps ∼6%
NVIDIA GeForce 940M, 5700HQ
MSI GP62 2QD
9.4 (8min) fps ∼2%
11.6 (10min) fps ∼2%
21.1 (19min) fps ∼4%
34.3 (32min) fps ∼4%
NVIDIA GeForce GT 750M, 4702MQ
Schenker M503
9 (8min) fps ∼2%
9.9 (9min) fps ∼2%
17.1 (16min) fps ∼3%
27.1 (25min) fps ∼3%
Intel Iris Pro Graphics 5200, 4750HQ
SCHENKER S413
7.8 (6min) fps ∼2%
14.8 (12min) fps ∼3%
26.6 (24min) fps ∼3%
AMD Radeon R7 (Kaveri), FX-7600P
Asus N551ZU-CN007H
8.1 (6min) fps ∼2%
16.6 (15min) fps ∼3%
25.8 (23min) fps ∼3%
NVIDIA GeForce 920M, 2970M
MSI CX61 2QC 2970M MS-16GD
13.4 (12min) fps ∼3%
22.2 (21min) fps ∼3%
NVIDIA GeForce GT 740M, 4200M
HP Envy 15-j011sg
6.4 (5min) fps ∼1%
7.6 (7min) fps ∼2%
13.5 (12min) fps ∼3%
22 (20min) fps ∼3%
NVIDIA GeForce GT 720M, 4200M
MSI CX61-i572M
9.7 (0min) fps ∼2%
15.2 (0min) fps ∼2%
Intel HD Graphics 4600, 4700MQ
Schenker W504
8.9 (7min) fps ∼2%
15.5 (14min) fps ∼2%
Show Restrictions
PosModel< PrevNext >Rise of the Tomb Raider
 Rise of the Tomb Raider (2016)
low
1024x768
Lowest Preset
med.
1366x768
Medium Preset
2xAF
high
1920x1080
High Preset
4xAF FXAA
ultra
1920x1080
Very High Preset
16xAF FXAA
4K
3840x2160
High Preset
4xAF FXAA
NVIDIA GeForce RTX 4090
493.5n2
399n2
376.5n2
377n2
241.5n2
AMD Radeon RX 6950 XT
401
316
300
254
129.5
NVIDIA GeForce RTX 3090
345.65n2
273.3n2
263.35n2
246.85n2
128.05n2
NVIDIA GeForce RTX 3080 Ti
487.5n2
364n2
269.5n2
232n2
116.4n2
AMD Radeon RX 7800 XT
394
300
211
180.3
94
NVIDIA GeForce RTX 3080 12 GB
441
286
232
197.4
102.2
NVIDIA GeForce RTX 3080
357.5n2
265.5n2
245n2
225n2
110.5n2
AMD Radeon RX 6800 XT
438
258
205
98.4
AMD Radeon RX 6800
441
313
202
165
86.6
AMD Radeon RX 7700 XT
347
253
170.4
148.6
75.5
NVIDIA Titan RTX
272
196
189
188
99
NVIDIA GeForce RTX 4060 Ti 16G
371
278
183.5
111.2n2
NVIDIA GeForce RTX 3070
336n3
252n3
182.9n3
153.7n3
80.9n3
AMD Radeon RX 6750 XT
421
335
211
167.3
78.5
NVIDIA GeForce RTX 2080 Ti (Desktop)
335n2
231n2
217n2
199.5n2
95n2
AMD Radeon RX 6700 XT
463
327
197
149
73
NVIDIA GeForce RTX 3080 Laptop GPU
283.7
210
157.2
139.5
Intel Arc A770
63.2
59.2
62
62.5
62.1
NVIDIA GeForce RTX 2080 Super (Desktop)
252
183
176
165
79
PosModel< PrevNext >Rise of the Tomb Raider
low med. high ultra 4K
AMD Radeon RX 6650 XT
434
291
164.9
136.4
56.3
AMD Radeon RX 6600 XT
416.9
310.4
171.4
140.5
54
NVIDIA GeForce RTX 2080 (Desktop)
278.1n2
202.2n2
183.4n2
160.25n2
75.2n2
NVIDIA GeForce RTX 3070 Laptop GPU
293n3
206n3
141.9n3
122n3
56.15n2
AMD Radeon RX 7600M XT
280
199.4
128.1
108.3
49.3
NVIDIA GeForce RTX 3060
435
267
150
128
56.8
NVIDIA GeForce RTX 2080 Mobile
275.8n5
207.8n5
168.2n5
144.3n5
64.4
NVIDIA GeForce GTX 1080 Ti (Desktop)
180
161
69.65n2
NVIDIA Titan X Pascal
288
224.3
155.5
138.9
68.4
NVIDIA GeForce RTX 2070 Super (Desktop)
311n3
200n3
170n3
147n3
67.3n3
AMD Radeon VII
232
163
105
89
56.3
AMD Radeon RX 5700 XT (Desktop)
324n3
131n2
112n3
50.6n2
NVIDIA GeForce RTX 2070 (Desktop)
265n4
191.2n4
157.3n4
130.95n4
59.4n3
NVIDIA GeForce RTX 3060 Laptop GPU
208.5
200.3
132.9
110.2
NVIDIA GeForce GTX 1080 (Desktop)
244
201
131
112n6
50n3
NVIDIA GeForce RTX 2060 Super (Desktop)
285.5n2
201n2
153n2
127n2
53.45n2
AMD Radeon RX 6600
415
260
133
104
45.2
AMD Radeon RX 6600M
234n4
174.5n4
121.2n4
95.9n4
41.55n2
NVIDIA GeForce RTX 2070 Mobile
211.15n4
151.95n4
131.75n4
112.1n4
NVIDIA GeForce RTX 2080 Max-Q
231.4n6
175.7n6
139.4n6
118.55n6
52.4
PosModel< PrevNext >Rise of the Tomb Raider
low med. high ultra 4K
NVIDIA GeForce RTX 2060 (Desktop)
268
189
136
113
47.3
AMD Radeon RX Vega 64
272.75n14
189.25n12
114.8n14
95.55n14
48.1n14
NVIDIA GeForce GTX 1080 Mobile
210n3
166n3
132.5n4
115.1n10
50.4n6
NVIDIA GeForce GTX 1070 Ti (Desktop)
111
46.5
NVIDIA GeForce RTX 2070 Max-Q
213.15n4
172.1n4
118.95n4
101.95n4
44.5n2
AMD Radeon RX Vega 56
251
173
107
86
44.7
NVIDIA GeForce RTX 2060 Mobile
150.85n2
142n2
107
85.2n3
39
NVIDIA GeForce RTX 3050
215
138
84.7
35
NVIDIA GeForce GTX 1070 (Desktop)
271.4
195.4
119
99.7n3
42n3
NVIDIA GeForce GTX 1080 Max-Q
125
109.6n2
43.6
AMD Radeon Pro Vega 56
94
74.8
39.3
NVIDIA GeForce GTX 1070 Mobile
218.5n9
170.2n9
107.75n18
92n25
37.75n8
NVIDIA GeForce GTX 1660 Ti (Desktop)
247
182
110
88
40.4
NVIDIA GeForce GTX 1660 Super (Desktop)
295
199
111
86
37
AMD Radeon RX 6500 XT
238
154
85.7
68.1
27.8
AMD Radeon RX 5500 XT (Desktop)
262.5
160.6
86
68.7
30
NVIDIA GeForce GTX 1660 Ti Mobile
156n3
164n3
97.8n3
81n3
38
NVIDIA GeForce GTX 980 Ti
224
163
103
88
40.6
NVIDIA GeForce GTX 1070 Max-Q
202.7n3
166n3
97.8n5
82.4n7
33.6n3
NVIDIA GeForce GTX 1650 Super (Desktop)
250
147
86
67
30
PosModel< PrevNext >Rise of the Tomb Raider
low med. high ultra 4K
AMD Radeon R9 Fury
159
110
72
57
32.4
AMD Radeon R9 Nano
56.2
29.8
NVIDIA GeForce GTX 980
205
135
80.5
72.7n2
27.9
NVIDIA GeForce GTX 1660 Ti Max-Q
93.7
72.7
64.5
AMD Radeon RX 590 (Desktop)
233.8
151.5
84.1
68.1
32.6
AMD Radeon RX 580 (Desktop)
247
158.9
83.9
65.4
27.8
NVIDIA GeForce GTX 980 (Laptop)
225.9
144.4
88.4
68.75n2
33.7
NVIDIA GeForce GTX 1060 (Desktop)
214.05n2
139.75n2
81.65n2
66.9n3
27.5n3
AMD Radeon RX 570 (Desktop)
200
126
71
56.1
28.5
AMD Radeon RX 480 (Desktop)
57
25.6n2
NVIDIA GeForce GTX 1060 Mobile
162n15
123.3n14
73n24
61.3n37
25.15n6
NVIDIA GeForce GTX 1650 Ti Mobile
181
124
68.3
58.9
AMD Radeon RX 580 (Laptop)
176
121
64
53
22.9
NVIDIA GeForce GTX 1650 (Desktop)
207
122
66
53.4
22
NVIDIA GeForce GTX 1650 Mobile
136.35n2
102.8
61.1n2
50.85n2
20.2
NVIDIA GeForce GTX 970
159.1
127.7
75.9
62.35n2
25.3
NVIDIA GeForce GTX 1060 Max-Q
168n5
126.05n6
67.6n7
55n8
23.75n4
NVIDIA GeForce GTX 1650 Ti Max-Q
126.55n2
96.05n2
59.3n2
49n2
21.4n2
AMD Radeon RX 470 (Desktop)
68.7
54.2n3
25.3
NVIDIA GeForce GTX 1650 Max-Q
134.6
93
50.9
41.7
18.3
PosModel< PrevNext >Rise of the Tomb Raider
low med. high ultra 4K
NVIDIA Quadro T1000 (Laptop)
136.2
86
53.4
43.8
AMD Radeon R9 290X
149
102
65
50.5
27.2
NVIDIA GeForce GTX 980M
139.5n4
93.45n4
57.6n8
49n9
21.7n4
AMD Radeon RX Vega M GH
161.8
102.4
53.9
40.8
AMD Radeon Pro Vega 20
120.4
87.3
74.6
AMD Radeon R9 280X
116
78
49.3
39.4
21.1
NVIDIA GeForce GTX 960
112.6
71.3
43.7
36.1
17
NVIDIA GeForce GTX 1050 Ti Mobile
115.4n9
75.75n12
46.55n14
38.15n16
15.85n2
NVIDIA GeForce GTX 1050 Ti (Desktop)
48.9
40.7
NVIDIA GeForce GTX 970M
105.75n4
72.6n4
44.9n5
37.6n5
16.8
NVIDIA GeForce GTX 680
110.9
68.9
46.4
40.6
17.2
NVIDIA GeForce GTX 1050 Ti Max-Q
129.7n4
78.25n4
47.35n4
39.7n4
16.95n2
AMD Radeon RX Vega M GL / 870
132.1n2
80.2n3
40.6n3
31.7n3
13.15n2
AMD Radeon Pro WX Vega M GL
74.4
77.6
40.4
31.8
13.8
NVIDIA GeForce GTX 1050 (Desktop)
94.1
53.5
40.6n3
32.9n2
15.6
NVIDIA GeForce GTX 1050 Mobile
110.4n21
69.3n25
38.4n28
32.3n30
12.9n4
AMD Radeon R7 370
94
61
35.5
27.3
13.3
NVIDIA GeForce GTX 880M
84.9
55.9
36.3
32.3
14.6
NVIDIA GeForce GTX 1050 Max-Q
101.75n2
56n3
34.6n3
29n3
12.9
NVIDIA GeForce GTX 950
105
66.3
38.8
30.6
13
PosModel< PrevNext >Rise of the Tomb Raider
low med. high ultra 4K
AMD Radeon RX 460 (Desktop)
69
36.6
27.9
12.9
NVIDIA GeForce GTX 965M
102.9n3
63.65n4
36.6n5
29.1n5
11.9
AMD Radeon RX 560X (Laptop)
108.6
65.7
35.3
26.6
AMD Radeon RX 560 (Laptop)
61.85n2
49.5n2
32.85n2
25.95n2
NVIDIA GeForce GTX 870M
71.9
47.4
30
25.8
11.3
AMD Radeon HD 8970M
85
54
31.9
23.4
AMD Radeon RX 460 (Laptop)
61.5
28.4
19.7
Intel Iris Xe MAX Graphics
68.2
38.3
25.4
20.8
AMD Radeon Pro 560X
30.5
24.3
AMD Radeon Pro 460
76
25.8
20.8
Intel Iris Xe Graphics G7 96EUs
76.8n5
43.8n5
25n5
20.4n5
8.3
NVIDIA GeForce GTX 960M
65.4n3
46.95n8
26.4n13
22.5n13
8.85n2
AMD Radeon RX 550X (Laptop)
65.7
39.8
20.2
AMD Radeon RX 550 (Laptop)
67.66n2
44.99n2
22.51n2
21
AMD Radeon RX 640
63.15n2
35.65n2
20.45n2
AMD Radeon Pro WX 3200
50.6
36.22
18.54
AMD Radeon Pro 555
73.6
23.5
AMD Radeon Pro 455
84
24.9
18.3
NVIDIA GeForce GT 1030 (Desktop)
74.1n2
45.45n2
24.1n2
19.7n2
7.6n2
NVIDIA GeForce MX250
71n5
40n5
24n5
18.75n4
PosModel< PrevNext >Rise of the Tomb Raider
low med. high ultra 4K
NVIDIA GeForce MX150
65.3n28
37.4n29
21.2n28
17.5n23
7
AMD Radeon RX 540
54.9n2
29.8n2
15.65n2
12.5n2
AMD Radeon Pro WX 3100
50.4n2
29.55n2
15.05n2
12.2
NVIDIA GeForce GTX 860M
57
36
22
19.6
7.9
NVIDIA GeForce GTX 950M
58.4n9
35.59n10
21n10
17.05n8
AMD Radeon Pro 450
66.6
20.8n2
AMD Radeon R9 M385X
39.4
34.8
19.7
15.2
NVIDIA GeForce GTX 850M
59.6
37.2
20.9
17
6.9
AMD Radeon R9 M280X
52
37.7
21.4
16.6
Intel Iris Plus Graphics G7 (Ice Lake 64 EU)
42.4n5
26.9n5
14.7n5
10.5n3
AMD Radeon RX Vega 10
37.3n6
30
12n6
13
Intel Iris Pro Graphics 580
30.2
18.2
12.2
8.9
Apple M1 8-Core GPU
39.6
AMD Radeon RX Vega 8 (Ryzen 4000/5000)
59n4
40.45n4
22.7n4
16.6n4
19
AMD Radeon RX Vega 7
54.85n4
30.4n3
19.65n4
14.6n3
NVIDIA GeForce GT 750M
27.1
17.1
9.9
9
NVIDIA GeForce MX130
46.25n8
28.9n8
15.7n8
12.8n7
NVIDIA GeForce 940MX
35.8n20
22.2n20
13.2n17
10.75n10
AMD Radeon RX Vega 8 (Ryzen 2000/3000)
36.05n10
21.7n3
12.3n11
9.35n2
NVIDIA GeForce 940M
26.53n4
18.74n4
11.07n4
7.98n2
PosModel< PrevNext >Rise of the Tomb Raider
low med. high ultra 4K
Intel Iris Plus Graphics G4 (Ice Lake 48 EU)
10.2
NVIDIA GeForce 930MX
35.09n2
19.84n2
10.9
Intel Iris Plus Graphics 655
32.55n2
19.95n2
10.8
8.9
AMD Radeon R7 M445
29.6
15.1
8.5
6.7
AMD Radeon R7 512 Cores (Kaveri Desktop)
31
18.9
Intel Iris Pro Graphics 5200
26.6
14.8
7.8
NVIDIA GeForce GT 740M
22
13.5
7.6
6.4
Intel Iris Plus Graphics 650
25.9
18.3
NVIDIA GeForce 930M
25
16.4
9.6
7.7
Intel Iris Graphics 550
25.45n2
18.3n3
10.2n2
4.3
AMD Radeon 530
29.7n2
18n2
10.6
8.5
AMD Radeon RX Vega 6 (Ryzen 4000/5000)
56
38.1
17.4
NVIDIA GeForce MX110
29.3
19
10.9
9.1
Intel Iris Plus Graphics 640
24.65n2
18.05n2
9.1
NVIDIA GeForce 920MX
23.2
14.7
8.1
Intel Iris Graphics 540
23.7n3
16.1n2
AMD Radeon R7 (Bristol Ridge)
21.1n4
12.8n4
7n3
AMD Radeon R7 (Kaveri)
25.8
16.6
8.1
AMD Radeon R7 M460
19.5
12.2
6.8
AMD Radeon R7 M360
22.55n2
12.3n2
7.1n2
4.1
PosModel< PrevNext >Rise of the Tomb Raider
low med. high ultra 4K
NVIDIA GeForce 920M
20.25n2
12.35n2
6.4
3.7
AMD Radeon R7 M440
22.25n2
12.3n2
6.2n2
3.5
AMD Radeon R7 M340
28.2
15
AMD Radeon 520
28.8n2
17.15n2
8.6n2
7.4
AMD Radeon RX Vega 6 (Ryzen 2000/3000)
33.65n2
18.5
11.05n2
Intel UHD Graphics 630
24.65n2
Intel HD Graphics 630
23.6
14.5
Intel HD Graphics 530
16n2
AMD Radeon R5 (Bristol Ridge)
20.6
11.2
6.2
Intel UHD Graphics 620
20.7n82
12.2n62
6.5n42
4n11
Intel HD Graphics 620
17.89n60
11.2n35
6.25n21
4.3n10
AMD Radeon R6 (Carrizo)
16.8n3
8.5
AMD Radeon HD 8650G
12.8
6.5
NVIDIA GeForce GT 630M
14.2
AMD Radeon R5 M330
18.95n2
11.65n2
6.3
3.9
AMD Radeon R5 M430
18.8
11.5
AMD Radeon R5 M255
19
11.8
6.3
AMD Radeon RX Vega 3
23.3n2
13.3n2
6.6
NVIDIA GeForce 910M
14.5
9.4
6.1
3.5
Intel HD Graphics 520
15n23
9.6n21
5.3n11
9.3
PosModel< PrevNext >Rise of the Tomb Raider
low med. high ultra 4K
Intel Iris Graphics 6100
9.7
NVIDIA GeForce GT 720M
15.2
9.7
AMD Radeon R5 (Stoney Ridge)
15.05n2
9.2n2
Intel HD Graphics 4600
15.25n2
9.3n2
Intel HD Graphics 5500
11.4
7.3
AMD Radeon R5 (Carrizo)
19
12.2
Intel UHD Graphics 617
16.1
Intel UHD Graphics 615
10.6n3
8.1n2
5.3
Intel HD Graphics 615
13.4n6
9.1n4
Intel HD Graphics 515
8.13n4
5.18n3
Intel HD Graphics 4400
13.1
7.6
Intel HD Graphics 510
11.1
7
Intel UHD Graphics 605
6.9
Intel HD Graphics 505
6.15n4
4.05n4
Intel HD Graphics 5300
6.6
3.9
Intel HD Graphics 4000
10
AMD Radeon R5 (Beema/Carrizo-L)
11
6.7
AMD Radeon R4 (Beema)
11.9
6.7
Intel HD Graphics 4200
11.2
6.4
Intel HD Graphics 405 (Braswell)
7.1
4.2
PosModel< PrevNext >Rise of the Tomb Raider
low med. high ultra 4K
Intel HD Graphics 400 (Braswell)
5.3
Intel HD Graphics (Haswell)
9.4
5.3
2.5
1.8
(-) * Smaller values are better. / n123 Number of benchmarks for this median value / * Approximate position


Legend
5Stutters – This game is very likely to stutter and have poor frame rates. Based on all known benchmarks using the specified graphical settings, average frame rates are expected to fall below 25fps
May Stutter – This graphics card has not been explicitly tested on this game. Based on interpolated information from surrounding graphics cards of similar performance levels, stutters and poor frame rates are expected.
30Fluent – Based on all known benchmarks using the specified graphical settings, this game should run at or above 25fps
40Fluent – Based on all known benchmarks using the specified graphical settings, this game should run at or above 35fps
60Fluent – Based on all known benchmarks using the specified graphical settings, this game should run at or above 58fps
May Run Fluently – This graphics card has not been explicitly tested on this game. Based on interpolated information from surrounding graphics cards of similar performance levels, fluent frame rates are expected.
?Uncertain – This graphics card experienced unexpected performance issues during testing for this game. A slower card may be able to achieve better and more consistent frame rates than this particular GPU running the same benchmark scene.
Uncertain – This graphics card has not been explicitly tested on this game and no reliable interpolation can be made based on the performances of surrounding cards of the same class or family.
The value in the fields displays the average frame rate of all values in the database. Move your cursor over the value to see individual results.

Test Systems

Desktop PCs

Custom Nvidia Custom AMD

Mainboard

Asus Z170-A Intel

Processor

Intel Core i7-6700K Intel Core i7-4790K

Graphics card

Nvidia GeForce GTX 980 (4 GB), PNY GTX 950 (2 GB) AMD Radeon R9 Fury (4 GB), AMD R9 290X (4 GB), MSI R7 370 (2 GB)

Memory

2x 8 GB G.Skill Trident Z DDR4-3000 2x 4 GB DDR3-1600

Storage 1

Crucial MX100 SSD (256 GB) Intel SSD 530 (240 GB)

Storage 2

Crucial M500 SSD (480 GB) /

Storage 3

OCZ Trion 100 SSD (480 GB) /

Operating system

Windows 10 Pro 64-bit Windows 10 Home 64-bit

Schenker Notebooks

Schenker W504 Schenker XMG A505 Schenker M504 Schenker M503 Schenker S413

Mainboard

Intel HM87 Intel HM87 Intel HM86 Intel HM86 Intel HM87

Processor

Intel Core i7-4700MQ Intel Core i7-4720HQ Intel Core i5-4340M Intel Core i7-4702MQ Intel Core i7-4750HQ

Graphics card

Nvidia GeForce GTX 980M (8 GB), GTX 970M (6 GB), GTX 880M (8 GB), GTX 870M (6 GB), GTX 860M (4 GB) Nvidia GeForce GTX 960M (2 GB) Nvidia GeForce GTX 850M (2 GB) Nvidia GeForce GT 750M (2 GB) Intel Iris Pro Graphics 5200

Memory

2x 4 GB DDR3-1600 2x 4 GB DDR3-1600 2x 4 GB DDR3-1600 2x 4 GB DDR3-1600 2x 8 GB DDR3-1600

Storage 1

Samsung SSD 840 EVO (250 GB) Micron M600 SSD (128 GB) Intel SSD 520 (240 GB) Intel SSD 520 (240 GB) Crucial M4 SSD (256 GB)

Storage 2

Seagate Laptop Thin SSHD (500 GB) HGST Travelstar 7K1000 (1000 GB) / / /

Operating system

Windows 10 Pro 64-bit Windows 10 Home 64-bit Windows 7 Pro 64-bit Windows 7 Pro 64-bit Windows 8 Pro 64-bit

Other notebooks

HP Envy 15-j011sg Asus N551ZU-CN007H MSI CX61-i572M281BW7

Mainboard

Intel HM87 AMD K15.1 Intel HM86

Processor

Intel Core i5-4200M AMD FX-7600P Intel Core i5-4200M

Graphics card

Nvidia GeForce GT 740M (2 GB) AMD Radeon R9 M280X (4 GB) Nvidia GeForce GT 720M (2 GB)

Memory

1x 8 GB DDR3-1600 2x 4 GB DDR3-1600 1x 8 GB DDR3-1600

Storage 1

Samsung SSD 830 (256 GB) HGST Travelstar 5K1000 (1000 GB) Western Digital Scorpio Blue (1000 GB)

Storage 2

/ / /

Operating system

Windows 10 Home 64-bit Windows 8.1 Pro 64-bit Windows 7 Home Premium 64-bit

4K Monitor

Nvidia driver AMD driver Intel driver

Asus PB287Q

ForceWare 361.75 Crimson 16.1 Hotfix 15.40.10.64.4300

Read all 7 comments / answer
static version load dynamic
Loading Comments
Comment on this article
Please share our article, every link counts!
> Expert Reviews and News on Laptops, Smartphones and Tech Innovations > Reviews > Rise of the Tomb Raider Notebook Benchmarks
Florian Glaser, 2016-02- 3 (Update: 2016-02- 3)