


Acer ConceptD 5 CN515-51 laptop review: Kaby Lake G lightweight struggles with cost cutting
Acer leaves known paths with its ConceptD 5 CN515-51 to differentiate itself from the competition, with especially lightweight materials, Kaby Lake G with an integrated AMD GPU and a 4K UHD screen that covers a wider color gamut. At the same time, the Acer ConceptD CN515-51 is also cheaper than other multimedia laptops with a 15.6 inch screen. Unfortunately, the necessary cost cuts are showing up quite fast in this comprehensive review.
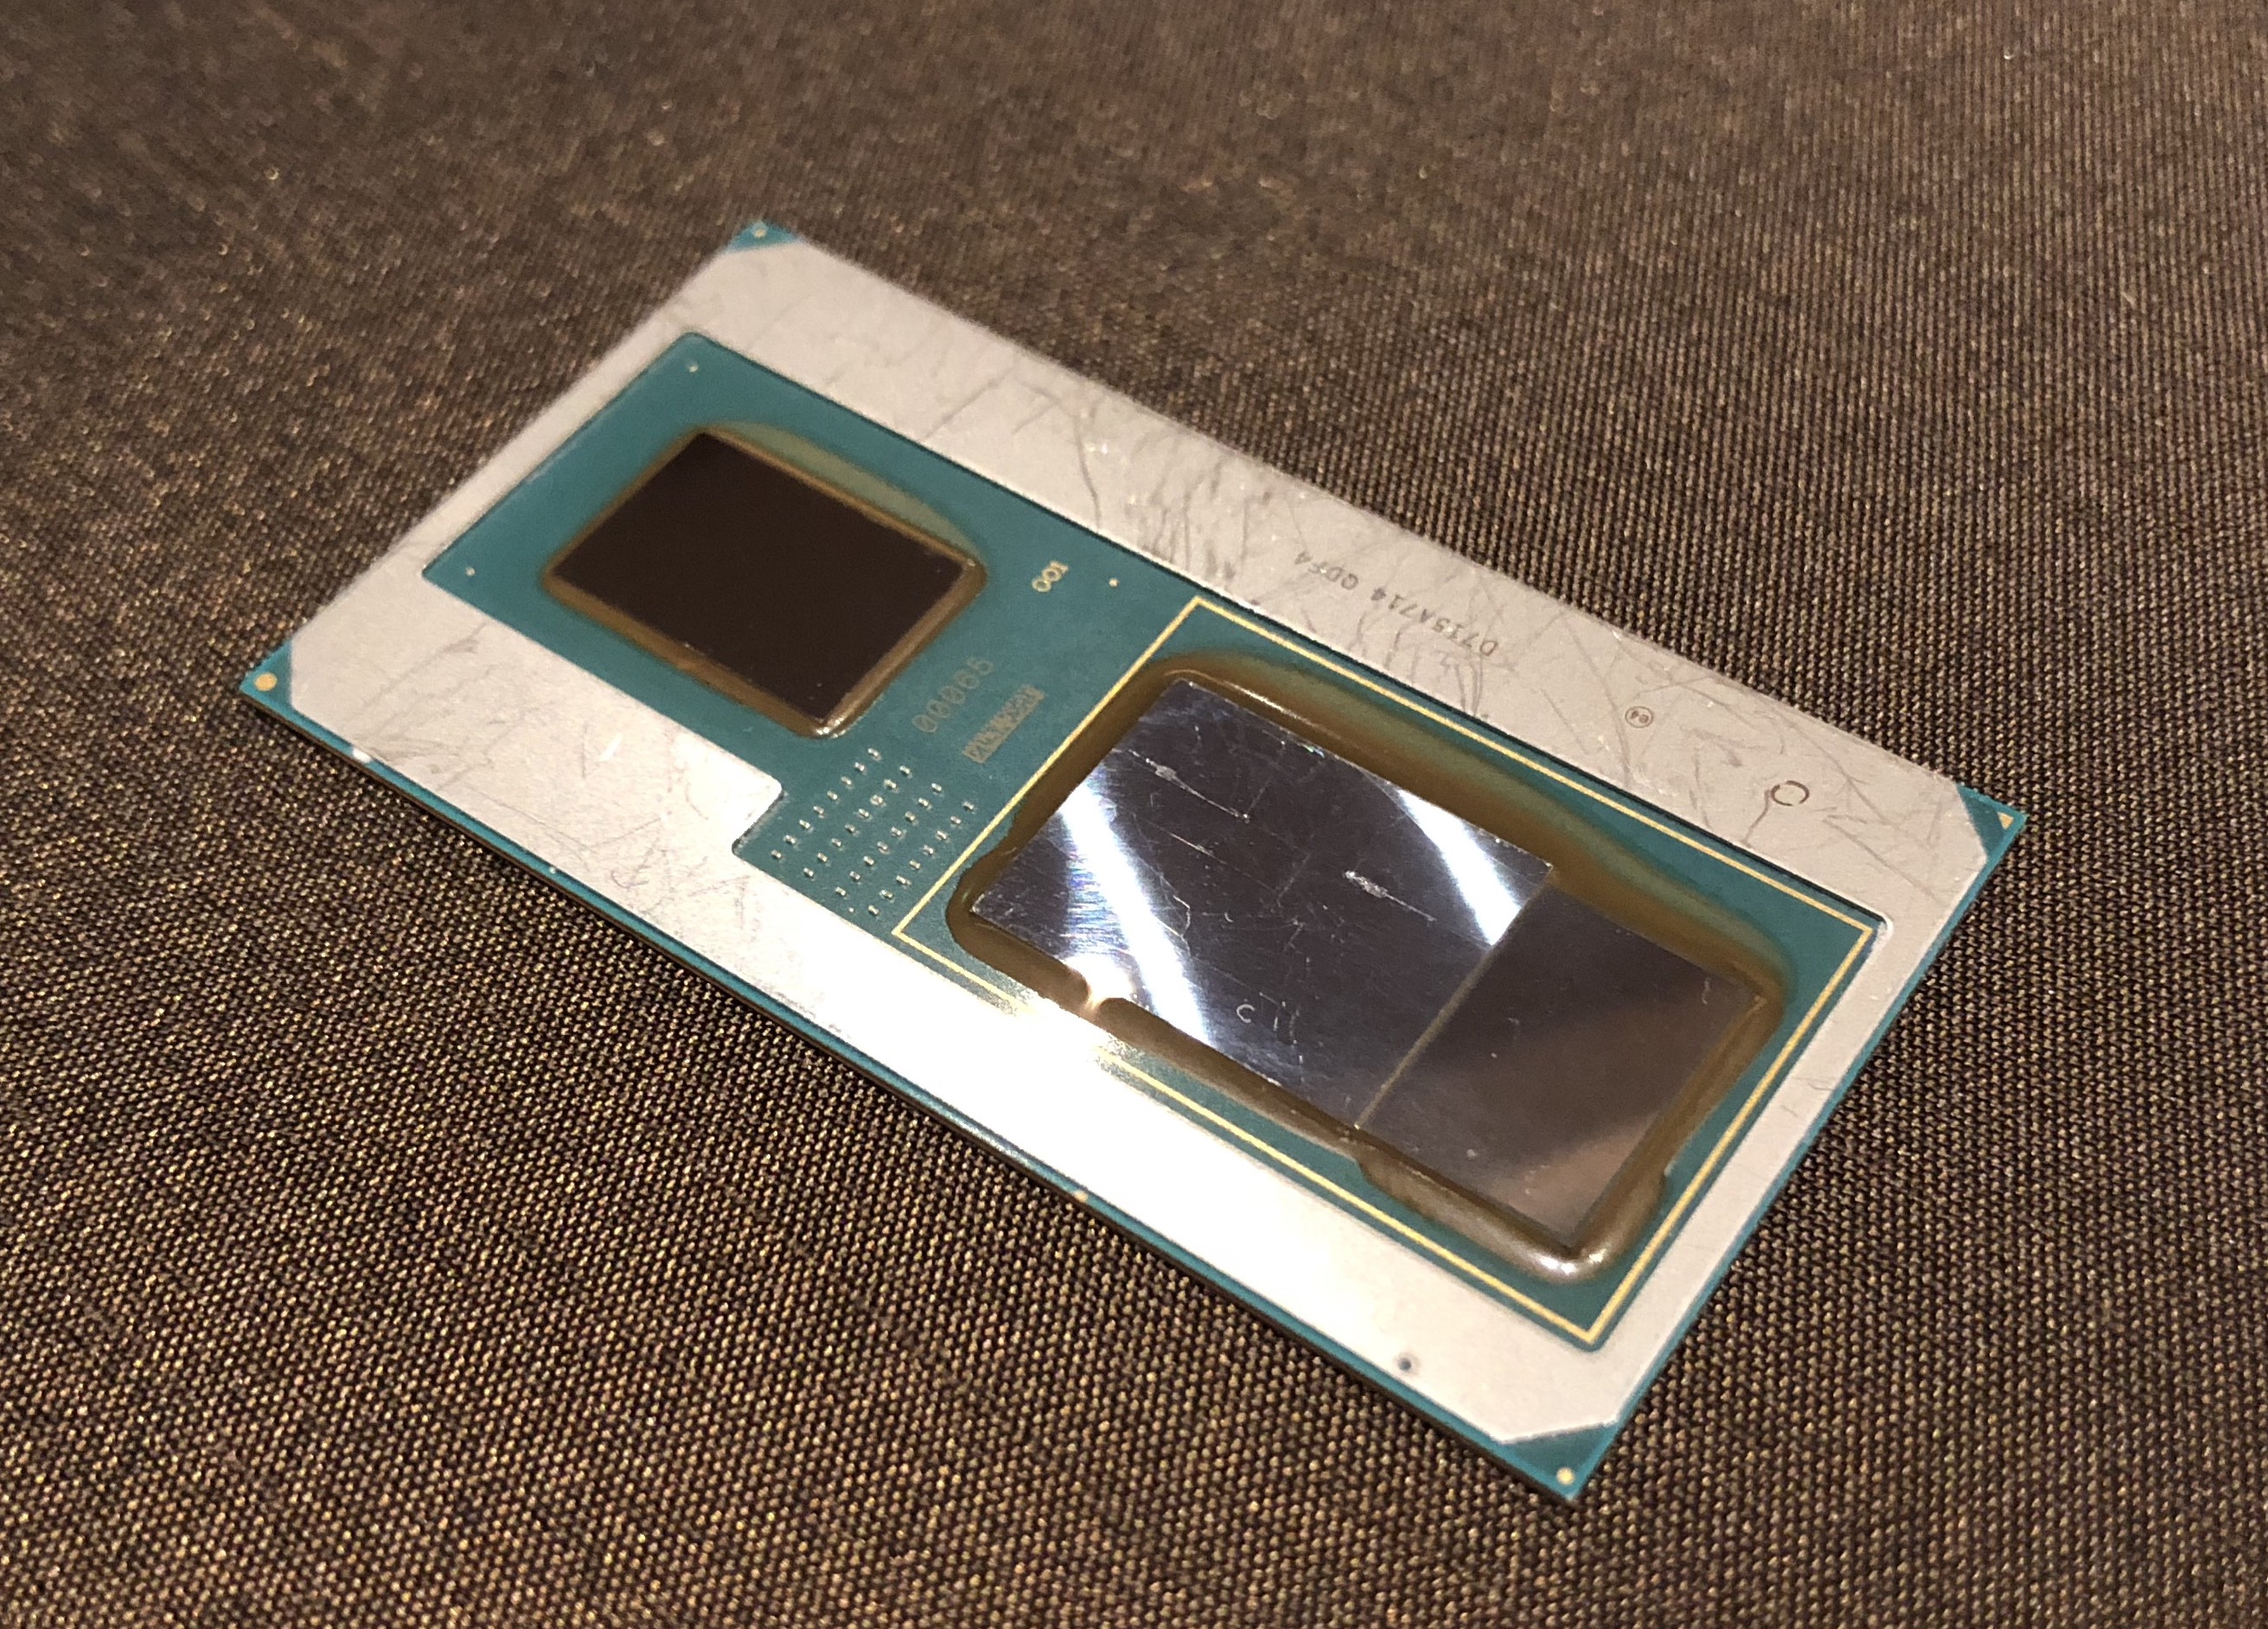
Intel Core i7-8705G, AMD Radeon RX Vega M GL / 870, 15.6", 1.5 kg