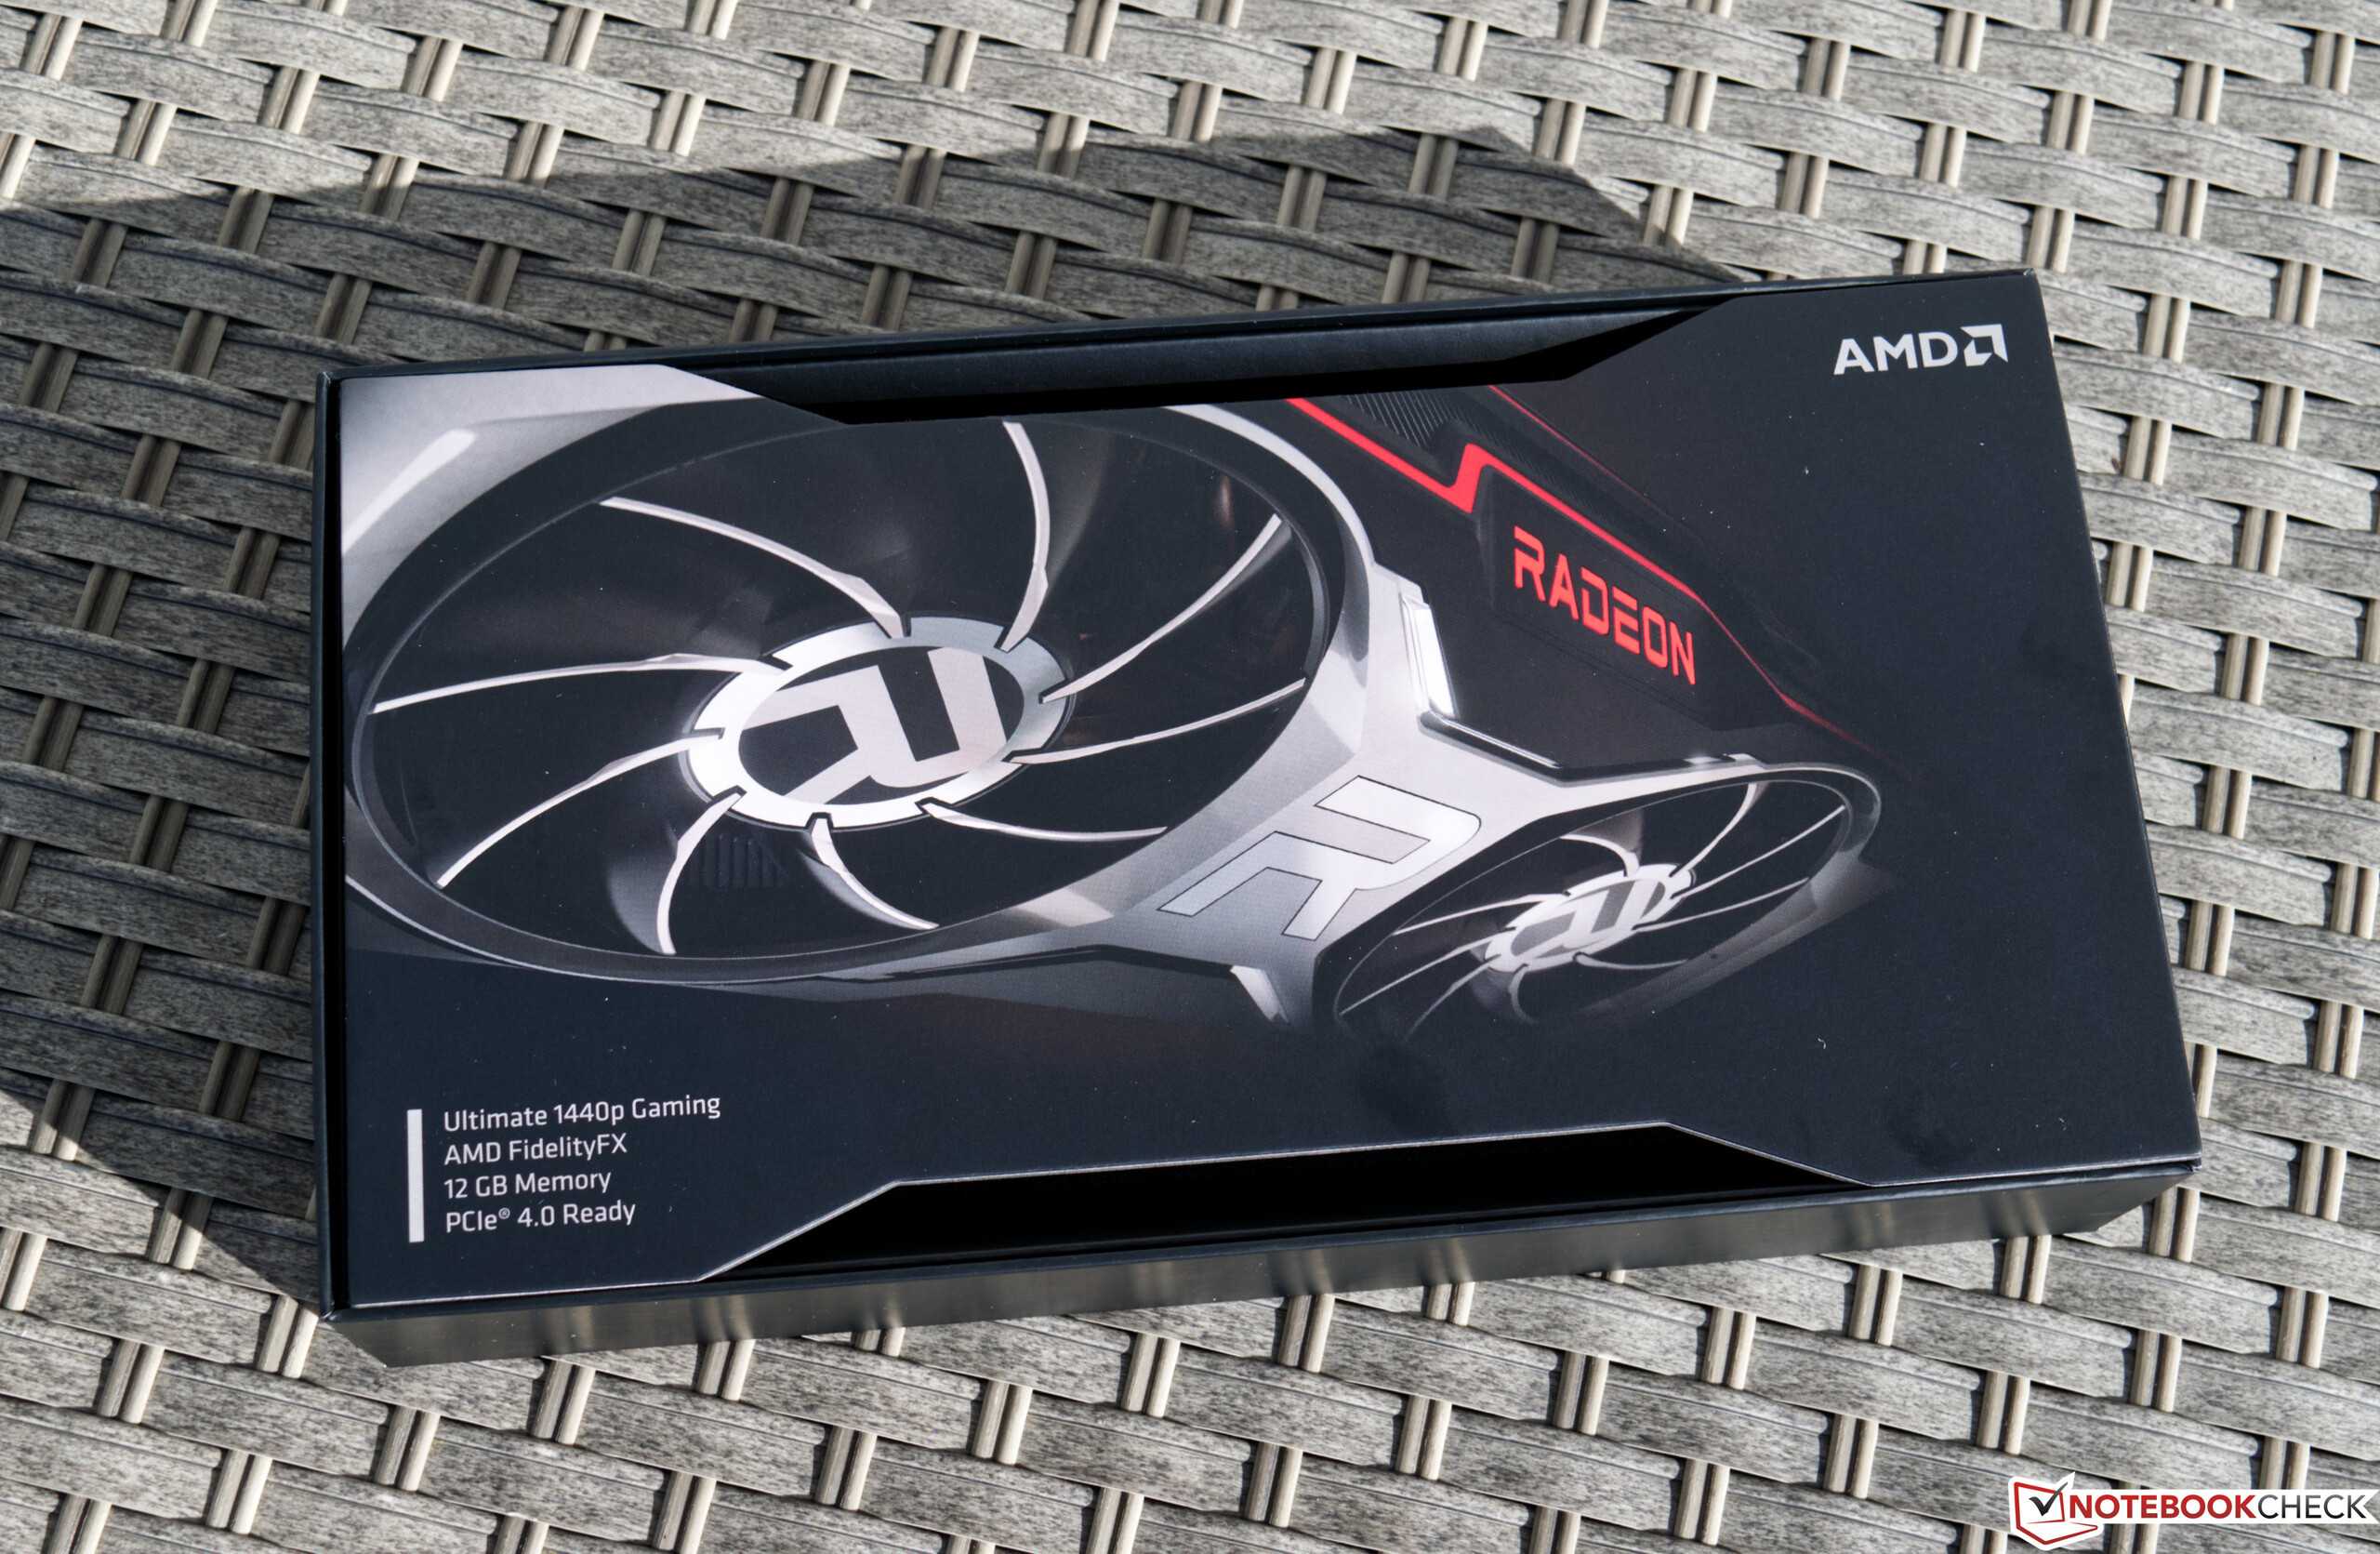
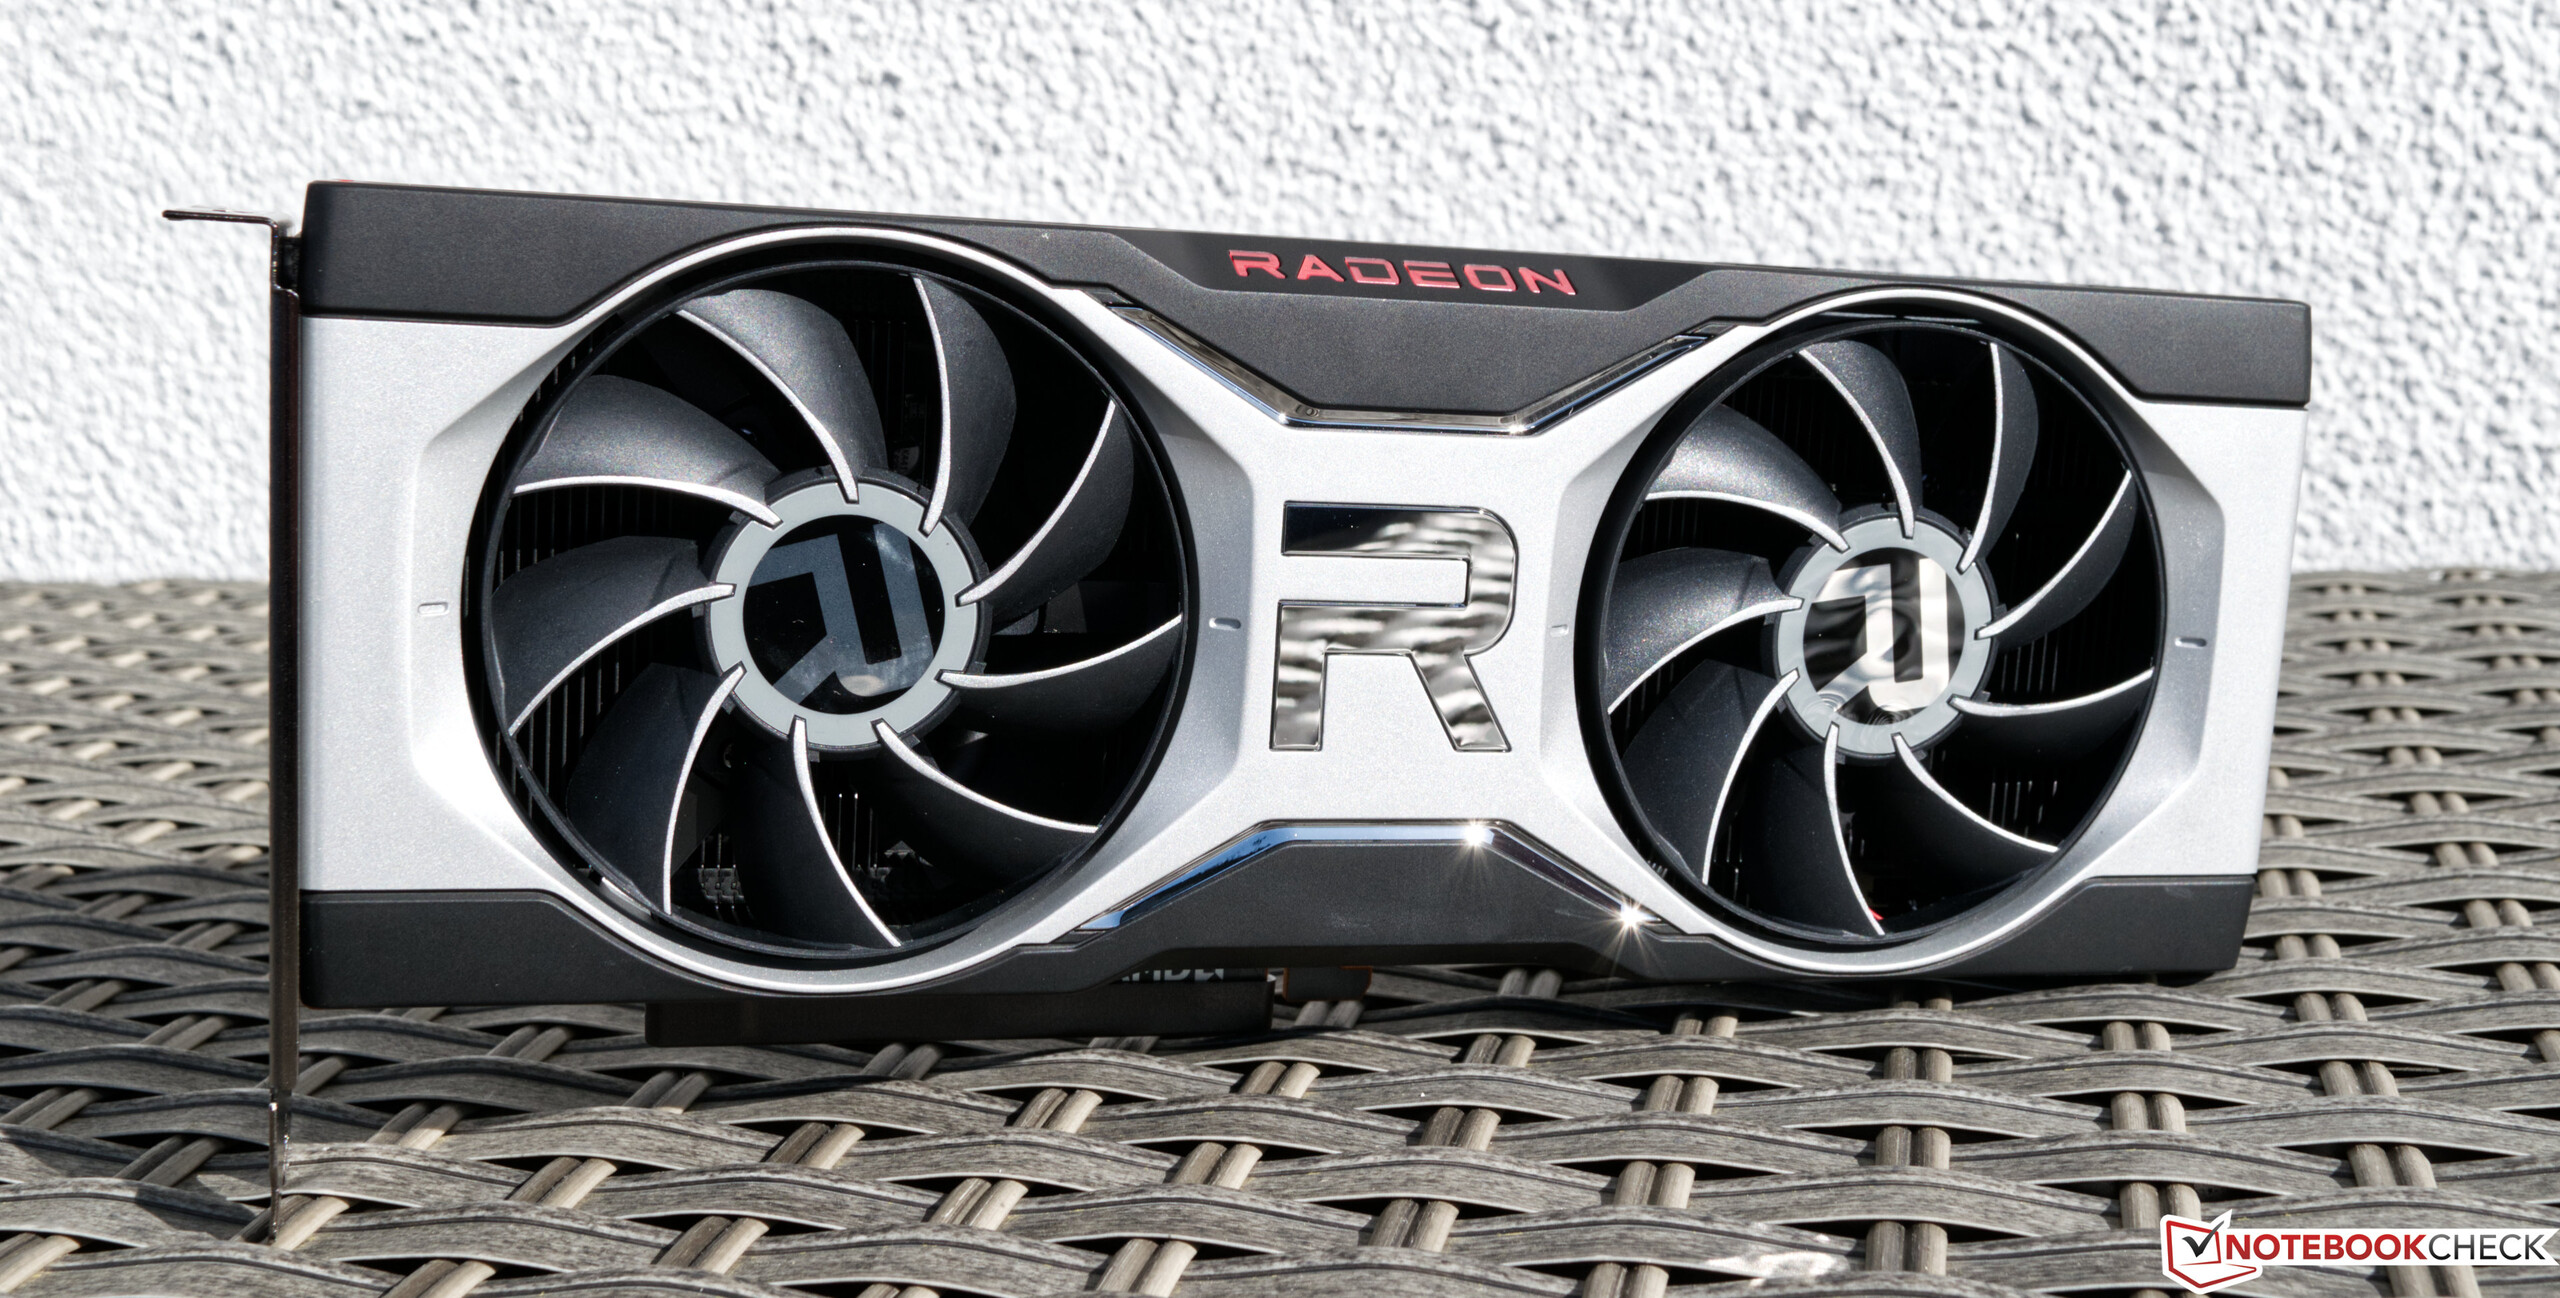
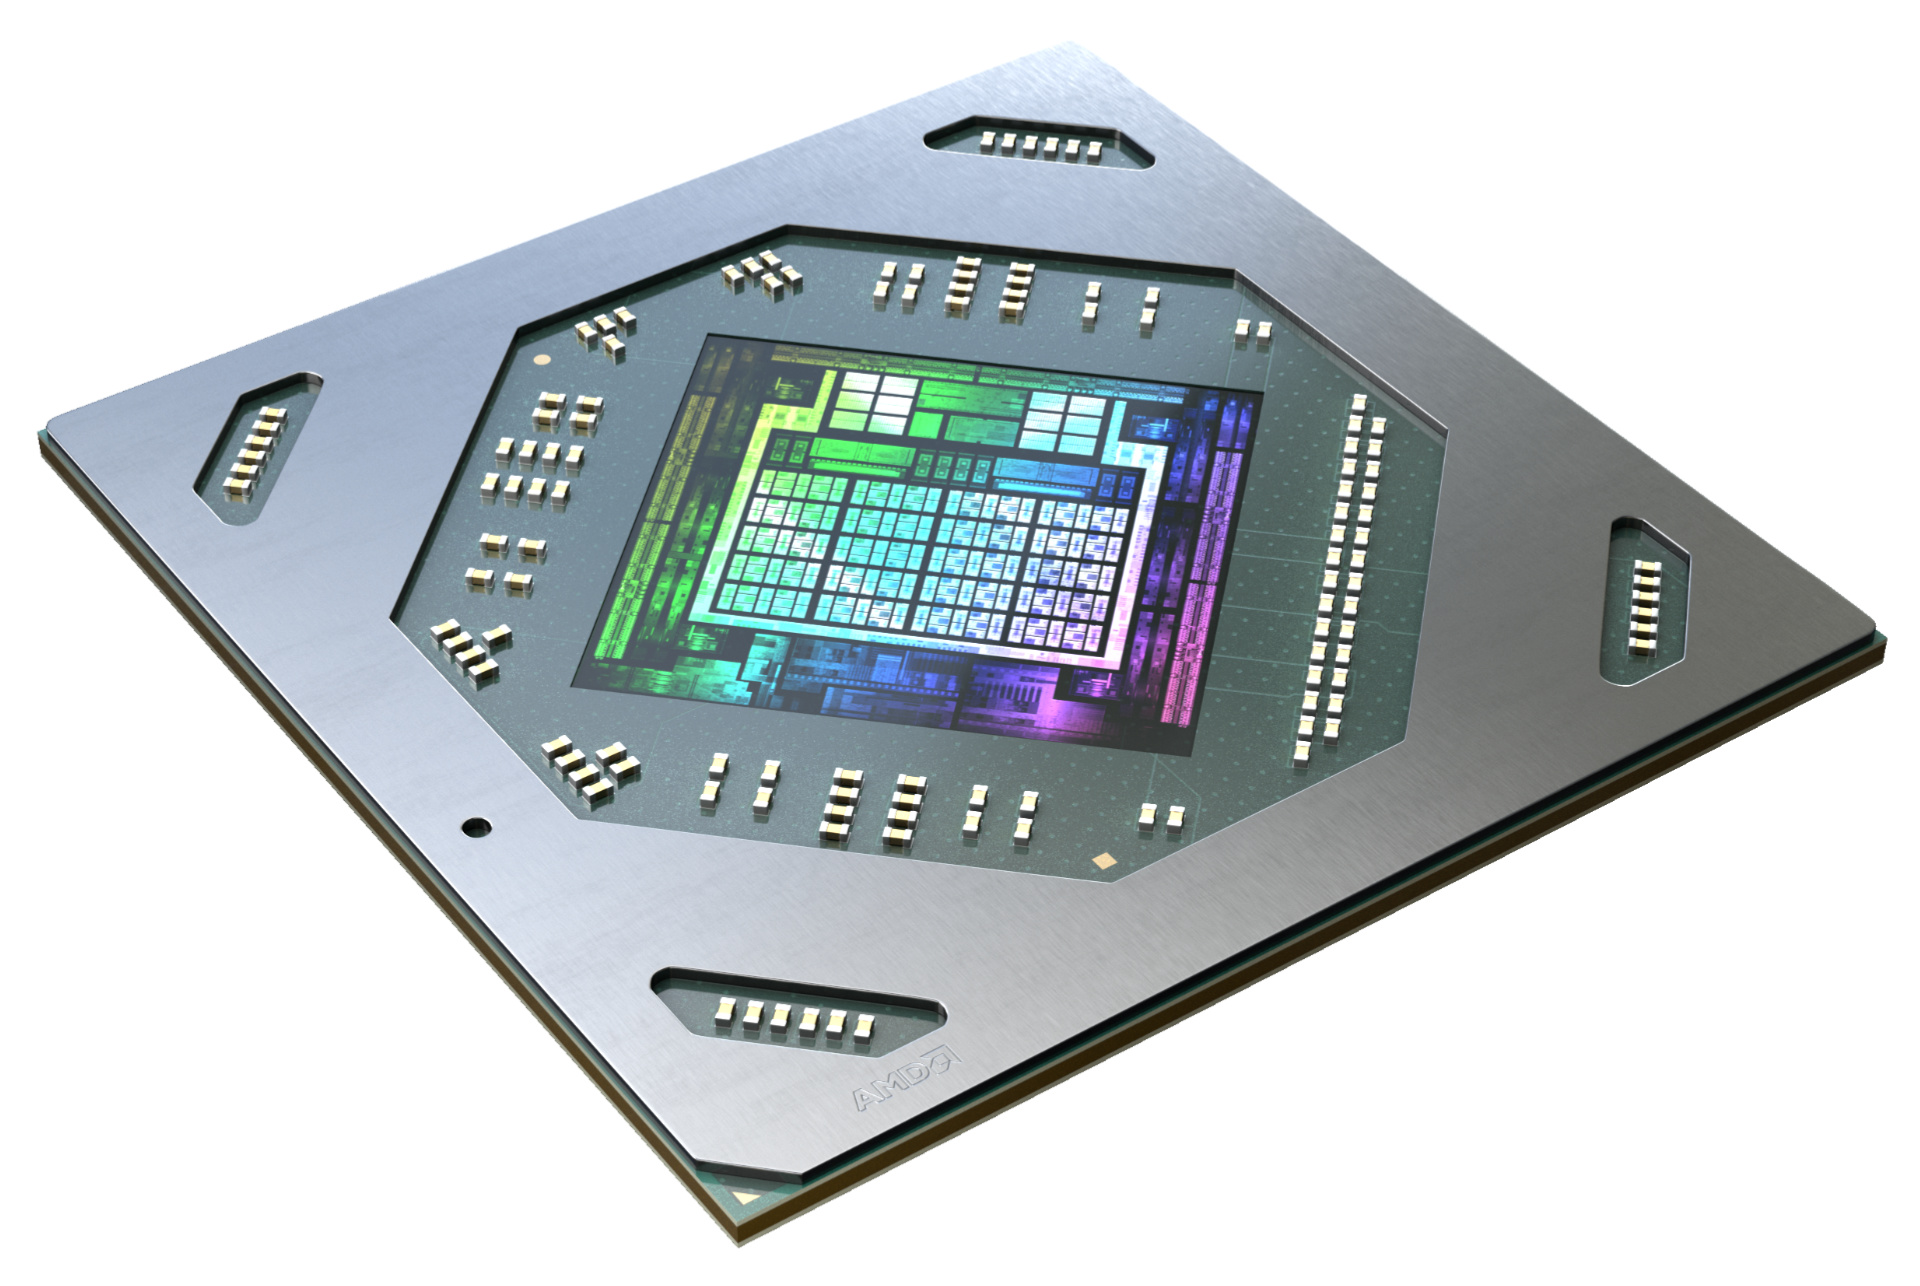
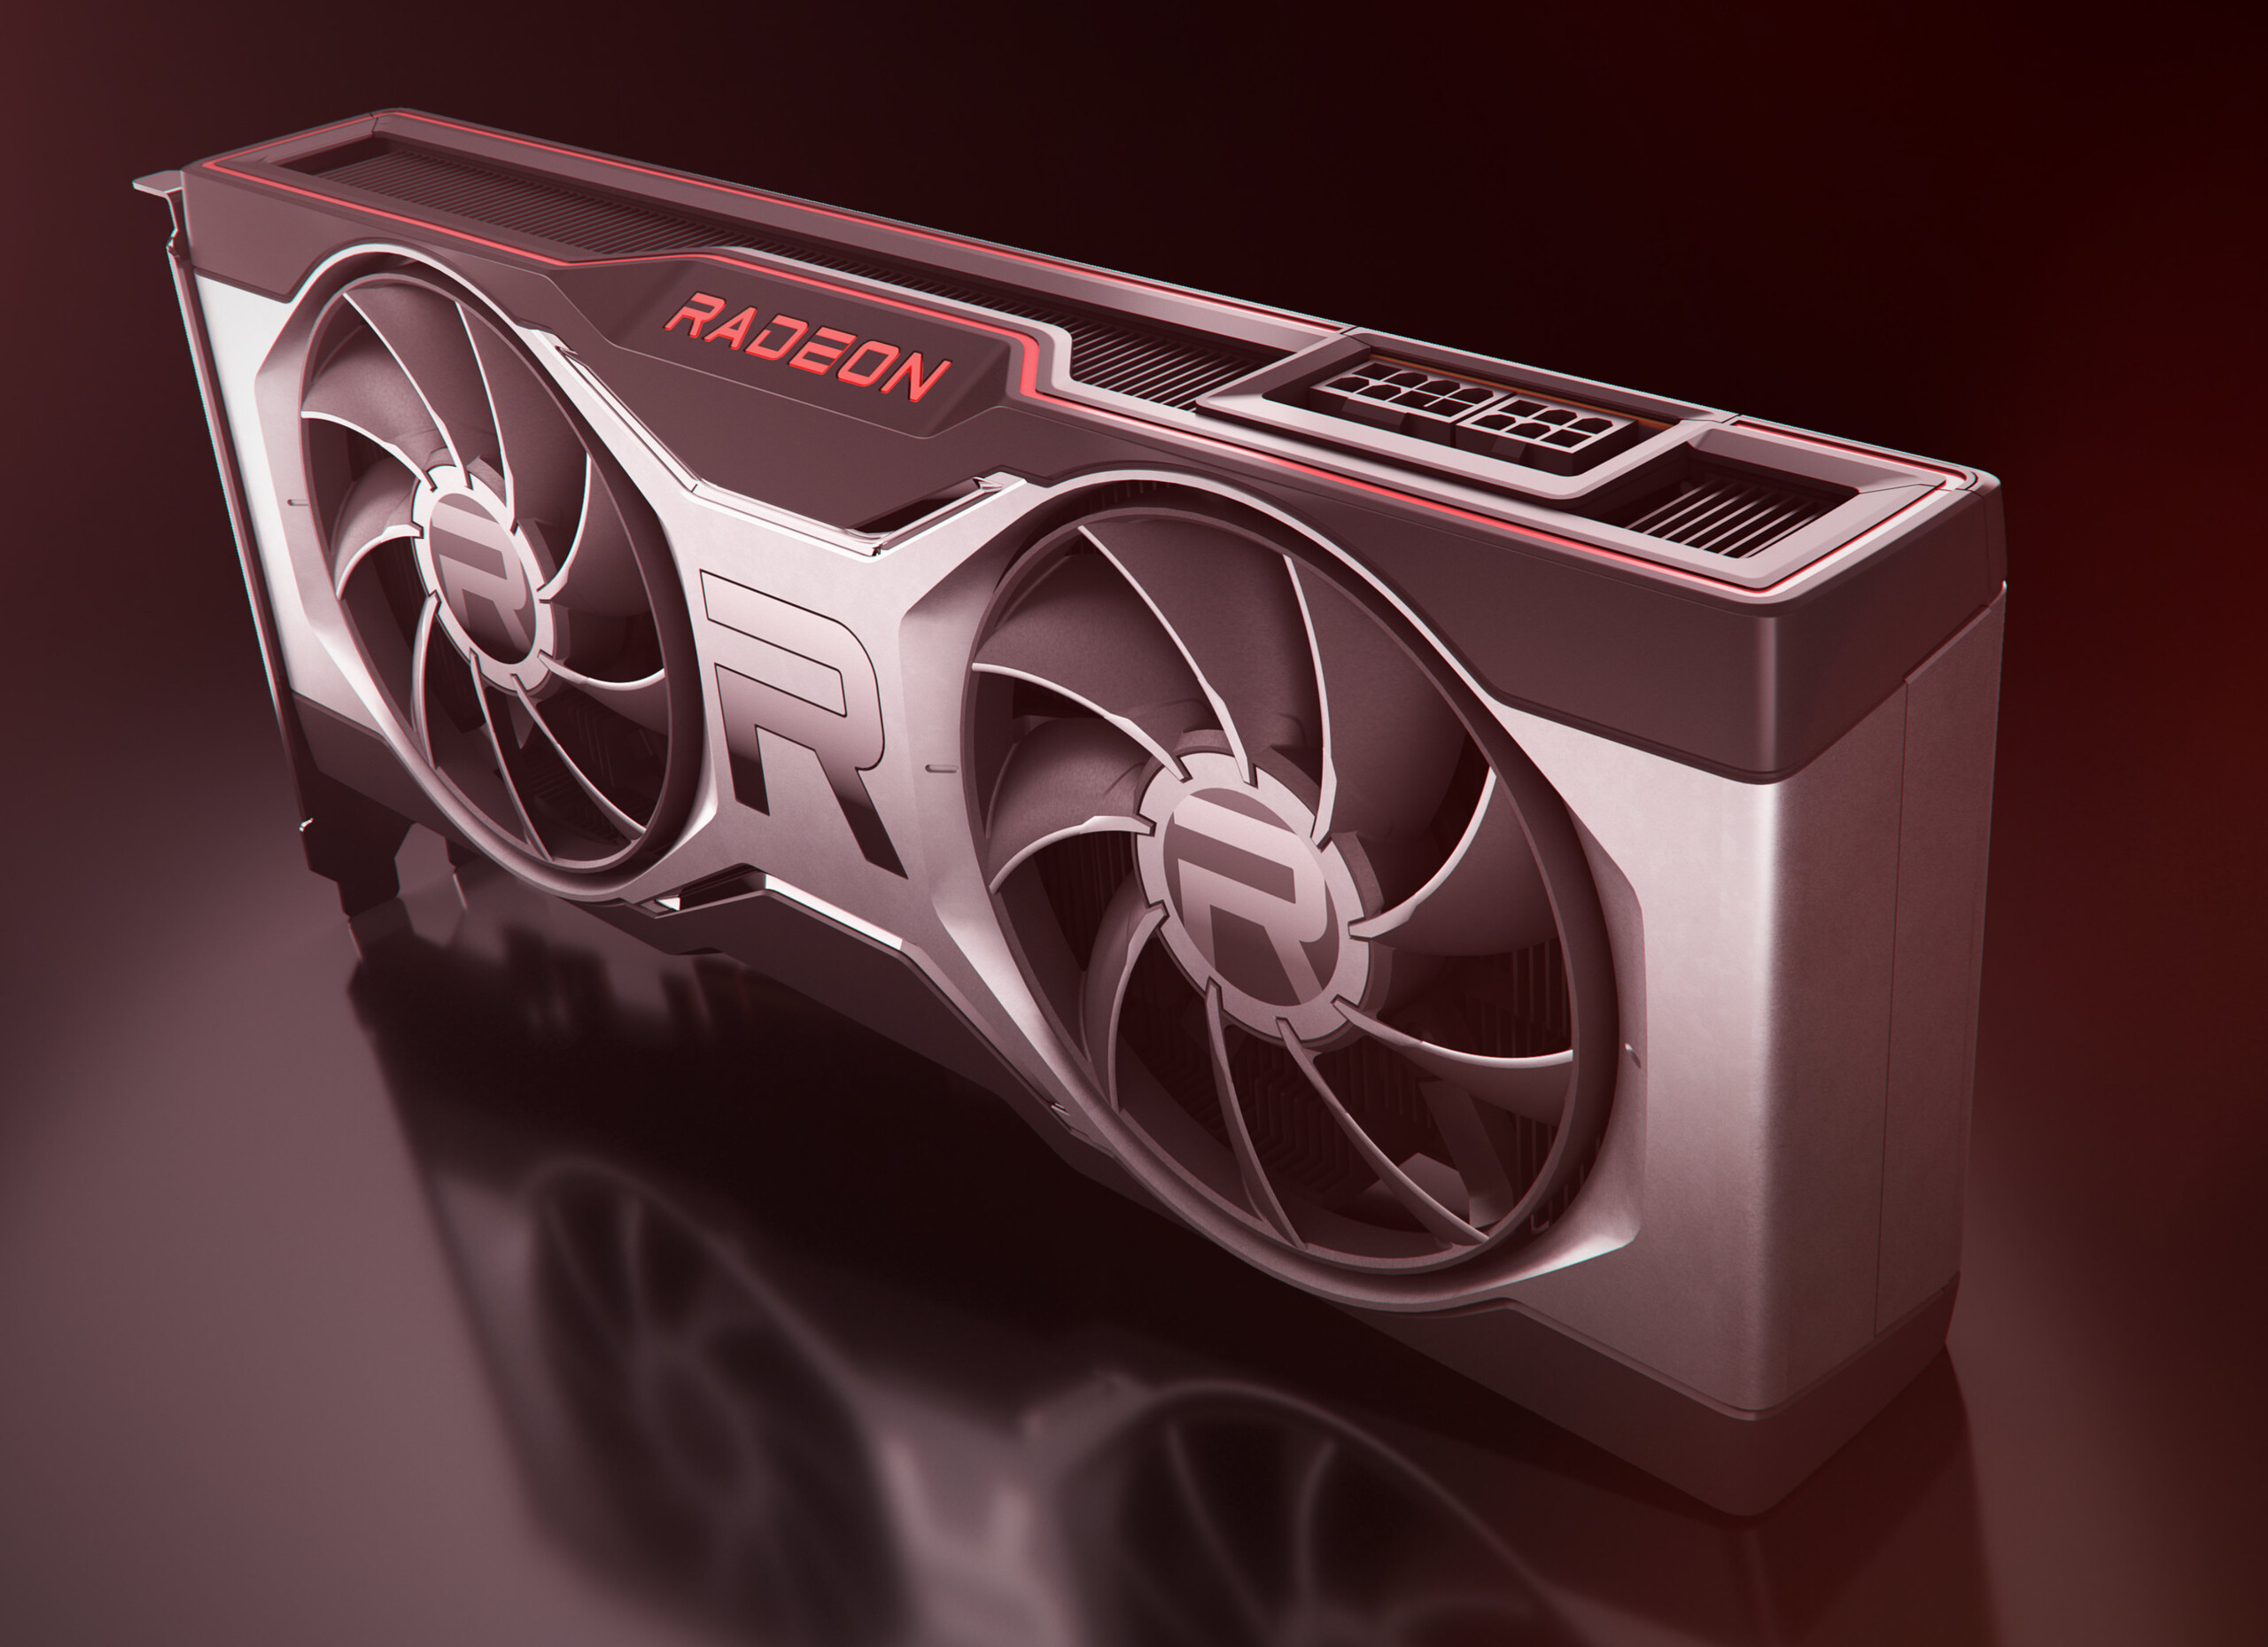
The new mid-range: The AMD Radeon RX 6700 XT Desktop GPU is equipped with 12 GB of VRAM

Unfortunately, the graphics card market is still completely overwhelmed, which is reflected in the very poor availability of various graphics cards. Whether AMD manages to prevent the AMD Radeon RX 6700 XT from suffering the same fate will be seen in the near future.
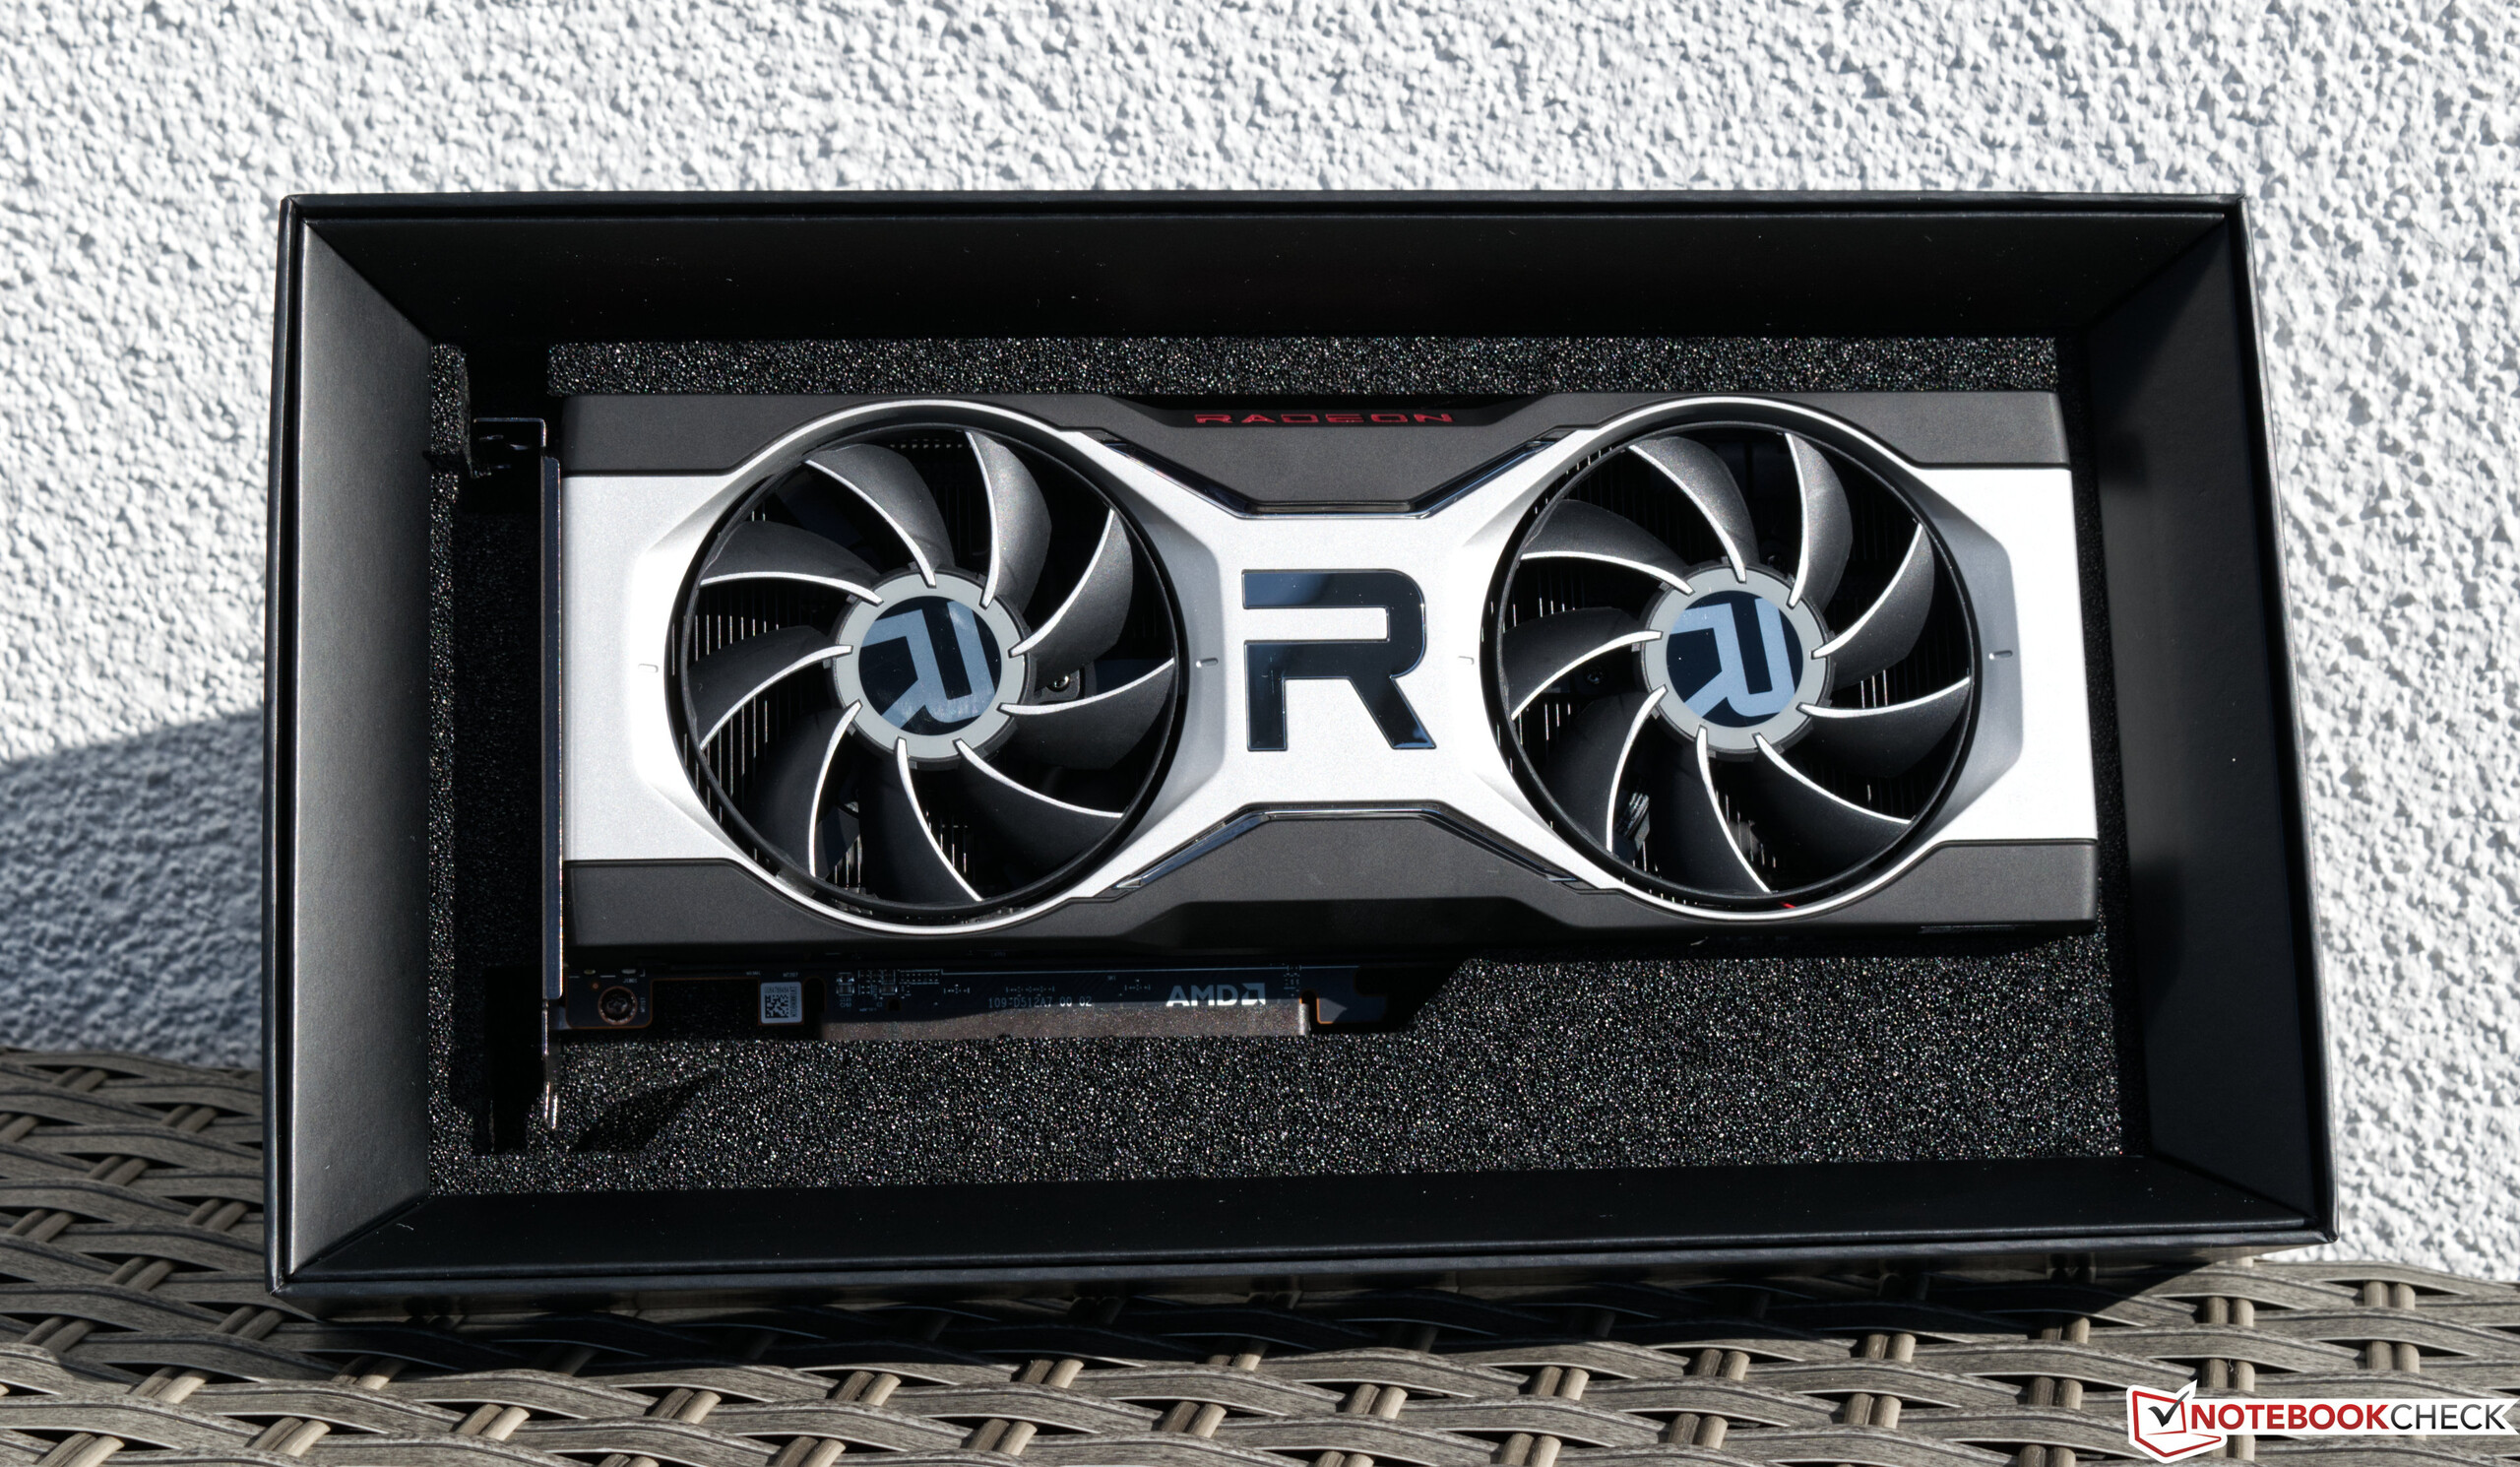
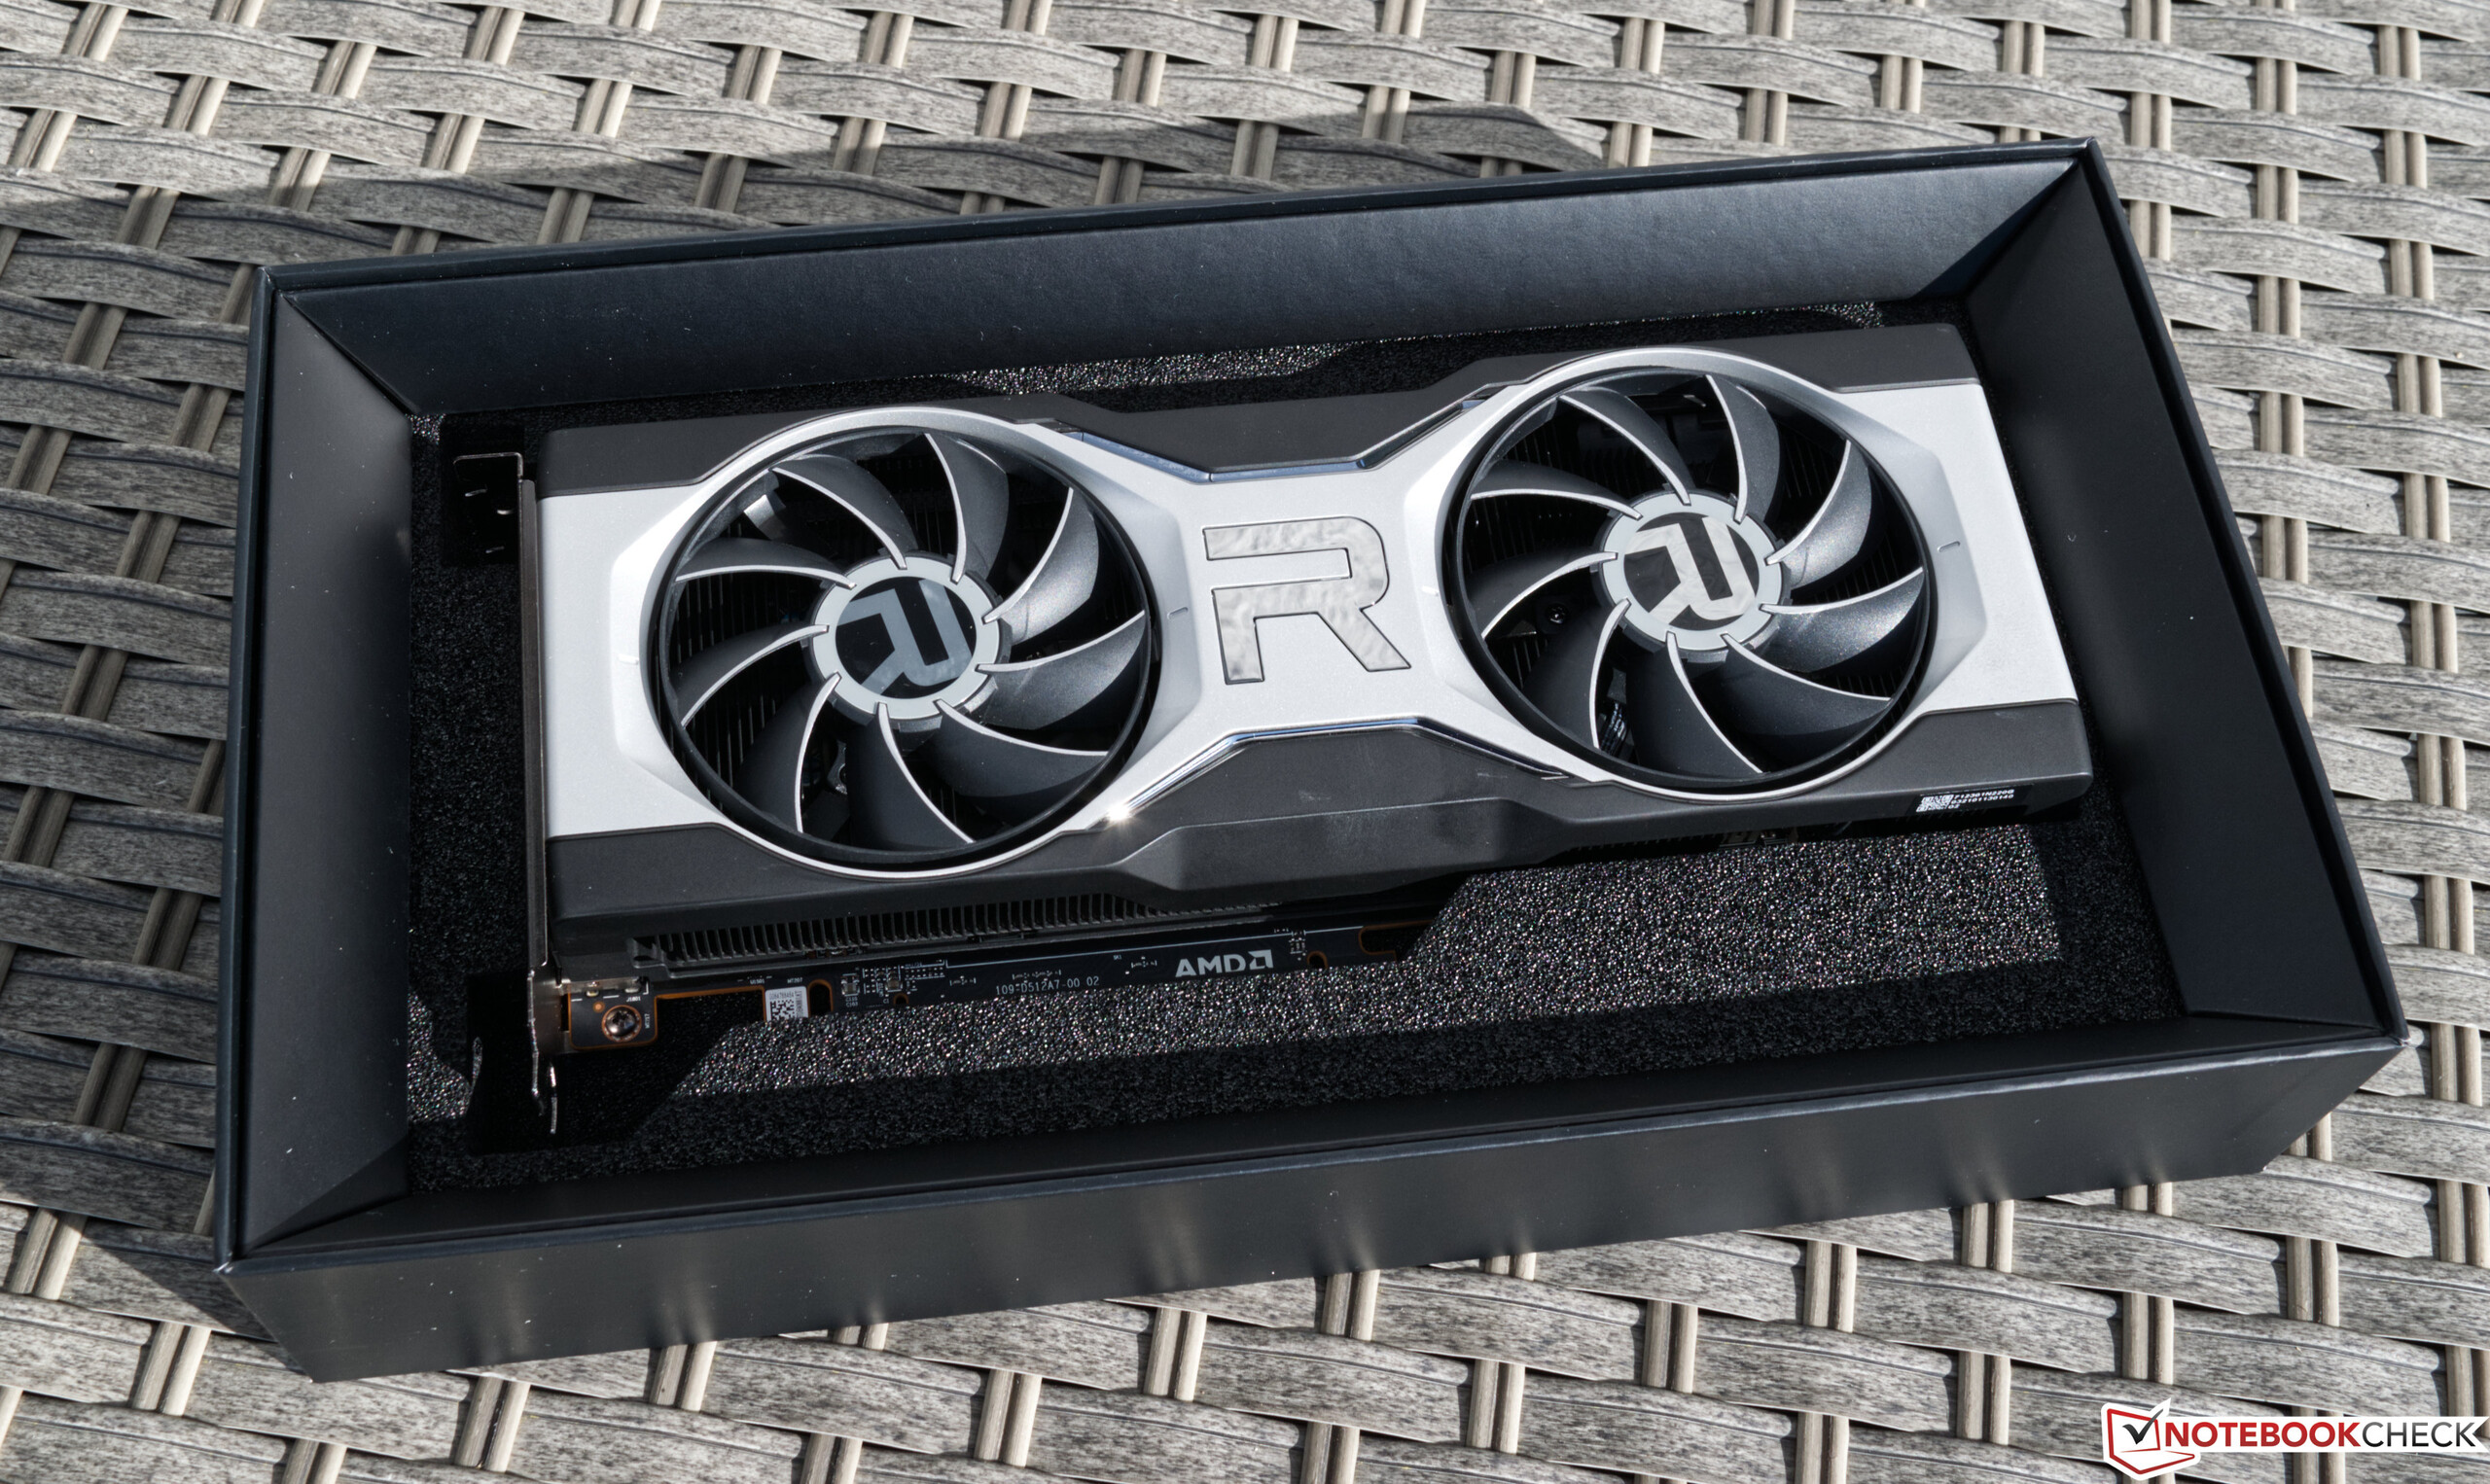
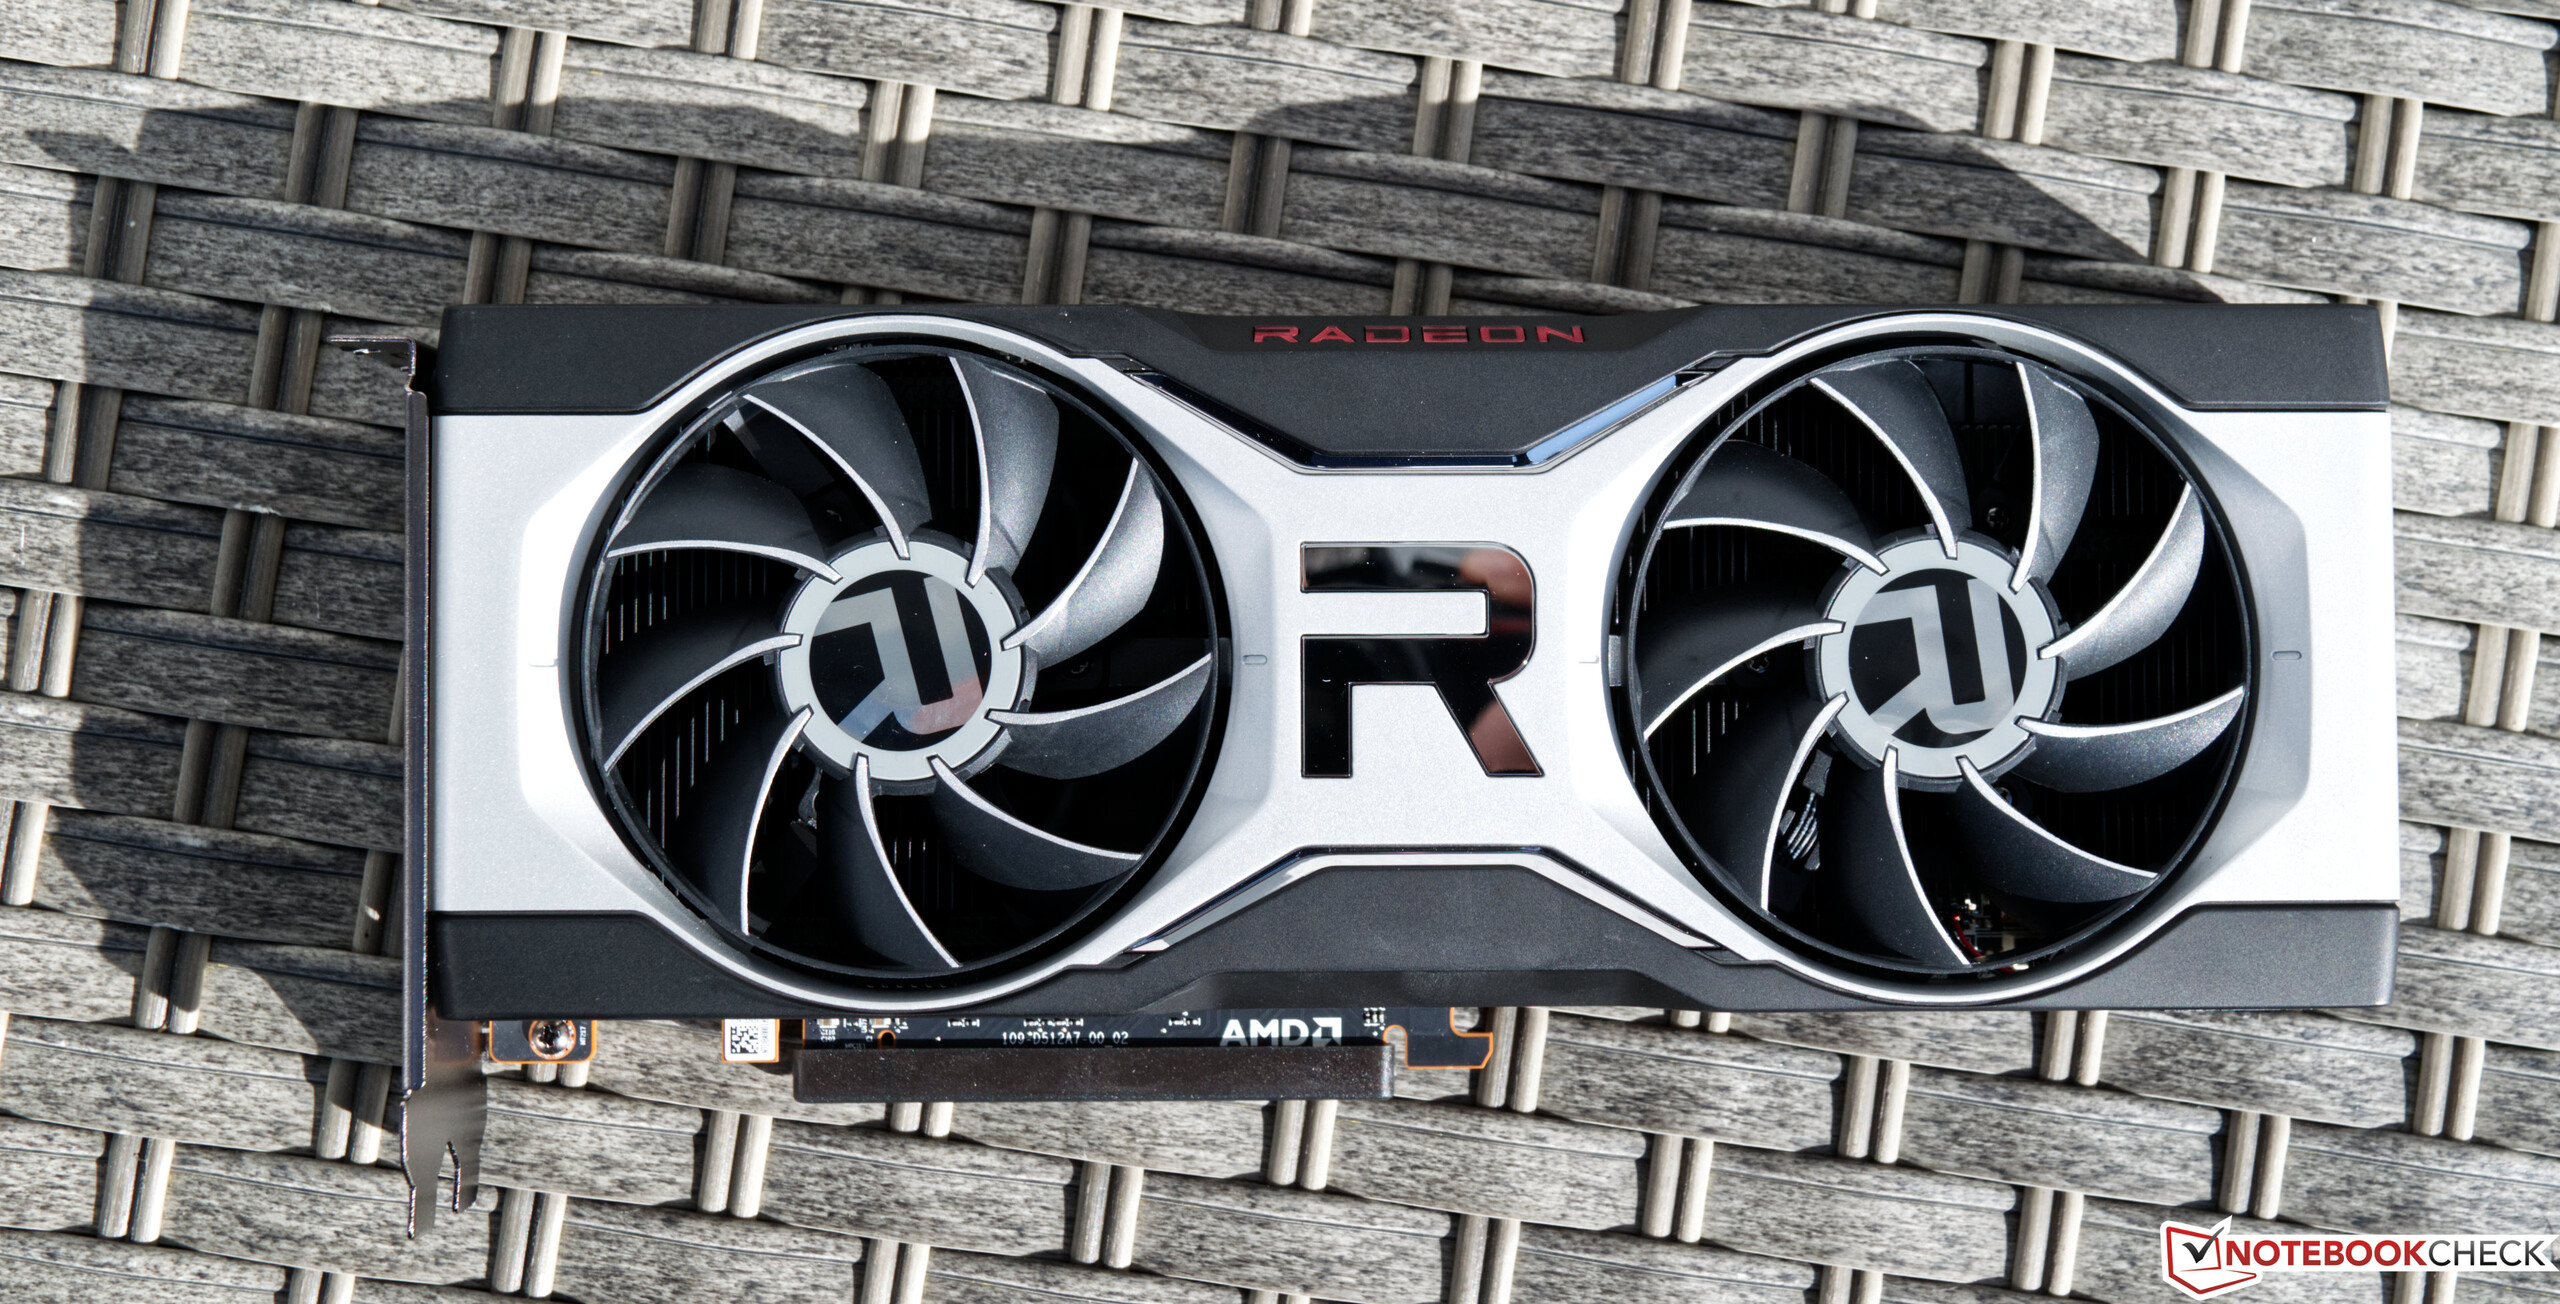
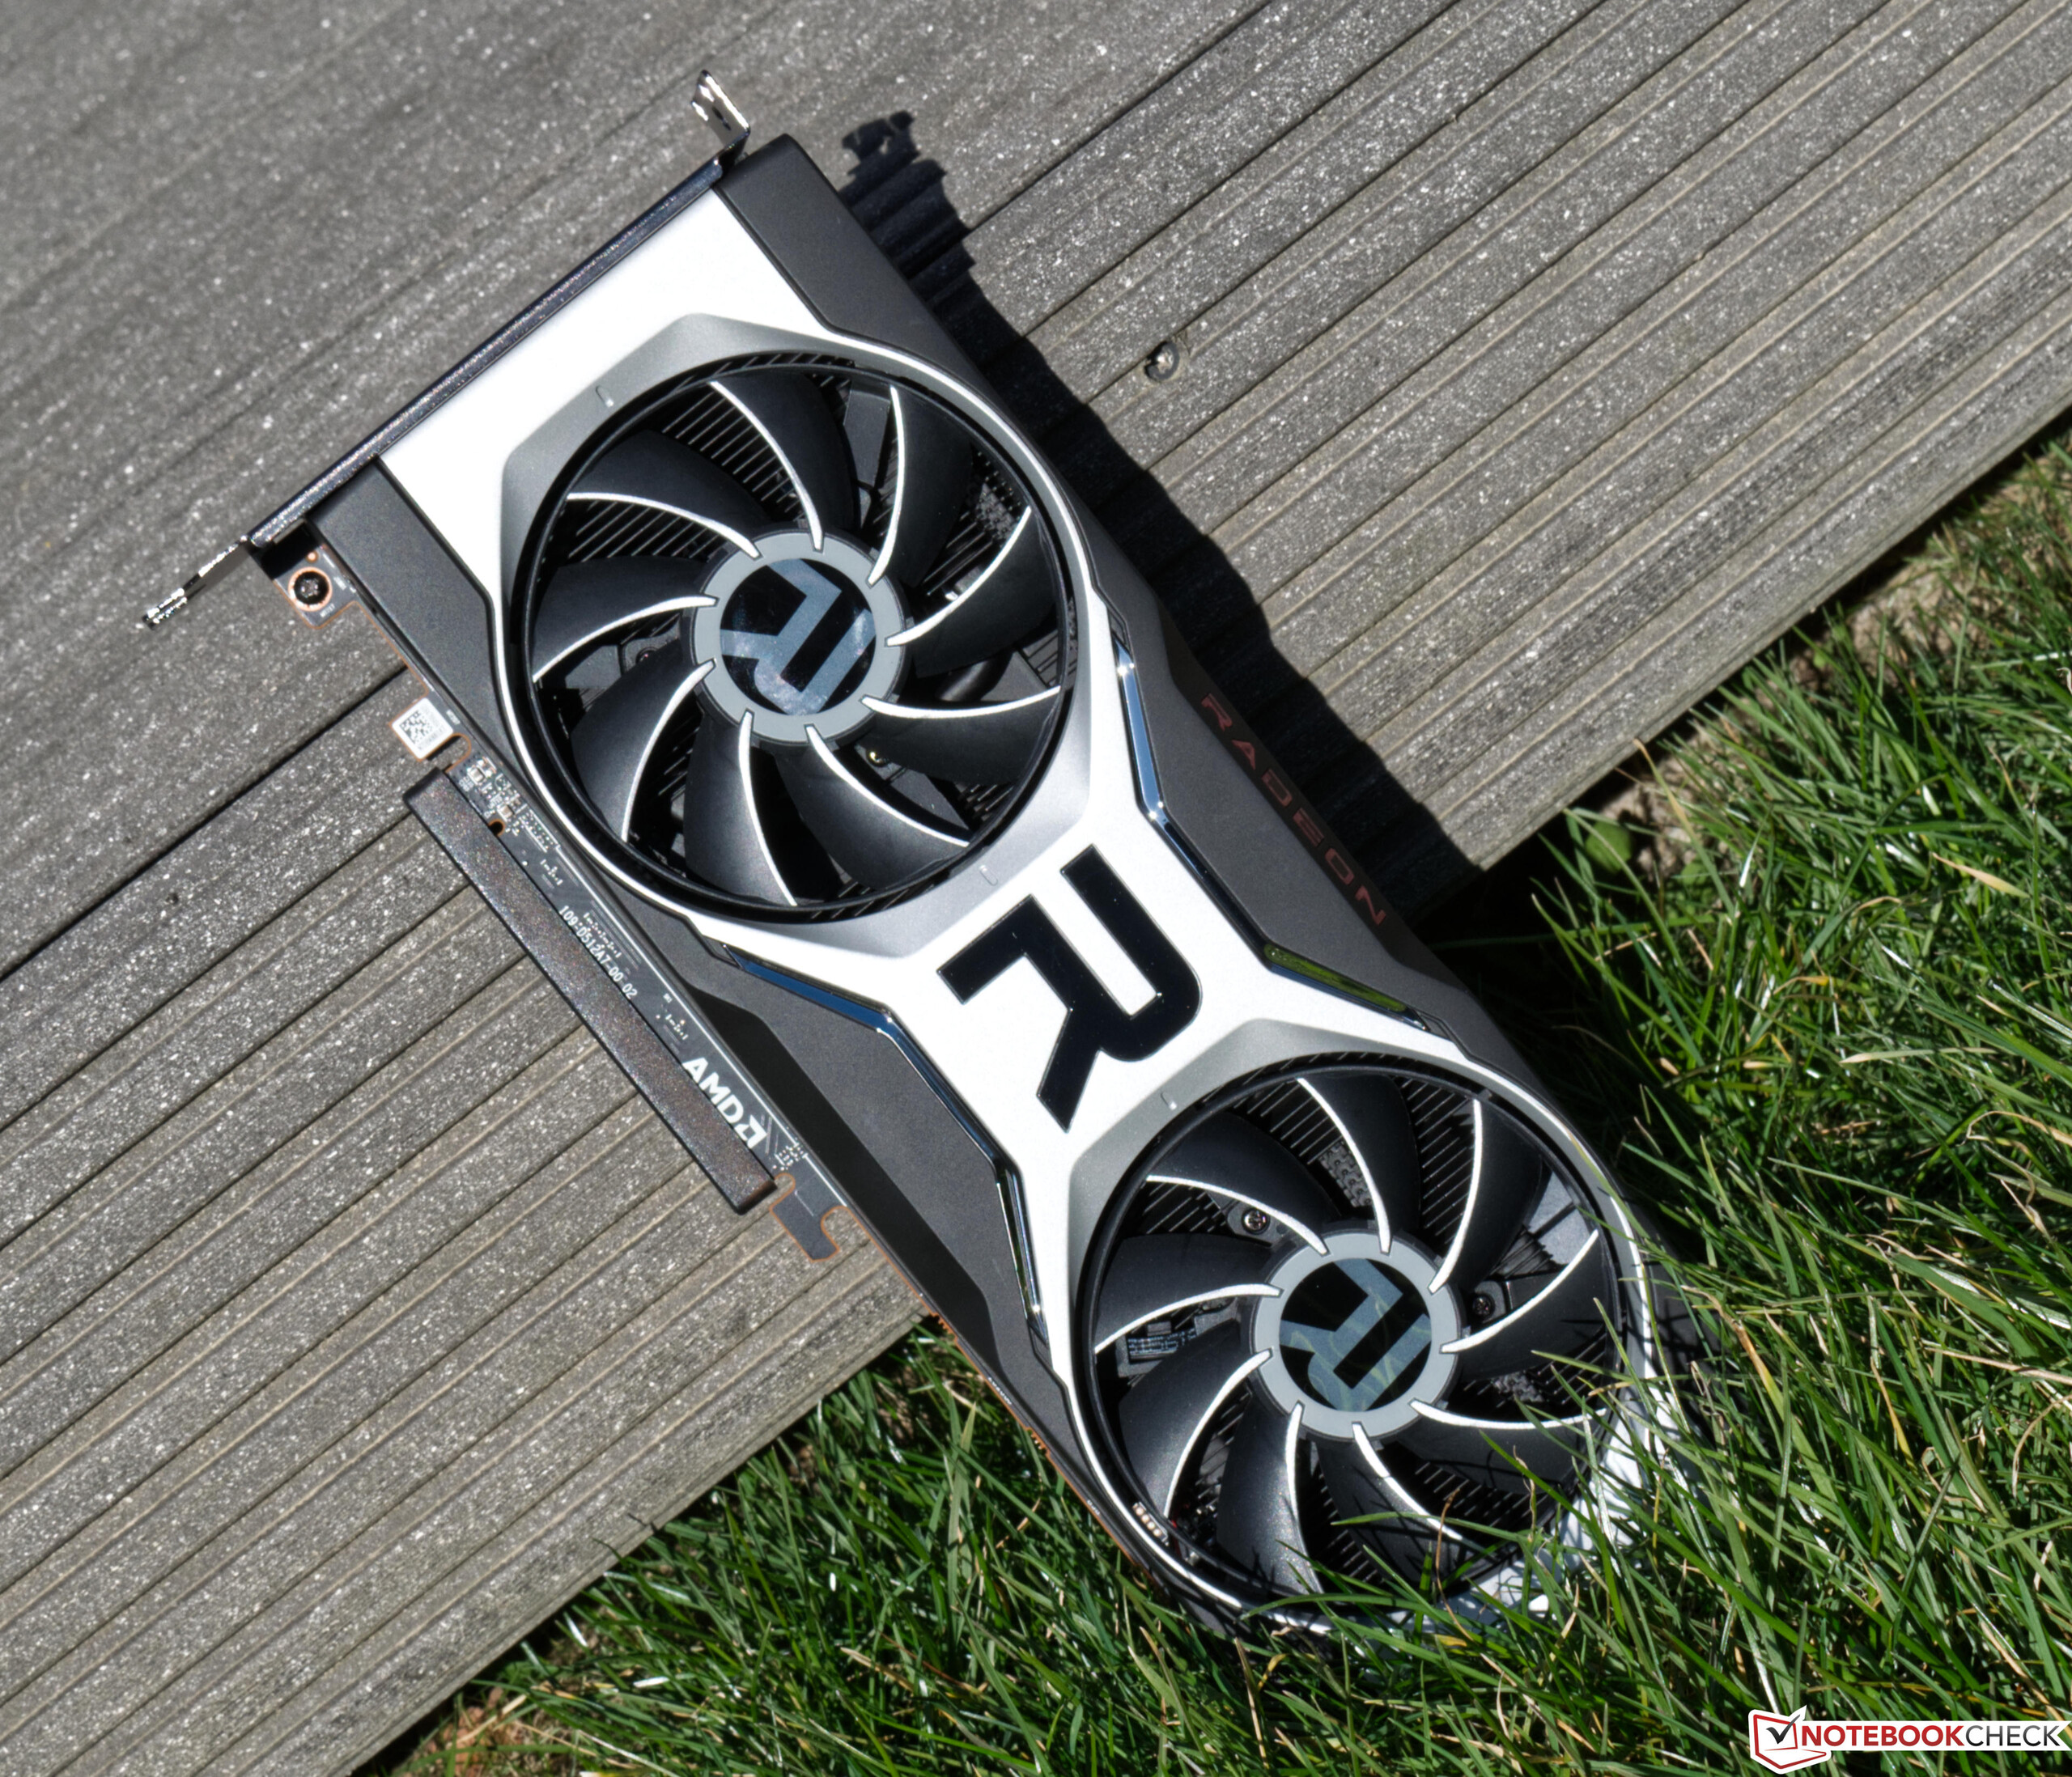
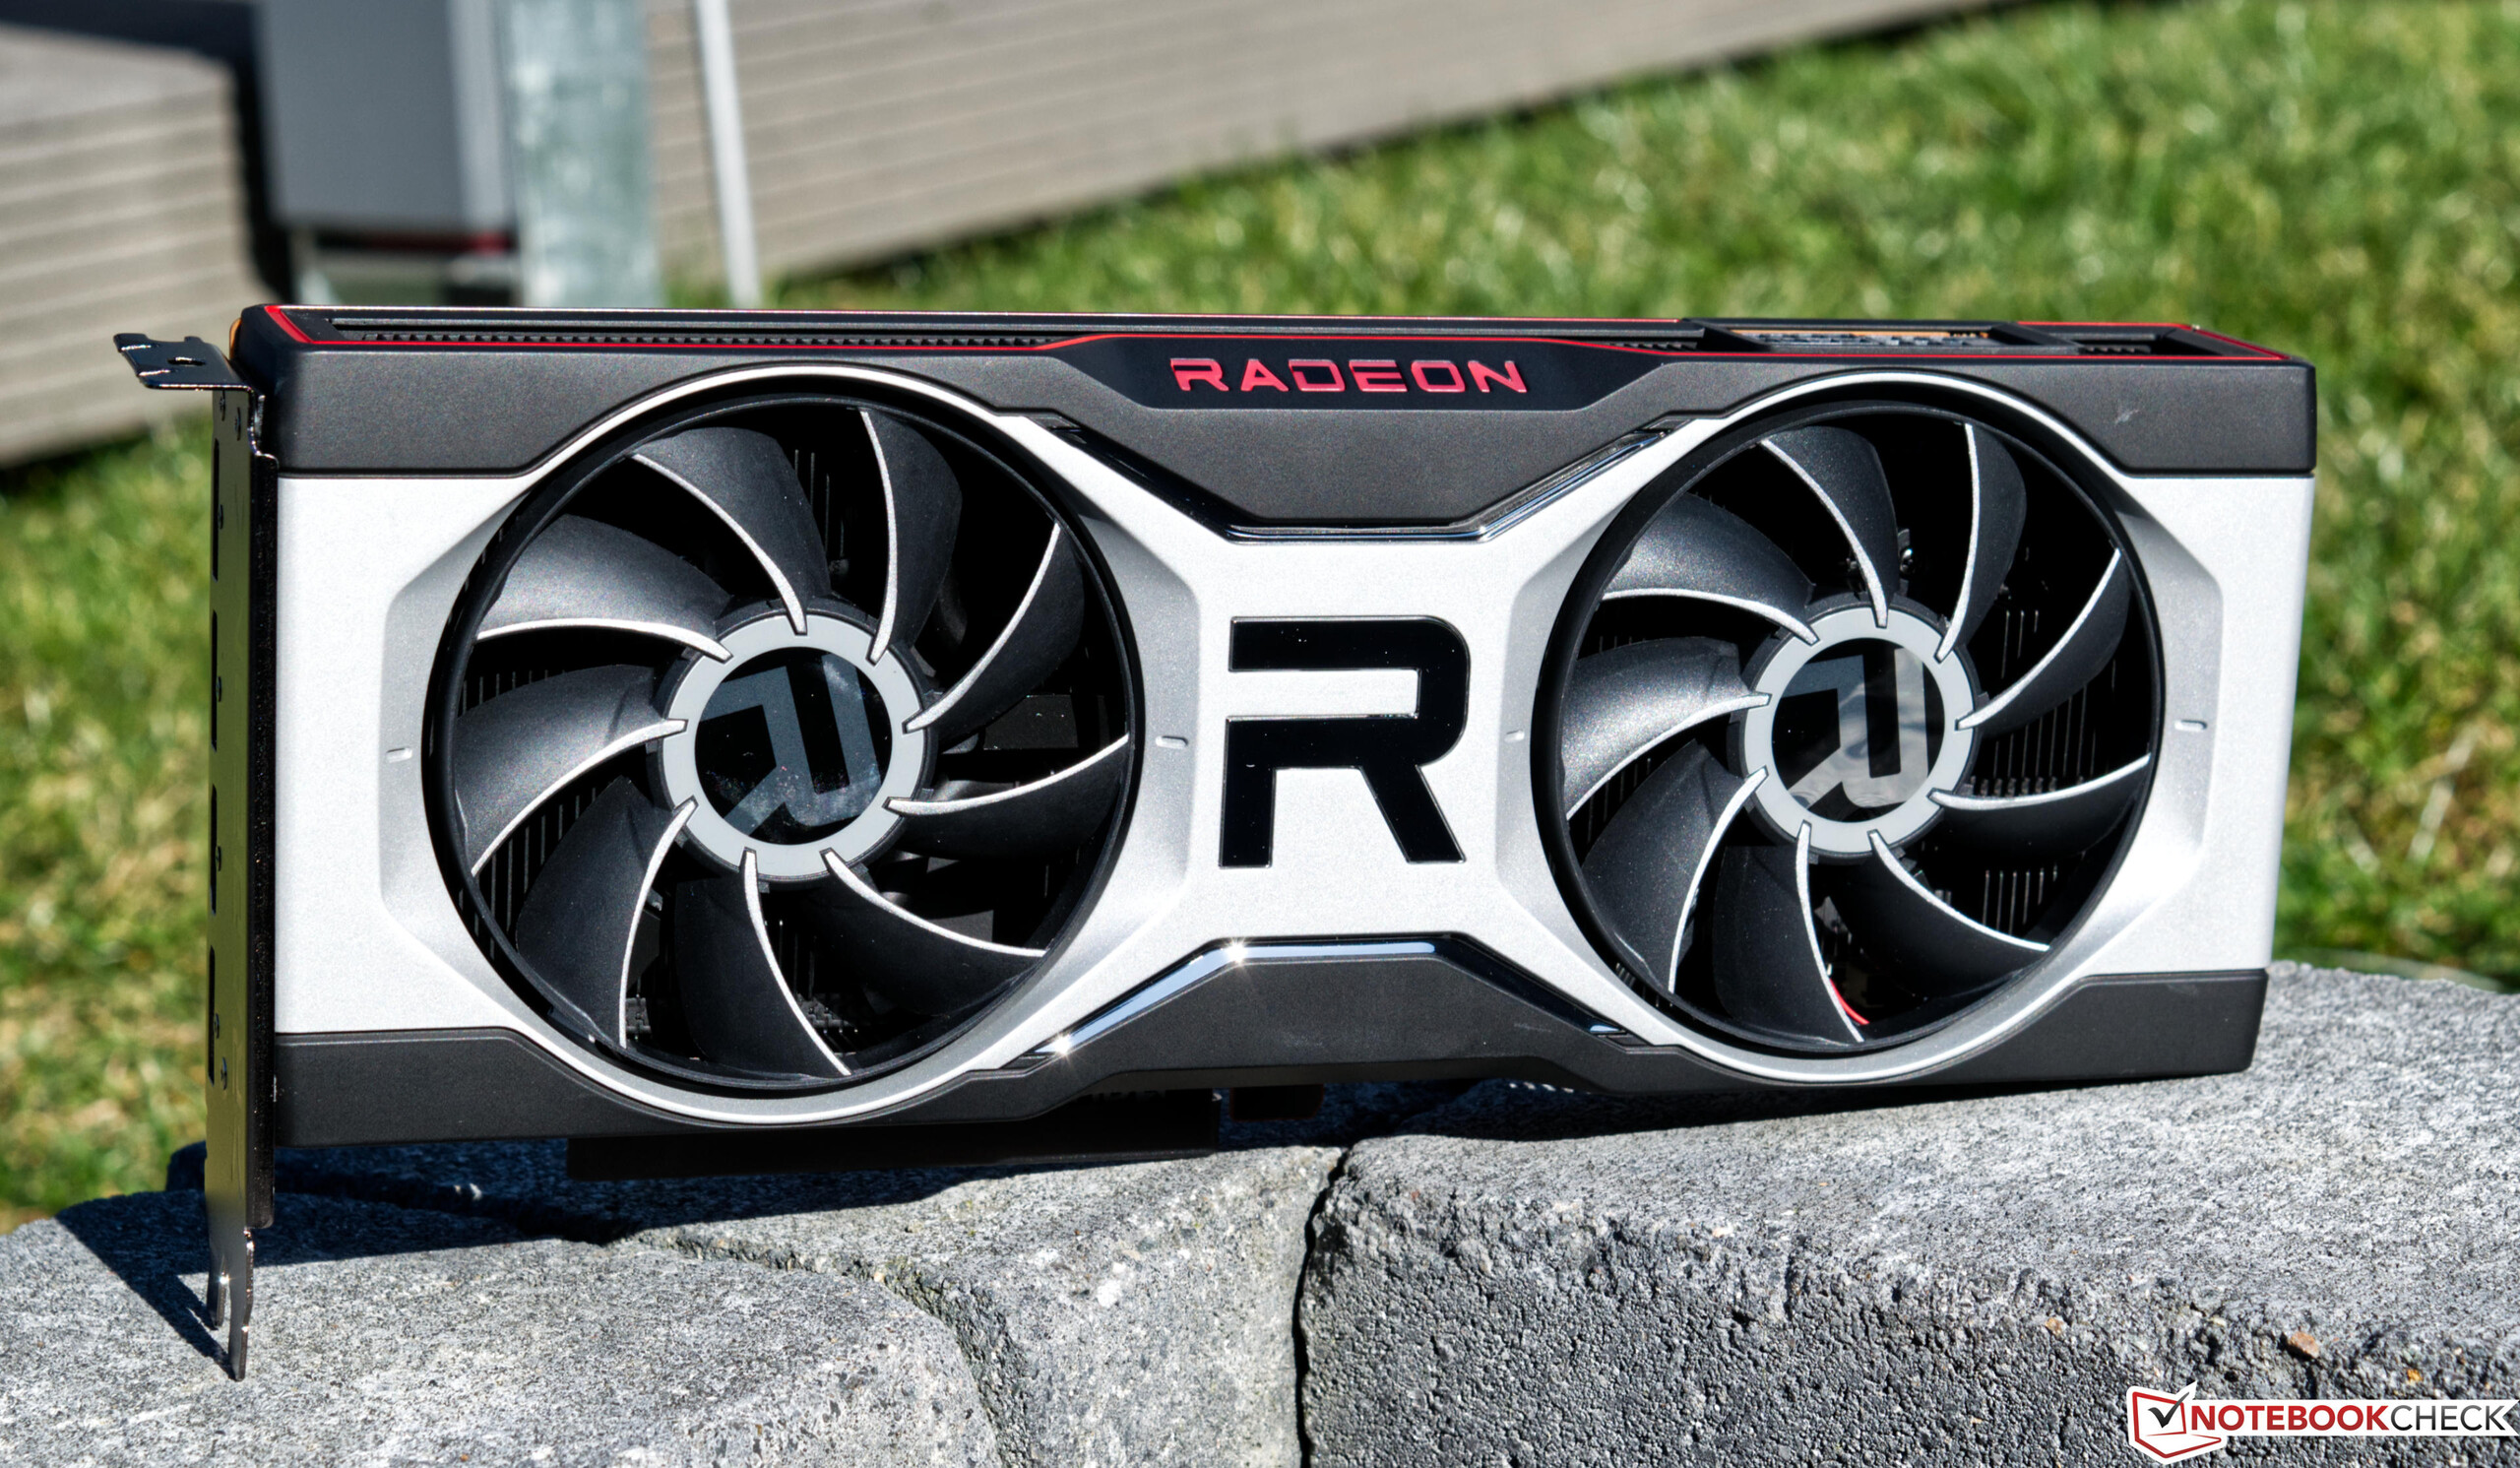
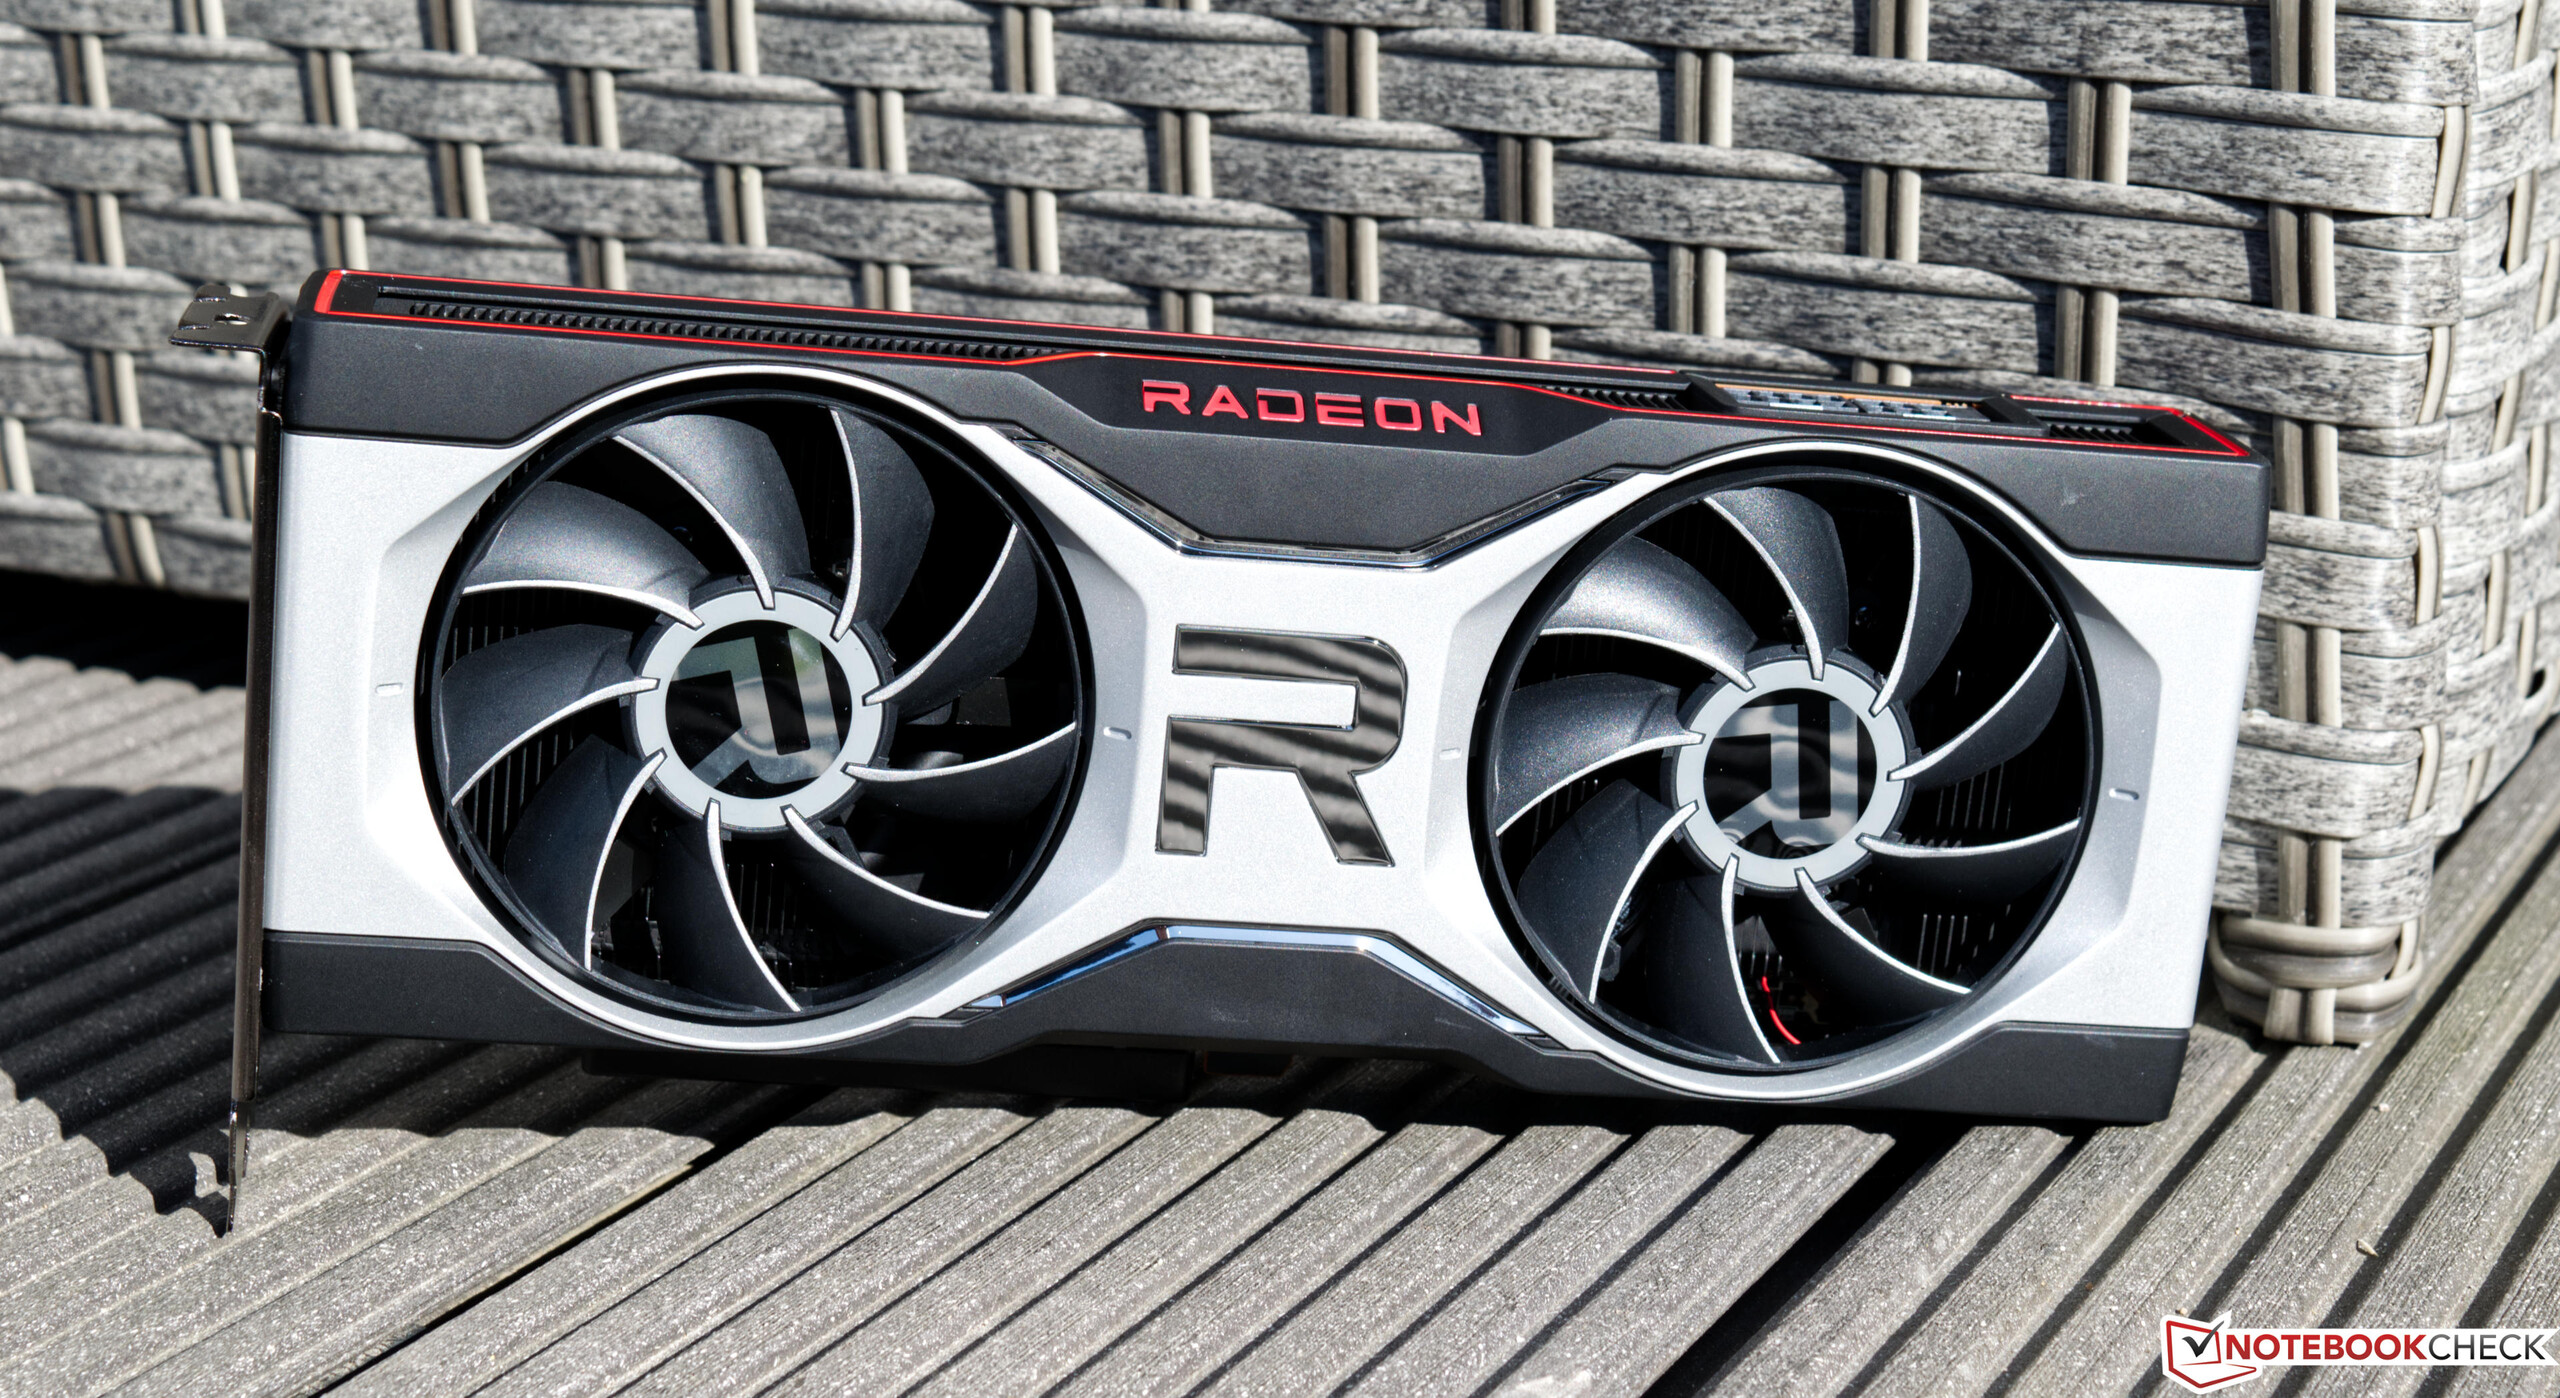
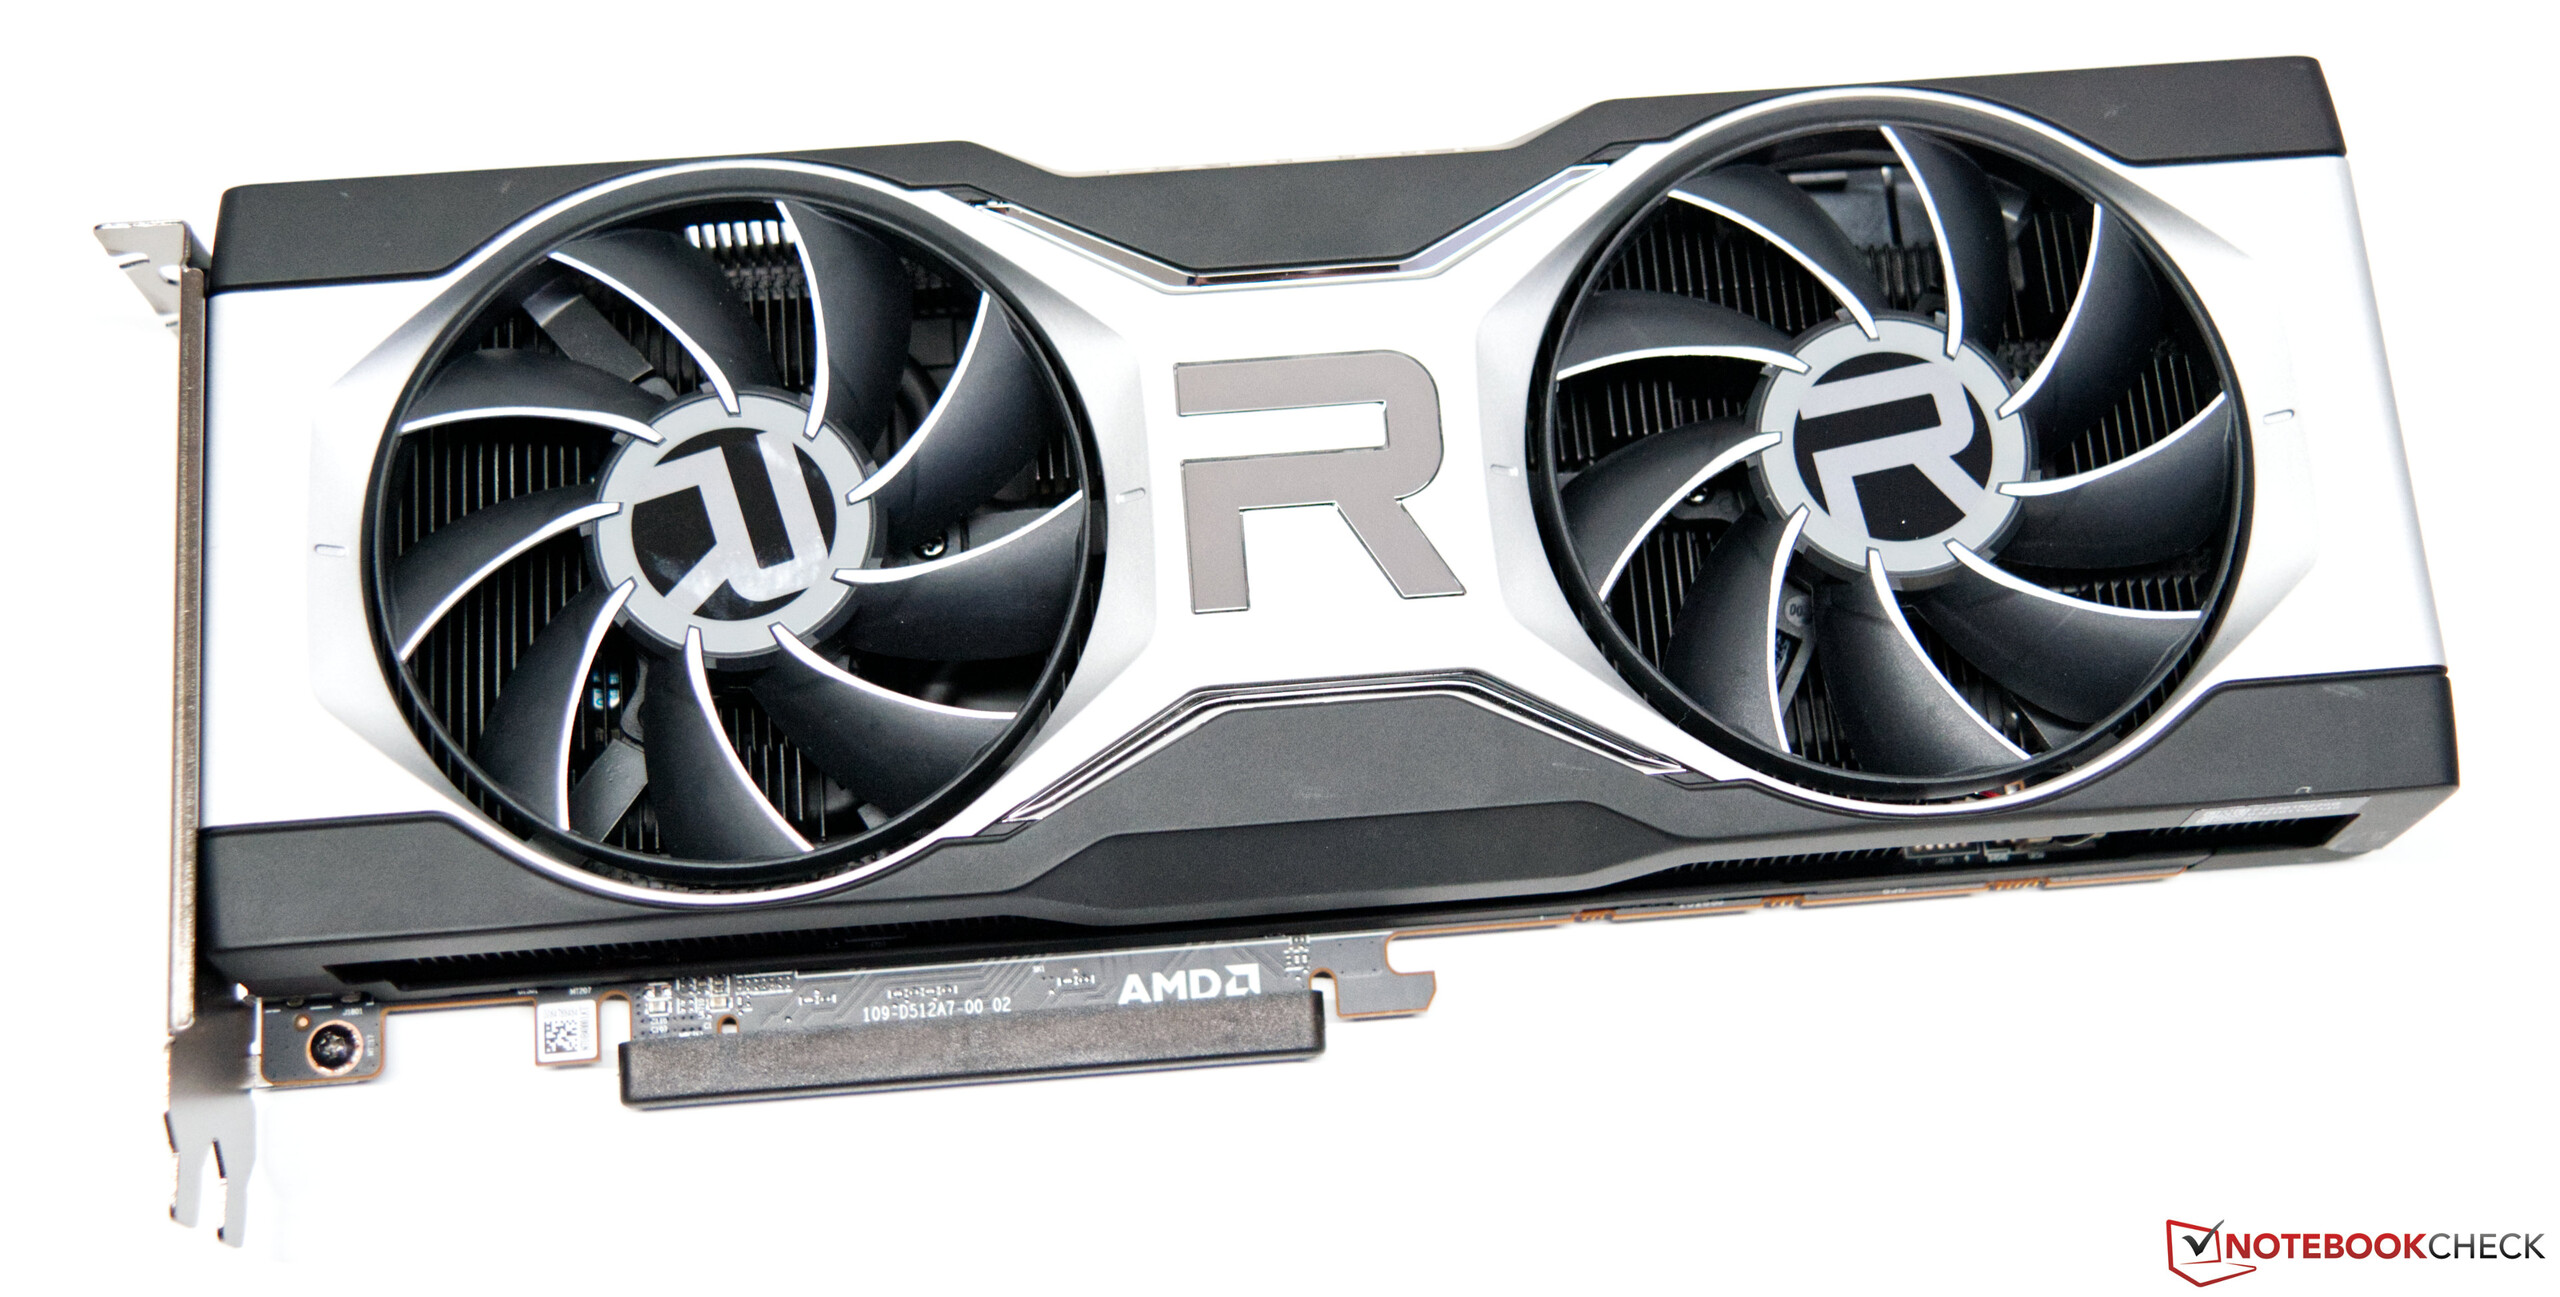
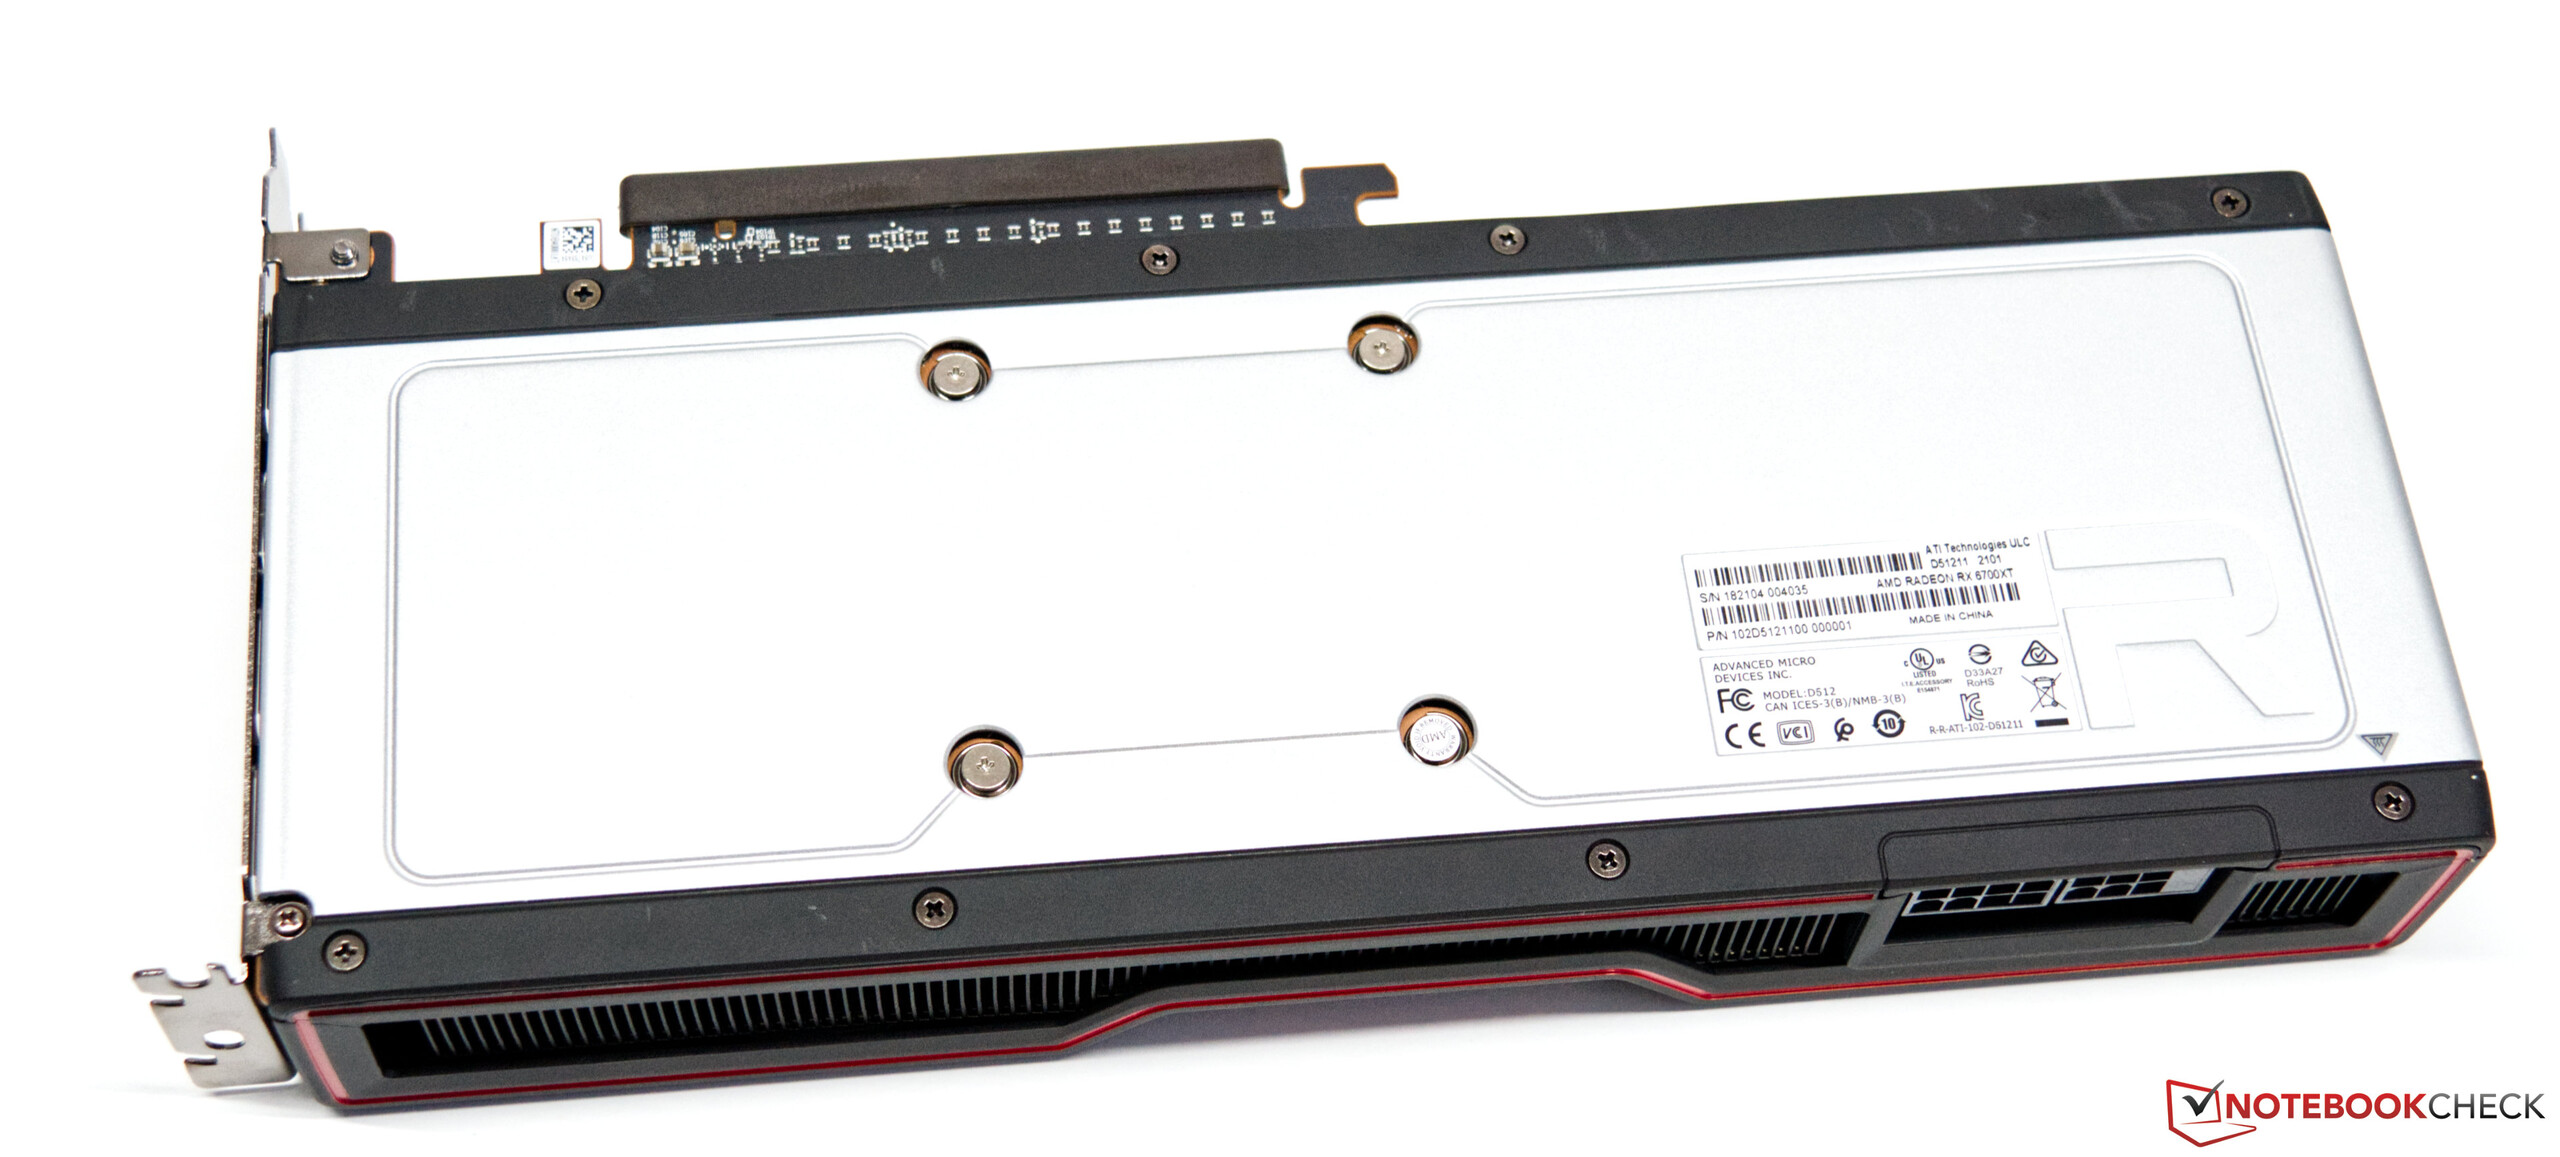
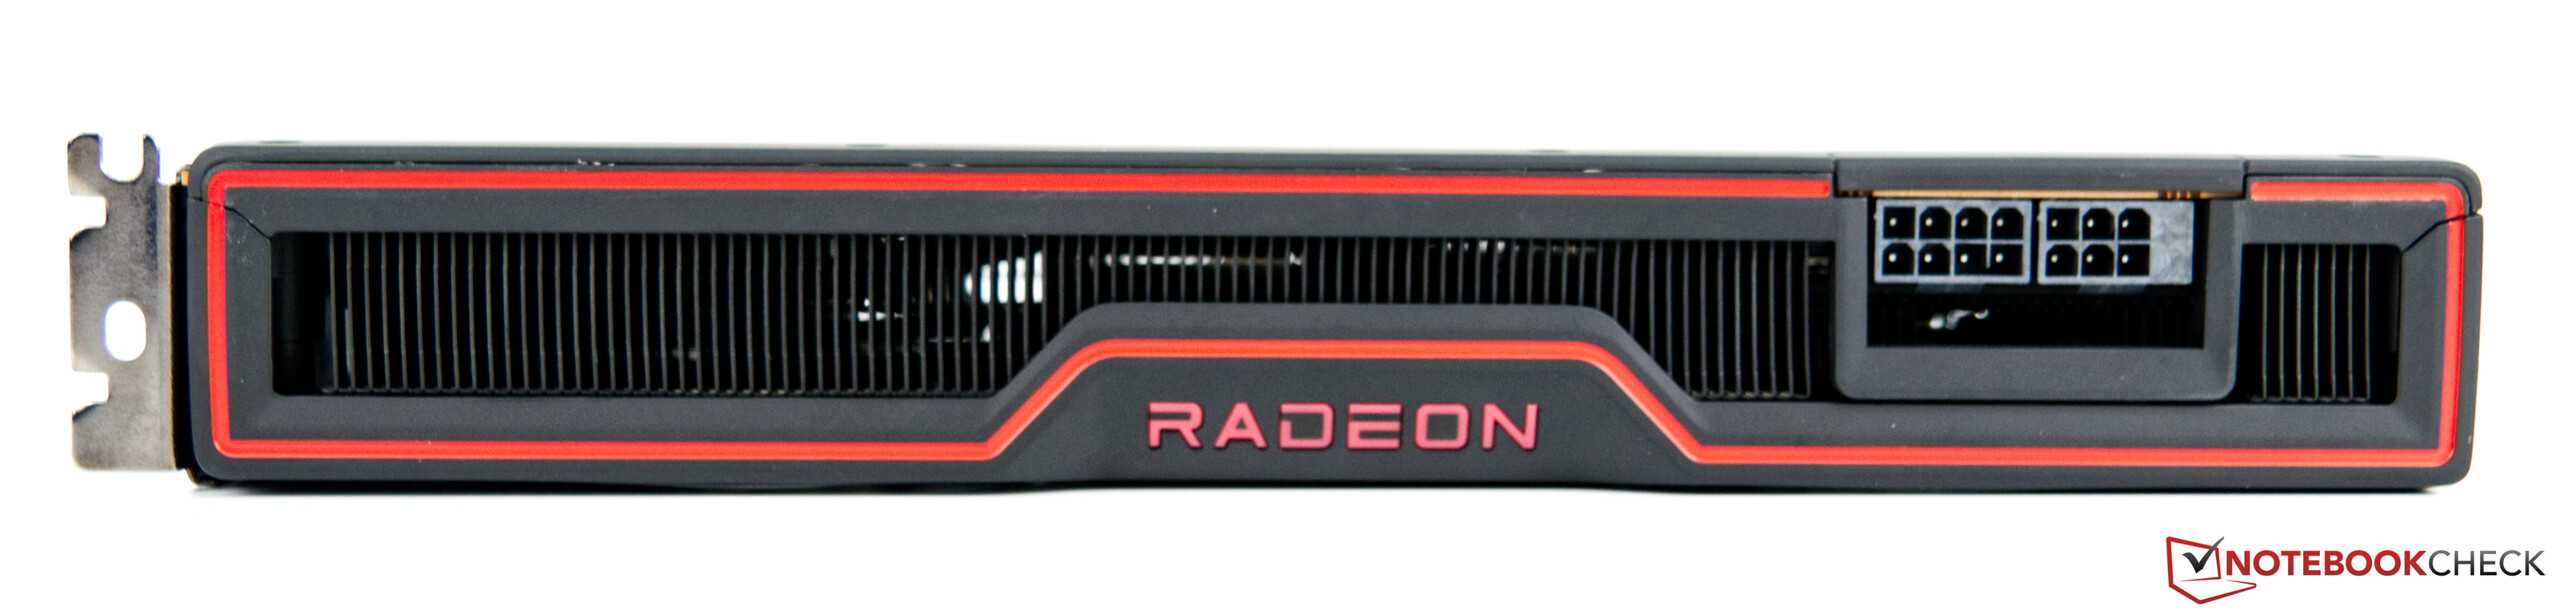
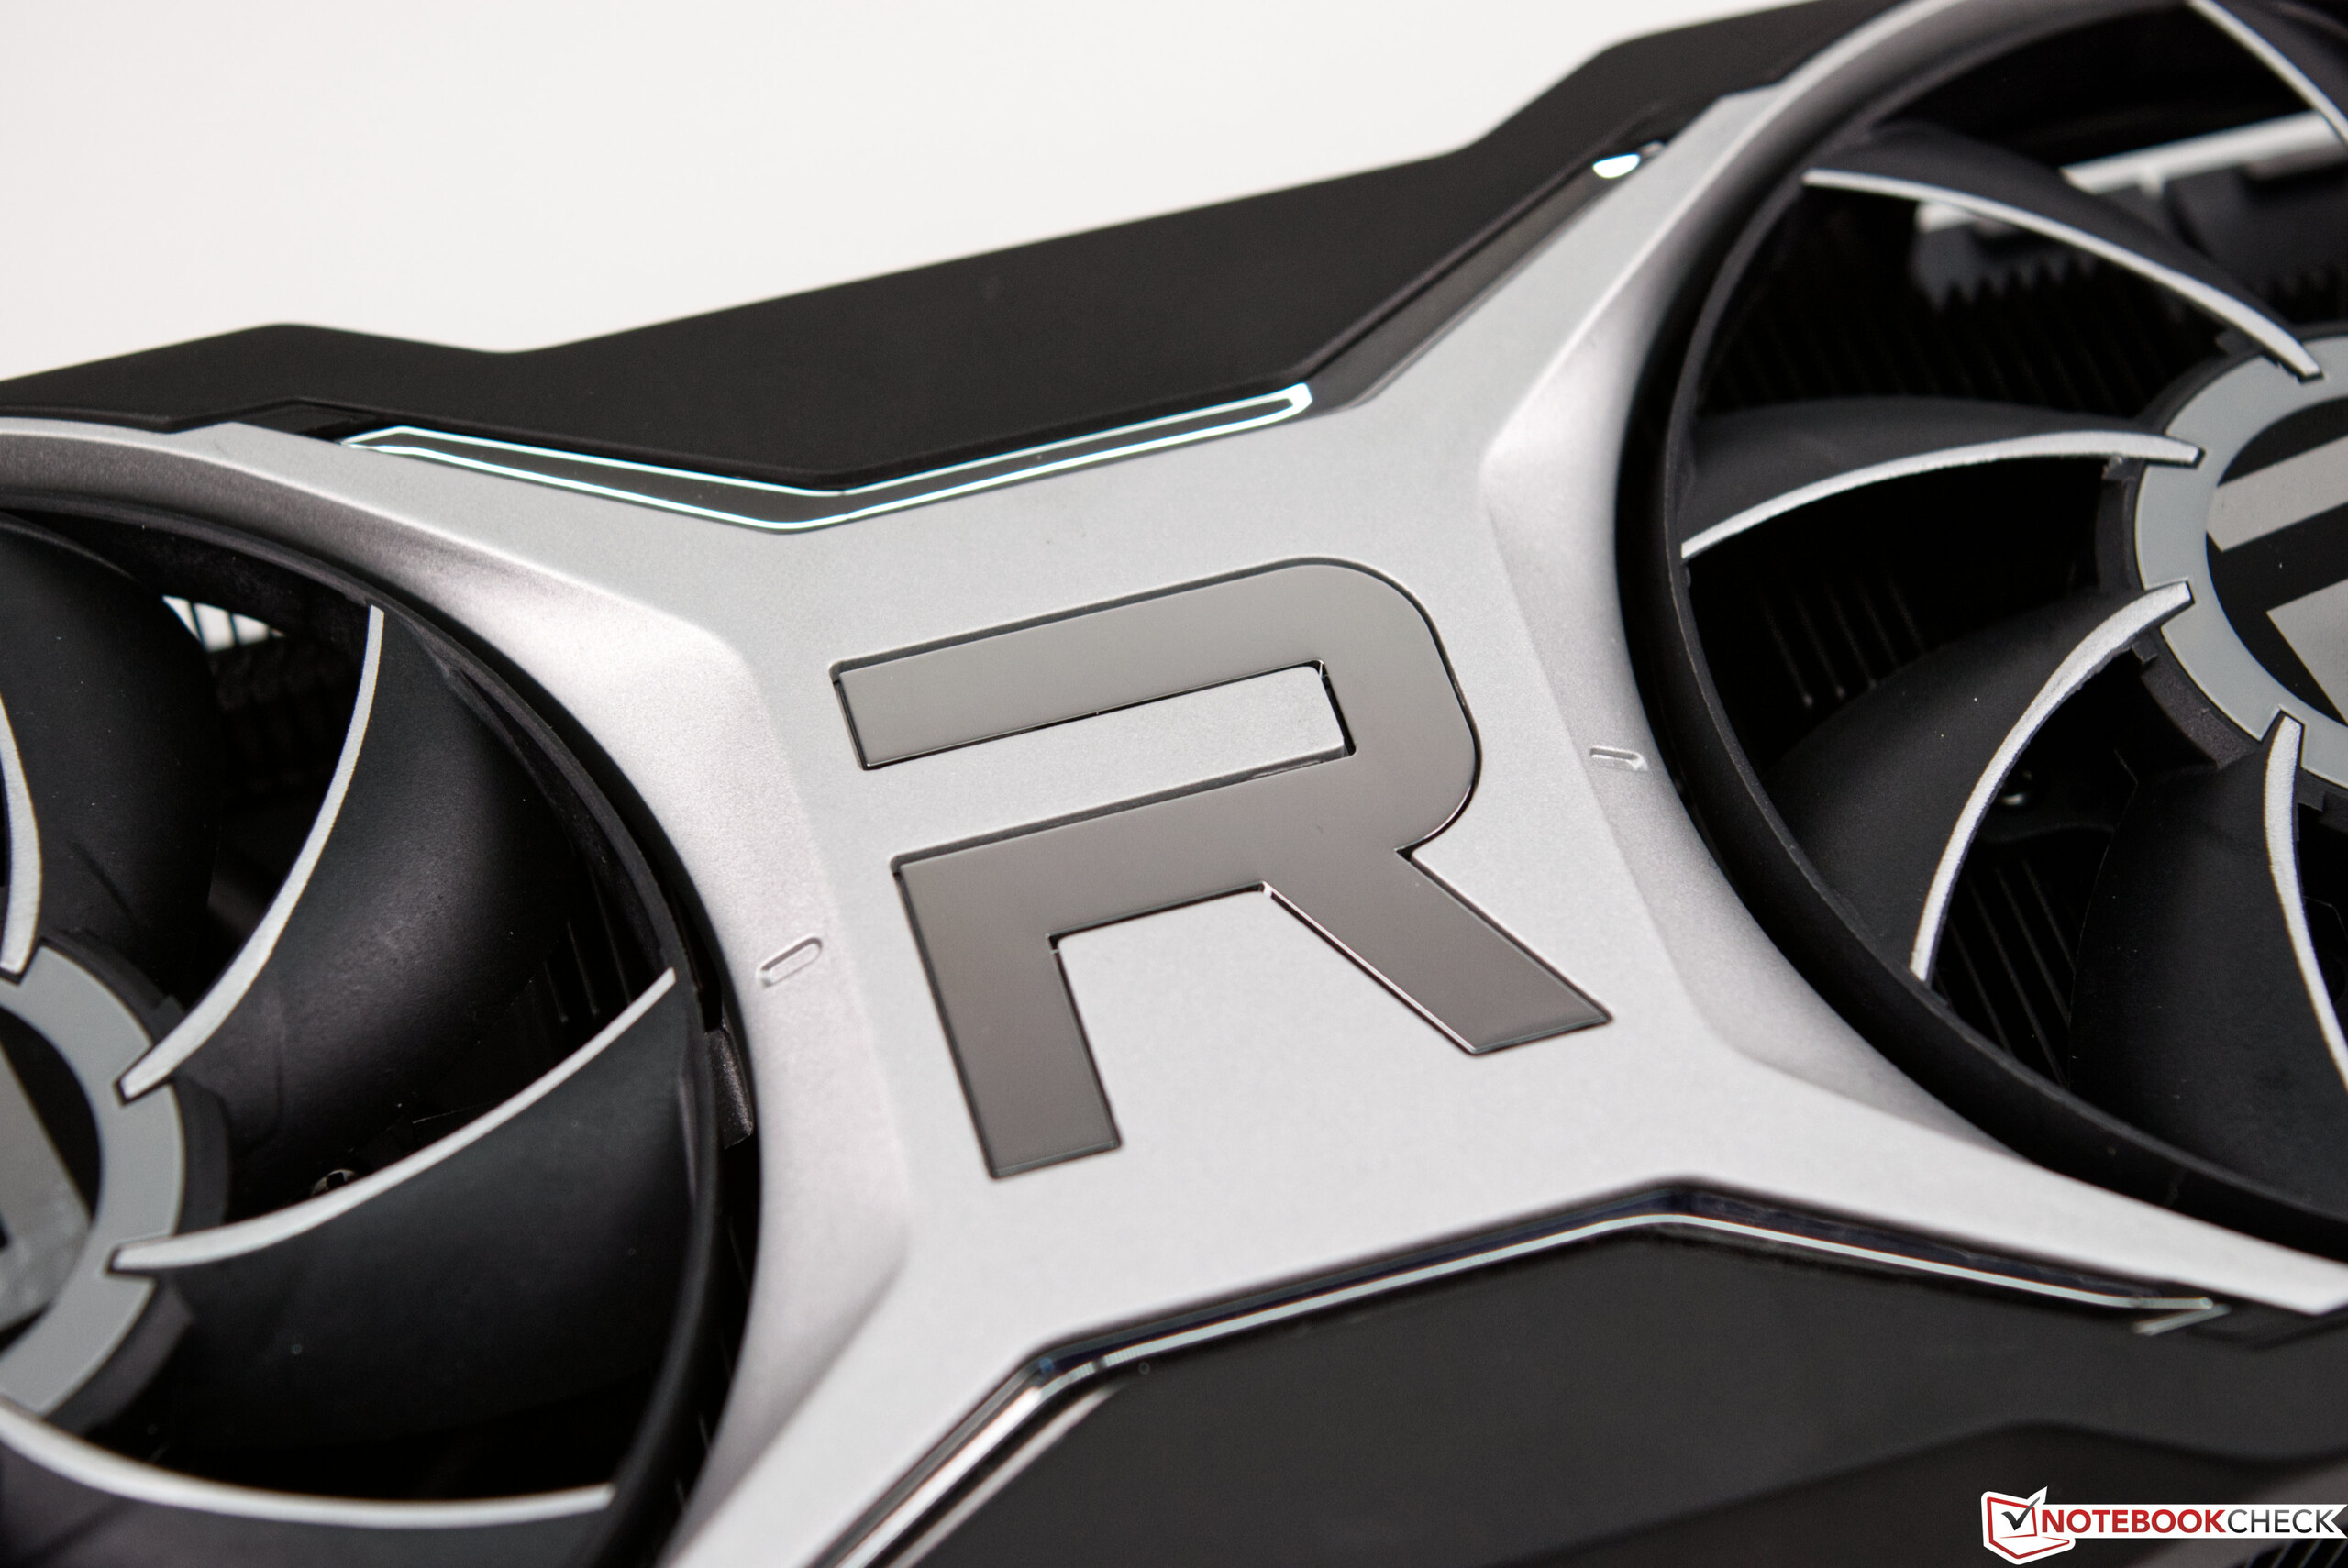
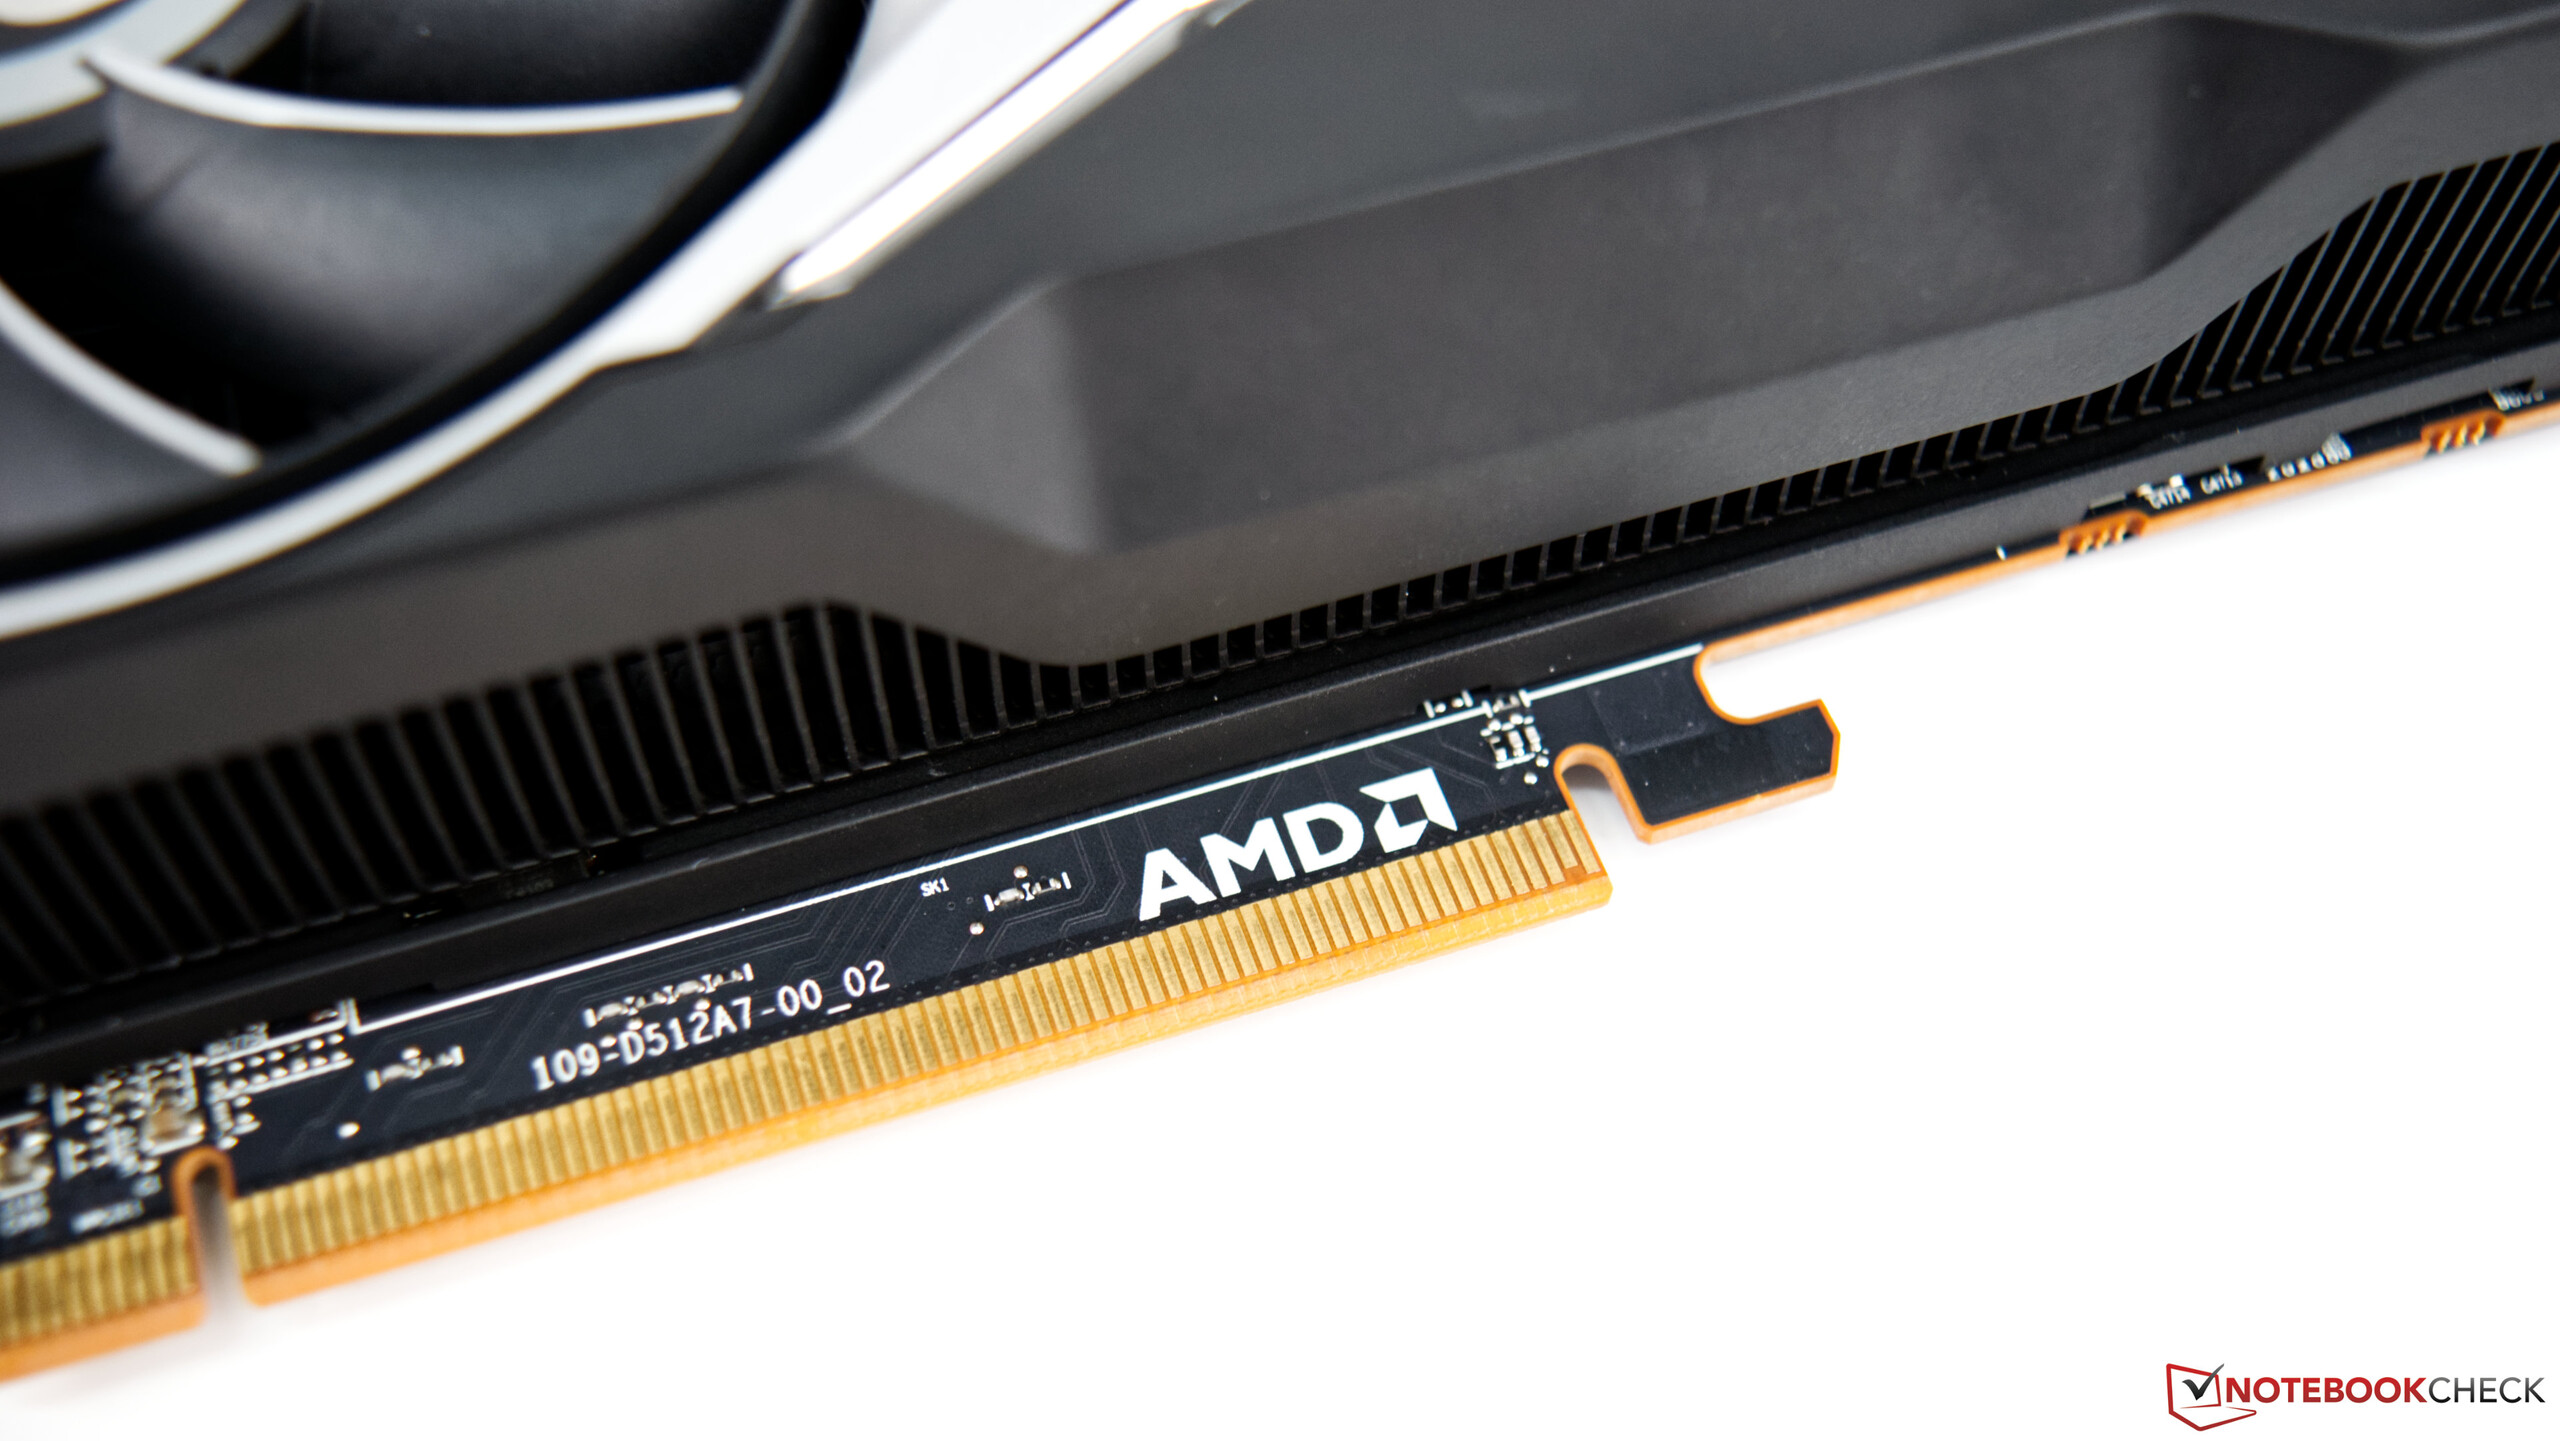
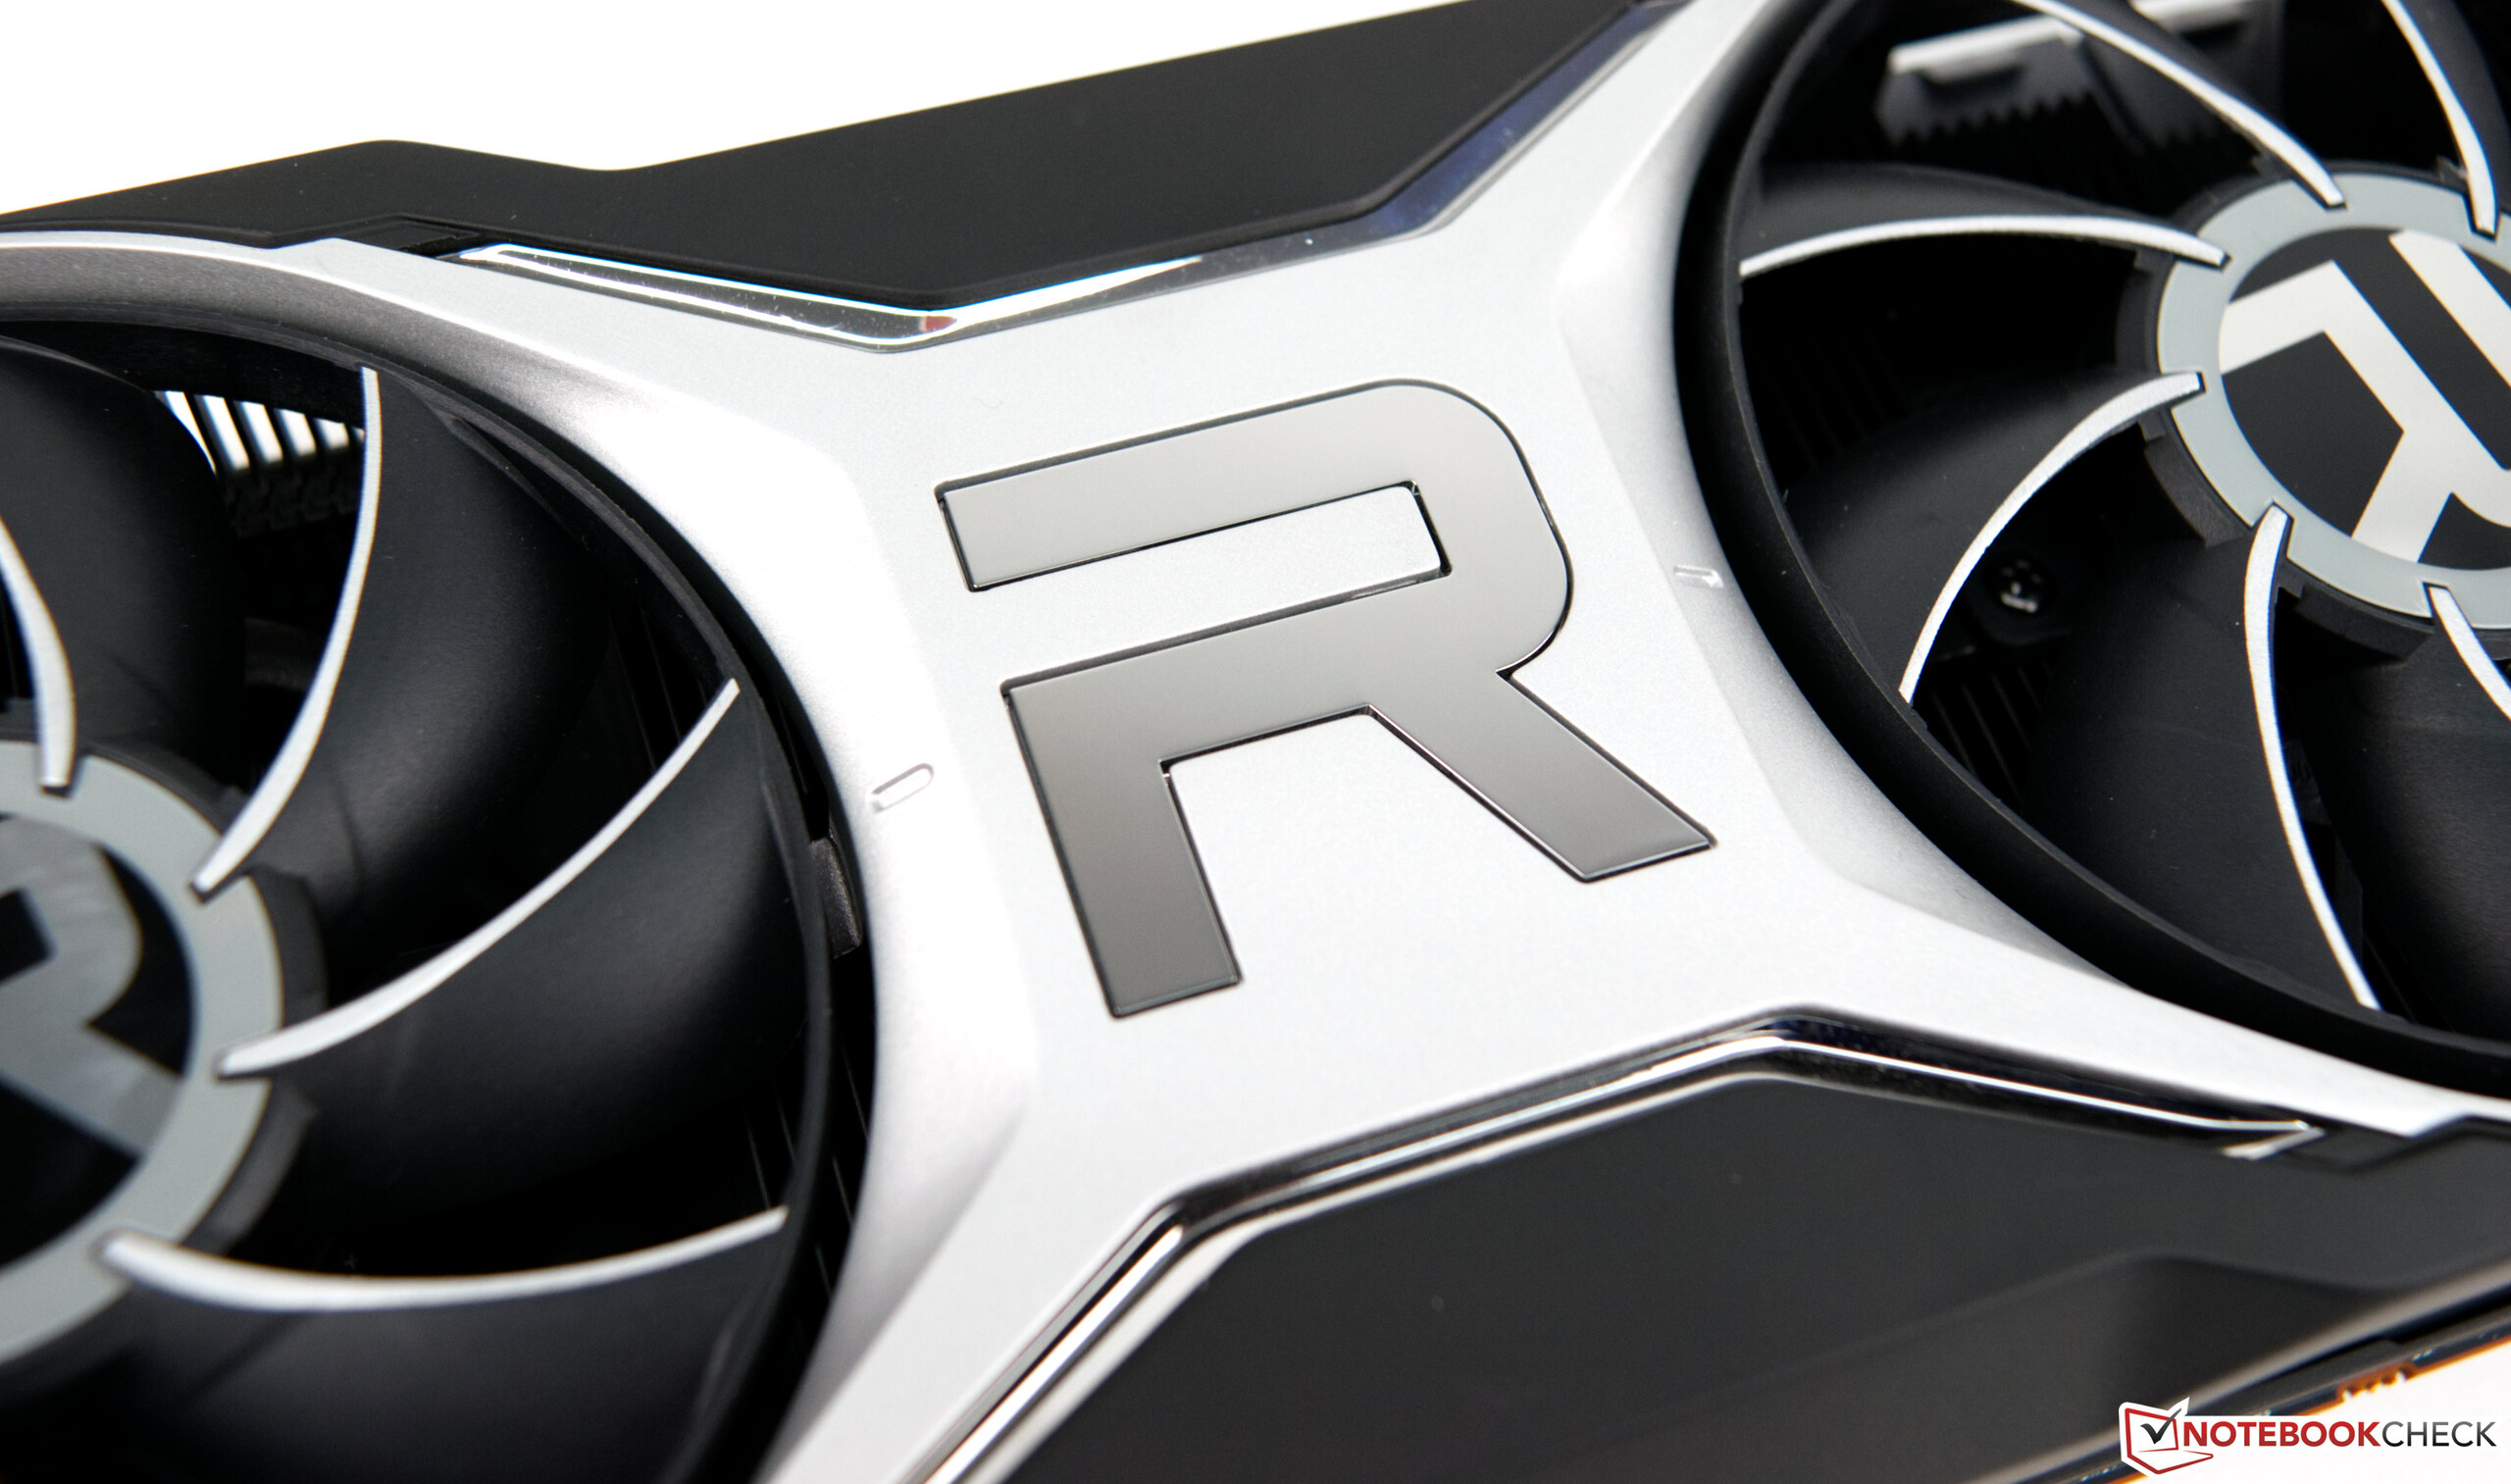
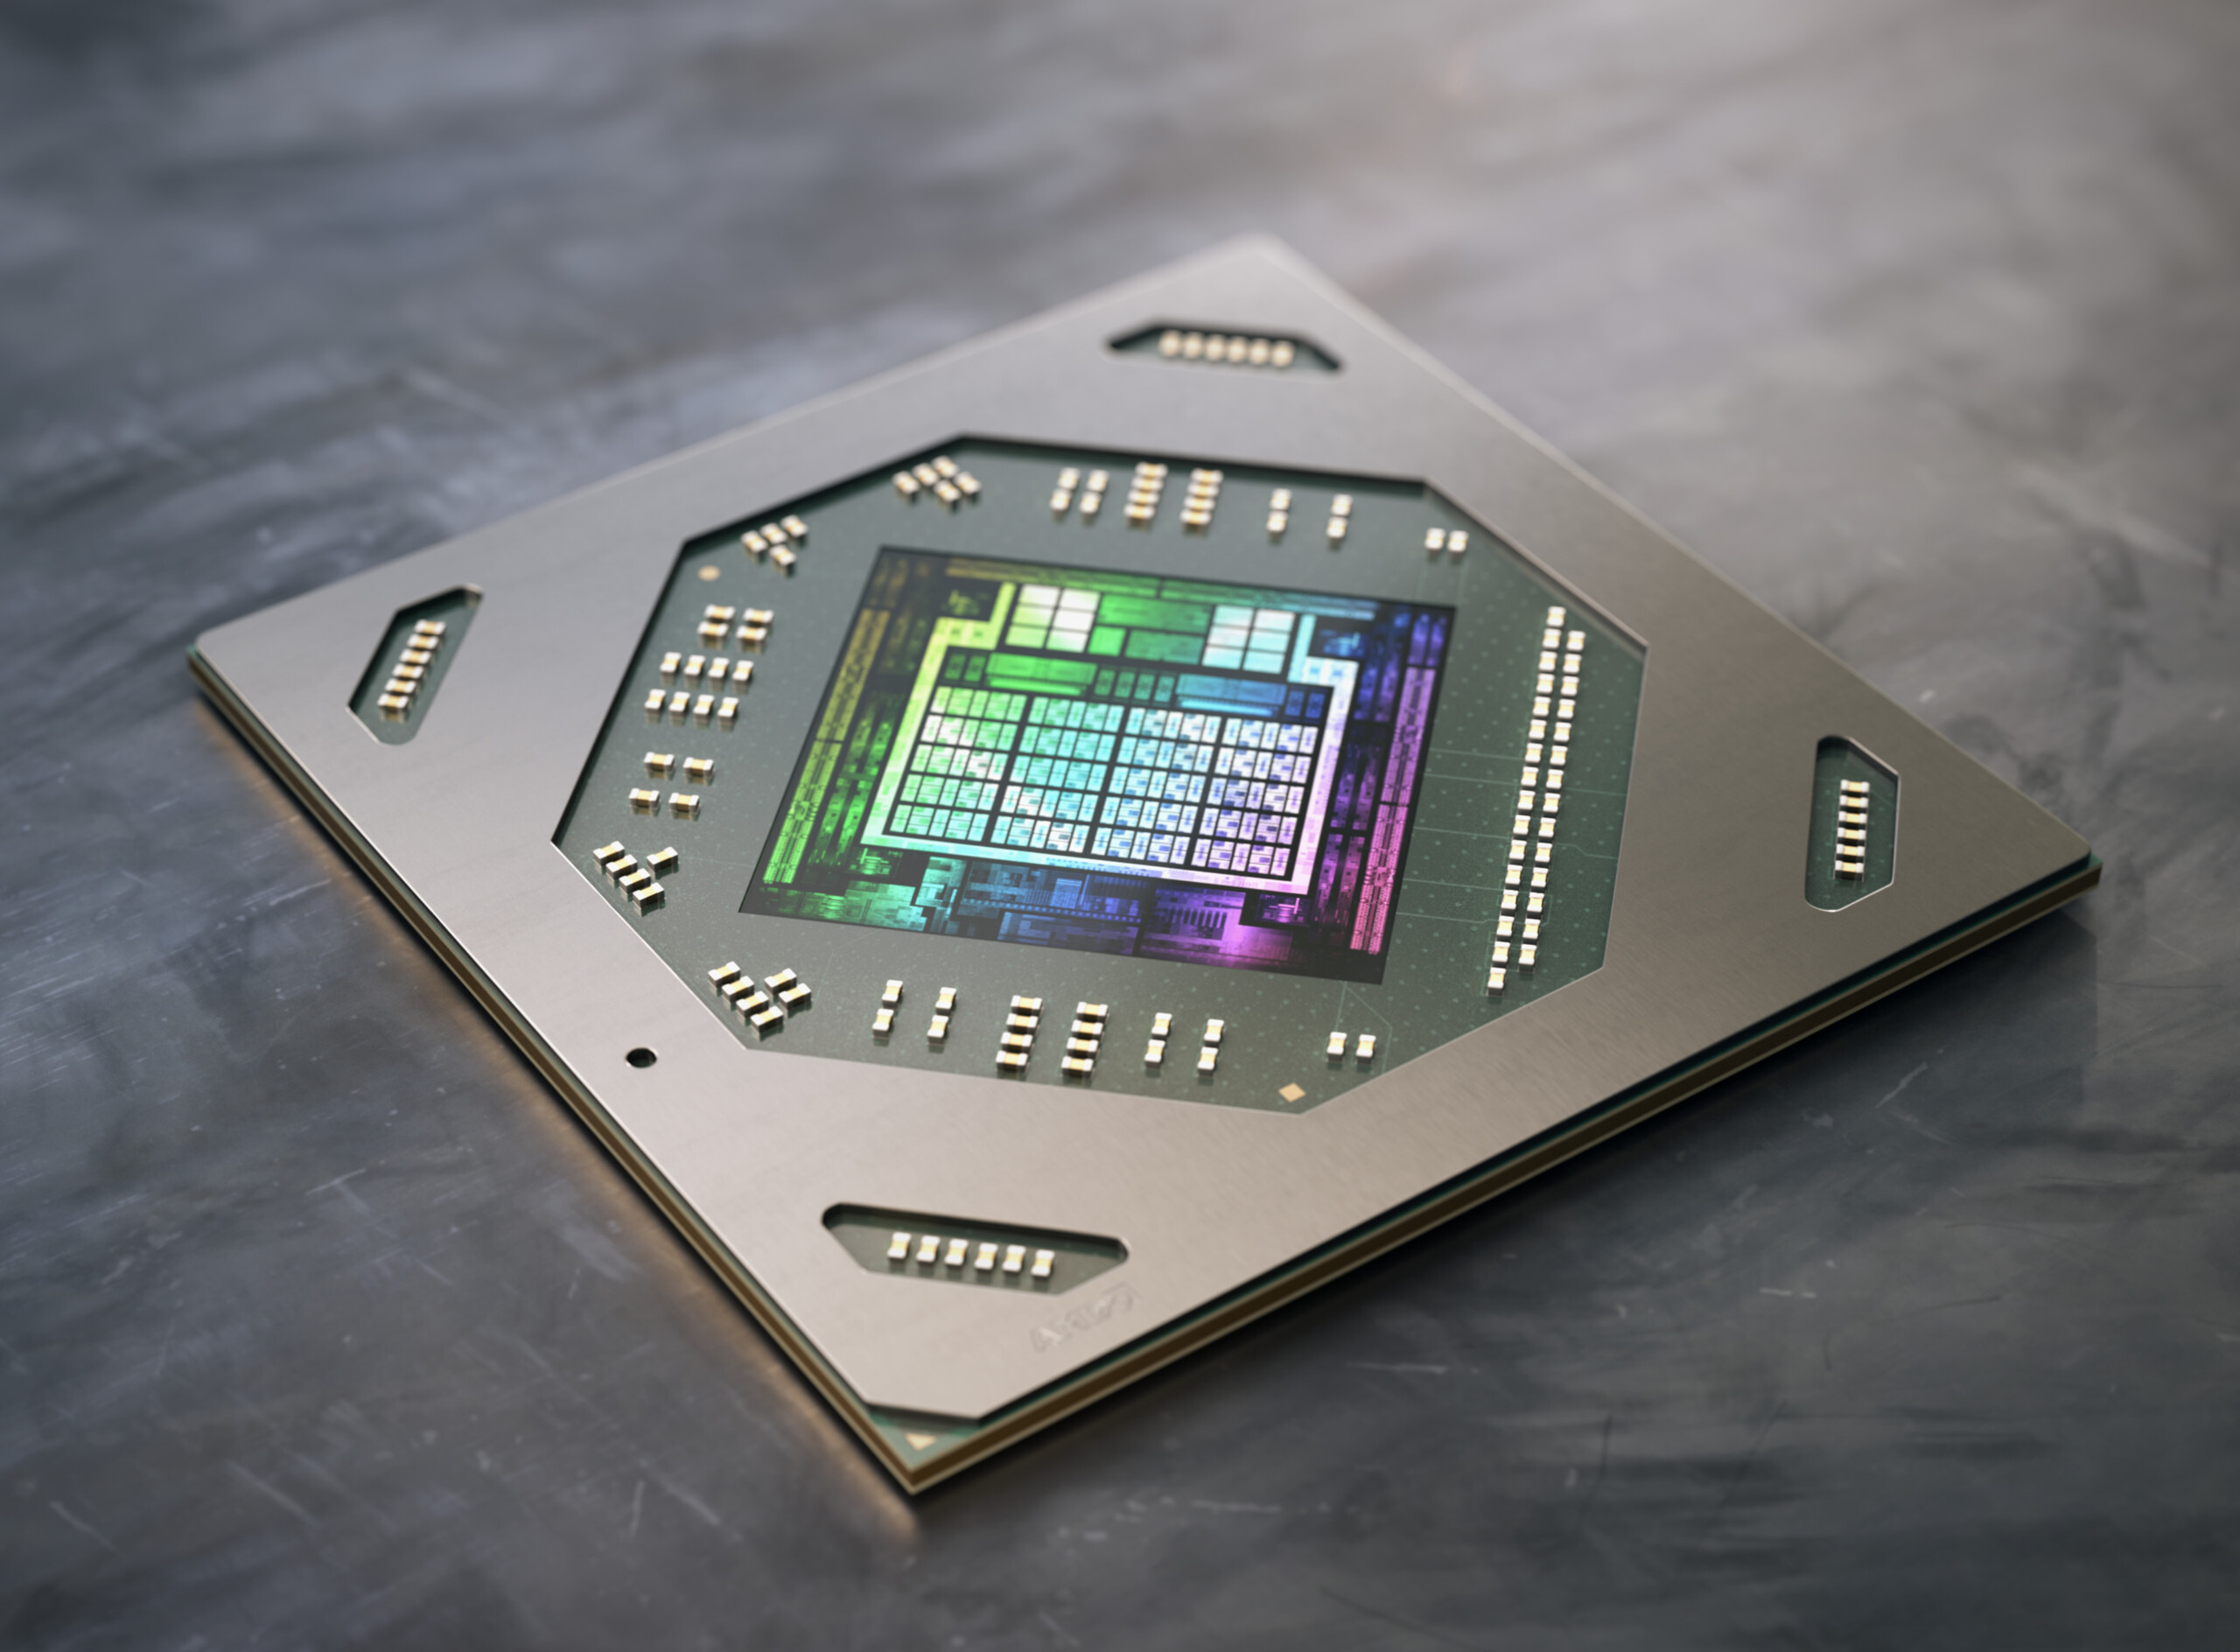
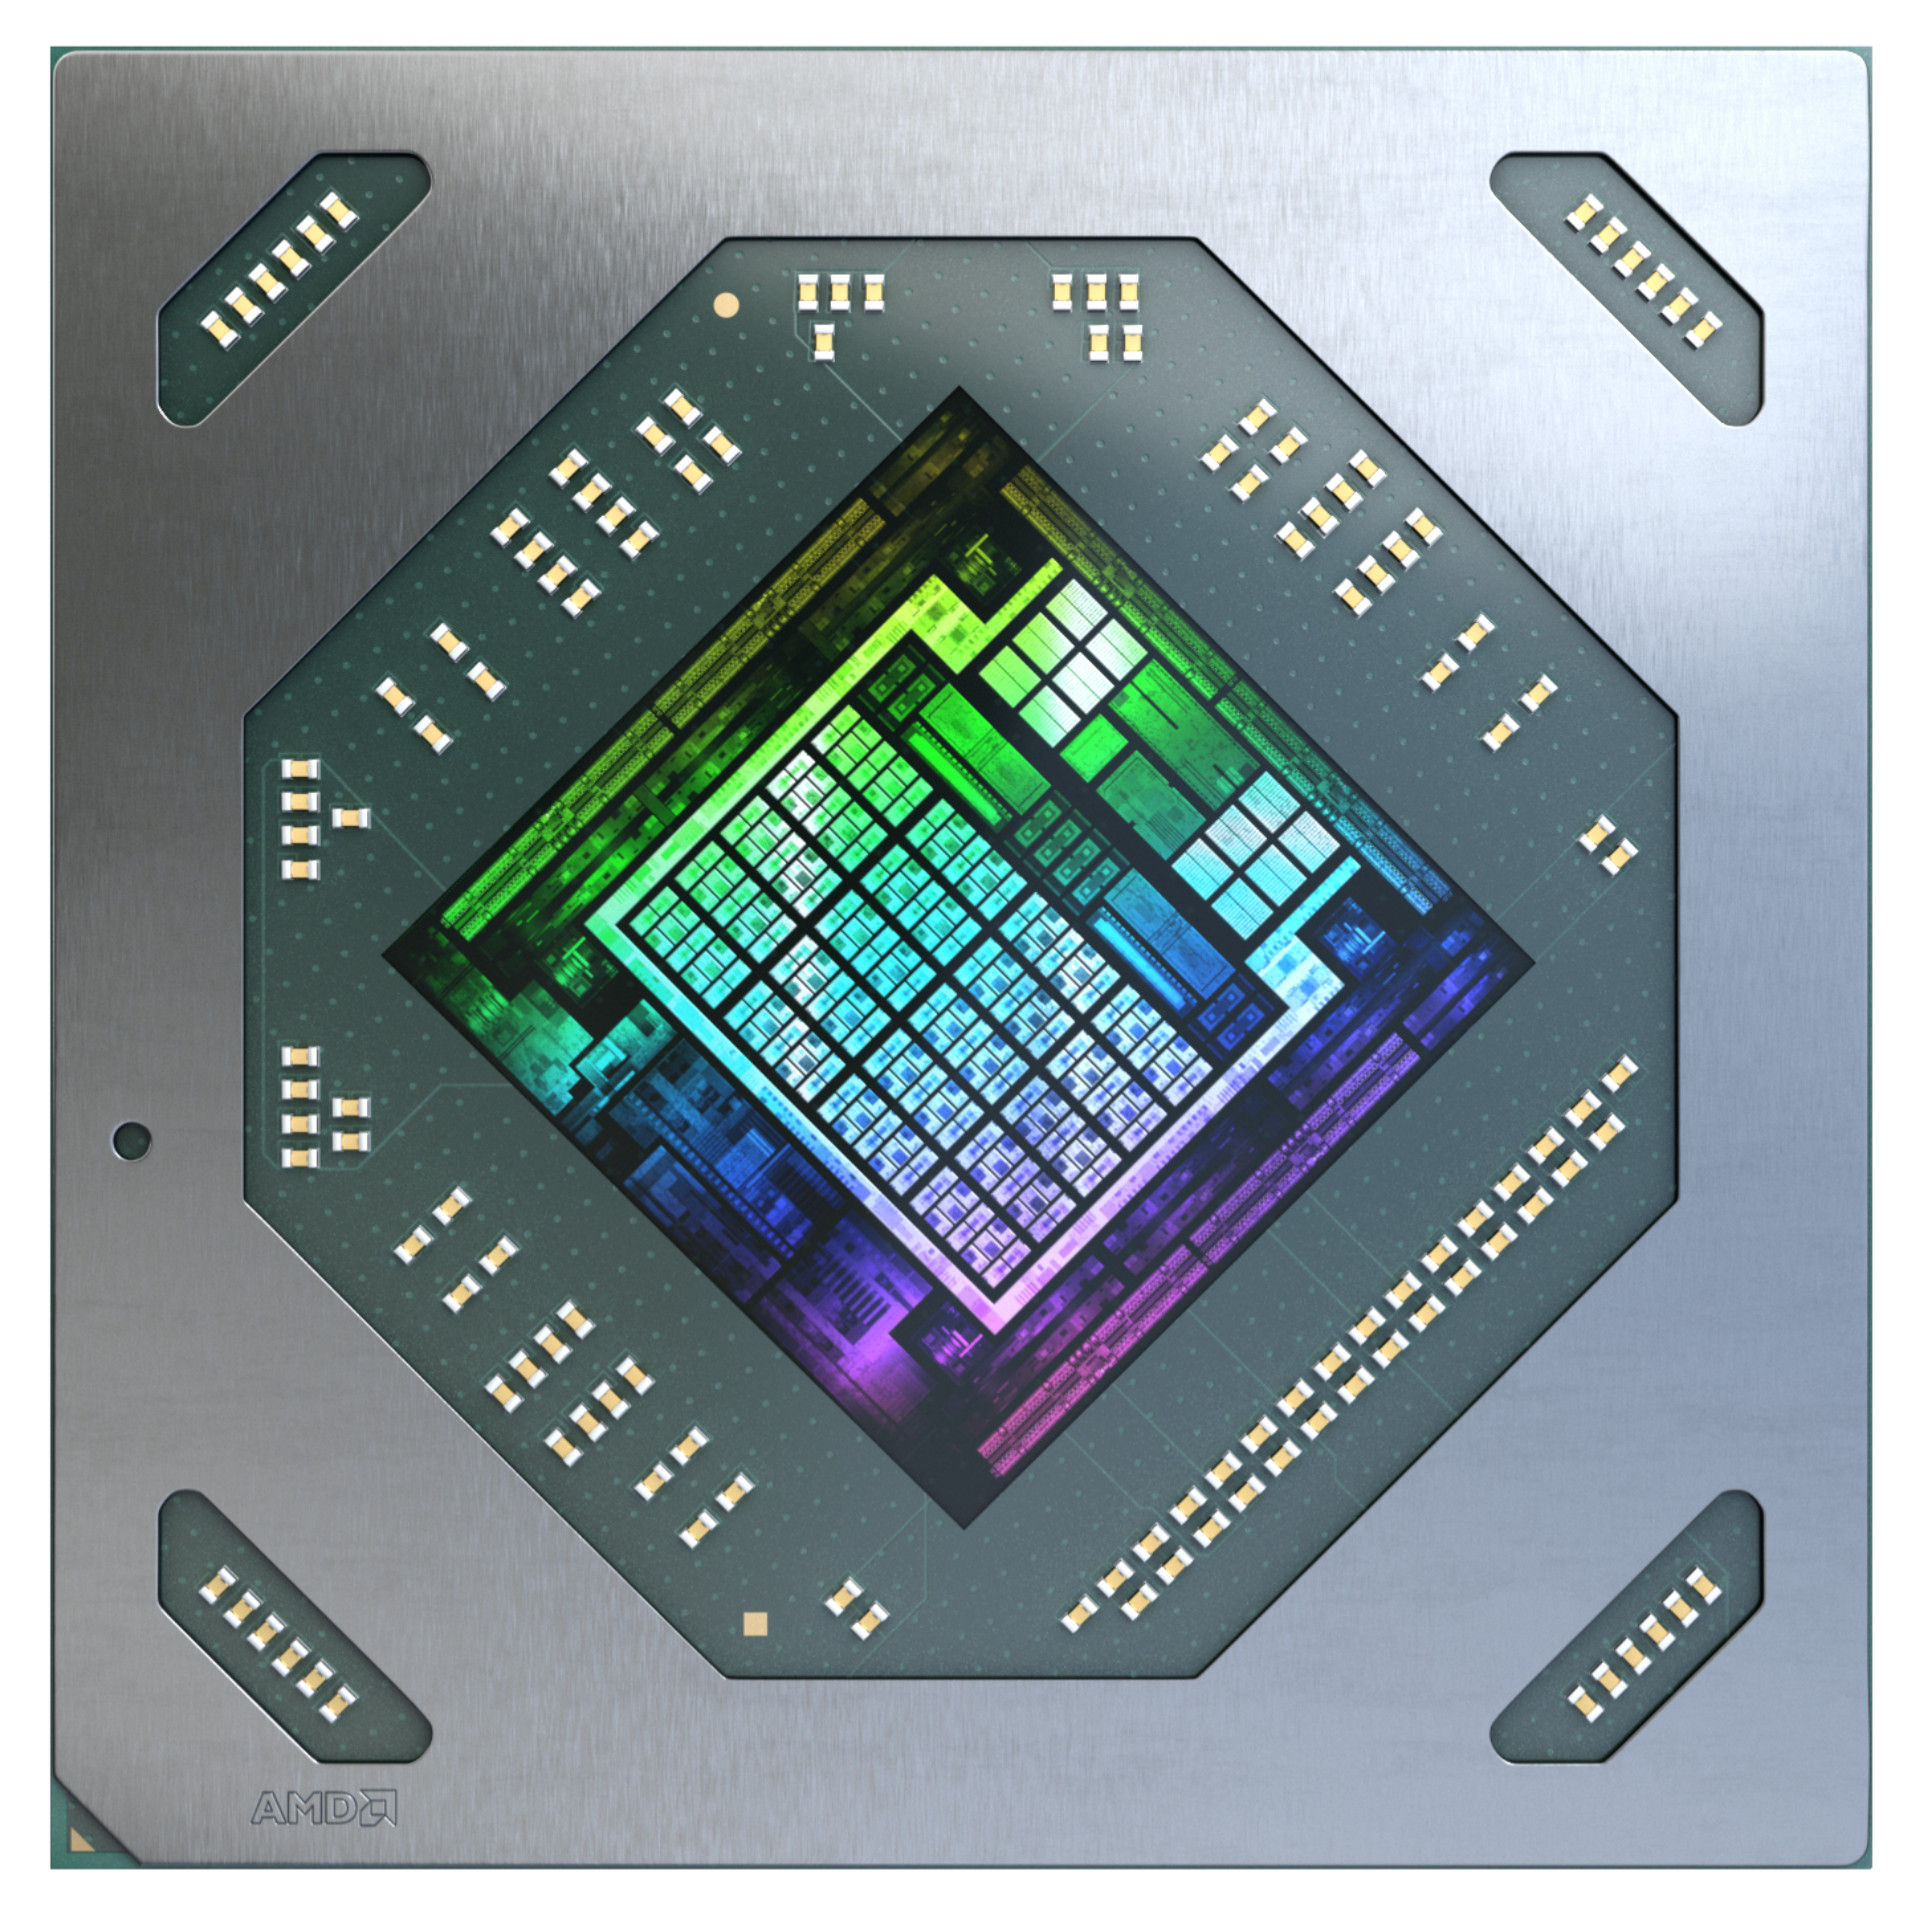
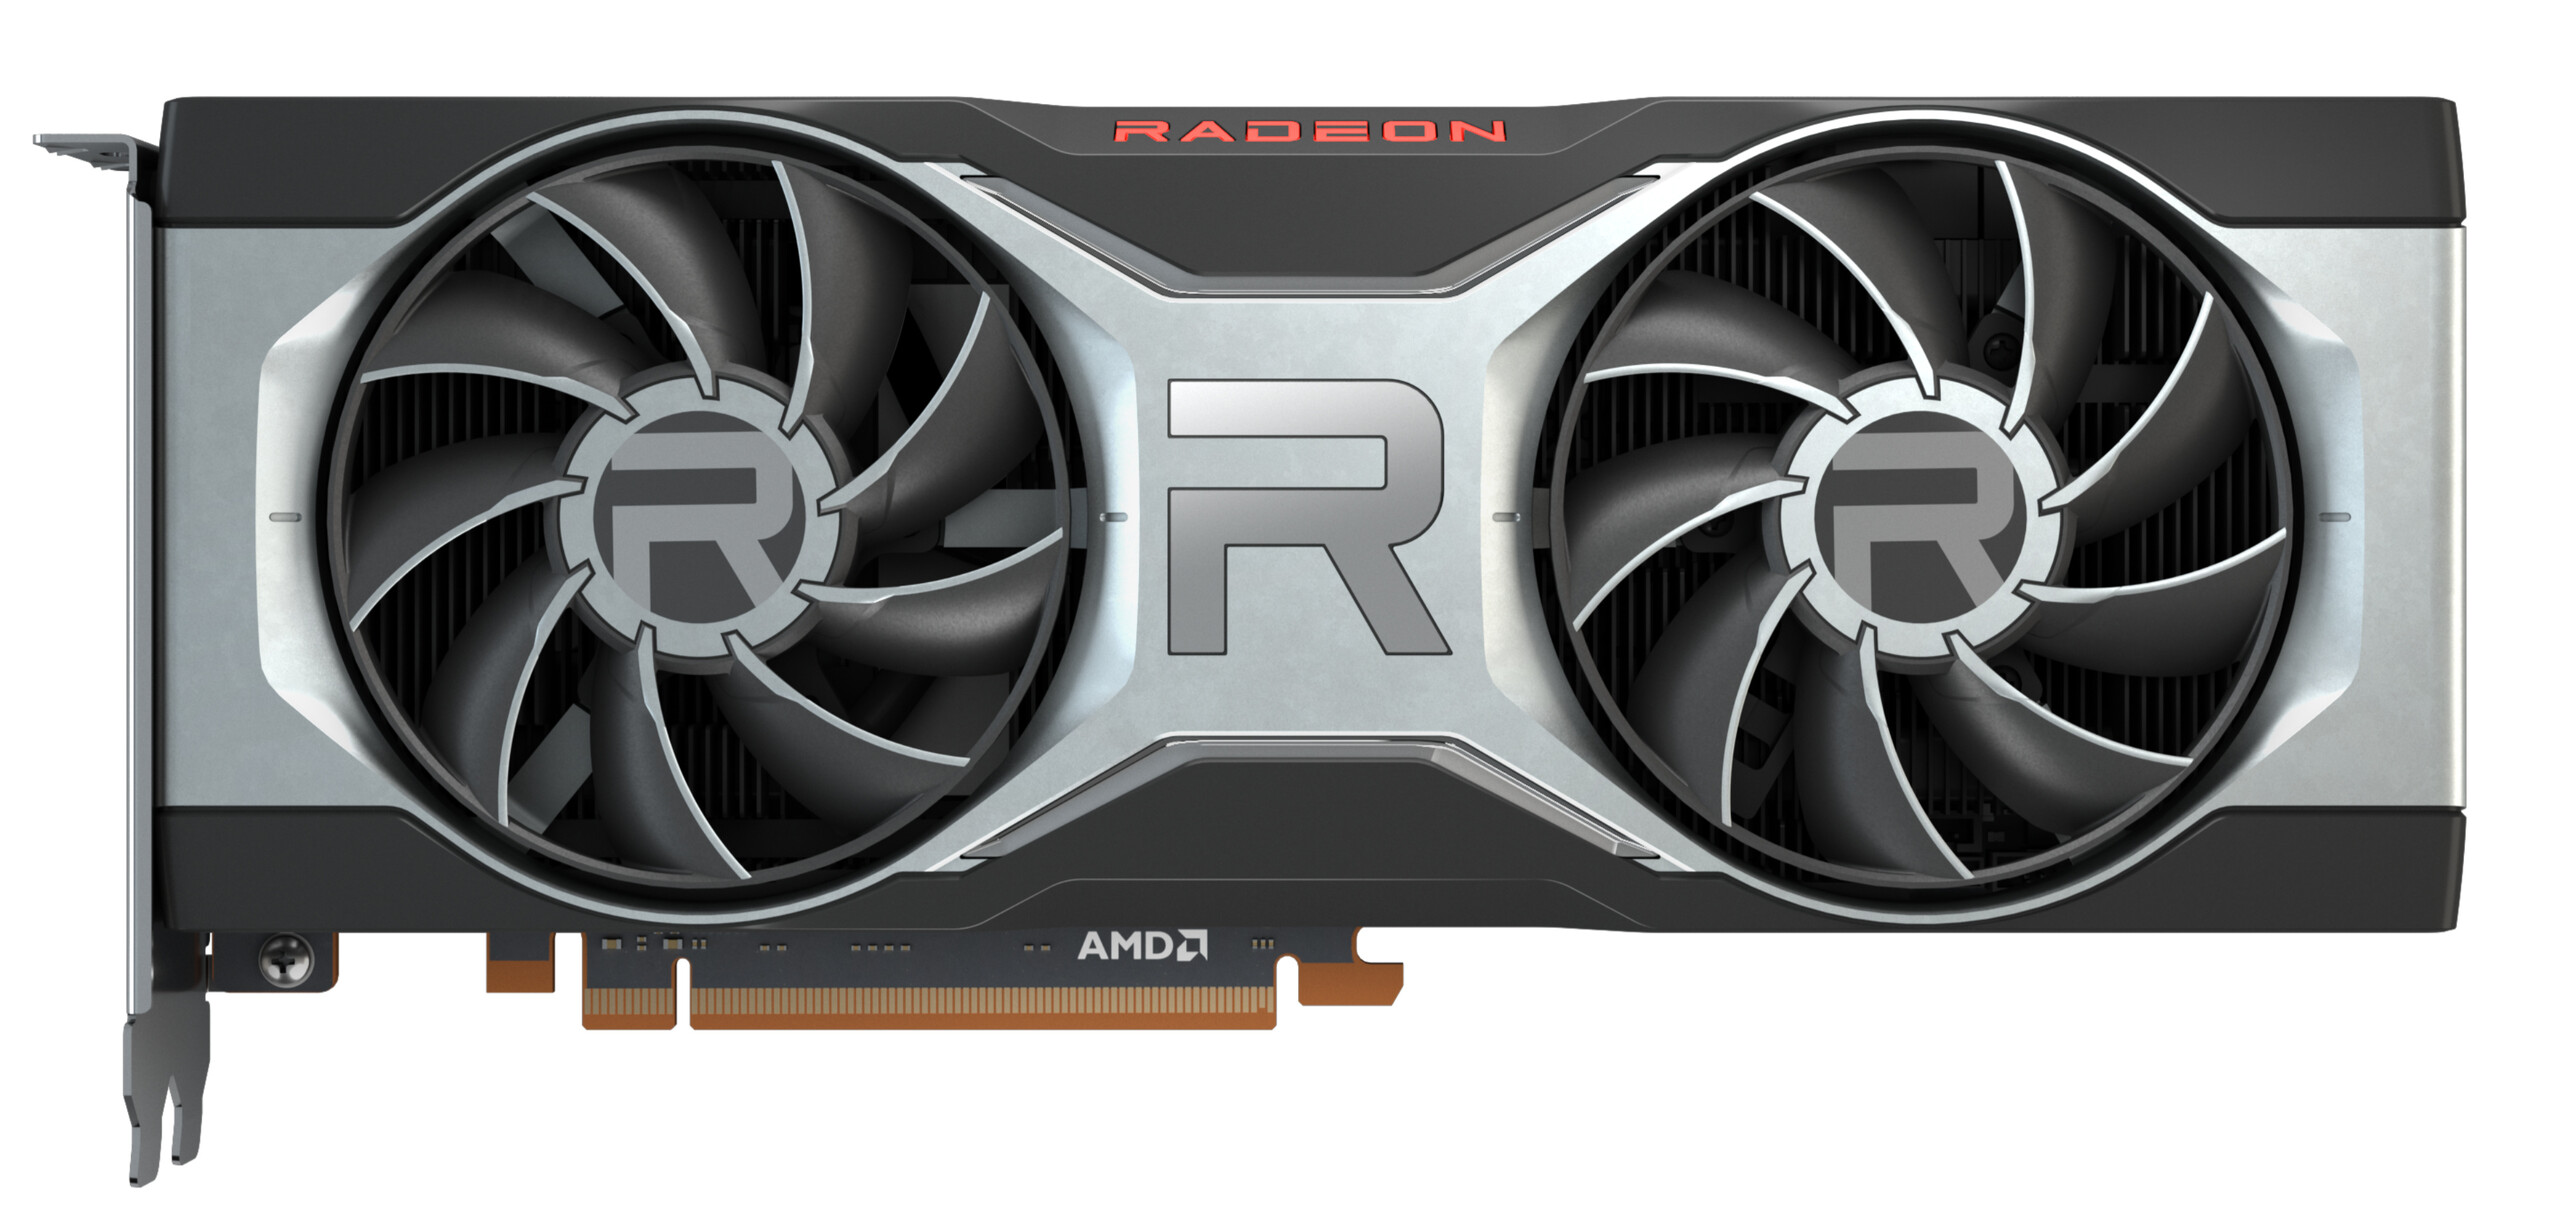
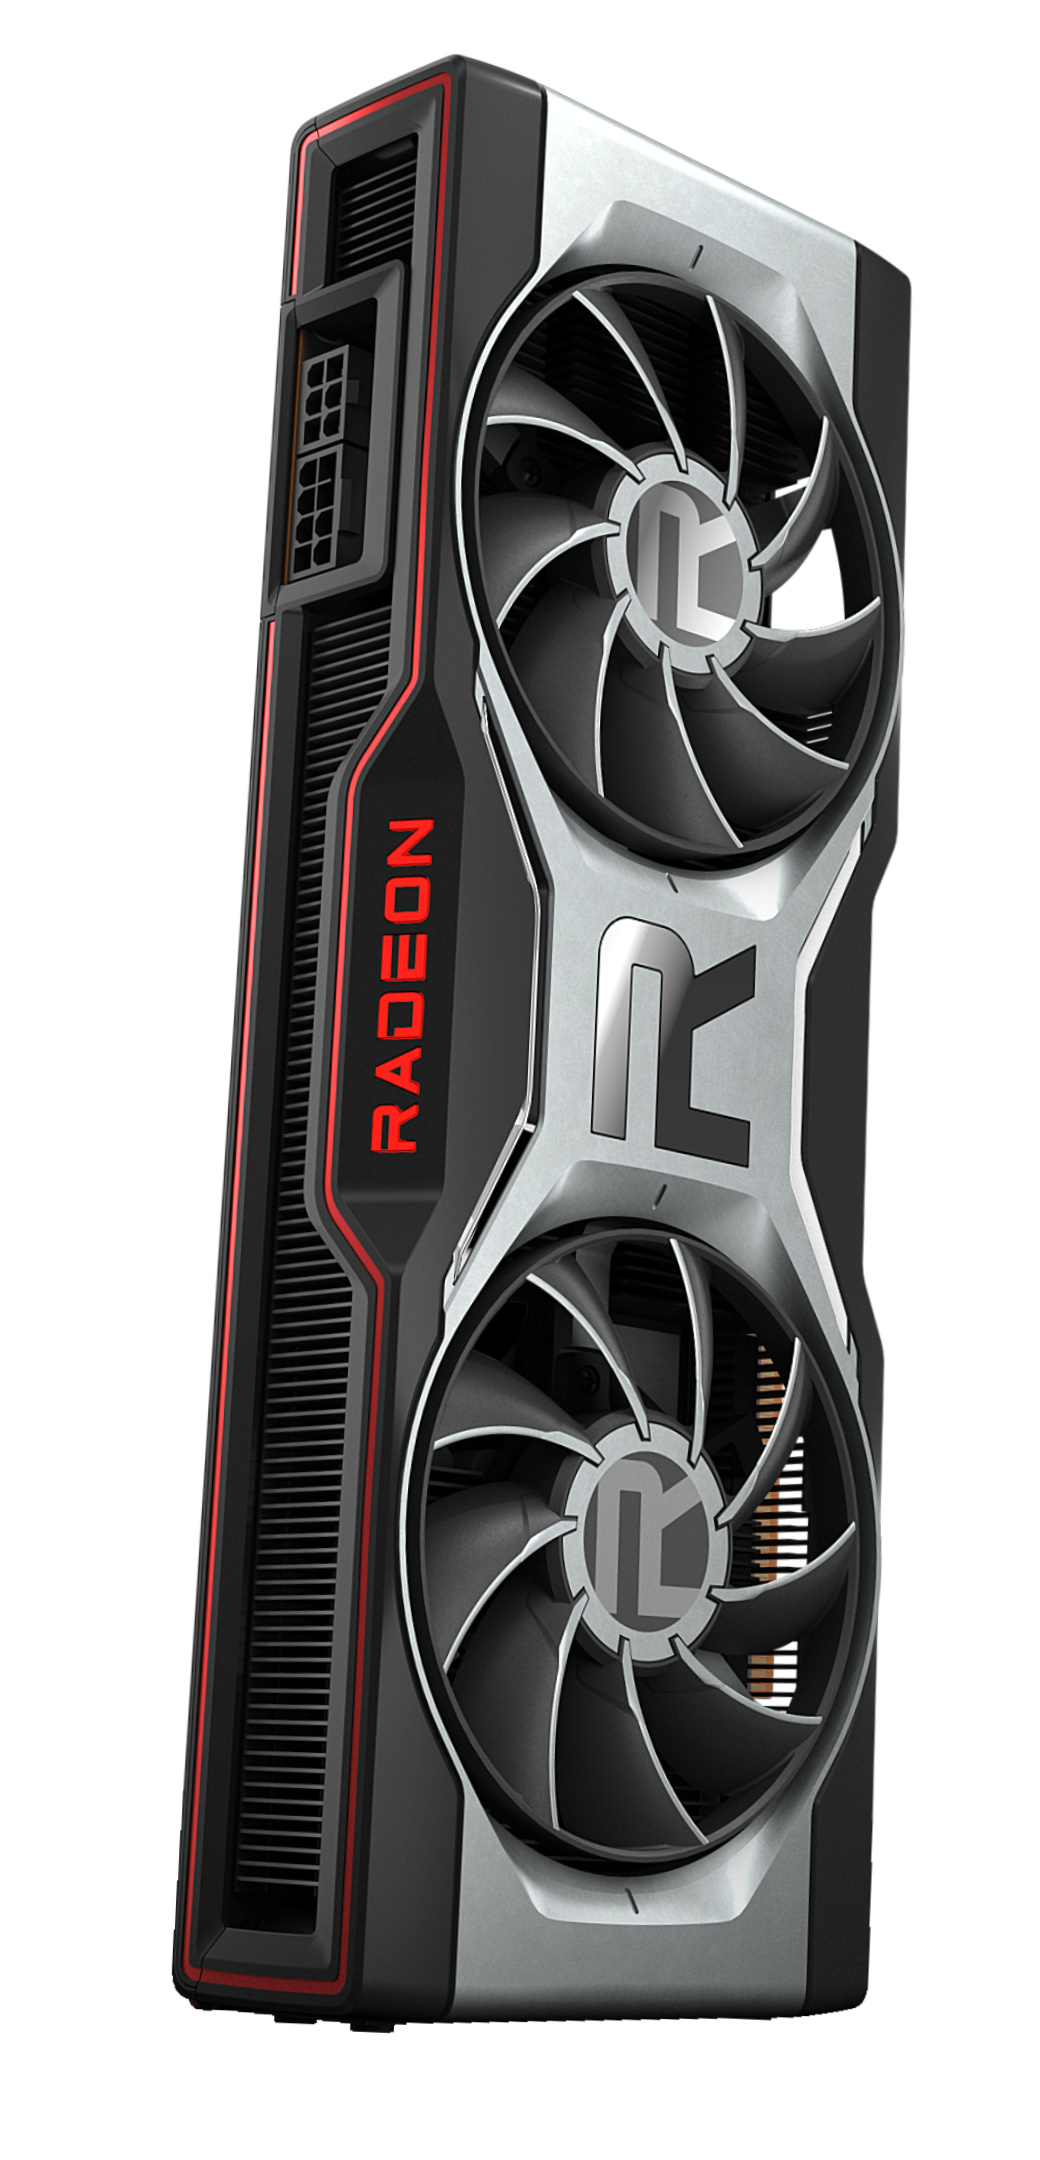
With the AMD Radeon RX 6700 XT, there's now an additional graphics card based on the new RDNA architecture that made its debut late last year. All the new features are included in the new mid-range model. For instance, there's support for both SAM (Smart Access Memory) and ray tracing. We received the reference model directly from AMD, and it appears to be quite compact compared to current graphics cards. Therefore, you don't have to pay much attention to case compatibility here. However, things can look different for custom designs, which are usually also equipped with a higher power target and, accordingly, a larger cooling system.
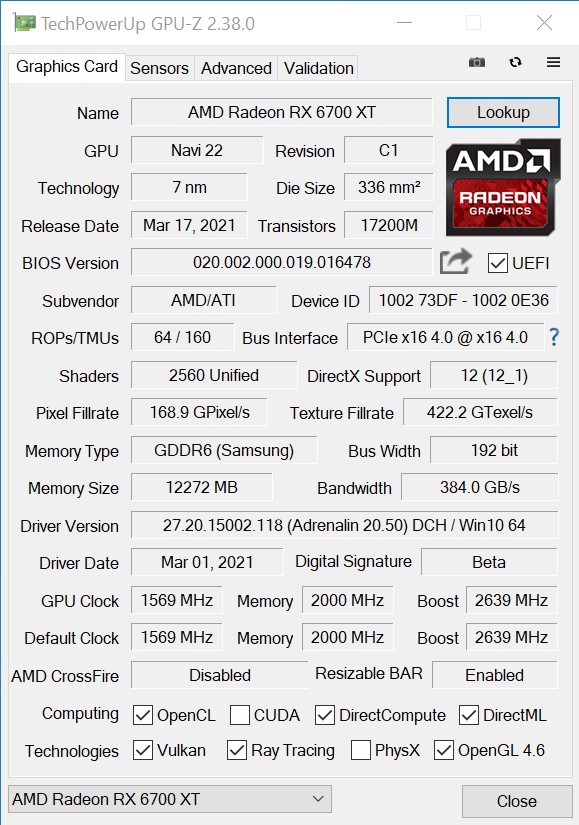
We find the trend of installing more VRAM to be positive. Due to the 192-bit memory interface, 6 or 12 GB is possible. Thankfully, AMD opted for the 12 GB variant. Nvidia also took the same step with the GeForce RTX 3060. This takes the wind out of critics' sails right away, since we're not dealing with a memory cripple with only 6 GB of VRAM here. The Navi 22 graphics chip reaches surprisingly high clock rates, although the base clock speed is only 1,569 MHz. However, the so-called "game clock" is actually 2,424 MHz, and the maximum boost speed is as high as 2,639 MHz. We were able to confirm all these high clock rates in our review, although the maximum boost speed is only available very briefly. Most of the time, the GPU ran at 2,580 MHz when gaming.
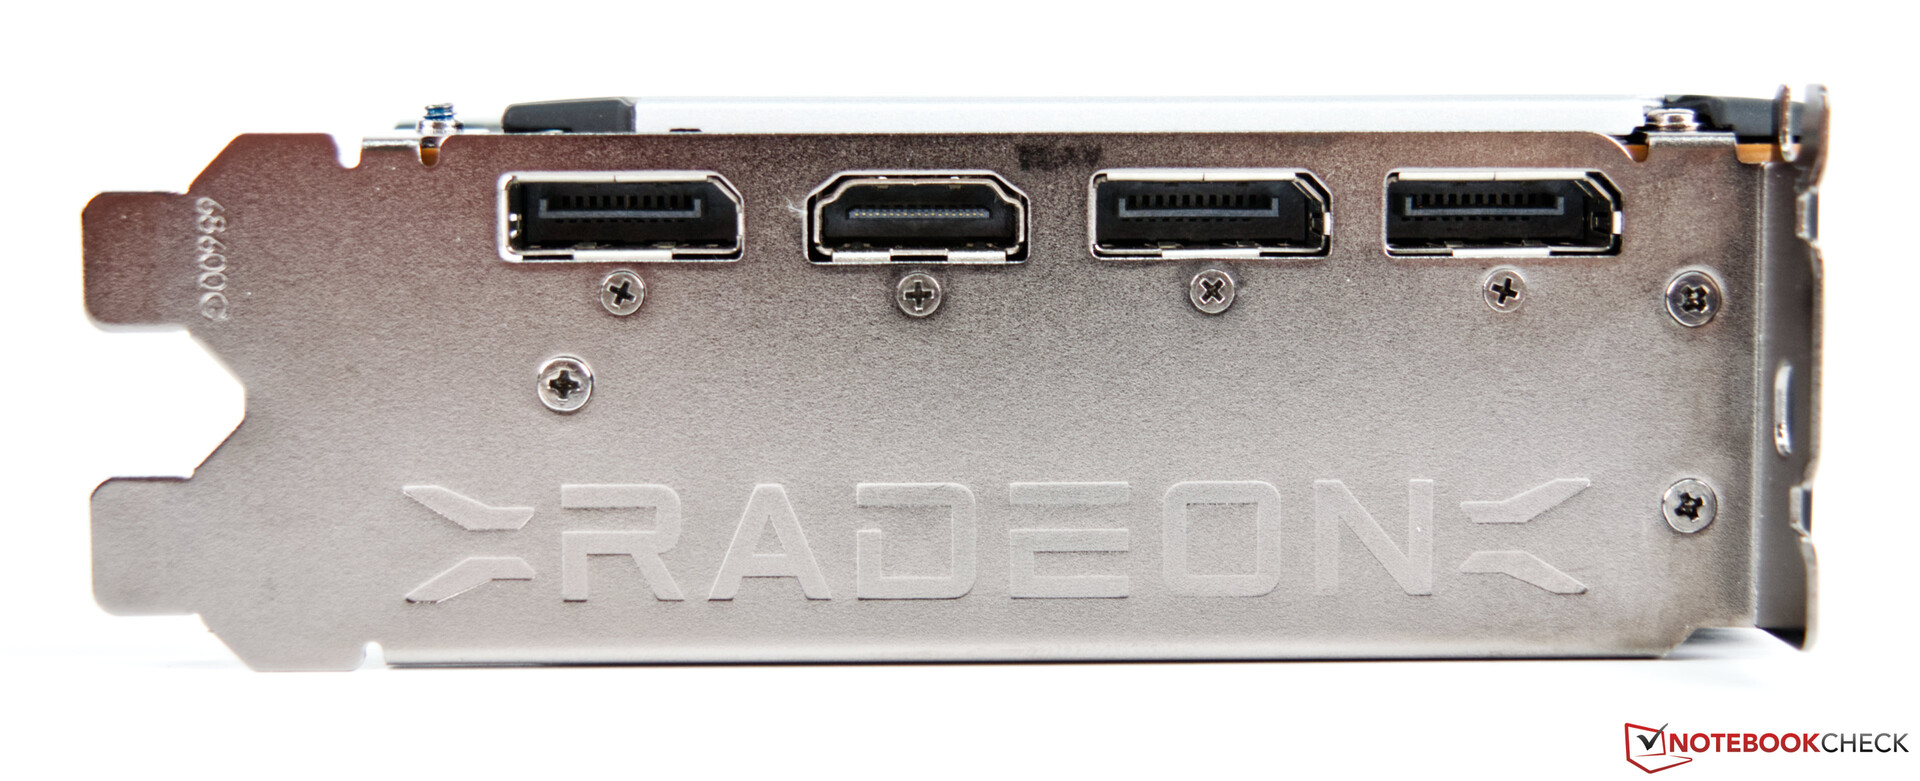
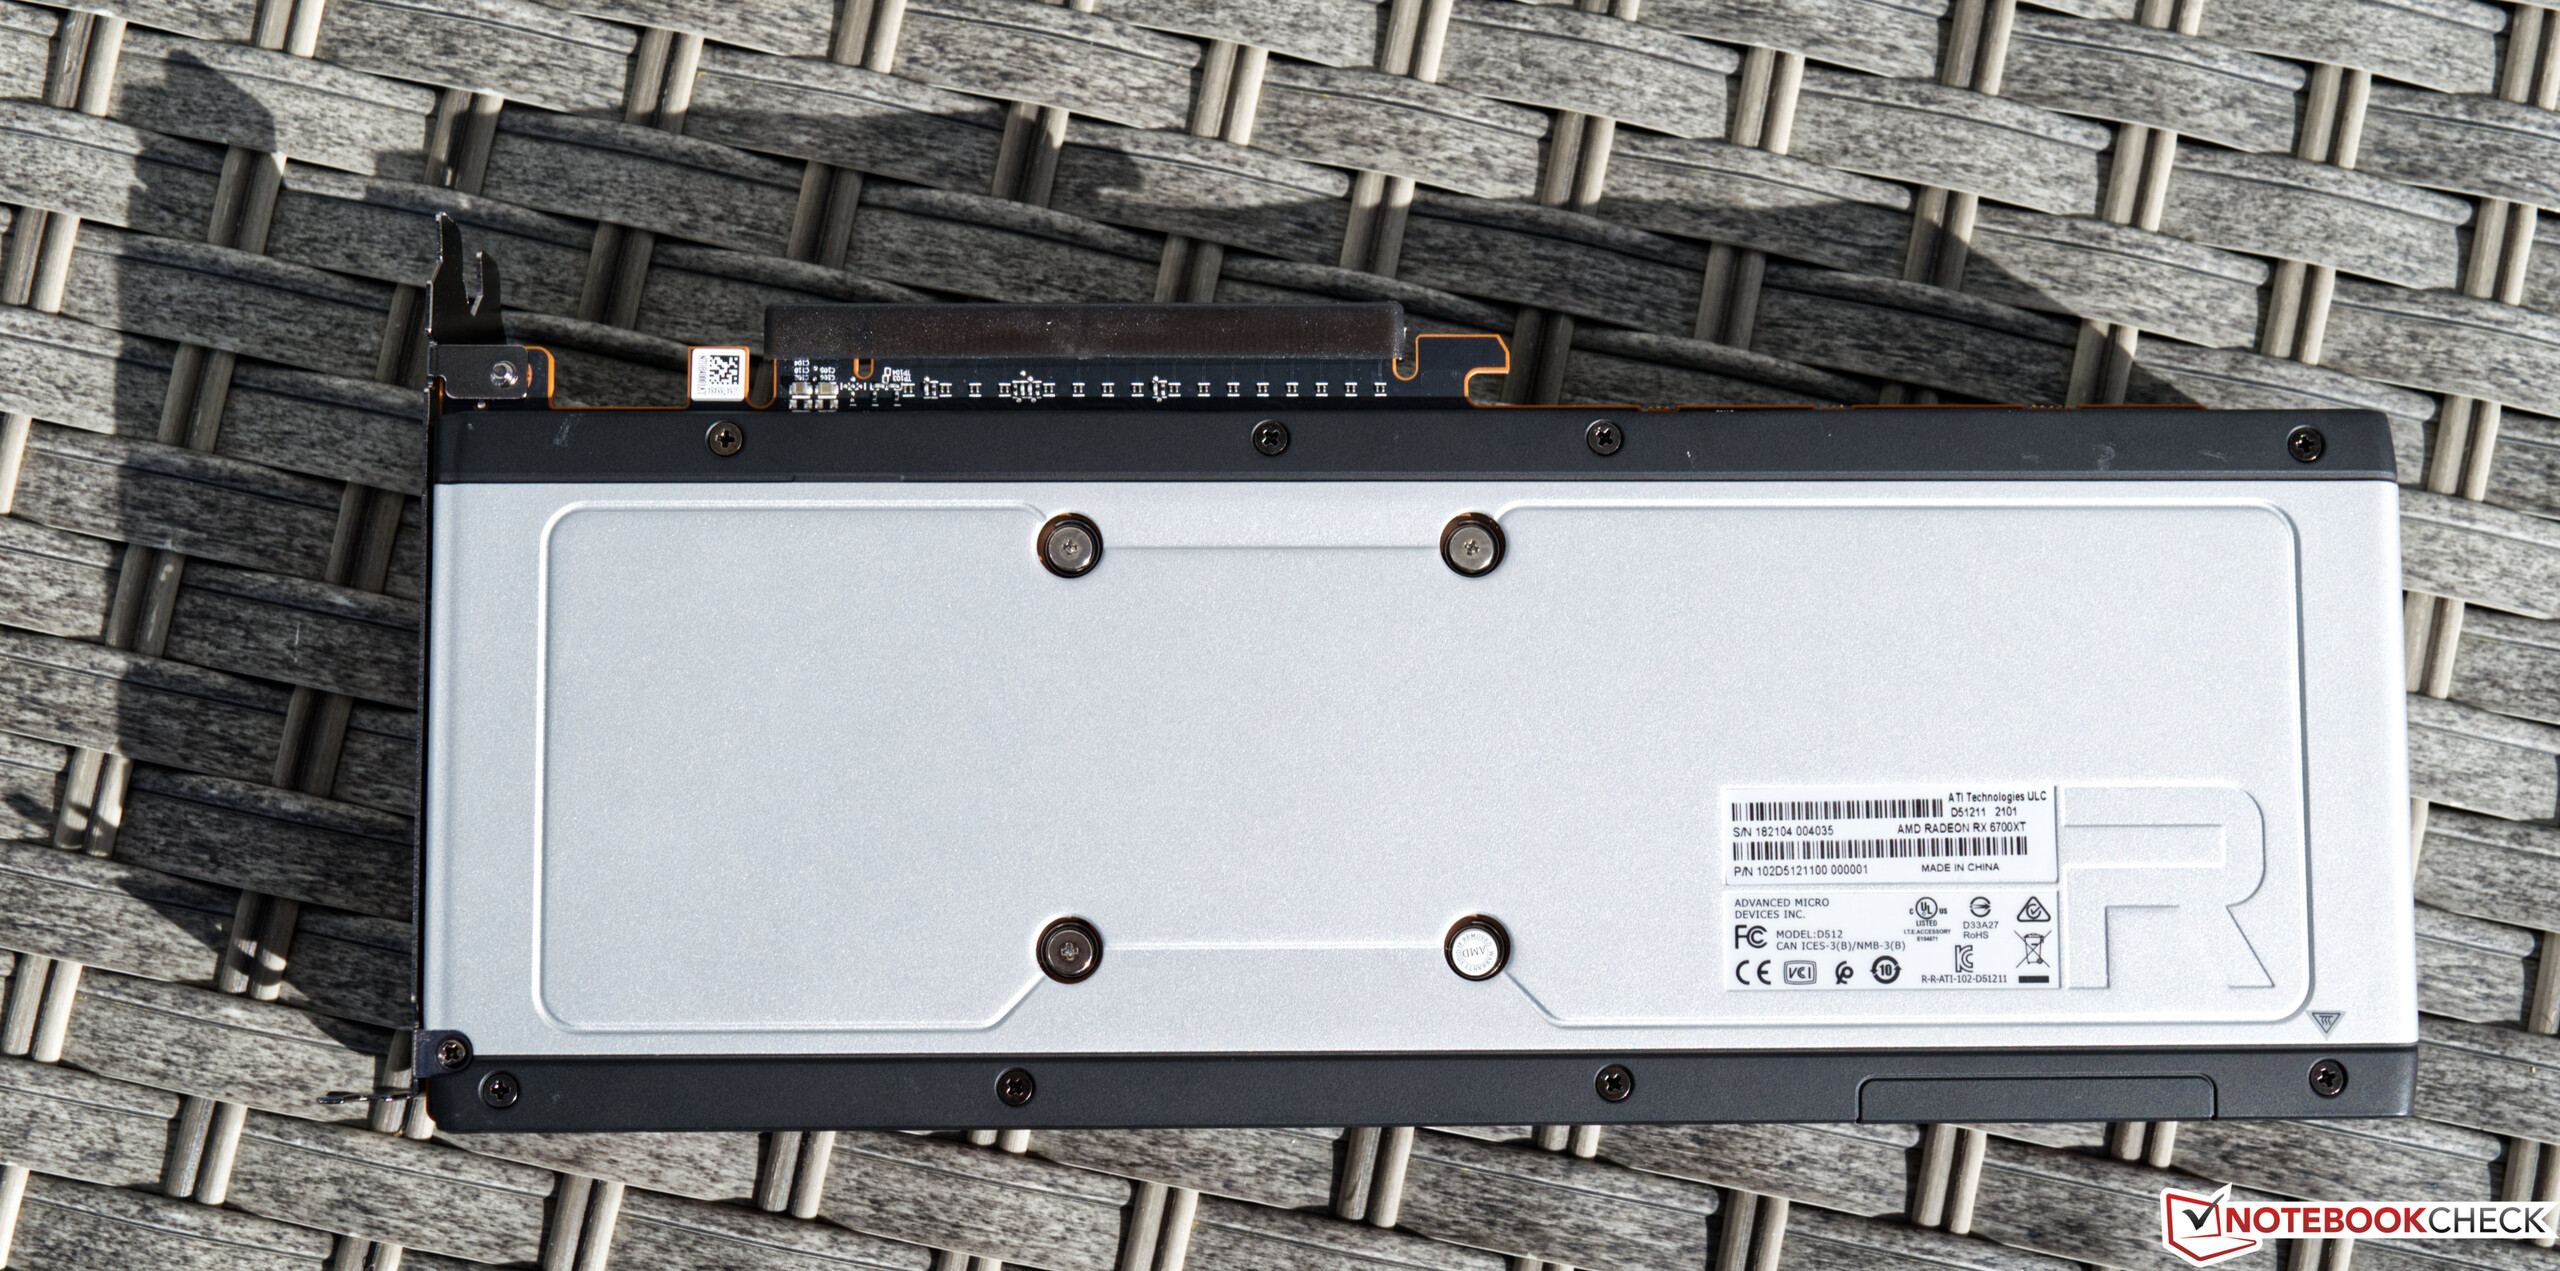
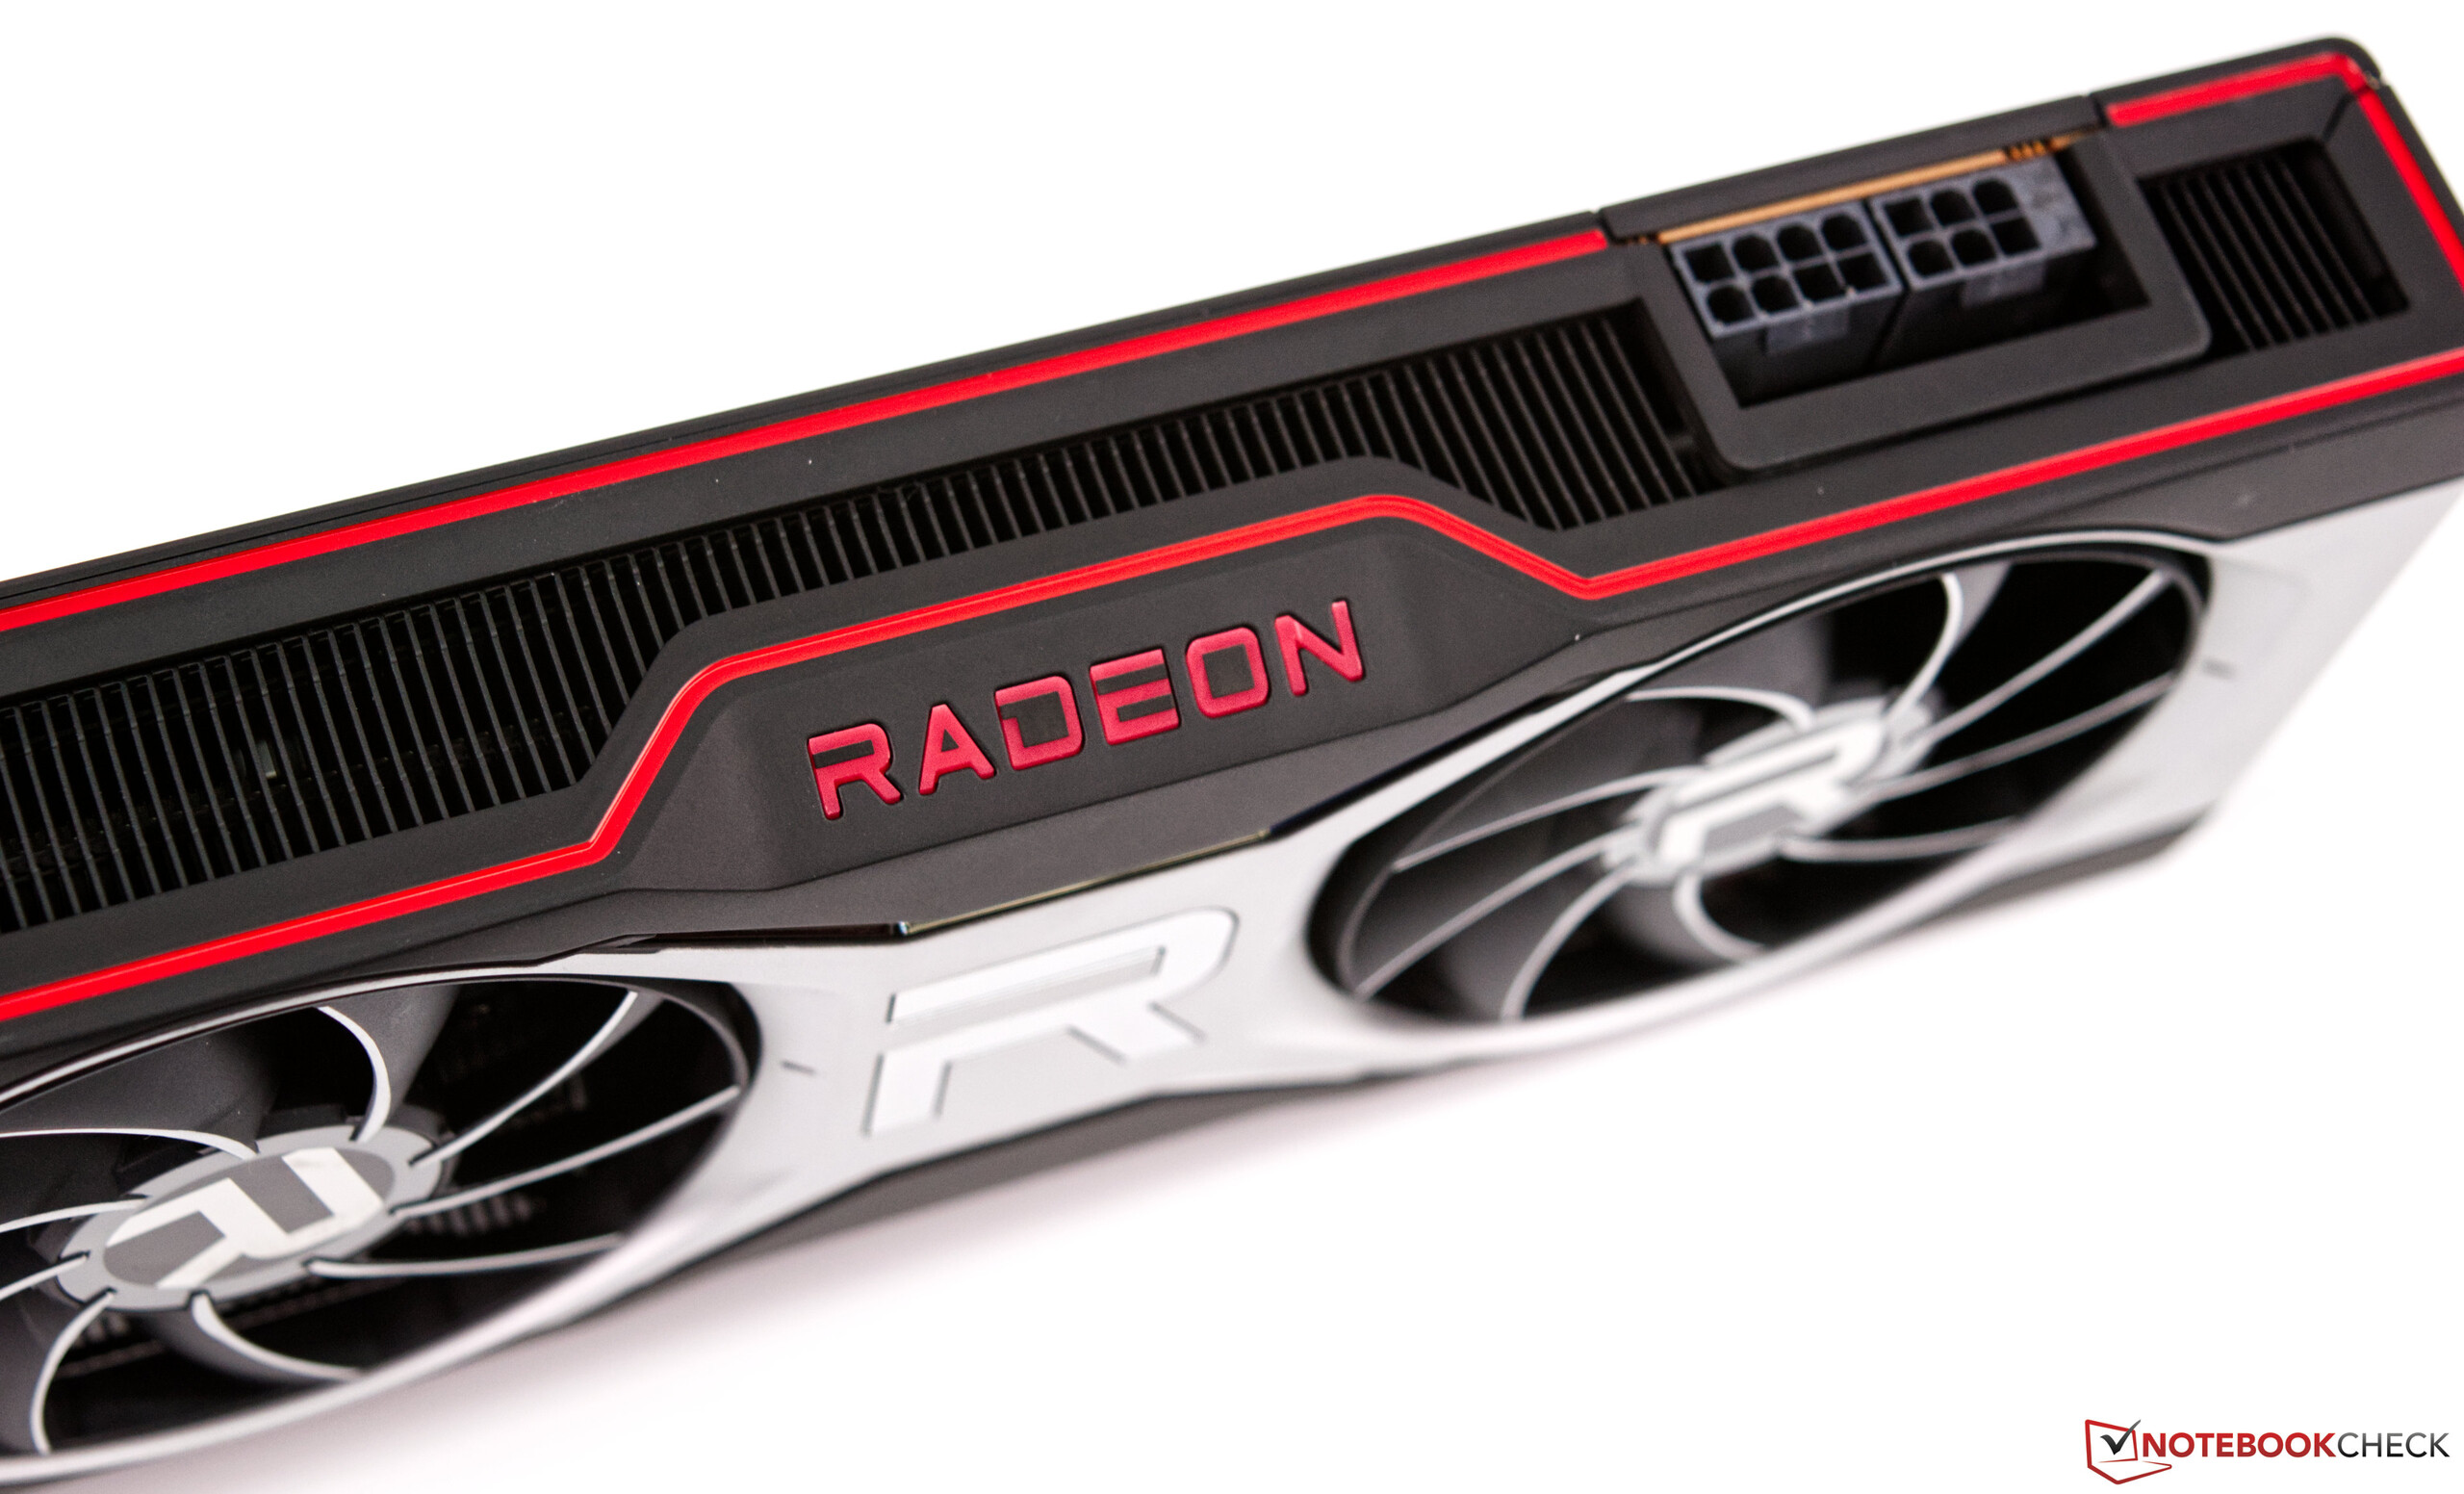
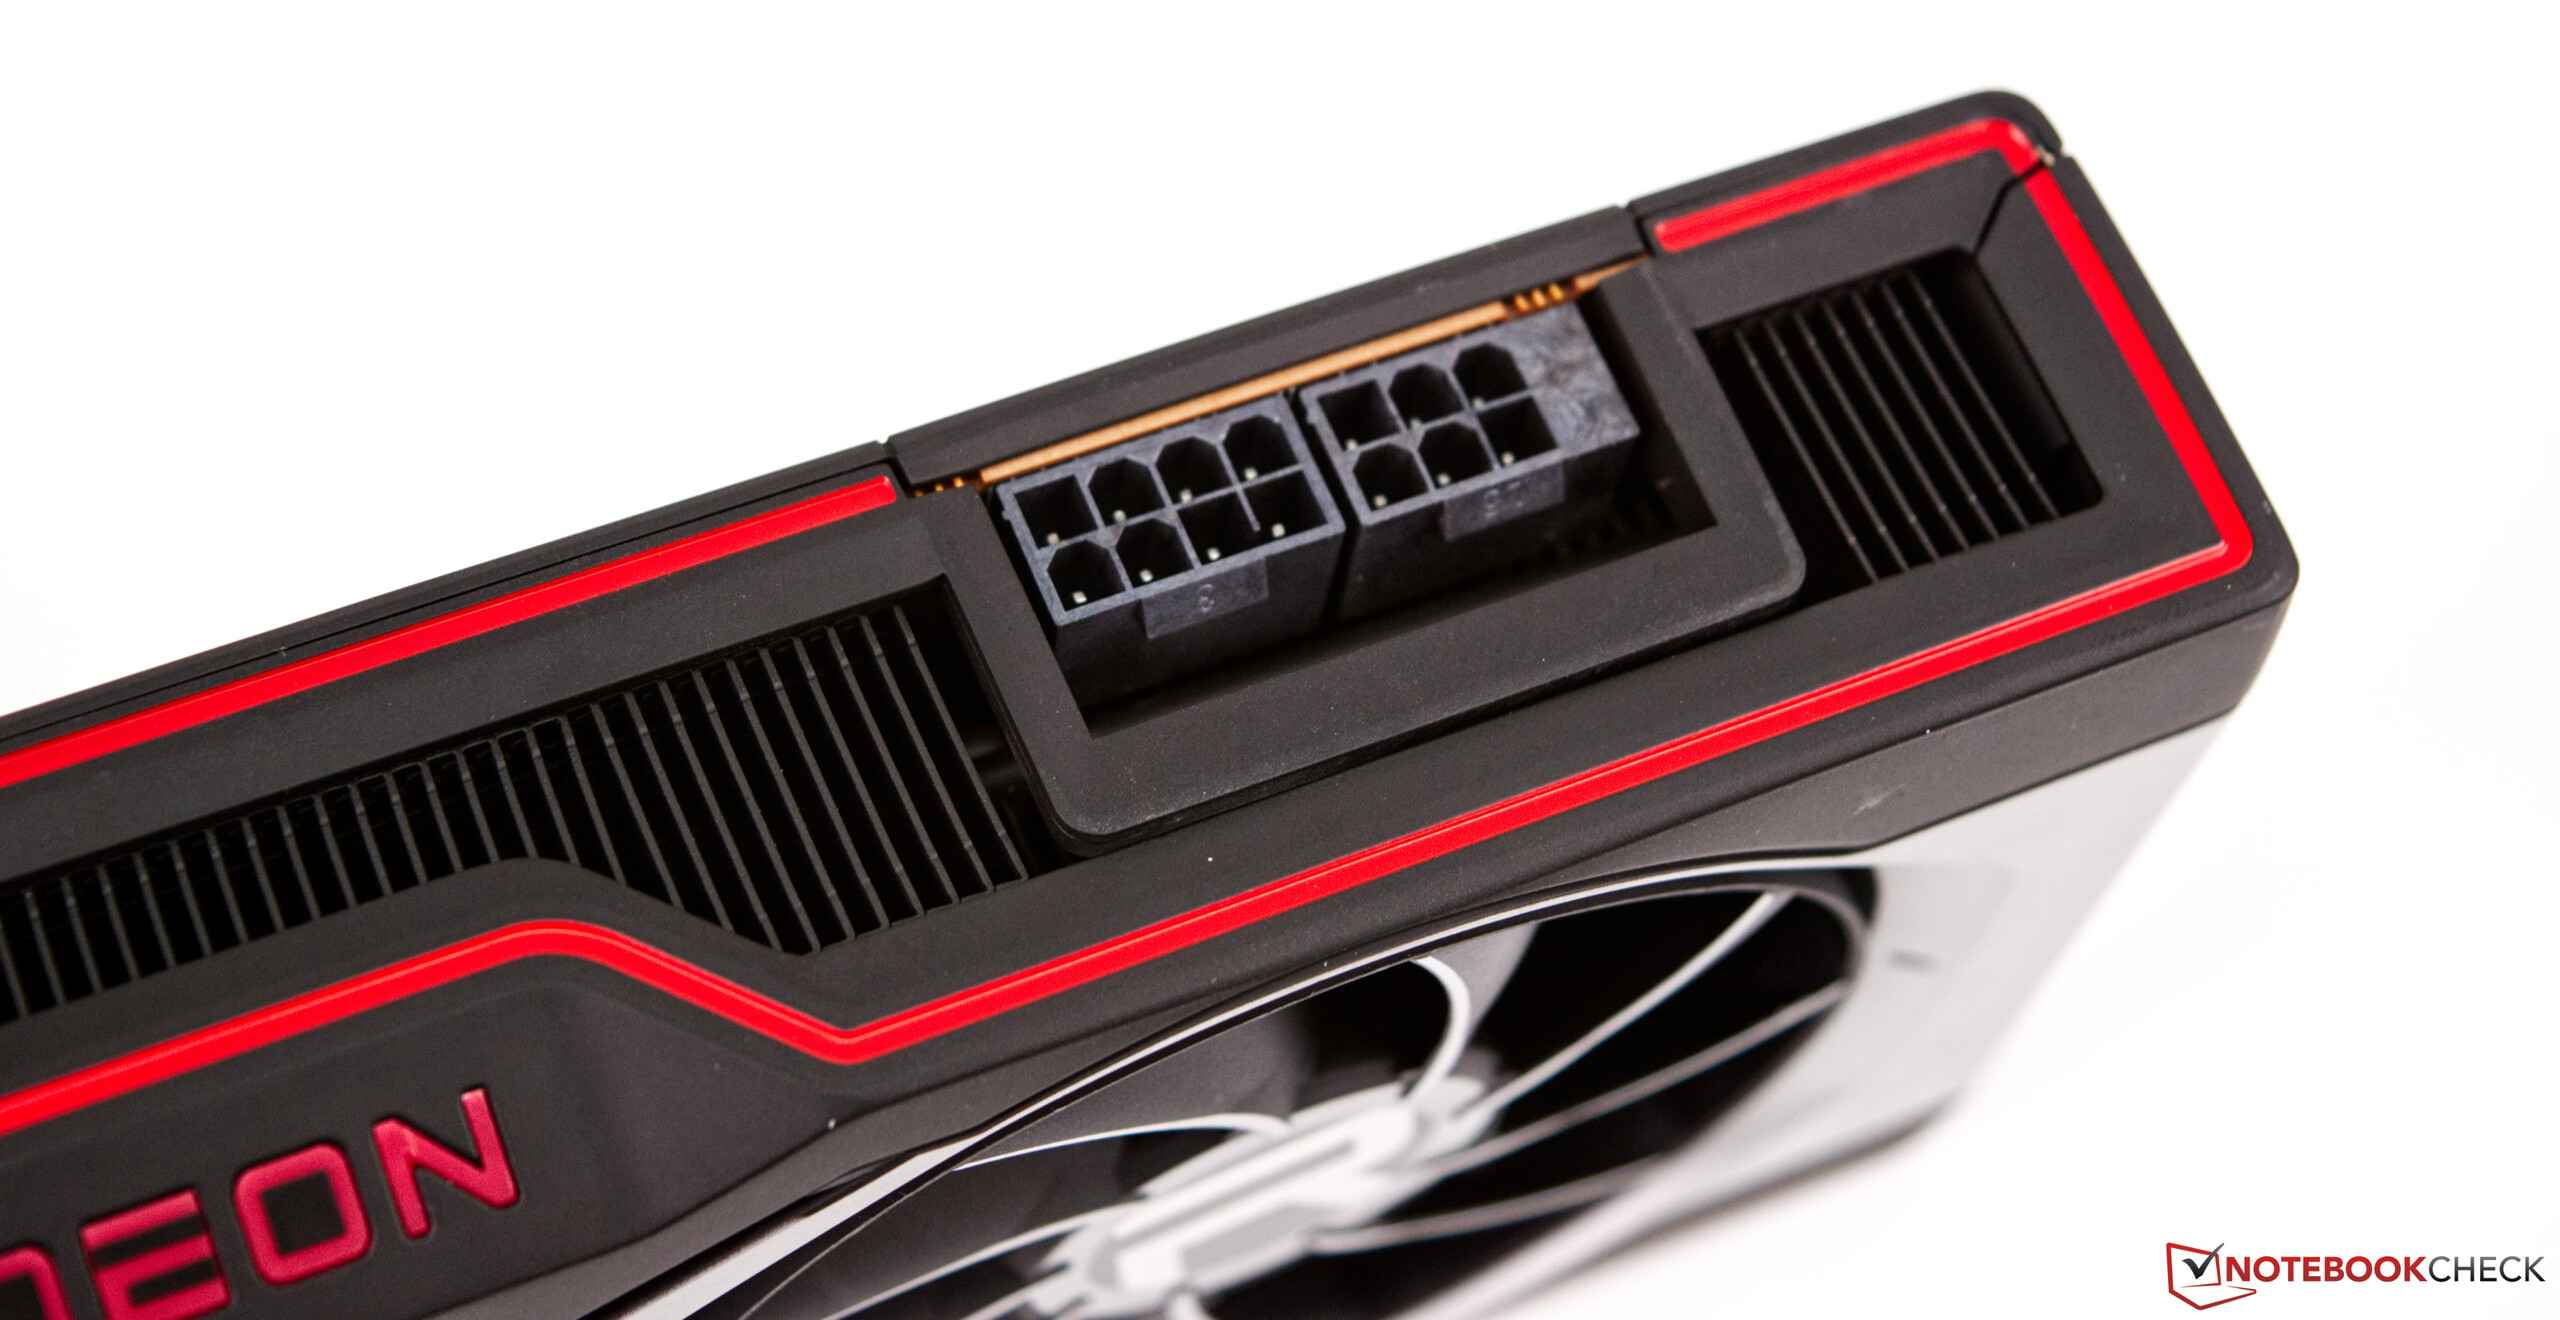
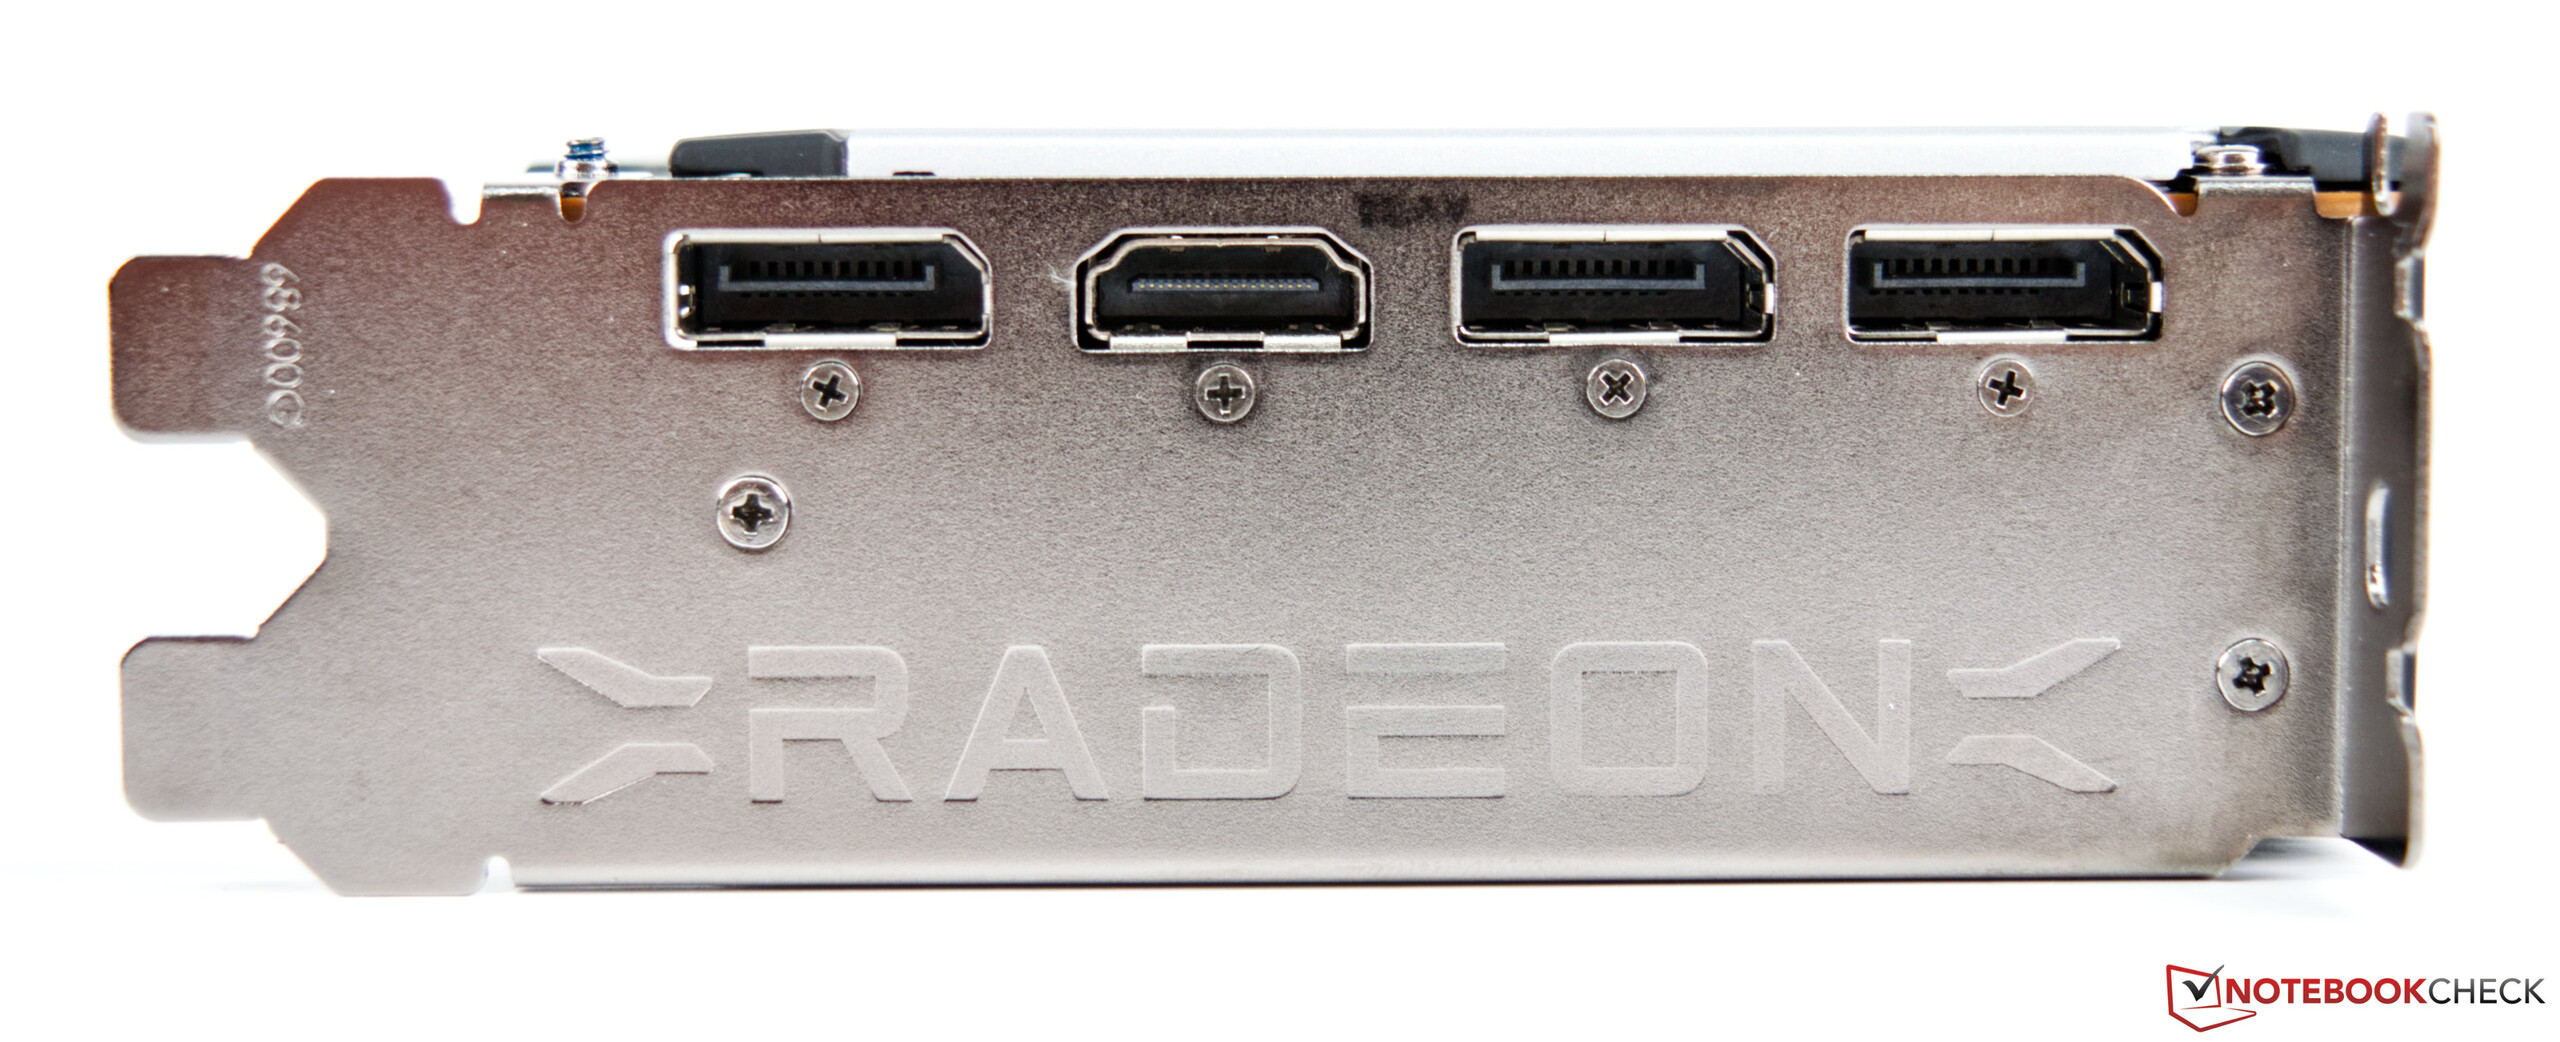
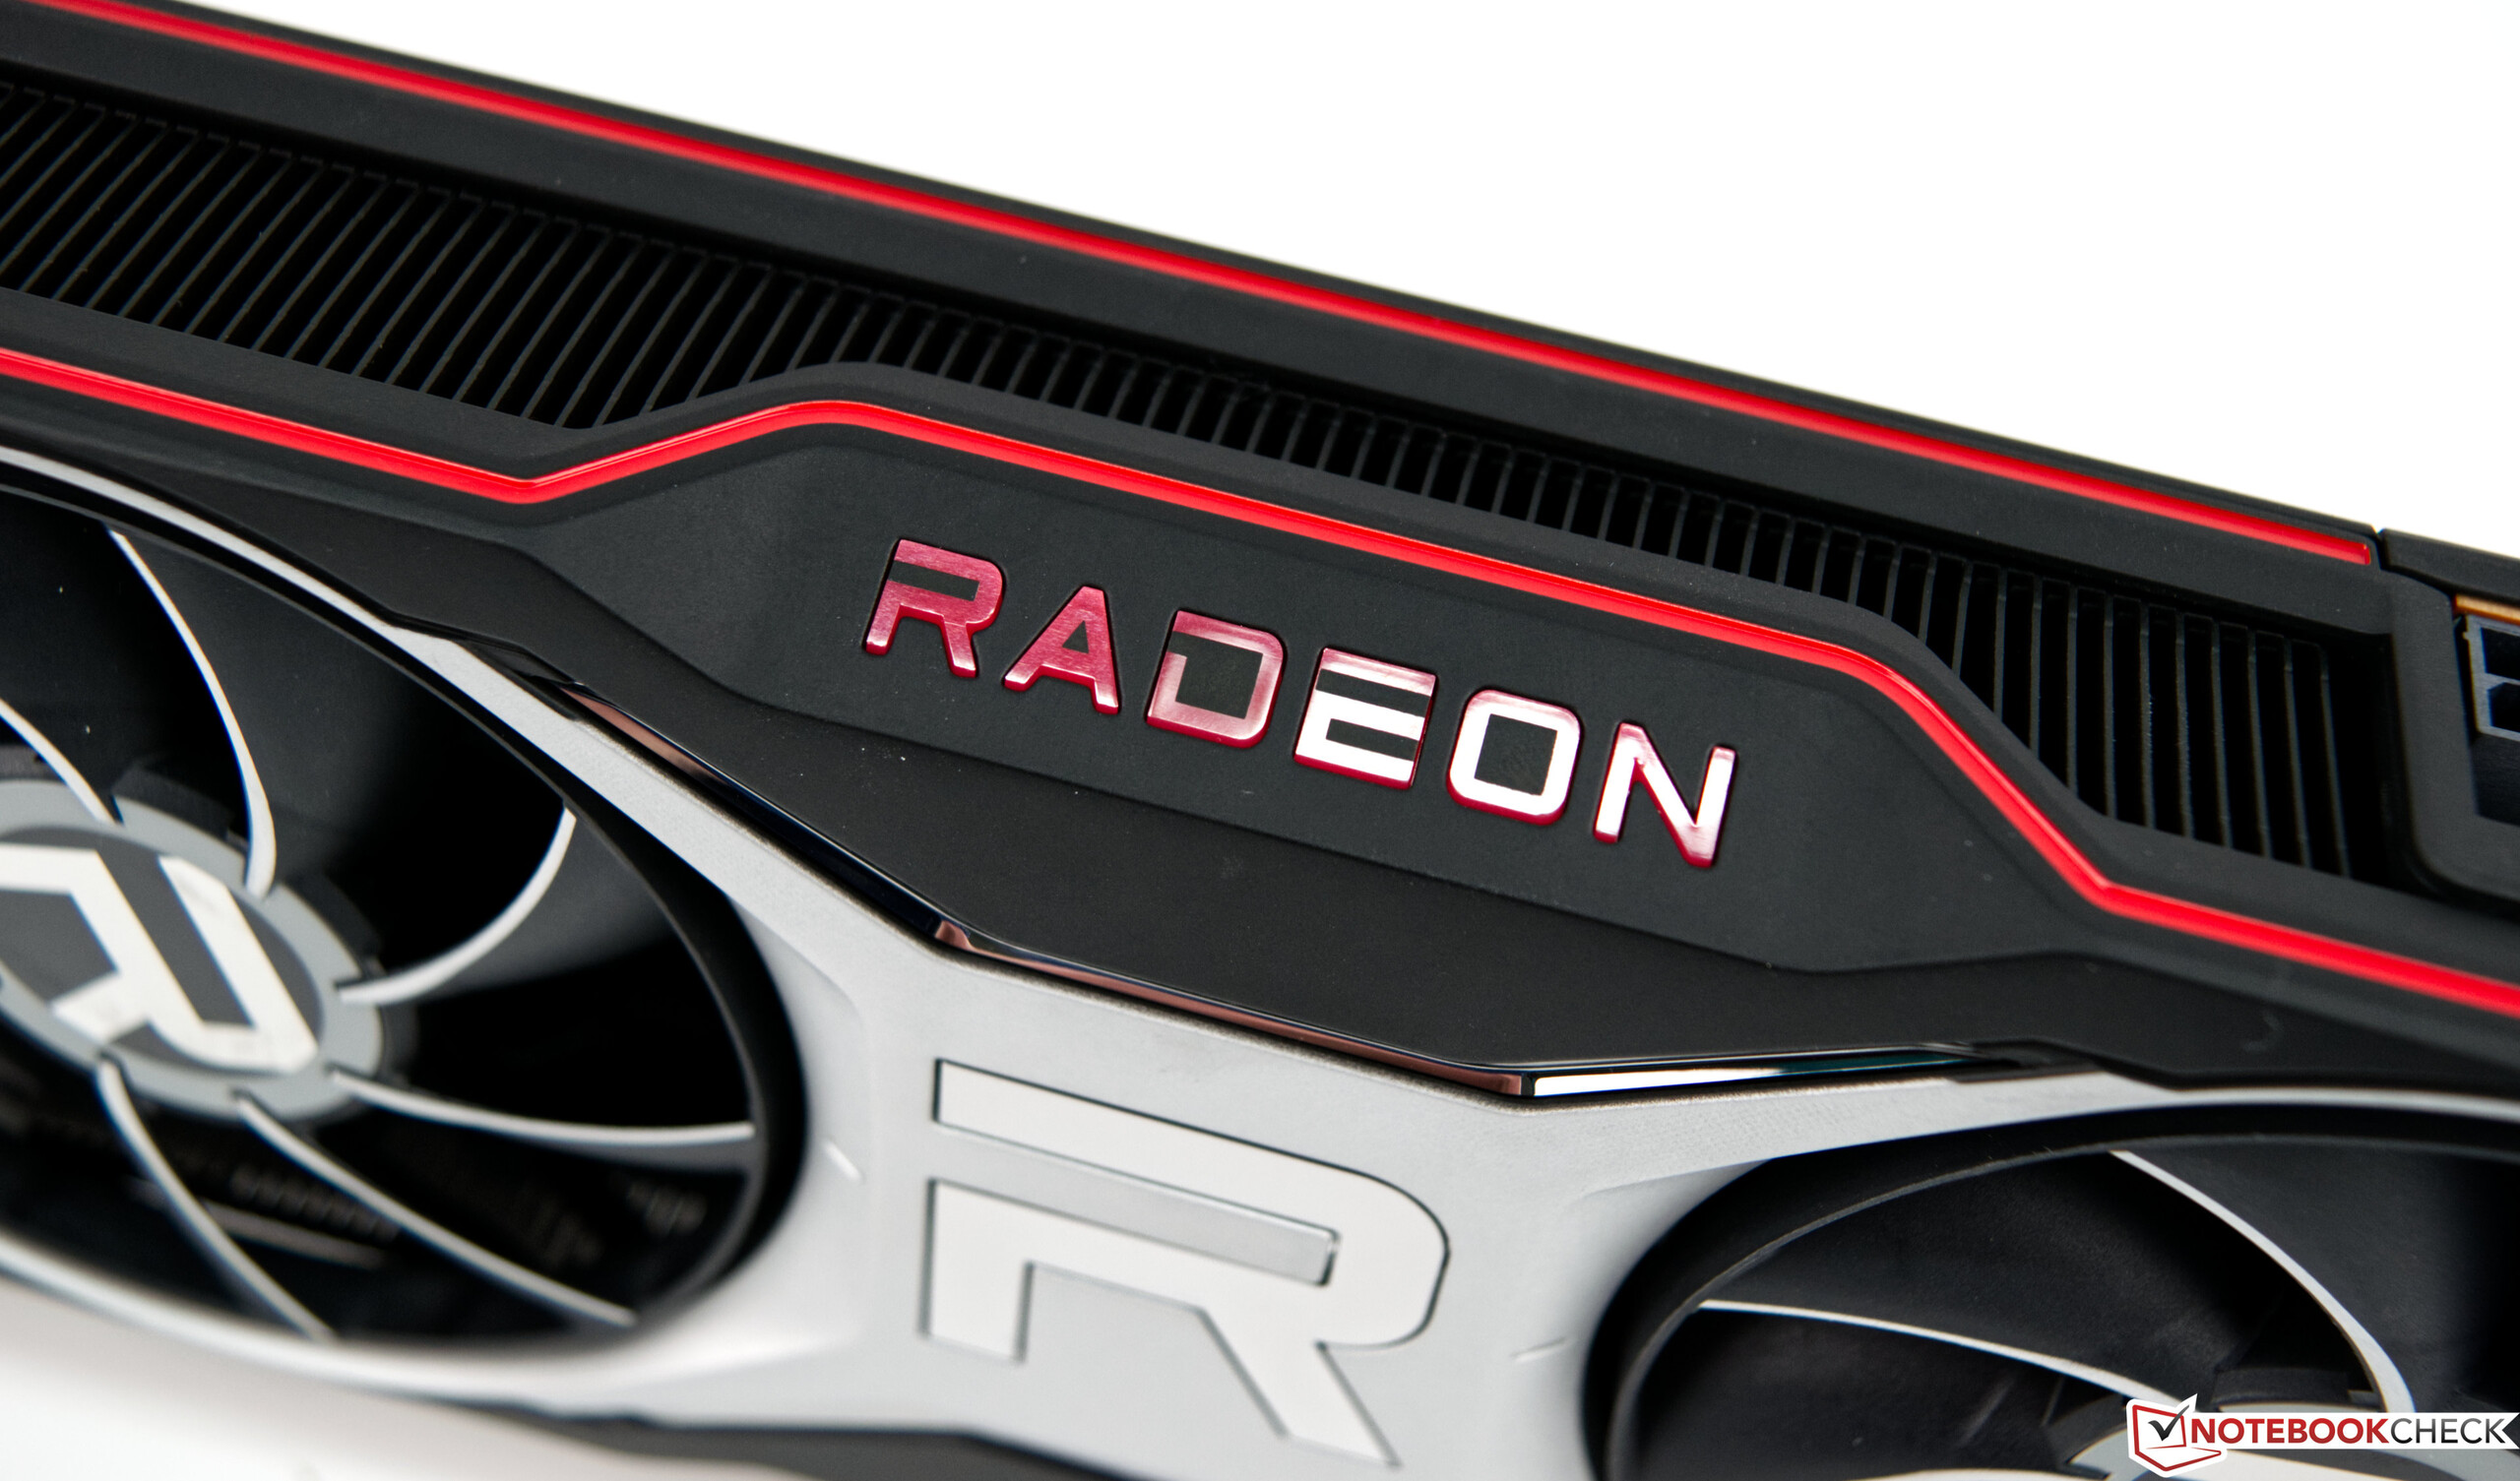
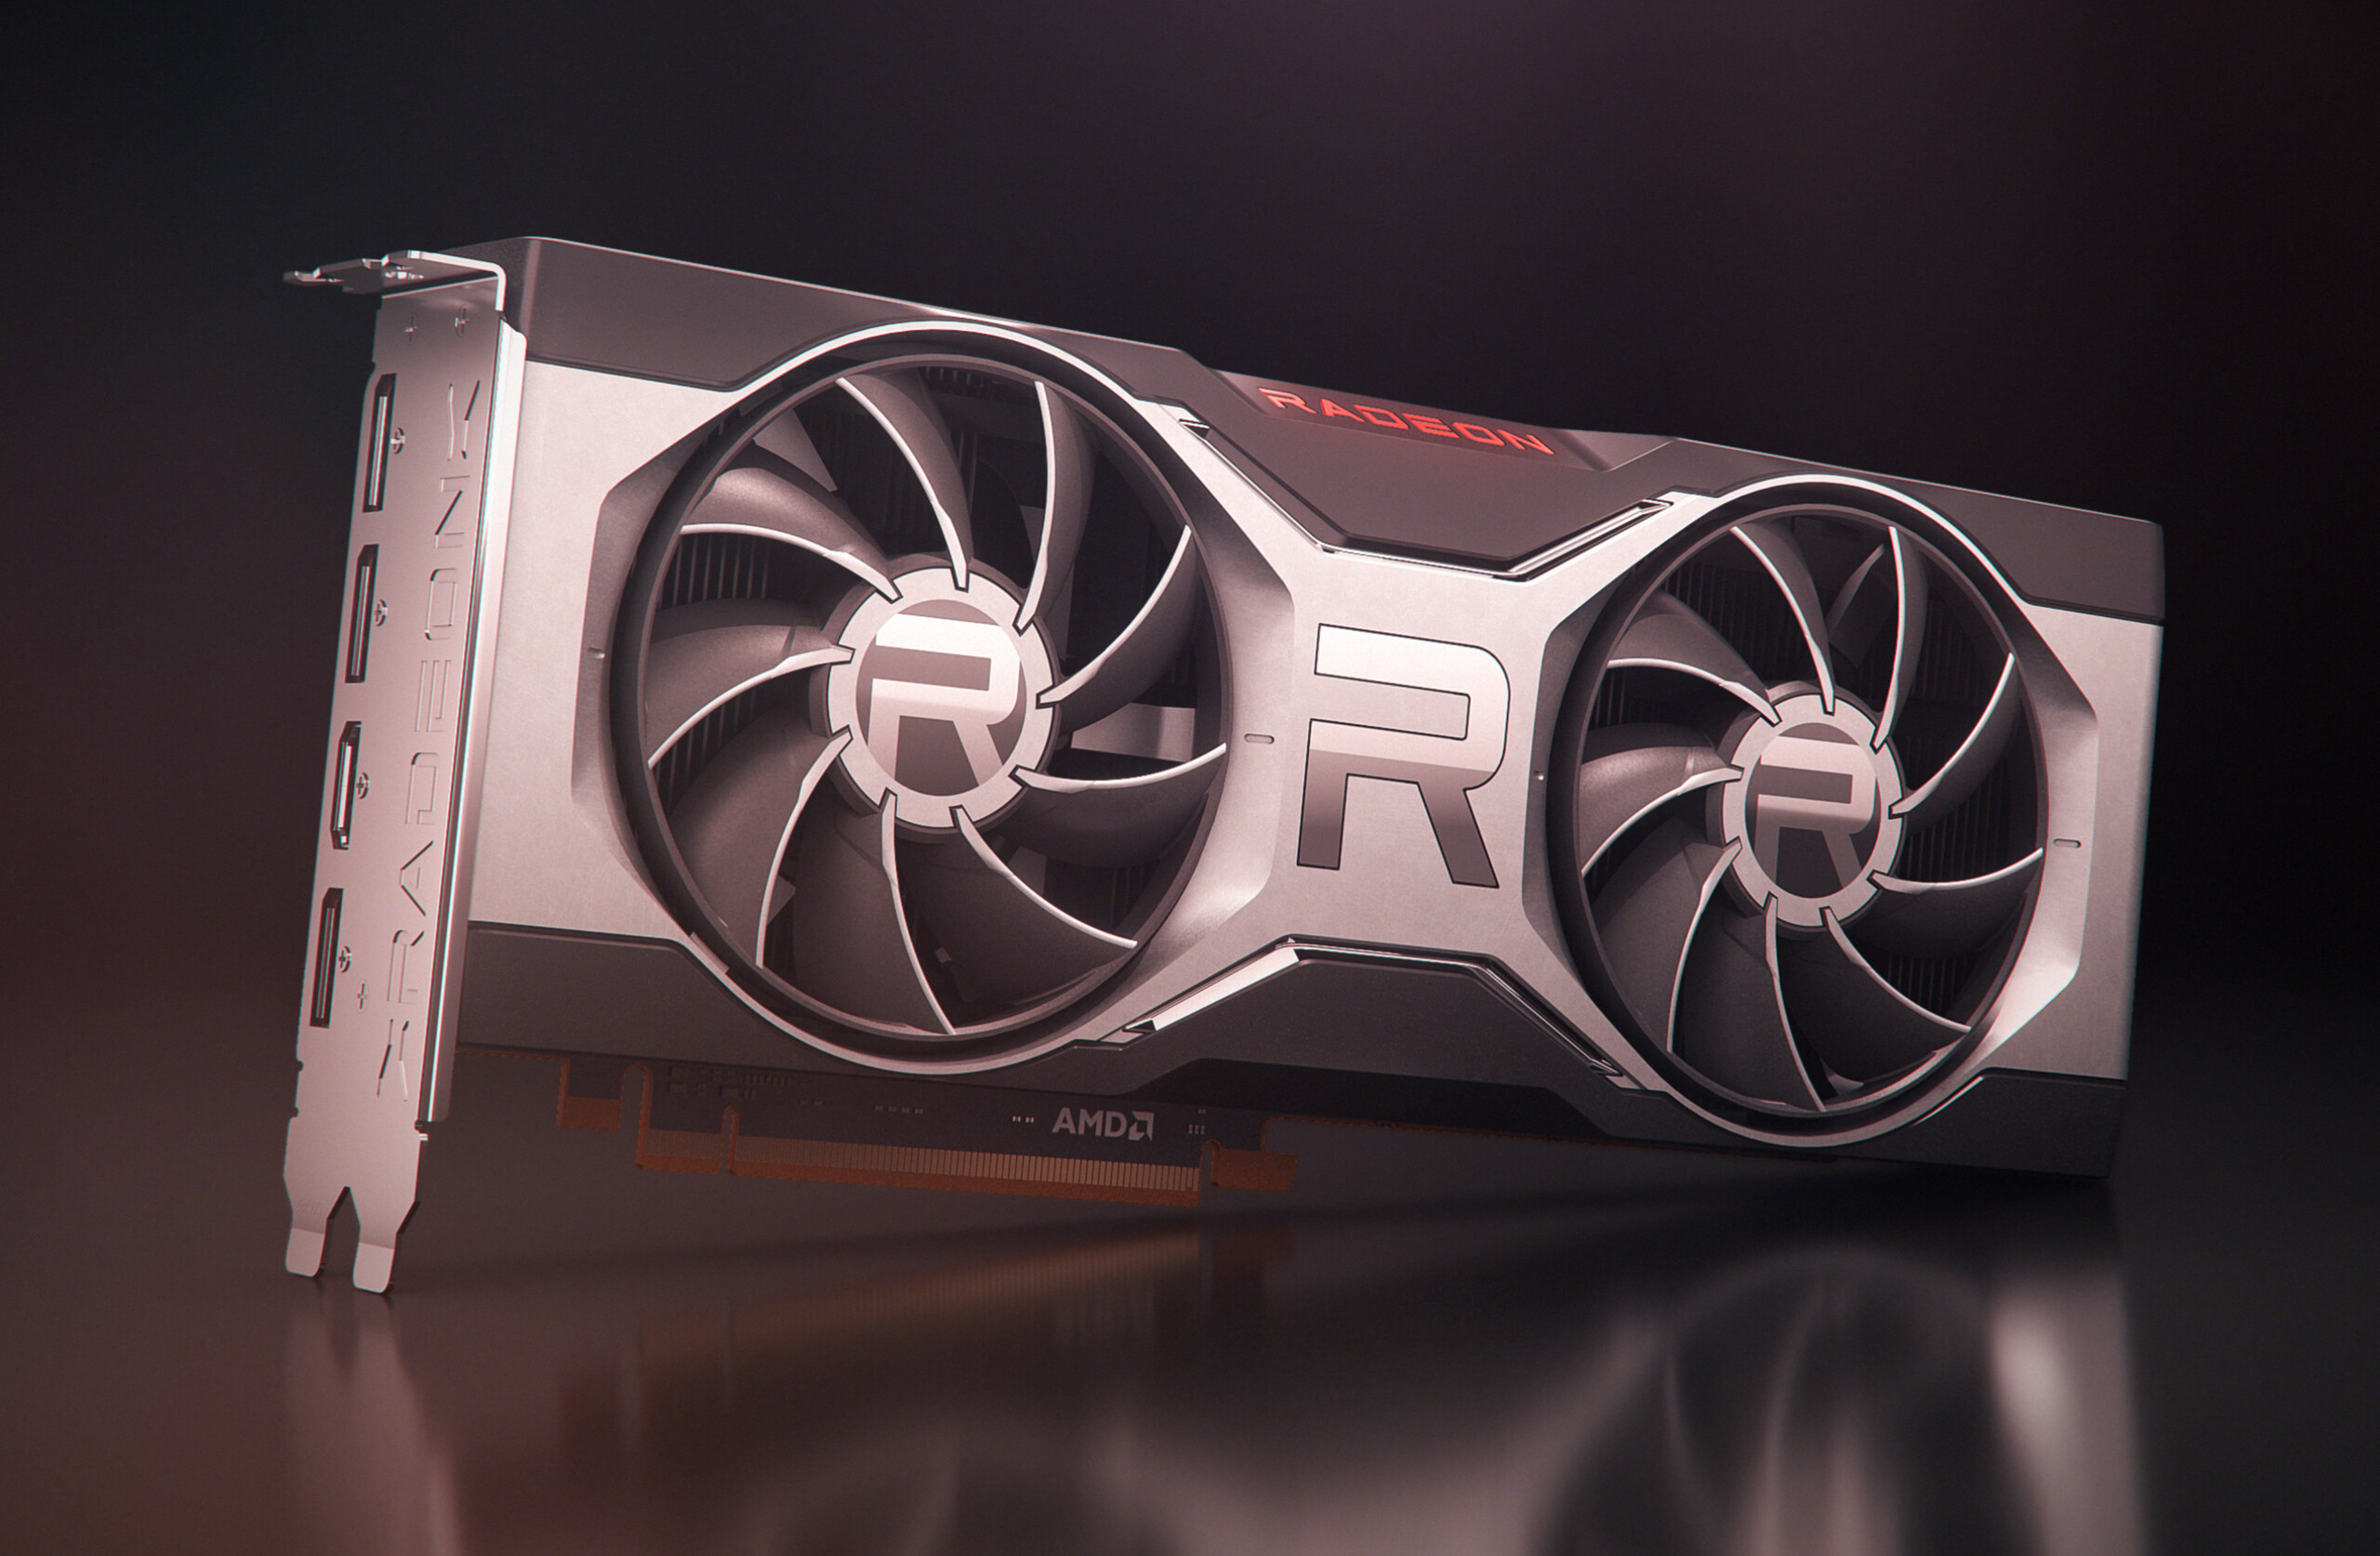
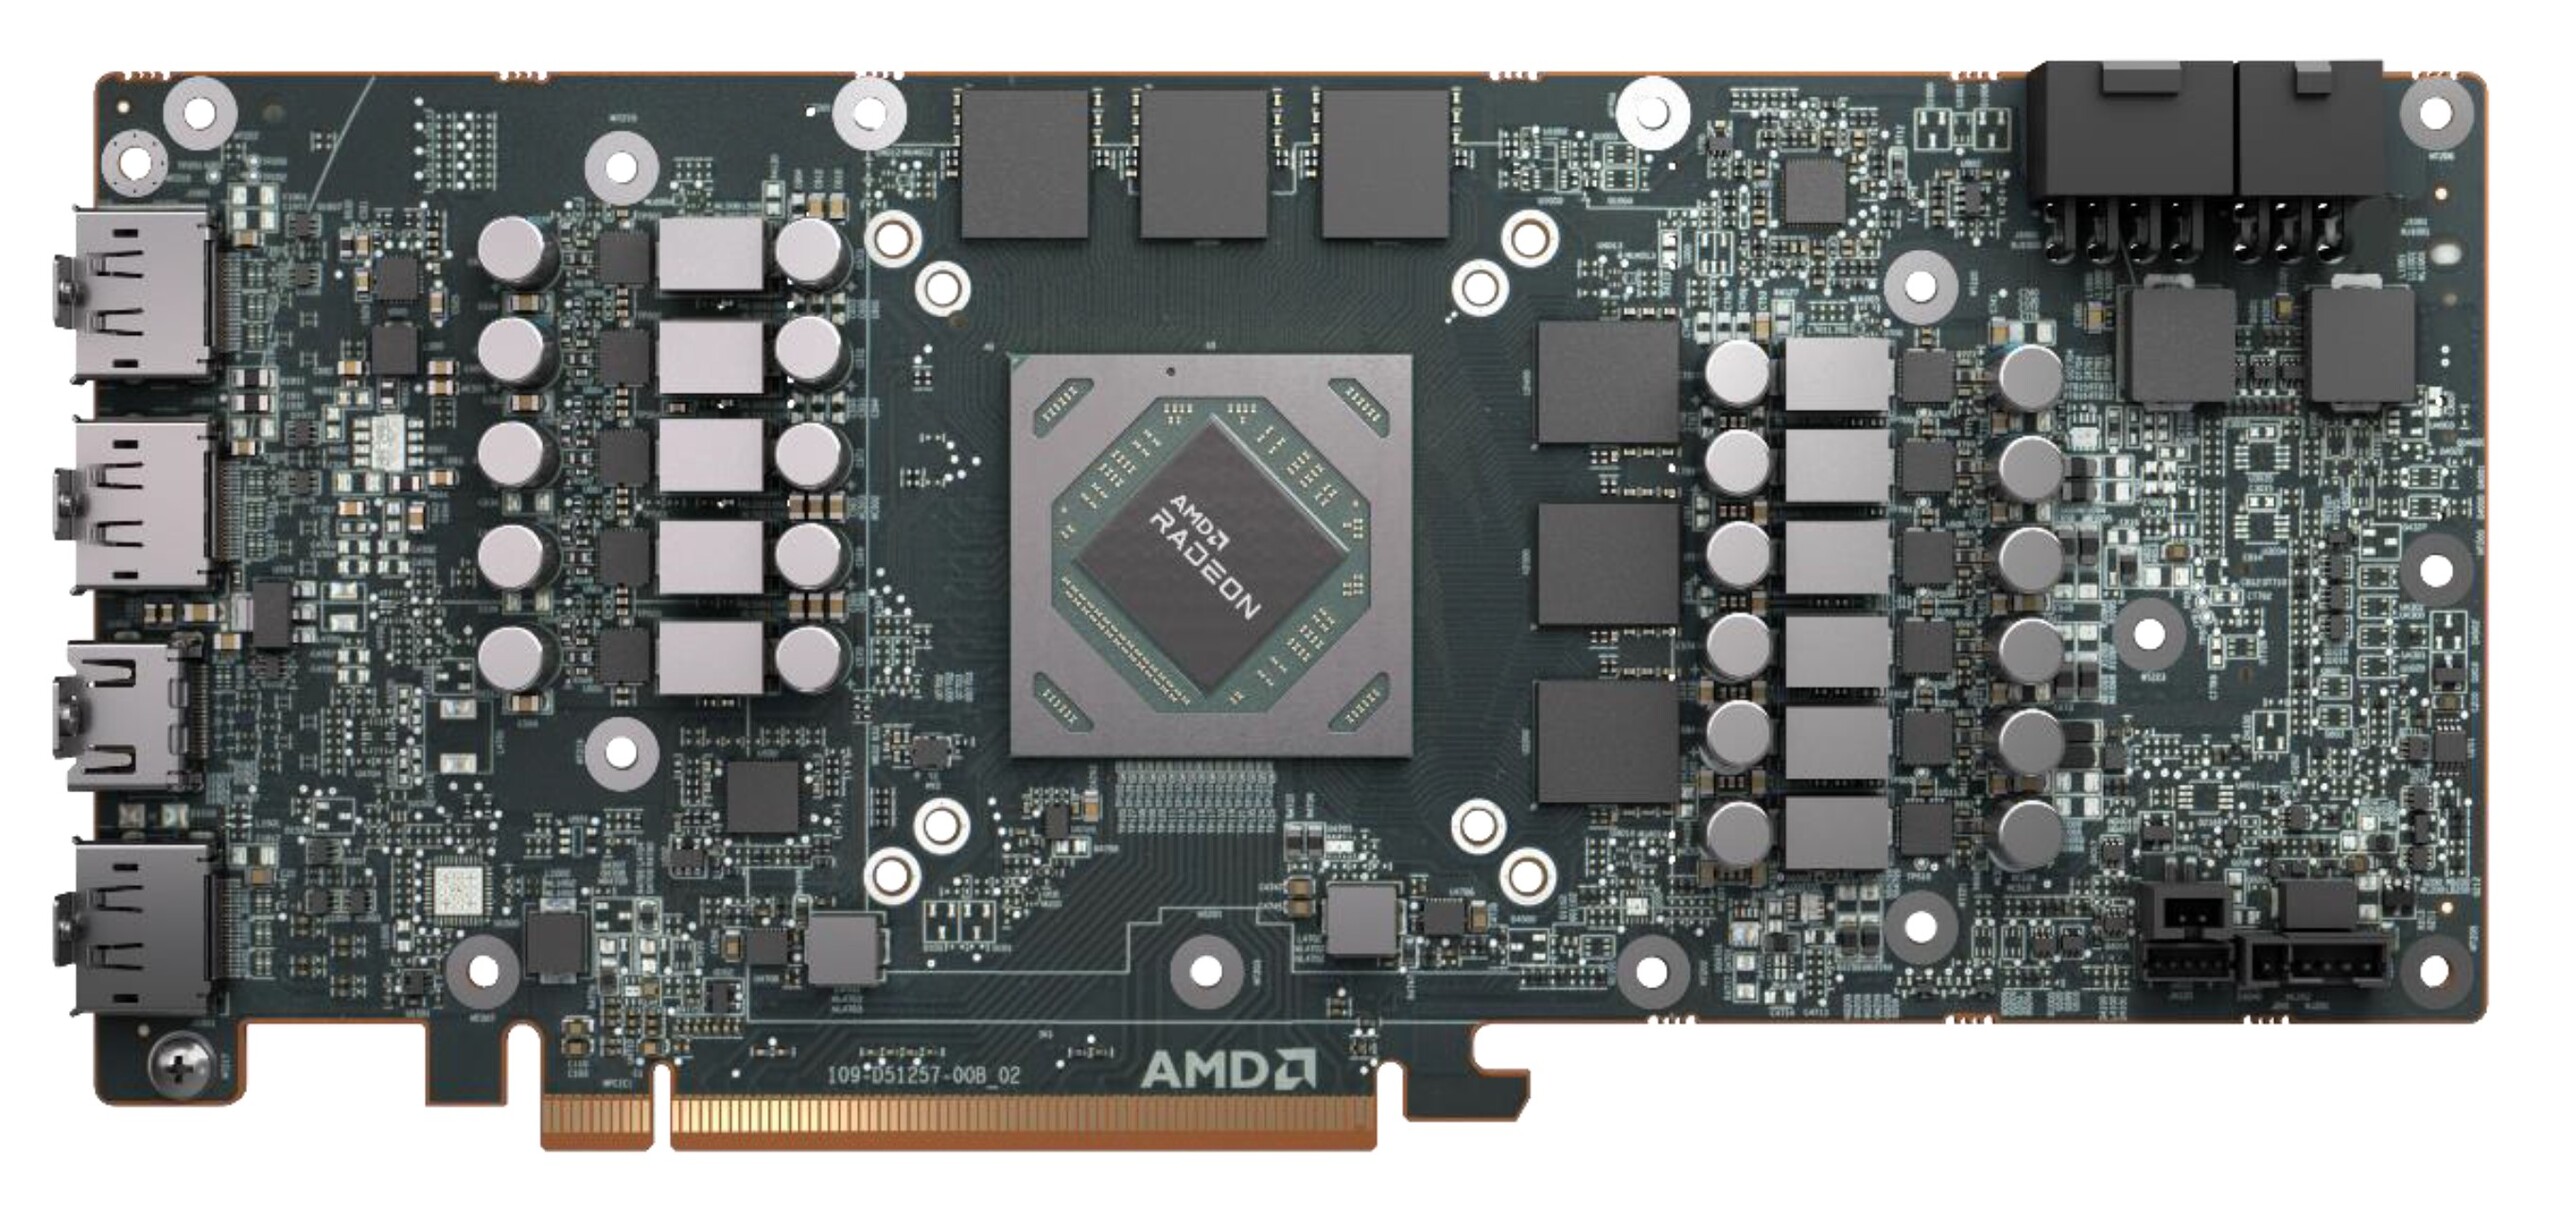
In terms of power demand, the AMD Radeon RX 6700 XT's energy consumption is similarly frugal as that of the AMD Radeon RX 5700 XT. At 230 watts (TGP), the graphics card isn't excessively power-hungry. As for the reference model's workmanship, it can be said that everything looks very high-quality. Both the front and the backplate are made of metal and don't feel cheap, either. Visually, an illuminated "Radeon" logo decorates the graphics card. AMD recommends using at least a 650-watt power supply for operation. The AMD Radeon RX 6700 XT offers one HDMI port and three DisplayPorts for connecting monitors.

GPU specifications in overview
| Specification | AMD Radeon RX 6800 XT | AMD Radeon RX 6800 | AMD Radeon RX 6700 XT | AMD Radeon RX 5700 XT | AMD Radeon RX 5700 | RTX 3080 FE | RTX 3070 FE |
| Chip | Navi 21 | Navi 21 | Navi 22 | Navi 10 | Navi 10 | GA102 | GA104 |
| Manufacturing process | 7 nm | 7 nm | 7 nm | 7 nm | 7 nm | 8 nm | 8 nm |
| Shaders | 4,608 | 3,840 | 2,560 | 2,560 | 2,304 | 8,704 | 5,888 |
| Texture units | 288 | 240 | 160 | 160 | 144 | 272 | 184 |
| Tensor cores | - | - | - | - | - | 272 3rd. Gen. | 184 3rd. Gen. |
| RT cores | 72 | 60 | 40 | - | - | 68 | 46 |
| GPU base clock | 1,825 MHz | 1,700 MHz | 1,569 MHz | 1,605 MHz | 1,465 MHz | 1,440 MHz | 1,500 MHz |
| GPU boost clock | 2,250 MHz | 2,105 MHz | 2,639 MHz | 1,755 MHz | 1,625 MHz | 1,710 MHz | 1,750 MHz |
| Memory bus | 256-bit | 256-bit | 192-bit | 256-bit | 256-bit | 320-bit | 256-bit |
| Memory bandwidth | 512 GB/s | 512 GB/s | 384 GB/s | 448 GB/s | 448 GB/s | 760 GB/s | 448 GB/s |
| Memory size | 16 GB GDDR6 | 16 GB GDDR6 | 12 GB GDDR6 | 8 GB GDDR6 | 8 GB GDDR6 | 10 GB GDDR6X | 8 GB GDDR6 |
| Power consumption | 300 W | 250 W | 230 W | 225 W | 180 W | 320 W | 220 W |
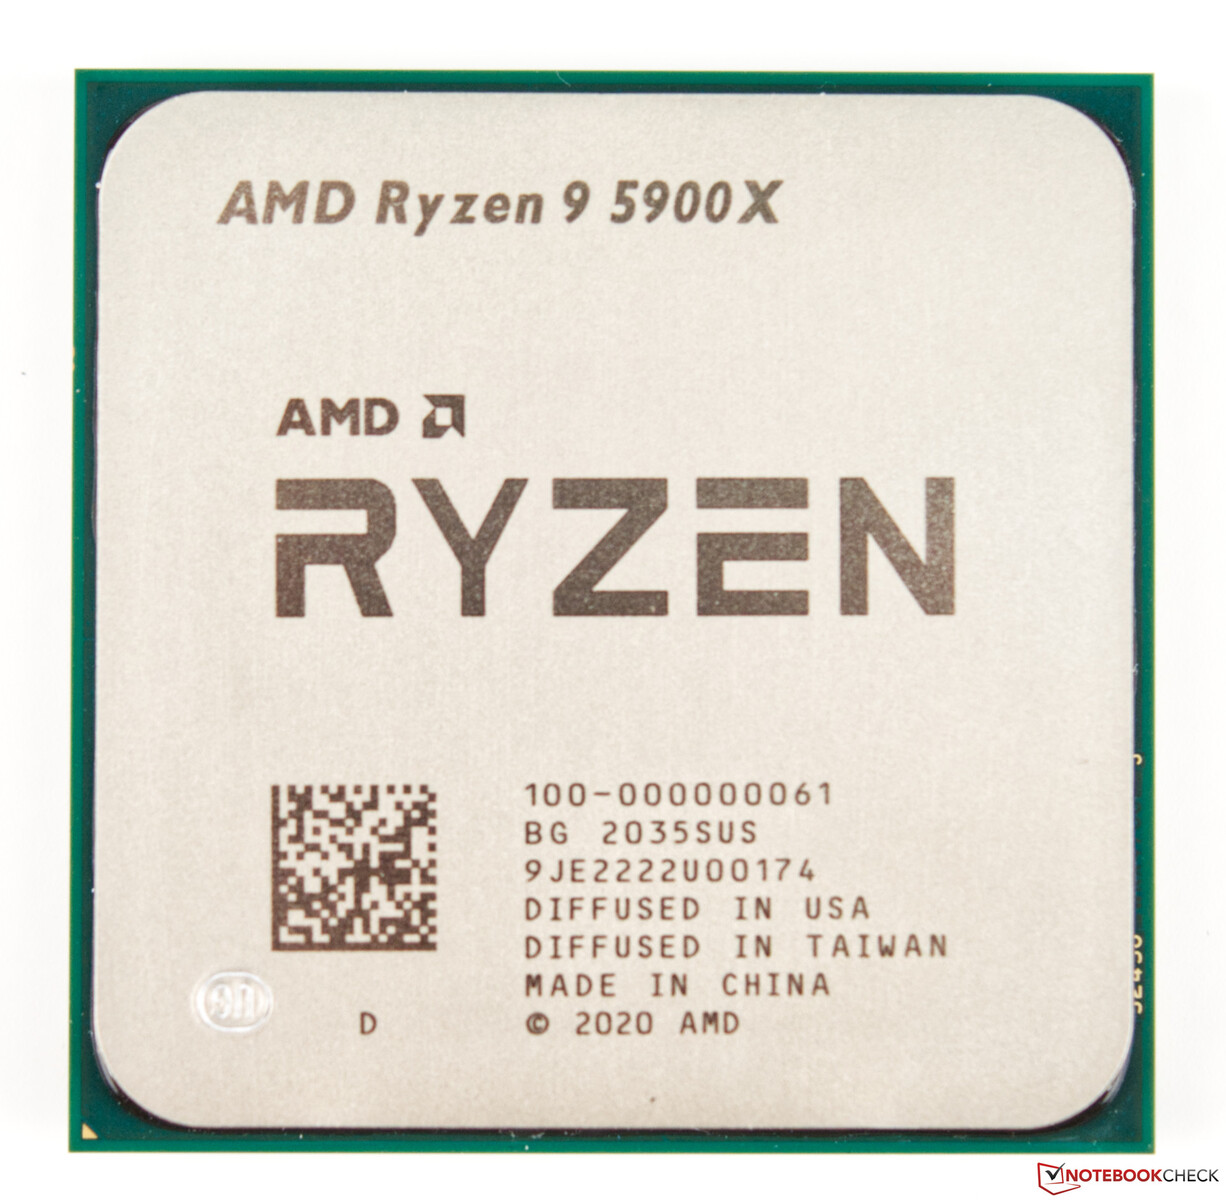
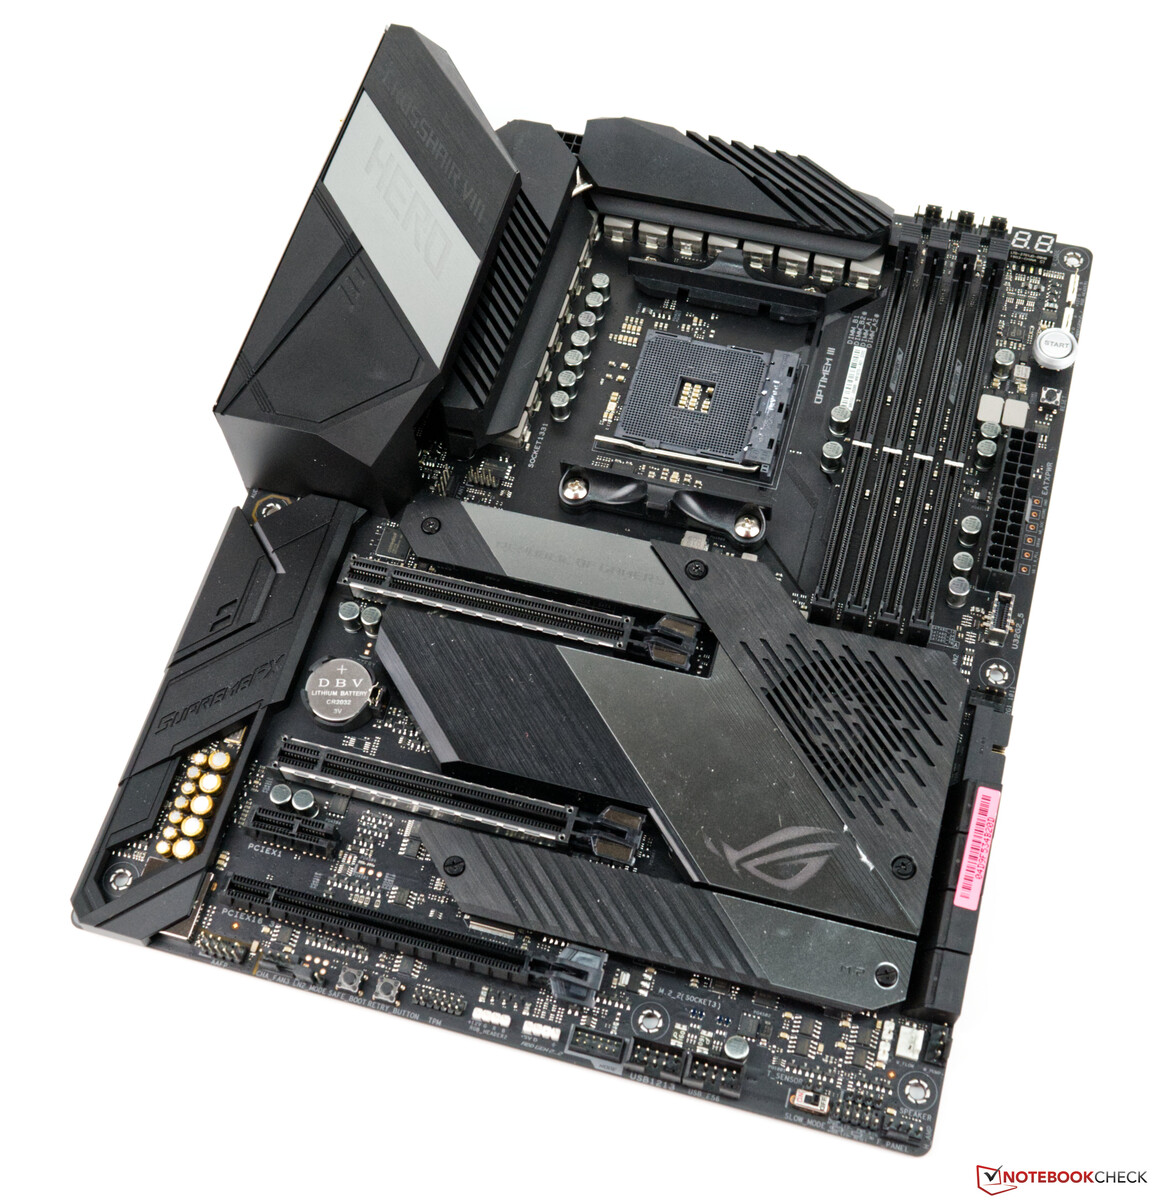
Our test system based on the AMD Ryzen 9 5900X
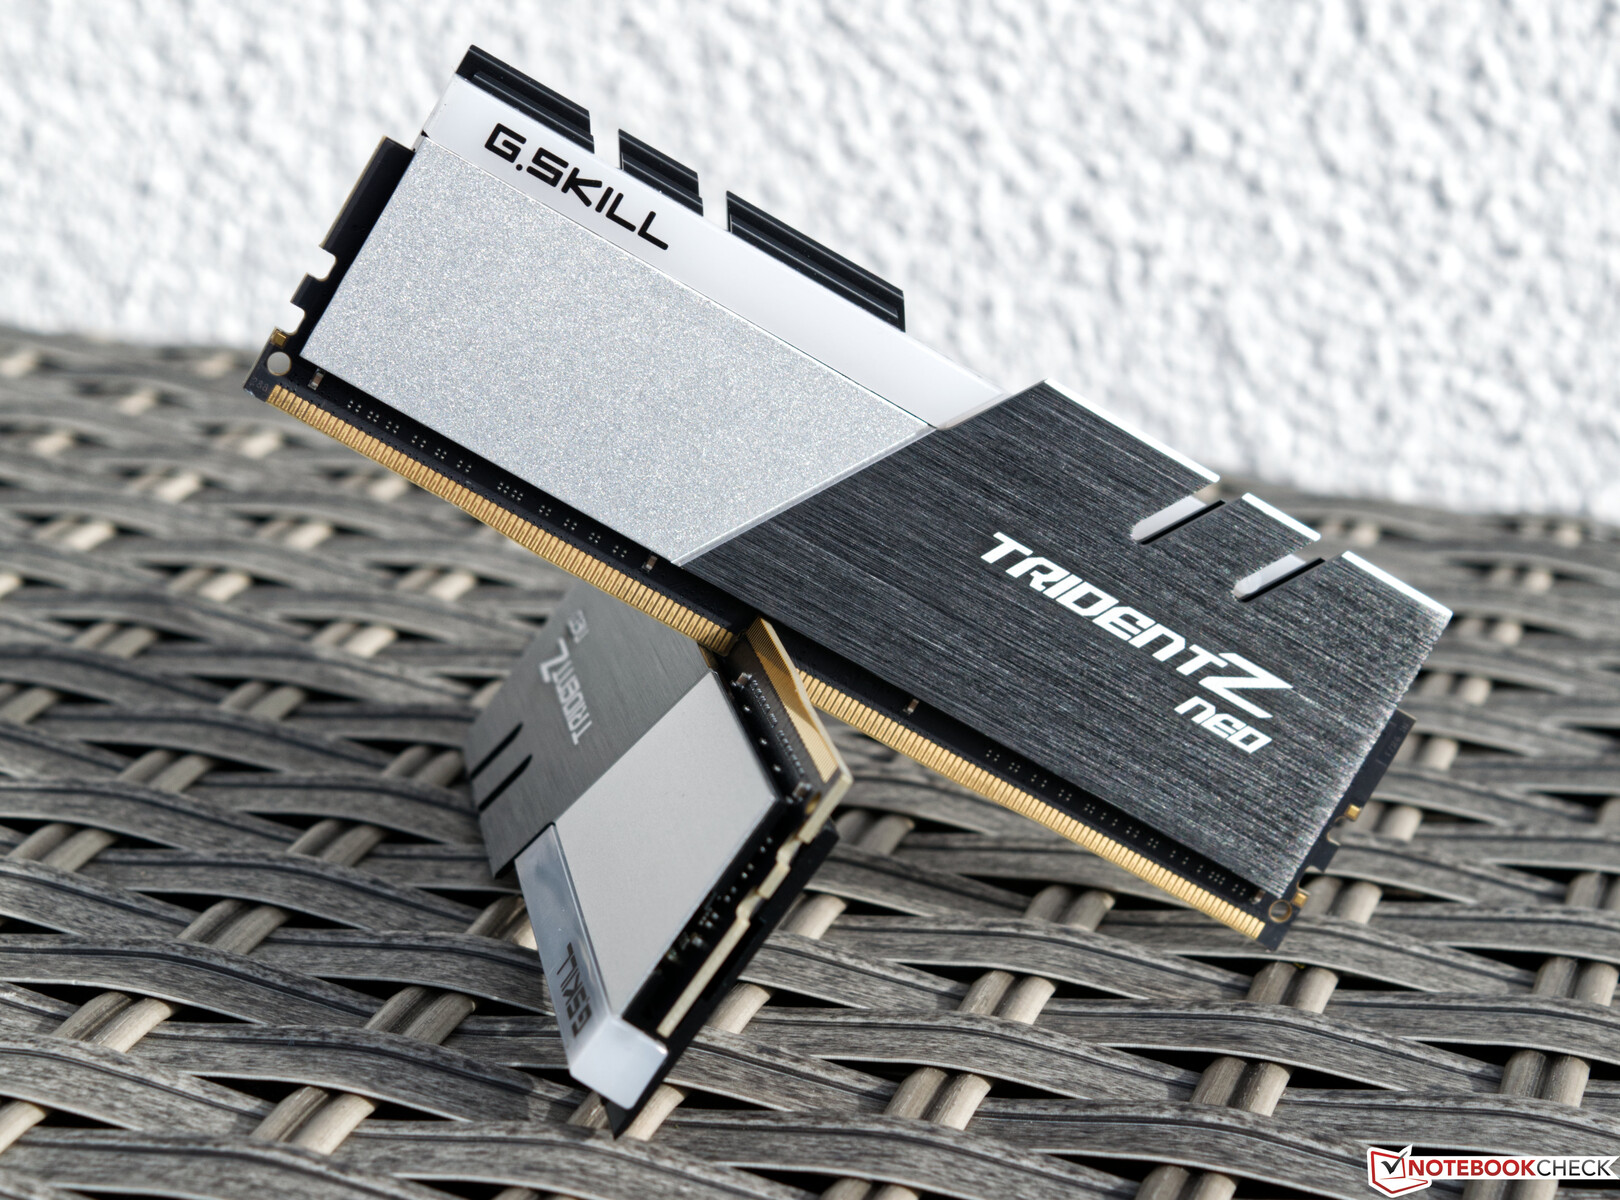
A current AMD platform based on the Asus X570 ROG Crosshair VIII Hero Wi-Fi serves as our test system. The CPU (AMD Ryzen 9 5900X) offers good CPU performance, and we use an AIO (G.Skill ENKI 360) as cooling. The 32 GB RAM comes from G.Skill and was provided to us just like the AIO. We use the Acer Predator XB321HK as monitor. This doesn't limit us thanks to its UHD suitability. At this point, we would like to thank AMD for providing us with the test platform.
For the subsequent benchmarks and tests, we use the following system:
- Lian Li O11 Dynamic
- AMD Ryzen 9 5900X
- AMD Radeon RX 6700 XT (Adrenalin 20.50)
- Asus X570 ROG Crosshair VIII Hero Wi-Fi (BIOS 2402, default settings, XMP 1 for DDR4-4000)
- Corsair RM1000X 1000-watt power supply
- G.Skill Trident Z Neo RGB DDR4-4000 2x 16 GB RAM kit
- Corsair MP600 2 TB M.2 PCIe 4.0 SSD
- Crucial MX500 2 TB (for games)
Synthetic benchmarks
In general, the AMD Radeon RX 6700 XT cuts a fine figure in the synthetic tests. The AMD Radeon RX 6700 XT and the GeForce RTX 3070 (here in MSI's Gaming X Trio variant) engage in a head-to-head duel. Both graphics cards are equally fast depending on the scenario, but one or the other has the edge now and then. However, gaming performance is what counts in the end, which we will address in one of the next sections.
The performance difference compared to the older AMD Radeon RX 5700 XT is clear. The new AMD Radeon RX 6700 XT is almost 30% to 40% faster. However, the performance difference to the AMD Radeon RX 6800 XT is disproportionately larger. In its defense, however, it has to be said that 1440p gaming is the primary focus with the AMD Radeon RX 6700 XT, while the Radeon RX 6800 XT is advertised for 4K gaming.
| Unigine Superposition | |
| 1280x720 720p Low | |
| Titan RTX | |
| Radeon RX 6800 XT | |
| AMD Radeon RX 6700 XT | |
| GeForce RTX 3070 | |
| GeForce RTX 3080 | |
| 1920x1080 1080p High | |
| Radeon RX 6800 XT | |
| GeForce RTX 3080 | |
| Titan RTX | |
| GeForce RTX 3070 | |
| AMD Radeon RX 6700 XT | |
| 1920x1080 1080p Extreme | |
| GeForce RTX 3080 | |
| Radeon RX 6800 XT | |
| Titan RTX | |
| GeForce RTX 3070 | |
| AMD Radeon RX 6700 XT | |
| 3840x2160 4k Optimized | |
| GeForce RTX 3080 | |
| Radeon RX 6800 XT | |
| Titan RTX | |
| GeForce RTX 3070 | |
| AMD Radeon RX 6700 XT | |
| 7680x4320 8k Optimized | |
| GeForce RTX 3080 | |
| Titan RTX | |
| Radeon RX 6800 XT | |
| GeForce RTX 3070 | |
| AMD Radeon RX 6700 XT | |
| Unigine Valley 1.0 | |
| 1920x1080 Extreme HD DirectX AA:x8 | |
| Radeon RX 6800 XT | |
| Titan RTX | |
| GeForce RTX 3080 | |
| GeForce RTX 2080 Ti (Desktop) | |
| GeForce RTX 3070 | |
| AMD Radeon RX 6700 XT | |
| GeForce RTX 2080 Super (Desktop) | |
| GeForce RTX 2070 Super (Desktop) | |
| GeForce RTX 2060 Super (Desktop) | |
| Radeon RX 5700 XT (Desktop) | |
| Radeon RX 5700 (Desktop) | |
| 1920x1080 Extreme HD Preset OpenGL AA:x8 | |
| GeForce RTX 3080 | |
| Titan RTX | |
| Radeon RX 6800 XT | |
| GeForce RTX 2080 Ti (Desktop) | |
| GeForce RTX 3070 | |
| GeForce RTX 2080 Super (Desktop) | |
| AMD Radeon RX 6700 XT | |
| GeForce RTX 2070 Super (Desktop) | |
| GeForce RTX 2060 Super (Desktop) | |
| Radeon RX 5700 XT (Desktop) | |
| Radeon RX 5700 (Desktop) | |
| SiSoft Sandra 2016 | |
| GP Financial Analysis (FP High/Double Precision) | |
| Radeon RX 6800 XT | |
| AMD Radeon RX 6700 XT | |
| GeForce RTX 3080 | |
| GeForce RTX 2080 Ti (Desktop) | |
| GeForce RTX 2080 Super (Desktop) | |
| GeForce RTX 3070 | |
| GeForce RTX 2070 Super (Desktop) | |
| GeForce RTX 2060 Super (Desktop) | |
| Radeon RX 5700 XT (Desktop) | |
| Radeon RX 5700 (Desktop) | |
| GP Cryptography (Higher Security AES256+SHA2-512) | |
| GeForce RTX 3080 | |
| Radeon RX 6800 XT | |
| GeForce RTX 2080 Ti (Desktop) | |
| GeForce RTX 3070 | |
| AMD Radeon RX 6700 XT | |
| GeForce RTX 2080 Super (Desktop) | |
| GeForce RTX 2070 Super (Desktop) | |
| GeForce RTX 2060 Super (Desktop) | |
| Image Processing | |
| Radeon RX 6800 XT | |
| AMD Radeon RX 6700 XT | |
| GeForce RTX 3080 | |
| GeForce RTX 3070 | |
| GeForce RTX 2080 Ti (Desktop) | |
| GeForce RTX 2080 Super (Desktop) | |
| GeForce RTX 2070 Super (Desktop) | |
| GeForce RTX 2060 Super (Desktop) | |
| Radeon RX 5700 XT (Desktop) | |
| Radeon RX 5700 (Desktop) | |
| 3DMark 05 Standard | 55070 points | |
| 3DMark 06 Standard Score | 47299 points | |
| 3DMark 11 Performance | 34078 points | |
| 3DMark Ice Storm Standard Score | 236324 points | |
| 3DMark Cloud Gate Standard Score | 70039 points | |
| 3DMark Fire Strike Score | 29656 points | |
| 3DMark Fire Strike Extreme Score | 16357 points | |
| 3DMark Time Spy Score | 11481 points | |
Help | ||
Game benchmarks
With the AMD Radeon RT 6700 XT, the manufacturer is primarily targeting gamers who predominantly play in 1440p. We can confirm this claim, and the numerous gaming tests showed that the AMD Radeon RX 6700 XT can still run titles at QHD resolution without being overtaxed. "Still" is the keyword here, because the AMD Radeon RX 5700 XT was also regarded as a 1440p gaming graphics card at the time of its release. If we take a closer look at the new Hitman 3, for example, we can see that the AMD Radeon RX 6700 XT already struggles quite a bit with an average of 52 FPS. Things don't look any better for our GPU when it comes to the popular building simulation Anno 1800. However, a significant performance improvement in the form of driver updates has often been seen in the past. Nevertheless, these two games present an extreme scenario that is not transferable to all tested games. Many games can even be experienced in 2160p with the new Radeon RX 6700 XT. As usual, AMD is ahead at times and Nvidia at others in the gaming tests. Therefore, if you want to buy a graphics card based on your favorite games, you should take a close look at the performance comparison beforehand.
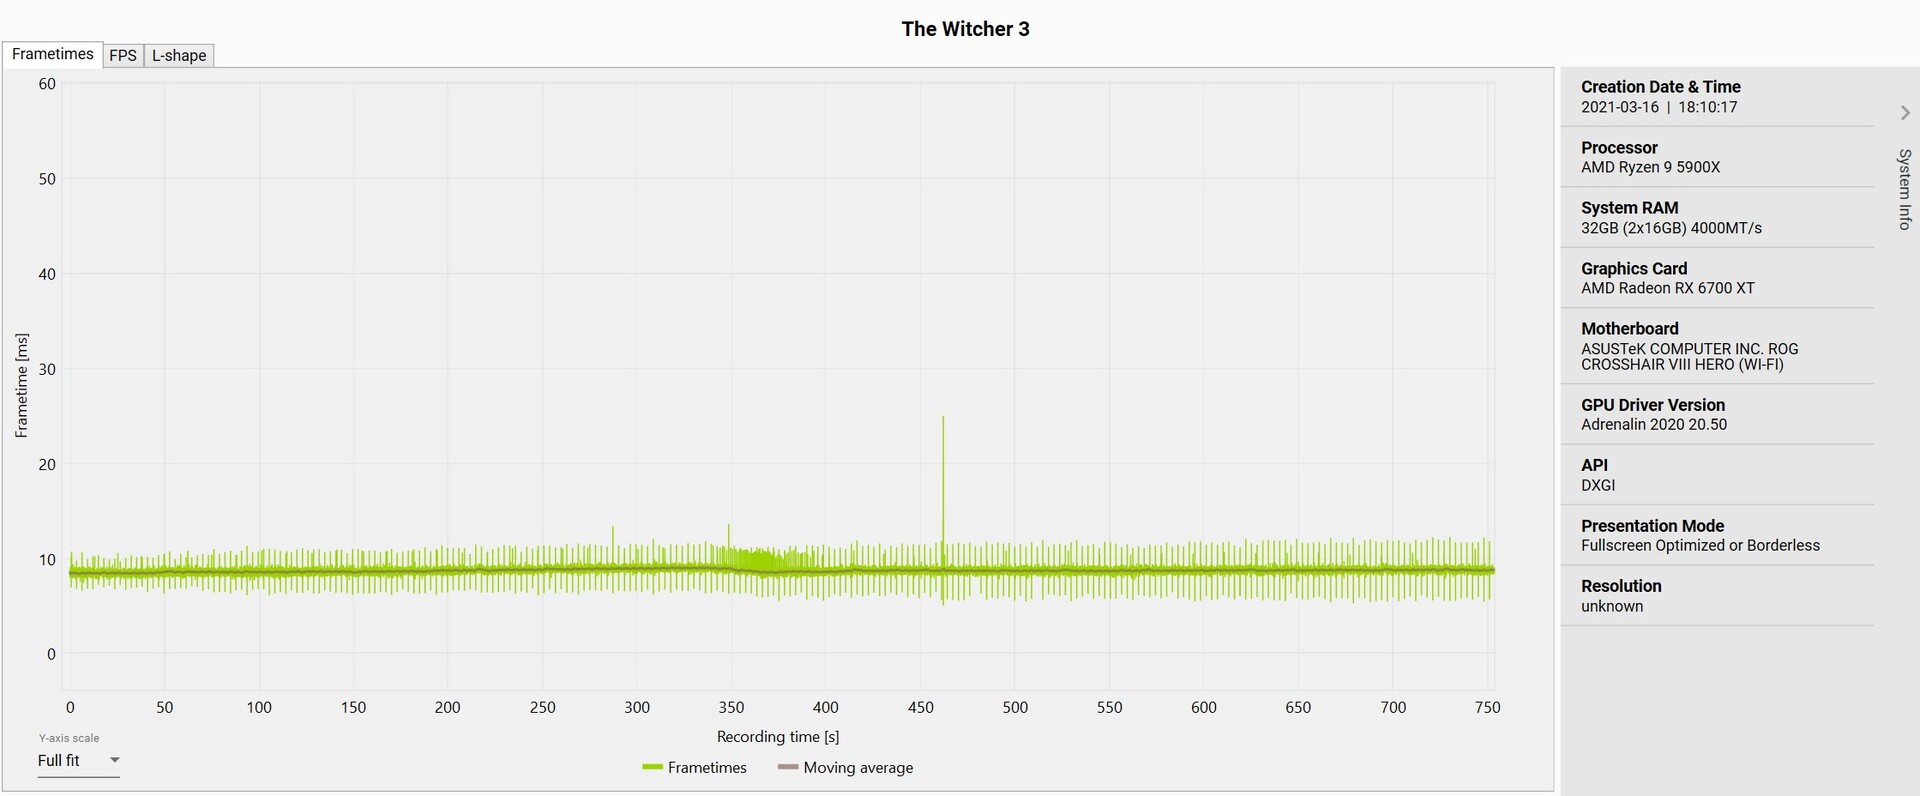
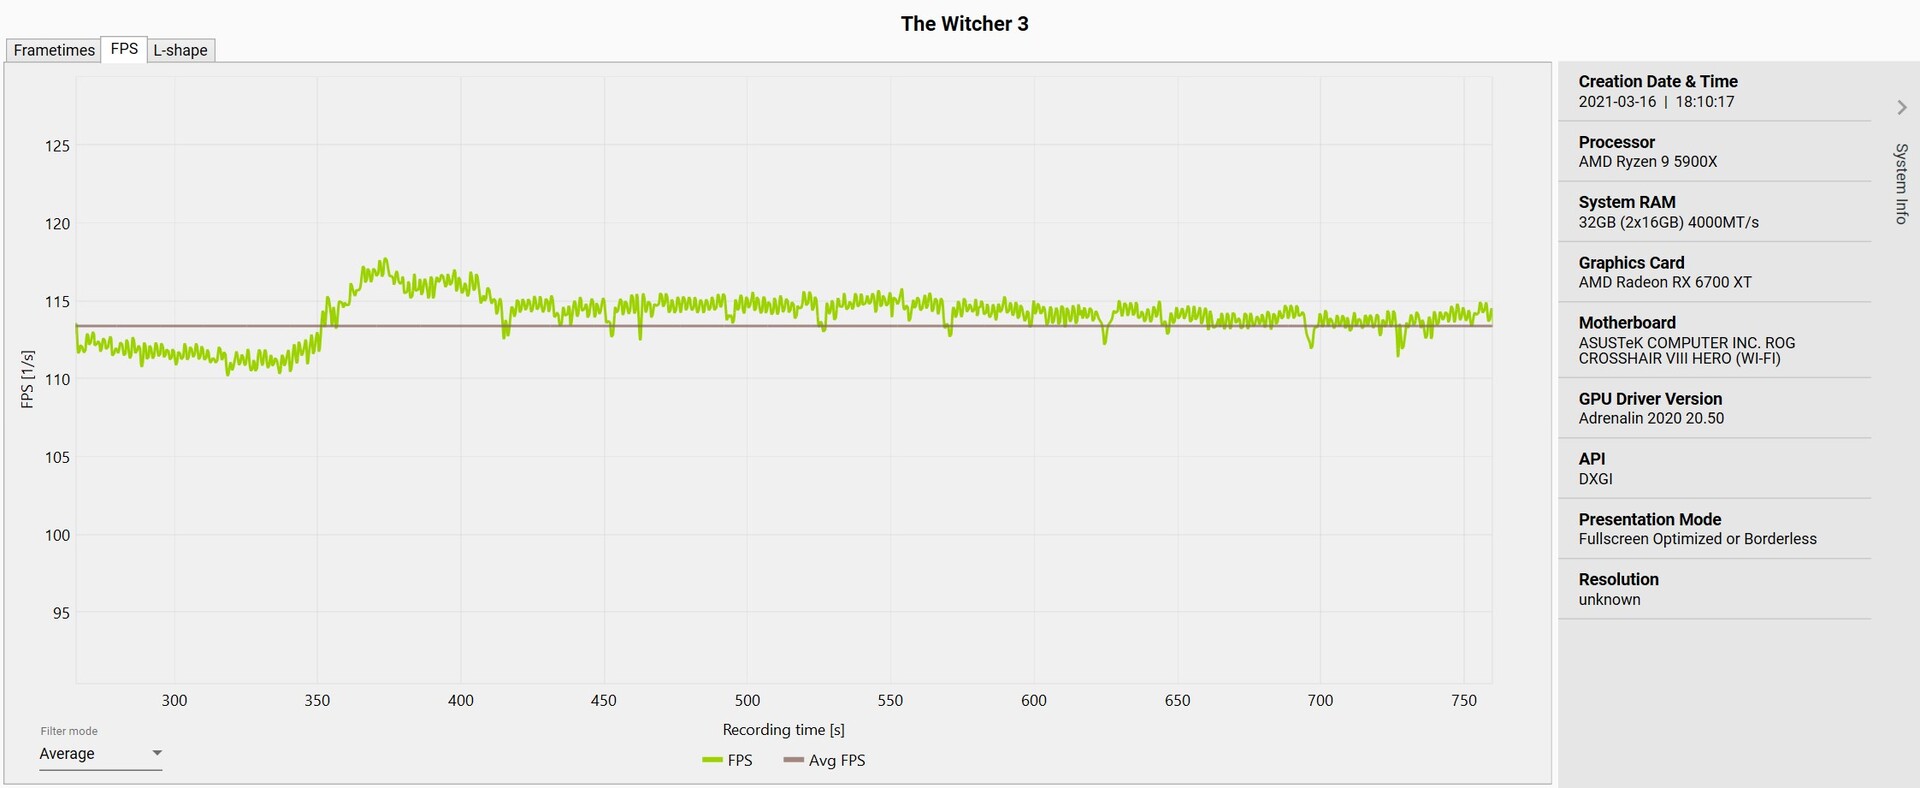
As always, we use the game The Witcher 3 (Ultra preset) to measure the frame times and frame rates. Apart from a single outlier, there are no irregularities here. The logged frame times are surprisingly constant and low in our sample. The performance curve of the frames per second registered is relatively stable over the course of the test. This means that there is no noticeable drop in performance during long gaming sessions.
| Crysis Remastered | |
| 1920x1080 Very High Preset AA:SM | |
| NVIDIA Titan RTX, AMD Ryzen 9 5900X | |
| AMD Radeon RX 6800 XT, AMD Ryzen 9 5950X | |
| AMD Radeon RX 6700 XT, AMD Ryzen 9 5900X | |
| 3840x2160 Very High Preset AA:SM | |
| AMD Radeon RX 6800 XT, AMD Ryzen 9 5950X | |
| NVIDIA Titan RTX, AMD Ryzen 9 5900X | |
| AMD Radeon RX 6700 XT, AMD Ryzen 9 5900X | |
| 2560x1440 Very High Preset AA:SM | |
| NVIDIA Titan RTX, AMD Ryzen 9 5900X | |
| AMD Radeon RX 6800 XT, AMD Ryzen 9 5950X | |
| AMD Radeon RX 6700 XT, AMD Ryzen 9 5900X | |
| 1280x720 Low Preset | |
| AMD Radeon RX 6800 XT, AMD Ryzen 9 5950X | |
| AMD Radeon RX 6700 XT, AMD Ryzen 9 5900X | |
| NVIDIA Titan RTX, AMD Ryzen 9 5900X | |
| 1920x1080 Medium Preset | |
| AMD Radeon RX 6800 XT, AMD Ryzen 9 5950X | |
| AMD Radeon RX 6700 XT, AMD Ryzen 9 5900X | |
| NVIDIA Titan RTX, AMD Ryzen 9 5900X | |
| Dirt 5 | |
| 1920x1080 Ultra High Preset | |
| AMD Radeon RX 6800 XT, AMD Ryzen 9 5950X | |
| AMD Radeon RX 6700 XT, AMD Ryzen 9 5900X | |
| NVIDIA Titan RTX, AMD Ryzen 9 5900X | |
| NVIDIA GeForce RTX 3070, AMD Ryzen 9 5900X | |
| 3840x2160 Ultra High Preset | |
| AMD Radeon RX 6800 XT, AMD Ryzen 9 5950X | |
| NVIDIA Titan RTX, AMD Ryzen 9 5900X | |
| AMD Radeon RX 6700 XT, AMD Ryzen 9 5900X | |
| NVIDIA GeForce RTX 3070, AMD Ryzen 9 5900X | |
| 2560x1440 Ultra High Preset | |
| AMD Radeon RX 6800 XT, AMD Ryzen 9 5950X | |
| AMD Radeon RX 6700 XT, AMD Ryzen 9 5900X | |
| NVIDIA Titan RTX, AMD Ryzen 9 5900X | |
| NVIDIA GeForce RTX 3070, AMD Ryzen 9 5900X | |
| 1280x720 Ultra Low Preset | |
| AMD Radeon RX 6800 XT, AMD Ryzen 9 5950X | |
| AMD Radeon RX 6700 XT, AMD Ryzen 9 5900X | |
| NVIDIA Titan RTX, AMD Ryzen 9 5900X | |
| NVIDIA GeForce RTX 3070, AMD Ryzen 9 5900X | |
| 1920x1080 Medium Preset | |
| AMD Radeon RX 6800 XT, AMD Ryzen 9 5950X | |
| AMD Radeon RX 6700 XT, AMD Ryzen 9 5900X | |
| NVIDIA Titan RTX, AMD Ryzen 9 5900X | |
| NVIDIA GeForce RTX 3070, AMD Ryzen 9 5900X | |
| Call of Duty Black Ops Cold War | |
| 1920x1080 Highest Settings | |
| NVIDIA Titan RTX, AMD Ryzen 9 5900X | |
| AMD Radeon RX 6800 XT, AMD Ryzen 9 5950X | |
| NVIDIA GeForce RTX 3070, AMD Ryzen 9 5900X | |
| AMD Radeon RX 6700 XT, AMD Ryzen 9 5900X | |
| 3840x2160 Highest Settings | |
| NVIDIA GeForce RTX 3070, AMD Ryzen 9 5900X | |
| AMD Radeon RX 6800 XT, AMD Ryzen 9 5950X | |
| NVIDIA Titan RTX, AMD Ryzen 9 5900X | |
| AMD Radeon RX 6700 XT, AMD Ryzen 9 5900X | |
| 2560x1440 Highest Settings | |
| NVIDIA GeForce RTX 3070, AMD Ryzen 9 5900X | |
| NVIDIA Titan RTX, AMD Ryzen 9 5900X | |
| AMD Radeon RX 6700 XT, AMD Ryzen 9 5900X | |
| AMD Radeon RX 6800 XT, AMD Ryzen 9 5950X | |
| 1280x720 Lowest Settings | |
| AMD Radeon RX 6800 XT, AMD Ryzen 9 5950X | |
| AMD Radeon RX 6700 XT, AMD Ryzen 9 5900X | |
| NVIDIA Titan RTX, AMD Ryzen 9 5900X | |
| NVIDIA GeForce RTX 3070, AMD Ryzen 9 5900X | |
| 1920x1080 Medium Settings | |
| AMD Radeon RX 6800 XT, AMD Ryzen 9 5950X | |
| NVIDIA Titan RTX, AMD Ryzen 9 5900X | |
| NVIDIA GeForce RTX 3070, AMD Ryzen 9 5900X | |
| AMD Radeon RX 6700 XT, AMD Ryzen 9 5900X | |
| Cyberpunk 2077 1.0 | |
| 1920x1080 Ultra Preset | |
| NVIDIA Titan RTX, AMD Ryzen 9 5900X | |
| AMD Radeon RX 6700 XT, AMD Ryzen 9 5900X | |
| 3840x2160 Ultra Preset | |
| NVIDIA Titan RTX, AMD Ryzen 9 5900X | |
| AMD Radeon RX 6700 XT, AMD Ryzen 9 5900X | |
| 2560x1440 Ultra Preset | |
| NVIDIA Titan RTX, AMD Ryzen 9 5900X | |
| AMD Radeon RX 6700 XT, AMD Ryzen 9 5900X | |
| 1280x720 Low Preset | |
| AMD Radeon RX 6700 XT, AMD Ryzen 9 5900X | |
| NVIDIA Titan RTX, AMD Ryzen 9 5900X | |
| 1920x1080 Medium Preset | |
| AMD Radeon RX 6700 XT, AMD Ryzen 9 5900X | |
| NVIDIA Titan RTX, AMD Ryzen 9 5900X | |
| F1 2020 | |
| 1920x1080 Ultra High Preset AA:T AF:16x | |
| AMD Radeon RX 6800 XT, AMD Ryzen 9 5950X | |
| AMD Radeon RX 6700 XT, AMD Ryzen 9 5900X | |
| NVIDIA GeForce RTX 3070, AMD Ryzen 9 5900X | |
| 3840x2160 Ultra High Preset AA:T AF:16x | |
| AMD Radeon RX 6800 XT, AMD Ryzen 9 5950X | |
| NVIDIA GeForce RTX 3070, AMD Ryzen 9 5900X | |
| AMD Radeon RX 6700 XT, AMD Ryzen 9 5900X | |
| 2560x1440 Ultra High Preset AA:T AF:16x | |
| AMD Radeon RX 6800 XT, AMD Ryzen 9 5950X | |
| NVIDIA GeForce RTX 3070, AMD Ryzen 9 5900X | |
| AMD Radeon RX 6700 XT, AMD Ryzen 9 5900X | |
| 1280x720 Ultra Low Preset | |
| AMD Radeon RX 6800 XT, AMD Ryzen 9 5950X | |
| AMD Radeon RX 6700 XT, AMD Ryzen 9 5900X | |
| NVIDIA GeForce RTX 3070, AMD Ryzen 9 5900X | |
| 1920x1080 Medium Preset AF:16x | |
| AMD Radeon RX 6800 XT, AMD Ryzen 9 5950X | |
| AMD Radeon RX 6700 XT, AMD Ryzen 9 5900X | |
| NVIDIA GeForce RTX 3070, AMD Ryzen 9 5900X | |
| Death Stranding | |
| 1920x1080 Very High Preset | |
| AMD Radeon RX 6800 XT, AMD Ryzen 9 5950X | |
| AMD Radeon RX 6700 XT, AMD Ryzen 9 5900X | |
| 3840x2160 Very High Preset | |
| AMD Radeon RX 6800 XT, AMD Ryzen 9 5950X | |
| AMD Radeon RX 6700 XT, AMD Ryzen 9 5900X | |
| 2560x1440 Very High Preset | |
| AMD Radeon RX 6800 XT, AMD Ryzen 9 5950X | |
| AMD Radeon RX 6700 XT, AMD Ryzen 9 5900X | |
| 1280x720 Low Preset | |
| AMD Radeon RX 6700 XT, AMD Ryzen 9 5900X | |
| AMD Radeon RX 6800 XT, AMD Ryzen 9 5950X | |
| 1920x1080 Medium Preset | |
| AMD Radeon RX 6800 XT, AMD Ryzen 9 5950X | |
| AMD Radeon RX 6700 XT, AMD Ryzen 9 5900X | |
| Mafia Definitive Edition | |
| 1920x1080 High Preset | |
| NVIDIA GeForce RTX 3070, AMD Ryzen 9 5900X | |
| AMD Radeon RX 6800 XT, AMD Ryzen 9 5950X | |
| AMD Radeon RX 6700 XT, AMD Ryzen 9 5900X | |
| 3840x2160 High Preset | |
| AMD Radeon RX 6800 XT, AMD Ryzen 9 5950X | |
| NVIDIA GeForce RTX 3070, AMD Ryzen 9 5900X | |
| AMD Radeon RX 6700 XT, AMD Ryzen 9 5900X | |
| 2560x1440 High Preset | |
| AMD Radeon RX 6800 XT, AMD Ryzen 9 5950X | |
| NVIDIA GeForce RTX 3070, AMD Ryzen 9 5900X | |
| AMD Radeon RX 6700 XT, AMD Ryzen 9 5900X | |
| 1280x720 Low Preset | |
| AMD Radeon RX 6700 XT, AMD Ryzen 9 5900X | |
| AMD Radeon RX 6800 XT, AMD Ryzen 9 5950X | |
| NVIDIA GeForce RTX 3070, AMD Ryzen 9 5900X | |
| 1920x1080 Medium Preset | |
| AMD Radeon RX 6800 XT, AMD Ryzen 9 5950X | |
| NVIDIA GeForce RTX 3070, AMD Ryzen 9 5900X | |
| AMD Radeon RX 6700 XT, AMD Ryzen 9 5900X | |
| Watch Dogs Legion | |
| 1920x1080 Ultra Preset (DX12) | |
| AMD Radeon RX 6800 XT, AMD Ryzen 9 5950X | |
| AMD Radeon RX 6700 XT, AMD Ryzen 9 5900X | |
| NVIDIA GeForce RTX 3070, AMD Ryzen 9 5900X | |
| 3840x2160 Ultra Preset (DX12) | |
| AMD Radeon RX 6800 XT, AMD Ryzen 9 5950X | |
| NVIDIA GeForce RTX 3070, AMD Ryzen 9 5900X | |
| AMD Radeon RX 6700 XT, AMD Ryzen 9 5900X | |
| 2560x1440 Ultra Preset (DX12) | |
| AMD Radeon RX 6800 XT, AMD Ryzen 9 5950X | |
| NVIDIA GeForce RTX 3070, AMD Ryzen 9 5900X | |
| AMD Radeon RX 6700 XT, AMD Ryzen 9 5900X | |
| 1280x720 Low Preset (DX12) | |
| AMD Radeon RX 6700 XT, AMD Ryzen 9 5900X | |
| AMD Radeon RX 6800 XT, AMD Ryzen 9 5950X | |
| NVIDIA GeForce RTX 3070, AMD Ryzen 9 5900X | |
| 1920x1080 Medium Preset (DX12) | |
| AMD Radeon RX 6800 XT, AMD Ryzen 9 5950X | |
| NVIDIA GeForce RTX 3070, AMD Ryzen 9 5900X | |
| Horizon Zero Dawn | |
| 1920x1080 Ultimate Quality | |
| AMD Radeon RX 6800 XT, AMD Ryzen 9 5950X | |
| NVIDIA GeForce RTX 3070, AMD Ryzen 9 5900X | |
| AMD Radeon RX 6700 XT, AMD Ryzen 9 5900X | |
| 3840x2160 Ultimate Quality | |
| AMD Radeon RX 6800 XT, AMD Ryzen 9 5950X | |
| NVIDIA GeForce RTX 3070, AMD Ryzen 9 5900X | |
| AMD Radeon RX 6700 XT, AMD Ryzen 9 5900X | |
| 2560x1440 Ultimate Quality | |
| AMD Radeon RX 6800 XT, AMD Ryzen 9 5950X | |
| NVIDIA GeForce RTX 3070, AMD Ryzen 9 5900X | |
| AMD Radeon RX 6700 XT, AMD Ryzen 9 5900X | |
| 1280x720 Favor Performance | |
| AMD Radeon RX 6800 XT, AMD Ryzen 9 5950X | |
| AMD Radeon RX 6700 XT, AMD Ryzen 9 5900X | |
| NVIDIA GeForce RTX 3070, AMD Ryzen 9 5900X | |
| 1920x1080 Original | |
| AMD Radeon RX 6800 XT, AMD Ryzen 9 5950X | |
| AMD Radeon RX 6700 XT, AMD Ryzen 9 5900X | |
| NVIDIA GeForce RTX 3070, AMD Ryzen 9 5900X | |
| Yakuza Like a Dragon | |
| 1920x1080 Ultra Preset | |
| AMD Radeon RX 6700 XT, AMD Ryzen 9 5900X | |
| AMD Radeon RX 6800 XT, AMD Ryzen 9 5950X | |
| NVIDIA Titan RTX, AMD Ryzen 9 5900X | |
| 3840x2160 Ultra Preset | |
| AMD Radeon RX 6800 XT, AMD Ryzen 9 5950X | |
| NVIDIA Titan RTX, AMD Ryzen 9 5900X | |
| AMD Radeon RX 6700 XT, AMD Ryzen 9 5900X | |
| 2560x1440 Ultra Preset | |
| AMD Radeon RX 6800 XT, AMD Ryzen 9 5950X | |
| NVIDIA Titan RTX, AMD Ryzen 9 5900X | |
| AMD Radeon RX 6700 XT, AMD Ryzen 9 5900X | |
| 1280x720 Lowest Preset | |
| AMD Radeon RX 6700 XT, AMD Ryzen 9 5900X | |
| AMD Radeon RX 6800 XT, AMD Ryzen 9 5950X | |
| NVIDIA Titan RTX, AMD Ryzen 9 5900X | |
| 1920x1080 Medium Preset | |
| AMD Radeon RX 6700 XT, AMD Ryzen 9 5900X | |
| AMD Radeon RX 6800 XT, AMD Ryzen 9 5950X | |
| NVIDIA Titan RTX, AMD Ryzen 9 5900X | |
| Star Wars Squadrons | |
| 1920x1080 Ultra Preset | |
| AMD Radeon RX 6800 XT, AMD Ryzen 9 5950X | |
| AMD Radeon RX 6700 XT, AMD Ryzen 9 5900X | |
| NVIDIA GeForce RTX 3070, AMD Ryzen 9 5900X | |
| 3840x2160 Ultra Preset | |
| AMD Radeon RX 6800 XT, AMD Ryzen 9 5950X | |
| NVIDIA GeForce RTX 3070, AMD Ryzen 9 5900X | |
| AMD Radeon RX 6700 XT, AMD Ryzen 9 5900X | |
| 2560x1440 Ultra Preset | |
| AMD Radeon RX 6800 XT, AMD Ryzen 9 5950X | |
| AMD Radeon RX 6700 XT, AMD Ryzen 9 5900X | |
| NVIDIA GeForce RTX 3070, AMD Ryzen 9 5900X | |
| 1280x720 Low Preset | |
| AMD Radeon RX 6800 XT, AMD Ryzen 9 5950X | |
| AMD Radeon RX 6700 XT, AMD Ryzen 9 5900X | |
| NVIDIA GeForce RTX 3070, AMD Ryzen 9 5900X | |
| 1920x1080 Medium Preset | |
| AMD Radeon RX 6800 XT, AMD Ryzen 9 5950X | |
| AMD Radeon RX 6700 XT, AMD Ryzen 9 5900X | |
| NVIDIA GeForce RTX 3070, AMD Ryzen 9 5900X | |
| low | med. | high | ultra | QHD | 4K | |
|---|---|---|---|---|---|---|
| GTA V (2015) | 186 | 184 | 179 | 115 | 96.8 | 96.5 |
| The Witcher 3 (2015) | 539 | 363 | 174 | 117 | 63 | |
| Dota 2 Reborn (2015) | 242 | 167.3 | 174.7 | 139.3 | 105.8 | |
| Rise of the Tomb Raider (2016) | 463 | 327 | 197 | 149 | 73 | |
| Final Fantasy XV Benchmark (2018) | 228 | 159 | 113 | 84.4 | 47.7 | |
| X-Plane 11.11 (2018) | 76.2 | 62.8 | 54.5 | 45.5 | ||
| Far Cry 5 (2018) | 179 | 156 | 149 | 139 | 125 | 70 |
| Strange Brigade (2018) | 637 | 334 | 271 | 230 | 167 | 91 |
| Shadow of the Tomb Raider (2018) | 226 | 178 | 170 | 150 | 102 | 54 |
| Far Cry New Dawn (2019) | 148 | 130 | 126 | 115 | 107 | 70 |
| Metro Exodus (2019) | 267 | 152 | 107 | 85.3 | 68.8 | 42.3 |
| The Division 2 (2019) | 271 | 195 | 157 | 117 | 81 | 43 |
| Anno 1800 (2019) | 125 | 122 | 87 | 45 | 40 | 29 |
| Control (2019) | 240 | 166 | 115 | 72 | 34 | |
| Borderlands 3 (2019) | 190 | 162 | 119 | 94.2 | 66.9 | 36.1 |
| F1 2020 (2020) | 482 | 337 | 276 | 190 | 142 | 83 |
| Death Stranding (2020) | 240 | 196 | 178 | 173 | 125 | 69 |
| Horizon Zero Dawn (2020) | 221 | 163 | 141 | 118 | 96 | 50 |
| Crysis Remastered (2020) | 317 | 208 | 112 | 88 | 67 | 38 |
| Mafia Definitive Edition (2020) | 168 | 124 | 112 | 81 | 43 | |
| Star Wars Squadrons (2020) | 622 | 448 | 404 | 372 | 247 | 126 |
| Watch Dogs Legion (2020) | 196 | 134 | 84.1 | 61.9 | 35.3 | |
| Dirt 5 (2020) | 257 | 157 | 133 | 114 | 89 | 57 |
| Assassin´s Creed Valhalla (2020) | 204 | 169 | 144 | 125 | 109 | 48 |
| Call of Duty Black Ops Cold War (2020) | 267 | 181 | 139 | 112 | 83 | 48 |
| Yakuza Like a Dragon (2020) | 150 | 138 | 136 | 135 | 83 | 42 |
| Immortals Fenyx Rising (2020) | 129 | 119 | 116 | 86 | 73 | 48 |
| Cyberpunk 2077 1.0 (2020) | 179 | 109 | 91 | 79 | 52 | 24 |
| Hitman 3 (2021) | 360 | 246 | 210 | 193 | 132 | 75 |
| Outriders (2021) | 197 | 175 | 152 | 140 | 99.7 | 49 |
| Resident Evil Village (2021) | 321 | 286 | 259 | 220 | 143 | 70.8 |
| Mass Effect Legendary Edition (2021) | 81.2 | 98.5 | 99.3 | 88.9 | ||
| Days Gone (2021) | 170 | 161 | 148 | 111 | ||
| Monster Hunter Stories 2 (2021) | 143 | 144 | 144 | 144 | 131 | |
| F1 2021 (2021) | 452 | 420 | 323 | 143 | 103 | 56.3 |
| Deathloop (2021) | 134 | 134 | 117 | 95.4 | 65.9 | 34.5 |
| New World (2021) | 130 | 105 | 102 | 95.8 | 78.4 | 39.6 |
| Alan Wake Remastered (2021) | 94 | 90.1 | 89.2 | 86.7 | ||
| Far Cry 6 (2021) | 138 | 124 | 112 | 102 | 88 | 50 |
| Back 4 Blood (2021) | 262 | 227 | 207 | 145 | 72 | |
| Guardians of the Galaxy (2021) | 138 | 134 | 133 | 131 | 99 | 55 |
| Riders Republic (2021) | 132 | 131 | 120 | 117 | 92 | 50 |
| Call of Duty Vanguard (2021) | 137 | 167 | 145 | 49.4 | 94 | |
| Forza Horizon 5 (2021) | 261 | 174 | 156 | 81 | 74 | 51 |
| Battlefield 2042 (2021) | 101 | 155 | 145 | 125 | 99.5 | 57 |
| Farming Simulator 22 (2021) | 292 | 225 | 189 | 170 | 157 | 99.2 |
| Halo Infinite (2021) | 133 | 108 | 103 | 69.4 | ||
| God of War (2022) | 134 | 132 | 111 | 76.4 | 61.7 | 39.5 |
| Rainbow Six Extraction (2022) | 282 | 237 | 225 | 182 | 116 | 55 |
| Dying Light 2 (2022) | 208 | 110 | 89.1 | 62.6 | 32.5 | |
| GRID Legends (2022) | 274 | 220 | 181 | 143 | 120 | 60 |
| Elden Ring (2022) | 60 | 60 | 60 | 60 | 60 | 50.5 |
| Cyberpunk 2077 1.6 (2022) | 79.4 | 79.2 | 78.5 | 76.9 | 53.7 | 23.1 |
| Elex 2 (2022) | 72.4 | 75.1 | 69.5 | 59 | 35 | |
| Ghostwire Tokyo (2022) | 195.4 | 184.2 | 185.6 | 182.7 | 119.3 | 53.4 |
| Tiny Tina's Wonderlands (2022) | 250 | 201 | 137.1 | 109 | 77 | 40.6 |
| Vampire Bloodhunt (2022) | 422 | 230 | 218 | 209 | 142.6 | 75.1 |
Compute performance
We already established that AMD was able to increase compute performance significantly with the RDNA 2 architecture in our review of the AMD Radeon RX 6800 XT. Compared to the AMD Radeon RX 5700 XT, the AMD Radeon RX 6700 XT also shows a significant improvement, although both graphics cards have the same number of computing cores. However, our test card can't hold its own against the competition from Nvidia. The GeForce RTX 3070 is faster in some cases.
| LuxMark v2.0 64Bit | |
| Room GPUs-only | |
| ASUS GeForce RTX 3080 ROG STRIX OC GAMING | |
| AMD Radeon RX 6800 XT | |
| Nvidia Titan RTX | |
| MSI RTX 2080 Ti Gaming X Trio | |
| MSI GeForce RTX 3070 Gaming X Trio | |
| AMD Radeon VII | |
| MSI RTX 2080 Gaming X Trio | |
| Nvidia GeForce RTX 2070 Super | |
| MSI RTX 2070 Gaming Z 8G | |
| AMD Radeon RX 6700 XT | |
| MSI RTX 2060 Gaming Z 6G | |
| AMD Radeon RX 5700 XT | |
| AMD Radeon RX 5700 | |
| Sala GPUs-only | |
| AMD Radeon RX 6800 XT | |
| AMD Radeon RX 6700 XT | |
| ASUS GeForce RTX 3080 ROG STRIX OC GAMING | |
| Nvidia Titan RTX | |
| MSI RTX 2080 Ti Gaming X Trio | |
| MSI GeForce RTX 3070 Gaming X Trio | |
| MSI RTX 2080 Gaming X Trio | |
| Nvidia GeForce RTX 2070 Super | |
| MSI RTX 2070 Gaming Z 8G | |
| AMD Radeon VII | |
| AMD Radeon RX 5700 XT | |
| MSI RTX 2060 Gaming Z 6G | |
| AMD Radeon RX 5700 | |
Emissions - Power consumption and noise
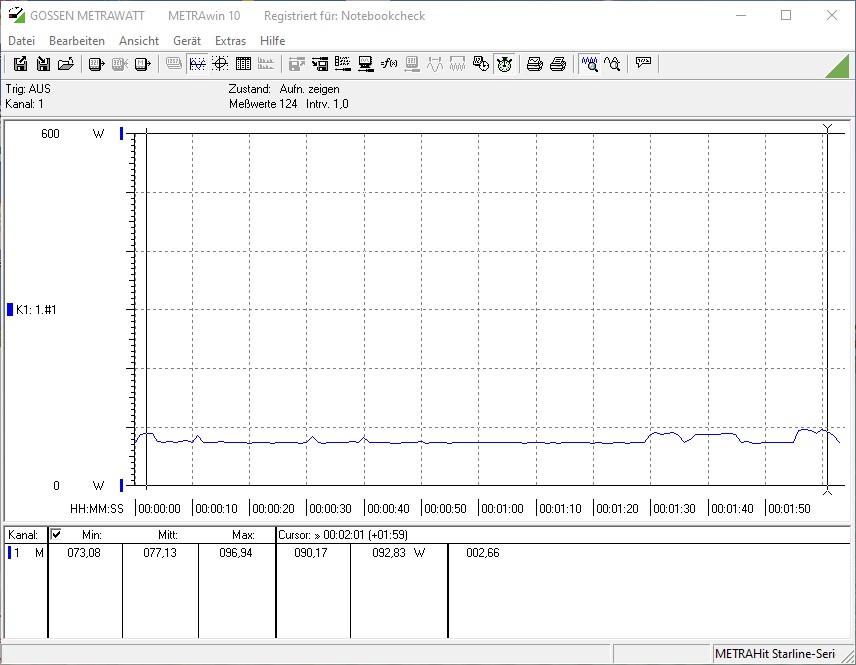
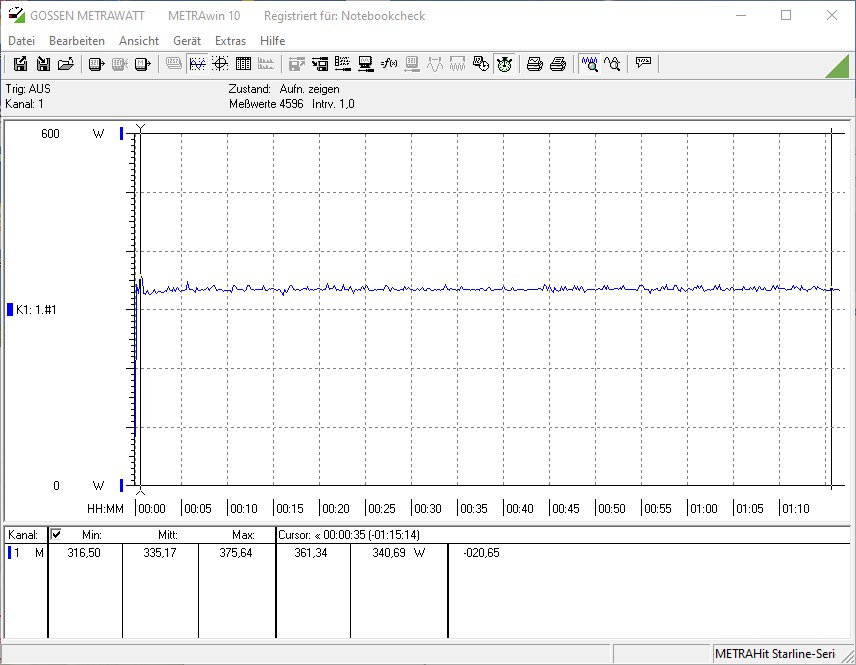
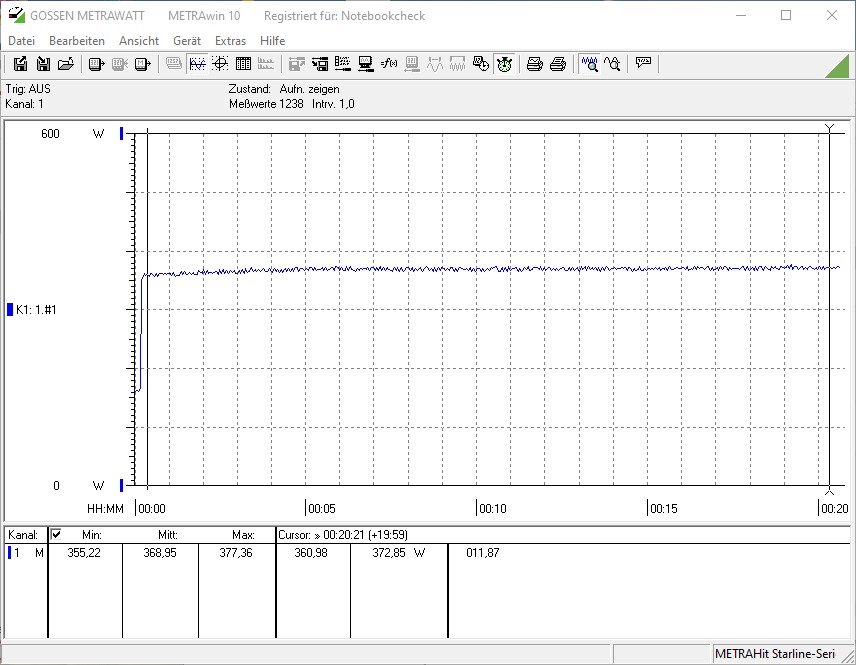
The AMD Radeon RX 6700 XT copes well with the 230 watts specified (TGP). In direct comparison to the AMD Radeon RX 5700 XT, our review sample is a bit more power hungry, even though the increase is kept within limits at about 20 watts. Compared to the Nvidia GeForce RTX 3070, the AMD Radeon RX 6700 XT is much more energy-efficient in our comparison. AMD's new mid-range GPU is a bit more frugal both when gaming and in the stress test.
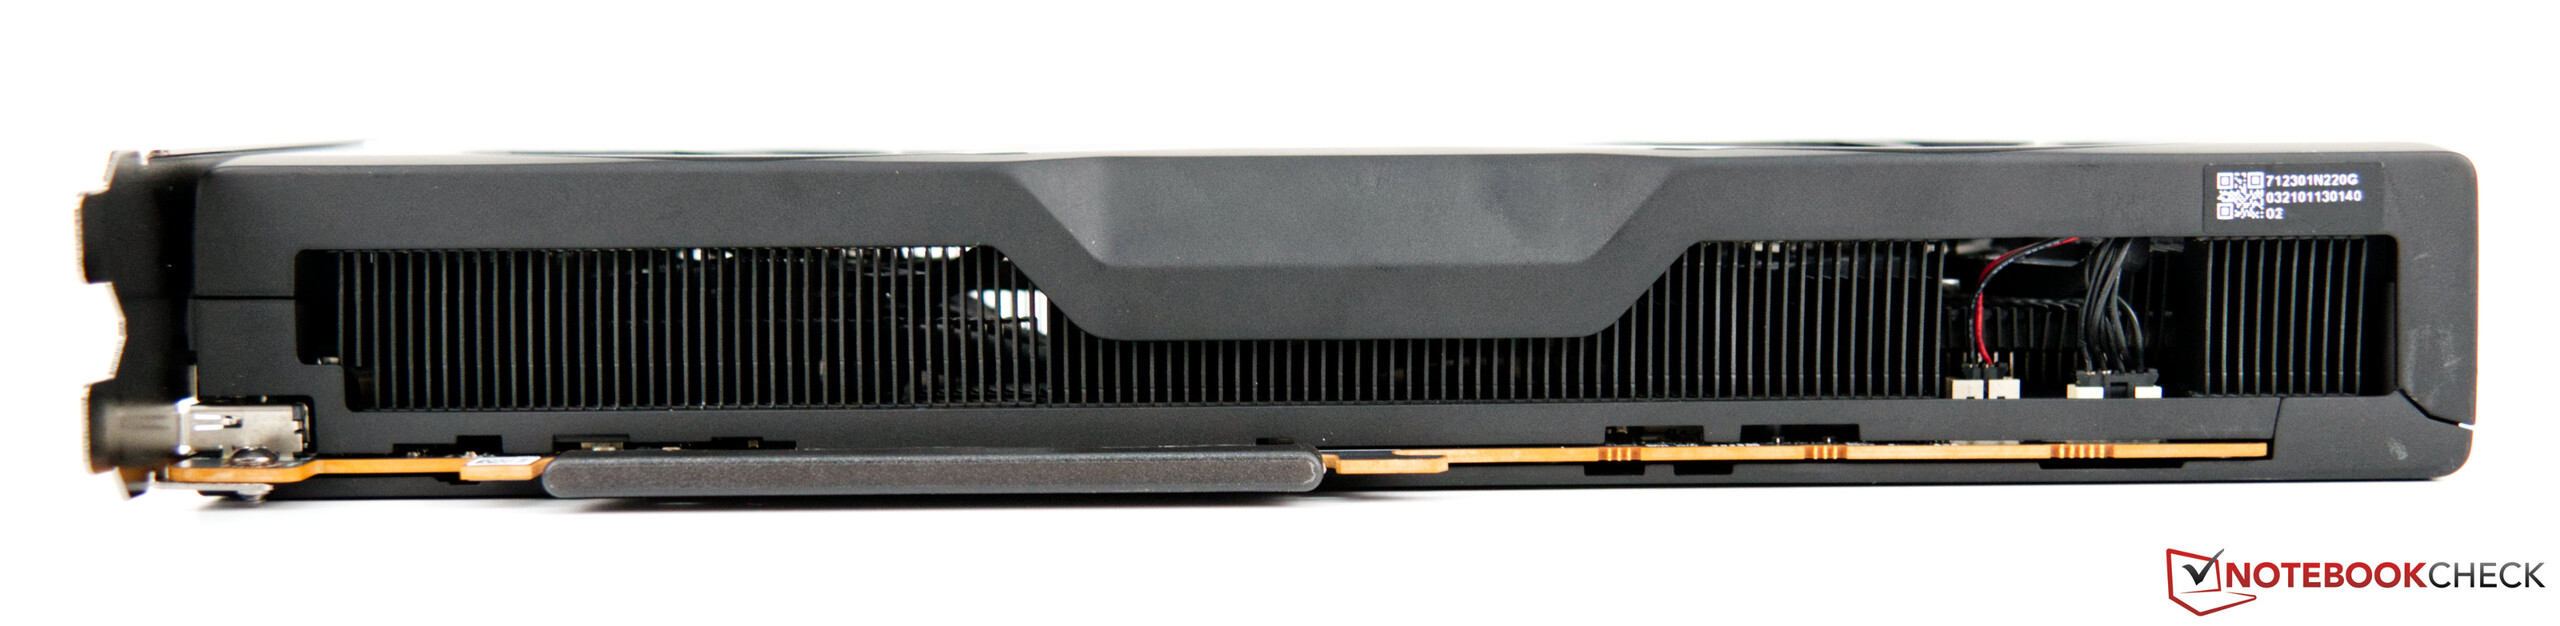
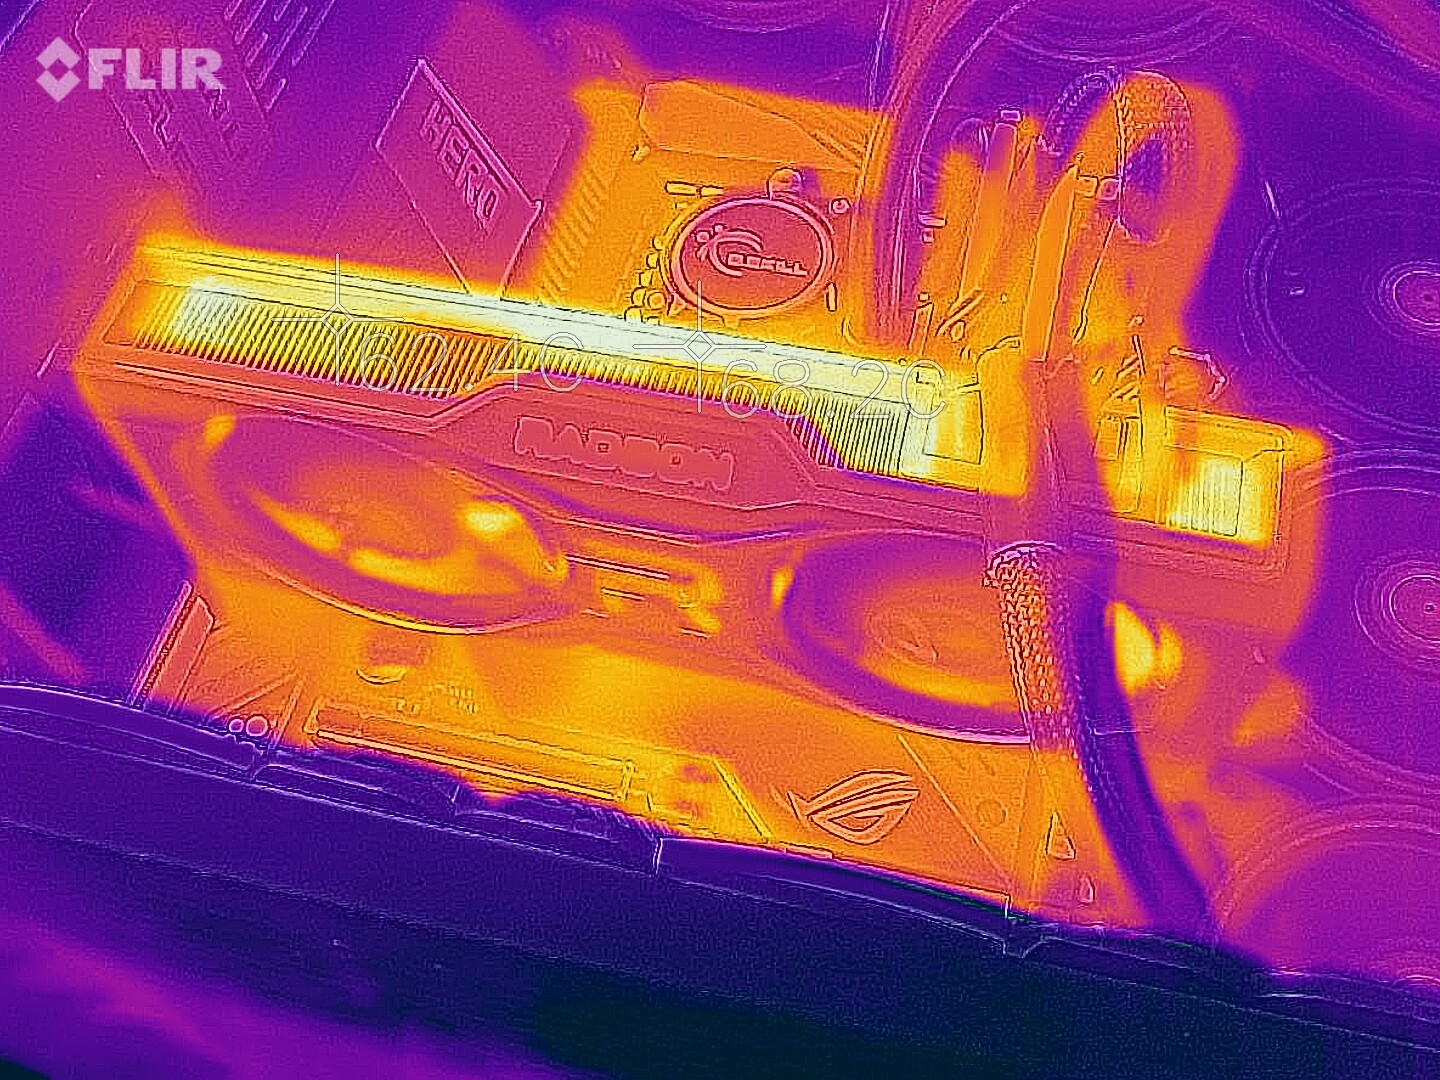
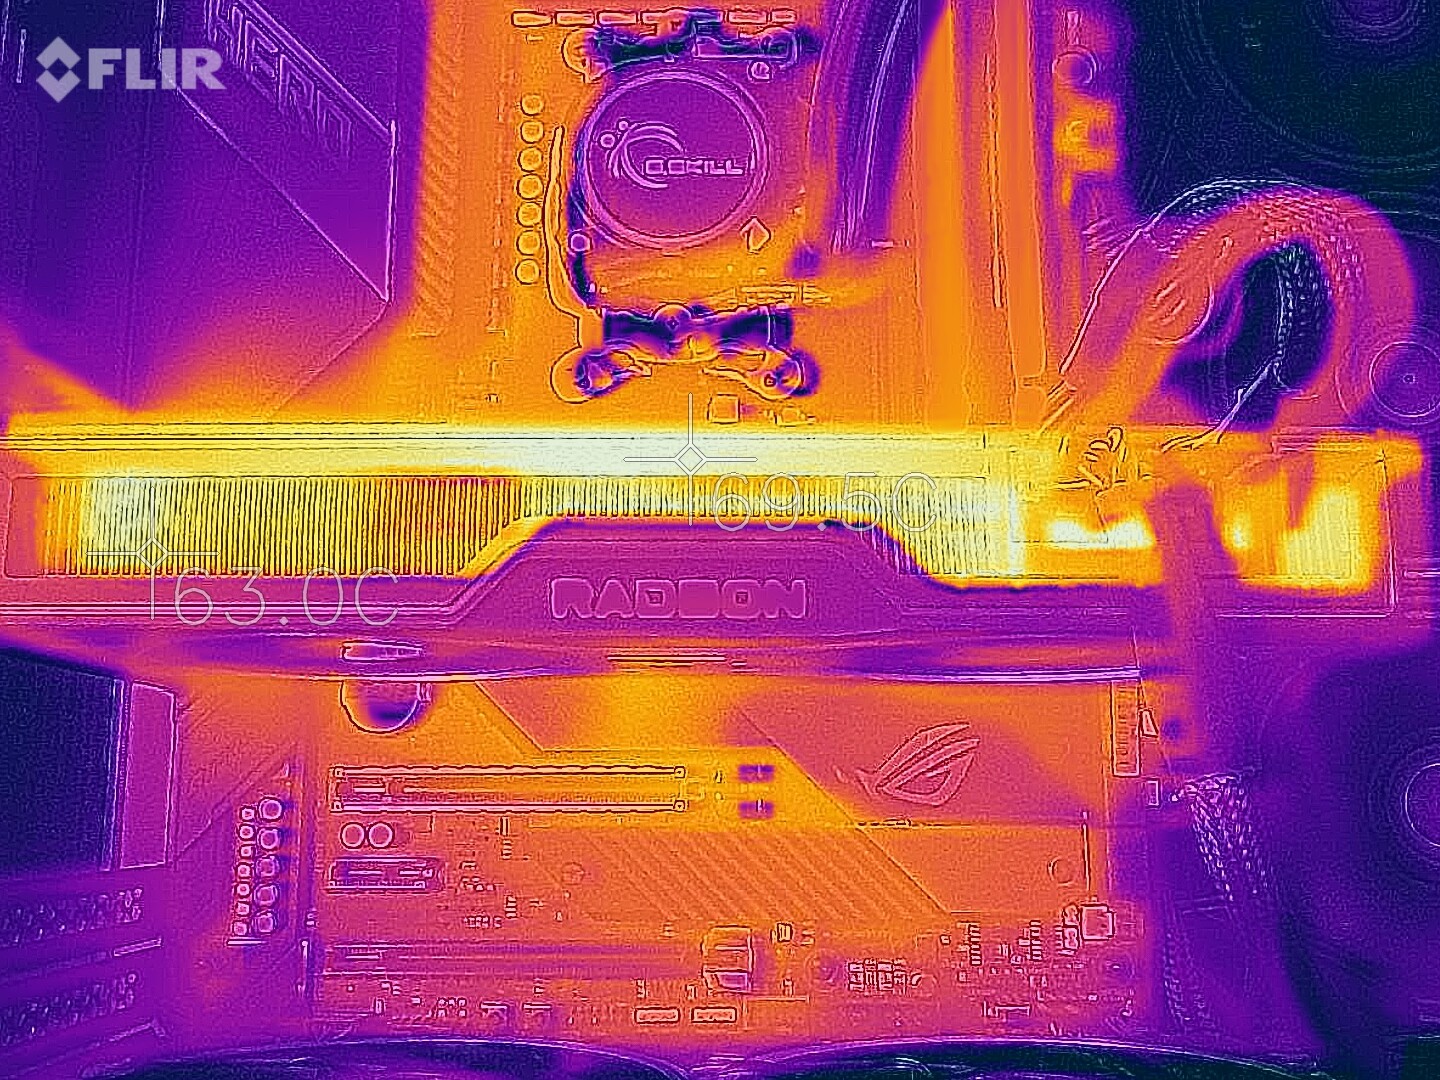
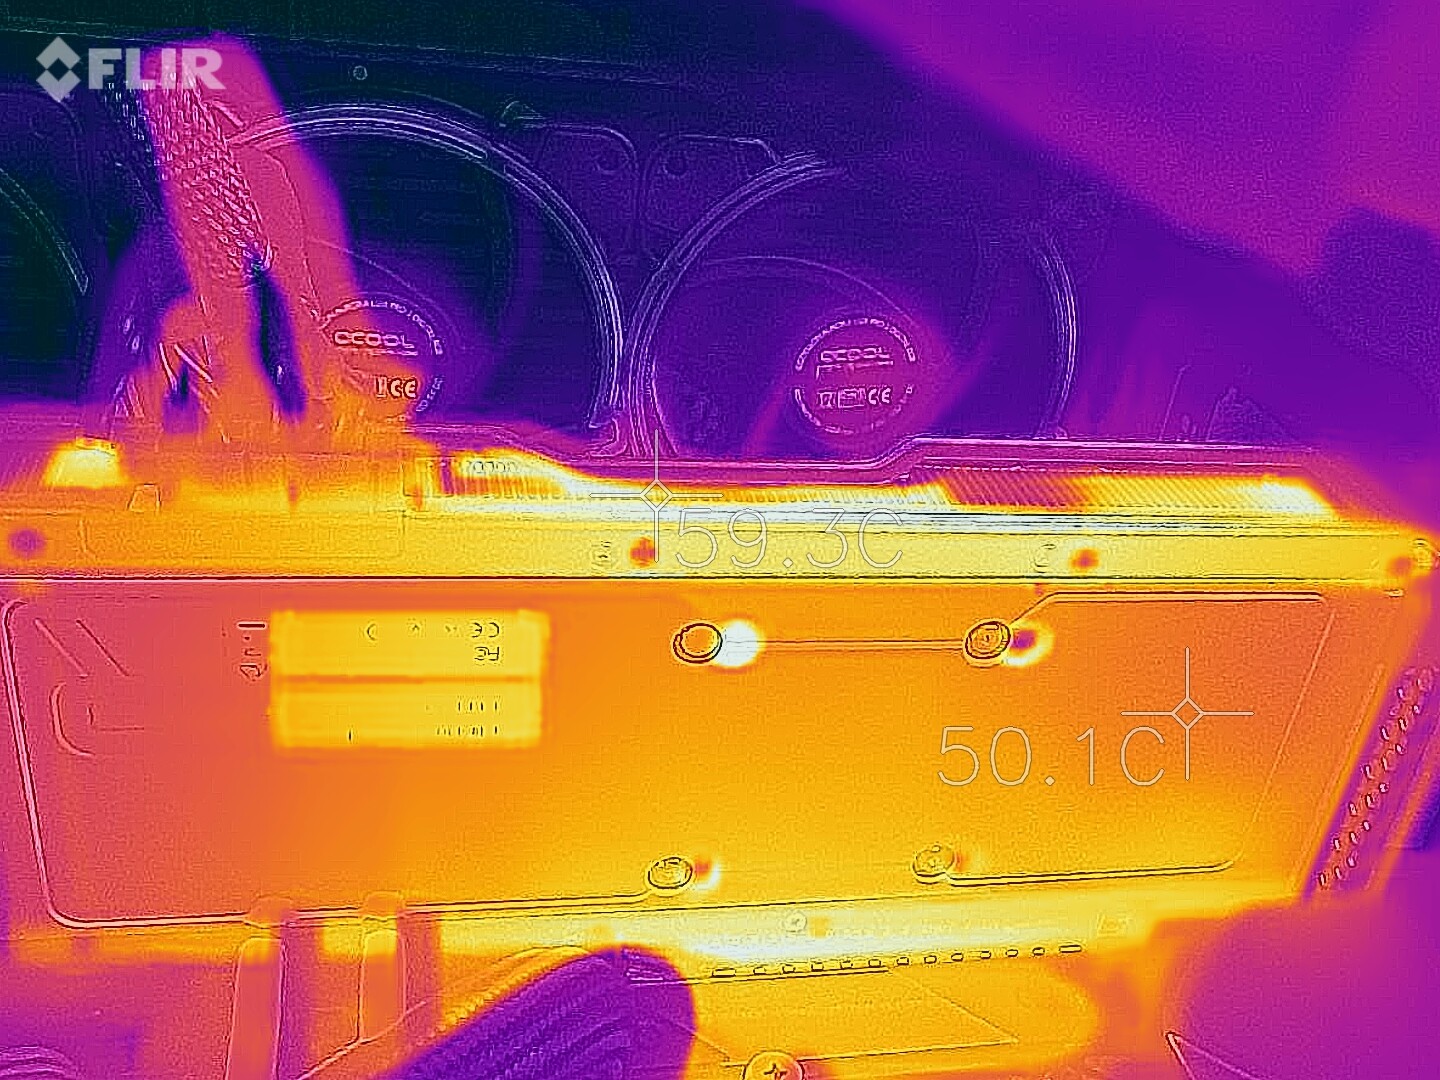
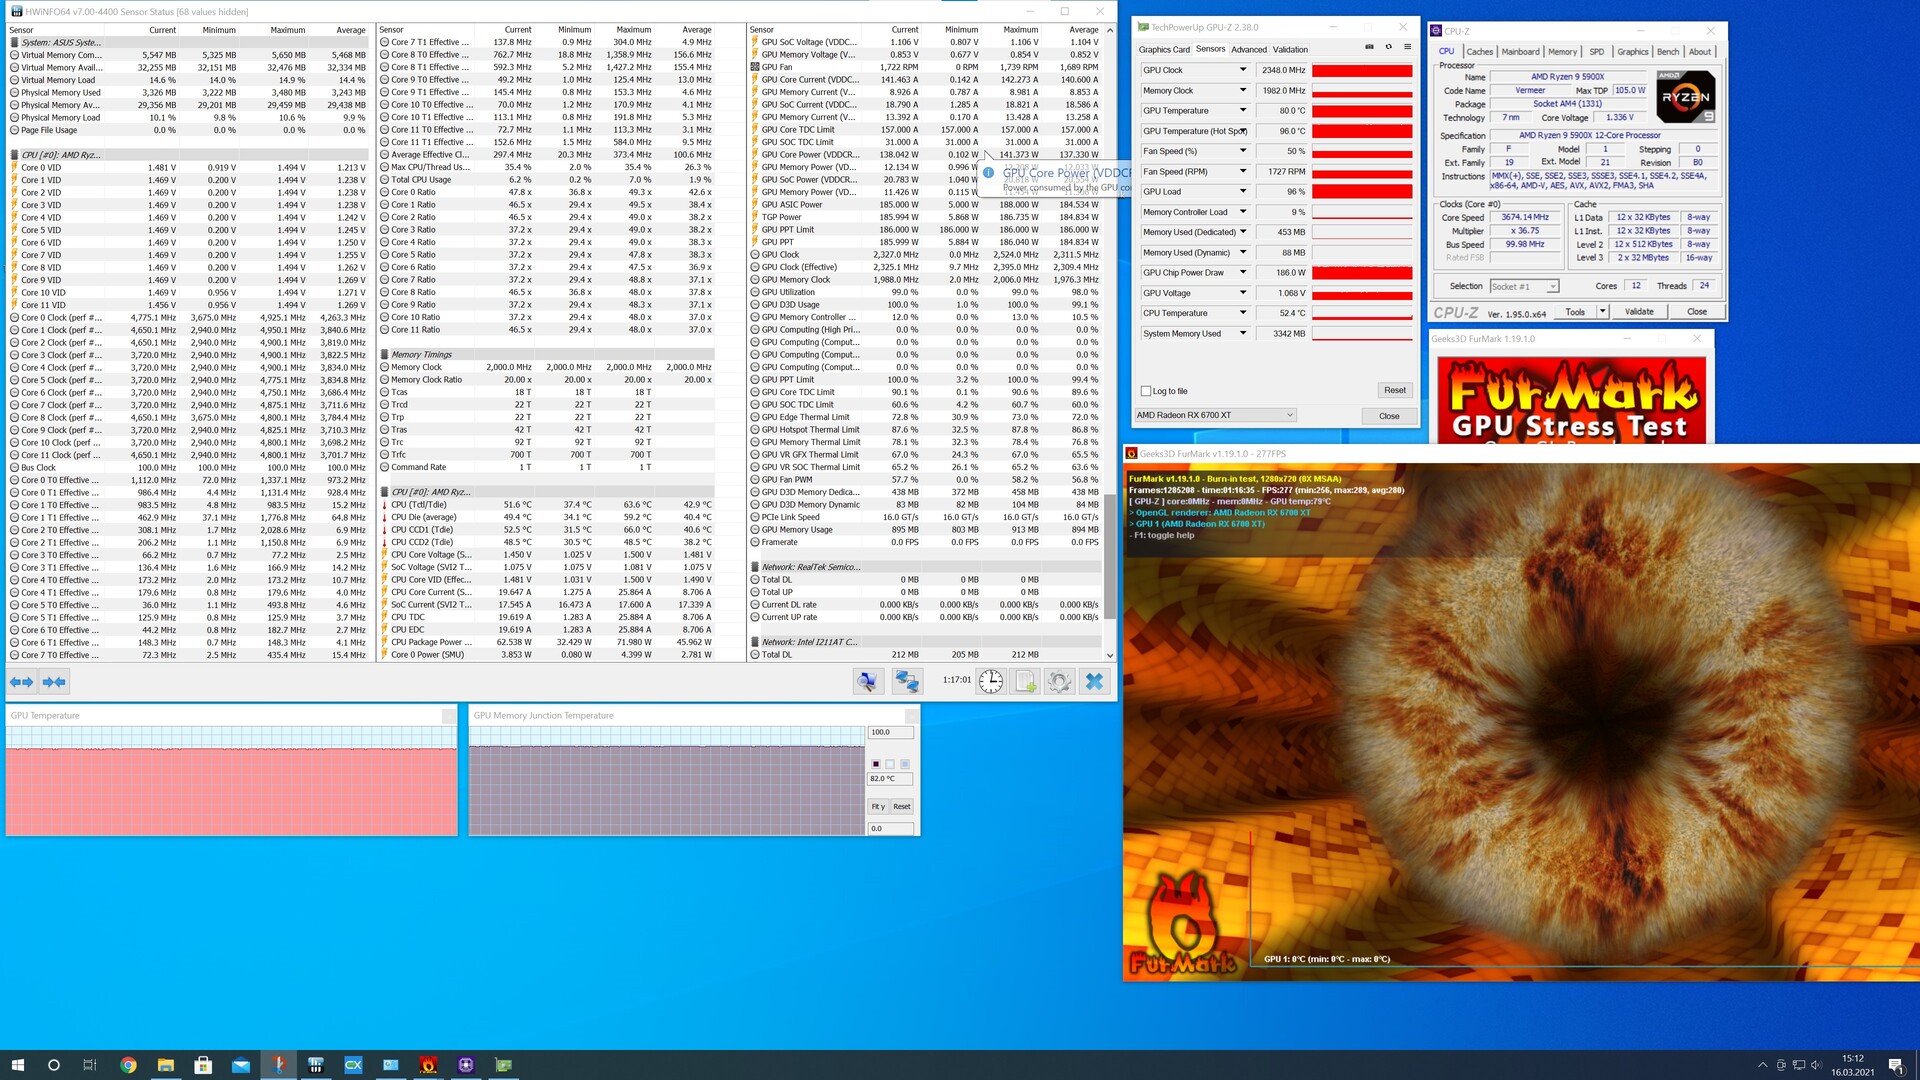
AMD relies on the design of the 6800 series for cooling. However, AMD only provides the RX 6700 XT with two axial fans that are very quiet. In 2D mode and under low load, they even stand still, which definitely suits users who are sensitive to noise. Nevertheless, the two 85-millimeter rotors never really rev up under load. Even during the stress test, GPU-Z displayed a good 1,700 revolutions per minute. With that, the graphics card wasn't audible outside of our test system. The case fans were louder in this scenario.
We were already able to see that the cooler does a good job when looking at the frame rates. This translates into just under 80 °C (~176 °F) for the GPU under load. Nevertheless, there's a hot spot temperature of 96 °C (~205 °F). AMD specifies a maximum hot spot temperature of 110 °C (~230 °F). The GPU is likely to slow down here.
Overall, the emission rates of the AMD Radeon RX 6700 XT are good, even though the gap to the maximum hot spot temperature is a bit narrow. It remains to be seen how the model performs on hot summer days.
| Power Consumption / The Witcher 3 ultra (external Monitor) | |
| ASUS GeForce RTX 3080 ROG STRIX OC GAMING (Idle: 88.3 W) | |
| KFA2 GeForce RTX 2080 Ti EX (Idle: 100.5 W) | |
| AMD Radeon RX Vega 64 (Idle: 74.3 W) | |
| MSI RTX 2080 Gaming X Trio (Idle: 87.78 W) | |
| MSI GeForce RTX 3070 Gaming X Trio (Idle: 95.1 W) | |
| Nvidia GeForce RTX 2080 Super (Idle: 78.87 W) | |
| AMD Radeon RX 6700 XT (Idle: 77.1 W) | |
| AMD Radeon RX 5700 XT (Idle: 69.8 W) | |
| Nvidia GeForce RTX 2070 Super (96.8 fps, Idle: 80.5 W) | |
| MSI RTX 2070 Gaming Z 8G (Idle: 73.3 W) | |
| AMD Radeon VII (Idle: 81.39 W) | |
| Nvidia GeForce RTX 2060 Super (82.7 fps, Idle: 77.12 W) | |
| AMD Radeon RX 5700 (84.2 fps, Idle: 64.5 W) | |
| MSI RTX 2060 Gaming Z 6G (Idle: 74.66 W) | |
| Power Consumption / FurMark 1.19 GPU Stress Test (external Monitor) | |
| ASUS GeForce RTX 3080 ROG STRIX OC GAMING (Idle: 88.3 W) | |
| AMD Radeon VII (Idle: 81.39 W) | |
| MSI RTX 2080 Gaming X Trio | |
| KFA2 GeForce RTX 2080 Ti EX (Idle: 100.5 W) | |
| MSI GeForce RTX 3070 Gaming X Trio (Idle: 95.1 W) | |
| Nvidia GeForce RTX 2080 Super (Idle: 78.87 W) | |
| MSI RTX 2070 Gaming Z 8G (Idle: 73.3 W) | |
| AMD Radeon RX 6700 XT (Idle: 77.1 W) | |
| AMD Radeon RX 5700 XT (239 fps, Idle: 69.8 W) | |
| Nvidia GeForce RTX 2070 Super (283 fps, Idle: 80.5 W) | |
| MSI RTX 2060 Gaming Z 6G (Idle: 74.66 W) | |
| Nvidia GeForce RTX 2060 Super (237 fps, Idle: 77.12 W) | |
| AMD Radeon RX 5700 (207 fps, Idle: 64.5 W) | |
* ... smaller is better
Pros
Cons
Verdict - Attractive 1440p graphics card

With the Radeon RX 6700 XT, AMD has launched a fast graphics card for 1440p gaming. All the latest games can be played smoothly in the native resolution without compromising on quality. However, the AMD Radeon RX 6700 XT is often outperformed by the Nvidia GeForce RTX 3070 in gaming tests. This is especially true when it comes to features like ray tracing. In addition, AMD still doesn't have an alternative to Nvidia's DLSS. Nevertheless, the graphics card is fast and equipped with 12 GB of VRAM, which is in line with modern standards. Meanwhile, Nvidia has also realized this and recently introduced the GeForce RTX 3060 with 12 GB of VRAM as well.
The new Radeon RX 6700 XT has it easy compared to its predecessor, the AMD Radeon RX 5700 XT. Performance could be improved significantly in all areas, even though both graphics cards are equipped with 2,560 shader units. The advantage of the RDNA 2 architecture can be seen clearly here, since the performance increase wasn't achieved through higher energy consumption. Both graphics cards consume somewhat the same in the test.
With the new AMD Radeon RX 6700 XT, the mid-range now gets a decent performance boost. No corners have been cut when it comes to VRAM, either, since the graphics card is very well equipped with 12 GB.
The next few days will have to show if the AMD Radeon RX 6700 XT is going to be a successful model, because everything depends on the availability of the new graphics card. The competing models (RTX 3070) are currently going for 1,000 Euros (~$1,198) and up. AMD has specified an MSRP of 479 Euros (~$574) for the AMD Radeon RX 6700 XT. It remains to be seen how much the model will really cost in the end. The only advantage that AMD has against Nvidia at the moment is better availability, because the latter doesn't have any alternative priced at just under 500 Euros (~$599) right now.
After Nvidia tried to make the GeForce RTX 3060 unattractive for miners by putting brakes on mining cryptocurrency, AMD should have perhaps also thought about such a step. After all, a short test showed that the Ethereum hash rate (about 45 MH/s) with the AMD Radeon RX 6700 XT is on par with an unthrottled GeForce RTX 3060. That's still a bit less than compared to the AMD Radeon RX 5700 XT, but it might still be interesting for miners.
Consequently, users who are planning a GPU upgrade should strike quickly before the prices of the AMD Radeon RX 6700 XT also reach utopian levels. A price drop below the MSRP will most likely not happen for a long time.
However, the AMD graphics card is also an interesting upgrade option if the system doesn't have a recent CPU. The keywords "driver overhead" should be mentioned here, because AMD graphics cards achieve higher FPS than their Nvidia counterparts in the CPU limit. This is a very positive side effect if you don't want to replace the entire system.

