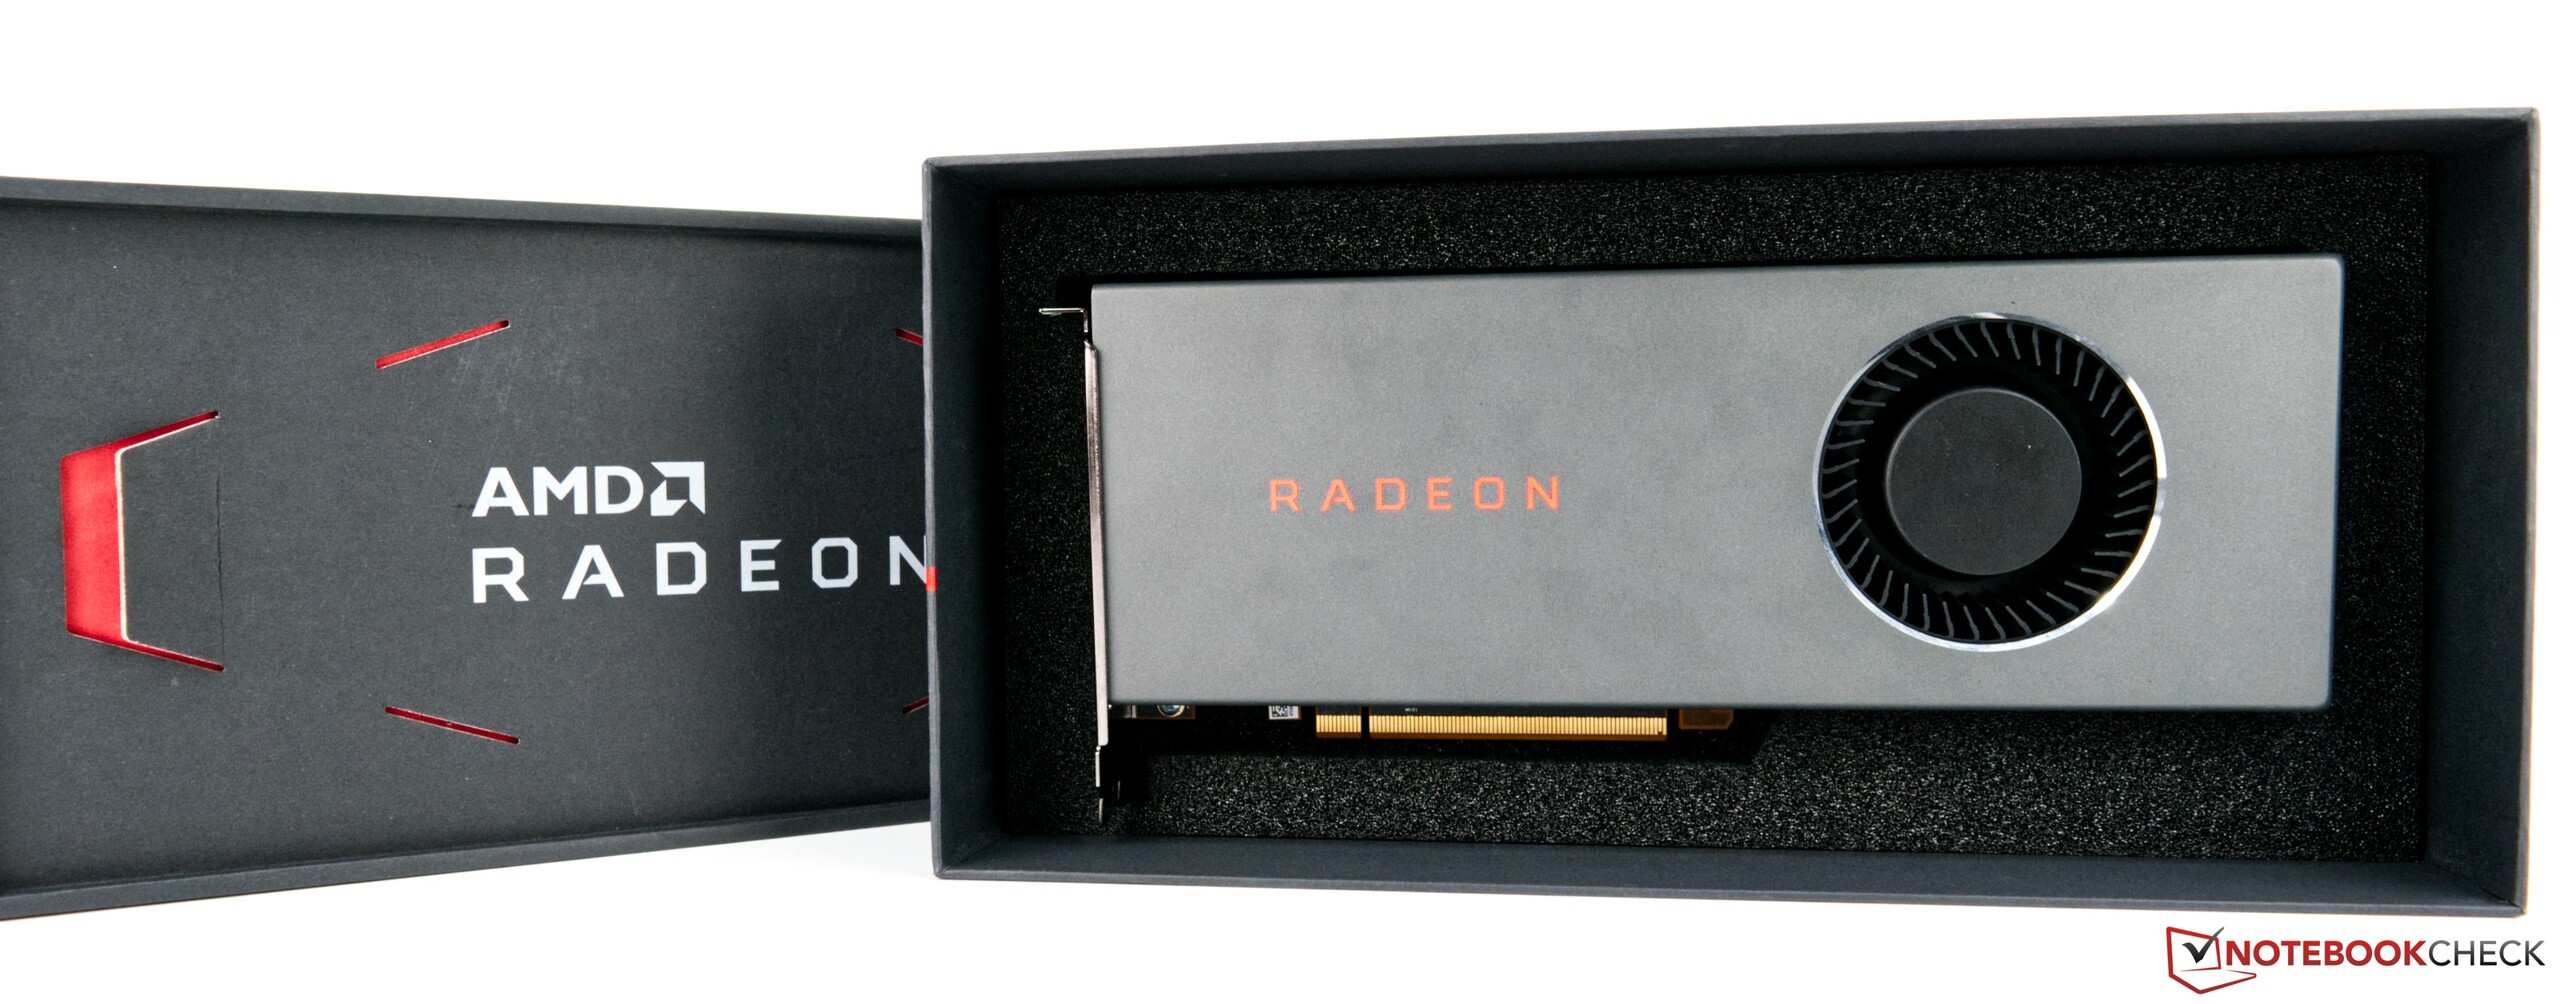
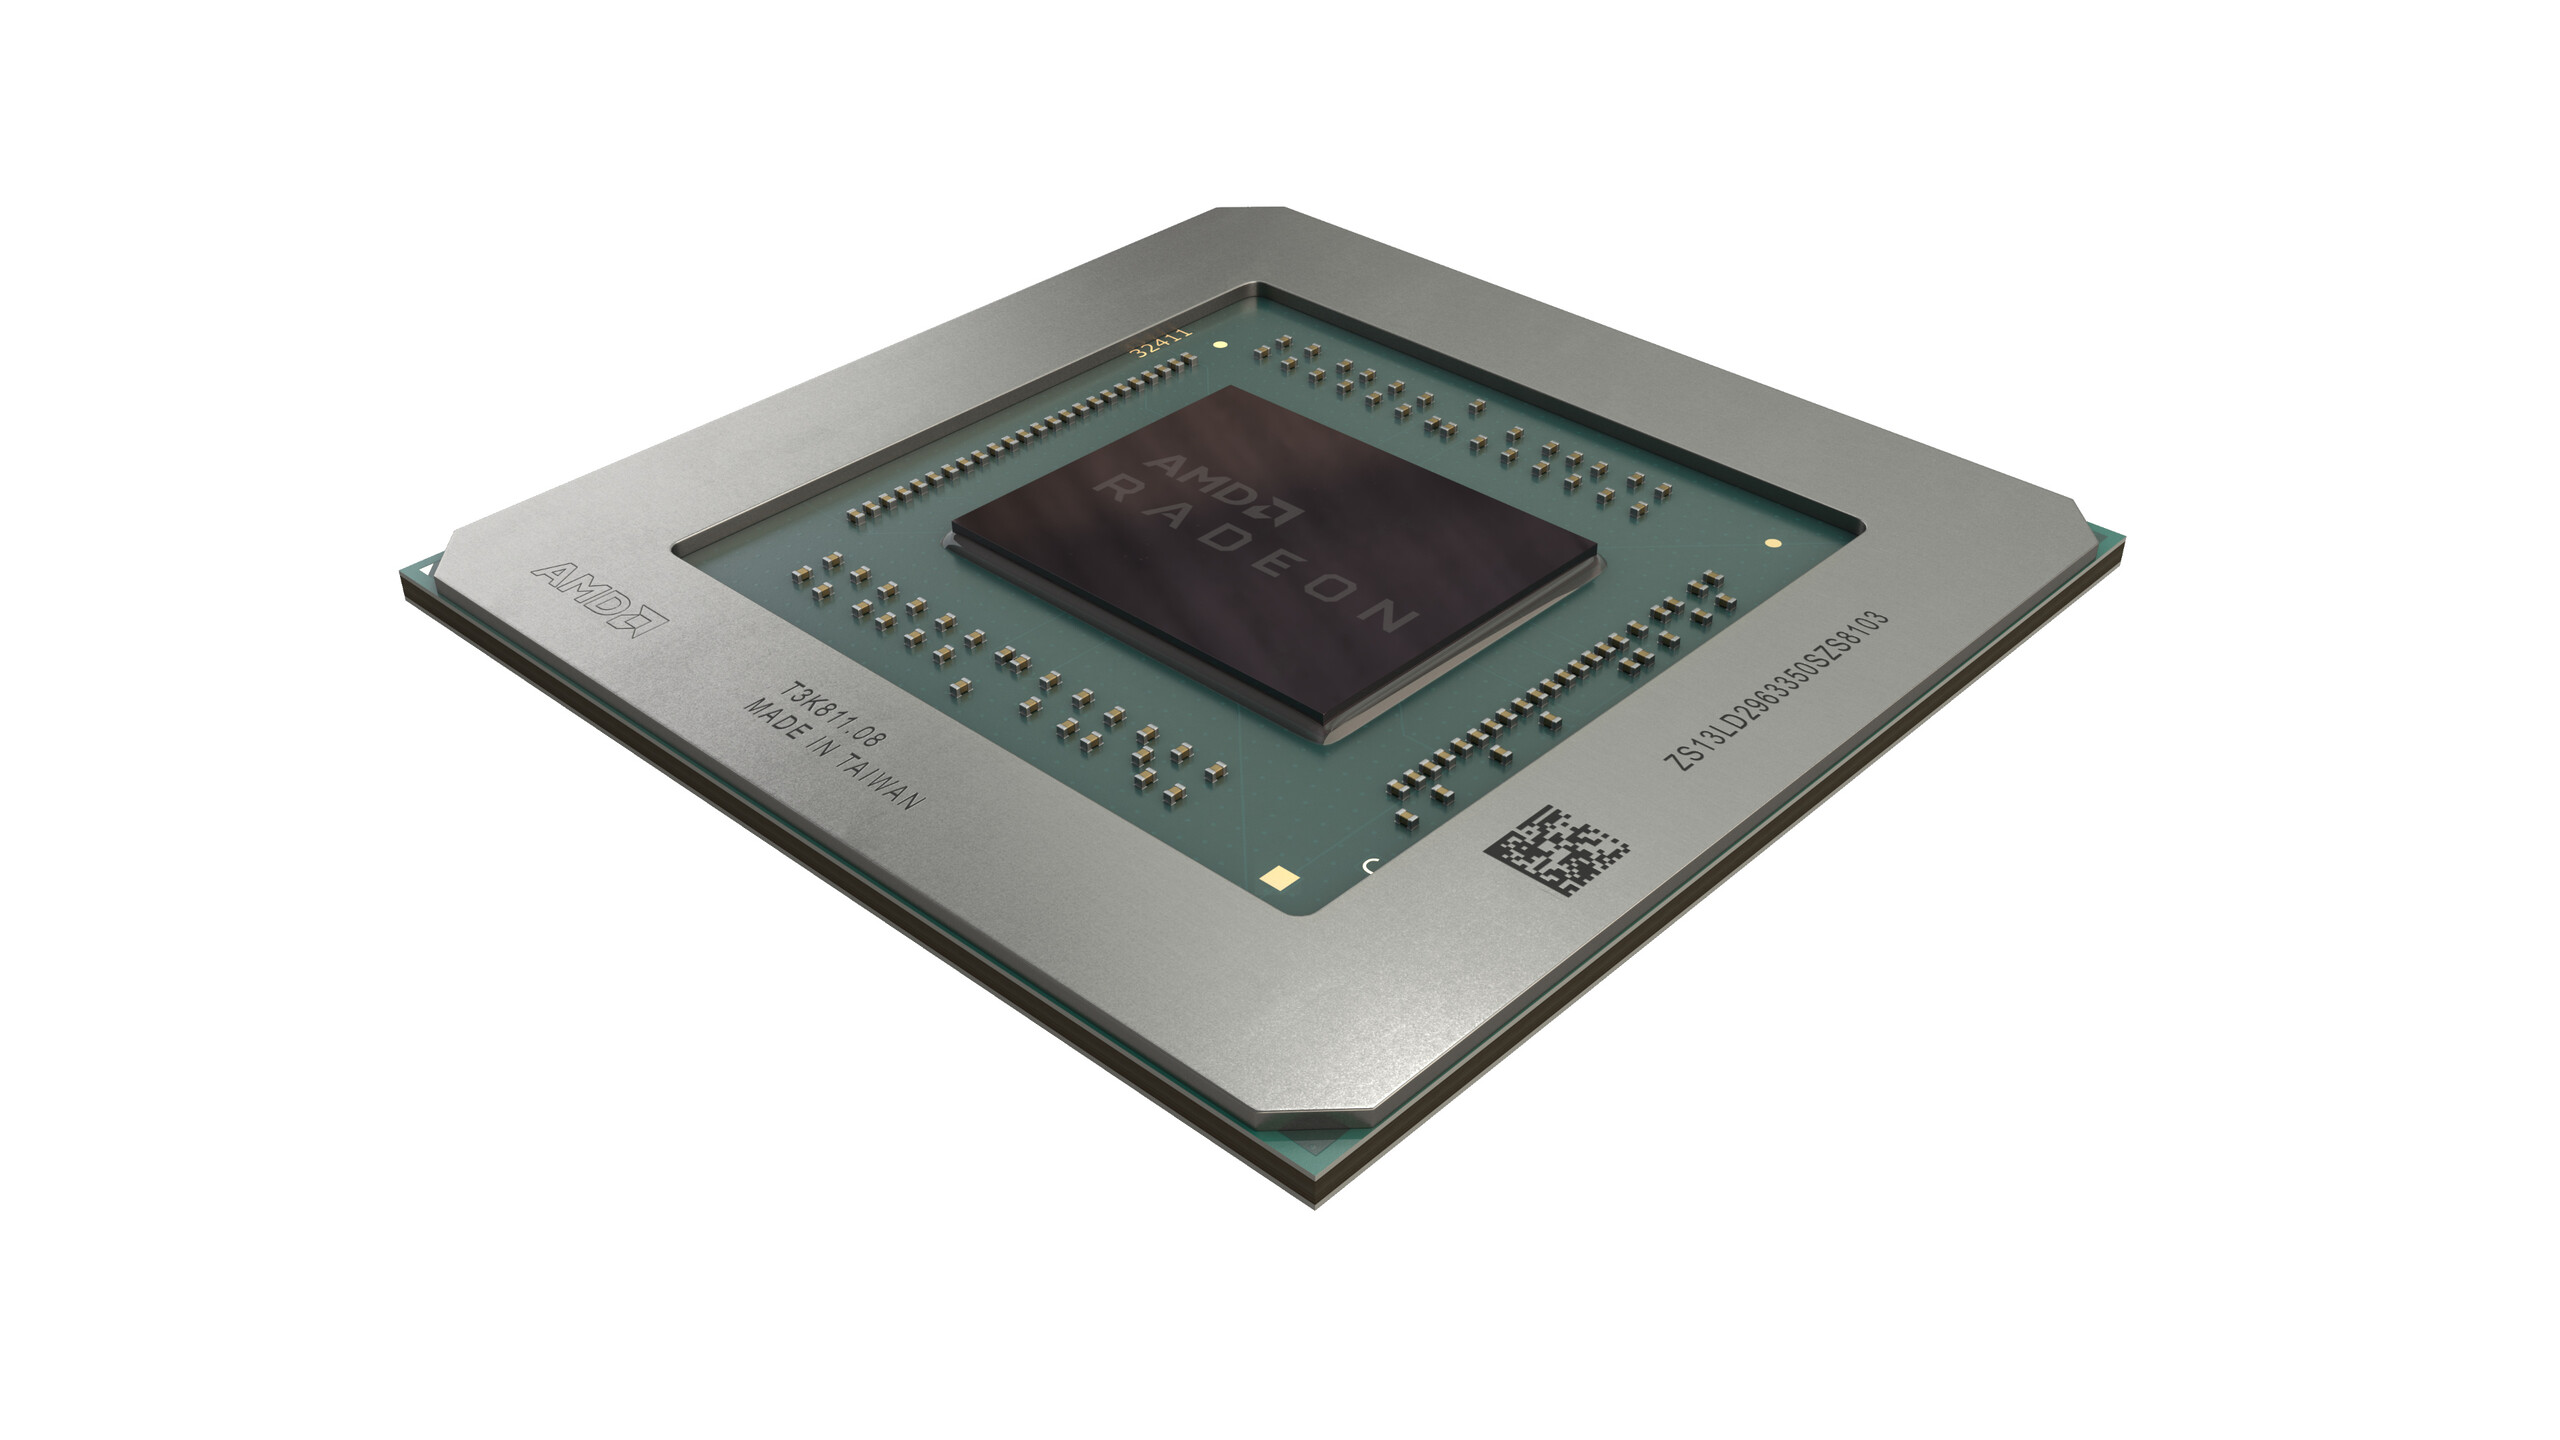
AMD Radeon RX 5700 review: With 7 nm to success?
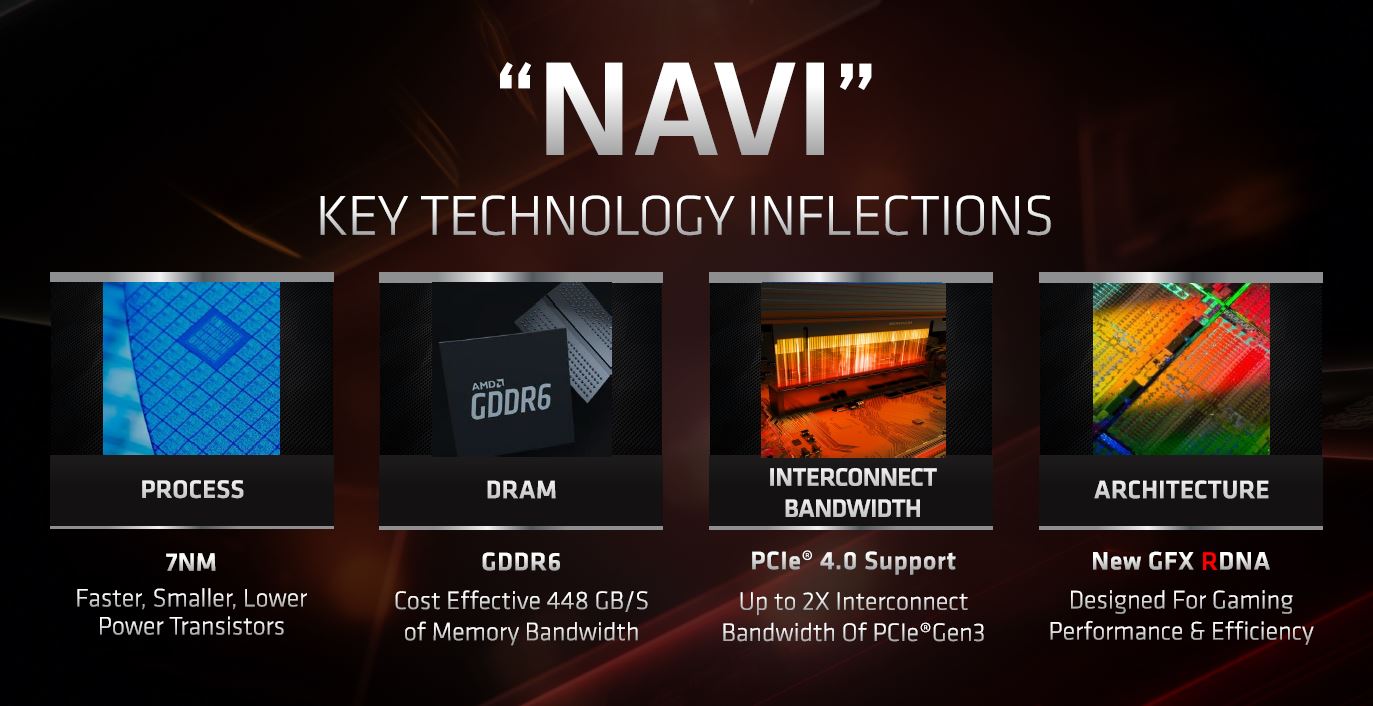
AMD is heralding a new era in graphics card architecture with RDNA. The new architecture was developed from the ground up and optimized for performance and energy efficiency. With a structural width of only 7 nm, AMD continues the trend of pioneering technology. This applies to the PCI Express interface too since the 5700 series from AMD features the first GPUs to use PCI Express 4.0, which was an innovation with the introduction of the Ryzen 3000. This doubles the bandwidth so that more data can be transferred.
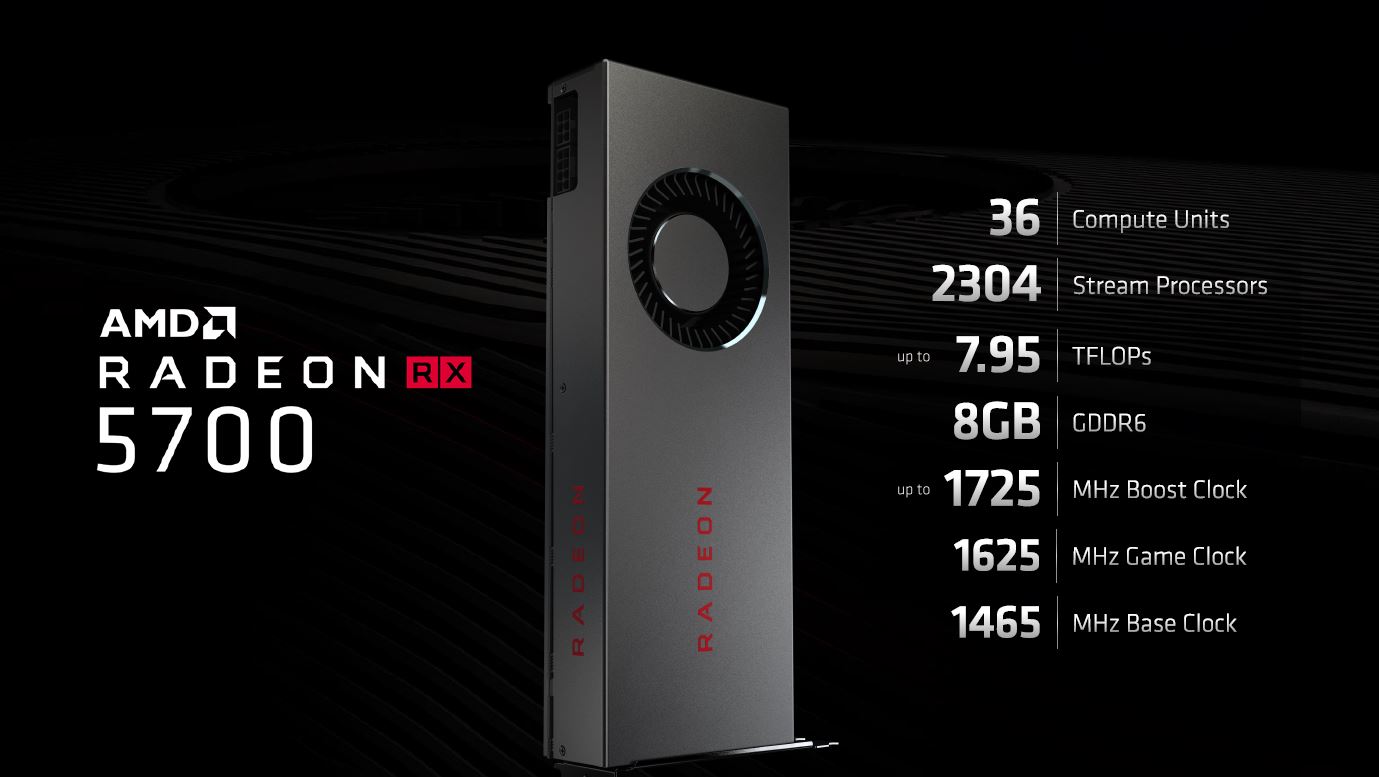
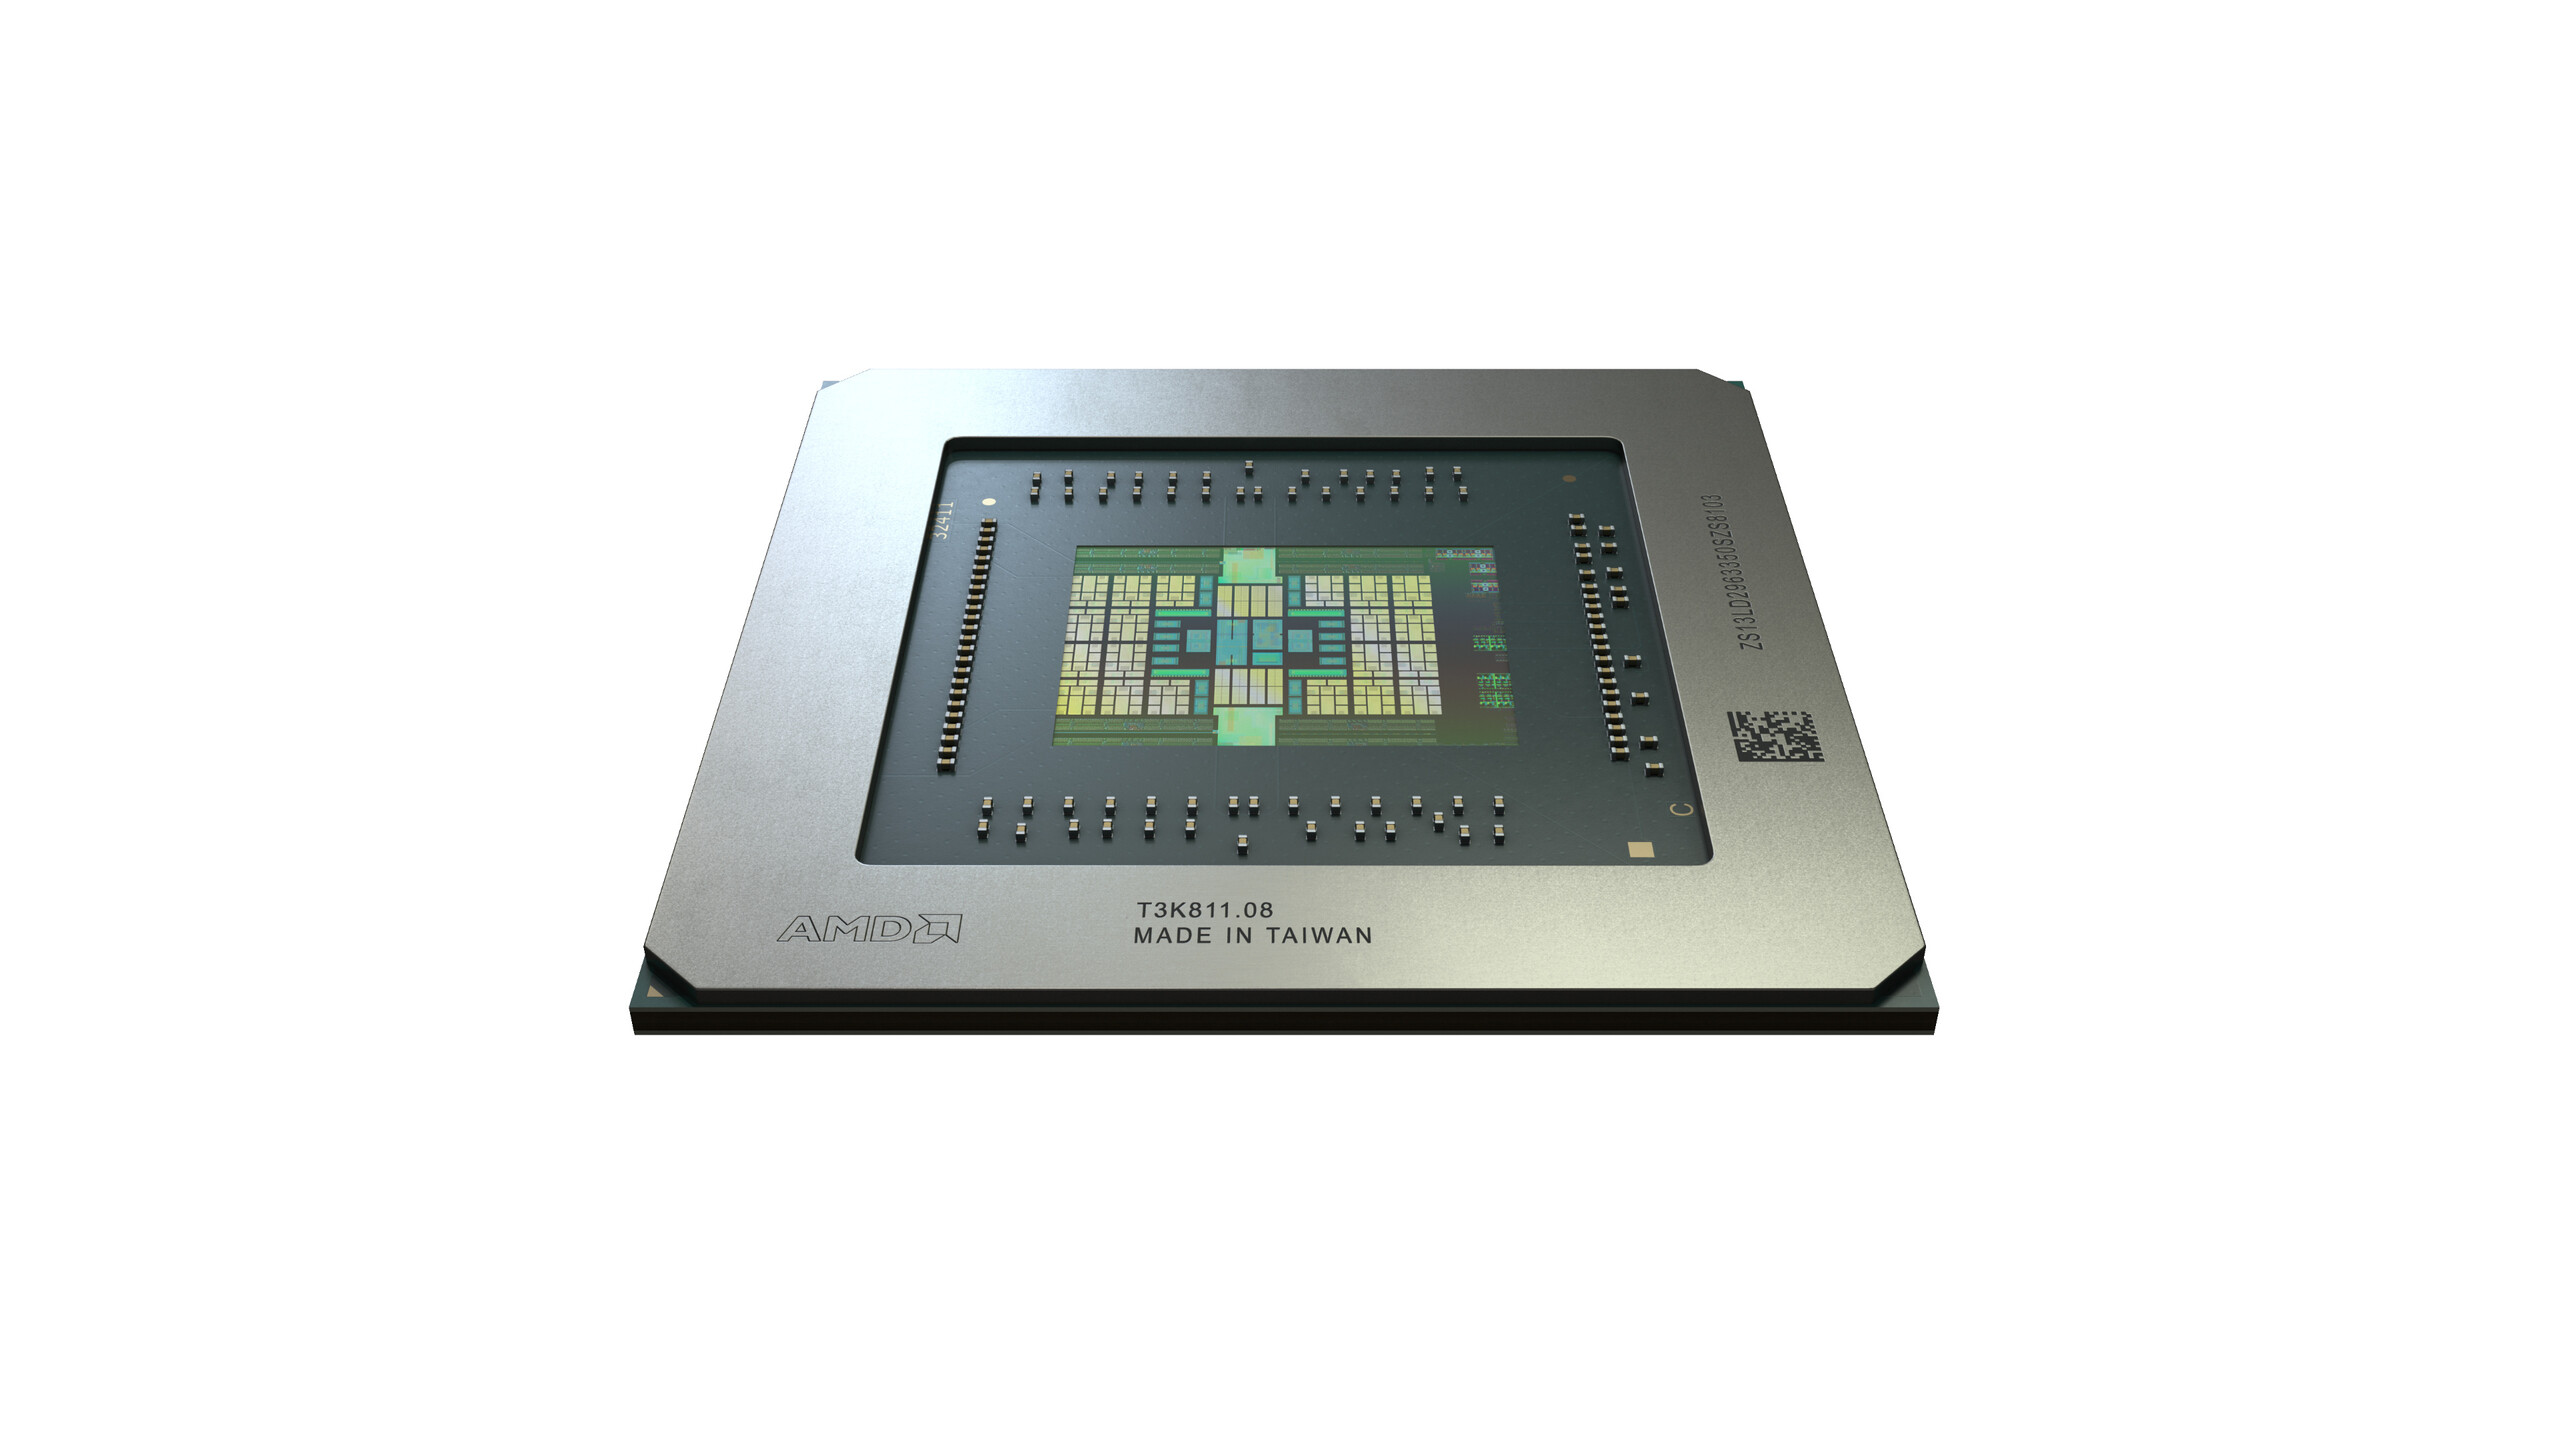
The Navi 10 graphics chip in the AMD Radeon RX 5700 is a weaker model since the complete version of the Navi 10 is found in the Radeon RX 5700 XT. With 2306 stream processors, the chip offers a bit more than the Nvidia RTX 2060S with the TU106 though. Both graphics cards are similar in terms of clock speeds because the biggest rival to the Radeon RX 5700 is the GeForce RTX 2060S. AMD has never really skimped on VRAM, and so we find 8 GB GDDR6 RAM in the new Navi cards too.
In terms of energy consumption, AMD especially wanted and needed to improve since the somewhat similarly fast AMD Radeon RX Vega 64 doesn't offer a good energy balance with its high TDP of about 300 watts. The panorama is very different if you look at the technical specifications of the RX 5700. With 180 watts, the AMD graphics card ranks on the same level as the competing model from Nvidia. We will discuss later whether this proved to be true in our review.
If you want to buy an RX 5700 model from AMD, you should expect to spend around 370 Euros (~$412) with taxes included. The RX 5700 is in this way a bit less expensive than the GeForce RTX 2060S Founders Edition (419 Euros, ~$466).

GPU specifications at a glance
| Specifications | AMD Radeon RX 5700 | AMD Radeon RX 5700 XT | AMD Radeon VII | RX Vega 64 | RTX 2060 | RTX 2060S | RTX 2070 | RTX 2070S |
| Chip | Navi 10 | Navi 10 | Vega 20 | Vega 10 | TU106 | TU106 | TU106 | TU104 |
| Manufactured | 7 nm | 7 nm | 7 nm | 14 nm | 12 nm | 12 nm | 12 nm | 12 nm |
| Shader | 2304 | 2560 | 3840 | 4096 | 1920 | 2176 | 2304 | 2560 |
| Texture Units | 144 | 160 | 240 | 256 | 120 | 136 | 144 | 160 |
| Tensor Cores | - | - | - | - | 240 | 272 | 288 | 320 |
| RT Cores | - | - | - | - | 30 | 34 | 36 | 40 |
| GPU Base Clock | 1465 MHz | 1605 MHz | 1400 MHz | 1200 MHz | 1365 MHz | 1470 MHz | 1410 MHz | 1605 MHz |
| GPU Boost Clock | 1625 MHz | 1755 MHz | 1750 MHz | 1536 MHz | 1680 MHz | 1650 MHz | 1620 MHz | 1770 MHz |
| Memory Bus | 256 Bit | 256 Bit | 4096 Bit | 2048 Bit | 192 Bit | 256 Bit | 256 Bit | 256 Bit |
| Memory Bandwidth | 448 GB/s | 448 GB/s | 1024 GB/s | 483.8 GB/s | 336 GB/s | 448 GB/s | 448 GB/s | 448 GB/s |
| Memory Size | 8 GB GDDR6 | 8 GB GDDR6 | 16 GB HBM2 | 8 GB HBM2 | 6 GB GDDR6 | 8 GB GDDR6 | 8 GB GDDR6 | 8 GB GDDR6 |
| Power (W) | 180 W | 225 W | 295 W | 295 W | 160 W | 175 W | 175 W | 215 W |
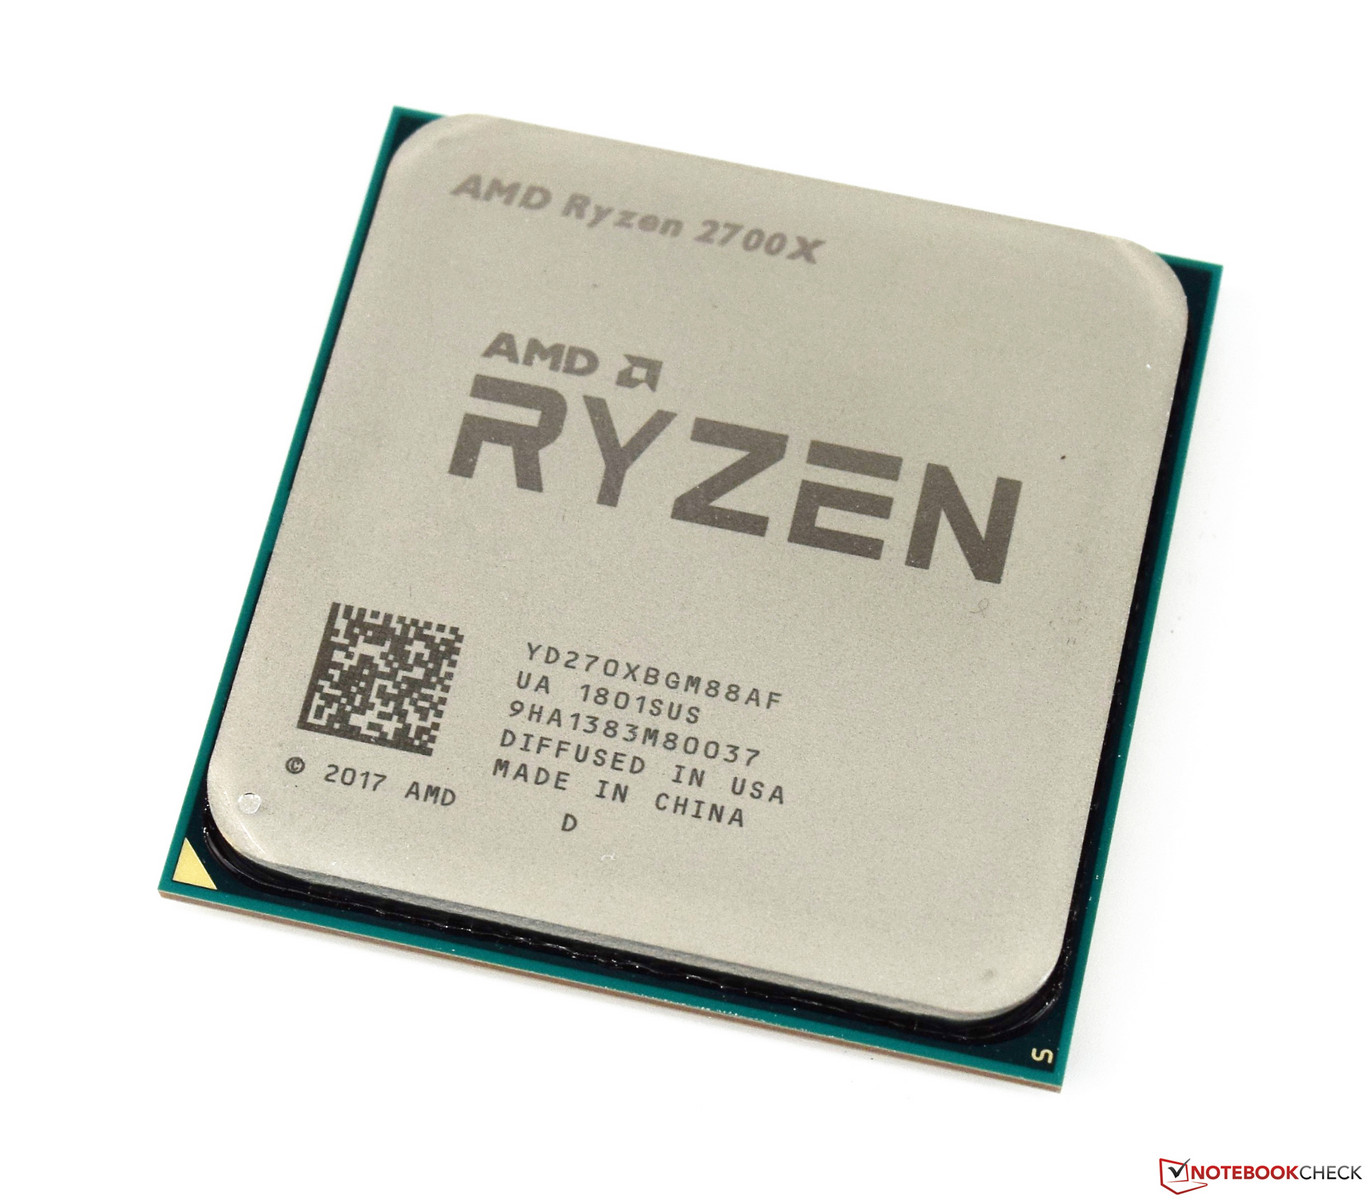
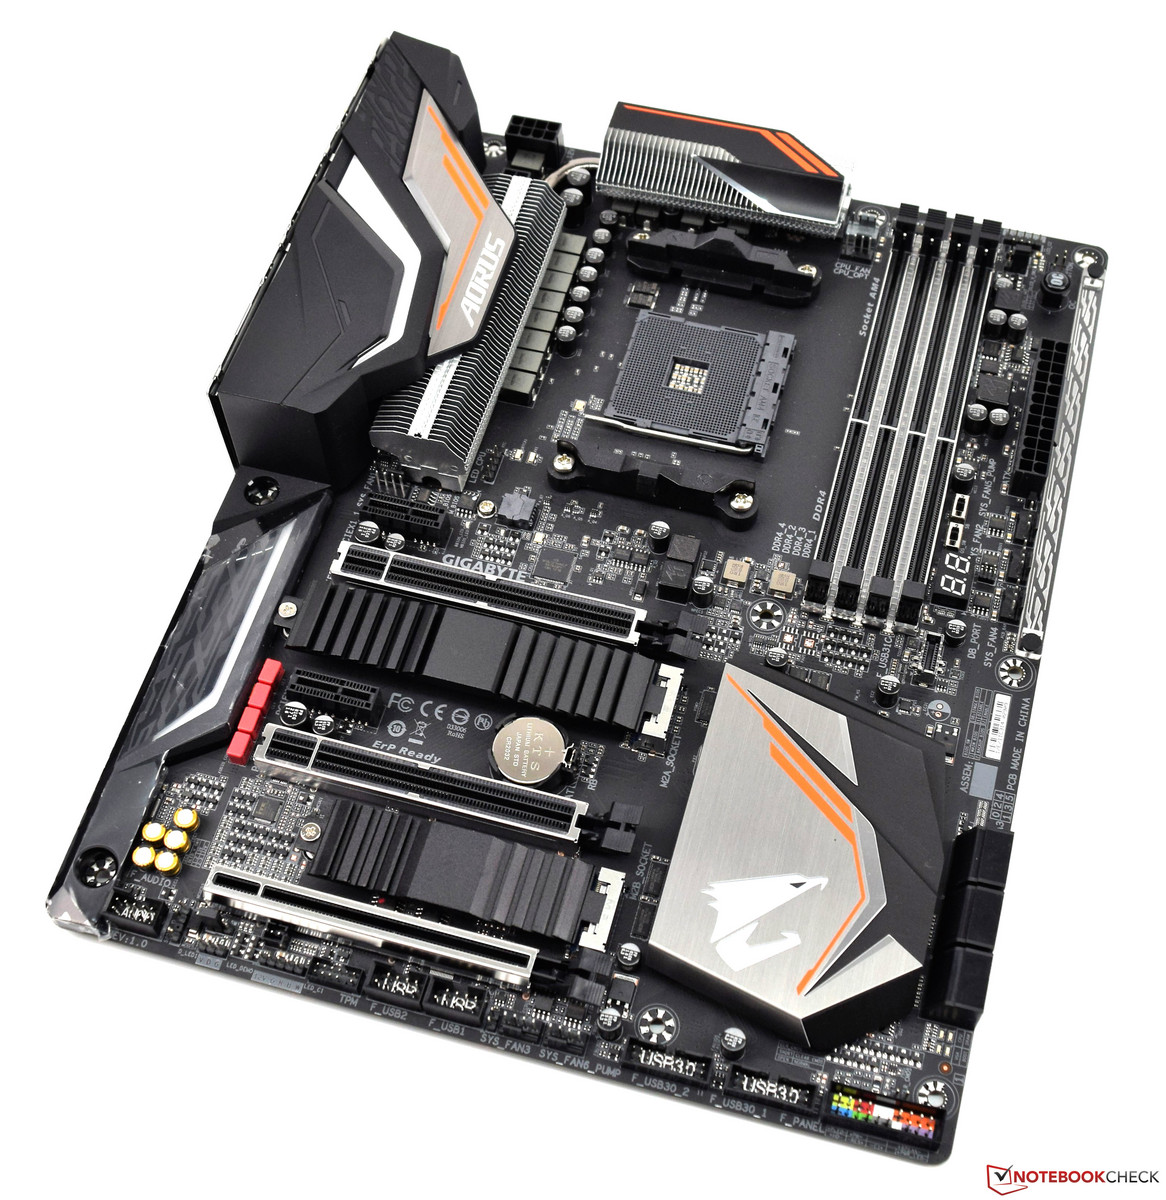
Test system - Ryzen 7 2700X as base
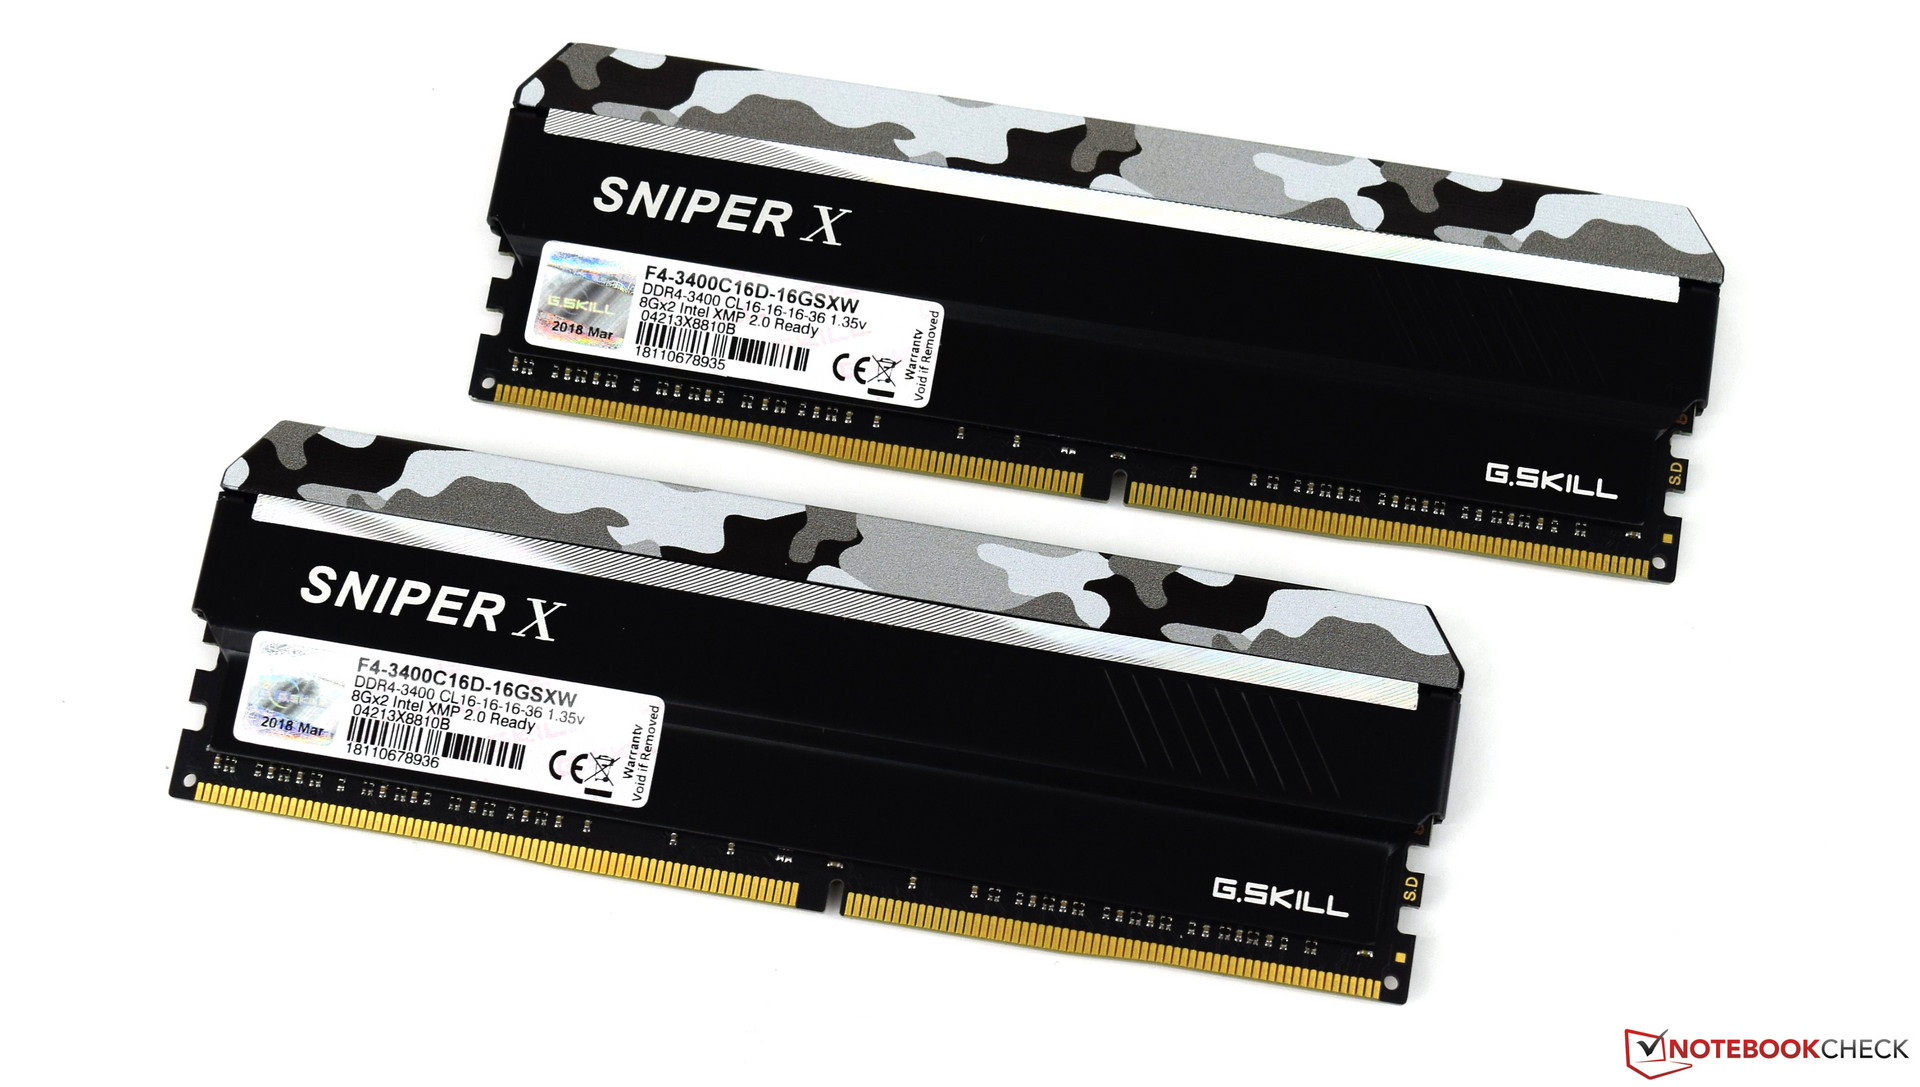
The test system is a current AMD platform based on the Gigabyte X470 Aorus Gaming 7 Wi-Fi. The CPU, an AMD Ryzen 7 2700X, provides good CPU performance, and we used an AIO (Be Quiet Silent Loop 280mm) for cooling. The 16 GB RAM comes from G-Skill and has a speed of 3400 MHz. We used the Acer Predator XB321HK as monitor. We don't have any limitations with it due to its UHD capability. A big thank you goes to AMD at this point for providing the test platform.
We made a deliberate choice not to use an X570 platform including a Ryzen 3900X so as not to alter the test conditions compared to the Nvidia Super graphics card.
| Case | Corsair Carbide Air 540 ATX Cube |
| CPU | AMD Ryzen 7 2700X |
| CPU cooler | Be Quiet Silent Loop 280mm |
| RAM | G-Skill Sniper X 16 GB DDR4 3400 MHz |
| Mainboard | Gigabyte X470 Aorus Gaming 7 Wi-Fi |
| Monitor | Acer Predator XB321HK 4K |
| SSD | ADATA SP900 M.2 SSD 256 GB (system) |
| SSD | Western Digital PC SN720 NVMe SSD 512 GB (for games) |
| SSD | Crucial MX500 2 TB (for games) |
| Operating system | Microsoft Windows 10 Professional 64-Bit (version 1903) |
| AMD drivers | Adrenalin 19.7.2 (date: 07/20/2019) |
The clock speeds of the AMD Radeon RX 5700
As can be gathered from the image on the right side, AMD provides three different clock speeds for the Radeon RX 5700. The base frequency of the smaller Navi 10 GPU is 1465 MHz, while the maximum boost frequency is 1725 MHz. AMD also gives the game frequency now, which can be expected when gaming. This is an average value since the full boost isn't reached all the time. In this way, the game frequency for the RX 5700 is 1625 MHz.
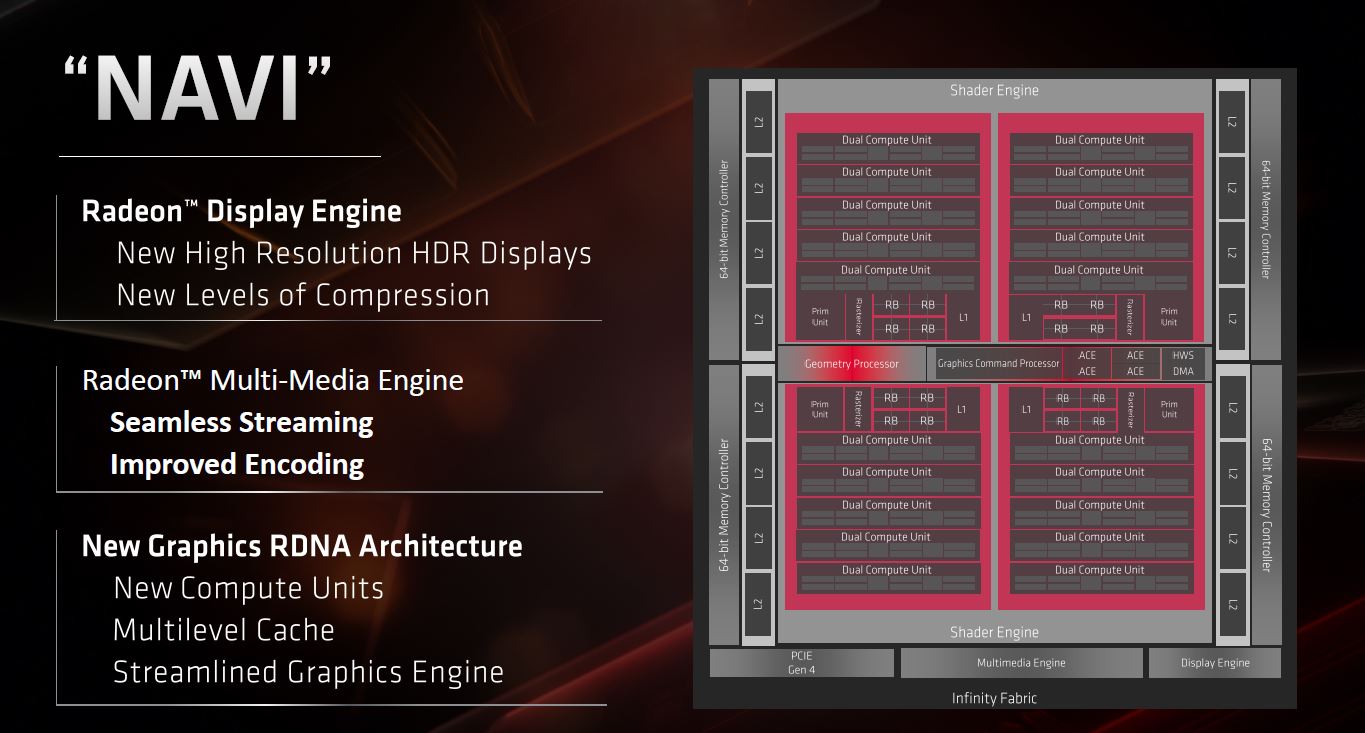
Regarding VRAM, AMD chose GDDR6 for the first time. Although using HBM2 would be possible, AMD went with the lower priced solution. That's good and also easy on the wallet. AMD isn't at a disadvantage here in comparison to Nvidia since the RTX 2060S is equipped with the same VRAM. They both have the same clock speeds of 7000 MHz too. The memory bandwidth is therefore 448 GB/s. In contrast to the RX Vega 64 with 483.8 GB/s, this is a drawback that can be accepted. The significantly higher production costs wouldn't have any relationship with the little increase in performance.
Synthetic benchmarks
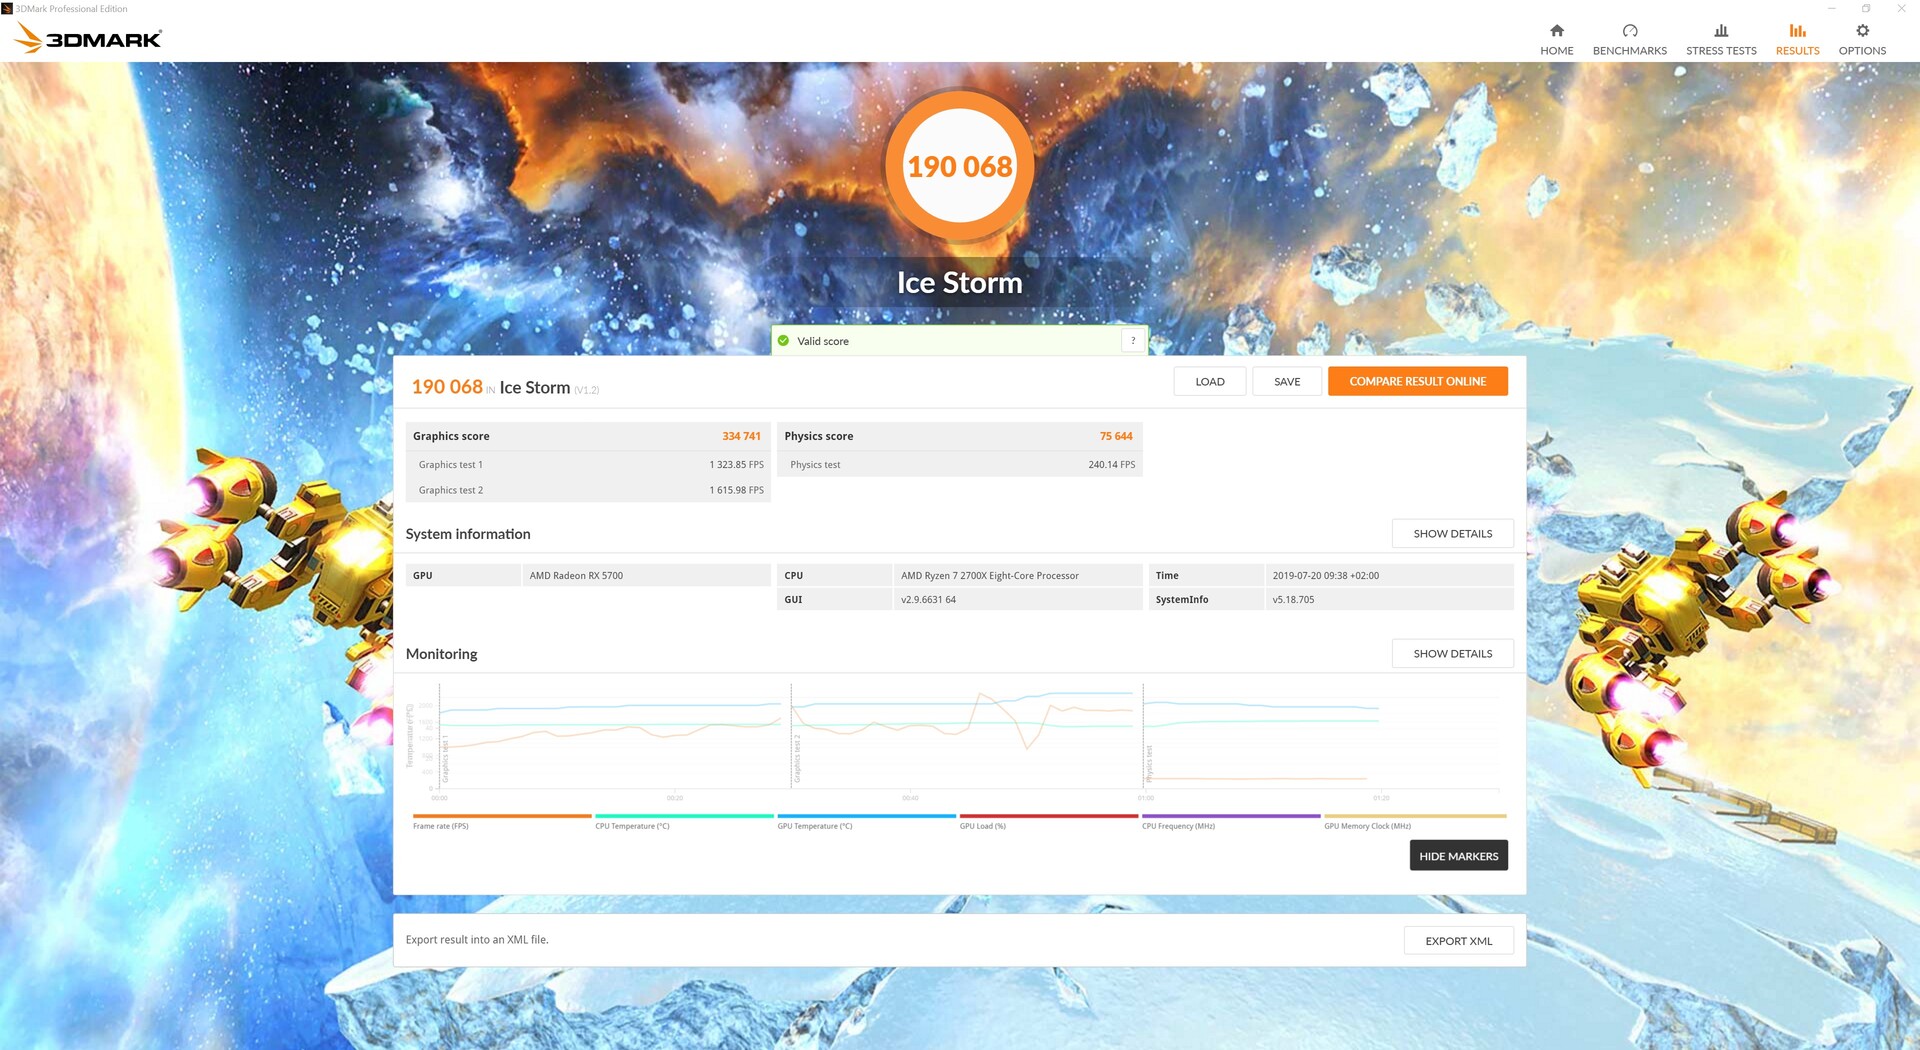
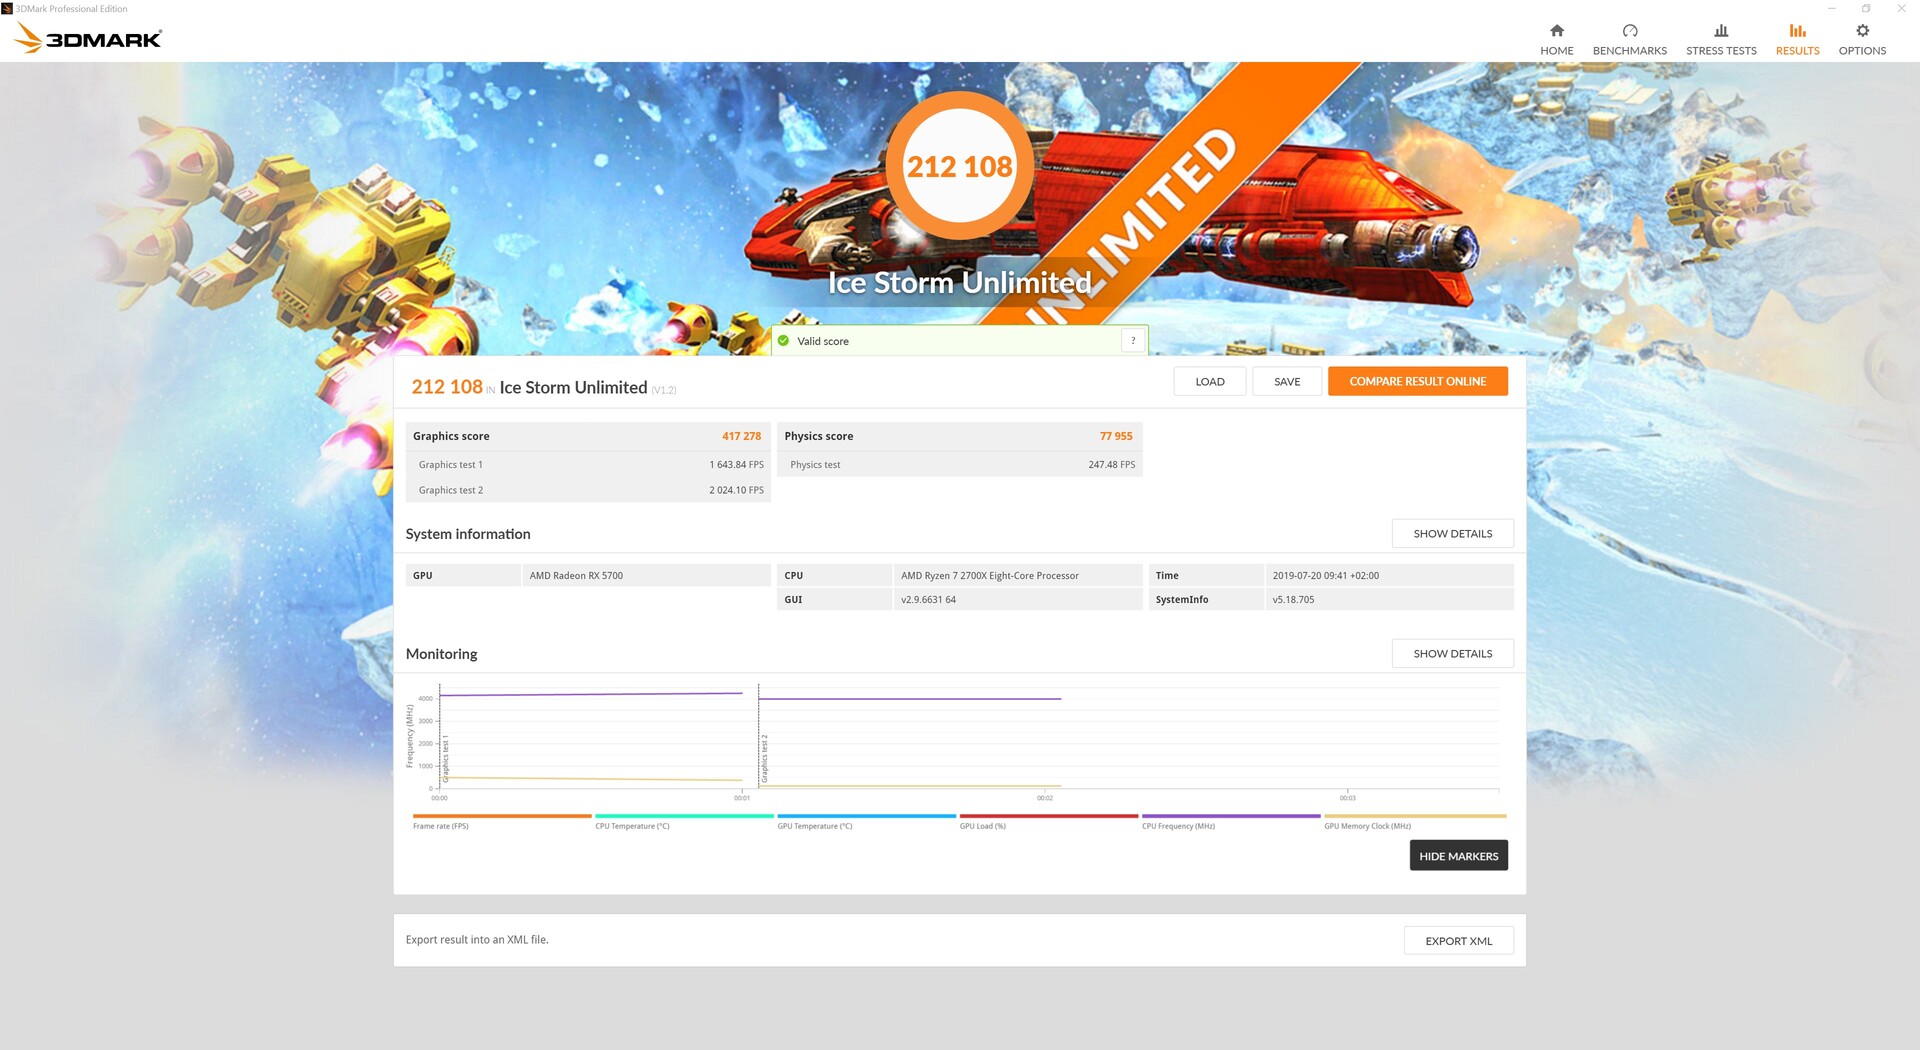
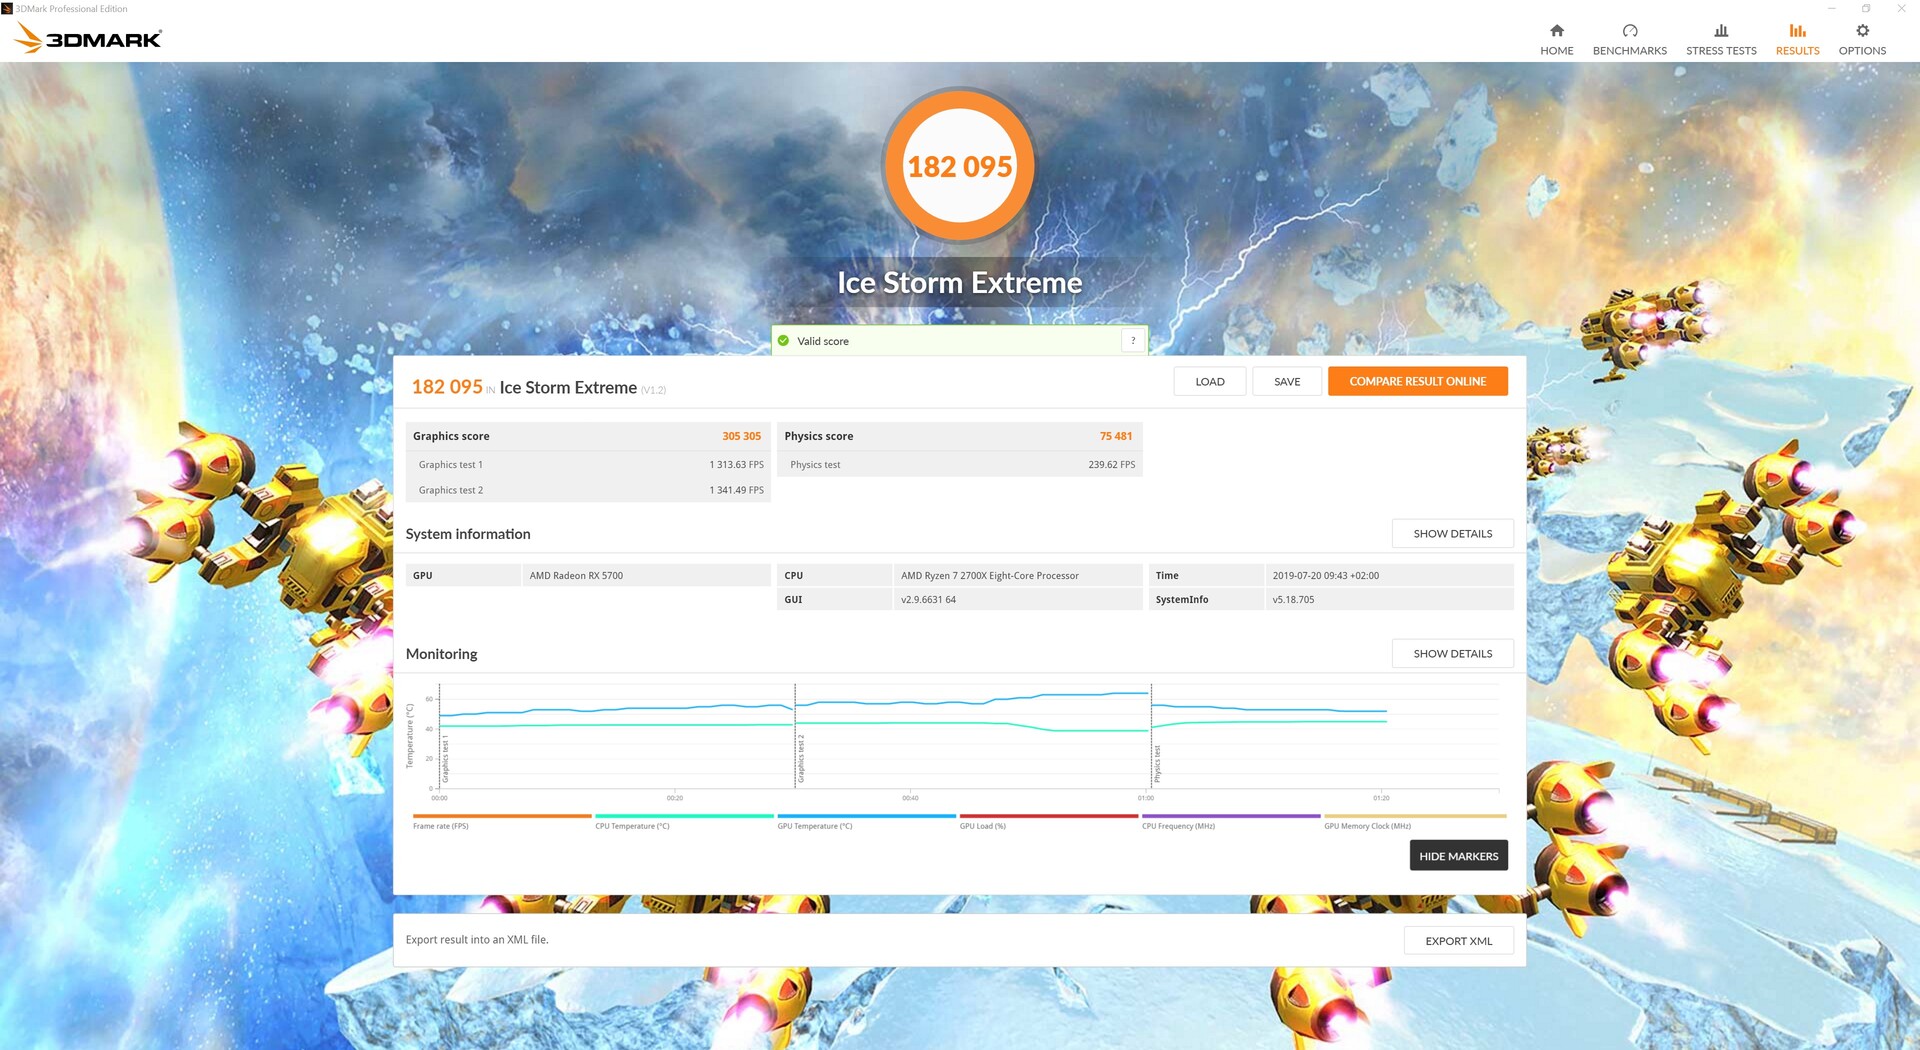
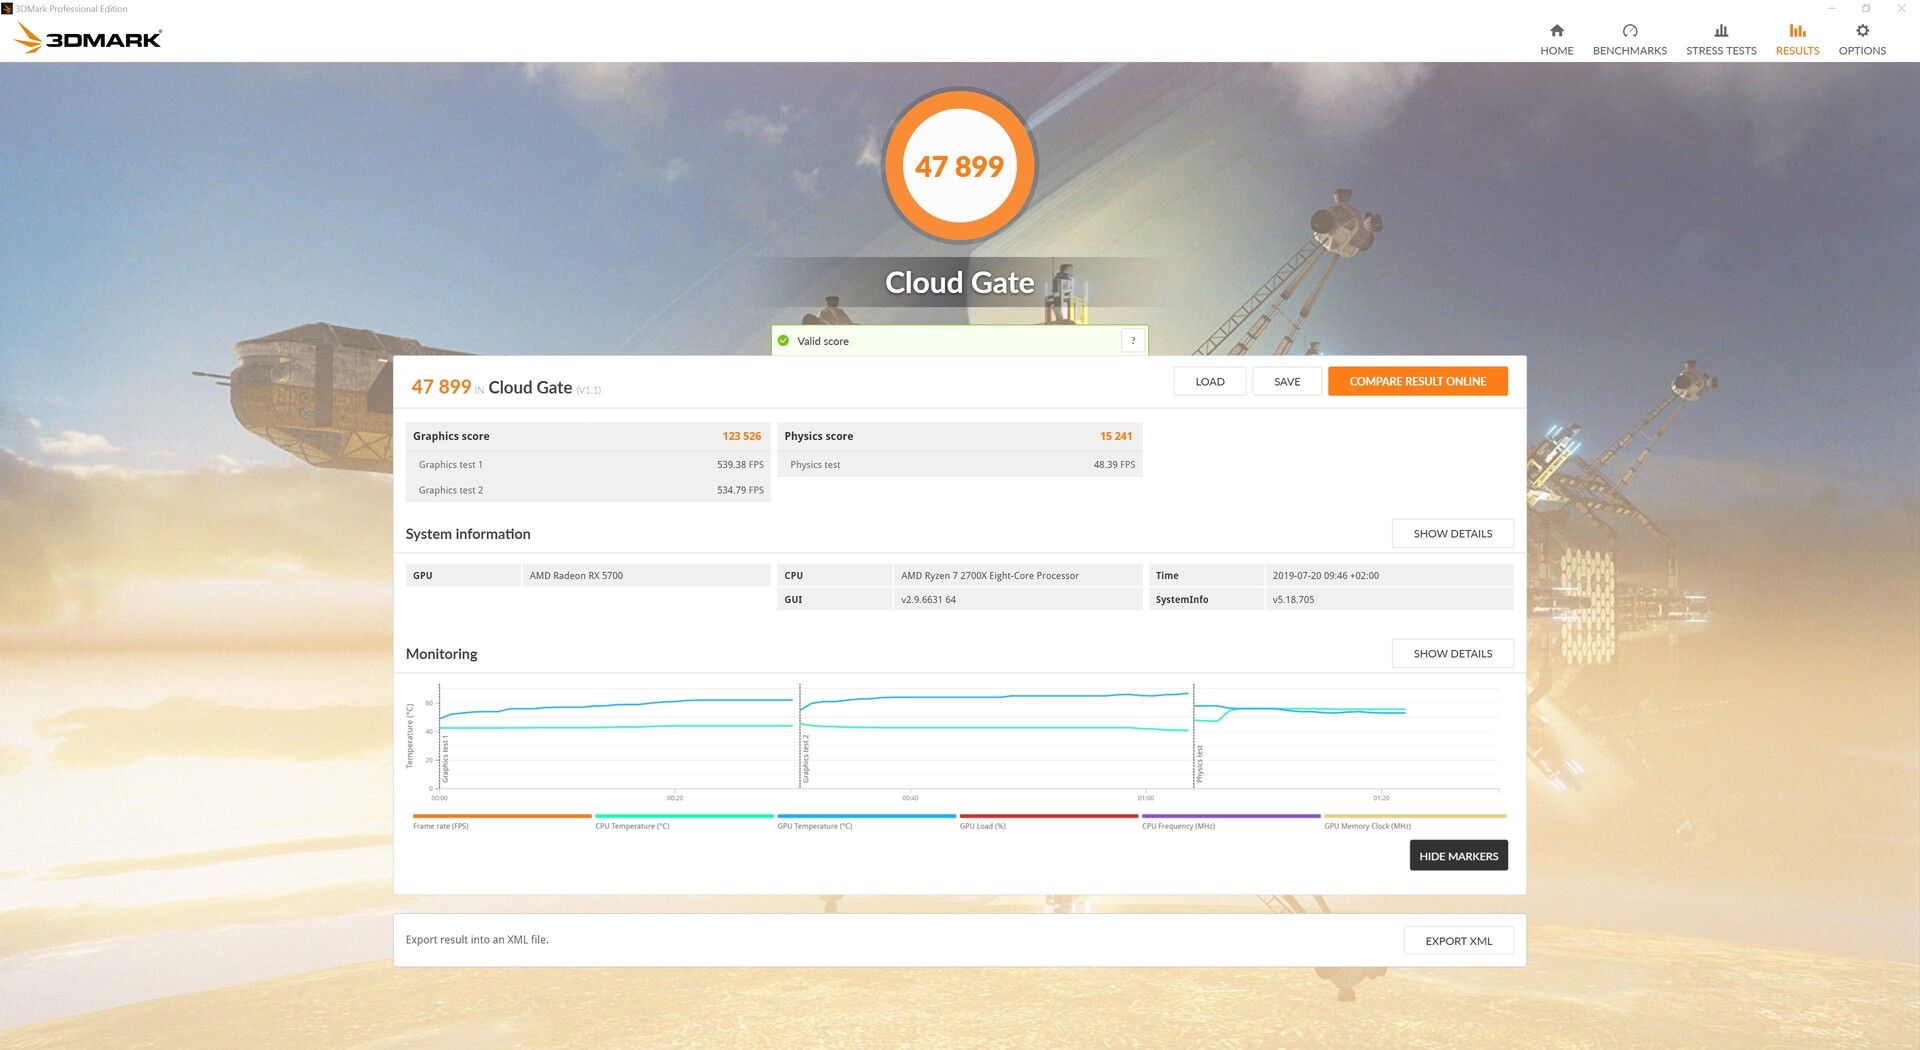
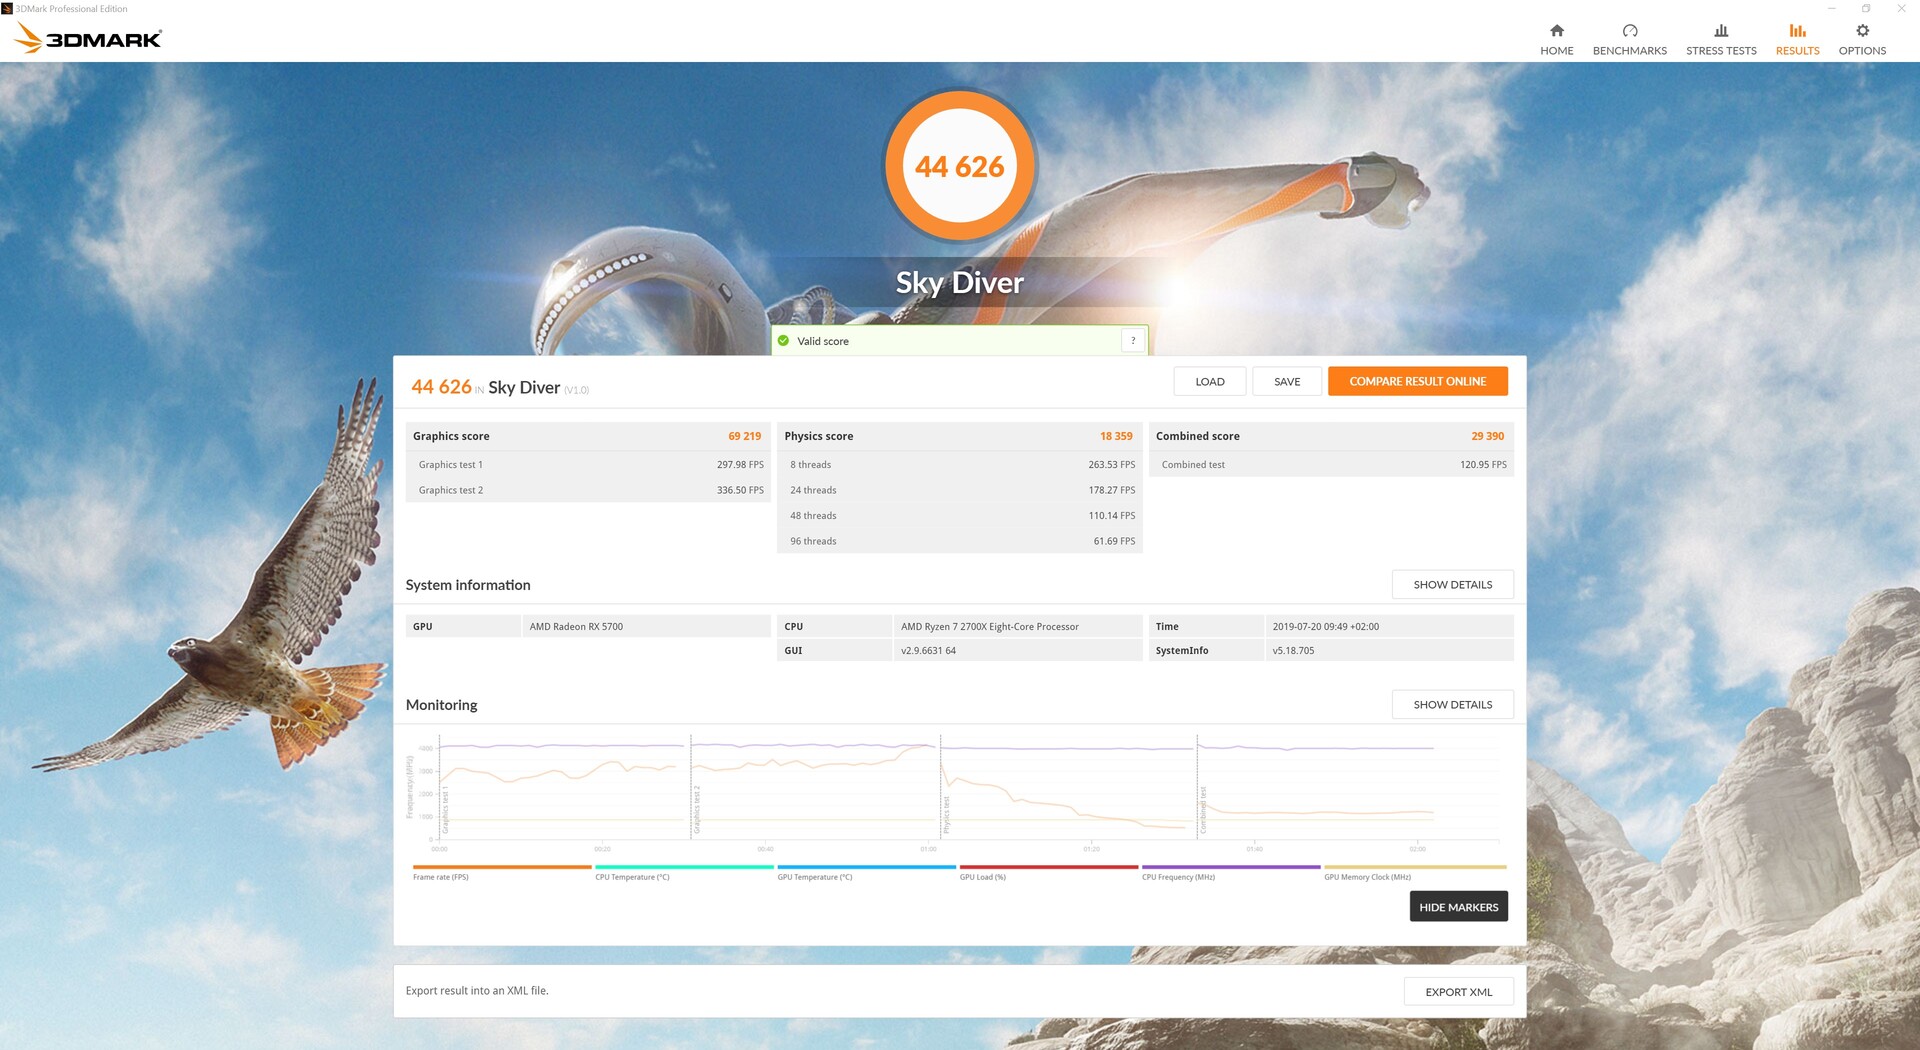
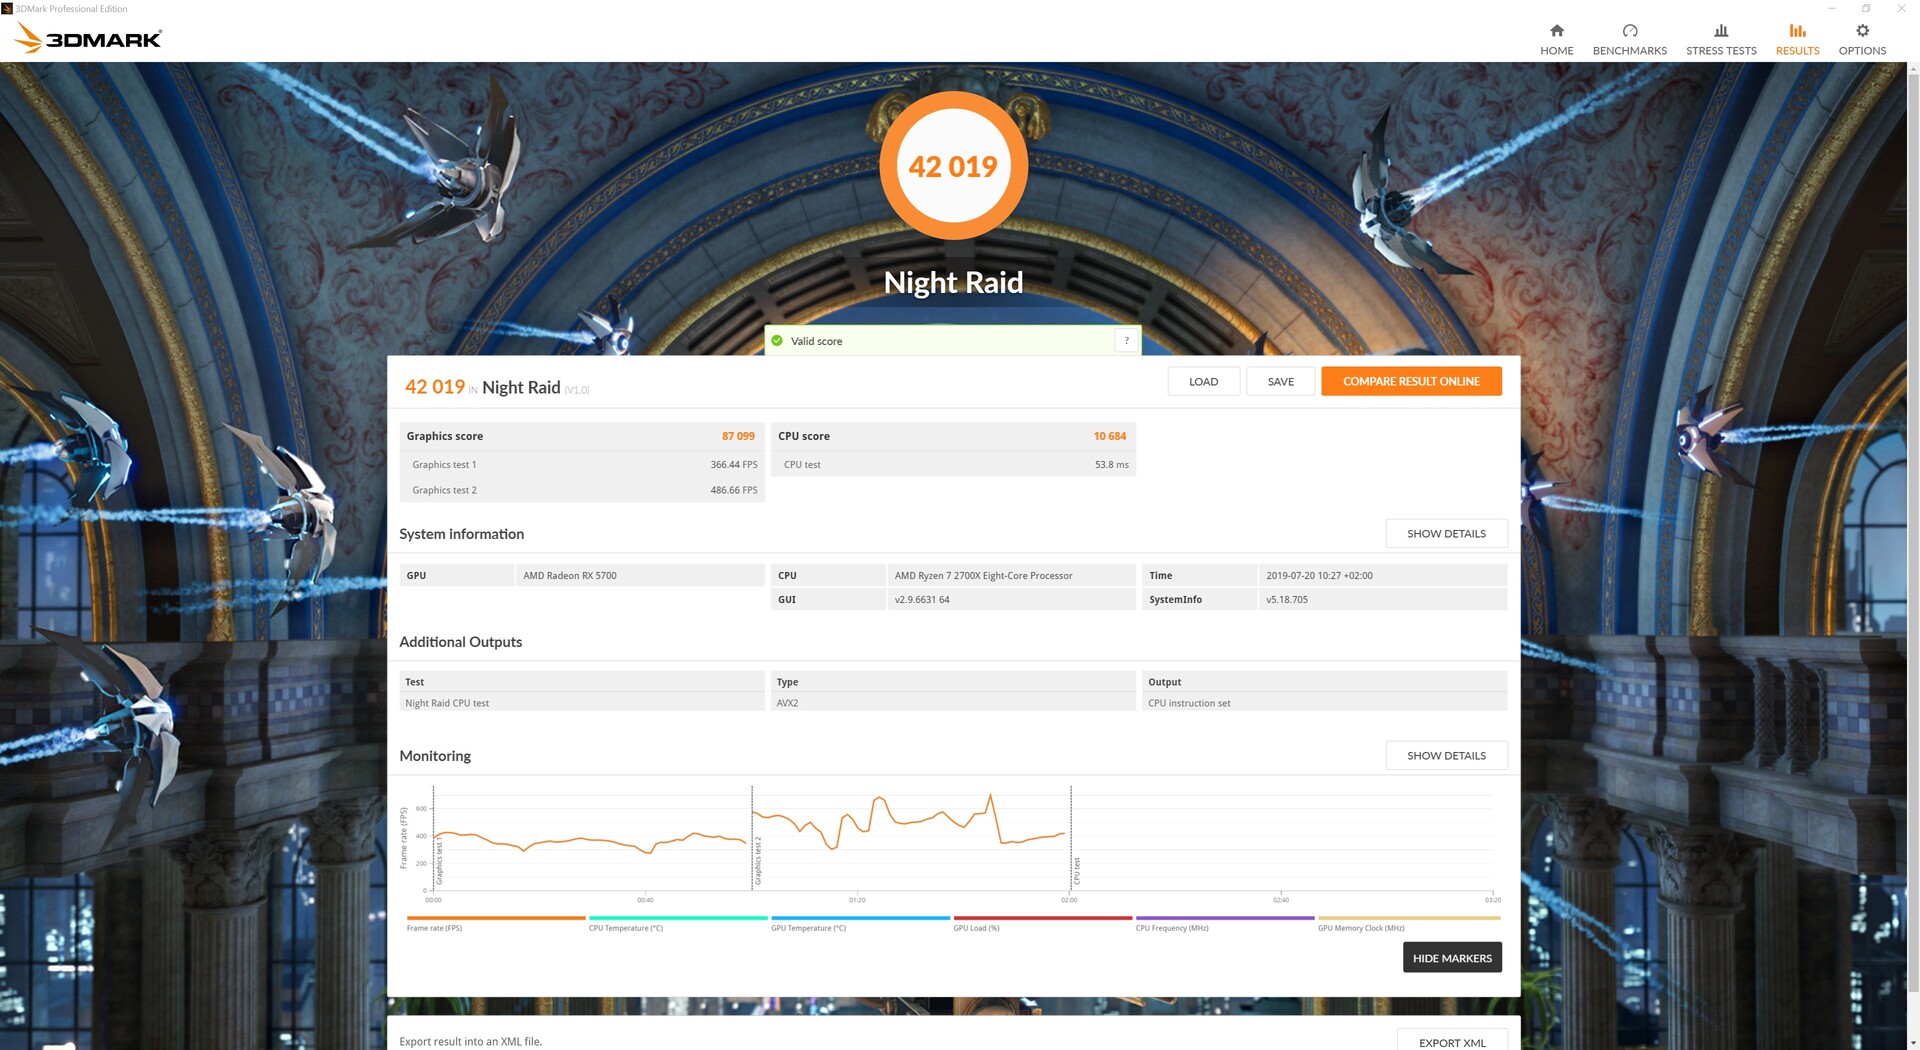
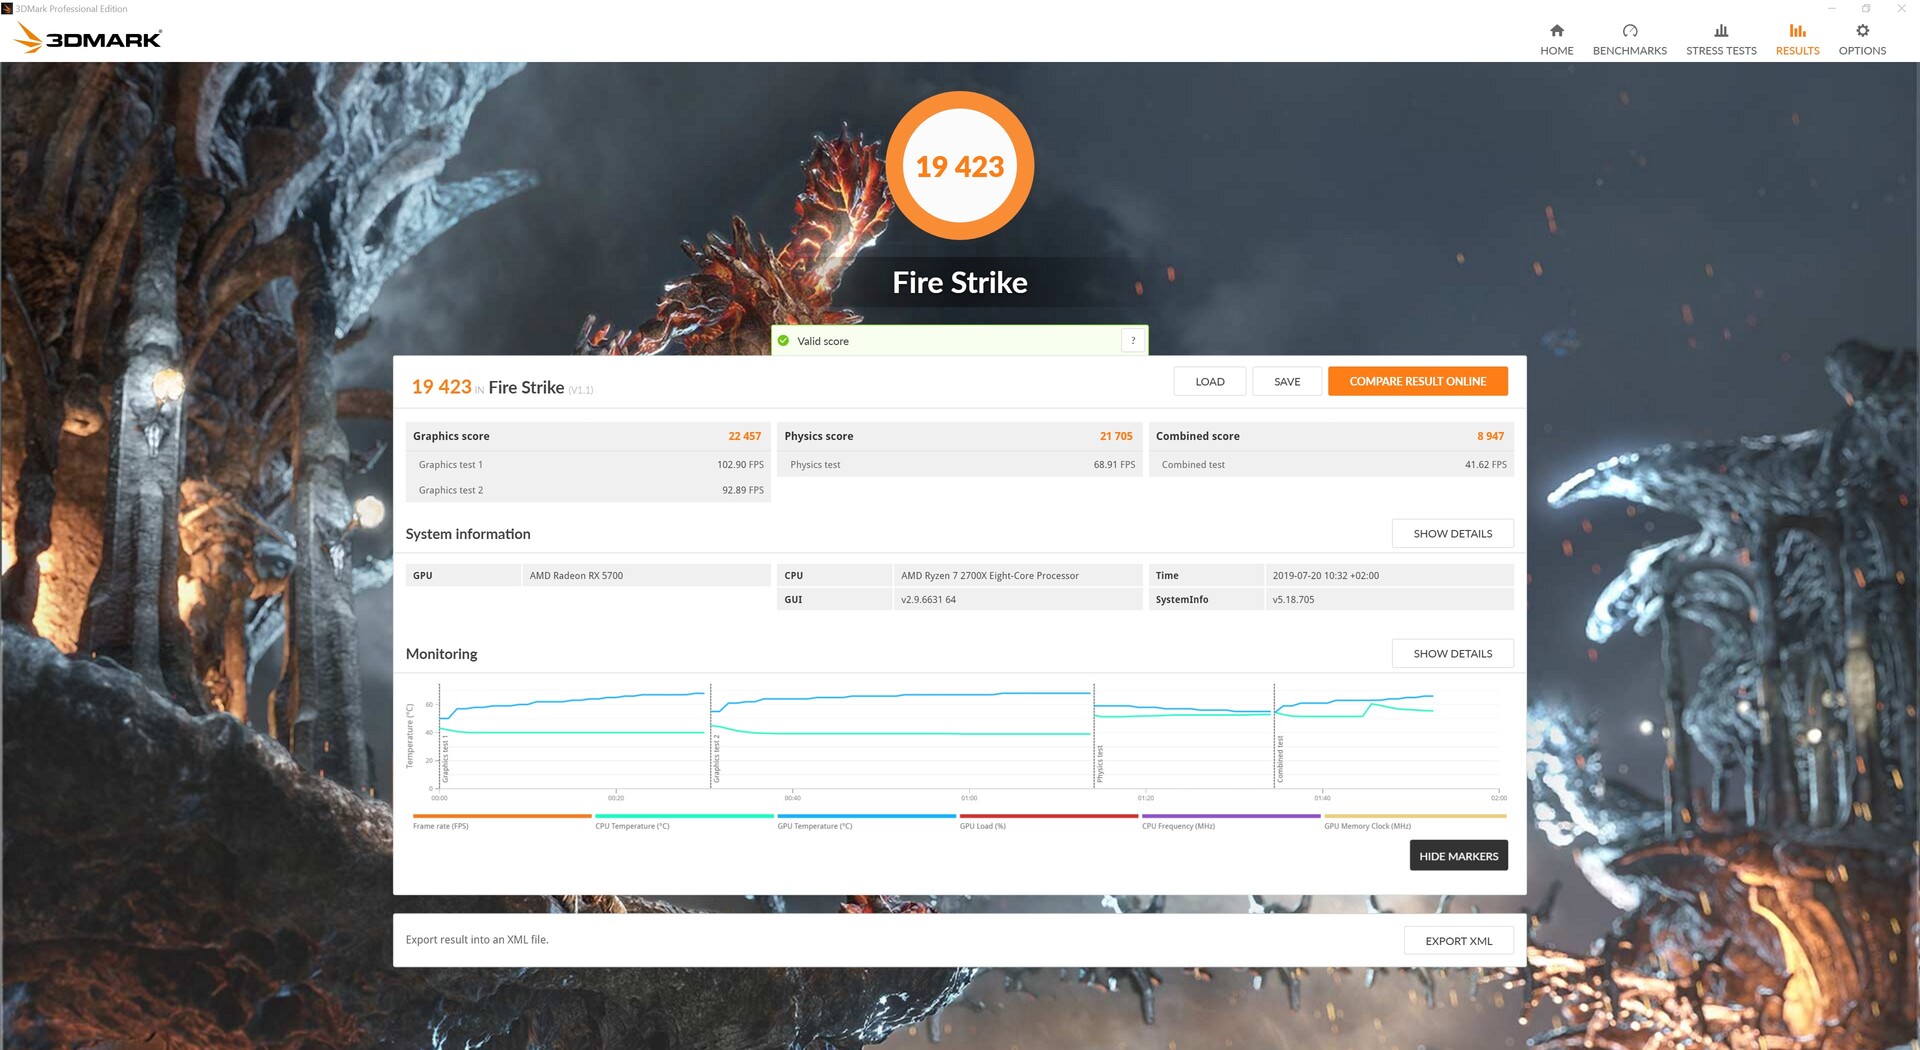
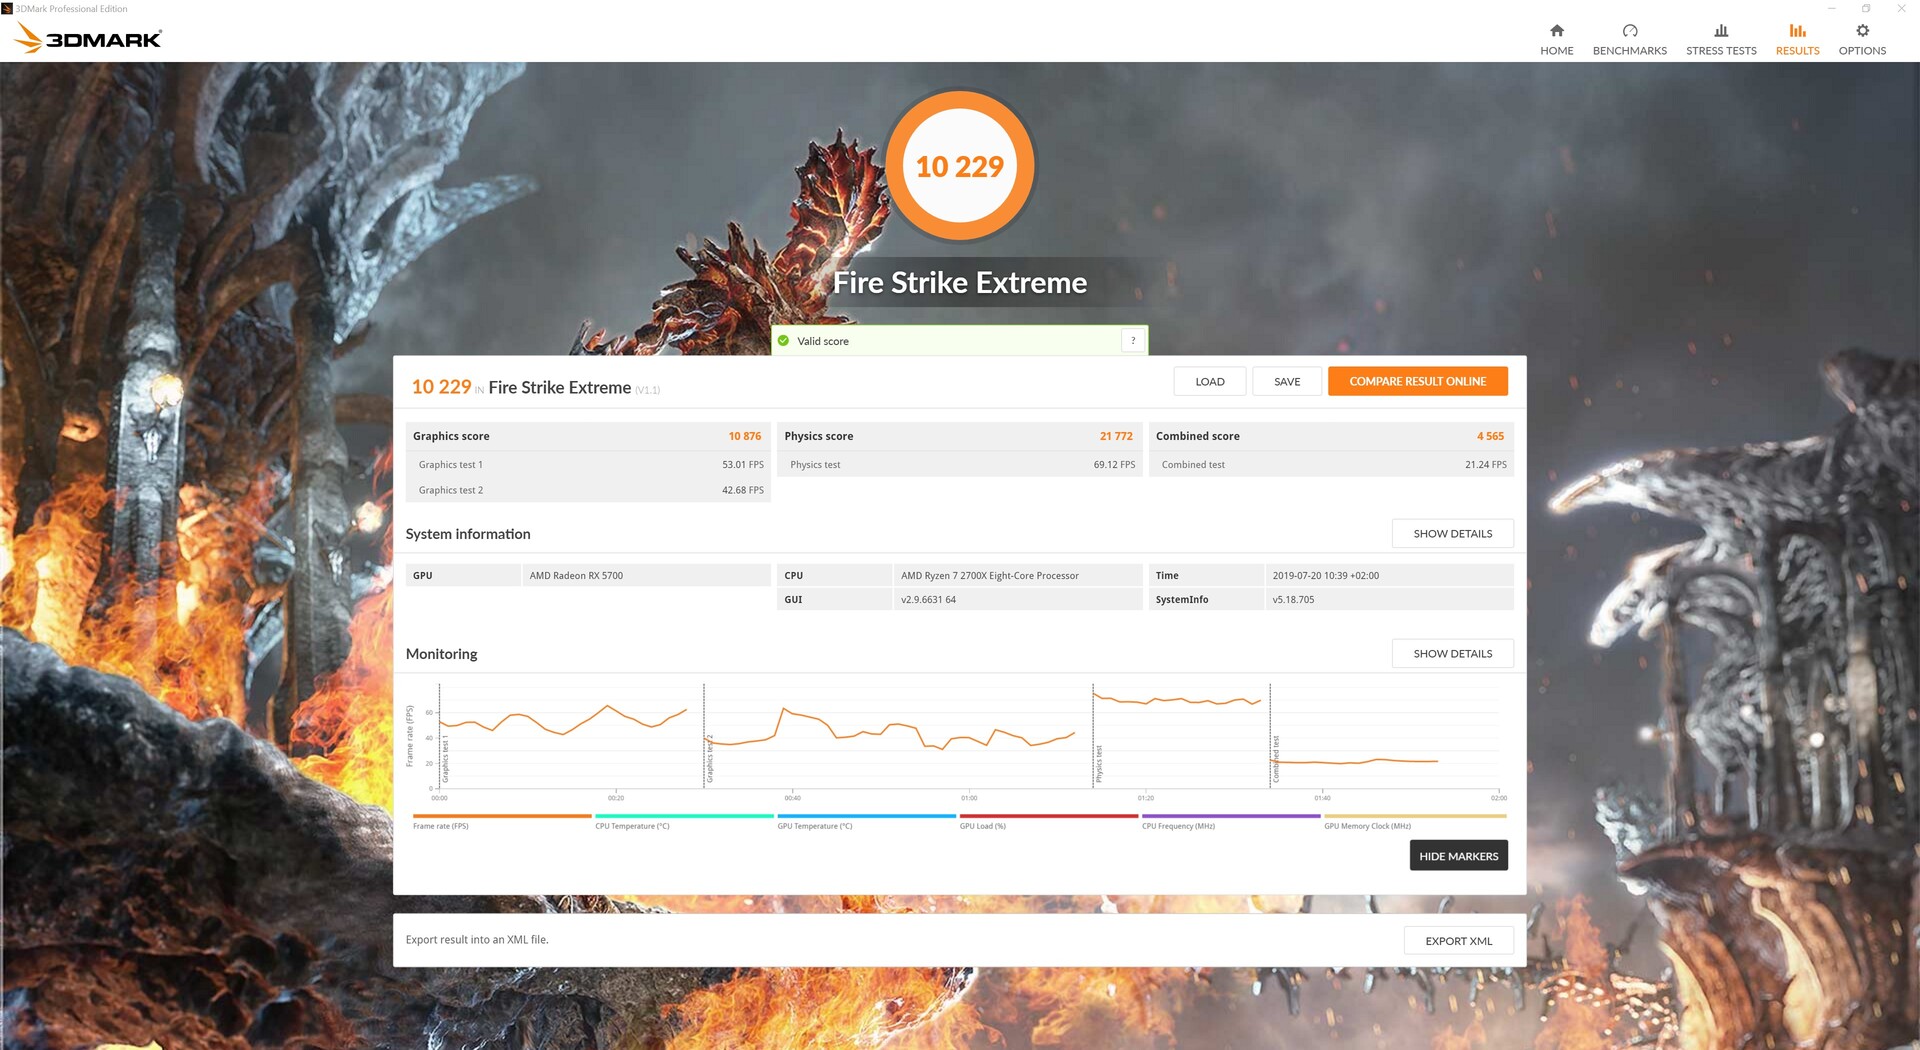
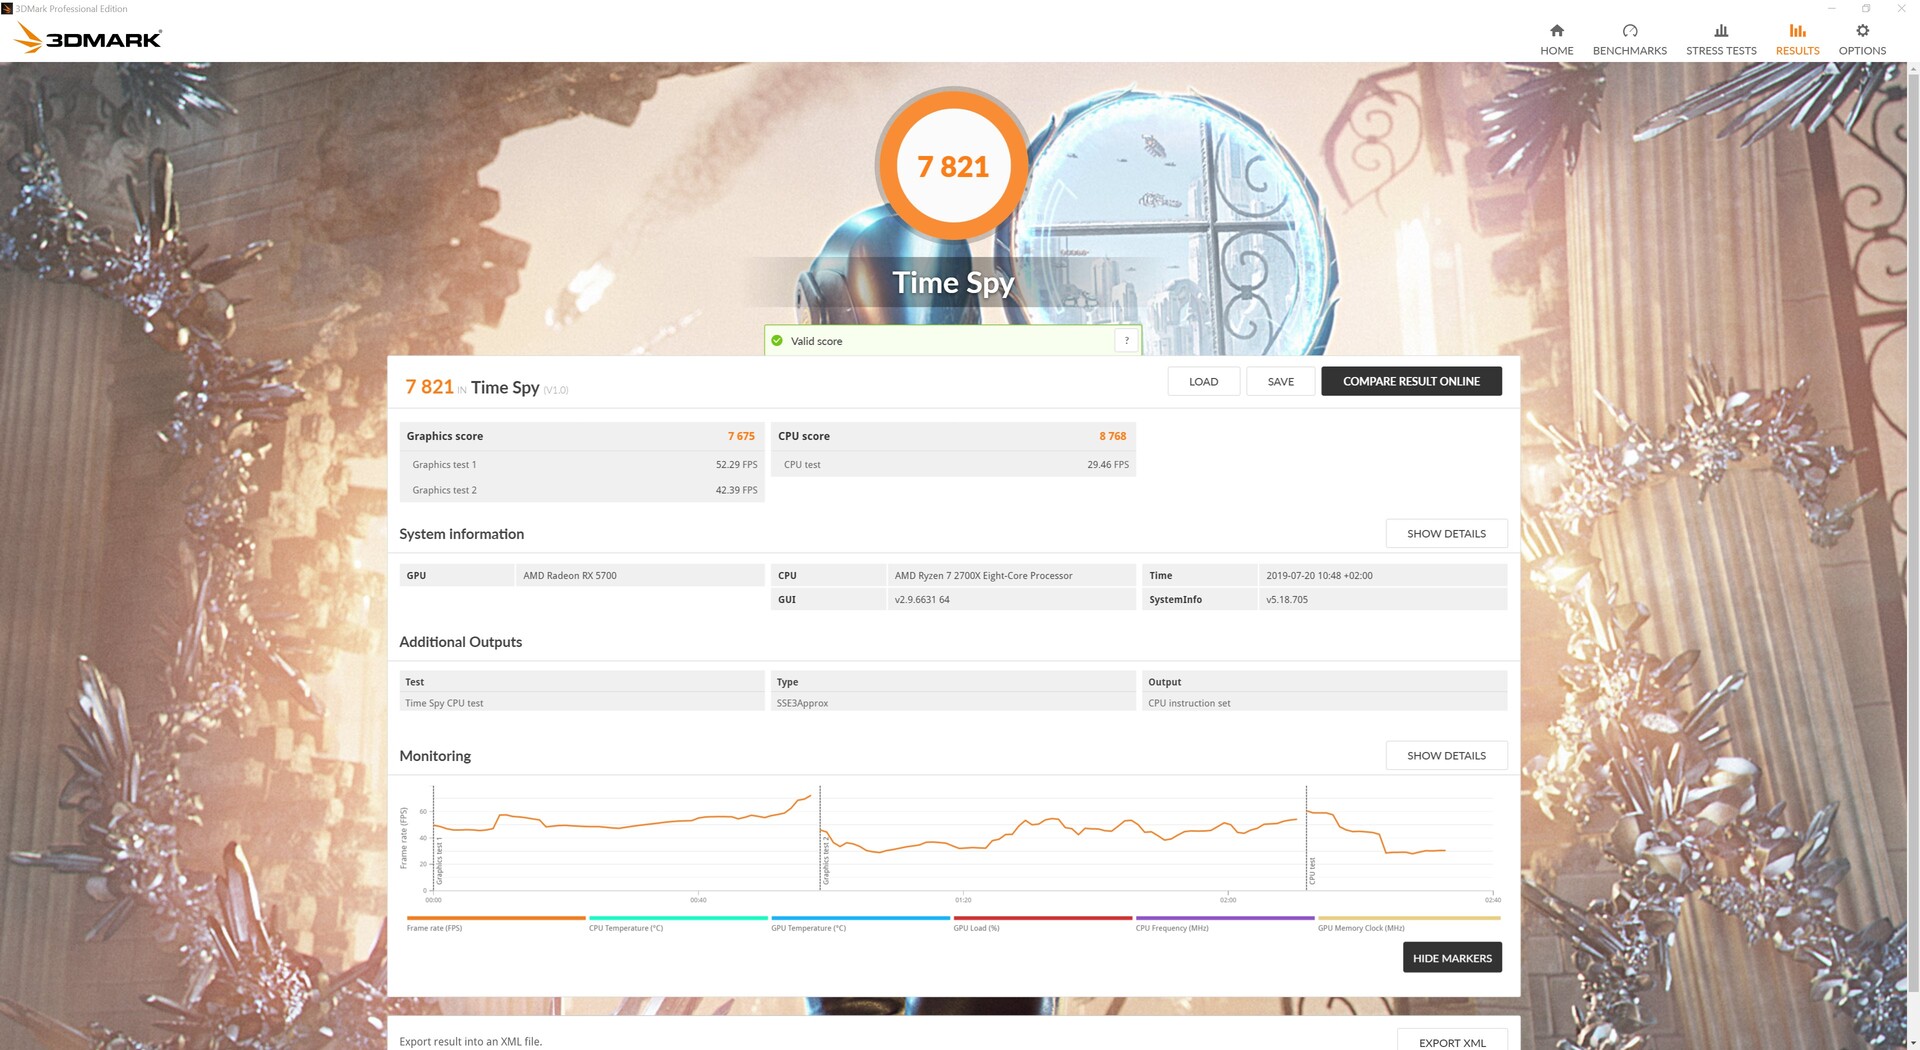
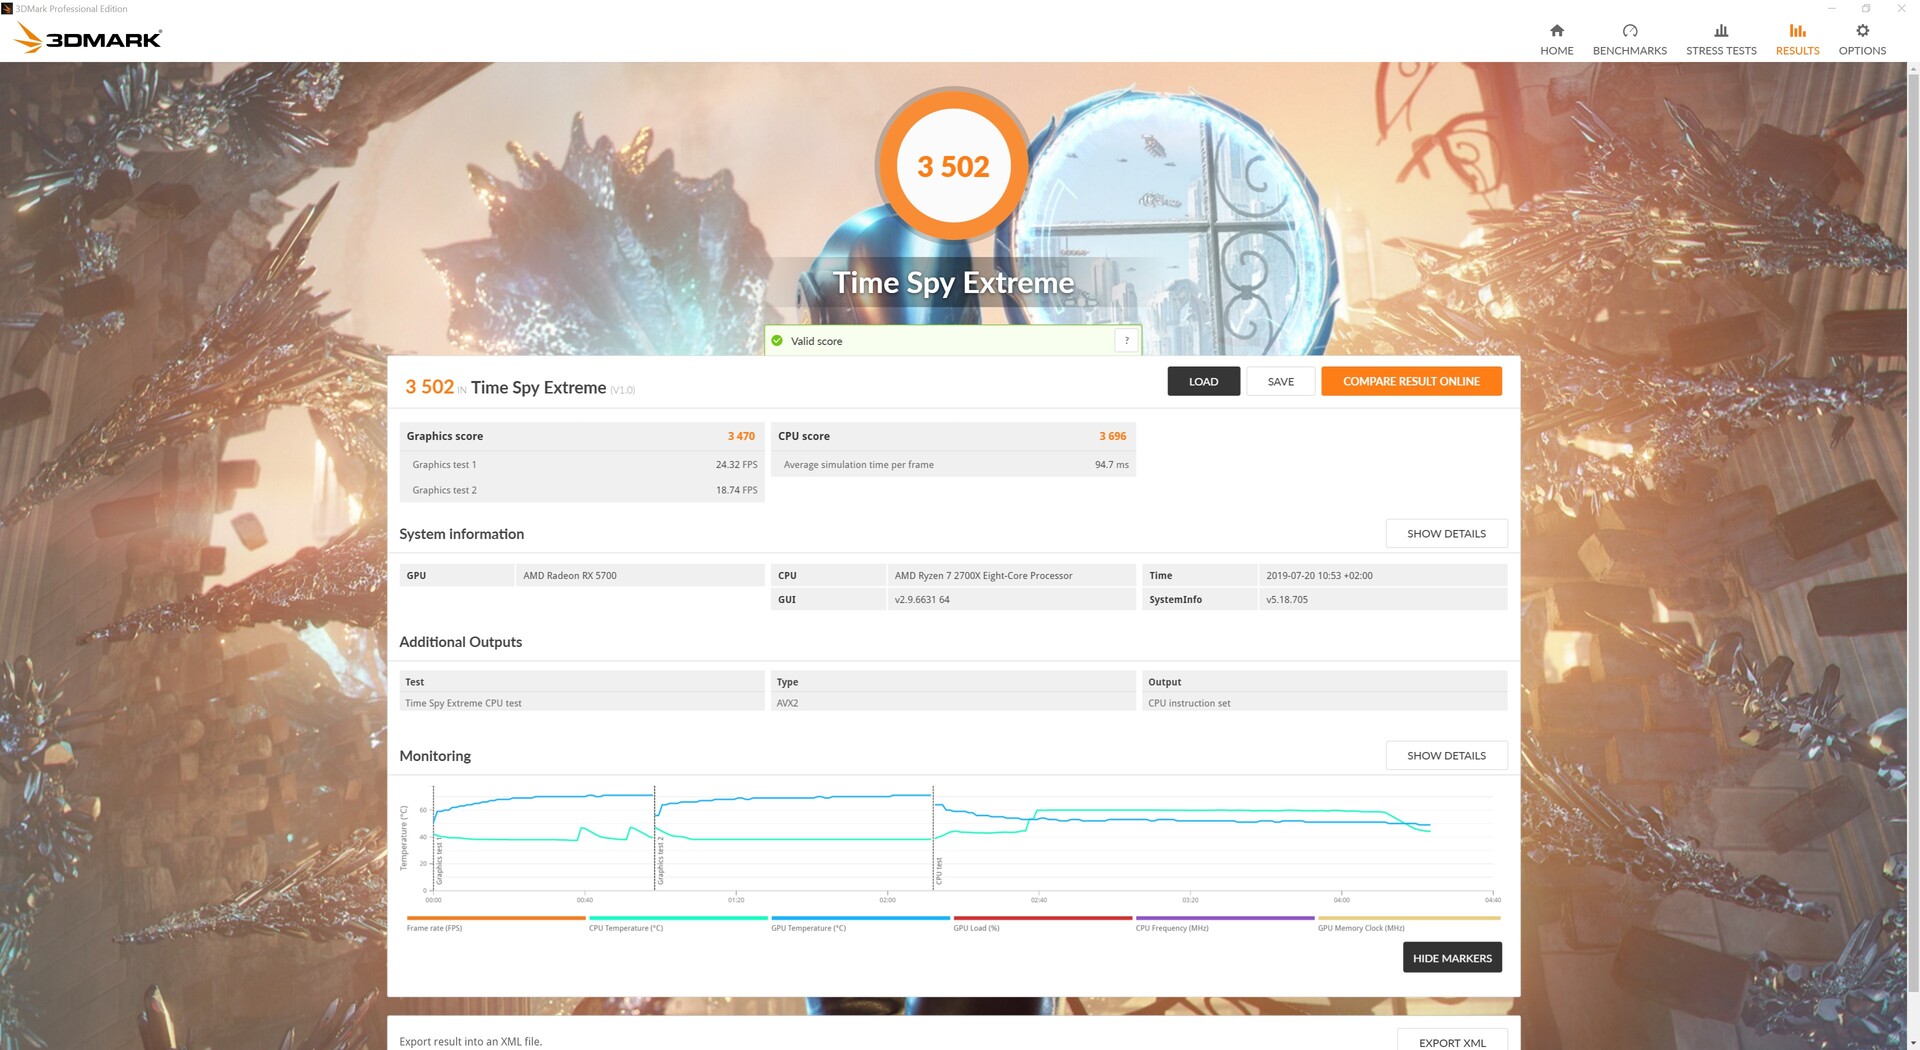
The AMD Radeon RX 5700 is able to attract attention with good results in the synthetic benchmarks à la 3DMark. Not only can the GeForce RTX 2060 from MSI be kept in check but the GeForce RTX 2060S FE can also even be beaten in the tests. Only in the Time Spy benchmark was the RX 5700 unable to achieve this. But things don't look so good with both Unigine benchmarks either. The Navi GPU lags considerably behind its direct contenders from Nvidia here.

| 3DMark 11 - 1280x720 Performance GPU | |
| Nvidia Titan RTX | |
| MSI RTX 2080 Gaming X Trio | |
| AMD Radeon VII | |
| AMD Radeon RX 5700 XT | |
| Nvidia GeForce RTX 2070 Super | |
| AMD Radeon RX 5700 | |
| MSI RTX 2070 Gaming Z 8G | |
| Nvidia GeForce RTX 2060 Super | |
| AMD Radeon RX Vega 64 | |
| MSI RTX 2060 Gaming Z 6G | |
| Unigine Heaven 4.0 | |
| Extreme Preset OpenGL | |
| Nvidia Titan RTX | |
| MSI RTX 2080 Gaming X Trio | |
| Nvidia GeForce RTX 2070 Super | |
| MSI RTX 2070 Gaming Z 8G | |
| Nvidia GeForce RTX 2060 Super | |
| MSI RTX 2060 Gaming Z 6G | |
| AMD Radeon RX 5700 XT | |
| AMD Radeon VII | |
| AMD Radeon RX 5700 | |
| Extreme Preset DX11 | |
| Nvidia Titan RTX | |
| MSI RTX 2080 Gaming X Trio | |
| Nvidia GeForce RTX 2070 Super | |
| MSI RTX 2070 Gaming Z 8G | |
| Nvidia GeForce RTX 2060 Super | |
| AMD Radeon VII | |
| AMD Radeon RX 5700 XT | |
| MSI RTX 2060 Gaming Z 6G | |
| AMD Radeon RX 5700 | |
| Unigine Valley 1.0 | |
| 1920x1080 Extreme HD DirectX AA:x8 | |
| Nvidia Titan RTX | |
| MSI RTX 2080 Gaming X Trio | |
| Nvidia GeForce RTX 2070 Super | |
| MSI RTX 2070 Gaming Z 8G | |
| AMD Radeon VII | |
| Nvidia GeForce RTX 2060 Super | |
| AMD Radeon RX 5700 XT | |
| AMD Radeon RX 5700 | |
| MSI RTX 2060 Gaming Z 6G | |
| 1920x1080 Extreme HD Preset OpenGL AA:x8 | |
| Nvidia Titan RTX | |
| MSI RTX 2080 Gaming X Trio | |
| Nvidia GeForce RTX 2070 Super | |
| MSI RTX 2070 Gaming Z 8G | |
| Nvidia GeForce RTX 2060 Super | |
| AMD Radeon RX 5700 XT | |
| MSI RTX 2060 Gaming Z 6G | |
| AMD Radeon RX 5700 | |
| AMD Radeon VII | |
| 3DMark 05 Standard | 42479 points | |
| 3DMark 06 Standard Score | 36361 points | |
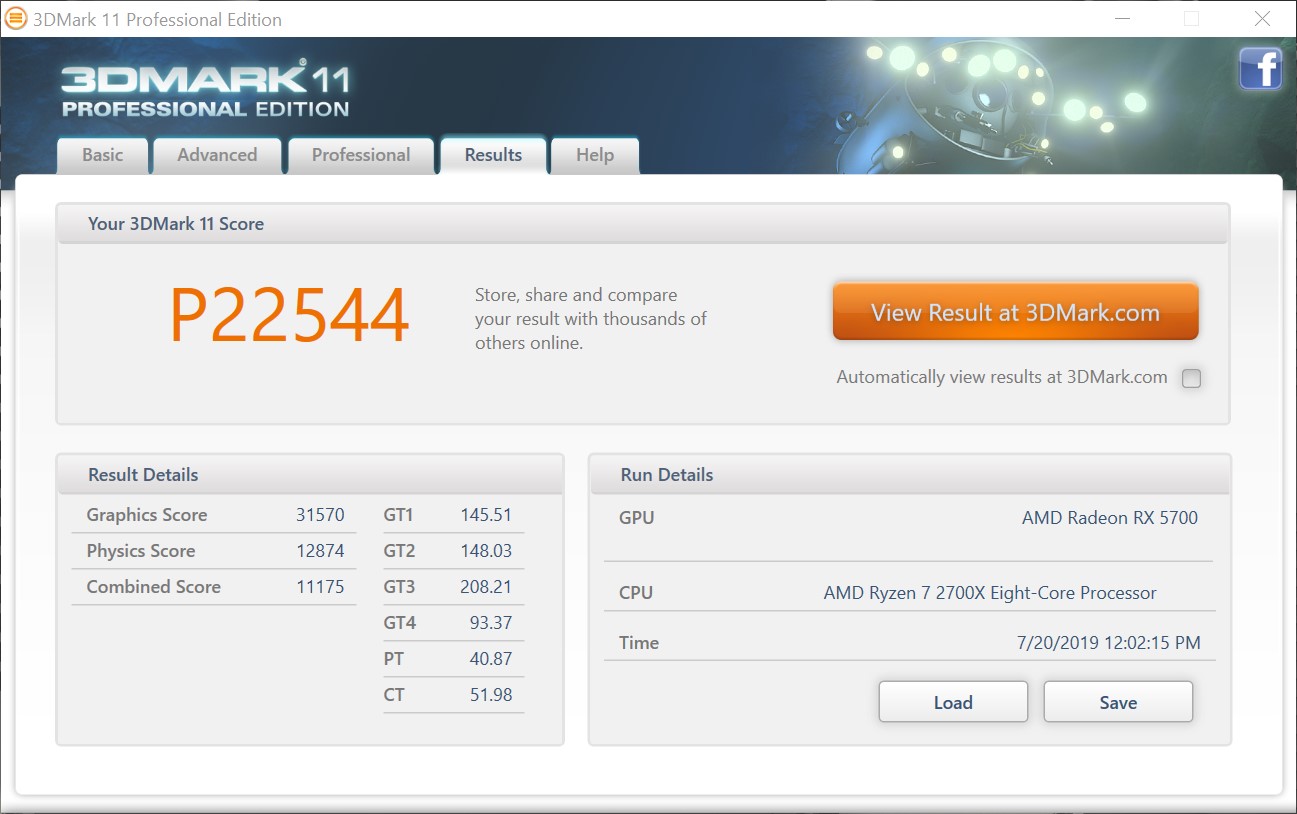
| 3DMark 11 Performance | 22544 points | |
| 3DMark Ice Storm Standard Score | 190068 points | |
| 3DMark Cloud Gate Standard Score | 47899 points | |
| 3DMark Fire Strike Score | 19423 points | |
| 3DMark Fire Strike Extreme Score | 10229 points | |
| 3DMark Time Spy Score | 7821 points | |
Help | ||
Gaming benchmarks
Synthetic benchmarks don't reflect the real performance of a graphics card in modern games. The Radeon RX 5700 was almost always able to place itself ahead of the MSI RTX 2060 Gaming Z 6G in our test course. The GeForce RTX 2060S FE from Nvidia is a bit faster, although the RX 5700 is on par in certain games. In the modern title F1 2019, the Navi GPU is slightly faster even. It only remains to be said that both pixel accelerators work almost equally fast. Depending on how games are optimized and how well the manufacturer tuned the drivers, there are slight differences in performance. There isn't a clear winner or loser. However, the support of ray tracing is a plus for Nvidia. At the moment, AMD still can't show anything in this regard.
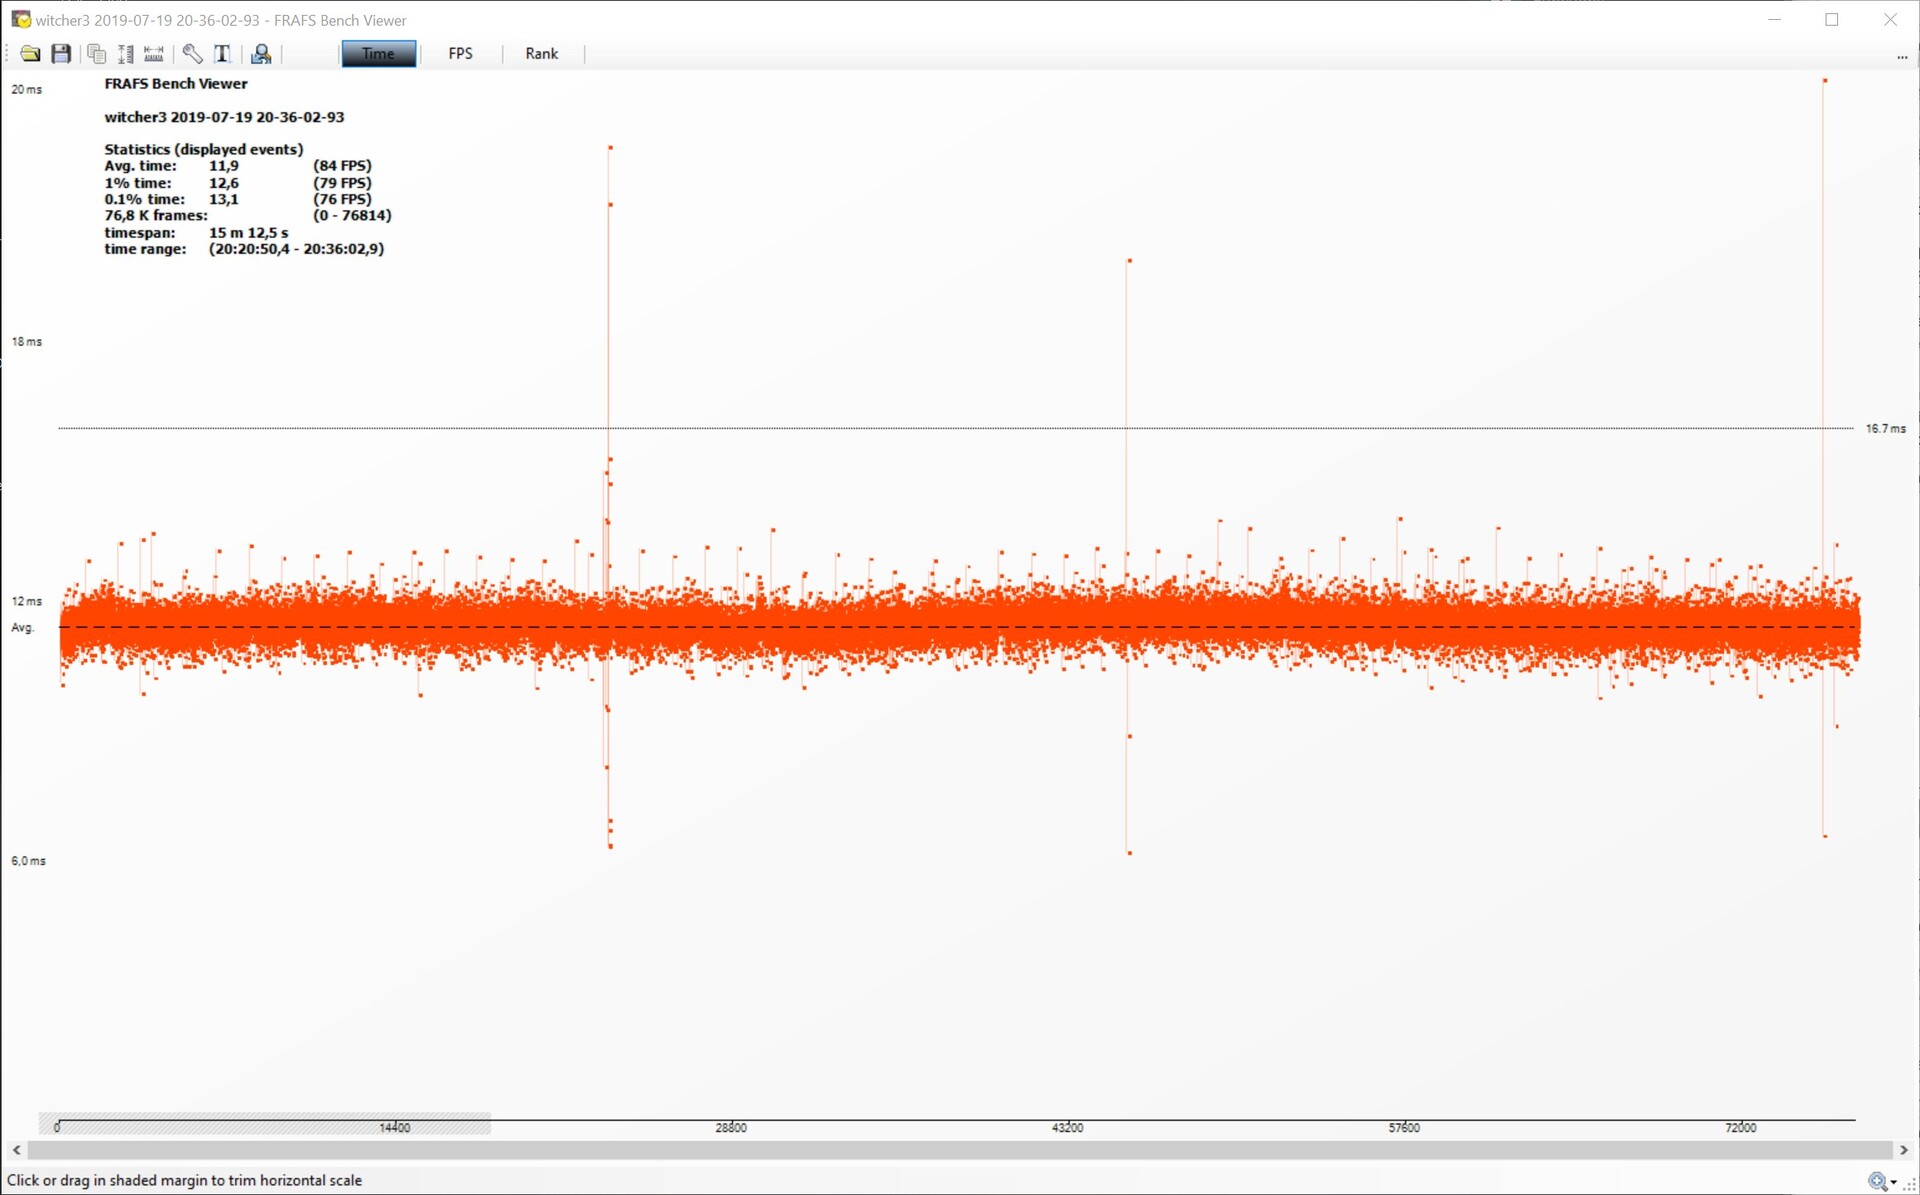
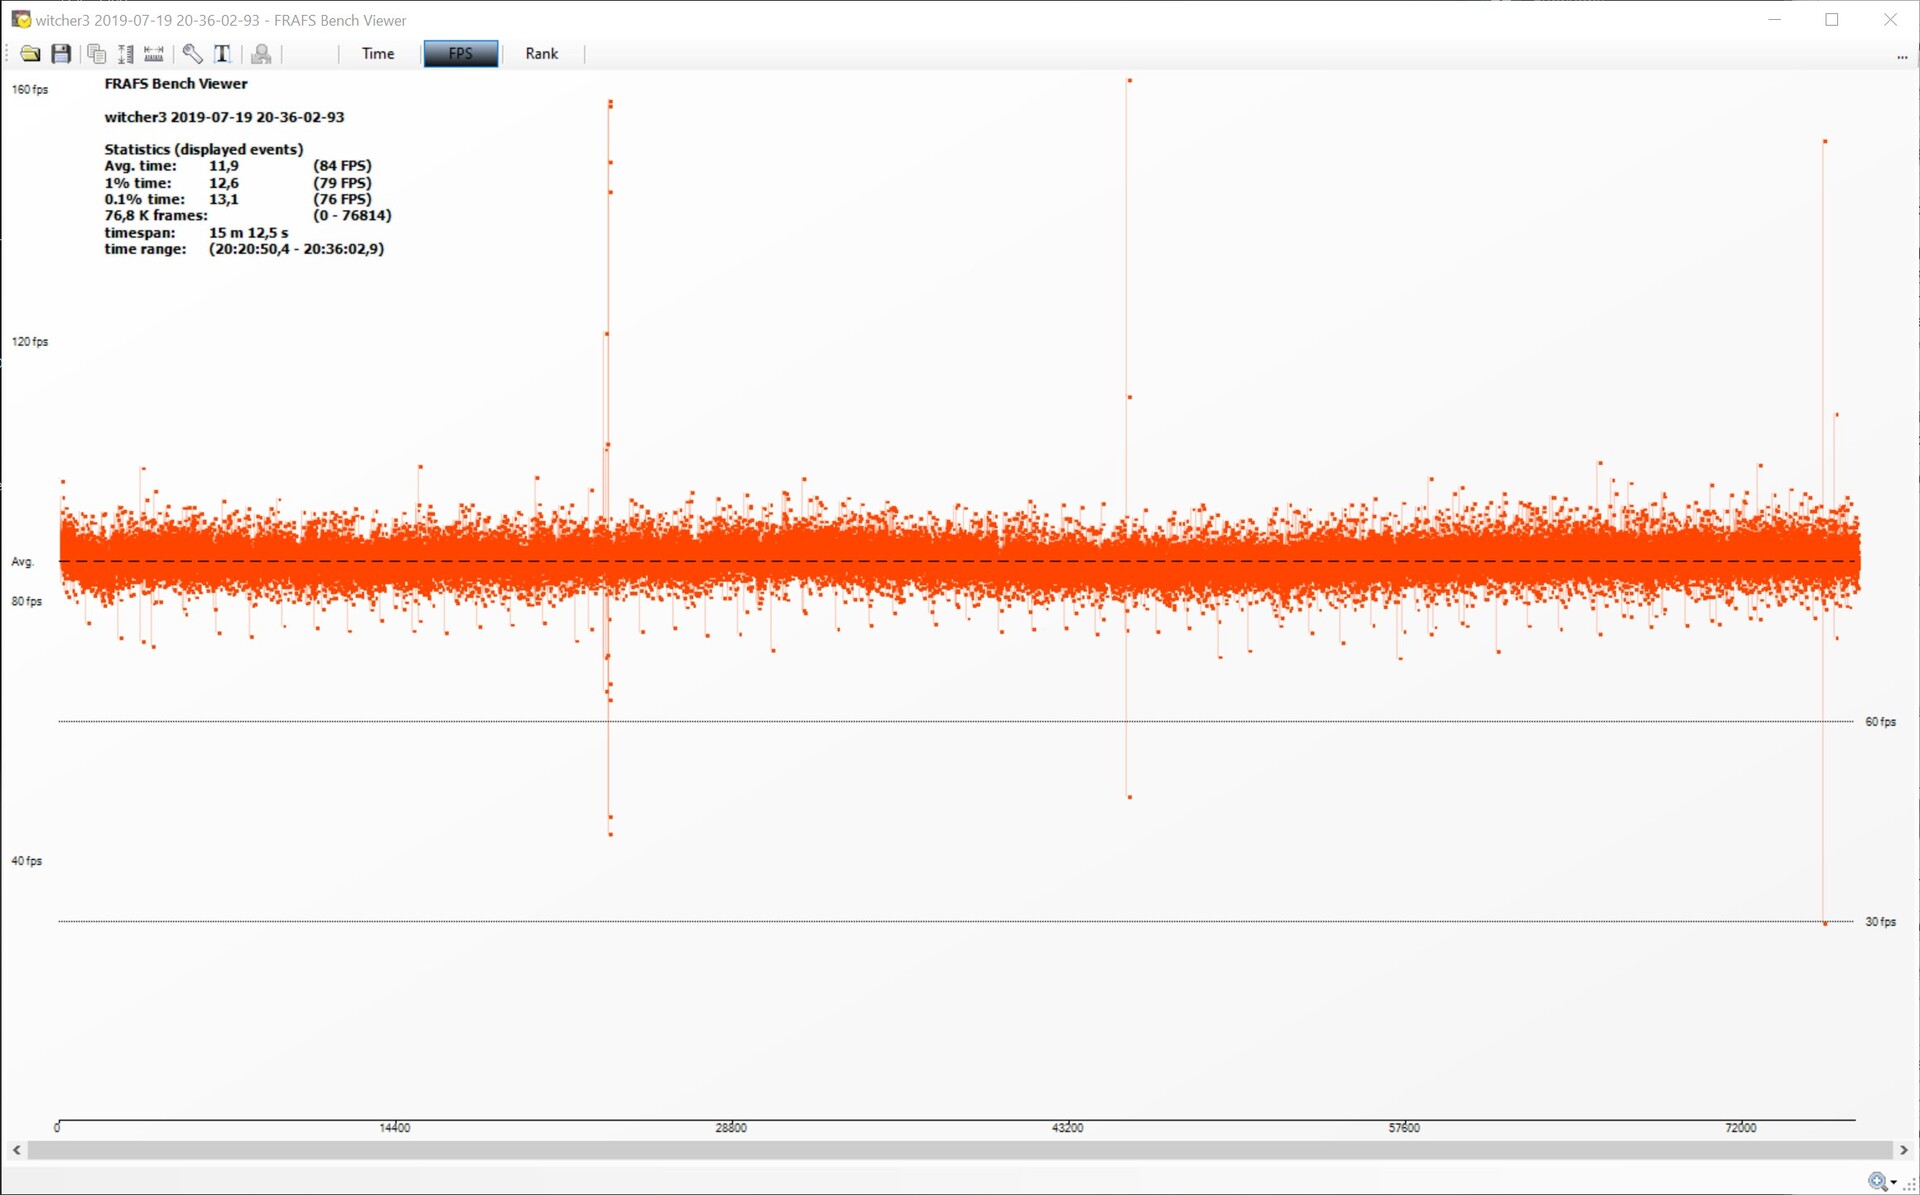
The frame times for the Radeon RX 5700 are considerably better compared to the RTX 2060S. Although individual drops are documented and graphically visible, they don't have a negative impact on the gaming experience. The frame rates also show a much steadier progress in the test with The Witcher 3 (ultra preset) compared to the GeForce RTX 2060S FE. With an average of 84.2 fps, smooth gaming is guaranteed.
The AMD Radeon RX 5700 is suitable for games at a 1440p resolution. The graphics card's performance drops significantly more at higher resolutions, as was the case with the GeForce RTX 2060S. The GeForce card is not suitable for 4K gaming without compromises either. The advertised support for 1440p gaming with the Radeon RX 5700 is alright, even if the graphics card breaks a proper sweat with the modern Anno 1800 at QHD.
The Witcher 3 frame rates ultra preset
| Call of Duty Black Ops 4 | |
| 1920x1080 Very High / On | |
| Nvidia Titan RTX | |
| MSI RTX 2080 Gaming X Trio | |
| AMD Radeon RX Vega 64 | |
| Nvidia GeForce RTX 2070 Super | |
| MSI RTX 2070 Gaming Z 8G | |
| AMD Radeon VII | |
| Nvidia GeForce RTX 2060 Super | |
| AMD Radeon RX 5700 XT | |
| MSI RTX 2060 Gaming Z 6G | |
| AMD Radeon RX 5700 | |
| 3840x2160 Very High / On | |
| Nvidia Titan RTX | |
| MSI RTX 2080 Gaming X Trio | |
| AMD Radeon RX Vega 64 | |
| AMD Radeon VII | |
| AMD Radeon RX 5700 XT | |
| Nvidia GeForce RTX 2070 Super | |
| AMD Radeon RX 5700 | |
| Nvidia GeForce RTX 2060 Super | |
| MSI RTX 2070 Gaming Z 8G | |
| MSI RTX 2060 Gaming Z 6G | |
| 2560x1440 Very High / On | |
| AMD Radeon RX 5700 XT | |
| MSI RTX 2080 Gaming X Trio | |
| Nvidia GeForce RTX 2070 Super | |
| MSI RTX 2070 Gaming Z 8G | |
| AMD Radeon RX 5700 | |
| Nvidia GeForce RTX 2060 Super | |
| Assassin´s Creed Odyssey | |
| 1920x1080 Ultra High Preset | |
| Nvidia Titan RTX | |
| MSI RTX 2080 Gaming X Trio | |
| MSI RTX 2070 Gaming Z 8G | |
| Nvidia GeForce RTX 2070 Super | |
| AMD Radeon VII | |
| AMD Radeon RX 5700 XT | |
| Nvidia GeForce RTX 2060 Super | |
| AMD Radeon RX 5700 | |
| MSI RTX 2060 Gaming Z 6G | |
| AMD Radeon RX Vega 64 | |
| 3840x2160 Ultra High Preset | |
| Nvidia Titan RTX | |
| AMD Radeon VII | |
| MSI RTX 2080 Gaming X Trio | |
| Nvidia GeForce RTX 2070 Super | |
| MSI RTX 2070 Gaming Z 8G | |
| AMD Radeon RX 5700 XT | |
| Nvidia GeForce RTX 2060 Super | |
| AMD Radeon RX 5700 | |
| AMD Radeon RX Vega 64 | |
| MSI RTX 2060 Gaming Z 6G | |
| 2560x1440 Ultra High Preset | |
| MSI RTX 2080 Gaming X Trio | |
| Nvidia GeForce RTX 2070 Super | |
| MSI RTX 2070 Gaming Z 8G | |
| AMD Radeon RX 5700 XT | |
| Nvidia GeForce RTX 2060 Super | |
| AMD Radeon RX 5700 | |
| FIFA 19 | |
| 1920x1080 Ultra Preset AA:4x MS | |
| AMD Radeon RX Vega 64 | |
| AMD Radeon RX 5700 XT | |
| AMD Radeon RX 5700 | |
| Nvidia GeForce RTX 2070 Super | |
| Nvidia Titan RTX | |
| MSI RTX 2080 Gaming X Trio | |
| AMD Radeon VII | |
| MSI RTX 2070 Gaming Z 8G | |
| Nvidia GeForce RTX 2060 Super | |
| MSI RTX 2060 Gaming Z 6G | |
| 3840x2160 Ultra Preset AA:4x MS | |
| Nvidia Titan RTX | |
| AMD Radeon VII | |
| MSI RTX 2080 Gaming X Trio | |
| AMD Radeon RX 5700 XT | |
| Nvidia GeForce RTX 2060 Super | |
| MSI RTX 2070 Gaming Z 8G | |
| Nvidia GeForce RTX 2070 Super | |
| AMD Radeon RX 5700 | |
| AMD Radeon RX Vega 64 | |
| MSI RTX 2060 Gaming Z 6G | |
| 2560x1440 Ultra Preset AA:4x MS | |
| AMD Radeon RX 5700 XT | |
| AMD Radeon RX 5700 | |
| Nvidia GeForce RTX 2070 Super | |
| MSI RTX 2080 Gaming X Trio | |
| Nvidia GeForce RTX 2060 Super | |
| MSI RTX 2070 Gaming Z 8G | |
| Forza Horizon 4 | |
| 1920x1080 Ultra Preset AA:2xMS | |
| MSI RTX 2080 Gaming X Trio | |
| AMD Radeon RX 5700 XT | |
| Nvidia Titan RTX | |
| AMD Radeon VII | |
| Nvidia GeForce RTX 2070 Super | |
| AMD Radeon RX Vega 64 | |
| AMD Radeon RX 5700 | |
| MSI RTX 2070 Gaming Z 8G | |
| Nvidia GeForce RTX 2060 Super | |
| MSI RTX 2060 Gaming Z 6G | |
| 3840x2160 Ultra Preset AA:2xMS | |
| Nvidia Titan RTX | |
| MSI RTX 2080 Gaming X Trio | |
| AMD Radeon RX 5700 XT | |
| AMD Radeon VII | |
| Nvidia GeForce RTX 2070 Super | |
| AMD Radeon RX 5700 | |
| MSI RTX 2070 Gaming Z 8G | |
| AMD Radeon RX Vega 64 | |
| Nvidia GeForce RTX 2060 Super | |
| MSI RTX 2060 Gaming Z 6G | |
| 2560x1440 Ultra Preset AA:2xMS | |
| AMD Radeon RX 5700 XT | |
| MSI RTX 2080 Gaming X Trio | |
| Nvidia GeForce RTX 2070 Super | |
| AMD Radeon RX 5700 | |
| MSI RTX 2070 Gaming Z 8G | |
| Nvidia GeForce RTX 2060 Super | |
| Monster Hunter World | |
| 1920x1080 Highest Preset (Image Quality High) | |
| Nvidia Titan RTX | |
| MSI RTX 2080 Gaming X Trio | |
| Nvidia GeForce RTX 2070 Super | |
| MSI RTX 2070 Gaming Z 8G | |
| AMD Radeon VII | |
| Nvidia GeForce RTX 2060 Super | |
| AMD Radeon RX 5700 XT | |
| MSI RTX 2060 Gaming Z 6G | |
| AMD Radeon RX Vega 64 | |
| AMD Radeon RX 5700 | |
| 3840x2160 Highest Preset (Image Quality High) | |
| Nvidia Titan RTX | |
| MSI RTX 2080 Gaming X Trio | |
| Nvidia GeForce RTX 2070 Super | |
| AMD Radeon VII | |
| MSI RTX 2070 Gaming Z 8G | |
| AMD Radeon RX 5700 XT | |
| AMD Radeon RX Vega 64 | |
| Nvidia GeForce RTX 2060 Super | |
| AMD Radeon RX 5700 | |
| MSI RTX 2060 Gaming Z 6G | |
| 2560x1440 Highest Preset (Image Quality High) | |
| MSI RTX 2080 Gaming X Trio | |
| Nvidia GeForce RTX 2070 Super | |
| MSI RTX 2070 Gaming Z 8G | |
| AMD Radeon RX 5700 XT | |
| Nvidia GeForce RTX 2060 Super | |
| AMD Radeon RX 5700 | |
| Far Cry 5 | |
| 1920x1080 Ultra Preset AA:T | |
| MSI RTX 2080 Gaming X Trio | |
| Nvidia Titan RTX | |
| MSI RTX 2070 Gaming Z 8G | |
| AMD Radeon RX Vega 64 | |
| Nvidia GeForce RTX 2060 Super | |
| Nvidia GeForce RTX 2070 Super | |
| AMD Radeon RX 5700 XT | |
| MSI RTX 2060 Gaming Z 6G | |
| AMD Radeon VII | |
| AMD Radeon RX 5700 | |
| 3840x2160 Ultra Preset AA:T | |
| Nvidia Titan RTX | |
| MSI RTX 2080 Gaming X Trio | |
| AMD Radeon VII | |
| Nvidia GeForce RTX 2070 Super | |
| AMD Radeon RX 5700 XT | |
| MSI RTX 2070 Gaming Z 8G | |
| Nvidia GeForce RTX 2060 Super | |
| AMD Radeon RX 5700 | |
| AMD Radeon RX Vega 64 | |
| MSI RTX 2060 Gaming Z 6G | |
| 2560x1440 Ultra Preset AA:T | |
| MSI RTX 2080 Gaming X Trio | |
| Nvidia GeForce RTX 2070 Super | |
| AMD Radeon RX 5700 XT | |
| MSI RTX 2070 Gaming Z 8G | |
| Nvidia GeForce RTX 2060 Super | |
| AMD Radeon RX 5700 | |
| The Crew 2 | |
| 1920x1080 Ultra Preset | |
| Nvidia Titan RTX | |
| MSI RTX 2060 Gaming Z 6G | |
| MSI RTX 2070 Gaming Z 8G | |
| MSI RTX 2080 Gaming X Trio | |
| AMD Radeon VII | |
| Nvidia GeForce RTX 2060 Super | |
| Nvidia GeForce RTX 2070 Super | |
| AMD Radeon RX 5700 | |
| AMD Radeon RX 5700 XT | |
| 3840x2160 Ultra Preset | |
| Nvidia Titan RTX | |
| MSI RTX 2080 Gaming X Trio | |
| Nvidia GeForce RTX 2070 Super | |
| AMD Radeon RX 5700 XT | |
| MSI RTX 2070 Gaming Z 8G | |
| AMD Radeon VII | |
| AMD Radeon RX 5700 | |
| Nvidia GeForce RTX 2060 Super | |
| MSI RTX 2060 Gaming Z 6G | |
| 2560x1440 Ultra Preset | |
| MSI RTX 2070 Gaming Z 8G | |
| MSI RTX 2080 Gaming X Trio | |
| Nvidia GeForce RTX 2070 Super | |
| AMD Radeon RX 5700 | |
| AMD Radeon RX 5700 XT | |
| Nvidia GeForce RTX 2060 Super | |
| Assassin´s Creed Origins | |
| 1920x1080 Ultra High Preset | |
| Nvidia Titan RTX | |
| MSI RTX 2080 Gaming X Trio | |
| MSI RTX 2070 Gaming Z 8G | |
| Nvidia GeForce RTX 2070 Super | |
| Nvidia GeForce RTX 2060 Super | |
| MSI RTX 2060 Gaming Z 6G | |
| AMD Radeon RX Vega 64 | |
| AMD Radeon VII | |
| AMD Radeon RX 5700 | |
| AMD Radeon RX 5700 XT | |
| 3840x2160 Ultra High Preset | |
| Nvidia Titan RTX | |
| MSI RTX 2080 Gaming X Trio | |
| AMD Radeon VII | |
| Nvidia GeForce RTX 2070 Super | |
| MSI RTX 2070 Gaming Z 8G | |
| Nvidia GeForce RTX 2060 Super | |
| MSI RTX 2060 Gaming Z 6G | |
| AMD Radeon RX 5700 XT | |
| AMD Radeon RX 5700 | |
| AMD Radeon RX Vega 64 | |
| 2560x1440 Ultra High Preset | |
| MSI RTX 2080 Gaming X Trio | |
| Nvidia GeForce RTX 2070 Super | |
| MSI RTX 2070 Gaming Z 8G | |
| Nvidia GeForce RTX 2060 Super | |
| AMD Radeon RX 5700 XT | |
| AMD Radeon RX 5700 | |
| Kingdom Come: Deliverance | |
| 1920x1080 Ultra High Preset | |
| Nvidia Titan RTX | |
| MSI RTX 2080 Gaming X Trio | |
| Nvidia GeForce RTX 2070 Super | |
| MSI RTX 2070 Gaming Z 8G | |
| Nvidia GeForce RTX 2060 Super | |
| AMD Radeon RX 5700 XT | |
| AMD Radeon RX Vega 64 | |
| AMD Radeon VII | |
| MSI RTX 2060 Gaming Z 6G | |
| AMD Radeon RX 5700 | |
| 3840x2160 Ultra High Preset | |
| Nvidia Titan RTX | |
| MSI RTX 2080 Gaming X Trio | |
| AMD Radeon RX Vega 64 | |
| Nvidia GeForce RTX 2070 Super | |
| AMD Radeon VII | |
| MSI RTX 2070 Gaming Z 8G | |
| Nvidia GeForce RTX 2060 Super | |
| AMD Radeon RX 5700 XT | |
| AMD Radeon RX 5700 | |
| MSI RTX 2060 Gaming Z 6G | |
| 2560x1440 Ultra High Preset | |
| MSI RTX 2080 Gaming X Trio | |
| Nvidia GeForce RTX 2070 Super | |
| AMD Radeon RX 5700 XT | |
| Nvidia GeForce RTX 2060 Super | |
| MSI RTX 2070 Gaming Z 8G | |
| AMD Radeon RX 5700 | |
| Fortnite | |
| 1920x1080 Epic Preset | |
| Nvidia GeForce RTX 2070 Super | |
| Nvidia GeForce RTX 2060 Super | |
| MSI RTX 2080 Gaming X Trio | |
| AMD Radeon RX 5700 XT | |
| MSI RTX 2060 Gaming Z 6G | |
| MSI RTX 2070 Gaming Z 8G | |
| Nvidia Titan RTX | |
| AMD Radeon RX 5700 | |
| AMD Radeon VII | |
| 3840x2160 Epic Preset | |
| Nvidia Titan RTX | |
| MSI RTX 2080 Gaming X Trio | |
| Nvidia GeForce RTX 2070 Super | |
| MSI RTX 2070 Gaming Z 8G | |
| Nvidia GeForce RTX 2060 Super | |
| AMD Radeon RX 5700 XT | |
| AMD Radeon VII | |
| AMD Radeon RX 5700 | |
| MSI RTX 2060 Gaming Z 6G | |
| 2560x1440 Epic Preset | |
| MSI RTX 2080 Gaming X Trio | |
| Nvidia GeForce RTX 2070 Super | |
| MSI RTX 2070 Gaming Z 8G | |
| Nvidia GeForce RTX 2060 Super | |
| AMD Radeon RX 5700 XT | |
| AMD Radeon RX 5700 | |
| Far Cry Primal | |
| 1920x1080 Ultra Preset AA:SM | |
| AMD Radeon RX Vega 64 | |
| MSI RTX 2070 Gaming Z 8G | |
| AMD Radeon VII | |
| MSI RTX 2060 Gaming Z 6G | |
| AMD Radeon RX 5700 | |
| MSI RTX 2080 Gaming X Trio | |
| Nvidia GeForce RTX 2060 Super | |
| Nvidia GeForce RTX 2070 Super | |
| AMD Radeon RX 5700 XT | |
| Nvidia Titan RTX | |
| 3840x2160 High Preset AA:SM | |
| Nvidia Titan RTX | |
| MSI RTX 2080 Gaming X Trio | |
| AMD Radeon VII | |
| Nvidia GeForce RTX 2070 Super | |
| MSI RTX 2070 Gaming Z 8G | |
| AMD Radeon RX 5700 XT | |
| Nvidia GeForce RTX 2060 Super | |
| AMD Radeon RX 5700 | |
| MSI RTX 2060 Gaming Z 6G | |
| AMD Radeon RX Vega 64 | |
| The Witcher 3 | |
| 1920x1080 Ultra Graphics & Postprocessing (HBAO+) | |
| Nvidia Titan RTX | |
| MSI RTX 2080 Gaming X Trio | |
| Nvidia GeForce RTX 2070 Super | |
| AMD Radeon RX 5700 XT | |
| MSI RTX 2070 Gaming Z 8G | |
| AMD Radeon RX 5700 | |
| Nvidia GeForce RTX 2060 Super | |
| AMD Radeon RX Vega 64 | |
| AMD Radeon VII | |
| MSI RTX 2060 Gaming Z 6G | |
| 3840x2160 High Graphics & Postprocessing (Nvidia HairWorks Off) | |
| Nvidia Titan RTX | |
| MSI RTX 2080 Gaming X Trio | |
| Nvidia GeForce RTX 2070 Super | |
| MSI RTX 2070 Gaming Z 8G | |
| Nvidia GeForce RTX 2060 Super | |
| AMD Radeon VII | |
| AMD Radeon RX 5700 XT | |
| MSI RTX 2060 Gaming Z 6G | |
| AMD Radeon RX Vega 64 | |
| AMD Radeon RX 5700 | |
| The Division | |
| 1920x1080 Ultra Preset AF:16x | |
| Nvidia Titan RTX | |
| MSI RTX 2080 Gaming X Trio | |
| AMD Radeon RX 5700 XT | |
| AMD Radeon RX 5700 | |
| Nvidia GeForce RTX 2070 Super | |
| MSI RTX 2070 Gaming Z 8G | |
| Nvidia GeForce RTX 2060 Super | |
| AMD Radeon RX Vega 64 | |
| MSI RTX 2060 Gaming Z 6G | |
| AMD Radeon VII | |
| 3840x2160 High Preset AF:8x | |
| Nvidia Titan RTX | |
| MSI RTX 2080 Gaming X Trio | |
| AMD Radeon RX 5700 XT | |
| Nvidia GeForce RTX 2070 Super | |
| AMD Radeon VII | |
| MSI RTX 2070 Gaming Z 8G | |
| AMD Radeon RX 5700 | |
| Nvidia GeForce RTX 2060 Super | |
| AMD Radeon RX Vega 64 | |
| MSI RTX 2060 Gaming Z 6G | |
| For Honor | |
| 1920x1080 Extreme Preset AA:T AF:16x | |
| Nvidia Titan RTX | |
| MSI RTX 2080 Gaming X Trio | |
| AMD Radeon RX 5700 XT | |
| Nvidia GeForce RTX 2070 Super | |
| AMD Radeon RX 5700 | |
| MSI RTX 2070 Gaming Z 8G | |
| Nvidia GeForce RTX 2060 Super | |
| AMD Radeon RX Vega 64 | |
| MSI RTX 2060 Gaming Z 6G | |
| AMD Radeon VII | |
| 3840x2160 High Preset AA:T AF:8x | |
| Nvidia Titan RTX | |
| MSI RTX 2080 Gaming X Trio | |
| Nvidia GeForce RTX 2070 Super | |
| AMD Radeon VII | |
| AMD Radeon RX 5700 XT | |
| MSI RTX 2070 Gaming Z 8G | |
| Nvidia GeForce RTX 2060 Super | |
| AMD Radeon RX 5700 | |
| MSI RTX 2060 Gaming Z 6G | |
| AMD Radeon RX Vega 64 | |
| Ghost Recon Wildlands | |
| 1920x1080 Ultra Preset AA:T AF:16x | |
| Nvidia Titan RTX | |
| MSI RTX 2080 Gaming X Trio | |
| Nvidia GeForce RTX 2070 Super | |
| AMD Radeon RX 5700 XT | |
| MSI RTX 2070 Gaming Z 8G | |
| Nvidia GeForce RTX 2060 Super | |
| AMD Radeon RX 5700 | |
| MSI RTX 2060 Gaming Z 6G | |
| AMD Radeon RX Vega 64 | |
| AMD Radeon VII | |
| 3840x2160 Ultra Preset AA:T AF:16x | |
| Nvidia Titan RTX | |
| MSI RTX 2080 Gaming X Trio | |
| Nvidia GeForce RTX 2070 Super | |
| AMD Radeon RX 5700 XT | |
| MSI RTX 2070 Gaming Z 8G | |
| AMD Radeon RX 5700 | |
| Nvidia GeForce RTX 2060 Super | |
| GTA V | |
| 1920x1080 Highest AA:4xMSAA + FX AF:16x | |
| Nvidia Titan RTX | |
| MSI RTX 2080 Gaming X Trio | |
| AMD Radeon VII | |
| MSI RTX 2070 Gaming Z 8G | |
| MSI RTX 2060 Gaming Z 6G | |
| Nvidia GeForce RTX 2060 Super | |
| Nvidia GeForce RTX 2070 Super | |
| AMD Radeon RX 5700 | |
| AMD Radeon RX 5700 XT | |
| 3840x2160 High/On (Advanced Graphics Off) AA:FX AF:8x | |
| Nvidia Titan RTX | |
| Nvidia GeForce RTX 2070 Super | |
| AMD Radeon RX 5700 XT | |
| MSI RTX 2080 Gaming X Trio | |
| Nvidia GeForce RTX 2060 Super | |
| AMD Radeon RX 5700 | |
| AMD Radeon VII | |
| MSI RTX 2070 Gaming Z 8G | |
| MSI RTX 2060 Gaming Z 6G | |
| Hitman 2 | |
| 1920x1080 Ultra AF:16x | |
| AMD Radeon VII | |
| AMD Radeon RX 5700 XT | |
| AMD Radeon RX 5700 | |
| MSI RTX 2060 Gaming Z 6G | |
| MSI RTX 2080 Gaming X Trio | |
| Nvidia GeForce RTX 2060 Super | |
| AMD Radeon RX Vega 64 | |
| MSI RTX 2070 Gaming Z 8G | |
| Nvidia GeForce RTX 2070 Super | |
| Nvidia Titan RTX | |
| 3840x2160 Ultra AF:16x | |
| Nvidia Titan RTX | |
| MSI RTX 2080 Gaming X Trio | |
| Nvidia GeForce RTX 2070 Super | |
| AMD Radeon VII | |
| AMD Radeon RX 5700 XT | |
| AMD Radeon RX Vega 64 | |
| MSI RTX 2070 Gaming Z 8G | |
| AMD Radeon RX 5700 | |
| Nvidia GeForce RTX 2060 Super | |
| MSI RTX 2060 Gaming Z 6G | |
| 2560x1440 Ultra AF:16x | |
| MSI RTX 2080 Gaming X Trio | |
| AMD Radeon RX 5700 XT | |
| AMD Radeon RX 5700 | |
| Nvidia GeForce RTX 2070 Super | |
| MSI RTX 2070 Gaming Z 8G | |
| Nvidia GeForce RTX 2060 Super | |
| Battlefield V | |
| 1920x1080 Ultra Preset | |
| Nvidia Titan RTX | |
| MSI RTX 2080 Gaming X Trio | |
| AMD Radeon RX Vega 64 | |
| AMD Radeon VII | |
| MSI RTX 2070 Gaming Z 8G | |
| MSI RTX 2060 Gaming Z 6G | |
| AMD Radeon RX 5700 XT | |
| AMD Radeon RX 5700 | |
| Nvidia GeForce RTX 2070 Super | |
| Nvidia GeForce RTX 2060 Super | |
| 3840x2160 Ultra Preset | |
| Nvidia Titan RTX | |
| MSI RTX 2080 Gaming X Trio | |
| AMD Radeon VII | |
| MSI RTX 2070 Gaming Z 8G | |
| AMD Radeon RX Vega 64 | |
| AMD Radeon RX 5700 XT | |
| AMD Radeon RX 5700 | |
| MSI RTX 2060 Gaming Z 6G | |
| Nvidia GeForce RTX 2070 Super | |
| Nvidia GeForce RTX 2060 Super | |
| 2560x1440 Ultra Preset | |
| MSI RTX 2080 Gaming X Trio | |
| MSI RTX 2070 Gaming Z 8G | |
| AMD Radeon RX 5700 XT | |
| AMD Radeon RX 5700 | |
| Nvidia GeForce RTX 2070 Super | |
| Nvidia GeForce RTX 2060 Super | |
| Farming Simulator 19 | |
| 1920x1080 Very High Preset | |
| Nvidia Titan RTX | |
| MSI RTX 2080 Gaming X Trio | |
| MSI RTX 2060 Gaming Z 6G | |
| Nvidia GeForce RTX 2070 Super | |
| MSI RTX 2070 Gaming Z 8G | |
| Nvidia GeForce RTX 2060 Super | |
| AMD Radeon RX 5700 XT | |
| AMD Radeon VII | |
| AMD Radeon RX Vega 64 | |
| AMD Radeon RX 5700 | |
| 3840x2160 Very High Preset | |
| Nvidia Titan RTX | |
| MSI RTX 2080 Gaming X Trio | |
| Nvidia GeForce RTX 2070 Super | |
| MSI RTX 2070 Gaming Z 8G | |
| Nvidia GeForce RTX 2060 Super | |
| MSI RTX 2060 Gaming Z 6G | |
| AMD Radeon RX 5700 XT | |
| AMD Radeon VII | |
| AMD Radeon RX 5700 | |
| AMD Radeon RX Vega 64 | |
| 2560x1440 Very High Preset | |
| MSI RTX 2080 Gaming X Trio | |
| MSI RTX 2070 Gaming Z 8G | |
| Nvidia GeForce RTX 2070 Super | |
| Nvidia GeForce RTX 2060 Super | |
| AMD Radeon RX 5700 XT | |
| AMD Radeon RX 5700 | |
| Darksiders III | |
| 1920x1080 Epic | |
| Nvidia Titan RTX | |
| MSI RTX 2080 Gaming X Trio | |
| Nvidia GeForce RTX 2070 Super | |
| MSI RTX 2070 Gaming Z 8G | |
| AMD Radeon RX 5700 XT | |
| AMD Radeon VII | |
| MSI RTX 2060 Gaming Z 6G | |
| Nvidia GeForce RTX 2060 Super | |
| AMD Radeon RX 5700 | |
| AMD Radeon RX Vega 64 | |
| 3840x2160 Epic | |
| Nvidia Titan RTX | |
| MSI RTX 2080 Gaming X Trio | |
| Nvidia GeForce RTX 2070 Super | |
| MSI RTX 2070 Gaming Z 8G | |
| AMD Radeon VII | |
| AMD Radeon RX 5700 XT | |
| Nvidia GeForce RTX 2060 Super | |
| AMD Radeon RX 5700 | |
| AMD Radeon RX Vega 64 | |
| MSI RTX 2060 Gaming Z 6G | |
| Just Cause 4 | |
| 1920x1080 Very High / On AA:SM AF:16x | |
| Nvidia Titan RTX | |
| MSI RTX 2080 Gaming X Trio | |
| Nvidia GeForce RTX 2070 Super | |
| AMD Radeon RX 5700 XT | |
| MSI RTX 2070 Gaming Z 8G | |
| Nvidia GeForce RTX 2060 Super | |
| AMD Radeon VII | |
| MSI RTX 2060 Gaming Z 6G | |
| AMD Radeon RX Vega 64 | |
| AMD Radeon RX 5700 | |
| 3840x2160 Very High / On AA:SM AF:16x | |
| Nvidia Titan RTX | |
| MSI RTX 2080 Gaming X Trio | |
| Nvidia GeForce RTX 2070 Super | |
| AMD Radeon VII | |
| AMD Radeon RX 5700 XT | |
| MSI RTX 2070 Gaming Z 8G | |
| Nvidia GeForce RTX 2060 Super | |
| AMD Radeon RX 5700 | |
| MSI RTX 2060 Gaming Z 6G | |
| AMD Radeon RX Vega 64 | |
| 2560x1440 Very High / On AA:SM AF:16x | |
| MSI RTX 2080 Gaming X Trio | |
| Nvidia GeForce RTX 2070 Super | |
| AMD Radeon RX 5700 XT | |
| MSI RTX 2070 Gaming Z 8G | |
| Nvidia GeForce RTX 2060 Super | |
| AMD Radeon RX 5700 | |
| Apex Legends | |
| 1920x1080 Maximum Settings AA:TS AF:16x | |
| MSI RTX 2070 Gaming Z 8G | |
| MSI RTX 2080 Gaming X Trio | |
| Nvidia Titan RTX 24 GB | |
| Nvidia GeForce RTX 2060 Super | |
| Nvidia GeForce RTX 2070 Super | |
| AMD Radeon RX 5700 XT | |
| AMD Radeon RX 5700 | |
| MSI RTX 2060 Gaming Z 6G | |
| AMD Radeon RX Vega 64 | |
| 3840x2160 Maximum Settings AA:TS AF:16x | |
| Nvidia Titan RTX 24 GB | |
| MSI RTX 2080 Gaming X Trio | |
| MSI RTX 2070 Gaming Z 8G | |
| Nvidia GeForce RTX 2070 Super | |
| AMD Radeon RX 5700 XT | |
| Nvidia GeForce RTX 2060 Super | |
| AMD Radeon RX 5700 | |
| AMD Radeon RX Vega 64 | |
| MSI RTX 2060 Gaming Z 6G | |
| 2560x1440 Maximum Settings AA:TS AF:16x | |
| Nvidia Titan RTX 24 GB | |
| MSI RTX 2070 Gaming Z 8G | |
| MSI RTX 2080 Gaming X Trio | |
| Nvidia GeForce RTX 2070 Super | |
| AMD Radeon RX 5700 XT | |
| Nvidia GeForce RTX 2060 Super | |
| AMD Radeon RX 5700 | |
| MSI RTX 2060 Gaming Z 6G | |
| AMD Radeon RX Vega 64 | |
| Far Cry New Dawn | |
| 1920x1080 Ultra Preset | |
| MSI RTX 2080 Gaming X Trio | |
| MSI RTX 2070 Gaming Z 8G | |
| MSI RTX 2060 Gaming Z 6G | |
| Nvidia GeForce RTX 2070 Super | |
| AMD Radeon RX Vega 64 | |
| Nvidia GeForce RTX 2060 Super | |
| AMD Radeon VII | |
| AMD Radeon RX 5700 | |
| AMD Radeon RX 5700 XT | |
| Nvidia Titan RTX 24 GB | |
| 3840x2160 Ultra Preset | |
| Nvidia Titan RTX 24 GB | |
| MSI RTX 2080 Gaming X Trio | |
| AMD Radeon VII | |
| Nvidia GeForce RTX 2070 Super | |
| AMD Radeon RX 5700 XT | |
| MSI RTX 2070 Gaming Z 8G | |
| AMD Radeon RX 5700 | |
| Nvidia GeForce RTX 2060 Super | |
| AMD Radeon RX Vega 64 | |
| MSI RTX 2060 Gaming Z 6G | |
| 2560x1440 Ultra Preset | |
| MSI RTX 2080 Gaming X Trio | |
| Nvidia GeForce RTX 2070 Super | |
| AMD Radeon VII | |
| MSI RTX 2070 Gaming Z 8G | |
| AMD Radeon RX 5700 XT | |
| AMD Radeon RX Vega 64 | |
| Nvidia GeForce RTX 2060 Super | |
| AMD Radeon RX 5700 | |
| MSI RTX 2060 Gaming Z 6G | |
| Nvidia Titan RTX 24 GB | |
| Metro Exodus | |
| 1920x1080 Ultra Quality AF:16x | |
| MSI RTX 2080 Gaming X Trio | |
| Nvidia Titan RTX 24 GB | |
| Nvidia GeForce RTX 2070 Super | |
| AMD Radeon VII | |
| AMD Radeon RX 5700 XT | |
| MSI RTX 2070 Gaming Z 8G | |
| Nvidia GeForce RTX 2060 Super | |
| AMD Radeon RX 5700 | |
| AMD Radeon RX Vega 64 | |
| MSI RTX 2060 Gaming Z 6G | |
| 3840x2160 Ultra Quality AF:16x | |
| Nvidia Titan RTX 24 GB | |
| AMD Radeon RX Vega 64 | |
| MSI RTX 2080 Gaming X Trio | |
| AMD Radeon VII | |
| Nvidia GeForce RTX 2070 Super | |
| MSI RTX 2070 Gaming Z 8G | |
| Nvidia GeForce RTX 2060 Super | |
| AMD Radeon RX 5700 XT | |
| AMD Radeon RX 5700 | |
| MSI RTX 2060 Gaming Z 6G | |
| 2560x1440 Ultra Quality AF:16x | |
| Nvidia Titan RTX 24 GB | |
| MSI RTX 2080 Gaming X Trio | |
| AMD Radeon VII | |
| AMD Radeon RX 5700 XT | |
| Nvidia GeForce RTX 2070 Super | |
| MSI RTX 2070 Gaming Z 8G | |
| AMD Radeon RX 5700 | |
| Nvidia GeForce RTX 2060 Super | |
| AMD Radeon RX Vega 64 | |
| MSI RTX 2060 Gaming Z 6G | |
| Anthem | |
| 1920x1080 Ultra Preset | |
| MSI RTX 2080 Gaming X Trio | |
| AMD Radeon RX Vega 64 | |
| Nvidia GeForce RTX 2070 Super | |
| Nvidia Titan RTX 24 GB | |
| MSI RTX 2070 Gaming Z 8G | |
| AMD Radeon VII | |
| Nvidia GeForce RTX 2060 Super | |
| MSI RTX 2060 Gaming Z 6G | |
| AMD Radeon RX 5700 XT | |
| AMD Radeon RX 5700 | |
| 2560x1440 Ultra Preset | |
| Nvidia Titan RTX 24 GB | |
| MSI RTX 2080 Gaming X Trio | |
| AMD Radeon RX 5700 XT | |
| AMD Radeon VII | |
| Nvidia GeForce RTX 2070 Super | |
| MSI RTX 2070 Gaming Z 8G | |
| AMD Radeon RX 5700 | |
| AMD Radeon RX Vega 64 | |
| Nvidia GeForce RTX 2060 Super | |
| MSI RTX 2060 Gaming Z 6G | |
| Dirt Rally 2.0 | |
| 1920x1080 Ultra Preset AA:T AF:16x | |
| Nvidia Titan RTX 24 GB | |
| AMD Radeon RX 5700 XT | |
| Nvidia GeForce RTX 2070 Super | |
| MSI RTX 2080 Gaming X Trio | |
| AMD Radeon VII | |
| AMD Radeon RX 5700 | |
| MSI RTX 2070 Gaming Z 8G | |
| Nvidia GeForce RTX 2060 Super | |
| AMD Radeon RX Vega 64 | |
| MSI RTX 2060 Gaming Z 6G | |
| 3840x2160 Ultra Preset AA:T AF:16x | |
| Nvidia Titan RTX 24 GB | |
| MSI RTX 2080 Gaming X Trio | |
| Nvidia GeForce RTX 2070 Super | |
| AMD Radeon VII | |
| AMD Radeon RX 5700 XT | |
| MSI RTX 2070 Gaming Z 8G | |
| AMD Radeon RX 5700 | |
| Nvidia GeForce RTX 2060 Super | |
| AMD Radeon RX Vega 64 | |
| MSI RTX 2060 Gaming Z 6G | |
| 2560x1440 Ultra Preset AA:T AF:16x | |
| Nvidia Titan RTX 24 GB | |
| Nvidia GeForce RTX 2070 Super | |
| AMD Radeon RX 5700 XT | |
| MSI RTX 2080 Gaming X Trio | |
| AMD Radeon VII | |
| AMD Radeon RX 5700 | |
| MSI RTX 2070 Gaming Z 8G | |
| Nvidia GeForce RTX 2060 Super | |
| AMD Radeon RX Vega 64 | |
| MSI RTX 2060 Gaming Z 6G | |
| The Division 2 | |
| 1920x1080 Ultra Preset | |
| Nvidia Titan RTX 24 GB | |
| MSI RTX 2080 Gaming X Trio | |
| MSI RTX 2070 Gaming Z 8G | |
| Nvidia GeForce RTX 2070 Super | |
| AMD Radeon RX 5700 XT | |
| MSI RTX 2060 Gaming Z 6G | |
| Nvidia GeForce RTX 2060 Super | |
| AMD Radeon RX Vega 64 | |
| AMD Radeon RX 5700 | |
| 3840x2160 Ultra Preset | |
| Nvidia Titan RTX 24 GB | |
| MSI RTX 2080 Gaming X Trio | |
| MSI RTX 2070 Gaming Z 8G | |
| Nvidia GeForce RTX 2070 Super | |
| AMD Radeon RX 5700 XT | |
| MSI RTX 2060 Gaming Z 6G | |
| AMD Radeon RX Vega 64 | |
| Nvidia GeForce RTX 2060 Super | |
| AMD Radeon RX 5700 | |
| 2560x1440 Ultra Preset | |
| Nvidia Titan RTX 24 GB | |
| MSI RTX 2080 Gaming X Trio | |
| MSI RTX 2070 Gaming Z 8G | |
| Nvidia GeForce RTX 2070 Super | |
| AMD Radeon RX 5700 XT | |
| MSI RTX 2060 Gaming Z 6G | |
| Nvidia GeForce RTX 2060 Super | |
| AMD Radeon RX Vega 64 | |
| AMD Radeon RX 5700 | |
| Anno 1800 | |
| 3840x2160 Ultra Graphics Quality (DX11) | |
| Nvidia Titan RTX 24 GB | |
| MSI RTX 2080 Gaming X Trio | |
| Nvidia GeForce RTX 2070 Super | |
| MSI RTX 2070 Gaming Z 8G | |
| AMD Radeon RX 5700 XT | |
| Nvidia GeForce RTX 2060 Super | |
| AMD Radeon RX 5700 | |
| MSI RTX 2060 Gaming Z 6G | |
| AMD Radeon RX Vega 64 | |
| 1920x1080 Ultra Graphics Quality (DX11) | |
| MSI RTX 2080 Gaming X Trio | |
| Nvidia GeForce RTX 2070 Super | |
| AMD Radeon RX 5700 XT | |
| MSI RTX 2070 Gaming Z 8G | |
| MSI RTX 2060 Gaming Z 6G | |
| Nvidia GeForce RTX 2060 Super | |
| AMD Radeon RX 5700 | |
| Nvidia Titan RTX 24 GB | |
| AMD Radeon RX Vega 64 | |
| 2560x1440 Ultra Graphics Quality (DX11) | |
| MSI RTX 2080 Gaming X Trio | |
| Nvidia GeForce RTX 2070 Super | |
| AMD Radeon RX 5700 XT | |
| MSI RTX 2070 Gaming Z 8G | |
| Nvidia GeForce RTX 2060 Super | |
| AMD Radeon RX 5700 | |
| MSI RTX 2060 Gaming Z 6G | |
| Nvidia Titan RTX 24 GB | |
| AMD Radeon RX Vega 64 | |
| Rage 2 | |
| 3840x2160 Ultra Preset (Resolution Scale Off) | |
| Nvidia Titan RTX 24 GB | |
| MSI RTX 2080 Gaming X Trio | |
| Nvidia GeForce RTX 2070 Super | |
| MSI RTX 2070 Gaming Z 8G | |
| AMD Radeon RX 5700 XT | |
| Nvidia GeForce RTX 2060 Super | |
| AMD Radeon RX Vega 64 | |
| AMD Radeon RX 5700 | |
| MSI RTX 2060 Gaming Z 6G | |
| 1920x1080 Ultra Preset (Resolution Scale Off) | |
| Nvidia Titan RTX 24 GB | |
| MSI RTX 2080 Gaming X Trio | |
| Nvidia GeForce RTX 2070 Super | |
| MSI RTX 2070 Gaming Z 8G | |
| AMD Radeon RX Vega 64 | |
| Nvidia GeForce RTX 2060 Super | |
| AMD Radeon RX 5700 XT | |
| MSI RTX 2060 Gaming Z 6G | |
| 2560x1440 Ultra Preset (Resolution Scale Off) | |
| Nvidia Titan RTX 24 GB | |
| MSI RTX 2080 Gaming X Trio | |
| Nvidia GeForce RTX 2070 Super | |
| MSI RTX 2070 Gaming Z 8G | |
| AMD Radeon RX Vega 64 | |
| Nvidia GeForce RTX 2060 Super | |
| AMD Radeon RX 5700 XT | |
| AMD Radeon RX 5700 | |
| MSI RTX 2060 Gaming Z 6G | |
| F1 2019 | |
| 3840x2160 Ultra High Preset AA:T AF:16x | |
| Nvidia Titan RTX 24 GB | |
| Nvidia GeForce RTX 2070 Super | |
| AMD Radeon RX 5700 XT | |
| AMD Radeon RX 5700 | |
| Nvidia GeForce RTX 2060 Super | |
| AMD Radeon RX Vega 64 | |
| 1920x1080 Ultra High Preset AA:T AF:16x | |
| AMD Radeon RX 5700 XT | |
| Nvidia GeForce RTX 2070 Super | |
| Nvidia Titan RTX 24 GB | |
| AMD Radeon RX Vega 64 | |
| AMD Radeon RX 5700 | |
| Nvidia GeForce RTX 2060 Super | |
| 2560x1440 Ultra High Preset AA:T AF:16x | |
| Nvidia Titan RTX 24 GB | |
| Nvidia GeForce RTX 2070 Super | |
| AMD Radeon RX 5700 XT | |
| AMD Radeon RX 5700 | |
| Nvidia GeForce RTX 2060 Super | |
| AMD Radeon RX Vega 64 | |
| Destiny 2 | |
| 2560x1440 Highest Preset AA:SM AF:16x | |
| MSI RTX 2080 Gaming X Trio | |
| Nvidia GeForce RTX 2070 Super | |
| MSI RTX 2070 Gaming Z 8G | |
| AMD Radeon RX 5700 XT | |
| Nvidia GeForce RTX 2060 Super | |
| AMD Radeon RX 5700 | |
| 1920x1080 Highest Preset AA:SM AF:16x | |
| Nvidia Titan RTX | |
| MSI RTX 2070 Gaming Z 8G | |
| MSI RTX 2080 Gaming X Trio | |
| Nvidia GeForce RTX 2060 Super | |
| Nvidia GeForce RTX 2070 Super | |
| AMD Radeon RX 5700 XT | |
| AMD Radeon RX 5700 | |
| AMD Radeon VII | |
| MSI RTX 2060 Gaming Z 6G | |
| 3840x2160 Highest Preset AA:SM AF:16x | |
| Nvidia Titan RTX | |
| MSI RTX 2080 Gaming X Trio | |
| Nvidia GeForce RTX 2070 Super | |
| MSI RTX 2070 Gaming Z 8G | |
| AMD Radeon RX 5700 XT | |
| Nvidia GeForce RTX 2060 Super | |
| AMD Radeon VII | |
| MSI RTX 2060 Gaming Z 6G | |
| AMD Radeon RX 5700 | |
| low | med. | high | ultra | QHD | 4K | |
|---|---|---|---|---|---|---|
| GTA V (2015) | 167 | 161 | 142 | 83 | 82 | |
| The Witcher 3 (2015) | 284 | 129 | 80 | 46.8 | ||
| Dota 2 Reborn (2015) | 126 | 118.3 | 86.4 | 85.1 | 84.4 | |
| Rainbow Six Siege (2015) | 283.3 | 250.7 | 236.5 | 103.2 | ||
| Far Cry Primal (2016) | 120 | 107 | 98 | 91 | 52 | |
| The Division (2016) | 268.8 | 149.1 | 116.8 | 55.9 | ||
| Overwatch (2016) | 299 | 298 | 201 | 138 | ||
| For Honor (2017) | 269.9 | 188.7 | 178.9 | 143.5 | 56.7 | |
| Ghost Recon Wildlands (2017) | 120.4 | 91.3 | 90.4 | 60.4 | 43.6 | |
| Rocket League (2017) | 235 | 224 | 205 | 132 | ||
| Playerunknown's Battlegrounds (PUBG) (2017) | 190 | 151 | 144 | 139 | 59.1 | |
| Destiny 2 (2017) | 139 | 137 | 135 | 132 | 92 | 49.1 |
| Assassin´s Creed Origins (2017) | 74 | 69 | 68 | 63 | 56 | 35 |
| Fortnite (2018) | 208 | 166 | 140 | 118 | 77 | 39.1 |
| Final Fantasy XV Benchmark (2018) | 144 | 100 | 59.6 | 28.9 | ||
| Kingdom Come: Deliverance (2018) | 124 | 112 | 90 | 64 | 52.2 | 26.2 |
| X-Plane 11.11 (2018) | 64 | 54.3 | 47 | 36.7 | ||
| Far Cry 5 (2018) | 108 | 93 | 90 | 84 | 80 | 45 |
| The Crew 2 (2018) | 60 | 60 | 60 | 60 | 60 | 39.4 |
| Monster Hunter World (2018) | 125 | 107 | 101 | 81 | 54.2 | 27.8 |
| Shadow of the Tomb Raider (2018) | 108 | 99 | 97 | 90 | 68 | 34 |
| FIFA 19 (2018) | 296 | 288 | 276 | 270 | 267 | 164 |
| Forza Horizon 4 (2018) | 153 | 132 | 130 | 118 | 103 | 70 |
| Assassin´s Creed Odyssey (2018) | 82 | 77 | 71 | 60 | 51 | 31 |
| Call of Duty Black Ops 4 (2018) | 210 | 180 | 176 | 114 | 102 | 53 |
| Hitman 2 (2018) | 94 | 92 | 82 | 80 | 78 | 46.6 |
| Battlefield V (2018) | 133 | 115 | 105 | 97 | 81 | 53.5 |
| Farming Simulator 19 (2018) | 154 | 124 | 101 | 94 | 87 | 46.2 |
| Darksiders III (2018) | 180 | 122 | 113 | 103 | 72 | 37.1 |
| Just Cause 4 (2018) | 105 | 99 | 92 | 88 | 73 | 39.2 |
| Apex Legends (2019) | 144 | 144 | 143 | 142 | 104 | 57.2 |
| Far Cry New Dawn (2019) | 106 | 95 | 93 | 83 | 79 | 51 |
| Metro Exodus (2019) | 142 | 74 | 64 | 58.6 | 48.4 | 28.6 |
| Anthem (2019) | 90 | 88 | 88 | 86 | 76 | 42.9 |
| Dirt Rally 2.0 (2019) | 168 | 142 | 135 | 103 | 77 | 43.4 |
| The Division 2 (2019) | 136 | 115 | 98 | 78 | 56.9 | 30 |
| Anno 1800 (2019) | 89 | 87 | 68 | 38.9 | 37 | 20.4 |
| Rage 2 (2019) | 218 | 95 | 65 | 32.4 | ||
| F1 2019 (2019) | 234 | 203 | 171 | 124 | 99 | 59 |
Compute performance
Due to the lack of driver optimizations, consumer graphics cards are only partially suitable for use in workstations. But the compute performance should not remain unexplained, and the less expensive gaming graphics cards have to prove themselves in the tests. In the LuxMark render test, the RX 5700 falls back to the last place. The slightly faster RX 5700 XT can only beat the MSI RTX 2060 Gaming Z 6G in the Sala test. With SPECviewperf, the Navi GPUs can show what they're made of to some extent. In individual tests, the RX 5700 is even faster than the AMD Radeon VII. Overall, the compute performance of the Radeon RX 5700 is mixed.
| LuxMark v2.0 64Bit | |
| Room GPUs-only | |
| Nvidia Titan RTX | |
| AMD Radeon VII | |
| MSI RTX 2080 Gaming X Trio | |
| Nvidia GeForce RTX 2070 Super | |
| MSI RTX 2070 Gaming Z 8G | |
| Nvidia GeForce RTX 2060 Super | |
| MSI RTX 2060 Gaming Z 6G | |
| AMD Radeon RX 5700 XT | |
| AMD Radeon RX 5700 | |
| Sala GPUs-only | |
| Nvidia Titan RTX | |
| MSI RTX 2080 Gaming X Trio | |
| Nvidia GeForce RTX 2070 Super | |
| MSI RTX 2070 Gaming Z 8G | |
| Nvidia GeForce RTX 2060 Super | |
| AMD Radeon VII | |
| AMD Radeon RX 5700 XT | |
| MSI RTX 2060 Gaming Z 6G | |
| AMD Radeon RX 5700 | |
| SiSoft Sandra 2016 | |
| GP Financial Analysis (FP High/Double Precision) | |
| AMD Radeon VII | |
| MSI RTX 2080 Gaming X Trio | |
| Nvidia GeForce RTX 2070 Super | |
| MSI RTX 2070 Gaming Z 8G | |
| Nvidia GeForce RTX 2060 Super | |
| MSI RTX 2060 Gaming Z 6G | |
| AMD Radeon RX 5700 XT | |
| AMD Radeon RX 5700 | |
| Image Processing | |
| AMD Radeon VII | |
| MSI RTX 2080 Gaming X Trio | |
| Nvidia GeForce RTX 2070 Super | |
| MSI RTX 2070 Gaming Z 8G | |
| Nvidia GeForce RTX 2060 Super | |
| AMD Radeon RX 5700 XT | |
| MSI RTX 2060 Gaming Z 6G | |
| AMD Radeon RX 5700 | |
Emissions of the AMD Radeon RX 5700

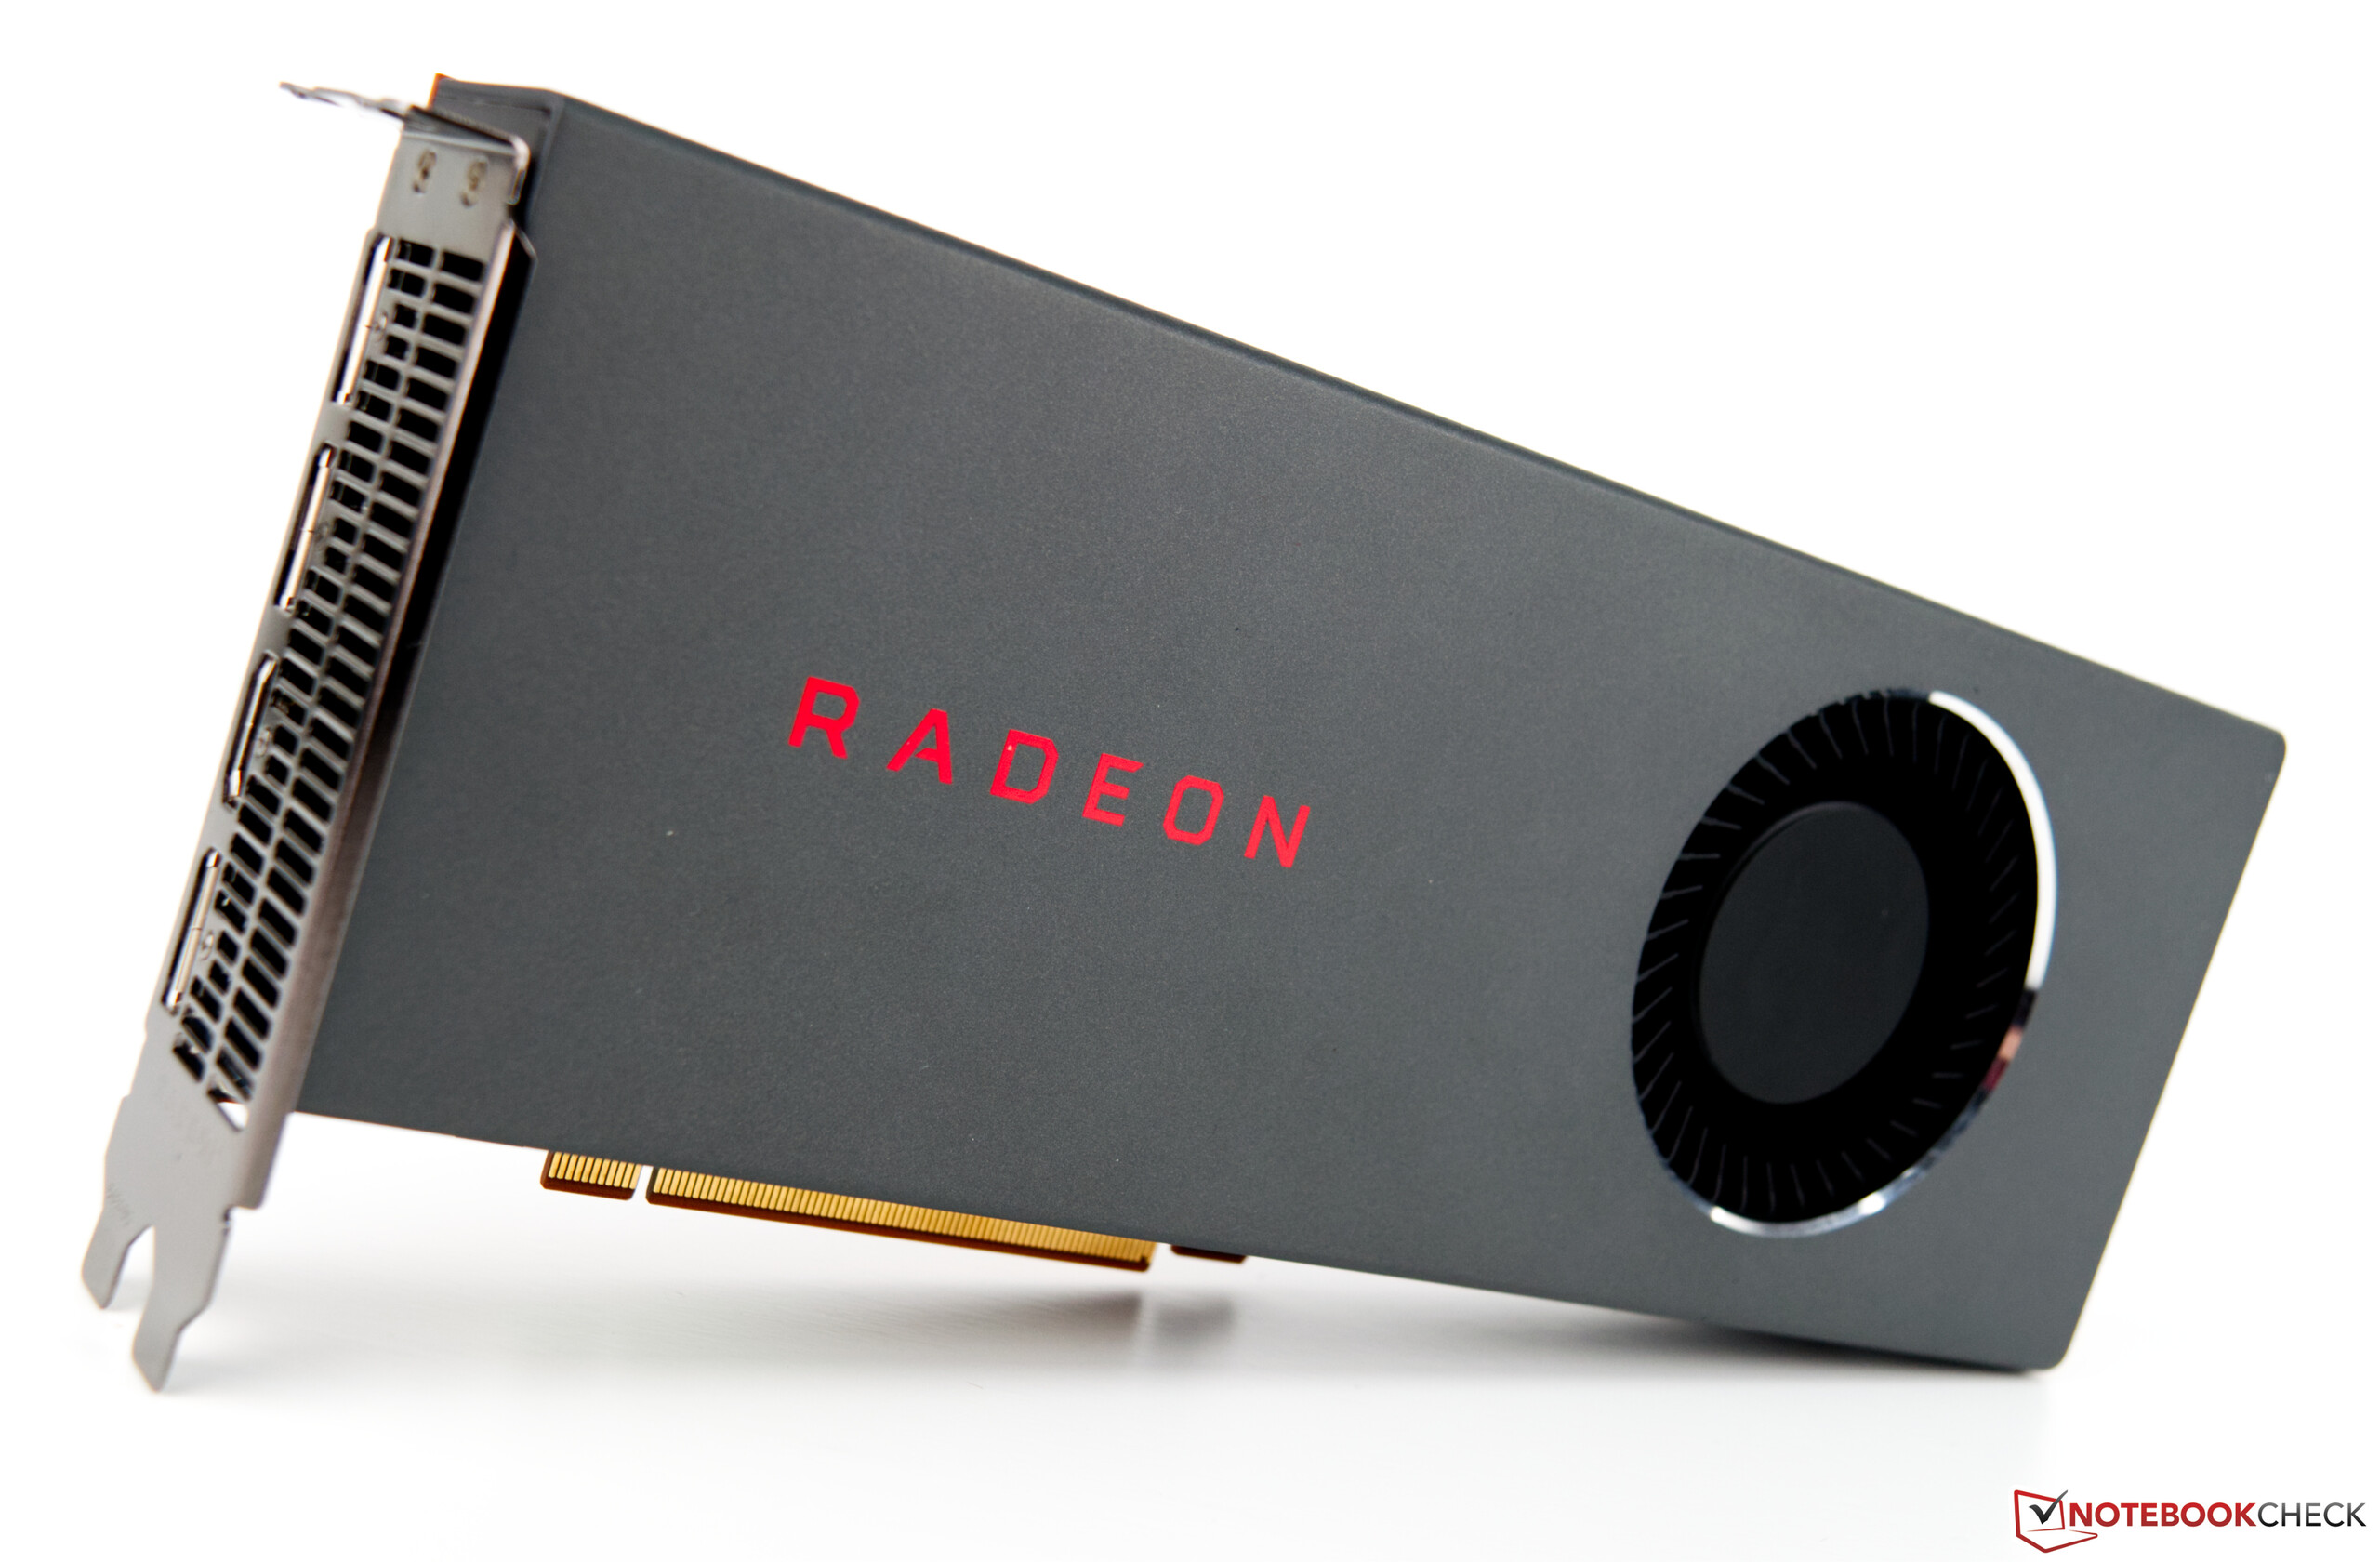
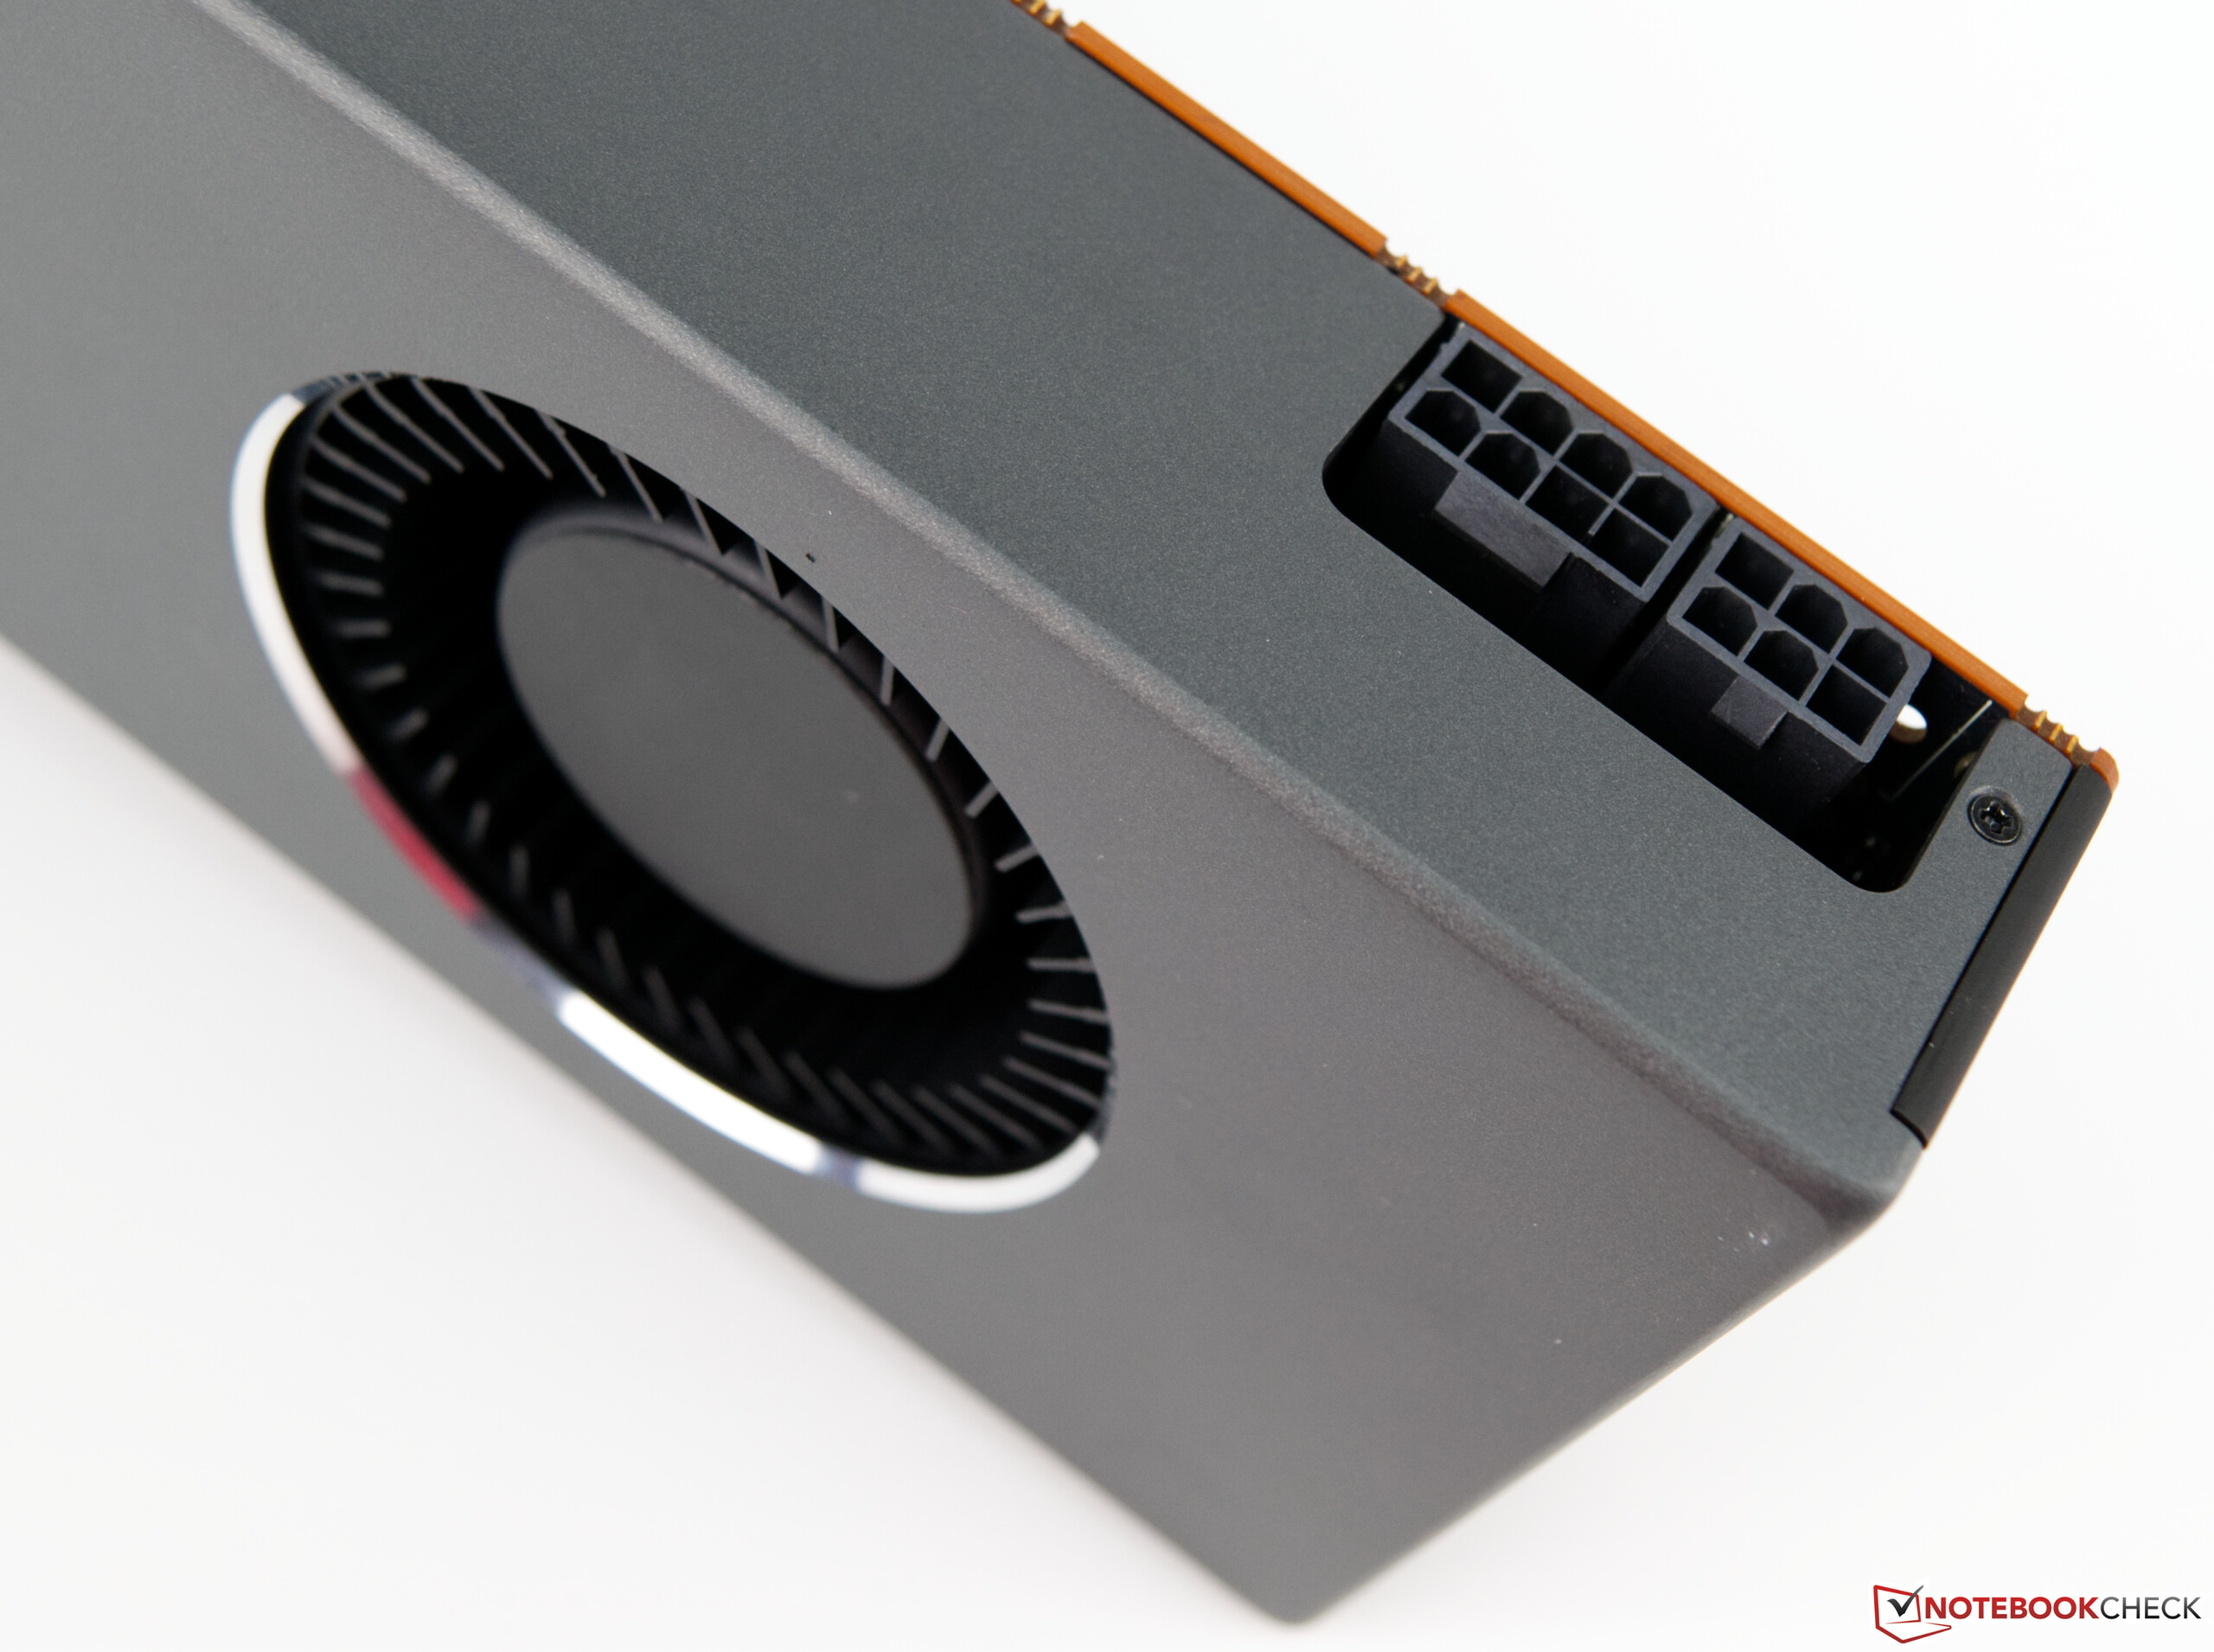
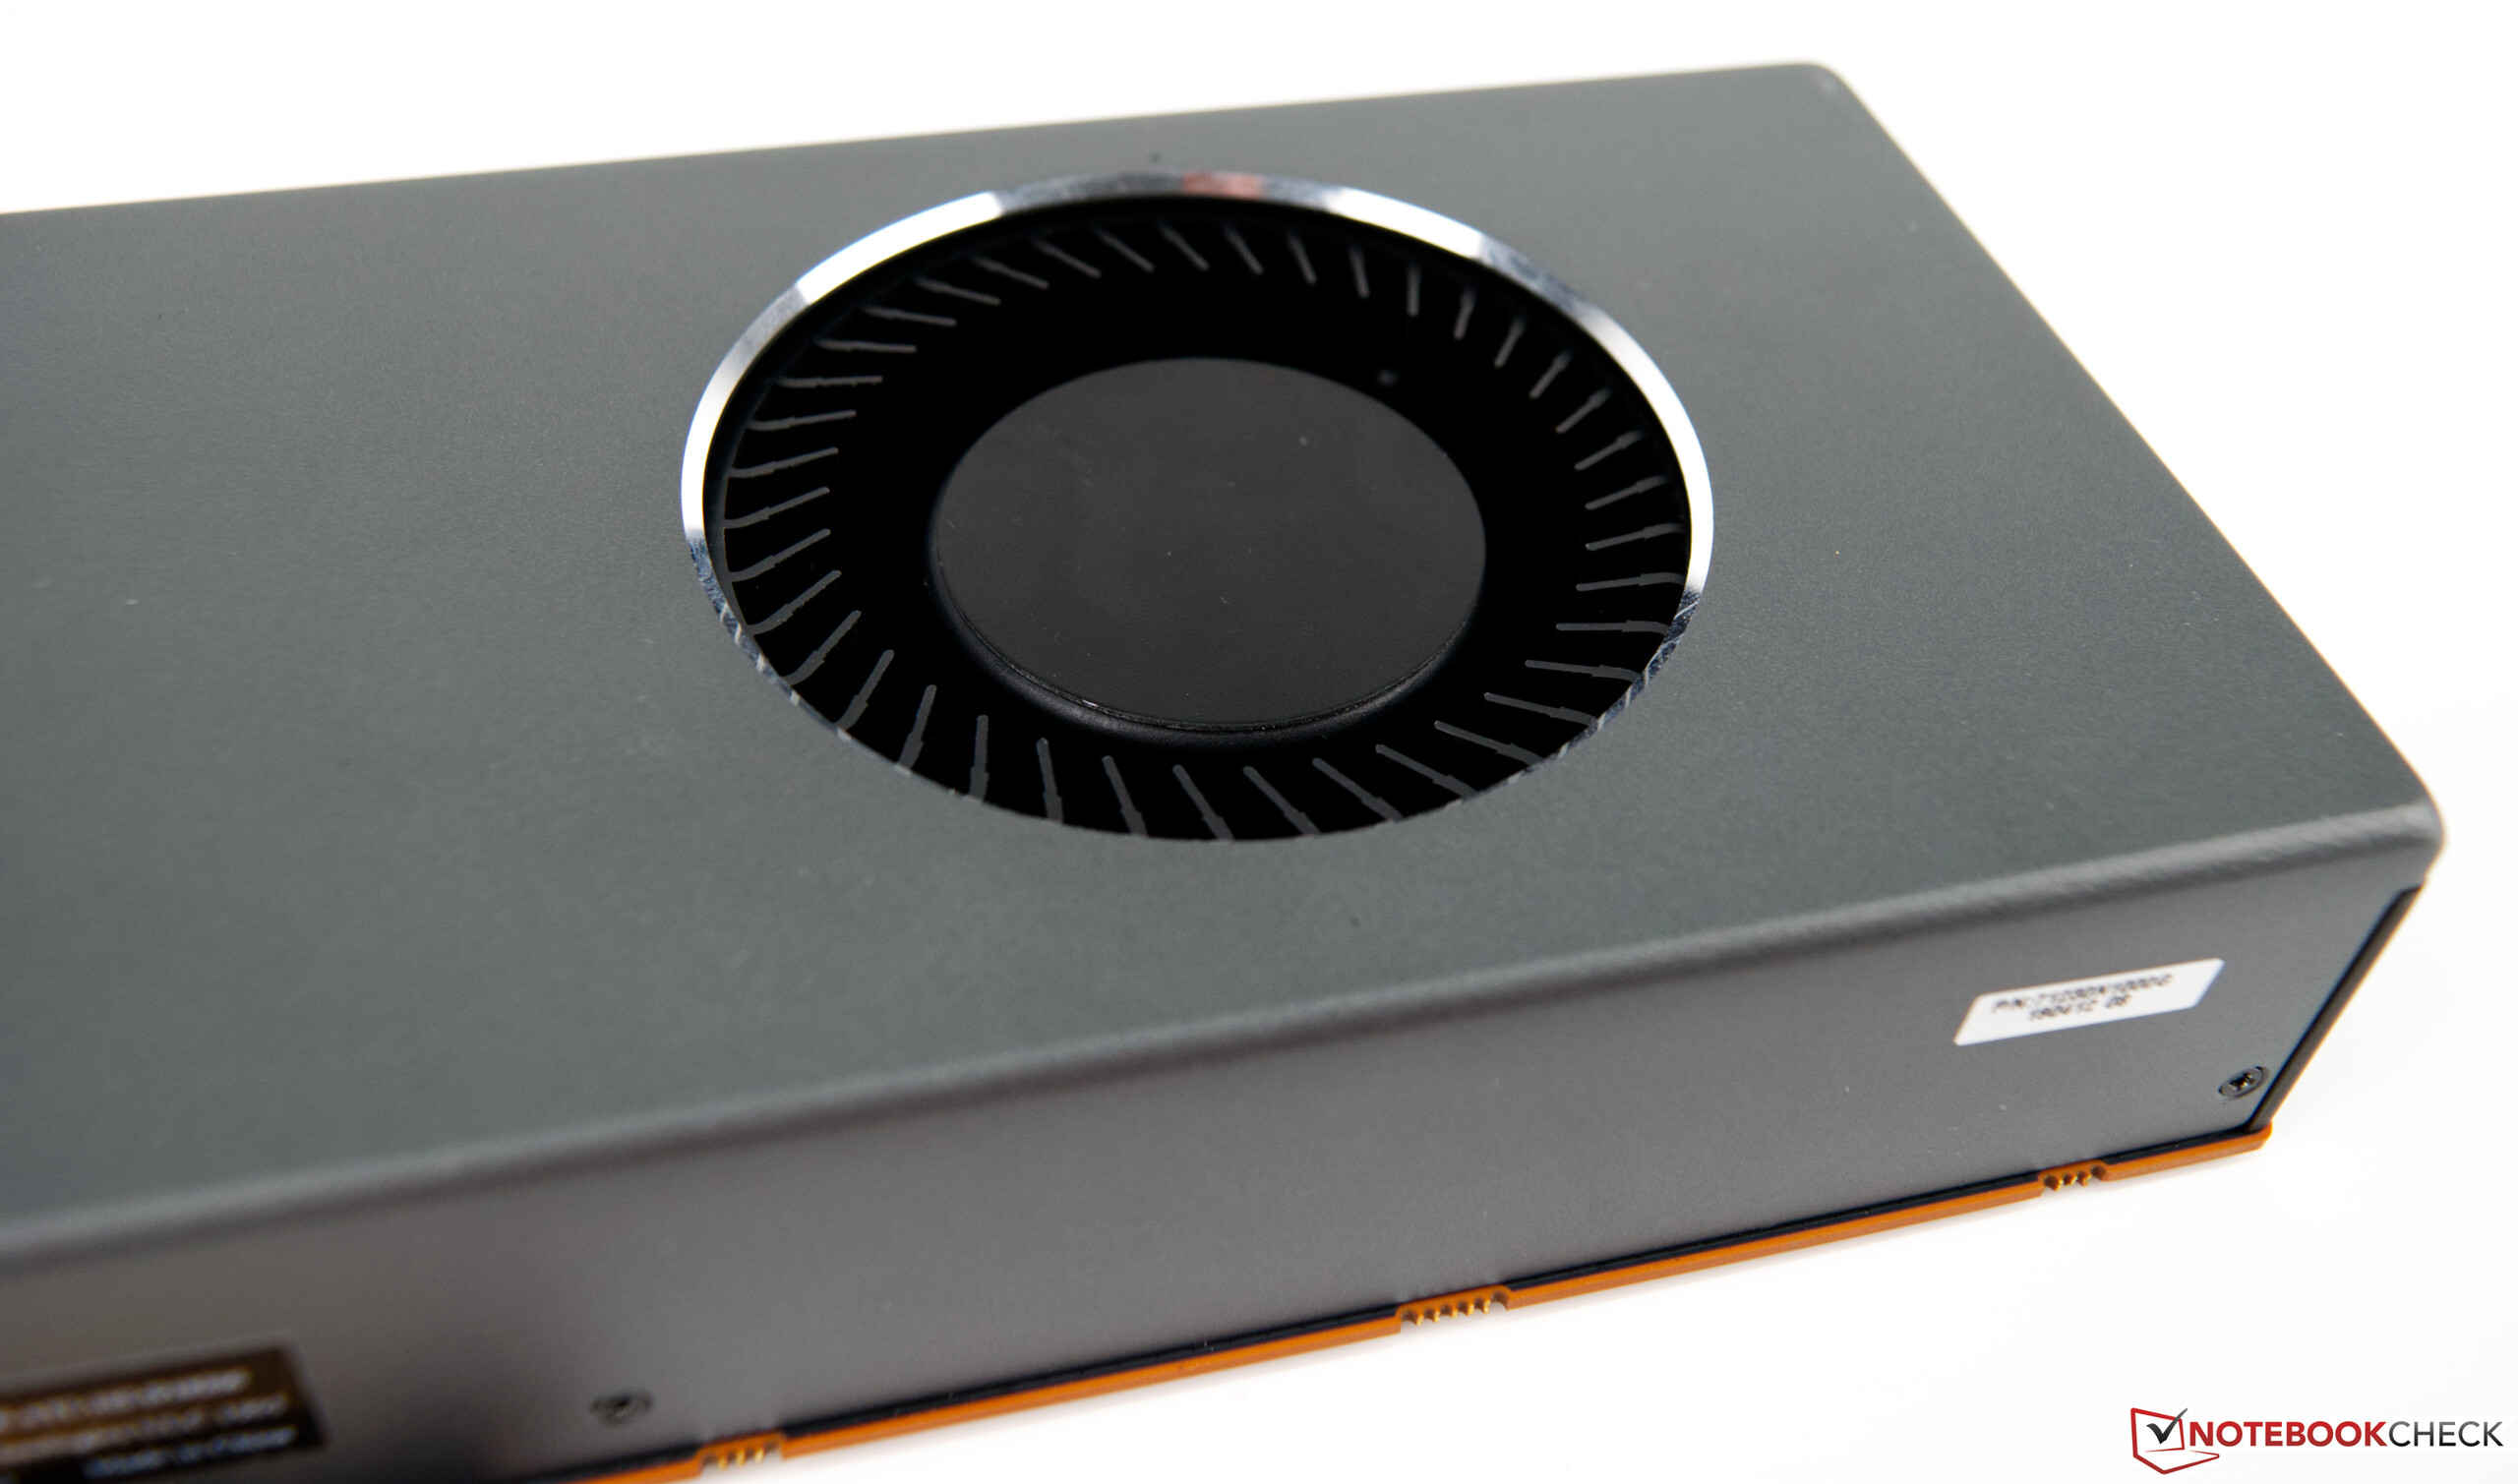
In terms of emissions, we'll start with the loudness of the graphics card. Although AMD also gives the smaller Navi variant a cooling unit including a vapor chamber, as is so often the case, AMD gives its graphics cards a radial fan in the reference design. This has a diameter of 75 mm and also spins happily in 2D scenarios. In this way, the graphics card is always audible if you have sensitive hearing. In principle, this form of cooling isn't a bad approach since it causes the resulting heat to be directly conducted towards the outside of the case under load. That Nvidia abstained from using this type of cooling solution since the introduction of the RTX graphics cards is a known thing, and the GPU still manages to cool itself in a reliable and comparatively quite way. However, a good air flow should be available with both forms of cooling so that no heat accumulation is produced.
But now back to the AMD Radeon RX 5700. It is barely audible in 2D usage despite the radial fan. Case fans or hard drives are almost louder here. Only under load does the fan become a bit louder, but it's still acceptable. We also need to consider that the RX 5700 only has a power consumption of 180 watts. When more power is introduced, as is the case with the RX 5700 XT, more heat needs to be dissipated too. The Radeon RX 5700 is indeed significantly louder under load compared to Nvidia's RTX 2060S FE. That's a fact, and it can't be sugar coated.
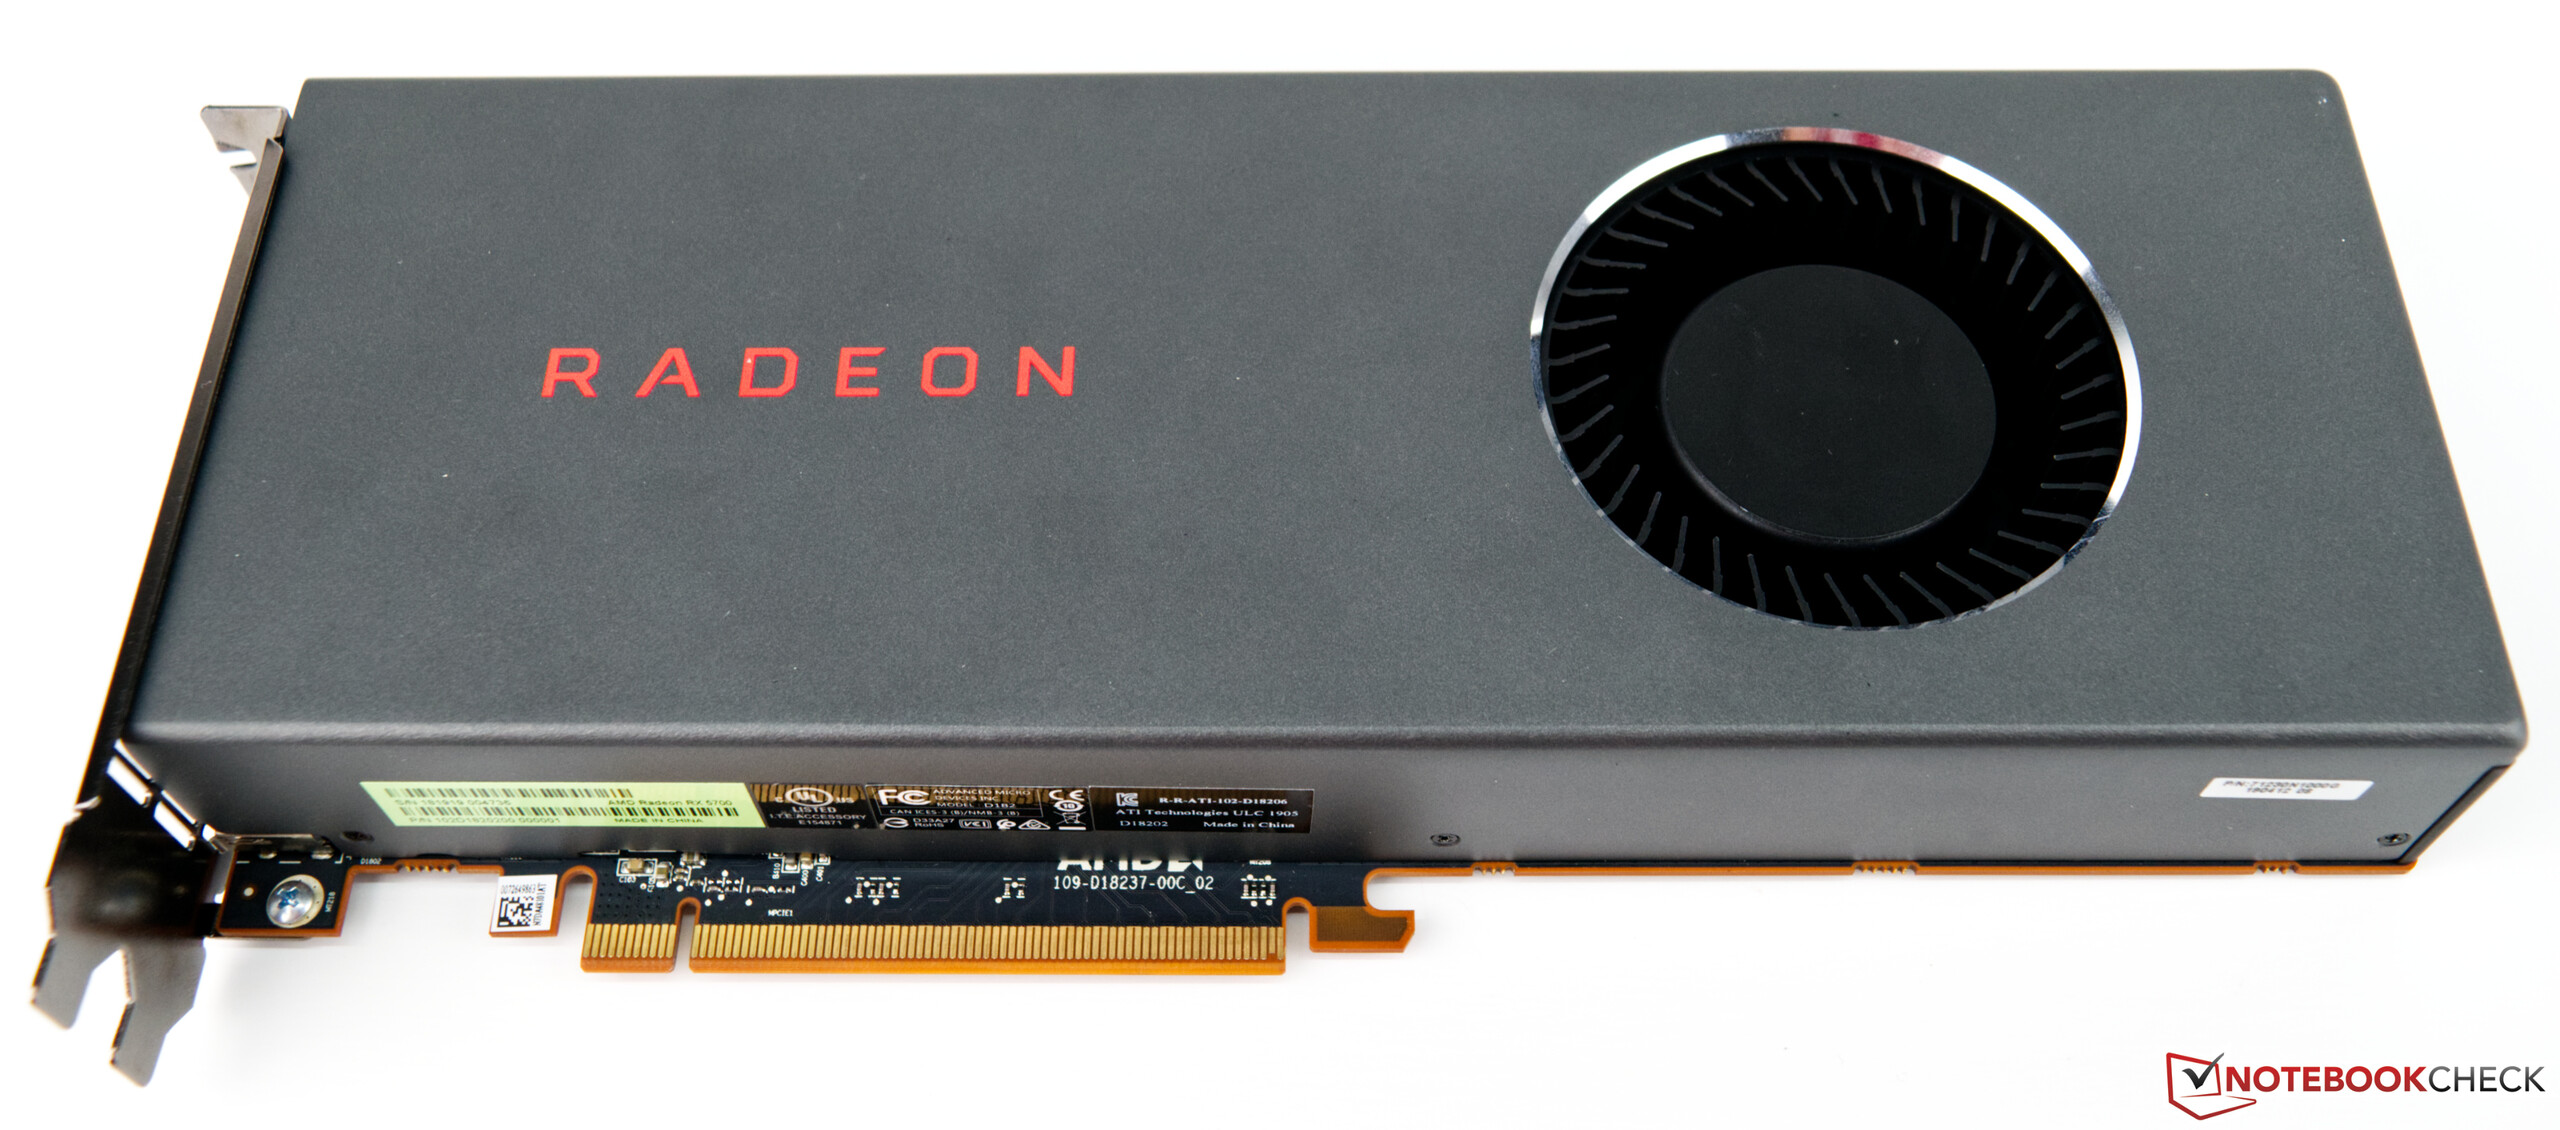
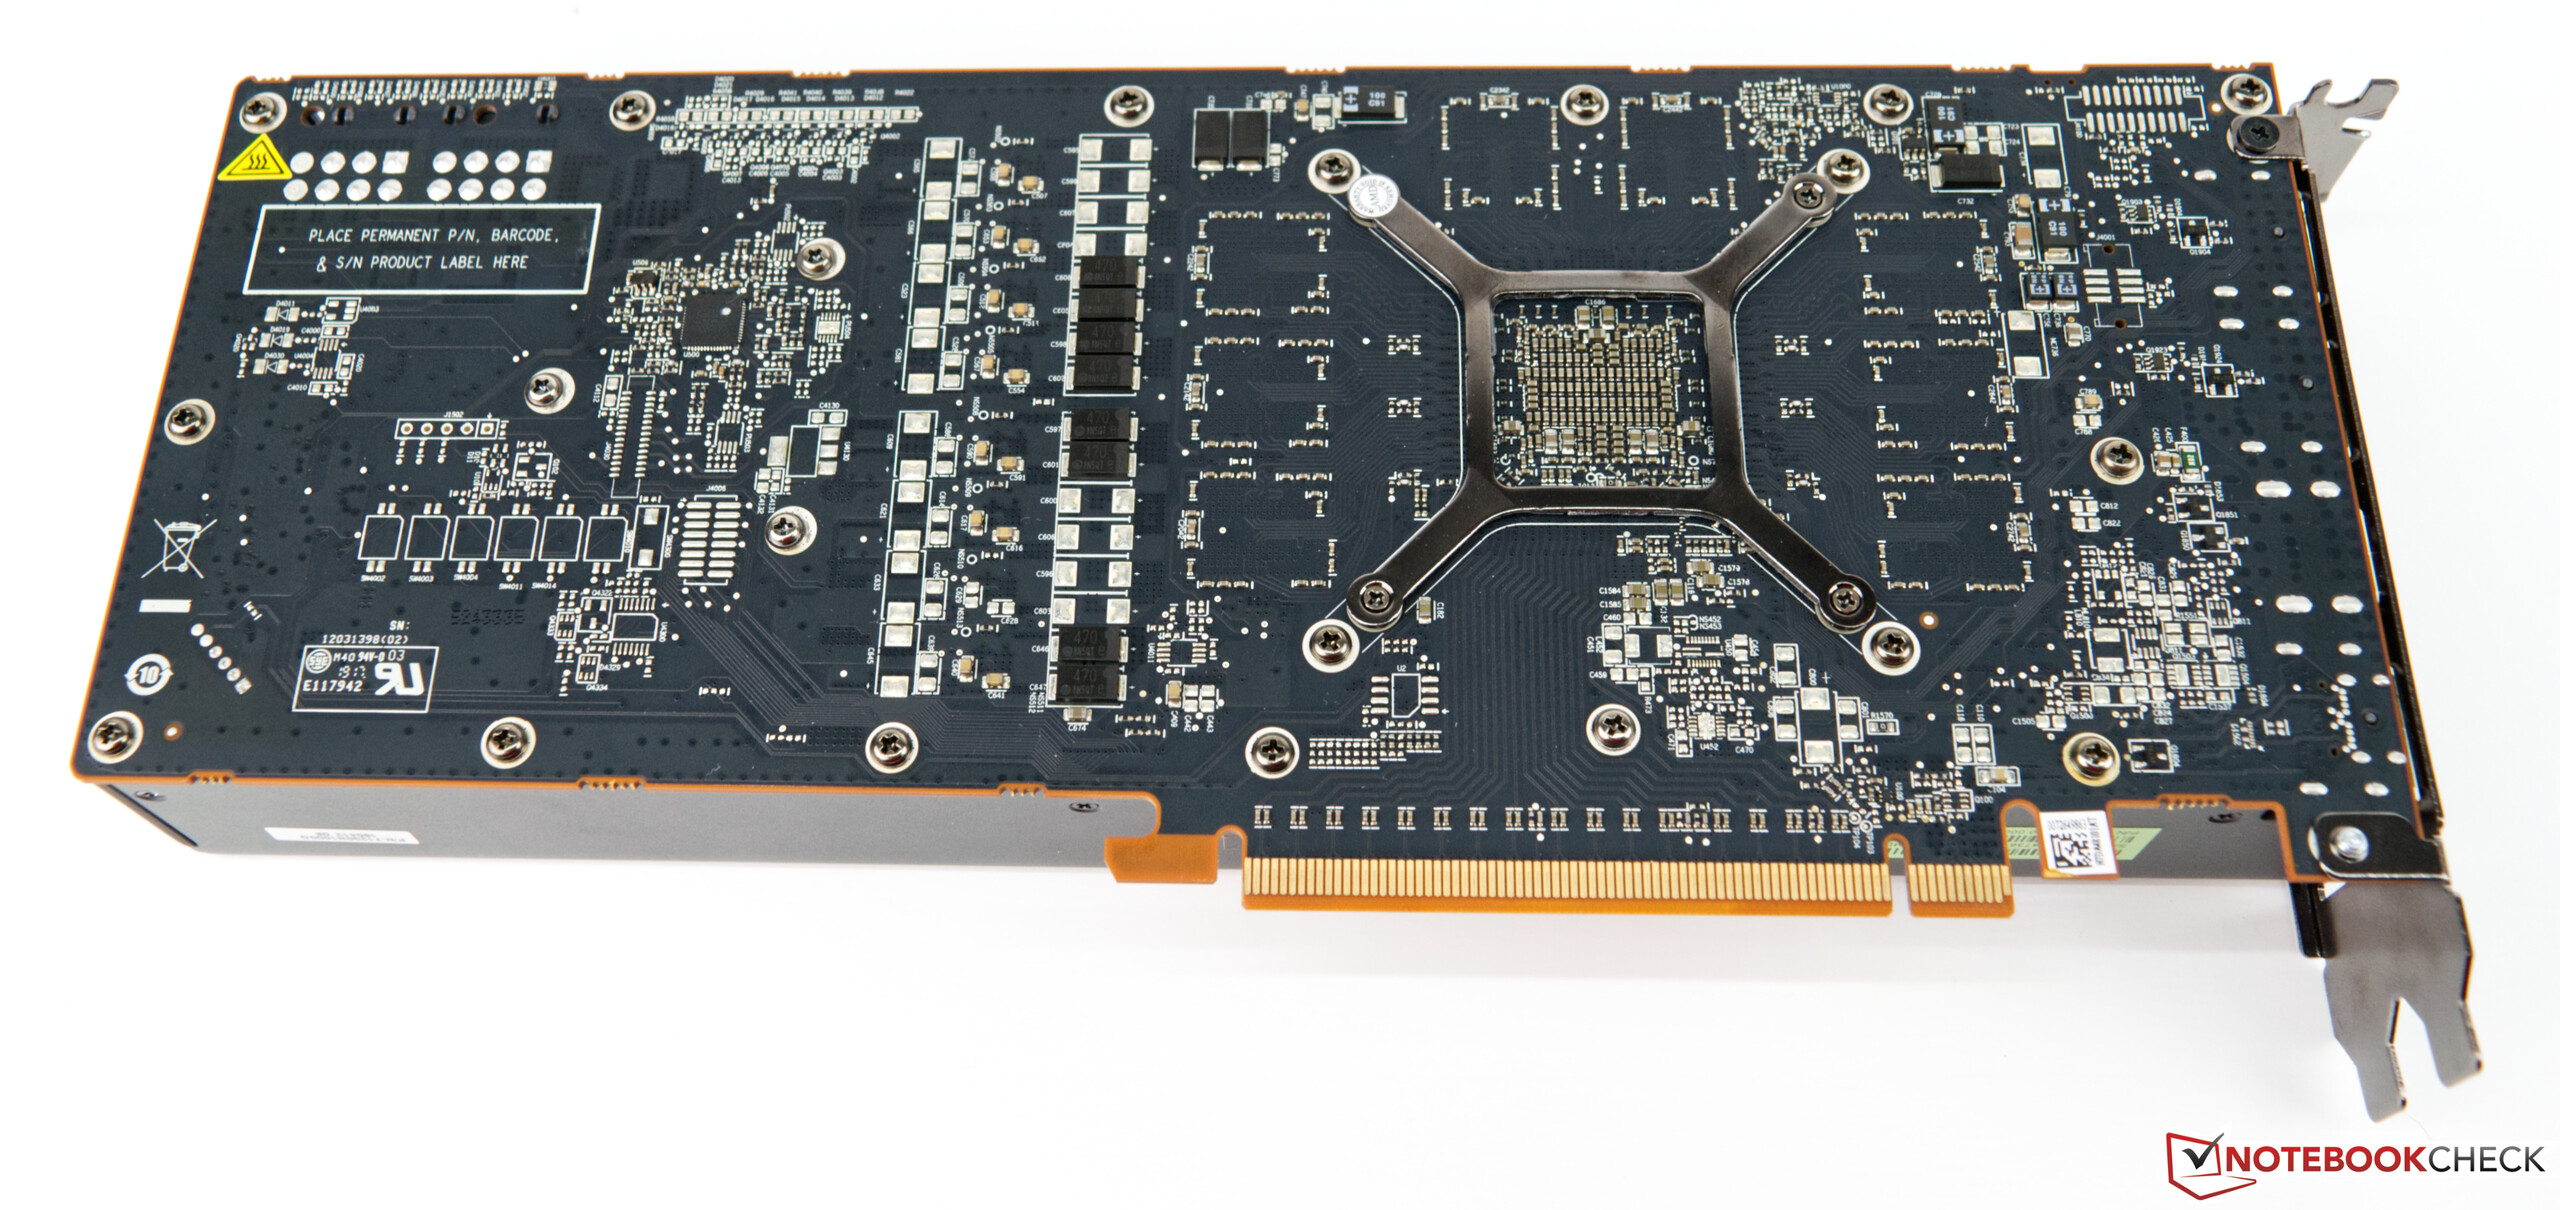
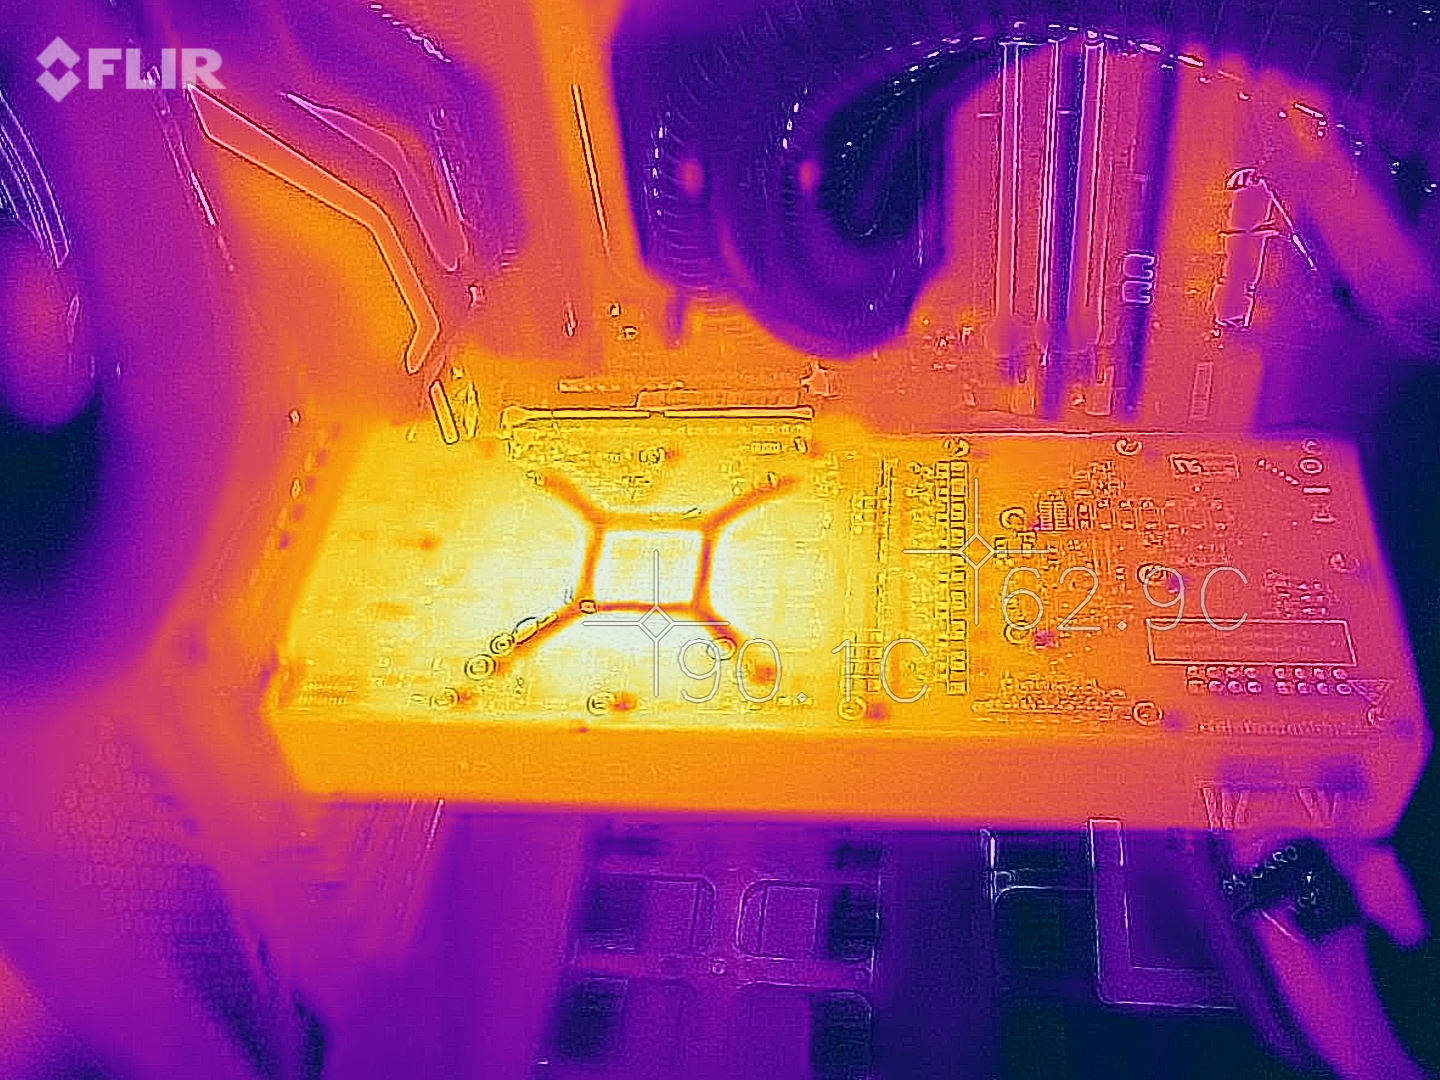
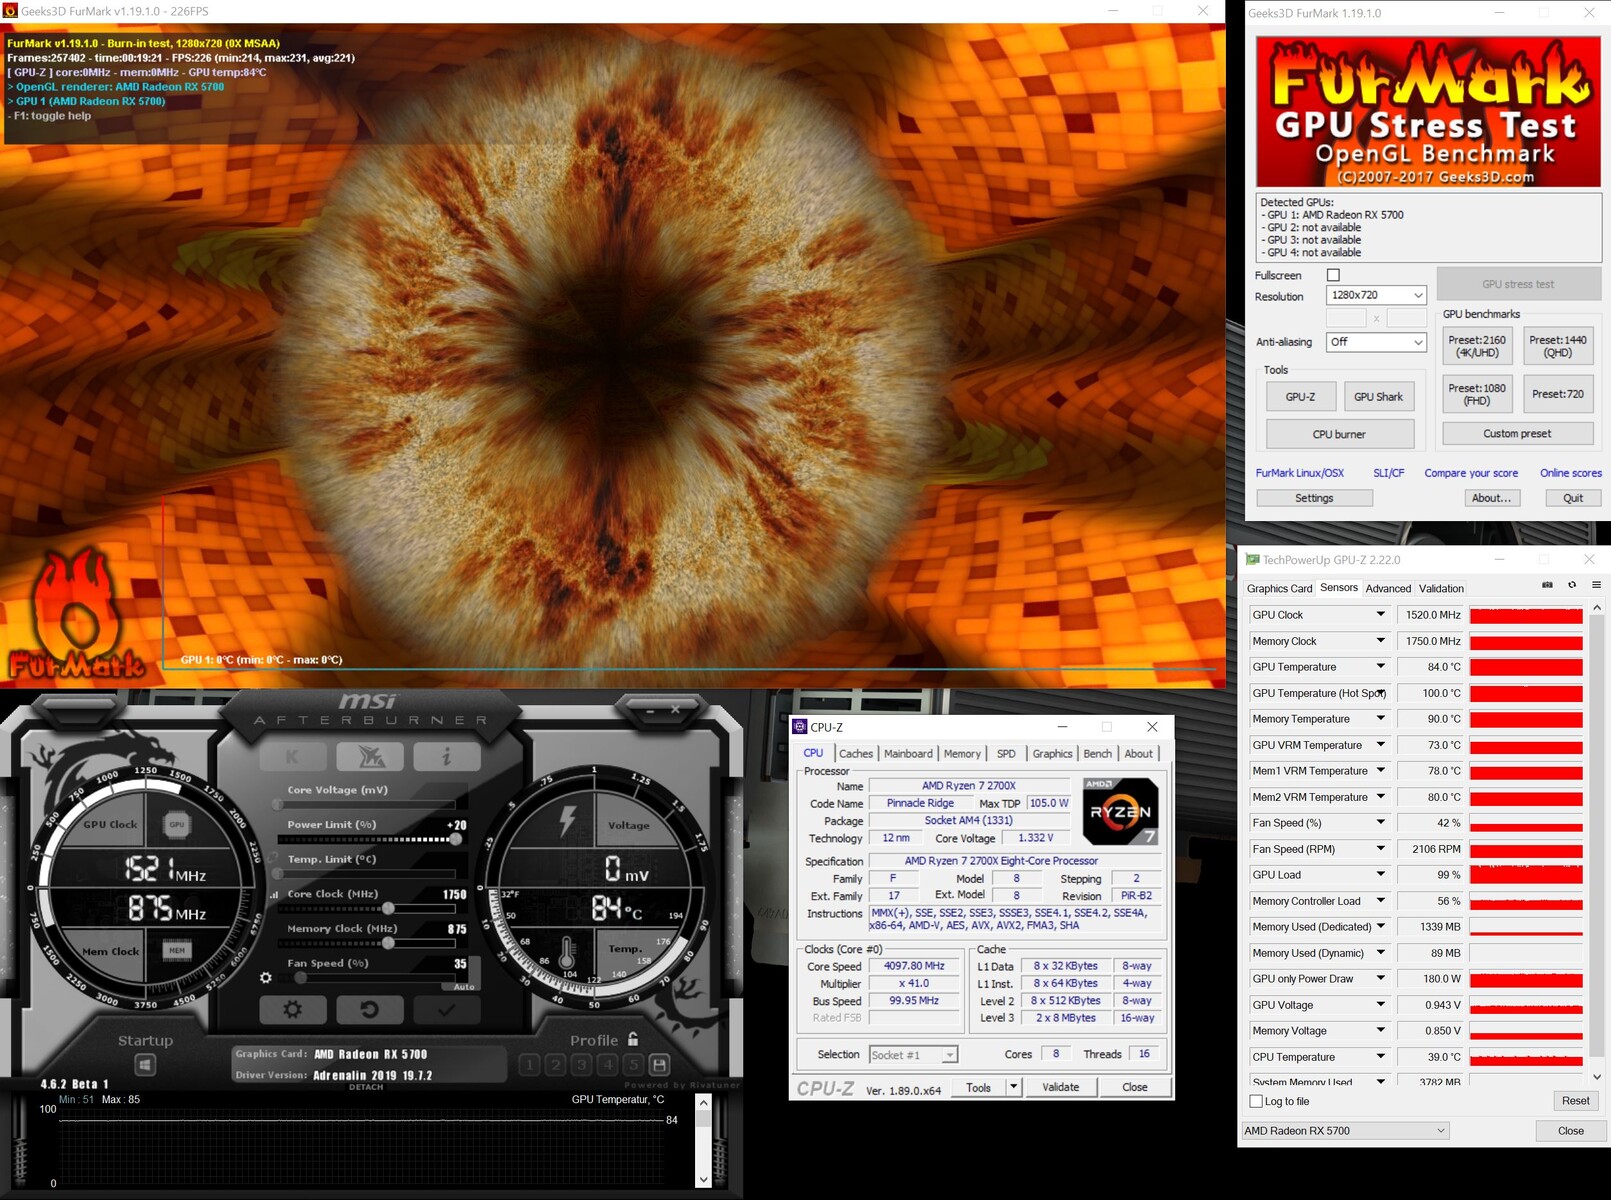
The temperatures measured in the stress test show that the cooling unit gets along well with the heat produced by the graphics card. The graphics chip is not too hot at 75 °C (~167 °F). However, there are further temperature sensors in the RX 5700. An example is the GPU hot spot temperature, which was measured at 87 °C under load in our review model. All this is still harmless and not a cause for concern. The lack of a backplate on the RX 5700 model is also forgivable. However, if we increase the PT (power target) to 120%, the power consumption increases by about 30 watts. The GPU chip alone now has 180 watts at its disposal. The cooling unit already has its hands full in keeping the temperatures in check here. The GPU hot spot temperature climbs to 100 °C (~212 °F).
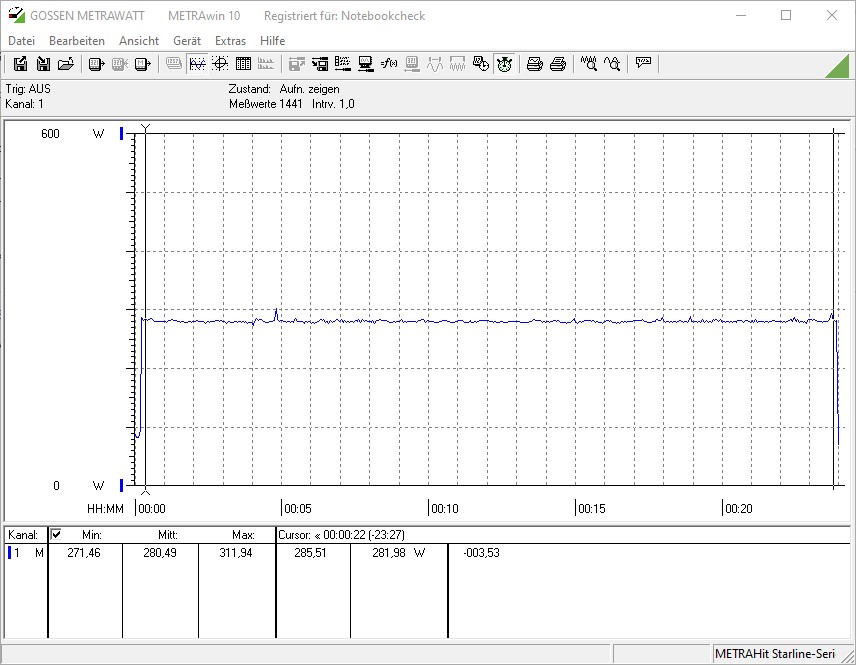
The energy requirement of the test system in idle usage is pleasing. With 64.5 watts, the system with the RX 5700 on board is the most economical in our comparison. The energy requirement climbs to an average of 296 watts when gaming. The same test system configured with the RTX 2060S FE consumed a bit more at 298 watts.
Note:
All gaming benchmarks and load tests were conducted with a closed case so as to represent the best possible use to consumers.

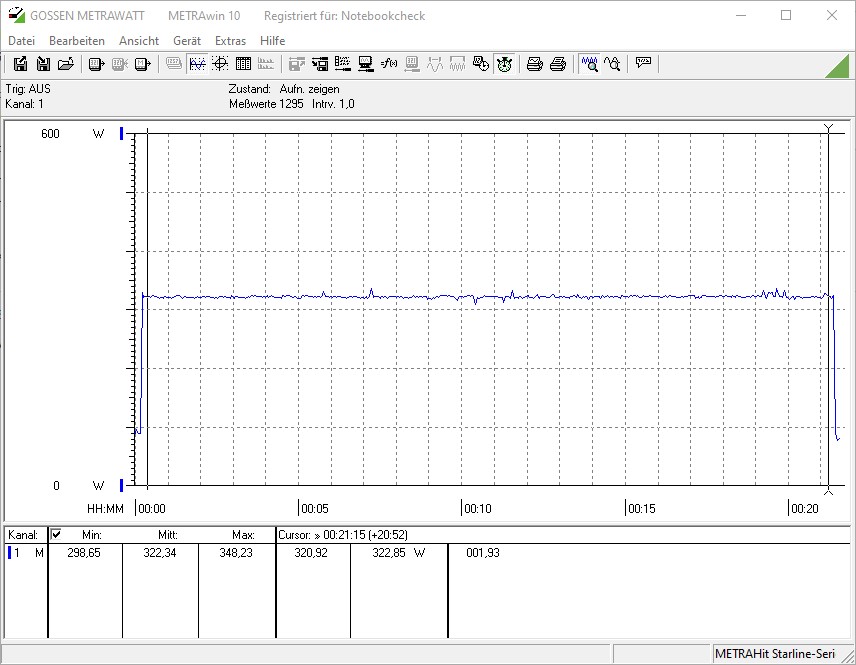

| Power Consumption | |
| 1920x1080 The Witcher 3 ultra (external Monitor) | |
| Nvidia Titan RTX | |
| AMD Radeon RX Vega 64 (Idle: 74.3 W) | |
| MSI RTX 2080 Gaming X Trio (Idle: 87.78 W) | |
| AMD Radeon RX 5700 XT (Idle: 69.8 W) | |
| Nvidia GeForce RTX 2070 Super (96.8 fps, Idle: 80.5 W) | |
| MSI RTX 2070 Gaming Z 8G (Idle: 73.3 W) | |
| AMD Radeon VII (Idle: 81.39 W) | |
| Nvidia GeForce RTX 2060 Super (82.7 fps, Idle: 77.12 W) | |
| AMD Radeon RX 5700 (84.2 fps, Idle: 64.5 W) | |
| MSI RTX 2060 Gaming Z 6G (Idle: 74.66 W) | |
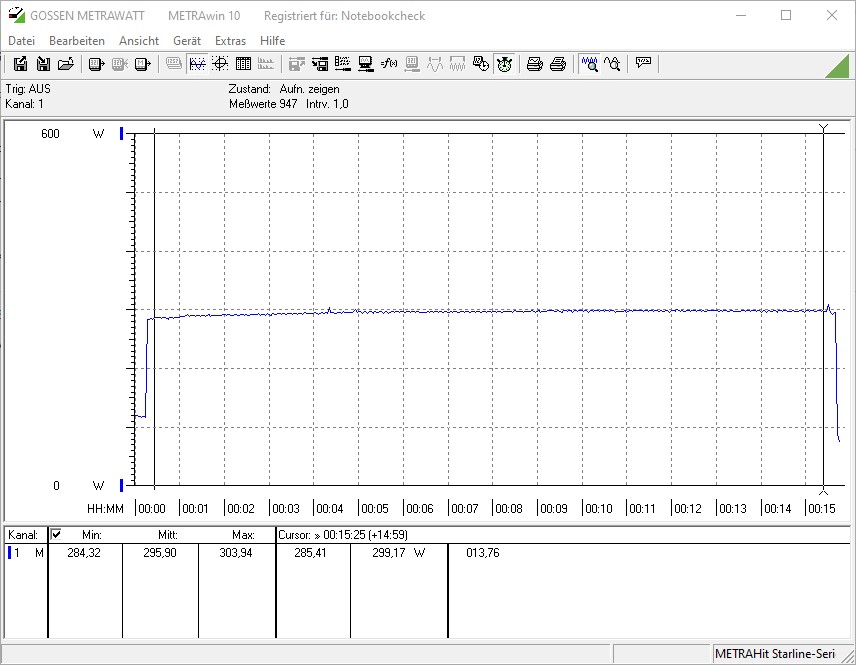
| 1280x720 FurMark 1.19 GPU Stress Test (external Monitor) | |
| AMD Radeon VII (Idle: 81.39 W) | |
| MSI RTX 2080 Gaming X Trio | |
| MSI RTX 2070 Gaming Z 8G (Idle: 73.3 W) | |
| AMD Radeon RX 5700 XT (239 fps, Idle: 69.8 W) | |
| Nvidia GeForce RTX 2070 Super (283 fps, Idle: 80.5 W) | |
| MSI RTX 2060 Gaming Z 6G (Idle: 74.66 W) | |
| Nvidia GeForce RTX 2060 Super (237 fps, Idle: 77.12 W) | |
| AMD Radeon RX 5700 (207 fps, Idle: 64.5 W) | |
* ... smaller is better
Overclocking - yes but not with reference design
Despite the high temperatures, we made an attempt at overclocking the AMD RX 5700. Disappointment followed quickly since there was virtually no room for modifications with the RAM. The RTX graphics card from Nvidia behaved a lot more friendly here, which concerns the VRAM. The GPU allowed an increase of 100 MHz. We were able to achieve slightly better results in the synthetic benchmarks when testing it. However, the performance increase is within the single-digit range so that it's not worth overclocking the graphics card in the reference design. The significantly higher energy consumption, which destroys the good energy balance that's found out of the box, is not something to sneer at either.
Due to the high temperatures under load with the increased PT, we don't recommend overclocking the graphics card with the standard cooler. Anyone who intends to operate their AMD Radeon RX 5700 permanently outside the specifications should consider alternative cooling solutions. Custom water cooling would be the first choice. In addition, the AMD Community offers tips and tricks to squeeze out even more performance from the graphics card. Soft power play tables are the keywords when it comes to overclocking Radeon graphics cards. However, if these mods are used any warranty claim against the manufacturer expires. Since we only have a loan of the RX 5700, we have not made any changes. Without an alternative cooling solution, the use of soft power play tables makes no sense anyway.


Pros
Cons
Verdict - good but not perfect
With the Radeon RX 5700, AMD not only presented a refresh but also introduced a completely new GPU architecture called RDNA. The changes in the chip's design and the smaller structural width of 7 nm bear fruit, and the AMD Radeon RX 5700 is in this way definitely able to keep up with an RTX 2060S FE. The distance to the competition is manageable and quite acceptable, because the Navi graphics card is at the front in the price comparison. The GPU in the reference design from AMD that we tested costs 369 Euros (~$411).
In exchange, buyers will receive a top modern graphics card with future-proof 8 GB GDDR6 VRAM and a GPU that has so far been able to run all tested games smoothly at 1440p.
Opinions differ when it comes to the cooling design. On one hand, it makes sense to quickly remove the heat from the case; on the other, the background noise is not something to sneeze at. Even if the graphics card is, with its 180 watts (TGP), significantly more economical than a Vega 64, its cooling unit is much louder under load than the competition in the green area. However, the cooling isn't a total fail with the RX 5700. The loudness doesn't get extremely bothersome, and if you play mostly with a headset you shouldn't notice much of the background noise under load. Overall, AMD shows with the Radeon RX 5700 that it doesn't want to completely yield the graphics card market to the competition.
However, we recommend buyers to wait a bit longer until board partners bring their models with better cooling solutions to market. Anyone not wanting to wait won't be doing much wrong by buying an AMD RX 5700. In the price range up to 400 Euros (~$445) the graphics card is probably the best choice in terms of price-performance ratio at the moment.
With RDNA and the 7-nm manufacturing process, AMD managed to bring a graphics card to market that not only can defy Nvidia in the midfield in terms of performance but can also make a decent impact in terms of energy balance.
Benchmarks
3DM Vant. Perf. total +
specvp12 sw-03 +
* Smaller numbers mean a higher performance
Game Benchmarks
The following benchmarks stem from our benchmarks of review laptops. The performance depends on the used graphics memory, clock rate, processor, system settings, drivers, and operating systems. So the results don't have to be representative for all laptops with this GPU. For detailed information on the benchmark results, click on the fps number.

F1 24
2024

Ghost of Tsushima
2024

Alone in the Dark
2024
Dragon's Dogma 2
2024
Last Epoch
2024
Skull & Bones
2024
Helldivers 2
2024
Enshrouded
2024
Palworld
2024

Ready or Not
2023
The Finals
2023


EA Sports WRC
2023
Alan Wake 2
2023
Lords of the Fallen
2023
Total War Pharaoh
2023

EA Sports FC 24
2023
Counter-Strike 2
2023
Cyberpunk 2077
2023
Baldur's Gate 3
2023
Lies of P
2023
Starfield
2023
Armored Core 6
2023
Immortals of Aveum
2023
Atlas Fallen
2023

F1 23
2023
Diablo 4
2023

Dead Island 2
2023
The Last of Us
2023

Company of Heroes 3
2023
Sons of the Forest
2023
Atomic Heart
2023
Returnal
2023
Hogwarts Legacy
2023
Dead Space Remake
2023
The Witcher 3 v4
2023
High On Life
2023


FIFA 23
2022
The Quarry
2022
F1 22
2022
Vampire Bloodhunt
2022
Ghostwire Tokyo
2022

Cyberpunk 2077 1.6
2022
Elex 2
2022
GRID Legends
2022
Elden Ring
2022
Dying Light 2
2022

God of War
2022
Halo Infinite
2021
Farming Simulator 22
2021
Battlefield 2042
2021
Forza Horizon 5
2021

Riders Republic
2021

Back 4 Blood
2021
Far Cry 6
2021
Alan Wake Remastered
2021
New World
2021
Deathloop
2021
F1 2021
2021

Days Gone
2021


Outriders
2021
Hitman 3
2021
Cyberpunk 2077 1.0
2020

Yakuza Like a Dragon
2020


Dirt 5
2020
Watch Dogs Legion
2020
FIFA 21
2020
Star Wars Squadrons
2020

Serious Sam 4
2020
Crysis Remastered
2020

Horizon Zero Dawn
2020
Death Stranding
2020
F1 2020
2020
Valorant
2020
Gears Tactics
2020
Doom Eternal
2020
Hunt Showdown
2020
Escape from Tarkov
2020


Need for Speed Heat
2019

GRID 2019
2019

FIFA 20
2019
Borderlands 3
2019
Control
2019
F1 2019
2019

Rage 2
2019
Anno 1800
2019
The Division 2
2019
Dirt Rally 2.0
2019
Anthem
2019
Far Cry New Dawn
2019
Metro Exodus
2019
Apex Legends
2019
Just Cause 4
2018
Darksiders III
2018
Battlefield V
2018
Farming Simulator 19
2018
Hitman 2
2018


Forza Horizon 4
2018
FIFA 19
2018

Strange Brigade
2018
Monster Hunter World
2018
The Crew 2
2018
Far Cry 5
2018
X-Plane 11.11
2018


Fortnite
2018

Destiny 2
2017
Rocket League
2017For Honor
2017
Overwatch
2016
The Division
2016
Far Cry Primal
2016
Rainbow Six Siege
2015Dota 2 Reborn
2015
The Witcher 3
2015
GTA V
2015| low | med. | high | ultra | QHD | 4K | |
|---|---|---|---|---|---|---|
| F1 24 | 205 | 178.7 | 130.1 | |||
| Senua's Saga Hellblade 2 | 48.5 | 39.7 | 21.4 | 14.2 | 7.6 | |
| Ghost of Tsushima | 94.7 | 76.7 | 70.3 | 55.3 | 42.3 | 18.9 |
| Horizon Forbidden West | 95.4 | 83.5 | 56 | 43.4 | 34.8 | 26.3 |
| Alone in the Dark | 210 | 155 | 74.6 | 35.8 | ||
| Dragon's Dogma 2 | 67.1 | 62.3 | 46.6 | 27.2 | ||
| Last Epoch | 244 | 193.4 | 156.1 | 104.8 | 89.5 | 43.8 |
| Skull & Bones | 95 | 84 | 67 | 60 | 45 | 25 |
| Helldivers 2 | 97.5 | 77.1 | 67.7 | 66.2 | 46.1 | 22.9 |
| Enshrouded | 60 | 52.3 | 43.7 | 36.6 | 27.6 | 15.9 |
| Palworld | 112.5 | 89 | 67.1 | 62.9 | 42.7 | 23.3 |
| Prince of Persia The Lost Crown | 358 | 359 | 359 | 309 | 153.1 | |
| Ready or Not | 156.3 | 143.1 | 133.2 | 93 | 55.7 | 25.2 |
| The Finals | 187.3 | 135.2 | 119.5 | 87.7 | 54 | 26.1 |
| Avatar Frontiers of Pandora | 70 | 63 | 53 | 40 | 31 | 26 |
| Call of Duty Modern Warfare 3 2023 | 112 | 100 | 77 | 72 | 50 | 29 |
| EA Sports WRC | 123.5 | 79.3 | 72.4 | 65.6 | 47.7 | 26.9 |
| Alan Wake 2 | 37.8 | 34 | 32.8 | 21.1 | 11.5 | |
| Lords of the Fallen | 67.5 | 56.3 | 38.6 | 26.8 | 17.6 | 8.7 |
| Total War Pharaoh | 310.3 | 220.3 | 113.8 | 93.6 | 59.2 | 28.3 |
| Assassin's Creed Mirage | 86 | 78 | 73 | 59 | 46 | 28 |
| EA Sports FC 24 | 247 | 218 | 183.4 | 157.1 | 120.4 | 75.6 |
| Counter-Strike 2 | 344 | 307 | 171.2 | 136.5 | 86.6 | 49.2 |
| Cyberpunk 2077 | 82.2 | 66.5 | 56.6 | 50.1 | 31.8 | 13.7 |
| Baldur's Gate 3 | 98.1 | 80.6 | 67.5 | 66.2 | 46 | 24.2 |
| Lies of P | 140.8 | 123.3 | 106.9 | 93.3 | 61.5 | 31.3 |
| Starfield | 58.6 | 50.1 | 41.8 | 37.5 | 29.8 | 18.3 |
| Armored Core 6 | 115 | 97.2 | 87.9 | 74.2 | 56.6 | 33.9 |
| Immortals of Aveum | 58.1 | 47.5 | 37.2 | 25.5 | 13.9 | |
| Atlas Fallen | 113.5 | 106.8 | 100.4 | 82.3 | 56.9 | 31.6 |
| Ratchet & Clank Rift Apart | 71.9 | 60.4 | 48.9 | 42.1 | 34.5 | 21.7 |
| F1 23 | 250 | 220 | 150.8 | 105.5 | 78.2 | 44.7 |
| Diablo 4 | 188.4 | 157.4 | 142.2 | 119.8 | 80.7 | 42.9 |
| Star Wars Jedi Survivor | 66.4 | 57.7 | 53.3 | 50.7 | 32.4 | 16.1 |
| Dead Island 2 | 204 | 175.9 | 124.7 | 95.2 | 63.6 | 31.8 |
| The Last of Us | 84.8 | 69.1 | 61.2 | 50.3 | 32.4 | 14.8 |
| Resident Evil 4 Remake | 130.8 | 95 | 84 | 72.1 | 51.2 | 28.5 |
| Company of Heroes 3 | 142.6 | 124.6 | 98.3 | 97.5 | 70.9 | 42.3 |
| Sons of the Forest | 100.4 | 73.3 | 71.2 | 69.3 | 50.6 | 28.8 |
| Atomic Heart | 159 | 120.8 | 69.8 | 55.3 | 41.8 | 24.7 |
| Returnal | 62 | 60 | 56 | 50 | 38 | 23 |
| Hogwarts Legacy | 115.4 | 85.5 | 67.8 | 49.8 | 38 | 21.2 |
| Dead Space Remake | 75.6 | 71.1 | 60.8 | 60.5 | 40.7 | 19.4 |
| The Witcher 3 v4 | 167.6 | 133.6 | 112.7 | 94.3 | 66.6 | 36.2 |
| High On Life | 224 | 139.4 | 110.7 | 86.2 | 52.5 | 23.5 |
| The Callisto Protocol | 132 | 91 | 59 | 58 | 42 | 24 |
| Need for Speed Unbound | 117.1 | 112.6 | 89.6 | 72.1 | 56.7 | 33.1 |
| Spider-Man Miles Morales | 103.2 | 93.9 | 92.8 | 84.8 | 58.6 | 30.9 |
| Call of Duty Modern Warfare 2 2022 | 129 | 115 | 83 | 79 | 56 | 33 |
| Uncharted Legacy of Thieves Collection | 76.2 | 73.1 | 69.7 | 65.5 | 49.4 | 24.8 |
| A Plague Tale Requiem | 95.6 | 73 | 53.8 | 40.5 | 29.3 | 16.6 |
| FIFA 23 | 267 | 246 | 163.7 | 160.3 | 126.8 | 76.6 |
| The Quarry | 121 | 95 | 77 | 56 | 37 | 14 |
| F1 22 | 231 | 211 | 155 | 104 | 80 | 48 |
| Vampire Bloodhunt | 295 | 160.5 | 155.4 | 150.4 | 96.9 | 48.2 |
| Ghostwire Tokyo | 171 | 125 | 122 | 120 | 77 | 37 |
| Tiny Tina's Wonderlands | 189 | 149 | 97 | 74 | 51 | 26 |
| Cyberpunk 2077 1.6 | 84 | 75 | 67 | 58 | 36 | 15 |
| Elex 2 | 74.9 | 73 | 67 | 61.2 | 46 | 26.7 |
| GRID Legends | 223 | 181 | 149 | 120 | 97 | 62 |
| Elden Ring | 60 | 60 | 60 | 60 | 59.3 | 36.1 |
| Dying Light 2 | 143 | 73 | 60.6 | 42 | 21.9 | |
| Rainbow Six Extraction | 190 | 153 | 148 | 126 | 79 | 38 |
| God of War | 119 | 93 | 87 | 57 | 45 | 28 |
| Halo Infinite | 77.6 | 67.3 | 68.7 | 64.2 | 32.4 | |
| Farming Simulator 22 | 293 | 188 | 141 | 119 | 92 | 60.1 |
| Battlefield 2042 | 134 | 116 | 98.5 | 83 | 67.7 | 39.9 |
| Forza Horizon 5 | 257 | 139 | 121 | 65 | 54 | 37 |
| Call of Duty Vanguard | 82.9 | 110 | 97.2 | 91 | 63.8 | 34.2 |
| Riders Republic | 138 | 126 | 104 | 94 | 66 | 34 |
| Guardians of the Galaxy | 114 | 85 | 84 | 81 | 62 | 40 |
| Back 4 Blood | 183 | 157 | 146 | 96.9 | 49.1 | |
| Far Cry 6 | 195 | 131 | 113 | 96 | 66 | 19 |
| Alan Wake Remastered | 102 | 95.7 | 89.9 | 82.8 | ||
| New World | 147 | 94 | 85.1 | 74.8 | 49 | 29.3 |
| Deathloop | 132 | 108 | 89.6 | 65.4 | 44.7 | 23.9 |
| F1 2021 | 539 | 301 | 238 | 155 | 116 | 67 |
| Monster Hunter Stories 2 | 144 | 144 | 144 | 144 | 106 | |
| Days Gone | 175 | 130 | 112 | 73.8 | 56.8 | 30.1 |
| Mass Effect Legendary Edition | 112 | 108 | 103 | 68.7 | ||
| Resident Evil Village | 316 | 160 | 153 | 135 | 88.2 | 43.8 |
| Outriders | 154 | 146 | 116 | 99.8 | 66.8 | 33.2 |
| Hitman 3 | 289 | 150 | 135 | 124 | 82 | 46 |
| Cyberpunk 2077 1.0 | 127 | 73.9 | 60.1 | 51.4 | 32.2 | 14.8 |
| Immortals Fenyx Rising | 105 | 91 | 84 | 79 | 64 | 39 |
| Yakuza Like a Dragon | 78.1 | 75.5 | 75.4 | 73.4 | 55 | 28.4 |
| Call of Duty Black Ops Cold War | 163 | 110 | 92.6 | 73.6 | 54.2 | 30.9 |
| Assassin´s Creed Valhalla | 139 | 97 | 80 | 77 | 53 | 31 |
| Dirt 5 | 162 | 102 | 83.4 | 73.1 | 59.6 | 37.3 |
| Watch Dogs Legion | 141 | 108 | 94.2 | 58 | 37.5 | 11.4 |
| FIFA 21 | 251 | 259 | 243 | 245 | 244 | 180 |
| Star Wars Squadrons | 477.1 | 339.9 | 291.3 | 266.4 | 171.4 | 88.8 |
| Mafia Definitive Edition | 128.4 | 92.9 | 88 | 60.9 | 32.4 | |
| Serious Sam 4 | 144.6 | 106.5 | 93.2 | 75.2 | 64.6 | 42.3 |
| Crysis Remastered | 230 | 137 | 74.7 | 57.8 | 42.6 | 23 |
| Flight Simulator 2020 | 83.3 | 66.9 | 48.3 | 30.9 | 23.9 | 14.3 |
| Horizon Zero Dawn | 176 | 120 | 100 | 78 | 59 | 32 |
| Death Stranding | 198 | 134 | 124 | 121 | 85.6 | 46.4 |
| F1 2020 | 349 | 230 | 188 | 127 | 97 | 57 |
| Valorant | 308.5 | 294.1 | 290.5 | 276.6 | 231.2 | |
| Gears Tactics | 347.4 | 213.6 | 134 | 89.8 | 60.5 | 30.6 |
| Doom Eternal | 241 | 182 | 164 | 160 | 110 | 56.4 |
| Hunt Showdown | 210 | 124 | 99.7 | 60.1 | 29.9 | |
| Escape from Tarkov | 121 | 121 | 121 | 121 | 88.3 | 40.3 |
| Red Dead Redemption 2 | 151 | 109 | 72 | 46.2 | 37.1 | 24 |
| Star Wars Jedi Fallen Order | 113 | 112 | 102 | 70 | 35.3 | |
| Need for Speed Heat | 108 | 105 | 98 | 88 | 72 | 39.9 |
| Call of Duty Modern Warfare 2019 | 181 | 130 | 110 | 95 | 68 | 37.8 |
| GRID 2019 | 173 | 148 | 128 | 91 | 74 | 49.4 |
| Ghost Recon Breakpoint | 130 | 102 | 92 | 68 | 50 | 26 |
| FIFA 20 | 309 | 307 | 285 | 284 | 277 | 190 |
| Borderlands 3 | 185 | 138 | 92 | 69 | 48 | 26 |
| Control | 236 | 110 | 76 | 48 | 24 | |
| F1 2019 | 234 | 203 | 171 | 124 | 99 | 59 |
| Total War: Three Kingdoms | 244.4 | 133.8 | 92.3 | 63 | 39.1 | 18.9 |
| Rage 2 | 218 | 95 | 65 | 32.4 | ||
| Anno 1800 | 89 | 87 | 68 | 38.9 | 37 | 20.4 |
| The Division 2 | 136 | 115 | 98 | 78 | 56.9 | 30 |
| Dirt Rally 2.0 | 168 | 142 | 135 | 103 | 77 | 43.4 |
| Anthem | 90 | 88 | 88 | 86 | 76 | 42.9 |
| Far Cry New Dawn | 159 | 131 | 123 | 111 | 89 | 50 |
| Metro Exodus | 201 | 101 | 76 | 63 | 50 | 30 |
| Apex Legends | 144 | 144 | 143 | 142 | 104 | 57.2 |
| Just Cause 4 | 105 | 99 | 92 | 88 | 73 | 39.2 |
| Darksiders III | 180 | 122 | 113 | 103 | 72 | 37.1 |
| Battlefield V | 133 | 115 | 105 | 97 | 81 | 53.5 |
| Farming Simulator 19 | 154 | 124 | 101 | 94 | 87 | 46.2 |
| Hitman 2 | 94 | 92 | 82 | 80 | 78 | 46.6 |
| Call of Duty Black Ops 4 | 210 | 180 | 176 | 114 | 102 | 53 |
| Assassin´s Creed Odyssey | 82 | 77 | 71 | 60 | 51 | 31 |
| Forza Horizon 4 | 153 | 132 | 130 | 118 | 103 | 70 |
| FIFA 19 | 296 | 288 | 276 | 270 | 267 | 164 |
| Shadow of the Tomb Raider | 247 | 125 | 116 | 101 | 70 | 36 |
| Strange Brigade | 489 | 208 | 170 | 150 | 106 | 62 |
| Monster Hunter World | 125 | 107 | 101 | 81 | 54.2 | 27.8 |
| The Crew 2 | 60 | 60 | 60 | 60 | 60 | 39.4 |
| Far Cry 5 | 180 | 135 | 126 | 118 | 89 | 46 |
| X-Plane 11.11 | 116 | 86 | 67 | 51 | ||
| Kingdom Come: Deliverance | 124 | 112 | 90 | 64 | 52.2 | 26.2 |
| Final Fantasy XV Benchmark | 185 | 105 | 72 | 58 | 32 | |
| Fortnite | 208 | 166 | 140 | 118 | 77 | 39.1 |
| Assassin´s Creed Origins | 74 | 69 | 68 | 63 | 56 | 35 |
| Destiny 2 | 139 | 137 | 135 | 132 | 92 | 49.1 |
| Playerunknown's Battlegrounds (PUBG) | 190 | 151 | 144 | 139 | 59.1 | |
| Rocket League | 235 | 224 | 205 | 132 | ||
| Ghost Recon Wildlands | 120.4 | 91.3 | 90.4 | 60.4 | 43.6 | |
| For Honor | 269.9 | 188.7 | 178.9 | 143.5 | 56.7 | |
| Overwatch | 299 | 298 | 201 | 138 | ||
| The Division | 268.8 | 149.1 | 116.8 | 55.9 | ||
| Far Cry Primal | 120 | 107 | 98 | 91 | 52 | |
| Rainbow Six Siege | 283.3 | 250.7 | 236.5 | 103.2 | ||
| Dota 2 Reborn | 233 | 206 | 180 | 168 | 104 | |
| The Witcher 3 | 367 | 268 | 141 | 87 | 48 | |
| GTA V | 177 | 179 | 167 | 92 | 72 | 75 |
| low | med. | high | ultra | QHD | 4K | < 30 fps < 60 fps < 120 fps ≥ 120 fps | 4 45 100 | 6 71 70 | 1 14 84 53 | 1 25 84 29 | 8 65 60 9 | 57 74 14 7 |
For more games that might be playable and a list of all games and graphics cards visit our Gaming List
