Notebookcheck Logo

Atomic Heart review: Notebook and desktop benchmarks

Real eye candy. Atomic Heart isn't just stylish in gameplay - it is also a top-tier game from a technical standpoint. The first-person shooter is definitely one of the best looking PC games released in the past few years. You can read about what that means in terms of hardware requirements in our benchmark check.
Atomic Heart

Technical aspects

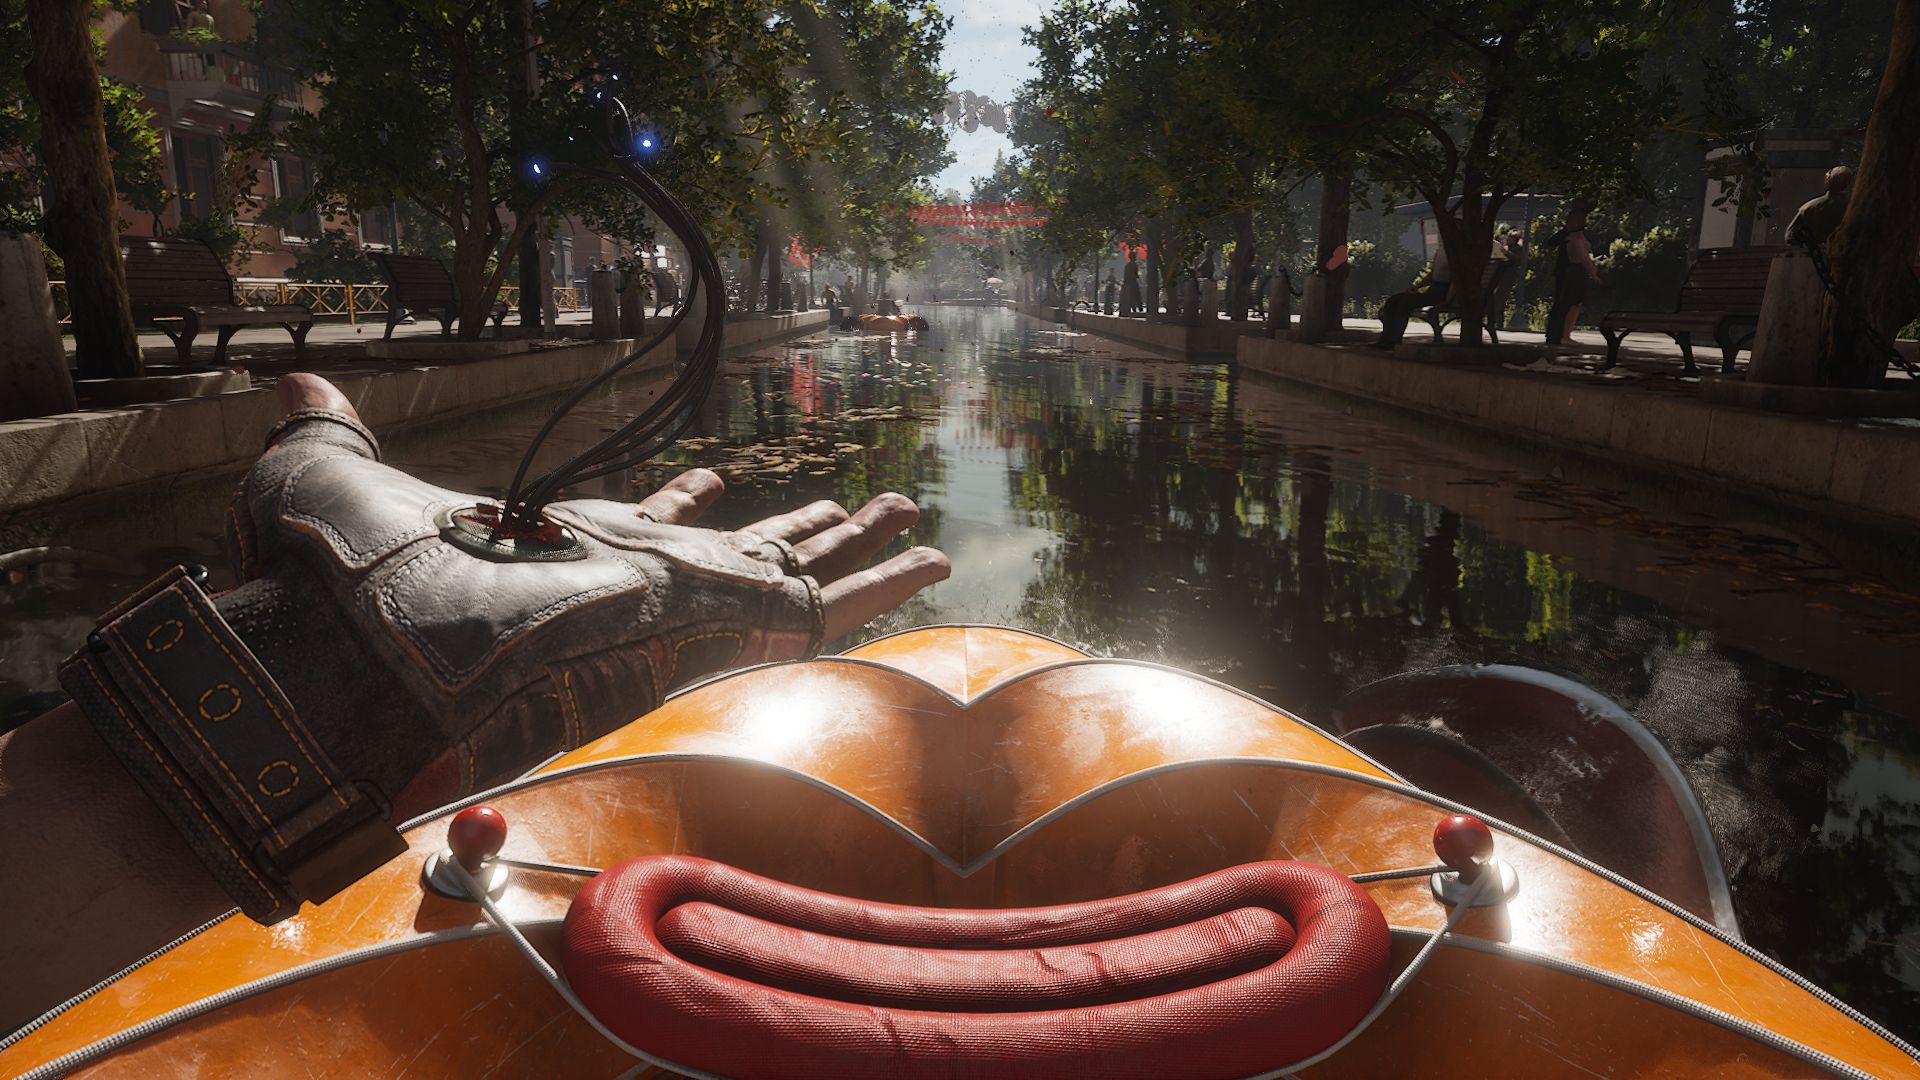
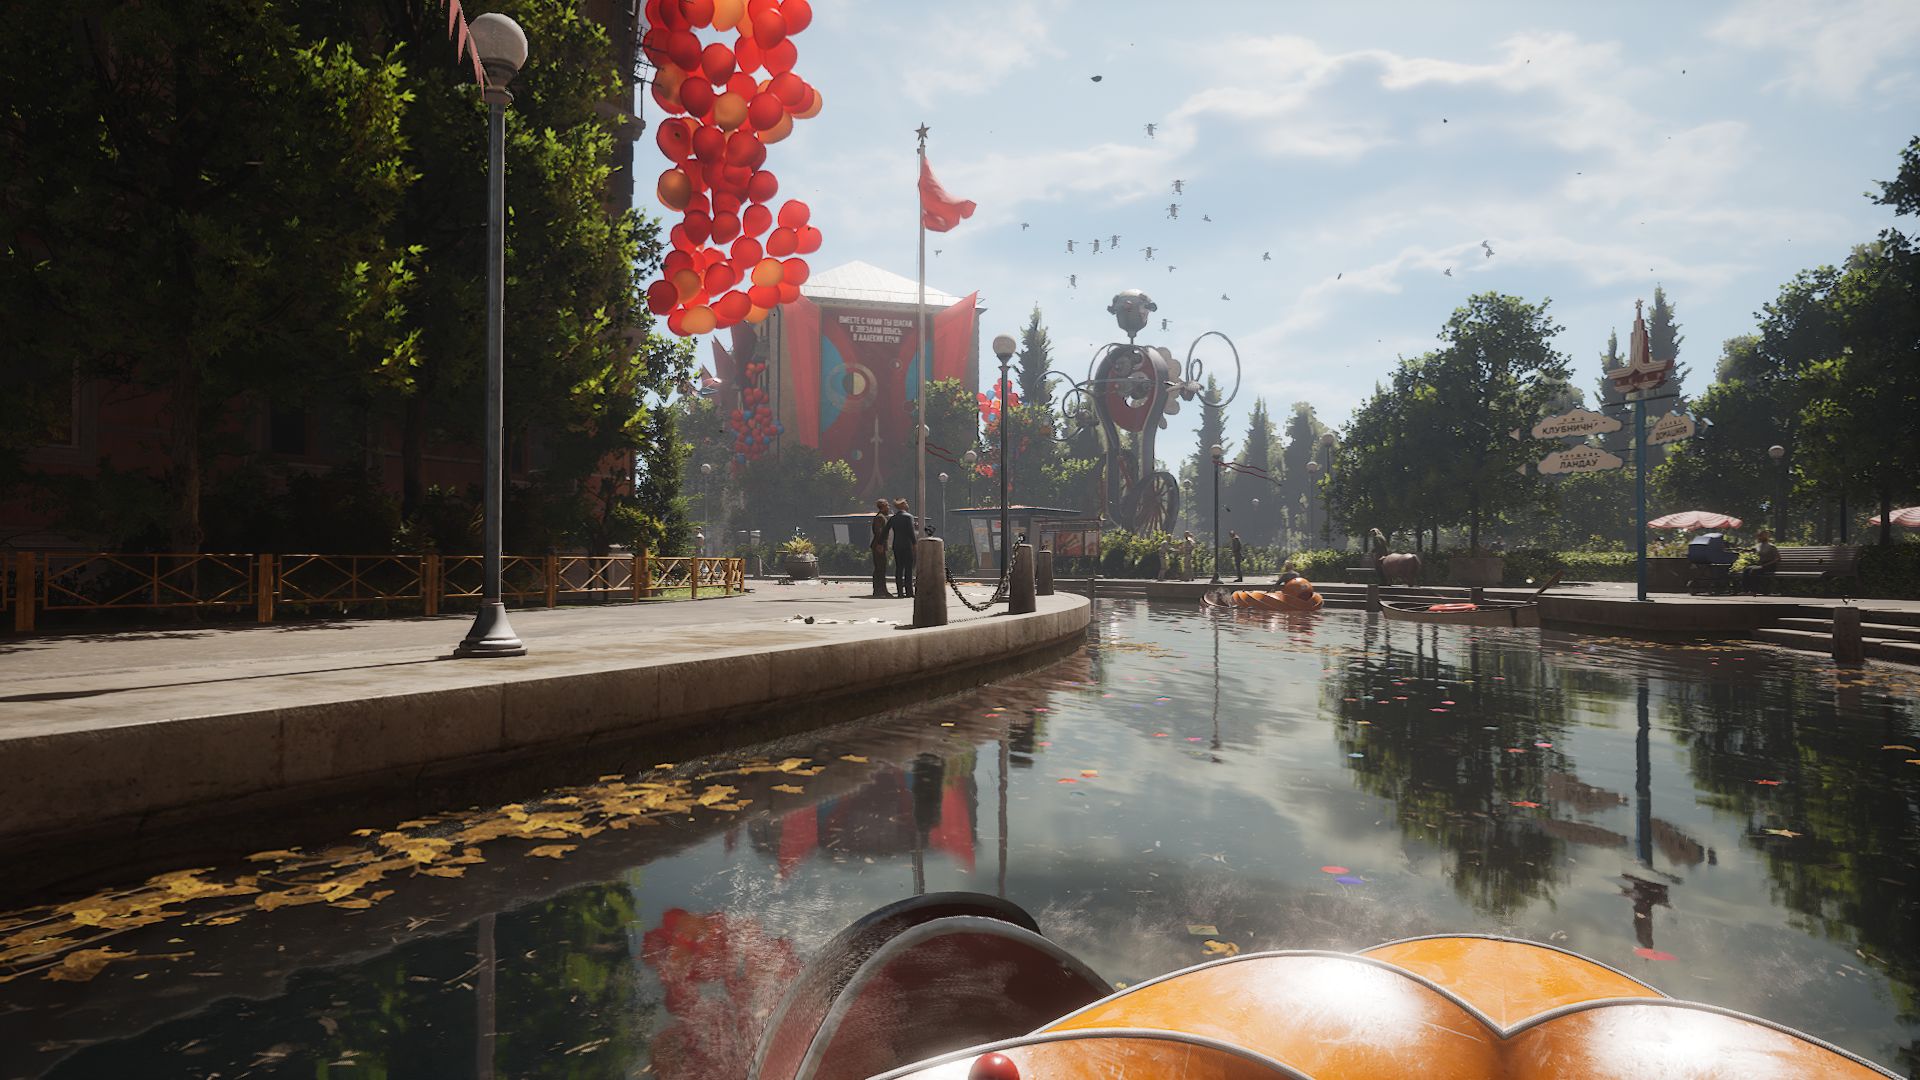
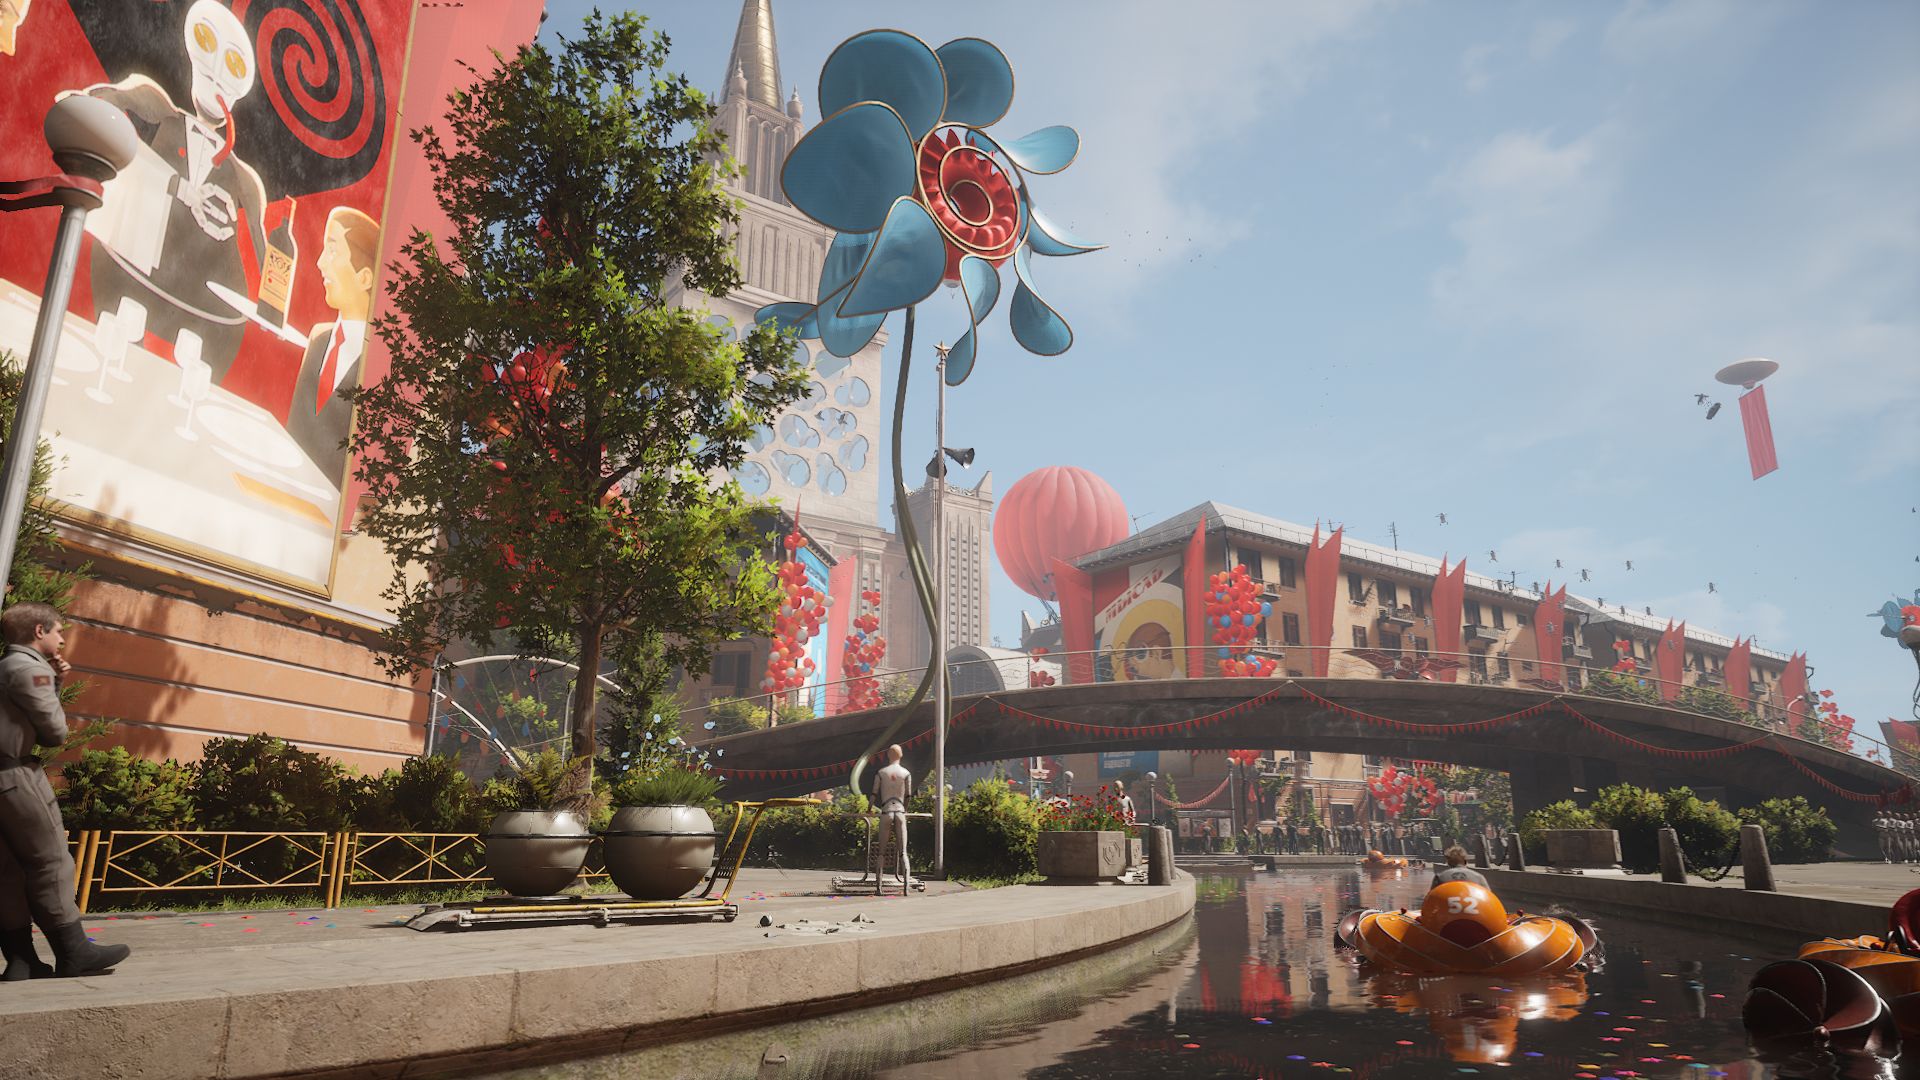
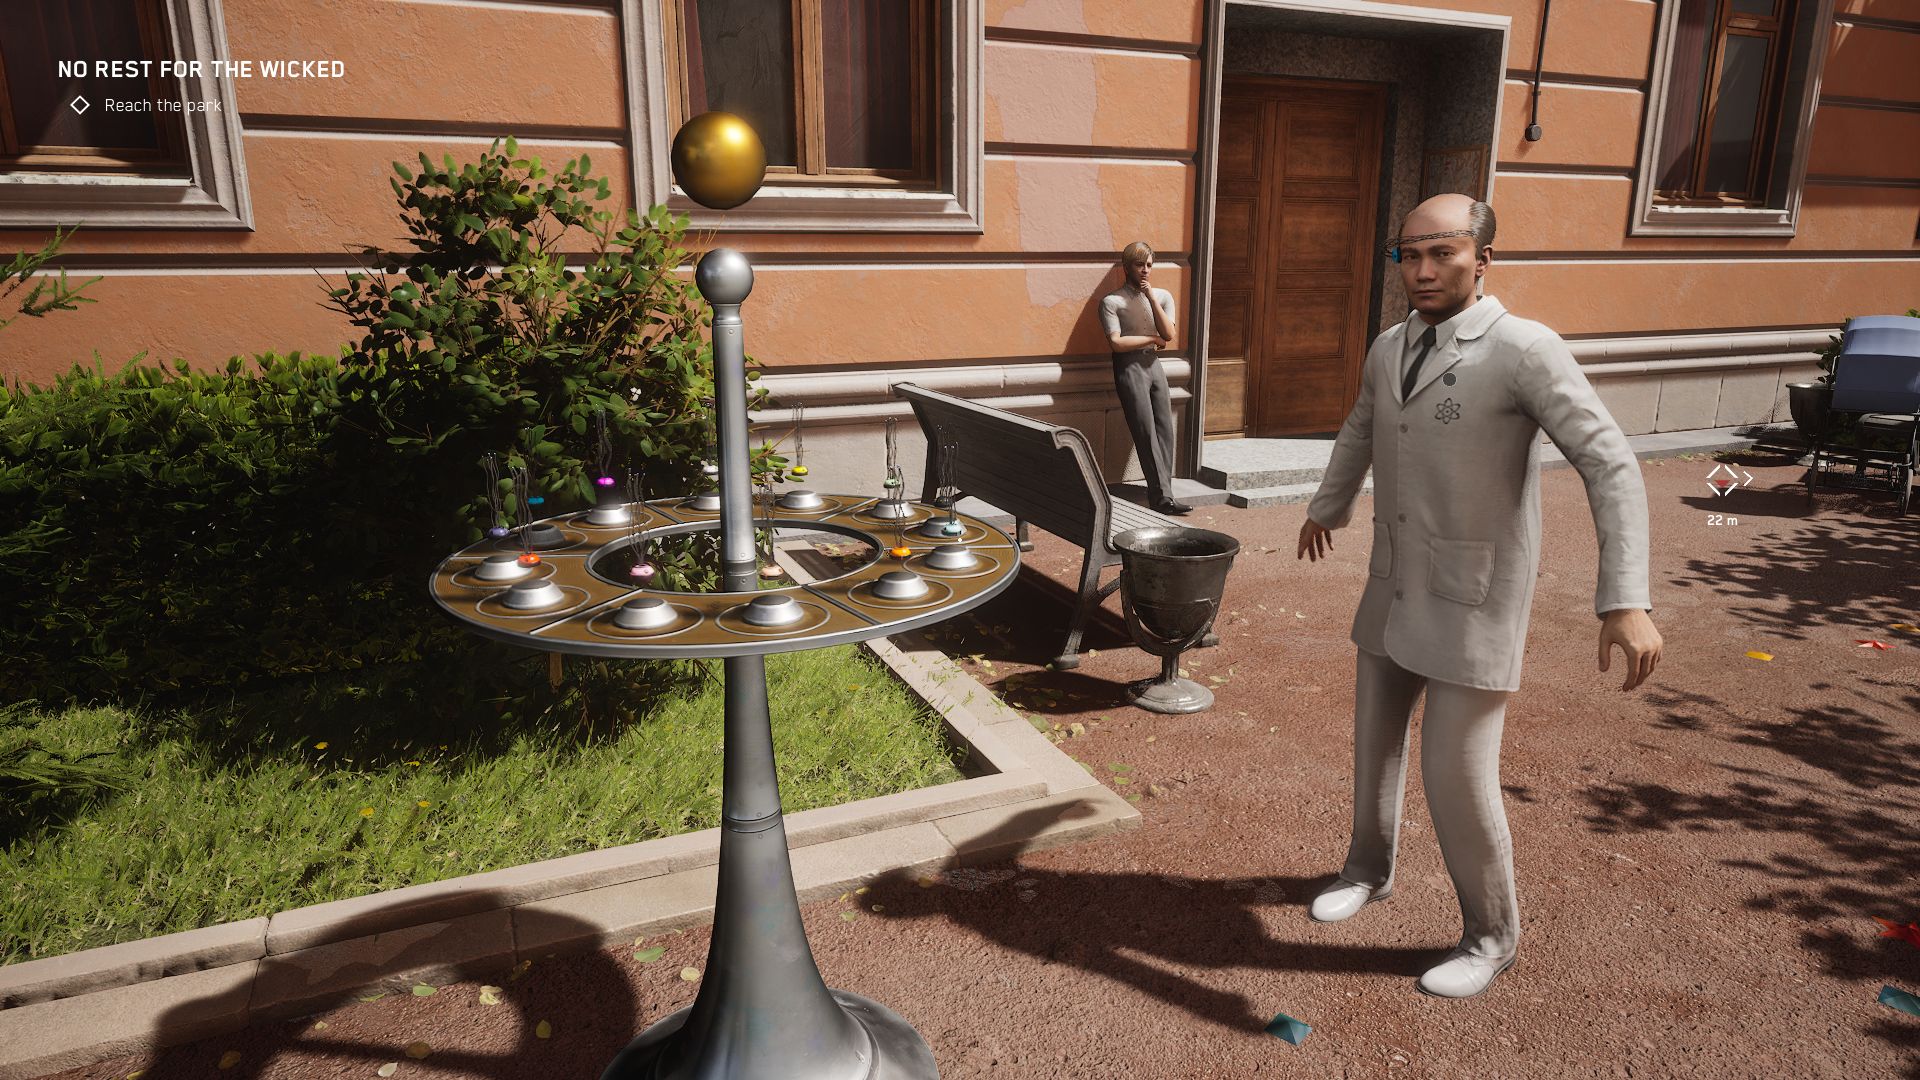
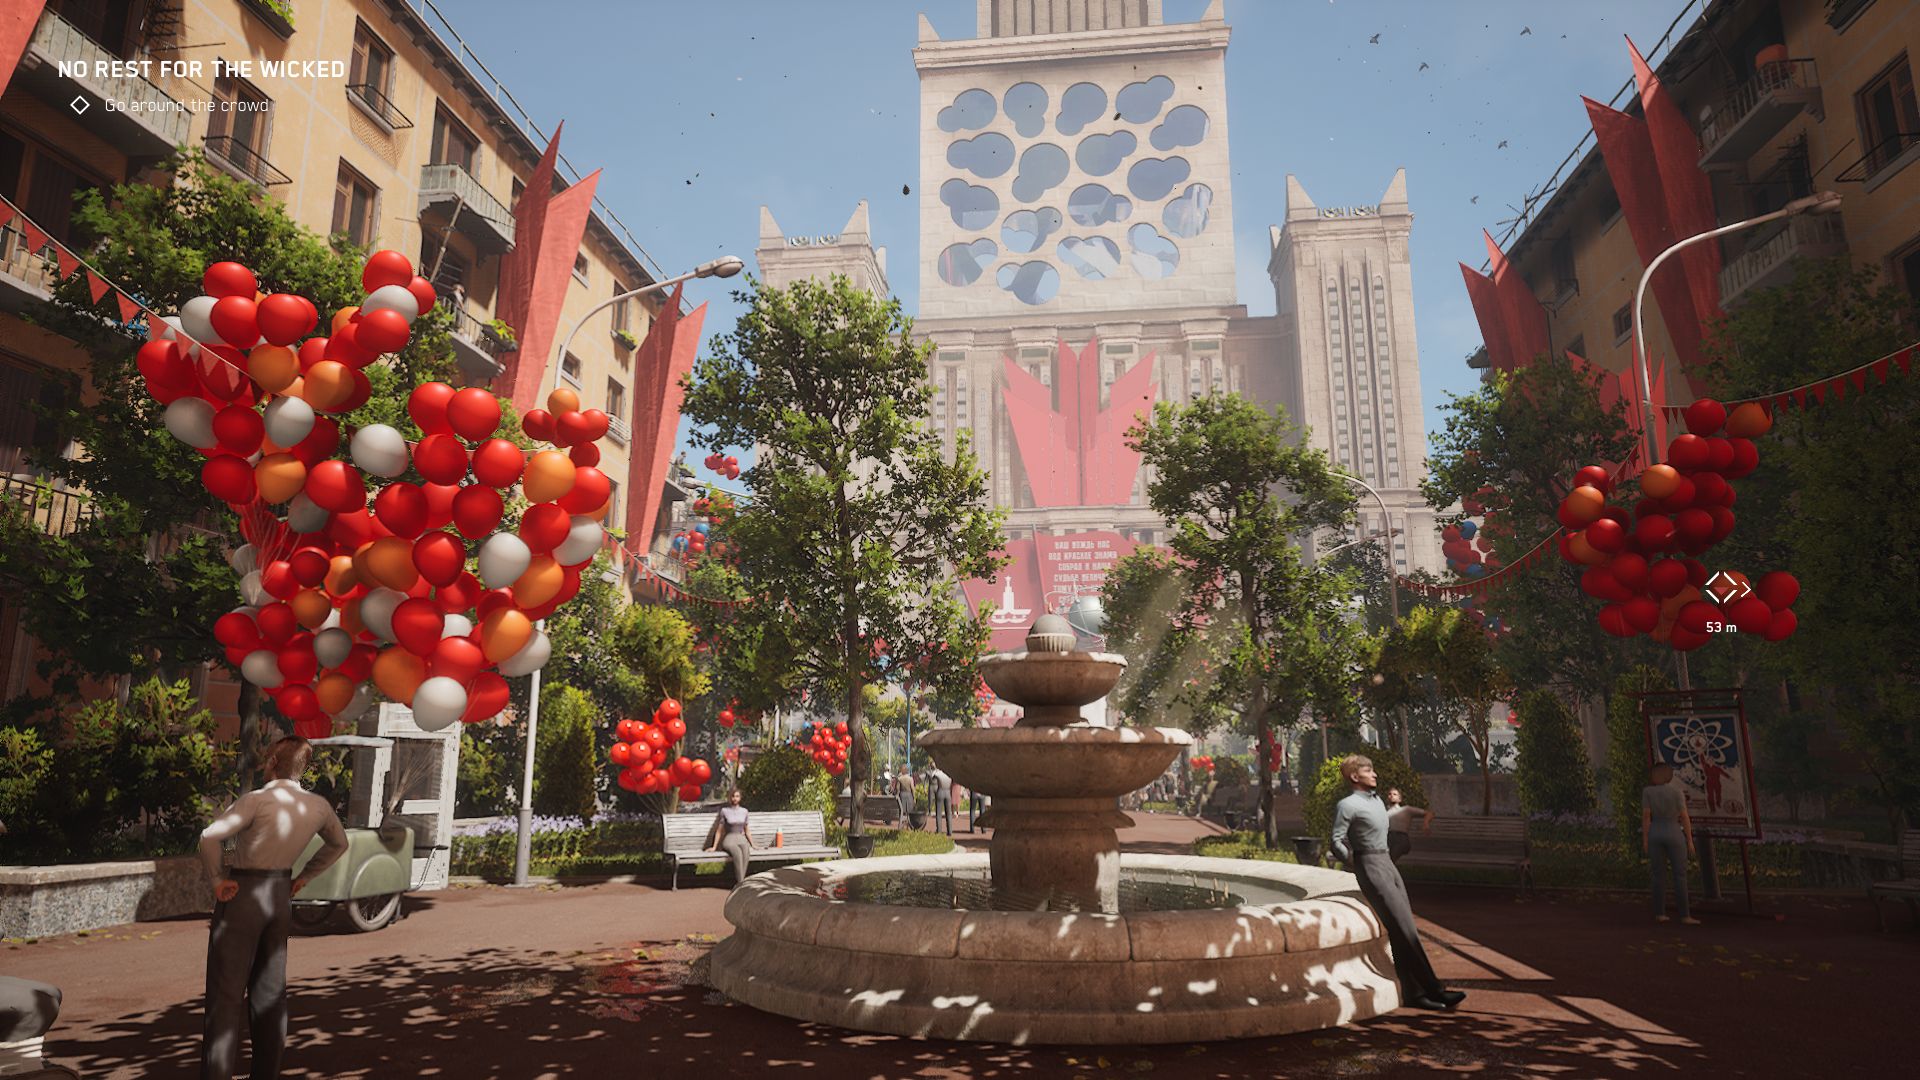
Atomic Heart isn't your run-of-the-mill shooter and this becomes clear within the first few minutes of gameplay. The game has a really dense atmosphere, which is fuelled by its extreme eye for detail as well as its unique style - a mix of Sci-Fi and Steampunk. Fans of games such as DishonoredDeathloop and the BioShock series will be in for a real treat playing Atomic Heart.

At high to maximum detail levels, Atomic Heart looks stunning thanks to its sharp textures, great reflections and well-executed effects.

Atomic Heart
Atomic Heart
Atomic Heart
Atomic Heart
Atomic Heart
Atomic Heart

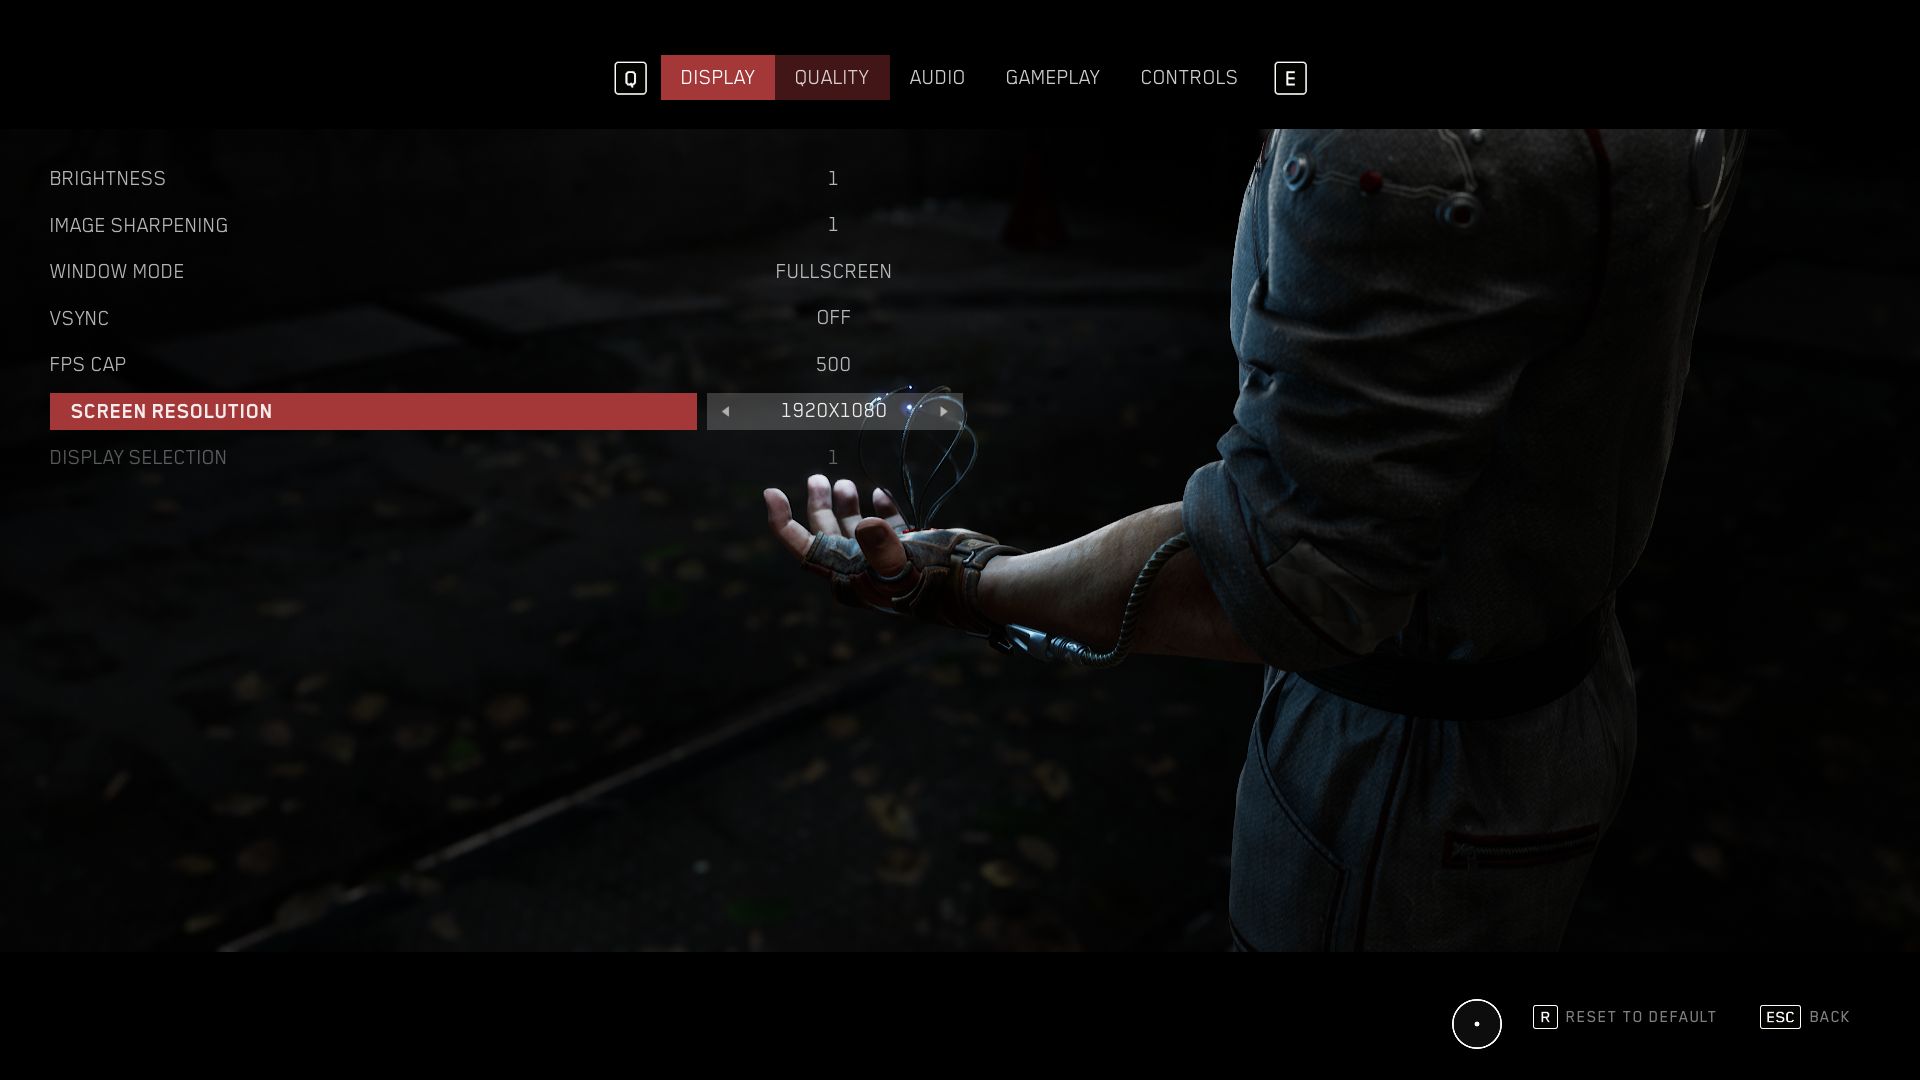
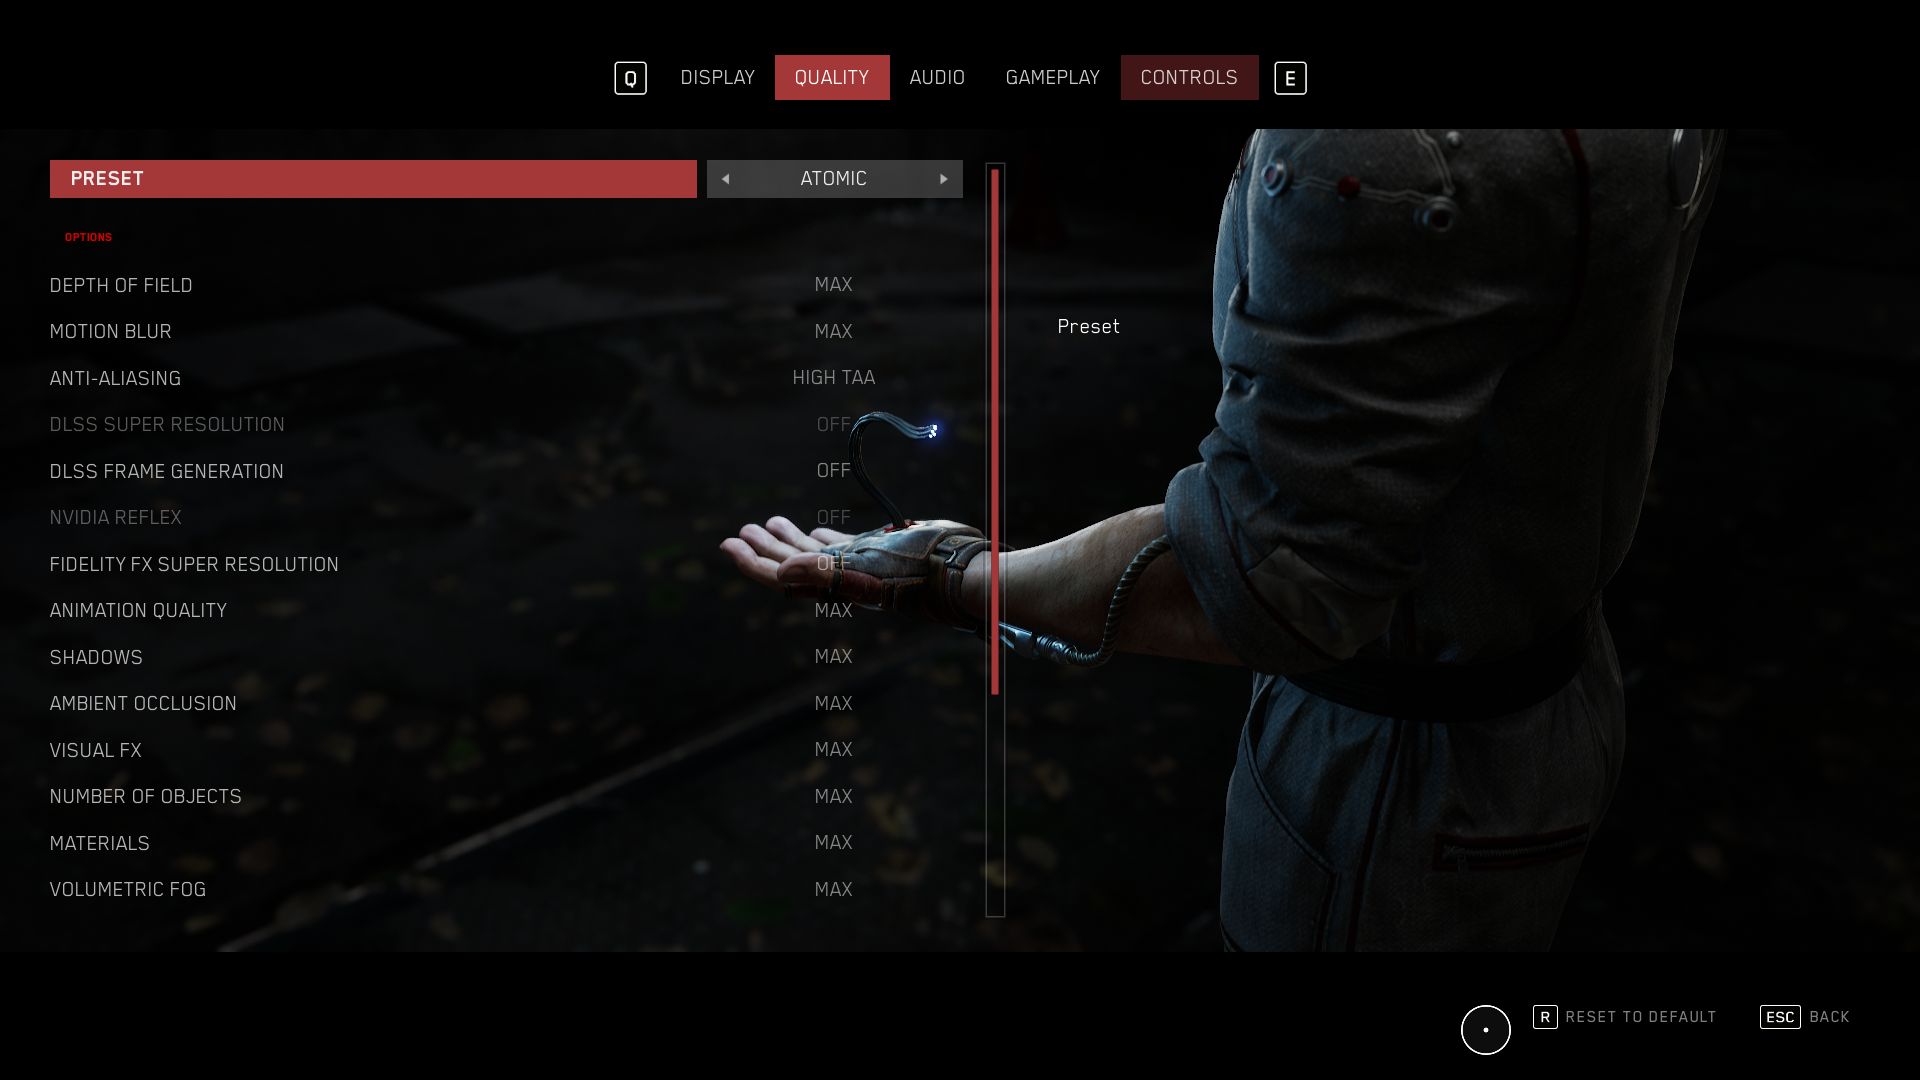
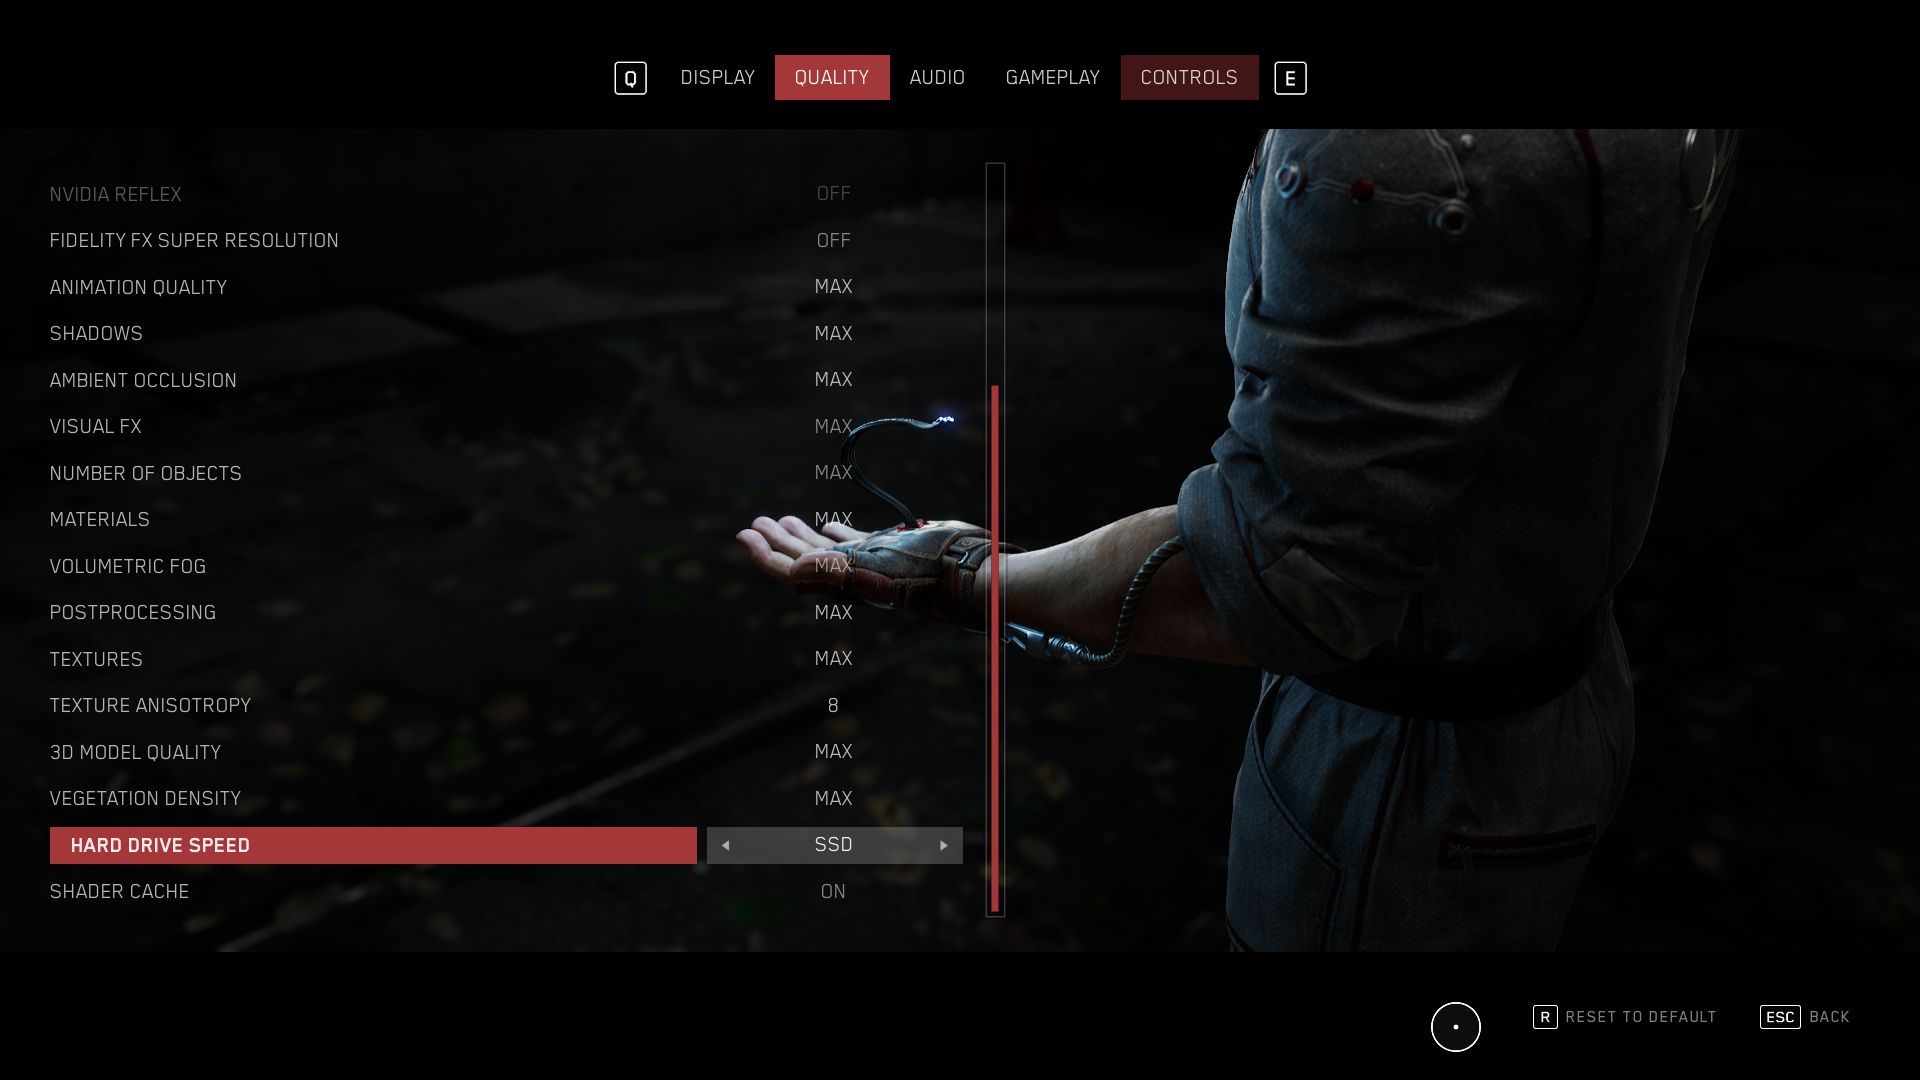
The graphics menu left us with some mixed feelings. While the display menu is a little frugal with only a few options (resolution, FPS limit, VSync etc.), the quality menu really steals the show with not only multiple presets (the maximum level is very fittingly called "Atomic") but also over 20 detail settings, which can be applied without having to restart the game.

With that being said, it can take a moment for Atomic Heart to regain its bearings, as a change in settings usually prompts the game to optimize its shaders - a thing which always happens when booting up the game (also seen with Hogwarts Legacy) and which can take a good few minutes.

Atomic Heart
Atomic Heart
Atomic Heart
Atomic Heart
Atomic Heart
Atomic Heart

Generally, the game supports a variety of modern features, such as DLSS or Fidelity FX. The originally announced ray tracing is still missing, however, this can be forgiven due to the game's already stunning optics (at least we didn't miss ray tracing). But back to the graphics menu: The individual settings are only accompanied with short descriptions. More comprehensive explanations and comparison images, which can be seen in Returnal, are nowhere to be found.

Atomic Heart
Atomic Heart
Atomic Heart
Atomic Heart
Atomic Heart
Atomic Heart

From a technical standpoint, we find Atomic Heart to be surprisingly sophisticated - with the exception of a few graphics problems at lower levels of detail (removed objects have a tendency to judder and passers-by's hair sometimes flutters strangely). In our test, we didn't experience any crashes or slumps in performance. Speaking of performance: Lower frame rates (i.e. when lowering the quality level) don't really seem to affect the game much, which means you don't necessarily need an atomic PC to run Atomic Heart.

Atomic Heart
Atomic Heart
Atomic Heart

Benchmark

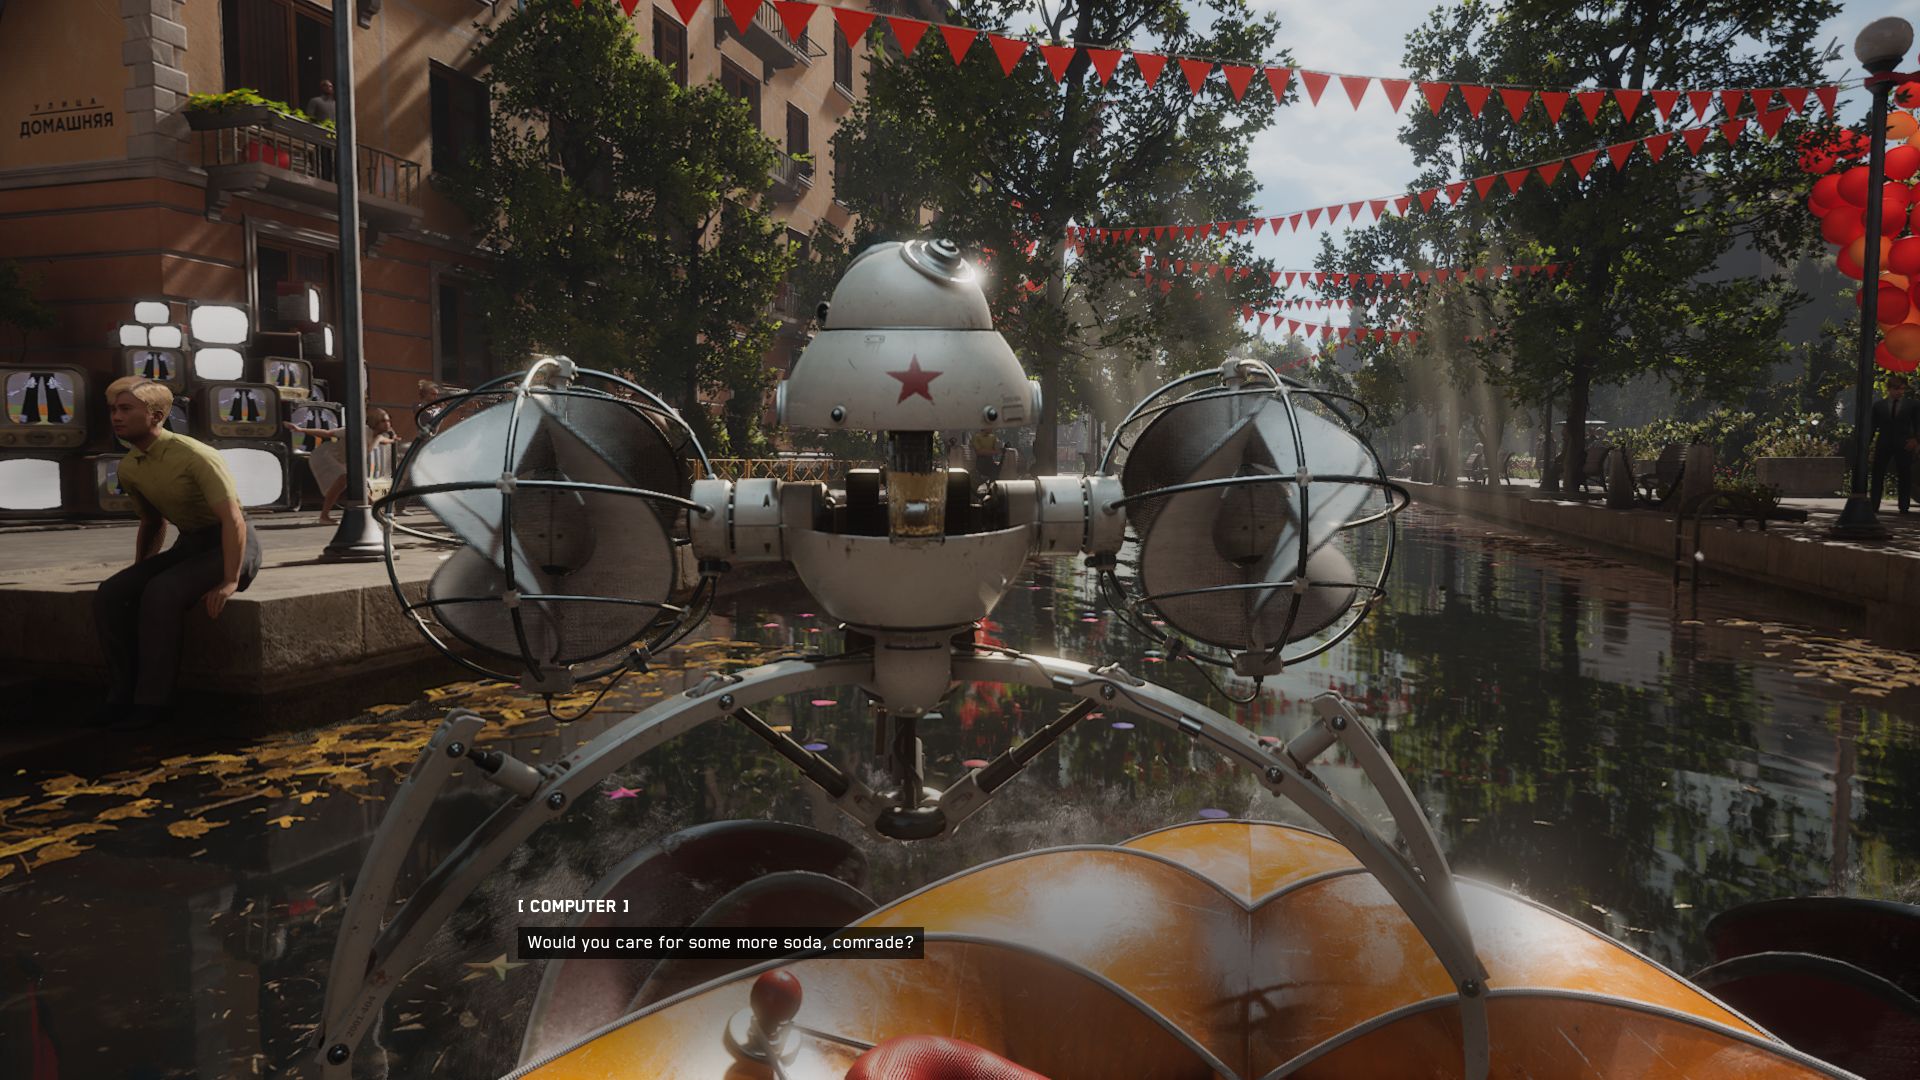
The boat journey at the beginning of the game is perfect for measuring speeds, as it is graphically quite demanding and it always runs the exact same. As you can see in the following video, we measured the frame rate for around 1 minute (using CapFrameX), until a flying robot offered the main character some lemonade.

Since the game is a fast-paced first-person shooter - at least later on - ideally, you would want to see results of over 60 FPS. Our GPU recommendations are kept accordingly.

Results


FHD (1,920 x 1,080)

While iGPUs are generally only able to display moderate resolutions and details smoothly (see Radeon 680M & Iris Xe Graphics G7), a midrange GPU such as the Radeon RX 6600M was fast enough to run Atomic Heart at 1,920 x 1,080 pixels on the preset "High". For maximum details, you would be better off running the game on an upper midrange device - for example, on a GeForce RTX 3060, you can run it in Full HD and using the preset "Atomic".

Atomic Heart
    1920x1080 Low Preset     1920x1080 Medium Preset     1920x1080 High Preset     1920x1080 Atomic Preset
AMD Radeon RX 7900 XTX, i9-12900K
Desktop-PC
338 (164.8min, 228P0.1, 276P1) fps ∼73%
273 (126.7min, 184.2P0.1, 216P1) fps ∼74%
188.2 (96.3min, 124.2P0.1, 160.3P1) fps ∼58%
155.6 (91.2min, 105.9P0.1, 129.3P1) fps ∼51%
AMD Radeon RX 7900 XT, i9-12900K
Desktop-PC
328 (26.2min, 209P0.1, 275P1) fps ∼71%
262 (94.5min, 182.2P0.1, 221P1) fps ∼71%
169.8 (85min, 105.2P0.1, 142.4P1) fps ∼52%
137.9 (48.8min, 87.9P0.1, 108.6P1) fps ∼45%
NVIDIA GeForce RTX 3080, i9-12900K
Desktop-PC
307 (161.6min, 210P0.1, 250P1) fps ∼66%
239 (135.8min, 163.4P0.1, 192.3P1) fps ∼64%
147.4 (92.8min, 115P0.1, 124.8P1) fps ∼45%
121.4 (86.9min, 97.7P0.1, 102.8P1) fps ∼40%
NVIDIA GeForce RTX 3070, i9-12900K
Desktop-PC
263 (95.3min, 185.8P0.1, 211P1) fps ∼57%
195.9 (113.3min, 145.6P0.1, 161.5P1) fps ∼53%
112.9 (69.7min, 92.3P0.1, 97.4P1) fps ∼35%
91.7 (69.3min, 73.4P0.1, 78.7P1) fps ∼30%
NVIDIA GeForce RTX 3080 Ti Laptop GPU, i9-12900HX
MSI Titan GT77 12UHS
221 (33.3min, 143.7P0.1, 171.7P1) fps ∼48%
169.2 (37.4min, 111.2P0.1, 132.8P1) fps ∼46%
99.8 (42.2min, 73P0.1, 84.3P1) fps ∼31%
84.1 (35.7min, 59.7P0.1, 71.8P1) fps ∼27%
AMD Radeon RX 6800M, R9 5900HX
Asus ROG Strix G15
153.8 (79.3min, 111.3P0.1, 125.9P1) fps ∼33%
121.4 (67.8min, 82.5P0.1, 96.1P1) fps ∼33%
84.6 (43.5min, 60.6P0.1, 73.6P1) fps ∼26%
68.6 (30.7min, 54.3P0.1, 60.2P1) fps ∼22%
NVIDIA GeForce RTX 3060 Laptop GPU, i7-12700H
Lenovo Legion 5 Pro
174.2 (67.2min, 111.4P0.1, 141.7P1) fps ∼37%
130.5 (79.6min, 103.2P0.1, 109.6P1) fps ∼35%
75.3 (30.3min, 61.3P0.1, 65.1P1) fps ∼23%
60.2 (27.5min, 49.8P0.1, 51.8P1) fps ∼20%
AMD Radeon RX 6600M, R7 5800H
Lenovo Legion 5
154.5 (24.9min, 109.1P0.1, 132.8P1) fps ∼33%
107.7 (64.9min, 85.1P0.1, 96.4P1) fps ∼29%
64 (37.4min, 48P0.1, 58P1) fps ∼20%
50.8 (32.7min, 44.9P0.1, 45.6P1) fps ∼17%
AMD Radeon 680M, R9 6900HS
Asus ROG Zephyrus G14
47.2 (20.2min, 25.5P0.1, 30.6P1) fps ∼10%
36.8 (20.7min, 21.1P0.1, 25.7P1) fps ∼10%
20.3 (10.7min, 11.8P0.1, 14.1P1) fps ∼6%
16.9 (10.2min, 11.7P0.1, 12.4P1) fps ∼6%
Intel Iris Xe Graphics G7 96EUs, i7-1165G7
Zotac ZBOX CI665 Nano
25.8 (15.8min, 16.5P0.1, 22.5P1) fps ∼6%
17.7 (10.6min, 10.7P0.1, 14.8P1) fps ∼5%
12.2 (6.99min, 8.96P0.1, 10.7P1) fps ∼4%
8.66 (5.55min, 6.16P0.1, 7.81P1) fps ∼3%

QHD (2,560 x 1,440)

To run the game on a QHD or UHD display and with high-quality graphics, you will most likely need a high-end GPU. 2,560 x 1,440 pixels call for a GeForce RTX 3080 Ti or better. 

Atomic Heart
    2560x1440 Atomic Preset
AMD Radeon RX 7900 XTX, i9-12900K
Desktop-PC
129.8 (81.3min, 94.7P0.1, 108.4P1) fps ∼49%
AMD Radeon RX 7900 XT, i9-12900K
Desktop-PC
112.9 (49.1min, 77.1P0.1, 87.3P1) fps ∼42%
NVIDIA GeForce RTX 3080, i9-12900K
Desktop-PC
95.7 (71.3min, 79.2P0.1, 83.3P1) fps ∼36%
NVIDIA GeForce RTX 3070, i9-12900K
Desktop-PC
71.6 (58.8min, 60.3P0.1, 62.5P1) fps ∼27%
NVIDIA GeForce RTX 3080 Ti Laptop GPU, i9-12900HX
MSI Titan GT77 12UHS
67.1 (19.7min, 53P0.1, 57.9P1) fps ∼25%
AMD Radeon RX 6800M, R9 5900HX
Asus ROG Strix G15
55.2 (29.1min, 46.6P0.1, 49P1) fps ∼21%
NVIDIA GeForce RTX 3060 Laptop GPU, i7-12700H
Lenovo Legion 5 Pro
47.7 (33.3min, 39.7P0.1, 41P1) fps ∼18%
AMD Radeon RX 6600M, R7 5800H
Lenovo Legion 5
38.4 (32.2min, 34.6P0.1, 35.2P1) fps ∼14%

UHD (3,840 x 2,160)

In 4K, so at 3,840 x 2,160 pixels, almost all notebook chips reach their limits. Even the previously mentioned RTX 3080 Ti only just manages over 40 FPS when the preset "Atomic" is selected. Desktop devices are much better-suited thanks to their higher TDPs. A GeForce RTX 3080 is able to hit the 60-FPS mark.

Atomic Heart
    3840x2160 Atomic Preset
AMD Radeon RX 7900 XTX, i9-12900K
Desktop-PC
86 (51.1min, 70.4P0.1, 74P1) fps ∼36%
AMD Radeon RX 7900 XT, i9-12900K
Desktop-PC
71.4 (48.4min, 58.9P0.1, 61.2P1) fps ∼30%
NVIDIA GeForce RTX 3080, i9-12900K
Desktop-PC
60 (47.3min, 51.6P0.1, 53.7P1) fps ∼25%
NVIDIA GeForce RTX 3070, i9-12900K
Desktop-PC
43.8 (37.5min, 38.2P0.1, 39.8P1) fps ∼18%
NVIDIA GeForce RTX 3080 Ti Laptop GPU, i9-12900HX
MSI Titan GT77 12UHS
42.6 (35.9min, 36.5P0.1, 37.8P1) fps ∼18%
AMD Radeon RX 6800M, R9 5900HX
Asus ROG Strix G15
34.2 (22min, 28.9P0.1, 30.2P1) fps ∼14%
NVIDIA GeForce RTX 3060 Laptop GPU, i7-12700H
Lenovo Legion 5 Pro
28.9 (23.2min, 23.7P0.1, 24.7P1) fps ∼12%
AMD Radeon RX 6600M, R7 5800H
Lenovo Legion 5
22.7 (20.8min, 20.8P0.1, 21.1P1) fps ∼9%

Note

Because gaming tests are very time-consuming and are often constrained by installation or activation limits, we are only able to provide you with part of the benchmark results at the time of publishing this article. We will be adding more graphics cards over the coming days and weeks. 

Overview

Show Restrictions
PosModel< PrevNext >Atomic Heart
 Atomic Heart (2023)
low
1920x1080
Low Preset
med.
1920x1080
Medium Preset
high
1920x1080
High Preset
ultra
1920x1080
Atomic Preset
QHD
2560x1440
Atomic Preset
4K
3840x2160
Atomic Preset
NVIDIA GeForce RTX 4090
316n5
251n5
234n5
223n5
181.6n5
110.9n5
AMD Radeon RX 7900 XTX
359n2
290n2
199.1n2
162.85n2
134.05n2
87.7n2
NVIDIA GeForce RTX 4080 Super
300n2
279.5n2
216.5n2
177.3n2
138.2n2
82.35n2
NVIDIA GeForce RTX 4080
227
205
179.6
142.7
83.6
AMD Radeon RX 7900 XT
328
262
169.8
137.9
112.9
71.4
NVIDIA GeForce RTX 4070 Ti
316
253
180.1
148
112.3
63.4
AMD Radeon RX 7900 GRE
302.5n2
231.5n2
149.6n2
116.45n2
94.9n2
58.1n2
AMD Radeon RX 6950 XT
347
257
158.9
130.7
104.2
65.3
NVIDIA GeForce RTX 4090 Laptop GPU
211n2
174.45n2
166.6n3
138.5n3
107.8n3
62.7
NVIDIA GeForce RTX 3090
325
262
156.3
129.3
101.7
63.3
AMD Radeon RX 7800 XT
317
236
141.1
109.8
87.9
53.6
NVIDIA GeForce RTX 4080 Laptop GPU
170.8
142.3
121.1
100.3
79.2
NVIDIA GeForce RTX 3080 12 GB
248
145.2
142.6
111.4
69.1
NVIDIA GeForce RTX 3080
307
239
147.4
121.4
95.7
60
NVIDIA GeForce RTX 4070
320
250
148.3
144.8
109.4
62.4
AMD Radeon RX 6800
262
197.7
120
96.3
77.5
47.7
AMD Radeon RX 7700 XT
265
199.4
118.8
93.6
73.9
43.8
NVIDIA Titan RTX
264
197.6
117.7
96.9
74.9
45
NVIDIA GeForce RTX 4060 Ti 16G
259
197.9
117.3
92.3
68
38.3
PosModel< PrevNext >Atomic Heart
low med. high ultra QHD 4K
NVIDIA GeForce RTX 4060 Ti 8G
264n3
202n3
117.3n3
92.5n3
68.8n3
38.4n3
NVIDIA GeForce RTX 3080 Ti Laptop GPU
221
169.2
99.8
84.1
67.1
42.6
NVIDIA GeForce RTX 4070 Laptop GPU
188.2n2
139.95n4
95.05n4
76.1n4
58.6n3
NVIDIA GeForce RTX 3070
263
195.9
112.9
91.7
71.6
43.8
AMD Radeon RX 6750 XT
245
175.9
104.1
82.7
64.8
38
AMD Radeon RX 6700 XT
232
169.4
101.2
79.4
61.9
36.3
NVIDIA GeForce RTX 3080 Laptop GPU
174.7
138.5
84.8
70.15n2
54.3n2
33.25n2
NVIDIA GeForce RTX 3060 Ti
236
179.7
103.1
82.4
63.6
38.4
Intel Arc A770
179.1
131.9
99.3
72.2
58.3
34.1
NVIDIA GeForce RTX 4060
213
159.3
93.5
70.9
53.1
30.1
AMD Radeon RX 7600
213
158.3
92.6
70.7
52
30.5
NVIDIA GeForce RTX 3070 Ti Laptop GPU
157.9
94.5
76.3
60.2
37
NVIDIA GeForce RTX 4060 Laptop GPU
150.6n2
122.1n3
81.6n3
64.9n3
50.7
AMD Radeon RX 6800M
153.8
121.4
84.6
68.6
55.2
34.2
AMD Radeon RX 6650 XT
212
152.9
89.4
69.5
51.4
29.3
NVIDIA GeForce RTX 3070 Laptop GPU
186.7
143.9
88.5
63.7n2
49.1n2
29.85n2
AMD Radeon RX 7600M XT
173.1
130.9
79.9
60.9
46.4
27.6
Intel Arc A750
163.6
122.6
89.3
64.6
51.8
30.5
NVIDIA Titan X Pascal
172.5
126.6
78.4
62.2
48.4
28.6
NVIDIA GeForce RTX 2070 Super (Desktop)
195.4
147.3
85.8
68.3
52
30.4
PosModel< PrevNext >Atomic Heart
low med. high ultra QHD 4K
AMD Radeon RX 5700 XT (Desktop)
174.6
133.2
78
61.7
47.2
27.7
NVIDIA GeForce RTX 3060 Laptop GPU
174.2
130.5
75.3
60.2
47.7
28.9
AMD Radeon RX 7600S
167.1
125.5
71.6
56.6
Intel Arc A580
148.8
110.1
79.2
56.7
45.1
27.1
NVIDIA GeForce RTX 2060 Super (Desktop)
168.3
124.3
72.7
58.1
43.6
25.6
AMD Radeon RX 6600
168.5
120.4
69.5
53.8
39.7
22.8
AMD Radeon RX 5700 (Desktop)
159
120.8
69.8
55.3
41.8
24.7
AMD Radeon RX 6600M
163.5n3
114.4n3
67.1n3
50.8n3
38.4n3
22.7n3
NVIDIA GeForce RTX 3050
127.3
98.6
56.9
44.7
33.9
19.6
AMD Radeon RX 5600 XT (Desktop)
146.5
114.6
66.3
53.4
40.2
23.5
NVIDIA GeForce GTX 1660 Super (Desktop)
124.2
90.7
52
41.5
30.7
17
AMD Radeon RX 6500 XT
110.9
84.2
47.9
37.4
27.2
13.8
AMD Radeon RX 5500 XT (Desktop)
97.5
75.4
43.4
34.7
26.2
15.1
NVIDIA GeForce RTX 4050 Laptop GPU
132.45n2
124n3
72n3
57.1n3
43.4n3
24.6
Intel Arc A730M
69n2
51.9n2
40.35n2
33.4n2
27.8
NVIDIA GeForce GTX 1660 Ti Mobile
109
81.4
49.6
38
NVIDIA GeForce RTX 3050 Ti Laptop GPU
94.3
71.4
41.6
32.3
24.5
NVIDIA GeForce GTX 1660 (Desktop)
111.4
83.4
48.5
38.4
28.1
14.8
NVIDIA GeForce GTX 1650 Super (Desktop)
98.9
73.4
42.4
33.2
24
10.1
NVIDIA GeForce RTX 3050 4GB Laptop GPU
71.4
54.3
31.6
24.5
PosModel< PrevNext >Atomic Heart
low med. high ultra QHD 4K
NVIDIA GeForce GTX 1060 Mobile
72.9
51.3
31.9
25.8
NVIDIA GeForce GTX 1650 Ti Mobile
76.4
56.3
34
25.7
Intel Arc A370M
55.5
42.4
24
20.2
AMD Radeon RX 5500M
75.1
56.7
35.9
28.3
NVIDIA GeForce RTX 2050 Mobile
48.7
29.5
29.1
NVIDIA GeForce GTX 1650 Mobile
68.7
50.5
30.3
23
Intel Arc A380
64.8
48.3
32.3
22.6
Intel Arc A310
54.2
40.3
27.4
18.8
Intel Arc 8-Cores iGPU
53.35n2
39.75n2
27.75n2
20.45n2
Intel Arc 7-Cores iGPU
40.7
31.9
22.8
16.4
AMD Radeon 780M
49.45n2
39.3n2
23.25n2
18.6n2
AMD Radeon 680M
47.2
36.8
20.3
16.9
NVIDIA GeForce GTX 1050 Mobile
45.3
32.9
20.2
15.3
AMD Radeon 760M
38.6
28.8
16.7
AMD Radeon 660M
29
22.9
13
10.2
AMD Radeon RX 560X (Laptop)
40.8
29.8
17.6
13.6
Intel Iris Xe Graphics G7 96EUs
25.8
17.7
12.2
8.66
NVIDIA GeForce MX350
30.9
23.9
6.89
AMD Radeon RX 550 (Laptop)
18.4
10.2
6.87
NVIDIA GeForce MX250
26.6
19.5
7.41
PosModel< PrevNext >Atomic Heart
low med. high ultra QHD 4K
Intel Iris Xe Graphics G7 80EUs
22.6
16.4
11.7
8.42
AMD Radeon 540X
13.3
9.62
Intel UHD Graphics 64EUs (Alder Lake 12th Gen)
24.4
17.5
12.5
Intel Iris Plus Graphics G7 (Ice Lake 64 EU)
15.2
11.6
AMD Radeon RX Vega 10
19.4
15.1
8.82
Intel UHD Graphics Xe 32EUs (Tiger Lake-H)
14.9
Intel UHD Graphics 770
15.2
10.9
AMD Radeon RX Vega 8 (Ryzen 4000/5000)
24.3
18.9
11.2
NVIDIA GeForce MX130
12.1
7.62
AMD Radeon RX Vega 8 (Ryzen 2000/3000)
13.9
10.3
AMD Radeon RX Vega 6 (Ryzen 4000/5000)
19
15
8.79
AMD Radeon RX Vega 6 (Ryzen 2000/3000)
9.63
AMD Radeon RX Vega 5
14.1
11.1
6.7
Intel UHD Graphics G1 (Ice Lake 32 EU)
7.56
Intel UHD Graphics 630
7.98
Intel UHD Graphics Xe 16EUs (Tiger Lake-H)
6.75
Intel UHD Graphics 620
7.74
AMD Radeon R5 M255
8.5
(-) * Smaller values are better. / n123 Number of benchmarks for this median value / * Approximate position


Legend
5Stutters – This game is very likely to stutter and have poor frame rates. Based on all known benchmarks using the specified graphical settings, average frame rates are expected to fall below 25fps
May Stutter – This graphics card has not been explicitly tested on this game. Based on interpolated information from surrounding graphics cards of similar performance levels, stutters and poor frame rates are expected.
30Fluent – Based on all known benchmarks using the specified graphical settings, this game should run at or above 25fps
40Fluent – Based on all known benchmarks using the specified graphical settings, this game should run at or above 35fps
60Fluent – Based on all known benchmarks using the specified graphical settings, this game should run at or above 58fps
May Run Fluently – This graphics card has not been explicitly tested on this game. Based on interpolated information from surrounding graphics cards of similar performance levels, fluent frame rates are expected.
?Uncertain – This graphics card experienced unexpected performance issues during testing for this game. A slower card may be able to achieve better and more consistent frame rates than this particular GPU running the same benchmark scene.
Uncertain – This graphics card has not been explicitly tested on this game and no reliable interpolation can be made based on the performances of surrounding cards of the same class or family.
The value in the fields displays the average frame rate of all values in the database. Move your cursor over the value to see individual results.

Test systems

Device Graphics card Processor RAM Operating system
Notebooks
MSI Titan GT77 12UHS Nvidia GeForce RTX 3080 Ti @175 W TGP (16 GB GDDR6) Intel Core i9-12900 2 x 16 GB DDR5 Windows 11
Lenovo Legion 5 Pro Nvidia GeForce RTX 3060 @140 W TGP (6 GB GDDR6) Intel Core i7-12700H 2 x 8 GB DDR5 Windows 11
Asus ROG Strix G15 AMD Radeon RX 6800M (12 GB GDDR6) AMD Ryzen 9 5900HX 2 x 8 GB DDR4 Windows 11
Lenovo Legion 5 AMD Radeon RX 6600M (8 GB GDDR6) AMD Ryzen 7 5800H 2 x 8 GB DDR4 Windows 11
Asus ROG Zephyrus G14 AMD Radeon 680M AMD Ryzen 9 6900HS 2 x 16 GB DDR5 Windows 11
Tower-PCs
Custom I AMD Radeon RX 7900 XTX (24 GB GDDR6)
AMD Radeon RX 7900 XT (20 GB GDDR6)
MSI GeForce RTX 3080 (10 GB GDDR6X)
MSI GeForce RTX 3070 (8 GB GDDR6)
Intel Core i9-12900K 2 x 16 GB DDR4 Windows 11
Custom II Palit GeForce RTX 4090 GameRock OC (24 GB GDDR6X)
Nvidia GeForce RTX 3090 FE (24 GB GDDR6X)
Nvidia GeForce RTX 3060 Ti (8 GB GDDR6X)
Nvidia Titan RTX (24 GB GDDR6)
lNvidia GeForce RTX 2070 Super (8 GB GDDR6)
Nvidia GeForce RTX 2060 Super (8 GB GDDR6)
KFA2 GeForce GTX 1660 Super (6 GB GDDR6)
PNY GeForce GTX 1660 (6 GB GDDR5)
KFA2 GeForce GTX 1650 Super (4 GB GDDR6)
AMD Radeon RX 6950 XT (16 GB DDR6)
AMD Radeon RX 6800 (16 GB DDR6)
AMD Radeon RX 6700 XT (12 GB DDR6)
AMD Radeon RX 6650 XT (8 GB GDDR6)
AMD Radeon RX 6600 (8 GB GDDR6)
AMD Radeon RX 5700 XT (8 GB GDDR6)
AMD Radeon RX 5700 (8 GB GDDR6)
AMD Radeon RX 5600 XT (6 GB GDDR6)
AMD Radeon RX 5500 XT (8 GB GDDR6)
AMD Ryzen 9 7950X 2 x 16 GB DDR5 Windows 11
Custom III Nvidia GeForce RTX 2080 Super FE Intel Core i9-11900K 2 x 8 GB DDR4 Windows 11
Mini-PCs
Zotac ZBOX CI665 Nano Intel Iris Xe Graphics G7 (96 CUs) Intel Core i7-1165G7 2 x 8 GB DDR4 Windows 11
Morefine S500+ AMD Radeon RX Vega 8 AMD Ryzen 9 5900HX 2 x 16 GB DDR4 Windows 11
Minisforum NUCXi7 Nvidia GeForce RTX 3070 @125 W TGP (8 GB GDDR6) Intel Core i7-11800H 2 x 8 GB DDR4 Windows 11
Minisforum HX99G AMD Radeon RX 6600M @100 W TGP (8 GB GDDR6) AMD Ryzen 9 6900HX 2 x 16 GB DDR5 Windows 11
4K monitors Nvidia driver AMD driver
Philips Brilliance 329P9H, Gigabyte M32U ForceWare 531.18 Adrenalin 23.3.1
Please share our article, every link counts!
> Expert Reviews and News on Laptops, Smartphones and Tech Innovations > Reviews > Atomic Heart review: Notebook and desktop benchmarks
Florian Glaser, 2023-03-13 (Update: 2023-03-13)