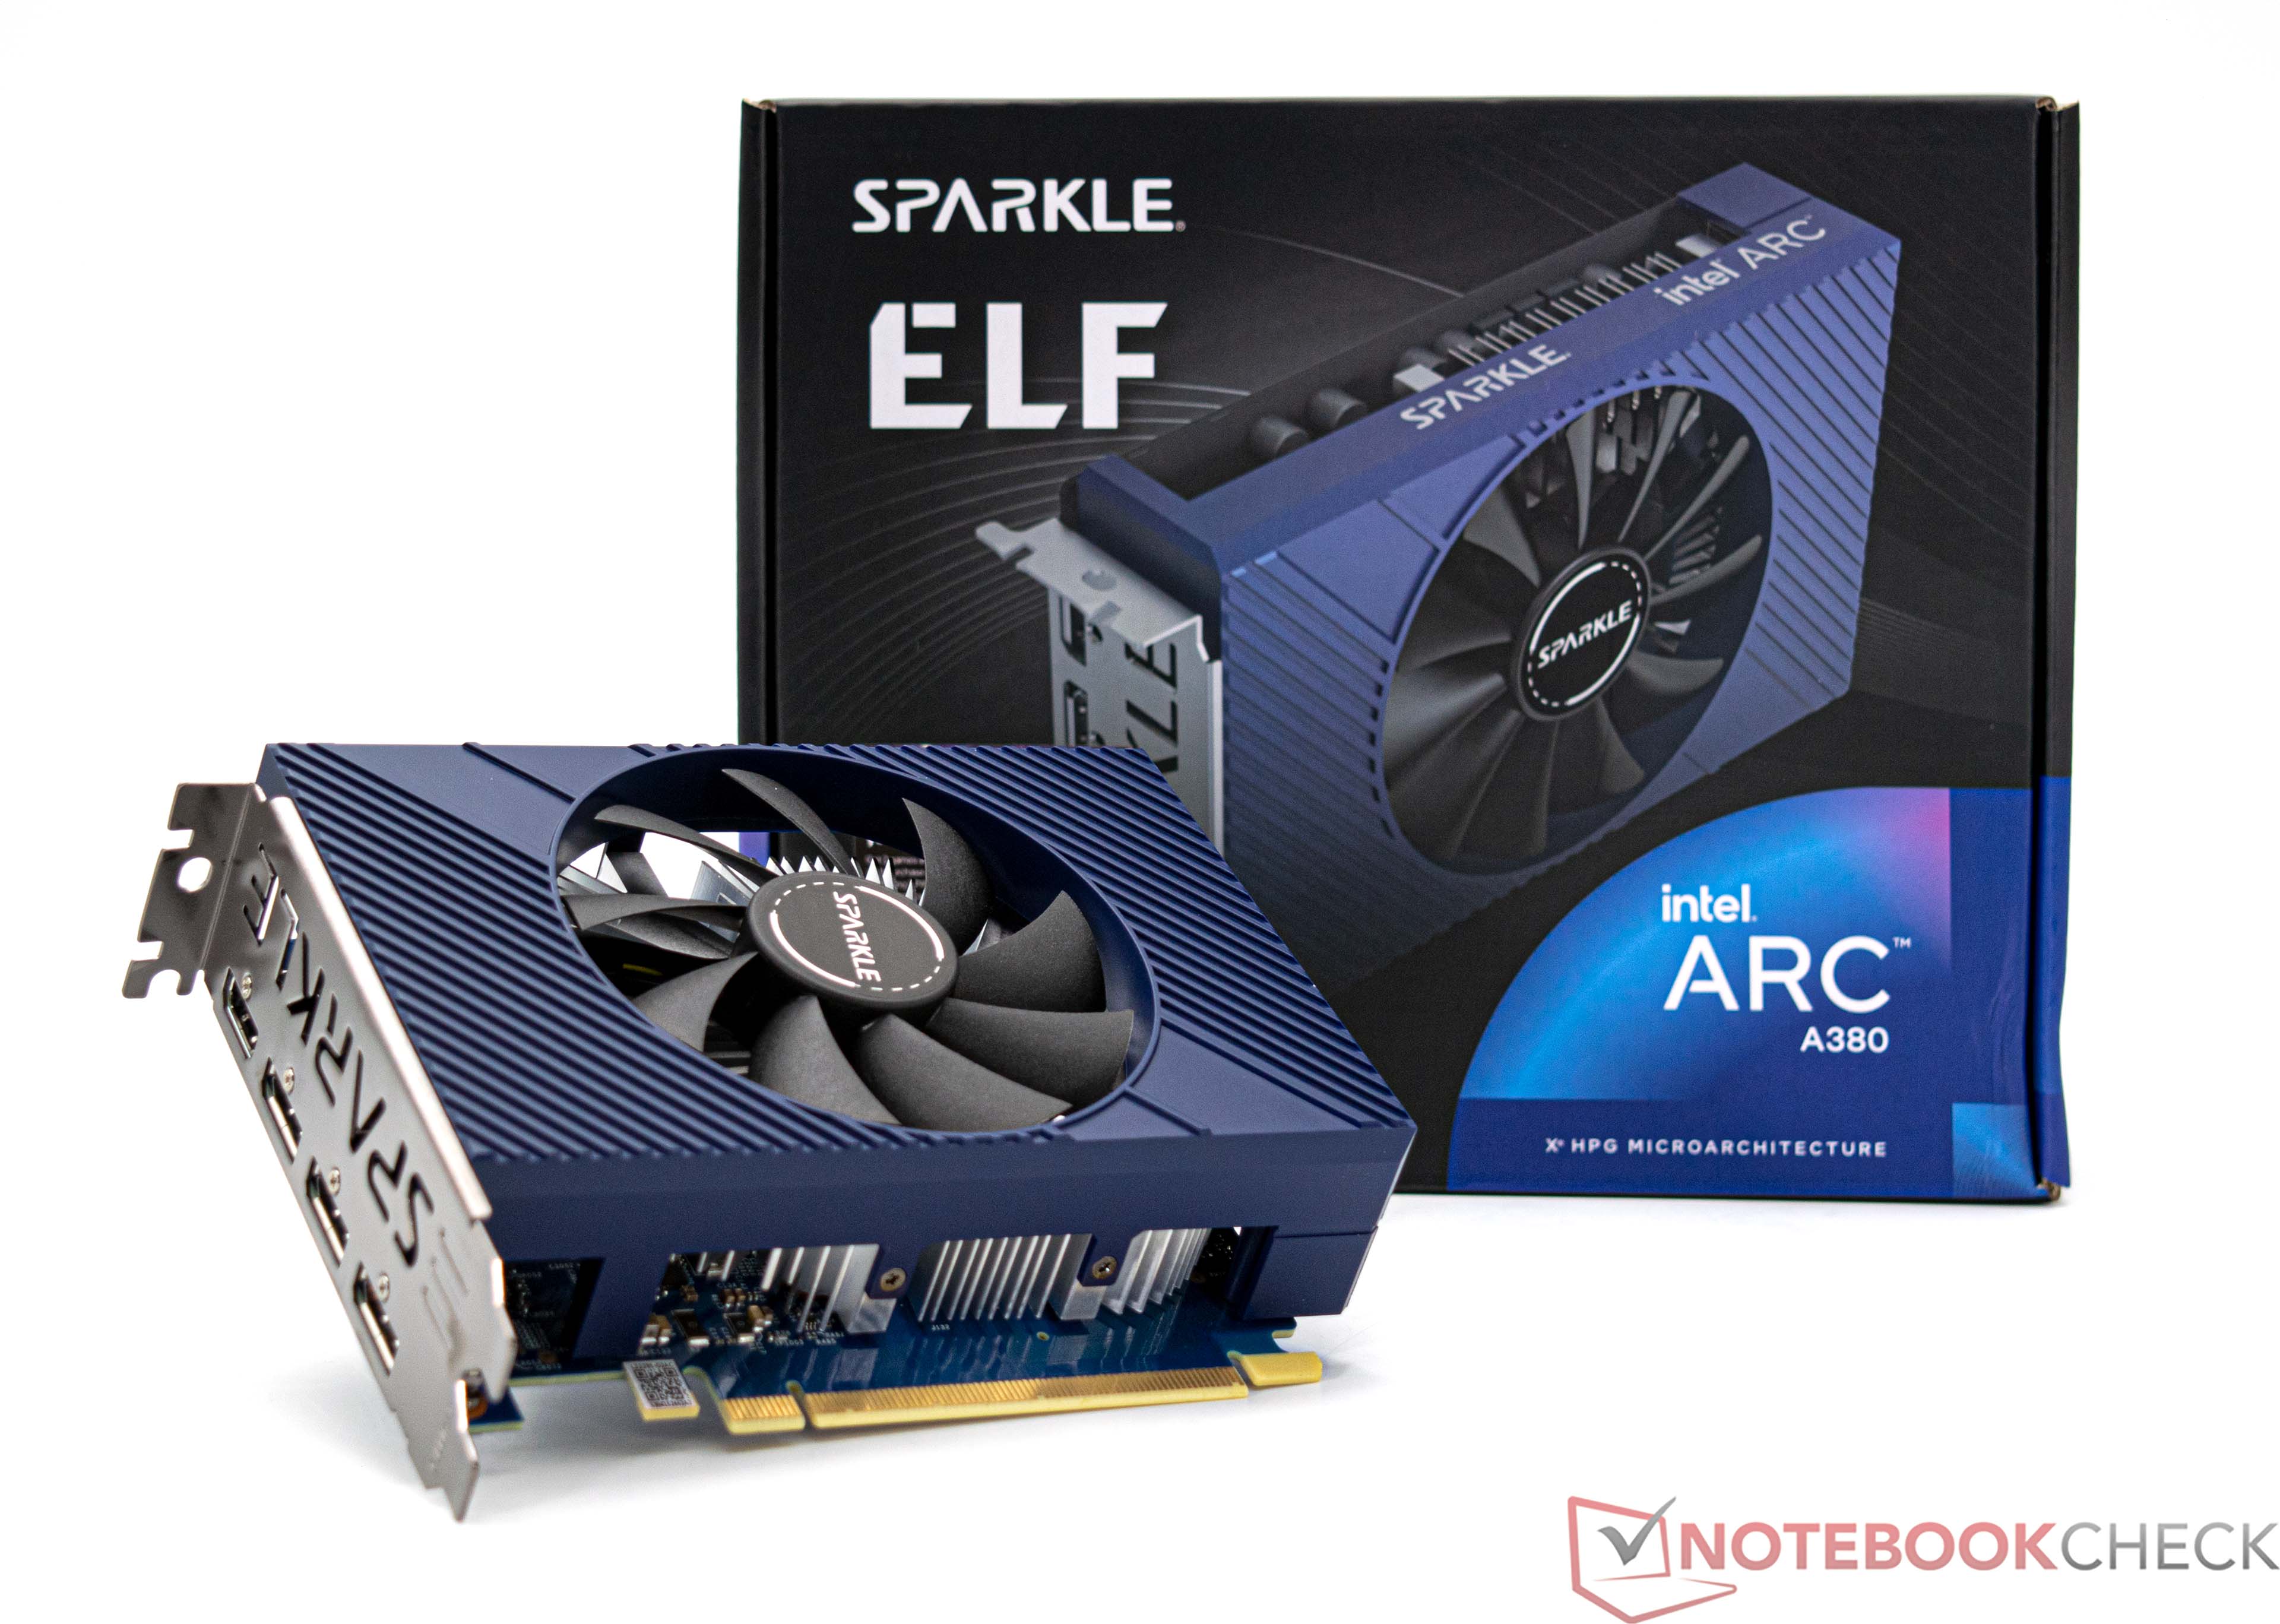
Notebookcheck Logo

Intel Arc A380

Intel Arc A380

The Intel Arc A380 is a low-cost single-seed desktop GPU and is manufactured at TSMC using the 6 nm process. The graphics processor has the internal designation DG2-128 and combines 1,024 shader units. In terms of VRAM, you still get 6 GB GDDR6, which are connected via a 96-bit interface (15.5 Gbps, 186 GB/s). This makes the Intel Arc A380 the fourth fastest graphics card model from Intel.

Features

As the Intel Arc A380 is also based on the Alchemist architecture, the small model also has the same features as the faster models of the current Arc models. Nevertheless, there are significant performance limitations compared to the faster models. The most useful feature is certainly AV1 support, which enables encoding and decoding on the hardware side.

Performance

The performance of the Intel Arc A380 cannot keep up with current graphics cards from AMD and Nvidia. In view of this, this graphics card is not recommended exclusively for gaming use.

Power consumption

The power consumption of the Intel Arc A380 is estimated by the manufacturer at 75 watts (TGP). In terms of efficiency, the Intel Arc A380 is not convincing due to its low 3D performance. In the internal duel, the Intel Arc A380 is slightly more efficient than an Intel Arc A580 or an Intel Arc A750.

Arc Series

Arc B580 compare 2560 @ 2.67 - 2.67 GHz192 Bit @ 19000 MHz
Arc A770 compare 4096 @ 2.1 - 2.4 GHz256 Bit @ 16000 MHz
Arc A750 compare 3584 @ 2.05 - 2.4 GHz256 Bit @ 16000 MHz
Arc A580 compare 3072 @ 1.7 - 2 GHz256 Bit @ 16000 MHz
A770M compare 4096 @ 1.65 GHz256 Bit @ 16000 MHz
A730M compare 3072 @ 1.1 GHz192 Bit @ 14000 MHz
A570M compare 16 @ 0.9 - 1.3 GHz128 Bit @ 14000 MHz
A550M compare 16 @ 0.9 - 2.01 GHz128 Bit @ 14000 MHz
A530M compare 12 @ 0.9 - 1.3 GHz128 Bit @ 14000 MHz
A370M compare 8 @ 1.55 GHz64 Bit @ 14000 MHz
Arc A380 1024 @ 2 GHz96 Bit @ 15500 MHz
A310 compare 6 @ 2 GHz64 Bit @ 15500 MHz
A350M compare 6 @ 1.15 GHz64 Bit @ 14000 MHz
CodenameDG2-128
ArchitectureXe HPG
Pipelines1024 - unified
TMUs64
ROPs32
Tensor / AI Cores128
Core Speed2000 MHz
Shader Speed2050 MHz
Theoretical Performance8397 TFLOPS FP16, 4194 TFLOPS FP32
CacheL2: 4 MB
Memory Speed15500 effective = 1937 MHz
Memory Bus Width96 Bit
Memory TypeGDDR6
Max. Amount of Memory6 GB
Shared Memoryno
Memory Bandwidth186 GB/s
APIDirectX 12_2, Shader 6.6, OpenGL 4.6, OpenCL 3.0, Vulkan 1.3
Power Consumption75 Watt
Transistor Count7.2 Billion
Die Size 157 mm²
technology6 nm
PCIe4 8x
Displays4 Displays (max.), HDMI 2.1, DisplayPort 2.0
Date of Announcement14.07.2022

Benchmarks

Performance Rating - 3DMark 11 + Fire Strike + Time Spy
3.8 pt (11%)
Restrict / Search: Model: Max. age: years
3DMark - 3DMark Time Spy Score
4457 Points (12%)
3DMark - 3DMark Time Spy Graphics
3915 Points (8%)
Restrict / Search: Model: Max. age: years
3DMark - 3DMark Ice Storm Unlimited Graphics
466666 Points (47%)
3DMark - 3DMark Ice Storm Extreme Graphics
208153 Points (24%)
3DMark - 3DMark Cloud Gate Score
48677 Points (46%)
3DMark - 3DMark Cloud Gate Graphics
60804 Points (15%)
3DMark - 3DMark Fire Strike Standard Score
9728 Points (15%)
3DMark - 3DMark Fire Strike Standard Graphics
10174 Points (9%)
3DMark - 3DMark Ice Storm Graphics
268298 Points (30%)
3DMark - 3DMark Night Raid
40980 Points (39%)
3DMark - 3DMark Night Raid Graphics Score
46613 Points (18%)
3DMark 11 - 3DM11 Performance Score
15095 Points (18%)
3DMark 11 - 3DM11 Performance GPU
13892 Points (11%)
Restrict / Search: Model: Max. age: years
3DMark Vantage
3DM Vant. Perf. total +
3DMark Vantage - 3DM Vant. Perf. total
53979 Points (16%)
3DM Vant. Perf. GPU no PhysX +
3DMark Vantage - 3DM Vant. Perf. GPU no PhysX
45909 Points (25%)
Restrict / Search: Model: Max. age: years
3DMark 05 - 3DMark 05 - Standard
69490 Points (76%)
Restrict / Search: Model: Max. age: years
3DMark 06 3DMark 06 - Standard 1280x1024 +
3DMark 06
58638 Points (77%)
Unigine Valley 1.0 - Unigine Valley 1.0 DX
26.2 fps (8%)
SPECviewperf 12
specvp12 sw-03 +
SPECviewperf 12 - specvp12 sw-03
68.7 fps (17%)
specvp12 snx-02 +
SPECviewperf 12 - specvp12 snx-02
1.6 fps (0%)
specvp12 showcase-01 +
SPECviewperf 12 - specvp12 showcase-01
43.4 fps (8%)
specvp12 mediacal-01 +
SPECviewperf 12 - specvp12 mediacal-01
23.2 fps (6%)
specvp12 maya-04 +
SPECviewperf 12 - specvp12 maya-04
90.3 fps (25%)
specvp12 energy-01 +
SPECviewperf 12 - specvp12 energy-01
1.1 fps (1%)
specvp12 creo-01 +
SPECviewperf 12 - specvp12 creo-01
39.7 fps (16%)
specvp12 catia-04 +
SPECviewperf 12 - specvp12 catia-04
84.2 fps (14%)
specvp12 3dsmax-05 +
SPECviewperf 12 - specvp12 3dsmax-05
81.4 fps (12%)
SPECviewperf 13 specvp13 sw-04 +
SPECviewperf 13 - specvp13 sw-04
77.7 fps (21%)
specvp13 snx-03 +
SPECviewperf 13 - specvp13 snx-03
2.8 fps (0%)
specvp13 showcase-02 +
SPECviewperf 13 - specvp13 showcase-02
43.3 fps (7%)
specvp13 medical-02 +
SPECviewperf 13 - specvp13 medical-02
30.9 fps (5%)
specvp13 maya-05 +
SPECviewperf 13 - specvp13 maya-05
125 fps (14%)
specvp13 energy-02 +
SPECviewperf 13 - specvp13 energy-02
6.4 fps (2%)
specvp13 creo-02 +
SPECviewperf 13 - specvp13 creo-02
73.1 fps (11%)
specvp13 catia-05 +
SPECviewperf 13 - specvp13 catia-05
122 fps (14%)
specvp13 3dsmax-06 +
SPECviewperf 13 - specvp13 3dsmax-06
81 fps (13%)
SPECviewperf 2020 specvp2020 solidworks-05 4k +
SPECviewperf 2020 - specvp2020 solidworks-05 4k
20.4 fps (5%)
specvp2020 snx-04 4k +
SPECviewperf 2020 - specvp2020 snx-04 4k
2.8 fps (0%)
specvp2020 medical-03 4k +
SPECviewperf 2020 - specvp2020 medical-03 4k
5 fps (3%)
specvp2020 maya-06 4k +
SPECviewperf 2020 - specvp2020 maya-06 4k
65.3 fps (9%)
specvp2020 energy-03 4k +
SPECviewperf 2020 - specvp2020 energy-03 4k
5 fps (1%)
specvp2020 creo-03 4k +
SPECviewperf 2020 - specvp2020 creo-03 4k
34.1 fps (15%)
specvp2020 catia-06 4k +
SPECviewperf 2020 - specvp2020 catia-06 4k
18.3 fps (12%)
specvp2020 3dsmax-07 4k +
SPECviewperf 2020 - specvp2020 3dsmax-07 4k
17.6 fps (6%)
Geekbench 6.4 - Geekbench 6.4 GPU OpenCL
37044 points (10%)
Geekbench 6.4 - Geekbench 6.4 GPU Vulkan
38240 points (10%)
LuxMark v2.0 64Bit - LuxMark v2.0 Room GPU
1054 Samples/s (4%)
LuxMark v2.0 64Bit - LuxMark v2.0 Sala GPU
3461 Samples/s (6%)
ComputeMark v2.1 - ComputeMark v2.1 Result
6759 points (6%)
Power Consumption - Furmark Stress Test Power Consumption - external Monitor *
145.4 Watt (20%)
0102030405060708090100110120130140150160170Tooltip
Power Consumption - The Witcher 3 Power Consumption - external Monitor *
143.3 Watt (20%)
0102030405060708090100110120130140150Tooltip
Power Consumption - Power Efficiency - Witcher 3 ultra external Monitor
0.2 fps per Watt (19%)
Power Consumption - Cyberpunk 2077 Power Consumption - external Monitor *
238 Watt (30%)
0153045607590105120135150165180195210225240255Tooltip
Emissions Witcher 3 Fan Noise +
Emissions - Witcher 3 Fan Noise
38.3 dB(A) (55%)
- Range of benchmark values
red legend - Average benchmark values
* Smaller numbers mean a higher performance

Game Benchmarks

The following benchmarks stem from our benchmarks of review laptops. The performance depends on the used graphics memory, clock rate, processor, system settings, drivers, and operating systems. So the results don't have to be representative for all laptops with this GPU. For detailed information on the benchmark results, click on the fps number.

F1 24

F1 24

2024
low 1920x1080
108.8  fps    + Compare
med. 1920x1080
91  fps    + Compare
high 1920x1080
63.5  fps    + Compare
ultra 1920x1080
16.3  fps    + Compare
» With all tested laptops playable in detail settings high.
low 1920x1080
19.1  fps    + Compare + 📈 Graph
med. 1920x1080
12.5  fps    + Compare + 📈 Graph
high 1920x1080
9.2  fps    + Compare + 📈 Graph
» The benchmarks indicate that the game is not playable in the tested settings.
low 1920x1080
40  fps    + Compare + 📈 Graph
med. 1920x1080
32.6  fps    + Compare + 📈 Graph
high 1920x1080
28  fps    + Compare + 📈 Graph
ultra 1920x1080
20  fps    + Compare + 📈 Graph
» With all tested laptops playable in detail settings low.
low 1920x1080
34.5  fps    + Compare + 📈 Graph
med. 1920x1080
31.2  fps    + Compare + 📈 Graph
high 1920x1080
20.2  fps    + Compare + 📈 Graph
ultra 1920x1080
14.9  fps    + Compare + 📈 Graph
» The benchmarks indicate that the game is not playable in the tested settings.
Additional Benchmarks
Very Low Preset 1280x720
52
low 1920x1080
84.6  fps    + Compare + 📈 Graph
med. 1920x1080
71.6  fps    + Compare + 📈 Graph
high 1920x1080
59  fps    + Compare + 📈 Graph
ultra 1920x1080
29.5  fps    + Compare + 📈 Graph
» With all tested laptops playable in detail settings high.
Additional Benchmarks
Low Preset 1280x720
144.2
low 1920x1080
22  fps    + Compare + 📈 Graph
high 1920x1080
18.9  fps    + Compare + 📈 Graph
» The benchmarks indicate that the game is not playable in the tested settings.
Additional Benchmarks
Low Preset 1280x720
28.7
low 1920x1080
78.2  fps    + Compare + 📈 Graph
med. 1920x1080
70.3  fps    + Compare + 📈 Graph
high 1920x1080
57.1  fps    + Compare + 📈 Graph
ultra 1920x1080
42.7  fps    + Compare + 📈 Graph
» With all tested laptops playable in detail settings ultra.
Additional Benchmarks
Very Low Preset 1280x720
177.1
low 1920x1080
41  fps    + Compare
med. 1920x1080
36  fps    + Compare
high 1920x1080
30  fps    + Compare
ultra 1920x1080
23  fps    + Compare
» With all tested laptops playable in detail settings med..
low 1920x1080
46.6  fps    + Compare + 📈 Graph
med. 1920x1080
36.5  fps    + Compare + 📈 Graph
high 1920x1080
32.4  fps    + Compare + 📈 Graph
ultra 1920x1080
33.1  fps    + Compare + 📈 Graph
» With all tested laptops playable in detail settings med..
Additional Benchmarks
Low Preset 1280x720
69.9
low 1920x1080
28.5  fps    + Compare + 📈 Graph
med. 1920x1080
25.5  fps    + Compare + 📈 Graph
high 1920x1080
20.9  fps    + Compare + 📈 Graph
ultra 1920x1080
17.1  fps    + Compare + 📈 Graph
» The benchmarks indicate that the game is not playable in the tested settings.
Additional Benchmarks
Max. Performance 1280x720
53.3
Palworld

Palworld

2024
low 1920x1080
46.3  fps    + Compare + 📈 Graph
med. 1920x1080
37.4  fps    + Compare + 📈 Graph
high 1920x1080
27.4  fps    + Compare + 📈 Graph
ultra 1920x1080
24.4  fps    + Compare + 📈 Graph
» With all tested laptops playable in detail settings med..
Additional Benchmarks
Very Low Preset 1280x720
99.7
med. 1920x1080
308  fps    + Compare + 📈 Graph
high 1920x1080
200  fps    + Compare + 📈 Graph
ultra 1920x1080
185.5  fps    + Compare + 📈 Graph
» With all tested laptops playable in detail settings ultra.
low 1920x1080
85.7  fps    + Compare + 📈 Graph
med. 1920x1080
70.3  fps    + Compare + 📈 Graph
high 1920x1080
68  fps    + Compare + 📈 Graph
ultra 1920x1080
43.8  fps    + Compare + 📈 Graph
» With all tested laptops playable in detail settings ultra.
low 1920x1080
86  fps    + Compare + 📈 Graph
med. 1920x1080
62.4  fps    + Compare + 📈 Graph
high 1920x1080
53.8  fps    + Compare + 📈 Graph
ultra 1920x1080
40.5  fps    + Compare + 📈 Graph
» With all tested laptops playable in detail settings ultra.
Additional Benchmarks
Low Preset 1280x720
150.3
low 1920x1080
23  fps    + Compare
med. 1920x1080
20  fps    + Compare
high 1920x1080
17  fps    + Compare
ultra 1920x1080
12  fps    + Compare
» The benchmarks indicate that the game is not playable in the tested settings.
Additional Benchmarks
Low Preset TAA 1280x720
37
low 1920x1080
41.2  fps    + Compare + 📈 Graph
med. 1920x1080
30.2  fps    + Compare + 📈 Graph
high 1920x1080
27.5  fps    + Compare + 📈 Graph
ultra 1920x1080
25.2  fps    + Compare + 📈 Graph
» With all tested laptops playable in detail settings low.
Additional Benchmarks
Ultra Low Preset LowAA 1280x720
96.4
low 1920x1080
24.9  fps    + Compare + 📈 Graph
med. 1920x1080
25.1  fps    + Compare + 📈 Graph
high 1920x1080
21.5  fps    + Compare + 📈 Graph
ultra 1920x1080
17.5  fps    + Compare + 📈 Graph
» The benchmarks indicate that the game is not playable in the tested settings.
Additional Benchmarks
Low Preset 1280x720
32.7
low 1920x1080
137  fps    + Compare
med. 1920x1080
87  fps    + Compare
high 1920x1080
49  fps    + Compare
ultra 1920x1080
39  fps    + Compare
» With all tested laptops playable in detail settings ultra.
Additional Benchmarks
Low Preset 1280x720
252
low 1920x1080
47  fps    + Compare
med. 1920x1080
41  fps    + Compare
high 1920x1080
38  fps    + Compare
ultra 1920x1080
27  fps    + Compare
» With all tested laptops playable in detail settings high.
Additional Benchmarks
Low Preset (Adaptive Quality Off) 1280x720
70
low 1920x1080
182.5  fps    + Compare + 📈 Graph
med. 1920x1080
122.3  fps    + Compare + 📈 Graph
high 1920x1080
68  fps    + Compare + 📈 Graph
ultra 1920x1080
46.2  fps    + Compare + 📈 Graph
» With all tested laptops playable in detail settings ultra.
Additional Benchmarks
Low Preset 1280x720
251
low 1920x1080
47.1  fps    + Compare
med. 1920x1080
36.9  fps    + Compare
high 1920x1080
31  fps    + Compare
ultra 1920x1080
27.3  fps    + Compare
» With all tested laptops playable in detail settings med..
Additional Benchmarks
Low Preset (FSR off) 1280x720
78
30min Start Ultra Preset (FSR off) 1920x1080
26.3
low 1920x1080
46.4  fps    + Compare + 📈 Graph
med. 1920x1080
35.2  fps    + Compare + 📈 Graph
high 1920x1080
30  fps    + Compare + 📈 Graph
ultra 1920x1080
29.2  fps    + Compare + 📈 Graph
» With all tested laptops playable in detail settings med..
Additional Benchmarks
Low Preset SMAA 1280x720
73.2
Lies of P

Lies of P

2023
low 1920x1080
58.4  fps    + Compare + 📈 Graph
med. 1920x1080
50.5  fps    + Compare + 📈 Graph
high 1920x1080
43.7  fps    + Compare + 📈 Graph
ultra 1920x1080
39.3  fps    + Compare + 📈 Graph
» With all tested laptops playable in detail settings ultra.
Additional Benchmarks
Low Preset 1280x720
94.5
Starfield

Starfield

2023
low 1920x1080
24.2  fps    + Compare + 📈 Graph
med. 1920x1080
17.1  fps    + Compare + 📈 Graph
high 1920x1080
11.5  fps    + Compare + 📈 Graph
ultra 1920x1080
9.8  fps    + Compare + 📈 Graph
» The benchmarks indicate that the game is not playable in the tested settings.
Additional Benchmarks
Low Preset 1280x720
37
low 1920x1080
69.9  fps    + Compare + 📈 Graph
med. 1920x1080
55.1  fps    + Compare + 📈 Graph
high 1920x1080
47.4  fps    + Compare + 📈 Graph
ultra 1920x1080
37.2  fps    + Compare + 📈 Graph
» With all tested laptops playable in detail settings ultra.
Additional Benchmarks
Low Preset 1280x720
103.4
low 1920x1080
23  fps    + Compare + 📈 Graph
high 1920x1080
19.2  fps    + Compare + 📈 Graph
ultra 1920x1080
18.4  fps    + Compare + 📈 Graph
» The benchmarks indicate that the game is not playable in the tested settings.
Additional Benchmarks
Low 1280x720
38.5
low 1920x1080
47  fps    + Compare + 📈 Graph
med. 1920x1080
45.7  fps    + Compare + 📈 Graph
high 1920x1080
41.4  fps    + Compare + 📈 Graph
ultra 1920x1080
15.1  fps    + Compare + 📈 Graph
» With all tested laptops playable in detail settings high.
Additional Benchmarks
Low Preset 1280x720
80.2
low 1920x1080
41.8  fps    + Compare + 📈 Graph
med. 1920x1080
30.9  fps    + Compare + 📈 Graph
high 1920x1080
24.6  fps    + Compare + 📈 Graph
ultra 1920x1080
21.1  fps    + Compare + 📈 Graph
» With all tested laptops playable in detail settings low.
Additional Benchmarks
Very Low Preset 1280x720
55
F1 23

F1 23

2023
low 1920x1080
110  fps    + Compare
med. 1920x1080
90.4  fps    + Compare
high 1920x1080
57.1  fps    + Compare
ultra 1920x1080
15.7  fps    + Compare
» With all tested laptops playable in detail settings high.
Additional Benchmarks
Ultra Low Preset TAA 1280x720
198.2
Diablo 4

Diablo 4

2023
low 1920x1080
84.9  fps    + Compare + 📈 Graph
med. 1920x1080
74.1  fps    + Compare + 📈 Graph
high 1920x1080
63.8  fps    + Compare + 📈 Graph
ultra 1920x1080
55  fps    + Compare + 📈 Graph
» With all tested laptops playable in detail settings ultra.
Additional Benchmarks
Low Preset 1280x720
147.6
low 1920x1080
26.1  fps    + Compare + 📈 Graph
med. 1920x1080
22.8  fps    + Compare + 📈 Graph
high 1920x1080
21.6  fps    + Compare + 📈 Graph
ultra 1920x1080
20.4  fps    + Compare + 📈 Graph
» The benchmarks indicate that the game is not playable in the tested settings.
Additional Benchmarks
Low Preset 1280x720
47.1
low 1920x1080
88.3  fps    + Compare + 📈 Graph
med. 1920x1080
74  fps    + Compare + 📈 Graph
high 1920x1080
53.1  fps    + Compare + 📈 Graph
ultra 1920x1080
39.4  fps    + Compare + 📈 Graph
» With all tested laptops playable in detail settings ultra.
Additional Benchmarks
Low Preset Low TAA 1280x720
135.6
low 1920x1080
30.6  fps    + Compare + 📈 Graph
med. 1920x1080
24.4  fps    + Compare + 📈 Graph
high 1920x1080
21.5  fps    + Compare + 📈 Graph
ultra 1920x1080
17.7  fps    + Compare + 📈 Graph
» The benchmarks indicate that the game is not playable in the tested settings.
Additional Benchmarks
Low Preset 1280x720
48.1
low 1920x1080
53  fps    + Compare + 📈 Graph
med. 1920x1080
36.8  fps    + Compare + 📈 Graph
high 1920x1080
33.2  fps    + Compare + 📈 Graph
ultra 1920x1080
21.1  fps    + Compare + 📈 Graph
» With all tested laptops playable in detail settings med..
Additional Benchmarks
Prioritize Performance Preset 1280x720
81.2
low 1920x1080
71.1  fps    + Compare
med. 1920x1080
59.9  fps    + Compare
high 1920x1080
39.5  fps    + Compare
» With all tested laptops playable in detail settings high.
Additional Benchmarks
Minimum Settings 1280x720
130.8
low 1920x1080
35.9  fps    + Compare + 📈 Graph
med. 1920x1080
26.9  fps    + Compare + 📈 Graph
high 1920x1080
25.4  fps    + Compare + 📈 Graph
ultra 1920x1080
25.1  fps    + Compare + 📈 Graph
» With all tested laptops playable in detail settings low.
Additional Benchmarks
Ultra Low Preset 1280x720
58.2
low 1920x1080
64.8  fps    + Compare + 📈 Graph
med. 1920x1080
48.3  fps    + Compare + 📈 Graph
high 1920x1080
32.3  fps    + Compare + 📈 Graph
ultra 1920x1080
22.6  fps    + Compare + 📈 Graph
» With all tested laptops playable in detail settings med..
Additional Benchmarks
Low Preset 1280x720
102
Returnal

Returnal

2023
low 1920x1080
34  fps    + Compare
med. 1920x1080
33  fps    + Compare
high 1920x1080
31  fps    + Compare
ultra 1920x1080
25  fps    + Compare
» The benchmarks indicate that the game is not playable in the tested settings.
Additional Benchmarks
Low Preset 1280x720
45
low 1920x1080
22.7  fps    + Compare + 📈 Graph
med. 1920x1080
18  fps    + Compare + 📈 Graph
high 1920x1080
13.2  fps    + Compare + 📈 Graph
ultra 1920x1080
6.5  fps    + Compare + 📈 Graph
» The benchmarks indicate that the game is not playable in the tested settings.
Additional Benchmarks
Low Preset Low TAA 1280x720
34.4
low 1920x1080
29.9  fps    + Compare + 📈 Graph
med. 1920x1080
29  fps    + Compare + 📈 Graph
high 1920x1080
25.3  fps    + Compare + 📈 Graph
ultra 1920x1080
25.2  fps    + Compare + 📈 Graph
» The benchmarks indicate that the game is not playable in the tested settings.
Additional Benchmarks
Low Preset TAA 1280x720
48.5
low 1920x1080
76  fps    + Compare + 📈 Graph
med. 1920x1080
57.8  fps    + Compare + 📈 Graph
high 1920x1080
49.2  fps    + Compare + 📈 Graph
ultra 1920x1080
40.3  fps    + Compare + 📈 Graph
» With all tested laptops playable in detail settings ultra.
Additional Benchmarks
Low Preset / Off 1280x720
128.3
low 1920x1080
102.1  fps    + Compare + 📈 Graph
med. 1920x1080
58.5  fps    + Compare + 📈 Graph
high 1920x1080
50.7  fps    + Compare + 📈 Graph
ultra 1920x1080
37.9  fps    + Compare + 📈 Graph
» With all tested laptops playable in detail settings ultra.
Additional Benchmarks
Low Preset 1280x720
162.8
low 1920x1080
63.2  fps    + Compare
med. 1920x1080
43.7  fps    + Compare
high 1920x1080
40.9  fps    + Compare
ultra 1920x1080
26.6  fps    + Compare
» With all tested laptops playable in detail settings high.
Additional Benchmarks
Low Preset (without FSR Upscaling) 1280x720
99.5
low 1920x1080
51.4  fps    + Compare + 📈 Graph
med. 1920x1080
42.4  fps    + Compare + 📈 Graph
high 1920x1080
31.6  fps    + Compare + 📈 Graph
ultra 1920x1080
22.6  fps    + Compare + 📈 Graph
» With all tested laptops playable in detail settings med..
Additional Benchmarks
Low Preset 1280x720
78.3
low 1920x1080
55.6  fps    + Compare + 📈 Graph
med. 1920x1080
48.9  fps    + Compare + 📈 Graph
high 1920x1080
45.3  fps    + Compare + 📈 Graph
ultra 1920x1080
39.8  fps    + Compare + 📈 Graph
» With all tested laptops playable in detail settings ultra.
Additional Benchmarks
Very Low Preset 1280x720
93.5
low 1920x1080
20.1  fps    + Compare + 📈 Graph
med. 1920x1080
18.9  fps    + Compare + 📈 Graph
high 1920x1080
17.3  fps    + Compare + 📈 Graph
» The benchmarks indicate that the game is not playable in the tested settings.
Additional Benchmarks
Low Preset 1280x720
22.4
low 1920x1080
39  fps    + Compare + 📈 Graph
med. 1920x1080
29.1  fps    + Compare + 📈 Graph
high 1920x1080
21.5  fps    + Compare + 📈 Graph
ultra 1920x1080
16.2  fps    + Compare + 📈 Graph
» With all tested laptops playable in detail settings low.
Additional Benchmarks
Low Preset 1280x720
52.1
low 1920x1080
44.8  fps    + Compare + 📈 Graph
med. 1920x1080
34.3  fps    + Compare + 📈 Graph
high 1920x1080
27.4  fps    + Compare + 📈 Graph
ultra 1920x1080
20.2  fps    + Compare + 📈 Graph
» With all tested laptops playable in detail settings low.
Additional Benchmarks
Low Preset 1280x720
66.4
F1 22

F1 22

2022
low 1920x1080
115.3  fps    + Compare
med. 1920x1080
105.5  fps    + Compare
high 1920x1080
74  fps    + Compare
ultra 1920x1080
19.2  fps    + Compare
» With all tested laptops playable in detail settings high.
Additional Benchmarks
Ultra Low Preset 16xAF TAA 1280x720
199.9
low 1920x1080
55.1  fps    + Compare + 📈 Graph
med. 1920x1080
50.3  fps    + Compare + 📈 Graph
high 1920x1080
50  fps    + Compare + 📈 Graph
ultra 1920x1080
49.5  fps    + Compare + 📈 Graph
» With all tested laptops playable in detail settings ultra.
Additional Benchmarks
Lowest Settings 1280x720
103.8
low 1920x1080
74.1  fps    + Compare
med. 1920x1080
59.2  fps    + Compare
high 1920x1080
37.6  fps    + Compare
ultra 1920x1080
29.3  fps    + Compare
» With all tested laptops playable in detail settings high.
Additional Benchmarks
Lowest Preset (DX12) 1280x720
143.6
low 1920x1080
41.3  fps    + Compare
med. 1920x1080
33.4  fps    + Compare
high 1920x1080
28.9  fps    + Compare
ultra 1920x1080
26  fps    + Compare
» With all tested laptops playable in detail settings low.
Additional Benchmarks
Low Preset 1280x720
62.3
low 1920x1080
112.4  fps    + Compare
med. 1920x1080
86.8  fps    + Compare
high 1920x1080
65.3  fps    + Compare
ultra 1920x1080
58.7  fps    + Compare
» With all tested laptops playable in detail settings ultra.
Additional Benchmarks
Low Preset 1280x720
141.1
low 1920x1080
44.7  fps    + Compare + 📈 Graph
med. 1920x1080
37.5  fps    + Compare + 📈 Graph
high 1920x1080
30.4  fps    + Compare + 📈 Graph
ultra 1920x1080
21.8  fps    + Compare + 📈 Graph
» With all tested laptops playable in detail settings med..
Additional Benchmarks
Low Preset 1280x720
60.8
low 1280x720
261  fps    + Compare + 📈 Graph
med. 1920x1080
108.7  fps    + Compare + 📈 Graph
high 1920x1080
78.9  fps    + Compare + 📈 Graph
ultra 1920x1080
64.5  fps    + Compare + 📈 Graph
» With all tested laptops playable in detail settings ultra.
Additional Benchmarks
Low Preset 1920x1080
183.2
low 1280x720
151  fps    + Compare
med. 1920x1080
72  fps    + Compare
high 1920x1080
64  fps    + Compare
ultra 1920x1080
28  fps    + Compare
» With all tested laptops playable in detail settings high.
Additional Benchmarks
Low Preset 1920x1080
88
low 1280x720
80  fps    + Compare
med. 1920x1080
50  fps    + Compare
high 1920x1080
49  fps    + Compare
ultra 1920x1080
45  fps    + Compare
» With all tested laptops playable in detail settings ultra.
Additional Benchmarks
Low Preset 1920x1080
52
Far Cry 6

Far Cry 6

2021
low 1280x720
116  fps    + Compare + 📈 Graph
med. 1920x1080
57.7  fps    + Compare + 📈 Graph
high 1920x1080
48.1  fps    + Compare + 📈 Graph
ultra 1920x1080
39  fps    + Compare + 📈 Graph
» With all tested laptops playable in detail settings ultra.
Additional Benchmarks
Low Graphics Quality 1920x1080
71.5
F1 2021

F1 2021

2021
low 1280x720
262  fps    + Compare
med. 1920x1080
112  fps    + Compare
high 1920x1080
87.1  fps    + Compare
ultra 1920x1080
38.8  fps    + Compare
» With all tested laptops playable in detail settings ultra.
low 1280x720
85  fps    + Compare
med. 1920x1080
50  fps    + Compare
high 1920x1080
37  fps    + Compare
ultra 1920x1080
31  fps    + Compare
» With all tested laptops playable in detail settings high.
Dirt 5

Dirt 5

2020
low 1280x720
29.7  fps    + Compare
med. 1920x1080
24.2  fps    + Compare
high 1920x1080
19.2  fps    + Compare
ultra 1920x1080
16.1  fps    + Compare
» The benchmarks indicate that the game is not playable in the tested settings.
low 1280x720
80  fps    + Compare
med. 1920x1080
55  fps    + Compare
high 1920x1080
48  fps    + Compare
ultra 1920x1080
25  fps    + Compare
» With all tested laptops playable in detail settings high.
low 1280x720
96  fps    + Compare
med. 1920x1080
57  fps    + Compare
high 1920x1080
47  fps    + Compare
ultra 1920x1080
39  fps    + Compare
» With all tested laptops playable in detail settings ultra.
low 1280x720
95.8  fps    + Compare + 📈 Graph
med. 1920x1080
59  fps    + Compare + 📈 Graph
high 1920x1080
55.4  fps    + Compare + 📈 Graph
ultra 1920x1080
54  fps    + Compare + 📈 Graph
» With all tested laptops playable in detail settings ultra.
F1 2020

F1 2020

2020
low 1280x720
185.7  fps    + Compare
med. 1920x1080
100.8  fps    + Compare
high 1920x1080
78.7  fps    + Compare
ultra 1920x1080
51.6  fps    + Compare
» With all tested laptops playable in detail settings ultra.
low 1280x720
136.5  fps    + Compare
med. 1920x1080
62  fps    + Compare
high 1920x1080
39.5  fps    + Compare
ultra 1920x1080
29.8  fps    + Compare
» With all tested laptops playable in detail settings high.
Additional Benchmarks
Very Low Overall Quality (DX11) 1920x1080
93.5
Control

Control

2019
low 1280x720
115.2  fps    + Compare + 📈 Graph
med. 1920x1080
42.2  fps    + Compare + 📈 Graph
high 1920x1080
31.3  fps    + Compare + 📈 Graph
» With all tested laptops playable in detail settings med..
low 1280x720
214  fps    + Compare
med. 1920x1080
73  fps    + Compare
high 1920x1080
43  fps    + Compare
ultra 1920x1080
27  fps    + Compare
» With all tested laptops playable in detail settings high.
Anno 1800

Anno 1800

2019
low 1280x720
131.8  fps    + Compare + 📈 Graph
med. 1920x1080
55.7  fps    + Compare + 📈 Graph
high 1920x1080
43.1  fps    + Compare + 📈 Graph
ultra 1920x1080
31.3  fps    + Compare + 📈 Graph
» With all tested laptops playable in detail settings high.
low 1280x720
135  fps    + Compare
med. 1920x1080
63  fps    + Compare
high 1920x1080
50  fps    + Compare
ultra 1920x1080
36  fps    + Compare
» With all tested laptops playable in detail settings ultra.
low 1280x720
112  fps    + Compare + 📈 Graph
med. 1920x1080
63  fps    + Compare + 📈 Graph
high 1920x1080
59  fps    + Compare + 📈 Graph
ultra 1920x1080
54  fps    + Compare + 📈 Graph
» With all tested laptops playable in detail settings ultra.
low 1280x720
111.2  fps    + Compare
med. 1920x1080
52.6  fps    + Compare
high 1920x1080
37  fps    + Compare
ultra 1920x1080
29.7  fps    + Compare
» With all tested laptops playable in detail settings high.
low 1280x720
98  fps    + Compare
med. 1920x1080
61  fps    + Compare
high 1920x1080
50  fps    + Compare
ultra 1920x1080
29  fps    + Compare
» With all tested laptops playable in detail settings high.
low 1280x720
141  fps    + Compare
med. 1920x1080
76  fps    + Compare
high 1920x1080
72  fps    + Compare
ultra 1920x1080
57  fps    + Compare
» With all tested laptops playable in detail settings ultra.
low 1280x720
136  fps    + Compare
med. 1920x1080
55.9  fps    + Compare
high 1920x1080
50.8  fps    + Compare
ultra 1920x1080
42.1  fps    + Compare
» With all tested laptops playable in detail settings ultra.
Additional Benchmarks
Lowest Preset 1920x1080
91.8
Strange Brigade

Strange Brigade

2018
low 1280x720
231  fps    + Compare
med. 1920x1080
94.3  fps    + Compare
high 1920x1080
79.8  fps    + Compare
ultra 1920x1080
61.1  fps    + Compare
» With all tested laptops playable in detail settings ultra.
Far Cry 5

Far Cry 5

2018
low 1280x720
115  fps    + Compare + 📈 Graph
med. 1920x1080
62  fps    + Compare + 📈 Graph
high 1920x1080
57  fps    + Compare + 📈 Graph
ultra 1920x1080
52  fps    + Compare + 📈 Graph
» With all tested laptops playable in detail settings ultra.
Additional Benchmarks
Low Preset TAA 1920x1080
121
70
low 1280x720
100.8  fps    + Compare
med. 1920x1080
75.6  fps    + Compare
high 1920x1080
63.9  fps    + Compare
» With all tested laptops playable in detail settings high.
low 1280x720
77  fps    + Compare
med. 1920x1080
55  fps    + Compare
high 1920x1080
50  fps    + Compare
ultra 1920x1080
41  fps    + Compare
» With all tested laptops playable in detail settings ultra.
low 1280x720
179.4 179.4 ~ 179 fps    + Compare
med. 1366x768
138.7 138.7 ~ 139 fps    + Compare
high 1920x1080
98.9 98.9 ~ 99 fps    + Compare
ultra 1920x1080
95.4 95.4 ~ 95 fps    + Compare
» With all tested laptops playable in detail settings ultra.
low 1024x768
198.2  fps    + Compare + 📈 Graph
med. 1366x768
124.9  fps    + Compare + 📈 Graph
high 1920x1080
65.6  fps    + Compare + 📈 Graph
ultra 1920x1080
33.5  fps    + Compare + 📈 Graph
» With all tested laptops playable in detail settings high.
Additional Benchmarks
Medium Graphics & Postprocessing 1920x1080
78.7
GTA V

GTA V

2015
low 1024x768
187.6  fps    + Compare
med. 1366x768
187.5  fps    + Compare
high 1920x1080
46.7  fps    + Compare
ultra 1920x1080
20  fps    + Compare
» With all tested laptops playable in detail settings high.
Additional Benchmarks
Normal/Off 4xAF 1920x1080
182.7
Lowest Settings possible 1920x1080
186.8
lowmed.highultraQHD4K
F1 24108.89163.516.3
Senua's Saga Hellblade 219.112.59.2
Ghost of Tsushima4032.62820
Horizon Forbidden West34.531.220.214.9
Alone in the Dark84.671.65929.5
Dragon's Dogma 22218.9
Last Epoch78.270.357.142.7
Skull & Bones41363023
Helldivers 246.636.532.433.1
Enshrouded28.525.520.917.1
Palworld46.337.427.424.4
Prince of Persia The Lost Crown308200185.5
Ready or Not85.770.36843.8
The Finals8662.453.840.5
Avatar Frontiers of Pandora23201712
EA Sports WRC41.230.227.525.2
Lords of the Fallen24.925.121.517.5
Total War Pharaoh137874939
Assassin's Creed Mirage47413827
Counter-Strike 2182.5122.36846.2
Cyberpunk 2077 2.2 Phantom Liberty47.136.93127.3
Baldur's Gate 346.435.23029.2
Lies of P58.450.543.739.3
Starfield24.217.111.59.8
Armored Core 669.955.147.437.2
Immortals of Aveum2319.218.4
Atlas Fallen4745.741.415.1
Ratchet & Clank Rift Apart41.830.924.621.1
F1 2311090.457.115.7
Diablo 484.974.163.855
Star Wars Jedi Survivor26.122.821.620.4
Dead Island 288.37453.139.4
The Last of Us30.624.421.517.7
Resident Evil 4 Remake5336.833.221.1
Company of Heroes 371.159.939.5
Sons of the Forest35.926.925.425.1
Atomic Heart64.848.332.322.6
Returnal34333125
Hogwarts Legacy22.71813.26.5
Dead Space Remake29.92925.325.2
The Witcher 3 v47657.849.240.3
High On Life102.158.550.737.9
The Callisto Protocol63.243.740.926.6
Need for Speed Unbound51.442.431.622.6
Spider-Man Miles Morales55.648.945.339.8
Uncharted Legacy of Thieves Collection20.118.917.3
A Plague Tale Requiem3929.121.516.2
The Quarry44.834.327.420.2
F1 22115.3105.57419.2
Ghostwire Tokyo55.150.35049.5
Tiny Tina's Wonderlands74.159.237.629.3
Cyberpunk 2077 1.641.333.428.926
GRID Legends112.486.865.358.7
God of War44.737.530.421.8
Farming Simulator 22261108.778.964.5
Forza Horizon 5151726428
Guardians of the Galaxy80504945
Far Cry 611657.748.139
F1 202126211287.138.8
Assassin´s Creed Valhalla85503731
Dirt 529.724.219.216.1
Watch Dogs Legion80554825
Horizon Zero Dawn96574739
Death Stranding95.85955.454
F1 2020185.7100.878.751.6
Borderlands 3136.56239.529.8
Control115.242.231.3
Total War: Three Kingdoms214734327
Anno 1800131.855.743.131.3
The Division 2135635036
Far Cry New Dawn112635954
Metro Exodus111.252.63729.7
Assassin´s Creed Odyssey98615029
Forza Horizon 4141767257
Shadow of the Tomb Raider13655.950.842.1
Strange Brigade23194.379.861.1
Far Cry 5115625752
X-Plane 11.11100.875.663.9
Assassin´s Creed Origins77555041
Dota 2 Reborn1791399995
The Witcher 3198.2124.965.633.5
GTA V187.6187.546.720
lowmed.highultraQHD4K
< 30 fps
< 60 fps
< 120 fps
≥ 120 fps
12
23
30
16
13
38
24
5
22
44
15
1
42
30
3
1


For more games that might be playable and a list of all games and graphics cards visit our Gaming List

Add one or more devices and compare

In the following list you can select (and also search for) devices that should be added to the comparison. You can select more than one device.

search for model:
v1.33
log 06. 17:45:58

#0 ran 0s before starting gpusingle class +0s ... 0s

#1 no ids found in url (should be separated by "_") +0s ... 0s

#2 not redirecting to Ajax server +0s ... 0s

#3 did not recreate cache, as it is less than 5 days old! Created at Wed, 06 Aug 2025 11:47:55 +0200 +0.001s ... 0.001s

#4 composed specs +0.027s ... 0.028s

#5 did output specs +0s ... 0.028s

#6 start showIntegratedCPUs +0s ... 0.028s

#7 getting avg benchmarks for device 12461 +0.03s ... 0.058s

#8 got single benchmarks 12461 +0.009s ... 0.067s

#9 got avg benchmarks for devices +0s ... 0.067s

#10 min, max, avg, median took s +1.092s ... 1.16s

#11 before gaming benchmark output +0s ... 1.16s

#12 Got 323 rows for game benchmarks. +0.022s ... 1.181s

#13 composed SQL query for gamebenchmarks +0s ... 1.181s

#14 got data and put it in $dataArray +0.064s ... 1.245s

#15 benchmarks composed for output. +0.808s ... 2.053s

#16 return log +0.006s ... 2.06s

Please share our article, every link counts!
Mail Logo

» Comparison of GPUs
Detailed list of all laptop GPUs sorted by class and performance.

» Benchmark List
Sort and restrict laptop GPUs based on performance in synthetic benchmarks.

» Notebook Gaming List
Playable games for each graphics card and their average FPS results.

Class 1

Class 2

Class 3

Class 4

* Approximate position of the graphics adapter

Klaus Hinum (Update: 2024-12-27)