Sparkle Intel Arc A380 Elf desktop graphics card review - What can you expect from Intel's 129-Euro budget GPU?

The Intel Arc A380 currently costs 129 Euros (~$141). But the entry-level GPU still offers 6 GB of VRAM, although they are only connected via a small 96-bit storage interface. With the DB2-128, you get a significantly smaller GPU chip than with the more powerful Intel Arc graphics cards.
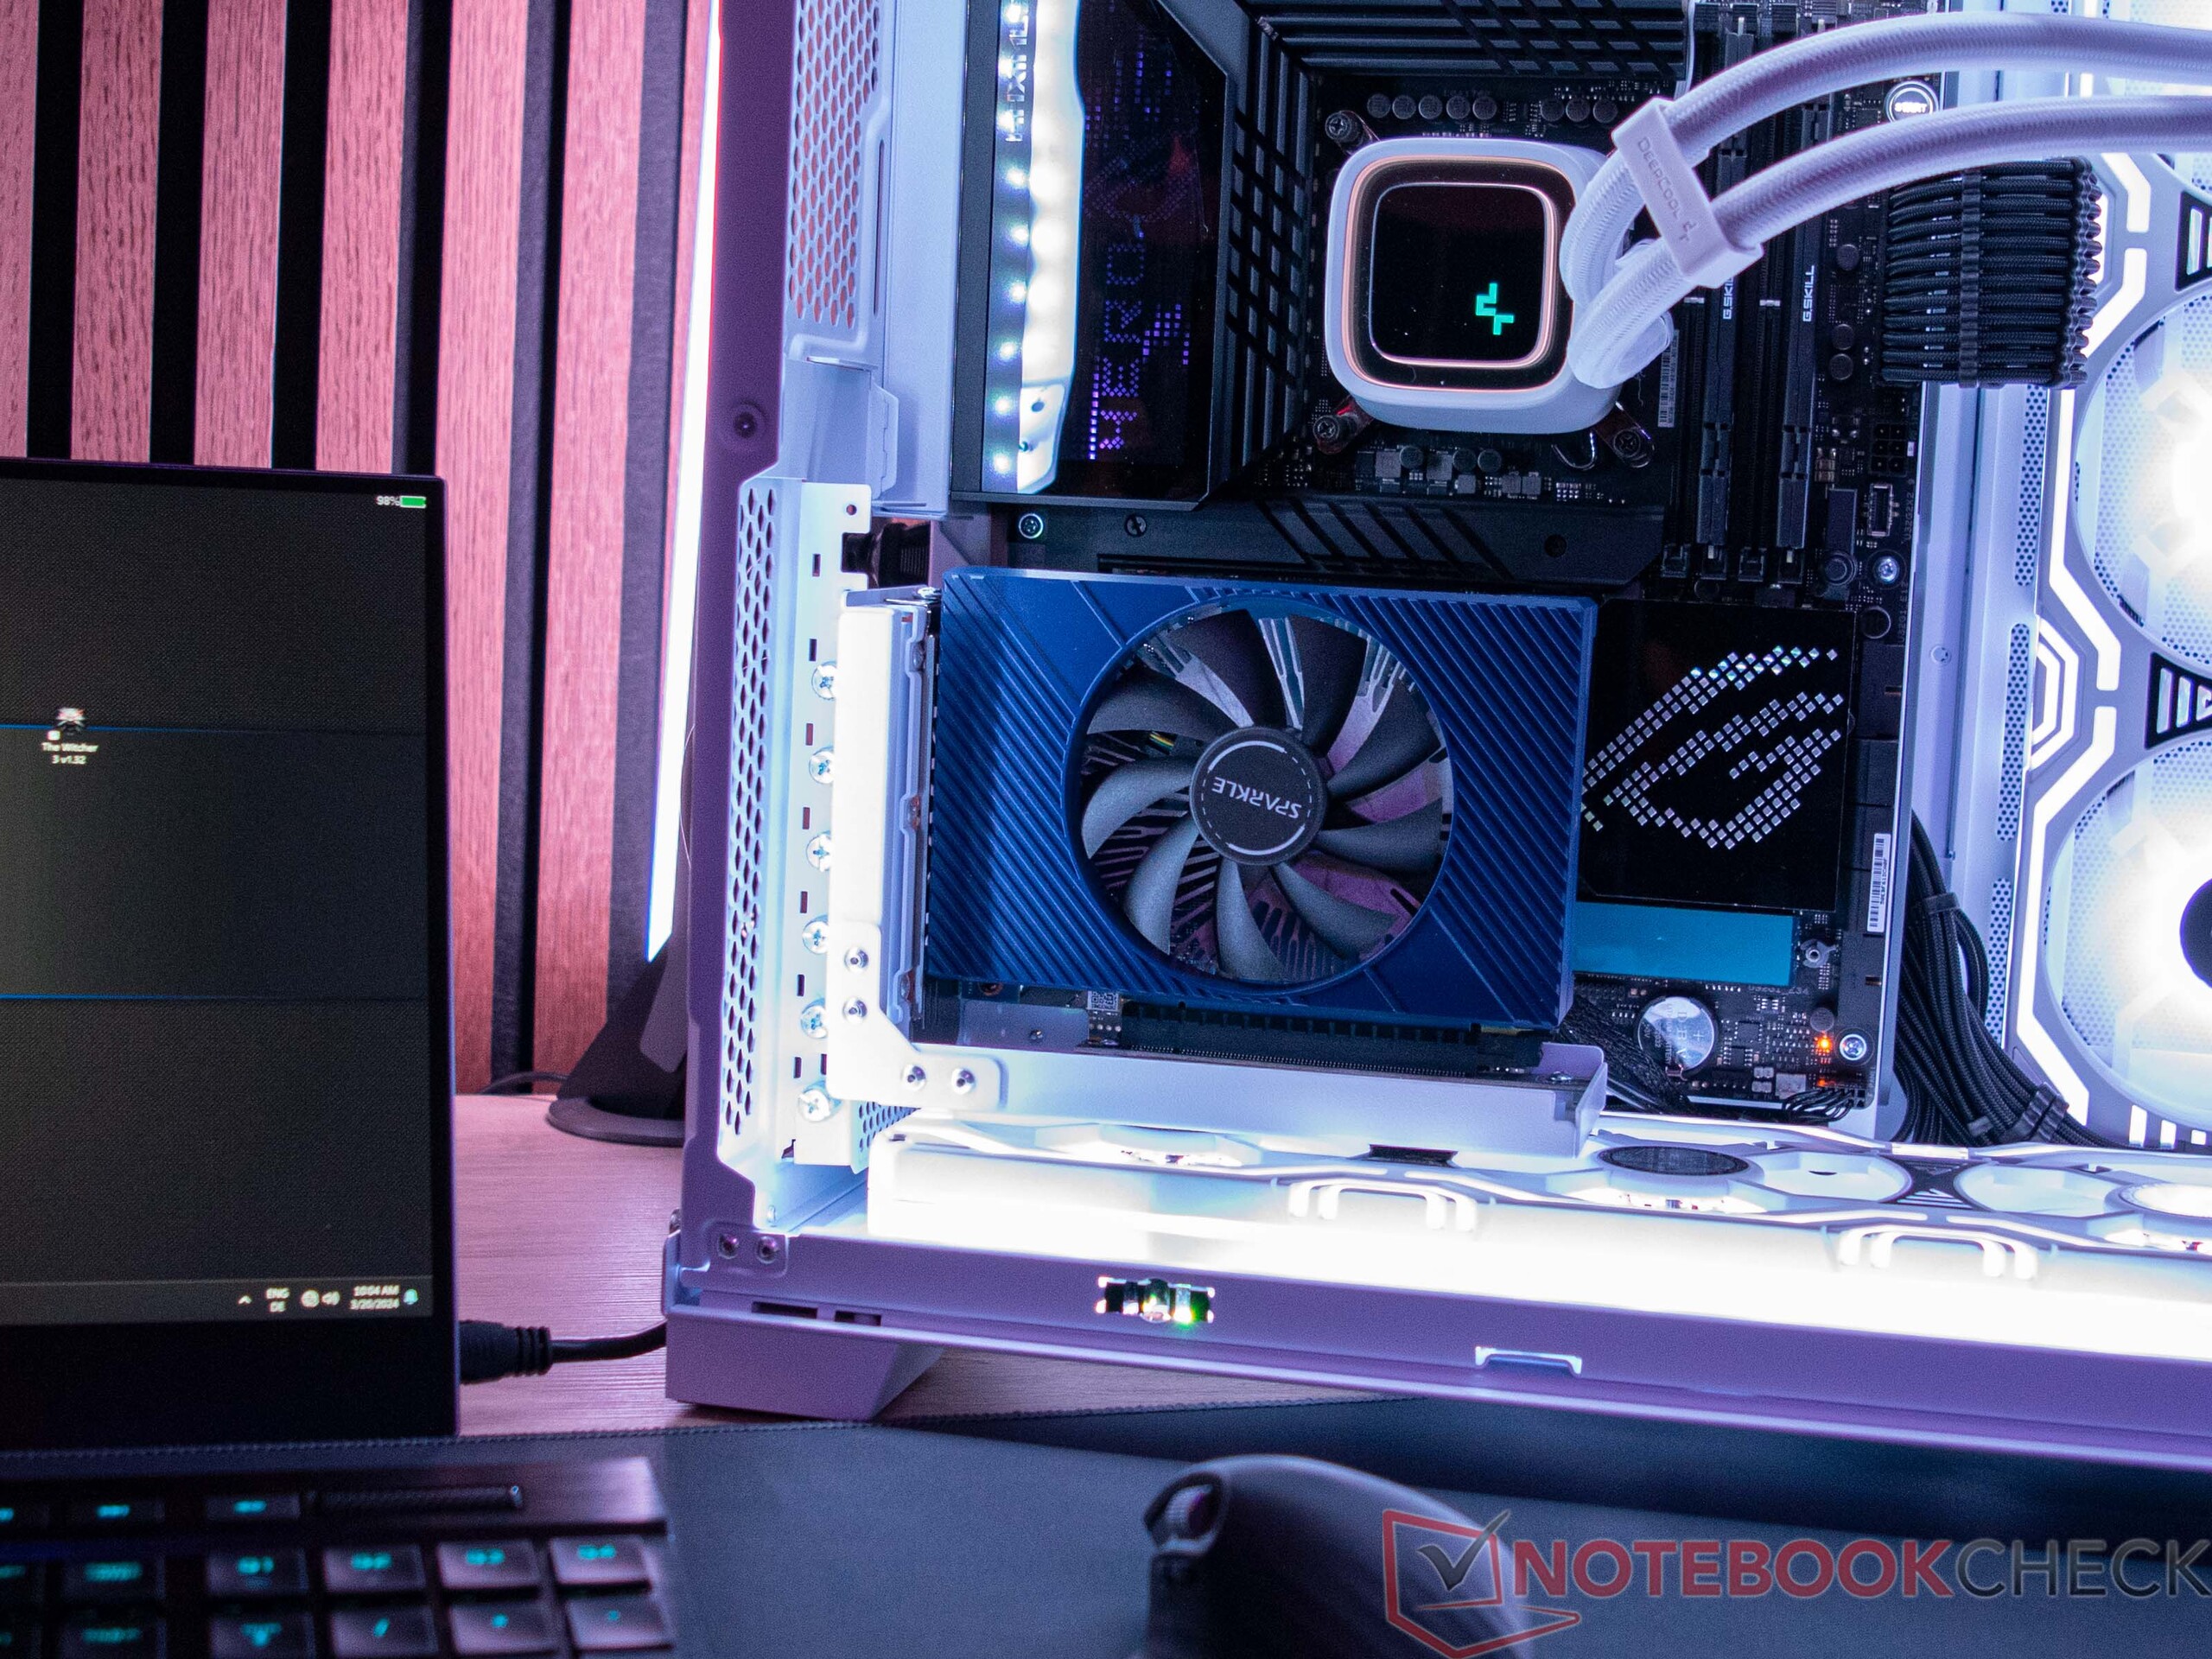
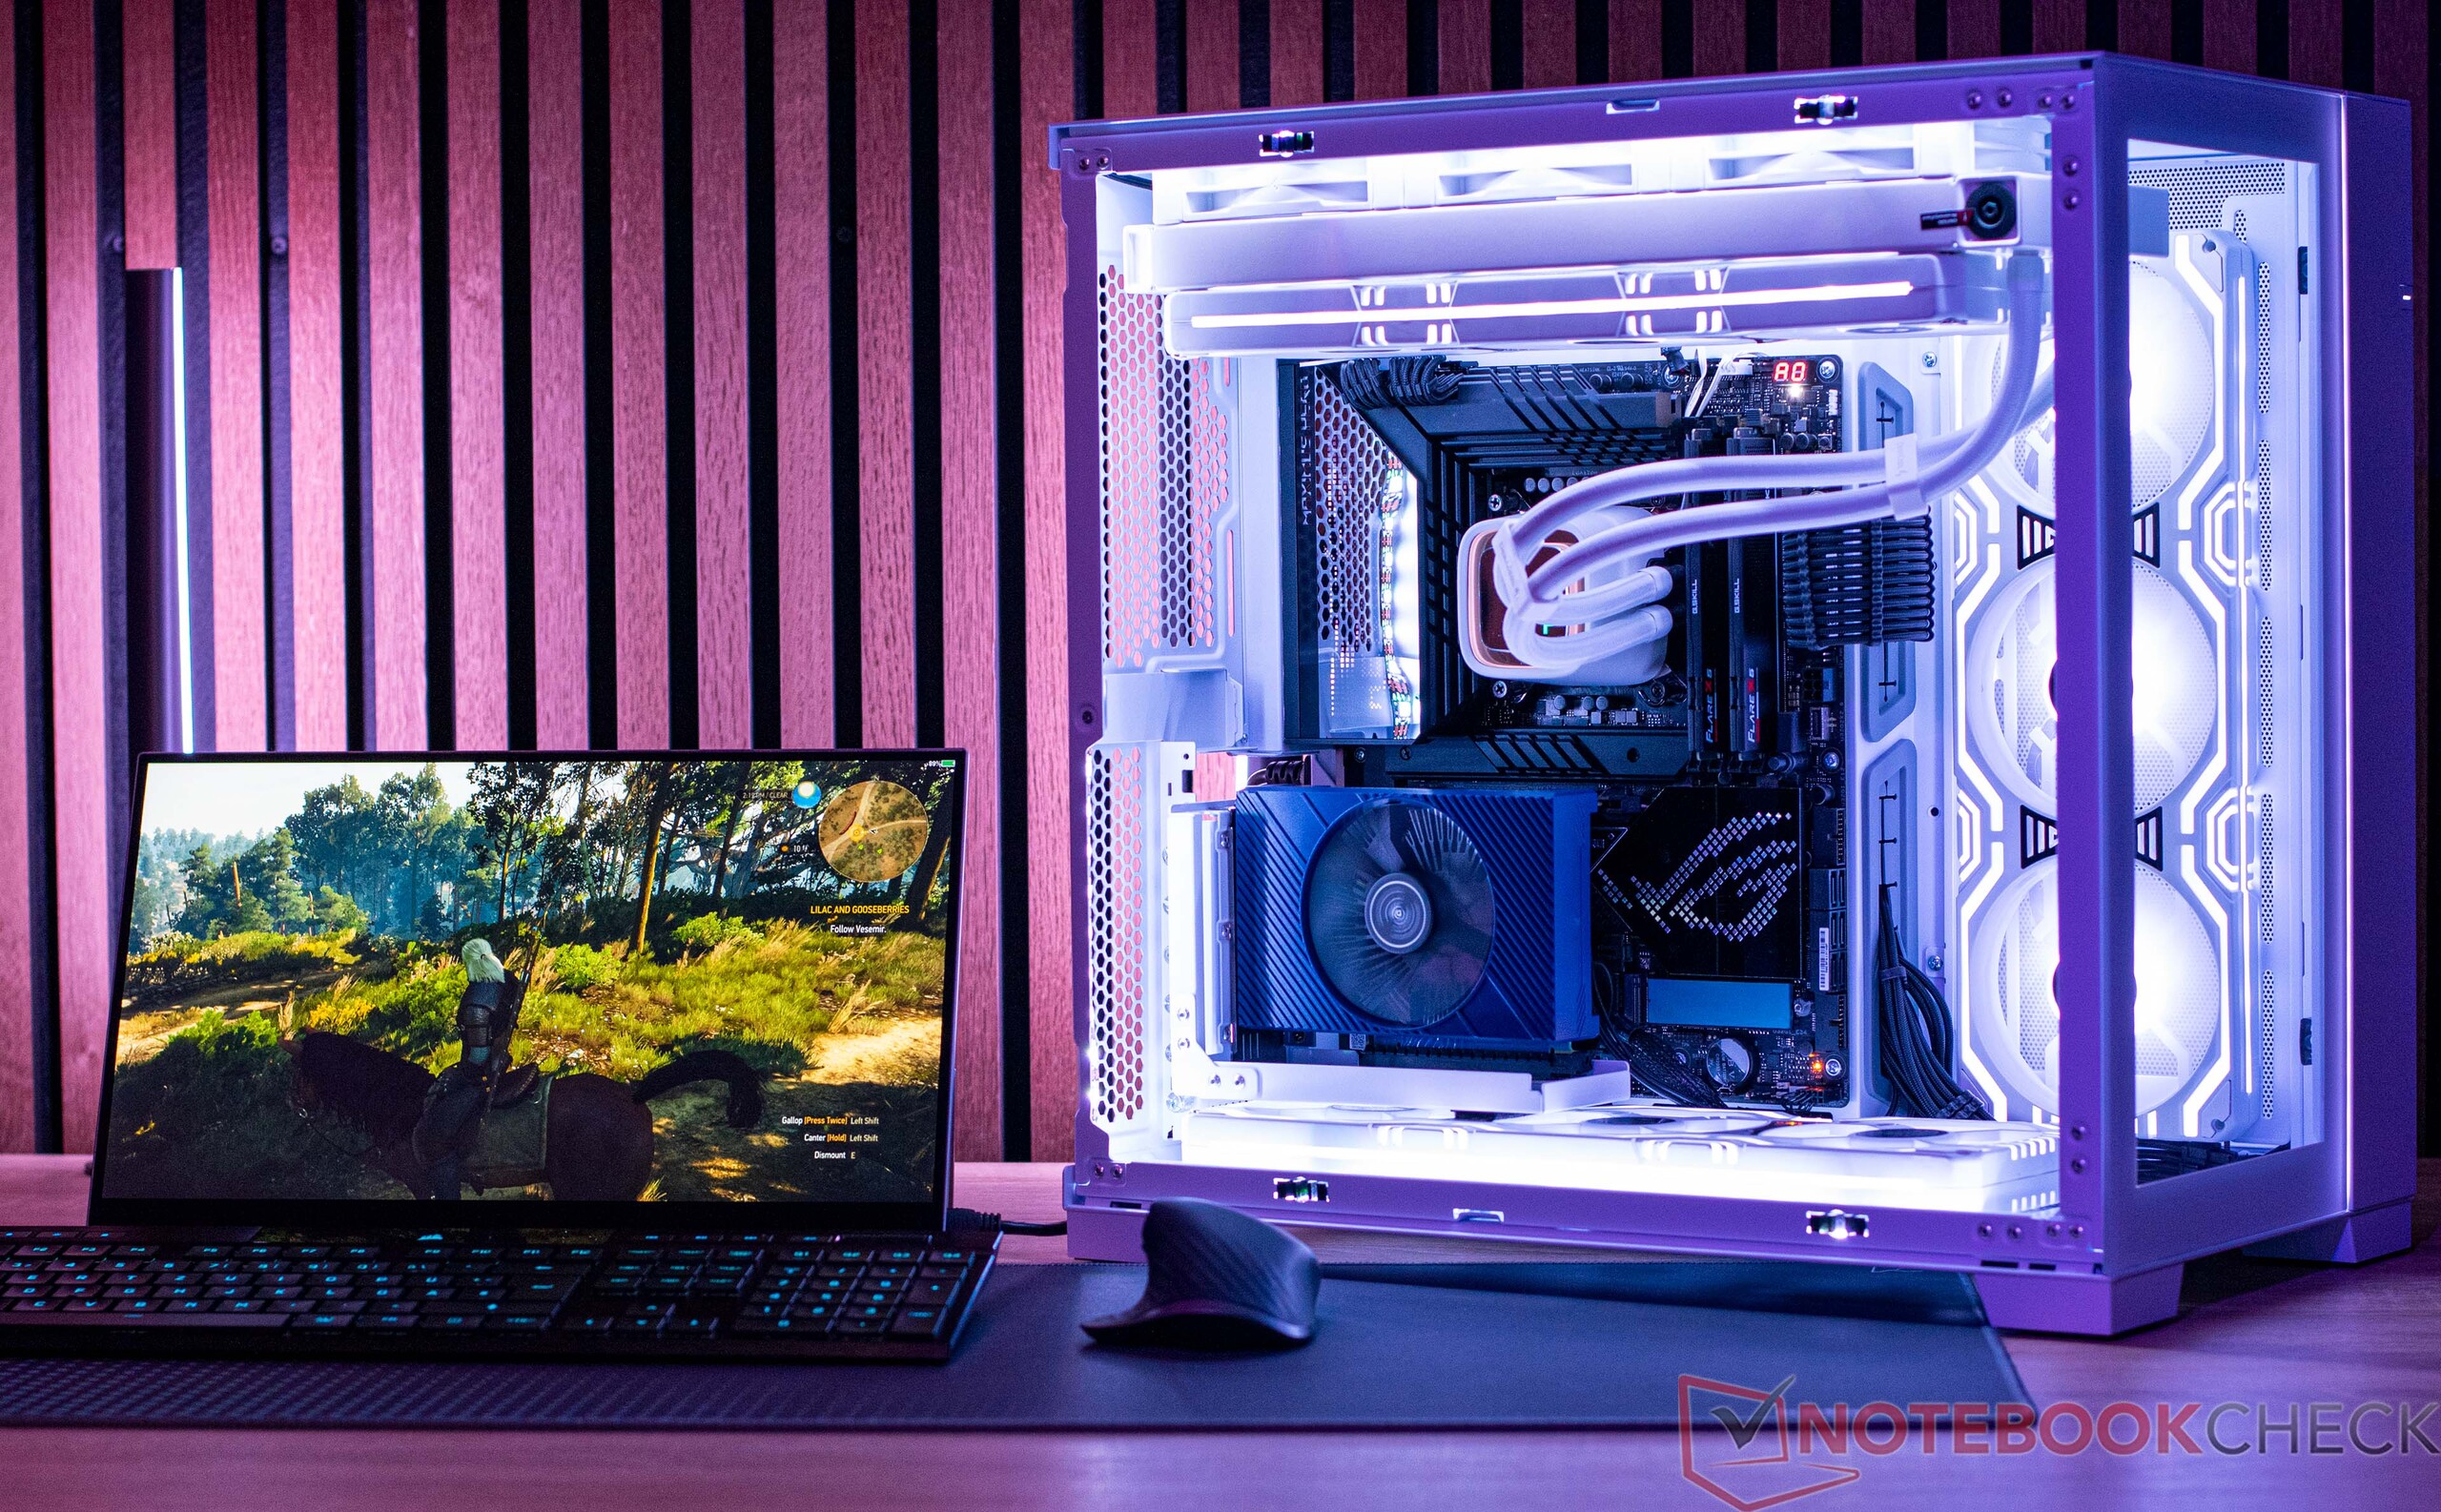
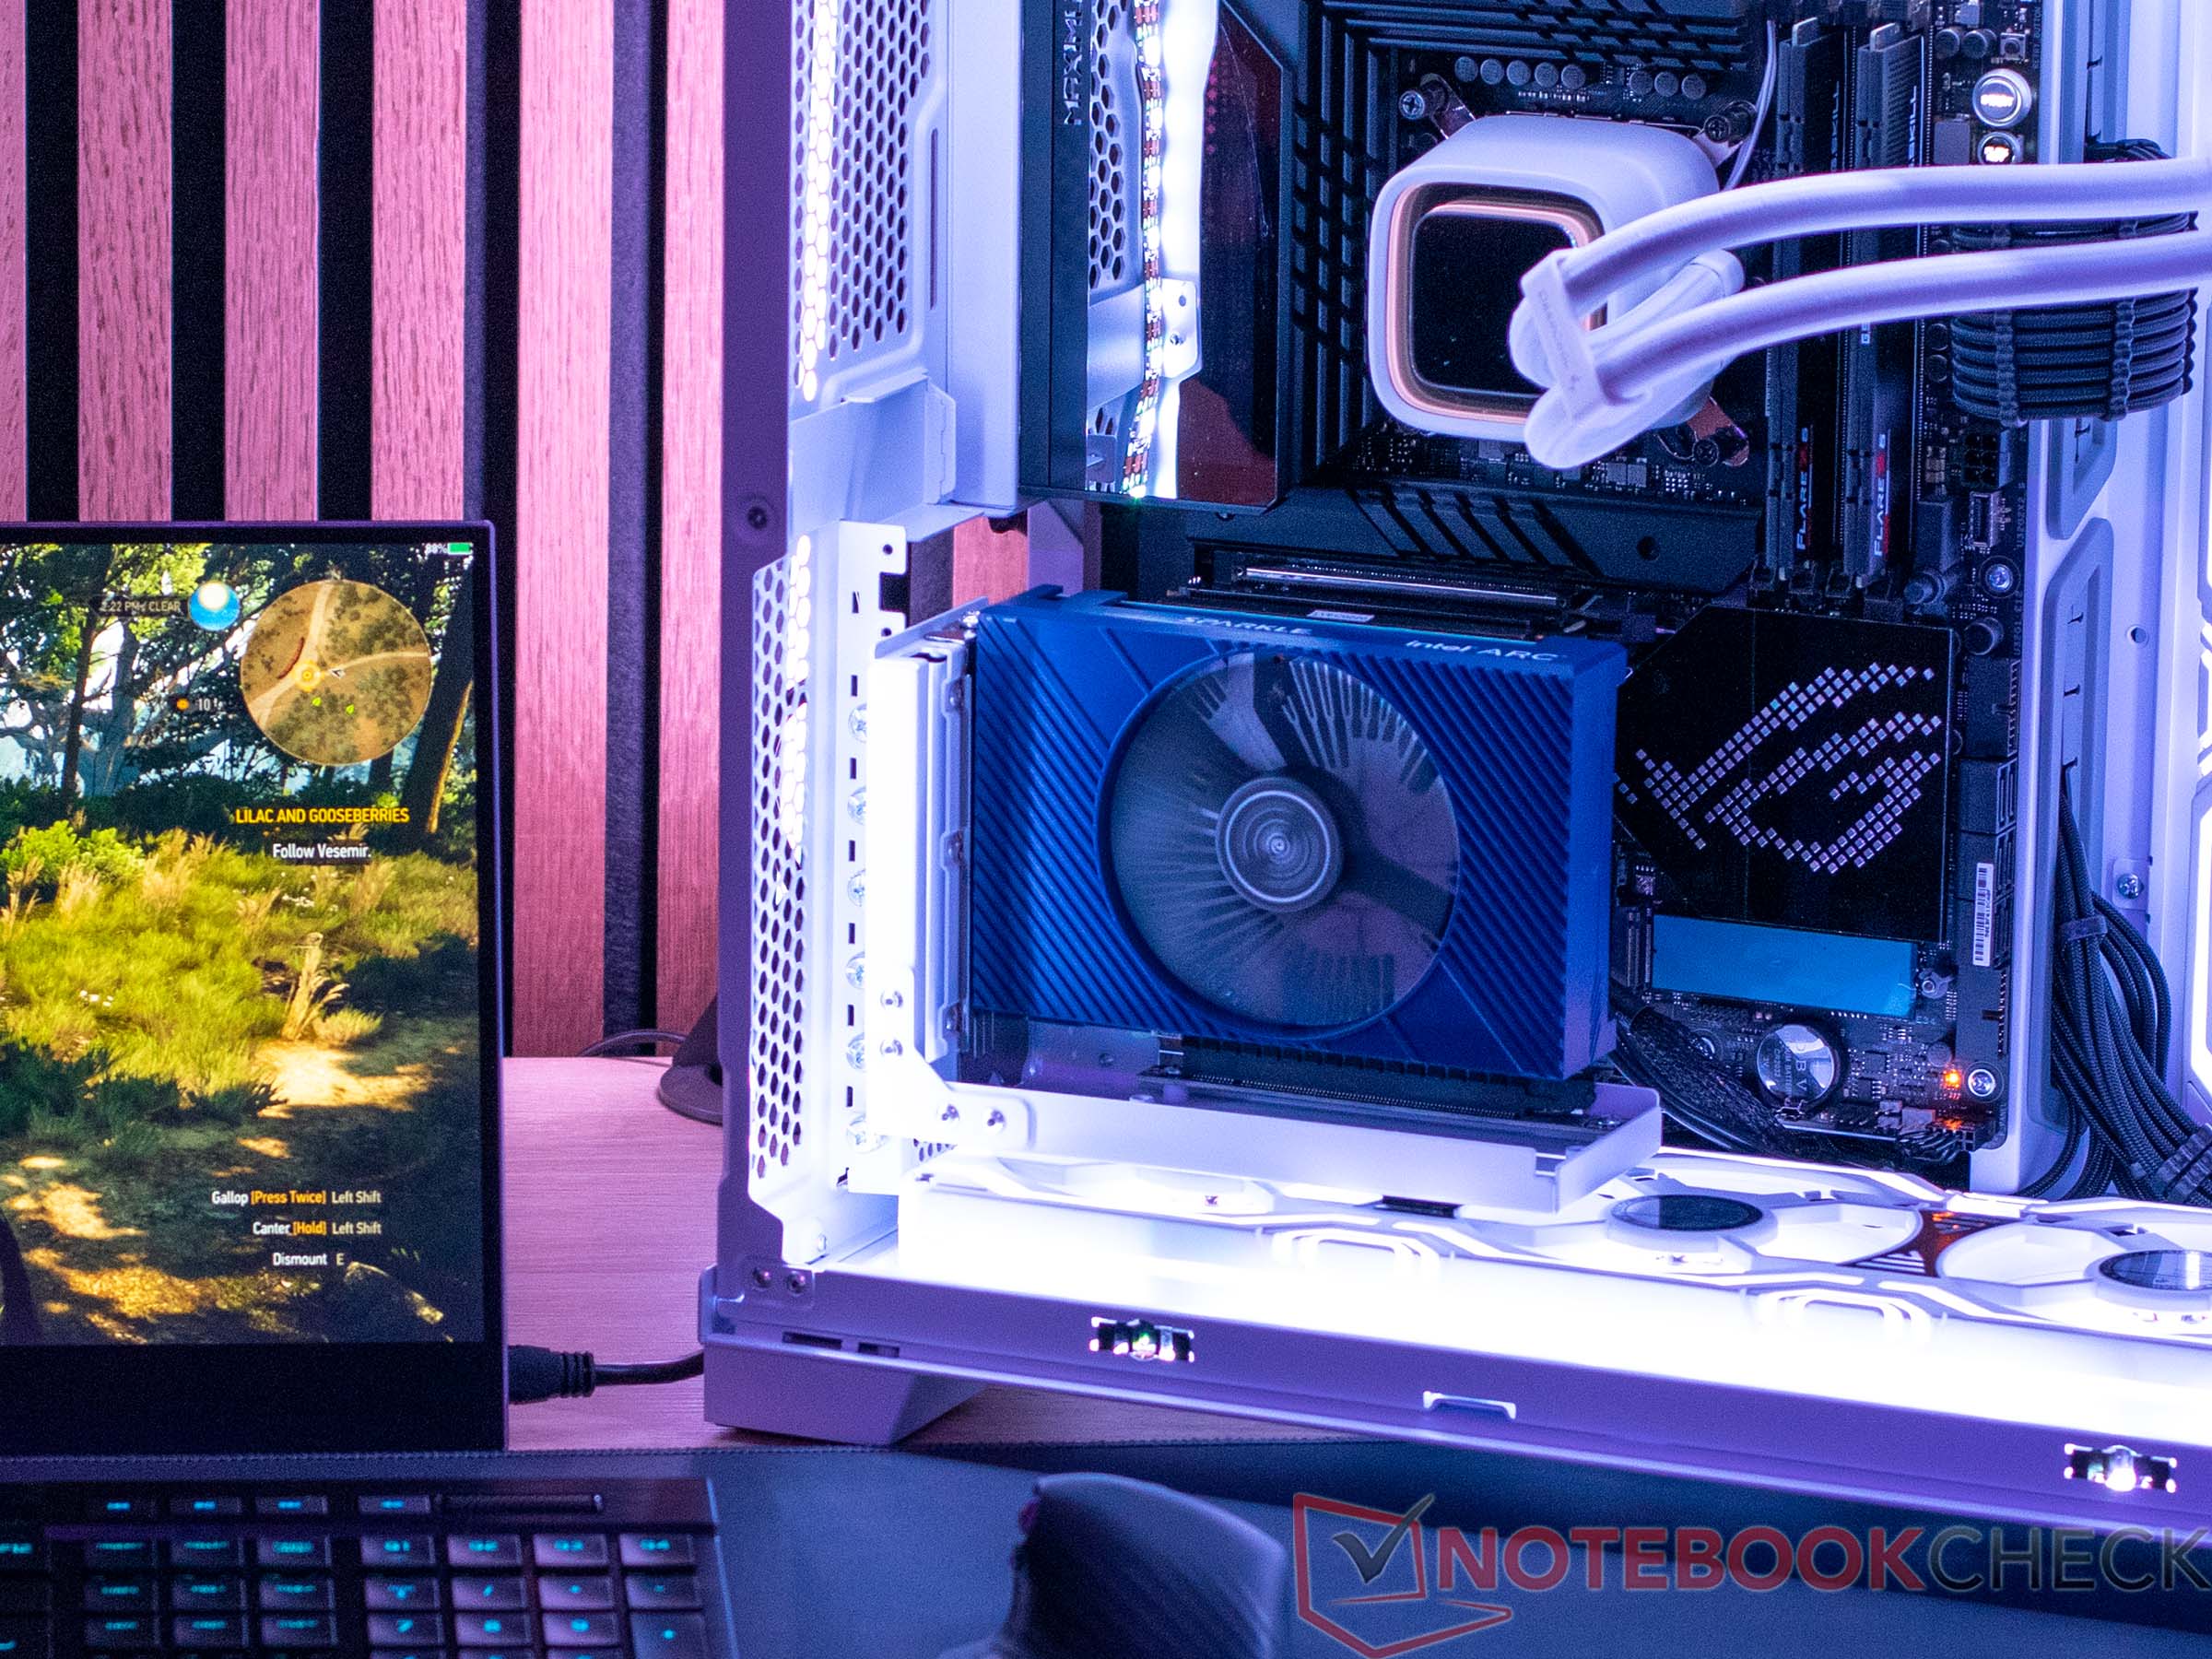
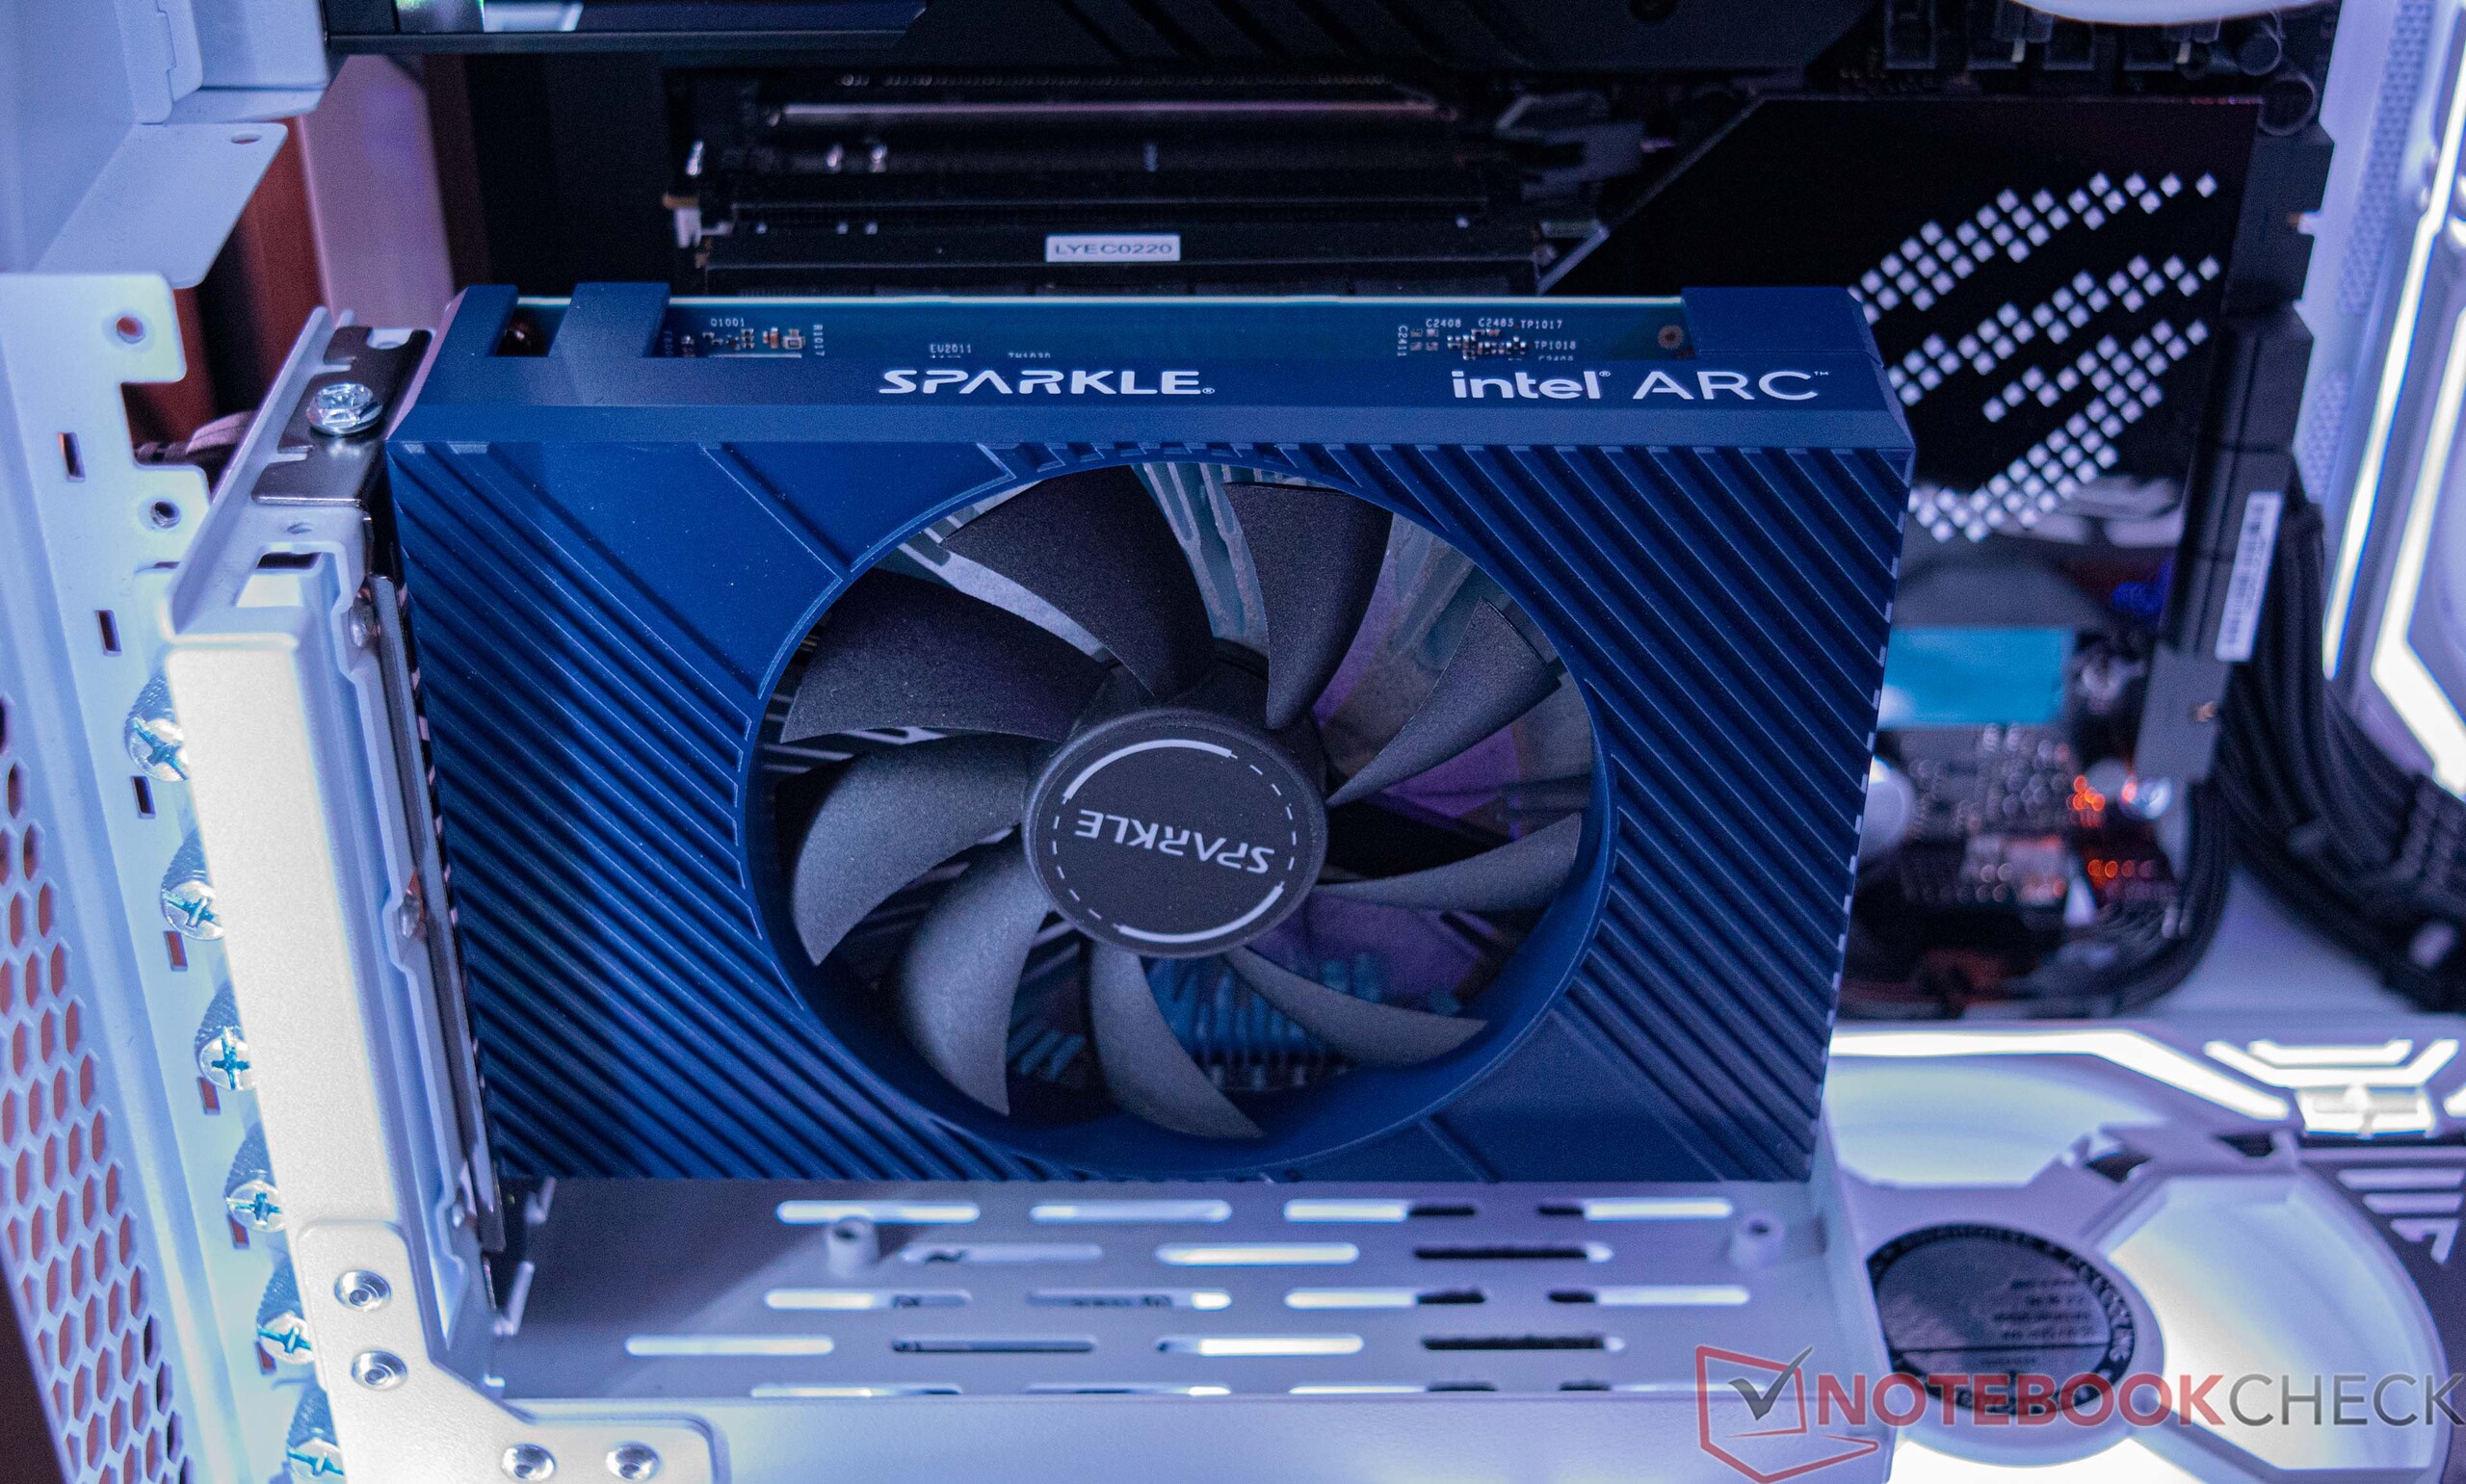
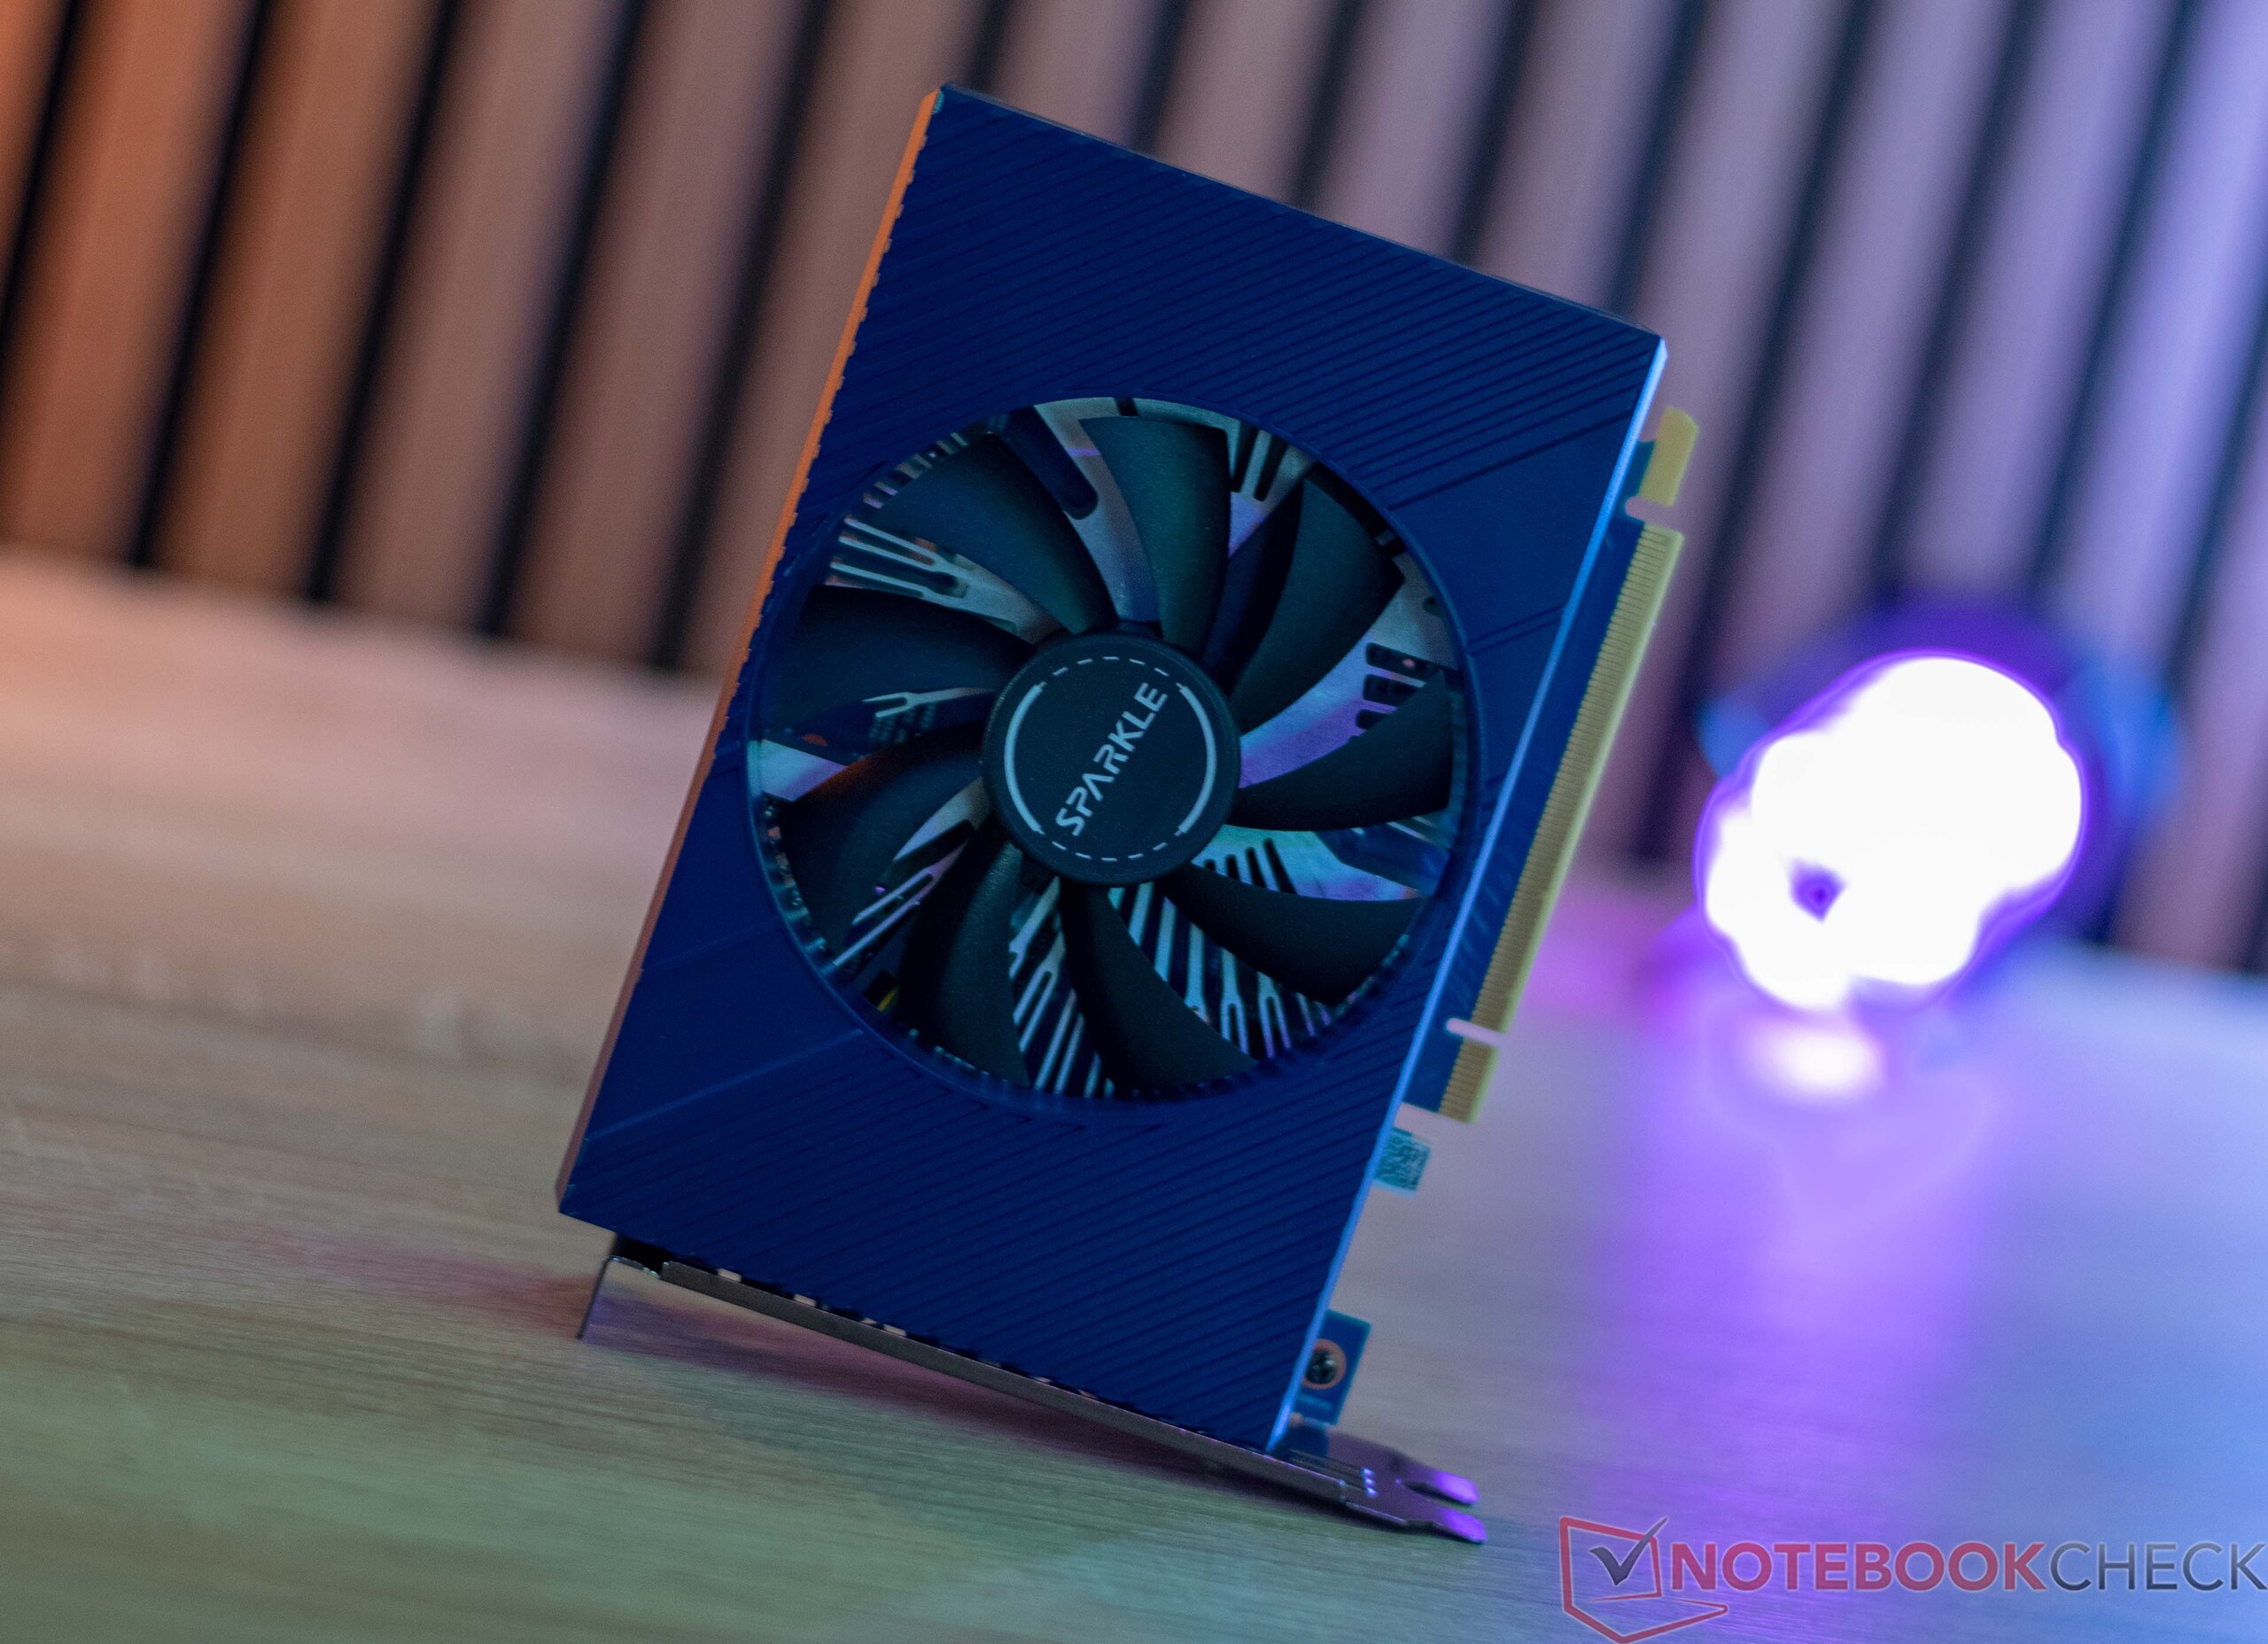
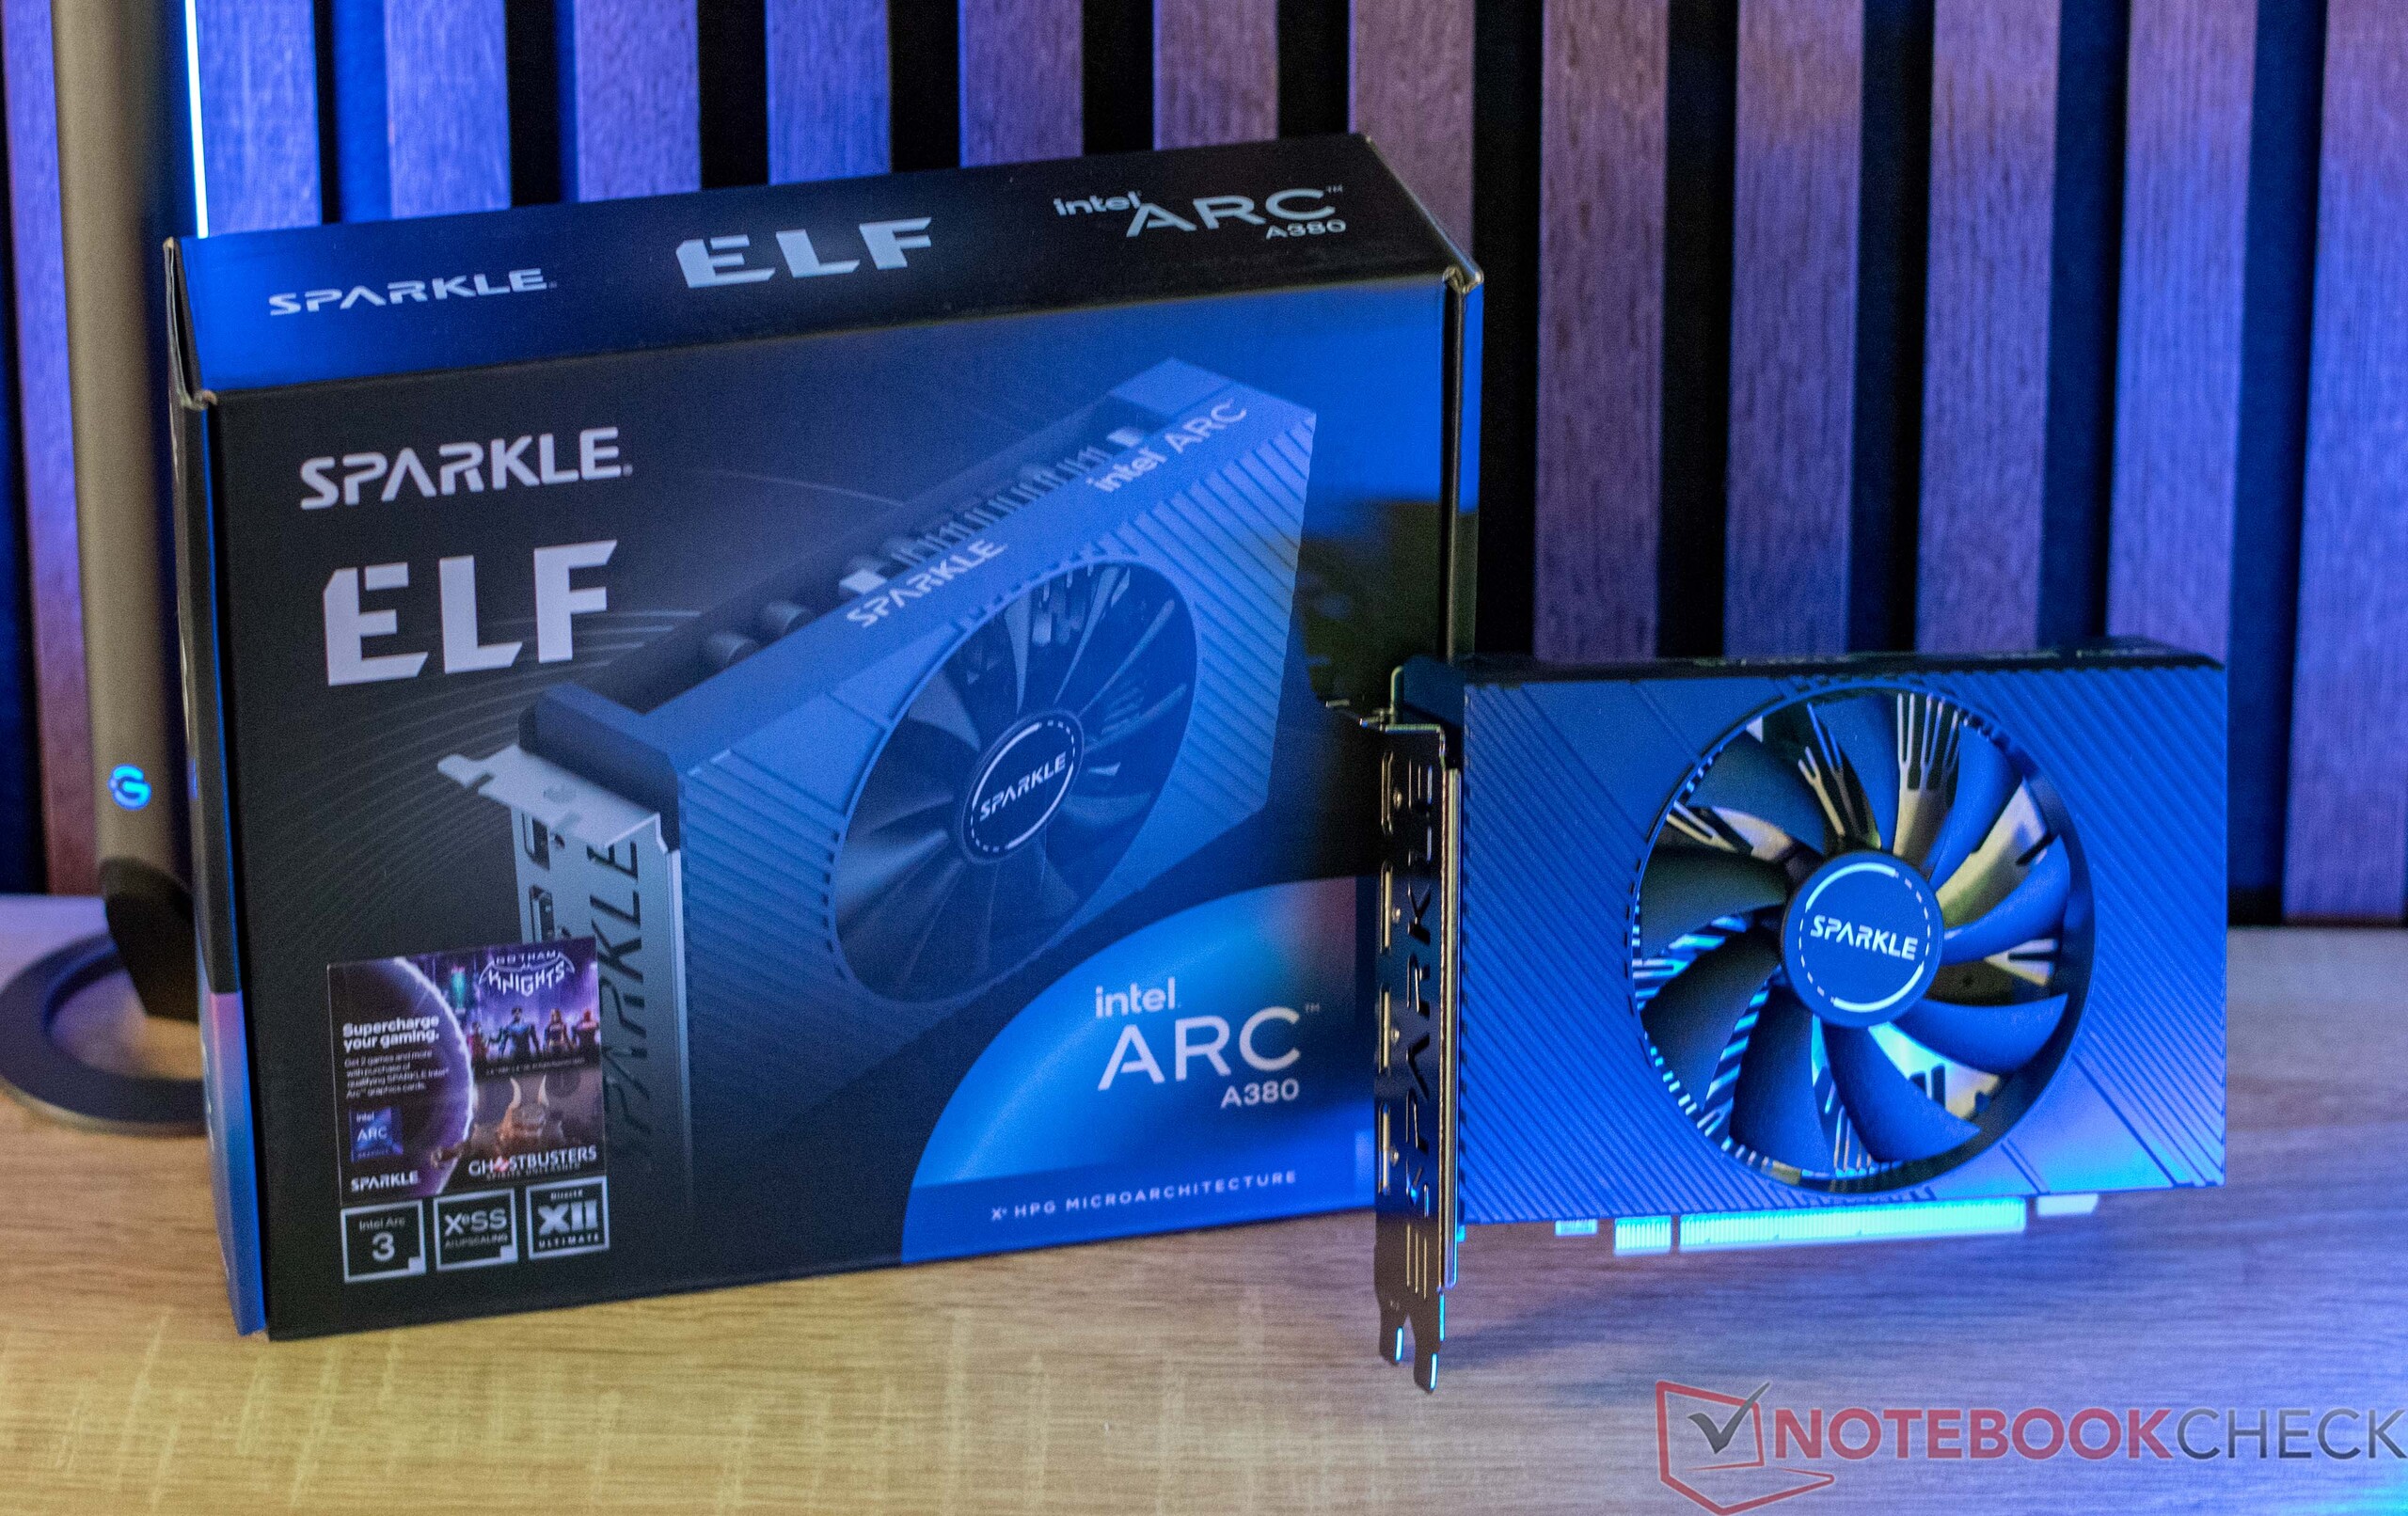
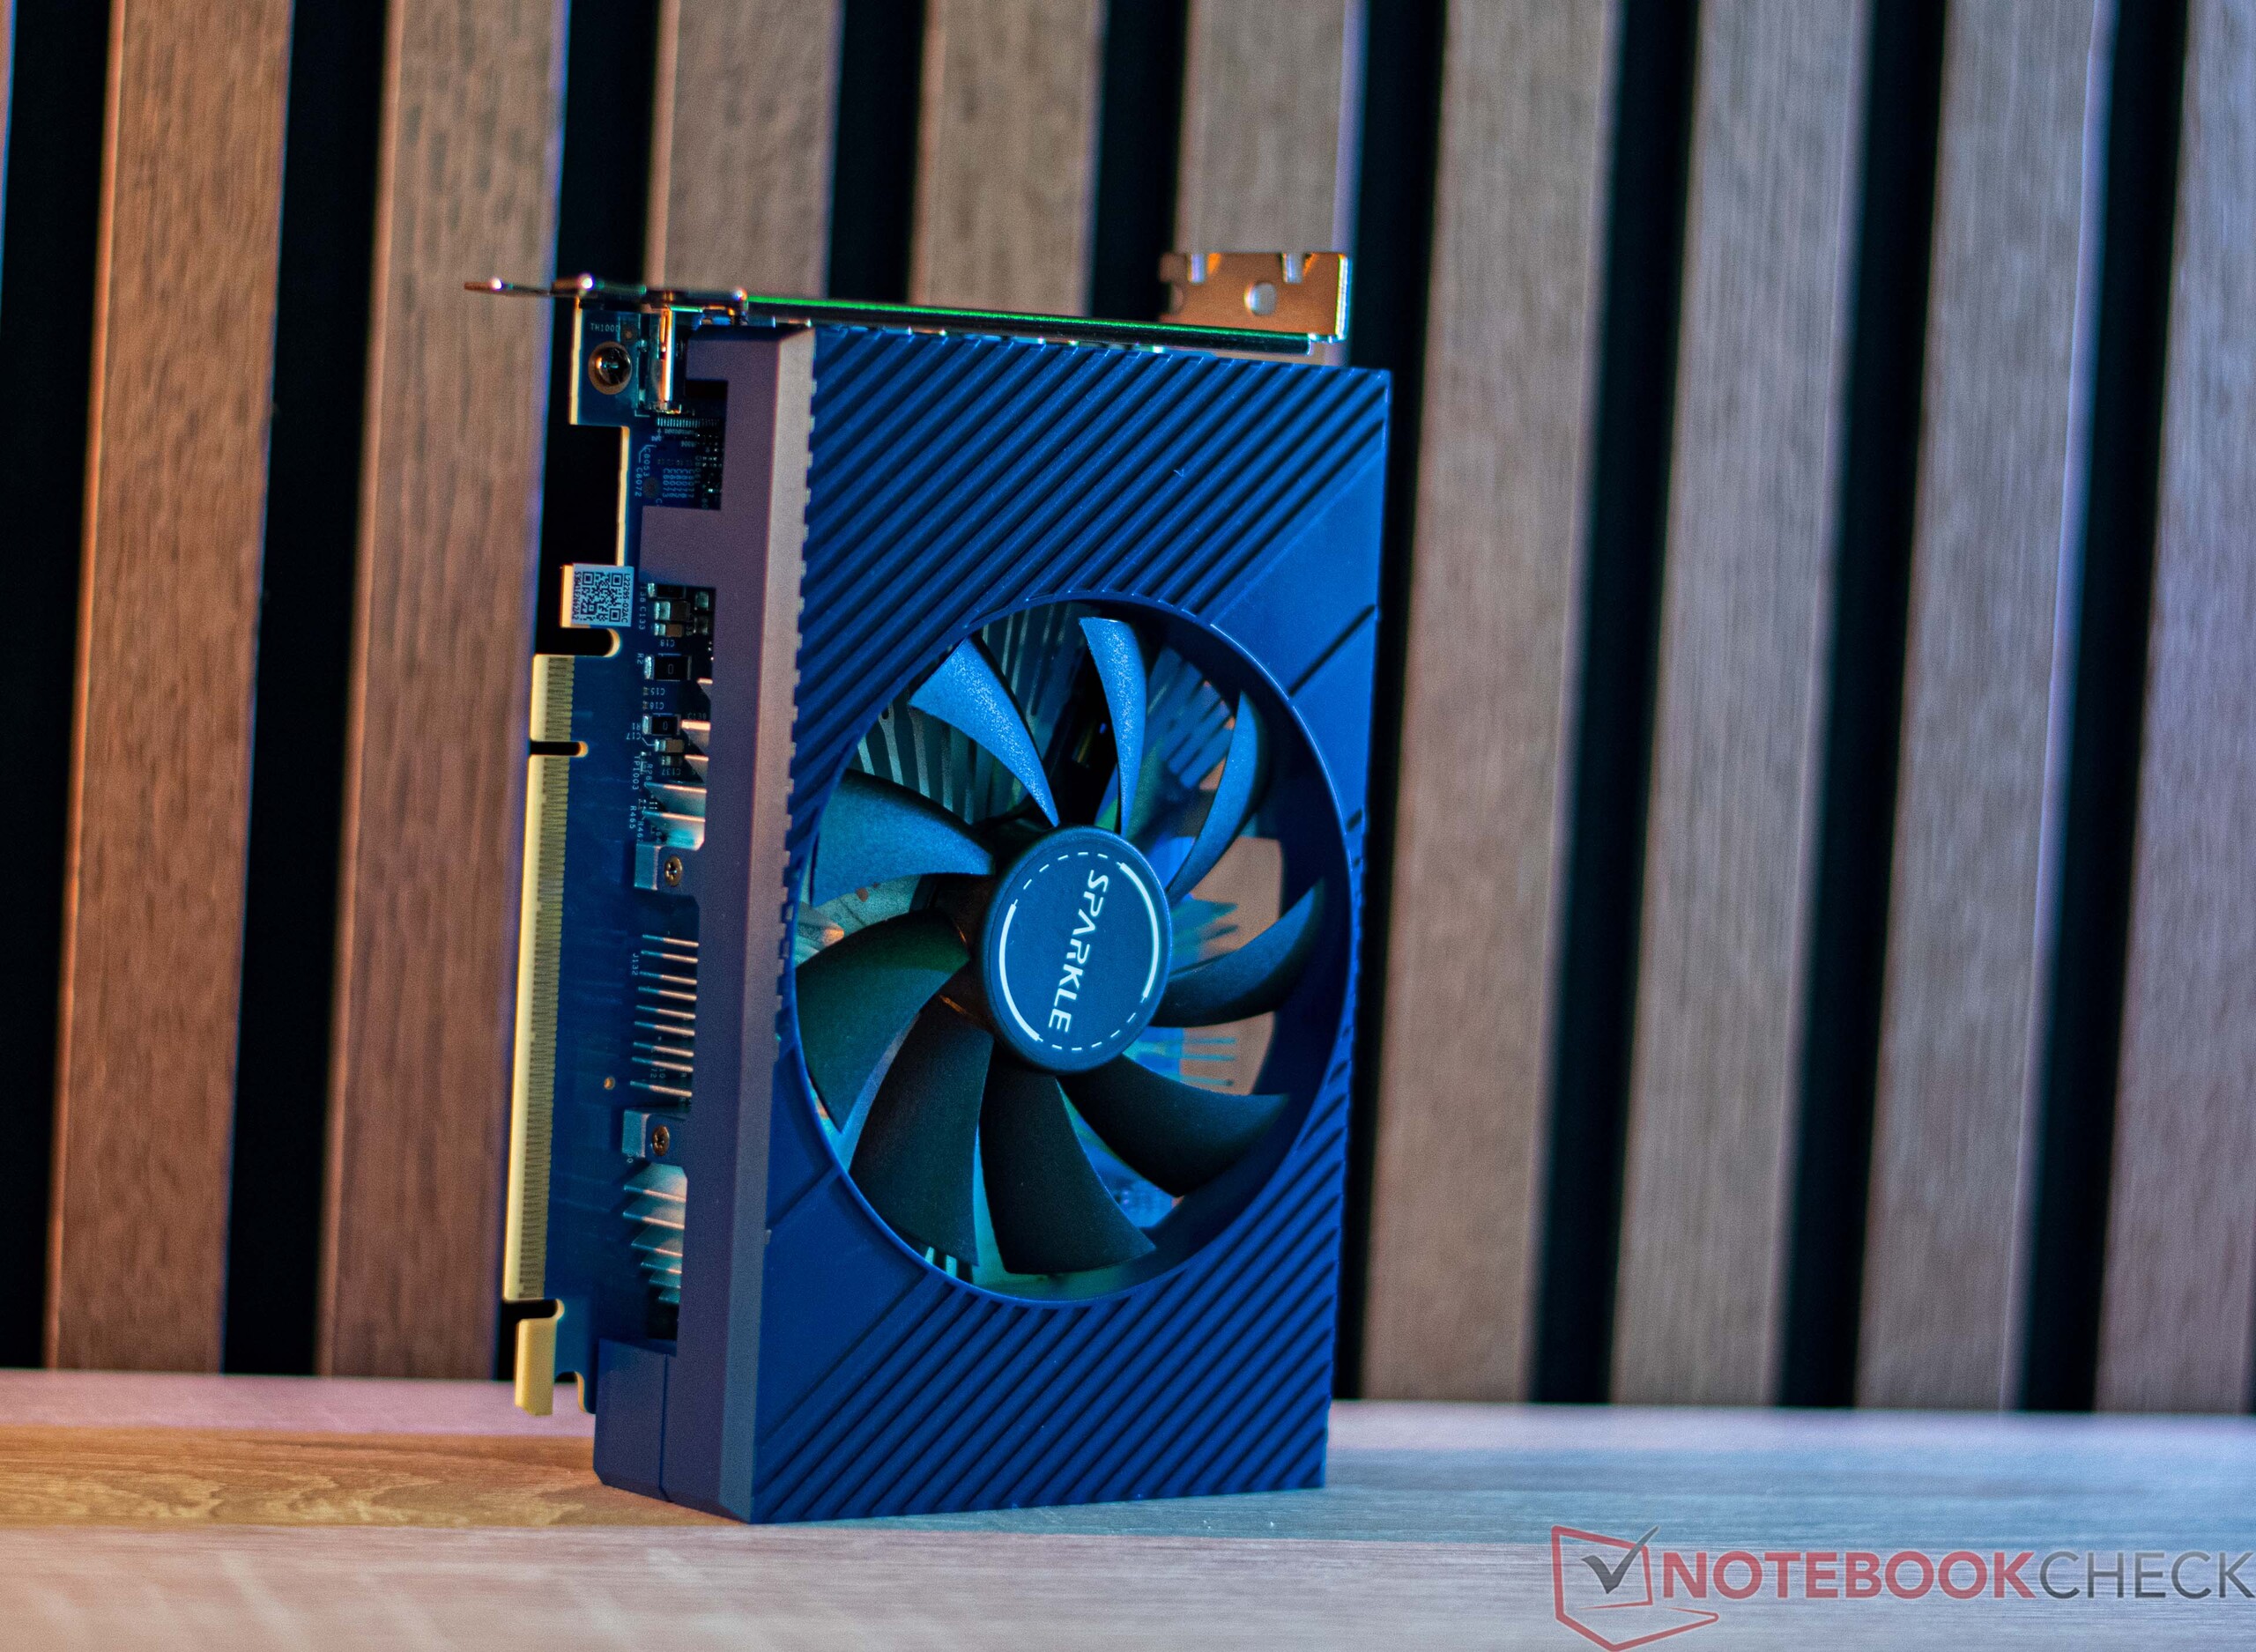
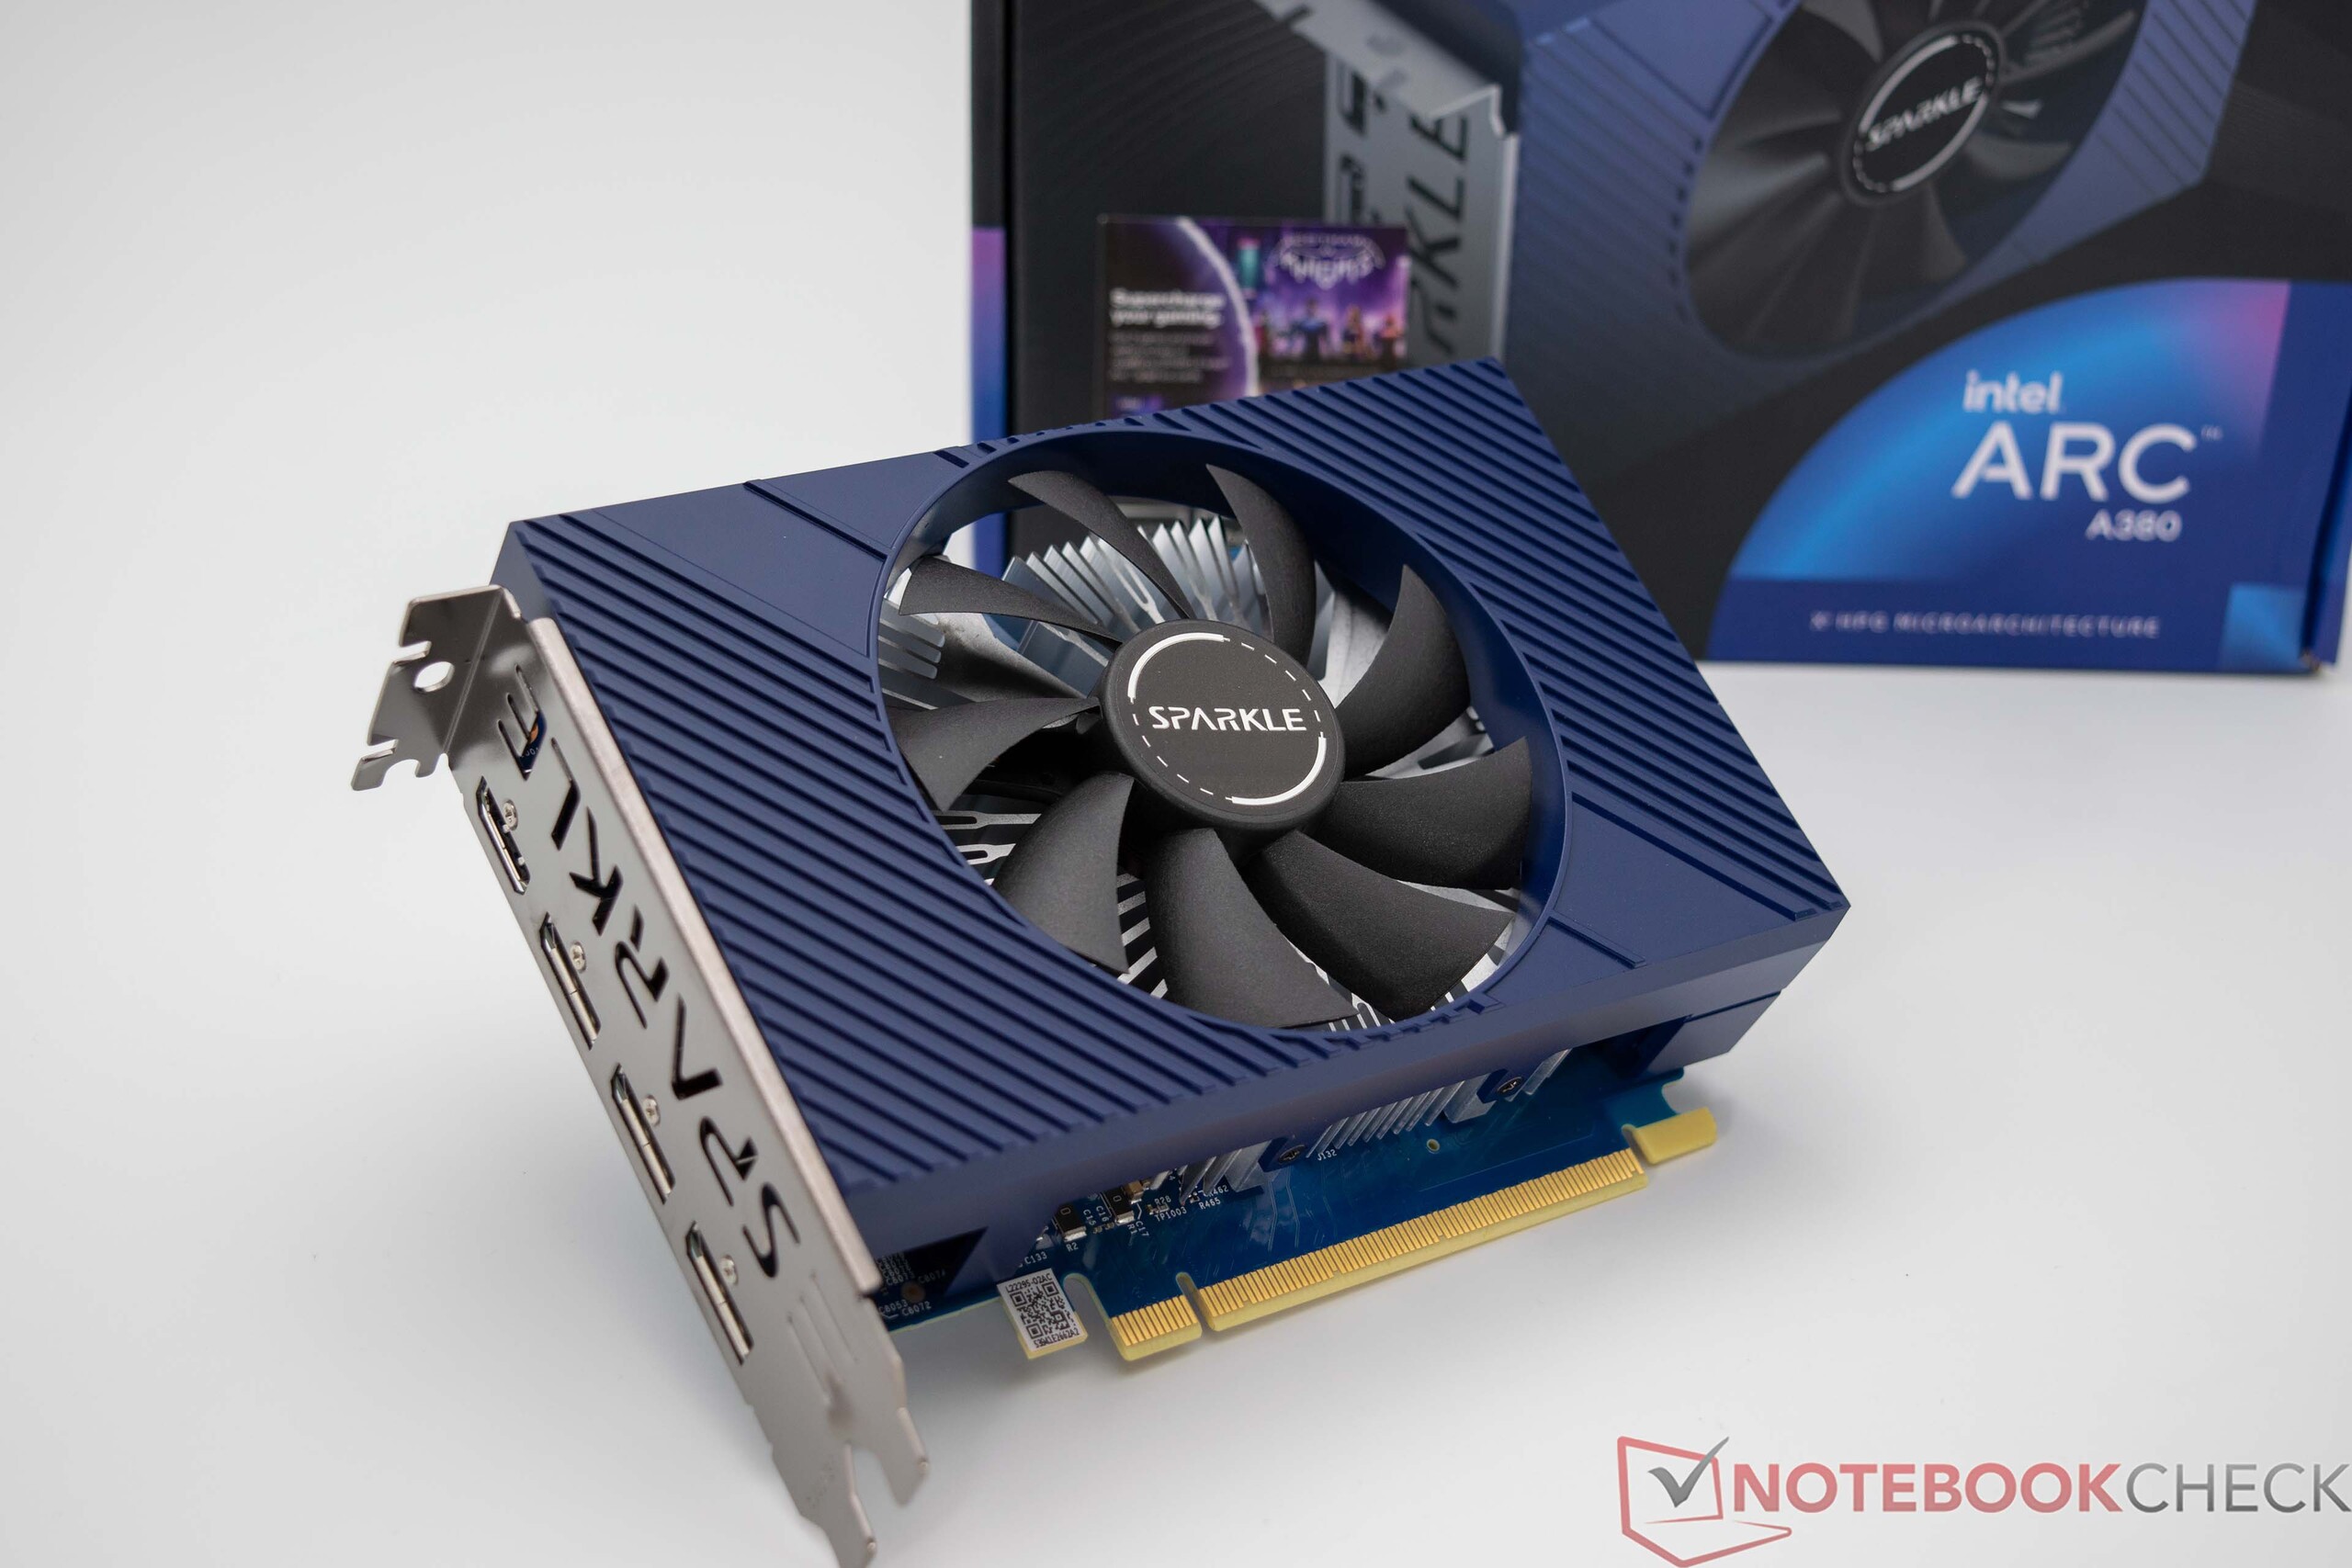
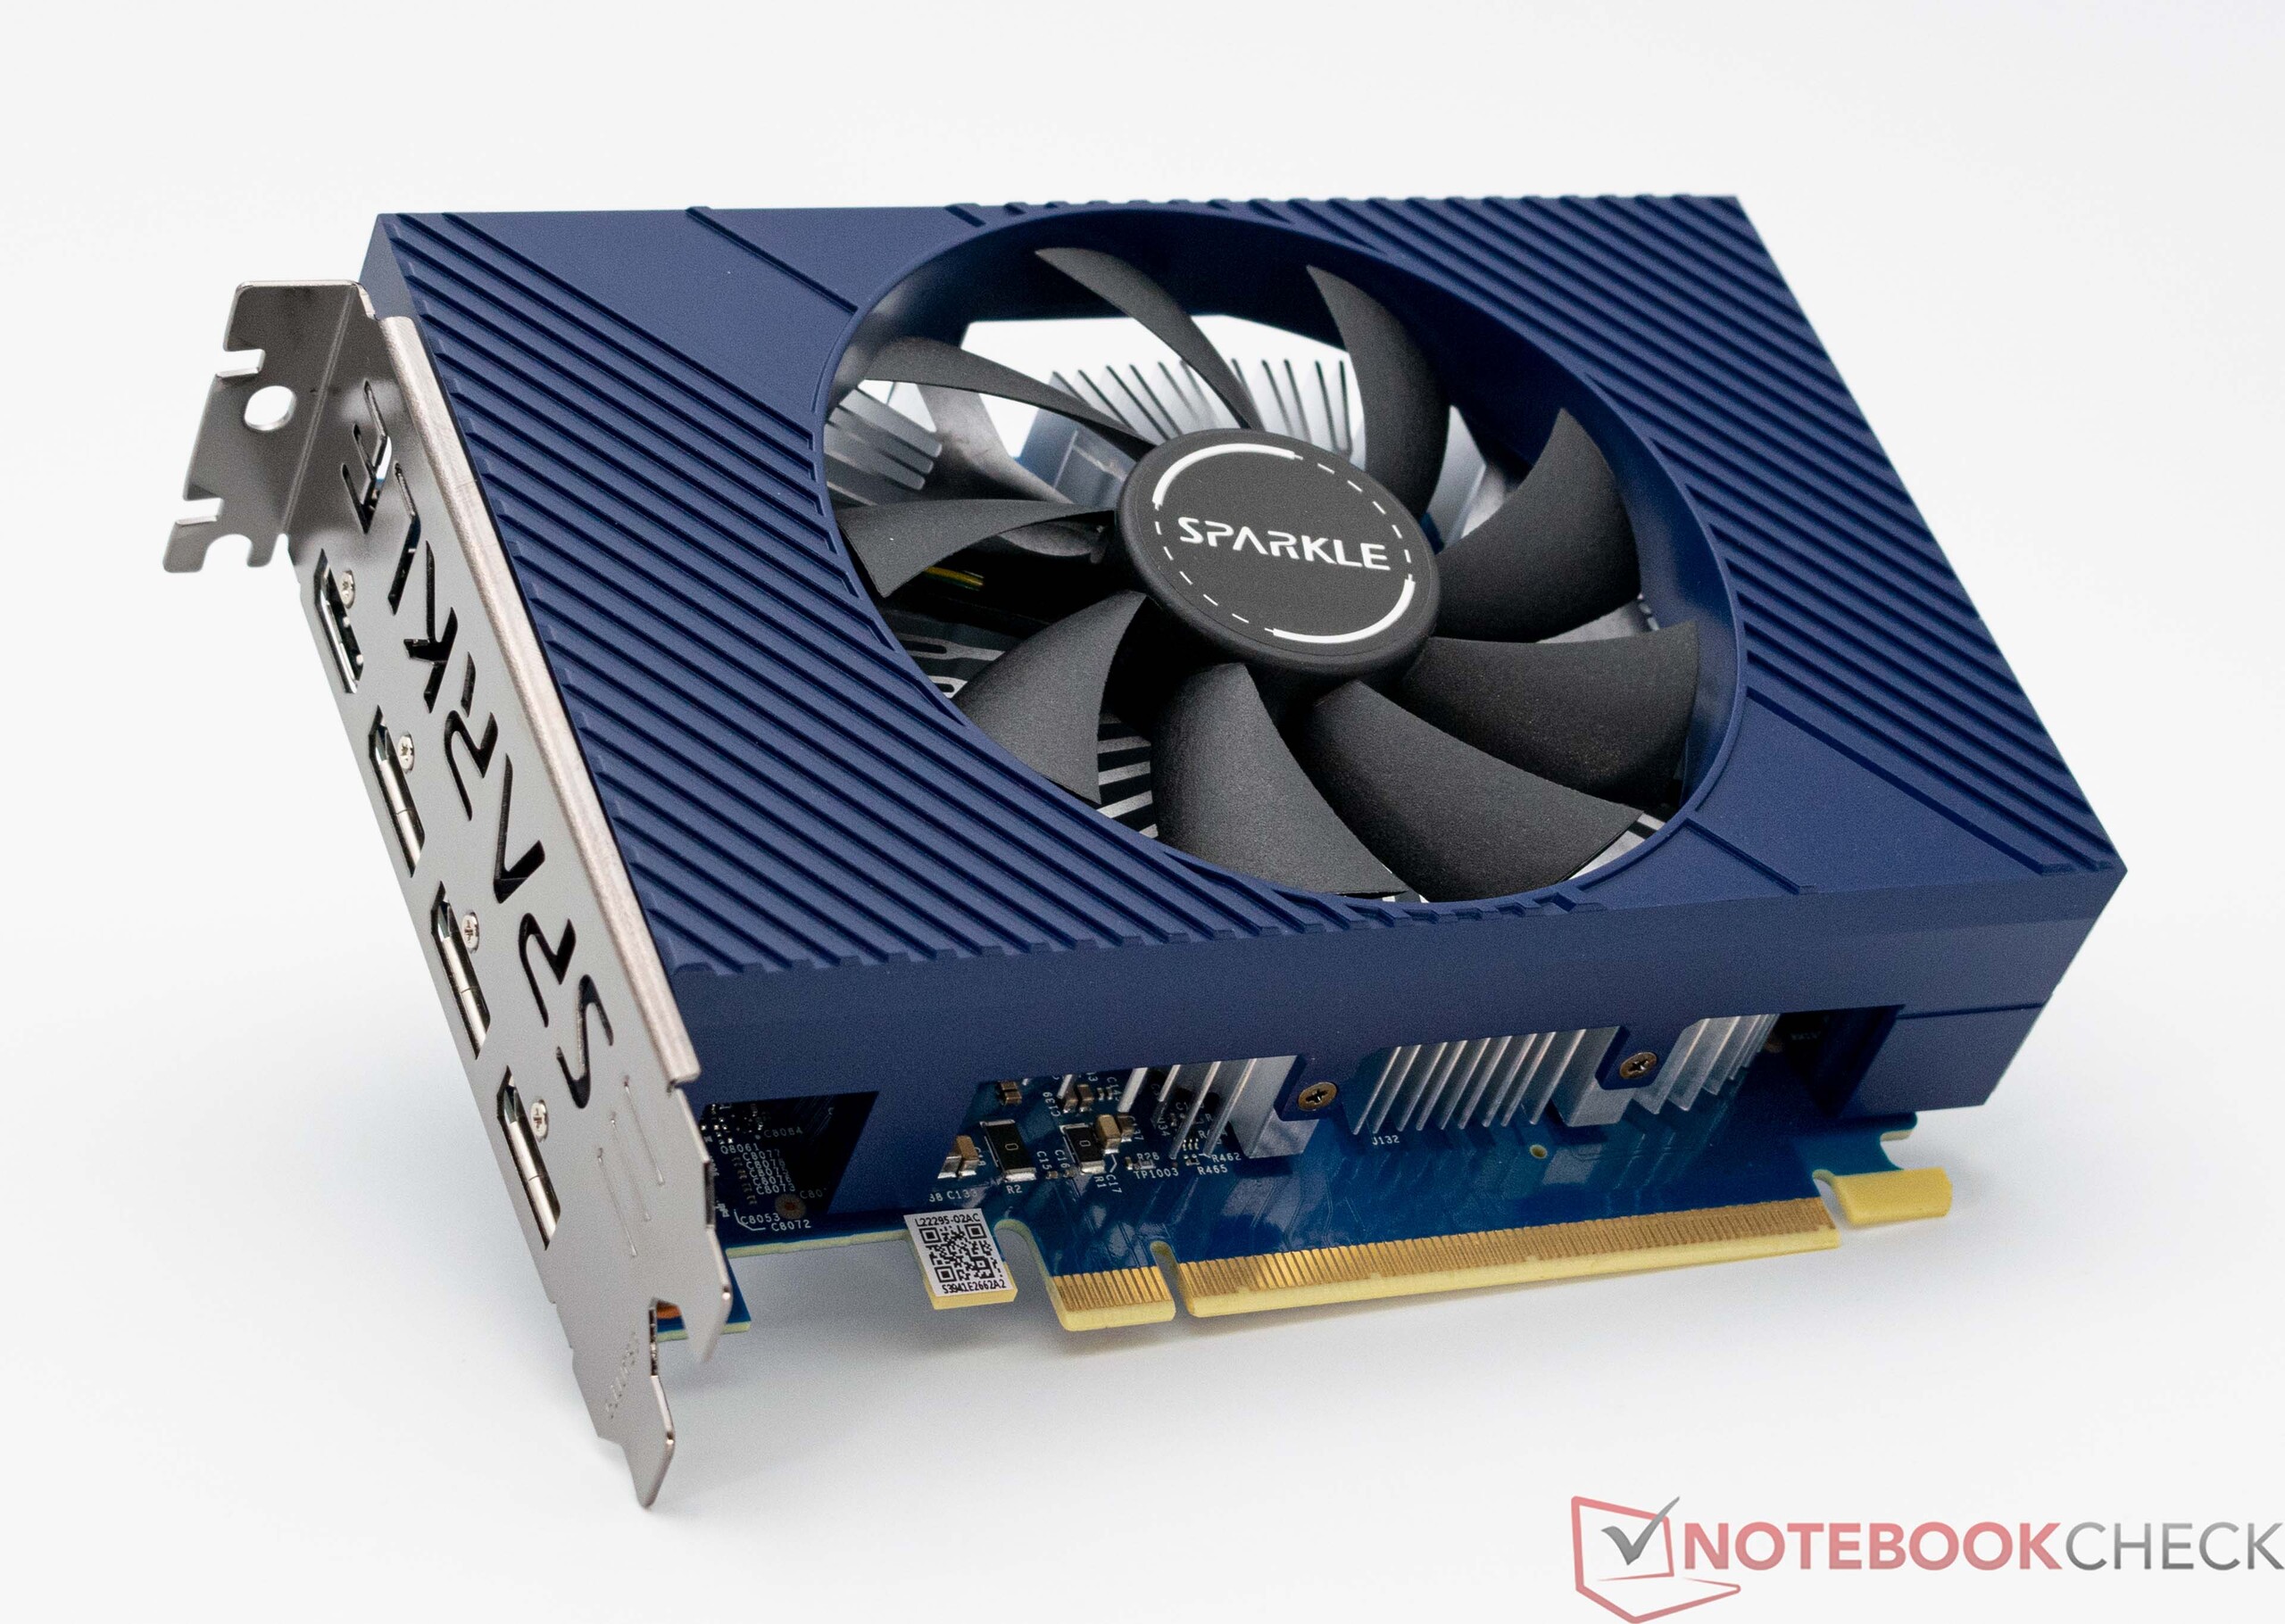
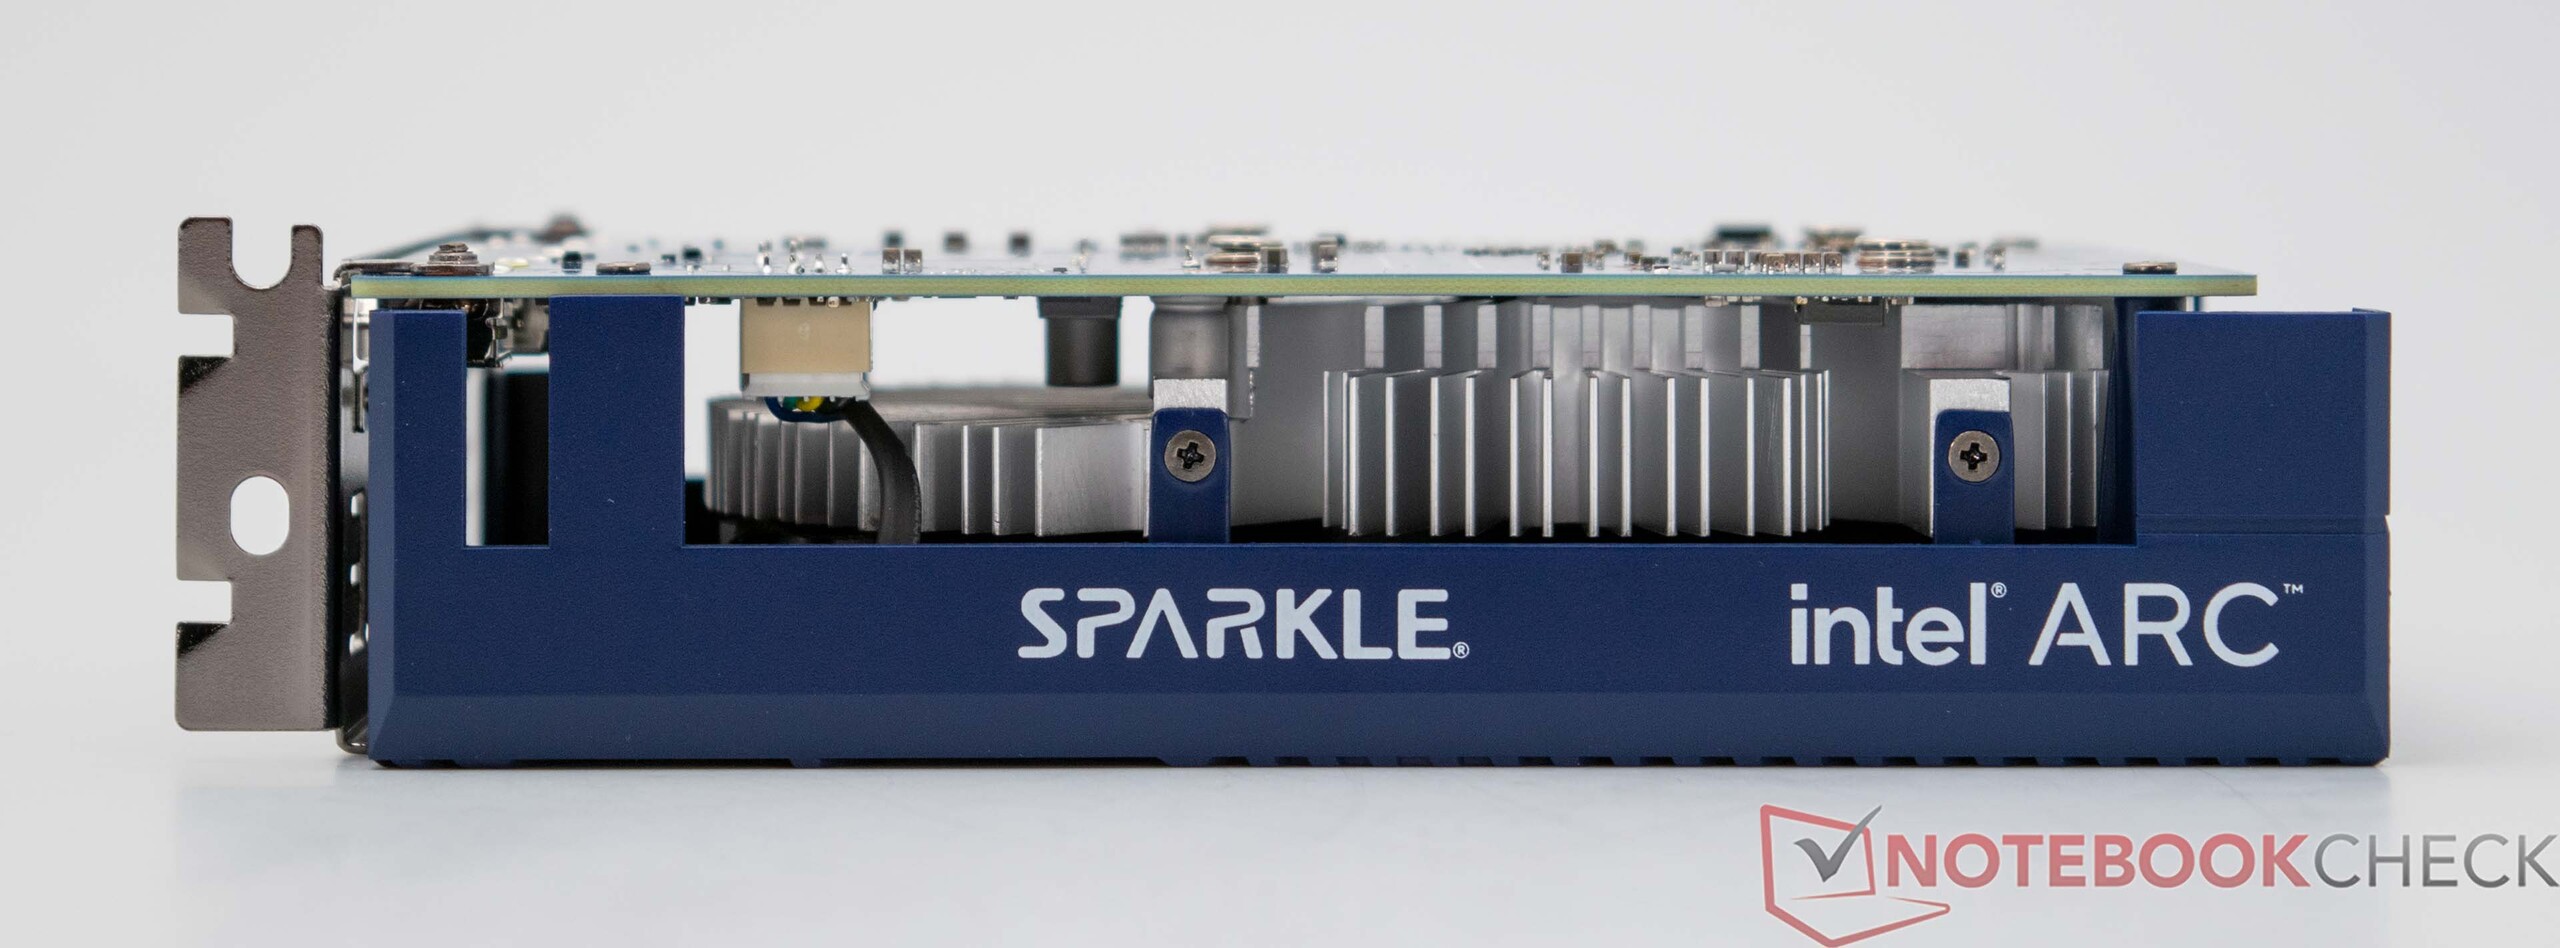
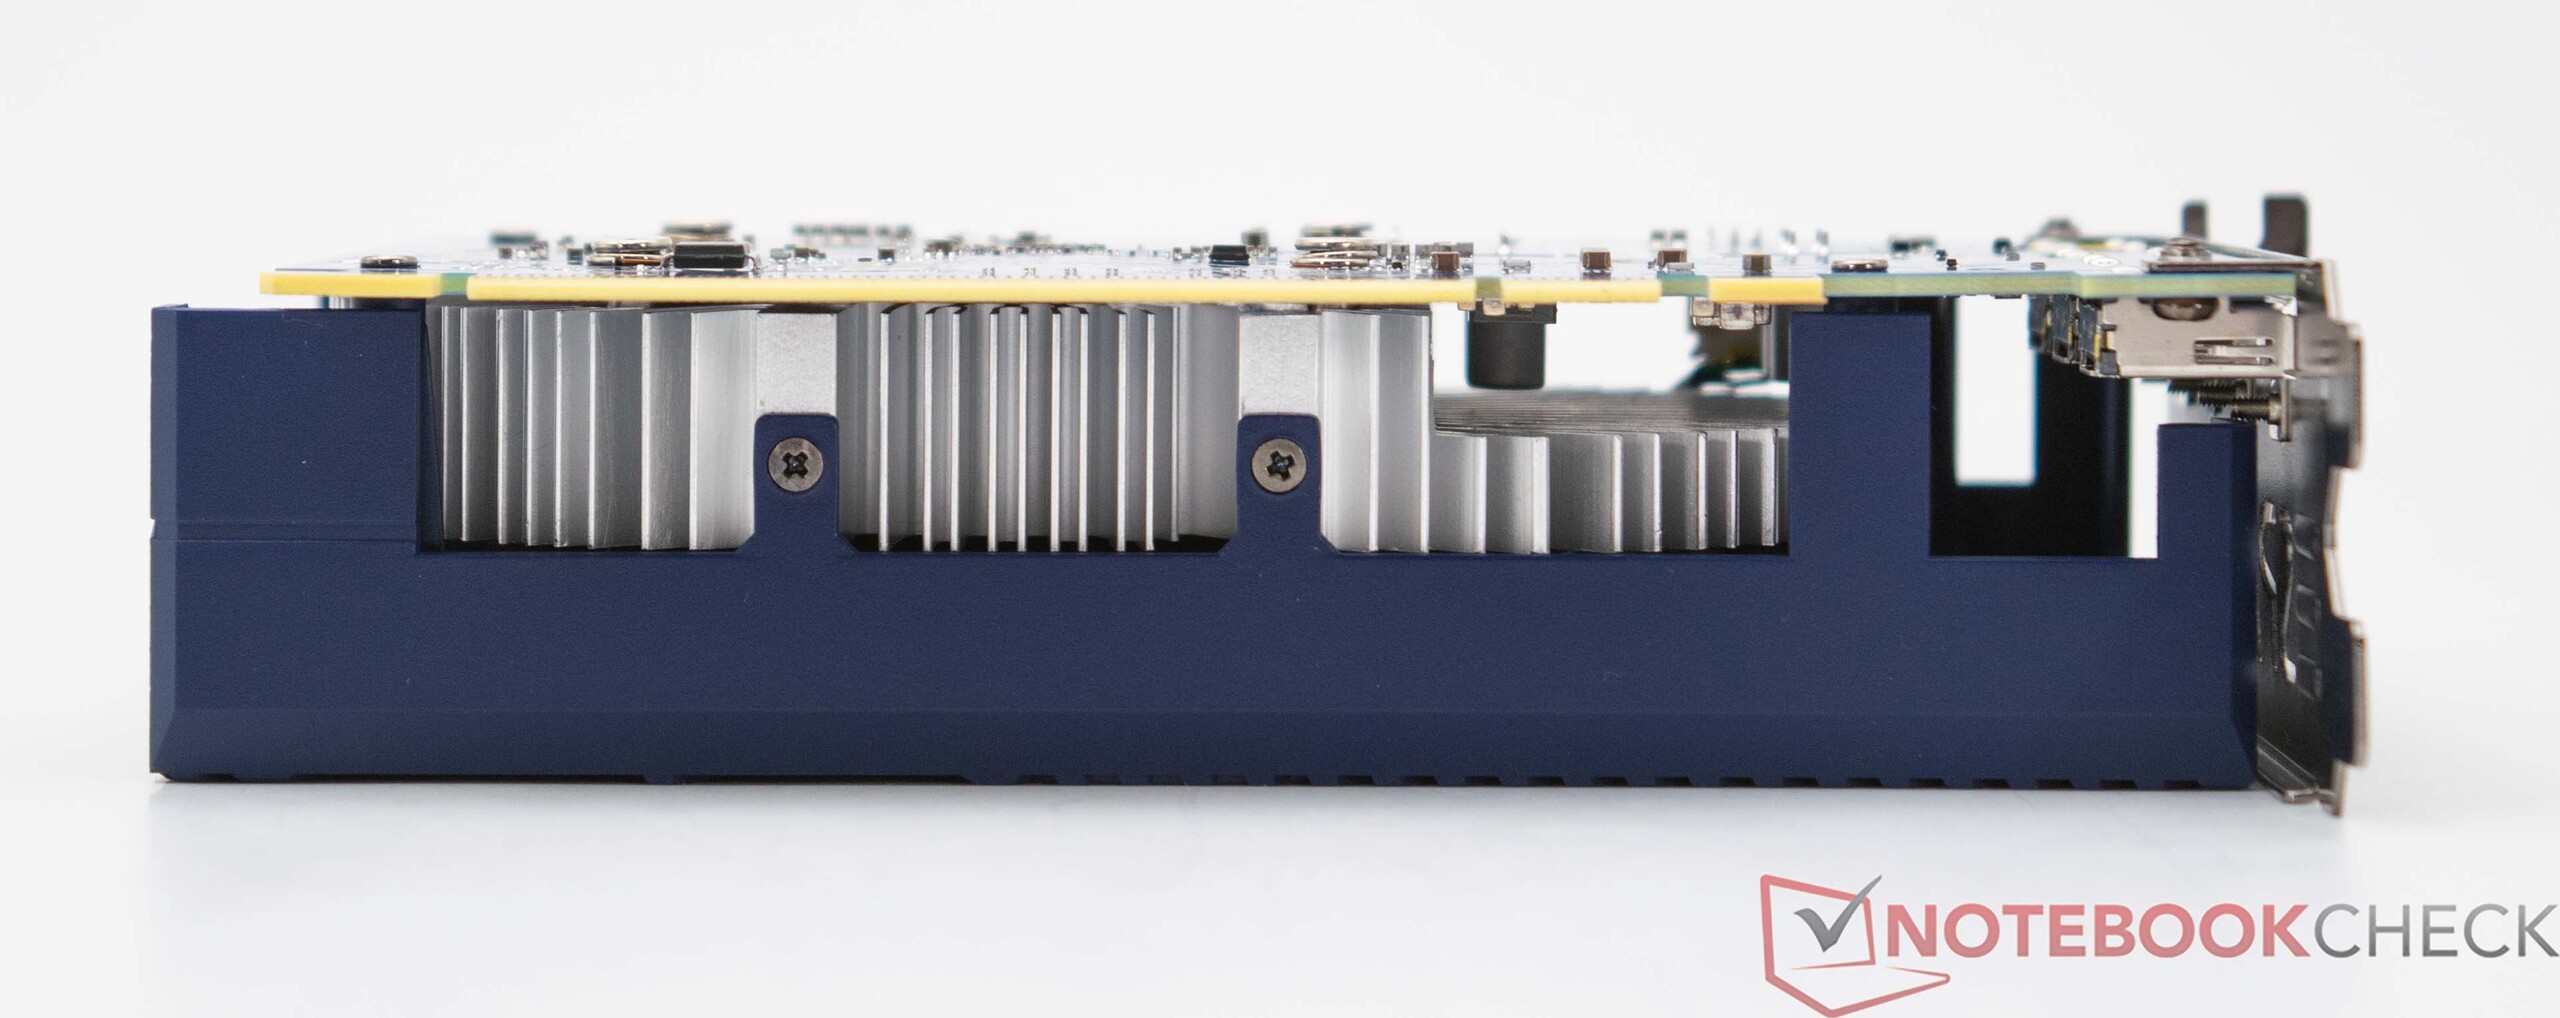
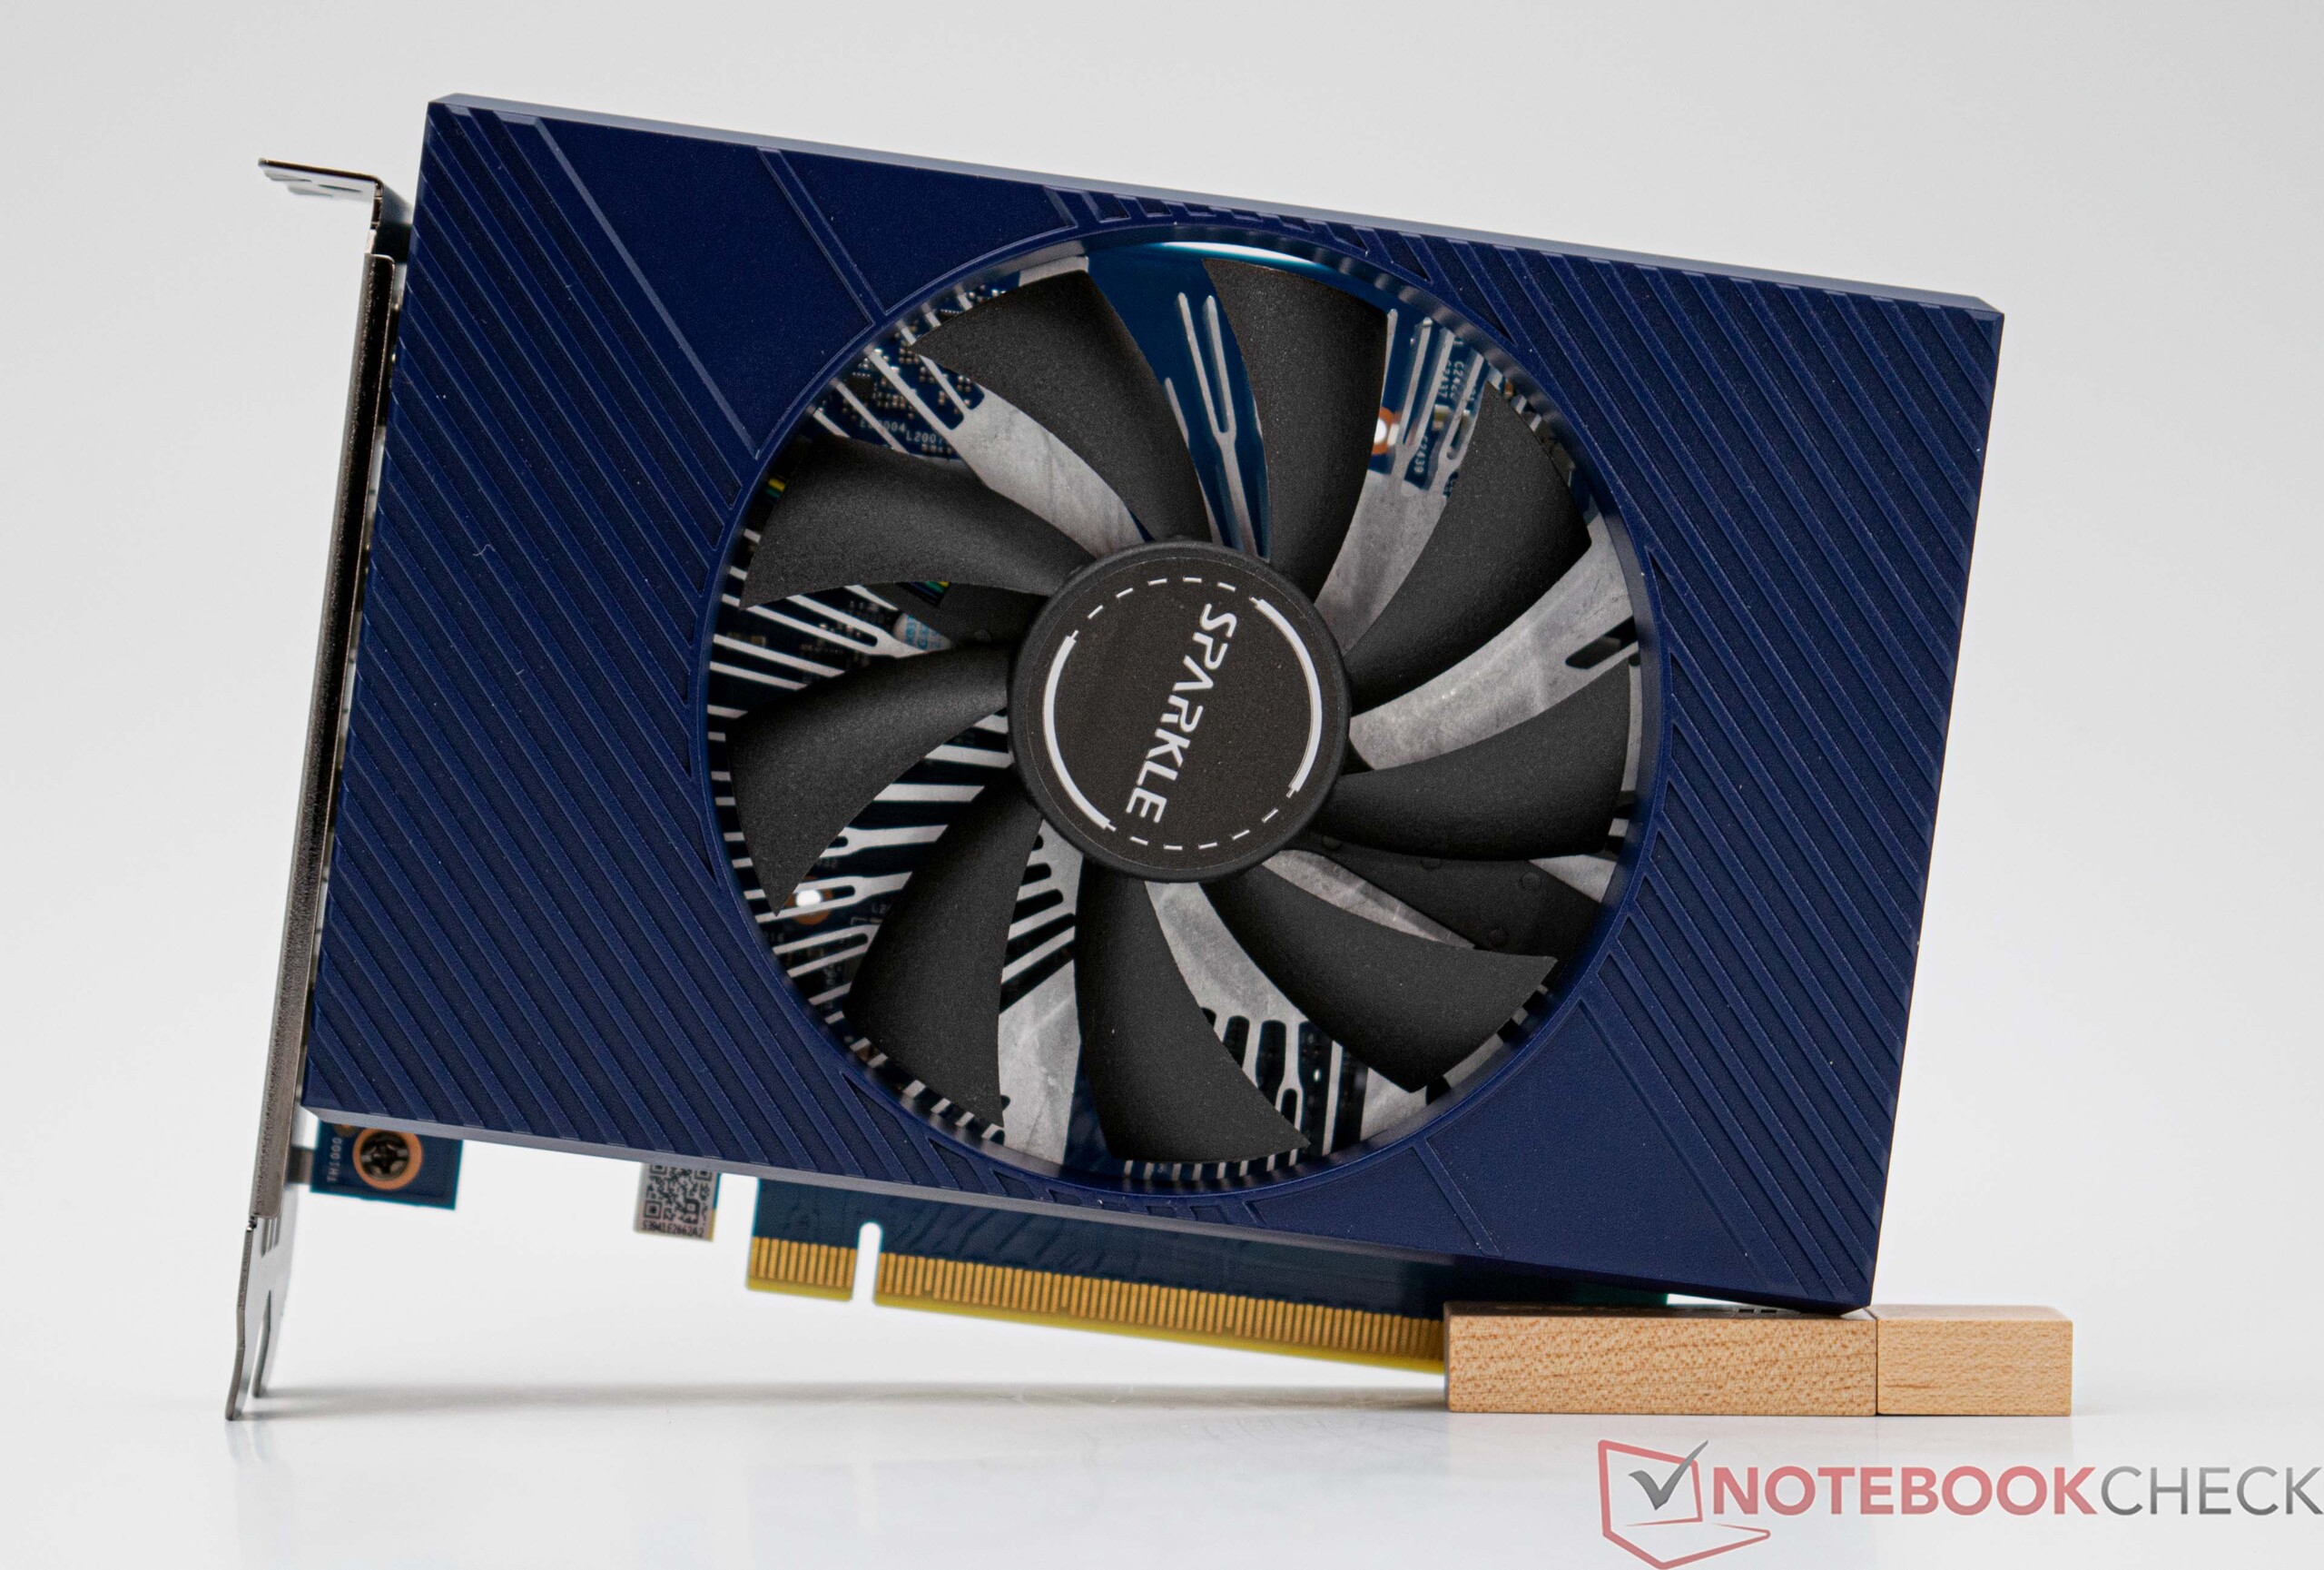
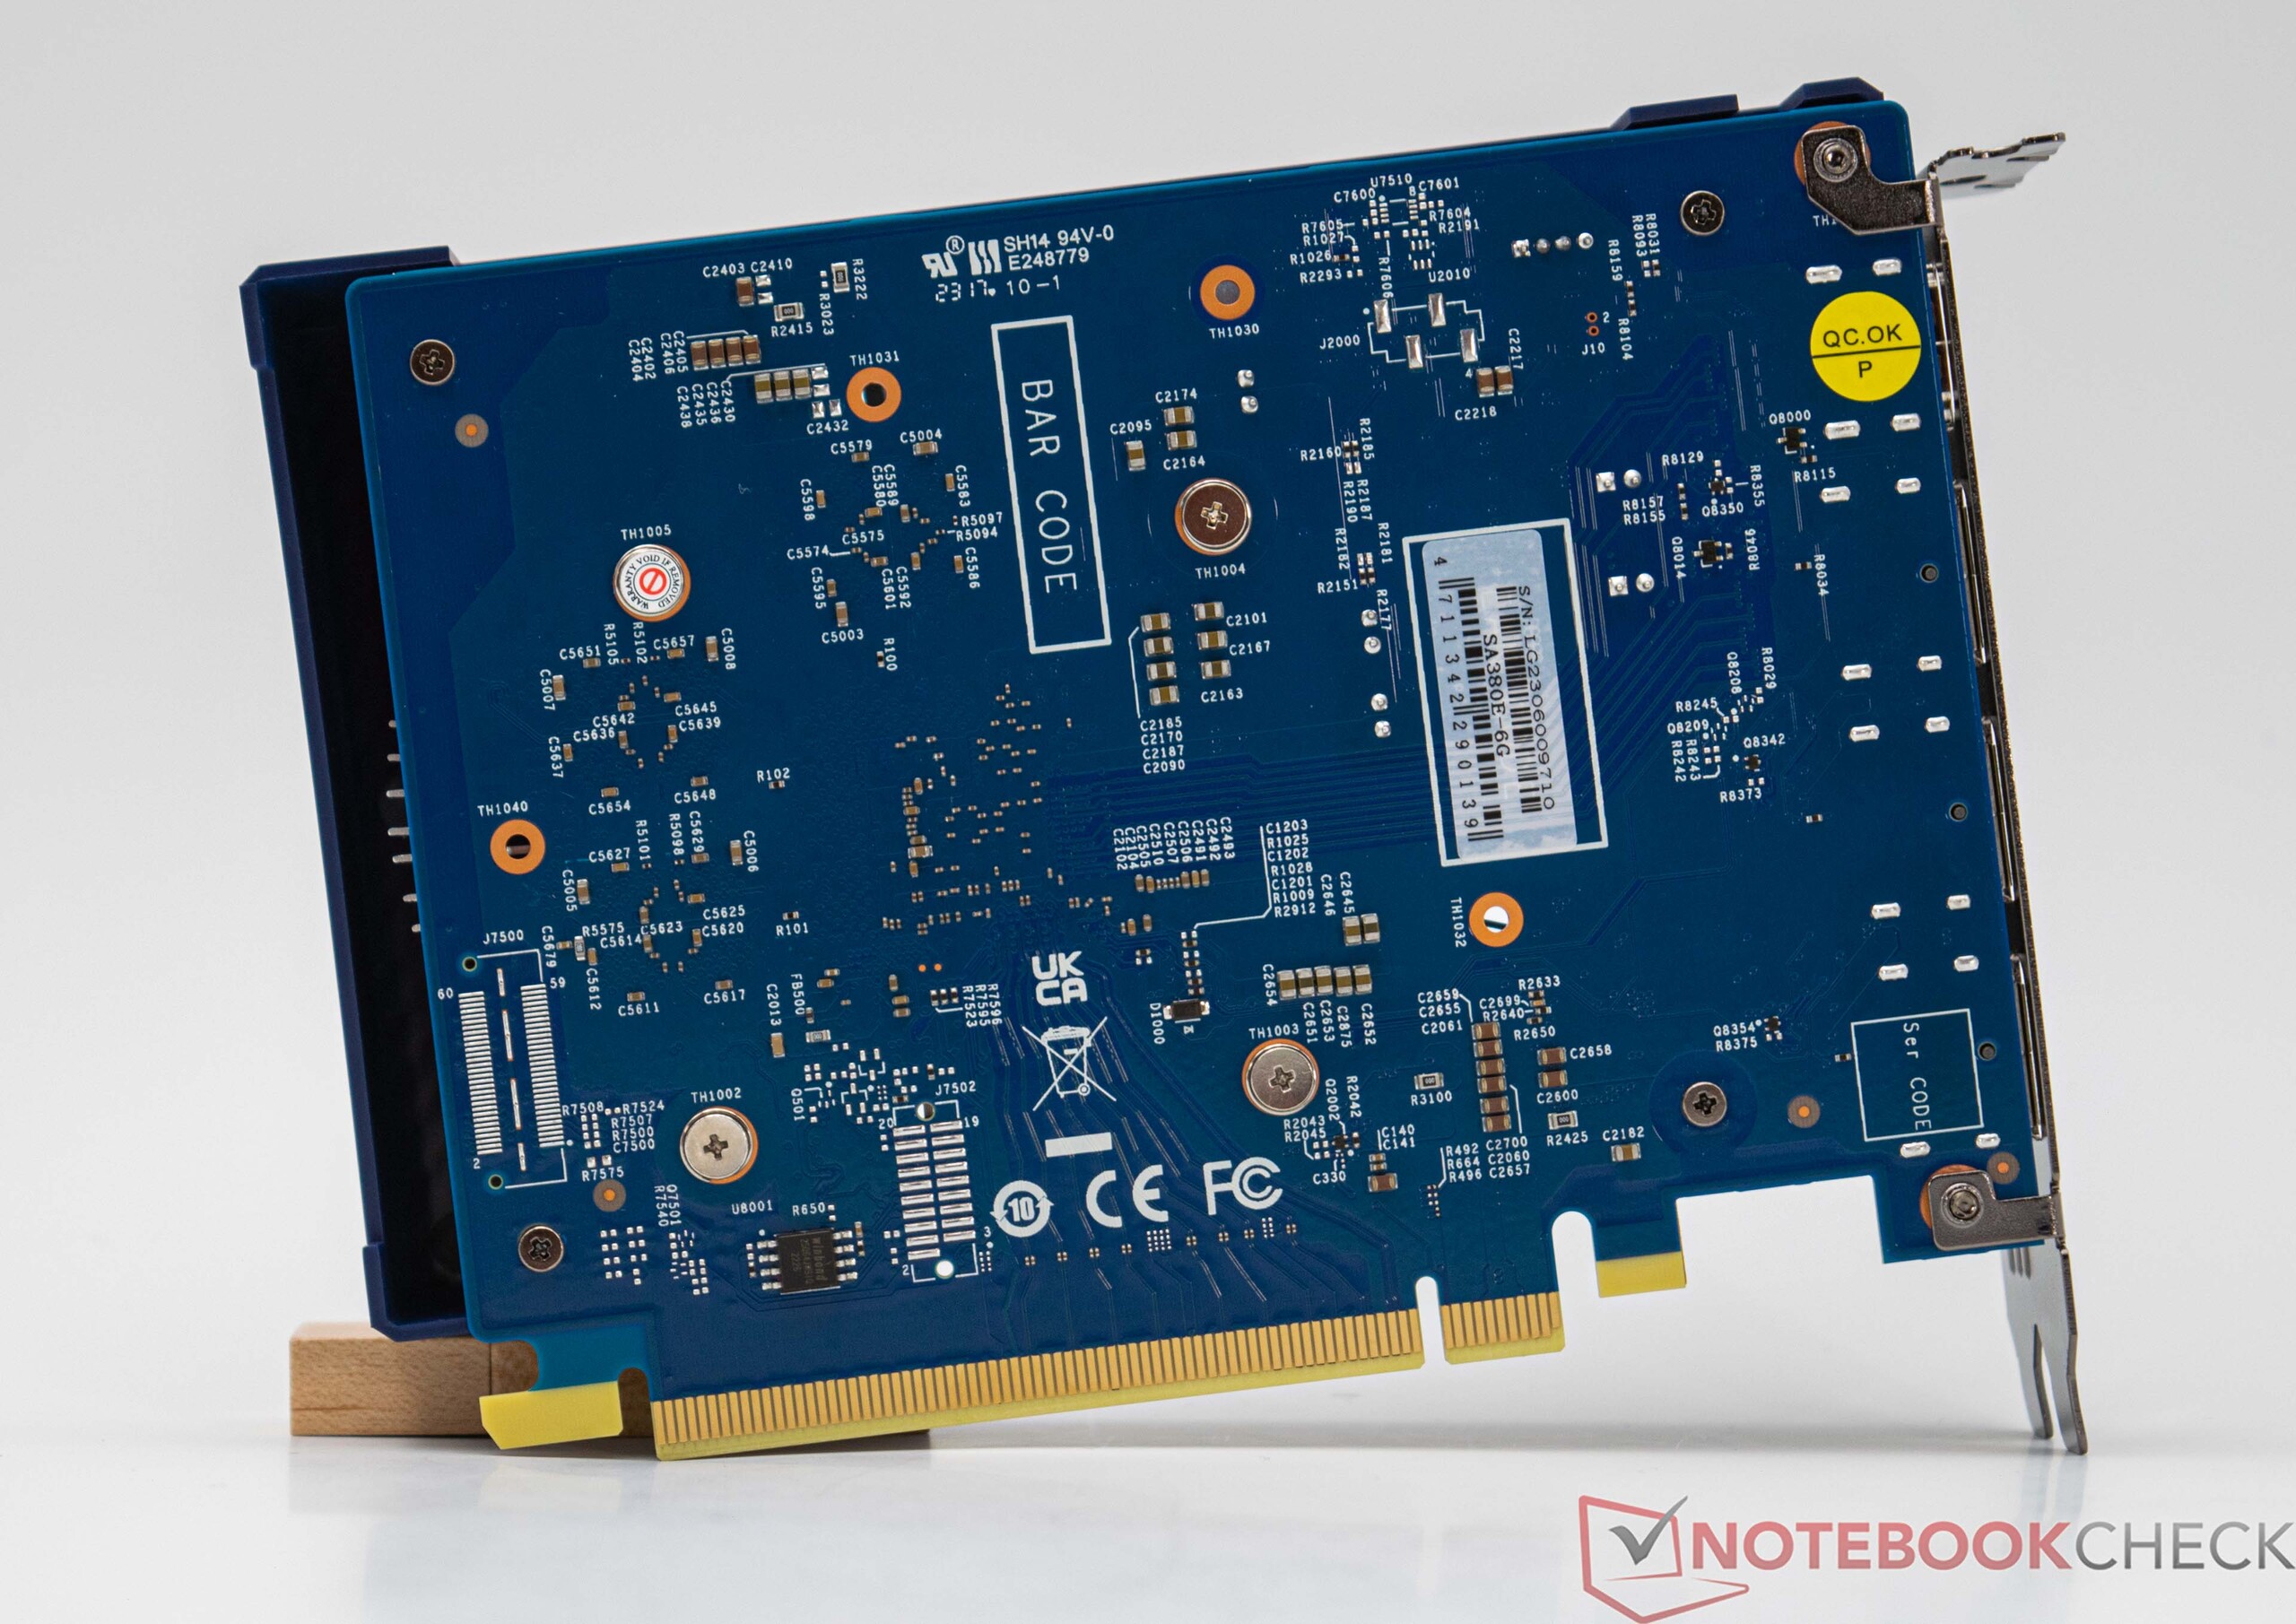
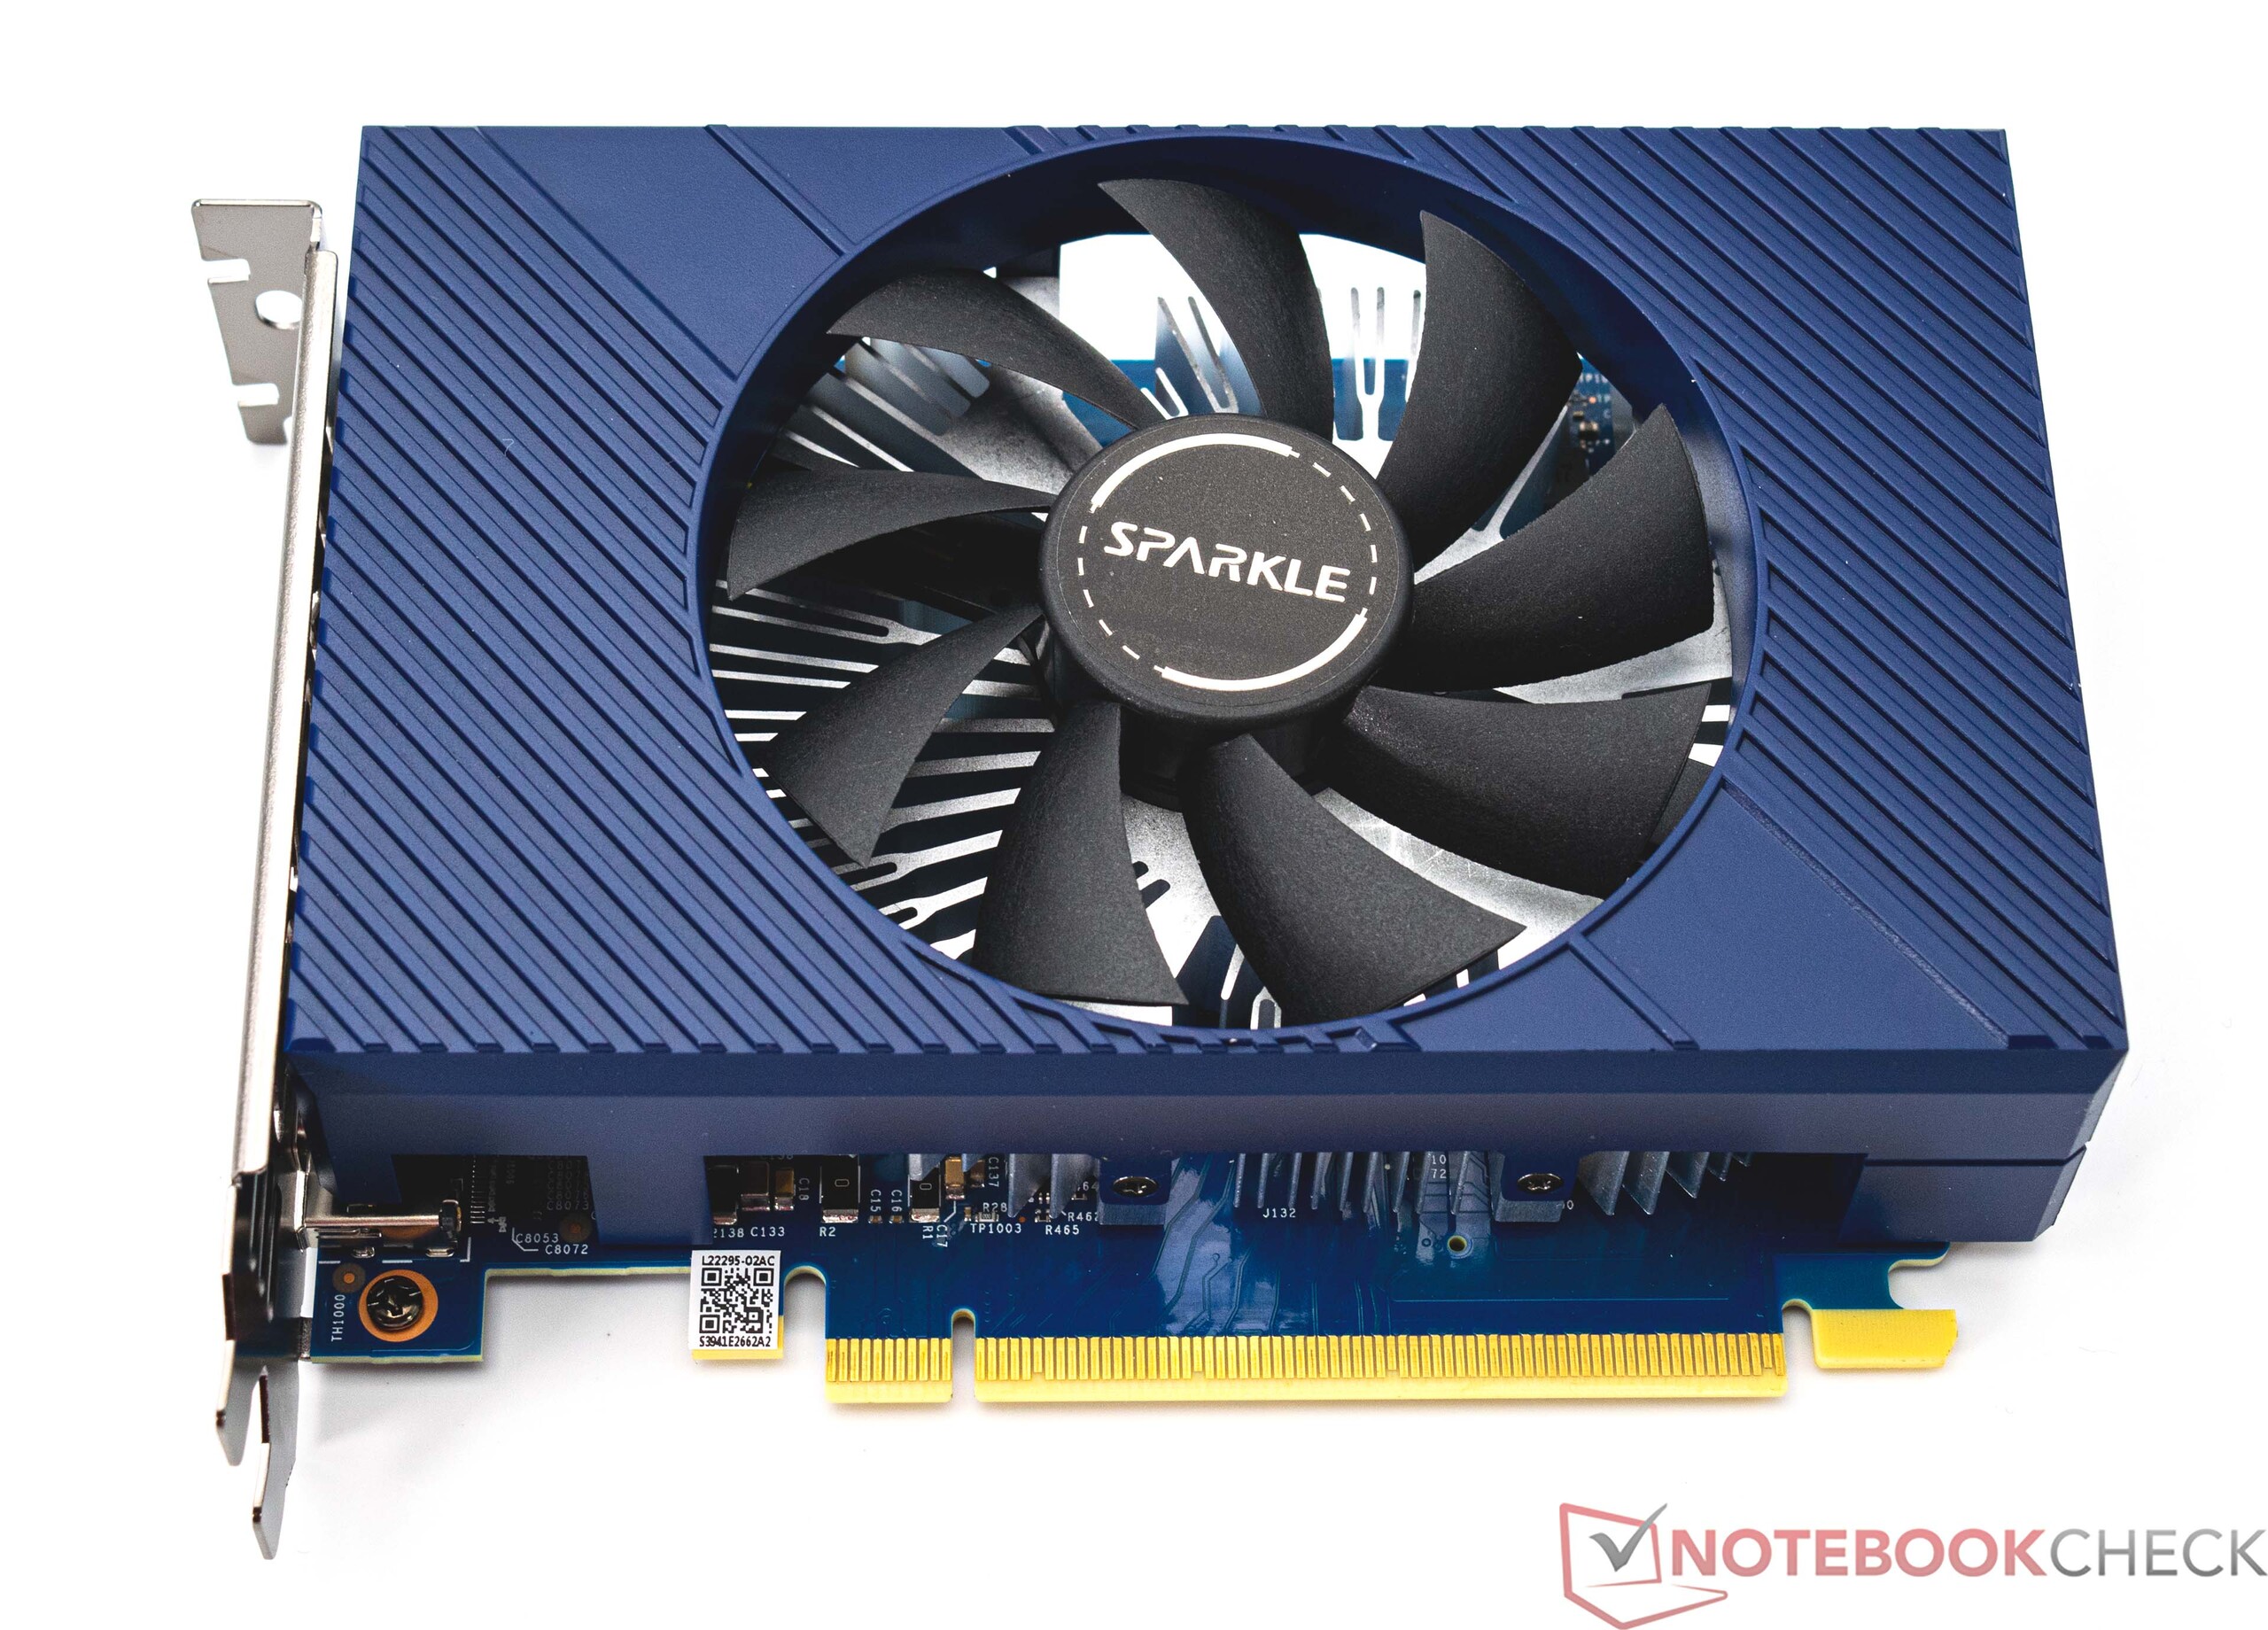
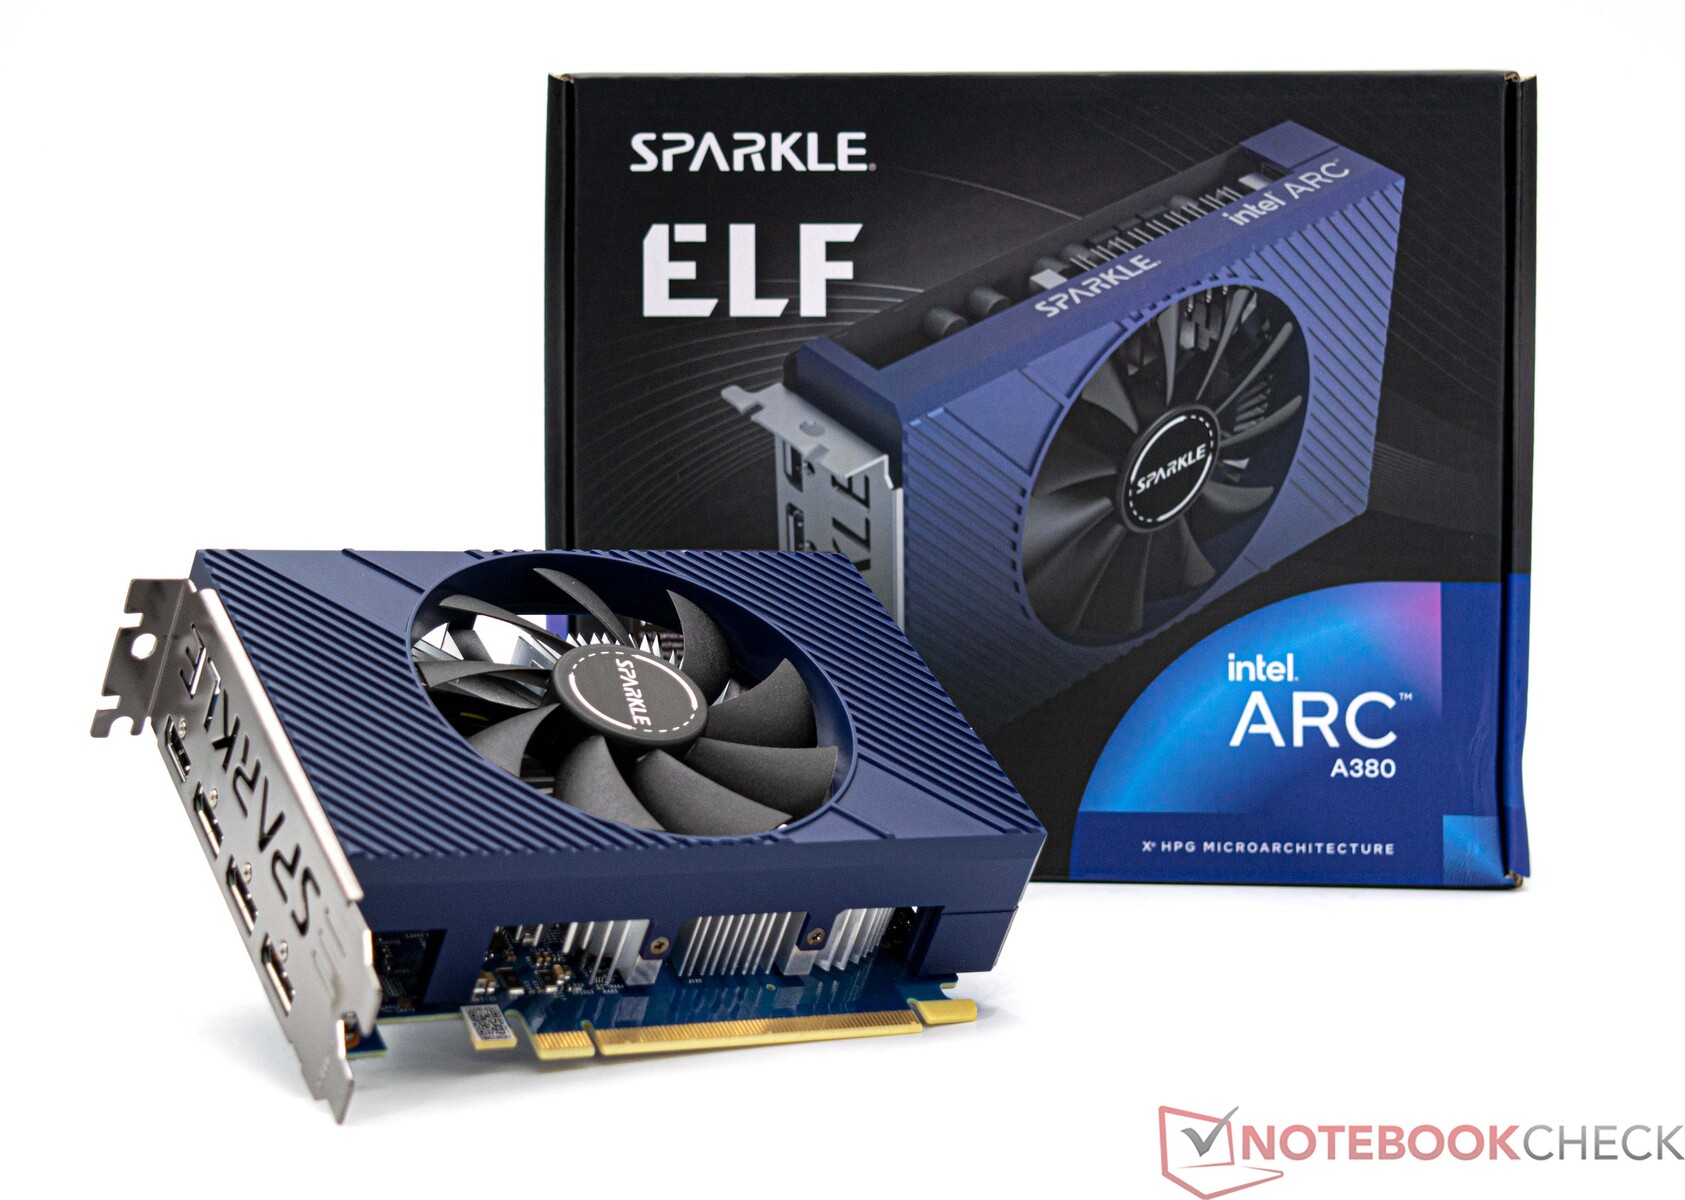
In this review, we take a closer look at the performance of the Sparkle Arc A380 Elf. Our test unit is short and only minimally longer than the PCIe slot, which makes the graphics card very well suited for small Mini-ITX systems. The model is equipped with an axial fan that provides the short dual-slot graphics card with cool air. Visually, the card is kept in a blue design that is shared by the whole model palette of the Intel graphics cards from Sparkle. However, you can still see and feel the low purchase price of the Sparkle Arc A380 Elf, since the front is completely made from plastic, and there is no back plate.
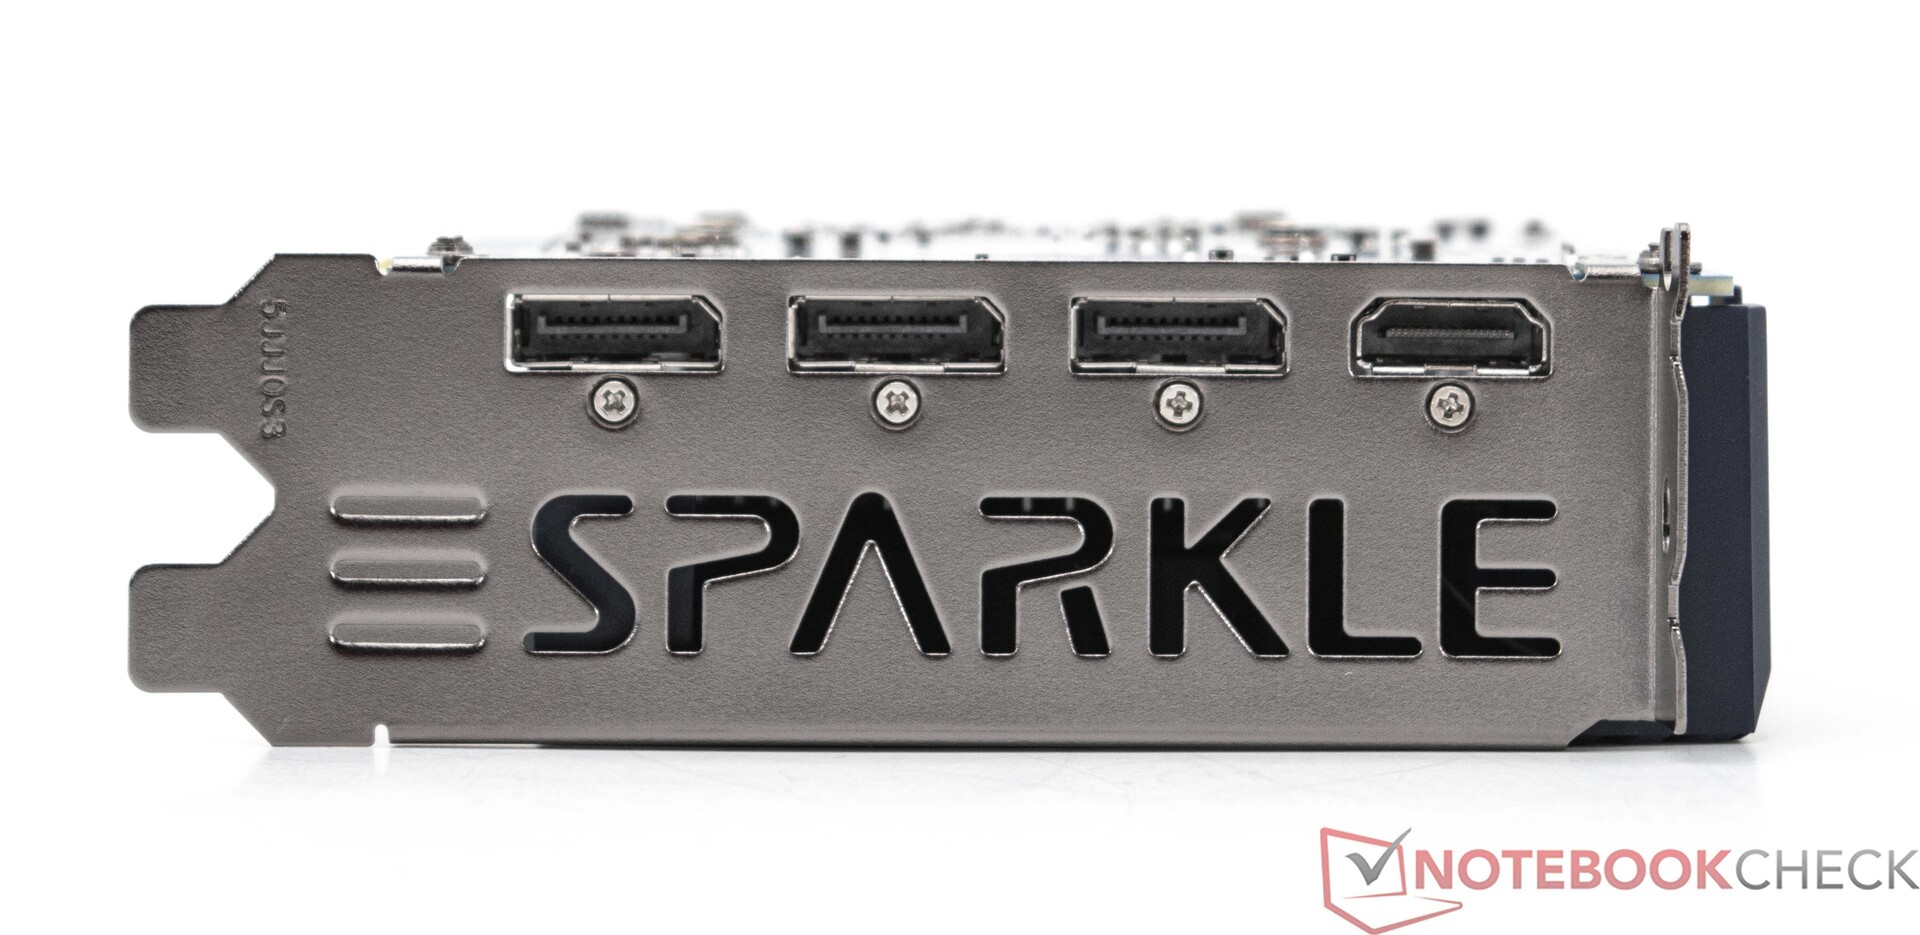
The efficient Sparkle Arc A380 Elf doesn't need an additional power connection, and all of the power is provided exclusively by the PCIe slot. In terms of external connections, in addition to the HDMI 2.0 port, we also see three DisplayPort 2.0 connections in our test unit. With this, even the affordable Intel model offers slightly better external connection equipment compared to Nvidia. At this point, AMD already offers DisplayPort 2.1 with its RX 7000 models.
Infos on our Test System
Sparkle Arc A380 Elf in Detail


Technical Data in Comparison
| Specifications | Intel Arc A770 | Intel Arc A750 | Intel Arc A580 | Intel Arc A380 | Radeon RX 7700 XT | Radeon RX 7600 | RTX 4060 Ti | RTX 4060 |
| GPU | DG2-512 | DG2-512 | DG2-512 | DG2-128 | Navi 32 XL | Navi 33 XL | AD106 | AD107 |
| Manufacturing Process | 6 nm | 6 nm | 6 nm | 6 nm | 5/6 nm | 6 nm | TSMC 4N | TSMC 4N |
| Shading Units | 4,096 | 3,584 | 3,072 | 1,024 | 3,456 | 2,048 | 4,352 | 3,072 |
| Texture Mapping Units | 256 | 224 | 192 | 64 | 216 | 128 | 136 | 96 |
| Ray Accelerators | 32 | 28 | 24 | 8 | 54 | 32 | 34 | 24 |
| GPU Boost Clock | 2,400 MHz | 2,400 MHz | 2,000 MHz | 2,050 MHz | 2,544 MHz | 2,655 MHz | 2,460 MHz | 2,105 MHz |
| Cache | 16 MB | 16 MB | 8 MB | 4 MB | 48 MB | 32 MB | 32 MB | 24 MB |
| Memory Bus Width | 256-bit | 256-bit | 256-bit | 96-bit | 256-bit | 128-bit | 128-bit | 128-bit |
| Memory Bandwidth | 560 GB/s | 512 GB/s | 512 GB/s | 186 GB/s | 432 GB/s | 288 GB/s | 288 GB/s | 272 GB/s |
| Memory Size | 16 GB GDDR6 | 8 GB GDDR6 | 8 GB GDDR6 | 6 GB GDDR6 | 12 GB | 8 GB GDDR6 | 8 GB GDDR6 | 8 GB GDDR6 |
| TBP | 225 W | 225 W | 175 W | 75 W | 245 W | 165 W | 160 W | 115 W |
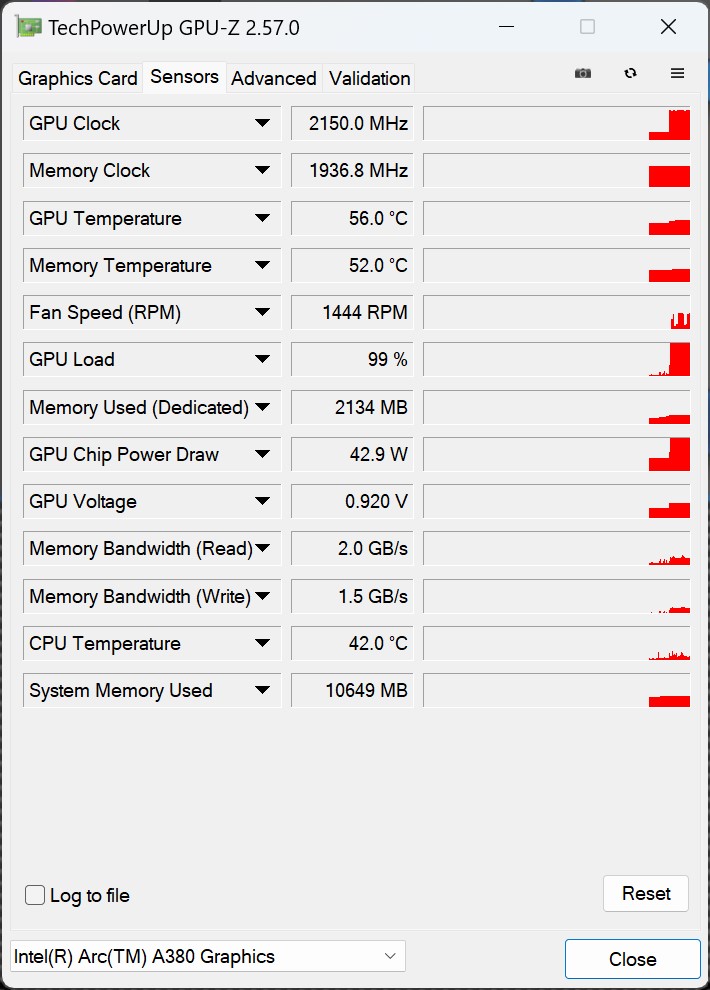
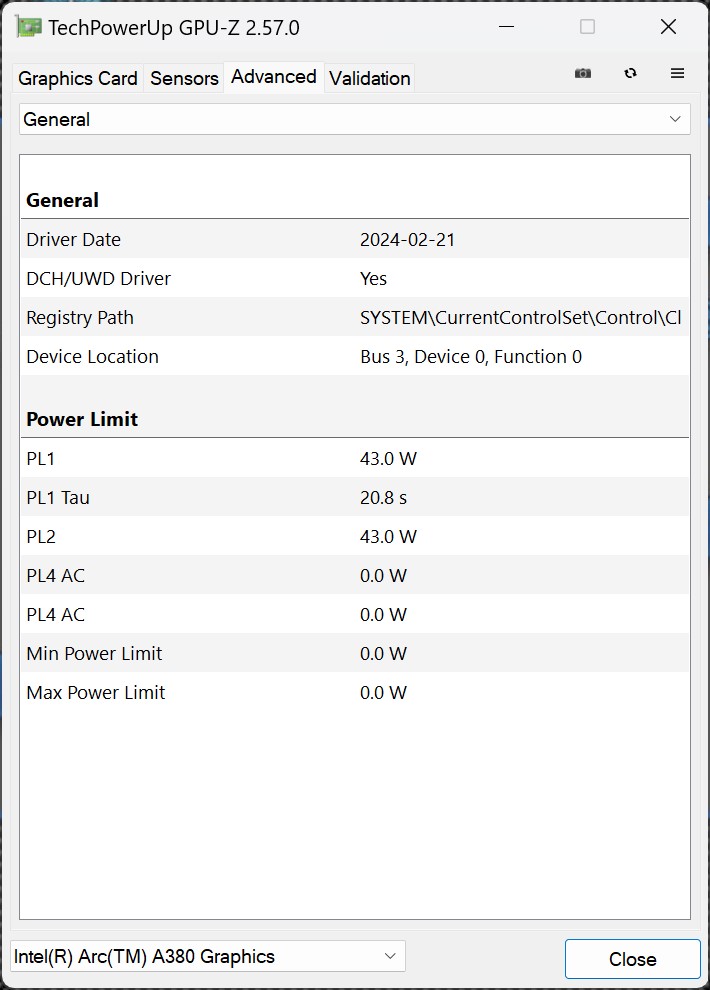
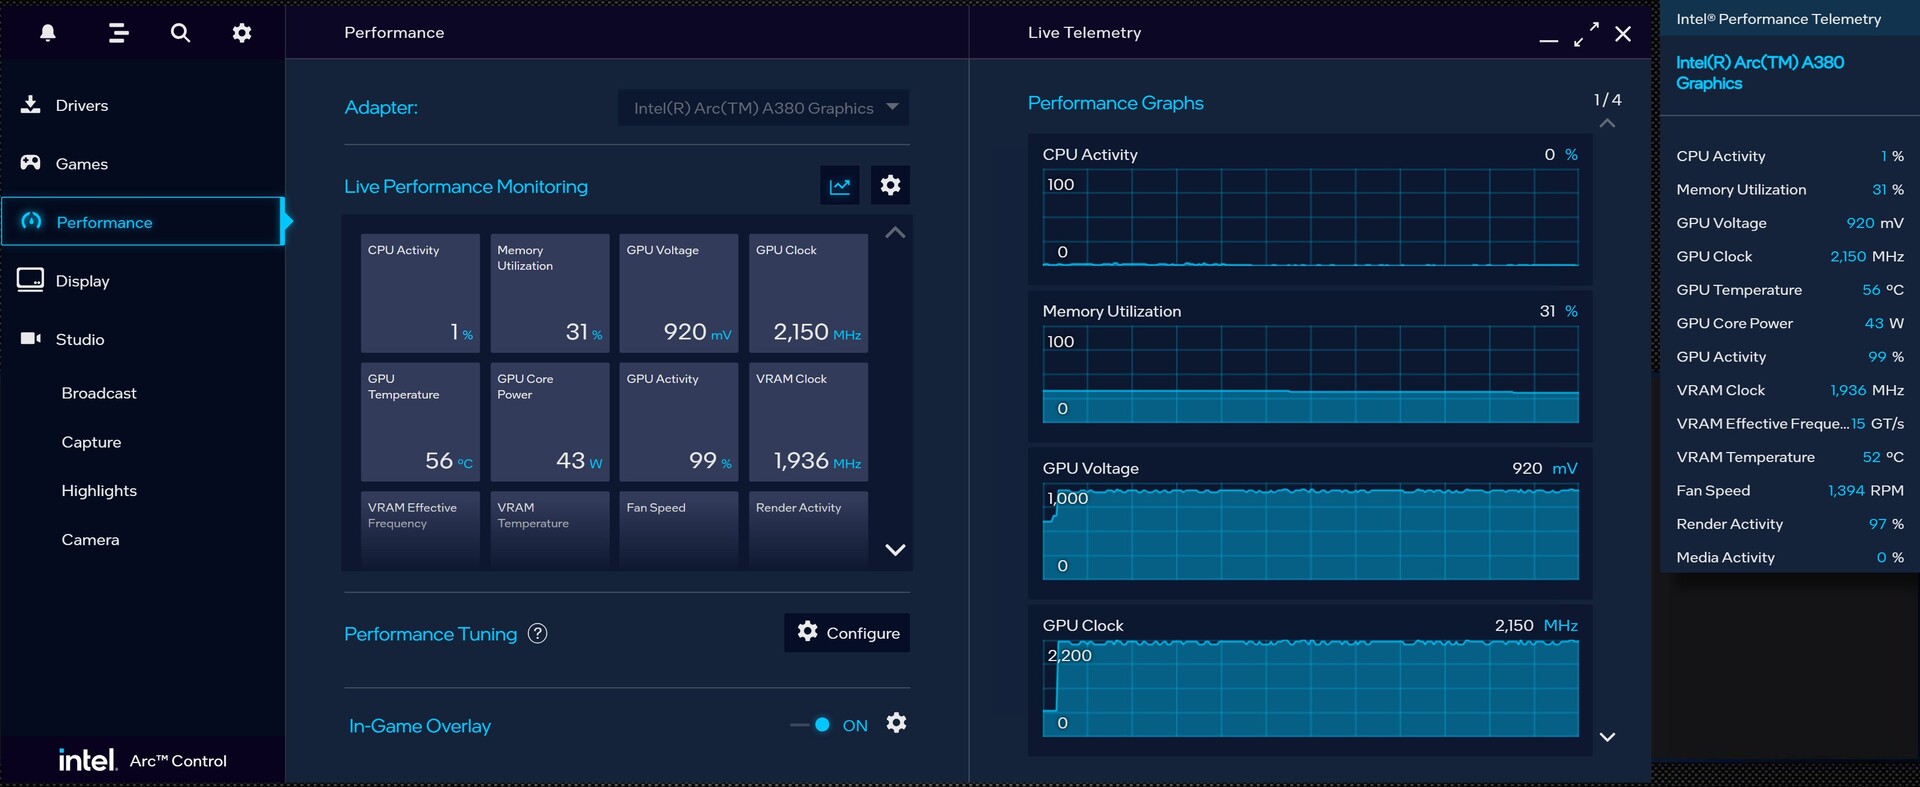
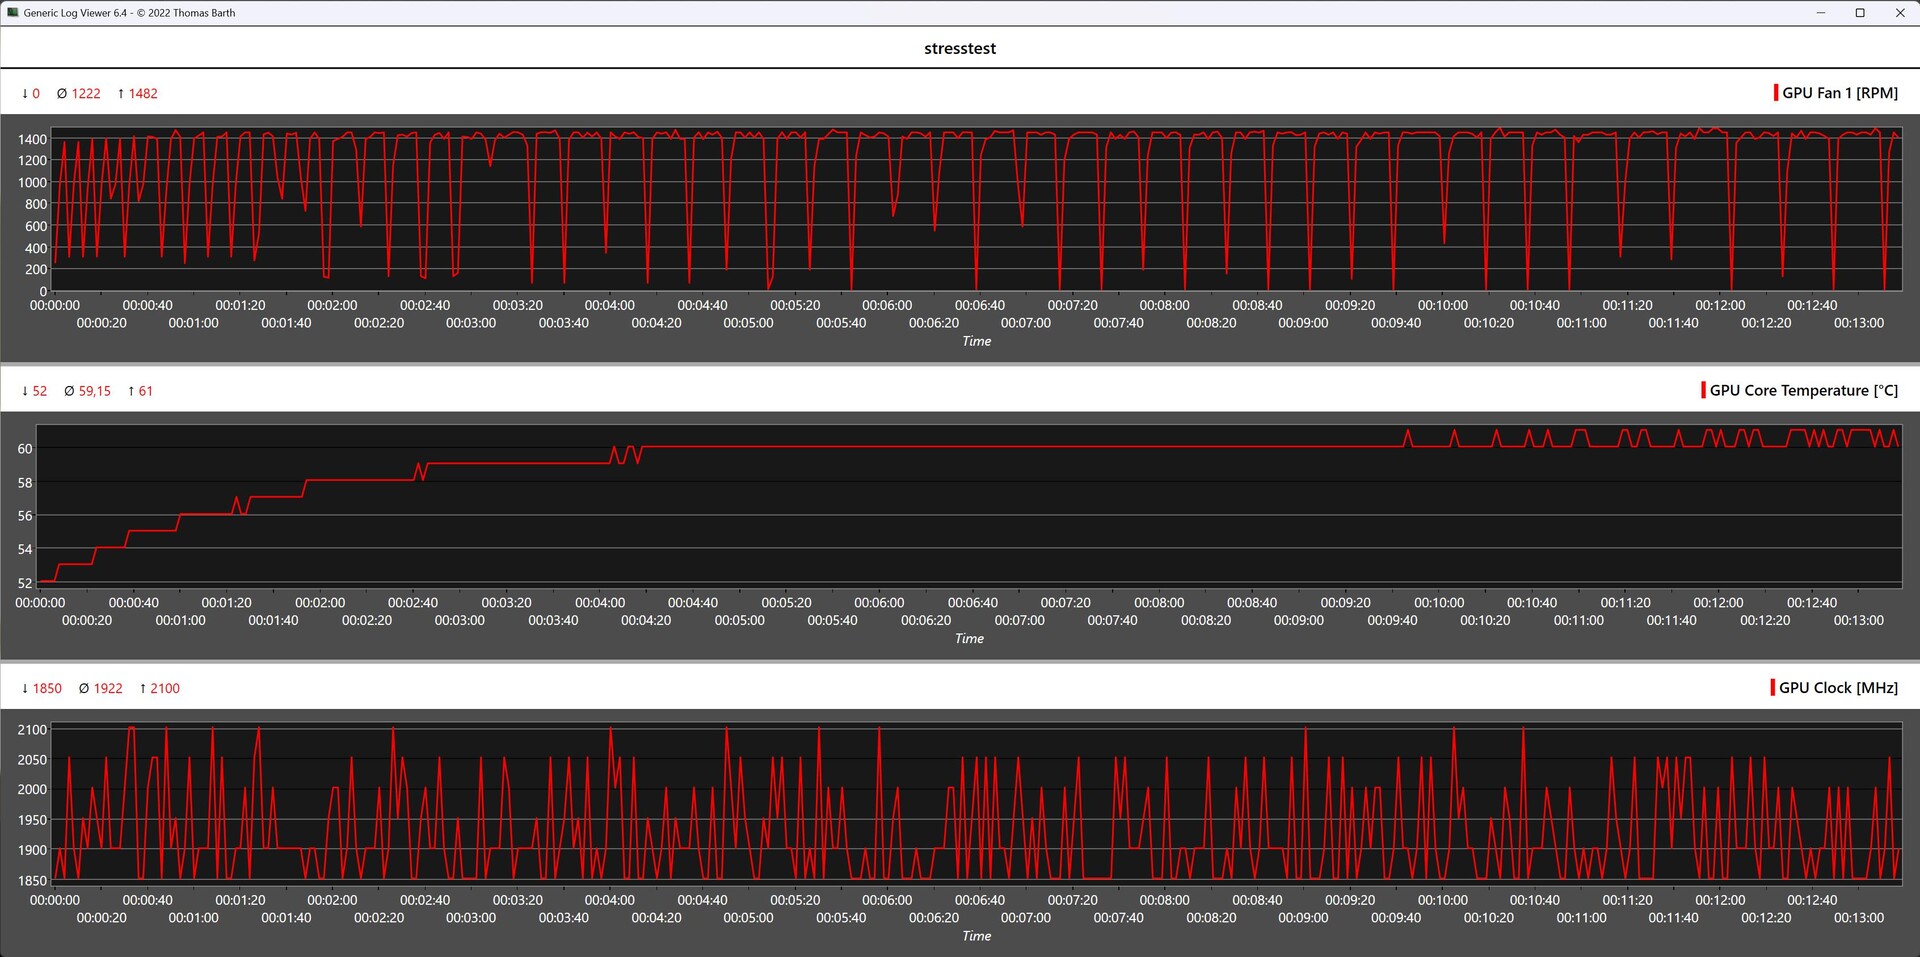
Clock Speeds of the Sparkle Arc A380 Elf
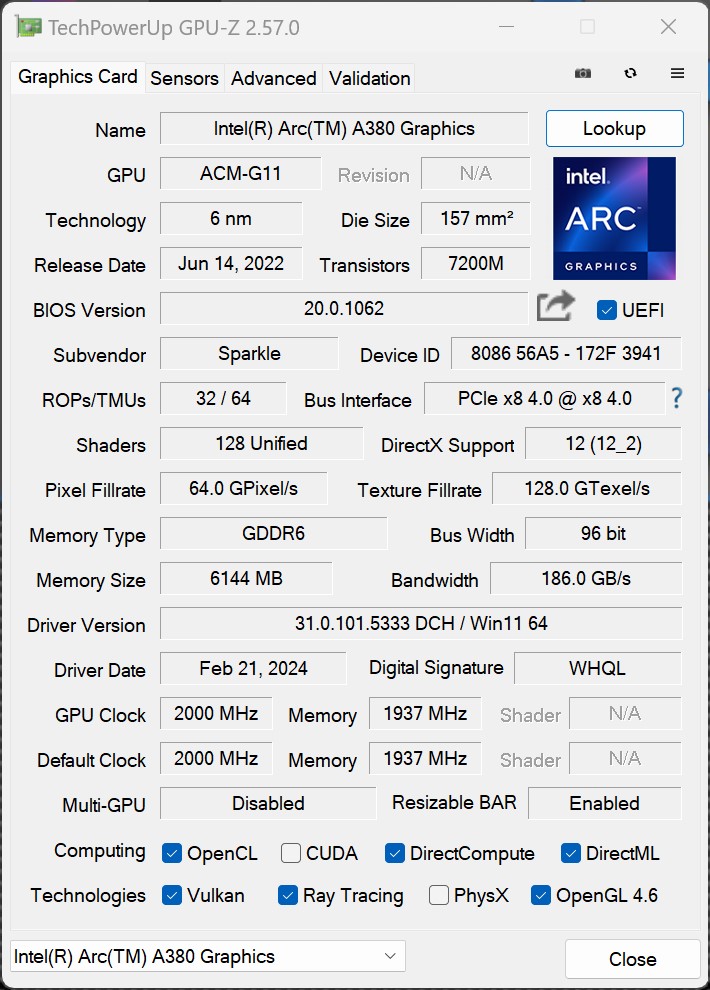
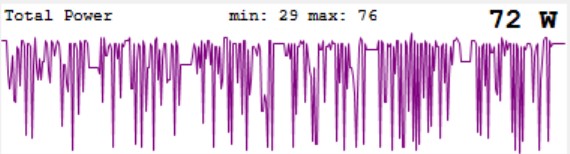
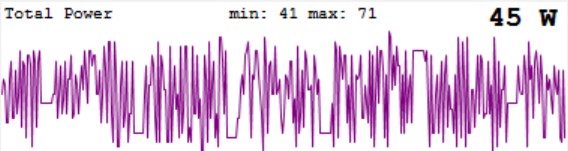
In terms of the clock speeds of the graphics chip and VRAM, Sparkle keeps to the specifications from Intel. Under load, we reach a GPU boost of up to 2,400 MHz, although this drops under longer load, leveling out at about 2,150 MHz. The Power Target of the Sparkle Arc A380 Elf is 43 watts and cannot be increased further.
Synthetic Benchmarks
You can already see from the technical specifications that the Sparkle Arc A380 Elf is a simple graphics card for low-budget systems. Correspondingly, the graphics card is also unable to deliver a high 3D performance. Even compared to the Sapphire Nitro+ Radeon RX 5500 XT 8G SE, our test sample remains significantly behind. On the other hand, the Intel graphics card presents a better picture in the Affinity Photo 2 Benchmark. However, there is a relatively large gap compared to the Intel Arc A580, which is currently only filled by some older GPU models.
| Performance rating - Percent | |
| KFA2 GeForce RTX 4070 EX Gamer | |
| Sapphire Pulse Radeon RX 7700 XT | |
| Sapphire Pulse Radeon RX 6750 XT | |
| AMD Radeon RX 6700 XT | |
| KFA2 GeForce RTX 4060 Ti EX, 16GB GDDR6 | |
| Acer Predator BiFrost Arc A770 OC, 16GB GDDR6 | |
| XFX Speedster QICK 308 Radeon RX 7600 Black Edition | |
| Sapphire Nitro+ Radeon RX 6650 XT | |
| Nvidia GeForce RTX 2070 Super | |
| KFA2 GeForce RTX 4060 1-Click-OC 2X | |
| Acer Predator BiFrost Arc A750 OC | |
| ASRock Arc A580 Challenger OC | |
| Nvidia GeForce RTX 2060 Super | |
| Sapphire Pulse Radeon RX 6600 | |
| Sapphire Nitro+ Radeon RX 5500 XT 8G SE | |
| Sparkle Intel Arc A380 Elf | |
| LuxMark v2.0 64Bit | |
| Room GPUs-only | |
| KFA2 GeForce RTX 4070 EX Gamer | |
| KFA2 GeForce RTX 4060 Ti EX, 16GB GDDR6 | |
| KFA2 GeForce RTX 4060 1-Click-OC 2X | |
| Acer Predator BiFrost Arc A750 OC | |
| Acer Predator BiFrost Arc A770 OC, 16GB GDDR6 | |
| ASRock Arc A580 Challenger OC | |
| Sapphire Pulse Radeon RX 7700 XT | |
| AMD Radeon RX 6700 XT | |
| Sapphire Pulse Radeon RX 6750 XT | |
| XFX Speedster QICK 308 Radeon RX 7600 Black Edition | |
| Sapphire Nitro+ Radeon RX 6650 XT | |
| Sapphire Pulse Radeon RX 6600 | |
| Sapphire Nitro+ Radeon RX 5500 XT 8G SE | |
| Sparkle Intel Arc A380 Elf | |
| Sala GPUs-only | |
| KFA2 GeForce RTX 4070 EX Gamer | |
| KFA2 GeForce RTX 4060 Ti EX, 16GB GDDR6 | |
| Acer Predator BiFrost Arc A770 OC, 16GB GDDR6 | |
| Acer Predator BiFrost Arc A750 OC | |
| ASRock Arc A580 Challenger OC | |
| KFA2 GeForce RTX 4060 1-Click-OC 2X | |
| Sapphire Pulse Radeon RX 7700 XT | |
| AMD Radeon RX 6700 XT | |
| Sapphire Pulse Radeon RX 6750 XT | |
| XFX Speedster QICK 308 Radeon RX 7600 Black Edition | |
| Sapphire Nitro+ Radeon RX 6650 XT | |
| Sapphire Pulse Radeon RX 6600 | |
| Sparkle Intel Arc A380 Elf | |
| Sapphire Nitro+ Radeon RX 5500 XT 8G SE | |
| Affinity Photo 2 - Combined (Single / Multi GPU) | |
| KFA2 GeForce RTX 4070 EX Gamer | |
| Nvidia GeForce RTX 2070 Super | |
| Nvidia GeForce RTX 2060 Super | |
| Sapphire Pulse Radeon RX 7700 XT | |
| Sapphire Pulse Radeon RX 6750 XT | |
| KFA2 GeForce RTX 4060 1-Click-OC 2X | |
| KFA2 GeForce RTX 4060 Ti EX, 16GB GDDR6 | |
| XFX Speedster QICK 308 Radeon RX 7600 Black Edition | |
| ASRock Arc A580 Challenger OC | |
| Acer Predator BiFrost Arc A770 OC, 16GB GDDR6 | |
| Acer Predator BiFrost Arc A750 OC | |
| Sparkle Intel Arc A380 Elf | |
| Sapphire Nitro+ Radeon RX 6650 XT | |
| AMD Radeon RX 6700 XT | |
| Sapphire Nitro+ Radeon RX 5500 XT 8G SE | |
| Sapphire Pulse Radeon RX 6600 | |
| 3DMark 05 Standard | 69490 points | |
| 3DMark 06 Standard Score | 58638 points | |
| 3DMark Vantage P Result | 53979 points | |
| 3DMark 11 Performance | 15095 points | |
| 3DMark Ice Storm Standard Score | 201497 points | |
| 3DMark Cloud Gate Standard Score | 48677 points | |
| 3DMark Fire Strike Score | 9728 points | |
| 3DMark Fire Strike Extreme Score | 4735 points | |
| 3DMark Time Spy Score | 4457 points | |
Help | ||
Professional Applications
We already saw in the tests of the three faster Intel models that Intel has a hard time keeping up with the current competitors. With the significantly slimmed-down graphics chip that is used in the Sparkle Arc A380 Elf, there is also a large performance gap between the Intel graphics cards here. Due to the lower GPU performance of the Arc A380, it would be better to change to another model in the professional arena. Even for the semi-professional arena, the graphics card isn't worth a recommendation.
| ASRock Arc A580 Challenger OC i9-14900K | Intel Arc A580 i9-14900K | Intel Arc A750 R9 7950X | Intel Arc A770 R9 7950X | AMD Radeon RX 5500 XT (Desktop) R9 7950X | AMD Radeon RX 6600 R9 7950X | AMD Radeon RX 7600 R9 7950X | NVIDIA GeForce RTX 2060 Super (Desktop) R9 7950X | NVIDIA GeForce RTX 2070 Super (Desktop) R9 7950X | NVIDIA GeForce RTX 3060 Ti R9 7950X | NVIDIA GeForce RTX 4060 R9 7950X | NVIDIA GeForce RTX 4060 Ti 16G R9 7950X | NVIDIA GeForce RTX 4070 R9 7950X | Average of class | |
|---|---|---|---|---|---|---|---|---|---|---|---|---|---|---|
| SPECviewperf 12 | 74% | 83% | 94% | 335% | 542% | 491% | 201% | 235% | 279% | 281% | 396% | 559% | 258% | |
| 1900x1060 3ds Max (3dsmax-05) (fps) | 81.4 | 154 89% | 166 104% | 179 120% | 141 73% | 258 217% | 279 243% | 220 170% | 247 203% | 297 265% | 251 208% | 290 256% | 382 369% | 206 ? 153% |
| 1900x1060 Catia (catia-04) (fps) | 84.2 | 162 92% | 166 97% | 174 107% | 108 28% | 256 204% | 273 224% | 84.5 0% | 114 35% | 114 35% | 113 34% | 128 52% | 161 91% | 113.6 ? 35% |
| 1900x1060 Creo (creo-01) (fps) | 39.7 | 45.5 15% | 45.7 15% | 45.3 14% | 72.7 83% | 133 235% | 115 190% | 58.8 48% | 65.7 65% | 65.2 64% | 60.6 53% | 73.4 85% | 89.1 124% | 66.6 ? 68% |
| 1900x1060 Energy (energy-01) (fps) | 1.09 | 2.02 85% | 2.25 106% | 2.44 124% | 23.1 2019% | 31.3 2772% | 25.5 2239% | 11.6 964% | 12.4 1038% | 14.4 1221% | 15.9 1359% | 22.6 1973% | 31.7 2808% | 16.9 ? 1450% |
| 1900x1060 Maya (maya-04) (fps) | 90.3 | 165 83% | 177 96% | 183 103% | 140 55% | 218 141% | 236 161% | 200 121% | 225 149% | 251 178% | 233 158% | 257 185% | 284 215% | 117.7 ? 30% |
| 1900x1060 Medical (medical-01) (fps) | 23.2 | 40.9 76% | 42.4 83% | 46.7 101% | 70.6 204% | 102 340% | 128 452% | 49.5 113% | 55.9 141% | 65.6 183% | 82.4 255% | 110 374% | 132 469% | 59.2 ? 155% |
| 1900x1060 Showcase (showcase-01) (fps) | 43.4 | 108 149% | 110 153% | 119 174% | 83.2 92% | 125 188% | 127 193% | 121 179% | 135 211% | 150 246% | 109 151% | 132 204% | 190 338% | 103.7 ? 139% |
| 1900x1060 Solidworks (sw-03) (fps) | 68.7 | 72.3 5% | 72.6 6% | 73.4 7% | 156 127% | 232 238% | 221 222% | 79.7 16% | 95.1 38% | 93.5 36% | 91.2 33% | 95.1 38% | 109 59% | 89.4 ? 30% |
| SPECviewperf 13 | 96% | 111% | 125% | 115% | 255% | 389% | 129% | 163% | 187% | 179% | 238% | 330% | 186% | |
| 3ds Max (3dsmax-06) (fps) | 81 | 151 86% | 163 101% | 179 121% | 141 74% | 258 219% | 280 246% | 218 169% | 247 205% | 297 267% | 252 211% | 289 257% | 381 370% | 196.9 ? 143% |
| Catia (catia-05) (fps) | 122 | 240 97% | 249 104% | 260 113% | 154 26% | 387 217% | 410 236% | 119 -2% | 163 34% | 167 37% | 163 34% | 189 55% | 241 98% | 211 ? 73% |
| Creo (creo-02) (fps) | 73.1 | 87.5 20% | 88.6 21% | 90 23% | 139 90% | 279 282% | 294 302% | 203 178% | 240 228% | 243 232% | 230 215% | 301 312% | 375 413% | 216 ? 195% |
| Energy (energy-02) (fps) | 6.44 | 15.7 144% | 19.3 200% | 22.5 249% | 29.4 357% | 44 583% | 82.9 1187% | 21.9 240% | 23.8 270% | 26.1 305% | 34.6 437% | 45.3 603% | 54.2 742% | 39.7 ? 516% |
| Maya (maya-05) (fps) | 125 | 285 128% | 301 141% | 319 155% | 208 66% | 348 178% | 333 166% | 291 133% | 344 175% | 372 198% | 343 174% | 403 222% | 510 308% | 278 ? 122% |
| Medical (medical-02) (fps) | 30.9 | 74.9 142% | 82.8 168% | 80.8 161% | 60.2 95% | 88.8 187% | 226 631% | 54.2 75% | 63.7 106% | 74.3 140% | 76.5 148% | 85.1 175% | 112 262% | 88.4 ? 186% |
| Showcase (showcase-02) (fps) | 43.3 | 109 152% | 110 154% | 119 175% | 83.2 92% | 125 189% | 127 193% | 122 182% | 135 212% | 150 246% | 108 149% | 133 207% | 191 341% | 126.2 ? 191% |
| Solidworks (sw-04) (fps) | 77.7 | 79.5 2% | 76.8 -1% | 77.5 0% | 168 116% | 220 183% | 195 151% | 119 53% | 136 75% | 135 74% | 127 63% | 135 74% | 157 102% | 124.1 ? 60% |
| SPECviewperf 2020 | 151% | 228% | 213% | 93% | 250% | 470% | 177% | 188% | 267% | 242% | 330% | 460% | 365% | |
| 3840x2160 Medical (medical-03) (fps) | 5 | 14.5 190% | 20 300% | 22.3 346% | 12.7 154% | 20.9 318% | 36.1 622% | 10.3 106% | 12 140% | 11.9 138% | 13.7 174% | 16.5 230% | 22.2 344% | 24 ? 380% |
| 3840x2160 Maya (maya-06) (fps) | 65.3 | 166 154% | 180 176% | 195 199% | 97.1 49% | 161 147% | 178 173% | 162 148% | 185 183% | 235 260% | 196 200% | 237 263% | 305 367% | 221 ? 238% |
| 3840x2160 Energy (energy-03) (fps) | 5.04 | 17.6 249% | 35 594% | 25 396% | 13.8 174% | 29.5 485% | 67 1229% | 22.9 354% | 17.8 253% | 31.2 519% | 33.2 559% | 44.9 791% | 57.6 1043% | 50 ? 892% |
| 3840x2160 Creo (creo-03) (fps) | 34.1 | 51.7 52% | 51.9 52% | 52.9 55% | 58.6 72% | 93.4 174% | 106 211% | 77.2 126% | 85.8 152% | 91.2 167% | 85.9 152% | 95.9 181% | 112 228% | 78.3 ? 130% |
| 3840x2160 CATIA (catia-06) (fps) | 18.3 | 36.7 101% | 38.9 113% | 38.9 113% | 30.3 66% | 60.8 232% | 68 272% | 30.5 67% | 36.7 101% | 40.5 121% | 34 86% | 38.5 110% | 51.6 182% | 48.9 ? 167% |
| 3840x2160 3ds Max (3dsmax-07) (fps) | 17.6 | 45.2 157% | 40.7 131% | 47.4 169% | 25.2 43% | 42.4 141% | 72.9 314% | 63.1 259% | 69.7 296% | 87 394% | 67.4 283% | 88.8 405% | 122 593% | 85 ? 383% |
| Total Average (Program / Settings) | 107% /
103% | 141% /
132% | 144% /
138% | 181% /
189% | 349% /
358% | 450% /
448% | 169% /
168% | 195% /
196% | 244% /
242% | 234% /
233% | 321% /
321% | 450% /
448% | 270% /
261% |
Gaming Performance
We take a look at the 3D performance of the Sparkle Arc A380 Elf in current and also older games using numerous gaming titles. We see a similar picture as in the synthetic 3DMark benchmarks before. In order to compare the performance of our test unit with the powerful iGPUs from AMD, we also include the AMD Radeon 780M in our test. In most cases, the Sparkle Arc A380 Elf wins this comparison, although there are also some games that you shouldn't expect the Intel Arc to be able to play. Those who plan on buying the Arc A380 should first figure out what games they want to play. Our list of tested games includes a number of older but also of more current games that you can play with the affordable graphics card.
You can find an overview of the performance compared to other graphics cards in our GPU games list.
| The Witcher 3 - 1366x768 Medium Graphics & Postprocessing | |
| KFA2 GeForce RTX 4070 Ti EX Gamer | |
| AMD Radeon RX 7900 GRE | |
| KFA2 GeForce RTX 4070 EX Gamer | |
| Sapphire Pulse Radeon RX 7700 XT | |
| AMD Radeon RX 7800 XT | |
| KFA2 GeForce RTX 4060 Ti EX, 16GB GDDR6 | |
| Sapphire Pulse Radeon RX 6750 XT | |
| XFX Speedster QICK 308 Radeon RX 7600 Black Edition | |
| AMD Radeon RX 6700 XT | |
| KFA2 GeForce RTX 4060 1-Click-OC 2X | |
| Nvidia GeForce RTX 2070 Super | |
| Sapphire Nitro+ Radeon RX 6650 XT | |
| Acer Predator BiFrost Arc A770 OC, 16GB GDDR6 | |
| Acer Predator BiFrost Arc A750 OC | |
| Nvidia GeForce RTX 2060 Super | |
| ASRock Arc A580 Challenger OC | |
| Sapphire Pulse Radeon RX 6600 | |
| Sapphire Nitro+ Radeon RX 5500 XT 8G SE | |
| Sparkle Intel Arc A380 Elf | |
| Average AMD Radeon 780M (47.7 - 103.8, n=33) | |
| Metro Exodus - 1920x1080 Medium Quality AF:4x | |
| KFA2 GeForce RTX 4070 Ti EX Gamer | |
| AMD Radeon RX 7900 GRE | |
| KFA2 GeForce RTX 4070 EX Gamer | |
| AMD Radeon RX 7800 XT | |
| Sapphire Pulse Radeon RX 7700 XT | |
| Sapphire Pulse Radeon RX 6750 XT | |
| KFA2 GeForce RTX 4060 Ti EX, 16GB GDDR6 | |
| AMD Radeon RX 6700 XT | |
| Acer Predator BiFrost Arc A770 OC, 16GB GDDR6 | |
| XFX Speedster QICK 308 Radeon RX 7600 Black Edition | |
| Acer Predator BiFrost Arc A750 OC | |
| KFA2 GeForce RTX 4060 1-Click-OC 2X | |
| Nvidia GeForce RTX 2070 Super | |
| ASRock Arc A580 Challenger OC | |
| Sapphire Nitro+ Radeon RX 6650 XT | |
| Nvidia GeForce RTX 2060 Super | |
| Sapphire Pulse Radeon RX 6600 | |
| Sapphire Nitro+ Radeon RX 5500 XT 8G SE | |
| Sparkle Intel Arc A380 Elf | |
| Average AMD Radeon 780M (32.2 - 37.8, n=8) | |
| Far Cry 5 - 1920x1080 Medium Preset AA:T | |
| KFA2 GeForce RTX 4070 EX Gamer | |
| KFA2 GeForce RTX 4070 Ti EX Gamer | |
| AMD Radeon RX 7900 GRE | |
| KFA2 GeForce RTX 4060 Ti EX, 16GB GDDR6 | |
| Sapphire Pulse Radeon RX 6750 XT | |
| AMD Radeon RX 6700 XT | |
| Sapphire Pulse Radeon RX 7700 XT | |
| KFA2 GeForce RTX 4060 1-Click-OC 2X | |
| XFX Speedster QICK 308 Radeon RX 7600 Black Edition | |
| AMD Radeon RX 7800 XT | |
| Sapphire Nitro+ Radeon RX 6650 XT | |
| Nvidia GeForce RTX 2070 Super | |
| Sapphire Pulse Radeon RX 6600 | |
| Nvidia GeForce RTX 2060 Super | |
| ASRock Arc A580 Challenger OC | |
| Acer Predator BiFrost Arc A770 OC, 16GB GDDR6 | |
| Acer Predator BiFrost Arc A750 OC | |
| Sapphire Nitro+ Radeon RX 5500 XT 8G SE | |
| Sparkle Intel Arc A380 Elf | |
| Average AMD Radeon 780M (22 - 54, n=48) | |
| Far Cry 6 - 1920x1080 Medium Graphics Quality AA:SM | |
| AMD Radeon RX 7900 GRE | |
| AMD Radeon RX 7800 XT | |
| KFA2 GeForce RTX 4070 Ti EX Gamer | |
| Sapphire Pulse Radeon RX 7700 XT | |
| KFA2 GeForce RTX 4070 EX Gamer | |
| Sapphire Pulse Radeon RX 6750 XT | |
| XFX Speedster QICK 308 Radeon RX 7600 Black Edition | |
| AMD Radeon RX 6700 XT | |
| KFA2 GeForce RTX 4060 Ti EX, 16GB GDDR6 | |
| Sapphire Nitro+ Radeon RX 6650 XT | |
| KFA2 GeForce RTX 4060 1-Click-OC 2X | |
| Nvidia GeForce RTX 2070 Super | |
| Sapphire Pulse Radeon RX 6600 | |
| Acer Predator BiFrost Arc A770 OC, 16GB GDDR6 | |
| Nvidia GeForce RTX 2060 Super | |
| Acer Predator BiFrost Arc A750 OC | |
| ASRock Arc A580 Challenger OC | |
| Sapphire Nitro+ Radeon RX 5500 XT 8G SE | |
| Sparkle Intel Arc A380 Elf | |
| Average AMD Radeon 780M (43 - 48, n=4) | |
| F1 2021 - 1920x1080 Medium Preset AA:T AF:16x | |
| AMD Radeon RX 7900 GRE (874931) | |
| AMD Radeon RX 7800 XT (874931) | |
| KFA2 GeForce RTX 4070 Ti EX Gamer (874931) | |
| KFA2 GeForce RTX 4070 EX Gamer (874931) | |
| Sapphire Pulse Radeon RX 7700 XT (874931) | |
| Sapphire Pulse Radeon RX 6750 XT (874931) | |
| KFA2 GeForce RTX 4060 Ti EX, 16GB GDDR6 (874931) | |
| AMD Radeon RX 6700 XT (874931) | |
| XFX Speedster QICK 308 Radeon RX 7600 Black Edition (874931) | |
| Sapphire Nitro+ Radeon RX 6650 XT (874931) | |
| Acer Predator BiFrost Arc A770 OC, 16GB GDDR6 (874931) | |
| Nvidia GeForce RTX 2070 Super (874931) | |
| Acer Predator BiFrost Arc A750 OC (874931) | |
| Sapphire Pulse Radeon RX 6600 (874931) | |
| ASRock Arc A580 Challenger OC (874931) | |
| Nvidia GeForce RTX 2060 Super (874931) | |
| Sapphire Nitro+ Radeon RX 5500 XT 8G SE (874931) | |
| Sparkle Intel Arc A380 Elf (874931) | |
| Average AMD Radeon 780M (53.9 - 115, n=16) | |
| F1 22 - 1920x1080 Medium Preset AA:T AF:16x | |
| AMD Radeon RX 7900 GRE (959964) | |
| AMD Radeon RX 7800 XT (959964) | |
| KFA2 GeForce RTX 4070 Ti EX Gamer (959964) | |
| Sapphire Pulse Radeon RX 6750 XT (959964) | |
| Sapphire Pulse Radeon RX 7700 XT (959964) | |
| KFA2 GeForce RTX 4070 EX Gamer (959964) | |
| AMD Radeon RX 6700 XT (939134) | |
| KFA2 GeForce RTX 4060 Ti EX, 16GB GDDR6 (959964) | |
| XFX Speedster QICK 308 Radeon RX 7600 Black Edition (959964) | |
| Sapphire Nitro+ Radeon RX 6650 XT (946728) | |
| Nvidia GeForce RTX 2070 Super (923662) | |
| Acer Predator BiFrost Arc A770 OC, 16GB GDDR6 (959964) | |
| Sapphire Pulse Radeon RX 6600 (946728) | |
| Acer Predator BiFrost Arc A750 OC (959964) | |
| Nvidia GeForce RTX 2060 Super (923662) | |
| ASRock Arc A580 Challenger OC (959964) | |
| KFA2 GeForce RTX 4060 1-Click-OC 2X (959964) | |
| Sapphire Nitro+ Radeon RX 5500 XT 8G SE (959964) | |
| Sparkle Intel Arc A380 Elf (959964) | |
| Average AMD Radeon 780M (41.5 - 95, n=35) | |
| Cyberpunk 2077 1.6 - 1920x1080 Medium Preset | |
| KFA2 GeForce RTX 4070 Ti EX Gamer | |
| AMD Radeon RX 7900 GRE (1.6) | |
| AMD Radeon RX 7800 XT (1.6) | |
| KFA2 GeForce RTX 4070 EX Gamer | |
| Sapphire Pulse Radeon RX 7700 XT (1.6) | |
| KFA2 GeForce RTX 4060 Ti EX, 16GB GDDR6 (1.6) | |
| Sapphire Nitro+ Radeon RX 6650 XT (1.5) | |
| Sapphire Pulse Radeon RX 6750 XT | |
| AMD Radeon RX 6700 XT (1.61) | |
| XFX Speedster QICK 308 Radeon RX 7600 Black Edition (1.6) | |
| KFA2 GeForce RTX 4060 1-Click-OC 2X (1.6) | |
| Sapphire Pulse Radeon RX 6600 (1.5) | |
| Nvidia GeForce RTX 2070 Super (1.6) | |
| Nvidia GeForce RTX 2060 Super (1.6) | |
| Acer Predator BiFrost Arc A770 OC, 16GB GDDR6 (1.6) | |
| Acer Predator BiFrost Arc A750 OC (1.6) | |
| ASRock Arc A580 Challenger OC (1.6) | |
| Sapphire Nitro+ Radeon RX 5500 XT 8G SE | |
| Sparkle Intel Arc A380 Elf (1.6) | |
| Average AMD Radeon 780M (16 - 42, n=12) | |
| A Plague Tale Requiem - 1920x1080 Medium Preset | |
| KFA2 GeForce RTX 4070 Ti EX Gamer | |
| AMD Radeon RX 7900 GRE | |
| AMD Radeon RX 7800 XT | |
| KFA2 GeForce RTX 4070 EX Gamer | |
| Sapphire Pulse Radeon RX 7700 XT | |
| KFA2 GeForce RTX 4060 Ti EX, 16GB GDDR6 | |
| Sapphire Pulse Radeon RX 6750 XT | |
| AMD Radeon RX 6700 XT | |
| XFX Speedster QICK 308 Radeon RX 7600 Black Edition | |
| KFA2 GeForce RTX 4060 1-Click-OC 2X | |
| Sapphire Nitro+ Radeon RX 6650 XT | |
| Nvidia GeForce RTX 2070 Super | |
| Acer Predator BiFrost Arc A770 OC, 16GB GDDR6 | |
| Acer Predator BiFrost Arc A750 OC | |
| Nvidia GeForce RTX 2060 Super | |
| Sapphire Pulse Radeon RX 6600 | |
| ASRock Arc A580 Challenger OC | |
| Sapphire Nitro+ Radeon RX 5500 XT 8G SE | |
| Sparkle Intel Arc A380 Elf | |
| Average AMD Radeon 780M (n=1) | |
| Spider-Man Miles Morales - 1920x1080 Medium Preset AA:SM | |
| KFA2 GeForce RTX 4070 Ti EX Gamer | |
| AMD Radeon RX 7800 XT | |
| KFA2 GeForce RTX 4070 EX Gamer | |
| AMD Radeon RX 7900 GRE | |
| KFA2 GeForce RTX 4060 Ti EX, 16GB GDDR6 | |
| Sapphire Pulse Radeon RX 7700 XT | |
| XFX Speedster QICK 308 Radeon RX 7600 Black Edition | |
| Sapphire Pulse Radeon RX 6750 XT | |
| KFA2 GeForce RTX 4060 1-Click-OC 2X | |
| AMD Radeon RX 6700 XT | |
| Acer Predator BiFrost Arc A770 OC, 16GB GDDR6 | |
| Nvidia GeForce RTX 2070 Super | |
| Acer Predator BiFrost Arc A750 OC | |
| Sapphire Nitro+ Radeon RX 6650 XT | |
| ASRock Arc A580 Challenger OC | |
| Nvidia GeForce RTX 2060 Super | |
| Sapphire Pulse Radeon RX 6600 | |
| Sapphire Nitro+ Radeon RX 5500 XT 8G SE | |
| Sparkle Intel Arc A380 Elf | |
| Average AMD Radeon 780M (n=1) | |
| Borderlands 3 - 1920x1080 Medium Overall Quality (DX11) | |
| KFA2 GeForce RTX 4070 EX Gamer | |
| AMD Radeon RX 7900 GRE | |
| AMD Radeon RX 7800 XT | |
| Sapphire Pulse Radeon RX 7700 XT | |
| KFA2 GeForce RTX 4070 Ti EX Gamer | |
| Sapphire Pulse Radeon RX 6750 XT | |
| AMD Radeon RX 6700 XT | |
| KFA2 GeForce RTX 4060 Ti EX, 16GB GDDR6 | |
| KFA2 GeForce RTX 4060 1-Click-OC 2X | |
| Sapphire Nitro+ Radeon RX 6650 XT | |
| XFX Speedster QICK 308 Radeon RX 7600 Black Edition | |
| Nvidia GeForce RTX 2070 Super | |
| Sapphire Pulse Radeon RX 6600 | |
| Nvidia GeForce RTX 2060 Super | |
| ASRock Arc A580 Challenger OC | |
| Acer Predator BiFrost Arc A750 OC | |
| Acer Predator BiFrost Arc A770 OC, 16GB GDDR6 | |
| Sapphire Nitro+ Radeon RX 5500 XT 8G SE | |
| Sparkle Intel Arc A380 Elf | |
| Average AMD Radeon 780M (38.6 - 51.4, n=8) | |
| God of War - 1920x1080 Original Preset | |
| AMD Radeon RX 7800 XT | |
| AMD Radeon RX 7900 GRE | |
| KFA2 GeForce RTX 4070 EX Gamer | |
| Sapphire Pulse Radeon RX 7700 XT | |
| Sapphire Pulse Radeon RX 6750 XT | |
| AMD Radeon RX 6700 XT | |
| KFA2 GeForce RTX 4060 Ti EX, 16GB GDDR6 | |
| XFX Speedster QICK 308 Radeon RX 7600 Black Edition | |
| KFA2 GeForce RTX 4060 1-Click-OC 2X | |
| Nvidia GeForce RTX 2070 Super | |
| Sapphire Nitro+ Radeon RX 6650 XT | |
| Nvidia GeForce RTX 2060 Super | |
| Sapphire Pulse Radeon RX 6600 | |
| Acer Predator BiFrost Arc A770 OC, 16GB GDDR6 | |
| Acer Predator BiFrost Arc A750 OC | |
| ASRock Arc A580 Challenger OC | |
| Sapphire Nitro+ Radeon RX 5500 XT 8G SE | |
| Sparkle Intel Arc A380 Elf | |
| Average AMD Radeon 780M (19.5 - 34.3, n=8) | |
| GTA V - 1366x768 Normal/Off AF:4x | |
| AMD Radeon RX 6700 XT | |
| Sapphire Nitro+ Radeon RX 6650 XT | |
| Sapphire Pulse Radeon RX 6750 XT | |
| XFX Speedster QICK 308 Radeon RX 7600 Black Edition | |
| Sapphire Pulse Radeon RX 6600 | |
| Nvidia GeForce RTX 2060 Super | |
| KFA2 GeForce RTX 4070 EX Gamer | |
| KFA2 GeForce RTX 4060 Ti EX, 16GB GDDR6 | |
| Nvidia GeForce RTX 2070 Super | |
| KFA2 GeForce RTX 4060 1-Click-OC 2X | |
| ASRock Arc A580 Challenger OC | |
| Sapphire Nitro+ Radeon RX 5500 XT 8G SE | |
| KFA2 GeForce RTX 4070 Ti EX Gamer | |
| Sparkle Intel Arc A380 Elf | |
| AMD Radeon RX 7900 GRE | |
| AMD Radeon RX 7800 XT | |
| Sapphire Pulse Radeon RX 7700 XT | |
| Acer Predator BiFrost Arc A750 OC | |
| Acer Predator BiFrost Arc A770 OC, 16GB GDDR6 | |
| Average AMD Radeon 780M (91.2 - 159, n=61) | |
| The Quarry - 1920x1080 Medium Preset | |
| KFA2 GeForce RTX 4070 Ti EX Gamer | |
| AMD Radeon RX 7900 GRE | |
| KFA2 GeForce RTX 4070 EX Gamer | |
| AMD Radeon RX 7800 XT | |
| Sapphire Pulse Radeon RX 7700 XT | |
| KFA2 GeForce RTX 4060 Ti EX, 16GB GDDR6 | |
| Sapphire Pulse Radeon RX 6750 XT | |
| AMD Radeon RX 6700 XT | |
| KFA2 GeForce RTX 4060 1-Click-OC 2X | |
| XFX Speedster QICK 308 Radeon RX 7600 Black Edition | |
| Nvidia GeForce RTX 2070 Super | |
| Sapphire Nitro+ Radeon RX 6650 XT | |
| Nvidia GeForce RTX 2060 Super | |
| Acer Predator BiFrost Arc A770 OC, 16GB GDDR6 | |
| Sapphire Pulse Radeon RX 6600 | |
| Acer Predator BiFrost Arc A750 OC | |
| ASRock Arc A580 Challenger OC | |
| Sapphire Nitro+ Radeon RX 5500 XT 8G SE | |
| Sparkle Intel Arc A380 Elf | |
| Average AMD Radeon 780M (n=1) | |
| Tiny Tina's Wonderlands - 1920x1080 Medium Preset (DX12) | |
| AMD Radeon RX 7900 GRE | |
| KFA2 GeForce RTX 4070 Ti EX Gamer | |
| AMD Radeon RX 7800 XT | |
| KFA2 GeForce RTX 4070 EX Gamer | |
| Sapphire Pulse Radeon RX 7700 XT | |
| Sapphire Pulse Radeon RX 6750 XT | |
| AMD Radeon RX 6700 XT | |
| KFA2 GeForce RTX 4060 Ti EX, 16GB GDDR6 | |
| Sapphire Nitro+ Radeon RX 6650 XT | |
| XFX Speedster QICK 308 Radeon RX 7600 Black Edition | |
| KFA2 GeForce RTX 4060 1-Click-OC 2X | |
| Acer Predator BiFrost Arc A770 OC, 16GB GDDR6 | |
| Nvidia GeForce RTX 2070 Super | |
| Sapphire Pulse Radeon RX 6600 | |
| Acer Predator BiFrost Arc A750 OC | |
| ASRock Arc A580 Challenger OC | |
| Nvidia GeForce RTX 2060 Super | |
| Sapphire Nitro+ Radeon RX 5500 XT 8G SE | |
| Sparkle Intel Arc A380 Elf | |
| Average AMD Radeon 780M (28.4 - 55.9, n=25) | |
| GRID Legends - 1920x1080 Medium Preset | |
| AMD Radeon RX 6700 XT (643827) | |
| Sapphire Pulse Radeon RX 6750 XT (712825) | |
| Sapphire Nitro+ Radeon RX 6650 XT (643827) | |
| KFA2 GeForce RTX 4070 EX Gamer (712825) | |
| KFA2 GeForce RTX 4070 Ti EX Gamer (712825) | |
| Nvidia GeForce RTX 2070 Super (591708) | |
| AMD Radeon RX 7800 XT (800660) | |
| Sapphire Pulse Radeon RX 7700 XT (800660) | |
| AMD Radeon RX 7900 GRE (800660) | |
| Nvidia GeForce RTX 2060 Super (623651) | |
| XFX Speedster QICK 308 Radeon RX 7600 Black Edition (800660) | |
| KFA2 GeForce RTX 4060 Ti EX, 16GB GDDR6 (800660) | |
| Sapphire Pulse Radeon RX 6600 (683088) | |
| KFA2 GeForce RTX 4060 1-Click-OC 2X (800660) | |
| Acer Predator BiFrost Arc A770 OC, 16GB GDDR6 (800660) | |
| ASRock Arc A580 Challenger OC (800660) | |
| Acer Predator BiFrost Arc A750 OC (800660) | |
| Sapphire Nitro+ Radeon RX 5500 XT 8G SE (712825) | |
| Sparkle Intel Arc A380 Elf (800660) | |
| Average AMD Radeon 780M (73.4 - 92.5, n=8) | |
| F1 23 - 1920x1080 Medium Preset AA:T AF:16x | |
| AMD Radeon RX 7800 XT (1022189) | |
| AMD Radeon RX 7900 GRE (1016022) | |
| Sapphire Pulse Radeon RX 7700 XT (1026791) | |
| KFA2 GeForce RTX 4070 EX Gamer | |
| Sapphire Pulse Radeon RX 6750 XT (1016022) | |
| AMD Radeon RX 6700 XT (1016022) | |
| KFA2 GeForce RTX 4060 Ti EX, 16GB GDDR6 (1022189) | |
| XFX Speedster QICK 308 Radeon RX 7600 Black Edition (1016022) | |
| Sapphire Nitro+ Radeon RX 6650 XT (1016022) | |
| KFA2 GeForce RTX 4060 1-Click-OC 2X (1008687) | |
| Nvidia GeForce RTX 2070 Super (1021115) | |
| Acer Predator BiFrost Arc A770 OC, 16GB GDDR6 (1026791) | |
| Sapphire Pulse Radeon RX 6600 (1016022) | |
| Acer Predator BiFrost Arc A750 OC (1042581) | |
| Nvidia GeForce RTX 2060 Super (1021115) | |
| ASRock Arc A580 Challenger OC (1082038) | |
| Sapphire Nitro+ Radeon RX 5500 XT 8G SE (1022189) | |
| Sparkle Intel Arc A380 Elf (1082038) | |
| Average AMD Radeon 780M (38.1 - 84.4, n=30) | |
| Hogwarts Legacy - 1920x1080 Medium Preset AA:High T | |
| AMD Radeon RX 7900 GRE | |
| AMD Radeon RX 7800 XT | |
| Sapphire Pulse Radeon RX 7700 XT | |
| KFA2 GeForce RTX 4070 EX Gamer | |
| KFA2 GeForce RTX 4070 Ti EX Gamer | |
| Sapphire Pulse Radeon RX 6750 XT | |
| KFA2 GeForce RTX 4060 Ti EX, 16GB GDDR6 | |
| AMD Radeon RX 6700 XT | |
| XFX Speedster QICK 308 Radeon RX 7600 Black Edition | |
| KFA2 GeForce RTX 4060 1-Click-OC 2X | |
| Sapphire Nitro+ Radeon RX 6650 XT | |
| Nvidia GeForce RTX 2070 Super | |
| Acer Predator BiFrost Arc A770 OC, 16GB GDDR6 | |
| Nvidia GeForce RTX 2060 Super | |
| Sapphire Pulse Radeon RX 6600 | |
| Acer Predator BiFrost Arc A750 OC | |
| ASRock Arc A580 Challenger OC | |
| Sapphire Nitro+ Radeon RX 5500 XT 8G SE | |
| Average AMD Radeon 780M (21.9 - 37.6, n=5) | |
| Sparkle Intel Arc A380 Elf | |
| Returnal - 1920x1080 Medium Preset | |
| AMD Radeon RX 7900 GRE | |
| KFA2 GeForce RTX 4070 Ti EX Gamer | |
| AMD Radeon RX 7800 XT | |
| KFA2 GeForce RTX 4070 EX Gamer | |
| Sapphire Pulse Radeon RX 7700 XT | |
| Sapphire Pulse Radeon RX 6750 XT | |
| AMD Radeon RX 6700 XT | |
| KFA2 GeForce RTX 4060 Ti EX, 16GB GDDR6 | |
| Sapphire Nitro+ Radeon RX 6650 XT | |
| XFX Speedster QICK 308 Radeon RX 7600 Black Edition | |
| KFA2 GeForce RTX 4060 1-Click-OC 2X | |
| Nvidia GeForce RTX 2070 Super | |
| Acer Predator BiFrost Arc A770 OC, 16GB GDDR6 | |
| Nvidia GeForce RTX 2060 Super | |
| Sapphire Pulse Radeon RX 6600 | |
| Acer Predator BiFrost Arc A750 OC | |
| ASRock Arc A580 Challenger OC | |
| Sapphire Nitro+ Radeon RX 5500 XT 8G SE | |
| Sparkle Intel Arc A380 Elf | |
| Average AMD Radeon 780M (20 - 29, n=2) | |
| Diablo 4 - 1920x1080 Medium Preset | |
| KFA2 GeForce RTX 4070 EX Gamer | |
| AMD Radeon RX 7800 XT | |
| AMD Radeon RX 7900 GRE | |
| Sapphire Pulse Radeon RX 7700 XT | |
| KFA2 GeForce RTX 4060 Ti EX, 16GB GDDR6 | |
| Sapphire Pulse Radeon RX 6750 XT | |
| AMD Radeon RX 6700 XT | |
| KFA2 GeForce RTX 4060 1-Click-OC 2X | |
| Nvidia GeForce RTX 2070 Super | |
| XFX Speedster QICK 308 Radeon RX 7600 Black Edition | |
| Sapphire Nitro+ Radeon RX 6650 XT | |
| Nvidia GeForce RTX 2060 Super | |
| Acer Predator BiFrost Arc A770 OC, 16GB GDDR6 | |
| Sapphire Pulse Radeon RX 6600 | |
| Acer Predator BiFrost Arc A750 OC | |
| ASRock Arc A580 Challenger OC | |
| Sapphire Nitro+ Radeon RX 5500 XT 8G SE | |
| Sparkle Intel Arc A380 Elf | |
| Average AMD Radeon 780M (n=1) | |
Overview of the Games Tested with the Sparkle Arc A380 Elf
| low | med. | high | ultra | |
|---|---|---|---|---|
| Prince of Persia The Lost Crown (2024) | 308 | 200 | 185.5 | |
| Palworld (2024) | 46.3 | 37.4 | 27.4 | 24.4 |
| Enshrouded (2024) | 28.5 | 25.5 | 20.9 | 17.1 |
| Helldivers 2 (2024) | 46.6 | 36.5 | 32.4 | 33.1 |
| Skull & Bones (2024) | 41 | 36 | 30 | 23 |
| Last Epoch (2024) | 78.2 | 70.3 | 57.1 | 42.7 |
| Alone in the Dark (2024) | 84.6 | 71.6 | 59 | 29.5 |
| Dragon's Dogma 2 (2024) | 22 | 18.9 | ||
| Horizon Forbidden West (2024) | 34.5 | 31.2 | 20.2 | 14.9 |
| Ghost of Tsushima (2024) | 40 | 32.6 | 28 | 20 |
| Senua's Saga Hellblade 2 (2024) | 19.1 | 12.5 | 9.2 | |
| F1 24 (2024) | 108.8 | 91 | 63.5 | 16.3 |
Emissions - Relatively loud despite the low performance
Noise Emissions
The Sparkle Arc A380 Elf is equipped with a 90-millimeter (~3.5 in) fan. Luckily, the manufacturer didn't forgo a fan stop mode, so the graphics card can run silently during idle operation. Under load, we also register a very noticeable coil whine in addition to the fan noise. In our test, this was even slightly louder under average load than during the stress test. At an average of 38.3 dB(A) while gaming, the noise level was also slightly above the one we determined during the stress test (37.7 dB(A)).
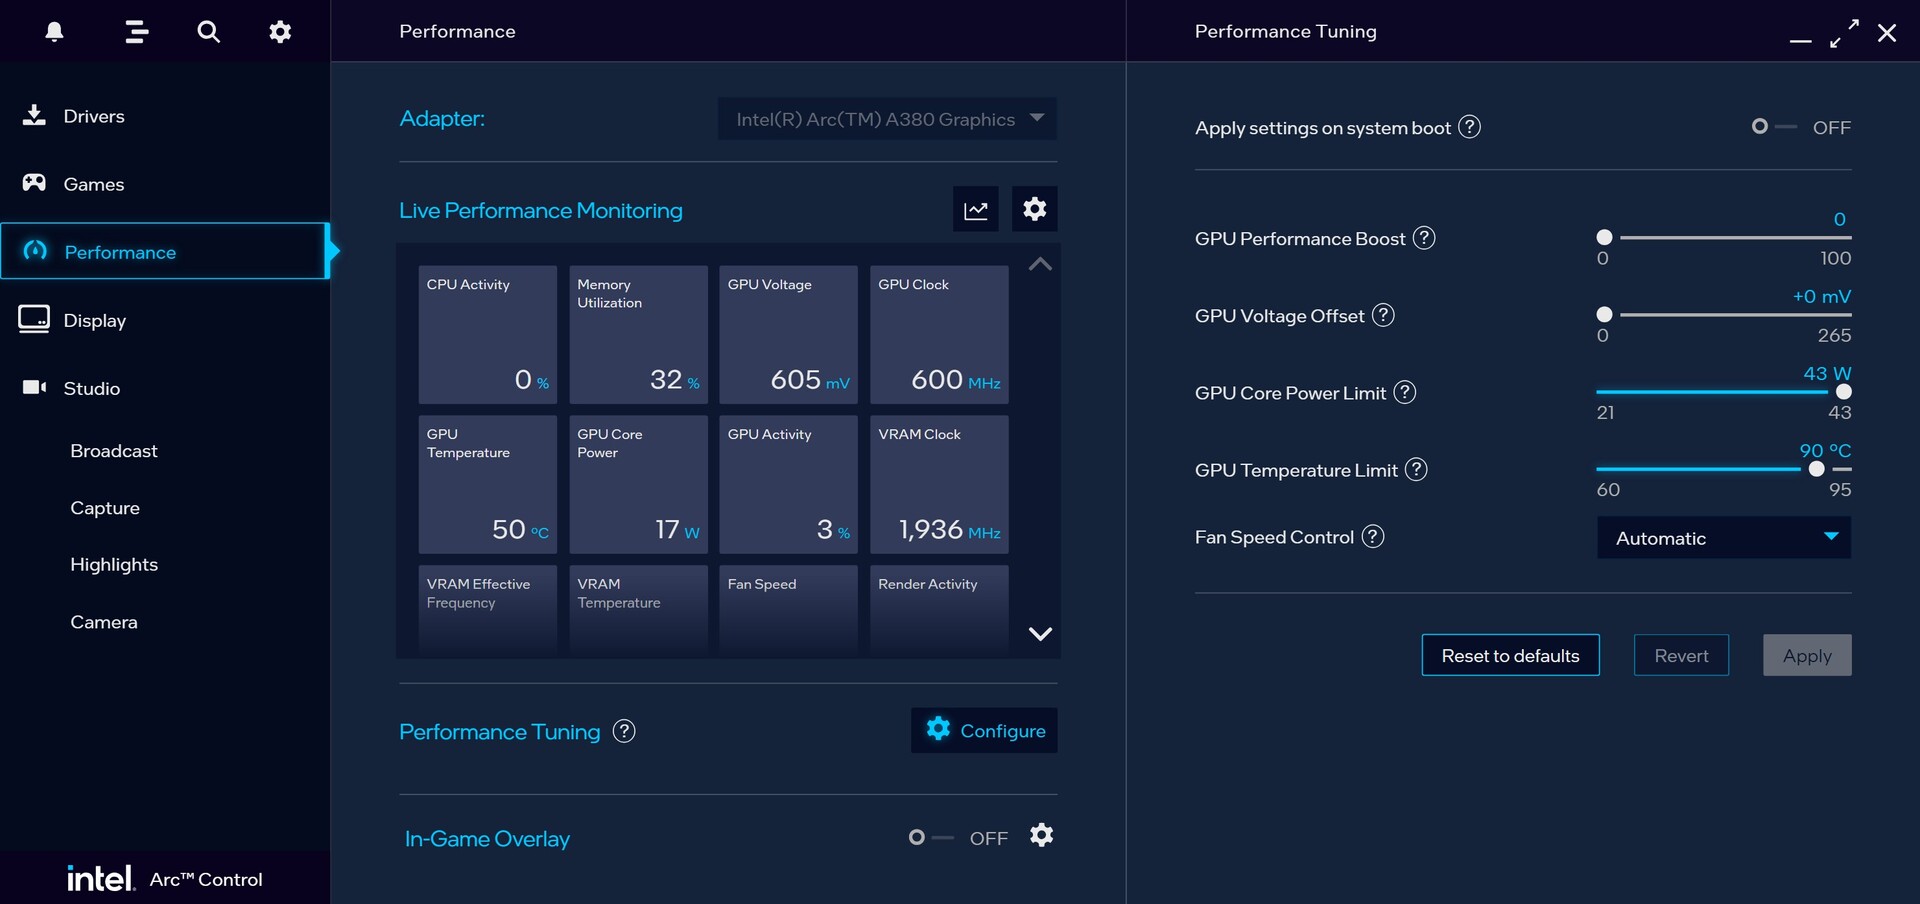
The manufacturer also has some catching up to do in terms of the fan speed control: Under load, the fan keeps revving up unnecessarily high in brief time intervals. This is very annoying in the long run, and you can only remedy this by manually adjusting the fan curve in the Intel driver. Alternatively, you can also set the fan speed at a fixed value.
Noise level
| Idle |
| 26 / 26 / 26.5 dB(A) |
| Load |
| 39.5 / 37.7 dB(A) |
 | ||
30 dB silent 40 dB(A) audible 50 dB(A) loud |
||
min: | ||
| Sparkle Intel Arc A380 Elf | ASRock Arc A580 Challenger OC | Acer Predator BiFrost Arc A750 OC | Acer Predator BiFrost Arc A770 OC, 16GB GDDR6 | AMD Radeon RX 7800 XT | KFA2 GeForce RTX 4070 Ti EX Gamer | KFA2 GeForce RTX 4070 EX Gamer | KFA2 GeForce RTX 4060 1-Click-OC 2X | ASUS Dual GeForce RTX 4060 Ti OC | XFX Speedster QICK 308 Radeon RX 7600 Black Edition | Sapphire Pulse Radeon RX 7700 XT | |
|---|---|---|---|---|---|---|---|---|---|---|---|
| Noise | 3% | -10% | -24% | -2% | -9% | -9% | -1% | -2% | 2% | -1% | |
| off / environment * (dB) | 25.3 | 25.3 -0% | 25.4 -0% | 25.4 -0% | 24.7 2% | 30 -19% | 30 -19% | 25.8 -2% | 25.4 -0% | 25.4 -0% | 25 1% |
| Idle Minimum * (dB) | 26 | 25.7 1% | 29 -12% | 39 -50% | 26.8 -3% | 30.1 -16% | 30.2 -16% | 25.9 -0% | 26.7 -3% | 26.3 -1% | 27.4 -5% |
| Idle Average * (dB) | 26 | 25.8 1% | 29.2 -12% | 39 -50% | 27.2 -5% | 30.1 -16% | 30.2 -16% | 25.9 -0% | 26.7 -3% | 26.3 -1% | 27.5 -6% |
| Idle Maximum * (dB) | 26.5 | 25.8 3% | 29.3 -11% | 39 -47% | 27.3 -3% | 30.1 -14% | 30.2 -14% | 25.9 2% | 26.7 -1% | 26.3 1% | 28 -6% |
| Load Average * (dB) | 39.5 | 34.3 13% | 35.1 11% | 39 1% | 30.7 22% | 30.2 24% | 31.8 19% | 30.3 23% | 29.3 26% | 29.6 25% | 32.6 17% |
| Witcher 3 ultra * (dB) | 38.3 | 37.1 3% | 44.2 -15% | 41.5 -8% | 42.6 -11% | 40.2 -5% | 45.2 -18% | 42.5 -11% | 39.6 -3% | 42.1 -10% | |
| Load Maximum * (dB) | 37.7 | 36.9 2% | 49.7 -32% | 42.1 -12% | 43 -14% | 44.7 -19% | 41.1 -9% | 43.5 -15% | 46 -22% | 39.4 -5% | 37.6 -0% |
* ... smaller is better
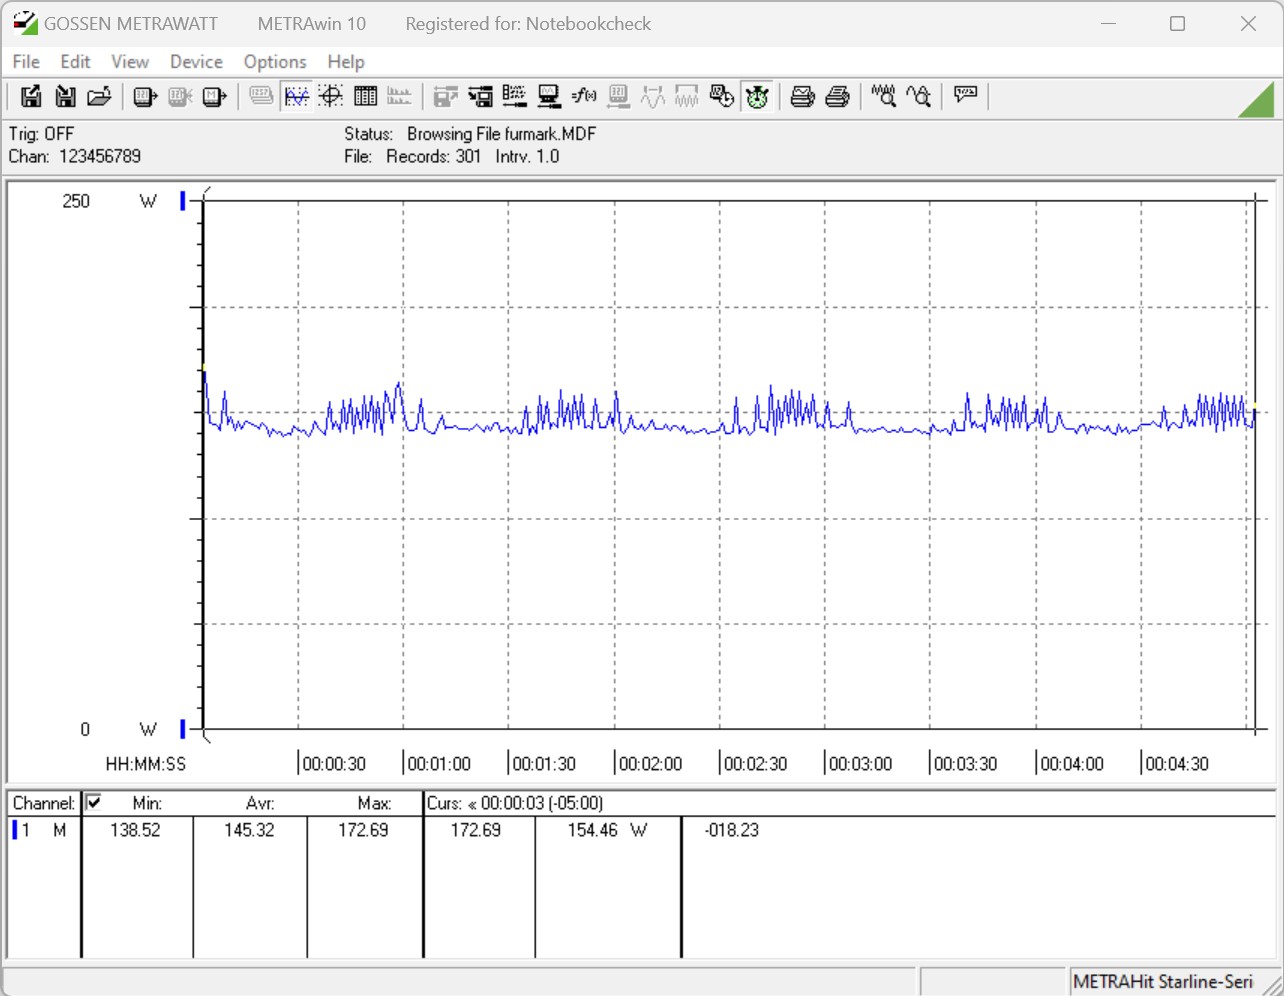
Temperatures and Power Consumption
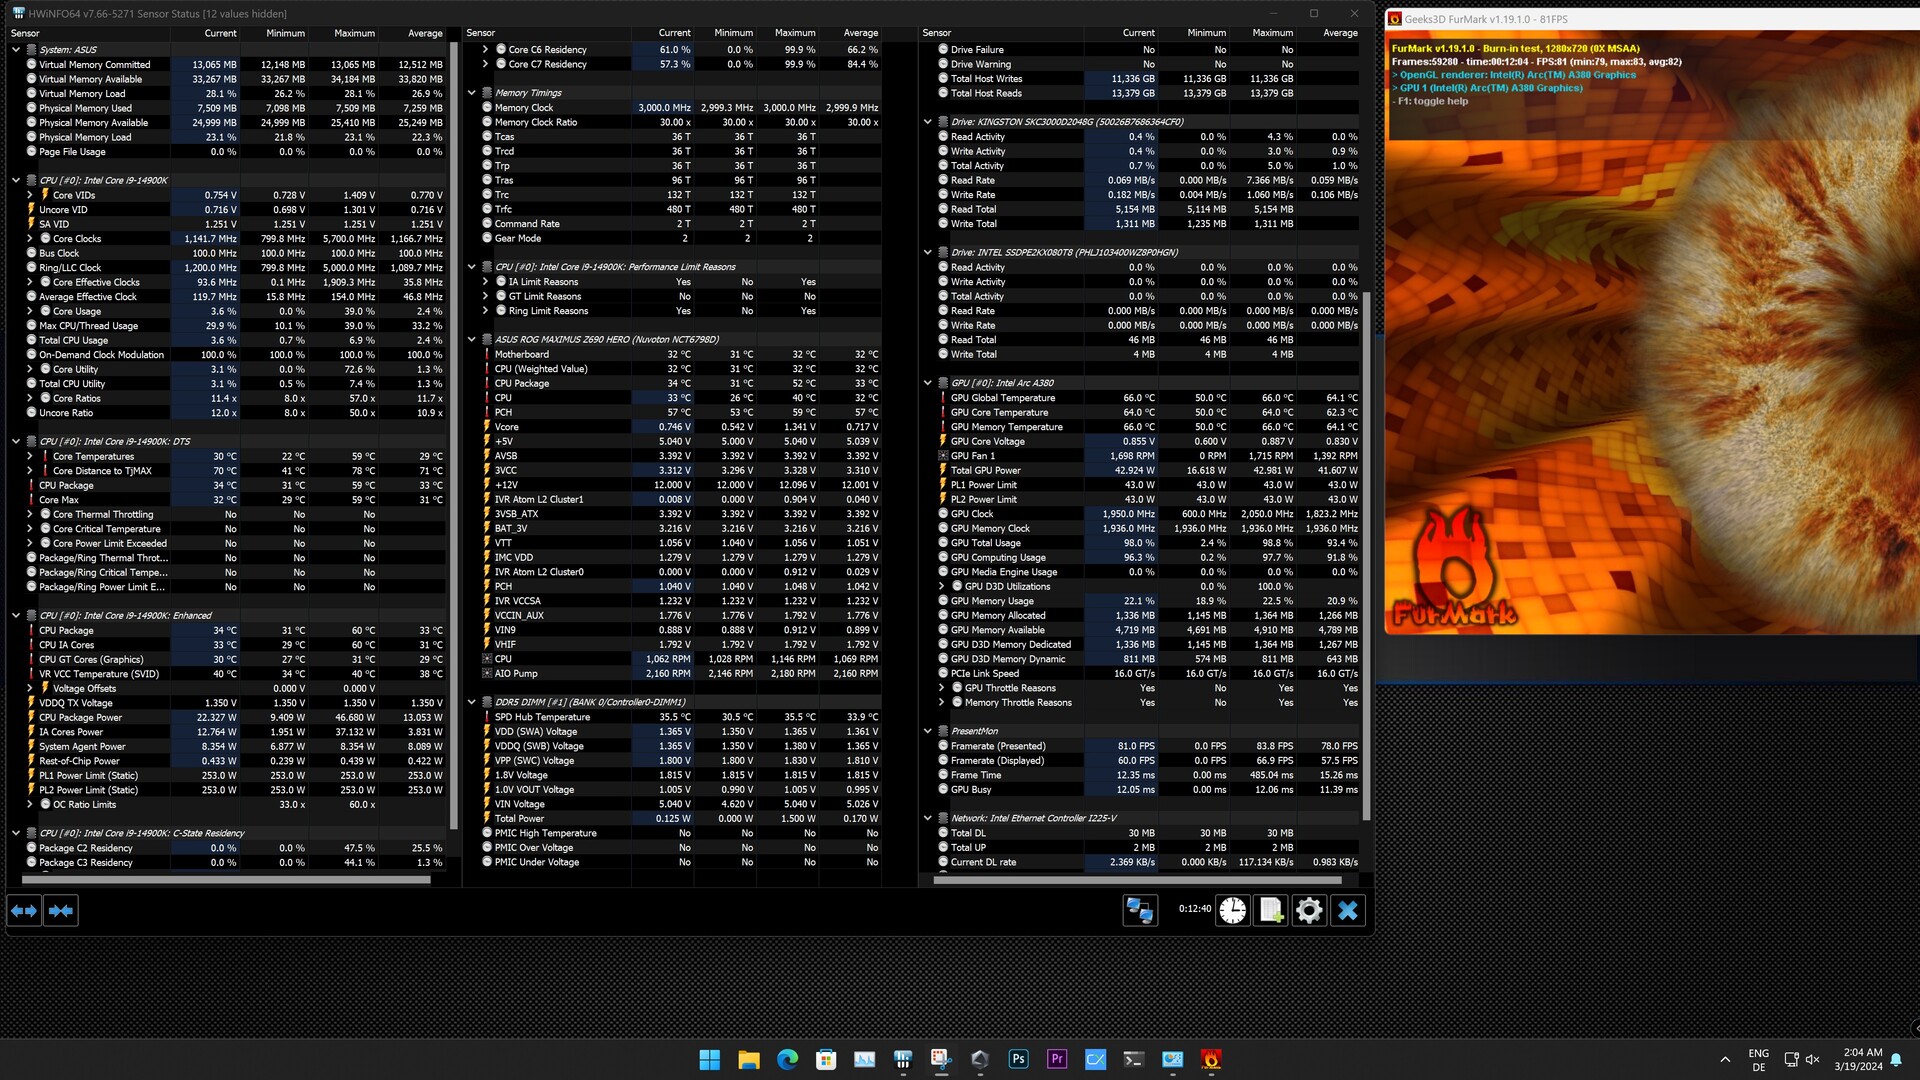
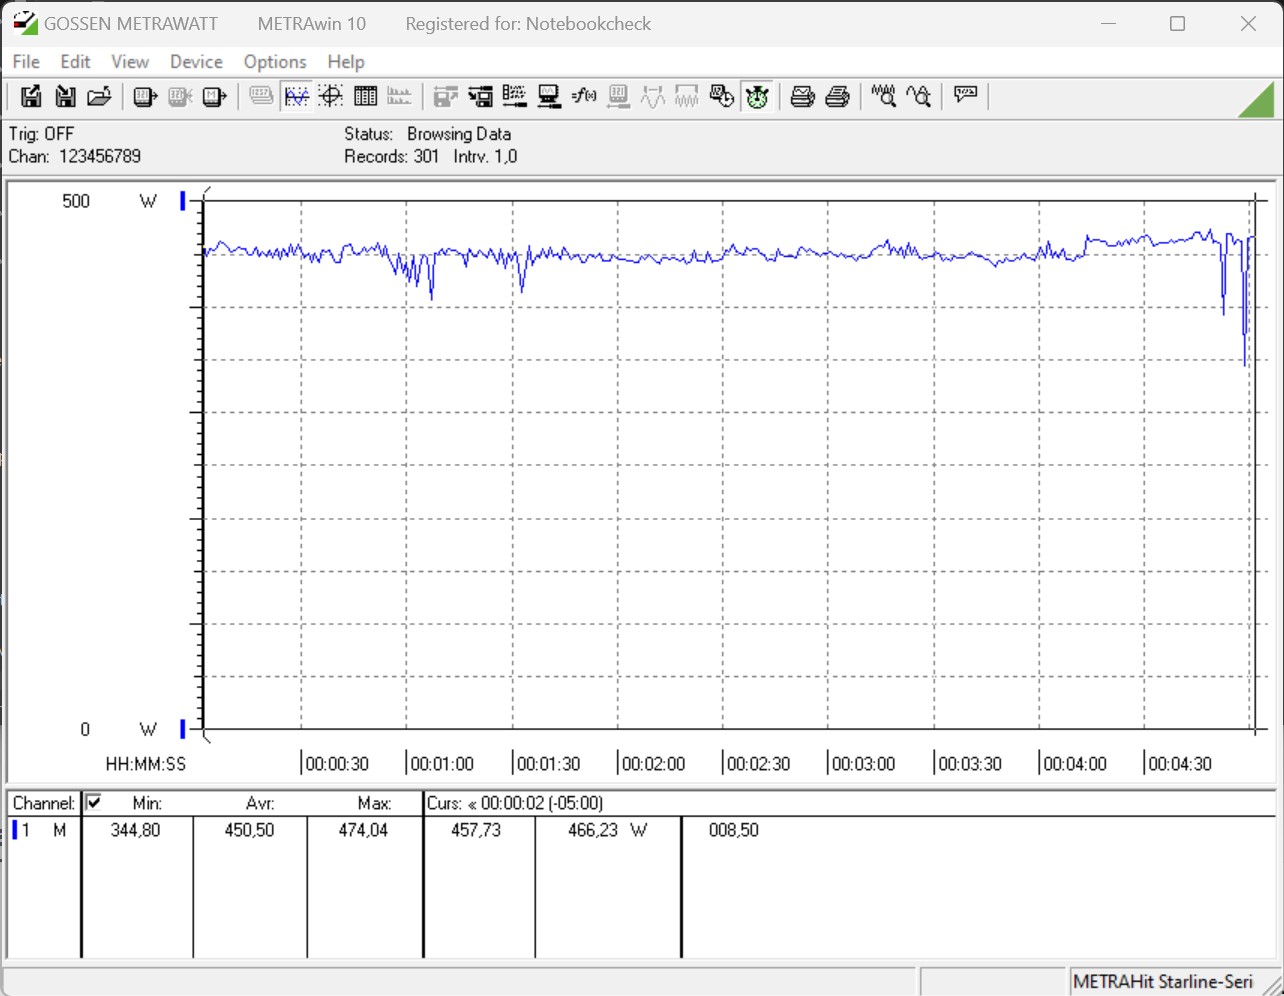
The fact that the Sparkle Arc A380 Elf only receives power via the PCI Express slot makes it clear that this is an efficient graphics card. In our comparison, the test system based on the Sparkle Arc A380 Elf is by far the most efficient. Our measurements only show 145 watts as average value during the stress test, even if it reaches about 143 watts during gaming. In our efficiency comparison, this is even sufficient to surpass the Acer Predator BiFrost Arc A750 OC and ASRock Arc A580 Challenger OC.
At no time does our test unit run into any temperature problems. Under load, the GPU and the VRAM temperature only increase to 66 °C (151 °F). So there is still sufficient room at the top to optimize the questionable fan curve in the state of delivery.
| Power Consumption / The Witcher 3 ultra (external Monitor) | |
| KFA2 GeForce RTX 3070 Ti SG (Idle: 88.9 W) | |
| AMD Radeon RX 7900 GRE | |
| KFA2 GeForce RTX 4070 Ti EX Gamer | |
| AMD Radeon RX 7800 XT | |
| Sapphire Pulse Radeon RX 6750 XT | |
| KFA2 GeForce RTX 4070 EX Gamer | |
| XFX Speedster QICK 308 Radeon RX 7600 Black Edition | |
| Sapphire Nitro+ Radeon RX 6650 XT | |
| Acer Predator BiFrost Arc A750 OC | |
| ASRock Arc A580 Challenger OC | |
| KFA2 GeForce RTX 4060 Ti EX | |
| Acer Predator BiFrost Arc A770 OC, 16GB GDDR6 | |
| KFA2 GeForce RTX 4060 1-Click-OC 2X | |
| Sparkle Intel Arc A380 Elf | |
| Power Consumption / FurMark 1.19 GPU Stress Test (external Monitor) | |
| KFA2 GeForce RTX 3070 Ti SG (Idle: 88.9 W) | |
| Acer Predator BiFrost Arc A750 OC | |
| KFA2 GeForce RTX 4070 Ti EX Gamer | |
| AMD Radeon RX 7900 GRE | |
| Sapphire Pulse Radeon RX 6750 XT | |
| AMD Radeon RX 7800 XT | |
| Acer Predator BiFrost Arc A770 OC, 16GB GDDR6 | |
| ASRock Arc A580 Challenger OC | |
| XFX Speedster QICK 308 Radeon RX 7600 Black Edition | |
| Sapphire Nitro+ Radeon RX 6650 XT | |
| KFA2 GeForce RTX 4070 EX Gamer | |
| KFA2 GeForce RTX 4060 Ti EX | |
| KFA2 GeForce RTX 4060 1-Click-OC 2X | |
| Sparkle Intel Arc A380 Elf | |
* ... smaller is better
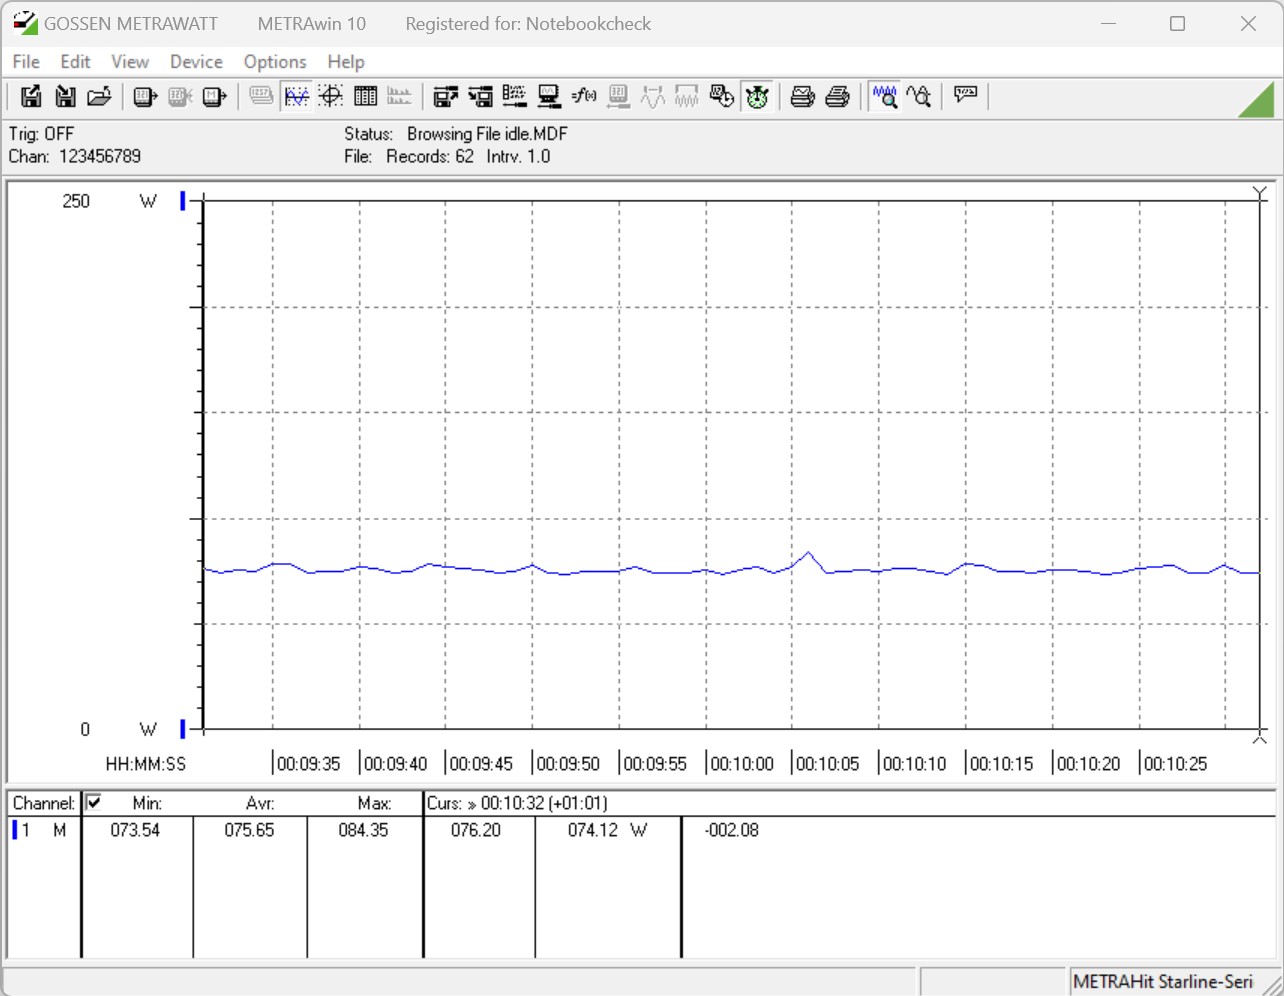
Power Consumption With External Monitor
Pros
Cons
Verdict - A simple Intel Arc graphics card with 6 GB of VRAM
The Sparkle Arc A380 Elf is a fairly simple graphics card for desktop PCs. With 6 GB of VRAM it is very attractive, and at only 129 Euros (~$141), the purchase price also won't leave too much of a dent in your budget. At the same time, you also shouldn't expect too much from the DG2-128 GPU chip. With only 1,024 shading units, the graphics performance has shrunk significantly compared to the faster Intel Arc graphics cards. Considering its performance, the graphics card shouldn't really cost more than 100 Euros (~$109). The small graphics card will have a hard time serving as a pure gaming graphics card in a system. However, there are also many games that can still be played with adequate frame rates.
The Sparkle Arc A380 Elf is currently the most affordable alternative to AMD and Nvidia that allows you to play many games in 1080p. But the largest advantage of the Intel Arc A380 lies in its AV1 encoding and decoding.
Due to the affordable price, the design looks and feels cheap, although it still fulfills its purpose. The manufacturer keeps the temperatures under control at all times, but this also shouldn't be very difficult in a 75-Watt graphics card. What is less attractive is the continuous revving up of the fan under load, making a manual adjustment necessary. In addition, our test unit of the Sparkle Arc A380 Elf struggles with some considerable coil whine that can even be heard through an enclosed PC case. Overall, the graphics card brings an up and down of advantages and disadvantages, but due to the forementioned disadvantages, we are unable to give a direct purchase recommendation. Those who still want to give the Intel Arc graphics cards a chance should take a closer look at the ASRock Arc A580 Challenger OC instead. Even though that is slightly more expensive, it offers a comparatively higher amount of performance than the Sparkle Arc A380 Elf.
Prices and Availability
The Sparkle Arc A380 Elf is currently available for ~$130 from Amazon, for example.
Transparency
The selection of devices to be reviewed is made by our editorial team. The test sample was freely purchased by the author at his/her own expense. The lender had no influence on this review, nor did the manufacturer receive a copy of this review before publication. There was no obligation to publish this review. As an independent media company, Notebookcheck is not subjected to the authority of manufacturers, retailers or publishers.
This is how Notebookcheck is testing
Every year, Notebookcheck independently reviews hundreds of laptops and smartphones using standardized procedures to ensure that all results are comparable. We have continuously developed our test methods for around 20 years and set industry standards in the process. In our test labs, high-quality measuring equipment is utilized by experienced technicians and editors. These tests involve a multi-stage validation process. Our complex rating system is based on hundreds of well-founded measurements and benchmarks, which maintains objectivity. Further information on our test methods can be found here.

