Notebookcheck Logo

Ratchet & Clank Rift Apart: Laptop and desktop benchmarks

Pretty sci-fi spectacle. Although AMD graphics cards currently still have to make do without ray tracing, the PC version of Ratchet & Clank: Rift Apart is one of the better console ports of the past few years. We ran a lot of benchmarks - including DLSS and Frame Generation.
Ratchet & Clank Rift Apart

Notebooks used in this review

XMG Neo 17 E23 (RTX 4090)
Schenker Key 17 Pro E23 (RTX 4080)
XMG Pro 15 E23 (RTX 4070 & RTX 4060)
XMG Focus 15 E23 (RTX 4050)
Asus ROG Strix Scar 17 (RTX 3080 Ti)
Acer Predator Helios 300 (RTX 3070 Ti)
Asus ROG Zephyrus G14 (RX 6800S & 680M)
 

We are currently running our gaming benchmarks with these notebooks. Clicking on the photos will take you to the respective manufacturer's homepage. All other test systems (tower PCs, mini PCs, ...) are listed at the end of the article.

Technical aspects

After the debacle around The Last of Us and its extreme VRAM requirements, we were very sceptical about Sony Entertainment's next PC adaptation in the run-up. But breathe a sigh of relief: Despite not exactly low system requirements, Rift Apart has not become an absolute hardware guzzler. The Dutch studio Nixxes Software, which was responsible for the PC version in this case, brings a lot of experience with it, whether it's through the last Deus Ex-, Tomb Raider- or Spider-Man-Parts.

Ratchet & Clank Rift Apart

Just like the PS5 original, Rift Apart also shines on the PC with very good to outstanding visuals, which are currently among the most beautiful and highest-quality on the respective platform. Whether textures, characters, effects or general richness of detail: The technology is on a high level, whereby the colorful comic look is, of course, a matter of taste.

Ratchet & Clank Rift Apart

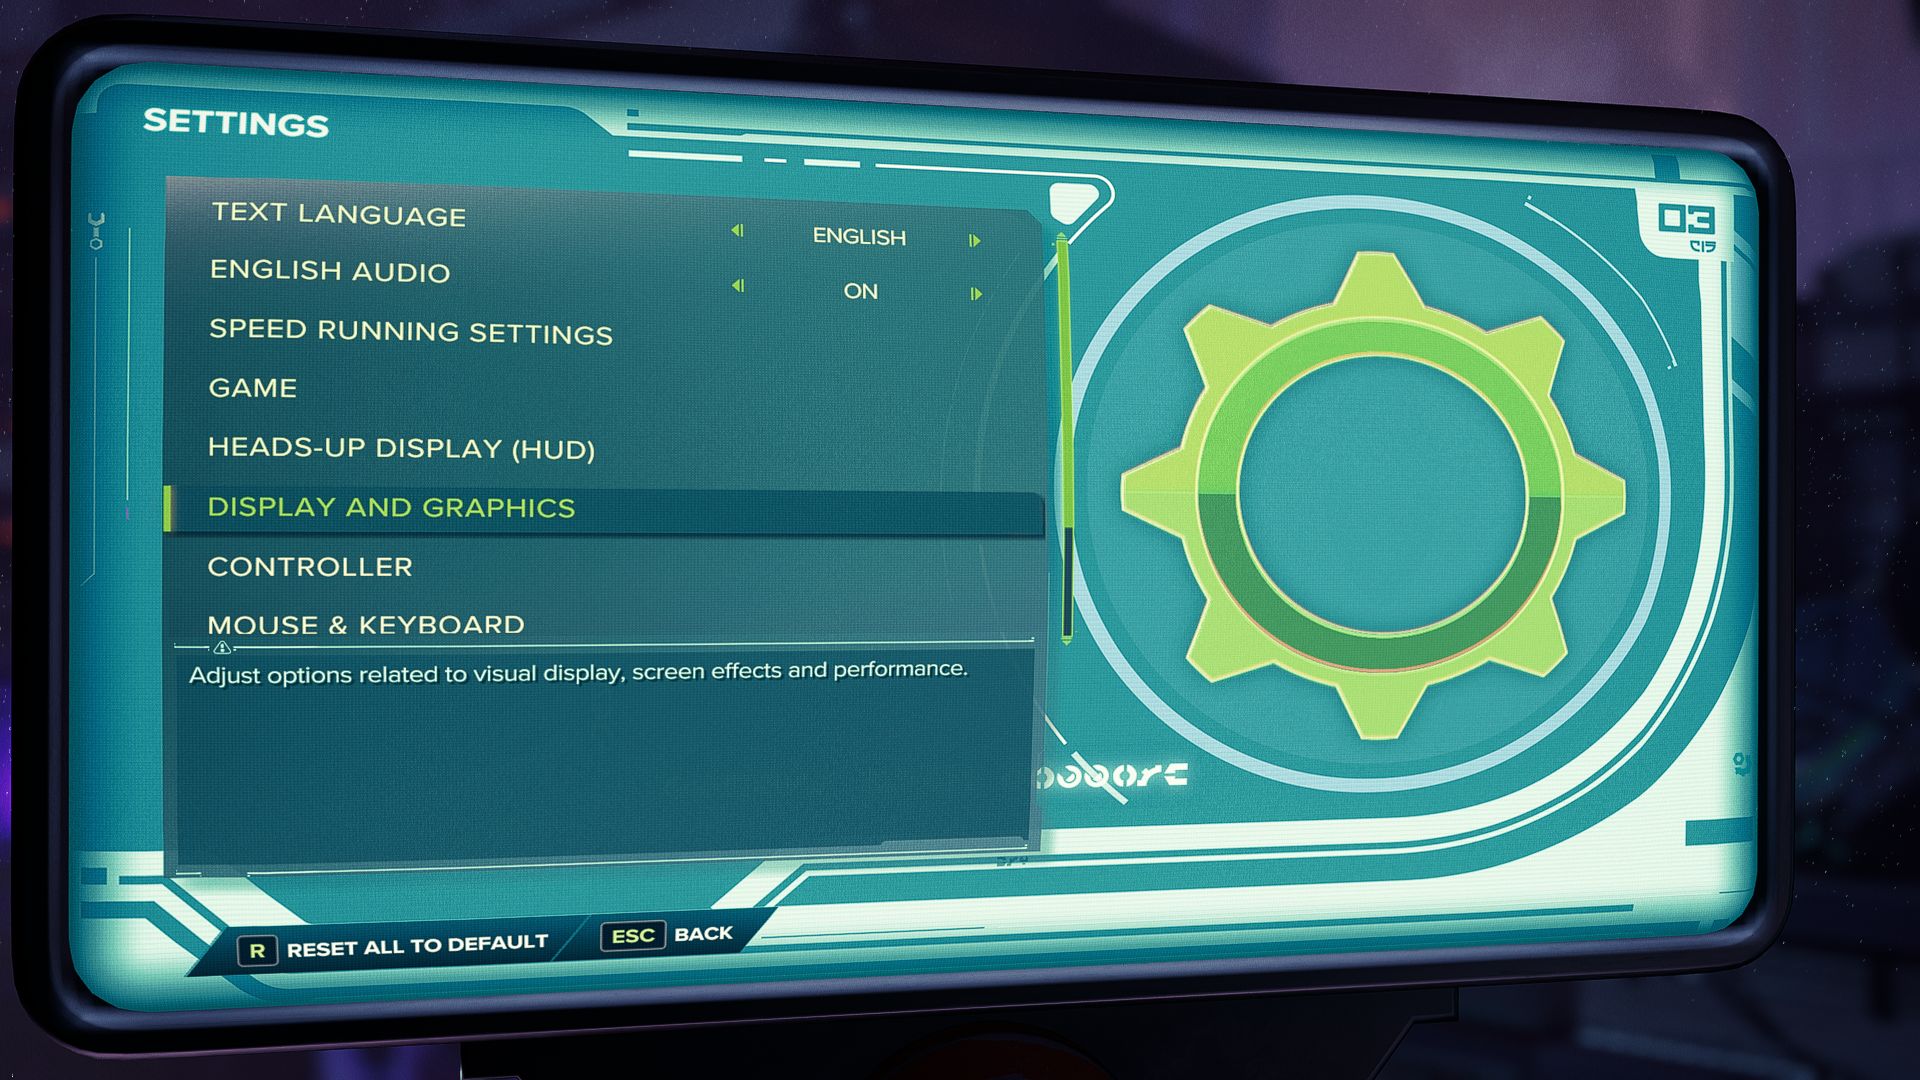
The title also deserves great praise for the extensive graphics menu, which is conveniently accessible both outside and inside the game. The options have been divided into two tabs. While the display menu takes care of the resolution, the picture mode, the edge smoothing (SMAA, TAA and DLAA are available) and VSync, there are more than 20 individual settings in the graphics menu, which can partly be controlled automatically via preset.

Ratchet & Clank Rift Apart
 

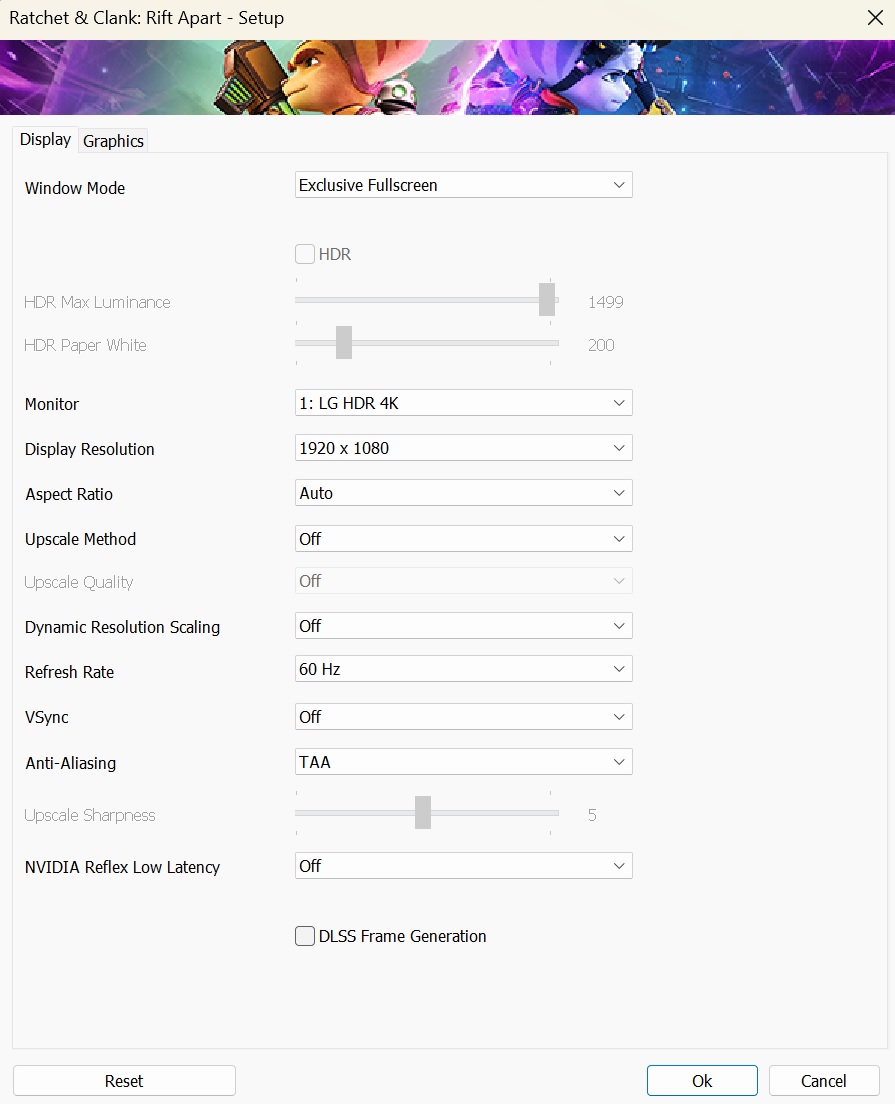
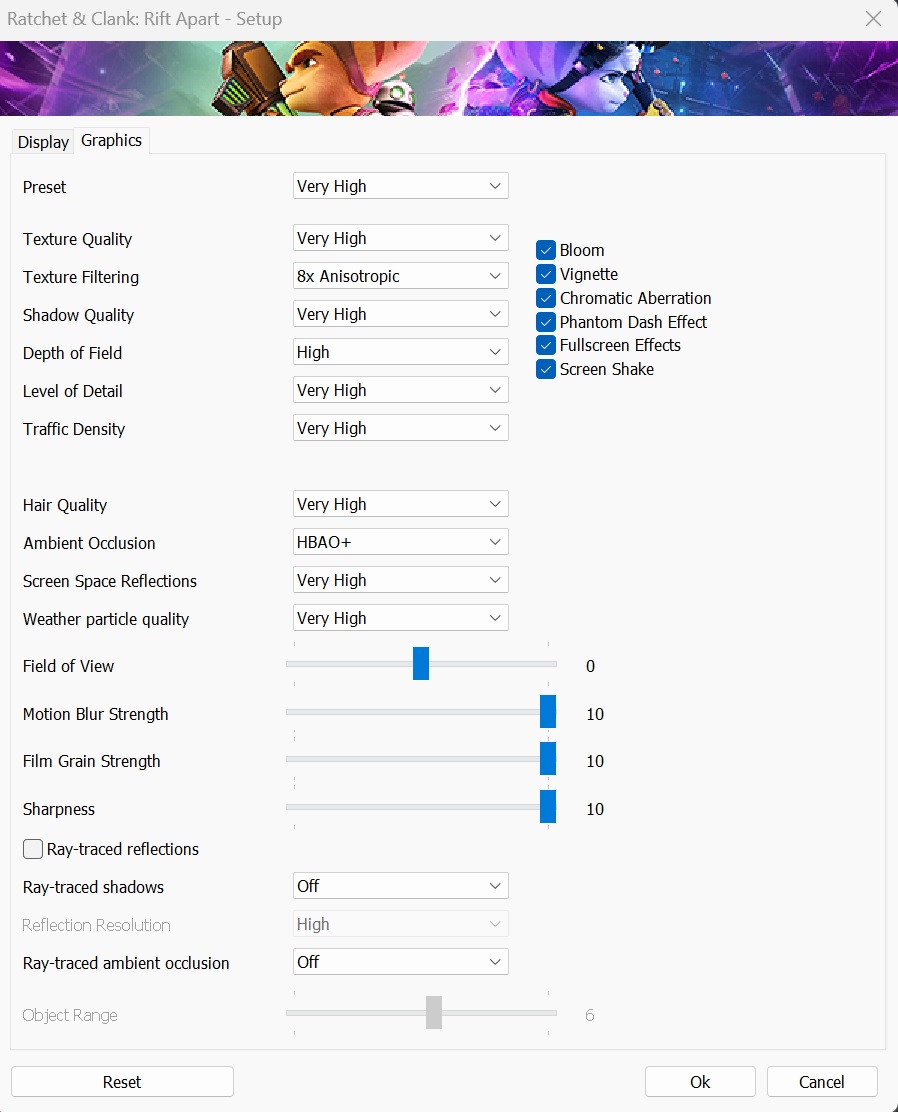
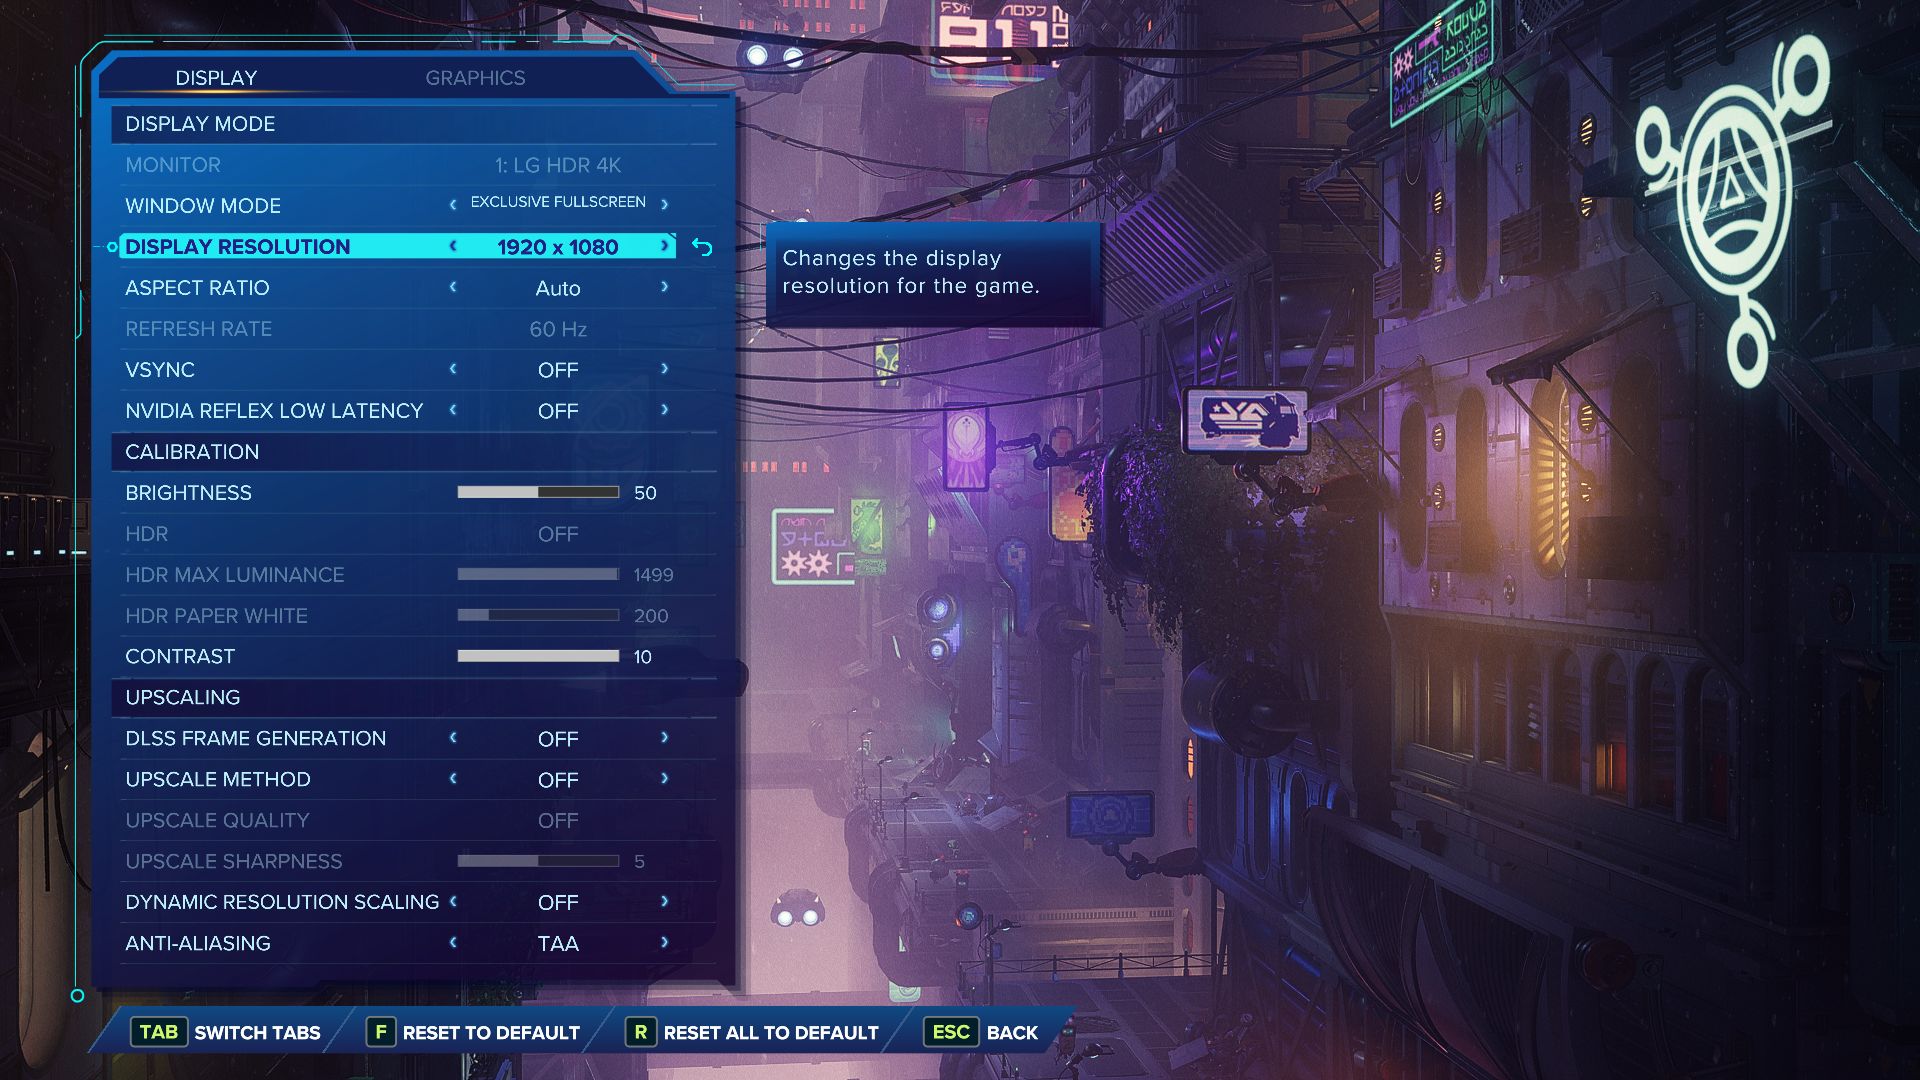
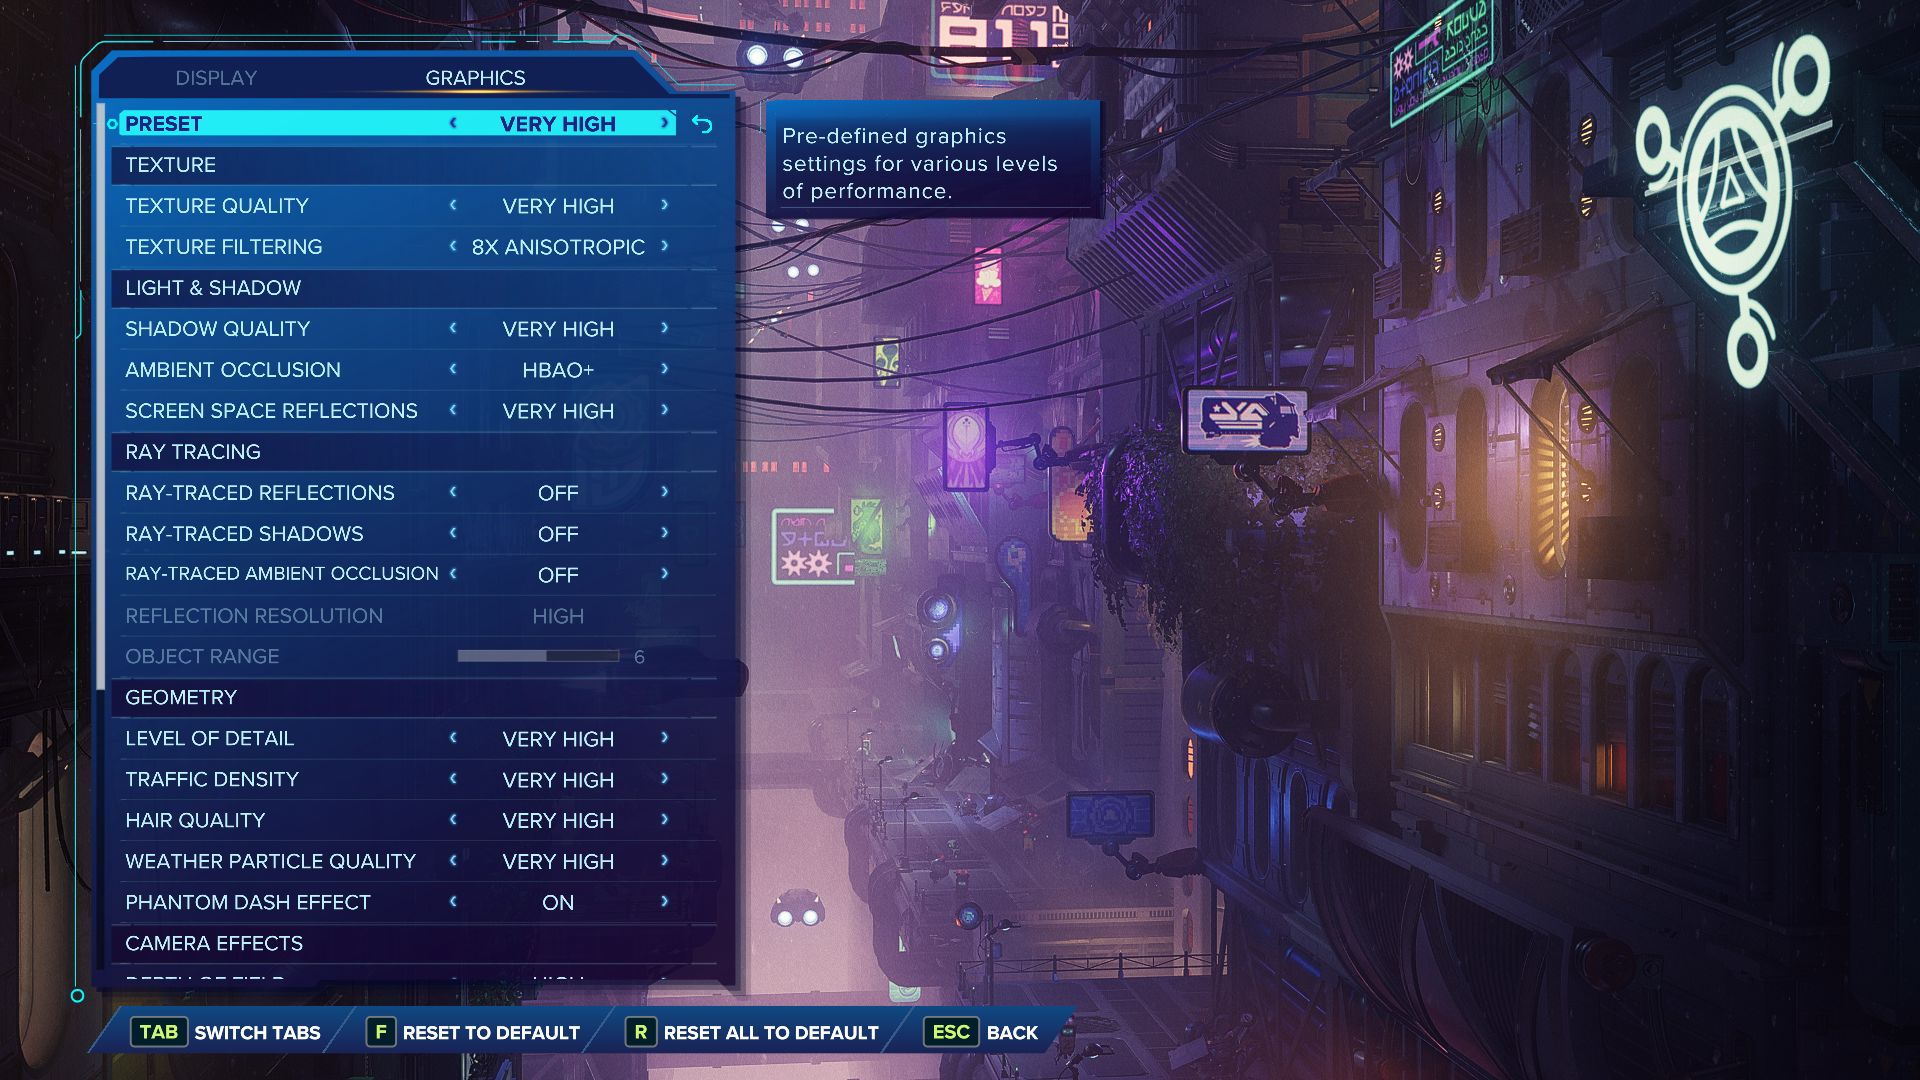
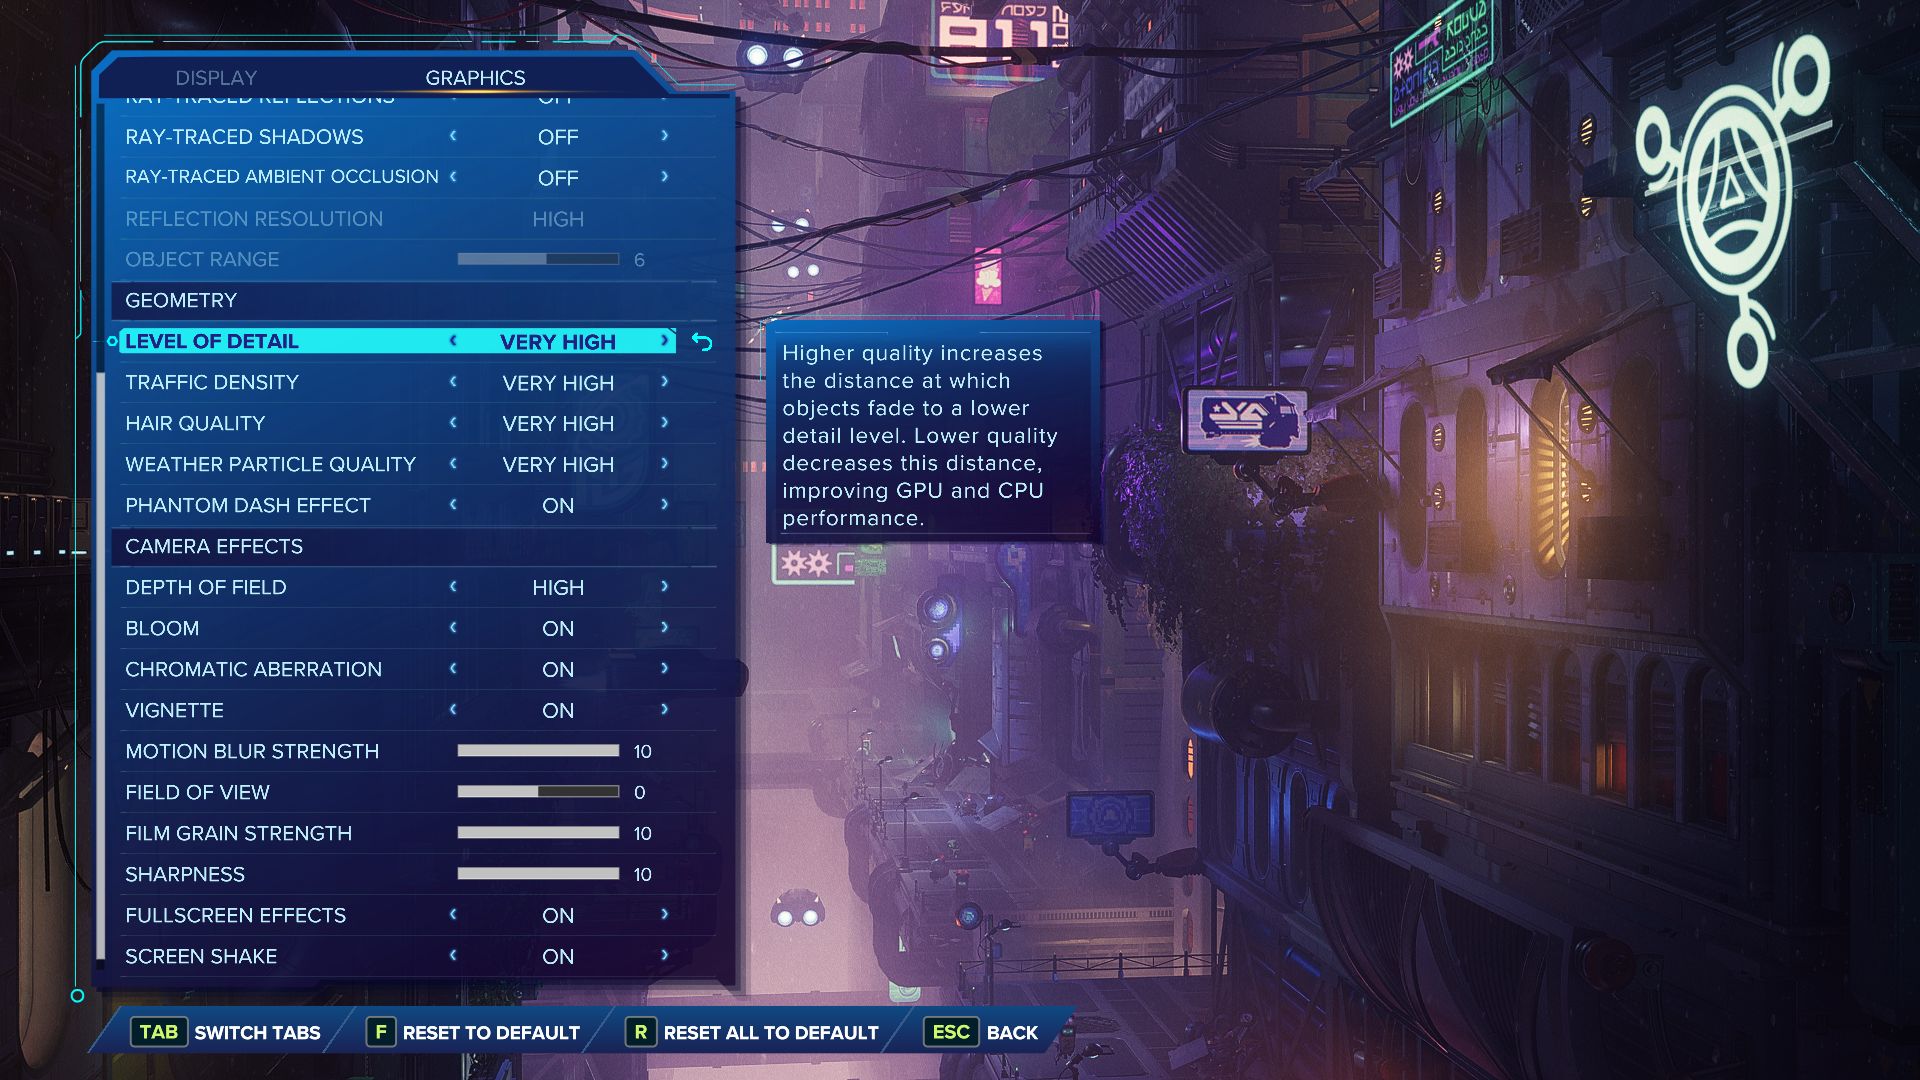
In general, Rift Apart offers numerous modern features like upscaling (Nvidia DLSS, AMD FSR, Intel XeSS) and ray tracing (reflections, shadows, ambient occlusion) although the latter - as mentioned at the beginning - unfortunately cannot be activated on AMD GPUs yet. Owners of Nvidia chips from the RTX 4000 generation, on the other hand, can be happy about the presence of Frame Generation. The fact that there are no comparison pictures for the different settings can be forgiven in view of the available descriptions. Top: Changes to the graphics options do not require a restart of the game. Apart from one crash, Rift Apart ran stably in our benchmarks.

Benchmark

We use the beginning of the game for the speed measurements since the initial platform ride (see video) is very well suited for benchmarks due to the many figures shown and the identical sequence. The frame rate of the 25-second sequence is recorded with the tool CapFrameX. Although the title "only" plays in the third-person perspective, we would recommend at least 40 FPS because of the fast sequence (movement, fights, etc.).

Results


FHD (1,920 x 1,080)

As long as you limit yourself to 1,920 x 1,080 pixels, the system requirements are quite moderate. Although even one of the strongest iGPUs, the Radeon 680M, only supports low details in Full-HD with just under 30 FPS; current mid-range models like the Geforce RTX 4050, on the other hand, also manage high to maximum settings smoothly.

Ratchet & Clank Rift Apart
    1920x1080 Low Preset     1920x1080 Medium Preset AA:T     1920x1080 High Preset AA:T     1920x1080 Very High Preset AA:T
NVIDIA GeForce RTX 4080, i9-12900K
Desktop-PC
186.6 (93.4min, 133.2P0.1, 150.4P1) fps ∼100%
163.5 (76.2min, 102.9P0.1, 115.4P1) fps ∼100%
135.6 (65.8min, 78.5P0.1, 96.8P1) fps ∼100%
AMD Radeon RX 7900 XTX, i9-12900K
Desktop-PC
175.5 (120.1min, 134.6P0.1, 150.4P1) fps ∼94%
151.5 (99.3min, 104.1P0.1, 113.7P1) fps ∼93%
126.1 (57.7min, 83.9P0.1, 92.6P1) fps ∼93%
NVIDIA GeForce RTX 4090 Laptop GPU, i9-13900HX
XMG Neo 17 E23
161.8 (82.8min, 111.7P0.1, 130P1) fps ∼87%
136.6 (51.2min, 61.8P0.1, 89.9P1) fps ∼84%
115.4 (47.7min, 53.7P0.1, 75.6P1) fps ∼85%
NVIDIA GeForce RTX 4080 Laptop GPU, i9-13900HX
Schenker Key 17 Pro E23
151.8 (49.4min, 113.2P0.1, 124P1) fps ∼81%
124 (33.1min, 60.2P0.1, 81.1P1) fps ∼76%
107.3 (35.2min, 50.4P0.1, 63.7P1) fps ∼79%
NVIDIA GeForce RTX 3080 Ti Laptop GPU, i9-12900H
Asus ROG Strix Scar 17 G733ZX
115.2 (70.1min, 79.7P0.1, 95.7P1) fps ∼62%
93.7 (20.6min, 34.8P0.1, 60.5P1) fps ∼57%
80.3 (11.7min, 22P0.1, 43.5P1) fps ∼59%
NVIDIA GeForce RTX 4070 Laptop GPU, i9-13900HX
XMG Pro 15 E23
79.5 (61.2min, 62.6P0.1, 65.4P1) fps ∼43%
64.7 (35min, 38.8P0.1, 44P1) fps ∼40%
58.1 (26min, 27P0.1, 36.2P1) fps ∼43%
NVIDIA GeForce RTX 3070 Ti Laptop GPU, i7-12700H
Acer Predator Helios 300 PH315-55
73.9 (51.7min, 57.4P0.1, 61.5P1) fps ∼40%
59.5 (32.2min, 37.2P0.1, 39.4P1) fps ∼36%
55 (17.2min, 29.6P0.1, 35.5P1) fps ∼41%
NVIDIA GeForce RTX 4060 Laptop GPU, i9-13900HX
XMG Pro 15 E23
73.4 (57min, 57.8P0.1, 61.4P1) fps ∼39%
60.6 (37.7min, 39P0.1, 40.2P1) fps ∼37%
54 (30.3min, 32.6P0.1, 35.5P1) fps ∼40%
NVIDIA GeForce RTX 4050 Laptop GPU, i9-13900HX
XMG Focus 15 E23
67.1 (50.9min, 51.5P0.1, 55.9P1) fps ∼36%
49.4 (29min, 29.4P0.1, 30.8P1) fps ∼30%
41.6 (16.8min, 20P0.1, 25.3P1) fps ∼31%
AMD Radeon RX 6800S, R9 6900HS
Asus ROG Zephyrus G14
71.5 (50.3min, 51.6P0.1, 55.7P1) fps ∼100%
62.9 (21.6min, 45.9P0.1, 48.6P1) fps ∼34%
44.7 (28.6min, 28.7P0.1, 29.1P1) fps ∼27%
37.8 (24.4min, 24.8P0.1, 25.1P1) fps ∼28%
AMD Radeon 680M, R9 6900HS
Asus ROG Zephyrus G14
29.9 (21.1min, 22.6P0.1, 23.4P1) fps ∼42%
25.5 (19.3min, 19.4P0.1, 20.1P1) fps ∼14%
21.1 (13.5min, 13.6P0.1, 15.7P1) fps ∼13%
18 (10.1min, 10.8P0.1, 12.6P1) fps ∼13%

QHD (2,560 x 1,440)

For QHD displays, it should tend to be a high-end GPU. For example, 2560 x 1,440 pixels and the Very High preset run with a GeForce RTX 3070 Ti smoothly.

Ratchet & Clank Rift Apart
    2560x1440 Very High Preset AA:T
NVIDIA GeForce RTX 4080, i9-12900K
Desktop-PC
127.6 (63.3min, 72.9P0.1, 87P1) fps ∼100%
AMD Radeon RX 7900 XTX, i9-12900K
Desktop-PC
114.3 (79.5min, 82P0.1, 86.8P1) fps ∼90%
NVIDIA GeForce RTX 4090 Laptop GPU, i9-13900HX
XMG Neo 17 E23
107.1 (27.6min, 56P0.1, 67.7P1) fps ∼84%
NVIDIA GeForce RTX 4080 Laptop GPU, i9-13900HX
Schenker Key 17 Pro E23
91.1 (44.6min, 48.7P0.1, 56.5P1) fps ∼71%
NVIDIA GeForce RTX 3080 Ti Laptop GPU, i9-12900H
Asus ROG Strix Scar 17 G733ZX
65 (17.4min, 24.9P0.1, 41P1) fps ∼51%
NVIDIA GeForce RTX 4070 Laptop GPU, i9-13900HX
XMG Pro 15 E23
49.1 (19.5min, 21.8P0.1, 32.1P1) fps ∼38%
NVIDIA GeForce RTX 4060 Laptop GPU, i9-13900HX
XMG Pro 15 E23
46.1 (18.9min, 30.1P0.1, 31.1P1) fps ∼36%
NVIDIA GeForce RTX 3070 Ti Laptop GPU, i7-12700H
Acer Predator Helios 300 PH315-55
45.8 (19.2min, 19.9P0.1, 29.5P1) fps ∼36%
NVIDIA GeForce RTX 4050 Laptop GPU, i9-13900HX
XMG Focus 15 E23
31.4 (18.7min, 19.2P0.1, 20.2P1) fps ∼25%

UHD (3,840 x 2,160)

As usual, things really get going in the 4K range. A mixture of 3,840 x 2,160 pixels and the highest preset screams for a lot of VRAM and a GeForce RTX 3080 Ti or better.

Ratchet & Clank Rift Apart
    3840x2160 Very High Preset AA:T
NVIDIA GeForce RTX 4080, i9-12900K
Desktop-PC
85 (57min, 58.4P0.1, 61.2P1) fps ∼100%
AMD Radeon RX 7900 XTX, i9-12900K
Desktop-PC
80.2 (61min, 61.9P0.1, 63.3P1) fps ∼94%
NVIDIA GeForce RTX 4090 Laptop GPU, i9-13900HX
XMG Neo 17 E23
67.6 (37.5min, 42.1P0.1, 45.8P1) fps ∼80%
NVIDIA GeForce RTX 4080 Laptop GPU, i9-13900HX
Schenker Key 17 Pro E23
57.9 (27.1min, 28.9P0.1, 38.8P1) fps ∼68%
NVIDIA GeForce RTX 3080 Ti Laptop GPU, i9-12900H
Asus ROG Strix Scar 17 G733ZX
41.6 (16.6min, 22.3P0.1, 27.5P1) fps ∼49%
NVIDIA GeForce RTX 4070 Laptop GPU, i9-13900HX
XMG Pro 15 E23
33.2 (18.4min, 18.4P0.1, 21.6P1) fps ∼39%
NVIDIA GeForce RTX 3070 Ti Laptop GPU, i7-12700H
Acer Predator Helios 300 PH315-55
30.6 (18.9min, 20P0.1, 21.5P1) fps ∼36%
NVIDIA GeForce RTX 4060 Laptop GPU, i9-13900HX
XMG Pro 15 E23
28.8 (8.21min, 13.2P0.1, 19.7P1) fps ∼34%
NVIDIA GeForce RTX 4050 Laptop GPU, i9-13900HX
XMG Focus 15 E23
15.6 (11.8min, 11.8P0.1, 11.9P1) fps ∼18%

Raytracing

The ray tracing performance varies greatly depending on the graphics card. For 1,920 x 1,080 pixels and maximum settings, for example, an RTX 4060. It gets curious with 3,840 x 2,160 pixels when DLSS (we chose the Quality setting) and Frame Generation are enabled. While the Desktop RTX 4080 and the Notebook RTX 4090 delivered (almost) identical rates in comparison to Full HD without DLSS and FG, the performance partly dropped extremely with weaker GPUs (see RTX 4050 to RTX 4070). Possibly, the VRAM is particularly heavily stressed here, so everything below 16 GB leads to problems.

Ratchet & Clank Rift Apart
    1920x1080 Very High Preset + Very High Raytracing AA:T     3840x2160 Very High Preset + Very High Raytracing + DLSS Quality + FG
NVIDIA GeForce RTX 4080, i9-12900K
Desktop-PC
105.5 (60min, 67.6P0.1, 75P1) fps ∼100%
104.8 (52.4min, 60.6P0.1, 71.8P1) fps ∼100%
NVIDIA GeForce RTX 4090 Laptop GPU, i9-13900HX
XMG Neo 17 E23
90.9 (1.445min, 39.1P0.1, 56.8P1) fps ∼86%
84.4 (32min, 35.8P0.1, 47.5P1) fps ∼81%
NVIDIA GeForce RTX 4080 Laptop GPU, i9-13900HX
Schenker Key 17 Pro E23
75.8 (0.625min, 39.3P0.1, 46.7P1) fps ∼72%
36.6 (12.4min, 14.6P0.1, 24.5P1) fps ∼35%
NVIDIA GeForce RTX 3080 Ti Laptop GPU, i9-12900H
Asus ROG Strix Scar 17 G733ZX
59.4 (2.1min, 18.7P0.1, 33.4P1) fps ∼56%
NVIDIA GeForce RTX 4070 Laptop GPU, i9-13900HX
XMG Pro 15 E23
44.8 (1.446min, 13.6P0.1, 20.5P1) fps ∼42%
13.3 (4.87min, 4.92P0.1, 5.61P1) fps ∼13%
NVIDIA GeForce RTX 4060 Laptop GPU, i9-13900HX
XMG Pro 15 E23
44.5 (1.318min, 20.1P0.1, 23.2P1) fps ∼42%
12 (4.07min, 4.33P0.1, 5.25P1) fps ∼11%
NVIDIA GeForce RTX 3070 Ti Laptop GPU, i7-12700H
Acer Predator Helios 300 PH315-55
38.3 (1.283min, 3.92P0.1, 17.7P1) fps ∼36%
NVIDIA GeForce RTX 4050 Laptop GPU, i9-13900HX
XMG Focus 15 E23
25.6 (0.554min, 2P0.1, 14.5P1) fps ∼24%
6.03 (2.59min, 2.6P0.1, 2.83P1) fps ∼6%

Note

Since gaming tests are very time-consuming and often restricted by installation or activation limits, we can only provide you with a part of the benchmarks for the publication of the articles. Further graphics cards will be installed later.

Overview

Show Restrictions
PosModel< PrevNext >Ratchet & Clank Rift Apart
 Ratchet & Clank Rift Apart (2023)
low
1920x1080
Low Preset
med.
1920x1080
Medium Preset
TAA
high
1920x1080
High Preset
TAA
ultra
1920x1080
Very High Preset
TAA
QHD
2560x1440
Very High Preset
TAA
4K
3840x2160
Very High Preset
TAA
NVIDIA GeForce RTX 4090
236n2
224n2
194.85n2
168.45n2
157.15n2
112.45n2
AMD Radeon RX 7900 XTX
230
190.75n2
161.15n2
137.35n2
121.35n2
83.4n2
NVIDIA GeForce RTX 4080 Super
230.5n2
228.5n2
193.6n2
170.35n2
143.75n2
92.1n2
NVIDIA GeForce RTX 4080
186.6
163.5
135.6
127.6
85
AMD Radeon RX 7900 GRE
161.05n2
143.4n2
121.25n2
106.15n2
88n2
58.9n2
AMD Radeon RX 6950 XT
167.4
146.3
123.3
109.3
93.2
64.2
NVIDIA GeForce RTX 4090 Laptop GPU
163.4
158.7n2
136n2
113.25n2
102.9n2
67.6
NVIDIA GeForce RTX 3090
192.8
169.9
134.1
114.9
97.9
62.3
AMD Radeon RX 7800 XT
168.6
144.6
119.8
105.4
85.7
54.6
AMD Radeon RX 7900M
86.2
83.6
54.8
NVIDIA GeForce RTX 4080 Laptop GPU
151.8
124
107.3
91.1
57.9
NVIDIA GeForce RTX 3080 12 GB
172.6
135.6
117.1
94.7
60.1
AMD Radeon RX 6800
133.5
117.9
97.2
85.5
71.5
46.9
AMD Radeon RX 7700 XT
151.3
121.9
102.1
90
72
42.5
NVIDIA Titan RTX
152.2
131.9
106.4
93.2
75.3
47.1
NVIDIA GeForce RTX 3070 Ti
132.6
115
93.7
83.7
69.1
45.7
NVIDIA GeForce RTX 4060 Ti 16G
141.6
124.4
101.4
90.1
70.6
42
NVIDIA GeForce RTX 4060 Ti 8G
101.5
91.1
73.3
68.3
63.7
56.6
NVIDIA GeForce RTX 3080 Ti Laptop GPU
115.2
93.7
80.3
65
41.6
PosModel< PrevNext >Ratchet & Clank Rift Apart
low med. high ultra QHD 4K
NVIDIA GeForce RTX 4070 Laptop GPU
90.4
75.65n4
61.25n4
56.7n4
48.8n3
33.2
NVIDIA GeForce RTX 3070
110.7
87.2
78.8
64.5
41.7
AMD Radeon RX 6750 XT
129.3
111
94.4
82.6
66.4
34.6
AMD Radeon RX 6700 XT
124.8
107.8
91.1
81.1
62.9
37.3
NVIDIA GeForce RTX 3080 Laptop GPU
113.8
100.6
81.6
72.3
65.9
62.3
NVIDIA GeForce RTX 3060 Ti
119.4
103.2
82.7
73.4
60.8
37.3
Intel Arc A770
113
98
79.2
68.5
56.4
36.2
AMD Radeon RX 7600
84.5
71.2
50.2
40.9
33.4
20.2
NVIDIA GeForce RTX 3070 Ti Laptop GPU
73.9
59.5
55
45.8
30.6
NVIDIA GeForce RTX 4060 Laptop GPU
85.4n3
74.7n4
60.6n4
54.3n4
46.1n3
28.8
AMD Radeon RX 6650 XT
78.5
65.8
47.8
41.2
31.6
19.2
NVIDIA GeForce RTX 3070 Laptop GPU
87.6
75.7
66.8
63.5
61.7
51.3
AMD Radeon RX 6800S
71.5
62.9
44.7
37.8
AMD Radeon RX 7600M XT
26.5
21
12.8
11.5
9.4
6.7
Intel Arc A750
85.4
74.3
59.9
53.7
43.5
30.5
NVIDIA Titan X Pascal
98.6
85.2
64.9
55.3
44.8
27.8
NVIDIA GeForce RTX 2070 Super (Desktop)
86
74.8
60.2
54
43.7
29.7
AMD Radeon RX 5700 XT (Desktop)
81.8
67.5
53.8
46.6
38.6
23.8
AMD Radeon RX 7600S
50.7
41.3
31.7
24.9
16.2
Intel Arc A580
86.5
74.4
59.7
52.9
43.4
27.2
PosModel< PrevNext >Ratchet & Clank Rift Apart
low med. high ultra QHD 4K
NVIDIA GeForce RTX 2060 Super (Desktop)
78.4
68.6
55.7
49.2
39.9
25.6
AMD Radeon RX 6600
72.9
59.6
44.5
37.6
29.2
15.5
AMD Radeon RX 5700 (Desktop)
71.9
60.4
48.9
42.1
34.5
21.7
AMD Radeon RX 6600M
62.8
59
47
39.4
34.9
30
AMD Radeon RX 5600 XT (Desktop)
61.7
51.9
41.9
28.4
24.9
19
NVIDIA GeForce GTX 1660 Super (Desktop)
63.4
52.4
44.7
33.4
26.6
14.3
AMD Radeon RX 6500 XT
23.7
20.5
15.3
10.6
AMD Radeon RX 5500 XT (Desktop)
44.5
38
28.6
24.7
19.6
12.1
NVIDIA GeForce RTX 4050 Laptop GPU
80.7
67.7n3
48.5n3
41.6n3
32.5n2
15.6
Intel Arc A730M
54.3n2
47.8n2
38.4n2
36.35n2
NVIDIA GeForce GTX 1660 Ti Mobile
58
49.6
40.3
36.3
NVIDIA GeForce GTX 1660 (Desktop)
59.6
49.3
36.4
31.9
21.6
13.5
NVIDIA GeForce GTX 1650 Super (Desktop)
45
38.4
29.5
22.8
12.2
6.74
NVIDIA GeForce RTX 3050 4GB Laptop GPU
60.7
42.6
35.1
28.5
NVIDIA GeForce GTX 1650 Ti Mobile
29.9
24.7
18
15.7
AMD Radeon RX 5500M
25.6
23
16.5
NVIDIA GeForce RTX 2050 Mobile
18.8
17.9
16.7
NVIDIA GeForce GTX 1650 Mobile
27.6
20.8
15.1
12.9
Intel Arc A380
41.8
30.9
24.6
21.1
Intel Arc A310
30.3
24.6
19.1
16.1
PosModel< PrevNext >Ratchet & Clank Rift Apart
low med. high ultra QHD 4K
Intel Arc 8-Cores iGPU
28.4
29
25.9
21.1
AMD Radeon 780M
23.9
23.6n2
18.15n2
20.2
AMD Radeon 680M
29.9
25.5
21.1
18
NVIDIA GeForce GTX 1050 Mobile
24.8
21.1
15.6
12.7
AMD Radeon 760M
20.5
AMD Radeon RX 560X (Laptop)
16.5
13.4
9.83
AMD Radeon RX Vega 10
11.4
10.1
Intel UHD Graphics Xe 32EUs (Tiger Lake-H)
8.75
NVIDIA GeForce MX130
3.76
AMD Radeon RX Vega 6 (Ryzen 4000/5000)
9.46
Intel UHD Graphics 630
3.81
(-) * Smaller values are better. / n123 Number of benchmarks for this median value / * Approximate position


Legend
5Stutters – This game is very likely to stutter and have poor frame rates. Based on all known benchmarks using the specified graphical settings, average frame rates are expected to fall below 25fps
May Stutter – This graphics card has not been explicitly tested on this game. Based on interpolated information from surrounding graphics cards of similar performance levels, stutters and poor frame rates are expected.
30Fluent – Based on all known benchmarks using the specified graphical settings, this game should run at or above 25fps
40Fluent – Based on all known benchmarks using the specified graphical settings, this game should run at or above 35fps
60Fluent – Based on all known benchmarks using the specified graphical settings, this game should run at or above 58fps
May Run Fluently – This graphics card has not been explicitly tested on this game. Based on interpolated information from surrounding graphics cards of similar performance levels, fluent frame rates are expected.
?Uncertain – This graphics card experienced unexpected performance issues during testing for this game. A slower card may be able to achieve better and more consistent frame rates than this particular GPU running the same benchmark scene.
Uncertain – This graphics card has not been explicitly tested on this game and no reliable interpolation can be made based on the performances of surrounding cards of the same class or family.
The value in the fields displays the average frame rate of all values in the database. Move your cursor over the value to see individual results.

All test systems

Device Graphics card Processor Memory
Notebooks
XMG Neo 17 E23 Nvidia GeForce RTX 4090 @175 W TGP (16 GB GDDR6X) Intel Core i9-13900HX 2 x 16 GB DDR5
Schenker Key 17 Pro E23 Nvidia GeForce RTX 4080 @175 W TGP (12 GB GDDR6X) Intel Core i9-13900HX 2 x 16 GB DDR5
XMG Pro 15 E23 Nvidia GeForce RTX 4070 @140 W TGP (8 GB GDDR6) Intel Core i9-13900HX 2 x 16 GB DDR5
XMG Pro 15 E23 Nvidia GeForce RTX 4060 @140 W TGP (8 GB GDDR6) Intel Core i9-13900HX 2 x 16 GB DDR5
XMG Focus 15 E23 Nvidia GeForce RTX 4050 @140 W TGP (6 GB GDDR6) Intel Core i9-13900HX 2 x 16 GB DDR5
Asus ROG Strix Scar 17 Nvidia GeForce RTX 3080 Ti @150 W TGP (16 GB GDDR6) Intel Core i9-12900H 2 x 16 GB DDR5
Acer Predator Helios 300 Nvidia GeForce RTX 3070 Ti @150 W TGP (8 GB GDDR6) Intel Core i7-12700H 2 x 8 GB DDR5
Asus ROG Zephyrus G14 AMD Radeon RX 6800S (8 GB GDDR6) & AMD Radeon 680M AMD Ryzen 9 6900HS 2 x 16 GB DDR5
Tower PCs
Custom I Nvidia GeForce RTX 4080 (16 GB GDDR6X)
AMD Radeon RX 7900 XTX (24 GB GDDR6)
Intel Core i9-12900K 2 x 16 GB DDR4
Custom II Palit GeForce RTX 4090 GameRock OC (24 GB GDDR6X)
Nvidia GeForce RTX 3090 FE (24 GB GDDR6X)
Nvidia GeForce RTX 3060 Ti (8 GB GDDR6X)
NvidiaTitan RTX (24 GB GDDR6)
lNvidia GeForce RTX2070 Super (8 GB GDDR6)
Nvidia GeForce RTX 2060 Super (8 GB GDDR6)
KFA2 GeForce GTX 1660 Super (6 GB GDDR6)
PNY GeForce GTX 1660 (6 GB GDDR5)
KFA2 GeForce GTX 1650 Super (4 GB GDDR6)
AMD RadeonRX 6950 XT (16 GB DDR6)
AMD Radeon RX 6800 (16 GB DDR6)
AMD Radeon RX 6700 XT (12 GB DDR6)
AMD Radeon RX 6650 XT (8 GB GDDR6)
AMD Radeon RX 6600 (8 GB GDDR6)
AMDRadeon RX 5700 XT (8 GB GDDR6)
AMD Radeon RX 5700 (8 GB GDDR6)
AMD Radeon RX 5600 XT (6 GB GDDR6)
AMD Radeon RX 5500 XT (8 GB GDDR6)
AMD Ryzen 9 7950X 2 x 16 GB DDR5
Mini PCs
Minisforum NUCXi7 Nvidia GeForce RTX 3070 @125 W TGP (8 GB GDDR6) Intel Core i7-11800H 2 x 8 GB DDR4
Minisforum HX99G AMD Radeon RX 6600M @100 W TGP (8 GB GDDR6) AMD Ryzen 9 6900HX 2 x 16 GB DDR5
Morefine S500+ AMD Radeon RX Vega 8 AMD Ryzen 9 5900HX 2 x 16 GB DDR4
4K monitors operating system Nvidia drivers AMD drivers
Philips Brilliance 329P9H, Gigabyte M32U Windows 11 ForceWare 536.67 Adrenalin 23.7.2
static version load dynamic
Loading Comments
Comment on this article
Please share our article, every link counts!
> Expert Reviews and News on Laptops, Smartphones and Tech Innovations > Reviews > Ratchet & Clank Rift Apart: Laptop and desktop benchmarks
Florian Glaser, 2023-08- 7 (Update: 2023-08- 7)