Notebook reviews with NVIDIA GeForce RTX 4050 Laptop GPU graphics card
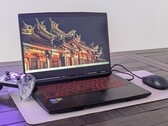
MSI Thin GF63 12VE laptop review: GeForce RTX 4050 gaming with 8 GB of RAM
MSI's least expensive 15.6-inch gaming laptop sports modern features like a 144 Hz IPS screen, GeForce RTX 4050 graphics, and a Core-H series processor. However, you'll want to avoid certain SKUs especially those with just 8 GB of RAM.
Intel Core i5-12450H, NVIDIA GeForce RTX 4050 Laptop GPU, 15.6", 1.8 kgHP OmniStudio X 32 review - The perfect all-in-one AI PC for the office, working from home, or school?
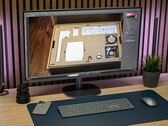
As a powerful all-in-one AI PC, the HP OmniStudio X 32 promises a perfect combination of performance, design and functionality. Whether for work, school or creative projects—we tested how good the smart 32-inch device really is and whether it lives up to its claim of being a versatile all-rounder.
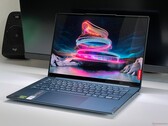
Intel Core Ultra 7 155H, NVIDIA GeForce RTX 4050 Laptop GPU, 32", 9.6 kgLenovo Yoga Pro 7 14 review - The multimedia laptop with 120-Hz OLED and an RTX 4050 Laptop
Lenovo's Yoga Pro 7 14 is a fast multimedia laptop that can optionally be equipped with dedicated GeForce GPUs. We tested the version with the Meteor Lake Core Ultra 7 155H, 32 GB RAM, 120-Hz OLED and the Nvidia GeForce RTX 4050 Laptop.
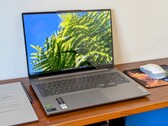
Intel Core Ultra 7 155H, NVIDIA GeForce RTX 4050 Laptop GPU, 14.5", 1.6 kgLenovo IdeaPad Pro 5 16IMH G9 review: 90 W GeForce RTX 4050 almost as good as the RTX 4060
The ideaPad Pro 5 16 G9 does it all when configured with its discrete GPU option. The downside, however, is a louder and much warmer system than many other ultra-thin multimedia alternatives.
Intel Core Ultra 9 185H, NVIDIA GeForce RTX 4050 Laptop GPU, 16", 2 kgLenovo Yoga Pro 9 16IMH9 laptop review: 75 W GeForce RTX 4050 overperforms
Lenovo's flagship model and closest MacBook Pro 16 competitor packs a ton of power for the size even at the lower-end configuration. At well over $1500, however, it's also one of Lenovo's pricier Yoga laptops.
Intel Core Ultra 9 185H, NVIDIA GeForce RTX 4050 Laptop GPU, 16", 2.1 kgDell XPS 14 2024 OLED: Intel Core Ultra 7 155H, 14.50", 1.8 kg
Review » Dell XPS 14 2024 review - The multimedia laptop with the slowest RTX 4050 Laptop in the world
Samsung Galaxy Book4 Ultra: Intel Core Ultra 7 155H, 16.00", 1.8 kg
Review » Samsung Galaxy Book4 Ultra review - A multimedia laptop with 120 Hz OLED & RTX 4050
HP Spectre x360 16 RTX 4050: Intel Core Ultra 7 155H, 16.00", 2 kg
Review » HP Spectre x360 16 convertible review: Now with 55 W GeForce RTX 4050 graphics
HP Victus 15-fa1057ng: Intel Core i5-13500H, 15.60", 2.3 kg
Review » HP Victus 15 gaming laptop with Raptor Lake and Ada Lovelace in review
Dell G15 5530, i5-13450HX RTX 4050: Intel Core i5-13450HX, 15.60", 2.7 kg
Review » Dell G15 5530 review: RTX 4050 gaming laptop in Dark Shadow Gray
Acer Nitro V 15 ANV15-51-582S: Intel Core i5-13420H, 15.60", 2.1 kg
Review » Acer Nitro V 15 ANV15-51 review: Budget gaming laptop with RTX 4050
Medion Erazer Crawler E40 - MD 62518: Intel Core i5-13500H, 15.60", 2.3 kg
Review » Medion Erazer Crawler E40 laptop review: Affordable gamer with good RTX-4050 performance
Asus VivoBook Pro 16 K6602VU: Intel Core i9-13900H, 16.00", 1.9 kg
Review » Asus VivoBook Pro 16 (2023) Laptop Review: Core i9-13900H, RTX 4050, and 3.2K OLED augur well for hobbyist creators
Acer Predator Helios Neo 16 NH.QLTEG.002: Intel Core i5-13500HX, 16.00", 2.6 kg
Review » Predator Helios Neo 16 laptop review: Acer has created a gaming chimera
Lenovo LOQ 15IRH8 Core i7: Intel Core i7-13620H, 15.60", 2.4 kg
Review » Lenovo LOQ 15 Core i7 Review: Affordable Legion alternative that throws up an Intel vs AMD conundrum
Schenker XMG Apex 15 (Late 23): AMD Ryzen 7 7840HS, 15.60", 2.2 kg
Review » XMG Apex 15 (Late 23) review: The gaming laptop with an RTX 4050 that delivers good runtimes
HP Victus 16-r0076TX: Intel Core i5-13500HX, 16.10", 2.3 kg
Review » HP Victus 16 Laptop Review: A 1080p gaming powerhouse with few compromises
Acer Nitro 16 AN16-41-R7YE: AMD Ryzen 5 7535HS, 16.00", 2.6 kg
Review » Acer Nitro 16 AN16-41 Review: Affordable gaming laptop with RTX 4050 and long run times
Lenovo Slim Pro 9i 16IRP8: Intel Core i9-13905H, 16.00", 2.2 kg
Review » Lenovo Slim Pro 9i 16IRP8 laptop review: The Apple MacBook Pro 16 alternative
Lenovo Legion Pro 5 16ARX8 (R5 7645HX, RTX 4050): AMD Ryzen 5 7645HX, 16.00", 2.5 kg
Review » Lenovo Legion Pro 5 16ARX8 review: Gaming laptop with RTX 4050 in great form
Lenovo LOQ 15APH8: AMD Ryzen 7 7840HS, 15.60", 2.5 kg
Review » Lenovo LOQ 15 Ryzen 7 7840HS laptop review: Don't call it a Legion
Acer Predator Triton 14 PT14-51: Intel Core i7-13700H, 14.00", 1.7 kg
Review » Acer Predator Triton 14 reviewed: A 14-inch gaming laptop with a bright display and an RTX 4050
Lenovo Yoga Pro 9-14IRP G8: Intel Core i7-13705H, 14.50", 1.7 kg
Review » Yoga Pro 9i 14 in Review: Lenovo's best Multimedia Laptop with AdobeRGB Mini-LED Panel
Schenker XMG Focus 15 (E23): Intel Core i9-13900HX, 15.60", 2.4 kg
Review » Schenker XMG Focus 15 (E23) budget gaming laptop review: A lot of performance at a lesser price than the Pro 15
MSI Stealth 14 Studio A13V: Intel Core i7-13700H, 14.00", 1.7 kg
Review » MSI Stealth 14 Studio review - An expensive gaming laptop that has made too many compromises
Acer Swift X SFX14-71G: Intel Core i7-13700H, 14.50", 1.5 kg
Review » Acer Swift X 14 2023 OLED review - The multimedia laptop with an RTX 4050 is only impressive on paper
Acer Nitro 5 AN517-55-5552: Intel Core i5-12500H, 17.30", 3 kg
Review » Acer Nitro 5 AN517 review: A gaming laptop with a quiet RTX 4050
Asus TUF A15 FA507: AMD Ryzen 7 7735HS, 15.60", 2.2 kg
Review » Asus TUF Gaming A15 laptop review - A budget gamer with an RTX 4050 and a 144 Hz screen
Medion Erazer Scout E20: Intel Core i7-13700H, 17.30", 2.8 kg
Review » Medion Erazer Scout E20 review: Affordable FHD gaming laptop with RTX 4050
Lenovo Yoga Pro 7 14IRH G8: Intel Core i7-13700H, 14.50", 1.5 kg
Review » Lenovo Yoga Pro 7 14 G8 notebook review: GeForce RTX 4050 laptop powers 3K display with 120 Hz
Gigabyte Aero 14 OLED BMF: Intel Core i7-13700H, 14.00", 1.4 kg
Review » Gigabyte Aero 14 OLED BMF laptop review: Compact studio notebook with true color display
Samsung Galaxy Book3 Ultra 16: Intel Core i7-13700H, 16.00", 1.8 kg
Review » Samsung Galaxy Book3 Ultra 16 review: Enduring 16-inch ultrabook with RTX 4050
MSI Katana 15 B12VEK: Intel Core i7-12650H, 15.60", 2.3 kg
Review » MSI Katana 15 laptop review: Budget gamer with RTX 4050 and Alder Lake CPU
Acer Nitro V 15 ANV15-52, RTX 4050: Intel Core 5 210H, 15.60", 2.1 kg
External Review » Acer Nitro V 15 ANV15-52, RTX 4050 - Reviews and Specs
Lenovo LOQ 15ARP10E, RTX 4050: AMD Ryzen 5 7535HS, 15.60", 1.8 kg
External Review » Lenovo LOQ 15ARP10E, RTX 4050 - Reviews and Specs
Acer Nitro V 15 AI ANV15-42: unknown, 15.60", 2.1 kg
External Review » Acer Nitro V 15 AI ANV15-42
HP Victus 15-fb3000: unknown, 15.60", 2.3 kg
External Review » HP Victus 15-fb3000
Acer Swift X 14 OLED SFX14-72G, Ultra 5 125H: Intel Core Ultra 5 125H, 14.50", 1.6 kg
External Review » Acer Swift X 14 OLED SFX14-72G, Ultra 5 125H
HP Victus 15-fb2000: AMD Ryzen 7 8845HS, 15.60", 2.3 kg
External Review » HP Victus 15-fb2000
Asus V16 V3607VU: Intel Core 5 210H, 16.00", 2 kg
External Review » Asus V16 V3607VU
Dell 14 Premium DA14250: Intel Core Ultra 7 255H, 14.50", 1.7 kg
External Review » Dell 14 Premium DA14250
Acer Nitro Lite 16 NL16-71G, RTX 4050: Intel Core i5-13420H, 16.00", 2 kg
External Review » Acer Nitro Lite 16 NL16-71G, RTX 4050
Gigabyte Gaming A16 CMHI2: Intel Core i7-13620H, 16.00", 2.2 kg
External Review » Gigabyte Gaming A16 CMHI2
MSI Thin 15 B13VE, i5-13420H: Intel Core i5-13420H, 15.60", 1.9 kg
External Review » MSI Thin 15 B13VE, i5-13420H
Gigabyte G6 MF: Intel Core i7-13620H, 16.00", 2.3 kg
External Review » Gigabyte G6 MF
Acer Nitro V15 ANV15-41, R7 7735HS: AMD Ryzen 7 7735HS, 15.60", 2.1 kg
External Review » Acer Nitro V15 ANV15-41, R7 7735HS
Acer Nitro V15 ANV15-41, RTX 4050: AMD Ryzen 5 7535HS, 15.60", 2.1 kg
External Review » Acer Nitro V15 ANV15-41, RTX 4050
Asus Vivobook Pro 15 N6506CU: Intel Core Ultra 9 285H, 15.60", 1.8 kg
External Review » Asus Vivobook Pro 15 N6506CU
Lenovo LOQ 15IAX9I, RTX 4050: Intel Core i5-12450HX, 15.60", 2.4 kg
External Review » Lenovo LOQ 15IAX9I, RTX 4050
Asus ProArt PX13 HN7306WU, HX 370: AMD Ryzen AI 9 HX 370, 13.30", 1.4 kg
External Review » Asus ProArt PX13 HN7306WU, HX 370
Asus TUF Gaming A15 FA507NU, R7 7435HS: AMD Ryzen 7 7435HS, 15.60", 2.2 kg
External Review » Asus TUF Gaming A15 FA507NU, R7 7435HS
Acer Predator Helios Neo PHN16-71, i7-13700HX RTX 4050: Intel Core i7-13700HX, 16.00", 2.6 kg
External Review » Acer Predator Helios Neo PHN16-71, i7-13700HX RTX 4050
HP Victus 15-fa1: Intel Core i7-12650H, 15.60", 2.3 kg
External Review » HP Victus 15-fa1
Acer Nitro V14 ANV14-61: AMD Ryzen 7 8845HS, 14.50", 1.7 kg
External Review » Acer Nitro V14 ANV14-61
Acer Nitro 14 AN14-41, RTX 4050: AMD Ryzen 7 8845HS, 14.50", 2 kg
External Review » Acer Nitro 14 AN14-41, RTX 4050
Asus ProArt PX13 HN7306WU: AMD Ryzen AI 9 365, 13.30", 1.4 kg
External Review » Asus ProArt PX13 HN7306WU
Asus Vivobook 16X K3605ZU, i5-12500H: Intel Core i5-12500H, 16.00", 1.8 kg
External Review » Asus Vivobook 16X K3605ZU, i5-12500H
Lenovo IdeaPad Pro 5 16IMH G9 RTX 4050: Intel Core Ultra 9 185H, 16.00", 2 kg
External Review » Lenovo IdeaPad Pro 5 16IMH G9 RTX 4050
Asus TUF Gaming F16 FX607JU: Intel Core i7-13650HX, 16.00", 2.3 kg
External Review » Asus TUF Gaming F16 FX607JU
Lenovo IdeaPad Pro 5 16AHP9: AMD Ryzen 7 8845HS, 16.00", 1.9 kg
External Review » Lenovo IdeaPad Pro 5 16AHP9
Acer Nitro V16 ANV16-41: AMD Ryzen 7 8845HS, 16.00", 2.5 kg
External Review » Acer Nitro V16 ANV16-41
MSI Cyborg 15 AI A1VEK: Intel Core Ultra 7 155H, 15.60", 2 kg
External Review » MSI Cyborg 15 AI A1VEK
Lenovo Yoga Pro 7 14IMH9, RTX 4050: Intel Core Ultra 7 155H, 14.50", 1.6 kg
External Review » Lenovo Yoga Pro 7 14IMH9, RTX 4050
Gigabyte G6X 9MG: Intel Core i7-13650HX, 16.00", 2.5 kg
External Review » Gigabyte G6X 9MG
Lenovo Yoga Pro 9 16IMH9, RTX 4050: Intel Core Ultra 9 185H, 16.00", 2.1 kg
External Review » Lenovo Yoga Pro 9 16IMH9, RTX 4050
Acer Aspire 3D 15 SpatialLabs Edition A3D15-71GM: Intel Core i7-13620H, 15.60", 2.3 kg
External Review » Acer Aspire 3D 15 SpatialLabs Edition A3D15-71GM
Asus TUF Gaming A17 FA707NU, R5 7535HS: AMD Ryzen 5 7535HS, 17.30", 2.6 kg
External Review » Asus TUF Gaming A17 FA707NU, R5 7535HS
MSI Thin 15 B13VE: Intel Core i7-13620H, 15.60", 1.9 kg
External Review » MSI Thin 15 B13VE
Lenovo Yoga Pro 9 16IMH9 RTX 4050: Intel Core Ultra 9 185H, 16.00", 2.1 kg
External Review » Lenovo Yoga Pro 9 16IMH9 RTX 4050
Asus ROG Zephyrus G14 2024 GA403UU, R7 8845HS: AMD Ryzen 7 8845HS, 14.00", 1.5 kg
External Review » Asus ROG Zephyrus G14 2024 GA403UU, R7 8845HS
Asus TUF Gaming F17 FX707VU: Intel Core i7-13620H, 17.30", 2.6 kg
External Review » Asus TUF Gaming F17 FX707VU
Acer Swift X 14 OLED SFX14-72G: Intel Core Ultra 7 155H, 14.50", 1.6 kg
External Review » Acer Swift X 14 OLED SFX14-72G
Asus VivoBook Pro 15 OLED N6506, RTX 4050: Intel Core Ultra 7 155H, 15.60", 1.8 kg
External Review » Asus VivoBook Pro 15 OLED N6506, RTX 4050
Asus ROG Zephyrus G14 2024 GA403UU: AMD Ryzen 9 8945HS, 14.00", 1.5 kg
External Review » Asus ROG Zephyrus G14 2024 GA403UU
Asus TUF Gaming A16 FA607J: Intel Core i7-13650HX, 16.00", 2.3 kg
External Review » Asus TUF Gaming A16 FA607J
MSI Katana 15 AI B8VE: AMD Ryzen 7 8845HS, 15.60", 2.3 kg
External Review » MSI Katana 15 AI B8VE
Lenovo LOQ 15IRX9, i5-13450HX: Intel Core i5-13450HX, 15.60", 2.4 kg
External Review » Lenovo LOQ 15IRX9, i5-13450HX
HP Spectre x360 16 RTX 4050: Intel Core Ultra 7 155H, 16.00", 2 kg
External Review » HP Spectre x360 16 RTX 4050
Acer Predator Triton 14 PT14-51: Intel Core i7-13700H, 14.00", 1.7 kg
External Review » Acer Predator Triton 14 PT14-51
HP Victus 15-fa1000na: Intel Core i5-12500H, 15.60", 2.3 kg
External Review » HP Victus 15-fa1000na
Samsung Galaxy Book4 Ultra: Intel Core Ultra 7 155H, 16.00", 1.8 kg
External Review » Samsung Galaxy Book4 Ultra
HP Omen Transcend 14-fb0000: Intel Core Ultra 7 155H, 14.00", 1.6 kg
External Review » HP Omen Transcend 14-fb0000
Acer Nitro 5 AN515-58, i7-12650H RTX 4050: Intel Core i7-12650H, 15.60", 2.5 kg
External Review » Acer Nitro 5 AN515-58, i7-12650H RTX 4050
Dell XPS 14 2024 OLED: Intel Core Ultra 7 155H, 14.50", 1.8 kg
External Review » Dell XPS 14 2024 OLED
Acer Swift X SFX16-61G-R0SU: AMD Ryzen 7 7840HS, 16.00", 2 kg
External Review » Acer Swift X SFX16-61G-R0SU
Acer Nitro 17 AN17-51: Intel Core i5-13500H, 17.30", 3 kg
External Review » Acer Nitro 17 AN17-51
Acer Nitro V 15 ANV15-51, i7-13620H: Intel Core i7-13620H, 15.60", 2.1 kg
External Review » Acer Nitro V 15 ANV15-51, i7-13620H
HP Omen 16-wd0000: Intel Core i5-13420H, 16.10", 2.4 kg
External Review » HP Omen 16-wd0000
Asus ROG Zephyrus G14 GA402NU: AMD Ryzen 7 7735HS, 14.00", 1.7 kg
External Review » Asus ROG Zephyrus G14 GA402NU
Acer Nitro V 15 ANV15-51: Intel Core i5-13420H, 15.60", 2.1 kg
External Review » Acer Nitro V 15 ANV15-51
Asus VivoBook Pro 16 OLED K6602V: Intel Core i9-13900H, 16.00", 1.9 kg
External Review » Asus VivoBook Pro 16 OLED K6602V
HP Victus 16-s0152ng: AMD Ryzen 5 7640HS, 16.10", 2.3 kg
External Review » HP Victus 16-s0152ng
Acer Nitro 5 AN517-55: Intel Core i5-12500H, 17.30", 3 kg
External Review » Acer Nitro 5 AN517-55
Asus ROG Strix G16 G614JU, i7-13650HX: Intel Core i7-13650HX, 16.00", 2.5 kg
External Review » Asus ROG Strix G16 G614JU, i7-13650HX
HP Victus 16-s0000ng: AMD Ryzen 7 7840HS, 16.10", 2.3 kg
External Review » HP Victus 16-s0000ng
Lenovo Yoga Pro 9-14IRP G8: Intel Core i7-13705H, 14.50", 1.7 kg
External Review » Lenovo Yoga Pro 9-14IRP G8
Lenovo Slim Pro 9 14IRP8: Intel Core i7-13705H, 14.50", 1.7 kg
External Review » Lenovo Slim Pro 9 14IRP8
HP Victus 15-fa1000ng: Intel Core i5-13420H, 15.60", 2.3 kg
External Review » HP Victus 15-fa1000ng
Acer Swift X SFX16-61G: AMD Ryzen 9 7940HS, 16.00", 2 kg
External Review » Acer Swift X SFX16-61G
MSI Cyborg 15 A12VE, i5-12450H: Intel Core i5-12450H, 15.60", 2 kg
External Review » MSI Cyborg 15 A12VE, i5-12450H
Acer Nitro 16 AN16-51: Intel Core i7-13700H, 16.00", 2.7 kg
External Review » Acer Nitro 16 AN16-51
Lenovo Legion Slim 5 16IRH8, i7-13700H RTX 4050: Intel Core i7-13700H, 16.00", 2.4 kg
External Review » Lenovo Legion Slim 5 16IRH8, i7-13700H RTX 4050
Asus Vivobook 16X K3605ZU: Intel Core i7-12650H, 16.00", 1.8 kg
External Review » Asus Vivobook 16X K3605ZU
Lenovo LOQ 15APH8: AMD Ryzen 7 7840HS, 15.60", 2.5 kg
External Review » Lenovo LOQ 15APH8
Lenovo Slim Pro 9i 16IRP8: Intel Core i9-13905H, 16.00", 2.2 kg
External Review » Lenovo Slim Pro 9i 16IRP8
Lenovo LOQ 15IRH8 Core i7: Intel Core i7-13620H, 15.60", 2.4 kg
External Review » Lenovo LOQ 15IRH8, i7-13620H RTX 4050
HP Victus 16-r0000ng: Intel Core i7-13700H, 16.10", 2.3 kg
External Review » HP Victus 16-r0000ng
Acer Nitro 16 AN16-41, R5 7640HS RTX 4050: AMD Ryzen 5 7640HS, 16.00", 2.7 kg
External Review » Acer Nitro 16 AN16-41, R5 7640HS RTX 4050
MSI Cyborg 15 A13VE: Intel Core i7-13620H, 15.60", 2 kg
External Review » MSI Cyborg 15 A13VE
Lenovo LOQ 16IRH8, i7-13620H RTX 4050: Intel Core i7-13620H, 16.00", 2.6 kg
External Review » Lenovo LOQ 16IRH8, i7-13620H RTX 4050
Dell XPS 15 9530 RTX 4050: Intel Core i7-13700H, 15.60", 1.9 kg
External Review » Dell XPS 15 9530 RTX 4050
Dell G15 5530, i5-13450HX RTX 4050: Intel Core i5-13450HX, 15.60", 2.7 kg
External Review » Dell G15 5530, i5-13450HX RTX 4050
Acer Nitro 17 AN17-41-R6L9: AMD Ryzen 7 7840HS, 17.30", 3 kg
External Review » Acer Nitro 17 AN17-41-R6L9
Lenovo LOQ 15IRH8, i5-13420H: Intel Core i5-13420H, 15.60", 2.4 kg
External Review » Lenovo LOQ 15IRH8, i5-13420H
Acer Nitro 5 AN515-58, i5-12500H RTX 4050: Intel Core i5-12500H, 15.60", 2.5 kg
External Review » Acer Nitro 5 AN515-58, i5-12500H RTX 4050
Dell G15 5530, RTX 4050: Intel Core i7-13650HX, 15.60", 2.8 kg
External Review » Dell G15 5530, RTX 4050
HP Victus 16-r0076TX: Intel Core i5-13500HX, 16.10", 2.3 kg
External Review » HP Victus 16-r0076TX
Asus ROG Flow Z13 GZ301VU: Intel Core i9-13900H, 13.40", 1.2 kg
External Review » Asus ROG Flow Z13 GZ301VU
Asus VivoBook Pro 15 OLED K6502VU: Intel Core i9-13900H, 15.60", 1.8 kg
External Review » Asus VivoBook Pro 15 OLED K6502VU
Gigabyte G5 MF: Intel Core i5-12500H, 15.60", 1.9 kg
External Review » Gigabyte G5 MF
MSI Bravo 15 C7V: AMD Ryzen 7 7735HS, 15.60", 2.3 kg
External Review » MSI Bravo 15 C7V
Asus ZenBook Pro 14 Duo UX8402VU: Intel Core i9-13900H, 14.50", 1.8 kg
External Review » Asus ZenBook Pro 14 Duo UX8402VU
Asus TUF Gaming F15 FX507VU: Intel Core i7-13700H, 15.60", 2.2 kg
External Review » Asus TUF Gaming F15 FX507VU
Medion Erazer Crawler E40: Intel Core i5-13500H, 15.60", 2.3 kg
External Review » Medion Erazer Crawler E40
Asus TUF Gaming A15 FA507NU: AMD Ryzen 7 7735HS, 15.60", 2.2 kg
External Review » Asus TUF Gaming A15 FA507NU
MSI Stealth 14 Studio A13VE: Intel Core i7-13700H, 14.00", 1.7 kg
External Review » MSI Stealth 14 Studio A13VE
Lenovo Legion Pro 5 16IRX8, i5-13500HX RTX 4050: Intel Core i5-13500HX, 16.00", 2.6 kg
External Review » Lenovo Legion Pro 5 16IRX8, i5-13500HX RTX 4050
Acer Swift X SFX14-71G: Intel Core i7-13700H, 14.50", 1.5 kg
External Review » Acer Swift X SFX14-71G
Acer Nitro 16 AN16-41, R5 7535HS RTX 4050: AMD Ryzen 5 7535HS, 16.00", 2.7 kg
External Review » Acer Nitro 16 AN16-41, R5 7535HS RTX 4050
Lenovo Yoga Pro 7 14IRH G8: Intel Core i7-13700H, 14.50", 1.5 kg
External Review » Lenovo Yoga Pro 7 14IRH G8
MSI Cyborg 15 A12VE, i7-12650H: Intel Core i7-12650H, 15.60", 2 kg
External Review » MSI Cyborg 15 A12VE, i7-12650H
Lenovo Ideapad Gaming 3 15ARH7, R5 7535HS RTX 4050: AMD Ryzen 5 7535HS, 15.60", 2.3 kg
External Review » Lenovo Ideapad Gaming 3 15ARH7, R5 7535HS RTX 4050
MSI Cyborg 15 A12VE: Intel Core i7-12650H, 15.60", 2 kg
External Review » MSI Cyborg 15 A12VE
Lenovo Yoga Pro 9i 16 2023: Intel Core i7-13705H, 16.00", 2.2 kg
External Review » Lenovo Yoga Pro 9i 16 2023
Acer Predator Helios Neo 16 PHN16-71: Intel Core i5-13500HX, 16.00", 2.6 kg
External Review » Acer Predator Helios Neo 16 PHN16-71
Asus ROG Strix G16 G614JU: Intel Core i5-13450HX, 16.00", 2.5 kg
External Review » Asus ROG Strix G16 G614JU
MSI Prestige 16 Studio A13VE: Intel Core i7-13700H, 16.00", 2.1 kg
External Review » MSI Prestige 16 Studio A13VE
Schenker XMG Focus 15 (E23): Intel Core i9-13900HX, 15.60", 2.4 kg
External Review » Schenker XMG Focus 15 (E23)
Asus TUF Gaming F15 FX507ZU: Intel Core i7-12700H, 15.60", 2.2 kg
External Review » Asus TUF Gaming F15 FX507ZU
MSI Katana 15 B13VEK: Intel Core i7-13620H, 15.60", 2.3 kg
External Review » MSI Katana 15 B13VEK
MSI GF63 Thin 12VE-066US: Intel Core i7-12650H, 15.60", 1.9 kg
External Review » MSI GF63 Thin 12VE-066US
Asus TUF Gaming A17 FA707NU-HX032W: AMD Ryzen 7 7735HS, 17.30", 2.6 kg
External Review » Asus TUF Gaming A17 FA707NU-HX032W
Alienware x14 R2 2023: Intel Core i7-13620H, 14.00", 1.9 kg
External Review » Alienware x14 R2 2023
MSI GF63 Thin 12VE: Intel Core i5-12450H, 15.60", 1.9 kg
External Review » MSI GF63 Thin 12VE
Lenovo LOQ 15IRH8: Intel Core i7-13700H, 15.60", 2.4 kg
External Review » Lenovo LOQ 15IRH8
MSI Katana 15 B12VEK: Intel Core i7-12650H, 15.60", 2.3 kg
External Review » MSI Katana 15 B12VEK
Gigabyte Aero 14 OLED BMF: Intel Core i7-13700H, 14.00", 1.4 kg
External Review » Gigabyte Aero 14 OLED BMF
Samsung Galaxy Book3 Ultra 16: Intel Core i7-13700H, 16.00", 1.8 kg
External Review » Samsung Galaxy Book3 Ultra 16
Lenovo Slim Pro 9i 16IRP8: Intel Core i9-13905H, 16.00", 2.2 kg
» Highly rated Lenovo Slim Pro 9i 16 with brilliant 16-inch Mini LED screen hits lowest price ever
MSI Thin GF63 12VE: Intel Core i5-12450H, 15.60", 1.8 kg
» Budget-friendly RTX 4060 gaming laptop drops to $699 thanks to big 30% discount
» It's 2025 and retailers are still selling gaming laptops with just 8 GB of RAM
Lenovo IdeaPad Pro 5 16IMH G9 RTX 4050: Intel Core Ultra 9 185H, 16.00", 2 kg
» Lenovo IdeaPad Pro 5 Gen 9 reaches record-low price bringing 120 Hz OLED panel and discrete GPU below $650
Acer Nitro V 15 ANV15-51-582S: Intel Core i5-13420H, 15.60", 2.1 kg
» Acer Nitro V 15 with RTX 4060 and 32 GB RAM is now 20% cheaper for limited time
Lenovo IdeaPad Pro 5 16IMH G9 RTX 4050: Intel Core Ultra 9 185H, 16.00", 2 kg
» Lenovo IdeaPad Pro 5 Gen 9 OLED laptop is now retailing for 47% less than list price with latest discount
Lenovo Yoga Pro 9 16IMH9 RTX 4050: Intel Core Ultra 9 185H, 16.00", 2.1 kg
» Lenovo Yoga Pro 9i Gen 9 with Mini LED display, Core Ultra 9 185H, and RTX 4060 records double-digit price drop
Lenovo IdeaPad Pro 5 16IMH G9 RTX 4050: Intel Core Ultra 9 185H, 16.00", 2 kg
» Lenovo IdeaPad Pro 5 Gen 9 laptop with 16-inch 120 Hz OLED panel and RTX 3050 records big 38% price drop
Lenovo LOQ 15IRH8 Core i7: Intel Core i7-13620H, 15.60", 2.4 kg
» RTX 4070-powered Lenovo LOQ 15 (2024) discounted to less than $900 in excellent Black Friday sale
Acer Nitro V 15 ANV15-51-582S: Intel Core i5-13420H, 15.60", 2.1 kg
» Acer Nitro V 15 gaming laptop with RTX 4060 and 32 GB RAM experiences massive 31% price cut
Lenovo LOQ 15IRH8 Core i7: Intel Core i7-13620H, 15.60", 2.4 kg
» RTX 4060-equipped Lenovo LOQ 15 (2024) gaming laptop is now on sale for cheapest price ever
Lenovo IdeaPad Pro 5 16IMH G9 RTX 4050: Intel Core Ultra 9 185H, 16.00", 2 kg
» Lenovo IdeaPad Pro 5 Gen 9 with 16-inch OLED display and excellent battery life is now 36% off list price
Lenovo LOQ 15IRH8 Core i7: Intel Core i7-13620H, 15.60", 2.4 kg
» Lenovo LOQ (2024) gaming laptop with RTX 4060 and 100% sRGB display is on sale at record-low price
Lenovo Yoga Pro 9 16IMH9 RTX 4050: Intel Core Ultra 9 185H, 16.00", 2.1 kg
» Lenovo Yoga Pro 9i Gen 9 price drops by $300 for RTX 4060 SKU with 16-inch Mini-LED display
Lenovo LOQ 15APH8: AMD Ryzen 7 7840HS, 15.60", 2.5 kg
» Lenovo LOQ 15 with RTX 4070 is now going for cheaper than many RTX 4060 laptops
Lenovo LOQ 15IRH8 Core i7: Intel Core i7-13620H, 15.60", 2.4 kg
» Lenovo LOQ 15 with RTX 4070 is now going for cheaper than many RTX 4060 laptops
Acer Swift X SFX14-71G: Intel Core i7-13700H, 14.50", 1.5 kg
» Acer Swift X 14 OLED laptop with Core Ultra 7 155H and RTX 4060 drops to lowest price ever for limited time
Lenovo Yoga Pro 9 16IMH9 RTX 4050: Intel Core Ultra 9 185H, 16.00", 2.1 kg
» Latest Lenovo Yoga Pro 9i Gen 9 with 1200-nit mini LED display and RTX 4060 is on sale at noticeable discount
» Highly-rated Lenovo Yoga 9i Gen 9 with Core Ultra 7 155H and 120 Hz OLED display is back on sale at record low price
Lenovo Legion Pro 5 16ARX8 (R5 7645HX, RTX 4050): AMD Ryzen 5 7645HX, 16.00", 2.5 kg
» Lenovo Legion Pro 5i Gen 9 with Core i9-14900HX and RTX 4070 can now be yours at a whopping 34% discount
» Lenovo Legion Pro 5i Gen 9 with Core i9-14900HX and RTX 4070 can now be yours at a whopping 34% discount
Dell XPS 14 2024 OLED: Intel Core Ultra 7 155H, 14.50", 1.8 kg
» Dell's new XPS 14 9440 is much too expensive and too slow
Dell G15 5530, i5-13450HX RTX 4050: Intel Core i5-13450HX, 15.60", 2.7 kg
» Dell G15 5530 with RTX 4050 is $330 off in latest budget gaming laptop sale
Lenovo LOQ 15IRH8 Core i7: Intel Core i7-13620H, 15.60", 2.4 kg
» 42% price cut makes Lenovo LOQ 15 one of the cheapest RTX 4050 gaming laptops
Lenovo Ideapad Gaming 3 15ARH7, R5 7535HS RTX 4050: AMD Ryzen 5 7535HS, 15.60", 2.3 kg
» Lenovo IdeaPad Gaming 3 laptop with AMD Ryzen 7 7735HS and RTX 4050 discounted by 44%
Medion Erazer Crawler E40 - MD 62518: Intel Core i5-13500H, 15.60", 2.3 kg
» Affordable gaming laptop Medion Erazer Crawler E40 with powerful RTX 4050 reviewed
Acer Predator Helios Neo 16 NH.QLTEG.002: Intel Core i5-13500HX, 16.00", 2.6 kg
» Acer Predator Helios Neo 16 laptop review: Entry-level gaming with a desktop-class CPU and lots of connectivity options
Schenker XMG Apex 15 (Late 23): AMD Ryzen 7 7840HS, 15.60", 2.2 kg
» XMG Apex 15 (Late 23): Powerful, frugal, quiet and with great stamina - Ryzen 7 and an RTX 4050 make it all possible
HP Victus 16-r0076TX: Intel Core i5-13500HX, 16.10", 2.3 kg
» Affordable HP Victus 15 gaming laptop records massive 33% discount at Best Buy
Lenovo Legion Pro 5 16ARX8 (R5 7645HX, RTX 4050): AMD Ryzen 5 7645HX, 16.00", 2.5 kg
» Great gaming performance: Lenovo Legion Pro 5 AMD reviewed
Lenovo Yoga Pro 9-14IRP G8: Intel Core i7-13705H, 14.50", 1.7 kg
» Lenovo's Yoga Pro 9i 14 with Mini-LED panel is the best Windows alternative to Apple's MacBook Pro 14
MSI Stealth 14 Studio A13V: Intel Core i7-13700H, 14.00", 1.7 kg
» MSI is charging US$1,699.99 for the Stealth 14 Studio - featuring an RTX 4050 Laptop without Advanced Optimus
Acer Nitro 5 AN517-55-5552: Intel Core i5-12500H, 17.30"
» Acer Nitro 5 reviewed: An efficient RTX 4050 in economy mode
Lenovo LOQ 15IRH8: Intel Core i7-13700H, 15.60", 2.4 kg
» Lenovo LOQ gaming laptop with RTX 4060 receives 22% discount
Medion Erazer Scout E20: Intel Core i7-13700H, 17.30", 2.8 kg
» Medion Erazer Scout E20: Gaming laptop with whisper mode
Lenovo Yoga Pro 7 14IRH G8: Intel Core i7-13700H, 14.50", 1.5 kg
» Lenovo's Yoga Pro 7 14 becomes a mobile gamer thanks to the GeForce RTX 4050
Gigabyte Aero 14 OLED BMF: Intel Core i7-13700H, 14.00", 1.4 kg
» Gigabyte Aero 14 OLED delivers good hardware, but weakens in the Control Center
Samsung Galaxy Book3 Ultra 16: Intel Core i7-13700H, 16.00", 1.8 kg
» Samsung Galaxy Book3 Ultra 16: RTX 4050 laptop with long runtimes and AMOLED panel
MSI Katana 15 B12VEK: Intel Core i7-12650H, 15.60", 2.3 kg
» MSI Katana 15 with RTX 4050 reviewed: US$1499.99 for a budget gamer at the RTX 3060 level is too much