
HP OmniStudio X 32 review - The perfect all-in-one AI PC for the office, working from home, or school?
Great total package.
As a powerful all-in-one AI PC, the HP OmniStudio X 32 promises a perfect combination of performance, design and functionality. Whether for work, school or creative projects—we tested how good the smart 32-inch device really is and whether it lives up to its claim of being a versatile all-rounder.Sebastian Bade, 👁 Sebastian Bade (translated by Daisy Dickson) Published 🇩🇪 🇫🇷 ...
Verdict - The HP OmniStudio X 32 declares war on cable clutter
The HP OmniStudio X 32 is a powerful all-in-one system particularly suitable for creative tasks. With its Intel Core Ultra 7 155H and Nvidia GeForce RTX 4050 Laptop, it offers solid performance for image and video editing as well as AI tasks. Its high-resolution 4K screen displays content sharply and boasts a high color space coverage, but shows weaknesses in its illumination. The PC's cooling works efficiently, keeps its temperatures within limits and ensures a moderate background noise level.
Its storage and memory configuration consisting of a fast 2 TB SSD and 32 GB DDR5 RAM is adequate, but you're severely limited when it comes to upgrade options. Its performance is only partially enough for gaming, as the Nvidia GeForce RTX 4050 Laptop quickly reaches its limits. A 144 Hz panel is missing, which could prove to be a disadvantage for some users. Overall, the OmniStudio X 32 delivers a well-thought-out overall package, which is an interesting option for professional creatives in particular and keeps your workspace tidy.
Pros
Cons
Price and availability

You can configure and order the HP OmniStudio X 32 directly from the manufacturer's website, with prices starting at $1,129.99.
The OmniStudio-X series from HP combines laptop hardware with a large display in an all-in-one PC. Its frugal components deliver enough performance for a wide range of applications. HP offers models in 27 and 32 inches. The 27-inch model with the Intel Core Ultra 5, 16 GB RAM and a 512-GB SSD costs around $1,100, while the 32-inch version with 32 GB RAM, a 2-TB SSD and a GeForce RTX 4050 Laptop costs around $2,000.
Specifications
Case & connectivity
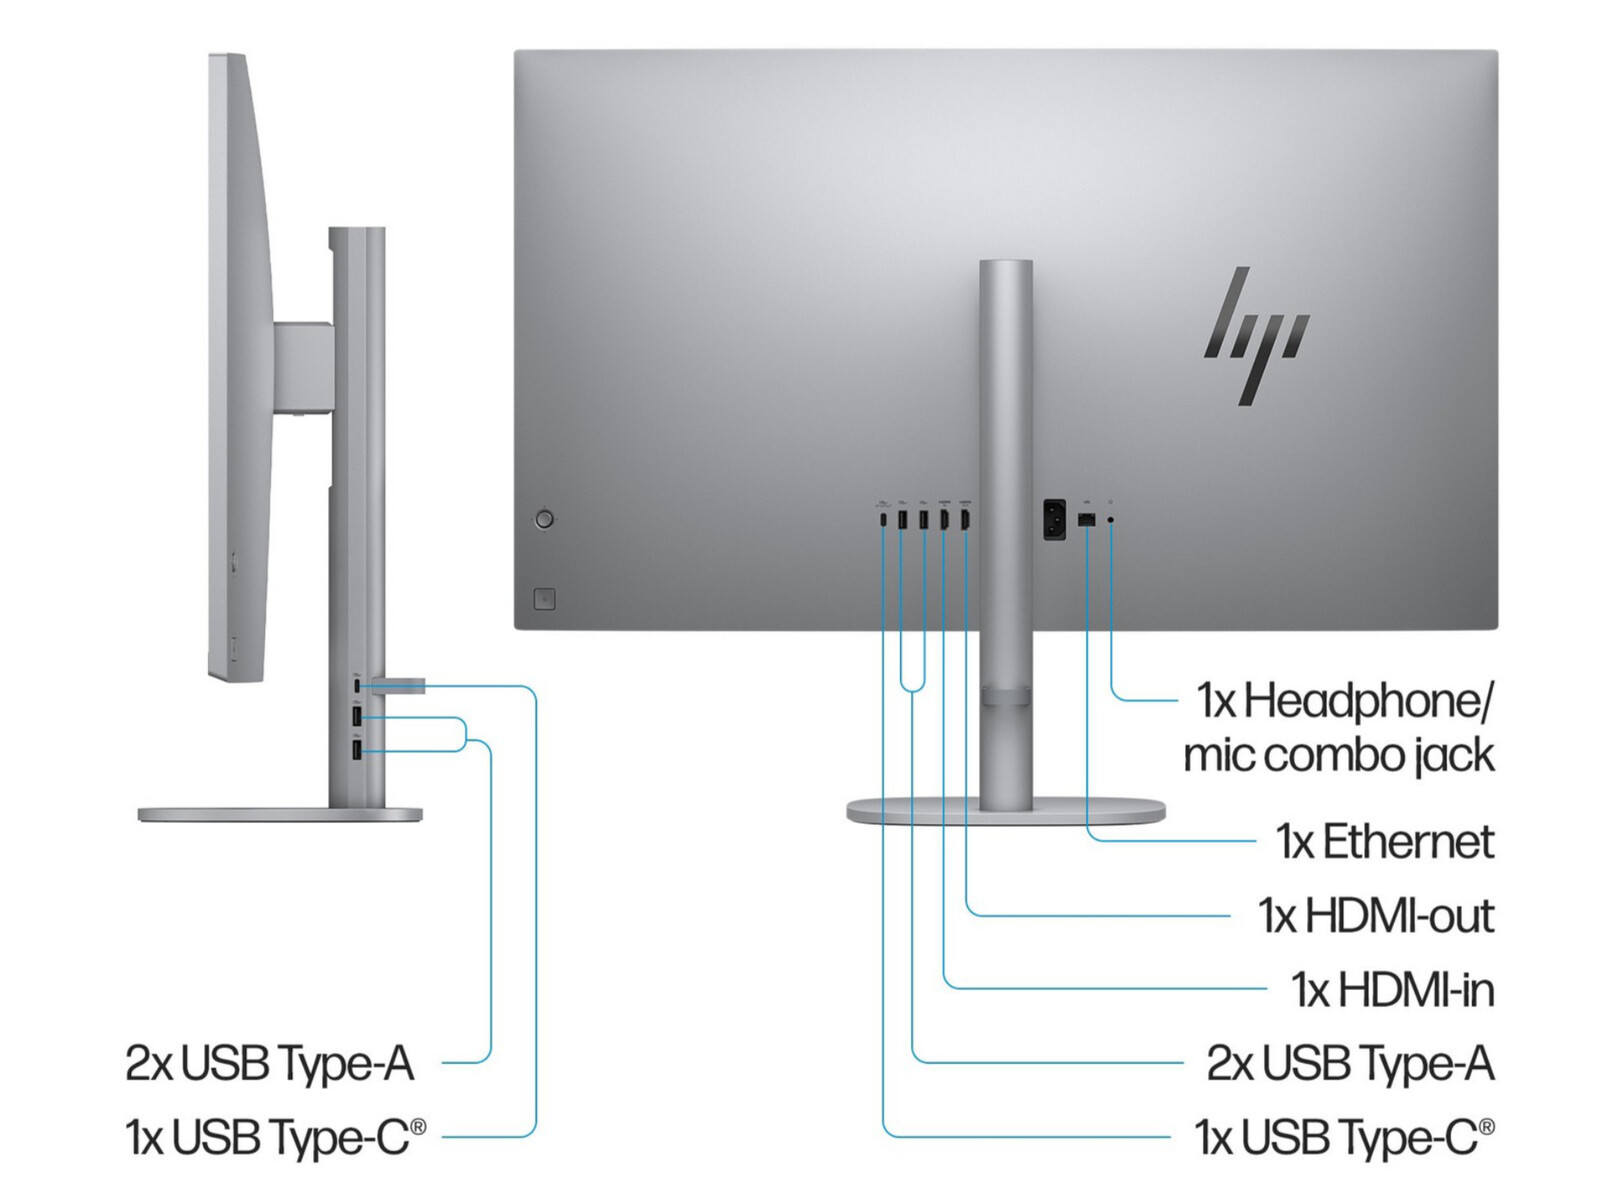
The HP OmniStudio X combines a slim design with high functionality. Its elegant case discreetly integrates the display, speakers and PC hardware. A wireless keyboard and mouse in the colorway Meteor Silver are included.
Three USB ports are installed into the stand and three more can be found at the back—they are all easily accessible. Two HDMI ports, including an HDMI-in connection, allow it to be used as an external monitor. Intel Wi-Fi 7 is available for wireless connections, or you can alternatively make use of a 2.5 Gbit/s RJ45 connection. For maintenance work, please refer to HP's support video.


Webcam

The HP OmniStudio X has a retractable 5 MP camera that quickly loses focus in poor lighting conditions. The included Poly Camera Pro software lets you easily customize it using predefined profiles. It also features a blur filter and a tracking mode that automatically keeps your face in focus.


Sustainability
The HP OmniStudio X devices meet the requirements for EPEAT and Energy Star, and have been awarded these. HP also uses ocean-bound plastic (OBP) and recycled post-consumer plastic, which is good for the environment. We also have to praise HP's packaging, which doesn't consist of any plastic at all.
Input devices - Mouse and keyboard included
The HP OmniStudio X comes with a stylish keyboard and mouse combination in the colorway Meteor Silver. Both devices connect wirelessly, with the keyboard scoring points for its good typing feel and number pad. The mouse is less ergonomic due to its sharp edges. The lack of keyboard backlighting is a minor disadvantage.

Display - 4K IPS only at 60 Hz

HP has equipped its OmniStudio X 32 with a high-resolution 4K display (3,840 x 2,160 pixels) featuring a 16:9 aspect ratio. The panel shows slight weaknesses when it comes to how uneven its illumination is, especially when displaying dark backgrounds. We were unable to detect PWM flickering, making it easier on the eyes. During our test, its maximum brightness averaged 488 cd/m², falling slightly short of the manufacturer's specifications.
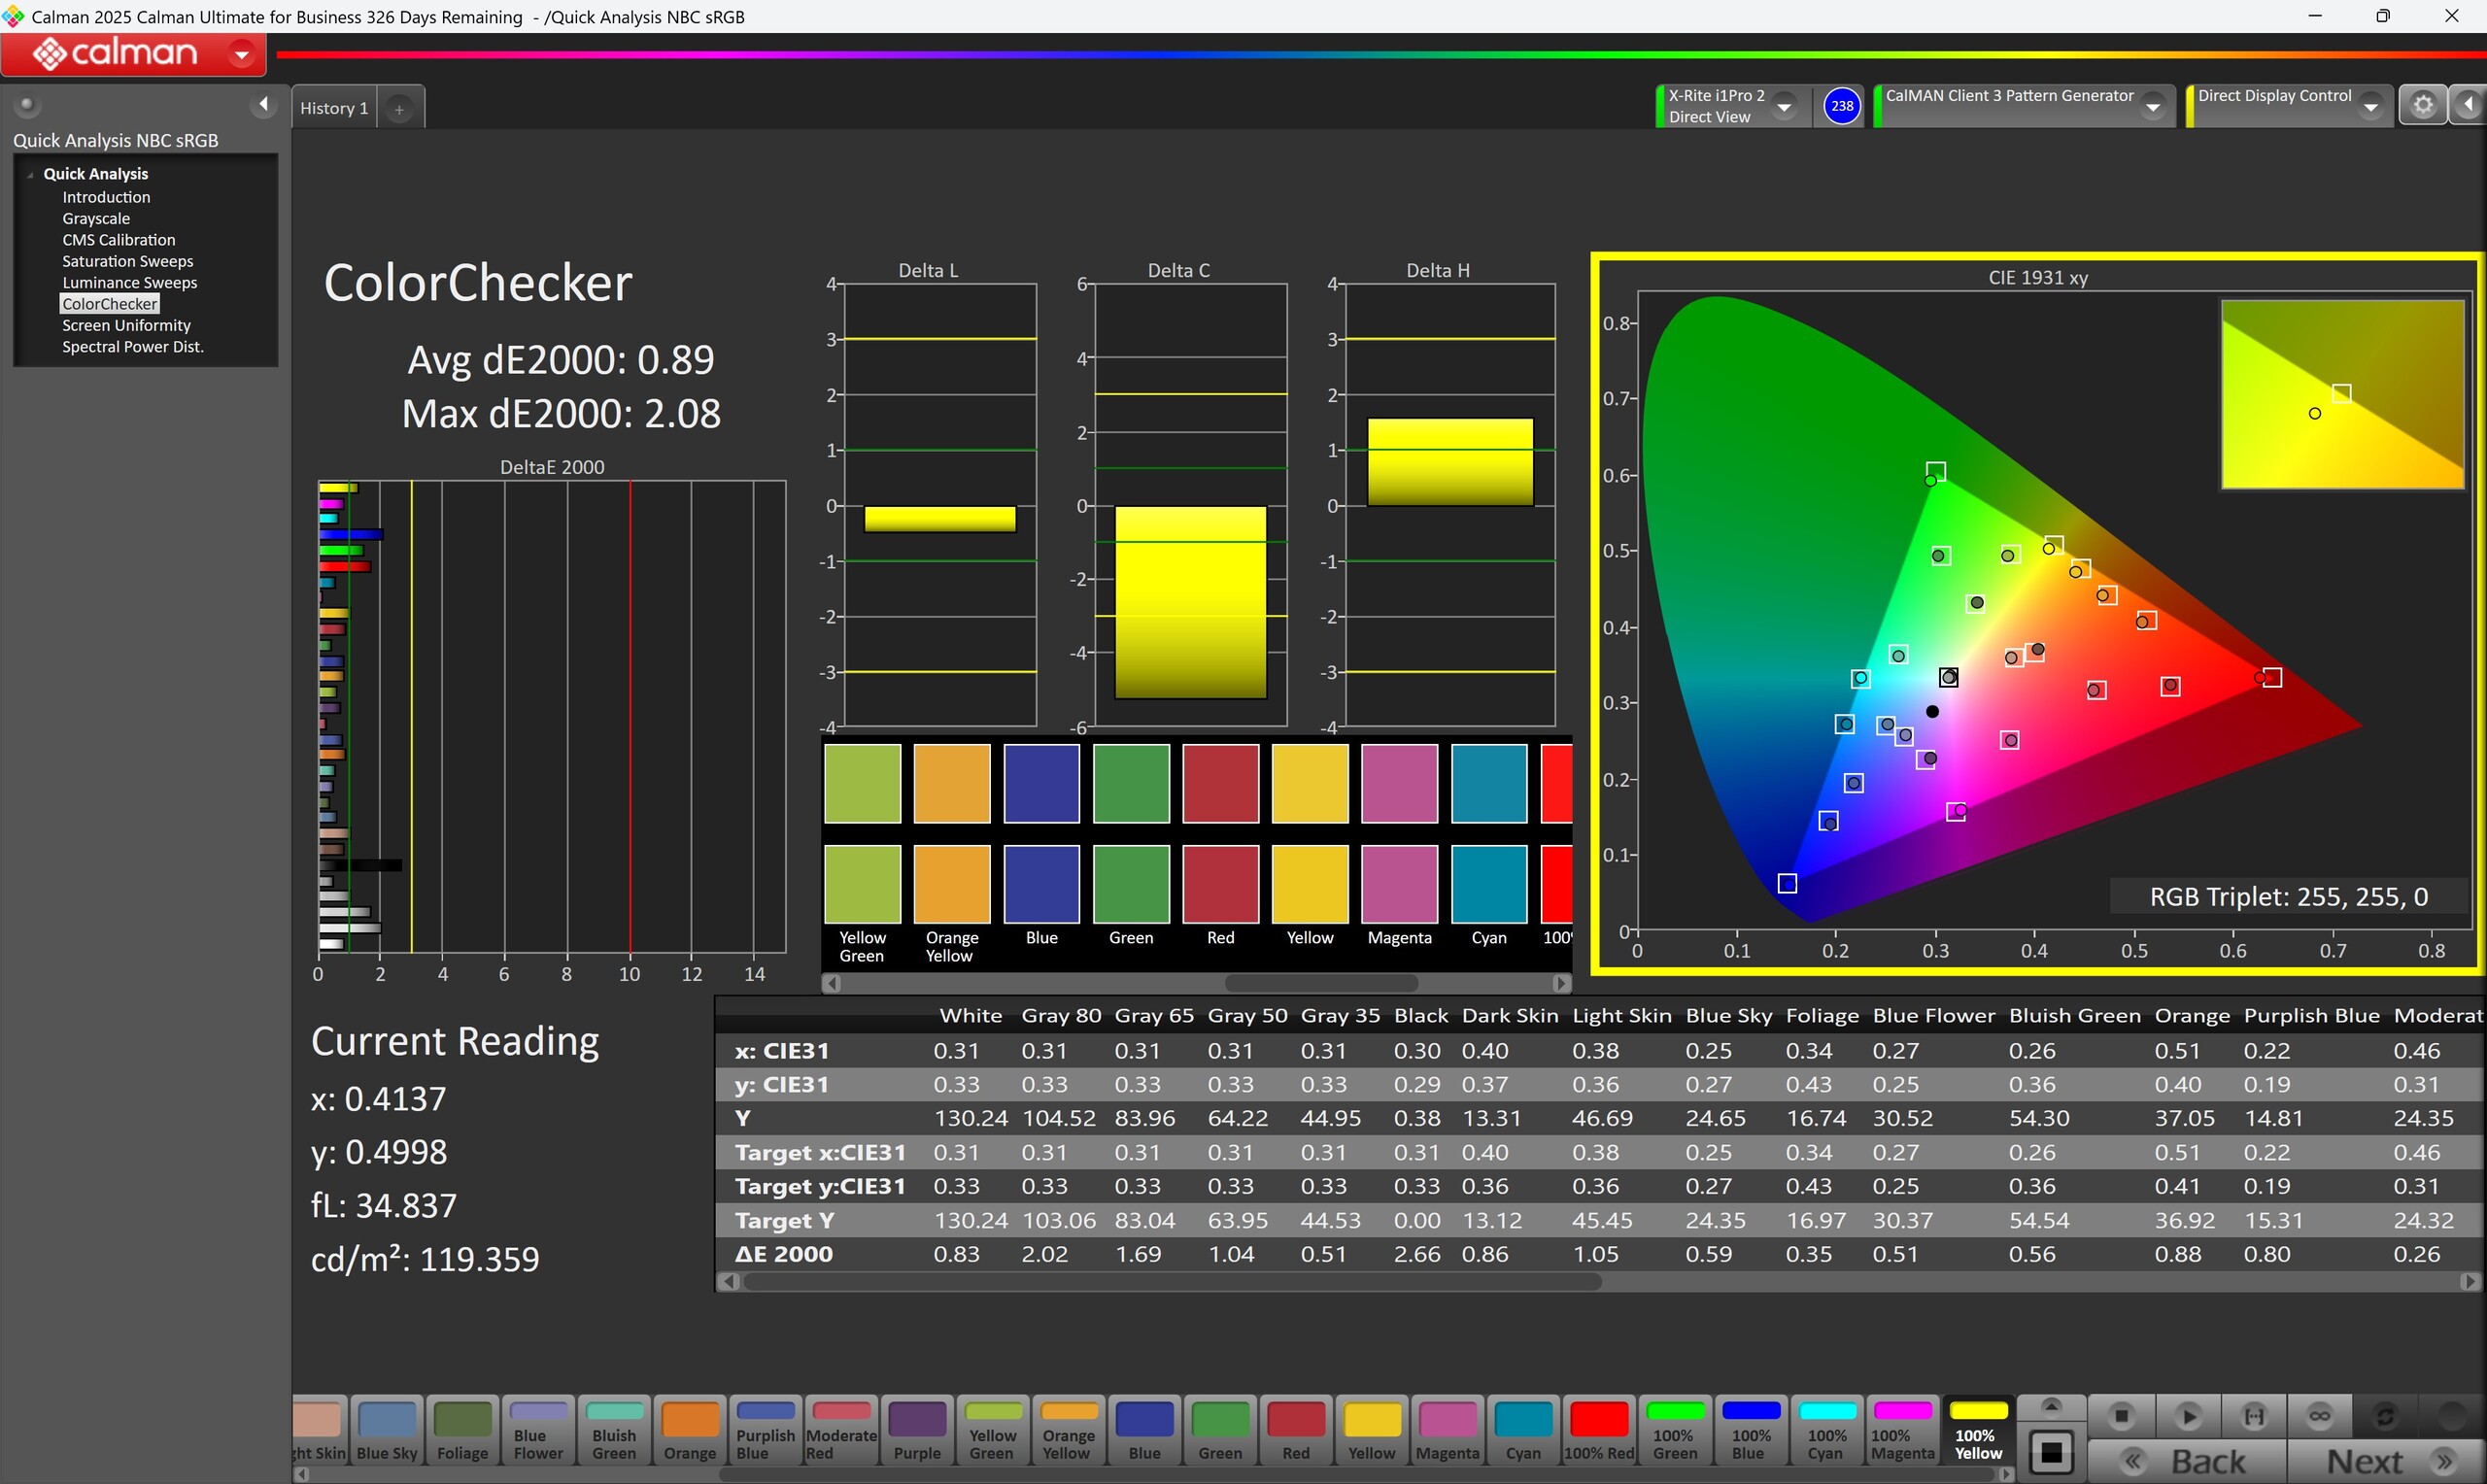
Its contrast ratio is slightly negatively affected by its increased black level. The panel features no factory calibration, which is reflected in increased Delta-E-2000 values. Regardless of the color profile used, color deviations are clearly visible and can only be significantly reduced via manual calibration.
Overall, the display offers good picture quality with high color space coverage and is suitable for professional photo and video editing. However, a 144 Hz option is missing, which would further enhance the device and underline its professional claim.
| |||||||||||||||||||||||||
Brightness Distribution: 88 %
Contrast: 1338:1 (Black: 0.39 cd/m²)
ΔE ColorChecker Calman: 3.76 | ∀{0.5-29.43 Ø4.71}
calibrated: 0.89
ΔE Greyscale Calman: 5.42 | ∀{0.09-98 Ø4.96}
85.8% AdobeRGB 1998 (Argyll 3D)
100% sRGB (Argyll 3D)
89.8% Display P3 (Argyll 3D)
Gamma: 2.49
CCT: 7521 K
| HP OmniStudio X 32-c0077ng HPN406F, IPS, 3840x2160, 32", 60 Hz | KTC KTC G42P5 OLED 3840x2160, 42", Hz | AOC CU34G2XPD VA , WLED, 3440x1440, 34", 180 Hz | Philips Evnia 34M2C8600 QD OLED, 3440x1440, 34", 175 Hz | |
|---|---|---|---|---|
| Display | 3% | -5% | 6% | |
| Display P3 Coverage (%) | 89.8 | 95.5 6% | 82.6 -8% | 98.4 10% |
| sRGB Coverage (%) | 100 | 100 0% | 99.6 0% | 99.9 0% |
| AdobeRGB 1998 Coverage (%) | 85.8 | 88.8 3% | 80.7 -6% | 93.9 9% |
| Response Times | 97% | 64% | 94% | |
| Response Time Grey 50% / Grey 80% * (ms) | 30.4 ? | 0.6 ? 98% | 11.6 ? 62% | 1.4 ? 95% |
| Response Time Black / White * (ms) | 20 ? | 1 ? 95% | 7 ? 65% | 1.4 ? 93% |
| PWM Frequency (Hz) | 60 | 175 | ||
| Screen | 4739% | -14% | 6% | |
| Brightness middle (cd/m²) | 522 | 448 -14% | 194 -63% | 231 -56% |
| Brightness (cd/m²) | 488 | 177 -64% | 210 -57% | |
| Brightness Distribution (%) | 88 | 86 -2% | 85 -3% | |
| Black Level * (cd/m²) | 0.39 | 0.001 100% | 0.05 87% | 0.1 74% |
| Contrast (:1) | 1338 | 448000 33383% | 3880 190% | 2310 73% |
| Colorchecker dE 2000 * | 3.76 | 4.08 -9% | 2.46 35% | 2.02 46% |
| Colorchecker dE 2000 max. * | 9.04 | 10.09 -12% | 4.36 52% | 5.12 43% |
| Colorchecker dE 2000 calibrated * | 0.89 | 3.3 -271% | 3.67 -312% | 2.02 -127% |
| Greyscale dE 2000 * | 5.42 | 5.63 -4% | 8.02 -48% | 2.11 61% |
| Gamma | 2.49 88% | 2.38 92% | 2.4 92% | 2.49 88% |
| CCT | 7521 86% | 7094 92% | 6394 102% | 6229 104% |
| Total Average (Program / Settings) | 1613% /
2781% | 15% /
-1% | 35% /
19% |
* ... smaller is better
Measurement results with sRGB color profile


Measurement results with P3 color profile


Color space coverage


Display Response Times
| ↔ Response Time Black to White | ||
|---|---|---|
| 20 ms ... rise ↗ and fall ↘ combined | ↗ 11.6 ms rise |  |
| ↘ 8.4 ms fall | ||
| The screen shows good response rates in our tests, but may be too slow for competitive gamers. In comparison, all tested devices range from 0.1 (minimum) to 240 (maximum) ms. » 44 % of all devices are better. This means that the measured response time is similar to the average of all tested devices (19.8 ms). | ||
| ↔ Response Time 50% Grey to 80% Grey | ||
| 30.4 ms ... rise ↗ and fall ↘ combined | ↗ 16.4 ms rise |  |
| ↘ 14 ms fall | ||
| The screen shows slow response rates in our tests and will be unsatisfactory for gamers. In comparison, all tested devices range from 0.165 (minimum) to 636 (maximum) ms. » 41 % of all devices are better. This means that the measured response time is similar to the average of all tested devices (30.9 ms). | ||
Screen Flickering / PWM (Pulse-Width Modulation)
| Screen flickering / PWM not detected |  | ||
In comparison: 52 % of all tested devices do not use PWM to dim the display. If PWM was detected, an average of 7748 (minimum: 5 - maximum: 343500) Hz was measured. | |||


Performance - Intel Core Ultra 7 with 16 cores
The HP OmniStudio X is equipped with the Intel Core Ultra 7 155H and, as a result, offers good computing power, efficient multitasking and modern AI functions. This combination makes it particularly attractive for demanding users. An Nvidia GeForce RTX 4050 Laptop is installed for 3D calculations. The HP OmniStudio X is slightly cheaper if the dedicated GPU is omitted.


Testing conditions
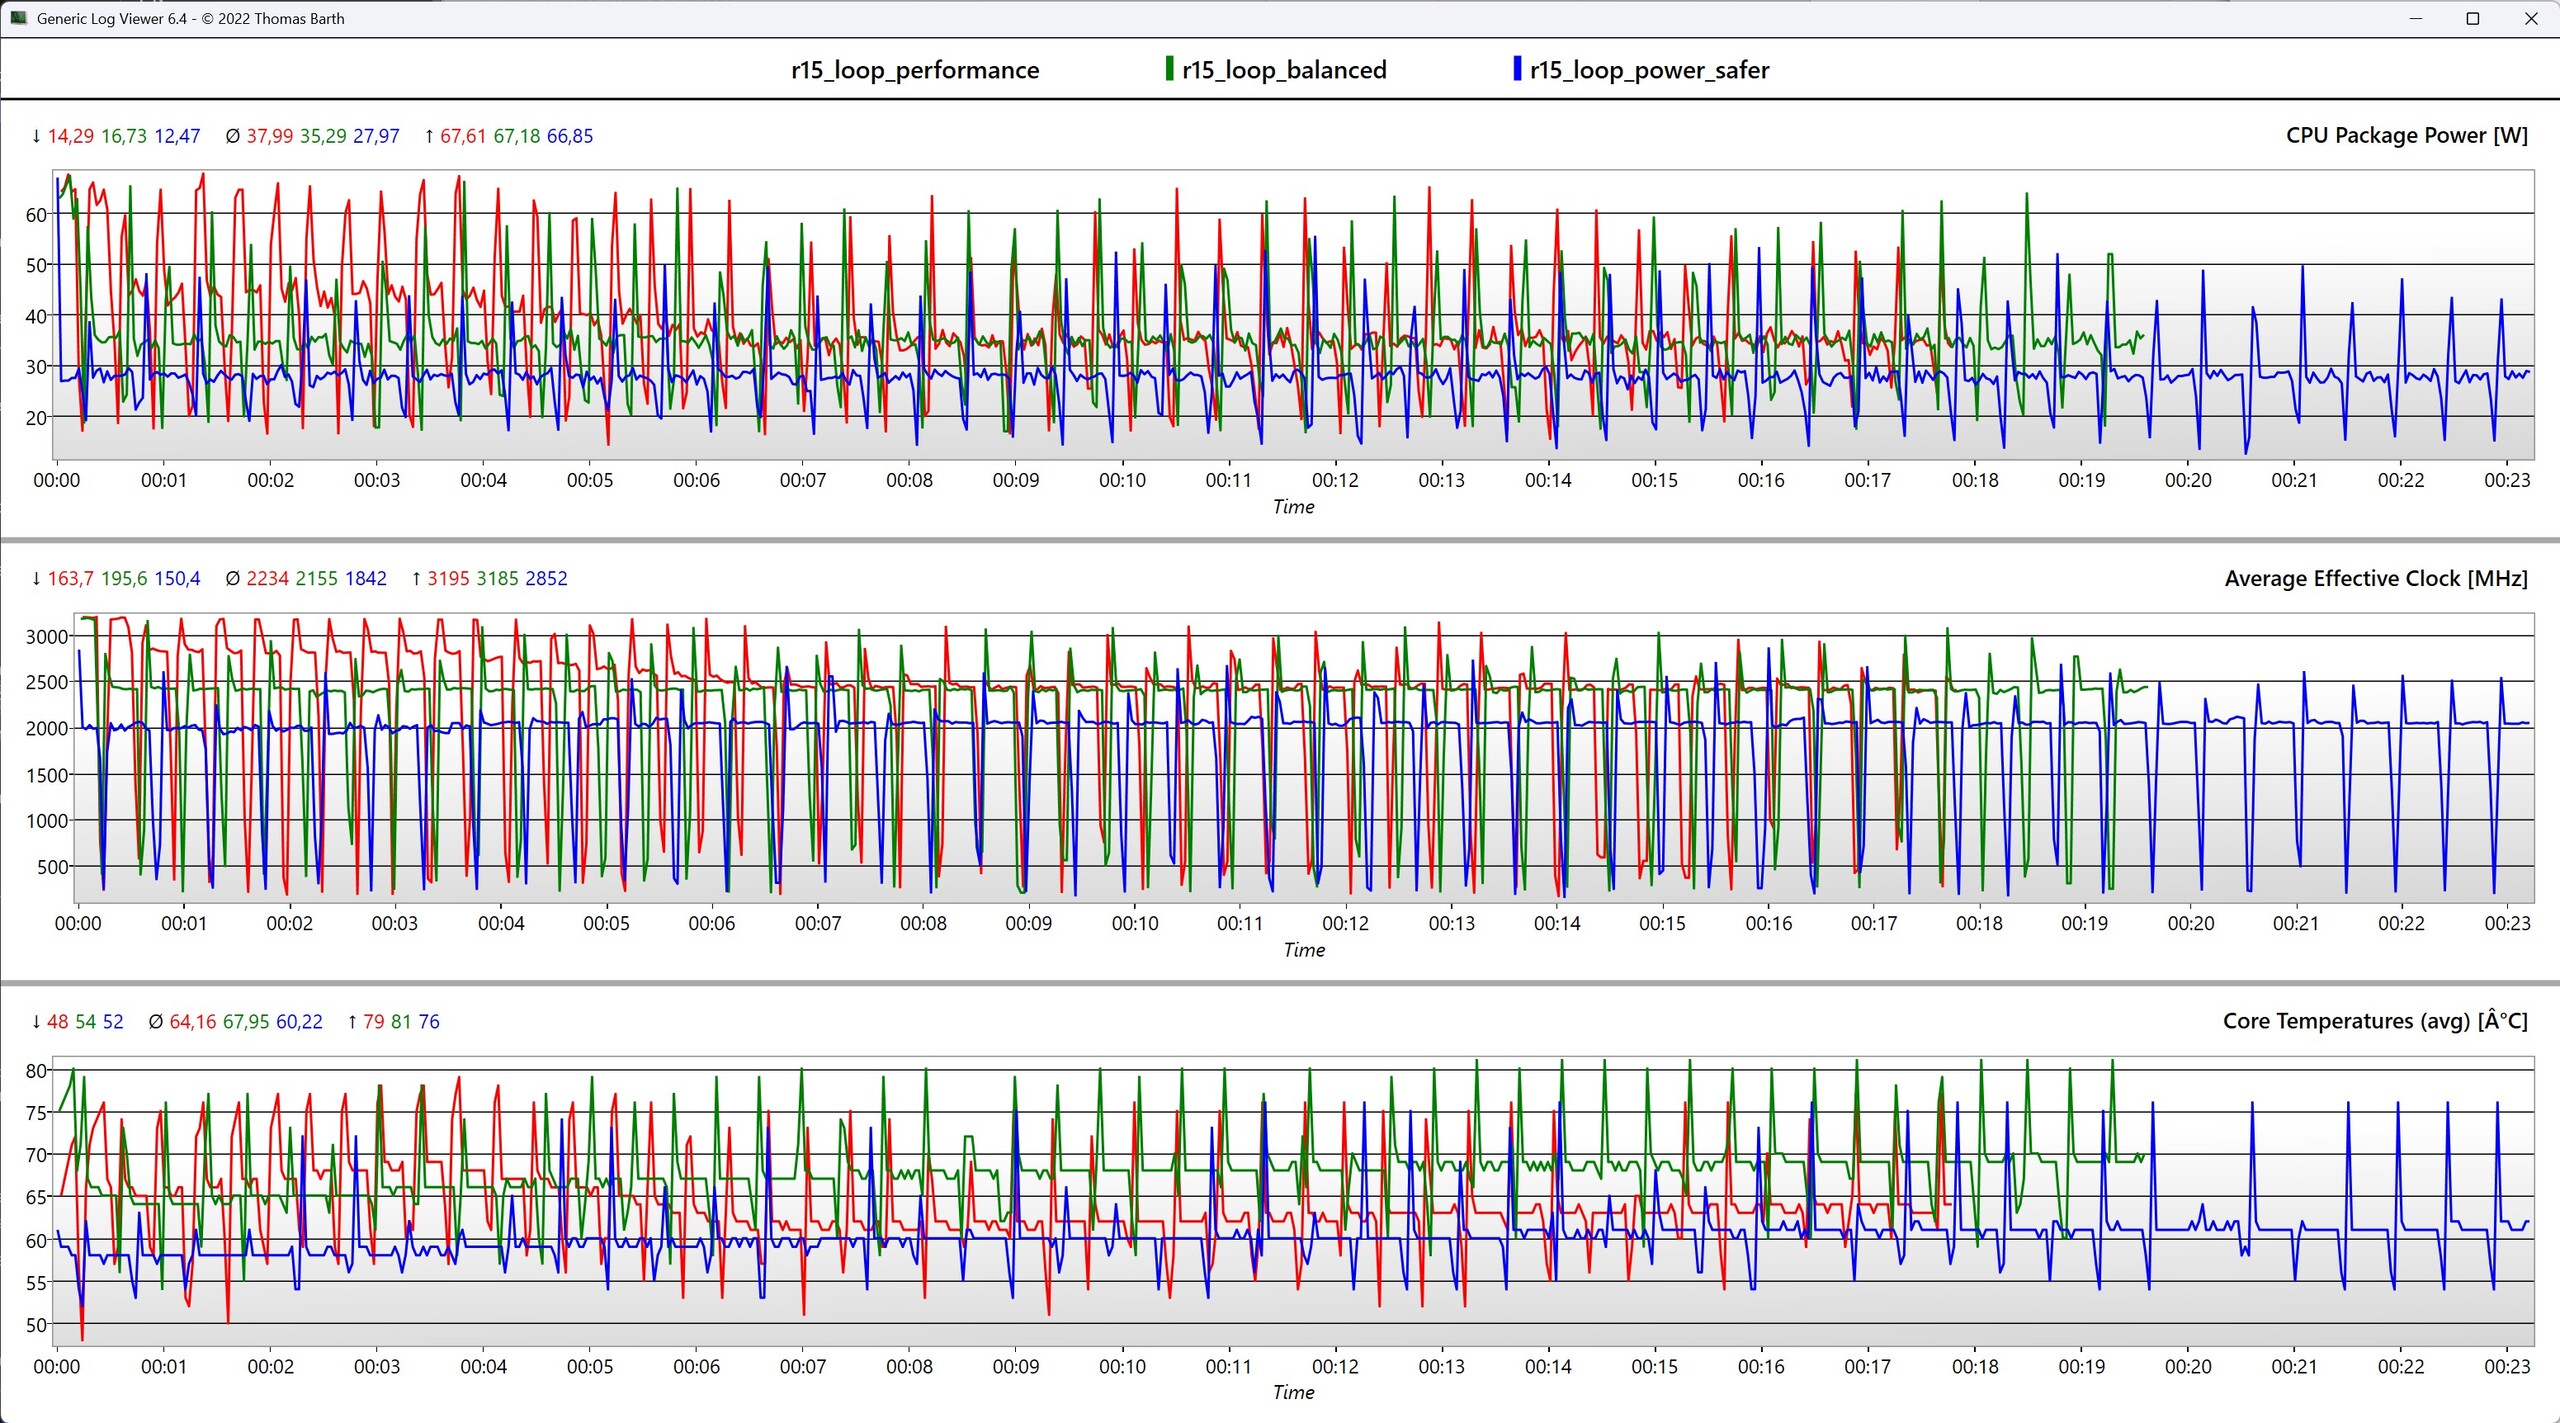
A handful of power modes can be selected via the myHP app. We carried out all performance tests using performance mode. Using this power profile, the Nvidia GeForce RTX 4050 Laptop can operate at up to 60 watts. In balanced mode, the dedicated graphics card's power consumption drops to 35 watts.

Processor
The Intel Core Ultra 7 155H inside the HP OmniStudio X delivers enough performance for creative applications with its 16 cores and 22 threads. With a clock rate of up to 4.8 GHz, the processor delivers a performance that is in line with our average results. It showed good results in benchmarks, both during single and multi-core tasks, but couldn't come close to the performance of an AMD Ryzen 7 8845HS.
| Power mode | Cinebench R15 1T | Cinebench R15 nT | Cinebench R20 1T | Cinebench R20 nT | Cinebench R23 1T | Cinebench R23 nT |
|---|---|---|---|---|---|---|
| Power Saver | 206 | 2,140 | 576 | 4,705 | 1,362 | 13,318 |
| Balanced | 238 | 2,378 | 653 | 5,505 | 1,708 | 14,199 |
| Performance | 246 | 2,652 | 674 | 5,710 | 1,722 | 16,119 |
Cinebench R23: Multi Core | Single Core
Cinebench R20: CPU (Multi Core) | CPU (Single Core)
Cinebench R15: CPU Multi 64Bit | CPU Single 64Bit
7-Zip 18.03: 7z b 4 | 7z b 4 -mmt1
Geekbench 6.7: Multi-Core | Single-Core
Geekbench 5.5: Multi-Core | Single-Core
HWBOT x265 Benchmark v2.2: 4k Preset
LibreOffice : 20 Documents To PDF
R Benchmark 2.5: Overall mean
| CPU Performance rating | |
| Average AMD Ryzen 7 8845HS | |
| Average Intel Core Ultra 7 155H | |
| HP OmniStudio X 32-c0077ng | |
| Average AMD Ryzen 9 6900HX | |
| Average Intel Core i7-11800H | |
| Average Intel Core Ultra 5 125H | |
| Cinebench R23 / Multi Core | |
| Average AMD Ryzen 7 8845HS (14895 - 18037, n=13) | |
| HP OmniStudio X 32-c0077ng | |
| Average Intel Core Ultra 7 155H (9769 - 19007, n=52) | |
| Average AMD Ryzen 9 6900HX (9709 - 15100, n=19) | |
| Average Intel Core Ultra 5 125H (8419 - 14564, n=8) | |
| Average Intel Core i7-11800H (6508 - 14088, n=48) | |
| Cinebench R23 / Single Core | |
| Average AMD Ryzen 7 8845HS (1623 - 1783, n=13) | |
| Average Intel Core Ultra 7 155H (1496 - 1815, n=52) | |
| HP OmniStudio X 32-c0077ng | |
| Average Intel Core Ultra 5 125H (1539 - 1735, n=8) | |
| Average AMD Ryzen 9 6900HX (1516 - 1616, n=19) | |
| Average Intel Core i7-11800H (1386 - 1522, n=45) | |
| Cinebench R20 / CPU (Multi Core) | |
| Average AMD Ryzen 7 8845HS (5808 - 7026, n=13) | |
| Average Intel Core Ultra 7 155H (3798 - 7409, n=50) | |
| HP OmniStudio X 32-c0077ng | |
| Average AMD Ryzen 9 6900HX (3742 - 5813, n=19) | |
| Average Intel Core Ultra 5 125H (3203 - 5618, n=8) | |
| Average Intel Core i7-11800H (2498 - 5408, n=50) | |
| Cinebench R20 / CPU (Single Core) | |
| Average AMD Ryzen 7 8845HS (673 - 698, n=13) | |
| HP OmniStudio X 32-c0077ng | |
| Average Intel Core Ultra 7 155H (601 - 696, n=50) | |
| Average Intel Core Ultra 5 125H (592 - 664, n=8) | |
| Average AMD Ryzen 9 6900HX (595 - 631, n=19) | |
| Average Intel Core i7-11800H (520 - 586, n=47) | |
| Cinebench R15 / CPU Multi 64Bit | |
| HP OmniStudio X 32-c0077ng | |
| Average AMD Ryzen 7 8845HS (2342 - 2908, n=13) | |
| Average Intel Core Ultra 7 155H (1932 - 2880, n=56) | |
| Average AMD Ryzen 9 6900HX (1588 - 2411, n=19) | |
| Average Intel Core Ultra 5 125H (1225 - 2245, n=8) | |
| Average Intel Core i7-11800H (1342 - 2173, n=50) | |
| Cinebench R15 / CPU Single 64Bit | |
| Average AMD Ryzen 7 8845HS (269 - 283, n=13) | |
| Average AMD Ryzen 9 6900HX (241 - 261, n=19) | |
| Average Intel Core Ultra 7 155H (99.6 - 268, n=52) | |
| HP OmniStudio X 32-c0077ng | |
| Average Intel Core Ultra 5 125H (217 - 251, n=8) | |
| Average Intel Core i7-11800H (201 - 231, n=46) | |
| 7-Zip 18.03 / 7z b 4 | |
| Average AMD Ryzen 7 8845HS (62669 - 74664, n=13) | |
| HP OmniStudio X 32-c0077ng | |
| Average AMD Ryzen 9 6900HX (49526 - 65336, n=20) | |
| Average Intel Core Ultra 7 155H (41739 - 70254, n=50) | |
| Average Intel Core i7-11800H (33718 - 56758, n=46) | |
| Average Intel Core Ultra 5 125H (0 - 0, n=3) | |
| 7-Zip 18.03 / 7z b 4 -mmt1 | |
| Average AMD Ryzen 7 8845HS (5197 - 6714, n=13) | |
| Average AMD Ryzen 9 6900HX (5090 - 6070, n=20) | |
| Average Intel Core i7-11800H (5138 - 5732, n=46) | |
| Average Intel Core Ultra 7 155H (4594 - 5621, n=50) | |
| HP OmniStudio X 32-c0077ng | |
| Average Intel Core Ultra 5 125H (4663 - 5136, n=8) | |
| Geekbench 6.7 / Multi-Core | |
| Average AMD Ryzen 7 8845HS (11073 - 14014, n=18) | |
| HP OmniStudio X 32-c0077ng | |
| Average Intel Core Ultra 7 155H (7732 - 13656, n=55) | |
| Average Intel Core Ultra 5 125H (10527 - 11749, n=7) | |
| Average AMD Ryzen 9 6900HX (n=1) | |
| Average Intel Core i7-11800H (8860 - 9647, n=2) | |
| Geekbench 6.7 / Single-Core | |
| Average AMD Ryzen 7 8845HS (2510 - 2698, n=16) | |
| HP OmniStudio X 32-c0077ng | |
| Average Intel Core Ultra 7 155H (1901 - 2473, n=52) | |
| Average Intel Core Ultra 5 125H (2134 - 2316, n=7) | |
| Average Intel Core i7-11800H (2165 - 2220, n=2) | |
| Average AMD Ryzen 9 6900HX (n=1) | |
| Geekbench 5.5 / Multi-Core | |
| HP OmniStudio X 32-c0077ng | |
| Average Intel Core Ultra 7 155H (10017 - 13556, n=52) | |
| Average AMD Ryzen 7 8845HS (11256 - 12726, n=15) | |
| Average Intel Core Ultra 5 125H (8717 - 10856, n=8) | |
| Average AMD Ryzen 9 6900HX (8313 - 10490, n=21) | |
| Average Intel Core i7-11800H (4655 - 9851, n=40) | |
| Geekbench 5.5 / Single-Core | |
| Average AMD Ryzen 7 8845HS (1765 - 2004, n=15) | |
| HP OmniStudio X 32-c0077ng | |
| Average Intel Core Ultra 7 155H (1462 - 1824, n=52) | |
| Average Intel Core Ultra 5 125H (1593 - 1699, n=8) | |
| Average AMD Ryzen 9 6900HX (1523 - 1652, n=21) | |
| Average Intel Core i7-11800H (1429 - 1625, n=40) | |
| HWBOT x265 Benchmark v2.2 / 4k Preset | |
| Average AMD Ryzen 7 8845HS (18.6 - 22.7, n=13) | |
| HP OmniStudio X 32-c0077ng | |
| Average AMD Ryzen 9 6900HX (12.6 - 18.7, n=20) | |
| Average Intel Core Ultra 7 155H (9.93 - 21.2, n=50) | |
| Average Intel Core i7-11800H (7.38 - 17.4, n=46) | |
| Average Intel Core Ultra 5 125H (8.52 - 16.7, n=8) | |
| LibreOffice / 20 Documents To PDF | |
| HP OmniStudio X 32-c0077ng | |
| Average Intel Core Ultra 5 125H (42.7 - 70.9, n=8) | |
| Average AMD Ryzen 9 6900HX (44.8 - 81.7, n=20) | |
| Average AMD Ryzen 7 8845HS (44.4 - 77, n=13) | |
| Average Intel Core Ultra 7 155H (37.5 - 79.2, n=49) | |
| Average Intel Core i7-11800H (38.6 - 59.9, n=45) | |
| R Benchmark 2.5 / Overall mean | |
| Average Intel Core i7-11800H (0.548 - 0.615, n=46) | |
| Average Intel Core Ultra 5 125H (0.4898 - 0.565, n=8) | |
| HP OmniStudio X 32-c0077ng | |
| Average AMD Ryzen 9 6900HX (0.4627 - 0.4974, n=20) | |
| Average Intel Core Ultra 7 155H (0.4457 - 0.53, n=49) | |
| Average AMD Ryzen 7 8845HS (0.4304 - 0.4935, n=13) | |
* ... smaller is better
Cinebench R15 Multi continuous test
AIDA64: FP32 Ray-Trace | FPU Julia | CPU SHA3 | CPU Queen | FPU SinJulia | FPU Mandel | CPU AES | CPU ZLib | FP64 Ray-Trace | CPU PhotoWorxx
| Performance rating | |
| Average AMD Ryzen 7 8845HS | |
| Average AMD Ryzen 9 6900HX | |
| Average Intel Core Ultra 7 155H | |
| HP OmniStudio X 32-c0077ng | |
| Average Intel Core i7-11800H | |
| Average Intel Core Ultra 5 125H | |
| AIDA64 / FP32 Ray-Trace | |
| Average AMD Ryzen 7 8845HS (23708 - 29544, n=13) | |
| Average AMD Ryzen 9 6900HX (10950 - 17963, n=20) | |
| Average Intel Core i7-11800H (8772 - 15961, n=20) | |
| Average Intel Core Ultra 7 155H (6670 - 18470, n=50) | |
| HP OmniStudio X 32-c0077ng | |
| Average Intel Core Ultra 5 125H (7208 - 13639, n=8) | |
| AIDA64 / FPU Julia | |
| Average AMD Ryzen 7 8845HS (99659 - 125873, n=13) | |
| Average AMD Ryzen 9 6900HX (71414 - 110797, n=20) | |
| Average Intel Core Ultra 7 155H (40905 - 93181, n=50) | |
| HP OmniStudio X 32-c0077ng | |
| Average Intel Core i7-11800H (39404 - 65636, n=20) | |
| Average Intel Core Ultra 5 125H (38292 - 70880, n=8) | |
| AIDA64 / CPU SHA3 | |
| Average AMD Ryzen 7 8845HS (4332 - 5180, n=13) | |
| Average Intel Core i7-11800H (2599 - 4439, n=20) | |
| Average AMD Ryzen 9 6900HX (2471 - 3804, n=20) | |
| Average Intel Core Ultra 7 155H (1940 - 4436, n=50) | |
| HP OmniStudio X 32-c0077ng | |
| Average Intel Core Ultra 5 125H (1734 - 3404, n=8) | |
| AIDA64 / CPU Queen | |
| Average AMD Ryzen 7 8845HS (109458 - 124695, n=13) | |
| Average AMD Ryzen 9 6900HX (84185 - 107544, n=20) | |
| Average Intel Core i7-11800H (85233 - 91941, n=20) | |
| Average Intel Core Ultra 7 155H (64698 - 94181, n=50) | |
| Average Intel Core Ultra 5 125H (76983 - 79986, n=7) | |
| HP OmniStudio X 32-c0077ng | |
| AIDA64 / FPU SinJulia | |
| Average AMD Ryzen 7 8845HS (14062 - 15519, n=13) | |
| Average AMD Ryzen 9 6900HX (10970 - 13205, n=20) | |
| Average Intel Core i7-11800H (6420 - 9792, n=20) | |
| Average Intel Core Ultra 7 155H (5639 - 10647, n=50) | |
| HP OmniStudio X 32-c0077ng | |
| Average Intel Core Ultra 5 125H (5219 - 7851, n=8) | |
| AIDA64 / FPU Mandel | |
| Average AMD Ryzen 7 8845HS (53436 - 67367, n=13) | |
| Average AMD Ryzen 9 6900HX (39164 - 61370, n=20) | |
| Average Intel Core i7-11800H (23365 - 39464, n=20) | |
| Average Intel Core Ultra 7 155H (18236 - 47685, n=50) | |
| HP OmniStudio X 32-c0077ng | |
| Average Intel Core Ultra 5 125H (19180 - 35321, n=8) | |
| AIDA64 / CPU AES | |
| Average Intel Core i7-11800H (74617 - 149388, n=20) | |
| Average AMD Ryzen 9 6900HX (54613 - 142360, n=20) | |
| Average AMD Ryzen 7 8845HS (64515 - 172642, n=13) | |
| Average Intel Core Ultra 7 155H (45713 - 152179, n=50) | |
| HP OmniStudio X 32-c0077ng | |
| Average Intel Core Ultra 5 125H (36196 - 108402, n=8) | |
| AIDA64 / CPU ZLib | |
| Average AMD Ryzen 7 8845HS (627 - 1080, n=13) | |
| Average Intel Core Ultra 7 155H (557 - 1250, n=50) | |
| HP OmniStudio X 32-c0077ng | |
| Average AMD Ryzen 9 6900HX (578 - 911, n=20) | |
| Average Intel Core Ultra 5 125H (485 - 994, n=8) | |
| Average Intel Core i7-11800H (461 - 830, n=43) | |
| AIDA64 / FP64 Ray-Trace | |
| Average AMD Ryzen 7 8845HS (12361 - 15911, n=13) | |
| Average AMD Ryzen 9 6900HX (5798 - 9540, n=20) | |
| Average Intel Core i7-11800H (4545 - 8717, n=21) | |
| Average Intel Core Ultra 7 155H (3569 - 9802, n=50) | |
| HP OmniStudio X 32-c0077ng | |
| Average Intel Core Ultra 5 125H (3753 - 7221, n=8) | |
| AIDA64 / CPU PhotoWorxx | |
| Average Intel Core Ultra 7 155H (32719 - 54223, n=50) | |
| HP OmniStudio X 32-c0077ng | |
| Average Intel Core Ultra 5 125H (23499 - 49844, n=8) | |
| Average AMD Ryzen 7 8845HS (33192 - 41668, n=13) | |
| Average AMD Ryzen 9 6900HX (26873 - 30604, n=20) | |
| Average Intel Core i7-11800H (11898 - 26757, n=21) | |
System performance
The HP OmniStudio X all-in-one PC offers powerful system performance that is good enough for creative and productive applications. Its combination of the Intel Core Ultra 7 155H and the Nvidia GeForce RTX 4050 Laptop features enough reserves to handle even power-hungry tasks. Thanks to its 4K display, it is ideal for image and video editing. Overall, it is a powerful all-in-one system for professional users.
CrossMark: Overall | Productivity | Creativity | Responsiveness
WebXPRT 3: Overall
WebXPRT 4: Overall
Mozilla Kraken 1.1: Total
| PCMark 10 / Score | |
| Average AMD Ryzen 7 8845HS (6993 - 8822, n=15) | |
| HP OmniStudio X 32-c0077ng | |
| Average AMD Ryzen 9 6900HX (6251 - 7669, n=21) | |
| Average Intel Core Ultra 7 155H, NVIDIA GeForce RTX 4050 Laptop GPU (6537 - 6973, n=5) | |
| Average Intel Core Ultra 7 155H (4809 - 7761, n=51) | |
| Average Intel Core i7-11800H (4960 - 7470, n=40) | |
| Average Intel Core Ultra 5 125H (6024 - 7240, n=9) | |
| PCMark 10 / Essentials | |
| Average AMD Ryzen 7 8845HS (9626 - 11570, n=15) | |
| Average Intel Core Ultra 7 155H (7605 - 11289, n=51) | |
| Average AMD Ryzen 9 6900HX (9374 - 11323, n=21) | |
| Average Intel Core Ultra 7 155H, NVIDIA GeForce RTX 4050 Laptop GPU (9463 - 10446, n=5) | |
| Average Intel Core i7-11800H (8472 - 11064, n=40) | |
| Average Intel Core Ultra 5 125H (9184 - 10697, n=9) | |
| HP OmniStudio X 32-c0077ng | |
| PCMark 10 / Productivity | |
| Average AMD Ryzen 7 8845HS (9631 - 14612, n=15) | |
| Average AMD Ryzen 9 6900HX (7704 - 10210, n=21) | |
| HP OmniStudio X 32-c0077ng | |
| Average Intel Core Ultra 7 155H, NVIDIA GeForce RTX 4050 Laptop GPU (8769 - 9272, n=5) | |
| Average Intel Core Ultra 7 155H (6042 - 10591, n=51) | |
| Average Intel Core i7-11800H (6562 - 9803, n=40) | |
| Average Intel Core Ultra 5 125H (7042 - 13501, n=9) | |
| PCMark 10 / Digital Content Creation | |
| Average AMD Ryzen 7 8845HS (9009 - 13528, n=15) | |
| HP OmniStudio X 32-c0077ng | |
| Average AMD Ryzen 9 6900HX (6920 - 11572, n=21) | |
| Average Intel Core Ultra 7 155H, NVIDIA GeForce RTX 4050 Laptop GPU (8602 - 10622, n=5) | |
| Average Intel Core Ultra 7 155H (4985 - 13035, n=51) | |
| Average Intel Core i7-11800H (5081 - 11323, n=40) | |
| Average Intel Core Ultra 5 125H (8022 - 9506, n=9) | |
| CrossMark / Overall | |
| Average AMD Ryzen 7 8845HS (1531 - 1939, n=12) | |
| HP OmniStudio X 32-c0077ng | |
| Average Intel Core Ultra 7 155H (1366 - 1903, n=50) | |
| Average Intel Core Ultra 7 155H, NVIDIA GeForce RTX 4050 Laptop GPU (1552 - 1740, n=5) | |
| Average AMD Ryzen 9 6900HX (1476 - 1743, n=16) | |
| Average Intel Core Ultra 5 125H (1480 - 1633, n=7) | |
| Average Intel Core i7-11800H (1367 - 1683, n=9) | |
| CrossMark / Productivity | |
| Average AMD Ryzen 7 8845HS (1488 - 1872, n=12) | |
| Average AMD Ryzen 9 6900HX (1451 - 1738, n=16) | |
| Average Intel Core Ultra 7 155H (1291 - 1798, n=49) | |
| HP OmniStudio X 32-c0077ng | |
| Average Intel Core Ultra 7 155H, NVIDIA GeForce RTX 4050 Laptop GPU (1459 - 1659, n=5) | |
| Average Intel Core i7-11800H (1389 - 1660, n=9) | |
| Average Intel Core Ultra 5 125H (1412 - 1594, n=7) | |
| CrossMark / Creativity | |
| HP OmniStudio X 32-c0077ng | |
| Average AMD Ryzen 7 8845HS (1683 - 2102, n=12) | |
| Average Intel Core Ultra 7 155H, NVIDIA GeForce RTX 4050 Laptop GPU (1811 - 1943, n=5) | |
| Average Intel Core Ultra 7 155H (1519 - 2014, n=49) | |
| Average AMD Ryzen 9 6900HX (1632 - 1867, n=16) | |
| Average Intel Core Ultra 5 125H (1520 - 1780, n=7) | |
| Average Intel Core i7-11800H (1430 - 1728, n=9) | |
| CrossMark / Responsiveness | |
| Average AMD Ryzen 7 8845HS (1255 - 1849, n=12) | |
| Average Intel Core Ultra 7 155H (939 - 1802, n=49) | |
| Average AMD Ryzen 9 6900HX (1060 - 1715, n=16) | |
| HP OmniStudio X 32-c0077ng | |
| Average Intel Core i7-11800H (1038 - 1633, n=9) | |
| Average Intel Core Ultra 5 125H (1171 - 1520, n=7) | |
| Average Intel Core Ultra 7 155H, NVIDIA GeForce RTX 4050 Laptop GPU (1167 - 1467, n=5) | |
| WebXPRT 3 / Overall | |
| Average AMD Ryzen 7 8845HS (275 - 334, n=13) | |
| Average AMD Ryzen 9 6900HX (248 - 304, n=17) | |
| Average Intel Core Ultra 7 155H (213 - 299, n=50) | |
| Average Intel Core Ultra 7 155H, NVIDIA GeForce RTX 4050 Laptop GPU (262 - 285, n=5) | |
| Average Intel Core i7-11800H (251 - 280, n=40) | |
| HP OmniStudio X 32-c0077ng | |
| Average Intel Core Ultra 5 125H (245 - 263, n=8) | |
| WebXPRT 4 / Overall | |
| Average AMD Ryzen 7 8845HS (176.4 - 314, n=12) | |
| Average Intel Core Ultra 7 155H, NVIDIA GeForce RTX 4050 Laptop GPU (247 - 260, n=5) | |
| Average Intel Core Ultra 7 155H (166.4 - 309, n=45) | |
| HP OmniStudio X 32-c0077ng | |
| Average Intel Core Ultra 5 125H (222 - 240, n=7) | |
| Average AMD Ryzen 9 6900HX (200 - 233, n=15) | |
| Average Intel Core i7-11800H (211 - 218, n=3) | |
| Mozilla Kraken 1.1 / Total | |
| Average Intel Core i7-11800H (600 - 690, n=45) | |
| Average AMD Ryzen 9 6900HX (564 - 607, n=18) | |
| Average Intel Core Ultra 5 125H (560 - 625, n=8) | |
| HP OmniStudio X 32-c0077ng | |
| Average Intel Core Ultra 7 155H (416 - 642, n=50) | |
| Average AMD Ryzen 7 8845HS (496 - 664, n=13) | |
| Average Intel Core Ultra 7 155H, NVIDIA GeForce RTX 4050 Laptop GPU (416 - 561, n=5) | |
* ... smaller is better
| PCMark 10 Score | 6956 points | |
Help | ||
| AIDA64 / Memory Copy | |
| Average Intel Core Ultra 7 155H (62397 - 96791, n=50) | |
| Average Intel Core Ultra 5 125H (37664 - 87473, n=8) | |
| HP OmniStudio X 32-c0077ng | |
| Average AMD Ryzen 7 8845HS (61459 - 71873, n=13) | |
| Average AMD Ryzen 9 6900HX (47938 - 53345, n=20) | |
| Average Intel Core i7-11800H (24508 - 48144, n=21) | |
| AIDA64 / Memory Read | |
| Average Intel Core Ultra 7 155H (60544 - 90647, n=50) | |
| HP OmniStudio X 32-c0077ng | |
| Average Intel Core Ultra 5 125H (41700 - 76803, n=8) | |
| Average AMD Ryzen 7 8845HS (49866 - 61976, n=13) | |
| Average AMD Ryzen 9 6900HX (43892 - 53321, n=20) | |
| Average Intel Core i7-11800H (25882 - 50365, n=20) | |
| AIDA64 / Memory Write | |
| Average AMD Ryzen 7 8845HS (68425 - 93239, n=13) | |
| Average Intel Core Ultra 7 155H (58692 - 93451, n=50) | |
| HP OmniStudio X 32-c0077ng | |
| Average Intel Core Ultra 5 125H (35730 - 72443, n=8) | |
| Average AMD Ryzen 9 6900HX (51085 - 57202, n=20) | |
| Average Intel Core i7-11800H (22240 - 46214, n=20) | |
| AIDA64 / Memory Latency | |
| HP OmniStudio X 32-c0077ng | |
| Average Intel Core Ultra 5 125H (127.3 - 184.8, n=8) | |
| Average Intel Core Ultra 7 155H (116.2 - 233, n=50) | |
| Average AMD Ryzen 7 8845HS (82.5 - 117, n=13) | |
| Average AMD Ryzen 9 6900HX (80.7 - 120.6, n=20) | |
| Average Intel Core i7-11800H (71.9 - 104.1, n=44) | |
* ... smaller is better
DPC latencies
The HP OmniStudio X showed neither serious shortcomings nor outstanding values during the DPC latency test. We measured the highest value when simply surfing the web using the Edge browser. When playing 4K videos, we noted occasional dropped frames that were noticeable throughout the entire playback.


| DPC Latencies / LatencyMon - interrupt to process latency (max), Web, Youtube, Prime95 | |
| Minisforum AI X1 Pro, HX 370 | |
| Geekom AX8 Pro | |
| HP OmniStudio X 32-c0077ng | |
| Geekom GT1 Mega | |
* ... smaller is better
Storage device
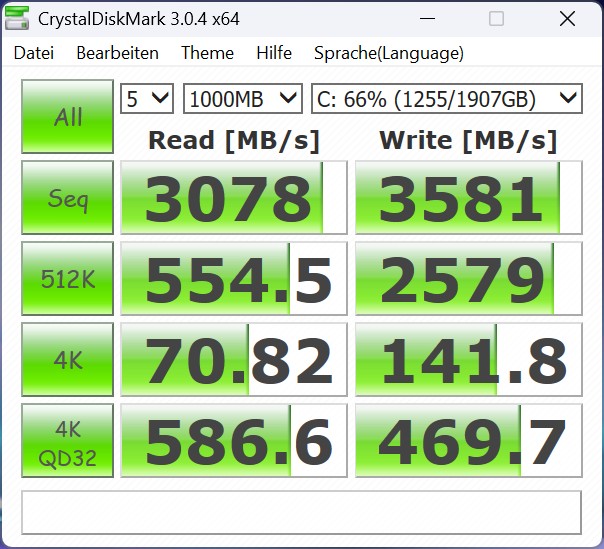
The HP OmniStudio X uses a 2-TB SSD from Western Digital. Despite its spacious case, you can only install one mass storage device, which limits its expansion options massively. The M.2 SSD's cooling is efficient, so there is no loss of performance even under continuous load.


Reading continuous performance: DiskSpd Read Loop, Queue Depth 8
Graphics card
The top configuration of the HP OmniStudio X uses the Nvidia GeForce RTX 4050 Laptop, which is clearly superior to the Intel Core Ultra 7 155H's iGPU. Due to its limited performance range, it lagged behind comparable systems during our test, but showed improved performance when it came to image editing, AI tasks and gaming. With 6 GB of VRAM, it is suitable for casual gaming, while older games can be played in 4K. Modern games usually only run with reduced details in Full HD resolution.
| 3DMark Performance rating - Percent | |
| Average of class Desktop | |
| Average NVIDIA GeForce RTX 4050 Laptop GPU | |
| HP OmniStudio X 32-c0077ng | |
| Average AMD Radeon 890M | |
| Average Intel Arc 8-Core iGPU | |
| 3DMark 05 Standard | 46696 points | |
| 3DMark 06 Standard Score | 41211 points | |
| 3DMark Vantage P Result | 70238 points | |
| 3DMark 11 Performance | 25224 points | |
| 3DMark Ice Storm Standard Score | 85052 points | |
| 3DMark Cloud Gate Standard Score | 47951 points | |
| 3DMark Fire Strike Score | 17640 points | |
| 3DMark Fire Strike Extreme Score | 8862 points | |
| 3DMark Time Spy Score | 7762 points | |
| 3DMark Steel Nomad Score | 1669 points | |
Help | ||
* ... smaller is better
| Performance rating - Percent | |
| Average of class Desktop | |
| Average NVIDIA GeForce RTX 4050 Laptop GPU | |
| HP OmniStudio X 32-c0077ng | |
| Average AMD Radeon 890M | |
| Average Intel Arc 8-Core iGPU | |
| Cyberpunk 2077 - 1920x1080 Ultra Preset (FSR off) | |
| Average of class Desktop (23.9 - 246, n=48, last 2 years) | |
| HP OmniStudio X 32-c0077ng | |
| Average NVIDIA GeForce RTX 4050 Laptop GPU (35.8 - 67.3, n=11) | |
| Average AMD Radeon 890M (15.5 - 28.4, n=35) | |
| Average Intel Arc 8-Core iGPU (13 - 24.7, n=28) | |
| Baldur's Gate 3 - 1920x1080 Ultra Preset AA:T | |
| Average of class Desktop (27.5 - 343, n=43, last 2 years) | |
| Average NVIDIA GeForce RTX 4050 Laptop GPU (48.3 - 81.3, n=11) | |
| HP OmniStudio X 32-c0077ng | |
| Average AMD Radeon 890M (16.8 - 32.7, n=33) | |
| Average Intel Arc 8-Core iGPU (14.2 - 26.2, n=26) | |
| GTA V - 1920x1080 Highest AA:4xMSAA + FX AF:16x | |
| Average of class Desktop (9.61 - 172.5, n=13, last 2 years) | |
| HP OmniStudio X 32-c0077ng | |
| Average NVIDIA GeForce RTX 4050 Laptop GPU (14.9 - 101.7, n=35) | |
| Average AMD Radeon 890M (14.9 - 33.3, n=30) | |
| Average Intel Arc 8-Core iGPU (9.59 - 20.6, n=39) | |
| Final Fantasy XV Benchmark - 1920x1080 High Quality | |
| Average of class Desktop (7.05 - 236, n=37, last 2 years) | |
| Average NVIDIA GeForce RTX 4050 Laptop GPU (15.5 - 122.3, n=39) | |
| HP OmniStudio X 32-c0077ng | |
| Average AMD Radeon 890M (17.7 - 34.8, n=32) | |
| Average Intel Arc 8-Core iGPU (14.7 - 31.7, n=46) | |
| Strange Brigade - 1920x1080 ultra AA:ultra AF:16 | |
| Average of class Desktop (12 - 616, n=17, last 2 years) | |
| Average NVIDIA GeForce RTX 4050 Laptop GPU (21.2 - 156.6, n=38) | |
| HP OmniStudio X 32-c0077ng | |
| Average AMD Radeon 890M (44.8 - 59.7, n=26) | |
| Average Intel Arc 8-Core iGPU (27.1 - 58.9, n=42) | |
| Dota 2 Reborn - 1920x1080 ultra (3/3) best looking | |
| Average of class Desktop (31.3 - 309, n=33, last 2 years) | |
| Average NVIDIA GeForce RTX 4050 Laptop GPU (73.5 - 175.6, n=39) | |
| HP OmniStudio X 32-c0077ng | |
| Average AMD Radeon 890M (32.4 - 93, n=35) | |
| Average Intel Arc 8-Core iGPU (35.2 - 80.9, n=46) | |
| X-Plane 11.11 - 1920x1080 high (fps_test=3) | |
| Average of class Desktop (19.5 - 202, n=50, last 2 years) | |
| Average NVIDIA GeForce RTX 4050 Laptop GPU (55.5 - 117, n=40) | |
| HP OmniStudio X 32-c0077ng | |
| Average AMD Radeon 890M (33.7 - 58.3, n=32) | |
| Average Intel Arc 8-Core iGPU (27.9 - 43.9, n=47) | |
| The Witcher 3 - 1920x1080 Ultra Graphics & Postprocessing (HBAO+) | |
| Average of class Desktop (7.8 - 369, n=48, last 2 years) | |
| Average NVIDIA GeForce RTX 4050 Laptop GPU (18.5 - 94.7, n=40) | |
| HP OmniStudio X 32-c0077ng | |
| Average AMD Radeon 890M (19.4 - 39.1, n=12) | |
| Average Intel Arc 8-Core iGPU (14.5 - 43.1, n=33) | |
FPS diagram - 30 minutes of Cyberpunk 2077 1920 x 1080 Ultra preset (FSR off)
| low | med. | high | ultra | QHD | 4K | |
|---|---|---|---|---|---|---|
| GTA V (2015) | 173.4 | 168.4 | 151.5 | 88.2 | 62.6 | 56.8 |
| The Witcher 3 (2015) | 328 | 239 | 144.7 | 74.5 | 52.7 | 41.7 |
| Dota 2 Reborn (2015) | 148.7 | 136.1 | 130.3 | 121.2 | 92.4 | |
| Final Fantasy XV Benchmark (2018) | 155.8 | 101.7 | 73.1 | 52.3 | 29.8 | |
| X-Plane 11.11 (2018) | 78.9 | 73.2 | 59.6 | 51 | ||
| Strange Brigade (2018) | 377 | 174.2 | 141.7 | 124.1 | 83.4 | 44.4 |
| Anno 1800 (2019) | 104.8 | 94.5 | 79 | 48.6 | 45.1 | 31 |
| Baldur's Gate 3 (2023) | 91.8 | 61.4 | 52.8 | 51.1 | 35.3 | 19.5 |
| Cyberpunk 2077 (2023) | 94.6 | 74.4 | 62.8 | 53.9 | 30.8 | 12.7 |
| Total War Pharaoh (2023) | 259.8 | 171.6 | 102.8 | 80 | 55.1 | 27.1 |
| F1 24 (2024) | 181.9 | 169.1 | 135.2 | 40.7 | 24.7 | 10.1 |
| Monster Hunter Wilds (2025) | 54.7 | 45.5 | 4 |
Emissions & energy
Noise emissions
The PC's operating noise remains subjectively discreet, even if the fans produce a low noise throughout—thankfully, its frequency makes it hardly annoying at all. In performance mode, the sound pressure level reached 37.5 dB(A) during the stress test, while it dropped to a maximum of 34 dB(A) in quiet mode, which made a significant difference. Users who don't constantly require the device's maximum performance can therefore confidently make use of quiet mode.
Noise level
| Idle |
| 32.3 / 32.4 / 32.6 dB(A) |
| Load |
| 35.9 / 37.5 dB(A) |
 | ||
30 dB silent 40 dB(A) audible 50 dB(A) loud |
||
min: | ||
| HP OmniStudio X 32-c0077ng GeForce RTX 4050 Laptop GPU, Ultra 7 155H, Western Digital PC SN5000S SDEPNSJ-2T00-1006 | Minisforum AtomMan G7 Ti GeForce RTX 4070 Laptop GPU, i9-14900HX, Kingston OM8PGP41024Q-A0 | Minisforum G7 PT Radeon RX 7600M XT, R9 7945HX, Kingston OM8PGP41024Q-A0 | Acemagic M2A GeForce RTX 3080 Laptop GPU, i9-12900H, Rayson RS1D0TSSD710 1024 GB PCIe 4.0 NVMe | |
|---|---|---|---|---|
| Noise | -17% | -4% | -11% | |
| off / environment * (dB) | 24 | 24.7 -3% | 24.4 -2% | 24.3 -1% |
| Idle Minimum * (dB) | 32.3 | 34 -5% | 29.3 9% | 32.7 -1% |
| Idle Average * (dB) | 32.4 | 34.1 -5% | 29.4 9% | 32.8 -1% |
| Idle Maximum * (dB) | 32.6 | 34.1 -5% | 29.4 10% | 33.1 -2% |
| Load Average * (dB) | 35.9 | 48.6 -35% | 43.5 -21% | 40.7 -13% |
| Cyberpunk 2077 ultra * (dB) | 40.8 | 55.2 -35% | 45.5 -12% | 45.8 -12% |
| Load Maximum * (dB) | 37.5 | 48.3 -29% | 45 -20% | 53.9 -44% |
| Witcher 3 ultra * (dB) | 49.3 |
* ... smaller is better
Temperature
The PC's cooling kept its components within the TDP limits during our test, but Turbo mode only ran for a short time. The SoC reached over 100 °C, but remained below the 110 °C limit, while it leveled off at 80 °C under continuous load. The Nvidia GeForce RTX 4050 also reached high temperatures, but is configured relatively frugally at 50 watts.


Speakers
The integrated speakers are from Bang & Olufsen and deliver a powerful sound, but it starts to get distorted at around 70 percent volume. They are well-suited for video conferencing and music playback. While the highs and mids are slightly more dominant than the lows, the sound can be adjusted via sound profiles. Bass is present and gives the sound a pleasant fullness at low to medium volumes.
HP OmniStudio X 32-c0077ng audio analysis
(+) | speakers can play relatively loud (89.4 dB)
Bass 100 - 315 Hz
(+) | good bass - only 3% away from median
(±) | linearity of bass is average (9.5% delta to prev. frequency)
Mids 400 - 2000 Hz
(+) | balanced mids - only 3.8% away from median
(+) | mids are linear (5% delta to prev. frequency)
Highs 2 - 16 kHz
(+) | balanced highs - only 2.9% away from median
(+) | highs are linear (5% delta to prev. frequency)
Overall 100 - 16.000 Hz
(+) | overall sound is linear (7.2% difference to median)
Compared to same class
» 11% of all tested devices in this class were better, 11% similar, 78% worse
» The best had a delta of 6%, average was 16%, worst was 46%
Compared to all devices tested
» 1% of all tested devices were better, 0% similar, 99% worse
» The best had a delta of 4%, average was 23%, worst was 134%
Apple MacBook Pro 16 2021 M1 Pro audio analysis
(+) | speakers can play relatively loud (84.7 dB)
Bass 100 - 315 Hz
(+) | good bass - only 3.8% away from median
(+) | bass is linear (5.2% delta to prev. frequency)
Mids 400 - 2000 Hz
(+) | balanced mids - only 1.3% away from median
(+) | mids are linear (2.1% delta to prev. frequency)
Highs 2 - 16 kHz
(+) | balanced highs - only 1.9% away from median
(+) | highs are linear (2.7% delta to prev. frequency)
Overall 100 - 16.000 Hz
(+) | overall sound is linear (4.6% difference to median)
Compared to same class
» 0% of all tested devices in this class were better, 0% similar, 100% worse
» The best had a delta of 5%, average was 17%, worst was 45%
Compared to all devices tested
» 0% of all tested devices were better, 0% similar, 100% worse
» The best had a delta of 4%, average was 23%, worst was 134%
Power consumption
The internal power supply delivers up to 280 watts. According to HP, it is an 80 Plus Platinum-certified power supply unit. We only measured 24 watts in idle mode and at the lowest display brightness, although we noted 66 watts at full brightness. Under average load, its energy requirement rose to just under 121 watts, with peaks of up to 195.2 watts being reached at times.
| Off / Standby | |
| Idle | |
| Load |
|
Key:
min: | |
Notebookcheck total rating
The HP OmniStudio X is a powerful all-in-one system for creative tasks. With its Intel Core Ultra 7 155H and Nvidia GeForce RTX 4050 Laptop, it offers solid performance for image editing, AI applications and casual gaming. The PC's 4K display is impressive and its cooling works efficiently. The GPU's performance limit and the device's mass storage not having any expansion options are both negative points.
Transparency
The selection of devices to be reviewed is made by our editorial team. The test sample was provided to the author as a loan by the manufacturer or retailer for the purpose of this review. The lender had no influence on this review, nor did the manufacturer receive a copy of this review before publication. There was no obligation to publish this review. As an independent media company, Notebookcheck is not subjected to the authority of manufacturers, retailers or publishers.
This is how Notebookcheck is testing
Every year, Notebookcheck independently reviews hundreds of laptops and smartphones using standardized procedures to ensure that all results are comparable. We have continuously developed our test methods for around 20 years and set industry standards in the process. In our test labs, high-quality measuring equipment is utilized by experienced technicians and editors. These tests involve a multi-stage validation process. Our complex rating system is based on hundreds of well-founded measurements and benchmarks, which maintains objectivity. Further information on our test methods can be found here.

