Notebookcheck Logo

Cyberpunk 2077 Phantom Liberty tech review: Laptop and desktop benchmarks

New contents, old bugs. In the past few years, hardly any game has been as highly anticipated as Cyberpunk 2077. Unfortunately, the RPG wasn't in a particularly good state technically at launch. Read our analysis to find out whether things have improved with the release of this DLC.
Cyberpunk 2077 Phantom Liberty

Notebooks used in this review

XMG Neo 17 E23 (RTX 4090)
Schenker Key 17 Pro E23 (RTX 4080)
XMG Pro 15 E23 (RTX 4070 & RTX 4060)
XMG Focus 15 E23 (RTX 4050)
Asus ROG Strix Scar 17 (RTX 3080 Ti)
Acer Predator Helios 300 (RTX 3070 Ti)
Asus ROG Zephyrus G14 (RX 6800S & 680M)
 

Right now, our gaming benchmarks are performed using these laptops. Click on the images to visit the respective product page. All other test systems (tower PCs, mini-PCs, etc.) are listed at the end of this article.

Technical aspects

After conducting an in-depth analysis of the release version in 2020 and checking out version 1.5 in 2022 to see what has changed, we are now going to put Cyberpunk 2077 through its paces for the third time. With the release of patch 2.0 alongside the Phantom Liberty story expansion, it would be especially interesting to examine how the game’s performance has improved since its launch roughly three years ago.

Cyberpunk 2077 Phantom Liberty

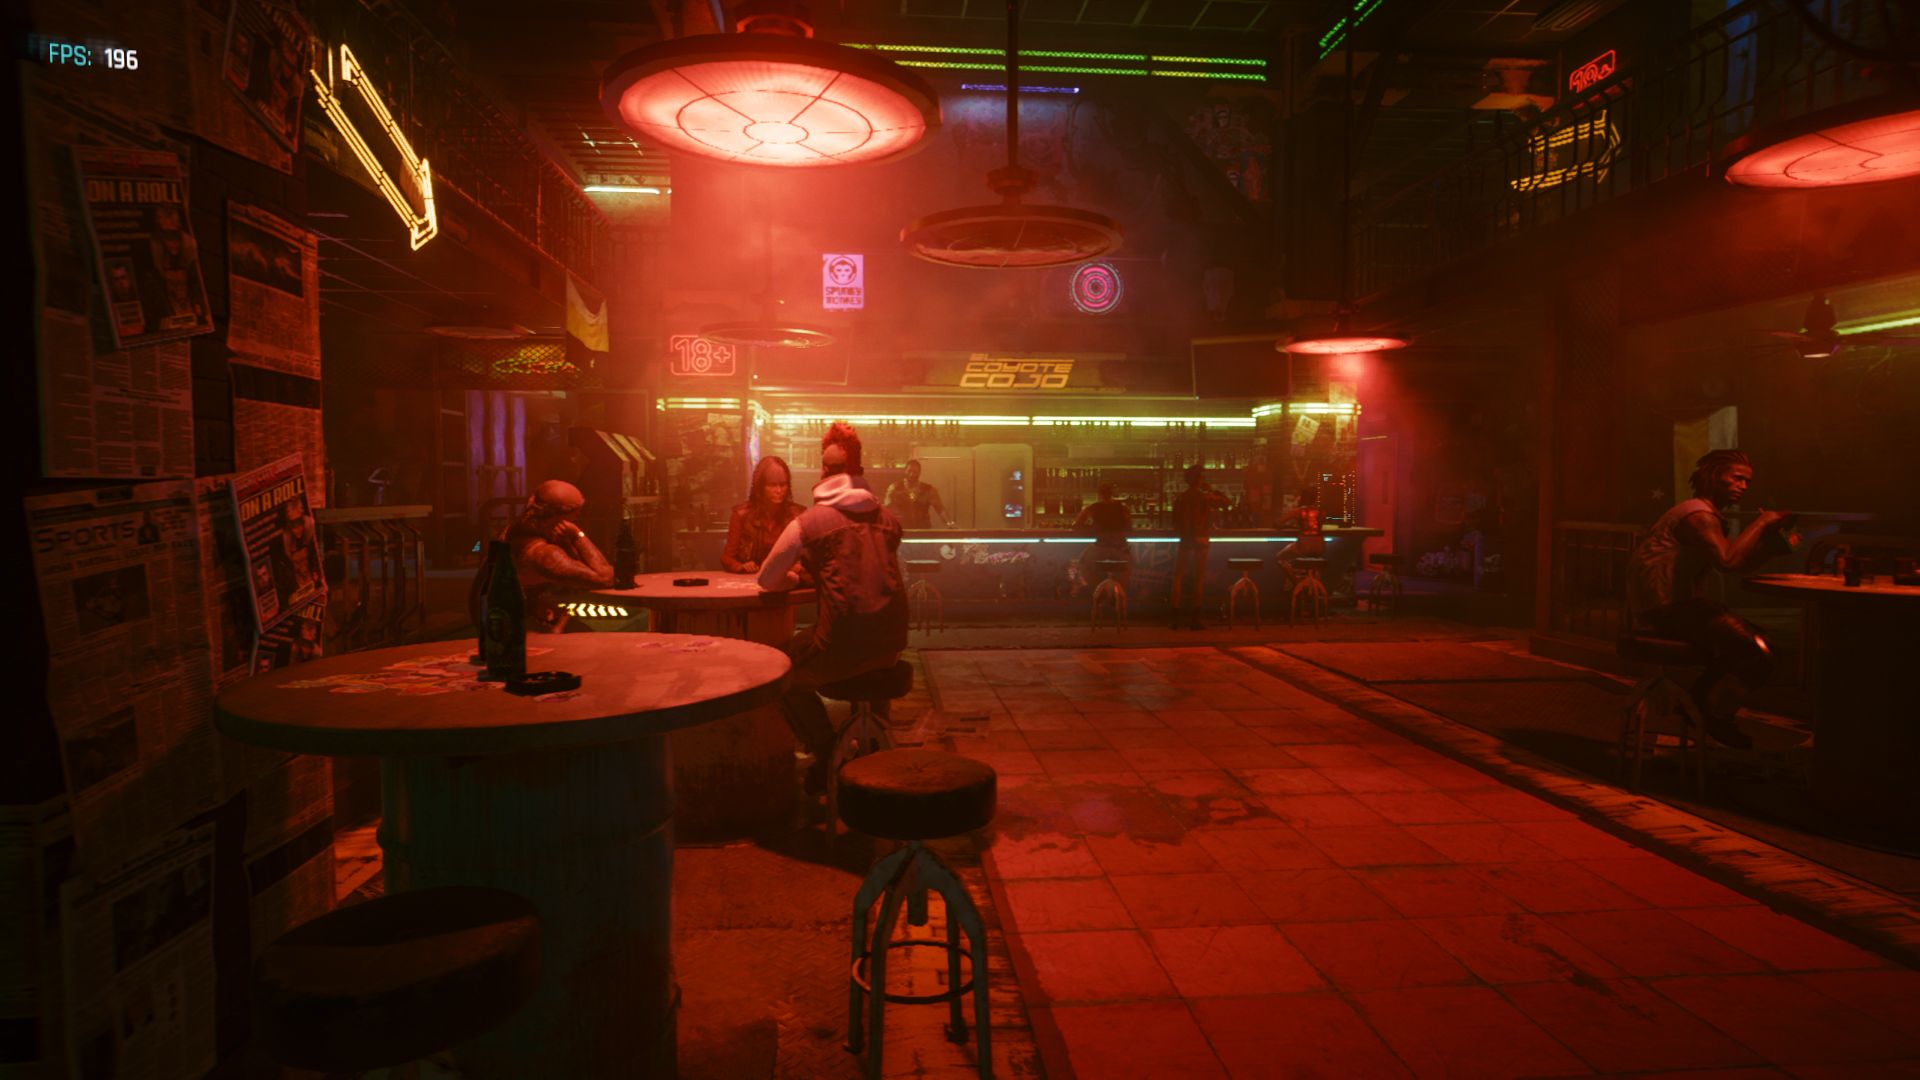
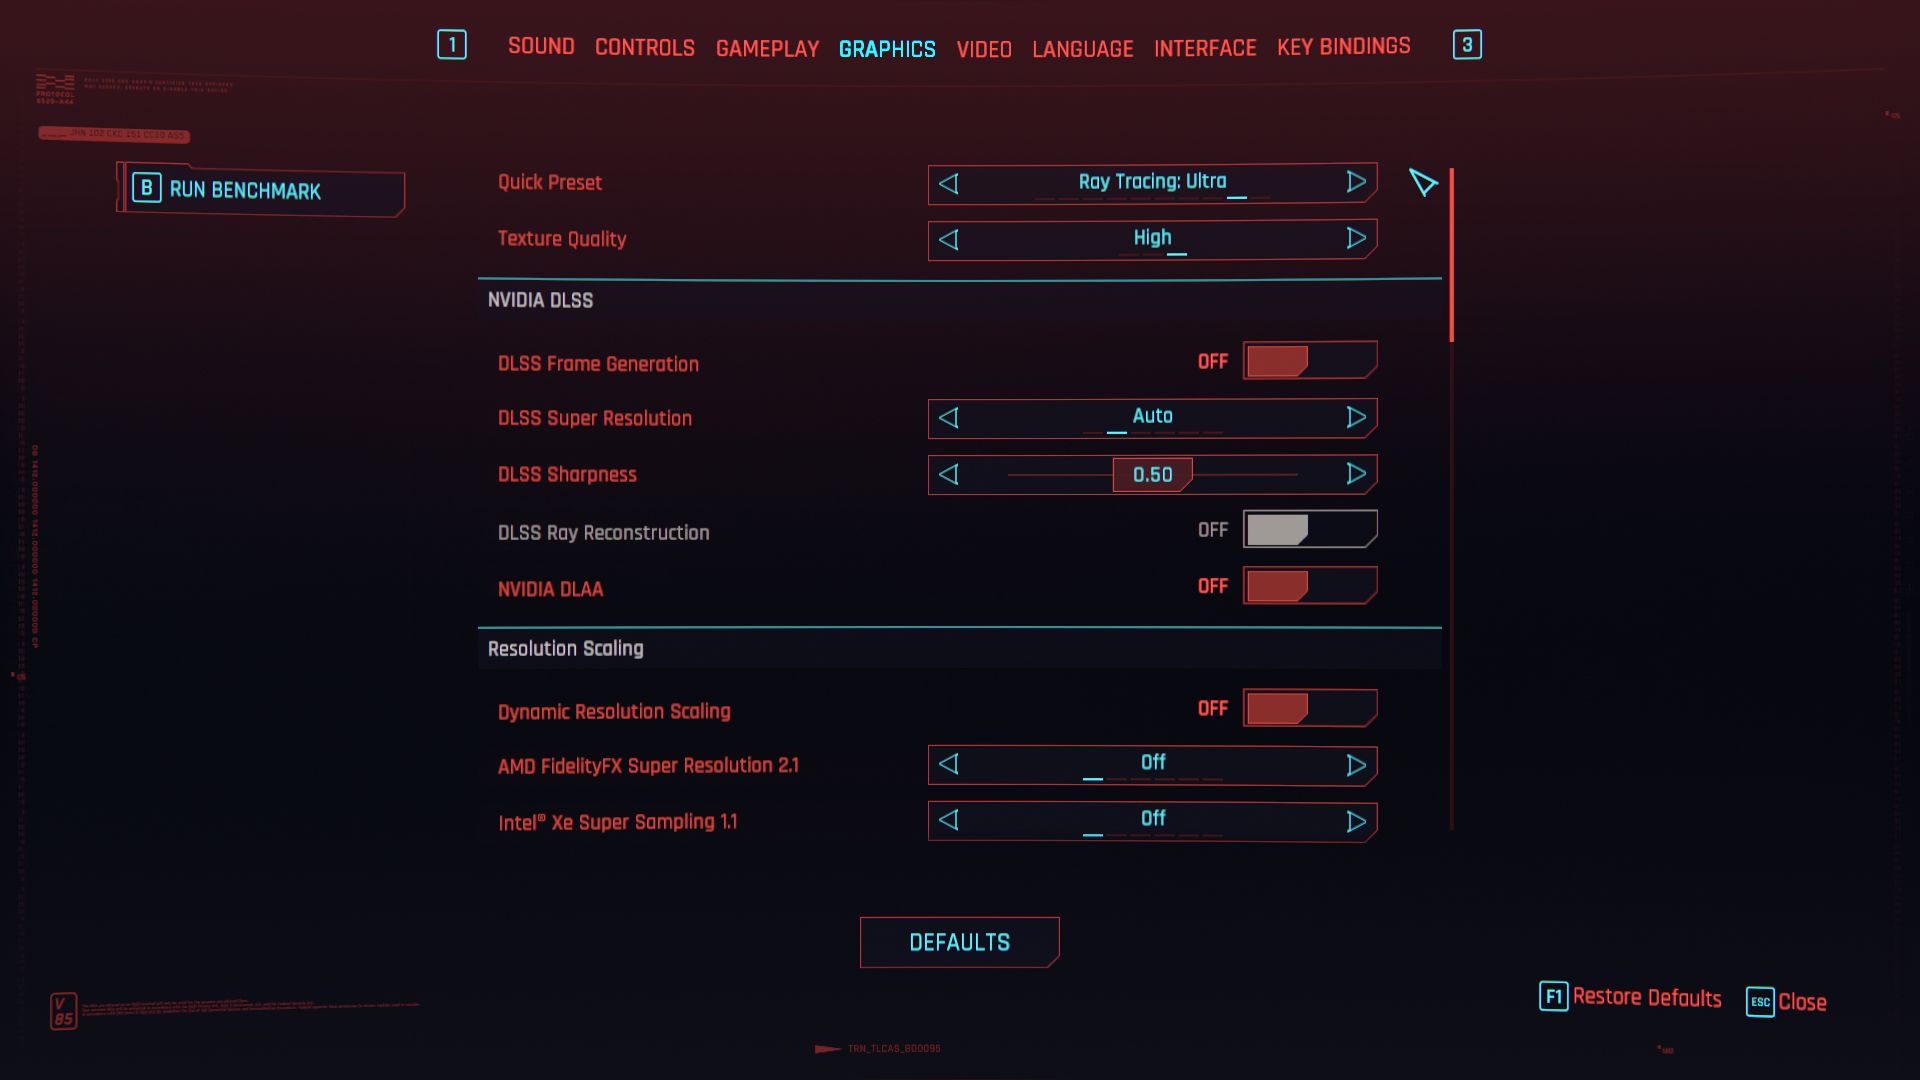
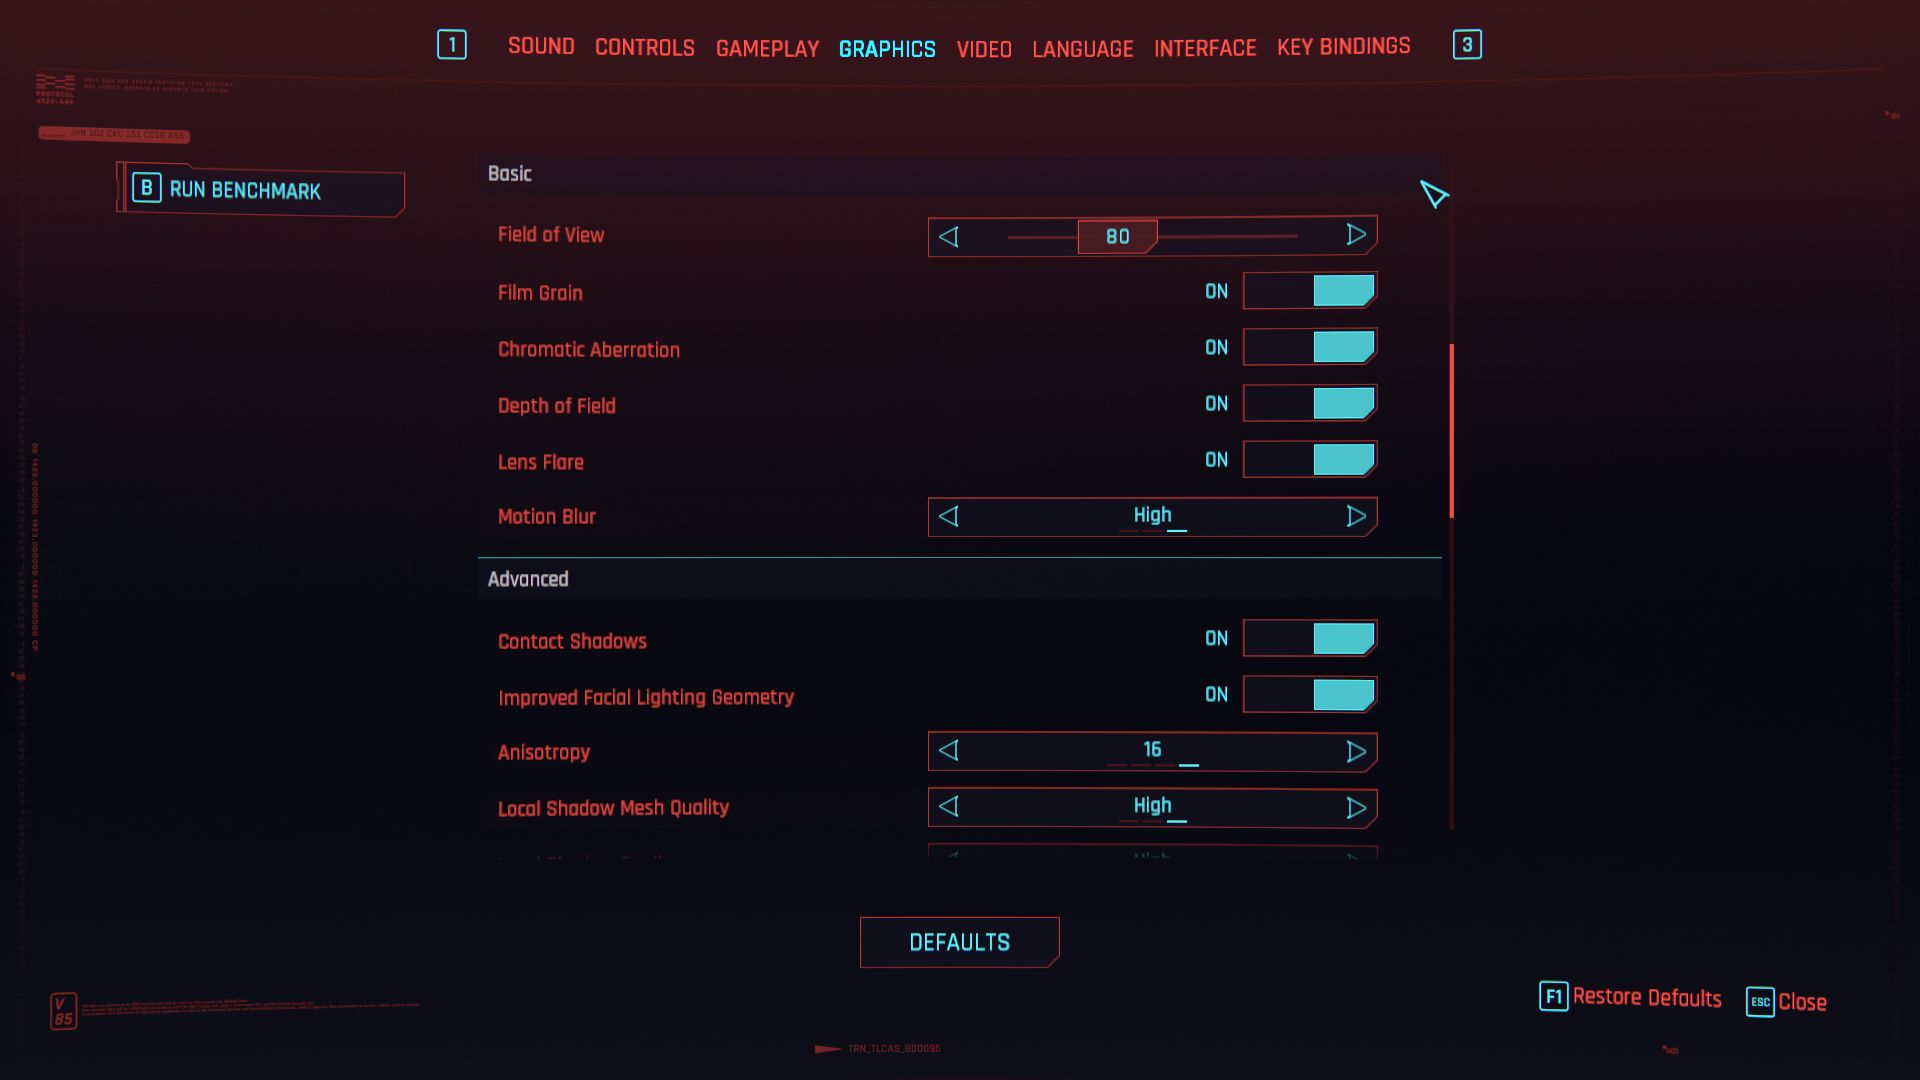
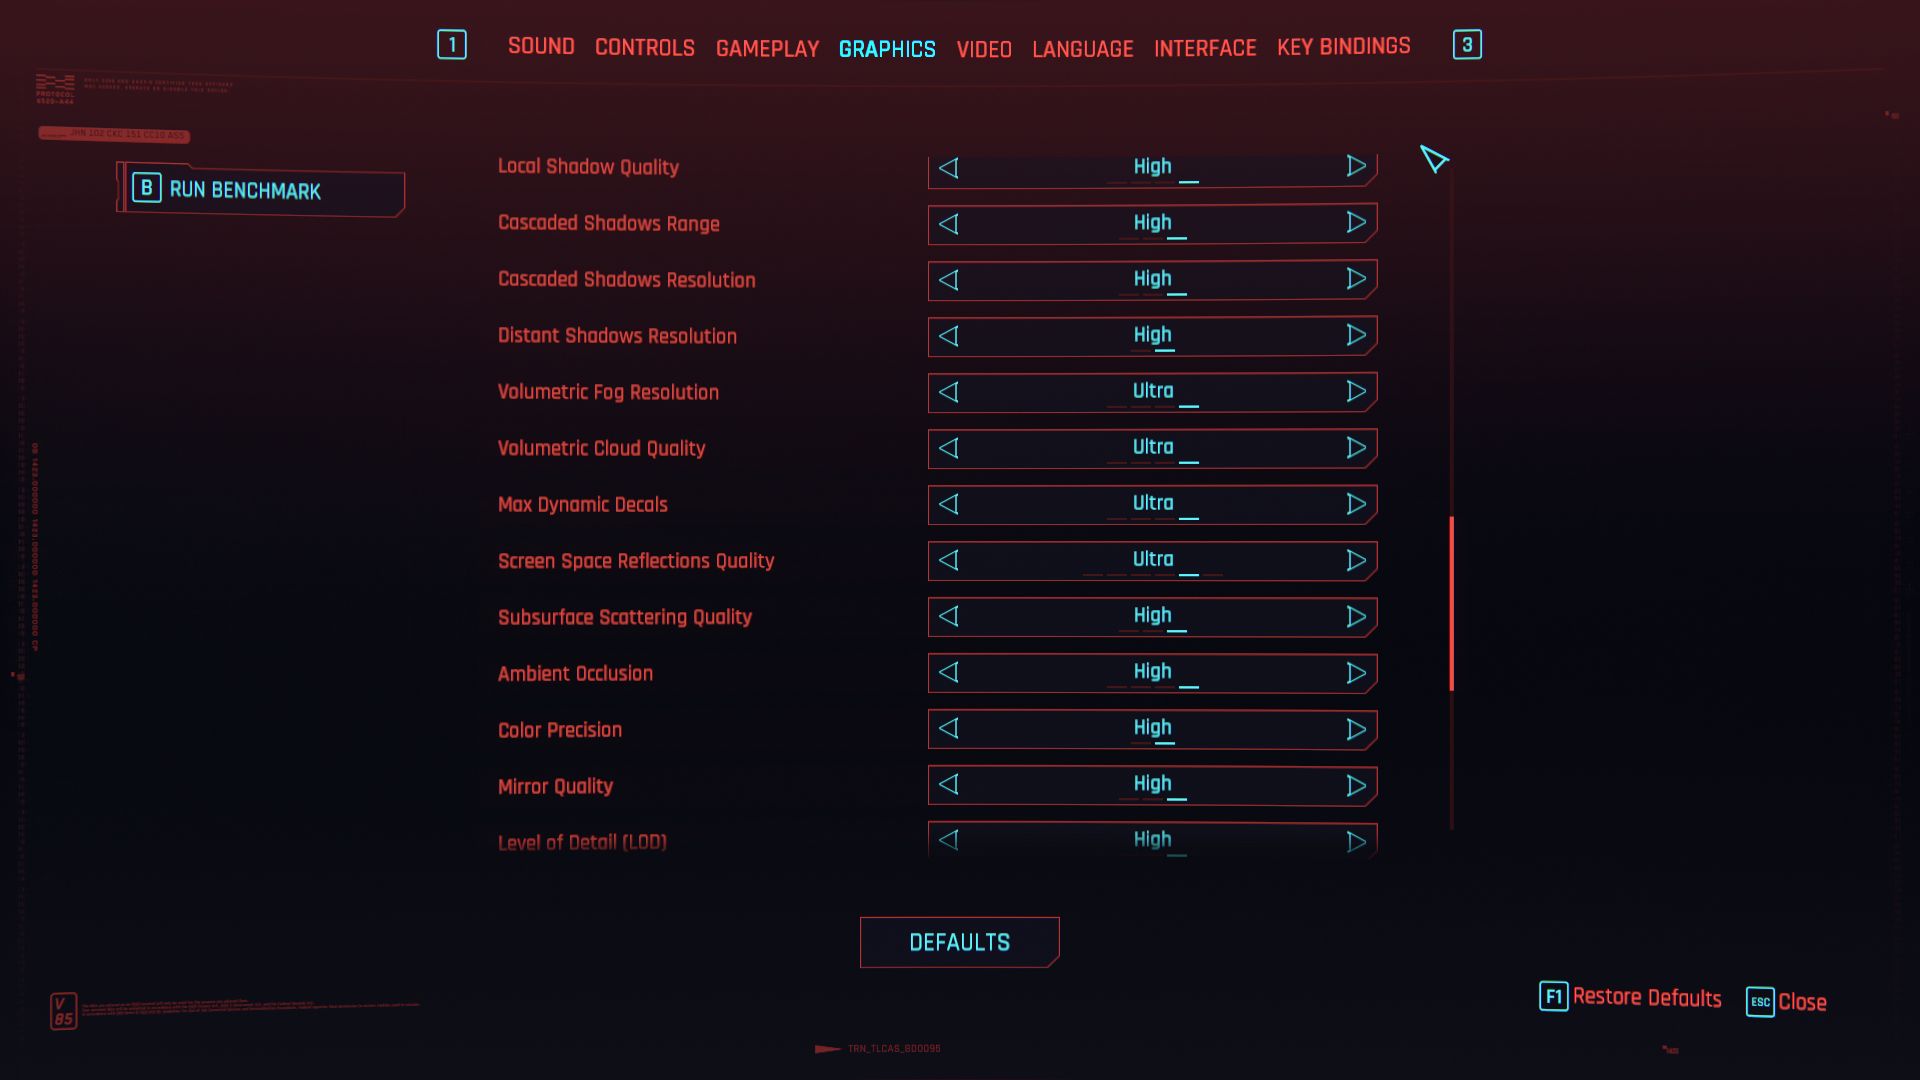
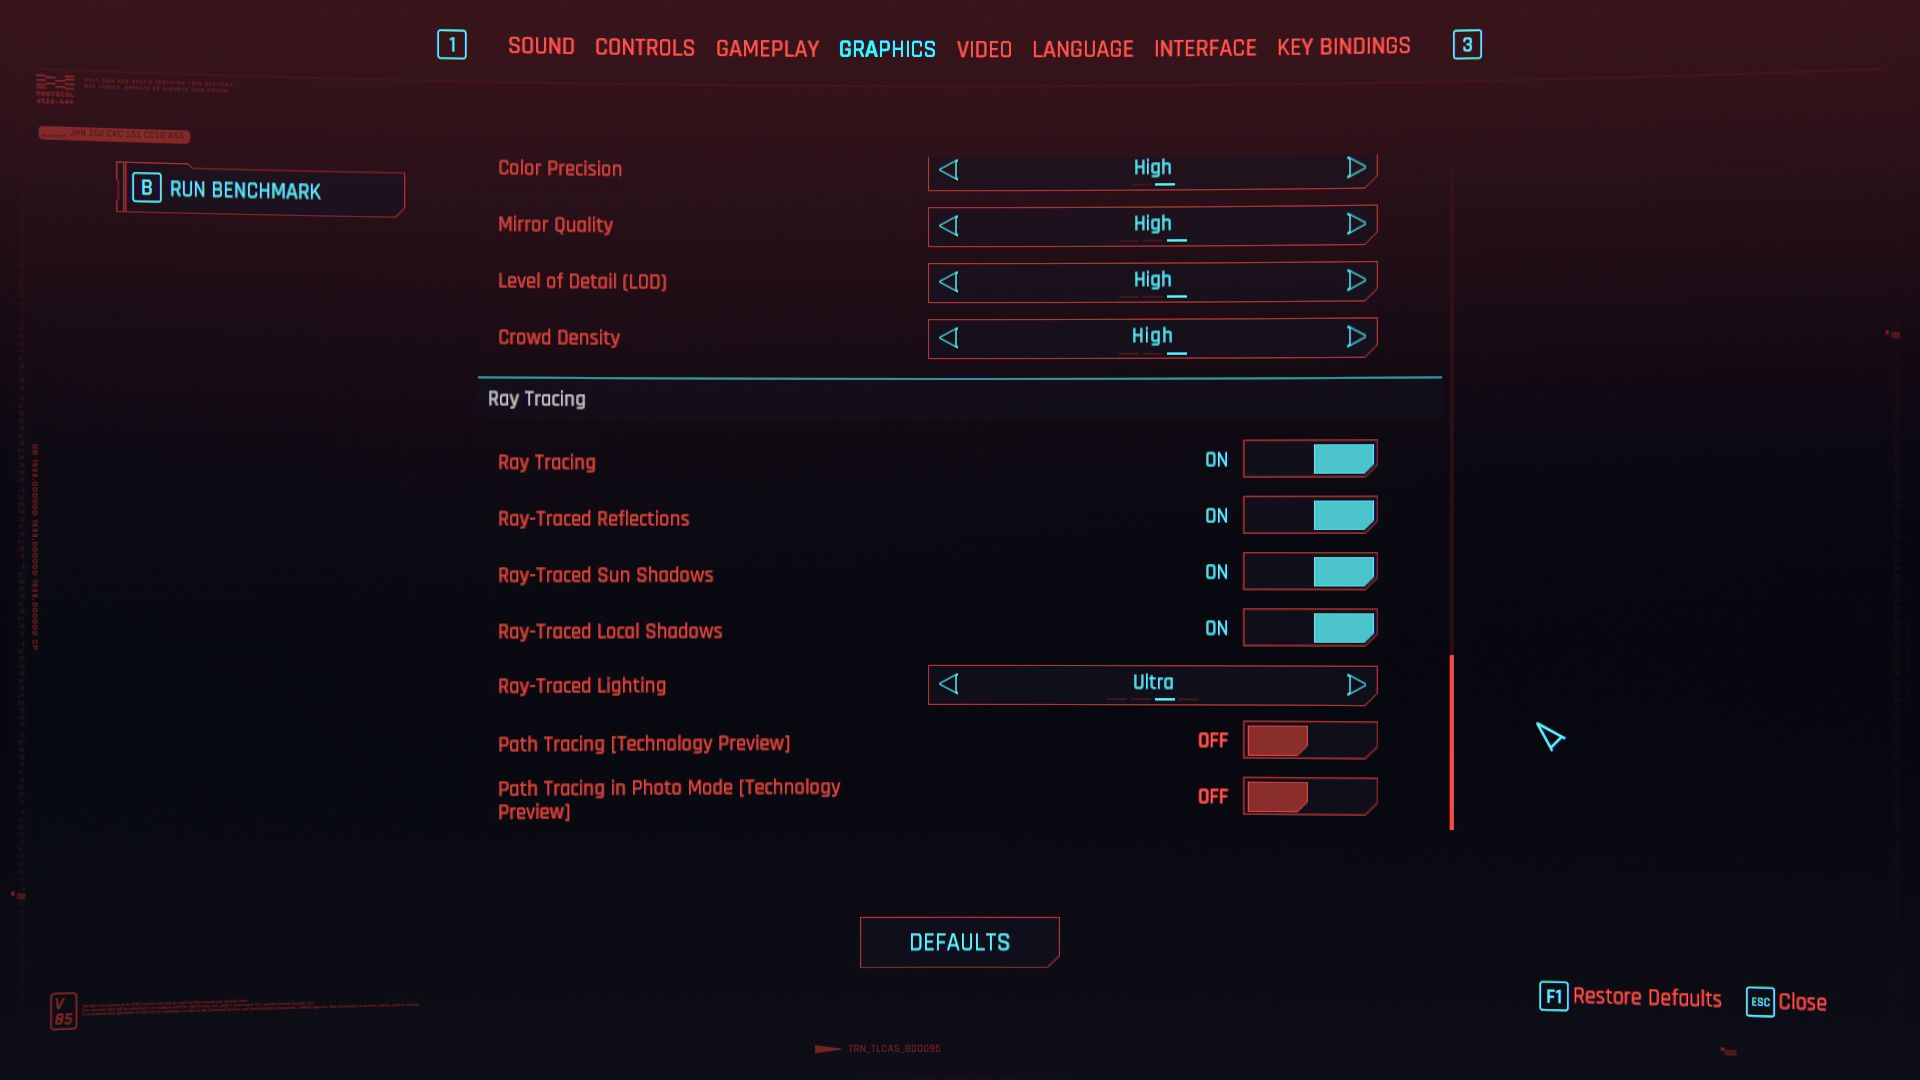
The current version of Cyberpunk 2077 cuts a good figure at first glance. Even though the graphics menu offers so many options that you need to do a whole lot of scrolling, the game also contains all the features you would expect to see in a modern game. The developers at CD Projekt have paid particular attention to upscaling. Besides Intel’s XeSS and AMD’s FSR, the role-playing game also supports DLSS, including Frame Generation. 

This brings us straight to the first problem. Similar to what we saw in version 1.5, changes to settings (especially FSR and DLSS) are sometimes applied incorrectly (for instance, you can observe this in the results after running the integrated benchmark). Restarting the game usually resolves the issue when this happens, but it is still rather annoying because of the non-skippable intro videos.

Cyberpunk 2077 Phantom Liberty

Another thing we find irritating is the fact that using the “normal” presets automatically enables FSR. In the past, such a setting is typically a sign that the developers are trying to cover up a poorly programmed or optimised engine. We’ll check out whether this is true of Cyberpunk 2077 in a moment. In any case, FSR was always disabled during our benchmark runs. However, doing so changes the presets to “Custom”. We likewise modified the ray tracing presets. DLSS was disabled for testing at Full HD, but we enabled DLSS Quality plus Frame Generation for our 4K tests.

Cyberpunk 2077 Phantom Liberty

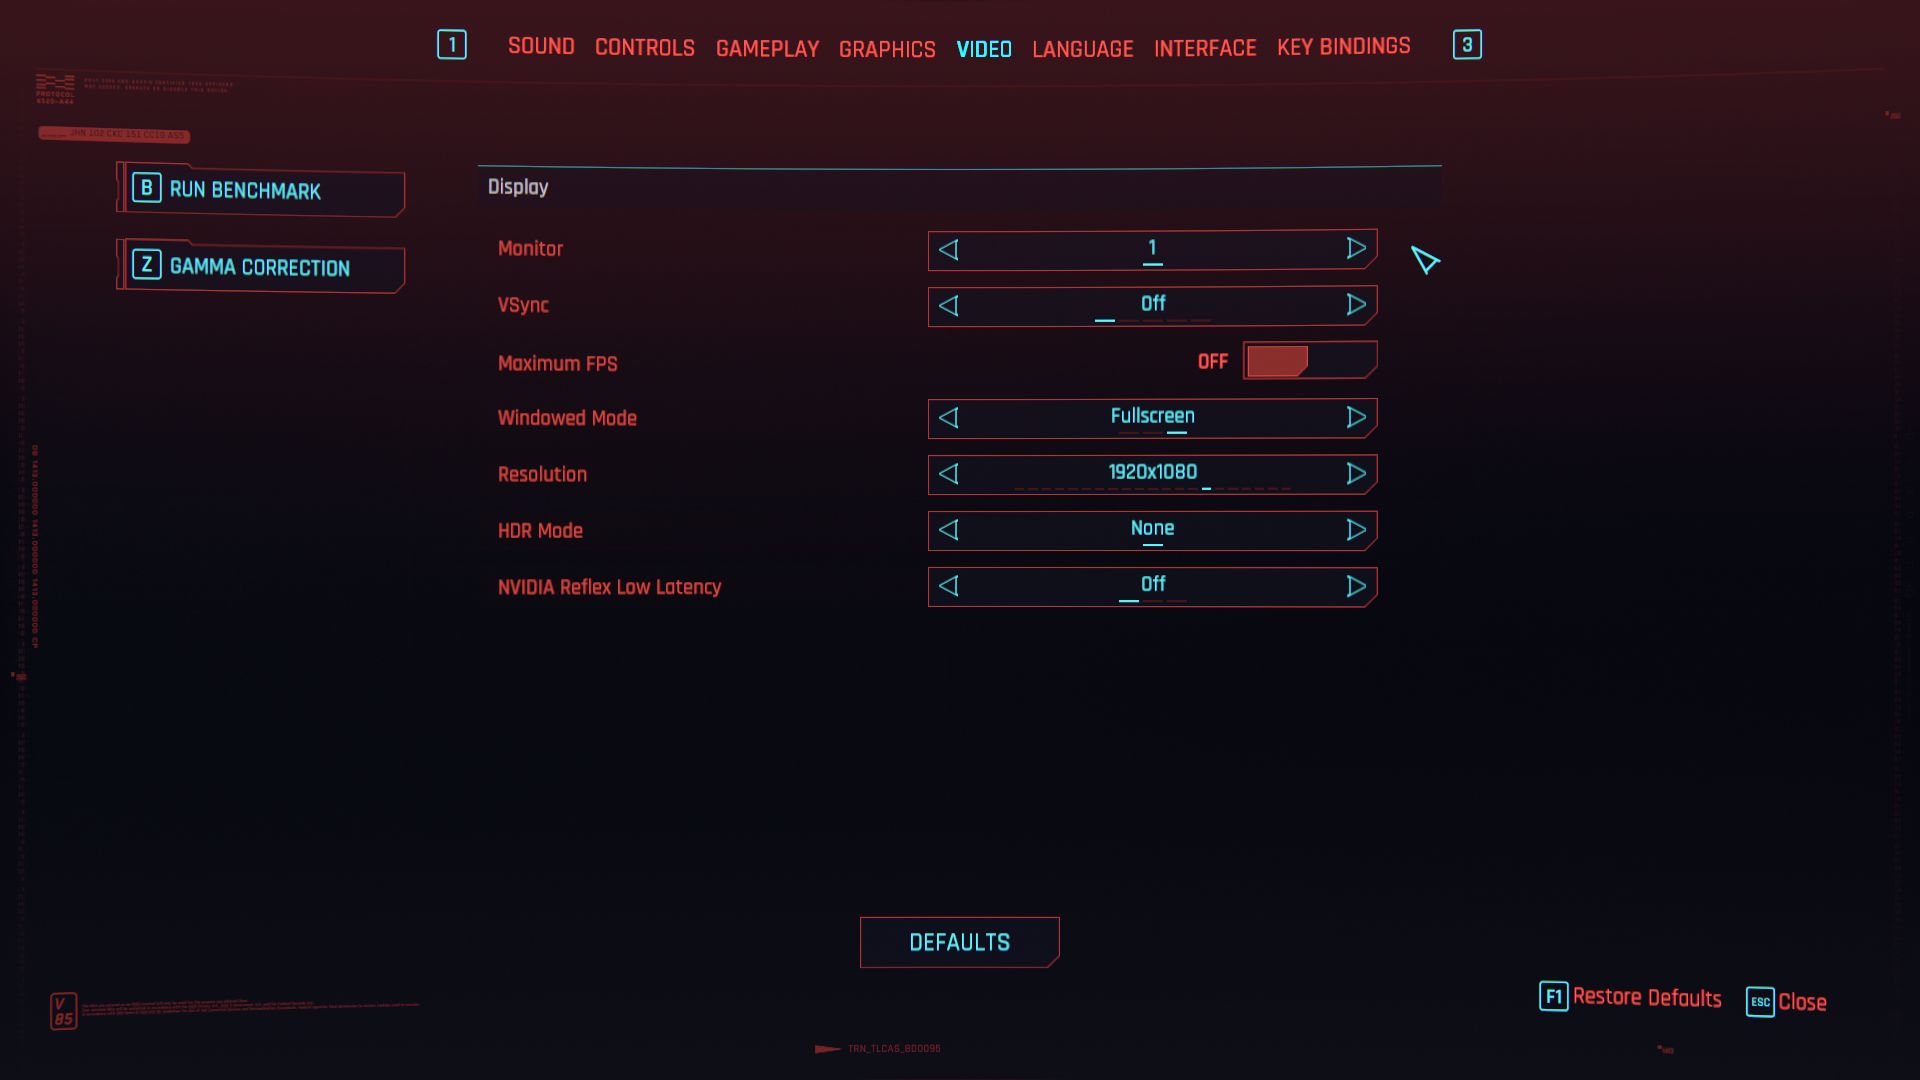
Cyberpunk 2077 Phantom Liberty is sadly not very polished in other aspects as well. For example, once you launch the game, it sometimes takes what feels like an eternity to access the main menu after the “Press to Continue” screen. Furthermore, we occasionally encountered the following problem: after booting up, the game would at times modify settings without being asked to do so. On our main test rig, version 2.0 of Phantom Liberty also downright refused to start and crashed during launch. The game only started running properly after being updated to version 2.1. With DLC included, Cyberpunk 2077 takes up around 77 GB of disk space, which is perfectly acceptable for a game of this scale.

Benchmark

Cyberpunk 2077 once again deserves huge kudos for its integrated benchmark tool. Though the game only shows the FPS count during the roughly one-minute camera roam without providing any performance graphs (as seen in many Ubisoft games), it does give you a fairly comprehensive analysis at the end, with details including minimum and maximum FPS, system information and the settings used (see video). 

All in all, it is safe to say that Cyberpunk 2077 isn’t particularly demanding when you use the normal presets. The game only starts becoming very difficult to run when ray tracing is enabled, especially at higher resolutions. This is true as long as you don’t use any upscaling. The combination we tested (DLSS Quality plus Frame Generation) offers a surprisingly great performance and very compelling visuals at 4K.

Results


FHD (1,920 x 1,080)

If your system is only equipped with an iGPU, you should probably stay away from Cyberpunk 2077. Even the relatively powerful Radeon 680M is able to churn out more than 40 FPS only at 720p and the lowest settings. On the other hand, mid-range cards, such as the GeForce RTX 4050Radeon RX 6800S or similar, have no problem handling the game at Full HD and can deliver upwards of 60 FPS even with settings cranked up to Ultra.

Cyberpunk 2077 2.0 Phantom Liberty
    1920x1080 Low Preset (FSR off)     1920x1080 Medium Preset (FSR off)     1920x1080 High Preset (FSR off)     1920x1080 Ultra Preset (FSR off)
NVIDIA GeForce RTX 4080, i9-13900K
Desktop-PC Asus ROG Strix Z790-F
217 (92min) fps ∼100%
202 (97min) fps ∼100%
187 (78min) fps ∼100%
AMD Radeon RX 7900 XT, i9-13900K
Desktop-PC Asus ROG Strix Z790-F
190 (65min) fps ∼88%
186 (92min) fps ∼92%
168 (79min) fps ∼90%
NVIDIA GeForce RTX 4090 Laptop GPU, i9-13900HX
XMG Neo 17 E23
140 (23min) fps ∼65%
127 (22min) fps ∼63%
119 (22min) fps ∼64%
NVIDIA GeForce RTX 4080 Laptop GPU, i9-13900HX
Schenker Key 17 Pro E23
131 (24min) fps ∼60%
121 (54min) fps ∼60%
113 (24min) fps ∼60%
NVIDIA GeForce RTX 3080 Ti Laptop GPU, i9-12900H
Asus ROG Strix Scar 17 G733ZX
126 (34min) fps ∼58%
107 (26min) fps ∼53%
96.6 (44min) fps ∼52%
NVIDIA GeForce RTX 4070 Laptop GPU, i9-13900HX
XMG Pro 15 E23
120 (44min) fps ∼55%
102 (52min) fps ∼50%
89.5 (53min) fps ∼48%
NVIDIA GeForce RTX 3070 Ti Laptop GPU, i7-12700H
Acer Predator Helios 300 PH315-55
99 (8min) fps ∼46%
90.7 (40min) fps ∼45%
81.9 (22min) fps ∼44%
NVIDIA GeForce RTX 4060 Laptop GPU, i9-13900HX
XMG Pro 15 E23
102 (48min) fps ∼47%
88.9 (51min) fps ∼44%
80.5 (49min) fps ∼43%
NVIDIA GeForce RTX 4050 Laptop GPU, i9-13900HX
XMG Focus 15 E23
88.6 (51min) fps ∼41%
75 (48min) fps ∼37%
67.3 (47min) fps ∼36%
AMD Radeon RX 6800S, R9 6900HS
Asus ROG Zephyrus G14
114 (73min) fps ∼100%
86.4 (39min) fps ∼40%
71.6 (55min) fps ∼35%
65.9 (51min) fps ∼35%
AMD Radeon 780M, R9 7940HS
Minisforum Venus Series UM790 Pro
44.6 (32.1min) fps ∼39%
35.6 (26.9min) fps ∼16%
28.2 (21.2min) fps ∼14%
26.3 (20.3min) fps ∼14%
AMD Radeon 680M, R9 6900HS
Asus ROG Zephyrus G14
35.7 (16min) fps ∼31%
27.3 (12min) fps ∼13%
21.8 (14min) fps ∼11%
20 (13min) fps ∼11%

QHD (2,560 x 1,440)

The game’s graphics requirements are likewise quite reasonable at QHD. Whilst the aforementioned mid-tier cards can deliver roughly 40 FPS with a combination of 1440p and max settings, GPUs that fall somewhere between the mid-range and high-end segments (e.g. the GeForce RTX 4070 and RTX 3070 Ti) come close to hitting the 60 FPS mark.

Cyberpunk 2077 2.0 Phantom Liberty
    2560x1440 Ultra Preset (FSR off)
NVIDIA GeForce RTX 4080, i9-13900K
Desktop-PC Asus ROG Strix Z790-F
125 (97min) fps ∼100%
AMD Radeon RX 7900 XT, i9-13900K
Desktop-PC Asus ROG Strix Z790-F
124 (78min) fps ∼99%
NVIDIA GeForce RTX 4090 Laptop GPU, i9-13900HX
XMG Neo 17 E23
98.1 (22min) fps ∼78%
NVIDIA GeForce RTX 4080 Laptop GPU, i9-13900HX
Schenker Key 17 Pro E23
86.3 (25min) fps ∼69%
NVIDIA GeForce RTX 3080 Ti Laptop GPU, i9-12900H
Asus ROG Strix Scar 17 G733ZX
62.8 (32min) fps ∼50%
NVIDIA GeForce RTX 4070 Laptop GPU, i9-13900HX
XMG Pro 15 E23
55.4 (43min) fps ∼44%
NVIDIA GeForce RTX 3070 Ti Laptop GPU, i7-12700H
Acer Predator Helios 300 PH315-55
54 (33min) fps ∼43%
NVIDIA GeForce RTX 4060 Laptop GPU, i9-13900HX
XMG Pro 15 E23
51.8 (32min) fps ∼41%
NVIDIA GeForce RTX 4050 Laptop GPU, i9-13900HX
XMG Focus 15 E23
40.6 (34min) fps ∼32%
AMD Radeon 780M, R9 7940HS
Minisforum Venus Series UM790 Pro
16.3 (10.6min) fps ∼13%

UHD (3,840 x 2,160)

The going gets really tough at 4K if you want to enjoy Cyberpunk in all its graphical glory. Without using upscaling, none of the current laptop GPUs can deliver 60 FPS or more at 4K and Ultra preset. That said, the game is definitely playable at the roughly 40 FPS and 50 FPS provided by the RTX 4080 and RTX 4090 respectively. A truly powerful desktop graphics card, such as the Radeon RX 7900 XT, is necessary if you with to achieve 60 FPS at these settings. 

Cyberpunk 2077 2.0 Phantom Liberty
    3840x2160 Ultra Preset (FSR off)
NVIDIA GeForce RTX 4080, i9-13900K
Desktop-PC Asus ROG Strix Z790-F
61.7 (51min) fps ∼100%
AMD Radeon RX 7900 XT, i9-13900K
Desktop-PC Asus ROG Strix Z790-F
59.8 (18min) fps ∼97%
NVIDIA GeForce RTX 4090 Laptop GPU, i9-13900HX
XMG Neo 17 E23
48.6 (40min) fps ∼79%
NVIDIA GeForce RTX 4080 Laptop GPU, i9-13900HX
Schenker Key 17 Pro E23
39.8 (31min) fps ∼65%
NVIDIA GeForce RTX 3080 Ti Laptop GPU, i9-12900H
Asus ROG Strix Scar 17 G733ZX
30.6 (25min) fps ∼50%
NVIDIA GeForce RTX 3070 Ti Laptop GPU, i7-12700H
Acer Predator Helios 300 PH315-55
26.3 (21min) fps ∼43%
NVIDIA GeForce RTX 4070 Laptop GPU, i9-13900HX
XMG Pro 15 E23
24 (19min) fps ∼39%
NVIDIA GeForce RTX 4060 Laptop GPU, i9-13900HX
XMG Pro 15 E23
23.4 (19min) fps ∼38%
NVIDIA GeForce RTX 4050 Laptop GPU, i9-13900HX
XMG Focus 15 E23
17.5 (13min) fps ∼28%
AMD Radeon 780M, R9 7940HS
Minisforum Venus Series UM790 Pro
7.16 (5.32min) fps ∼12%

Ray tracing

Many gamers would probably very interested in finding out how Cyberpunk performs with ray tracing enabled (we used the Ultra ray tracing preset for our testing here). Here's a quick rundown: It is possible to hit above 40 FPS at Full HD using a GeForce RTX 3080 Ti, RTX 4070 or better. By contrast, an RTX 4080 is capable of breaking the 60 FPS mark. For 4K, you’ll absolutely need to make use of upscaling. With DLSS Quality and Frame Generation enabled, an RTX 4080 or higher is again necessary to help you stay on the safe side. At least in the case of more powerful GPUs, performance is similar to what you might see at Full HD without DLSS, which is already very incredible.

Cyberpunk 2077 2.0 Phantom Liberty
    1920x1080 Ray Tracing Ultra Preset (DLSS off)     3840x2160 Ray Tracing Ultra Preset + DLSS Quality + FG
NVIDIA GeForce RTX 4080, i9-13900K
Desktop-PC Asus ROG Strix Z790-F
97.3 (60min) fps ∼100%
81.6 (70min) fps ∼100%
NVIDIA GeForce RTX 4090 Laptop GPU, i9-13900HX
XMG Neo 17 E23
70.2 (32min) fps ∼72%
63.8 (54min) fps ∼78%
NVIDIA GeForce RTX 4080 Laptop GPU, i9-13900HX
Schenker Key 17 Pro E23
62.1 (47min) fps ∼64%
53.7 (45min) fps ∼66%
AMD Radeon RX 7900 XT, i9-13900K
Desktop-PC Asus ROG Strix Z790-F
56.5 (44min) fps ∼58%
NVIDIA GeForce RTX 3080 Ti Laptop GPU, i9-12900H
Asus ROG Strix Scar 17 G733ZX
44.4 (31min) fps ∼46%
NVIDIA GeForce RTX 4070 Laptop GPU, i9-13900HX
XMG Pro 15 E23
41.2 (30min) fps ∼42%
29.6 (22min) fps ∼36%
NVIDIA GeForce RTX 3070 Ti Laptop GPU, i7-12700H
Acer Predator Helios 300 PH315-55
36.7 (25min) fps ∼38%
NVIDIA GeForce RTX 4060 Laptop GPU, i9-13900HX
XMG Pro 15 E23
35.8 (26min) fps ∼37%
25.2 (18min) fps ∼31%
NVIDIA GeForce RTX 4050 Laptop GPU, i9-13900HX
XMG Focus 15 E23
27.2 (10min) fps ∼28%
8.3 (4min) fps ∼10%

Note

Because gaming tests are very time-consuming and are often constrained by installation or activation limits, we are only able to provide you with part of the benchmark results at the time of publishing this article. We will be adding more graphics cards over the coming days and weeks.

Overview

Show Restrictions
PosModel< PrevNext >Cyberpunk 2077 2.0 Phantom Liberty
 Cyberpunk 2077 2.0 Phantom Liberty (2023)
low
1920x1080
Low Preset (FSR off)
med.
1920x1080
Medium Preset (FSR off)
high
1920x1080
High Preset (FSR off)
ultra
1920x1080
Ultra Preset (FSR off)
QHD
2560x1440
Ultra Preset (FSR off)
4K
3840x2160
Ultra Preset (FSR off)

3840x2160
Ray Tracing Ultra Preset + DLSS Quality + FG

3840x2160
Ray Tracing Ultra Preset (FSR on)
NVIDIA GeForce RTX 4090
198.95n4
198.15n4
184.95n4
174.35n4
152n3
75.1n4
145.9n3
AMD Radeon RX 7900 XTX
214
241
220
201
144.8
67.9
NVIDIA GeForce RTX 4080 Super
246n3
240n3
214n3
189.5n3
123n3
55.6n3
116.55n2
NVIDIA GeForce RTX 4080
217
202
187
125
61.7
81.6
NVIDIA GeForce RTX 4070 Ti SUPER
188.5
188.5
170.8
150.3
94.9
42.3
AMD Radeon RX 7900 XT
190
186
168
124
59.8
AMD Radeon RX 6950 XT
204
197.7
168.4
152.7
96.5
39.5
NVIDIA GeForce RTX 4090 Laptop GPU
149.3n5
142.7n6
132.4n7
122.7n13
93.4n13
43.4n7
62.86n3
NVIDIA GeForce RTX 3090
219.5n2
187.9n2
160.9n2
145.7n2
96.45n2
47.35n2
NVIDIA GeForce RTX 4070 SUPER
186
181.8
159.2n2
139.05n2
86.7n2
38.65n2
AMD Radeon RX 7900M
130.7
129.6
85.2
37.7
NVIDIA GeForce RTX 4080 Laptop GPU
147.85n4
135.3n5
123.85n6
113n9
77.03n9
33.75n4
52.5n3
NVIDIA GeForce RTX 3080 12 GB
179
154
140
93
46.7
AMD Radeon RX 6800
185.9
148.4
117.6n2
70.4
28.3
AMD Radeon RX 7700 XT
175.9
145.1
120.8
110.2
73.1
31.6
NVIDIA Titan RTX
165.6n2
140.8n3
120.45n2
110.3n2
73.85n2
36.6n2
NVIDIA GeForce RTX 3080 Ti Laptop GPU
144.7n2
125.25n2
109.95n2
96.85n4
62.8
27.1n3
NVIDIA GeForce RTX 4070 Laptop GPU
129.6n13
113.65n14
96.4n15
83.75n16
51.85n16
22.5n5
29.6
NVIDIA GeForce RTX 3070
137
119
107
71
34.3
PosModel< PrevNext >Cyberpunk 2077 2.0 Phantom Liberty
low med. high ultra QHD 4K
AMD Radeon RX 6750 XT
166.1
129.6
109.2
96.2
56.8
21.7
AMD Radeon RX 6700 XT
159
123.2
103.5
90.7
53.9
20.6
NVIDIA GeForce RTX 3080 Laptop GPU
117.9
99.8
86.3
82.1n2
49.65n2
22.2n2
NVIDIA GeForce RTX 3060 Ti
160.6
123.6
105.9
96.8
61.5
29.4
Intel Arc A770
116.3
99
88.3
83.2
58.6
30.4
9.65
AMD Radeon RX 7600
135.2
107.5
90.1
81
50.5
21.6
NVIDIA GeForce RTX 3070 Ti Laptop GPU
99
90.7
81.9
54
26.3
NVIDIA GeForce RTX 4060 Laptop GPU
118.3n7
94.8n7
78n9
70.5n11
44.2n8
23.4n3
25.2
NVIDIA GeForce RTX 2080 Super (Desktop)
135.1
111.3
96.9
86
55
24.3
AMD Radeon RX 6650 XT
136.8
103.6
83.5
73.8
41.7
16.7
AMD Radeon RX 6600 XT
119.8
66.6
38.7
15.7
NVIDIA GeForce RTX 3070 Laptop GPU
122.9
99.3
84.8
75
46.9
20.9
AMD Radeon RX 6800S
114
86.4
71.6
65.9
AMD Radeon RX 7600M XT
99.2n2
82.15n2
79.2n3
70.7n3
38.9n3
18.4n3
1.13
25
Intel Arc A750
90.7
87.9
76.3
74.9
54.2
27.6
AMD Radeon RX 7700S
100.7
80.5
68.1
60.7
37.3
15.8
Apple M3 Max 40-Core GPU
45
44
44.05n2
41.8n2
36.45n2
NVIDIA GeForce GTX 1080 Ti (Desktop)
59.9
36.7
16.3
NVIDIA Titan X Pascal
91.7
73.5
63.1
55.2
33.9
15.3
NVIDIA GeForce RTX 2070 Super (Desktop)
117.2
95.9
84
78.2
50.5
24.6
PosModel< PrevNext >Cyberpunk 2077 2.0 Phantom Liberty
low med. high ultra QHD 4K
AMD Radeon RX 5700 XT (Desktop)
93
75.6
63.8
56.7
36.2
15.6
AMD Radeon RX 7600S
86.5
75.2
68.9
44.3
21
NVIDIA GeForce GTX 1080 (Desktop)
46.6
27.5
11
Intel Arc A580
98
83.3
73.6
67.4
44.4
20.8
NVIDIA GeForce RTX 2060 Super (Desktop)
90.7
73.2
64.1
59.2
38.9
19.3
AMD Radeon RX 6600
111.1
83.7
68
59.3
33.4
13.6
Apple M3 Pro 18-Core GPU
53
42.6
35
30.8
Apple M2 Pro 19-Core GPU
39.6
33.5
29.3
26.5
AMD Radeon RX 5700 (Desktop)
82.2
66.5
56.6
50.1
31.8
13.7
AMD Radeon RX 6600M
105.6
80.7
66.1
60.8
36.2
16
AMD Radeon RX 5600 XT (Desktop)
76.5
62.8
52.7
46.5
28.7
12
NVIDIA GeForce GTX 1660 Super (Desktop)
89.75n2
61.9
52.4
47.5
28.8
12.5
AMD Radeon RX 6500 XT
64
39.8
28.4
23.5
AMD Radeon RX 5500 XT (Desktop)
65.5
49.9
40.6
34.5
19.1
7.3
NVIDIA GeForce RTX 4050 Laptop GPU
74.2n3
58.8n4
49.6n4
42.7n4
25.4n4
17.5
8.3
Intel Arc A730M
77.75n2
62.95n2
54.15n2
43.05n2
11.5
NVIDIA GeForce GTX 1660 Ti Mobile
73.3
57.4
49.1
41.7
NVIDIA GeForce RTX 3050 6GB Laptop GPU
61.4n2
47.9n2
39.9n2
34.15n2
21.3
NVIDIA GeForce GTX 1660 (Desktop)
71.9
56.4
47.7
43.1
26.1
11.2
NVIDIA GeForce GTX 1650 Super (Desktop)
61.2
48.3
39
35.2
20.2
3.36
PosModel< PrevNext >Cyberpunk 2077 2.0 Phantom Liberty
low med. high ultra QHD 4K
NVIDIA GeForce RTX 3050 4GB Laptop GPU
52.6
39.8
34.2
28.7
AMD Radeon RX 6550M
62.8
45.9
34.7
28.6
17.3
AMD Radeon RX 6500M
50.7
39.8
28.4
24.4
AMD Radeon RX 480 (Desktop)
28.5
NVIDIA GeForce GTX 1060 Mobile
39.8
30.9
26.8
22.6
NVIDIA GeForce GTX 1650 Ti Mobile
46.8
36.3
29.8
25.1
AMD Radeon RX 5500M
46.1
36.9
30.4
28.3
NVIDIA GeForce RTX 2050 Mobile
37.9n2
28.3n2
22.8n2
18.6n2
NVIDIA GeForce GTX 1650 Mobile
41
32.2
27
22.5
Intel Arc A380
47.1
36.9
31
27.3
Intel Arc A310
41
31.1
25.7
23.7
Intel Arc 8-Cores iGPU
31.5n13
26.3n12
22.8n13
20.6n8
13.1
Intel Arc 7-Cores iGPU
29.2
21.7
19.1
16.4
AMD Radeon 780M
42.4n11
31.8n11
25n11
20.5n7
16.3
7.16
Apple M3 10-Core GPU
33
25.7
21.3
18.1
AMD Radeon 680M
33.9n2
26.2n2
20.95n2
19.2n2
10.4
3.98
NVIDIA GeForce GTX 1050 (Desktop)
10.7
5.98n2
AMD Radeon Steam Deck 8CU
25
21.13
AMD Radeon RX 460 (Desktop)
18
9.72
Intel Iris Xe Graphics G7 96EUs
17.05n4
13.65n2
11.7n2
11.3
PosModel< PrevNext >Cyberpunk 2077 2.0 Phantom Liberty
low med. high ultra QHD 4K
NVIDIA GeForce MX250
11.9
9.03
5.04
4.16
Intel Iris Xe Graphics G7 80EUs
15.5
12.2
10.4
9.72
6.05
Intel Graphics 4-Cores iGPU (Arc)
20.9n3
16.9n3
14.4n3
12.7n3
AMD Radeon 540X
10.2
6.87
4.77
3.82
Intel Iris Plus Graphics G7 (Ice Lake 64 EU)
10.3
AMD Radeon RX Vega 10
11.9
8.8
7.4
6.76
Intel UHD Graphics Xe G4 48EUs
10.5
8.05
Intel UHD Graphics 32EUs (Alder Lake)
7.08n2
5.53
Intel UHD Graphics Xe 32EUs (Tiger Lake-H)
10.4
AMD Radeon RX Vega 8 (Ryzen 4000/5000)
13.8n3
11.5n2
9.17n3
8.23
NVIDIA GeForce MX130
5.19
4.08
2.56
2.3
AMD Radeon RX Vega 6 (Ryzen 4000/5000)
11.6
8.6
7.56
6.5
Intel UHD Graphics 24EUs (Alder Lake-N)
6.07
4.66
4.02
AMD Radeon RX Vega 6 (Ryzen 2000/3000)
6.35
Intel UHD Graphics 630
4.88
Intel UHD Graphics Xe 16EUs (Tiger Lake-H)
4.66
Intel UHD Graphics 620
5.08
AMD Radeon R5 M255
4.94
AMD Radeon RX Vega 3
5.93
(-) * Smaller values are better. / n123 Number of benchmarks for this median value / * Approximate position


Legend
5Stutters – This game is very likely to stutter and have poor frame rates. Based on all known benchmarks using the specified graphical settings, average frame rates are expected to fall below 25fps
May Stutter – This graphics card has not been explicitly tested on this game. Based on interpolated information from surrounding graphics cards of similar performance levels, stutters and poor frame rates are expected.
30Fluent – Based on all known benchmarks using the specified graphical settings, this game should run at or above 25fps
40Fluent – Based on all known benchmarks using the specified graphical settings, this game should run at or above 35fps
60Fluent – Based on all known benchmarks using the specified graphical settings, this game should run at or above 58fps
May Run Fluently – This graphics card has not been explicitly tested on this game. Based on interpolated information from surrounding graphics cards of similar performance levels, fluent frame rates are expected.
?Uncertain – This graphics card experienced unexpected performance issues during testing for this game. A slower card may be able to achieve better and more consistent frame rates than this particular GPU running the same benchmark scene.
Uncertain – This graphics card has not been explicitly tested on this game and no reliable interpolation can be made based on the performances of surrounding cards of the same class or family.
The value in the fields displays the average frame rate of all values in the database. Move your cursor over the value to see individual results.

All test systems

Notebook Graphics card Processor Memory
XMG Neo 17 E23 Nvidia GeForce RTX 4090 @175 W TGP (16 GB GDDR6X) Intel Core i9-13900HX 2 x 16 GB DDR5
Schenker Key 17 Pro E23 Nvidia GeForce RTX 4080 @175 W TGP (12 GB GDDR6X) Intel Core i9-13900HX 2 x 16 GB DDR5
XMG Pro 15 E23 Nvidia GeForce RTX 4070 @140 W TGP (8 GB GDDR6) Intel Core i9-13900HX 2 x 16 GB DDR5
XMG Pro 15 E23 Nvidia GeForce RTX 4060 @140 W TGP (8 GB GDDR6) Intel Core i9-13900HX 2 x 16 GB DDR5
XMG Focus 15 E23 Nvidia GeForce RTX 4050 @140 W TGP (6 GB GDDR6) Intel Core i9-13900HX 2 x 16 GB DDR5
Asus ROG Strix Scar 17 Nvidia GeForce RTX 3080 Ti @150 W TGP (16 GB GDDR6) Intel Core i9-12900H 2 x 16 GB DDR5
Acer Predator Helios 300 Nvidia GeForce RTX 3070 Ti @150 W TGP (8 GB GDDR6) Intel Core i7-12700H 2 x 8 GB DDR5
Asus ROG Zephyrus G14 AMD Radeon RX 6800S (8 GB GDDR6) & AMD Radeon 680M AMD Ryzen 9 6900HS 2 x 16 GB DDR5
Mini-PC Graphics card Processor Memory
Minisforum NUCXi7 Nvidia GeForce RTX 3070 @125 W TGP (8 GB GDDR6) Intel Core i7-11800H 2 x 8 GB DDR4
Minisforum HX99G AMD Radeon RX 6600M @100 W TGP (8 GB GDDR6) AMD Ryzen 9 6900HX 2 x 16 GB DDR5
Minisforum Neptune Series HN2673 Intel Arc A730M Intel Core i7-12650H 2 x 8 GB DDR4
Minisforum UM790 Pro AMD Radeon 780M AMD Ryzen 9 7940HS 2 x 32 GB DDR5
4K monitors Operating system Nvidia driver AMD driver
Gigabyte M32U Windows 11 ForceWare 537.42 Adrenalin 23.9.2
Read all 5 comments / answer
static version load dynamic
Loading Comments
Comment on this article
Please share our article, every link counts!
> Expert Reviews and News on Laptops, Smartphones and Tech Innovations > Reviews > Cyberpunk 2077 Phantom Liberty tech review: Laptop and desktop benchmarks
Florian Glaser, 2023-10-10 (Update: 2023-10-16)