Notebook reviews with AMD Radeon 860M graphics card
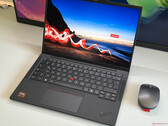
Excellent business laptop with 64 GB RAM - Lenovo ThinkPad T14s Gen 7 AMD Review
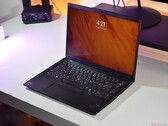
The new ThinkPad T14s Gen 7 is a premium 14-inch business laptop and Lenovo equipped it with a completely redesigned and lighter chassis. Our review unit features AMD's Ryzen AI 7 PRO 450 CPU, 64 GB RAM and a matte IPS-touchscreen. Update: Comparison with the X1 Carbon
AMD Ryzen AI 7 PRO 450, Radeon 860M, 14", 1.2 kgIs AMD trolling us with the Ryzen AI 7 450? Lenovo IdeaPad Pro 5 14 laptop review
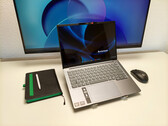
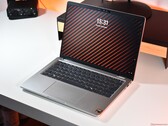
The IdeaPad Pro 5 14AGP11 is a high-quality subnotebook from Lenovo which, in the tested configuration, comes equipped with an eight-core chip based on Zen 5. Read on to find out how the Ryzen AI 7 450 fares against its predecessor and Intel's competition.
AMD Ryzen AI 7 450, Radeon 860M, 14", 1.4 kgAMD Ryzen AI meets classic ThinkPad: Lenovo ThinkPad T14 Gen 6 AMD laptop review
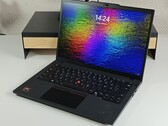
It may be a 2025 model, but the AMD Ryzen AI 300 CPU in the Lenovo ThinkPad T14 Gen 6 AMD delivers the same performance as a more modern Ryzen AI 400 chip. With rising prices, it may be worth to buy the older Lenovo laptop, despite its successor already being announced.
AMD Ryzen AI 7 PRO 350, Radeon 860M, 14", 1.4 kgThe budget Zen5 ThinkPad that finally steps out of the shadows: Lenovo ThinkPad L14 Gen 6 AMD review
Update | In times of rising prices, more affordable laptops become more interesting for more people. The Lenovo ThinkPad L14 Gen 6 AMD is such a device. This business laptop has an overall lower price, enabling buyers to get more memory for less money compared with more expensive models.
AMD Ryzen AI 7 PRO 350, Radeon 860M, 14", 1.6 kgFinally embracing AMD for the pro-series: Dell Pro 14 Plus PB14255 laptop review
With their new Dell Pro series, Dell has finally adopted AMD CPUs for their more expensive business laptop lineup. The Dell Pro 14 Plus replaces the Dell Latitude 5000 and 7000, bringing many business features in a more affordable package than the Dell Pro Premium series.
AMD Ryzen AI 7 PRO 350, Radeon 860M, 14", 1.6 kgAsus ExpertBook PM3406: AMD Ryzen AI 7 350, 14.00", 1.4 kg
Review » Asus ExpertBook PM3 Review: Office laptop with AMD, long battery life, and Copilot+
HP OmniBook 7 Aero 13-bg1077nr: AMD Ryzen AI 7 350, 13.30", 1 kg
Review » HP OmniBook 7 Aero 13 review: World's lightest 13-inch laptop with over 40 TOPS NPU
Lenovo ThinkPad X13 G6 AMD: AMD Ryzen AI 7 PRO 350, 13.30", 1.1 kg
Review » Compact business laptop with a few unwelcome surprises – Lenovo ThinkPad X13 G6 AMD
Acer Swift Go 16 AI SFG16-61-R5Y5: AMD Ryzen AI 7 350, 16.00", 1.5 kg
Review » Solid performance and colorful OLED: Acer Swift Go 16 AI review
Lenovo ThinkPad T16 Gen 4 21QQS06M00: AMD Ryzen AI 7 PRO 350, 16.00", 2 kg
Review » Large business laptop with AMD Ryzen Pro impresses - Lenovo ThinkPad T16 Gen 4 review
Asus ZenBook 14 OLED UM3406K, Ryzen AI 7 350: AMD Ryzen AI 7 350, 14.00", 1.2 kg
Review » AMD subnotebook in a tight three-way battle – Asus ZenBook 14 OLED UM3406K Review
HP EliteBook 8 G1a 16 AI: AMD Ryzen AI 7 PRO 350, 16.00", 1.9 kg
Review » HP EliteBook 8 G1a 16 AI laptop review: Redesigned inside and out
Asus ExpertCenter PN54-S70012NN: AMD Ryzen AI 7 350, 0.7 kg
Review » Asus ExpertCenter PN54 - Business mini PC with AMD Ryzen AI 7 and modern features in the review
Dell 14 Plus 2-in-1: AMD Ryzen AI 7 350, 14.00", 1.6 kg
Review » Dell 14 Plus 2-in-1 convertible review: AMD offers key advantage over Intel
Lenovo Yoga Slim 7 14AKP G10: AMD Ryzen AI 7 350, 14.00", 1.2 kg
Review » Brilliant 1,100-nit OLED, but unexpected quality issues - Lenovo Yoga Slim 7 14 G10 review
Lenovo IdeaPad 5 2-in-1 14AKP10 83KT0033GE: AMD Ryzen AI 7 350, 14.00", 1.5 kg
Review » Strong AMD Zen5 CPU with pen and OLED for a low price: Lenovo IdeaPad 5 2-in-1 14AKP10 laptop review
Lenovo Yoga Pro 7 14AKP G10: AMD Ryzen AI 7 350, 14.50", 1.6 kg
Review » 90 Hz OLED with AdobeRGB - Lenovo Yoga Pro 7 14 G10 laptop review
Lenovo IdeaPad Pro 5 14AKP G10: AMD Ryzen AI 7 350, 14.00", 1.4 kg
Review » A 1,100 nit OLED and AMD Zen 5 in a creator‘s laptop - The Lenovo IdeaPad Pro 5 14 G10 review
Asus Vivobook 16 M1606K: AMD Ryzen AI 7 350, 16.00", 1.9 kg
Review » Asus Vivobook 16 laptop review: AI features at the forefront – genuine productivity boost or marketing hype?
HP ProBook 4 G2a 14: AMD Ryzen AI 7 450, 14.00", 1.4 kg
External Review » HP ProBook 4 G2a 14 - Reviews and Specs
HP EliteBook 6 G1a 14: AMD Ryzen AI 7 350, 14.00", 1.4 kg
External Review » HP EliteBook 6 G1a 14
Acer Swift Go 16 AI SFG16-61-R5Y5: AMD Ryzen AI 7 350, 16.00", 1.5 kg
External Review » Acer Swift Go 16 AI SFG16-61-R5Y5
Acer Aspire 14 AI A14-61M: AMD Ryzen AI 7 350, 14.00", 1.2 kg
External Review » Acer Aspire 14 AI A14-61M
HP OmniBook X Flip NGAI 16-ar0000: AMD Ryzen AI 7 350, 16.00", 1.9 kg
External Review » HP OmniBook X Flip NGAI 16-ar0000
Acer Aspire 16 AI A16-61M: AMD Ryzen AI 7 350, 16.00", 1.6 kg
External Review » Acer Aspire 16 AI A16-61M
HP OmniBook 7 Aero 13-bg1077nr: AMD Ryzen AI 7 350, 13.30", 1 kg
External Review » HP OmniBook 7 Aero 13-bg1077nr
Lenovo ThinkPad T14 Gen 6 (AMD): AMD Ryzen AI 7 PRO 350, 14.00", 1.4 kg
External Review » Lenovo ThinkPad T14 Gen 6 (AMD)
Lenovo Yoga Pro 7 14AKP G10: AMD Ryzen AI 7 350, 14.50", 1.6 kg
External Review » Lenovo Yoga Pro 7 14AKP G10
Dell Pro 14 PC14255: AMD Ryzen AI 7 PRO 350, 14.00", 1.4 kg
External Review » Dell Pro 14 PC14255
HP EliteBook 8 G1a 14, Ryzen AI 7 350: AMD Ryzen AI 7 350, 14.00", 1.4 kg
External Review » HP EliteBook 8 G1a 14, Ryzen AI 7 350
Asus ExpertBook PM3606: AMD Ryzen AI 7 350, 16.00", 1.9 kg
External Review » Asus ExpertBook PM3606
Asus Vivobook S14 M3407KA: AMD Ryzen AI 7 350, 14.00", 1.4 kg
External Review » Asus Vivobook S14 M3407KA
LG gram 15Z80T (2025): AMD Ryzen AI 7 350, 15.60", 1.2 kg
External Review » LG gram 15Z80T (2025)
Dell 14 Plus 2-in-1: AMD Ryzen AI 7 350, 14.00", 1.6 kg
External Review » Dell 14 Plus 2-in-1
Asus ExpertBook PM3406: AMD Ryzen AI 7 350, 14.00", 1.4 kg
External Review » Asus ExpertBook PM3406
HP EliteBook 8 G1a 16 AI: AMD Ryzen AI 7 PRO 350, 16.00", 1.9 kg
External Review » HP EliteBook 8 G1a 16 AI
Asus Vivobook S14 M5406KA: AMD Ryzen AI 7 350, 14.00", 1.3 kg
External Review » Asus Vivobook S14 M5406KA
Lenovo IdeaPad Slim 5 14AKP10: AMD Ryzen AI 7 350, 14.00", 1.4 kg
External Review » Lenovo IdeaPad Slim 5 14AKP10
Lenovo IdeaPad Pro 5 14AKP G10: AMD Ryzen AI 7 350, 14.00", 1.4 kg
External Review » Lenovo IdeaPad Pro 5 14AKP G10
Acer Swift Go 14 AI OLED SFG14-64: AMD Ryzen AI 7 350, 14.00", 1.3 kg
External Review » Acer Swift Go 14 AI OLED SFG14-64
HP OmniBook X Flip NGAI 14-fk0000: AMD Ryzen AI 7 350, 14.00", 1.4 kg
External Review » HP OmniBook X Flip Next Gen AI 14-fk0000
Asus VivoBook S 14 OLED M5406WA, Ryzen AI 7 350: AMD Ryzen AI 7 350, 14.00", 1.3 kg
External Review » Asus VivoBook S 14 OLED M5406WA, Ryzen AI 7 350
HP Omnibook 7 Aero 13-bg: AMD Ryzen AI 7 350, 13.30", 1 kg
External Review » HP Omnibook 7 Aero 13-bg
MSI Venture A16 AI+ A3HMG: AMD Ryzen AI 7 350, 16.00", 1.9 kg
External Review » MSI Venture A16 AI+ A3HMG
Asus Vivobook 16 M1607KA: AMD Ryzen AI 7 350, 16.00", 1.9 kg
External Review » Asus Vivobook 16 M1607KA
Asus Zenbook S 16 UM5606, Ryzen AI 7 350: AMD Ryzen AI 7 350, 16.00", 1.5 kg
External Review » Asus Zenbook S 16 UM5606, Ryzen AI 7 350
Asus Zenbook 14 OLED UM3406KA: AMD Ryzen AI 7 350, 14.00", 1.2 kg
External Review » Asus Zenbook 14 OLED UM3406KA
Lenovo ThinkPad T14s Gen 7 21YW0022GE: AMD Ryzen AI 7 PRO 450, 14.00", 1.2 kg
» Review verdict for Lenovo ThinkPad T14s Gen 7 - A serious rival for the X1 Carbon?
» Lenovo's new ThinkPad T14s Gen 7 is lighter than ever, but the performance stagnates
Lenovo ThinkPad T14 Gen 6 AMD: AMD Ryzen AI 7 PRO 350, 14.00", 1.4 kg
» Lenovo ThinkPad T14 Gen 6 showdown: Ryzen power or Lunar Lake mobility?
» Better not wait for the T14 Gen 7: Why this older AMD ThinkPad is worth it
Lenovo ThinkPad L14 Gen 6 21SE0022GE: AMD Ryzen AI 7 PRO 350, 14.00", 1.6 kg
» You get what you pay for: The differences between a Lenovo ThinkPad L14 and T14 explained
» The AMD version is finally up to date: Why this Lenovo laptop is better than the ThinkPad E14
Dell Pro 14 Plus PB14255 GH77W: AMD Ryzen AI 7 PRO 350, 14.00", 1.6 kg
» Premium price, budget display: Why Dell’s Pro 14 Plus misses the mark
» Plastic-free box, soldered guts: Dell Pro 14 Plus undercuts its green message
Asus ExpertBook PM3406: AMD Ryzen AI 7 350, 14.00", 1.4 kg
» Review verdict Asus ExpertBook PM3 - Good office laptop with long warranty and update security
Dell Pro 14 Plus PB14255 GH77W: AMD Ryzen AI 7 PRO 350, 14.00", 1.6 kg
» Breaking with Intel-only past: AMD-powered Dell Pro 14 Plus targets corporate market
Asus ExpertBook PM3406: AMD Ryzen AI 7 350, 14.00", 1.4 kg
» The Asus ExpertBook PM3 is a good alternative for the Lenovo ThinkPad E14
HP OmniBook 7 Aero 13-bg1077nr: AMD Ryzen AI 7 350, 13.30", 1 kg
» HP OmniBook 7 Aero 13 is barely 4 months old and already almost 40 percent off
» The 1 kg HP OmniBook 7 Aero 13 is impressive, but there are some compromises
Lenovo ThinkPad X13 G6 AMD: AMD Ryzen AI 7 PRO 350, 13.30", 1.1 kg
» Lenovo's ThinkPad X13 G6 is just not as good as the Dell Pro 13 Premium
» Lenovo's ThinkPad X13 G6 is compact, but keyboard and display hinges are weak points
Lenovo ThinkPad T16 Gen 4 21QQS06M00: AMD Ryzen AI 7 PRO 350, 16.00", 2 kg
» Lenovo's ThinkPad T16 Gen 4 AMD offers plenty of room for improvements
Acer Swift Go 16 AI SFG16-61-R5Y5: AMD Ryzen AI 7 350, 16.00", 1.5 kg
» Running AI locally: Acer Swift Go 16 AI tested with Stable Diffusion, ChatGPT, Gemma3 and others
Lenovo ThinkPad T16 Gen 4 21QQS06M00: AMD Ryzen AI 7 PRO 350, 16.00", 2 kg
» AMD ThinkPad T16 offers comprehensive set of features including Thunderbolt 4
» Lenovo only offers the expensive business laptop ThinkPad T16 Gen 4 AMD with 60 Hz screens
Asus ZenBook 14 OLED UM3406K, Ryzen AI 7 350: AMD Ryzen AI 7 350, 14.00", 1.2 kg
» Intel ZenBook 14 OLED features Wi-Fi 7 — but the AMD version delivers faster transfer speeds
» Is the ZenBook 14 better with Intel or AMD this year?
HP EliteBook 8 G1a 16 AI: AMD Ryzen AI 7 PRO 350, 16.00", 1.9 kg
» EliteBook 8 G1a 16: The touchscreen configuration is a no-go if you care about color accuracy
» HP EliteBook 8 G1a 16 is a significant upgrade over the EliteBook 865 G10 except in one key aspect
Asus ExpertCenter PN54-S70012NN: AMD Ryzen AI 7 350, 0.7 kg
» Asus ExpertCenter PN54 reviewed - what the mini PC with AMD Ryzen AI 7 350 can really do in everyday life
Dell 14 Plus 2-in-1: AMD Ryzen AI 7 350, 14.00", 1.6 kg
» Dell 14 Plus 2-in-1 is missing some features found on the older Inspiron 14 7445 2-in-1
» Dell 14 Plus 2-in-1 AMD version is faster than Intel, but there's a catch
Lenovo Yoga Slim 7 14AKP G10: AMD Ryzen AI 7 350, 14.00", 1.2 kg
» Lenovo's new OLED screens are excellent but the Yoga Slim 7 14's chassis quality leaves much to be desired
Lenovo IdeaPad 5 2-in-1 14AKP10 83KT0033GE: AMD Ryzen AI 7 350, 14.00", 1.5 kg
» Careful with the affordable variant: Convertible laptop Lenovo IdeaPad 5 2-in-1 shows risks of cheaper configurations