Notebook reviews with Intel UHD Graphics 600 graphics card
Higole PC Stick review: The world's smallest PC stick has an Intel Celeron J4125, 8 GB RAM and a 128 GB SSD
PCs don't always have to be big and bulky. Many mini PCs we have tested previously have proven this. The Higole PC Stick's manufacturer has taken this a step further by managing to fit the whole of the PC's hardware into a case reminiscent of an oversized USB stick. We took a closer look at the device and what its Intel Celeron J4125 is capable of.
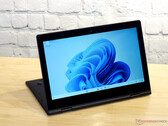
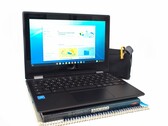
Intel Celeron J4125, UHD Graphics 600, 108 gGeo Computers GeoFlex 140 2-in-1 laptop in test: A convertible for about $160
The GeoFlex 140 is a convertible that is offered for less than 200 Euros (~$218) at some shopping events. You do not get much performance for that, but you get a 2-in-1 laptop with Windows 11 Home license and one year of Microsoft Office 365. If you get both via Microsoft, they already cost more than the convertible.
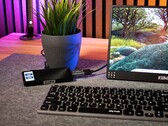
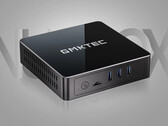
Intel Celeron N4020, UHD Graphics 600, 14.1", 2 kgGMK NucBox 3 review: Fanless Windows 11 HTPC
The Celeron J4125 may be getting a bit old, but its low power requirements can allow for both a slimmer chassis profile and fanless design to be attractive for HTPC users. Unfortunately, performance isn't where we would like it to be even for undemanding HTPC loads.
Intel Celeron J4125, UHD Graphics 600, 410 gAcer Chromebook Spin 511 R752T in review - The 2-in-1 laptop for the classroom
The Acer Chromebook Spin is one of the digital devices that Austria's school-age children will get starting in fall 2021. The laptop is inexpensive and offers a balanced performance. The most pressing question that arises in the test is: Can a laptop with Chrome OS replace a computer with Windows?
Intel Celeron N4120, UHD Graphics 600, 11.6", 1.2 kgBlackview AceBook 1 laptop review: Good for low loads but not much else
The AceBook 1 will attract a lot of eyes with its sub $400 USD price point, but it comes with a bunch of caveats buyers should be aware of. This passively-cooled Celeron laptop can only get you so far before things slow to a crawl.
Intel Celeron N4120, UHD Graphics 600, 14", 1.3 kgAC6-M Mini-PC: Intel Celeron J4125, 0.00"
Review » Newsmay Technology's AC6-M mini PC in review: A full-fledged mini PC for the office!
Beelink GK Mini: Intel Celeron J4125, 0.3 kg
Review » Beelink GK Mini PC Review: Ready-to-Go HTPC
Zotac ZBOX EDGE CI341: Intel Celeron N4100, 0.00"
Review » Affordable Zotac ZBOX edge mini PC in review
Teclast F7 Air: Intel Celeron N4120, 14.00", 1.2 kg
Review » Teclast F7 Air Laptop Review
Chuwi LarkBook CWI509: Intel Celeron N4120, 13.30", 1.1 kg
Review » Chuwi LarkBook Laptop Review: Good Looks, Poor Performance
Jumper Tech Ez Book X3 Air: Intel Celeron N4100, 13.30", 1.1 kg
Review » Jumper Tech EZbook X3 Air Laptop in review: Appealing design meets reasonable price
GMK NucBox K1: Intel Celeron J4125, 0.1 kg
Review » GMK NucBox K1 vs. Chuwi LarkBox Mini PC Review: Two Birds of a Feather
Chuwi GemiBook CWI528: Intel Celeron J4115, 13.00", 1.3 kg
Review » Chuwi GemiBook CWI528 Laptop Review: Full sRGB Coverage For $300 USD
Chuwi LarkBox 4K Mini PC: Intel Celeron J4115, 0.1 kg
Review » Chuwi LarkBox Celeron J4115 Review: A 4K Mini PC So Small, It's Lighter Than Its Own AC Adapter
Lenovo IdeaPad Flex 3 11IGL05: Intel Celeron N4020, 11.60", 1.1 kg
Review » Lenovo IdeaPad Flex 3 11IGL05 laptop review: Quiet, efficient, and slow convertible
Chuwi Hi10 X: Intel Celeron N4100, 10.10", 0.6 kg
Review » Chuwi Hi10 X Convertible Review: Metal Chassis for $230 USD
BMAX MaxBook Y11 H1M6: Intel Celeron N4100, 11.60", 1 kg
Review » BMAX MaxBook Y11 H1M6 Convertible Review
Lenovo Chromebook S340-14T 81V30002GE: Intel Celeron N4000, 14.00", 1.4 kg
Review » Lenovo Chromebook S340-14T Review: This simple Chromebook has a low-reflection touchscreen
Chuwi UBook CWI509: Intel Celeron N4100, 11.60", 0.8 kg
Review » Chuwi UBook CWI509 Tablet Review: The Surface Go Wannabe
Chuwi LapBook Pro: Intel Celeron N4100, 14.00", 1.4 kg
Review » Chuwi LapBook Pro Laptop Review: An affordable 14-inch laptop with good battery life and wide colour gamut
Chuwi MiniBook CWI526: Intel Celeron N4100, 8.00", 0.7 kg
Review » Chuwi at its Best: Chuwi MiniBook Netbook Review
Lenovo Tablet 10-20L3000KGE: Intel Celeron N4100, 10.10", 0.7 kg
Review » Lenovo Tablet 10 (Celeron N4100, eMMC, LTE, WUXGA) Tablet Review
Chuwi LapBook SE: Intel Celeron N4100, 13.30", 1.4 kg
Review » Chuwi LapBook SE Laptop Review
Lenovo IdeaPad 330-15IGM: Intel Celeron N4100, 15.60", 2 kg
Review » Lenovo IdeaPad 330-15IGM (Celeron N4100) Laptop Review
Chuwi GBox CWI560: Intel Celeron N4100, 0.6 kg
Review » Chuwi GBox CWI560 (Celeron N4100) Mini PC Review
Intel NUC7CJYH: Intel Celeron J4005, 0.00", 0.6 kg
Review » Intel NUC Kit NUC7CJYH (Celeron J4005, UHD 600) Mini PC Review
Lenovo Flex 6-11IGM: Intel Celeron N4000, 11.60", 1.3 kg
Review » Lenovo Flex 6 11 (Celeron N4000) Convertible Review
Asus Chromebook C424MA: Intel Celeron N4020, 14.00", 1.5 kg
External Review » Asus Chromebook C424MA
HP Stream 11-ak0013ns: Intel Celeron N4120, 11.60", 1.1 kg
External Review » HP Stream 11-ak0013ns
HP Stream 14s-dq0024ns: Intel Celeron N4120, 14.00", 1.5 kg
External Review » HP Stream 14s-dq0024ns
Chuwi MiniBook, Celeron J4125: Intel Celeron J4125, 13.00", 1.3 kg
External Review » Chuwi MiniBook, Celeron J4125
Asus VivoBook 14 E410MA-EK1987WS: Intel Celeron N4020, 14.00", 1.3 kg
External Review » Asus VivoBook 14 E410MA-EK1987WS
Acer Aspire 3 A315-34-C8K1: Intel Celeron N4000, 15.60", 1.9 kg
External Review » Acer Aspire 3 A315-34-C8K1
Acer Chromebook Spin 311 CP311-2H-C7QD: Intel Celeron N4000, 11.60", 1.2 kg
External Review » Acer Chromebook Spin 311 CP311-2H-C7QD
Acer Chromebook 311 C733-C6M8: Intel Celeron N4000, 11.00", 1.3 kg
External Review » Acer Chromebook 311 C733-C6M8
Gateway GWNC21524-RD: Intel Celeron N4020, 15.60", 1.6 kg
External Review » Gateway GWNC21524-RD
Asus VivoBook 14 E410MA-EK007WS: Intel Celeron N4020, 14.00", 1.3 kg
External Review » Asus VivoBook 14 E410MA-EK007WS
Acer Chromebook 315 CB315-3H-C6UR: Intel Celeron N4120, 15.60", 1.6 kg
External Review » Acer Chromebook 315 CB315-3H-C6UR
HP ChromeBook 14a-na0014ns: Intel Celeron N4020, 14.00", 1.5 kg
External Review » HP ChromeBook 14a-na0014ns
Acer Travelmate B3 TMB311-31-C369: Intel Celeron N4120, 11.60", 1.4 kg
External Review » Acer Travelmate B3 TMB311-31-C369
HP 15s-fq0011ns: Intel Celeron N4020, 15.60", 1.7 kg
External Review » HP 15s-fq0011ns
Microsoft Surface Laptop SE, Celeron N4120: Intel Celeron N4120, 11.60", 1.1 kg
External Review » Microsoft Surface Laptop SE, Celeron N4120
Asus VivoBook 14 E410MA-EK007TS: Intel Celeron N4020, 14.00", 1.3 kg
External Review » Asus VivoBook 14 E410MA-EK007TS
HP Stream 14s-dq0009ns: Intel Celeron N4020, 14.00", 1.5 kg
External Review » HP Stream 14s-dq0009ns
HP Stream 14s-dq0014ns: Intel Celeron N4020, 14.00", 1.5 kg
External Review » HP Stream 14s-dq0014ns
HP Stream 14s-dq0008ns: Intel Celeron N4020, 14.00", 1.5 kg
External Review » HP Stream 14s-dq0008ns
Asus Chromebook Flip C214MA-BU0410: Intel Celeron N4020, 11.60", 1.2 kg
External Review » Asus Chromebook Flip C214MA-BU0410
HP Chromebook 14a-na0023nr: Intel Celeron N4020, 14.00", 1.5 kg
External Review » HP Chromebook 14a-na0023nr
Asus Chromebook CX1101: Intel Celeron N4020, 11.60", 1.2 kg
External Review » Asus Chromebook CX1101
Alldocube iWork 20 Pro: Intel Celeron N4120, 10.50", 0.6 kg
External Review » Alldocube iWork 20 Pro
Lenovo V14 IGL-82C2001QGE: Intel Celeron N4020, 14.00", 1.6 kg
External Review » Lenovo V14 IGL-82C2001QGE
HP Chromebook 14a-na0006ns: Intel Celeron N4020, 14.00", 1.5 kg
External Review » HP Chromebook 14a-na0006ns
HP Chromebook 11 G8 EE-1A762UT: Intel Celeron N4020, 11.60", 1.3 kg
External Review » HP Chromebook 11 G8 EE-1A762UT
HP Chromebook x360 14a-ca0003ns: Intel Celeron N4020, 14.00", 1.5 kg
External Review » HP Chromebook x360 14a-ca0003ns
Acer TravelMate B3 TMB311-31-C1VR: Intel Celeron N4120, 11.60", 1.4 kg
External Review » Acer TravelMate B3 TMB311-31-C1VR
Acer Chromebook Spin 311 CP311-2H-C95K: Intel Celeron N4120, 11.60", 1.2 kg
External Review » Acer Chromebook Spin 311 CP311-2H-C95K
HP Stream 14-dq0010nr: Intel Celeron N4020, 14.00", 1.5 kg
External Review » HP Stream 14-dq0010nr
HP Chromebook 14a-na0004ns: Intel Celeron N4020, 14.00", 1.5 kg
External Review » HP Chromebook 14a-na0004ns
HP Chromebook 14a-na0005ns: Intel Celeron N4020, 14.00", 1.5 kg
External Review » HP Chromebook 14a-na0005ns
Asus VivoBook 15 F515MA-BR040: Intel Celeron N4020, 15.60", 1.8 kg
External Review » Asus VivoBook 15 F515MA-BR040
HP Stream 11-ak0004ns: Intel Celeron N4020, 11.60", 1.1 kg
External Review » HP Stream 11-ak0004ns
Lenovo 500e Chromebook G2: Intel Celeron N4100, 11.60", 1.3 kg
External Review » Lenovo 500e Chromebook G2
Lenovo 300e G2-81M9006EGE: Intel Celeron N4120, 11.60", 1.2 kg
External Review » Lenovo 300e G2-81M9006EGE
Asus Chromebook Flip C214 C214MA-Q1R-CB: Intel Celeron N4020, 11.60", 1.2 kg
External Review » Asus Chromebook Flip C214 C214MA-Q1R-CB
Dynabook E10-S: Intel Celeron N4020, 11.60", 1.1 kg
External Review » Dynabook E10-S
Asus E510MA-EJ133T: Intel Celeron N4020, 15.60", 1.6 kg
External Review » Asus E510MA-EJ133T
Acer Spin 1 SP111-33-C690: Intel Celeron N4020, 11.60", 1.3 kg
External Review » Acer Spin 1 SP111-33-C690
HP Chromebook x360 12b-ca0001ns: Intel Celeron N4020, 12.00", 1.4 kg
External Review » HP Chromebook x360 12b-ca0001ns
Asus L410MA-DB02: Intel Celeron N4020, 14.00", 1.3 kg
External Review » Asus L410MA-DB02
Acer Chromebook 14 CB314-1H-C7PS: Intel Celeron N4020, 14.00", 1.5 kg
External Review » Acer Chromebook 14 CB314-1H-C7PS
HP Chromebook x360 14b-ca0001ns: Intel Celeron N4020, 14.00", 1.6 kg
External Review » HP Chromebook x360 14b-ca0001ns
Lenovo IdeaPad 3 15IGL05-81WQ002QGE: Intel Celeron N4020, 15.60", 1.7 kg
External Review » Lenovo IdeaPad 3 15IGL05-81WQ002QGE
Lenovo IdeaPad 1 14IGL05-81VU0079US: Intel Celeron N4020, 14.00", 1.4 kg
External Review » Lenovo IdeaPad 1 14IGL05-81VU0079US
HP Chromebook 14a-na0021nr: Intel Celeron N4000, 14.00", 1.5 kg
External Review » HP Chromebook 14a-na0021nr
Asus L510MA-DS04: Intel Celeron N4020, 15.60", 1.6 kg
External Review » Asus L510MA-DS04
Samsung Chromebook 4 XE310XBA-KA1US: Intel Celeron N4020, 11.60", 1.2 kg
External Review » Samsung Chromebook 4 XE310XBA-KA1US
Chuwi GemiBook CWI528: Intel Celeron J4115, 13.00", 1.3 kg
External Review » Chuwi GemiBook CWI528
Asus VivoBook L203MA-DS04: Intel Celeron N4000, 11.60", 1.1 kg
External Review » Asus VivoBook L203MA-DS04
Prestigio Ecliptica 116 C3: Intel Celeron N4100, 11.60", 1.4 kg
External Review » Prestigio Ecliptica 116 C3
Acer Aspire 1 A115-31-C2Y3: Intel Celeron N4020, 15.60", 1.9 kg
External Review » Acer Aspire 1 A115-31-C2Y3
Lenovo IdeaPad 1 11IGL05-81VT003ASP: Intel Celeron N4020, 11.60", 1.2 kg
External Review » Lenovo IdeaPad 1 11IGL05-81VT003ASP
Acer Chromebook 311 C733-C37P: Intel Celeron N4000, 11.60", 1.3 kg
External Review » Acer Chromebook 311 C733-C37P
Acer Chromebook Spin 511 R752T-C3M5: Intel Celeron N4020, 11.60", 1.3 kg
External Review » Acer Chromebook Spin 511 R752T-C3M5
Dell Chromebook 11 3100-0JWC5: Intel Celeron N4020, 11.60", 1.3 kg
External Review » Dell Chromebook 11 3100-0JWC5
HP Stream 11-ak0005ns: Intel Celeron N4020, 11.60"
External Review » HP Stream 11-ak0005ns
HP Stream 11-ak0003ns: Intel Celeron N4020, 11.60"
External Review » HP Stream 11-ak0003ns
HP Chromebook x360 14a-ca0102nd: Intel Celeron N4020, 14.00", 1.5 kg
External Review » HP Chromebook x360 14a-ca0102nd
HP 240 G8: Intel Celeron N4020, 14.00", 1.5 kg
External Review » HP 240 G8
Acer Chromebook 315 CB315-3H-C7JF: Intel Celeron N4020, 15.60", 1.7 kg
External Review » Acer Chromebook 315 CB315-3H-C7JF
Samsung Chromebook 4 11.6 inch XE310XBA-K01US: Intel Celeron N4000, 11.60", 1.2 kg
External Review » Samsung Chromebook 4 11.6 inch XE310XBA-K01US
Acer Chromebook 11 CB311-9H-C4PP: Intel Celeron N4000, 11.60", 1.6 kg
External Review » Acer Chromebook 11 CB311-9H-C4PP
Acer Chromebook 315 CB315-3H-C5JS: Intel Celeron N4020, 15.60", 1.6 kg
External Review » Acer Chromebook 315 CB315-3H-C5JS
Asus VivoBook 14 E410MA-EK018TS: Intel Celeron N4020, 14.00", 1.3 kg
External Review » Asus VivoBook 14 E410MA-EK018TS
Lenovo IdeaPad Flex 3 11IGL05: Intel Celeron N4020, 11.60", 1.1 kg
External Review » Lenovo IdeaPad Flex 3 11IGL05
Chuwi LarkBook CWI509: Intel Celeron N4120, 13.30", 1.1 kg
External Review » Chuwi LarkBook CWI509
Acer Chromebook Spin 311 CP311-2H-C679: Intel Celeron N4000, 11.60", 1.2 kg
External Review » Acer Chromebook Spin 311 CP311-2H-C679
Samsung Chromebook 4+ XE350XBA-K03US: Intel Celeron N4000, 15.60", 1.7 kg
External Review » Samsung Chromebook 4+ XE350XBA-K03US
Asus L406MA-WH02: Intel Celeron N4000, 14.00", 1.3 kg
External Review » Asus L406MA-WH02
Chuwi Hi10 XR: Intel Celeron N4120, 10.10", 0.6 kg
External Review » Chuwi Hi10 XR
Asus Vivobook 12 E210MA-GJ001TS: Intel Celeron N4020, 11.60", 1.1 kg
External Review » Asus Vivobook 12 E210MA-GJ001TS
Lenovo IdeaPad 3 14IGL05-81WH0000MJ: Intel Celeron N4020, 14.00", 1.5 kg
External Review » Lenovo IdeaPad 3 14IGL05-81WH0000MJ
Lenovo IdeaPad Duet 3 10IGL5-82AT002YSP: Intel Celeron N4020, 10.30", 0.9 kg
External Review » Lenovo IdeaPad Duet 3 10IGL5-82AT002YSP
Asus Vivobook 12 L210MA-GJ050TS: Intel Celeron N4020, 11.60", 1.1 kg
External Review » Asus Vivobook 12 L210MA-GJ050TS
Asus VivoBook 14 A416: Intel Celeron N4020, 14.00", 1.6 kg
External Review » Asus VivoBook 14 A416
Chuwi GemiBook Pro: Intel Celeron J4125, 14.00", 1.5 kg
External Review » Chuwi GemiBook Pro
Asus Chromebook C204MA-GJ0114: Intel Celeron N4000, 11.60", 1.2 kg
External Review » Asus Chromebook C204MA-GJ0114
Acer Chromebook 314 CB314-1H-C75Z: Intel Celeron N4020, 14.00", 1.5 kg
External Review » Acer Chromebook 314 CB314-1H-C75Z
Lenovo IdeaPad Duet 3 10IGL5-82AT002VGE: Intel Celeron N4020, 10.30", 0.6 kg
External Review » Lenovo IdeaPad Duet 3 10IGL5-82AT002VGE
Asus VivoBook 14 E410MA-EK367TS: Intel Celeron N4020, 14.00", 1.3 kg
External Review » Asus VivoBook 14 E410MA-EK367TS
Jumper EZbook X3 Air: Intel Celeron N4100, 13.30", 1.1 kg
External Review » Jumper EZbook X3 Air
Lenovo IdeaPad Flex 3 Chromebook 11IGL05: Intel Celeron N4020, 11.60", 1.2 kg
External Review » Lenovo IdeaPad Flex 3 Chromebook 11IGL05
Samsung Chromebook 4+ 15.6 inch XE350XBA-K01US: Intel Celeron N4000, 15.60", 1.7 kg
External Review » Samsung Chromebook 4+ 15.6 inch XE350XBA-K01US
Acer Aspire 3 A317-32-C20M: Intel Celeron N4000, 17.30", 2.7 kg
External Review » Acer Aspire 3 A317-32-C20M
Lenovo IdeaPad 3 CB 14IGL05-82C10004US: Intel Celeron N4020, 14.00", 1.4 kg
External Review » Lenovo IdeaPad 3 CB 14IGL05-82C10004US
Chuwi HeroBook Pro: Intel Celeron N4000, 14.10", 1.4 kg
External Review » Chuwi HeroBook Pro
Lenovo IdeaPad 3 11IGL05 (Chromebook 3 11): Intel Celeron N4020, 11.60", 1.1 kg
External Review » Lenovo IdeaPad 3 11IGL05
Acer Chromebook 314 CB314-1H-C0YY: Intel Celeron N4020, 14.00", 1.5 kg
External Review » Acer Chromebook 314 CB314-1H-C0YY
HP 15-da0263ns: Intel Celeron N4000, 15.60", 1.8 kg
External Review » HP 15-da0263ns
Acer Chromebook Spin 11 CP311-2H-C7BG: Intel Celeron N4100, 11.60", 1.2 kg
External Review » Acer Chromebook Spin 11 CP311-2H-C7BG
Lenovo Chromebook C340-11-81TA0008MH: Intel Celeron N4000, 11.60", 1.2 kg
External Review » Lenovo Chromebook C340-11-81TA0008MH
Acer Aspire 3 A317-32-C5QZ: Intel Celeron N4000, 17.30", 2.7 kg
External Review » Acer Aspire 3 A317-32-C5QZ
Acer Chromebook 11 CB311-9HT-C783: Intel Celeron N4100, 11.60", 1.1 kg
External Review » Acer Chromebook 11 CB311-9HT-C783
Acer Chromebook 314 CB314-1H-C54R: Intel Celeron N4000, 14.00", 1.7 kg
External Review » Acer Chromebook 314 CB314-1H-C54R
HP Chromebook X360 12b-ca0002no: Intel Celeron N4000, 12.00", 1.4 kg
External Review » HP Chromebook X360 12b-ca0002no
HP Chromebook x360 12b-ca0005nf: Intel Celeron N4000, 12.00", 1.4 kg
External Review » HP Chromebook x360 12b-ca0005nf
Medion Akoya E4251-MD61555: Intel Celeron N4000, 14.00", 1.3 kg
External Review » Medion Akoya E4251-MD61555
HP 15-da0177ns: Intel Celeron N4000, 15.60", 2.1 kg
External Review » HP 15-da0177ns
Lenovo Chromebook C340-11-81TA000GGE: Intel Celeron N4000, 11.60", 1.2 kg
External Review » Lenovo Chromebook C340-11-81TA000GGE
Lenovo Ideapad S130-14IGM: Intel Celeron N4000, 14.00", 1.5 kg
External Review » Lenovo Ideapad S130-14IGM
Medion Akoya E4271 MD61263: Intel Celeron N4000, 14.00", 1.7 kg
External Review » Medion Akoya E4271 MD61263
Asus R540MA-GQ757: Intel Celeron N4000, 15.60", 1.9 kg
External Review » Asus R540MA-GQ757
Lenovo 300e Chromebook G2-81MB0003US: Intel Celeron N4000, 11.60", 1.3 kg
External Review » Lenovo 300e Chromebook G2-81MB0003US
HP 14-cf0005ns: Intel Celeron N4000, 14.00", 1.5 kg
External Review » HP 14-cf0005ns
Chuwi MiniBook CWI526: Intel Celeron N4100, 8.00", 0.7 kg
External Review » Chuwi MiniBook CWI526
Dell Chromebook 3100-6VTNP 2-in-1: Intel Celeron N4000, 11.60", 1.4 kg
External Review » Dell Chromebook 3100-6VTNP 2-in-1
Asus Chromebook Flip C214MA-YS02T: Intel Celeron N4000, 11.60", 1.3 kg
External Review » Asus Chromebook Flip C214MA-YS02T
Acer Swift 1 SF114-32-C73V: Intel Celeron N4000, 14.00", 1.4 kg
External Review » Acer Swift 1 SF114-32-C73V
Lenovo IdeaPad 330-15IGM-81D1003TUS: Intel Celeron N4100, 15.60", 2 kg
External Review » Lenovo IdeaPad 330-15IGM-81D1003TUS
Lenovo Ideapad D330-10IGM-81H3000VSP: Intel Celeron N4000, 10.10", 1.1 kg
External Review » Lenovo Ideapad D330-10IGM-81H3000VSP
Lenovo Ideapad D330-10IGM-81MD0006GE: Intel Celeron N4000, 10.10", 0.6 kg
External Review » Lenovo Ideapad D330-10IGM-81MD0006GE
Asus X507MA-BR072T: Intel Celeron N4000, 15.60", 1.8 kg
External Review » Asus X507MA-BR072T
HP 250 G6 4WV09EA: Intel Celeron N4000, 15.60", 1.9 kg
External Review » HP 250 G6 4WV09EA
Samsung NoteBook Flash NP530XBB-K01US: Intel Celeron N4000, 13.30", 1.4 kg
External Review » Samsung NoteBook Flash NP530XBB-K01US
Acer Aspire 1 A114-32-C1B2: Intel Celeron N4000, 14.00", 1.7 kg
External Review » Acer Aspire 1 A114-32-C1B2
Lenovo Yoga 330-11IGM-81A6001CSP: Intel Celeron N4000, 11.60", 1.3 kg
External Review » Lenovo Yoga 330-11IGM-81A6001CSP
Lenovo Tablet 10-20L3000RGE: Intel Celeron N4100, 10.10", 0.7 kg
External Review » Lenovo Tablet 10-20L3000RGE
Medion Akoya E4251-MD61202: Intel Celeron N4000, 14.00", 1.4 kg
External Review » Medion Akoya E4251-MD61202
Lenovo Ideapad 330-15IKB-81DC00HMSP: Intel Celeron N4000, 15.60", 2.2 kg
External Review » Lenovo Ideapad 330-15IKB-81DC00HMSP
Lenovo Yoga 330-11IGM-81A6002FSP: Intel Celeron N4000, 11.60", 1.3 kg
External Review » Lenovo Yoga 330-11IGM-81A6002FSP
Lenovo Ideapad 330-15IGM-81D100CESP: Intel Celeron N4000, 15.60", 2.2 kg
External Review » Lenovo Ideapad 330-15IGM-81D100CESP
HP 15-da0084ns: Intel Celeron N4000, 15.60", 1.8 kg
External Review » HP 15-da0084ns
Lenovo V130-14 81HMS00C00: Intel Celeron N4000, 14.00", 1.8 kg
External Review » Lenovo V130-14 81HMS00C00
Lenovo Ideapad S130-11IGM-81J1003NGE: Intel Celeron N4000, 11.60", 1.2 kg
External Review » Lenovo Ideapad S130-11IGM-81J1003NGE
Teclast F5: Intel Celeron N4100, 11.60", 1.1 kg
External Review » Teclast F5
HP 15-da0010ns: Intel Celeron N4000, 15.60", 2.1 kg
External Review » HP 15-da0010ns
Medion Akoya E4251-MD61227: Intel Celeron N4000, 14.00", 1.3 kg
External Review » Medion Akoya E4251-MD61227
Lenovo Ideapad D330-10IGM-81H30077GE: Intel Celeron N4000, 10.10", 0.6 kg
External Review » Lenovo Ideapad D330-10IGM-81H30077GE
Lenovo Tablet 10-20L3000KGE: Intel Celeron N4100, 10.10", 0.7 kg
External Review » Lenovo Tablet 10-20L3000KGE
Chuwi LapBook SE: Intel Celeron N4100, 13.30", 1.4 kg
External Review » Chuwi LapBook SE
Chuwi SurBook SE: Intel Celeron N4100, 10.10"
External Review » Chuwi SurBook SE
Lenovo V130-15IGM-81HL001CSP: Intel Celeron N4000, 15.60", 1.9 kg
External Review » Lenovo V130-15IGM-81HL001CSP
Acer Aspire 1 A114-32-C1YA: Intel Celeron N4000, 14.00", 1.7 kg
External Review » Acer Aspire 1 A114-32-C1YA
Jumper EZBook X4: Intel Celeron N4100, 14.00", 1.3 kg
External Review » Jumper EZBook X4
Jumper EZBook X1: Intel Celeron N4100, 11.60", 1 kg
External Review » Jumper EZBook X1
Lenovo Flex 6-11IGM: Intel Celeron N4000, 11.60", 1.3 kg
External Review » Lenovo Flex 6-11IGM
Beelink GK Mini: Intel Celeron J4125, 0.3 kg
» Beelink GK Mini PC is only $199 USD, comes with just the right amount of power and expandability for a basic 1080p HTPC setup
GMK NucBox K1: Intel Celeron J4125, 0.1 kg
» GMK says it will fix the problems we experienced on the NucBox
Chuwi GemiBook CWI528: Intel Celeron J4115, 13.00", 1.3 kg
» Chuwi GemiBook design flaw shows us what happens when ports are positioned too closely together
Lenovo IdeaPad Flex 3 11IGL05: Intel Celeron N4020, 11.60", 1.1 kg
» Despite the low price, the Lenovo IdeaPad Flex 3 is not a stunner
Chuwi LarkBox 4K Mini PC: Intel Celeron J4115, 0.1 kg
» Lemon-sized Chuwi LarkBox 4K mini PC is finally live at $155 USD and set for an August launch window
Chuwi Hi10 X: Intel Celeron N4100, 10.10", 0.6 kg
» The Chuwi Hi10 X feels great to hold, but it's just too slow and unreliable