GMK NucBox K1 vs. Chuwi LarkBox Mini PC Review: Two Birds of a Feather
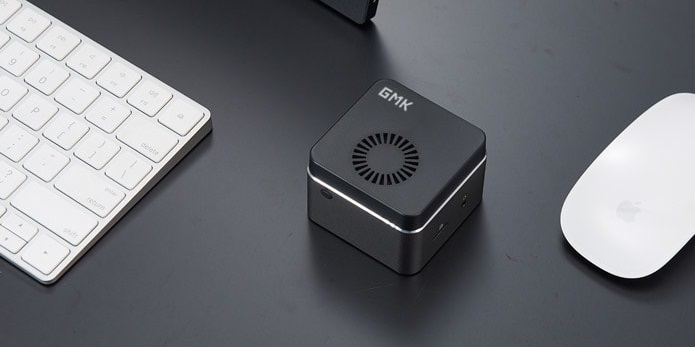
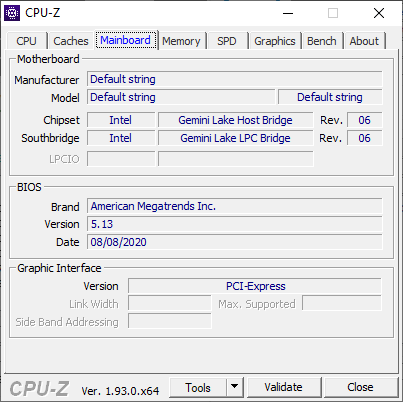
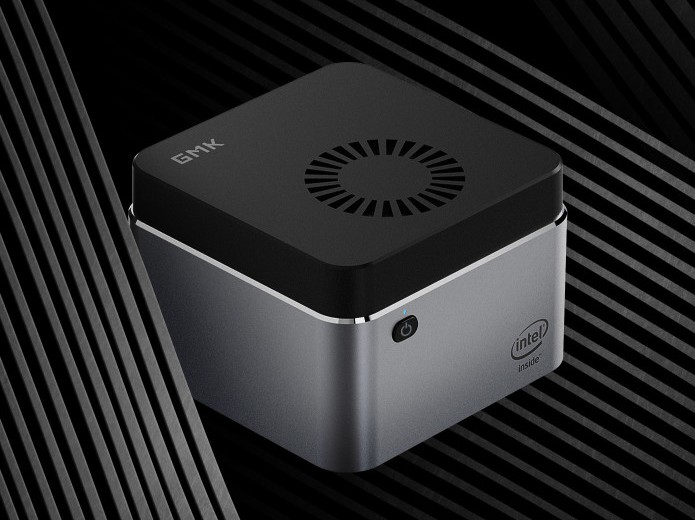
Not to be outdone by the Chuwi LarkBox, the GMK NucBox K1 is yet another ultra-small mini PC designed to fit just about anywhere. It's also notable for being one of the very few PCs shipping with a Gemini Lake Celeron J4125 CPU processor alongside a tiny internal fan to keep it all cool.
The manufacturer is aiming for a price of $209 USD while early backers can get one for as low as $159. Our pre-production test unit should mostly represent what backers will see once the NucBox K1 goes into mass production later this year.
| GMK NucBox | Chuwi Larkbox | |
|---|---|---|
| CPU | Intel Celeron J4125 | Intel Celeron J4115 |
| Dimensions | 62 x 62 x 42 mm | 61 x 61 x 43 cm |
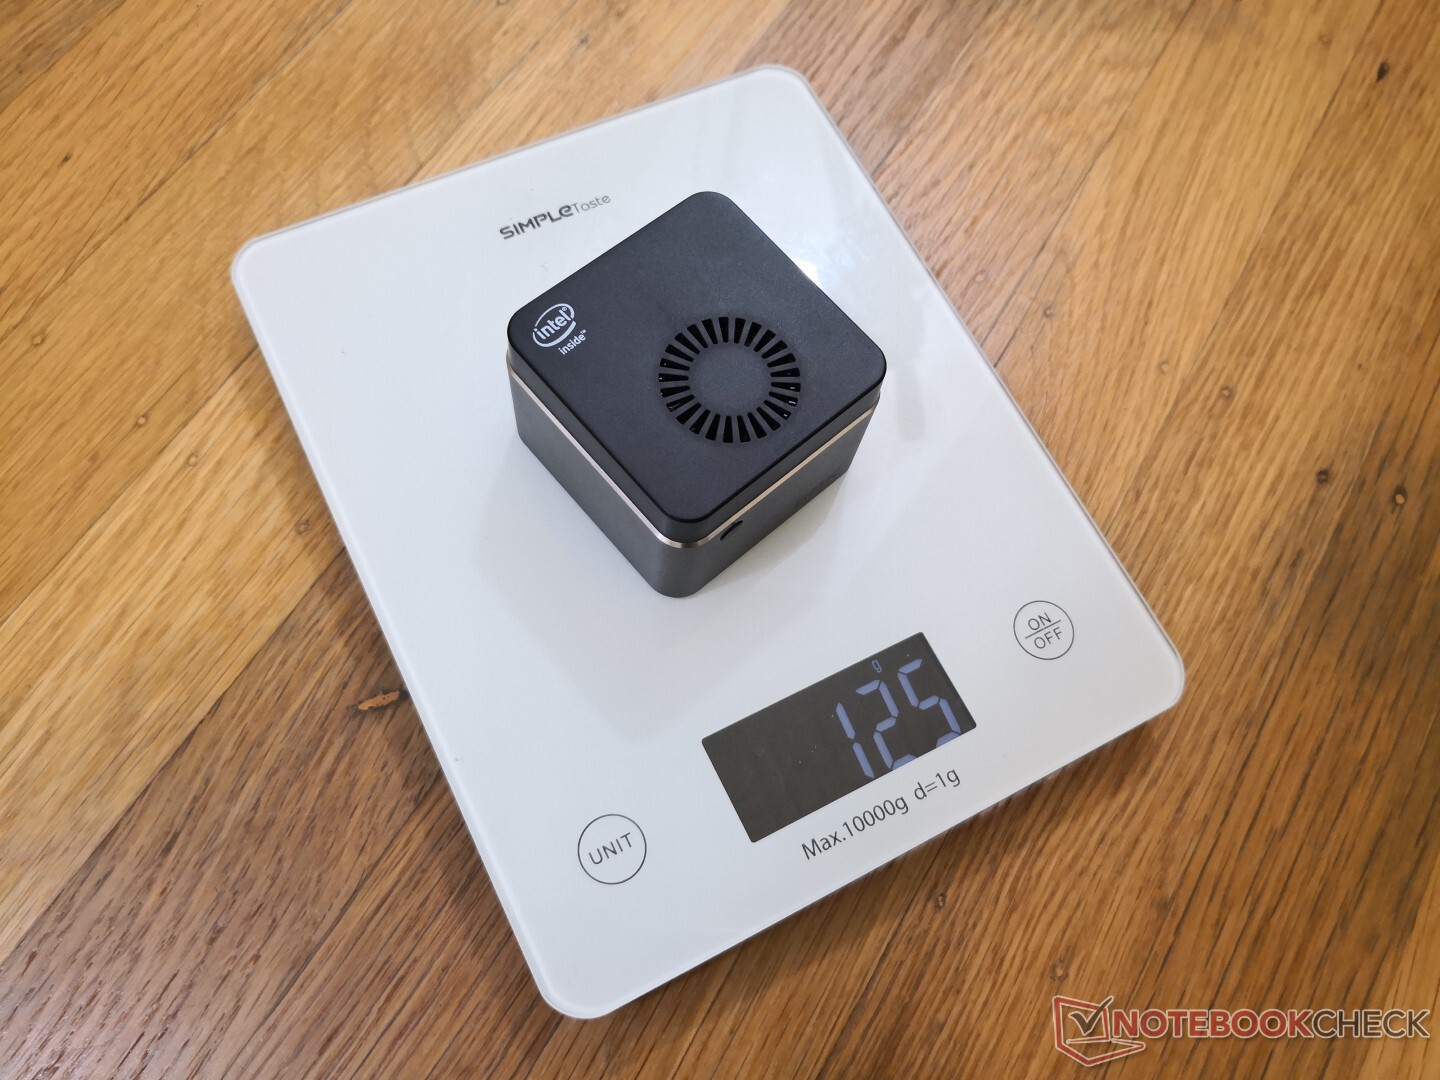
| Weight | 125 g | 127 g |
| Storage | 128/256/512 GB SSD | 128 GB eMMC |
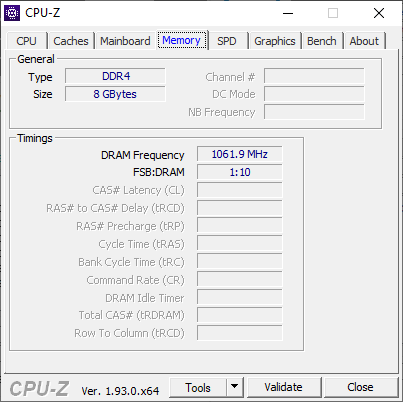
| RAM | 8 GB LPDDR4 | 6 GB LPDDR4 |
| Ports | 2x USB 3.0 | 2x USB 3.0 HDMI 2.0 USB Type-C 3.5 mm audio MicroSD |
| Wi-Fi | 2x2, 867 Mbps | 1x1, 433 Mbps |
More mini PC reviews:
Rating | Date | Model | Weight | Height | Size | Resolution | Price |
|---|---|---|---|---|---|---|---|
v (old) | 09 / 2020 | GMK NucBox K1 Celeron J4125, UHD Graphics 600 | 130 g | 42 mm | x | ||
v (old) | 07 / 2020 | Zotac ZBox MI643 i5-10210U, UHD Graphics 620 | 550 g | 28.5 mm | x | ||
v (old) | 07 / 2020 | Chuwi LarkBox 4K Mini PC Celeron J4115, UHD Graphics 600 | 129 g | 43 mm | x | ||
v (old) | 02 / 2020 | Intel NUC10i5FNK i5-10210U, UHD Graphics 620 | 493 g | 36 mm | 0.00" | 0x0 | |
v (old) | 12 / 2019 | Lenovo ThinkCentre M90n-1 Nano i5-8265U, UHD Graphics 620 | 499 g | 22 mm | 0.00" | x | |
v (old) | 09 / 2018 | Chuwi GBox CWI560 Celeron N4100, UHD Graphics 600 | 558 g | 37.3 mm | x |
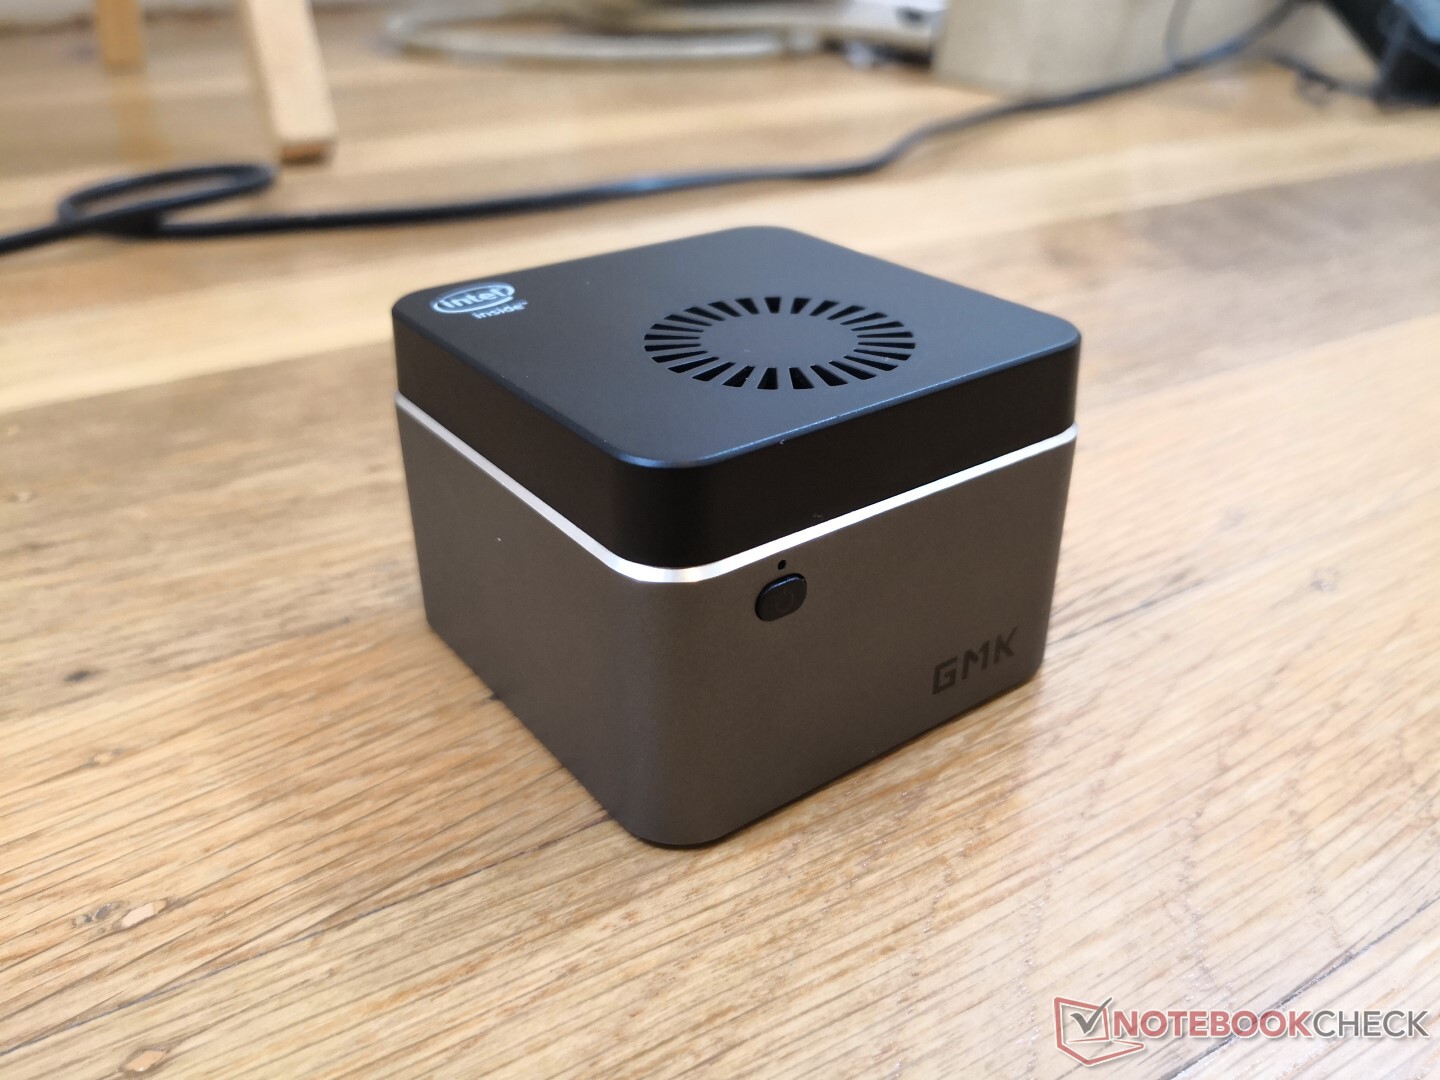
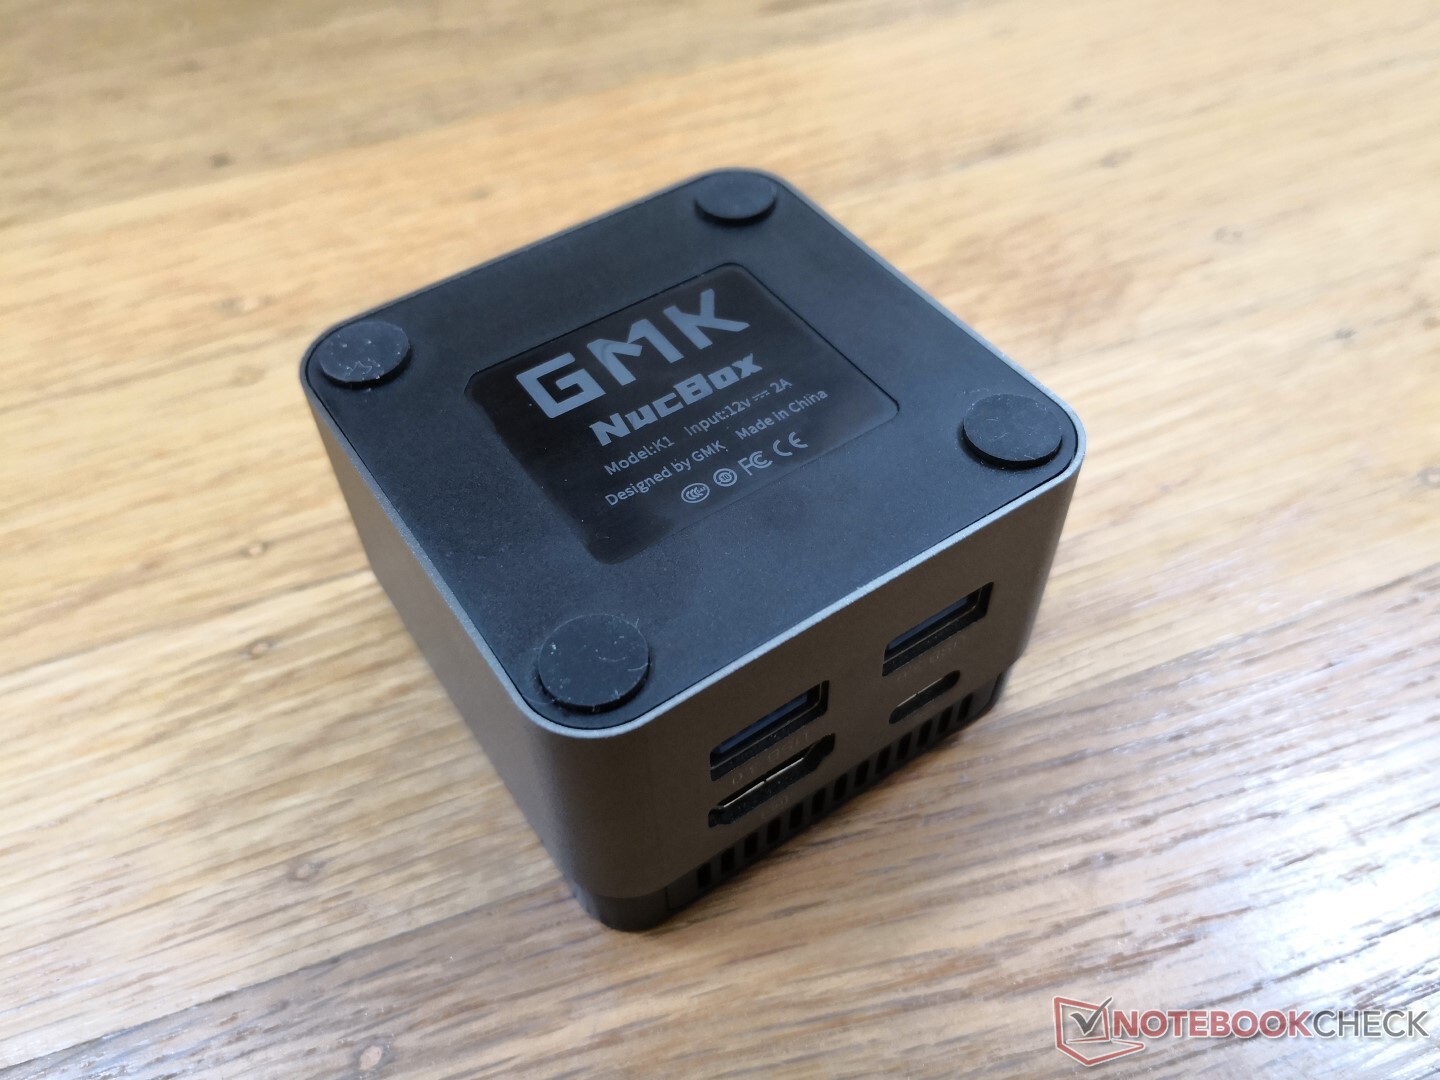
Case

Connectivity
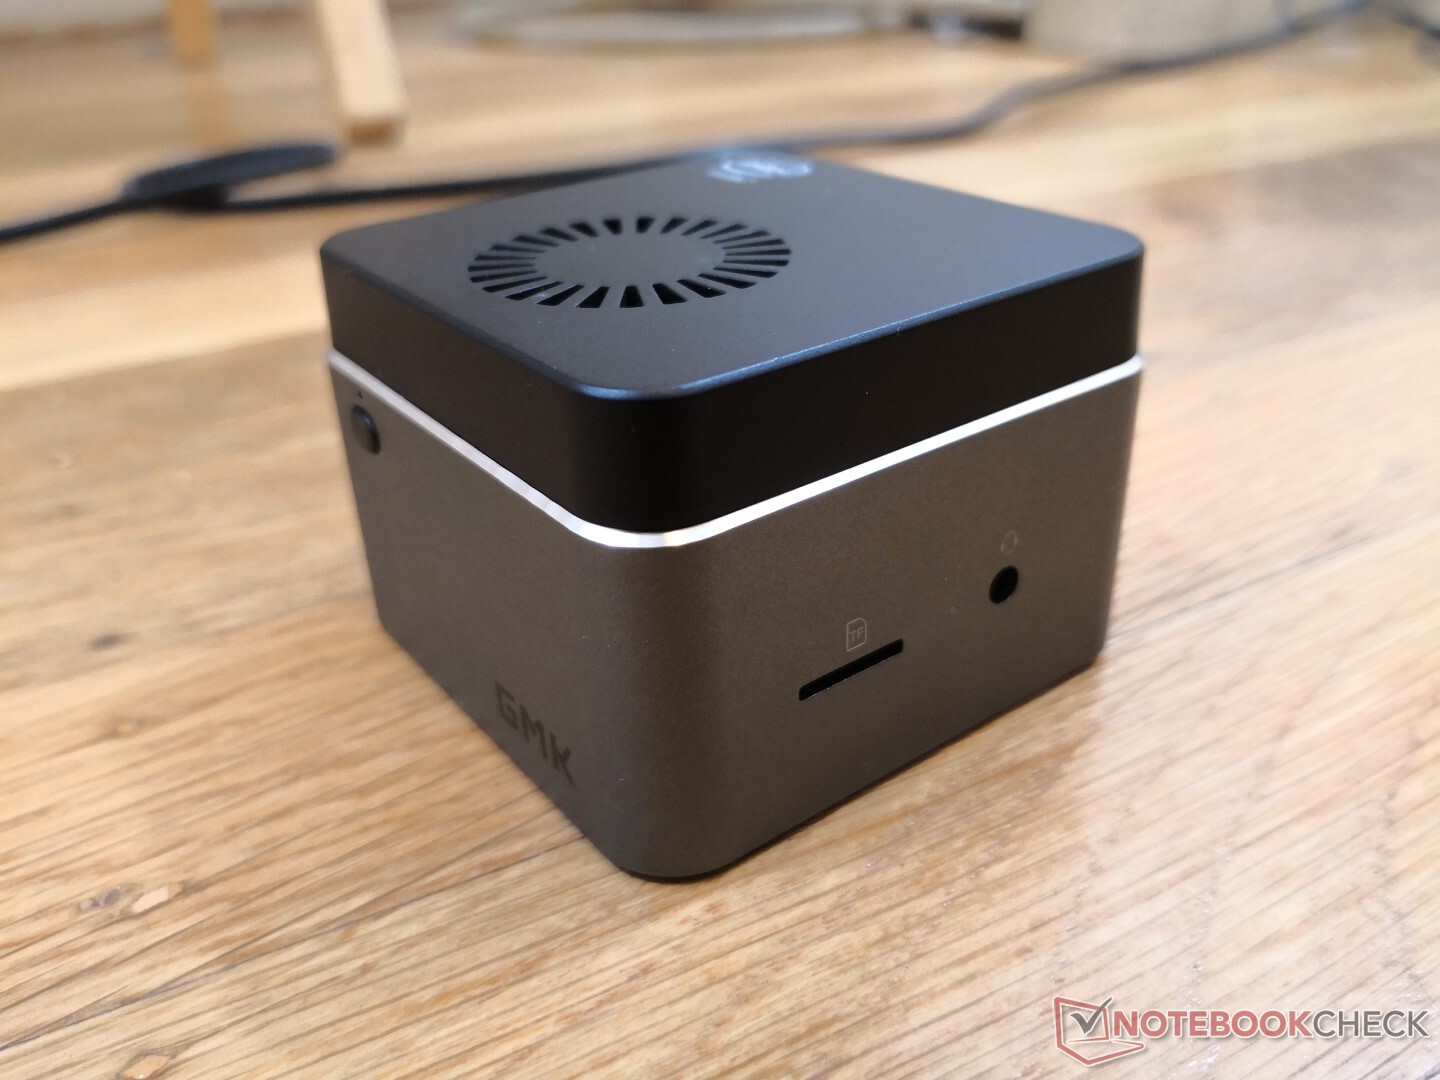
Port options are the same as on the Chuwi LarkBox. Unfortunately, the single USB-C port is used only for power which precludes the use of USB-C accessories. Attempting to expand this port via docking stations will not work.
SD Card Reader
Transfer rates from the integrated MicroSD card are similar to the LarkBox, but real-world performance can be slower depending on the sizes of the files being transferred. A fully inserted MicroSD card sits flush against the edge and can be difficult to eject.
| SD Card Reader | |
| average JPG Copy Test (av. of 3 runs) | |
| Chuwi LarkBox 4K Mini PC (Toshiba Exceria Pro M501 UHS-II) | |
| GMK NucBox K1 (Toshiba Exceria Pro M501 UHS-) | |
| Zotac ZBox MI643 (Toshiba Exceria Pro M501 UHS-II) | |
| Chuwi GBox CWI560 (Toshiba Exceria Pro M501 UHS-II) | |
| maximum AS SSD Seq Read Test (1GB) | |
| Chuwi LarkBox 4K Mini PC (Toshiba Exceria Pro M501 UHS-II) | |
| GMK NucBox K1 (Toshiba Exceria Pro M501 UHS-) | |
| Zotac ZBox MI643 (Toshiba Exceria Pro M501 UHS-II) | |
| Chuwi GBox CWI560 (Toshiba Exceria Pro M501 UHS-II) | |
Communication
While the integrated Intel 7265 is capable of transfer rates of up to 867 Mbps, real-world performance is much slower when connected to our Netgear RAX200 test router. We experienced constant random disconnects on our unit. Bluetooth 4.2 otherwise works as intended.
| Networking | |
| iperf3 transmit AX12 | |
| Beelink GTR35 II-G-16512D00W64PRO-1T | |
| Zotac ZBox MI643 | |
| Chuwi LarkBox 4K Mini PC | |
| GMK NucBox K1 | |
| iperf3 receive AX12 | |
| Beelink GTR35 II-G-16512D00W64PRO-1T | |
| GMK NucBox K1 | |
| Zotac ZBox MI643 | |
| Chuwi LarkBox 4K Mini PC | |
Maintenance
Accessories and Warranty
There are no extras in the box other than the AC adapter and paperwork. Claiming warranty will also be tricky as it may involve overseas shipping for many buyers.
Performance
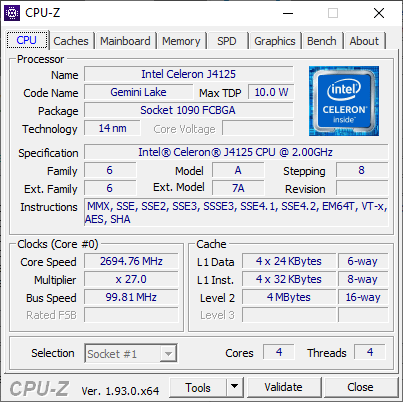
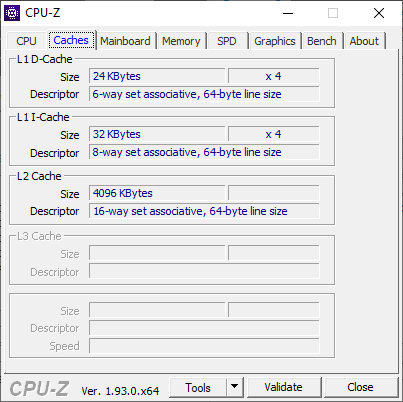


Processor
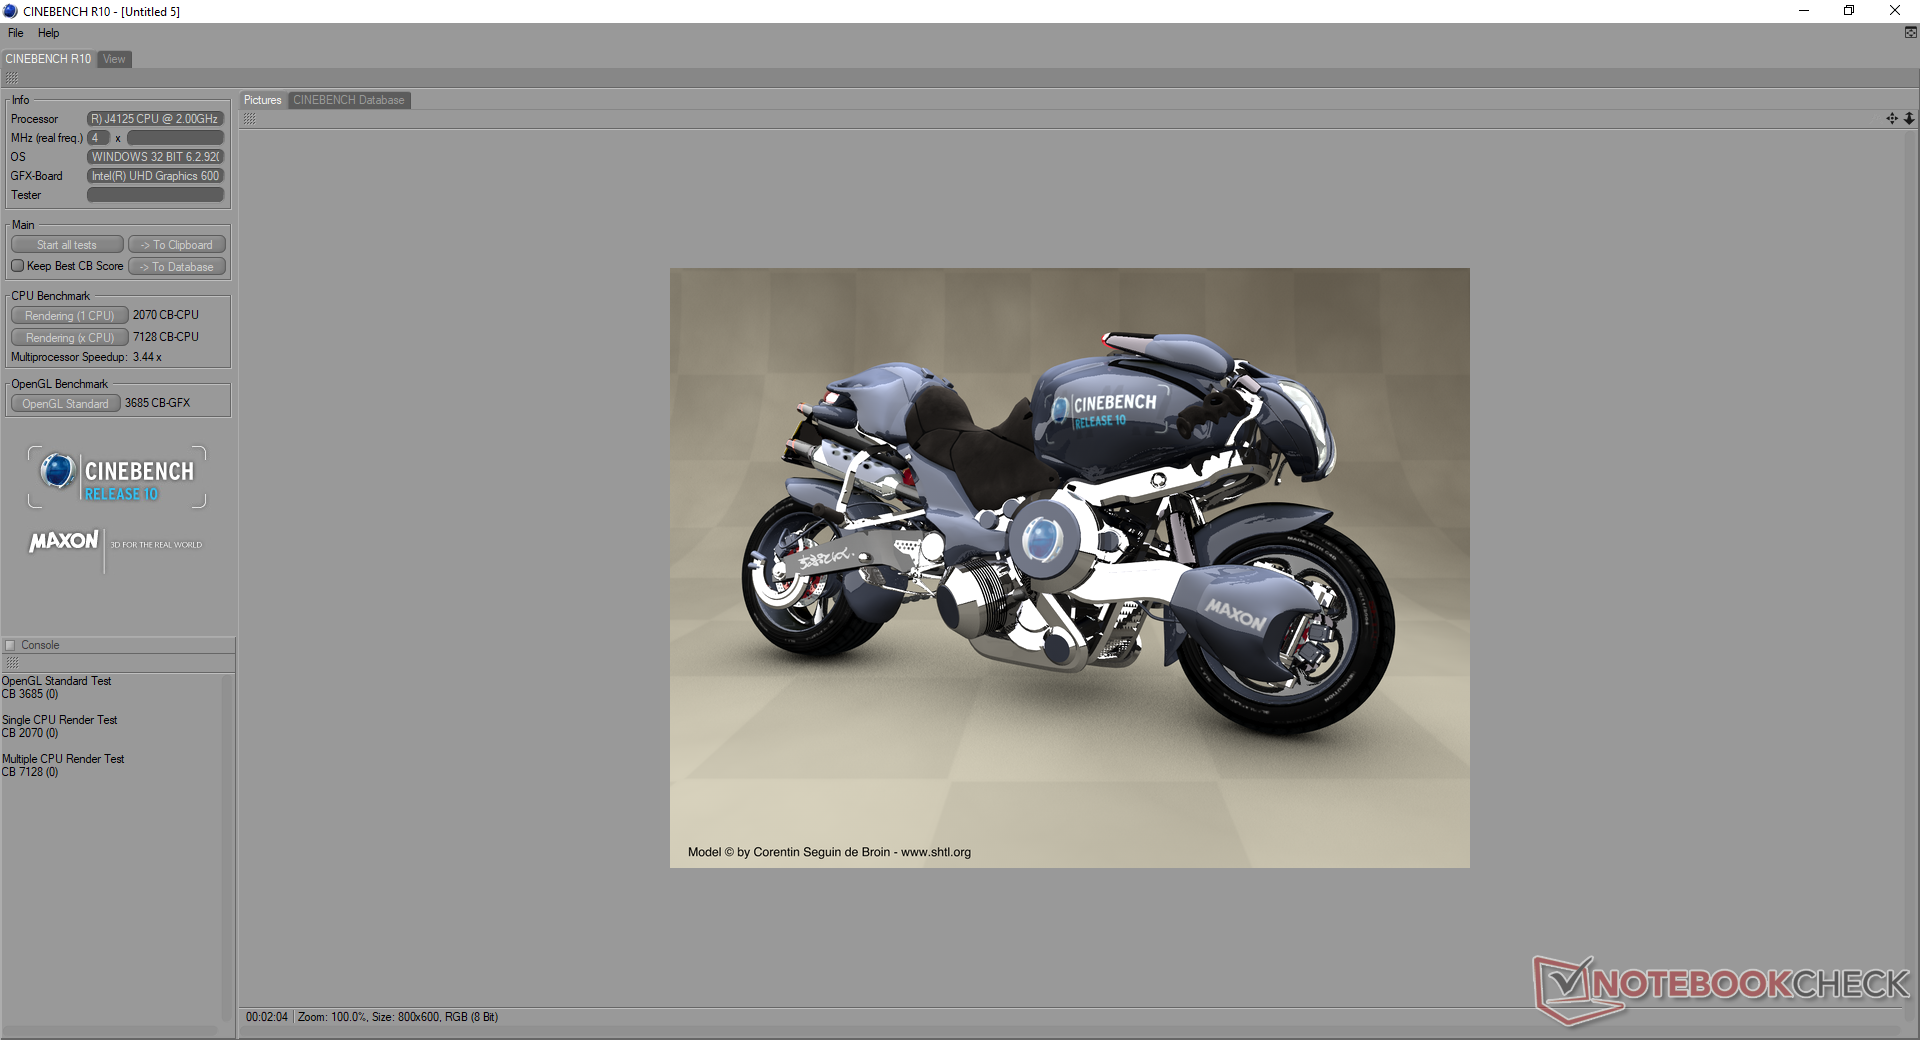
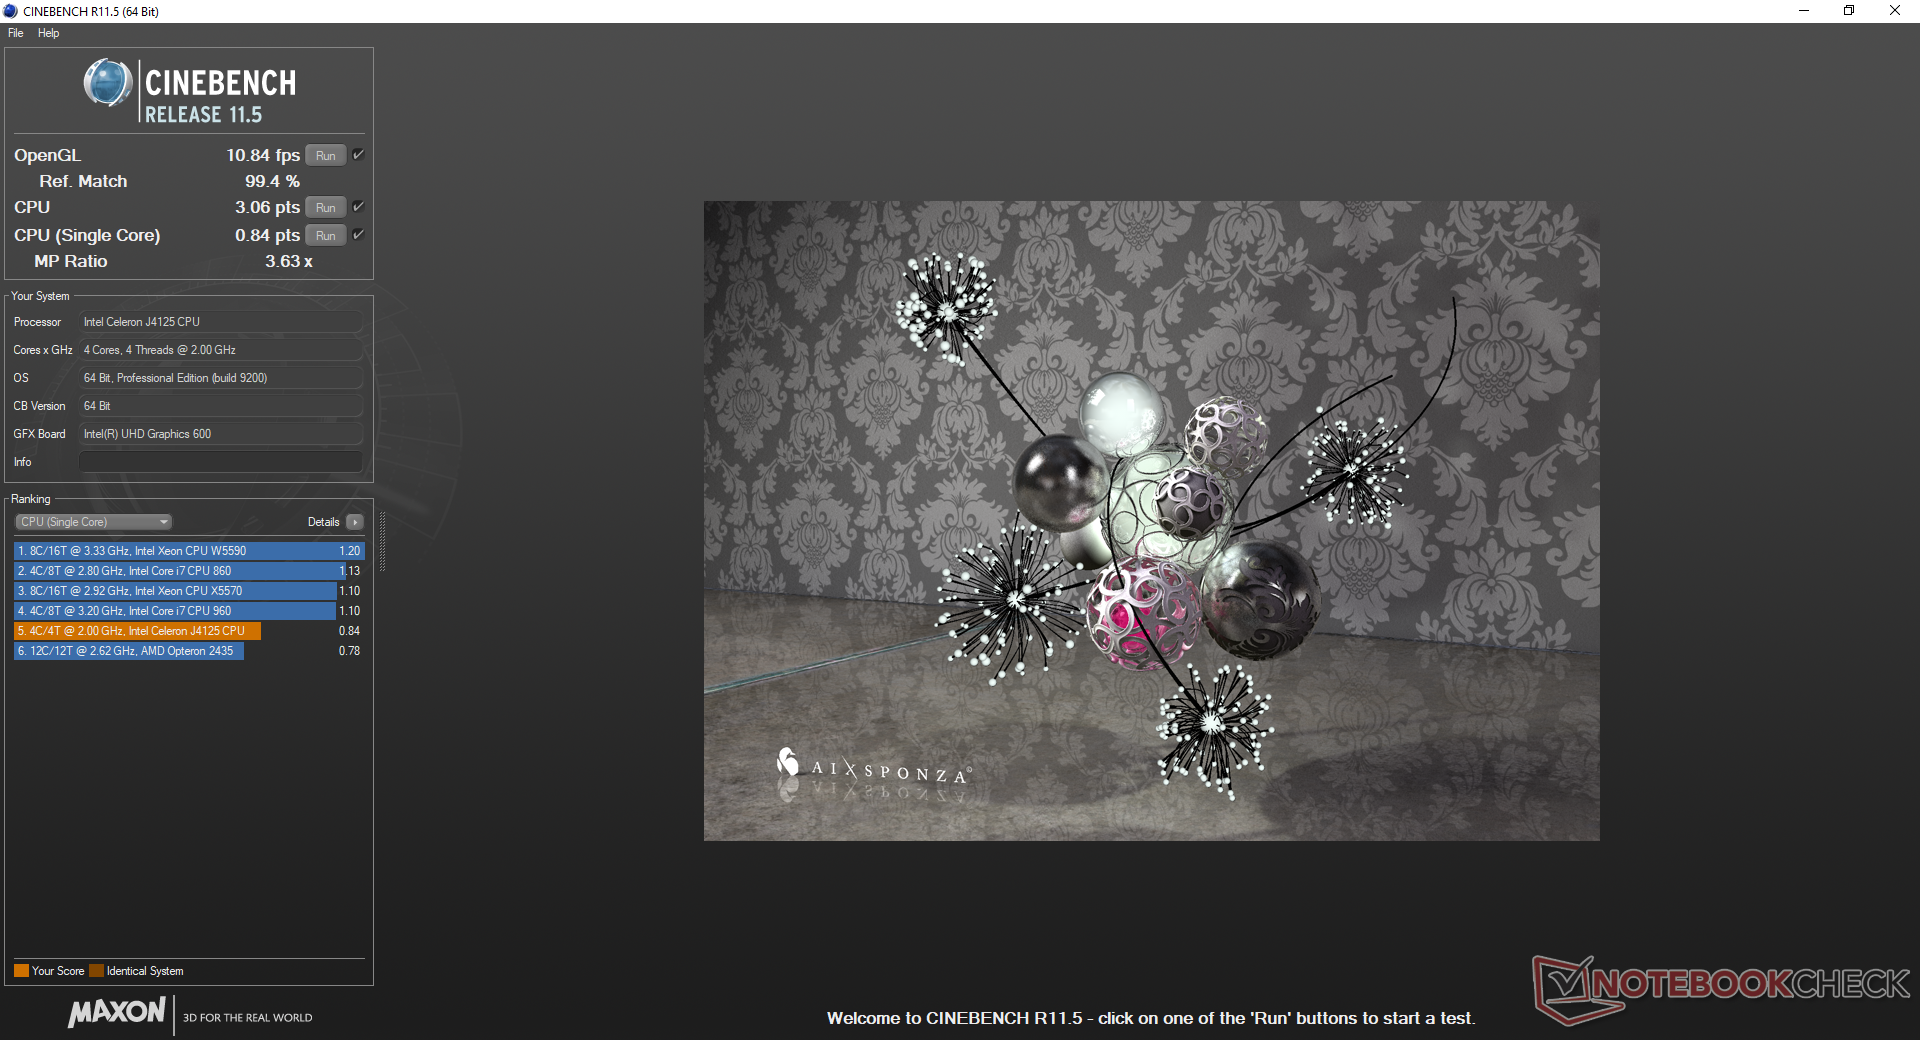
The quad-core Celeron J4125 is clocked 200 MHz faster than the Celeron J4115 in the LarkBox (2.0 - 2.7 GHz vs. 1.8 GHz - 2.5 GHz). In practice, benchmarks rank our J4125 slightly slower likely due to the poor implementation by GMK. Overall performance is not all that different from the older Celeron N4100.
See our dedicated page on the Celeron J4125 for more technical information and benchmark comparisons.
Cinebench R20: CPU (Multi Core) | CPU (Single Core)
Blender: v2.79 BMW27 CPU
7-Zip 18.03: 7z b 4 -mmt1 | 7z b 4
Geekbench 5.5: Single-Core | Multi-Core
HWBOT x265 Benchmark v2.2: 4k Preset
LibreOffice : 20 Documents To PDF
R Benchmark 2.5: Overall mean
| LibreOffice / 20 Documents To PDF | |
| Chuwi Hi10 X | |
| LincPlus P1 | |
| Chuwi LarkBox 4K Mini PC | |
| GMK NucBox K1 | |
| Apple MacBook Air 2020 i3 | |
| Beelink GTR35 II-G-16512D00W64PRO-1T | |
| Zotac ZBox MI643 | |
| Lenovo IdeaPad 3 14IIL05 | |
| R Benchmark 2.5 / Overall mean | |
| Chuwi Hi10 X | |
| LincPlus P1 | |
| GMK NucBox K1 | |
| Apple MacBook Air 2020 i3 | |
| Lenovo IdeaPad 3 14IIL05 | |
| Beelink GTR35 II-G-16512D00W64PRO-1T | |
| Intel NUC10i5FNK | |
| Zotac ZBox MI643 | |
Cinebench R20: CPU (Multi Core) | CPU (Single Core)
Blender: v2.79 BMW27 CPU
7-Zip 18.03: 7z b 4 -mmt1 | 7z b 4
Geekbench 5.5: Single-Core | Multi-Core
HWBOT x265 Benchmark v2.2: 4k Preset
LibreOffice : 20 Documents To PDF
R Benchmark 2.5: Overall mean
* ... smaller is better
System Performance
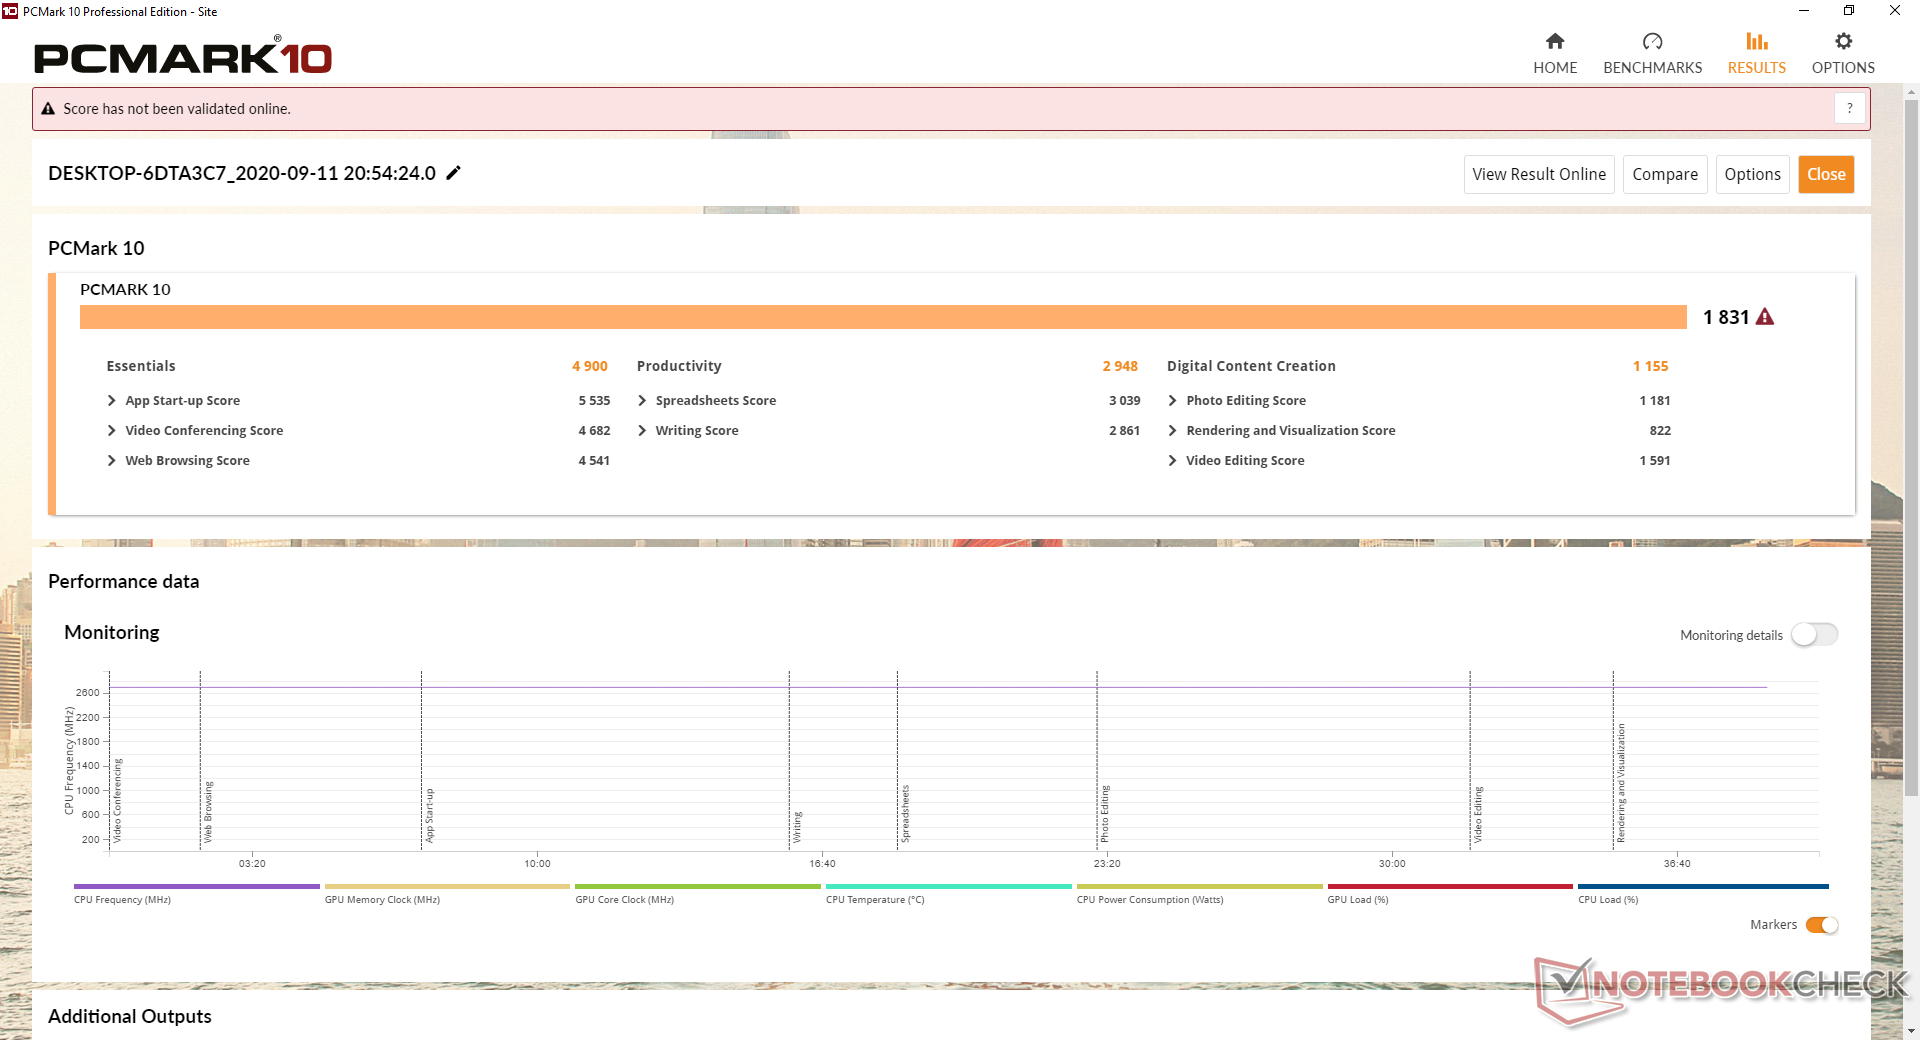
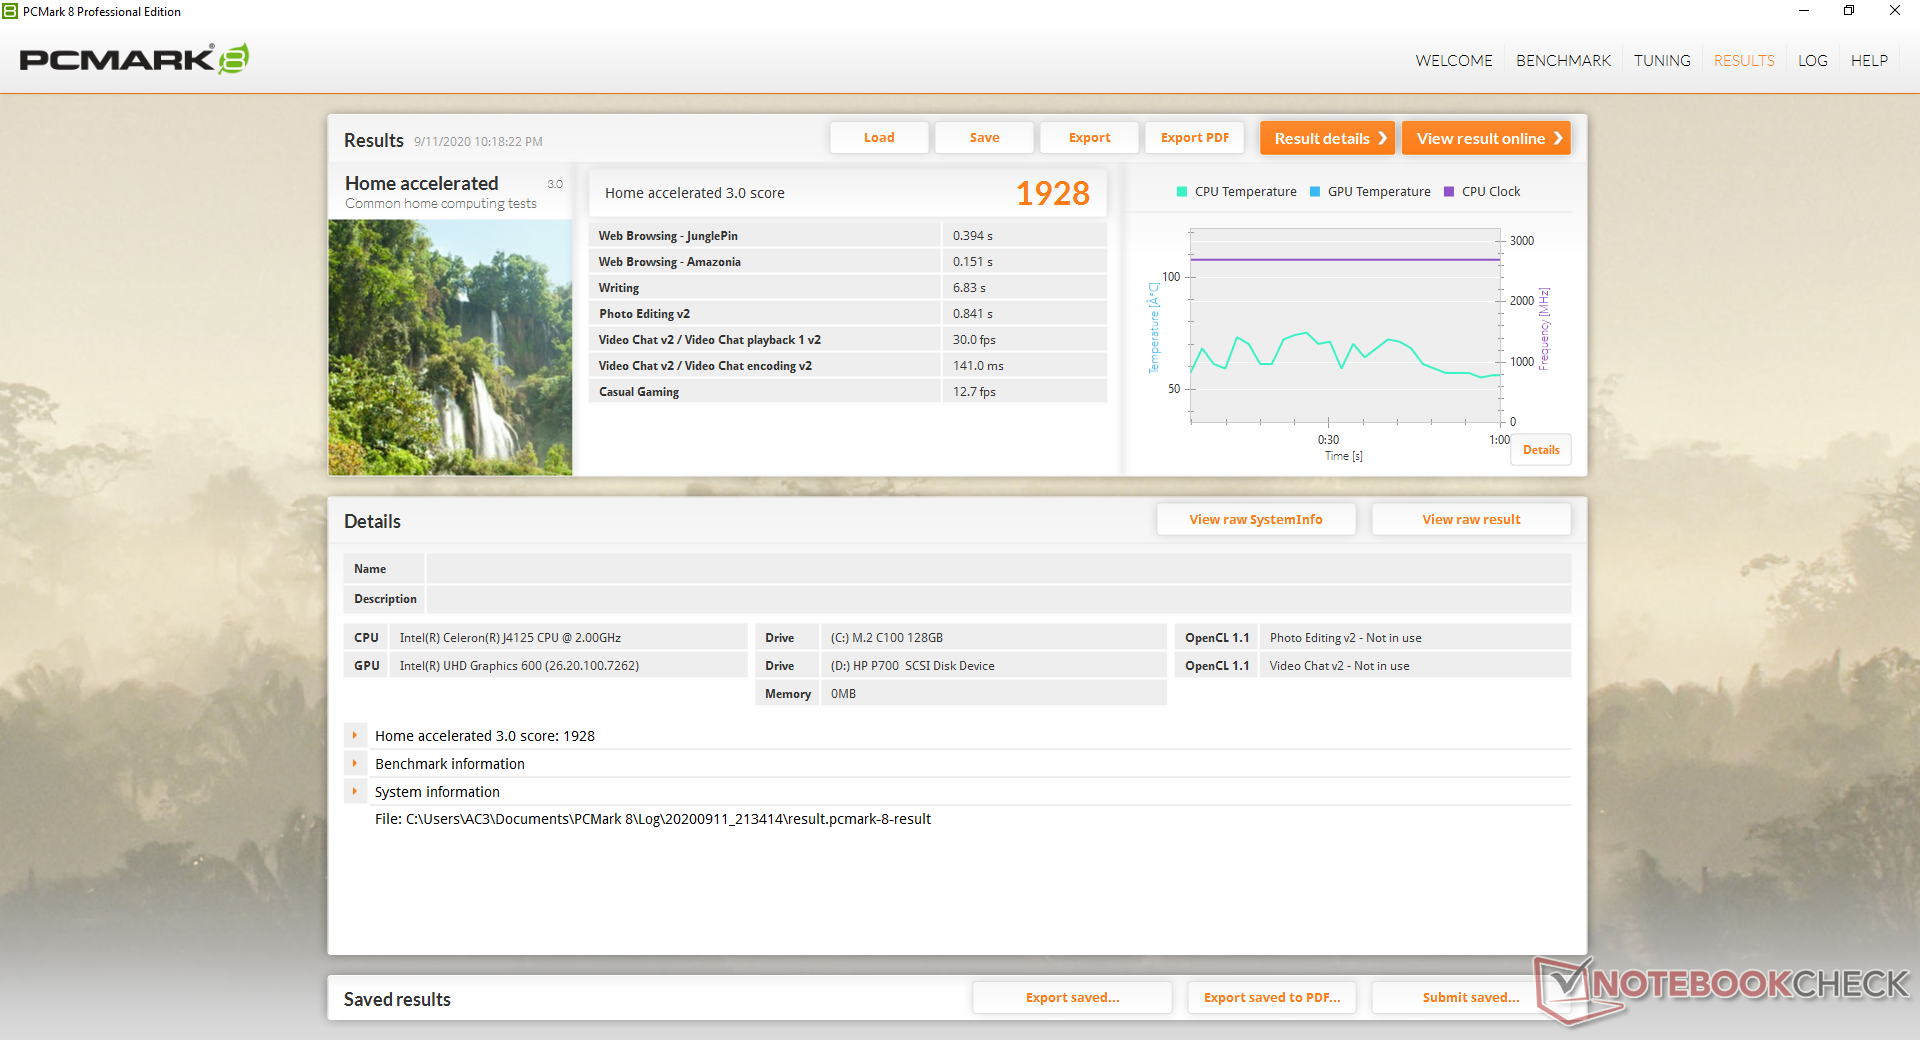
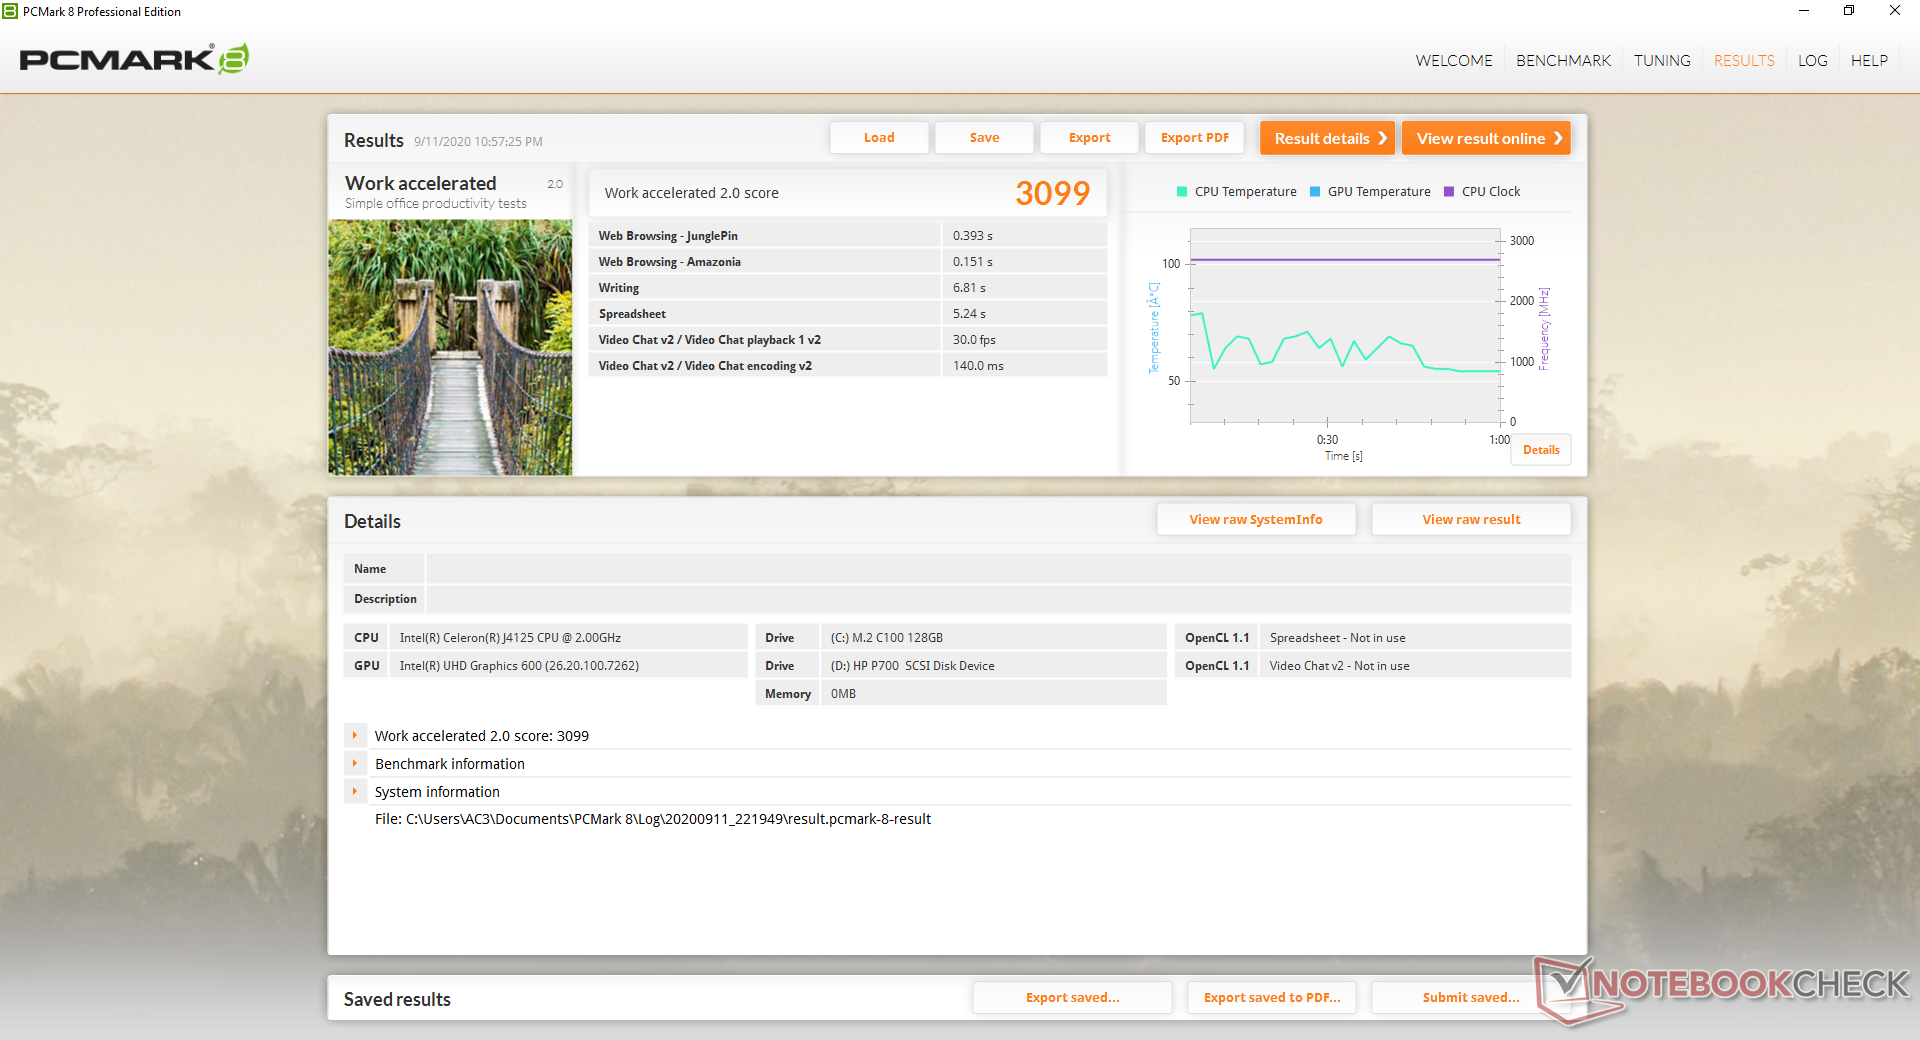
PCMark benchmarks are again very similar to the LarkBox and well below any Core i3-powered alternative.
| PCMark 8 | |
| Home Score Accelerated v2 | |
| Zotac ZBox MI643 | |
| Intel NUC10i5FNK | |
| Chuwi GBox CWI560 | |
| Chuwi LarkBox 4K Mini PC | |
| GMK NucBox K1 | |
| Work Score Accelerated v2 | |
| Zotac ZBox MI643 | |
| Intel NUC10i5FNK | |
| Chuwi LarkBox 4K Mini PC | |
| GMK NucBox K1 | |
| PCMark 8 Home Score Accelerated v2 | 1928 points | |
| PCMark 8 Work Score Accelerated v2 | 3099 points | |
| PCMark 10 Score | 1831 points | |
Help | ||
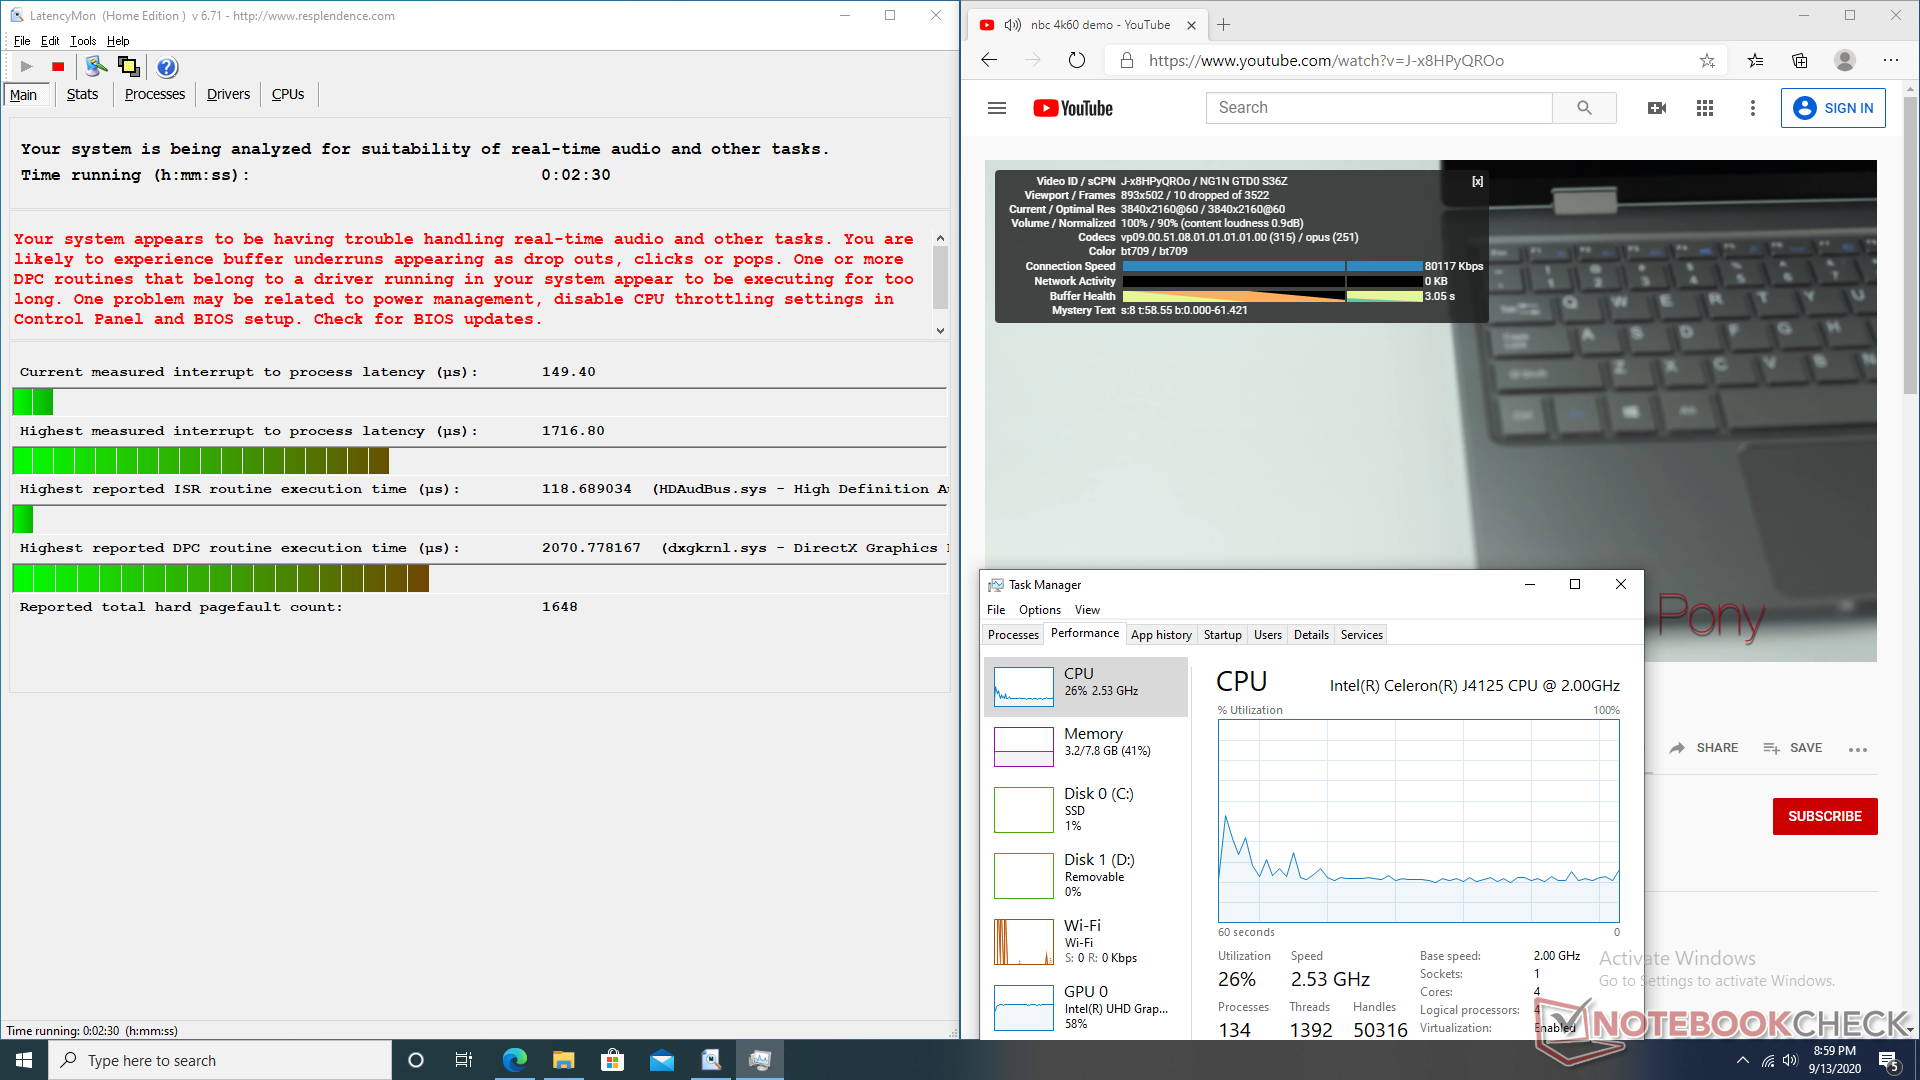
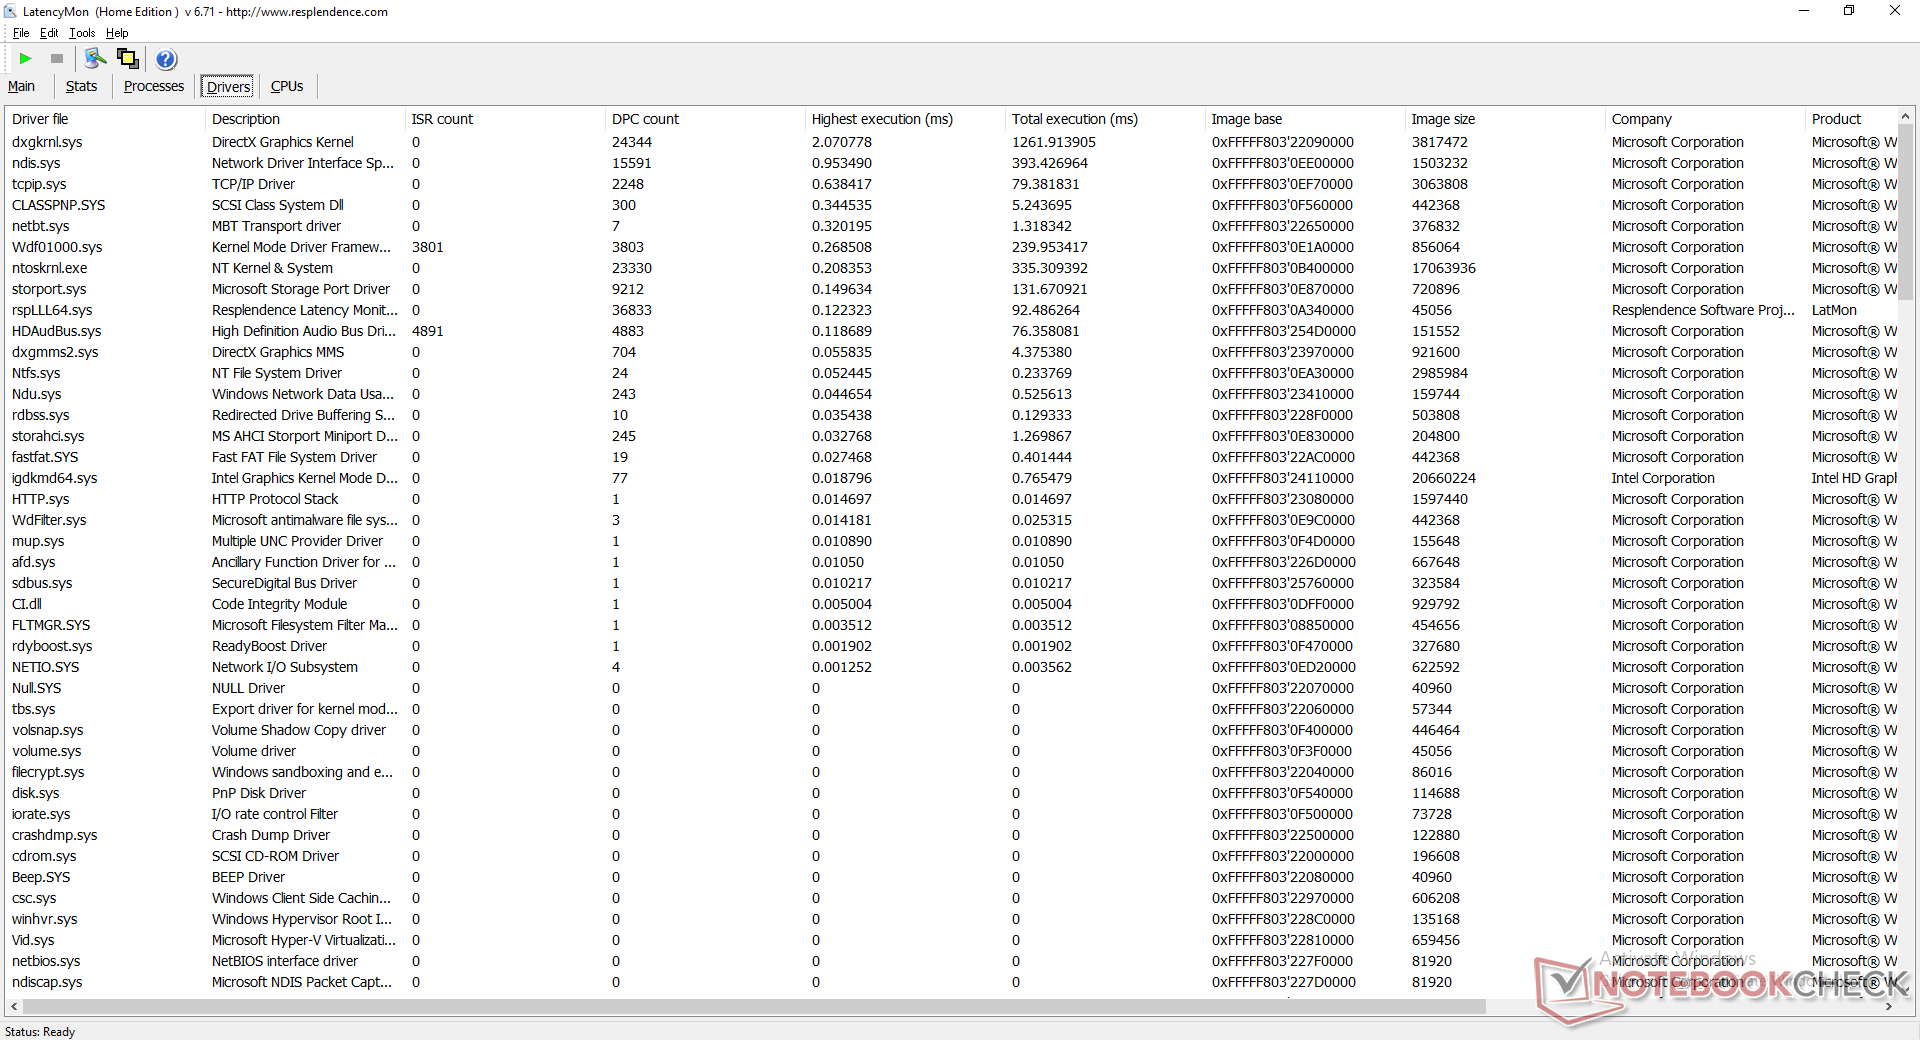
DPC Latency
LatencyMon shows DPC latency issues when opening multiple tabs on our homepage. 4K60 playback is not perfect either with 10 dropped frames during our minute-long YouTube test.
| DPC Latencies / LatencyMon - interrupt to process latency (max), Web, Youtube, Prime95 | |
| Chuwi Hi10 X | |
| GMK NucBox K1 | |
| Chuwi LarkBox 4K Mini PC | |
| Zotac ZBox MI643 | |
| Beelink GTR35 II-G-16512D00W64PRO-1T | |
| Lenovo IdeaPad 3 14IIL05 | |
* ... smaller is better
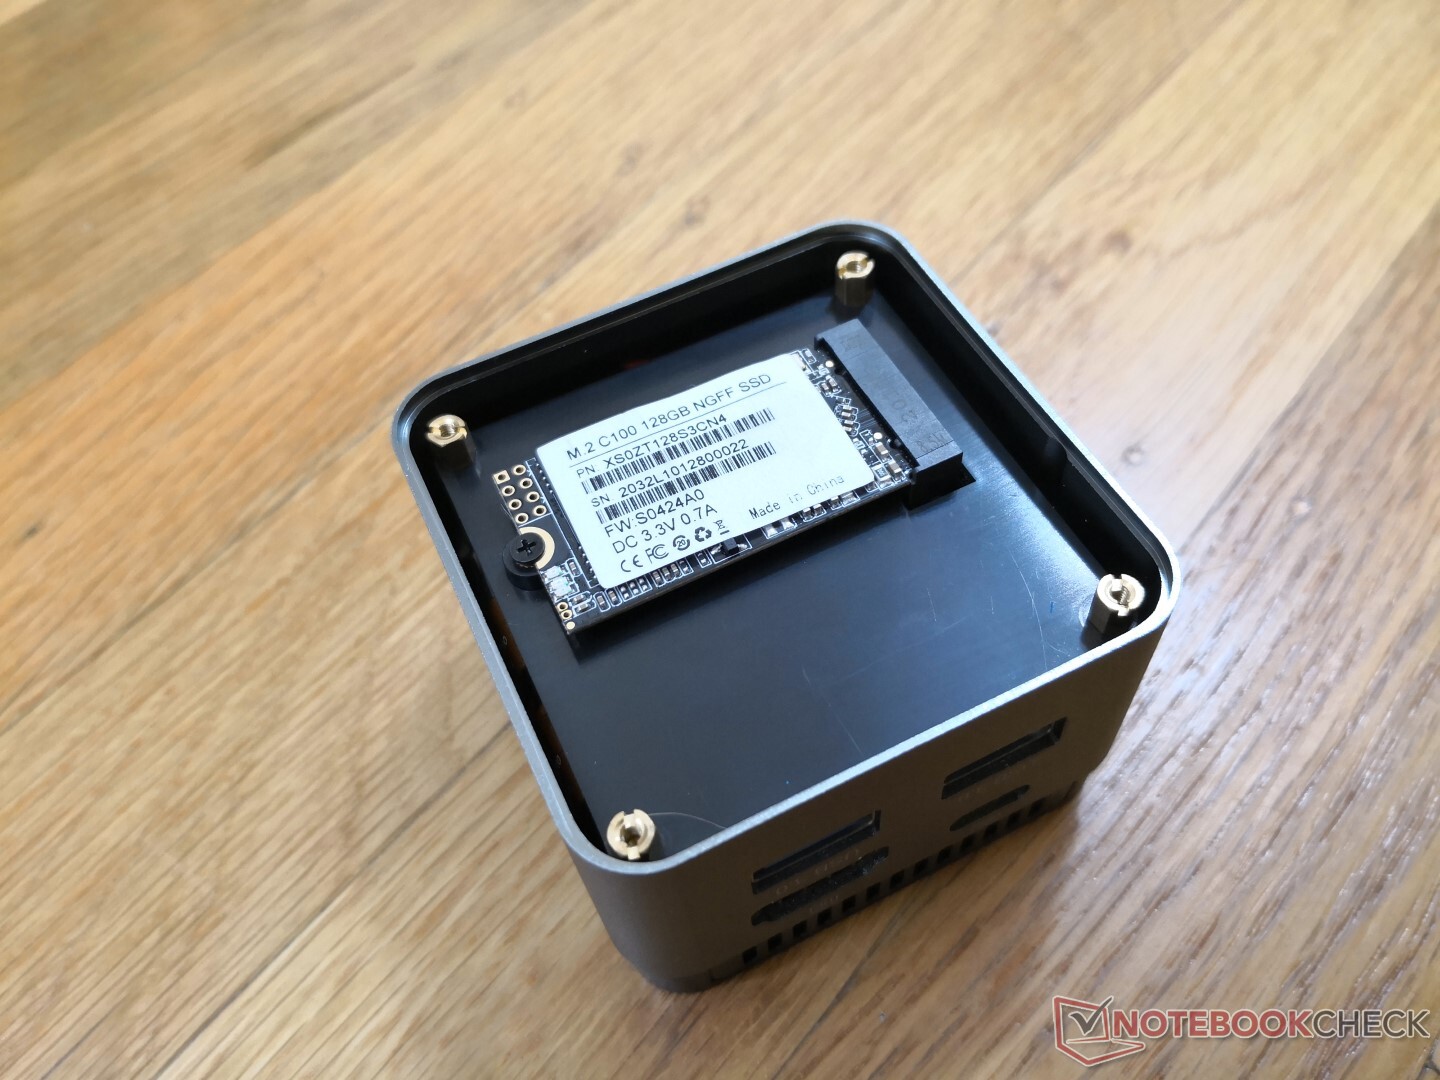
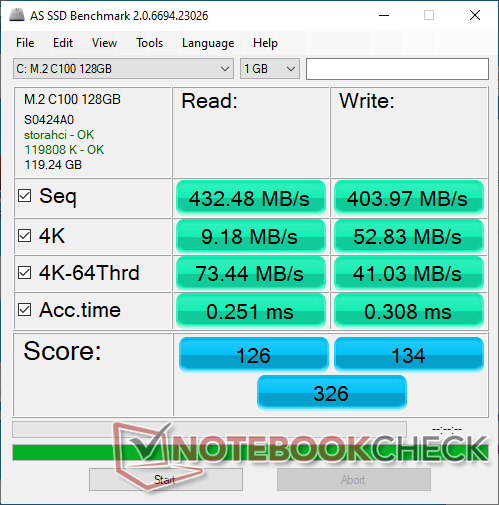
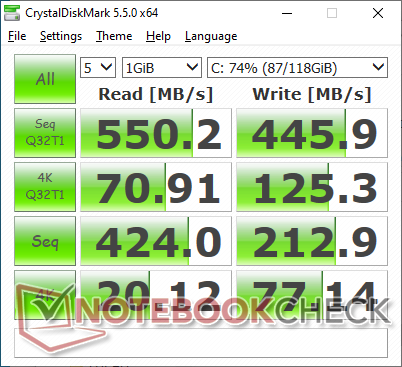
Storage Devices
Our unit comes with a 128 GB HIKVISION C100 M.2 SATA III SSD. The drive is removable and can be replaced with another M.2 2242 SSD if desired. Transfer rates are faster than many embedded solutions like the ones in the Chuwi LarkBox or GBox, but copy rates are still very slow.
| GMK NucBox K1 HIKVision C100 NGFF SSD 128GB | Zotac ZBox MI643 Lexar NM610 1TB | Chuwi LarkBox 4K Mini PC 128 GB eMMC Flash | Intel NUC10i5FNK Kingston RBUSNS8154P3256GJ1 | Lenovo ThinkCentre M90n-1 Nano Samsung SSD PM981 MZVLB512HAJQ | Chuwi GBox CWI560 SanDisk DA4064 | |
|---|---|---|---|---|---|---|
| AS SSD | 802% | 2% | 533% | 623% | ||
| Seq Read (MB/s) | 432.5 | 1511 249% | 286 -34% | 1318 205% | 1668 286% | |
| Seq Write (MB/s) | 404 | 1558 286% | 106.9 -74% | 616 52% | 1150 185% | |
| 4K Read (MB/s) | 9.18 | 43.77 377% | 15.22 66% | 26.44 188% | 48.46 428% | |
| 4K Write (MB/s) | 52.8 | 119.5 126% | 21.59 -59% | 61.3 16% | 116.5 121% | |
| 4K-64 Read (MB/s) | 73.4 | 839 1043% | 16.8 -77% | 650 786% | 726 889% | |
| 4K-64 Write (MB/s) | 41.03 | 909 2115% | 20.03 -51% | 642 1465% | 1074 2518% | |
| Access Time Read * (ms) | 0.251 | 0.032 87% | 0.254 -1% | 0.11 56% | 0.039 84% | |
| Access Time Write * (ms) | 0.308 | 0.242 21% | 0.406 -32% | 0.07 77% | 0.032 90% | |
| Score Read (Points) | 126 | 1034 721% | 61 -52% | 808 541% | 942 648% | |
| Score Write (Points) | 134 | 1185 784% | 52 -61% | 765 471% | 1305 874% | |
| Score Total (Points) | 326 | 2760 747% | 142 -56% | 1955 500% | 2716 733% | |
| Copy ISO MB/s (MB/s) | 54.9 | 1373 2401% | 107.3 95% | 576 949% | ||
| Copy Program MB/s (MB/s) | 52.3 | 280.4 436% | 92.6 77% | 328.9 529% | ||
| Copy Game MB/s (MB/s) | 27.38 | 531 1839% | 104.7 282% | 471.2 1621% | ||
| CrystalDiskMark 5.2 / 6 | 320% | -57% | 171% | 317% | -36% | |
| Write 4K (MB/s) | 77.1 | 214.1 178% | 26.02 -66% | 58.4 -24% | 130 69% | 38 -51% |
| Read 4K (MB/s) | 20.12 | 62.1 209% | 16.33 -19% | 30.24 50% | 45.61 127% | 23.84 18% |
| Write Seq (MB/s) | 212.9 | 1664 682% | 109.5 -49% | 773 263% | 226.7 6% | |
| Read Seq (MB/s) | 424 | 1797 324% | 334.3 -21% | 712 68% | 271.8 -36% | |
| Write 4K Q32T1 (MB/s) | 123.5 | 421.8 242% | 28.76 -77% | 448.5 263% | 365.3 196% | 44.74 -64% |
| Read 4K Q32T1 (MB/s) | 70.9 | 512 622% | 17.41 -75% | 391.4 452% | 350.2 394% | 53.2 -25% |
| Write Seq Q32T1 (MB/s) | 445.9 | 564 26% | 59 -87% | 914 105% | 2986 570% | 129.4 -71% |
| Read Seq Q32T1 (MB/s) | 550 | 2073 277% | 218.8 -60% | 1583 188% | 3565 548% | 189.4 -66% |
| Write 4K Q8T8 (MB/s) | 402.3 | 368.7 | ||||
| Read 4K Q8T8 (MB/s) | 680 | 790 | ||||
| Total Average (Program / Settings) | 561% /
627% | -28% /
-20% | 352% /
401% | 470% /
515% | -36% /
-36% |
* ... smaller is better

Disk Throttling: DiskSpd Read Loop, Queue Depth 8
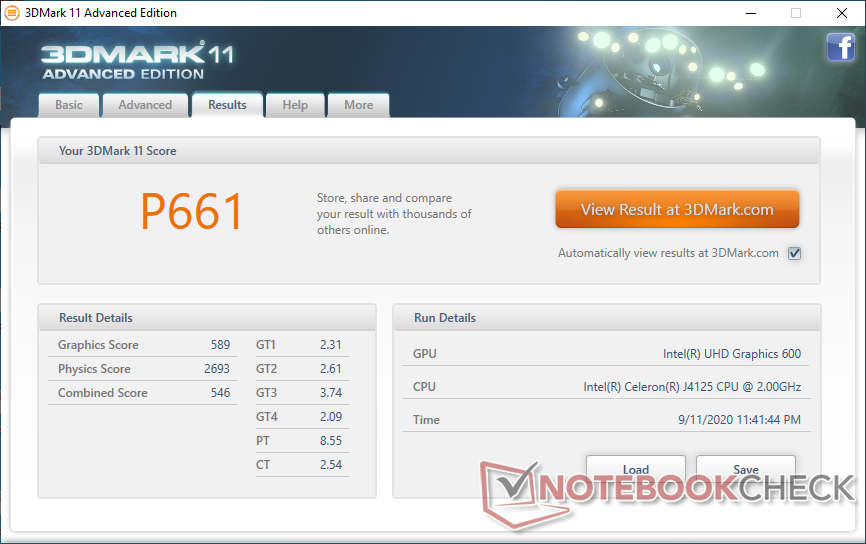
GPU Performance
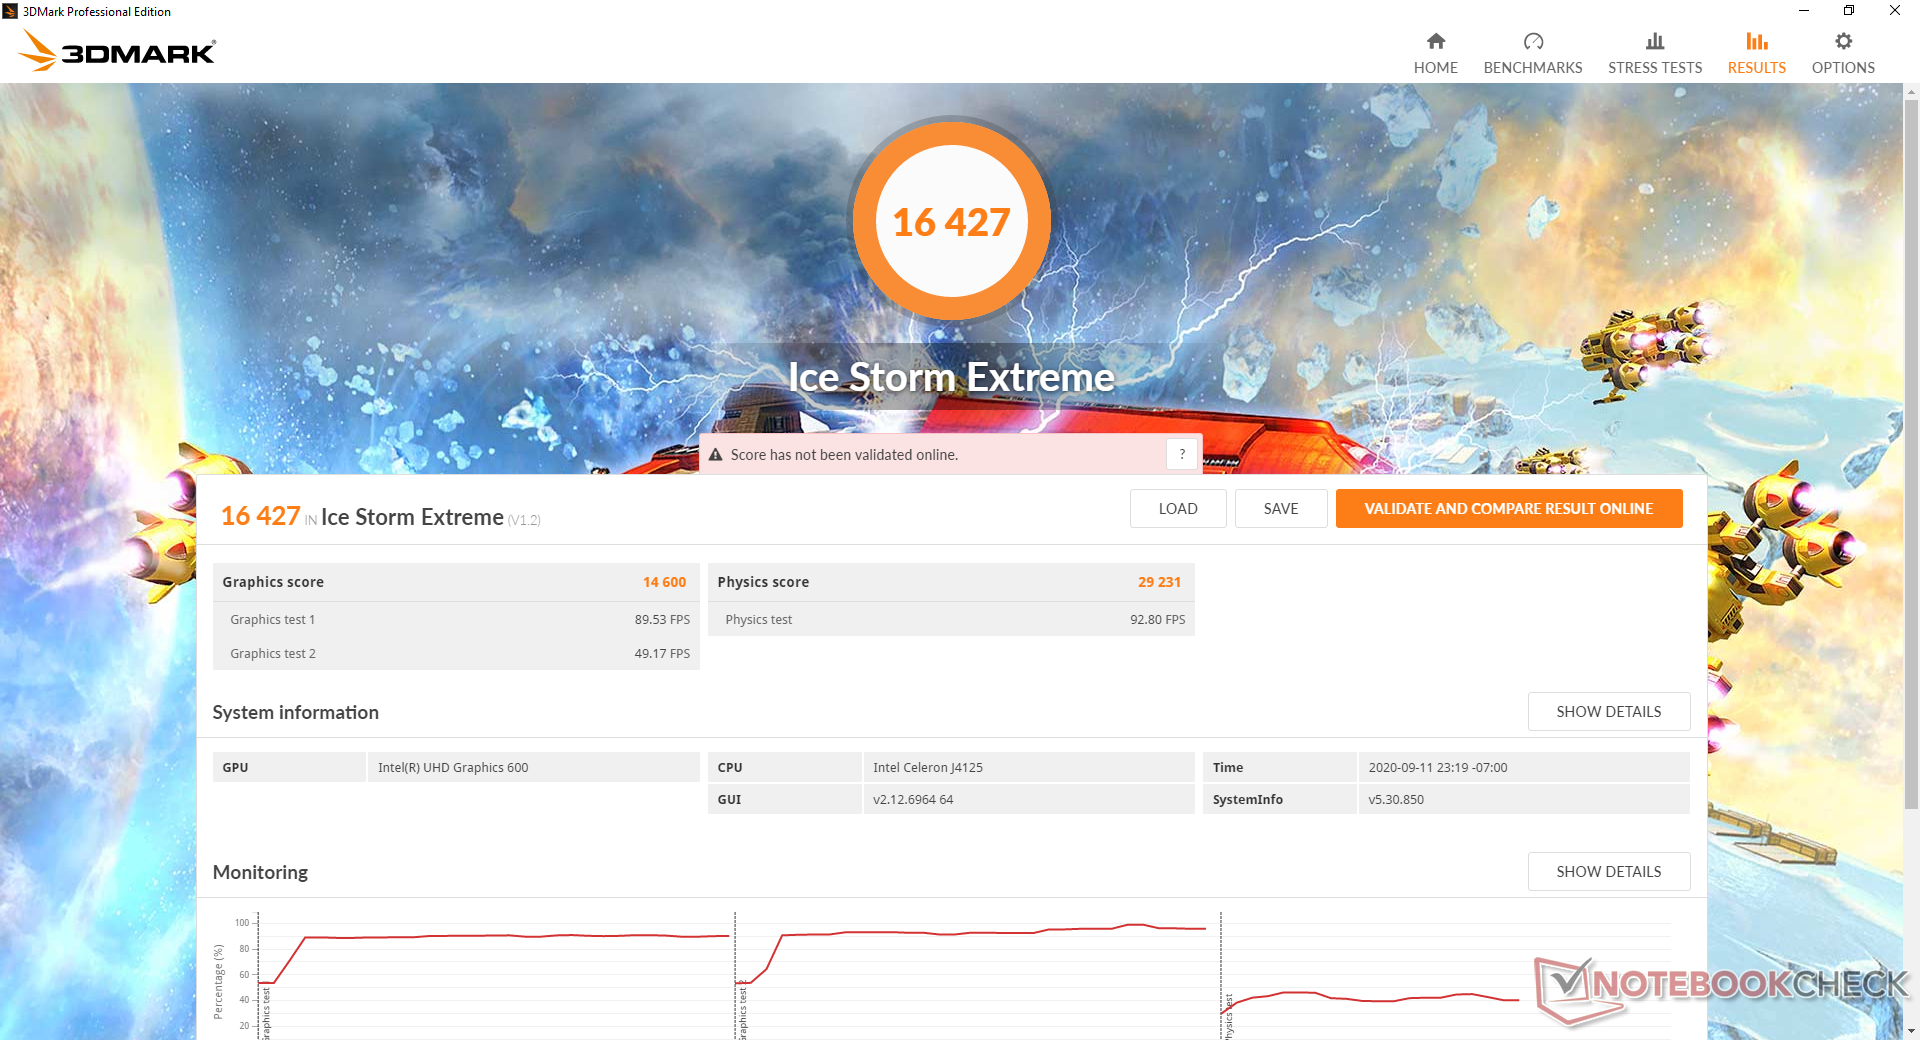
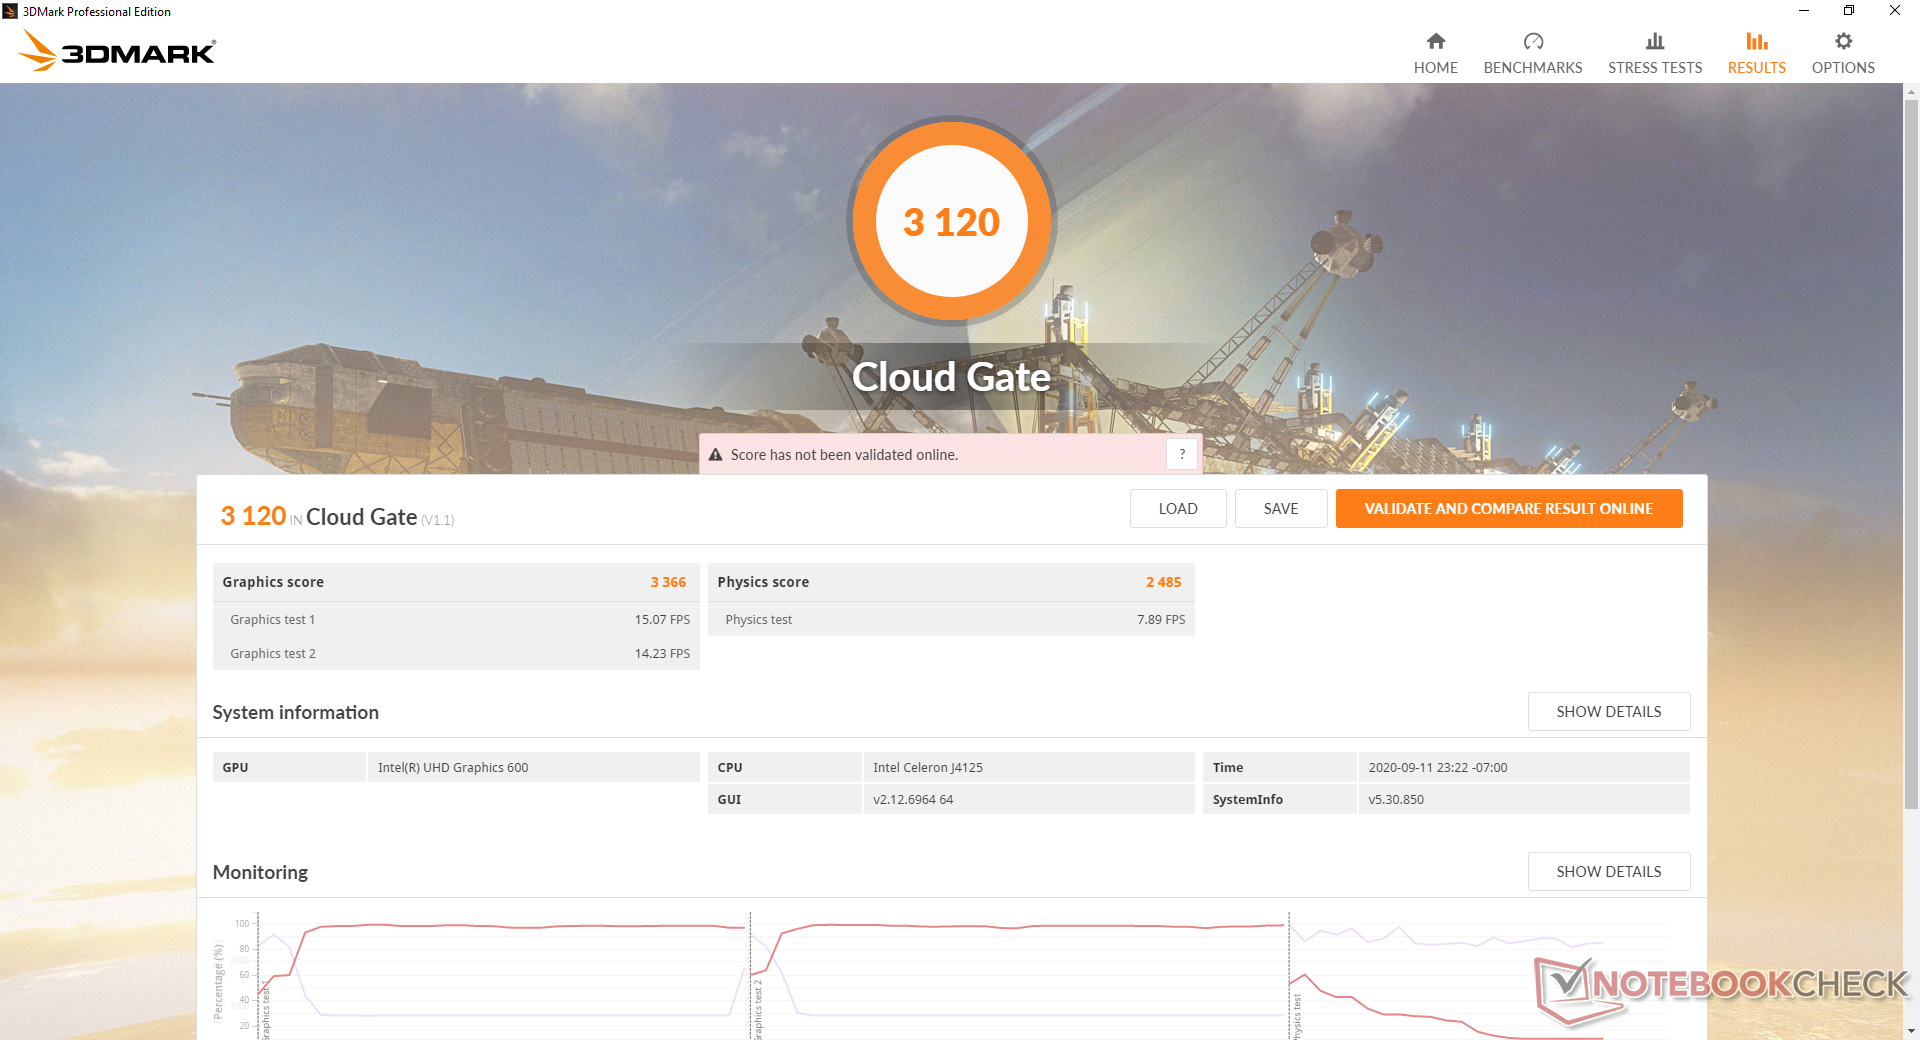
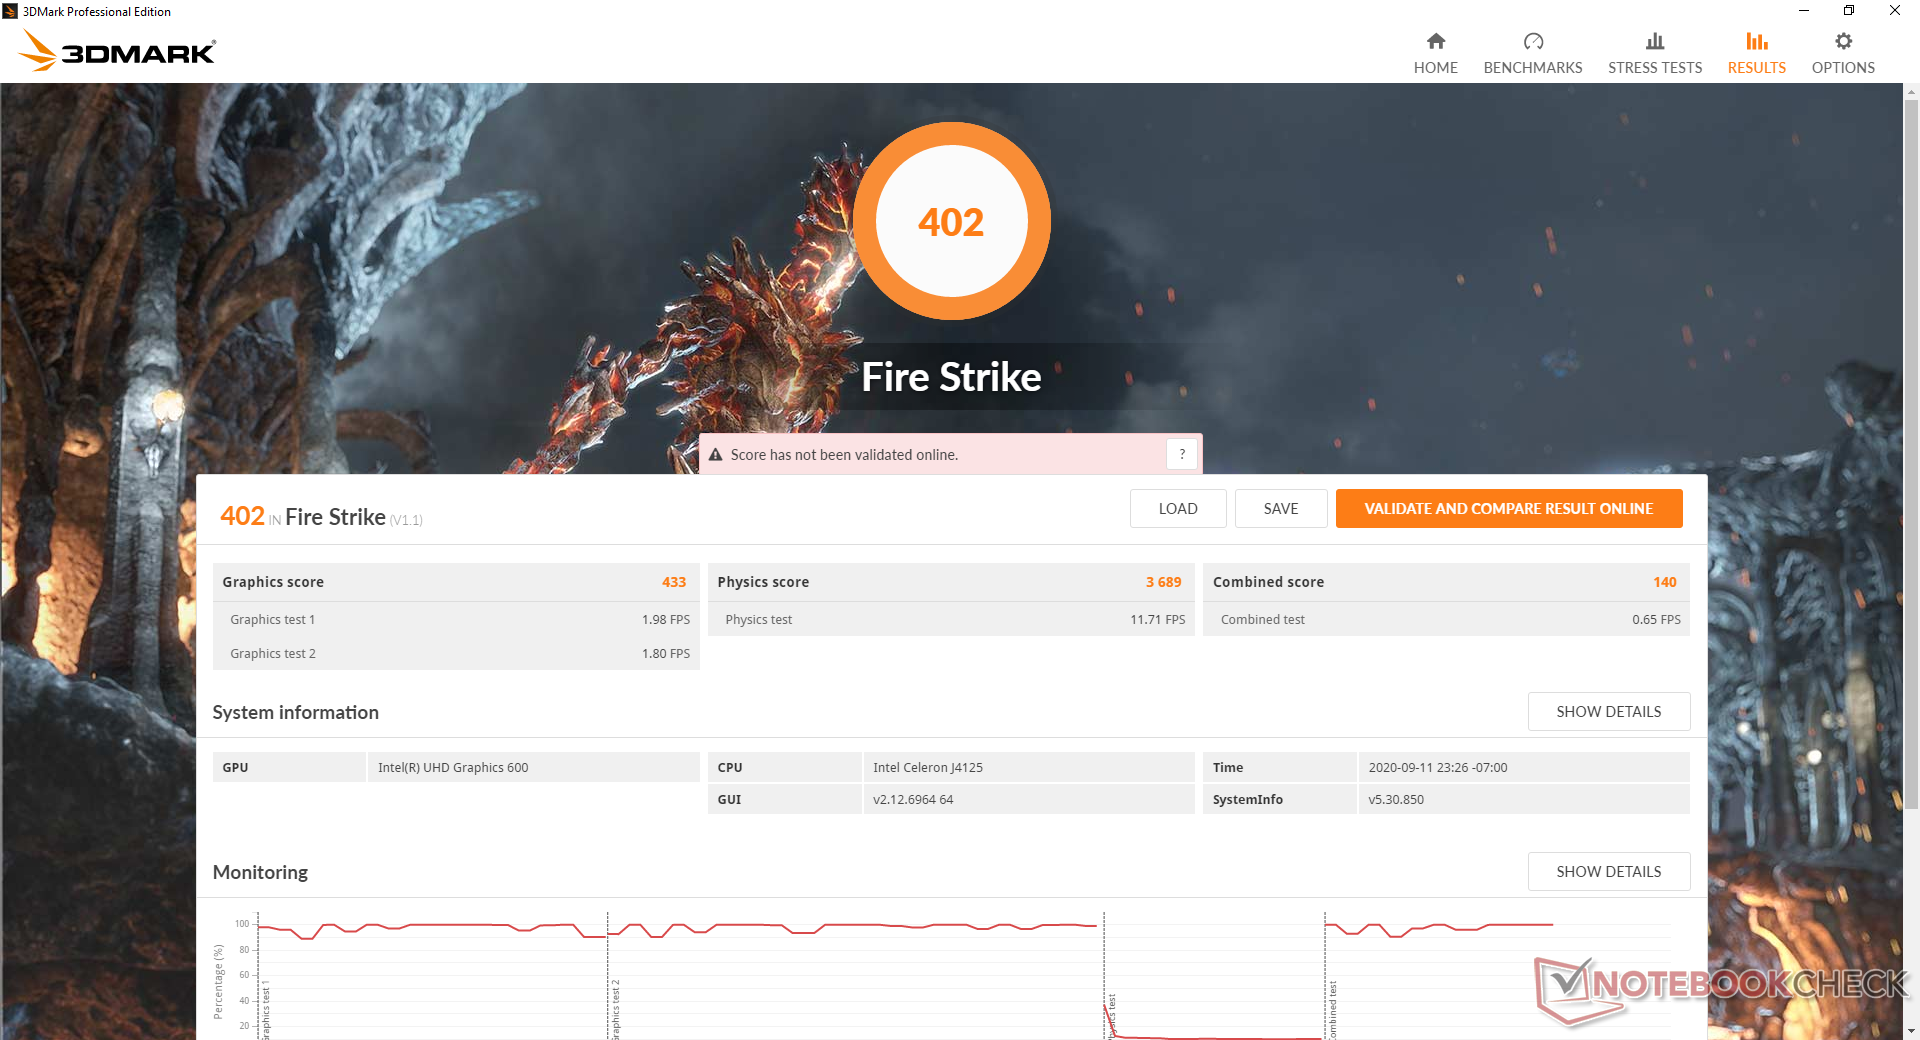
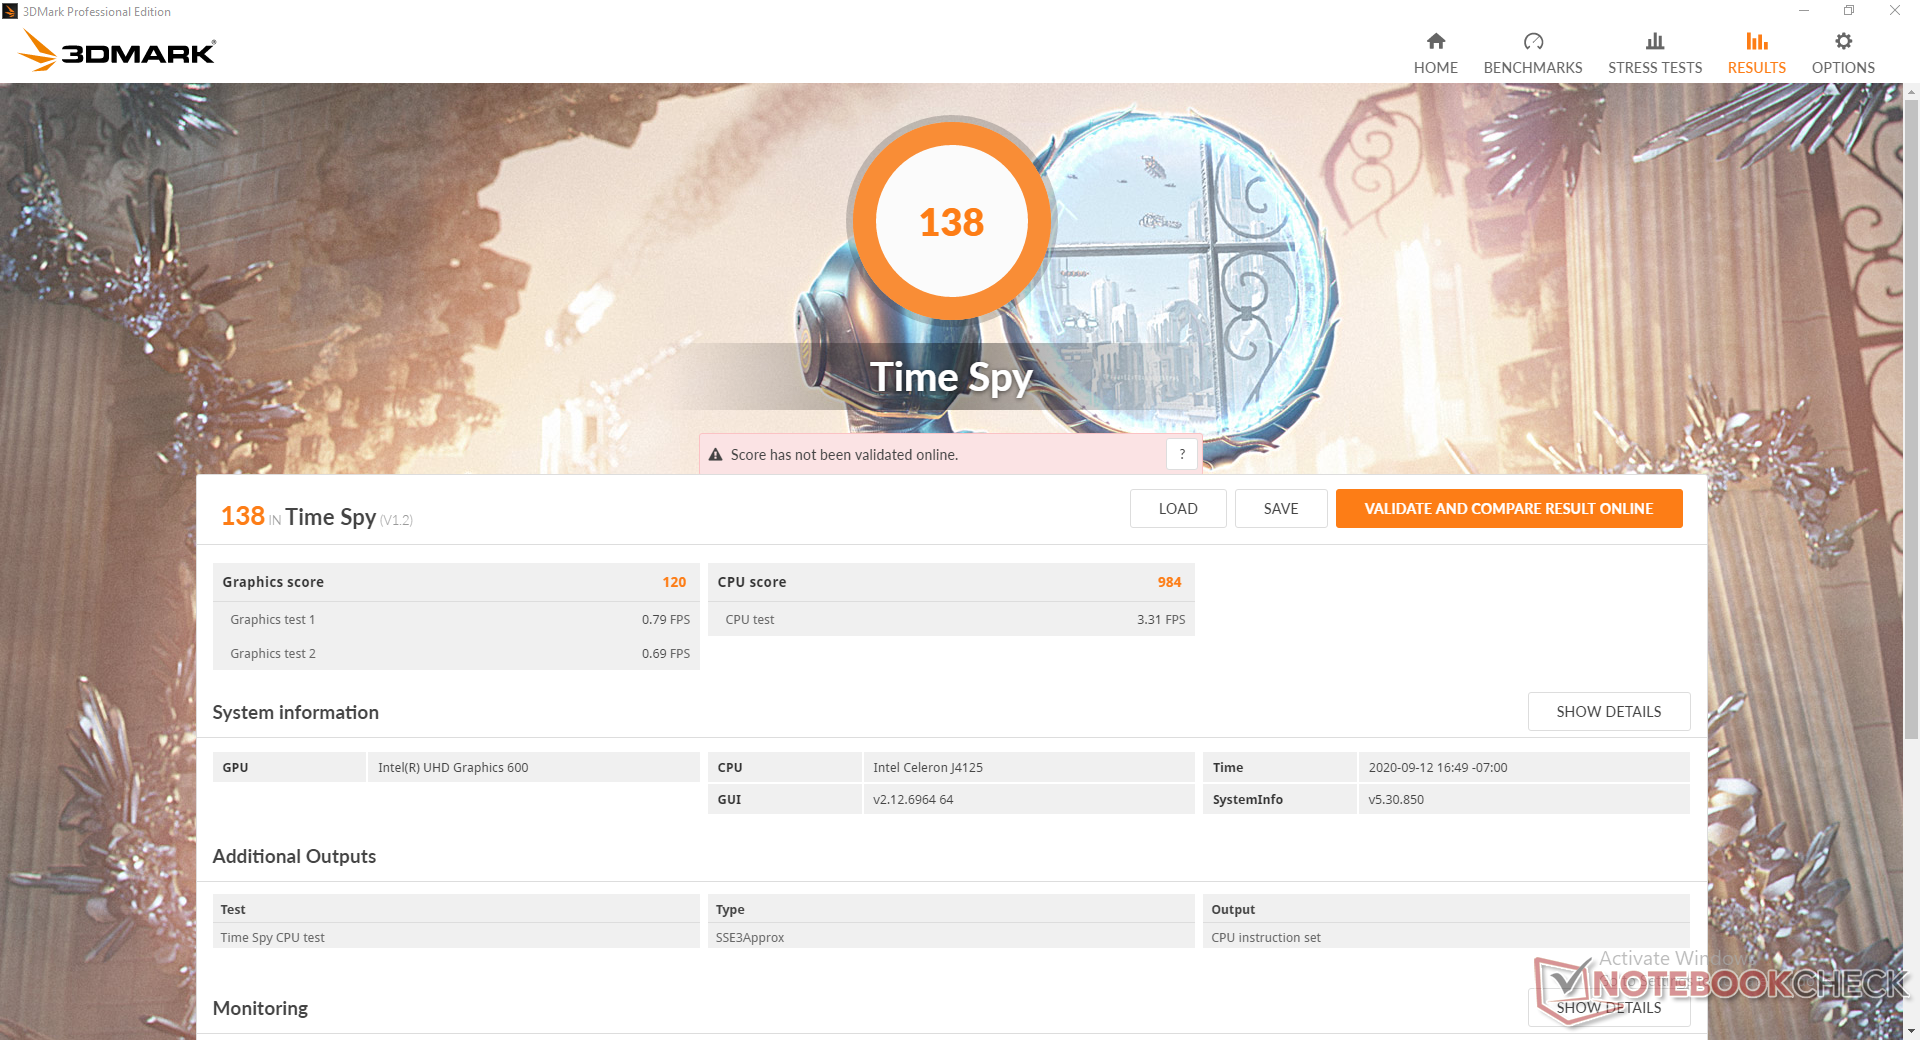
Graphics performance is consistently slower than the Chuwi LarkBox even though the NucBox is supposed to be the faster machine. This thankfully has no practical implications, but it shows that just because one model has a better processor on paper doesn't necessarily mean that it's the faster system in practice. Raw GPU performance is still where we expect it to be relative to other laptops with the same UHD Graphics 600 option.
| 3DMark 06 Standard Score | 3613 points | |
| 3DMark 11 Performance | 661 points | |
| 3DMark Cloud Gate Standard Score | 3120 points | |
| 3DMark Fire Strike Score | 402 points | |
| 3DMark Time Spy Score | 138 points | |
Help | ||
| low | med. | high | ultra | |
|---|---|---|---|---|
| Dota 2 Reborn (2015) | 32.8 | 16 | 6.8 | 6.1 |
| X-Plane 11.11 (2018) | 6.89 | 4.87 | 4.31 |
Emissions
System Noise
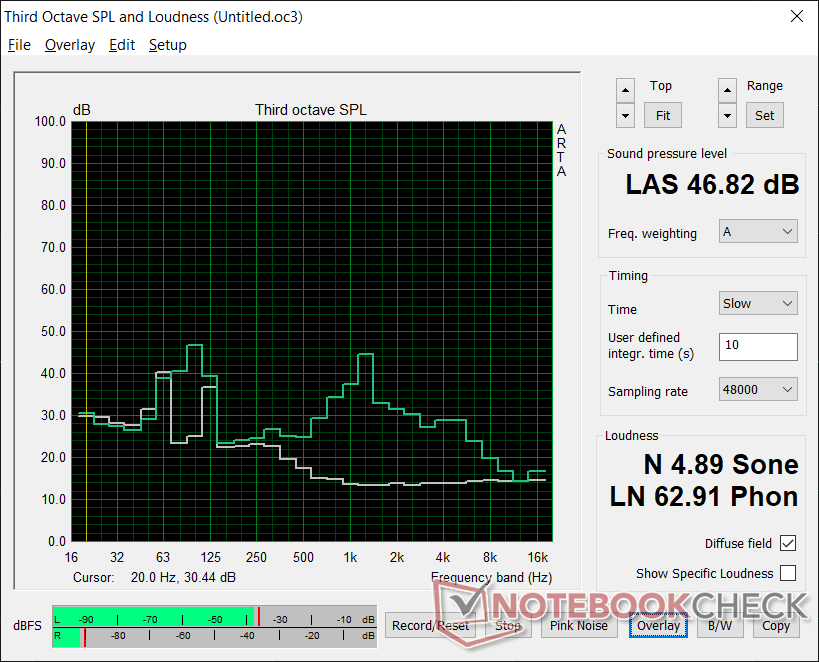
The fan is constantly pulsing between silent and 46.8 dB(A) with no other speed in between. You can be browsing the web or emailing and the fan will pulse to its maximum speed seemingly for no reason. It's not annoying if in a living room HTPC environment, but it's definitely noticeable and undesirable if in a smaller office or conference room.
| GMK NucBox K1 UHD Graphics 600, Celeron J4125, HIKVision C100 NGFF SSD 128GB | Zotac ZBox MI643 UHD Graphics 620, i5-10210U, Lexar NM610 1TB | Chuwi LarkBox 4K Mini PC UHD Graphics 600, Celeron J4115, 128 GB eMMC Flash | Intel NUC8i7BE Iris Plus Graphics 655, i7-8559U | Intel Skull Canyon NUC6i7KYK Iris Pro Graphics 580, 6770HQ, Samsung SSD 850 EVO m.2 120GB | |
|---|---|---|---|---|---|
| Noise | 10% | -4% | 1% | -6% | |
| off / environment * (dB) | 27.8 | 26.1 6% | 26 6% | 28.7 -3% | 29.5 -6% |
| Idle Minimum * (dB) | 27.8 | 27.5 1% | 26 6% | 28.7 -3% | 31.6 -14% |
| Idle Average * (dB) | 27.8 | 27.5 1% | 26 6% | 29.3 -5% | 32.2 -16% |
| Idle Maximum * (dB) | 27.8 | 27.5 1% | 43.3 -56% | 31.8 -14% | 32.3 -16% |
| Load Average * (dB) | 46.8 | 28.9 38% | 43.3 7% | 39 17% | 43 8% |
| Load Maximum * (dB) | 46.8 | 42 10% | 43.5 7% | 41.4 12% | 43.2 8% |
| Witcher 3 ultra * (dB) | 39 |
* ... smaller is better
Noise level
| Idle |
| 27.8 / 27.8 / 27.8 dB(A) |
| Load |
| 46.8 / 46.8 dB(A) |
 | ||
30 dB silent 40 dB(A) audible 50 dB(A) loud |
||
min: | ||
Temperature
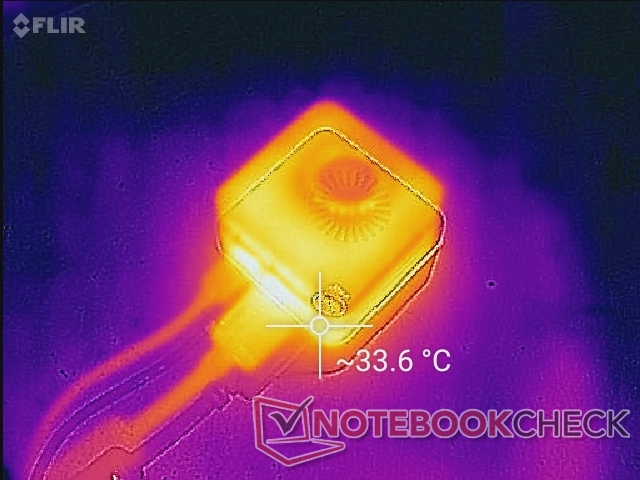
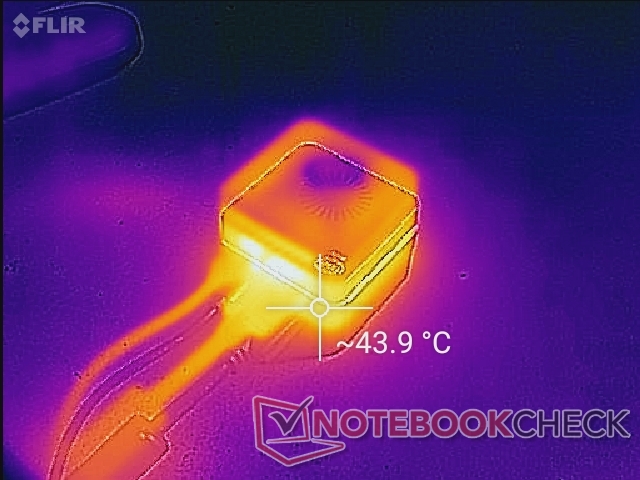
Surface temperatures are never uncomfortably warm no matter the load. However, be sure to not block any of the ventilation grilles along the top or rear since there is a fan inside.
Stress Test
When running Prime95, the CPU would boost to 2.5 GHz for the first couple of seconds before stabilizing at the 1.9 GHz to 2.2 GHz range. Core temperature plateaus at a worrying 101 C to 102 C which GMK says will be addressed in the final retail model.
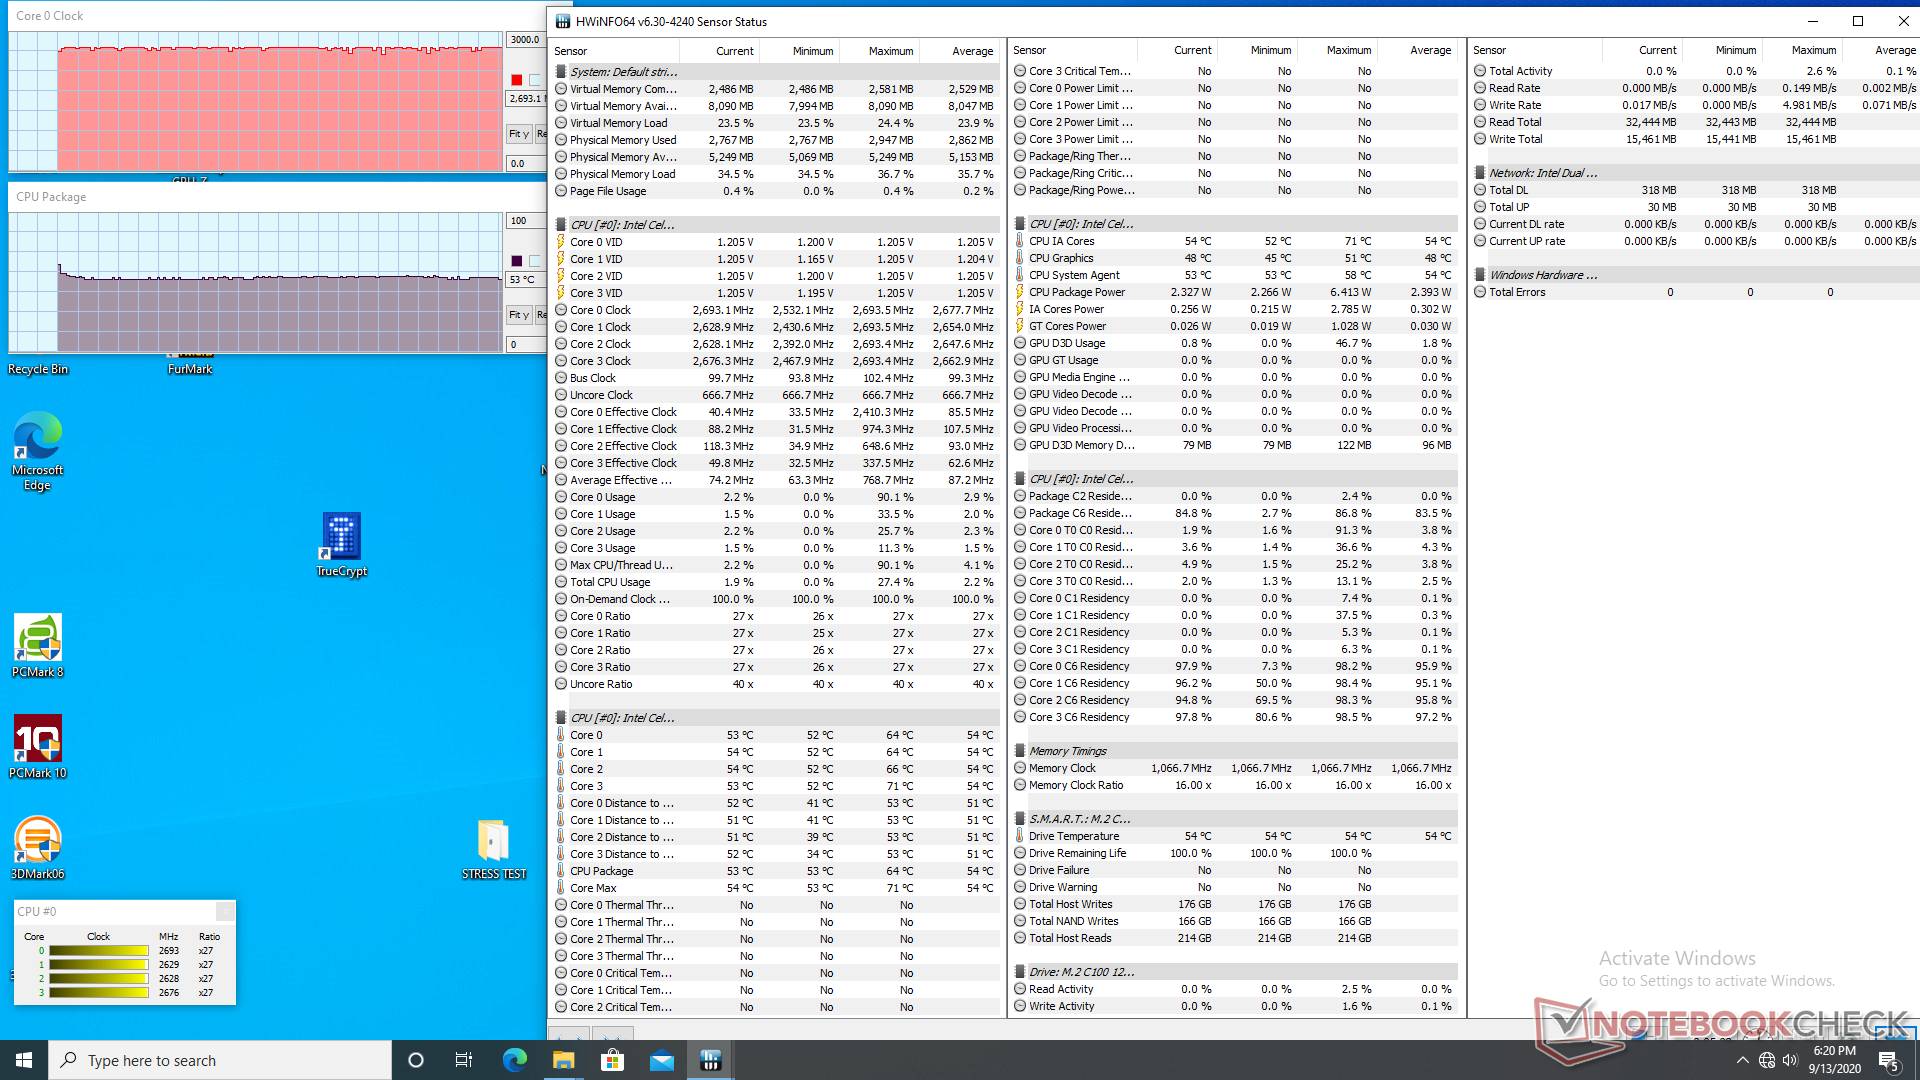
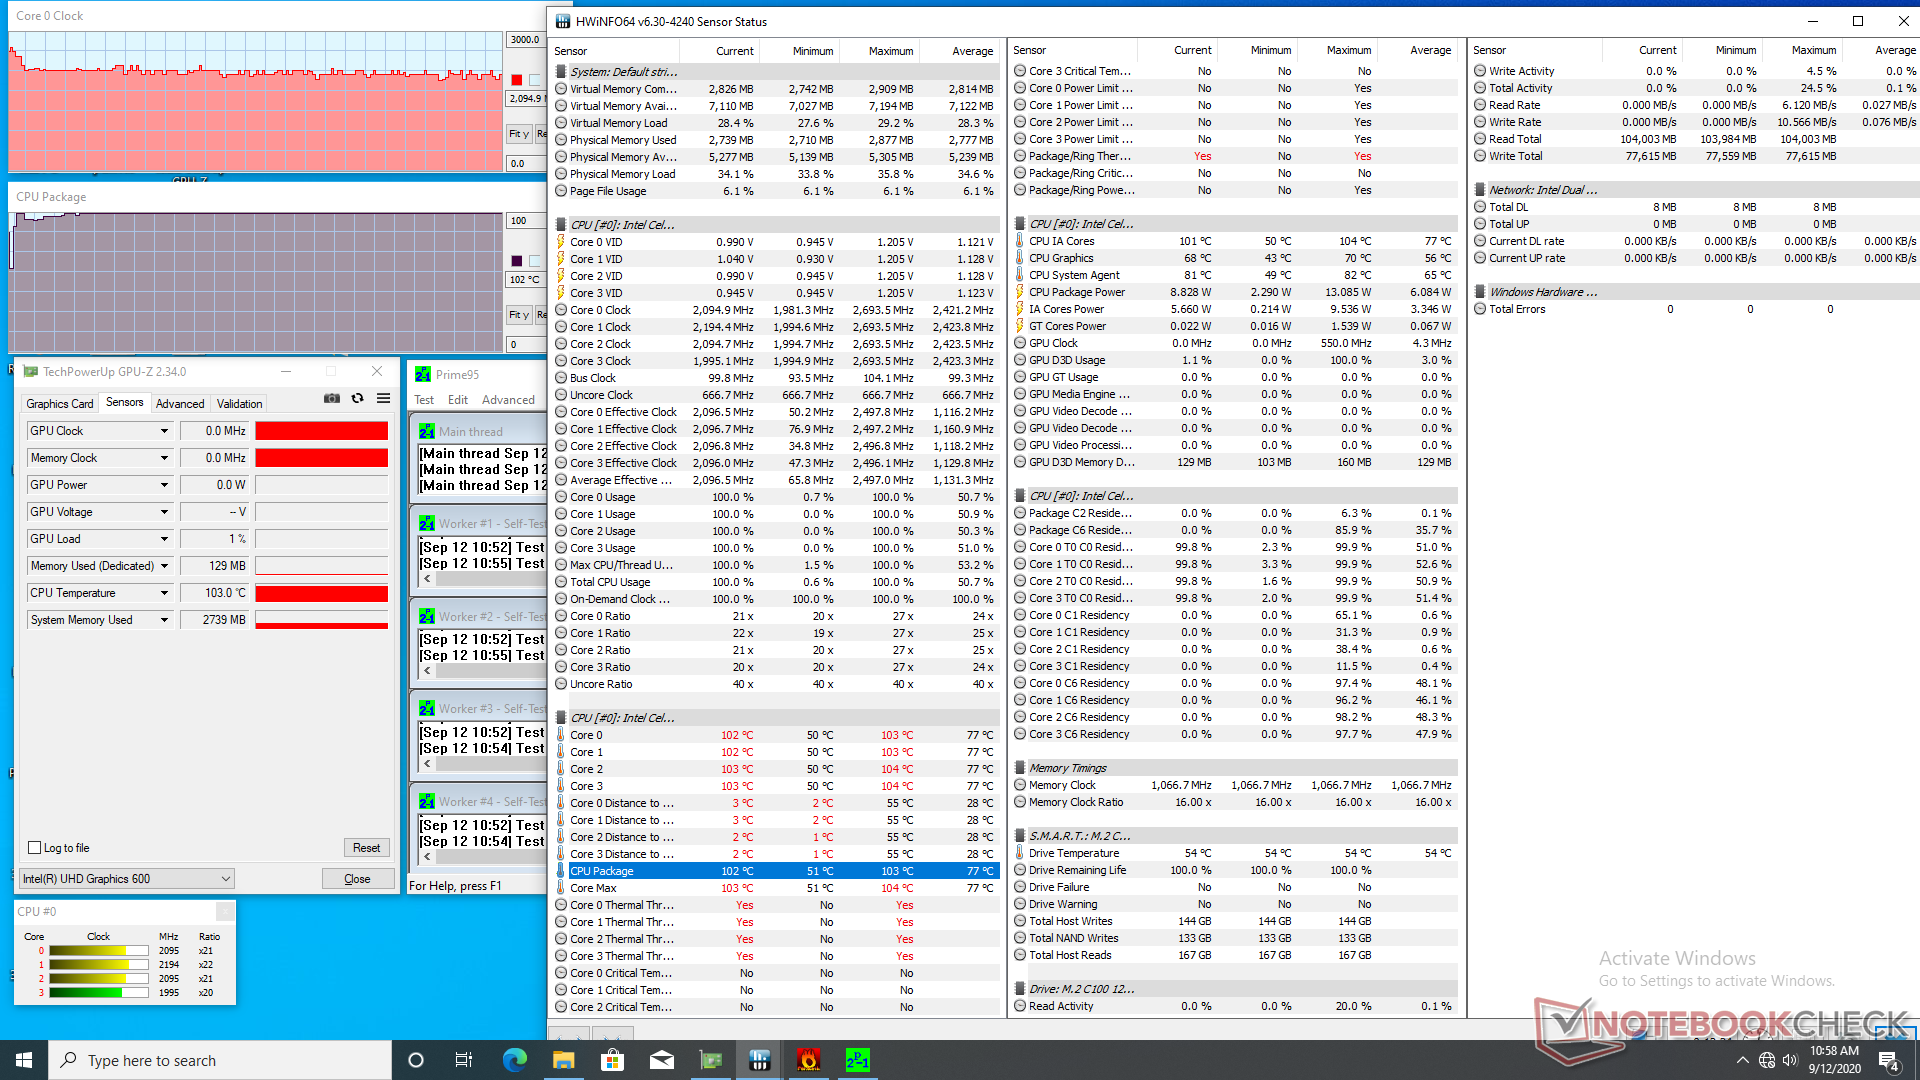
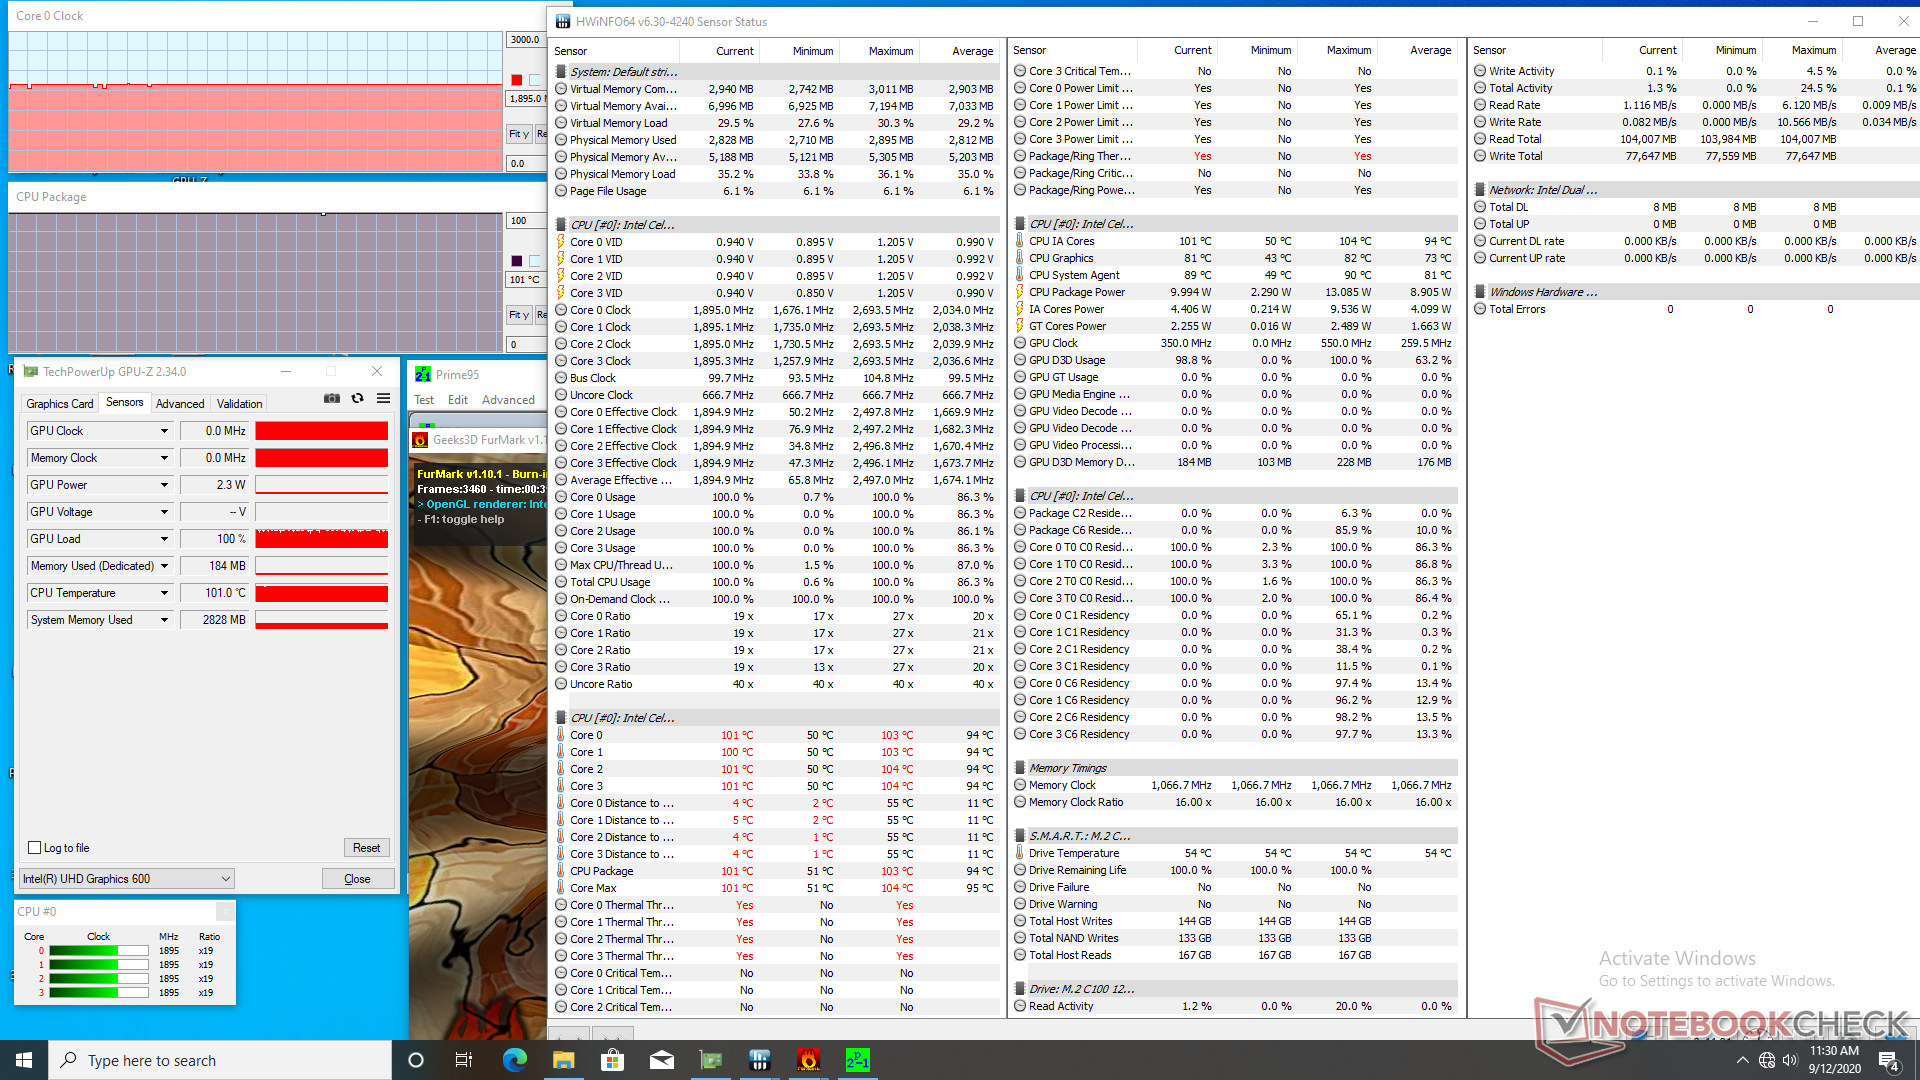
| CPU Clock (GHz) | GPU Clock (MHz) | Average CPU Temperature (°C) | |
| System Idle | -- | -- | 53 |
| Prime95 Stress | 1.9 - 2.2 | -- | 102 |
| Prime95 + FurMark Stress | 1.9 | 350 | 101 |
Energy Management
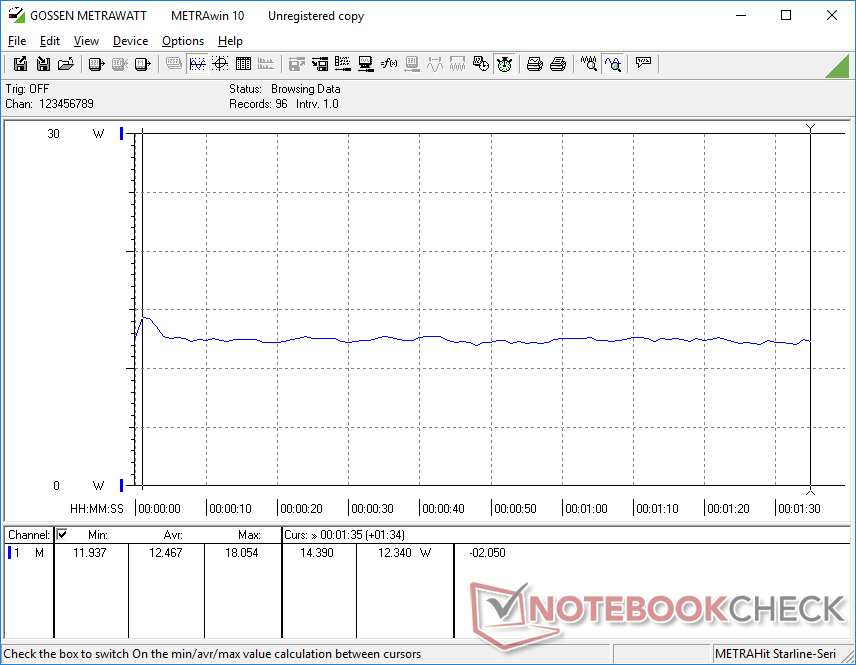
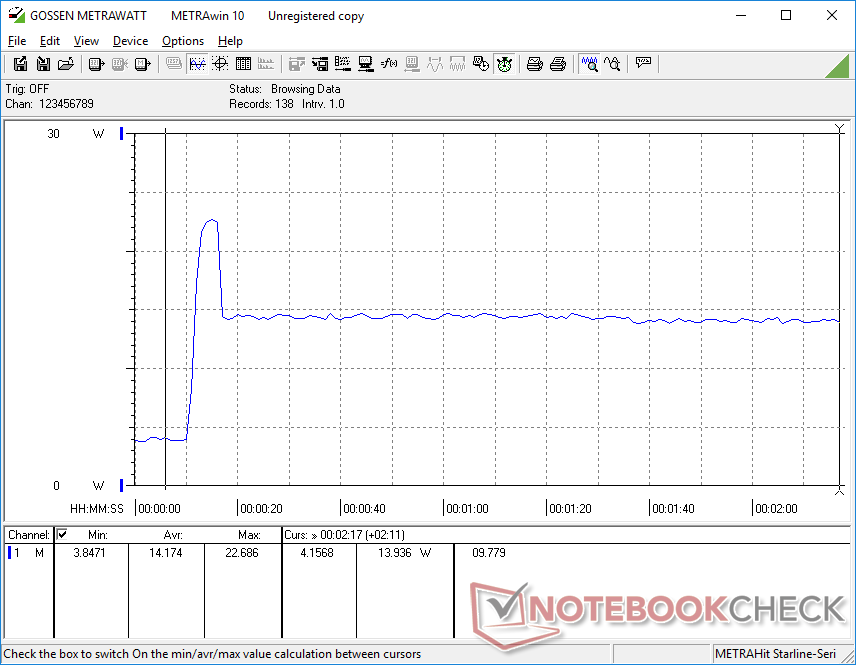
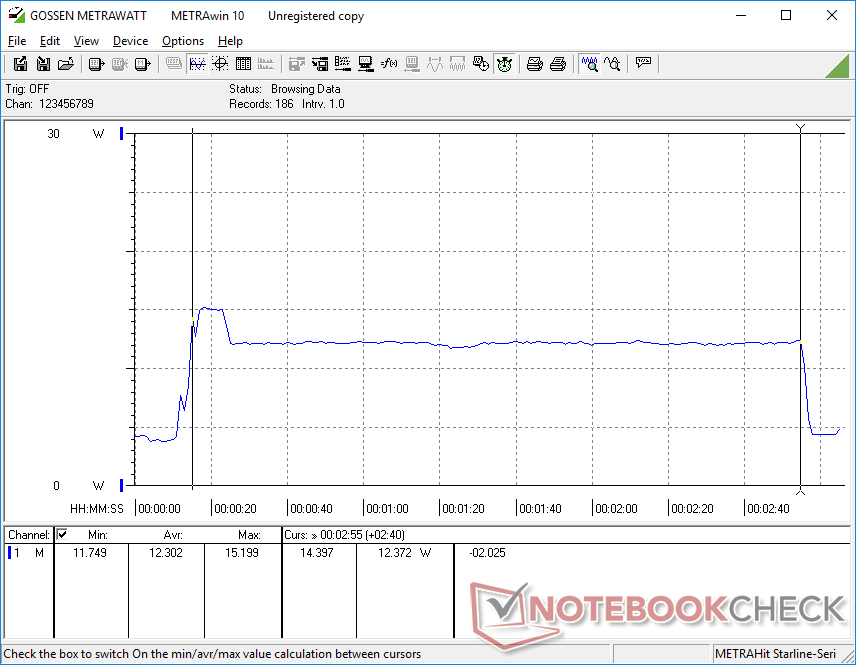
Power Consumption
Idling on desktop consumes between 3 W to 4 W to be about 1 W more than the LarkBox. We're able to record a maximum draw of 22.7 W from the small (~5.5 x 5.5 x 2.8 cm) 24 W AC adapter when running extreme loads. However, this maximum only lasts for a few seconds as shown by our graphs below.
| Off / Standby | |
| Idle | |
| Load |
|
Key:
min: | |
| GMK NucBox K1 Celeron J4125, UHD Graphics 600, HIKVision C100 NGFF SSD 128GB, , x, | Zotac ZBox MI643 i5-10210U, UHD Graphics 620, Lexar NM610 1TB, , x, | Chuwi LarkBox 4K Mini PC Celeron J4115, UHD Graphics 600, 128 GB eMMC Flash, , x, | Lenovo ThinkCentre M90n-1 Nano i5-8265U, UHD Graphics 620, Samsung SSD PM981 MZVLB512HAJQ, , x, 0" | Chuwi GBox CWI560 Celeron N4100, UHD Graphics 600, SanDisk DA4064, , x, | |
|---|---|---|---|---|---|
| Power Consumption | -150% | 18% | -62% | 41% | |
| Idle Minimum * (Watt) | 3.4 | 7.5 -121% | 2.2 35% | 4.4 -29% | 1.9 44% |
| Idle Average * (Watt) | 3.8 | 9.2 -142% | 2.6 32% | 4.4 -16% | 2 47% |
| Idle Maximum * (Watt) | 3.9 | 9.6 -146% | 3 23% | 4.7 -21% | 2.9 26% |
| Load Average * (Watt) | 12.5 | 34.4 -175% | 13.1 -5% | 27.7 -122% | 8.6 31% |
| Load Maximum * (Watt) | 22.7 | 60.6 -167% | 21.9 4% | 49.9 -120% | 9.5 58% |
* ... smaller is better
Pros
Cons
Verdict
Based on our time with the pre-production unit, the NucBox K1 is not ready for a wider release. The Wi-Fi constantly drops, the fan pulses frequently, the MicroSD reader will sometimes not recognize the card, USB devices turn on and off inexplicably, and system performance is jittery even when compared to the competing Chuwi LarkBox. The price, design, and overall concept are attractive, but you'd be better off spending a bit more on a larger and more reliable mini PC or even a last generation Intel NUC.
We're hopeful that GMK will fix all of these issues on final retail units. If you still plan on backing the project, then we definitely recommend stress testing your system and making sure all the ports and radios are working as intended.
Price comparison
