GMK NucBox 2 Mini PC Review: Reasonably Priced with Good Upgradeability
 vs. NucBox K1 (right)")
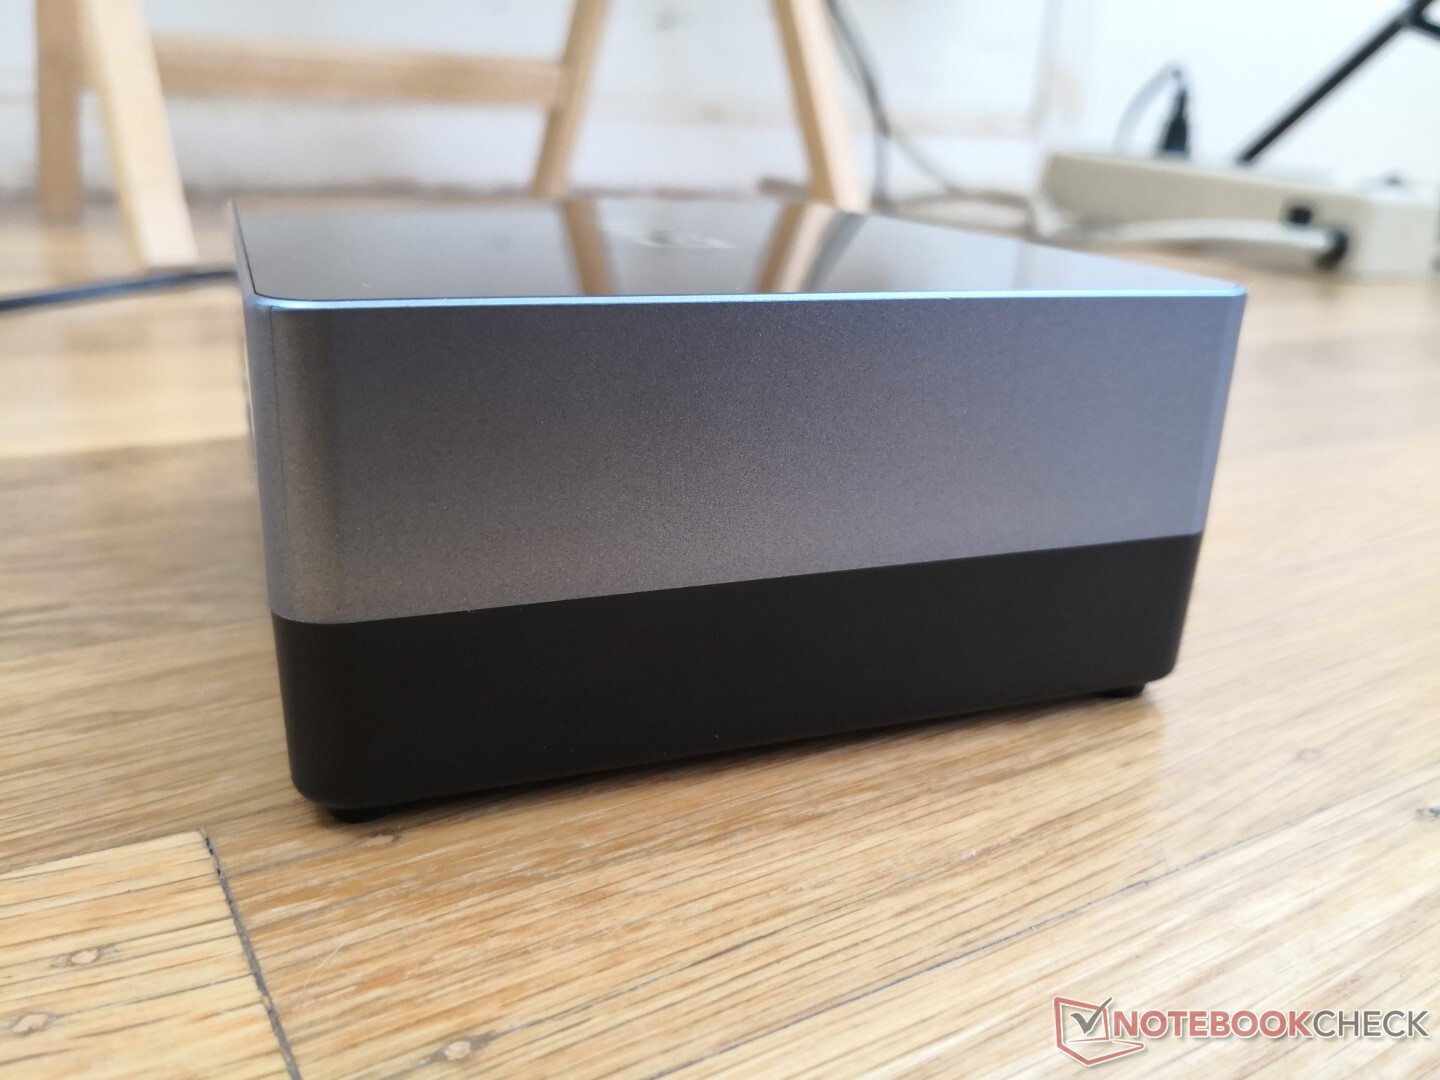
Unlike the super-small GMK NucBox K1 last year, the NucBox 2 is a more traditional mini PC in the same vein as the Intel NUC. The current configuration comes with an Intel Coffee Lake-U Core i5 CPU, Iris Plus Graphics 655 GPU, 8 GB of single-channel RAM, and 256 GB NVMe SSD for around $500 USD (or $440 when on sale).
Competitors in this space are becoming increasingly common with alternatives like the expansive Zotac ZBox series, Beelink SEi10, Chuwi GBox, Lenovo ThinkCentre, or the popular Intel NUC series.
Users can learn more about the NucBox 2 via its official product page here.
potential competitors in comparison
Rating | Date | Model | Weight | Height | Size | Resolution | Price |
|---|---|---|---|---|---|---|---|
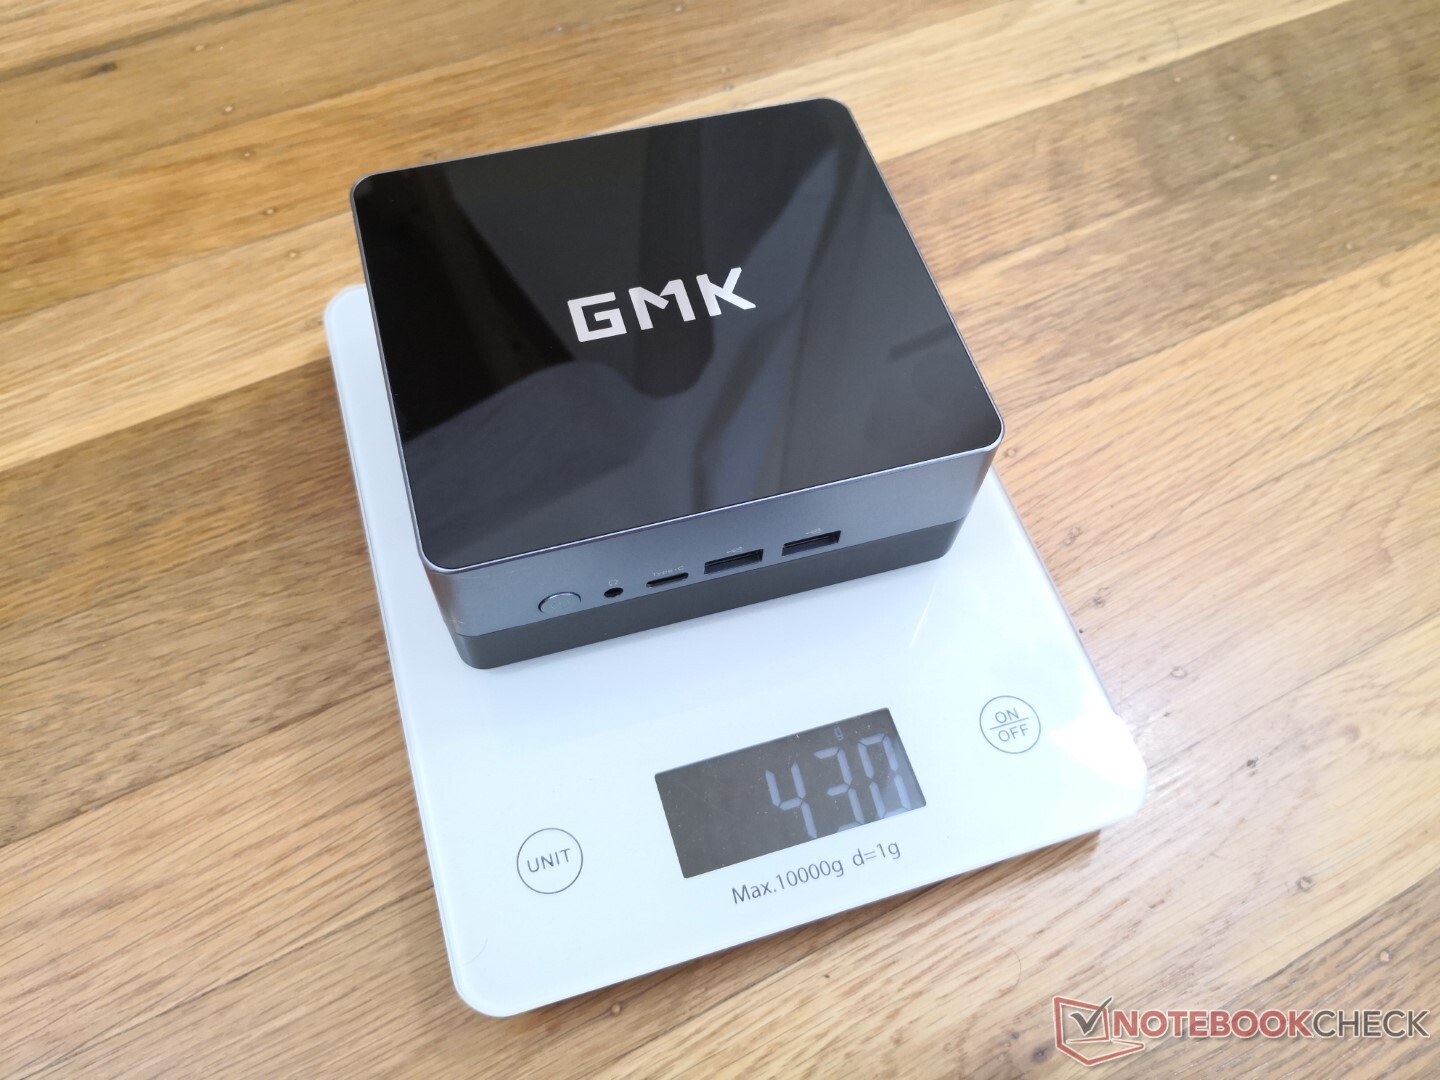
v (old) | 03 / 2021 | GMK NucBox 2 i5-8259U, Iris Plus Graphics 655 | 430 g | 50 mm | x | ||
v (old) | 02 / 2021 | Intel NUC11PAQi7 i7-1165G7, Iris Xe G7 96EUs | 647 g | 56 mm | x | ||
v (old) | 11 / 2018 | Intel NUC8i7BE i7-8559U, Iris Plus Graphics 655 | 683 g | 51 mm | x | ||
v (old) | 09 / 2020 | GMK NucBox K1 Celeron J4125, UHD Graphics 600 | 130 g | 42 mm | x | ||
v (old) | 12 / 2020 | Beelink SEi10 i3-1005G1, UHD Graphics G1 (Ice Lake 32 EU) | 350 g | 41 mm | x | ||
v (old) | 07 / 2020 | Zotac ZBox MI643 i5-10210U, UHD Graphics 620 | 550 g | 28.5 mm | x |
Case
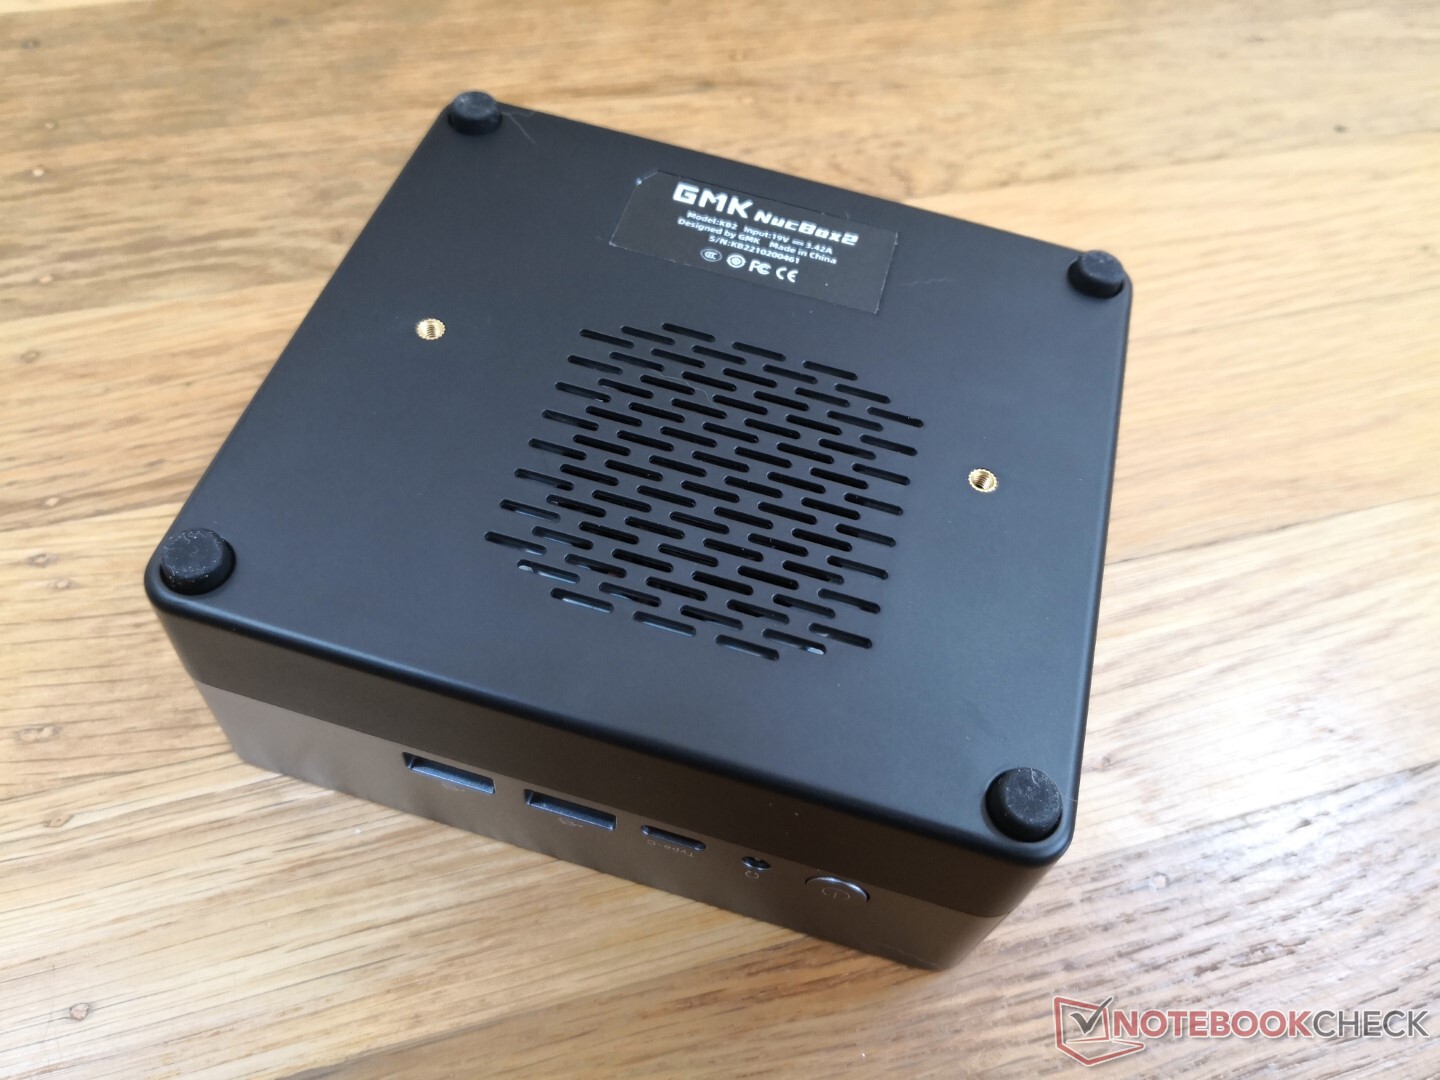
Overall dimensions are most similar to the older Intel NUC 8 but almost 40 percent lighter. Build quality is excellent all around with no warping on any of its six faces. Expect the glossy plastic surface on top to become dirtier more quickly than the rest of the matte metal chassis.
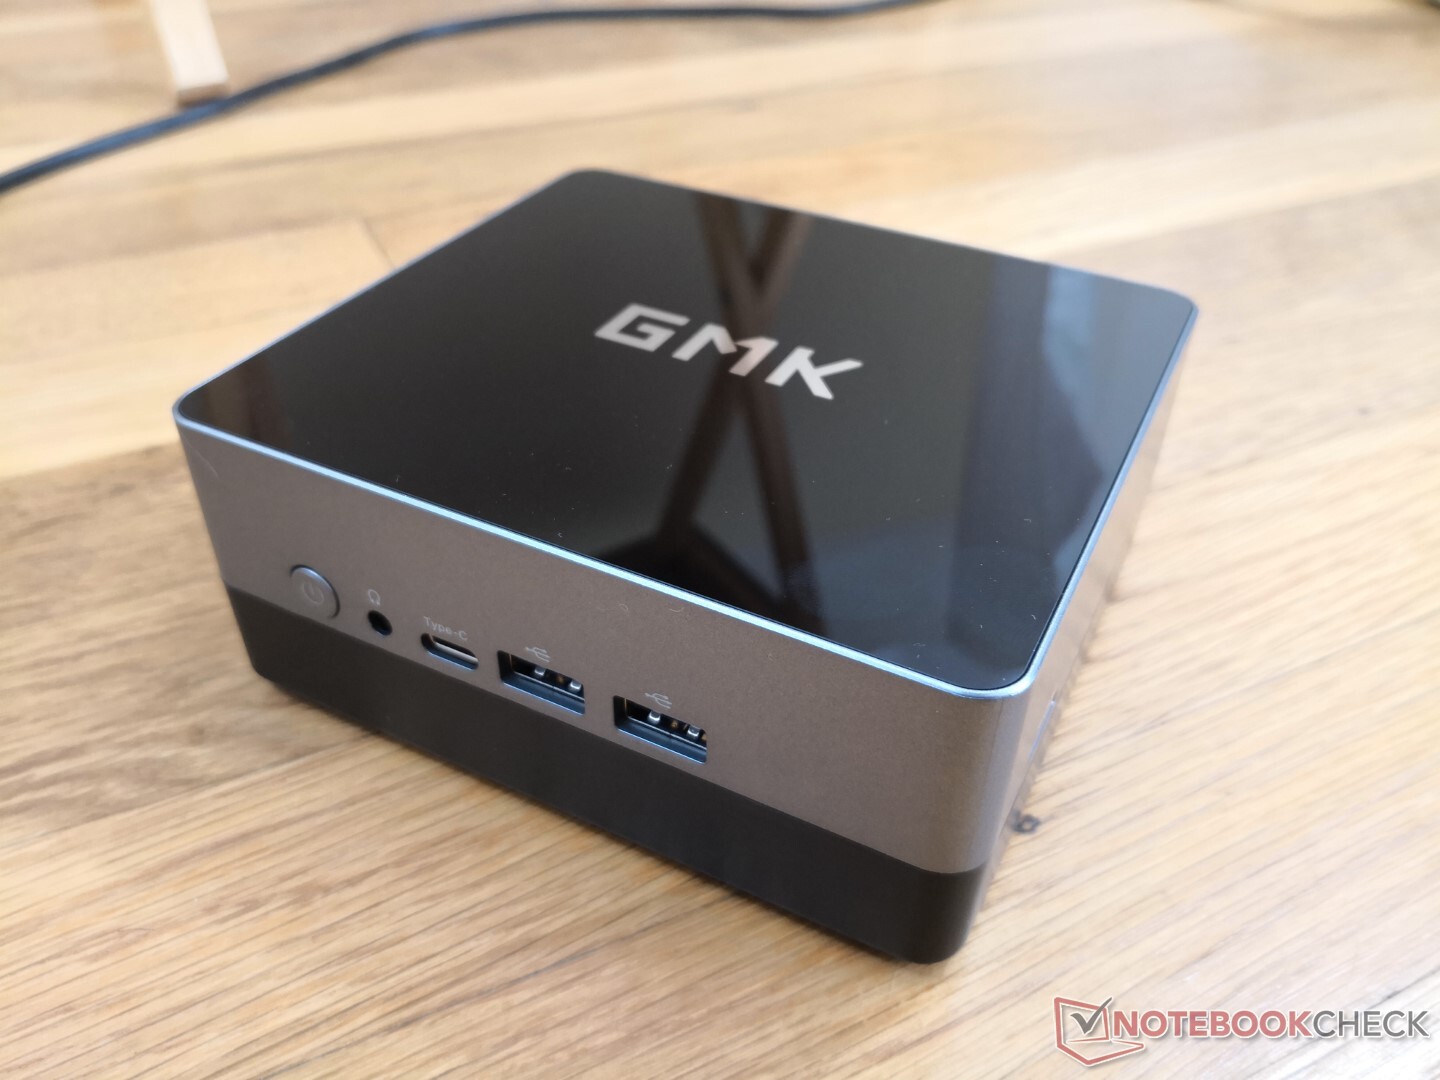
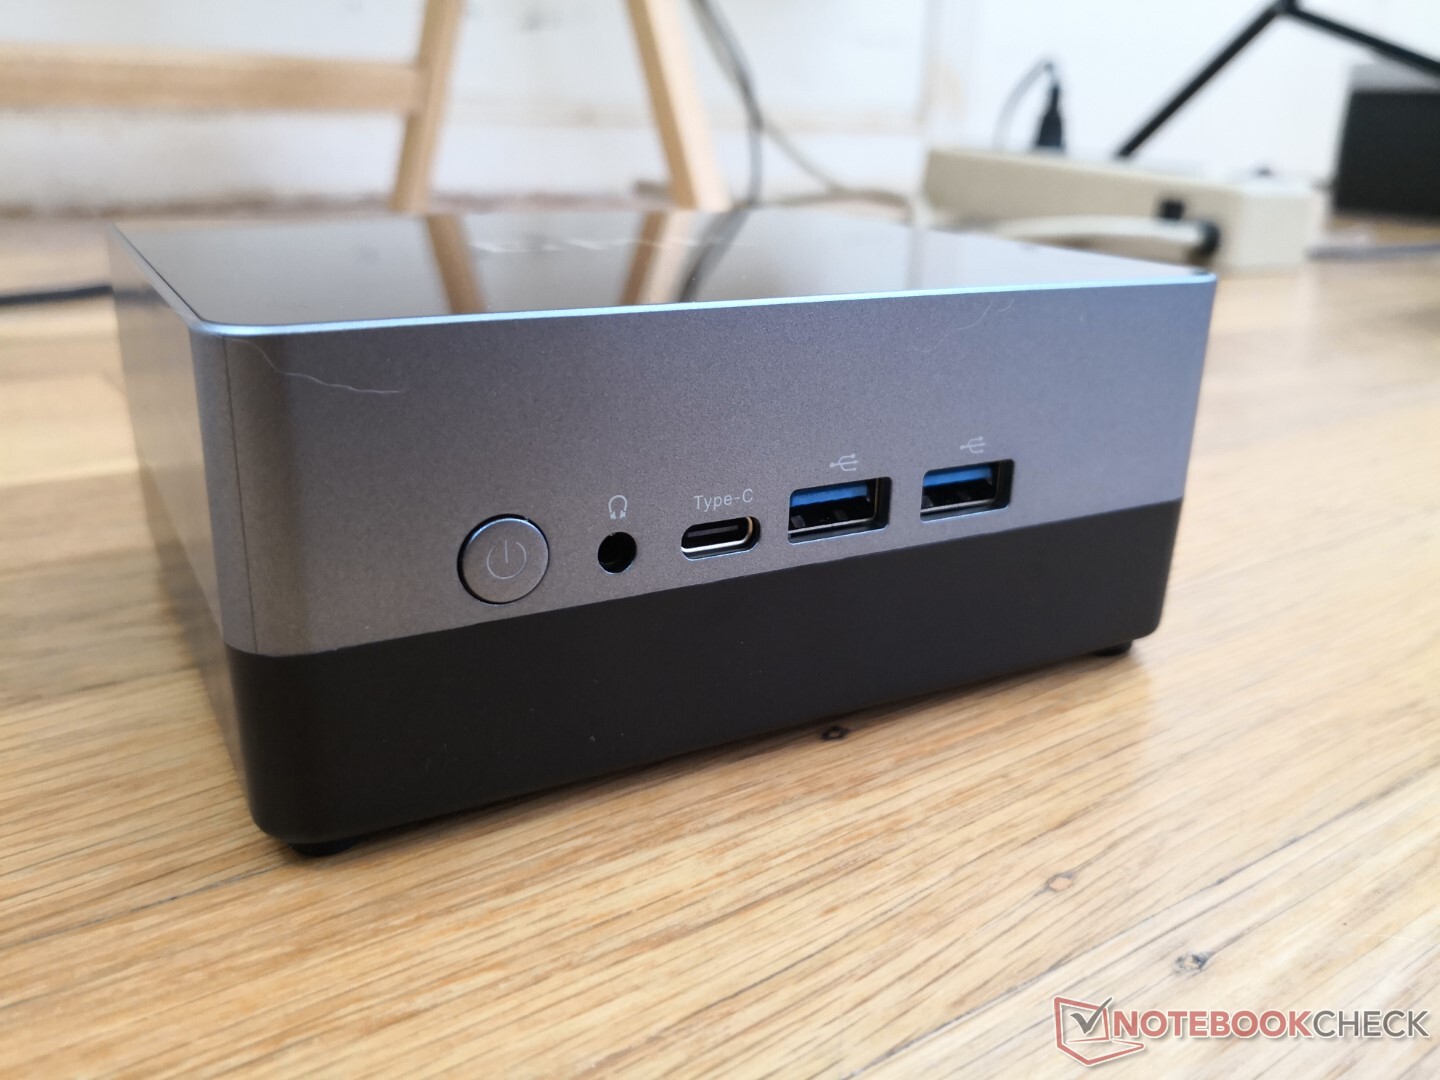
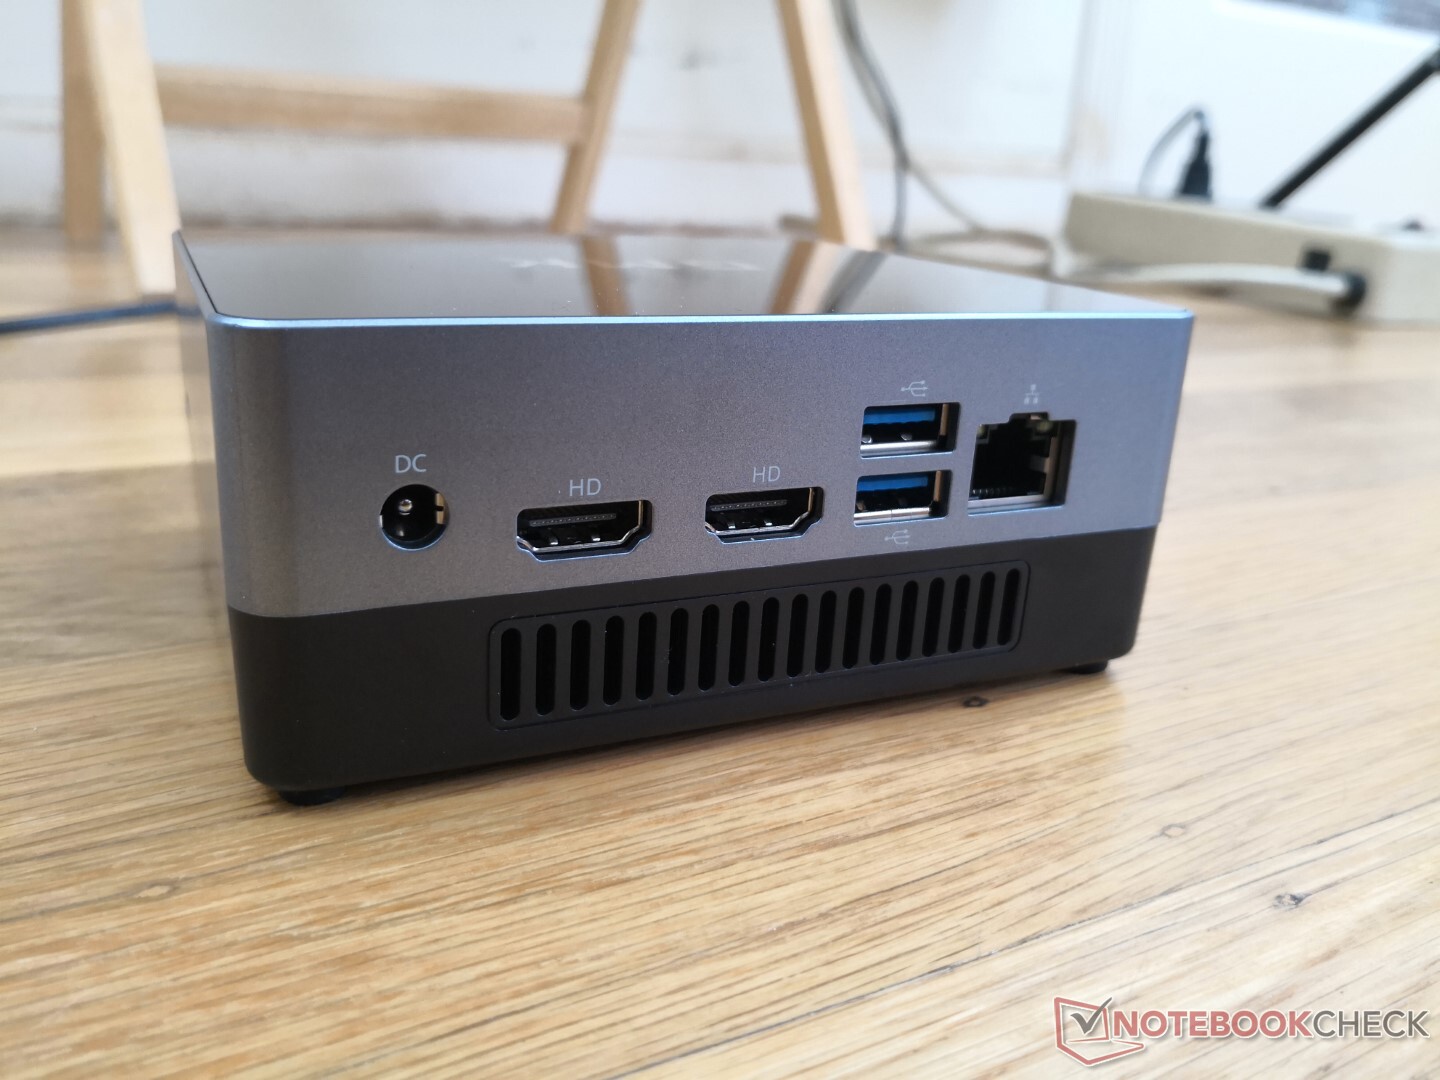
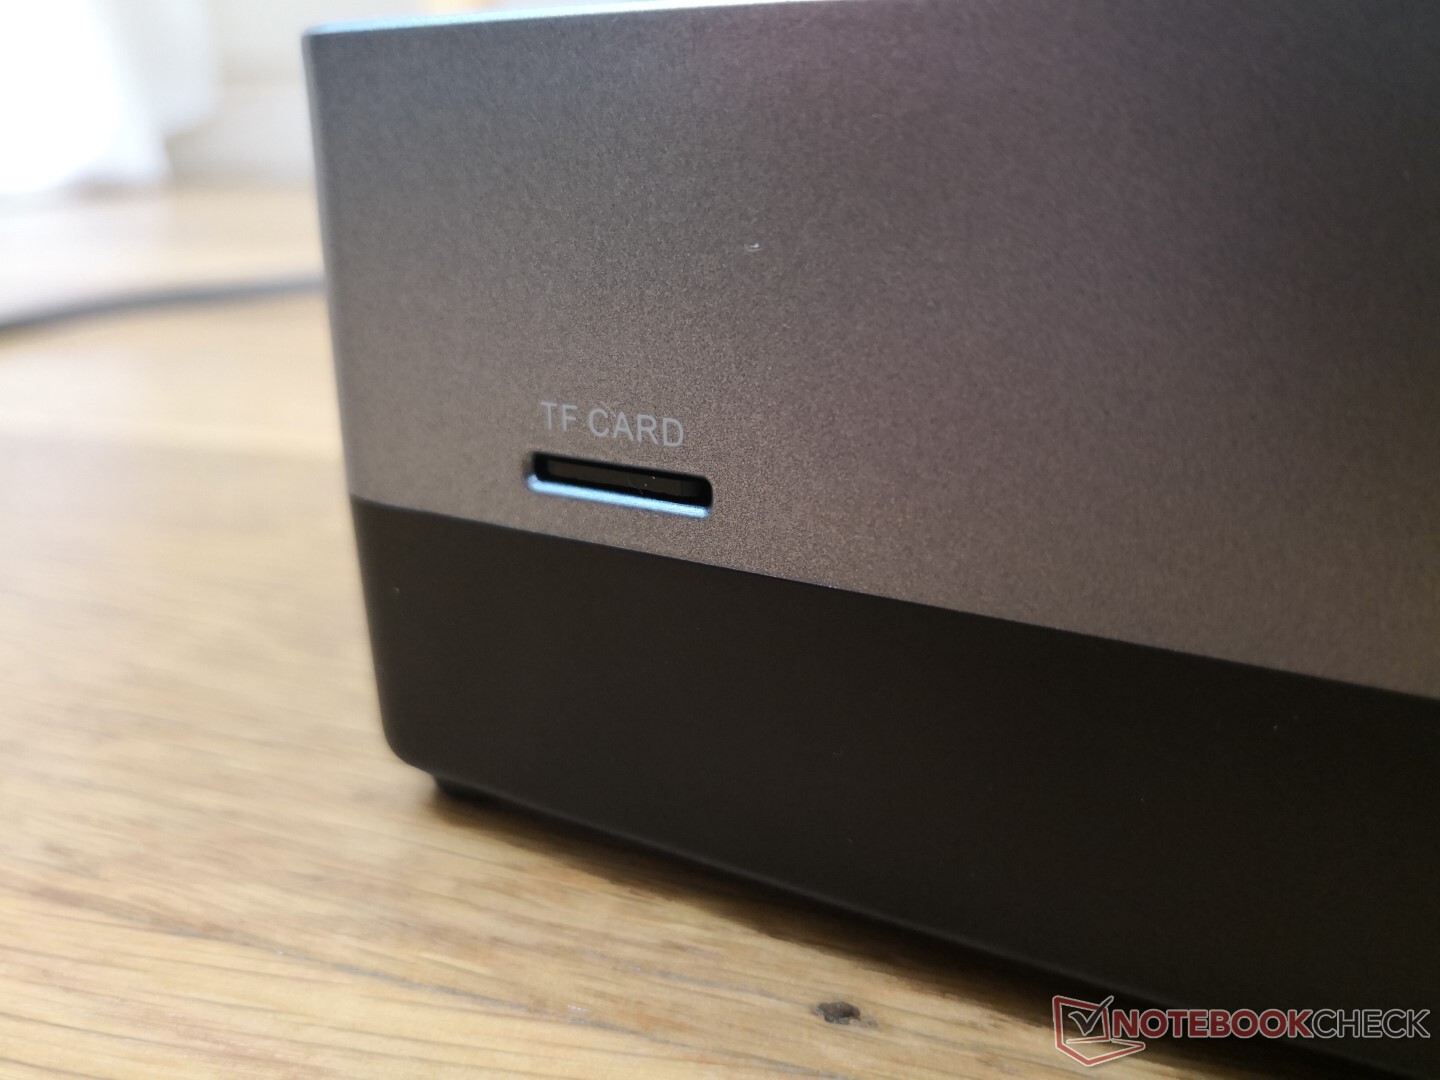
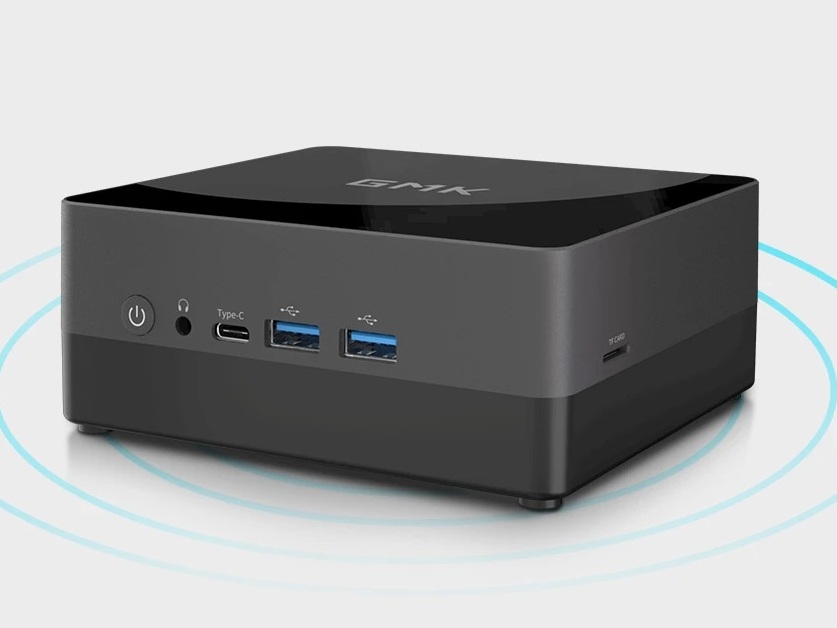
Connectivity
Port options are good, but they could have been better. In particular, there is only one USB-C port and it doesn't support DisplayPort, Thunderbolt, or Power Delivery in contrast to the USB-C port on the competing Beelink SEi10. There is also no IR receiver.
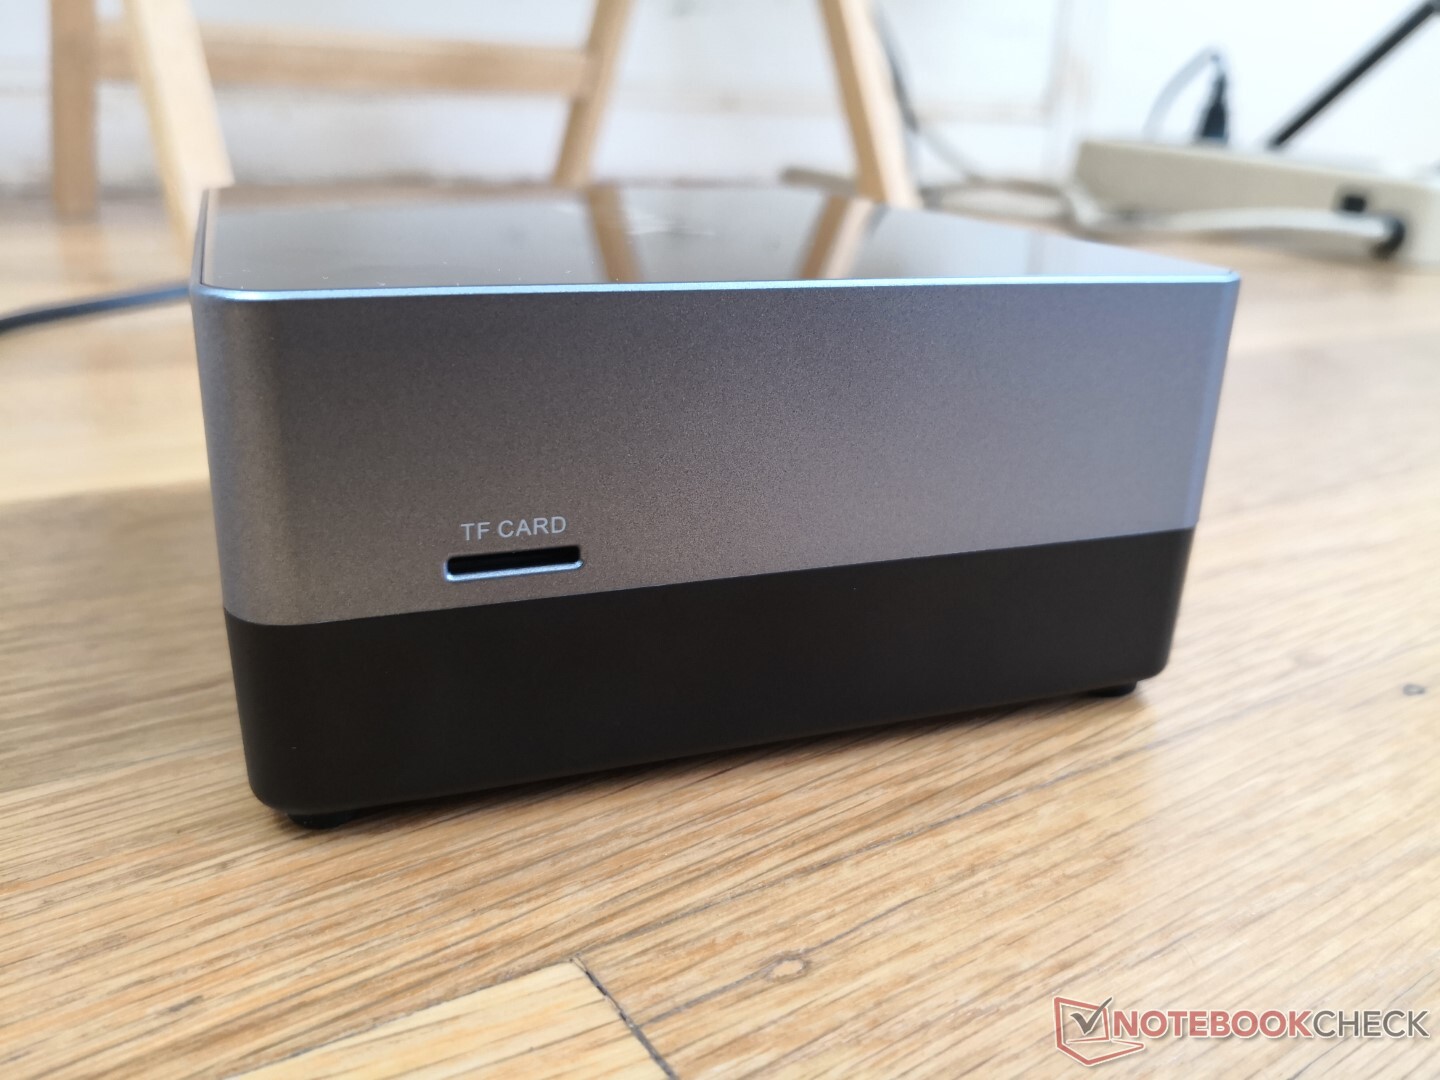
SD Card Reader
| SD Card Reader | |
| average JPG Copy Test (av. of 3 runs) | |
| Intel NUC11PAQi7 (Toshiba Exceria Pro SDXC 64 GB UHS-II) | |
| Intel NUC8i7BE (Toshiba Exceria Pro M501 UHS-II) | |
| GMK NucBox K1 (Toshiba Exceria Pro M501 UHS-) | |
| Zotac ZBox MI643 (Toshiba Exceria Pro M501 UHS-II) | |
| GMK NucBox 2 (Toshiba Exceria Pro M501 UHS-II) | |
| Beelink SEi10 (Toshiba Exceria Pro M501 UHS-II) | |
| maximum AS SSD Seq Read Test (1GB) | |
| Intel NUC11PAQi7 (Toshiba Exceria Pro SDXC 64 GB UHS-II) | |
| Intel NUC8i7BE (Toshiba Exceria Pro M501 UHS-II) | |
| GMK NucBox K1 (Toshiba Exceria Pro M501 UHS-) | |
| Zotac ZBox MI643 (Toshiba Exceria Pro M501 UHS-II) | |
| Beelink SEi10 (Toshiba Exceria Pro M501 UHS-II) | |
| GMK NucBox 2 (Toshiba Exceria Pro M501 UHS-II) | |
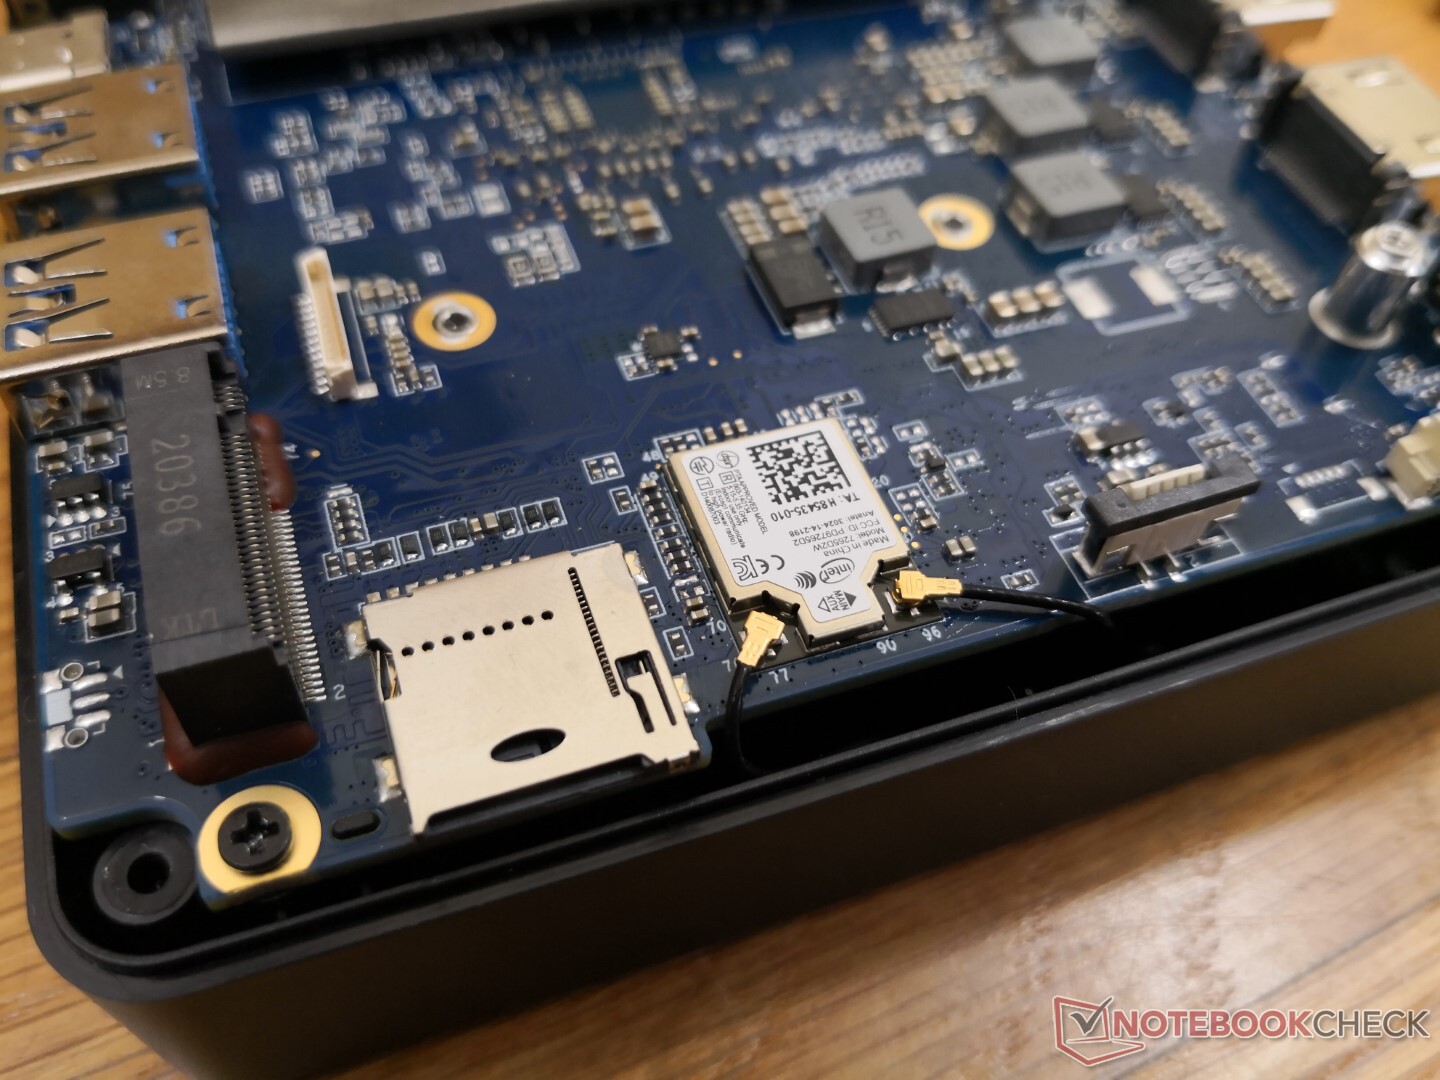
Communication
An Intel 7265 comes soldered for Wi-Fi 5 connectivity. Wi-Fi 6 is not available likely to save on costs. Though receive rates are excellent, real-world transmit rates are slower than expected at almost half when connected to our Netgear RAX200 test router.
| Networking | |
| iperf3 transmit AX12 | |
| Beelink SEi10 | |
| Intel NUC8i7BE | |
| Intel NUC11PAQi7 | |
| GMK NucBox 2 | |
| Zotac ZBox MI643 | |
| GMK NucBox K1 | |
| iperf3 receive AX12 | |
| Beelink SEi10 | |
| Intel NUC11PAQi7 | |
| GMK NucBox 2 | |
| Intel NUC8i7BE | |
| GMK NucBox K1 | |
| Zotac ZBox MI643 | |
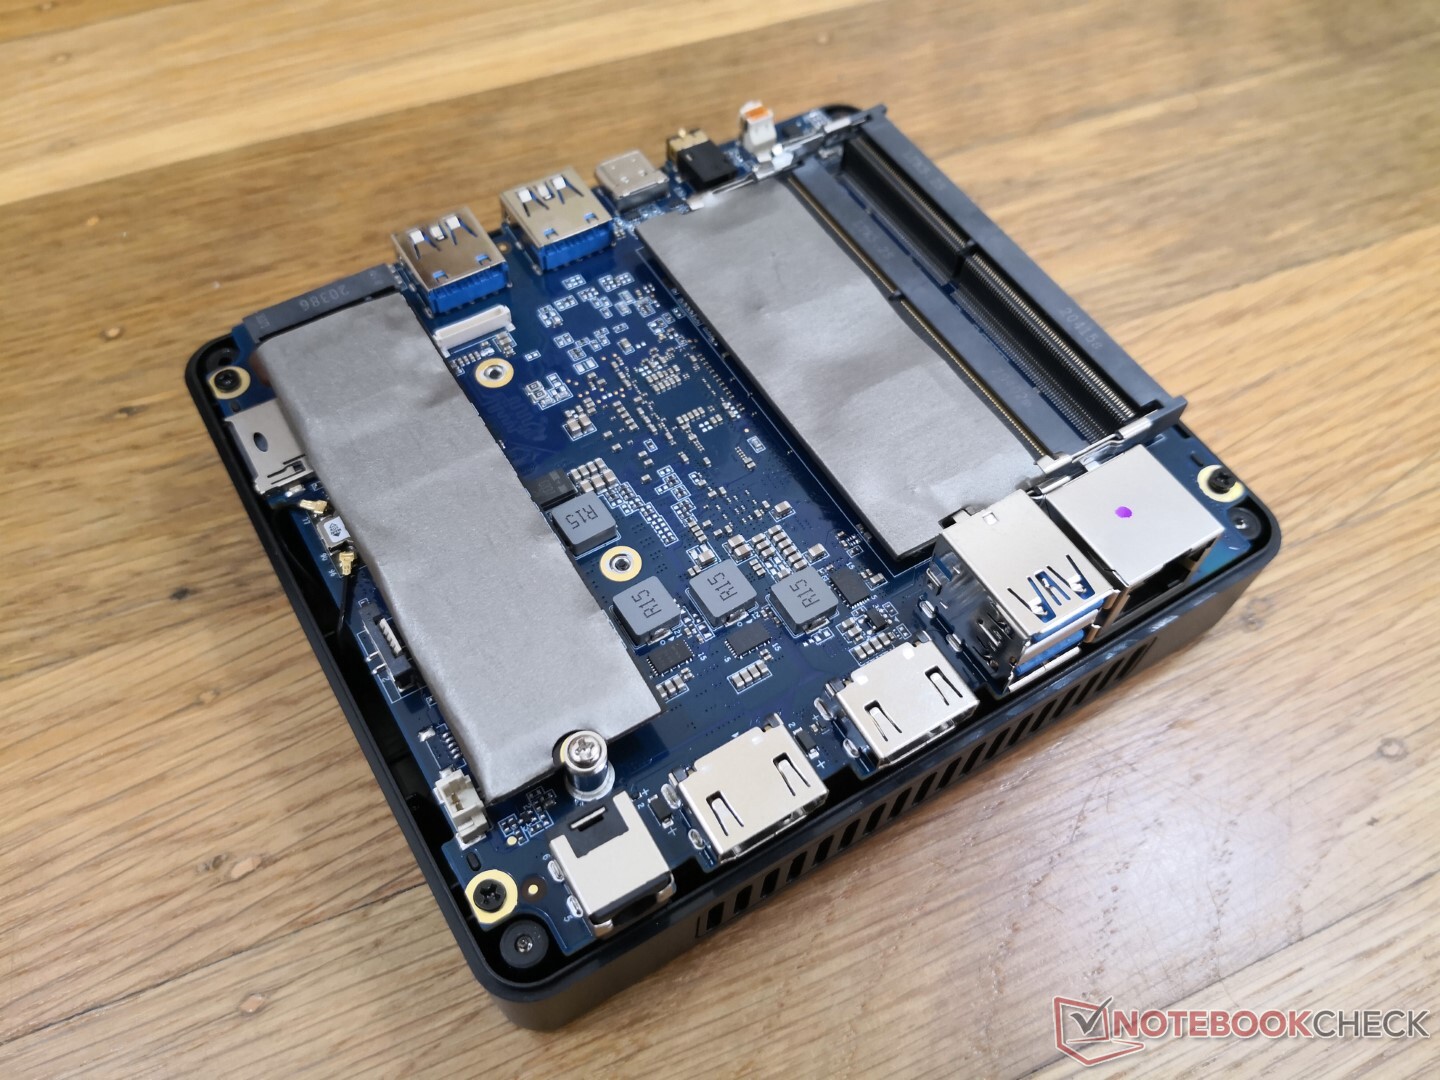
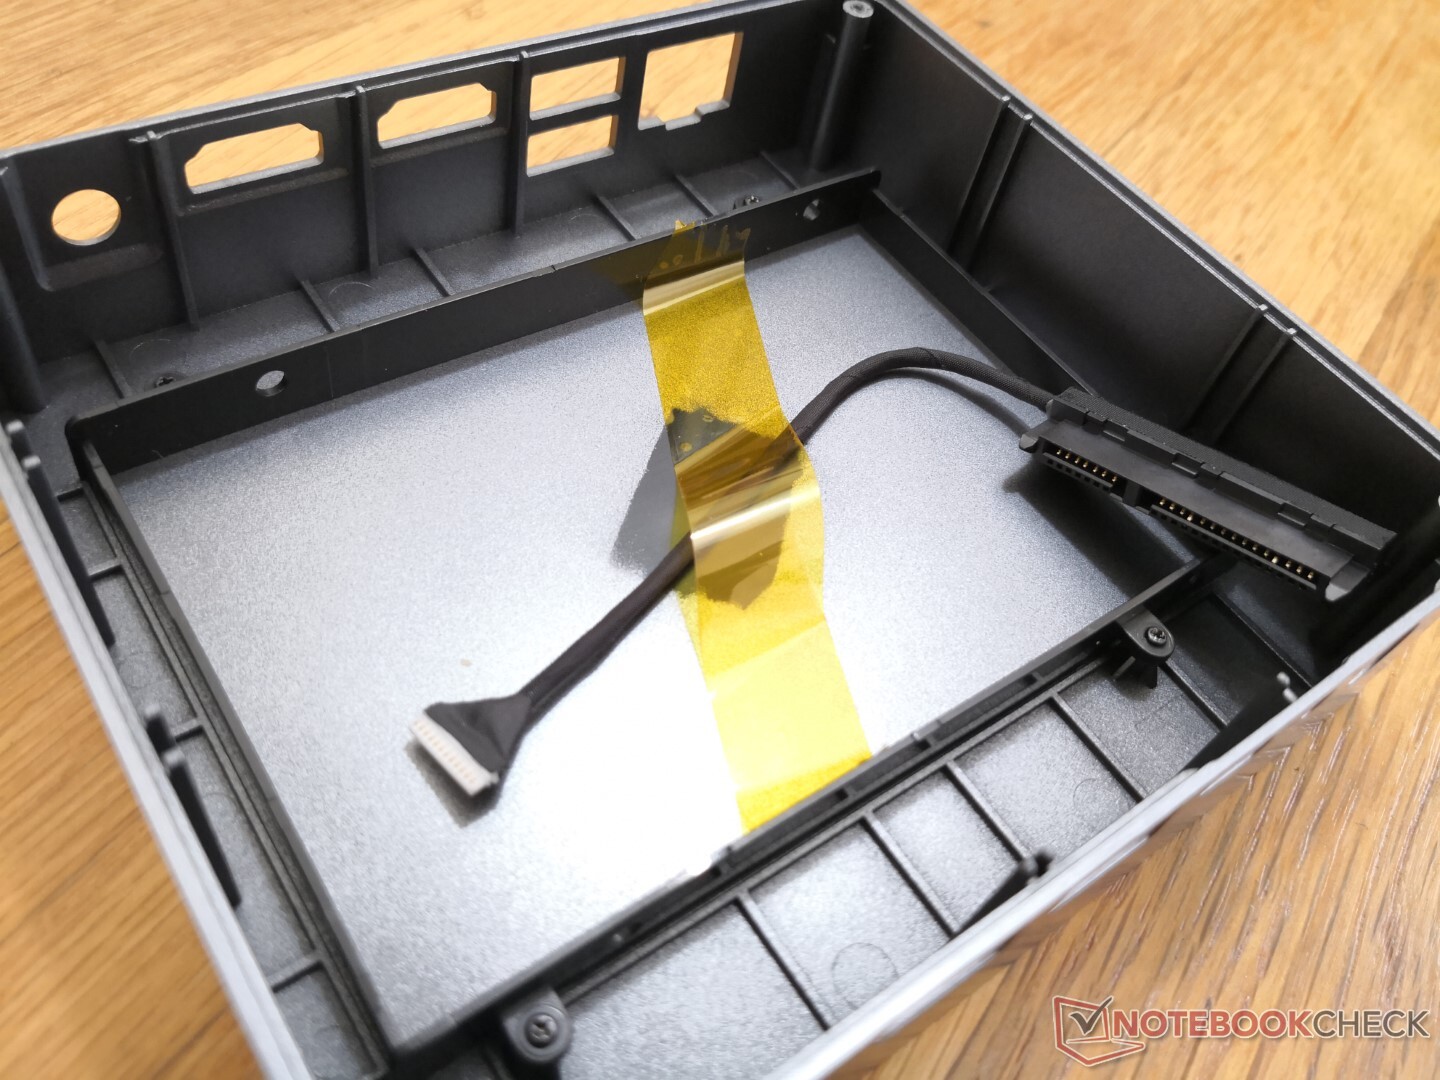
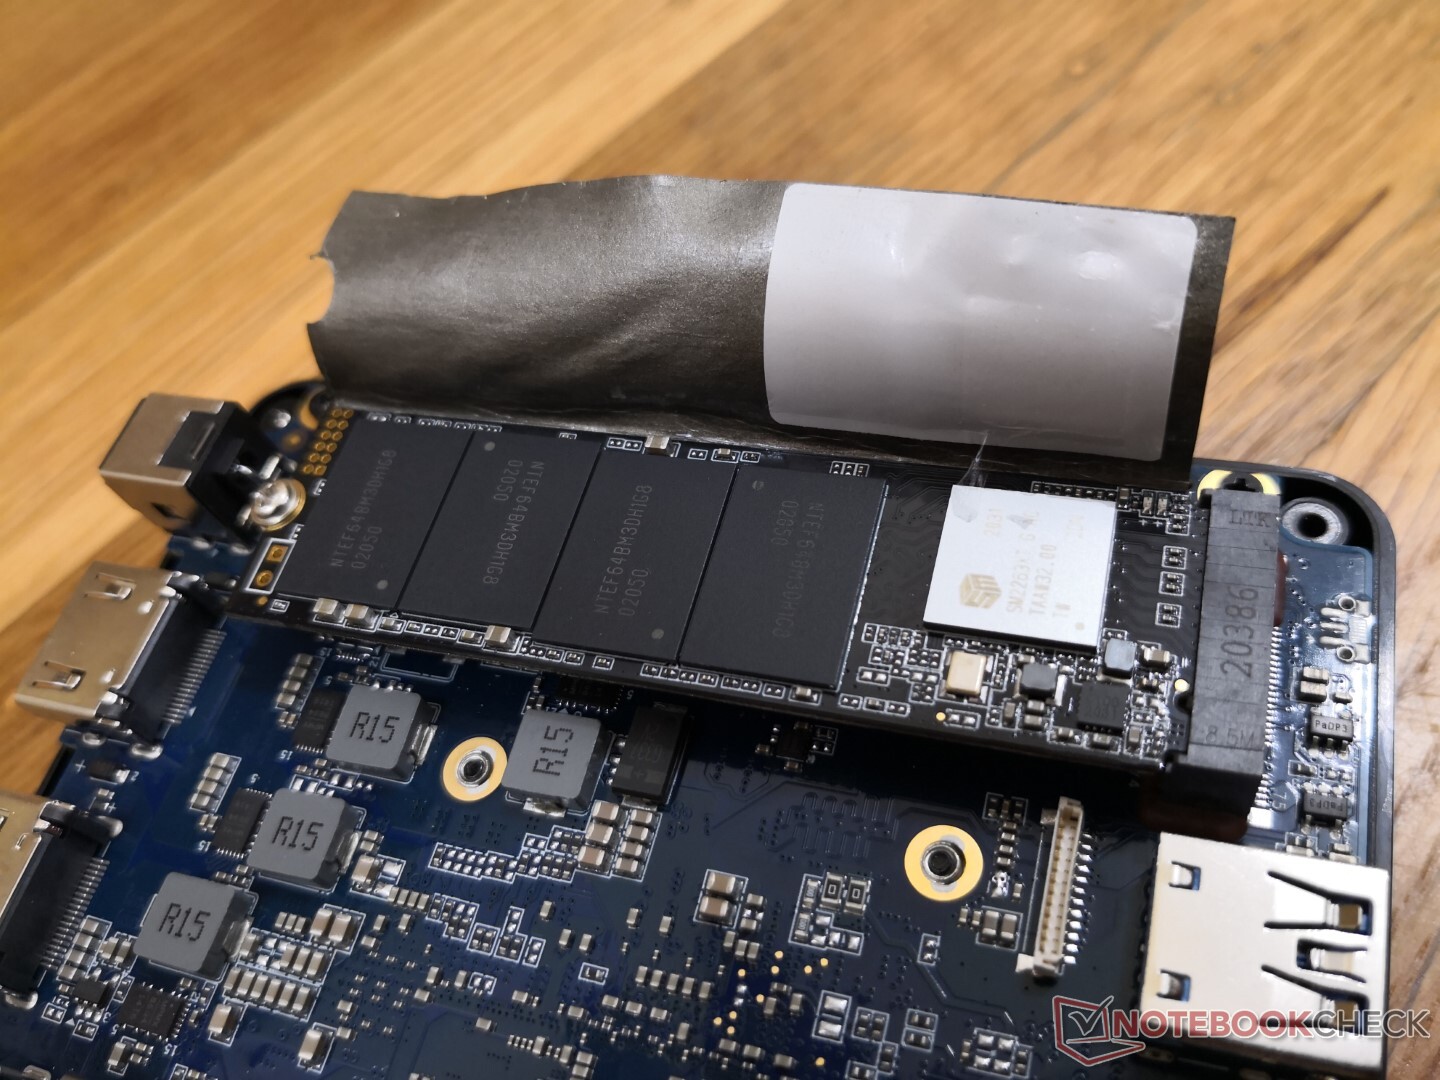
Maintenance
Four Philips screws are hidden underneath the rubber feet for relatively easy servicing. Once inside, users will see 1x M.2 2280, 1x 2.5-inch SATA III bay, and 2x DDR4 SODIMM slots. The cable for the 2.5-inch SATA III drive comes disconnected by default.
Accessories and Warranty
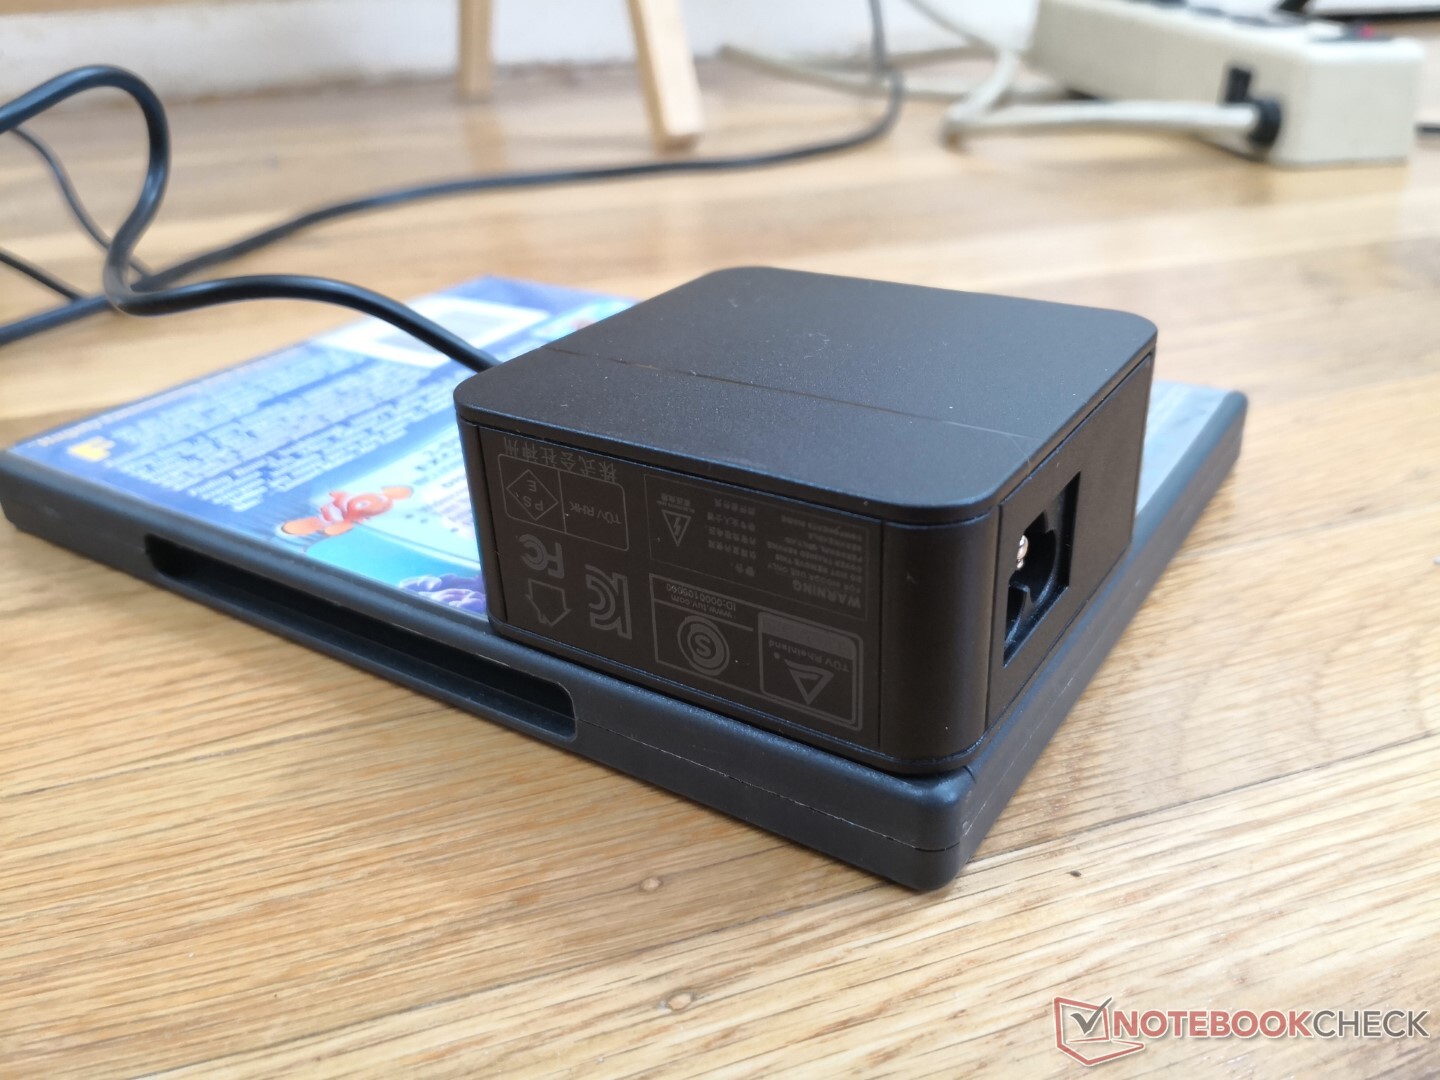
There are no extras in the box outside of the AC adapter and paperwork meaning users will have to supply their own VESA screws if they wish to mount the PC. Users may have to pay for overseas shipping and handling if claiming warranty.
Performance
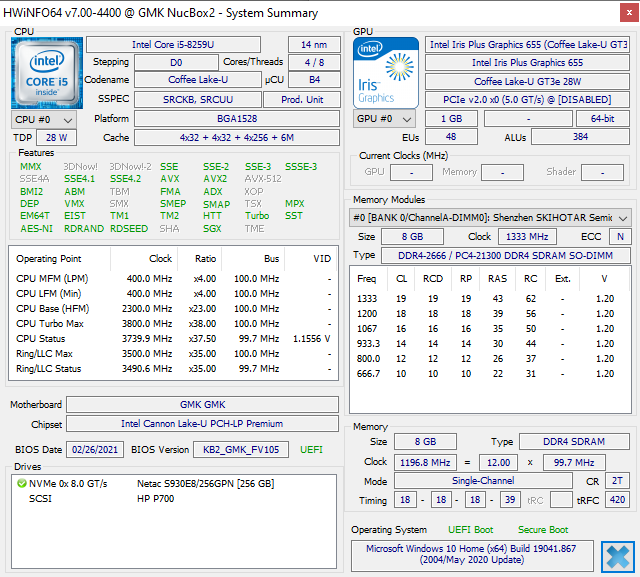
Cheap mini PCs like the Chuwi GBox tend to come with Celeron CPUs which are much slower than most Core series options. Meanwhile, pricier mini PCs like the Intel NUC come with the latest top-of-the-line Core i5/i7 CPUs. The NucBox 2 takes a middle-ground approach by utilizing older 8th gen Coffee Lake-U CPUs instead of the newer 11th gen Tiger Lake-U processors.
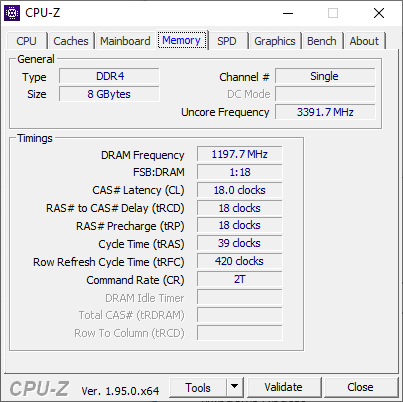
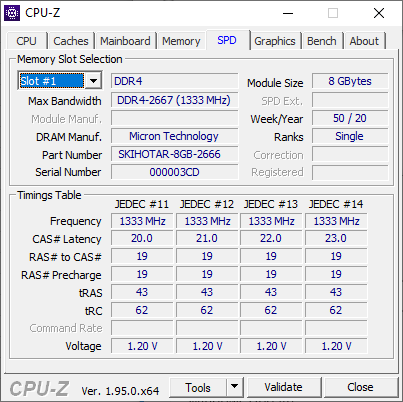
Our unit ships with a removable 8 GB DDR4 2666 MHz RAM module. Users can upgrade up to 32 GB across both SODIMM slots.
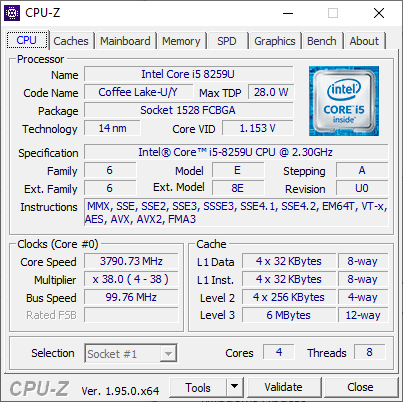
Processor
Raw CPU performance is most similar to the Core i5-8250U while being well above the Celeron J4125 and Core i3-1005G1 as found on the NucBox K1 and Beelink SEi10, respectively. Our Core i5-8259U is a middle-of-the-line processor that's about 15 to 25 percent slower than the Core i7-8559U directly above it. Performance stability is also good with no steep drops in clock rates after multiple loops of CineBench R15 xT.
Cinebench R20: CPU (Multi Core) | CPU (Single Core)
Blender: v2.79 BMW27 CPU
7-Zip 18.03: 7z b 4 -mmt1 | 7z b 4
Geekbench 5.5: Single-Core | Multi-Core
HWBOT x265 Benchmark v2.2: 4k Preset
LibreOffice : 20 Documents To PDF
R Benchmark 2.5: Overall mean
| Cinebench R15 / CPU Multi 64Bit | |
| Lenovo Yoga Slim 7 14ARE05 82A20008GE | |
| Intel NUC11PAQi7 | |
| HP Envy x360 15-ee0257ng | |
| Intel NUC8i7BE | |
| GPD Win 3 | |
| Average Intel Core i5-8259U (575 - 687, n=7) | |
| GMK NucBox 2 | |
| Lenovo Yoga C930-13IKB | |
| Zotac ZBox MI643 | |
| Beelink SEi10 | |
| GMK NucBox K1 | |
| Chuwi LarkBook CWI509 | |
| Apple MacBook 12 (Early 2016) 1.1 GHz | |
| Cinebench R20 / CPU (Multi Core) | |
| Lenovo Yoga Slim 7 14ARE05 82A20008GE | |
| Intel NUC11PAQi7 | |
| HP Envy x360 15-ee0257ng | |
| GPD Win 3 | |
| Intel NUC8i7BE | |
| Average Intel Core i5-8259U (1385 - 1567, n=5) | |
| GMK NucBox 2 | |
| Zotac ZBox MI643 | |
| Beelink SEi10 | |
| Chuwi LarkBook CWI509 | |
| GMK NucBox K1 | |
| Cinebench R20 / CPU (Single Core) | |
| Intel NUC11PAQi7 | |
| GPD Win 3 | |
| Lenovo Yoga Slim 7 14ARE05 82A20008GE | |
| Intel NUC8i7BE | |
| HP Envy x360 15-ee0257ng | |
| Zotac ZBox MI643 | |
| Beelink SEi10 | |
| GMK NucBox 2 | |
| Average Intel Core i5-8259U (369 - 386, n=5) | |
| Chuwi LarkBook CWI509 | |
| GMK NucBox K1 | |
| Blender / v2.79 BMW27 CPU | |
| GMK NucBox K1 | |
| Beelink SEi10 | |
| Zotac ZBox MI643 | |
| GMK NucBox 2 | |
| HP Envy x360 15-ee0257ng | |
| Average Intel Core i5-8259U (688 - 769, n=6) | |
| Intel NUC8i7BE | |
| Intel NUC8i7BE | |
| GPD Win 3 | |
| Lenovo Yoga Slim 7 14ARE05 82A20008GE | |
| Intel NUC11PAQi7 | |
| 7-Zip 18.03 / 7z b 4 -mmt1 | |
| Intel NUC8i7BE | |
| Intel NUC8i7BE | |
| Intel NUC11PAQi7 | |
| GPD Win 3 | |
| Zotac ZBox MI643 | |
| Lenovo Yoga Slim 7 14ARE05 82A20008GE | |
| HP Envy x360 15-ee0257ng | |
| Beelink SEi10 | |
| GMK NucBox 2 | |
| Average Intel Core i5-8259U (3753 - 4022, n=6) | |
| GMK NucBox K1 | |
| Chuwi LarkBook CWI509 | |
| Geekbench 5.5 / Single-Core | |
| Intel NUC11PAQi7 | |
| GPD Win 3 | |
| Zotac ZBox MI643 | |
| Lenovo Yoga Slim 7 14ARE05 82A20008GE | |
| Beelink SEi10 | |
| HP Envy x360 15-ee0257ng | |
| GMK NucBox 2 | |
| Average Intel Core i5-8259U (948 - 984, n=3) | |
| Intel NUC8i7BE | |
| Chuwi LarkBook CWI509 | |
| GMK NucBox K1 | |
| Geekbench 5.5 / Multi-Core | |
| Lenovo Yoga Slim 7 14ARE05 82A20008GE | |
| HP Envy x360 15-ee0257ng | |
| Intel NUC11PAQi7 | |
| GPD Win 3 | |
| Zotac ZBox MI643 | |
| Intel NUC8i7BE | |
| Average Intel Core i5-8259U (3359 - 3839, n=3) | |
| GMK NucBox 2 | |
| Beelink SEi10 | |
| Chuwi LarkBook CWI509 | |
| GMK NucBox K1 | |
| HWBOT x265 Benchmark v2.2 / 4k Preset | |
| Lenovo Yoga Slim 7 14ARE05 82A20008GE | |
| Intel NUC11PAQi7 | |
| GPD Win 3 | |
| Intel NUC8i7BE | |
| Intel NUC8i7BE | |
| HP Envy x360 15-ee0257ng | |
| GMK NucBox 2 | |
| Average Intel Core i5-8259U (4.72 - 5.49, n=6) | |
| Zotac ZBox MI643 | |
| Beelink SEi10 | |
| GMK NucBox K1 | |
| Chuwi LarkBook CWI509 | |
| LibreOffice / 20 Documents To PDF | |
| Chuwi LarkBook CWI509 | |
| GMK NucBox K1 | |
| HP Envy x360 15-ee0257ng | |
| Average Intel Core i5-8259U (62.7 - 76, n=5) | |
| Lenovo Yoga Slim 7 14ARE05 82A20008GE | |
| GMK NucBox 2 | |
| Zotac ZBox MI643 | |
| Beelink SEi10 | |
| GPD Win 3 | |
| Intel NUC11PAQi7 | |
| R Benchmark 2.5 / Overall mean | |
| Chuwi LarkBook CWI509 | |
| GMK NucBox K1 | |
| GMK NucBox 2 | |
| Average Intel Core i5-8259U (0.738 - 0.818, n=5) | |
| Beelink SEi10 | |
| Zotac ZBox MI643 | |
| GPD Win 3 | |
| Intel NUC8i7BE | |
| Lenovo Yoga Slim 7 14ARE05 82A20008GE | |
| HP Envy x360 15-ee0257ng | |
| Intel NUC11PAQi7 | |
Cinebench R20: CPU (Multi Core) | CPU (Single Core)
Blender: v2.79 BMW27 CPU
7-Zip 18.03: 7z b 4 -mmt1 | 7z b 4
Geekbench 5.5: Single-Core | Multi-Core
HWBOT x265 Benchmark v2.2: 4k Preset
LibreOffice : 20 Documents To PDF
R Benchmark 2.5: Overall mean
* ... smaller is better
System Performance
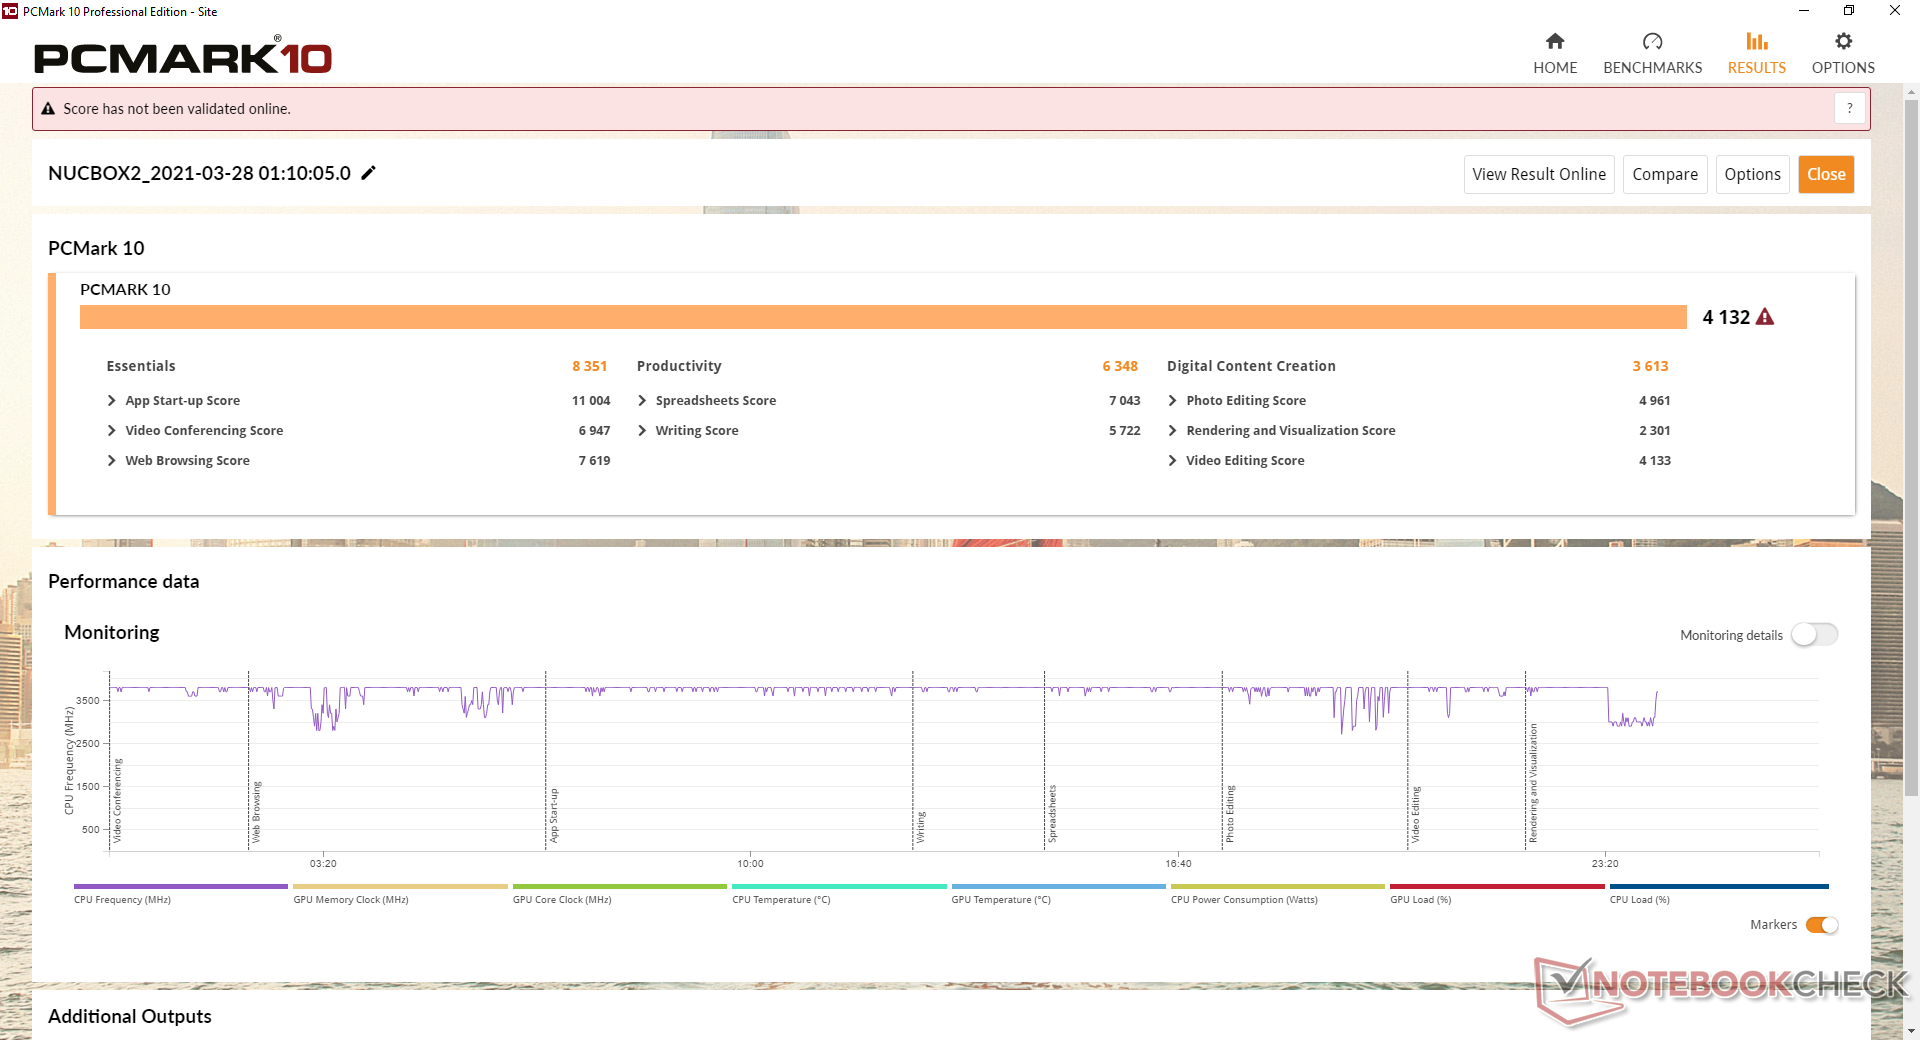
| PCMark 10 Score | 4132 points | |
Help | ||
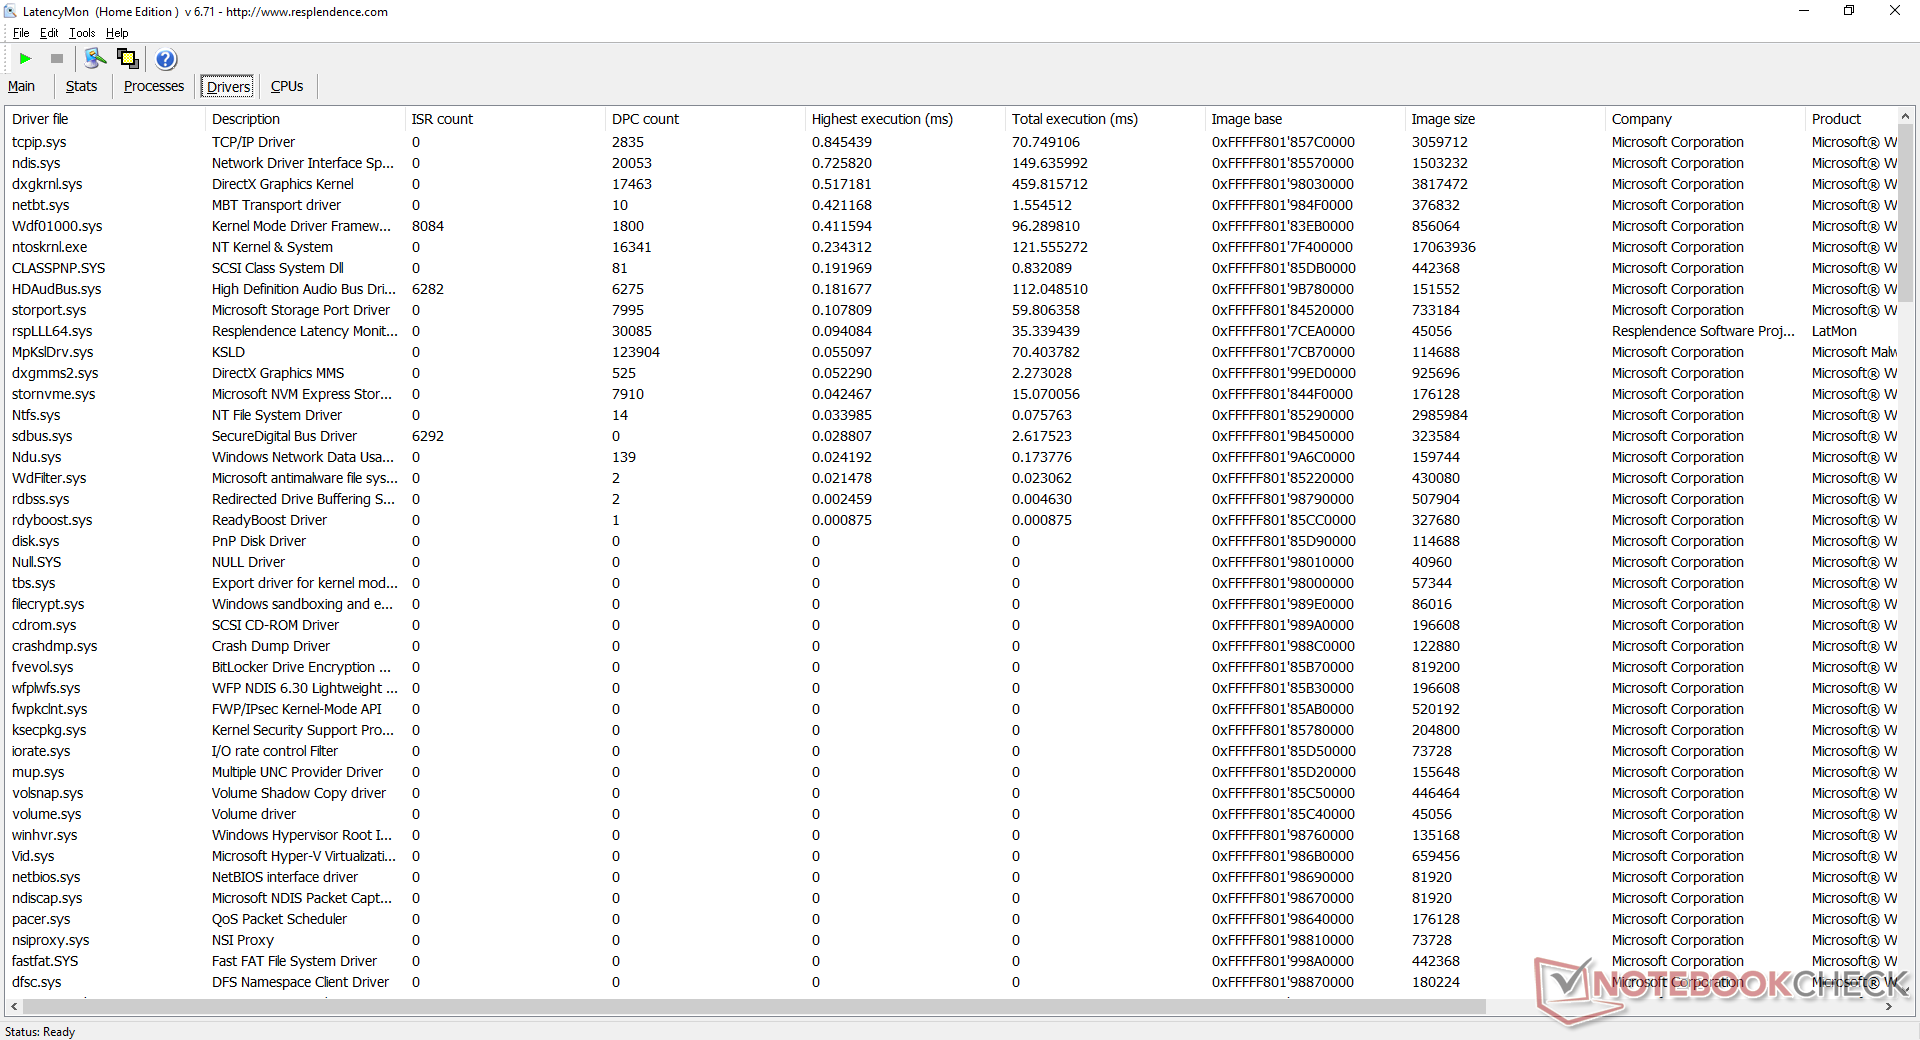
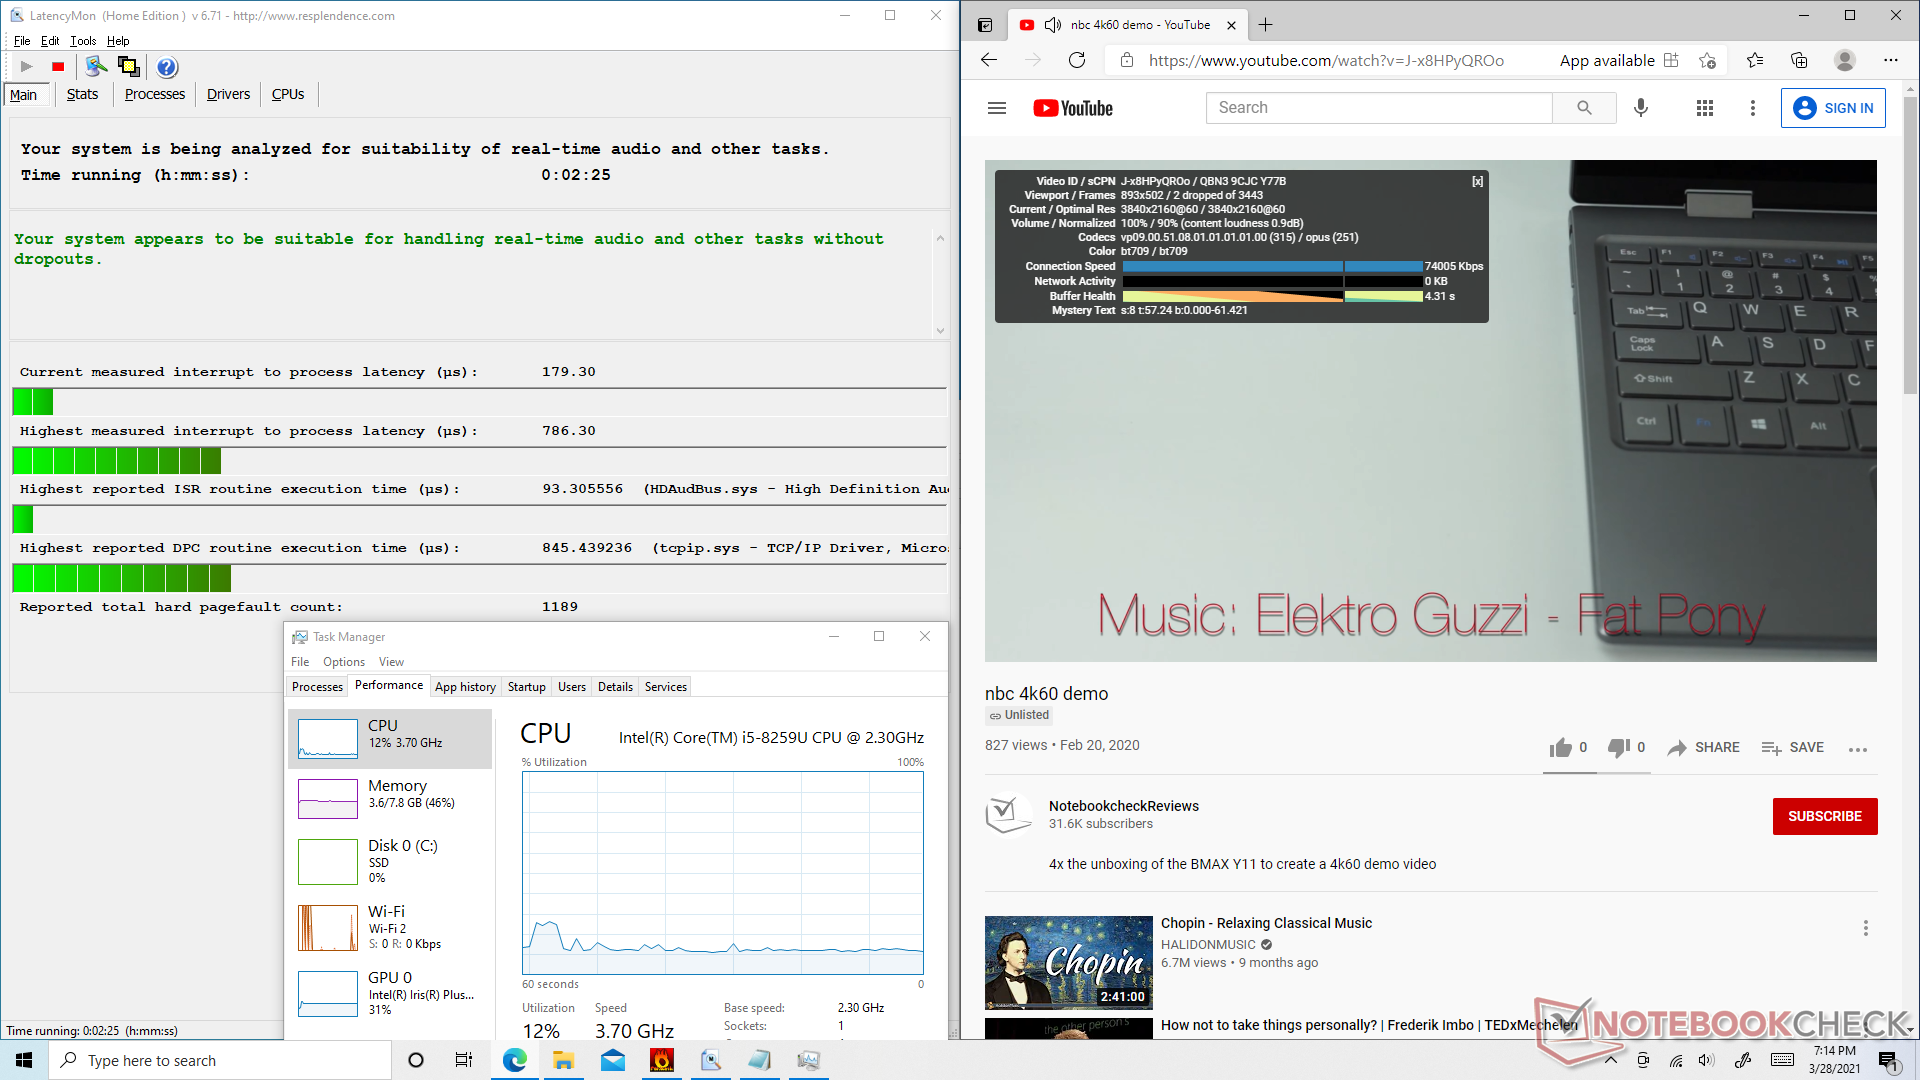
DPC Latency
LatencyMon shows no major DPC latency issues when opening multiple browser tabs on our homepage. 4K UHD playback at 60 FPS is also smooth with just two dropped frames during our minute-long YouTube test.
| DPC Latencies / LatencyMon - interrupt to process latency (max), Web, Youtube, Prime95 | |
| GMK NucBox K1 | |
| Beelink SEi10 | |
| GMK NucBox 2 | |
| Zotac ZBox MI643 | |
| Intel NUC11PAQi7 | |
* ... smaller is better
Storage Devices
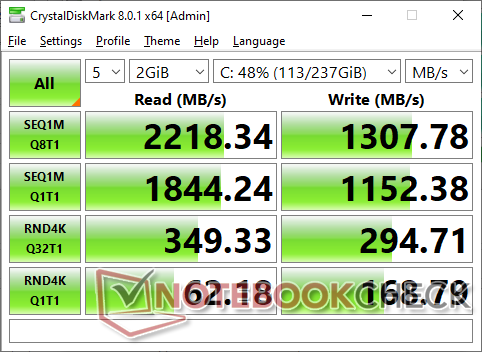
A 256 GB Netac S930E8 NVMe SSD is included with the option to add a 2.5-inch SATA III drive for additional storage. Transfer rates are quite good for a 256 GB NVMe SSD especially from this lesser-known manufacturer, but our DiskSpd loop test shows it may have trouble maintaining maximum performance levels over long periods.
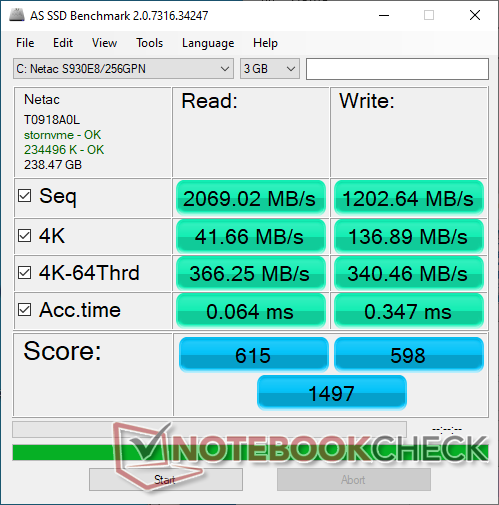
| GMK NucBox 2 Netac S930E8/256GPN | Intel NUC11PAQi7 Samsung SSD 980 Pro 500GB MZ-V8P500BW | Zotac ZBox MI643 Lexar NM610 1TB | GPD Win 3 BIWIN NS200 1TB CNF82GS1G02-1TB | |
|---|---|---|---|---|
| AS SSD | 209% | 45% | 99% | |
| Seq Read (MB/s) | 2069 | 3257 57% | 1511 -27% | 1585 -23% |
| Seq Write (MB/s) | 1203 | 3937 227% | 1558 30% | 1776 48% |
| 4K Read (MB/s) | 41.66 | 51.3 23% | 43.77 5% | 61.6 48% |
| 4K Write (MB/s) | 136.9 | 75.7 -45% | 119.5 -13% | 208.9 53% |
| 4K-64 Read (MB/s) | 366.3 | 2283 523% | 839 129% | 1142 212% |
| 4K-64 Write (MB/s) | 340.5 | 2206 548% | 909 167% | 1103 224% |
| Access Time Read * (ms) | 0.064 | 0.056 12% | 0.032 50% | 0.03 53% |
| Access Time Write * (ms) | 0.347 | 0.154 56% | 0.242 30% | 0.074 79% |
| Score Read (Points) | 615 | 2660 333% | 1034 68% | 1362 121% |
| Score Write (Points) | 598 | 2676 347% | 1185 98% | 1489 149% |
| Score Total (Points) | 1497 | 6725 349% | 2760 84% | 3573 139% |
| Copy ISO MB/s (MB/s) | 1186 | 2030 71% | 1373 16% | 1741 47% |
| Copy Program MB/s (MB/s) | 428.6 | 883 106% | 280.4 -35% | 543 27% |
| Copy Game MB/s (MB/s) | 435.7 | 1817 317% | 531 22% | 1318 203% |
| CrystalDiskMark 5.2 / 6 | 153% | 9% | 39% | |
| Write 4K (MB/s) | 178.4 | 244.6 37% | 214.1 20% | 223 25% |
| Read 4K (MB/s) | 61 | 80.4 32% | 62.1 2% | 66.5 9% |
| Write Seq (MB/s) | 1040 | 4094 294% | 1664 60% | 1857 79% |
| Read Seq (MB/s) | 1919 | 4099 114% | 1797 -6% | 1737 -9% |
| Write 4K Q32T1 (MB/s) | 417.7 | 715 71% | 421.8 1% | 611 46% |
| Read 4K Q32T1 (MB/s) | 325.6 | 783 140% | 512 57% | 688 111% |
| Write Seq Q32T1 (MB/s) | 1144 | 5065 343% | 564 -51% | 1948 70% |
| Read Seq Q32T1 (MB/s) | 2379 | 6884 189% | 2073 -13% | 1995 -16% |
| Total Average (Program / Settings) | 181% /
188% | 27% /
32% | 69% /
77% |
* ... smaller is better

Disk Throttling: DiskSpd Read Loop, Queue Depth 8
GPU Performance
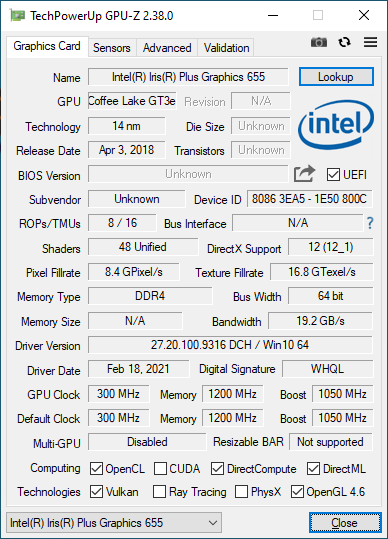
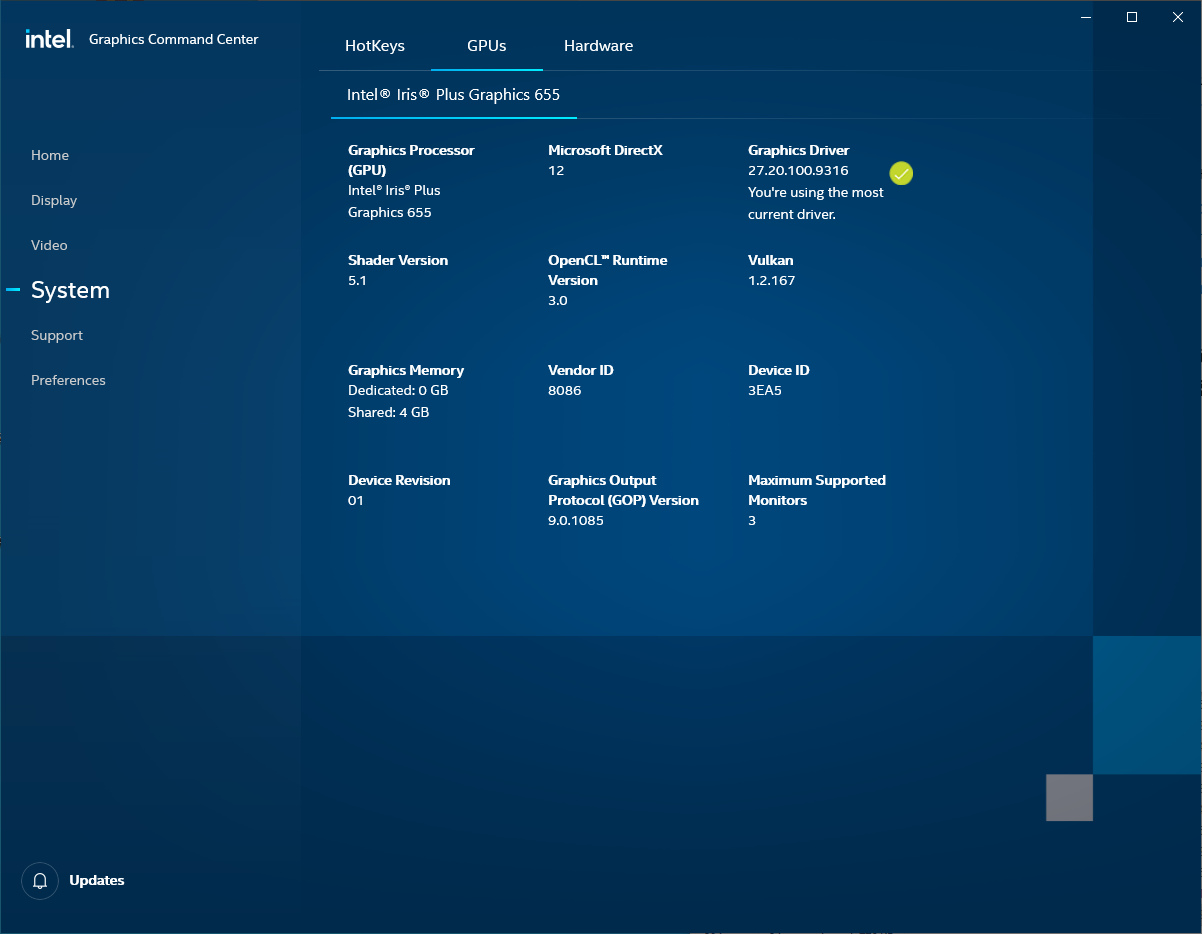
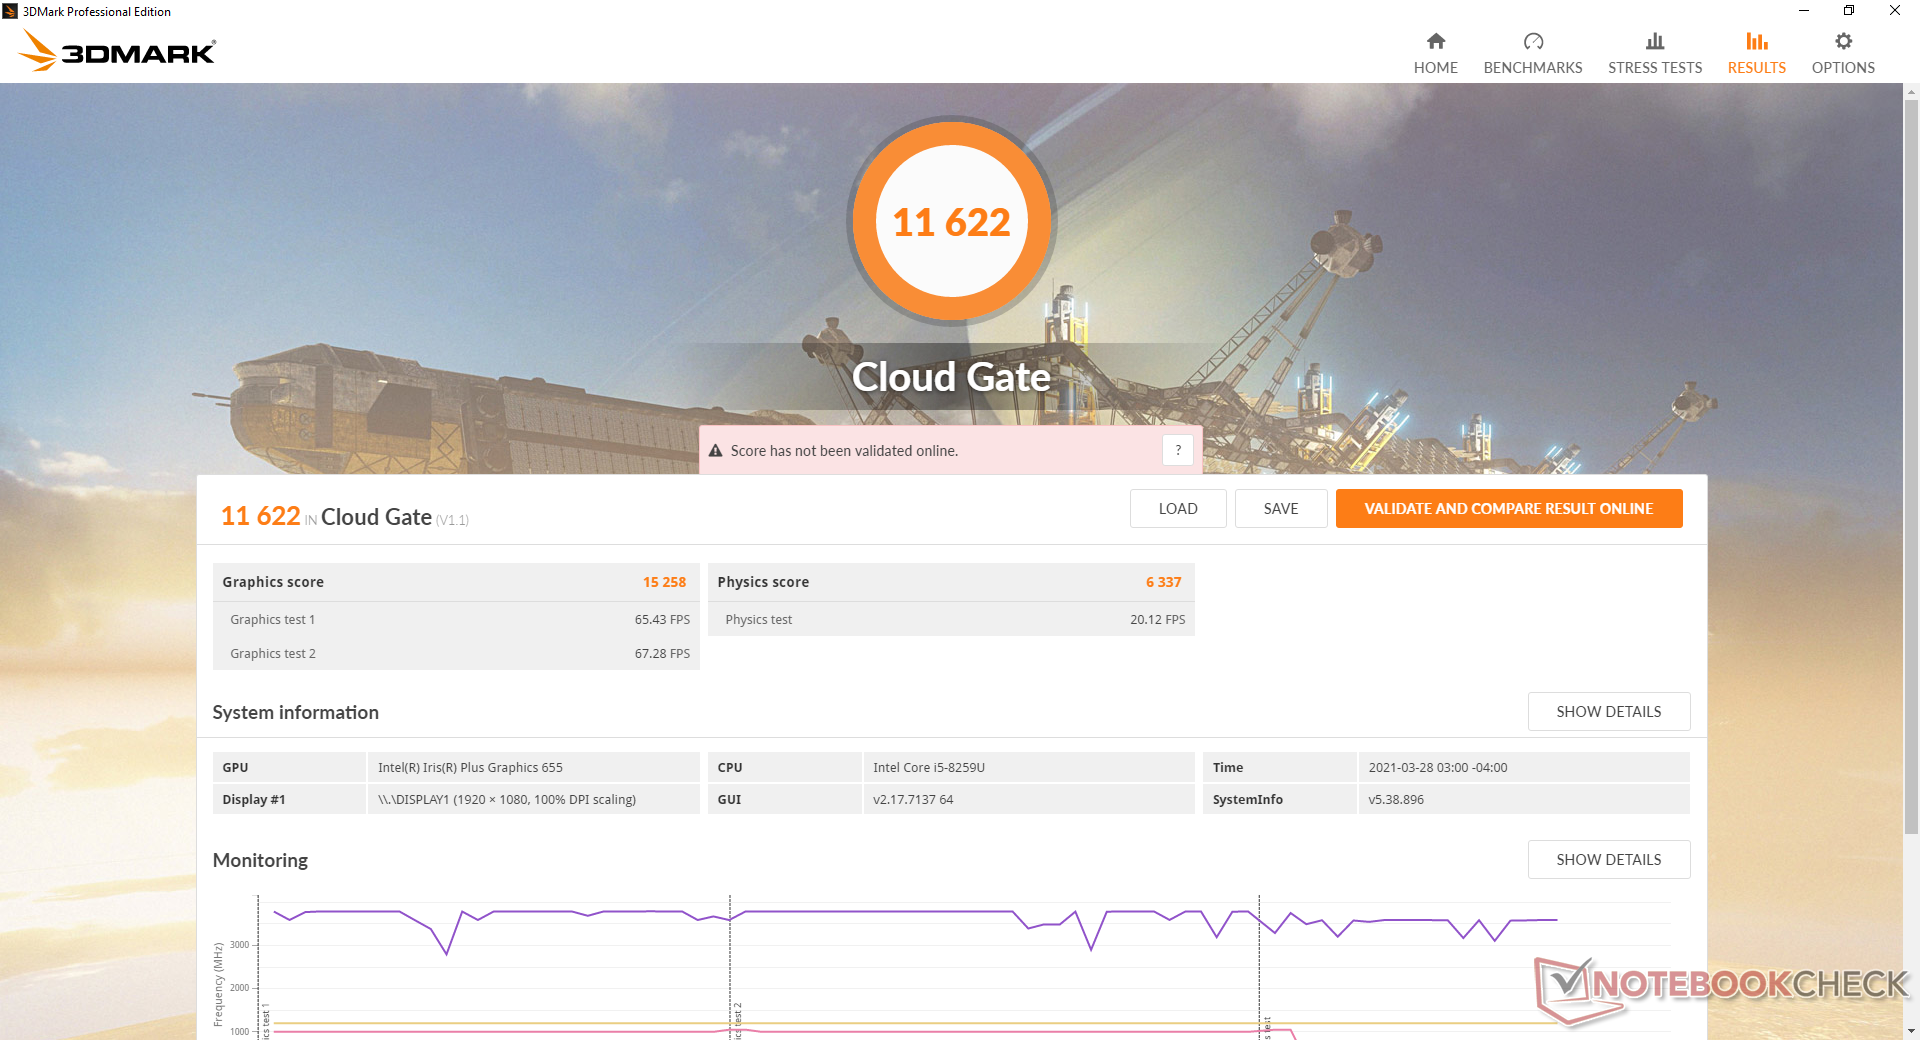
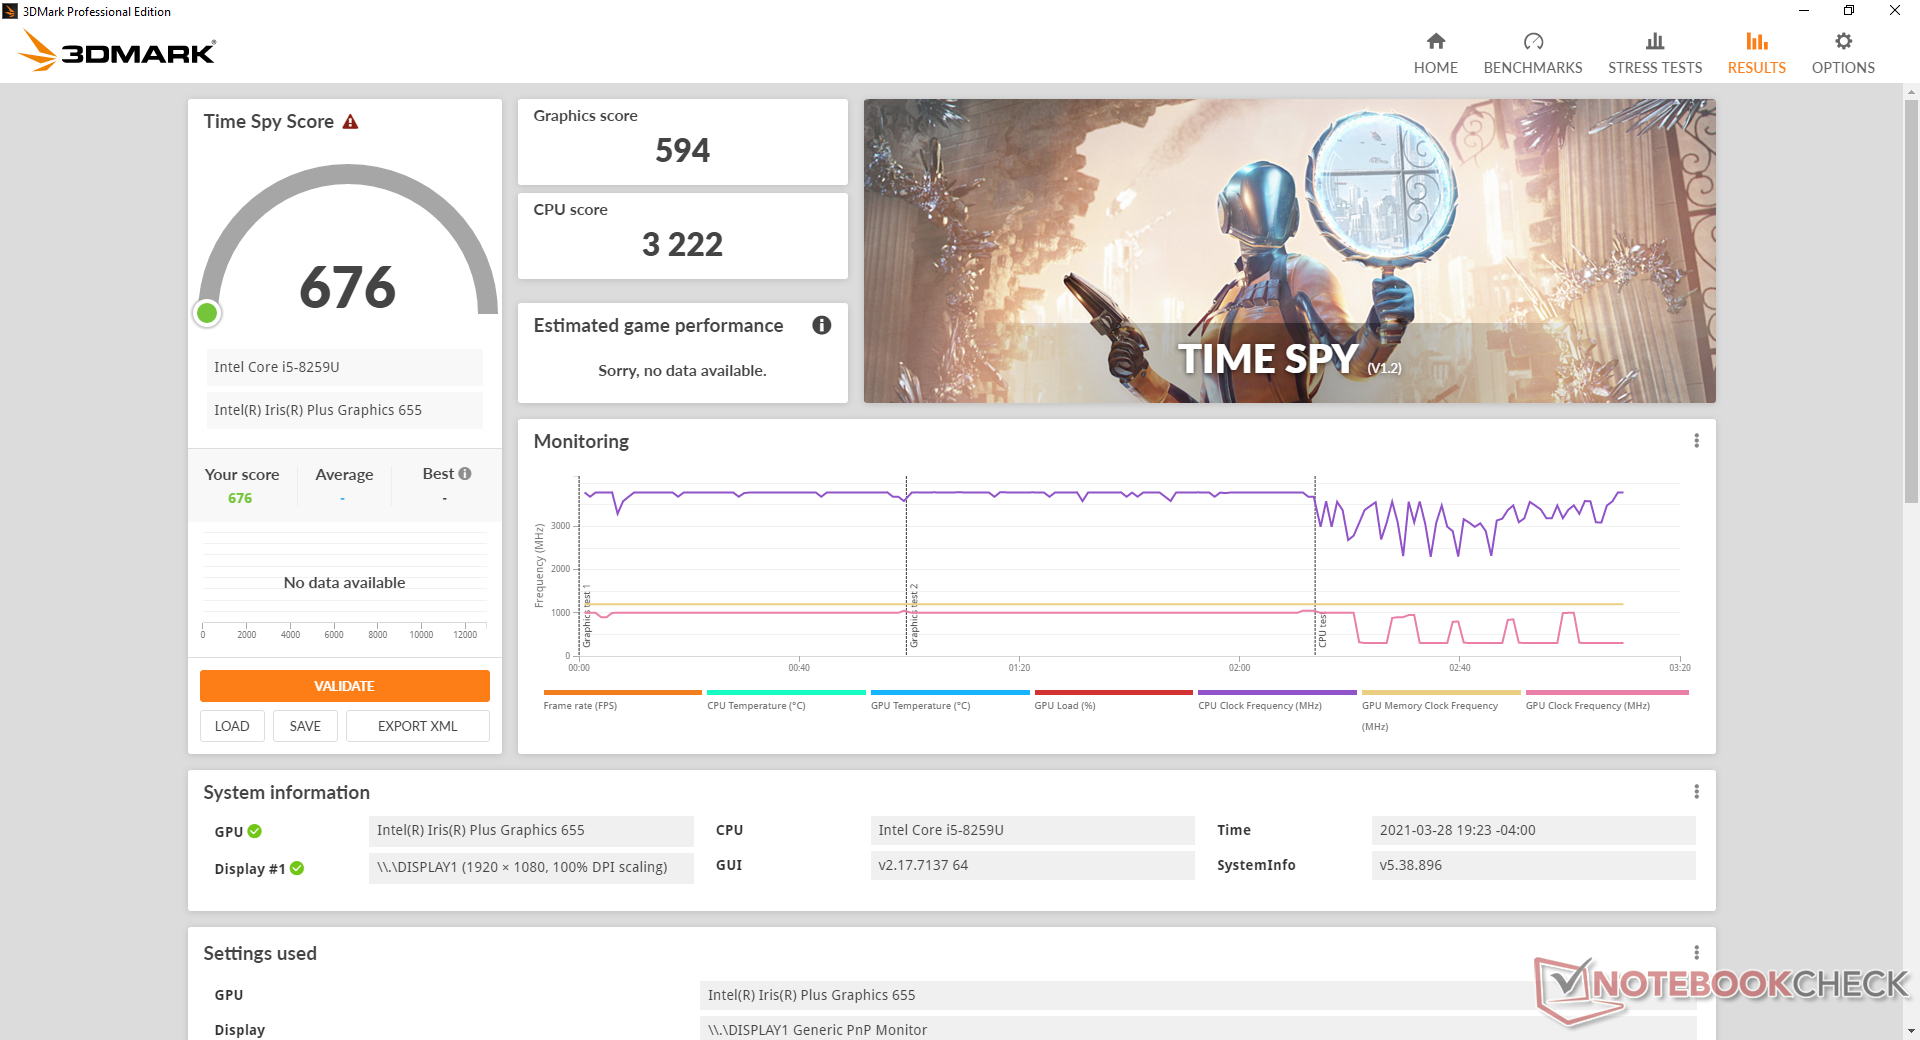
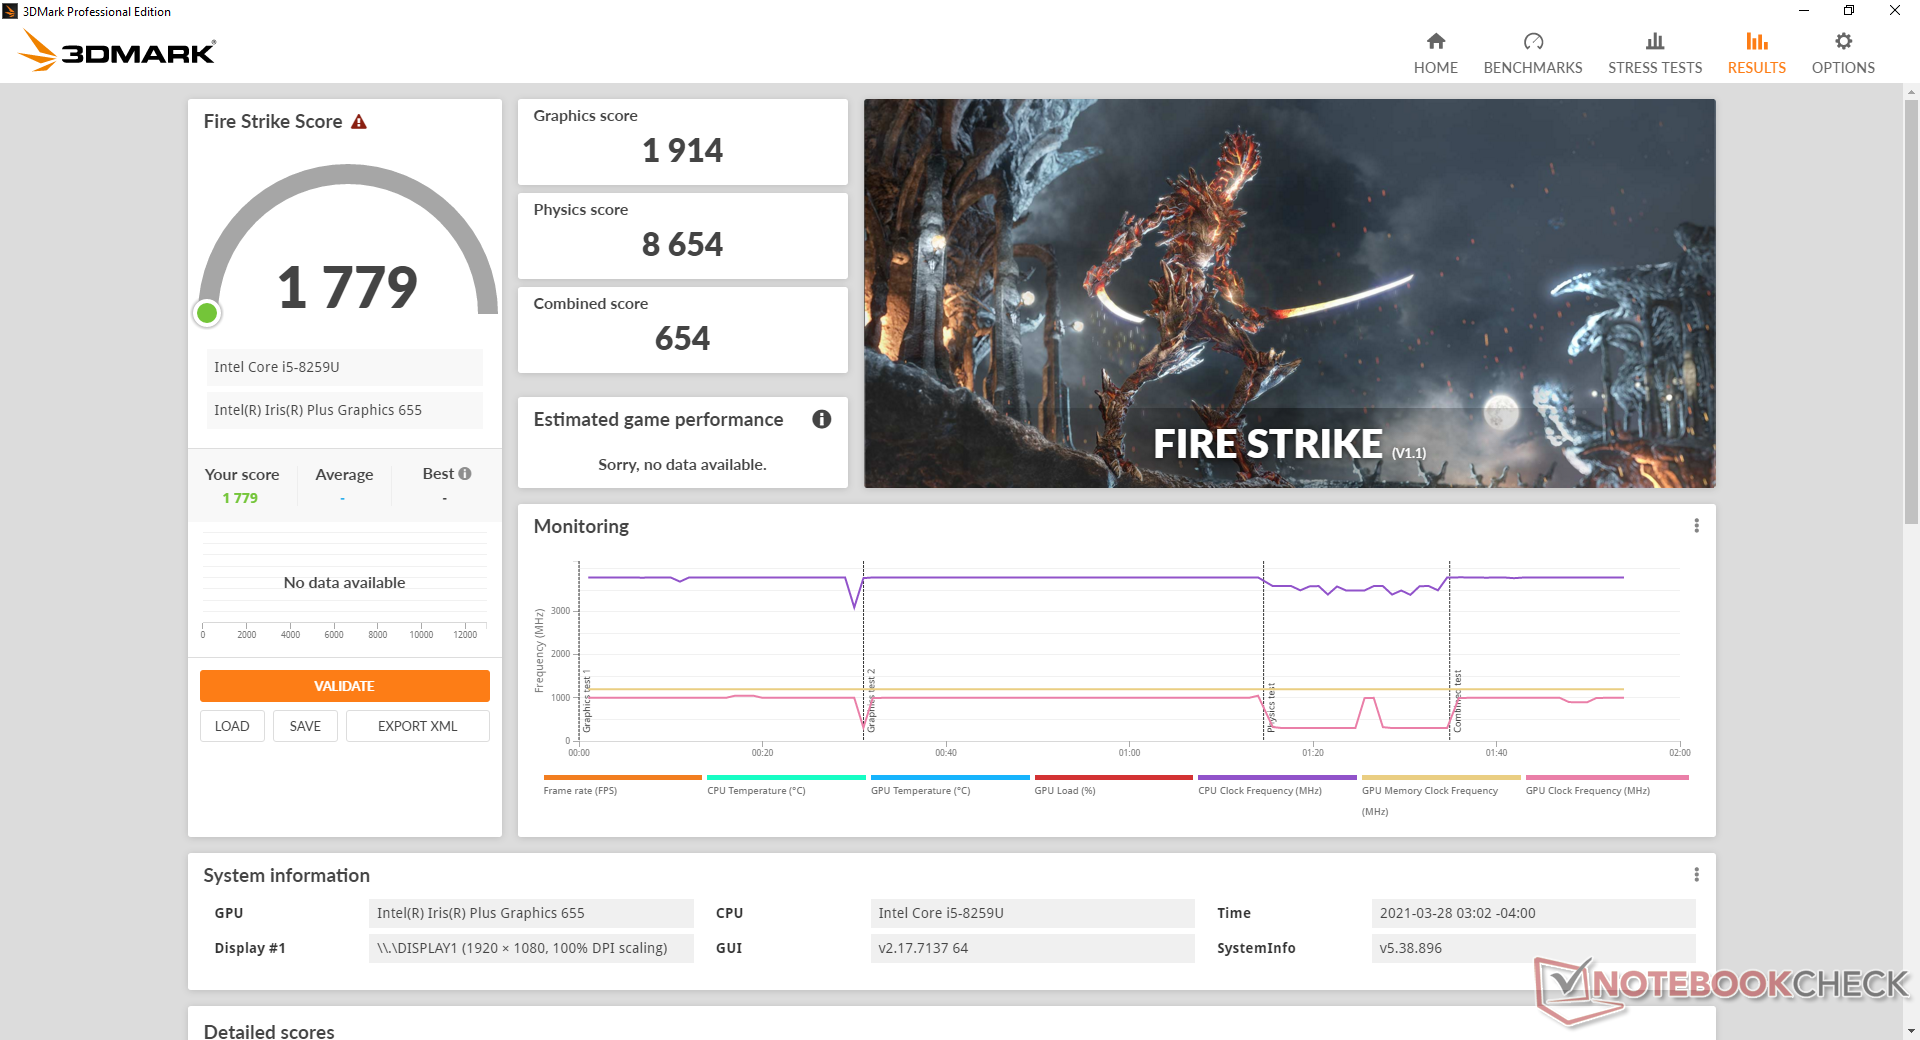
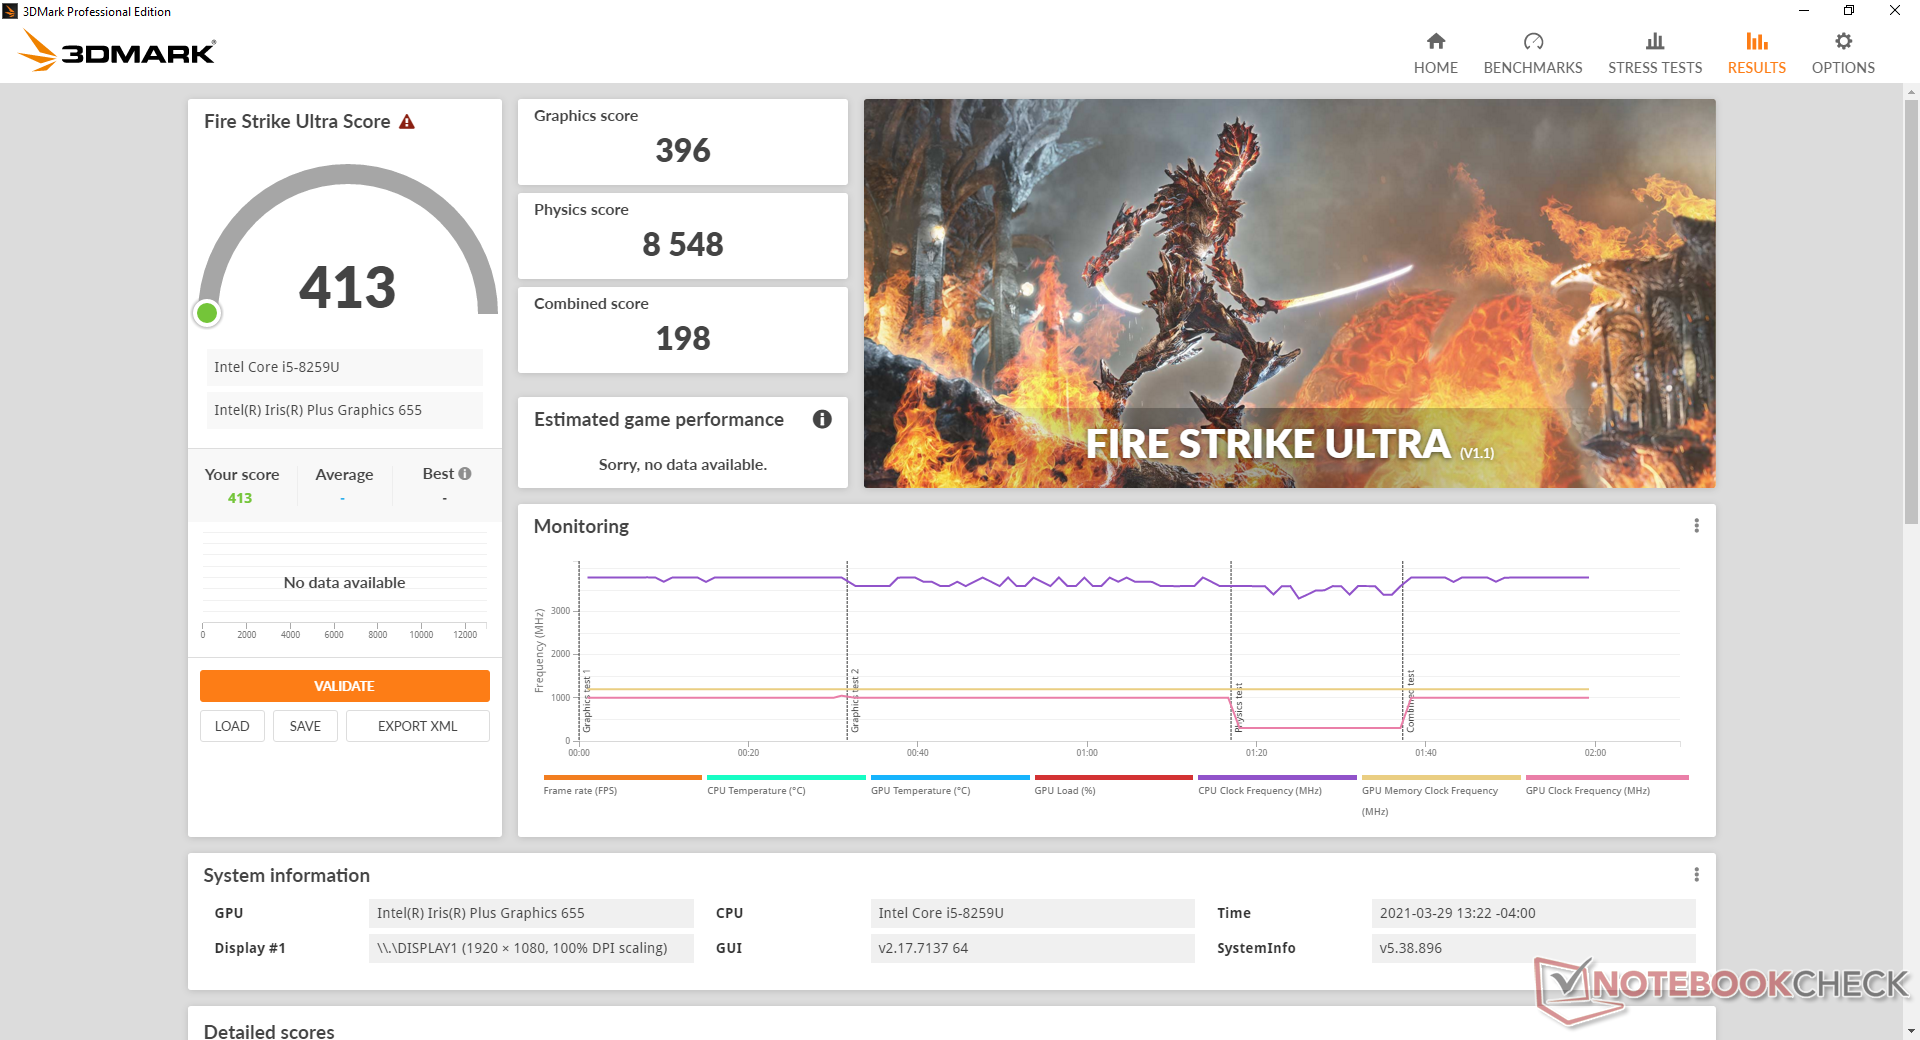
Graphics performance sits in between the older UHD Graphics 620 and newer 10th gen Ice Lake Iris Plus G7 graphics. The latest 11th gen Tiger Lake Iris Xe solution is even faster, but also much more expensive. The extra horsepower over the UHD Graphics 620 is helpful for light editing and 4K output much like on the 2018 MacBook Pro 13. Keep in mind that the Iris Plus Graphics 655 hasn't aged very well when compared to even the Radeon RX Vega series.
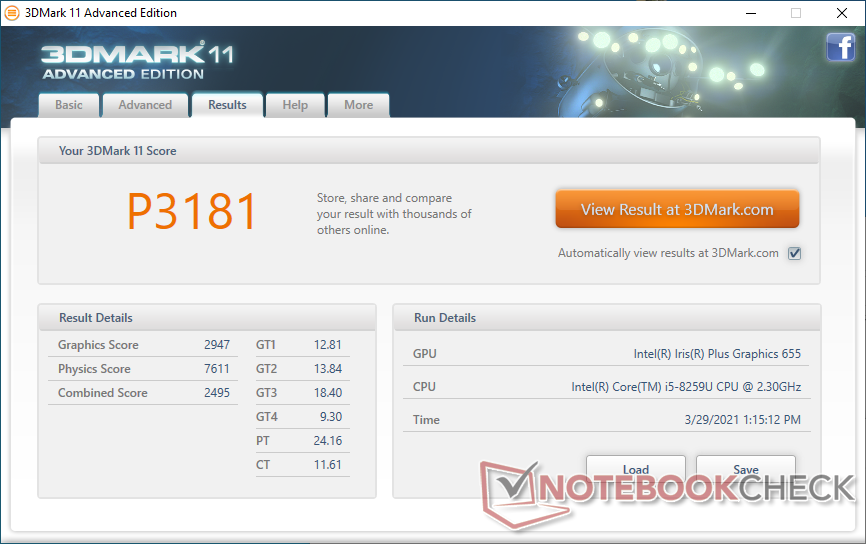
| 3DMark 11 Performance | 3181 points | |
| 3DMark Cloud Gate Standard Score | 11622 points | |
| 3DMark Fire Strike Score | 1779 points | |
| 3DMark Time Spy Score | 676 points | |
Help | ||
| Final Fantasy XV Benchmark | |
| 1280x720 Lite Quality | |
| GPD Win 3 | |
| Intel NUC11PAQi7 | |
| GMK NucBox 2 | |
| Intel NUC8i7BE | |
| Average Intel Iris Plus Graphics 655 (9.11 - 18.1, n=8) | |
| Apple MacBook Pro 13 2018 Touchbar i5 | |
| 1920x1080 Standard Quality | |
| GPD Win 3 | |
| Intel NUC11PAQi7 | |
| GMK NucBox 2 | |
| Average Intel Iris Plus Graphics 655 (7.88 - 9.73, n=4) | |
| 1920x1080 High Quality | |
| GPD Win 3 | |
| Intel NUC11PAQi7 | |
| GMK NucBox 2 | |
| Average Intel Iris Plus Graphics 655 (5.25 - 6.55, n=4) | |
| low | med. | high | ultra | |
|---|---|---|---|---|
| Dota 2 Reborn (2015) | 98 | 66 | 31.9 | 27.7 |
| Final Fantasy XV Benchmark (2018) | 17.3 | 9.07 | 6.04 | |
| X-Plane 11.11 (2018) | 25.3 | 18 | 15.9 |
Emissions
System Noise
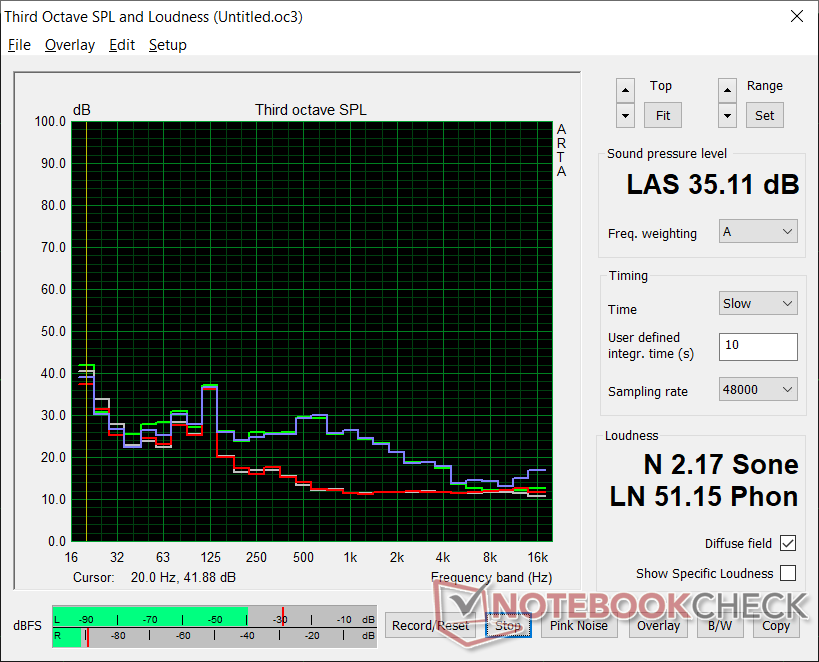
A single ~45 mm fan pulls in cool air from the bottom and expels hot air from the rear. It's almost always quiet when idling on desktop, but low loads like browsing or video streaming will quickly induce a steady fan noise of 29.1 dB(A) against a silent background of 25.6 dB(A). Higher loads like 3DMark 06 or games will induce a constant fan noise of 35 dB(A) which is still quieter than most other mini PCs under similar loads and conditions.
We're able to notice slight coil whine from our test unit only when it is powered off or on standby mode.
| GMK NucBox 2 Iris Plus Graphics 655, i5-8259U, Netac S930E8/256GPN | Intel NUC8i7BE Iris Plus Graphics 655, i7-8559U | Zotac ZBox MI643 UHD Graphics 620, i5-10210U, Lexar NM610 1TB | GMK NucBox K1 UHD Graphics 600, Celeron J4125, HIKVision C100 NGFF SSD 128GB | |
|---|---|---|---|---|
| Noise | -15% | -4% | -17% | |
| off / environment * (dB) | 25.6 | 28.7 -12% | 26.1 -2% | 27.8 -9% |
| Idle Minimum * (dB) | 25.7 | 28.7 -12% | 27.5 -7% | 27.8 -8% |
| Idle Average * (dB) | 25.7 | 29.3 -14% | 27.5 -7% | 27.8 -8% |
| Idle Maximum * (dB) | 25.7 | 31.8 -24% | 27.5 -7% | 27.8 -8% |
| Load Average * (dB) | 35.3 | 39 -10% | 28.9 18% | 46.8 -33% |
| Load Maximum * (dB) | 35.1 | 41.4 -18% | 42 -20% | 46.8 -33% |
| Witcher 3 ultra * (dB) | 39 |
* ... smaller is better
Noise level
| Idle |
| 25.7 / 25.7 / 25.7 dB(A) |
| Load |
| 35.3 / 35.1 dB(A) |
 | ||
30 dB silent 40 dB(A) audible 50 dB(A) loud |
||
min: | ||
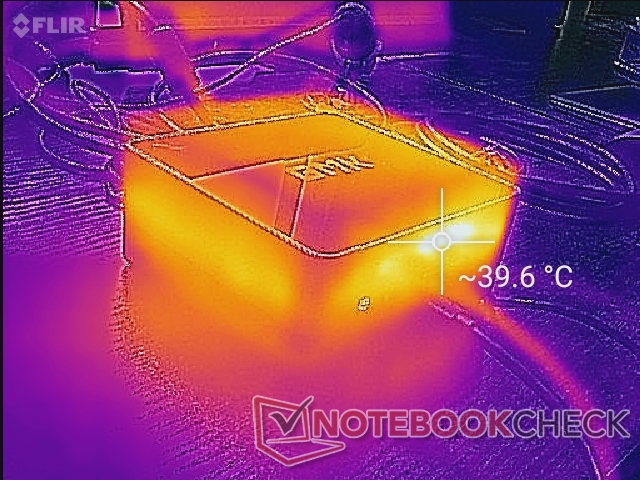
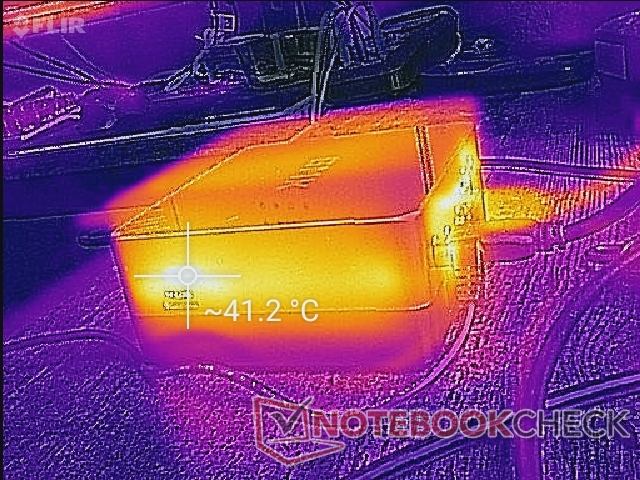
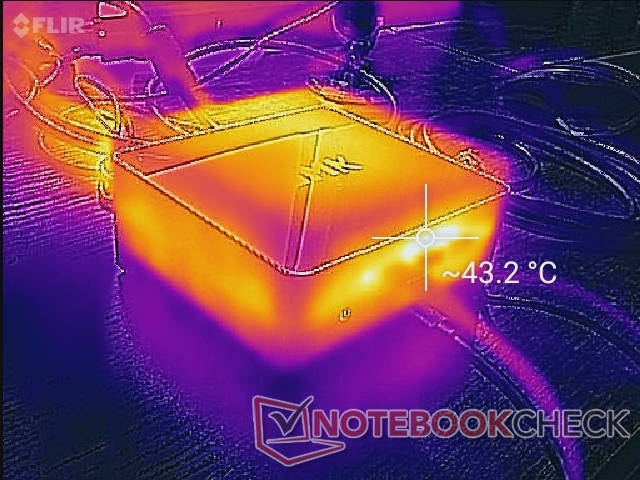
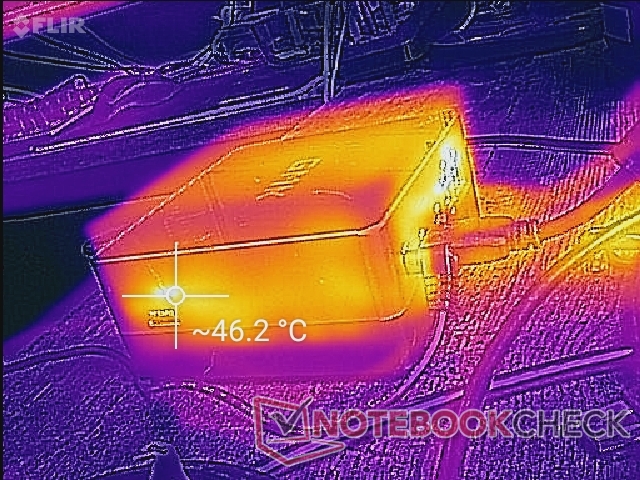
Temperature
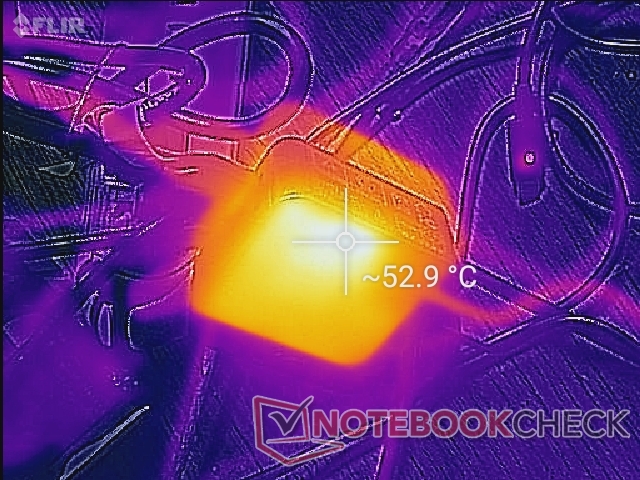
Ventilation grilles are only long the back edge of the mini PC meaning you can safely position the unit vertically or on its side without impeding the cooling solution. Surfaces are warm at about 27 C on the top surface of the system even when idling on desktop.
Stress Test
When stressed with Prime95, the CPU would simply stabilize at the 2.3 to 2.5 GHz range with no higher Turbo Boost potential. The CPU is able to reach up to 3.8 GHz but only in single-threaded workloads. Core temperature plateaus at a respectable 73 C when under very high multi-threaded loads. The processor will not throttle unless both of its CPU and integrated GPU are fully stressed.
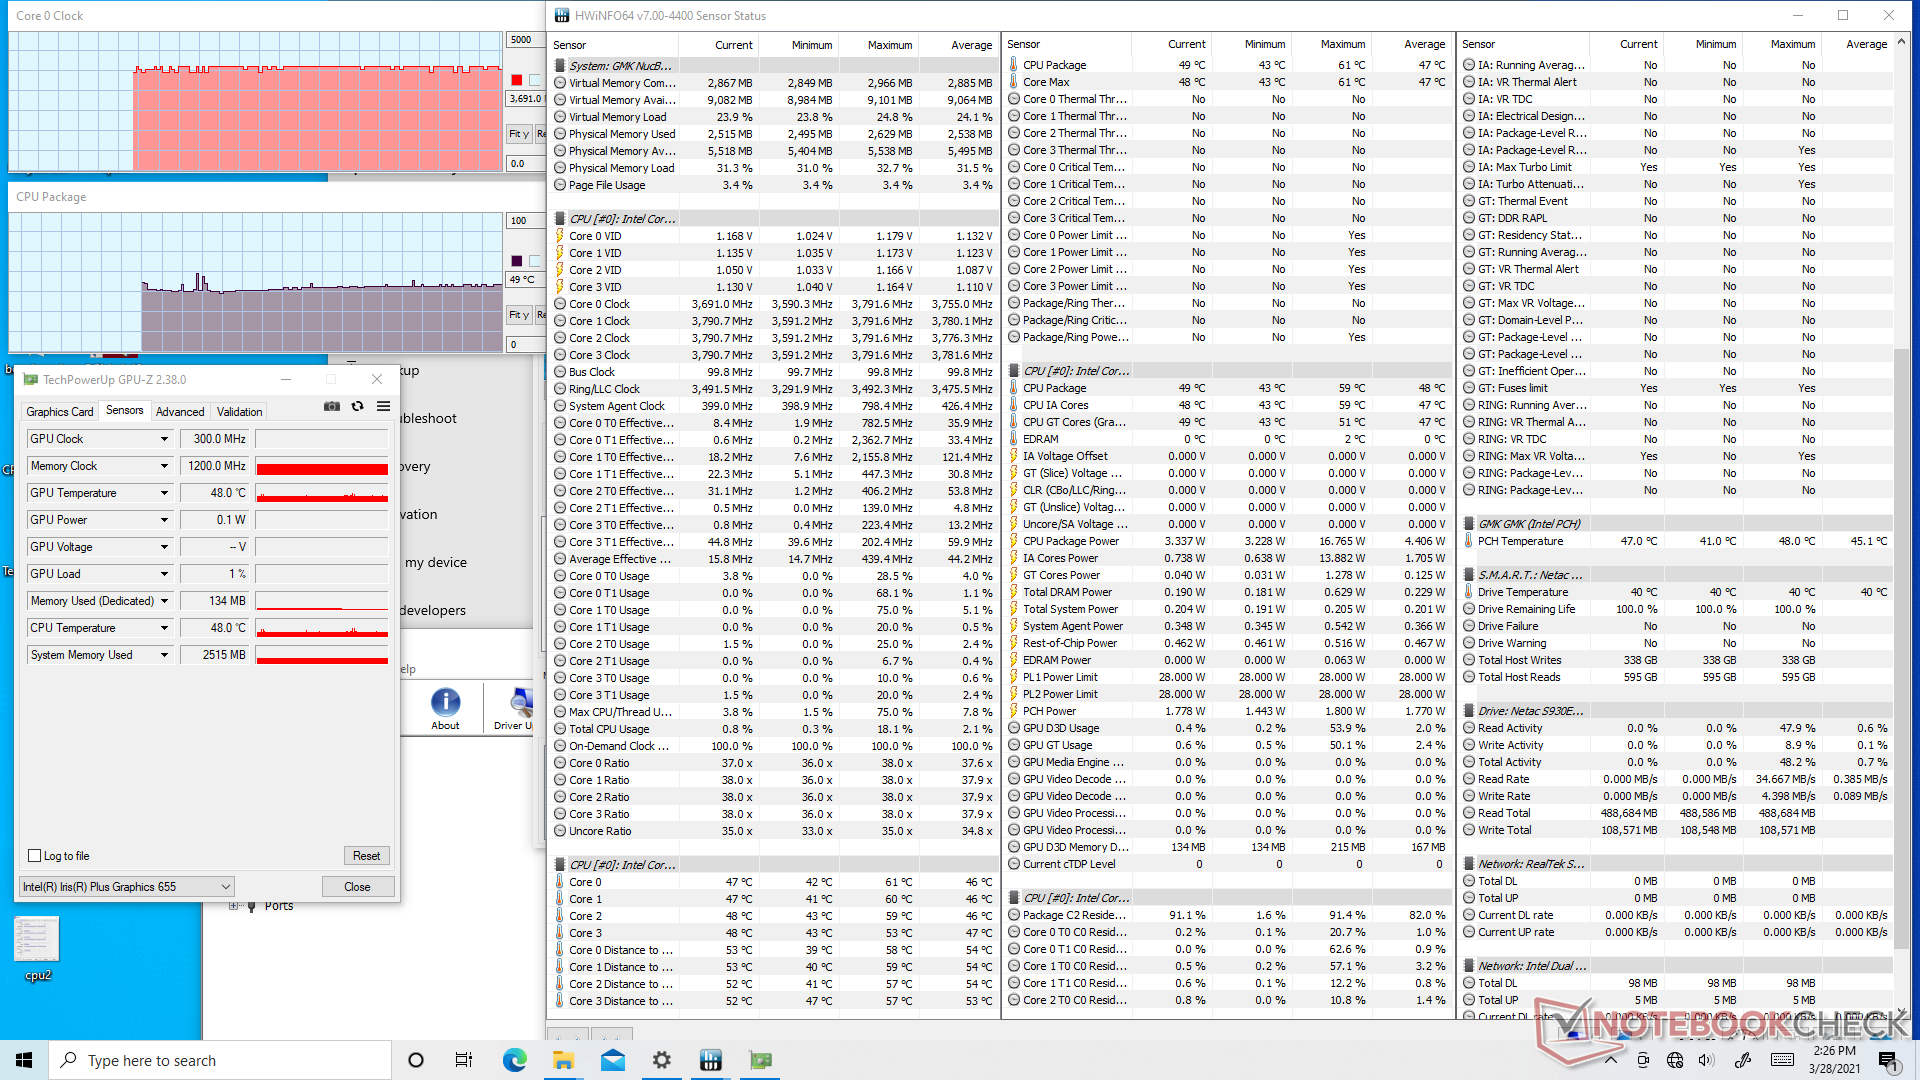
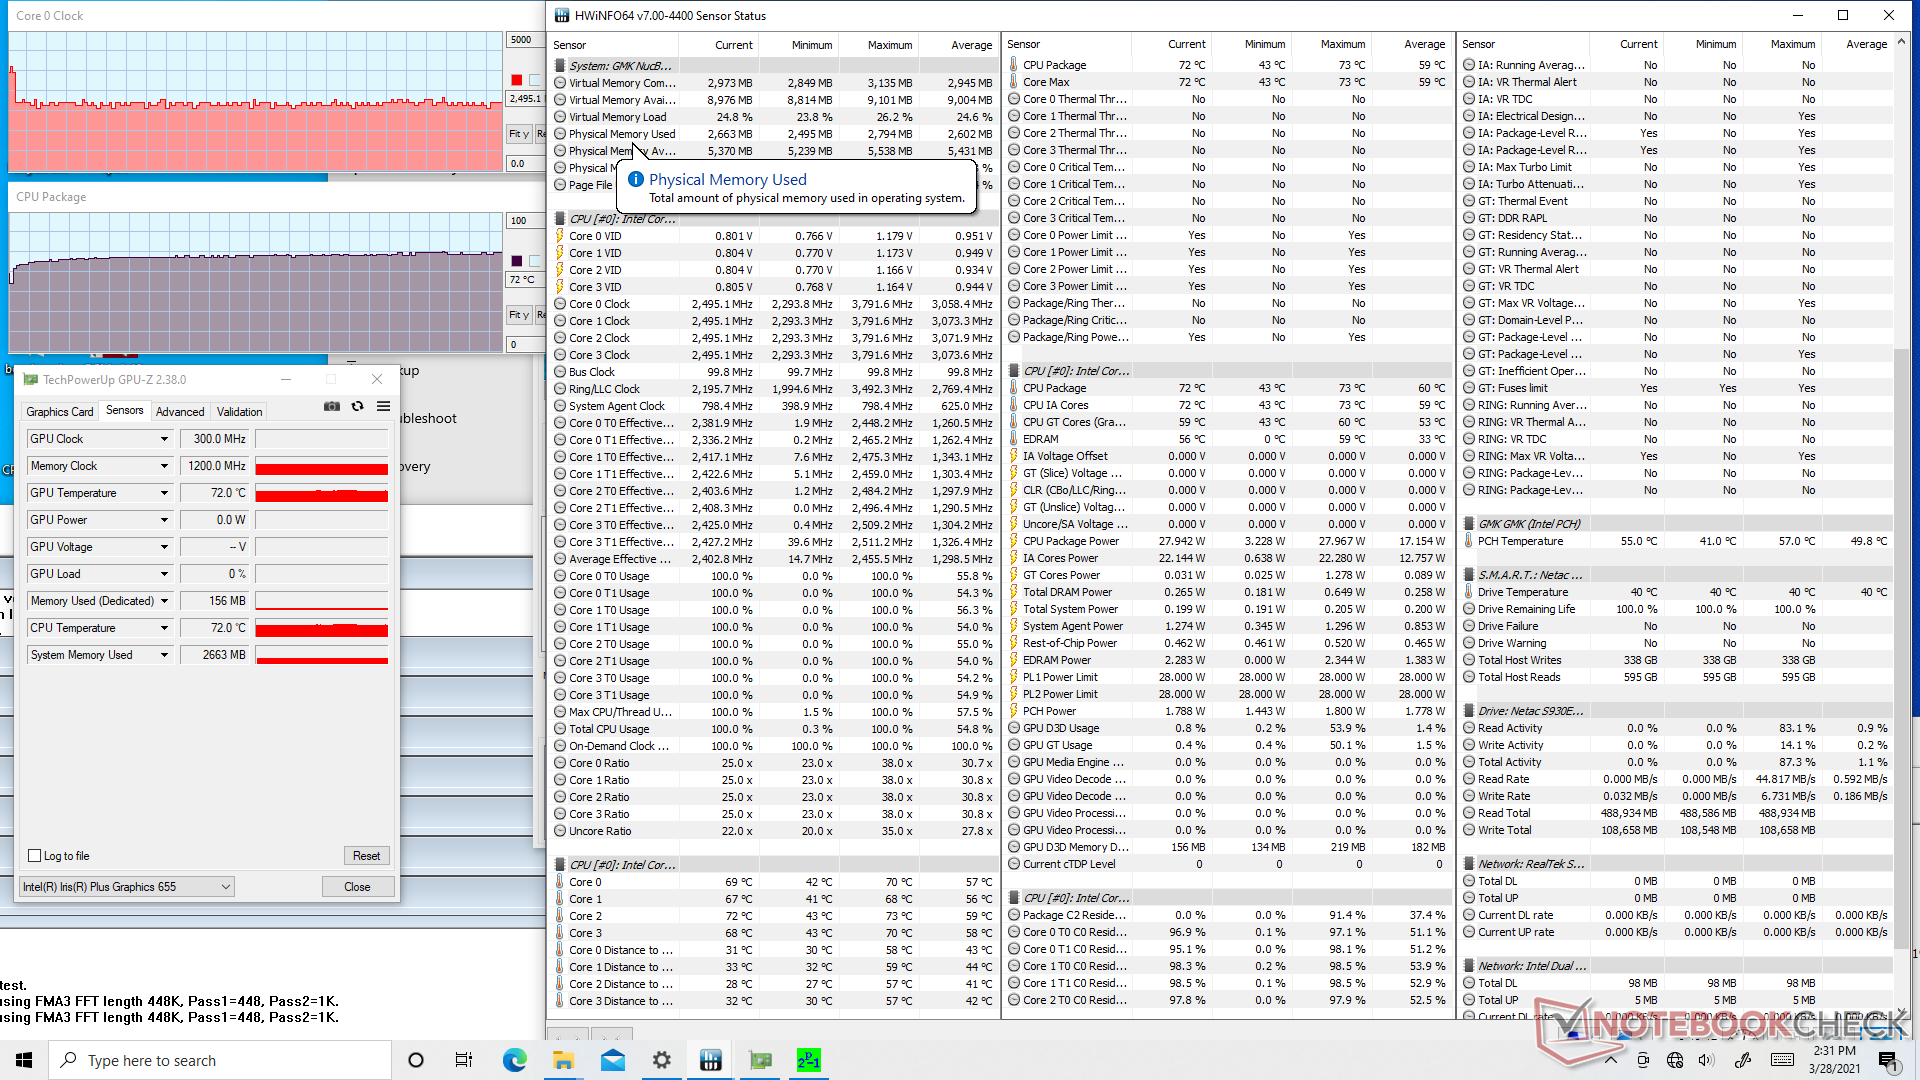
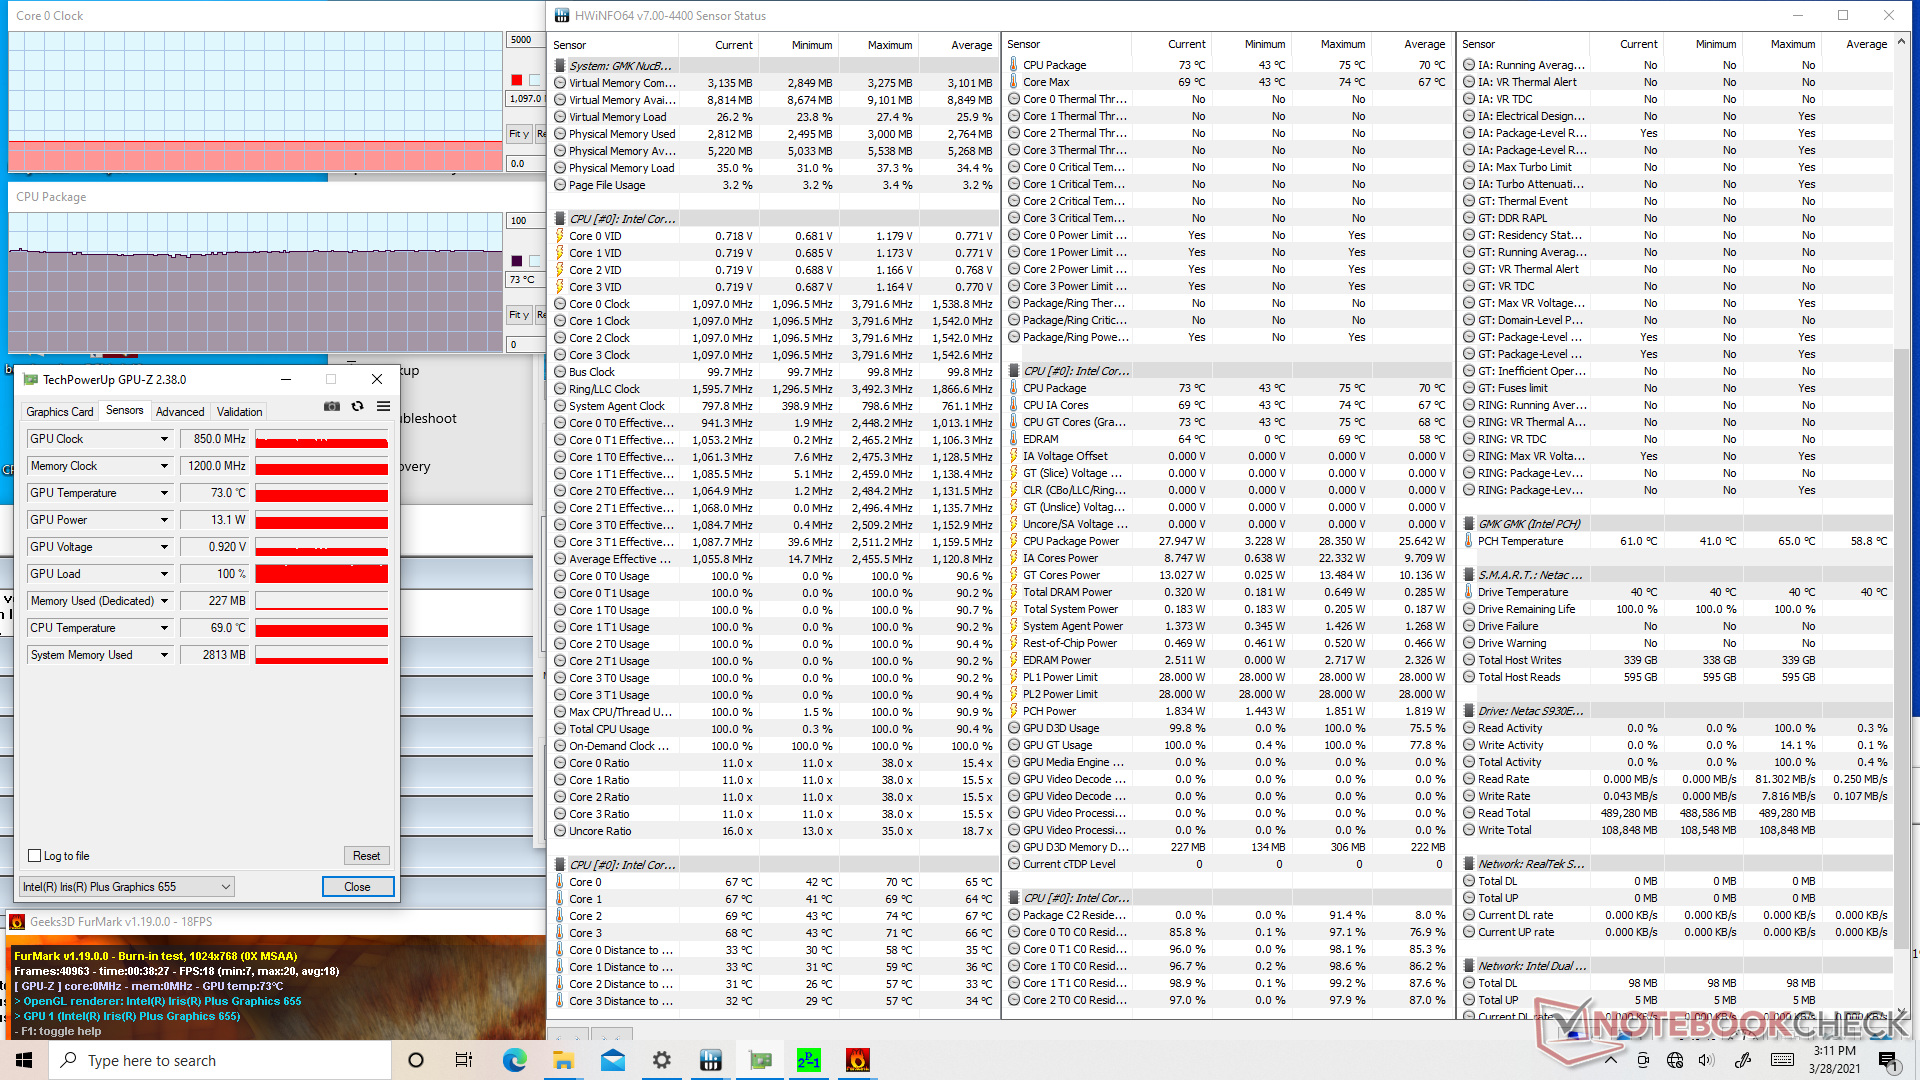
| CPU Clock (GHz) | GPU Clock (MHz) | Average CPU Temperature (°C) | |
| System Idle | -- | 49 | -- |
| Prime95 Stress | 2.3 - 2.5 | -- | 72 |
| Prime95 + FurMark Stress | 1.1 | 850 - 1000 | 73 |
Energy Management
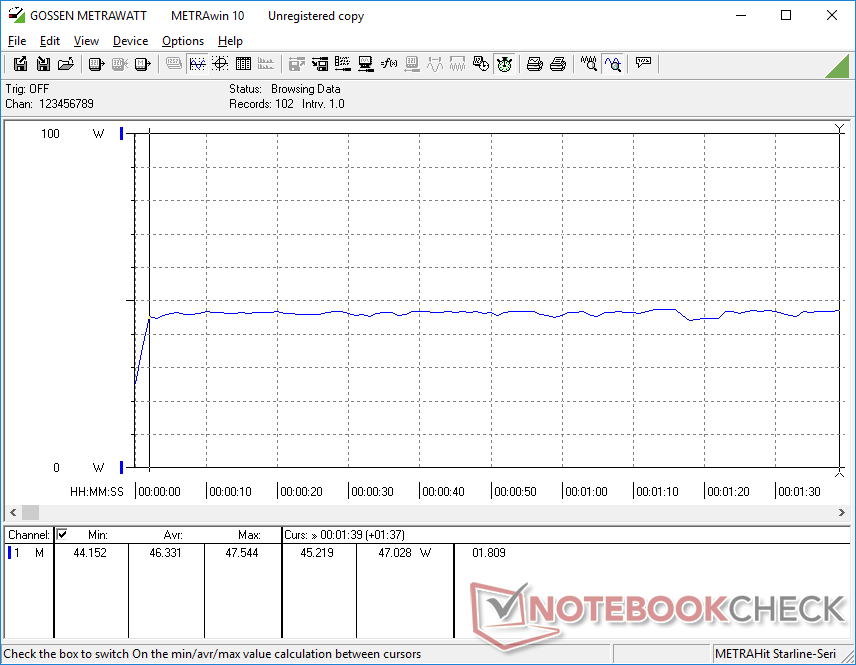
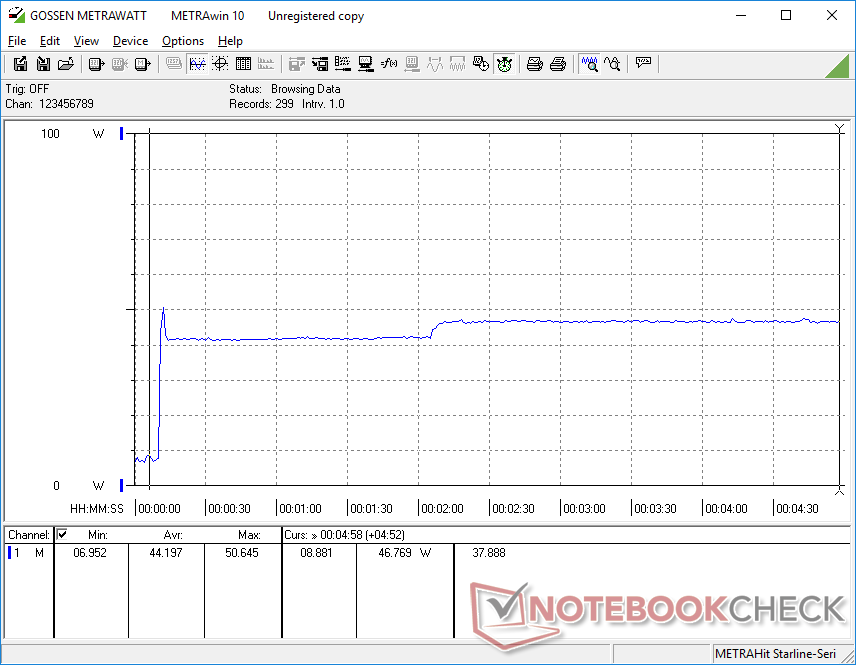
Power Consumption
Idling on desktop consumes just 6 W to 8 W while higher loads like games can consume about 46 W. Note that the Intel NUC 11 with its newer generation Iris Xe graphics would consume only 31 W to 39 W when running games despite it offering almost 2x the graphics performance of our Iris Plus 655.

| Off / Standby | |
| Idle | |
| Load |
|
Key:
min: | |
| GMK NucBox 2 i5-8259U, Iris Plus Graphics 655, Netac S930E8/256GPN, , x, | Intel NUC11PAQi7 i7-1165G7, Iris Xe G7 96EUs, Samsung SSD 980 Pro 500GB MZ-V8P500BW, , x, | Intel NUC8i7BE i7-8559U, Iris Plus Graphics 655, , , x, | GMK NucBox K1 Celeron J4125, UHD Graphics 600, HIKVision C100 NGFF SSD 128GB, , x, | Beelink SEi10 i3-1005G1, UHD Graphics G1 (Ice Lake 32 EU), Silicon Motion AZW 256G M.2280 NVMe 4X 200725 D, , x, | Zotac ZBox MI643 i5-10210U, UHD Graphics 620, Lexar NM610 1TB, , x, | |
|---|---|---|---|---|---|---|
| Power Consumption | 3% | 8% | 53% | 12% | -17% | |
| Idle Minimum * (Watt) | 6.1 | 5.6 8% | 2.7 56% | 3.4 44% | 6.3 -3% | 7.5 -23% |
| Idle Average * (Watt) | 6.8 | 5.6 18% | 3.1 54% | 3.8 44% | 6.6 3% | 9.2 -35% |
| Idle Maximum * (Watt) | 7.3 | 6 18% | 6.3 14% | 3.9 47% | 6.7 8% | 9.6 -32% |
| Load Average * (Watt) | 46.3 | 31.4 32% | 59.7 -29% | 12.5 73% | 25.9 44% | 34.4 26% |
| Load Maximum * (Watt) | 50.7 | 80.5 -59% | 78 -54% | 22.7 55% | 46.7 8% | 60.6 -20% |
| Witcher 3 ultra * (Watt) | 39 | 47.2 |
* ... smaller is better
Pros
Cons
Verdict
The NucBox 2 isn't trying to be the smallest mini PC or even the fastest. Instead, it's a no-frills mid-range offering with a decent Core i5 CPU, Iris Plus GPU for dual 4K60 support, and just enough RAM and storage to get by for HTPC purposes. Fan noise is quieter than the Intel NUC as well especially when running higher loads.
Unlike barebone kits that cost about the same, the NucBox 2 comes with everything you need to get started and with room for easy expansion should the need ever arise.
The reliance on a proprietary AC adapter plug instead of a more standard USB-C solution makes the NucBox 2 less universal. We would love to see more USB-C ports on future models or even an integrated PSU to avoid an external AC adapter altogether. Such a move would really one-up the competition where external adapters can sometimes be just as large as the mini PCs themselves.
Price and availability
The GMK NucBox 2 is available on Amazon for $499 USD. A current sale shaves off $60 for a final price of $439. Alternatively, users can also purchase directly from GMK for the same sale price when applying the coupon code 'Easter60OFF' at the time of writing.
Price comparison
