Intel NUC Kit NUC8i7BEH (i7-8559U) Mini PC Review
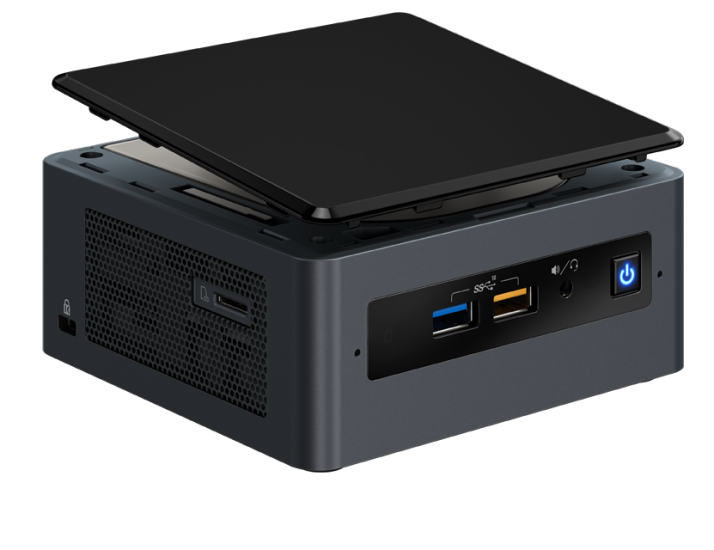
 vs. NUC8ixBEH (right)")
Announced back in August, retailers are now beginning to ship the next generation of Intel NUC8ixBE mini PCs under the brand new Bean Canyon platform. The series will replace the existing NUC7ixBN series that shipped with outdated ULV Kaby Lake CPUs. Unlike the common Kaby Lake-R i5-8250U or i7-8550U, these new Coffee Lake-U CPUs integrate Iris graphics for much faster GPU performance than most Ultrabooks.
Intel is currently offering five different SKUs of the new family as described below. Other than the swap in processors, the chassis of these models are nearly identical to the last generation NUC7ixBN series. Our test model today is the higher-end NUC8i7BEH configuration designed to compete directly with low-power mini PCs or HTPCs like the Zotac ZBox-CI660 Nano or Chuwi GBox CWI560.
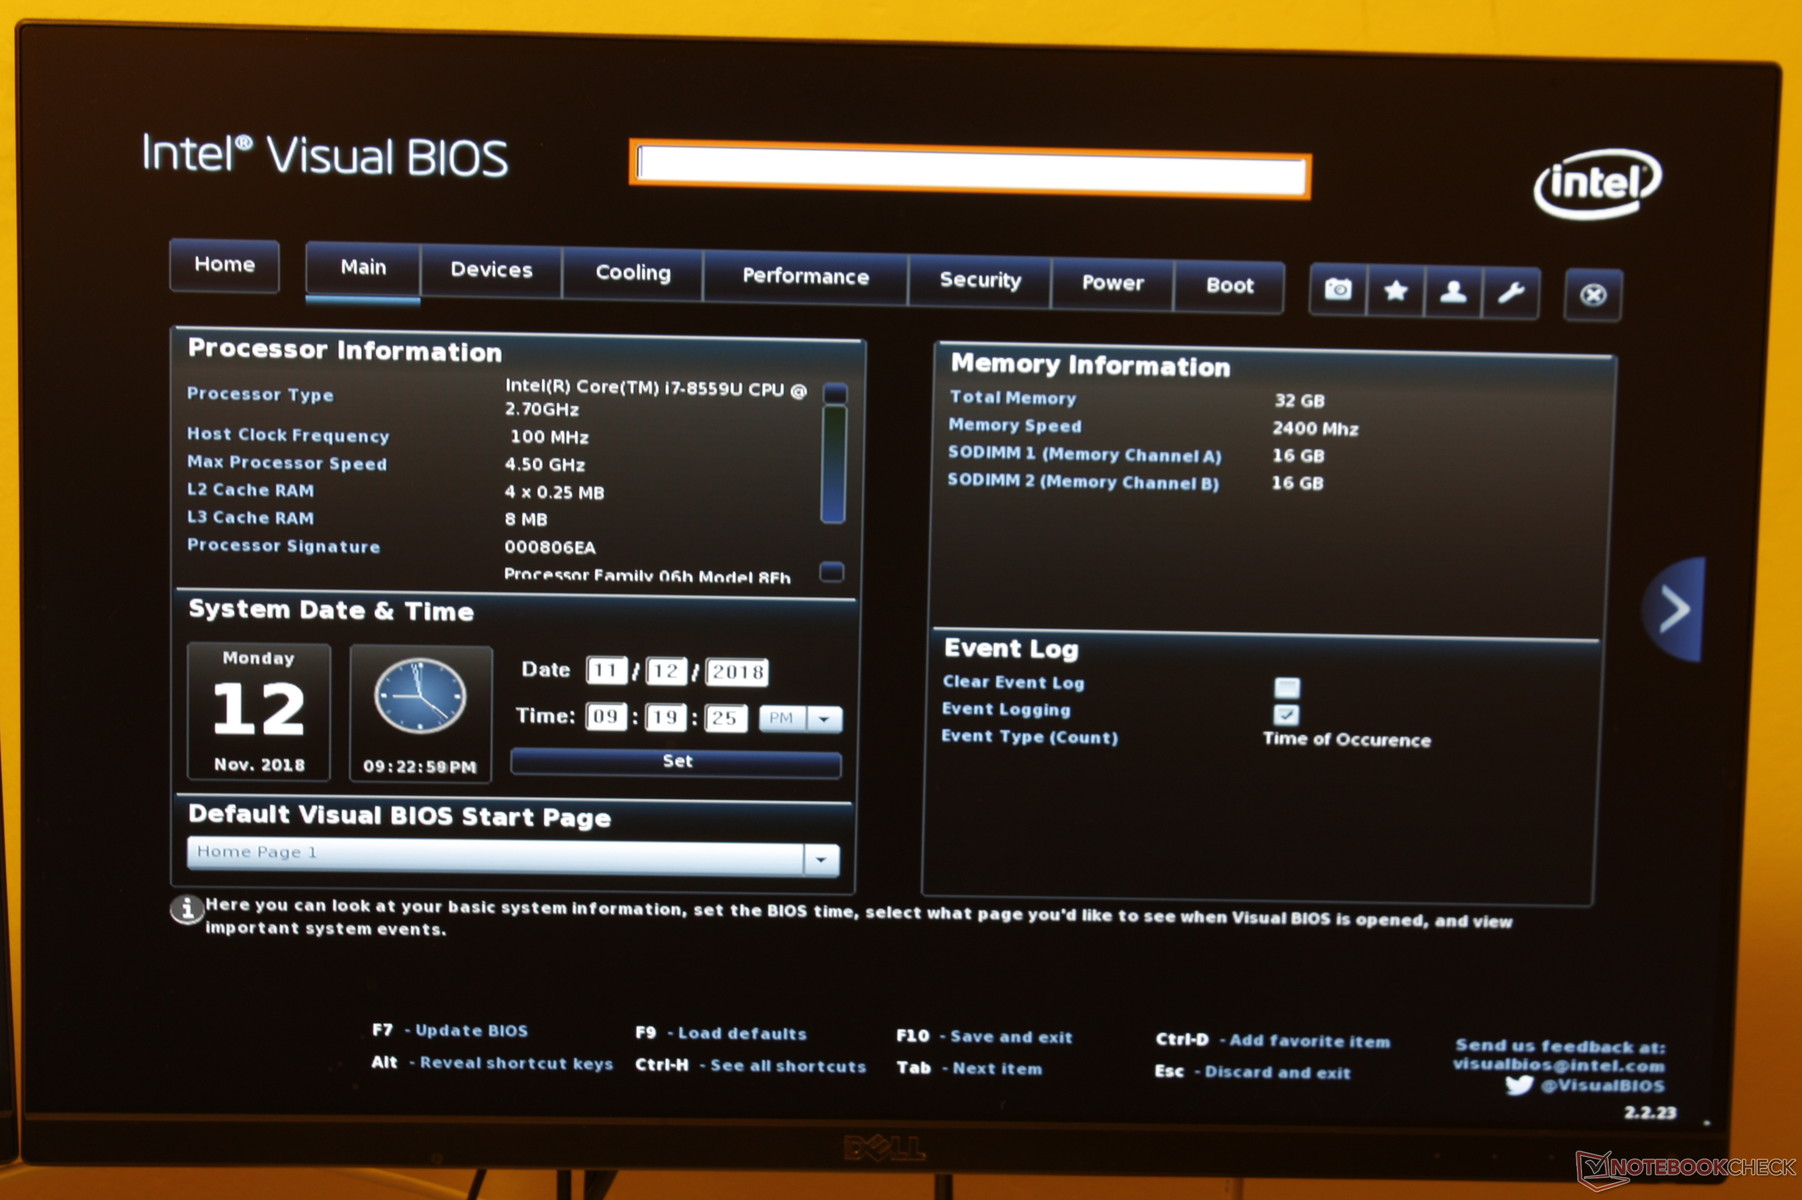
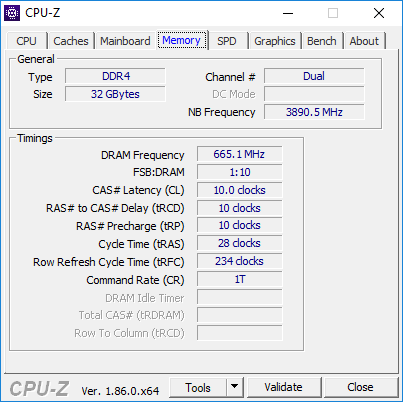
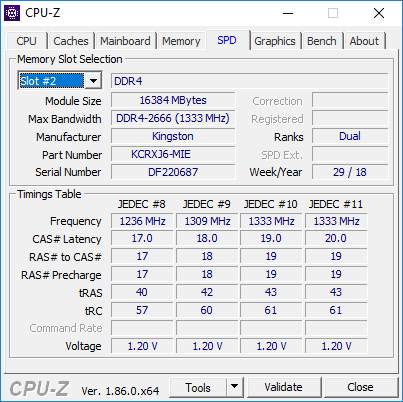
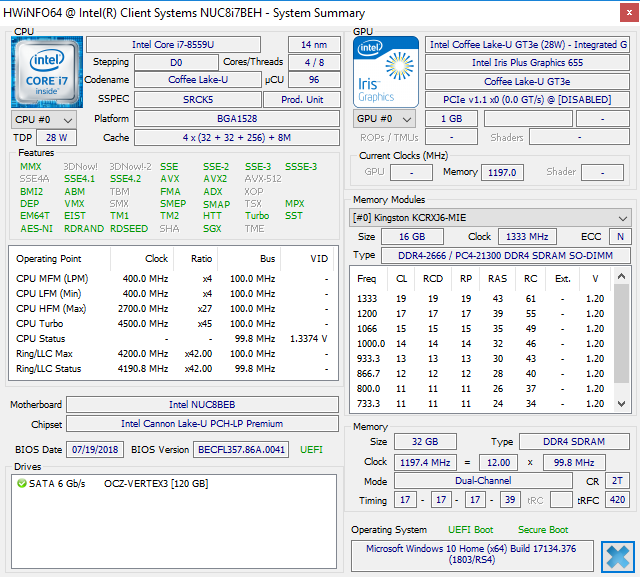
The NUC ships as a barebones kit and so we have equipped our unit with 32 GB of DDR4 PC4-21300 RAM and a 2.5-inch 120 GB SATA II SSD for testing purposes.
More Intel NUC and mini PC reviews:
- Intel NUC7CJYH
- Intel Hades Canyon NUC
- Intel Skull Canyon NUC
- Intel NUC6i5SYH
- Zotac ZBox-CI660 Nano
- Chuwi GBox CWI560
| Intel NUC8i7BEH | i7-8559U | M.2 + 2.5-inch SATA |
|---|---|---|
| Intel NUC8i5BEK | i5-8259U | M.2 only |
| Intel NUC8i5BEH | i5-8259U | M.2 + 2.5-inch SATA |
| Intel NUC8i3BEK | i3-8109U | M.2 only |
| Intel NUC8i3BEH | i3-8109U | M.2 + 2.5-inch SATA |
Case
The chassis skeleton and dimensions are identical to the last generation NUC7CJYH. The weight of the new model is a bit heavier this time around only because we included the weight of our installed SSD and two SODIMM modules.
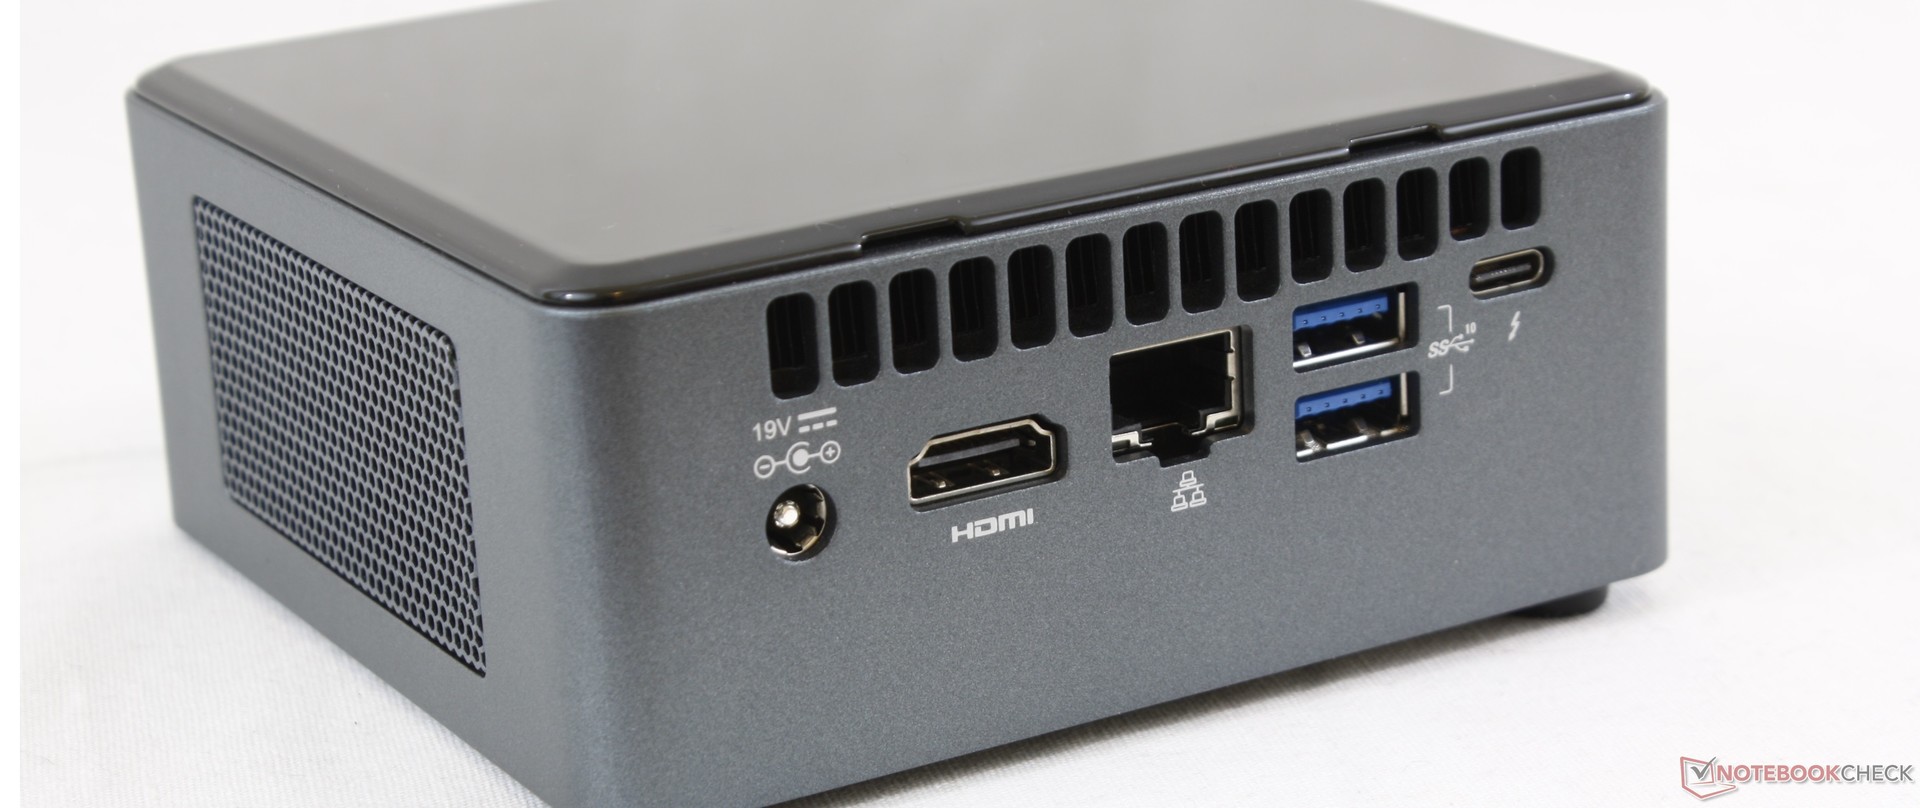
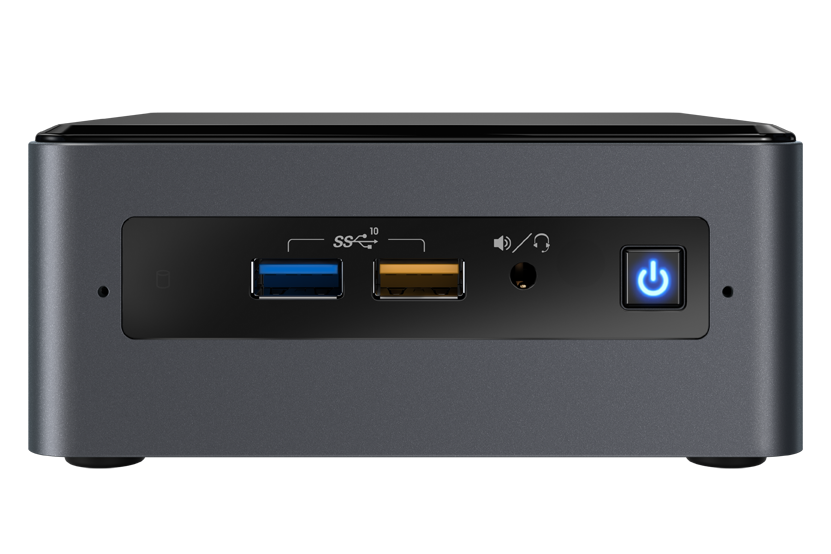
Connectivity
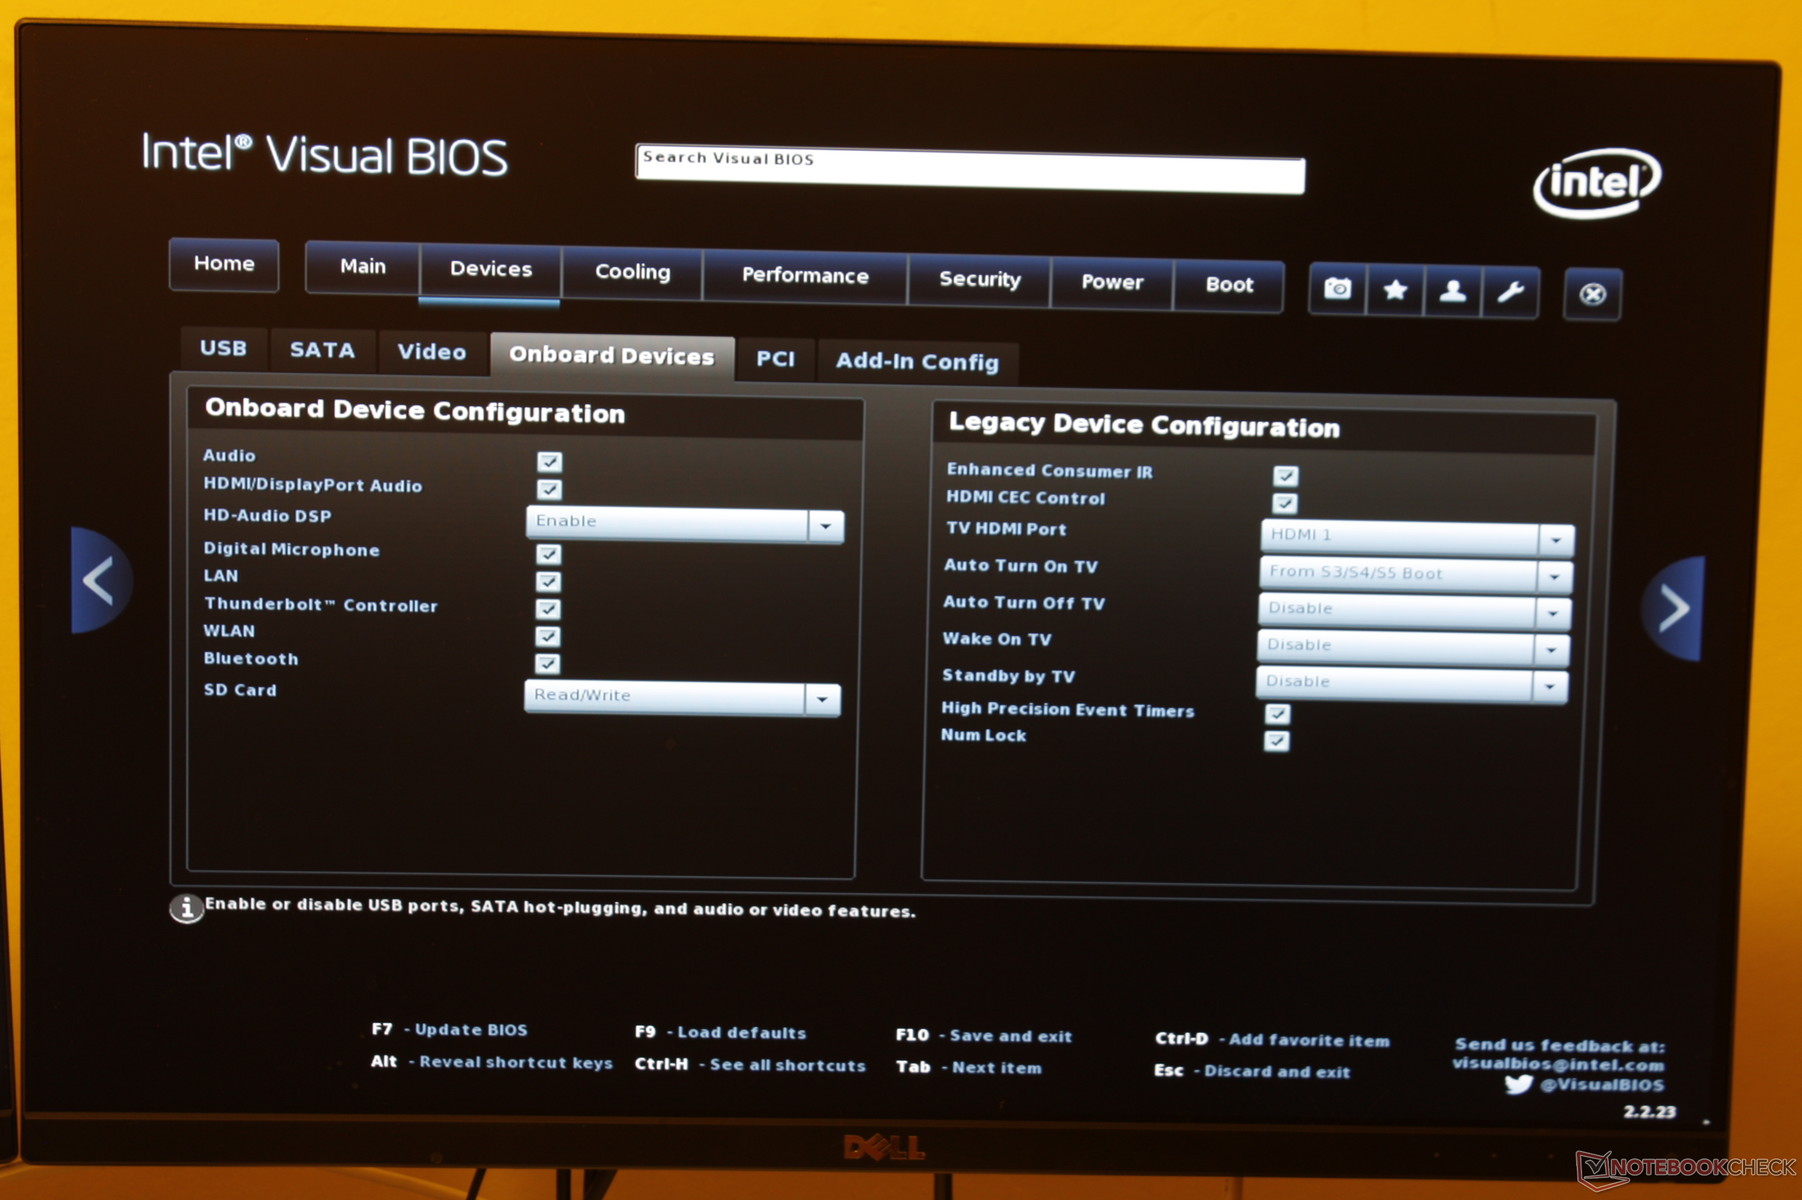
Port options are again identical to the last generation model but with one major change. Intel has swapped out the second HDMI port on the rear for the oft requested Thunderbolt 3 port. Since Thunderbolt is one of the most versatile ports out there, we're sure most users will welcome the change.
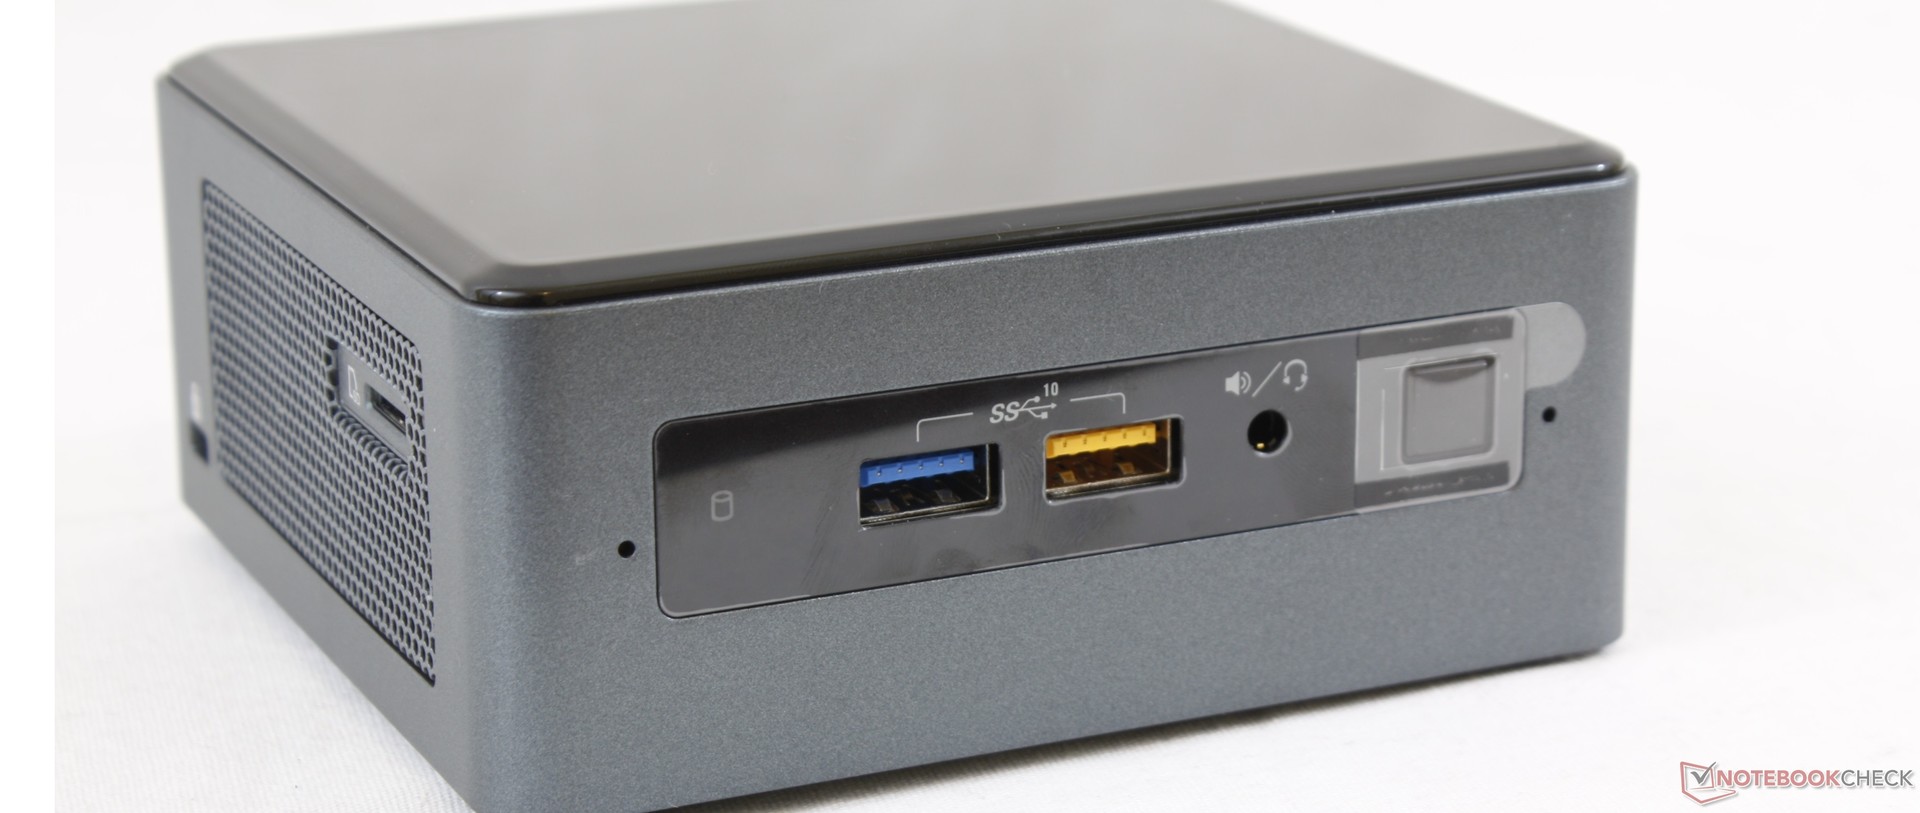
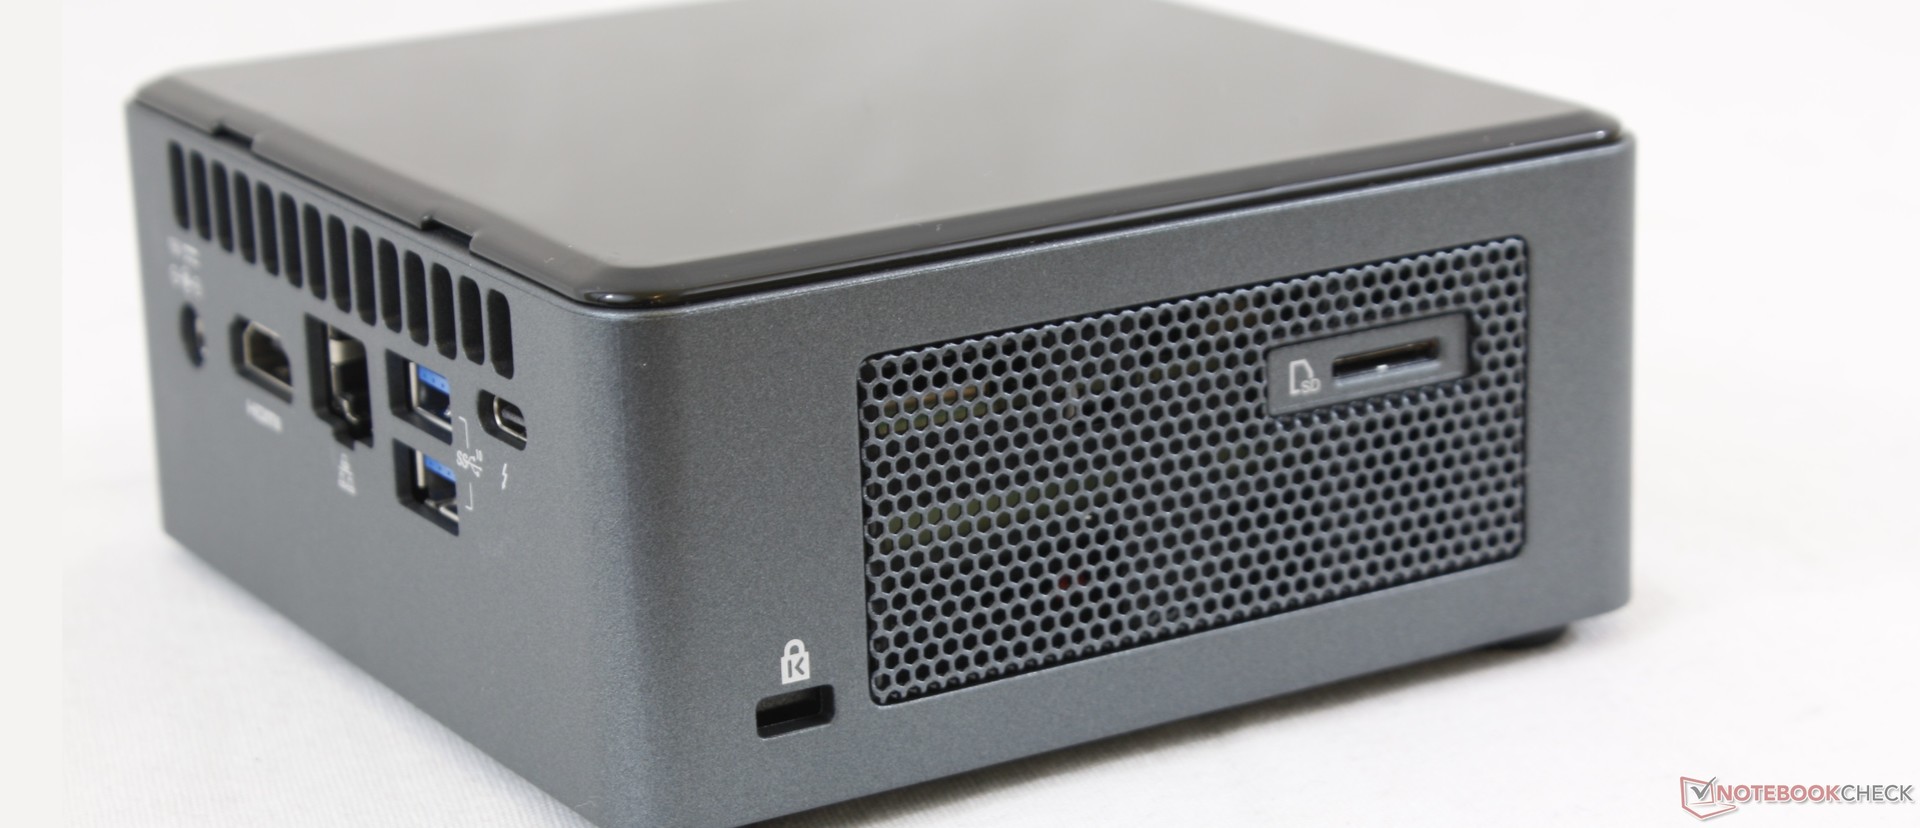
SD Card Reader
The spring-loaded SD reader is as fast as the reader on the pricier Hades Canyon NUC and about twice as fast as the SD reader on the Zotac ZBOX CI660 Nano. It's slightly disappointing to not see a full-size SD reader since the Skull Canyon NUC was able to integrate one.
| SD Card Reader | |
| average JPG Copy Test (av. of 3 runs) | |
| Intel Hades Canyon NUC8i7HVK (Toshiba Exceria Pro SDXC 64 GB UHS-II) | |
| Intel NUC8i7BE (Toshiba Exceria Pro M501 UHS-II) | |
| Zotac ZBOX-QK7P3000 (Toshiba Exceria Pro SDXC 64 GB UHS-II) | |
| Zotac ZBOX-CI660 Nano (Toshiba Exceria Pro SDXC 64 GB UHS-II) | |
| maximum AS SSD Seq Read Test (1GB) | |
| Intel Hades Canyon NUC8i7HVK (Toshiba Exceria Pro SDXC 64 GB UHS-II) | |
| Intel NUC8i7BE (Toshiba Exceria Pro M501 UHS-II) | |
| Zotac ZBOX-QK7P3000 (Toshiba Exceria Pro SDXC 64 GB UHS-II) | |
| Zotac ZBOX-CI660 Nano (Toshiba Exceria Pro SDXC 64 GB UHS-II) | |
Communication
It's only natural for an Intel mini PC to use an Intel WLAN module. The Intel 9260 is capable of transfer rates of up to 1.73 Gbps compared to just half that on the 8260. Most home networks are not equipped to take advantage of such fast speeds and so the 9260 can be considered future-proof. Our recorded transfer rates below are much slower than the theoretical maximum since our server is limited by a 1 Gbps line.
| Networking | |
| iperf3 transmit AX12 | |
| Intel NUC8i7BE | |
| Intel Hades Canyon NUC8i7HVK | |
| Zotac ZBOX-QK7P3000 | |
| Zotac ZBOX-CI660 Nano | |
| iperf3 receive AX12 | |
| Intel NUC8i7BE | |
| Intel Hades Canyon NUC8i7HVK | |
| Zotac ZBOX-CI660 Nano | |
| Zotac ZBOX-QK7P3000 | |
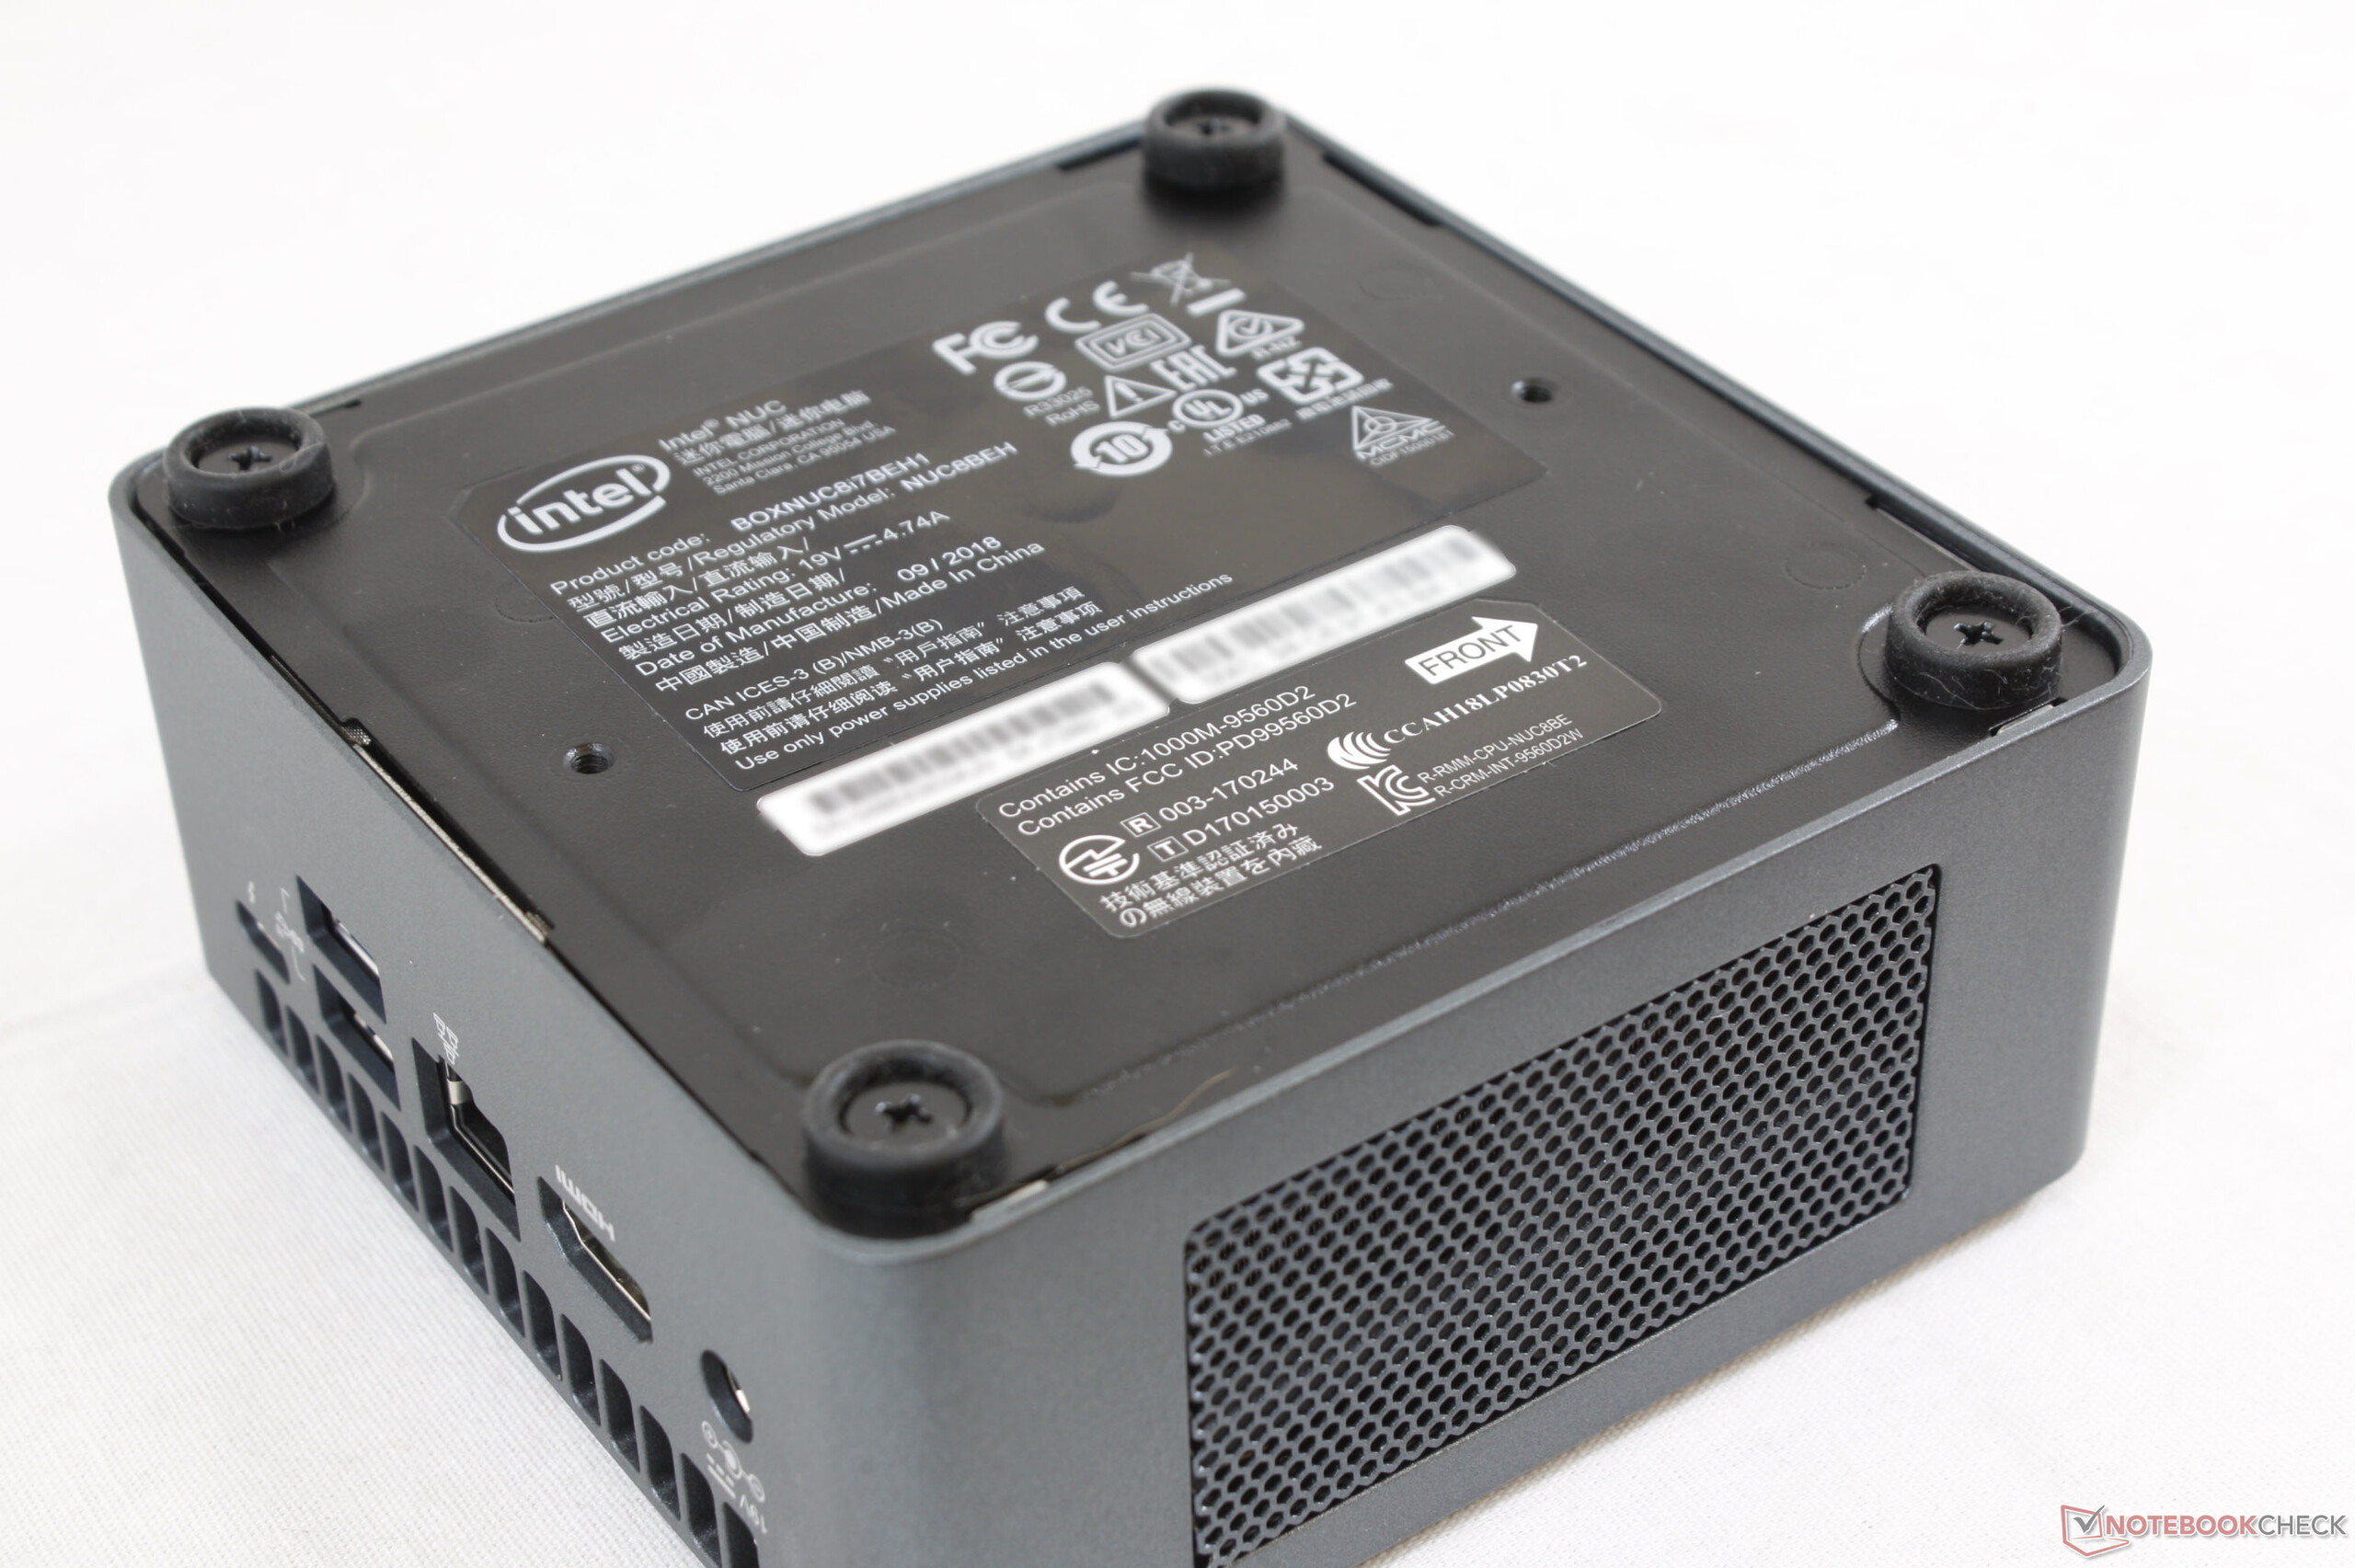
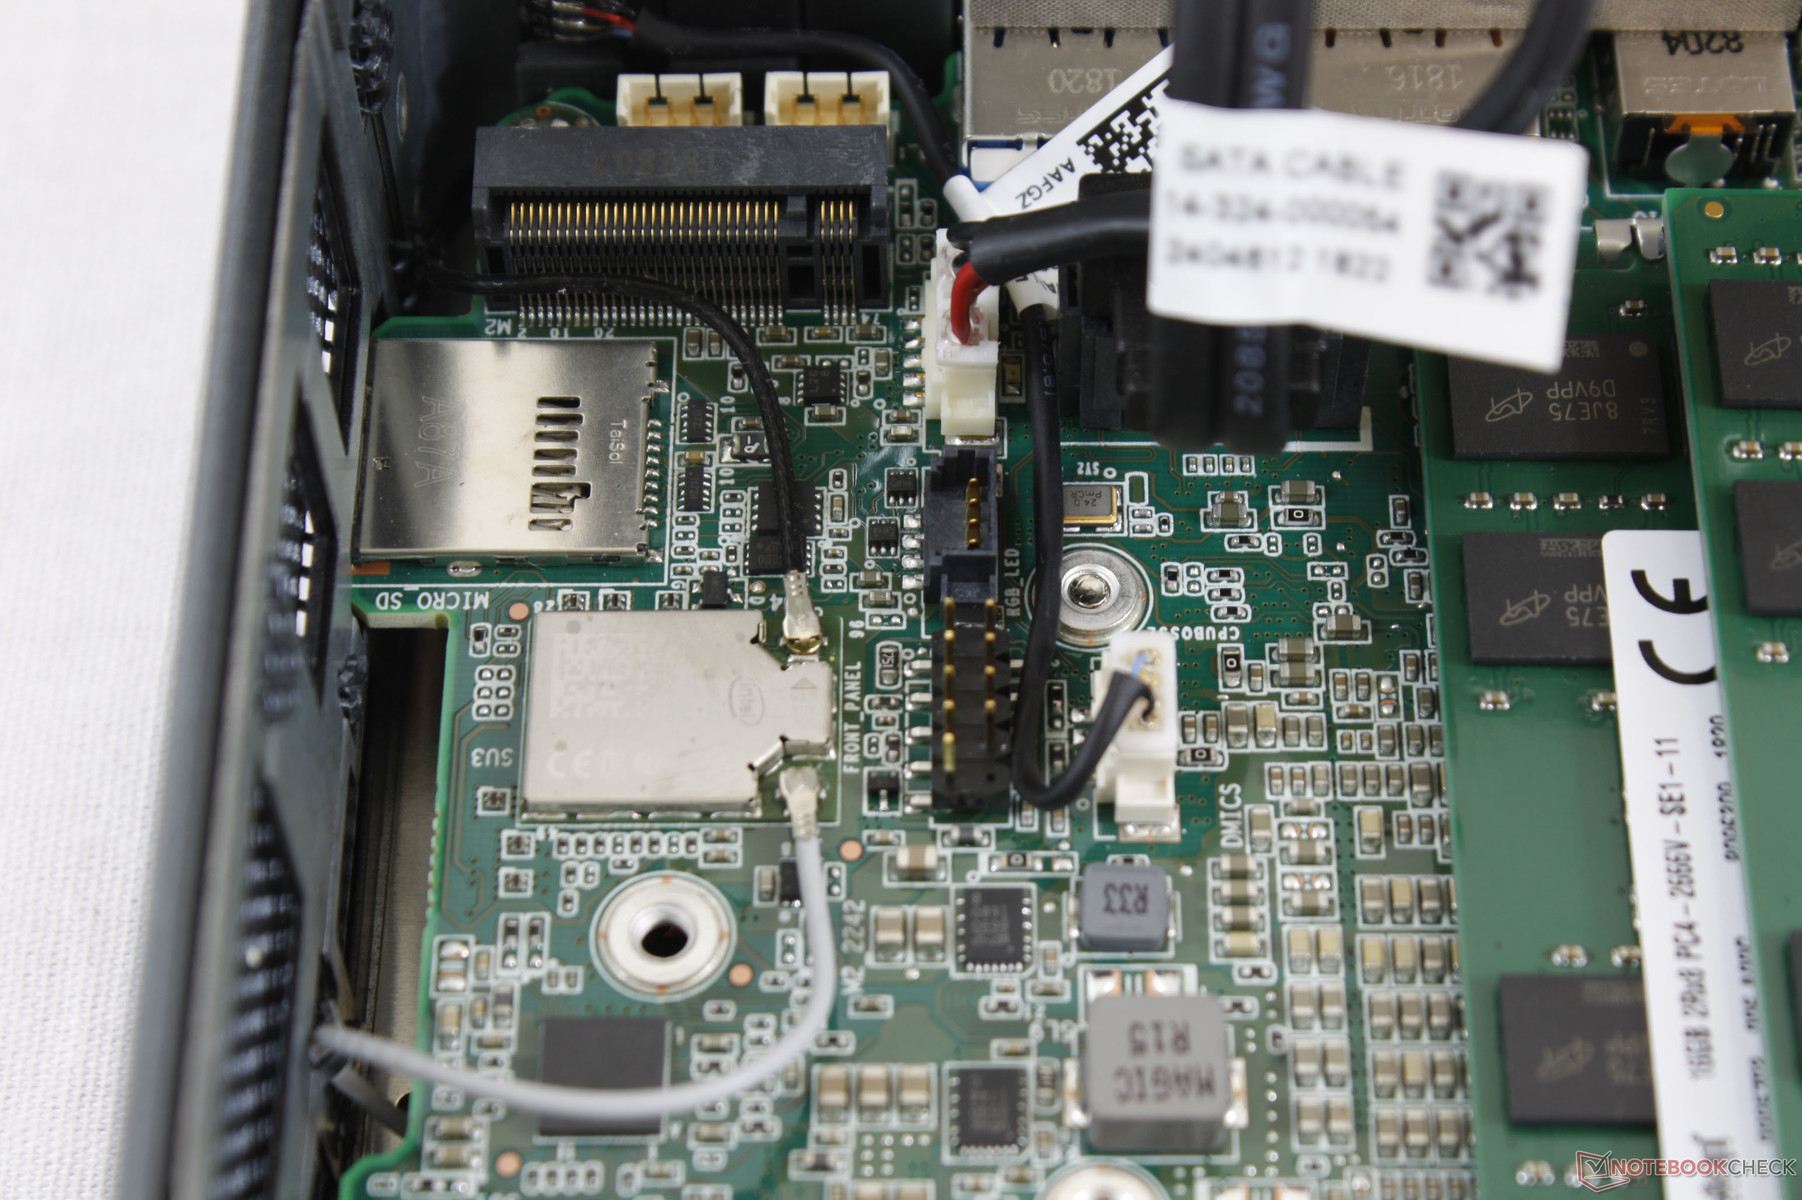
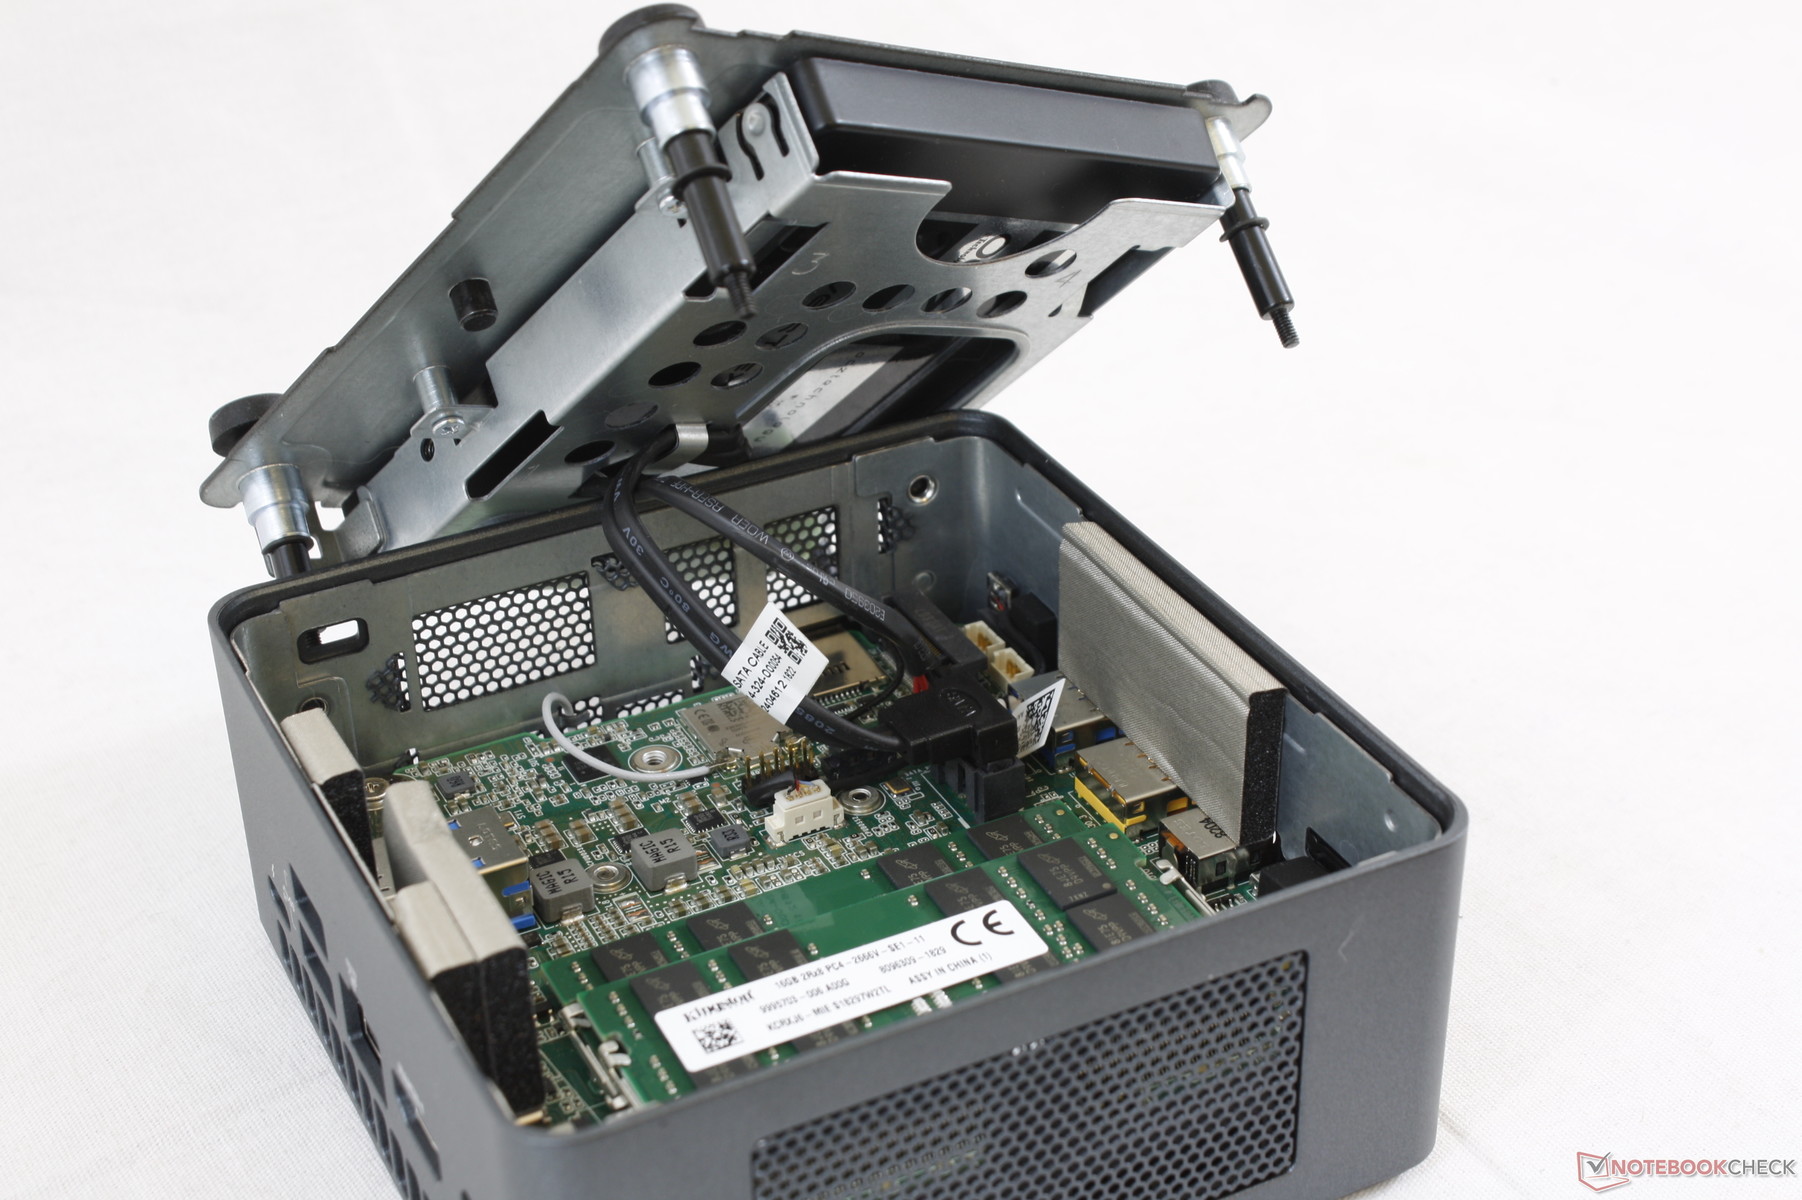
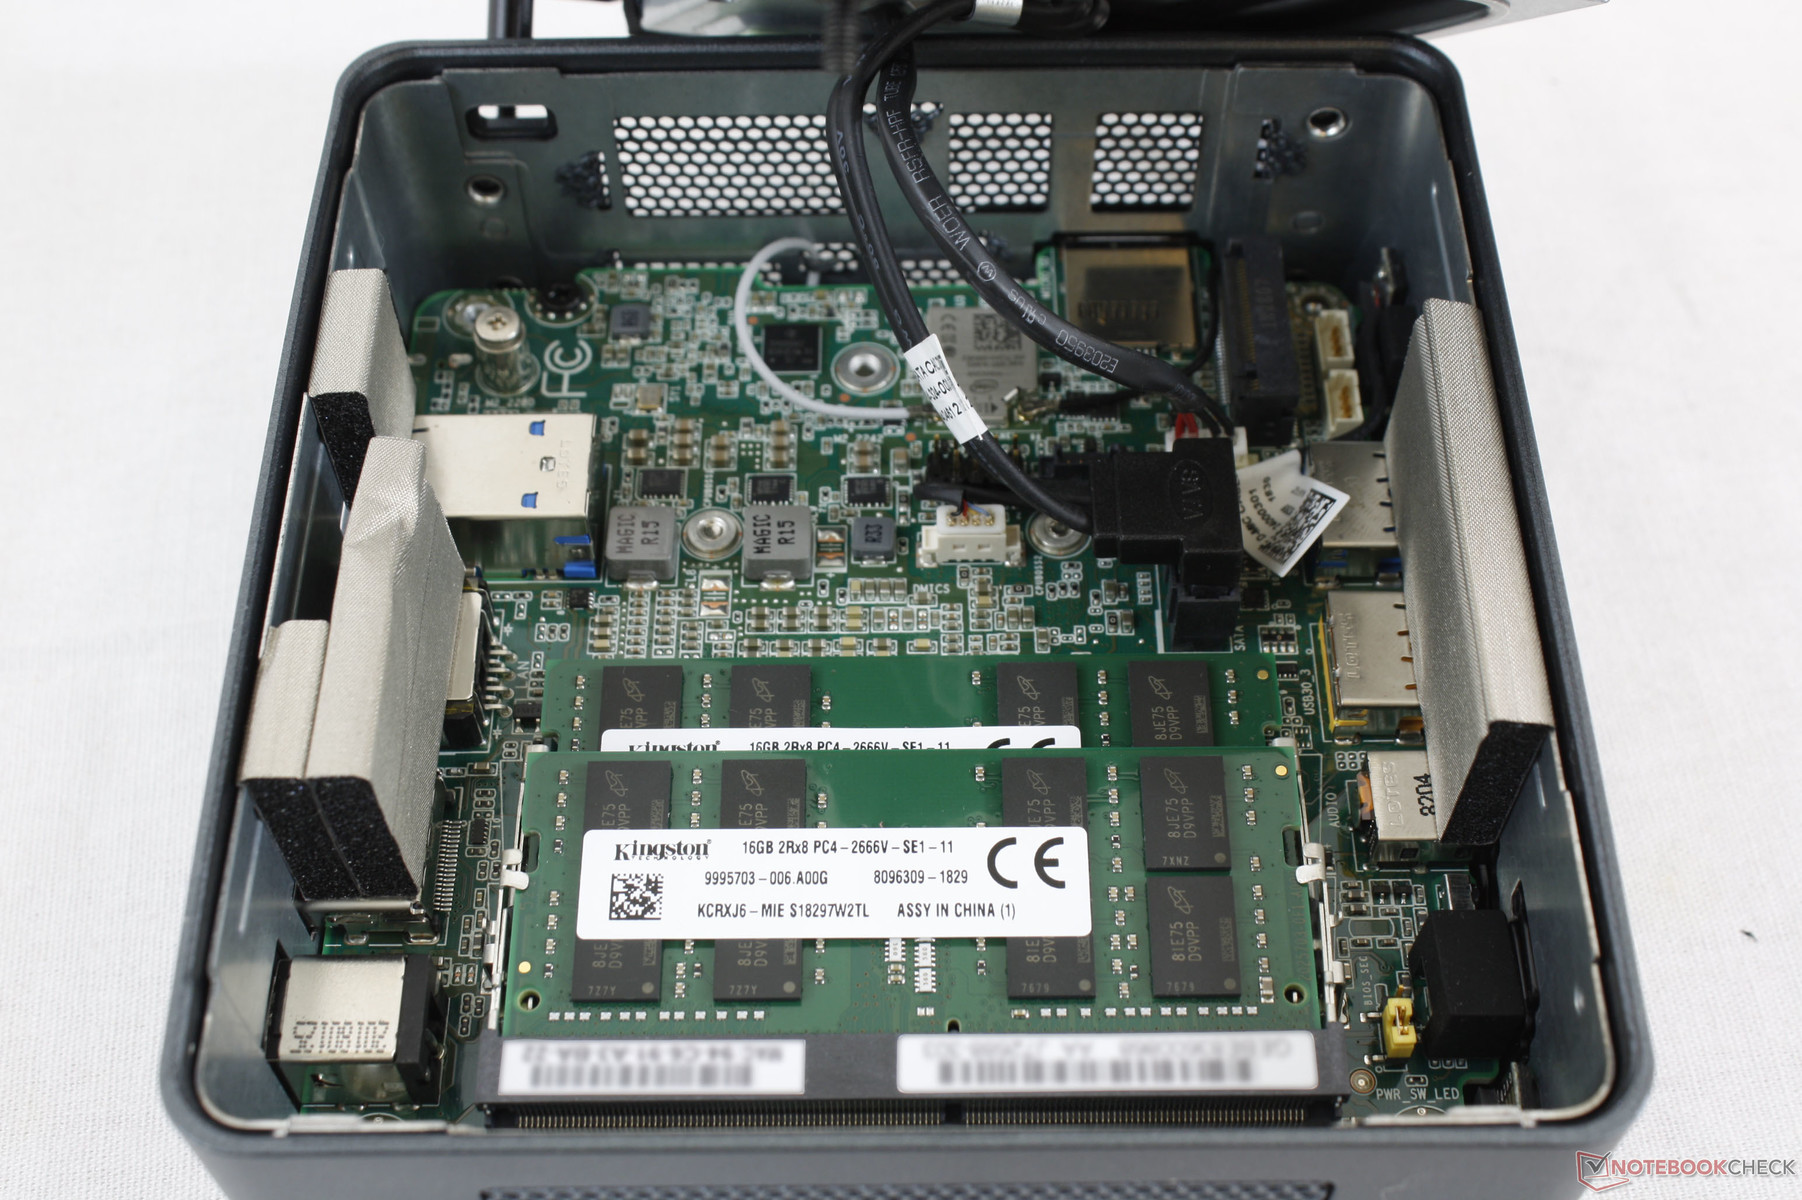
Maintenance
Both the top and bottom plates can be removed without any tools. Removing the bottom plate exposes the two SODIMM slots, M.2 slot, and 2.5-inch SATA III bay for accepting drives up to 9.5 mm thick. Access to the CPU, battery, and cooling solution requires additional disassembly. The smaller NUC8i3BEK and NUC8i5BEK SKUs lack the 2.5-inch SATA bay.
The official Intel technical manual can be found here.
Accessories and Warranty
Included extras are a removable VESA mounting bracket (80 mm and 100 mm), extra screws, and a Quick Start guide.
Intel offers three-year international limited warranty for its NUC products as standard. Please see our Guarantees, Return policies and Warranties FAQ for country-specific information.
Performance
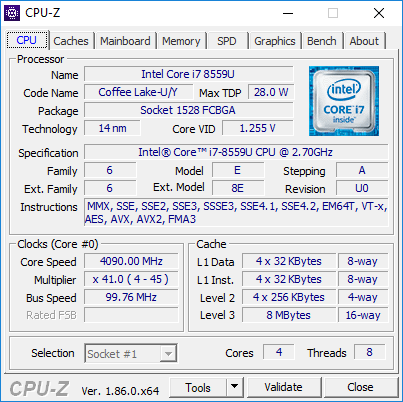
Processor
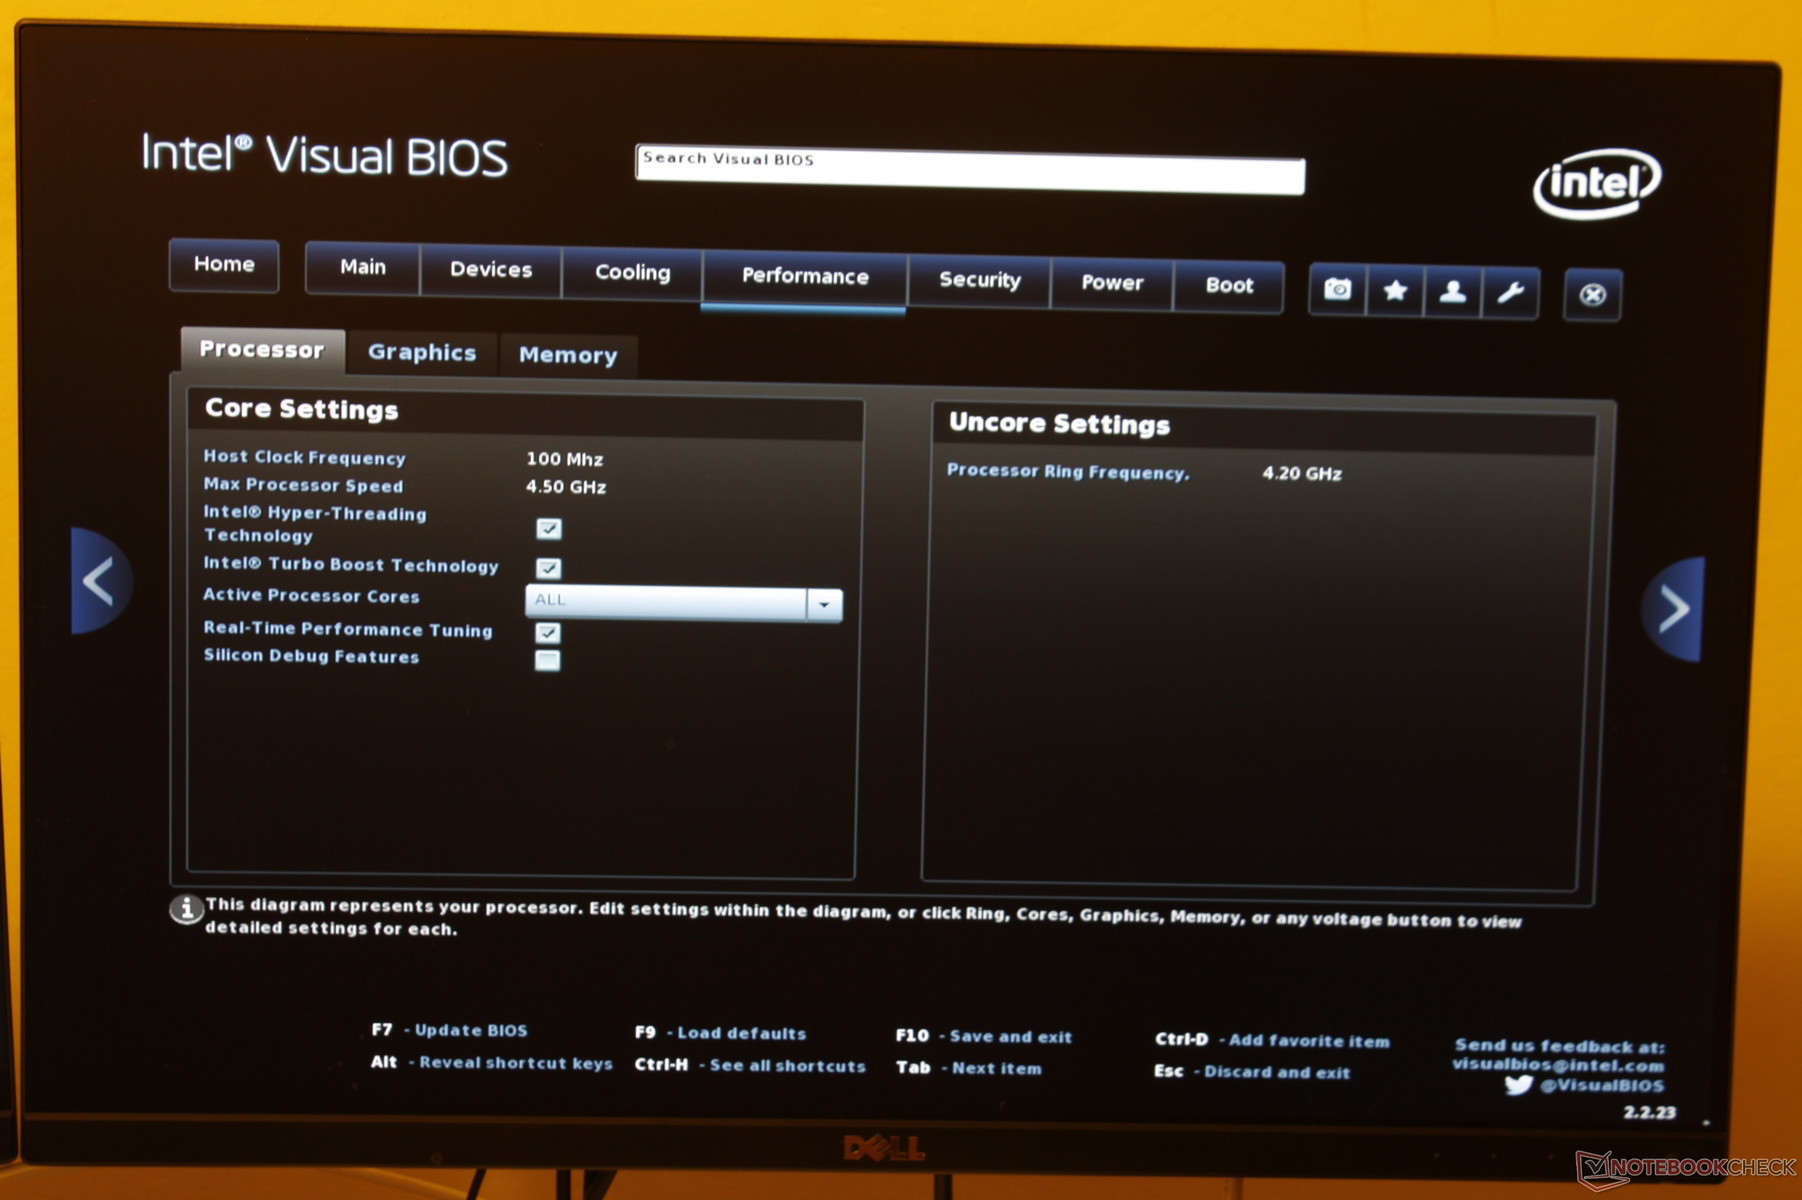
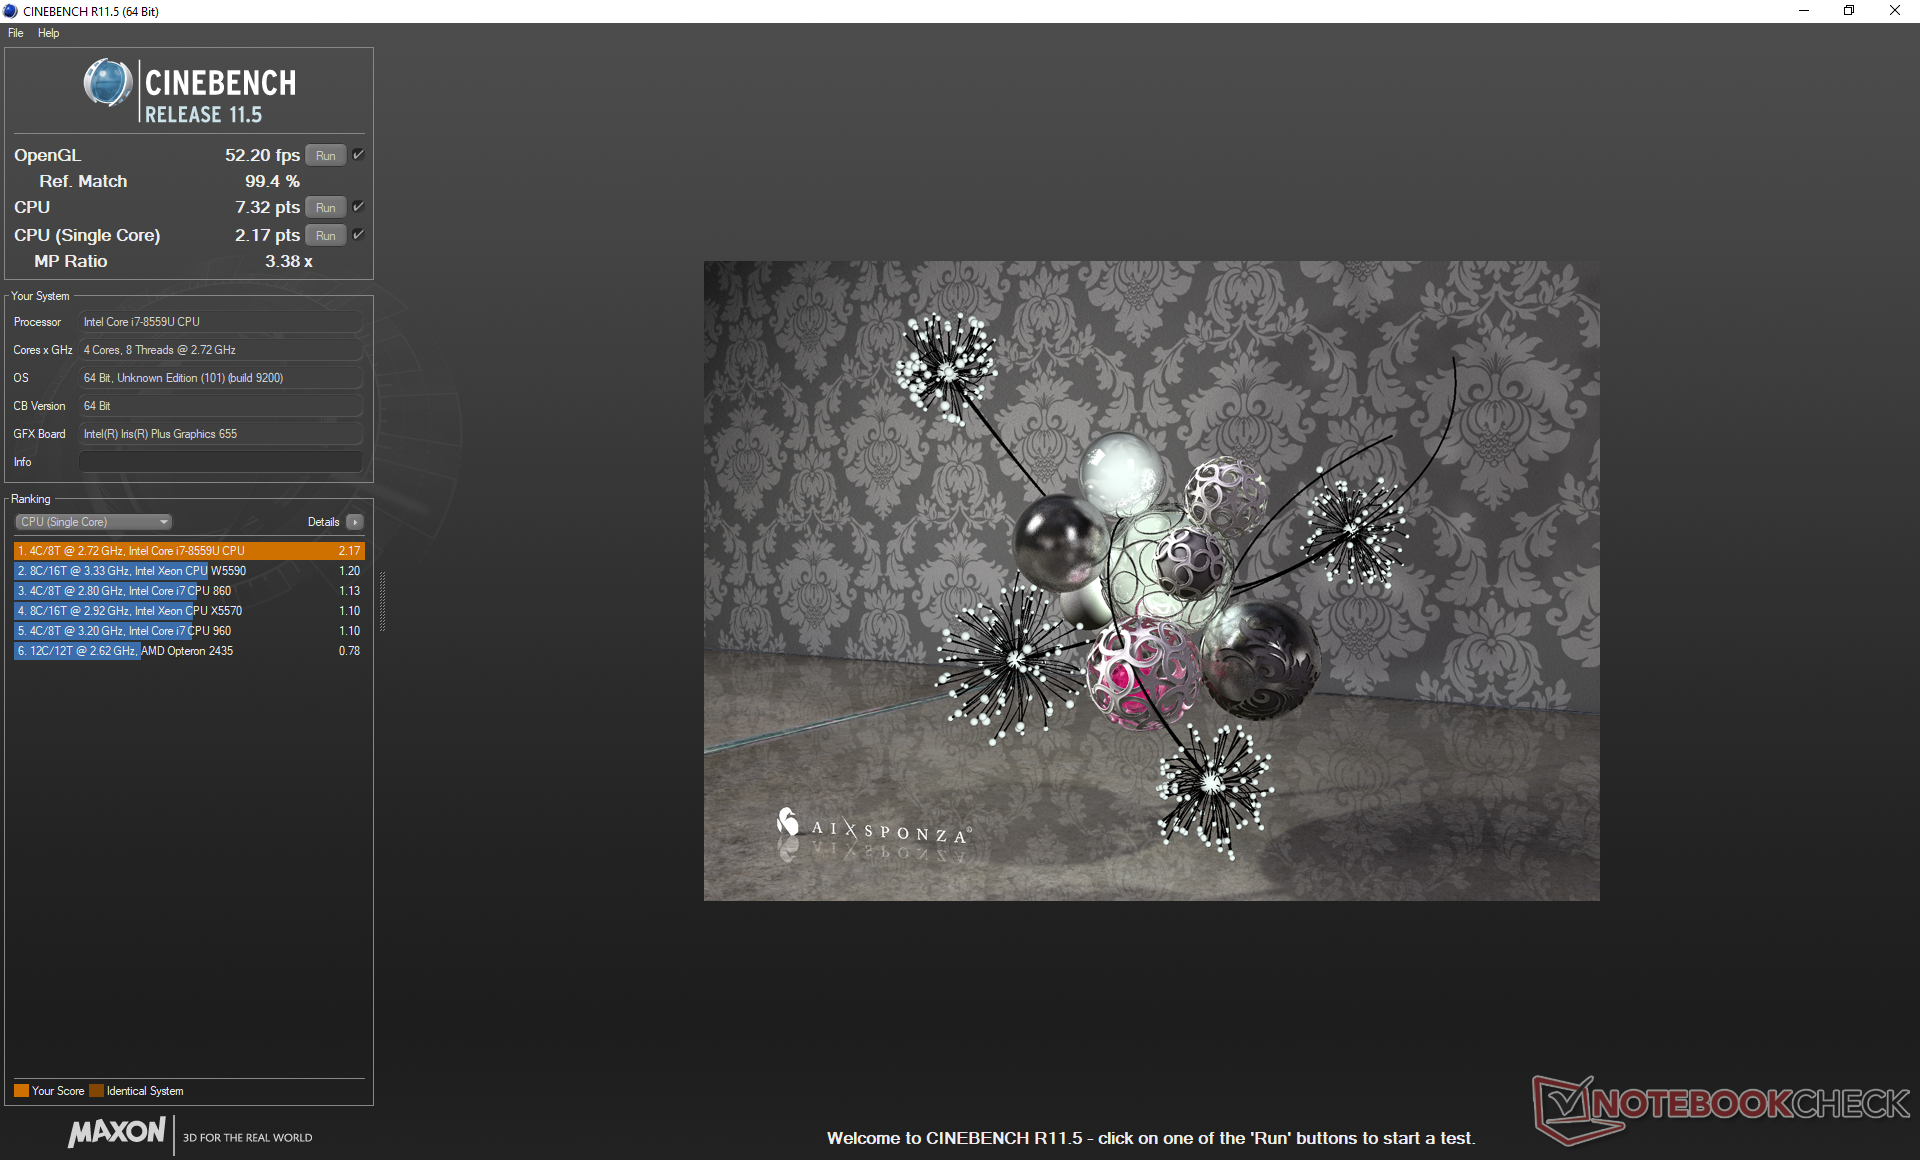
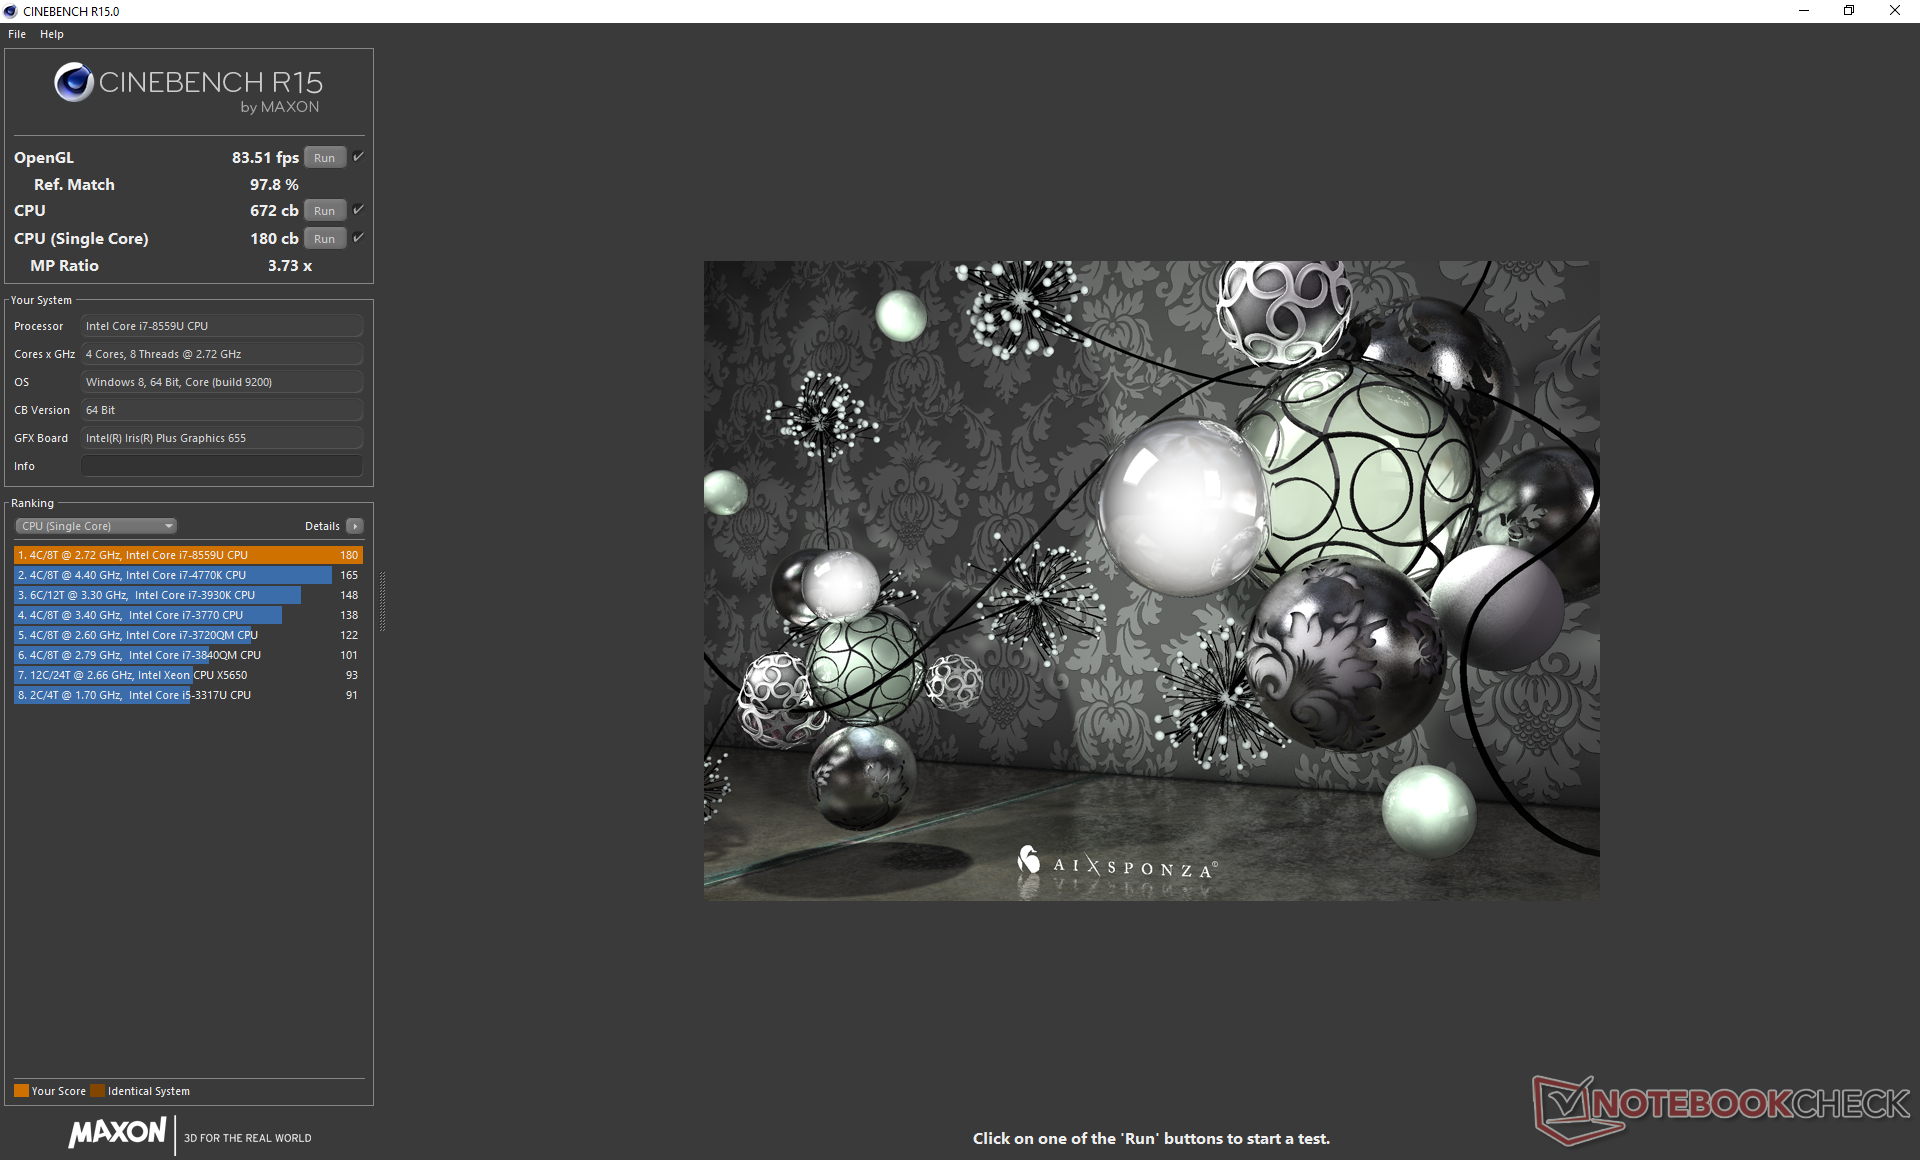
The quad-core Core i7-8559U has nearly twice the TDP of a quad-core i7-8550U (28 W vs. 15 W) and a significantly faster base clock rate (2.7 GHz vs. 1.8 GHz). Actual CPU performance, however, is mixed because the NUC is unable to sustain Turbo Boost clock rates for very long.
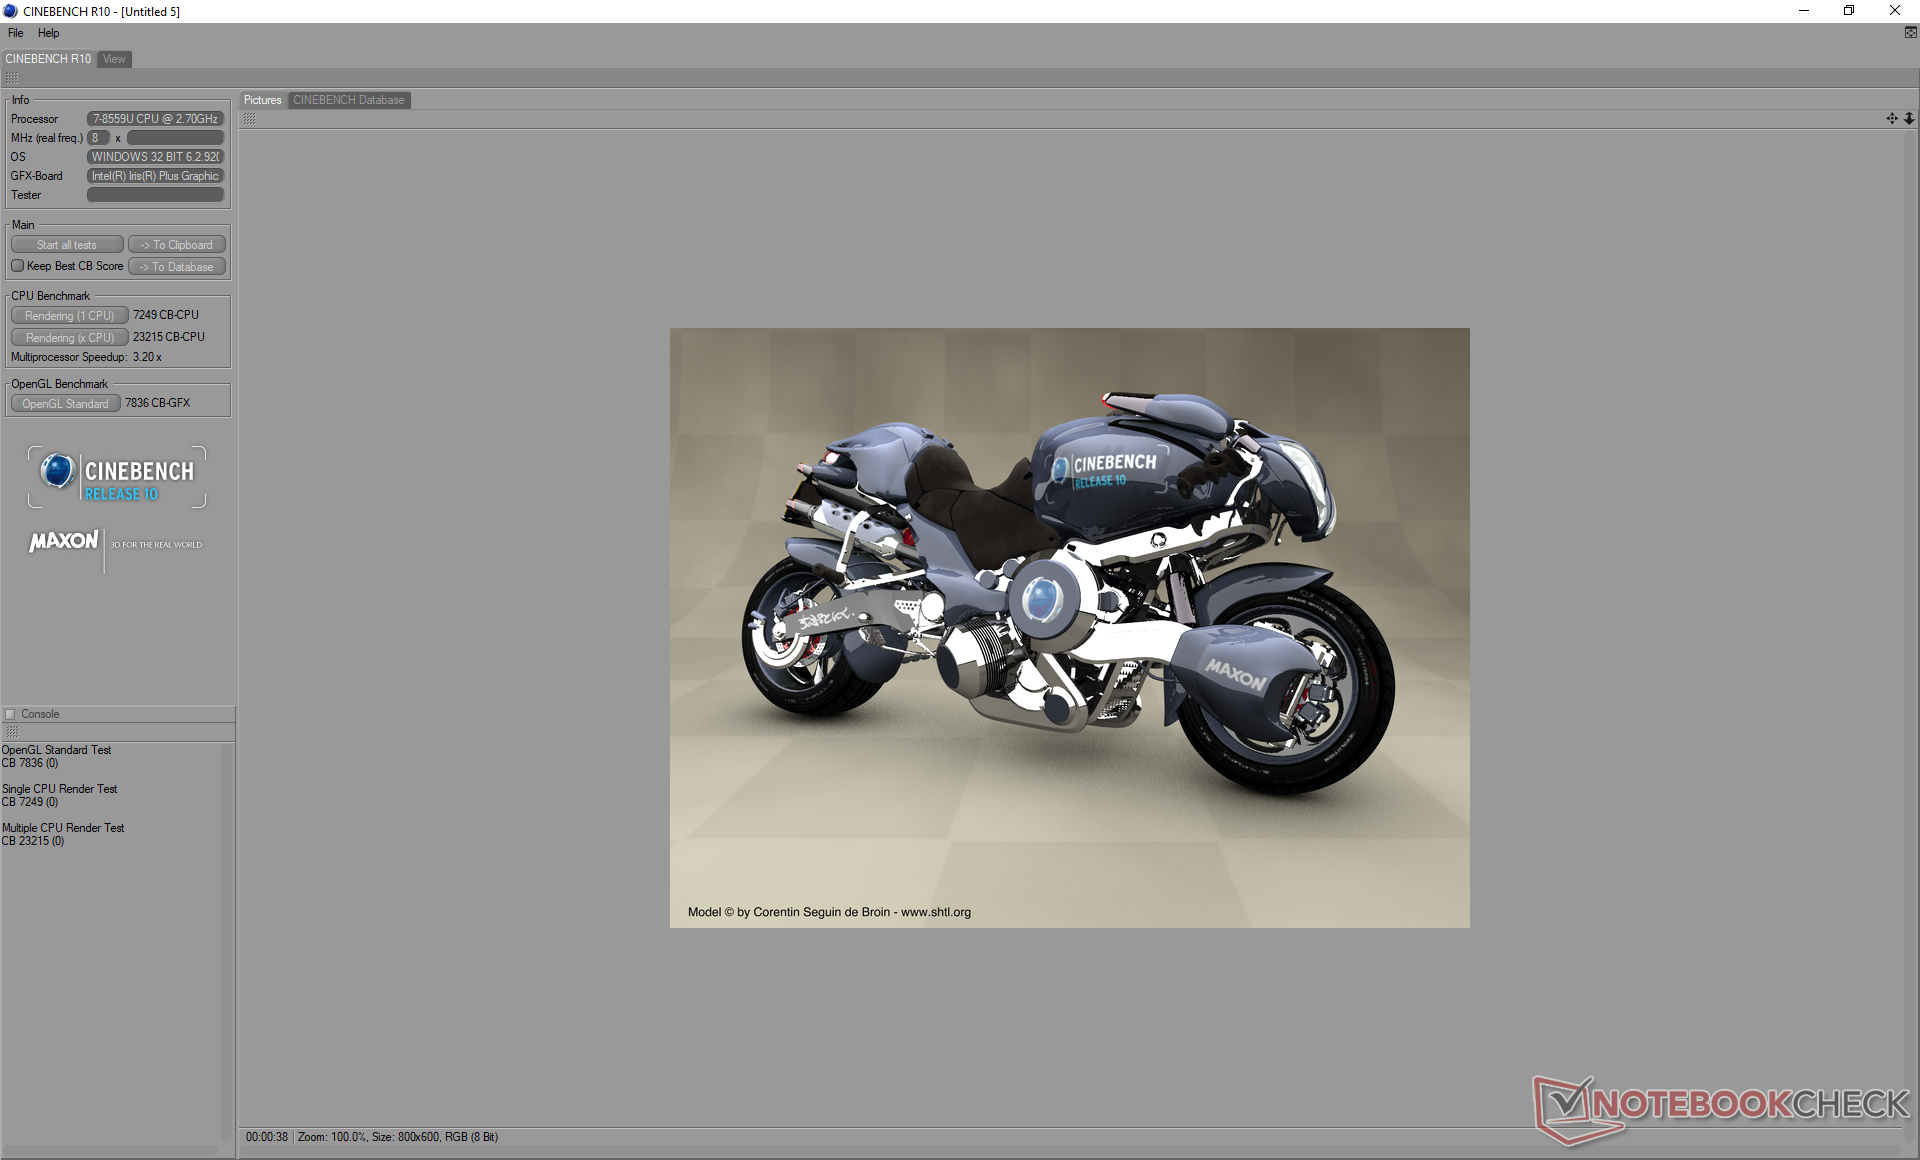
By running CineBench R15 Multi-Thread in a loop, we can observe how CPU performance changes over time. Our graph below shows our i7-8559U starting out strongly with a score of 808 points to best even the Core i7-7700HQ as found on many gaming laptops. Unfortunately, performance degrades very quickly and its score subsequently drops by about 17 percent during the second loop. The final result is a processor that only edges out the i7-8550U by a tinier margin than we had hoped. The initial burst in performance is short-lived and we investigate this further in our Stress Test section below.
Raw CPU performance is still faster than both the Ryzen 5 2500U and Ryzen 7 2700U even after accounting for the performance throttling.
See our dedicated page on the Core i7-8559U for more technical information and benchmark comparisons.
* ... smaller is better
System Performance
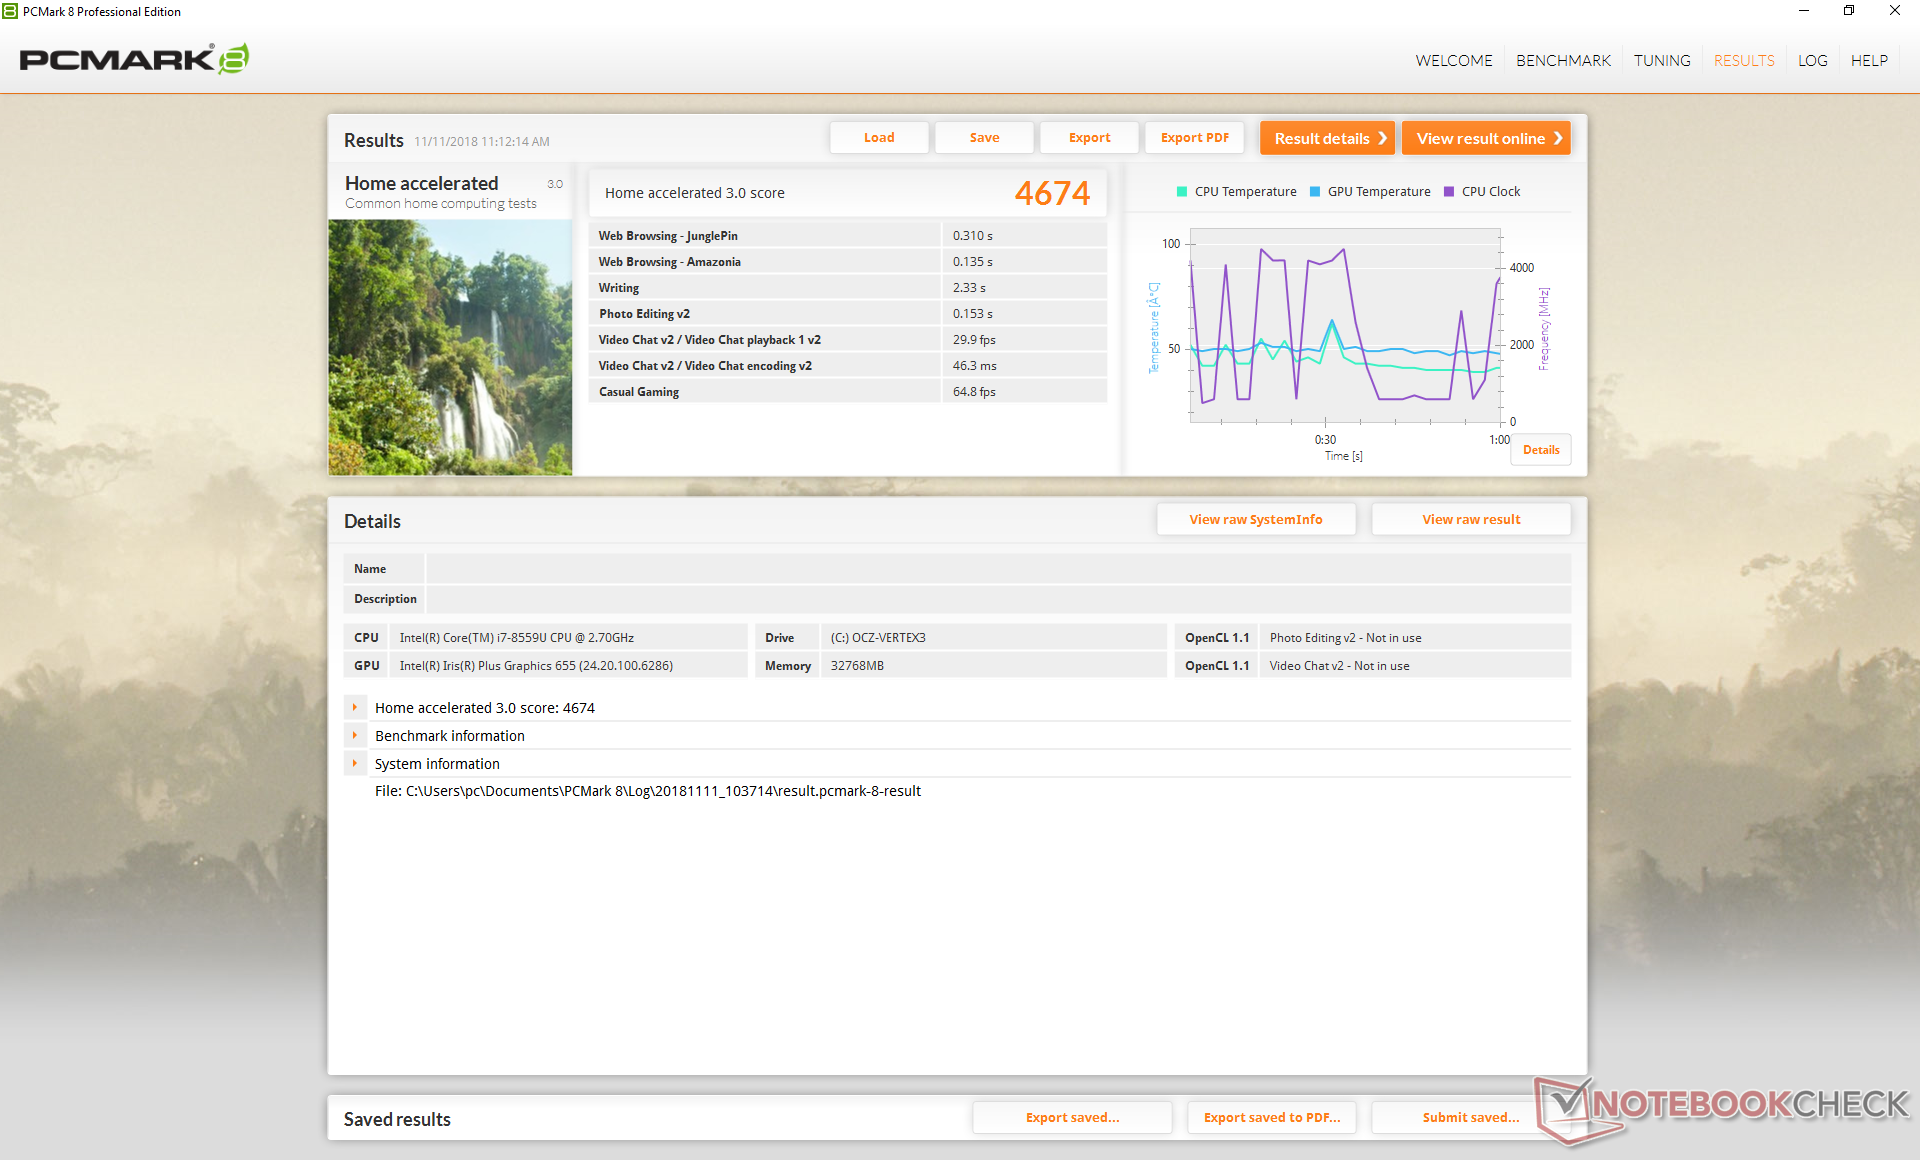
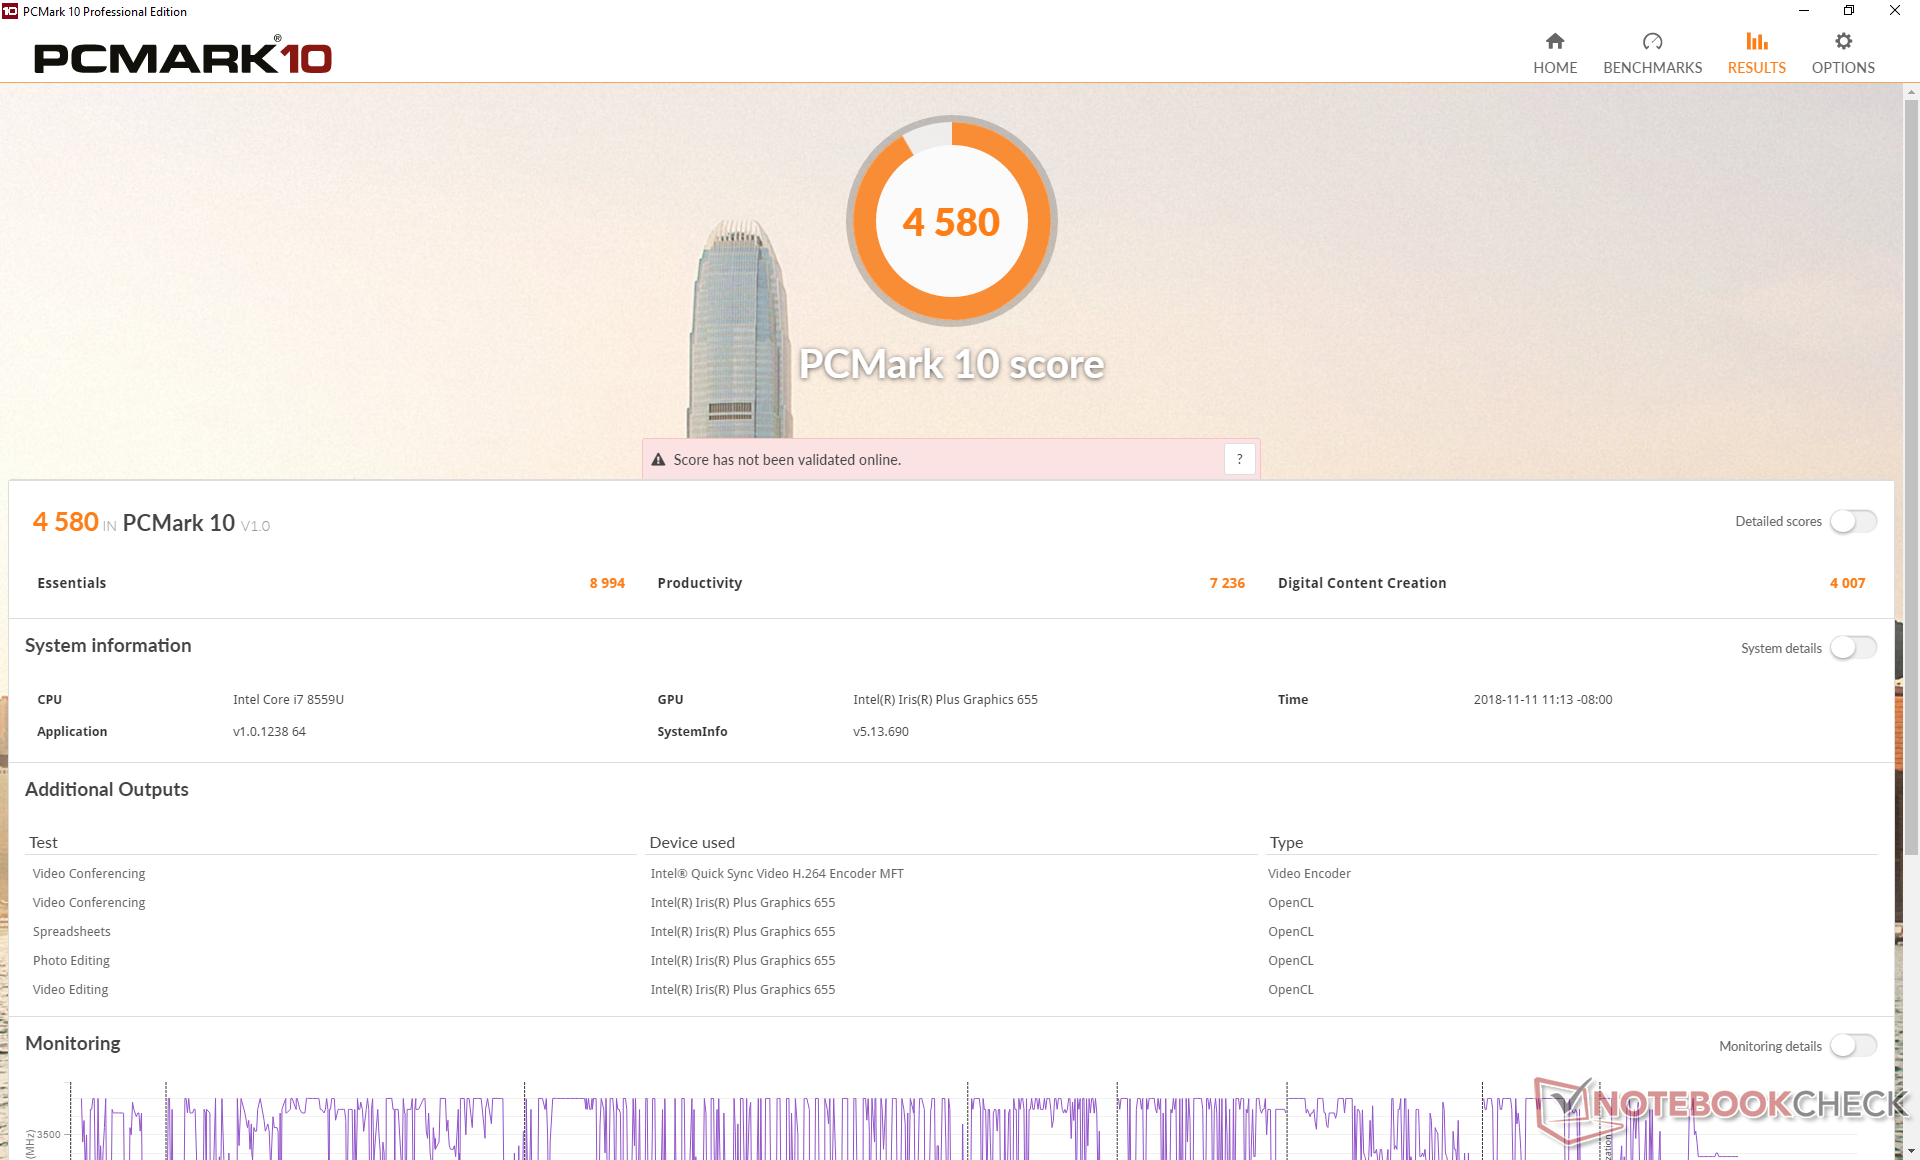
As expected, PCMark benchmarks rank our NUC8i7BEH in between the slower Zotac ZBOX-CI660 Nano and faster Hades Canyon NUC. We suspect that scores could have been higher had we equipped our test unit with a SATA III or NVMe SSD. Nonetheless, system performance is fluid and we experienced no crashes or errors during our time with the unit.
| PCMark 8 | |
| Home Score Accelerated v2 | |
| Intel Hades Canyon NUC8i7HVK | |
| Intel NUC8i7BE | |
| Intel NUC6i5SYH | |
| Zotac ZBOX-CI660 Nano | |
| Intel NUC7CJYH | |
| Work Score Accelerated v2 | |
| Intel Hades Canyon NUC8i7HVK | |
| Intel NUC6i5SYH | |
| Intel NUC7CJYH | |
| Creative Score Accelerated v2 | |
| Intel Hades Canyon NUC8i7HVK | |
| Intel NUC6i5SYH | |
| Intel NUC7CJYH | |
| PCMark 8 Home Score Accelerated v2 | 4674 points | |
| PCMark 10 Score | 4580 points | |
Help | ||
GPU Performance
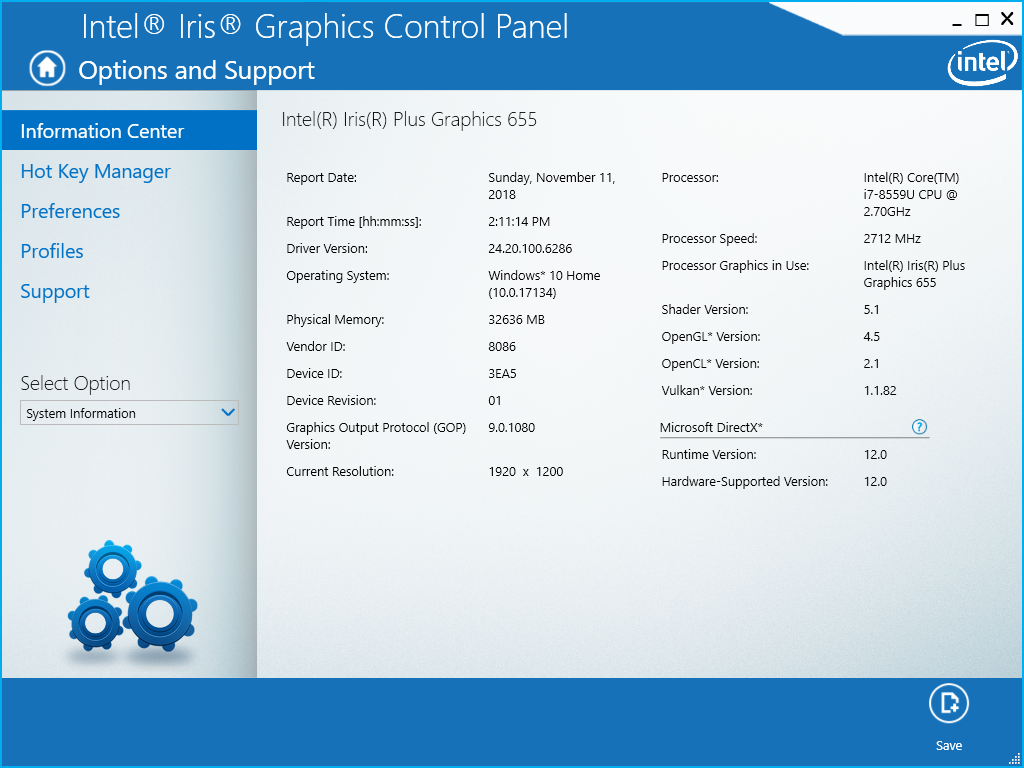
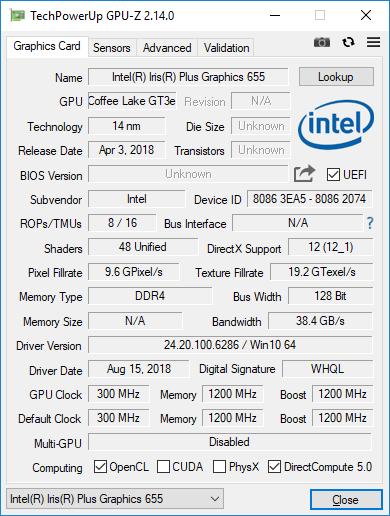
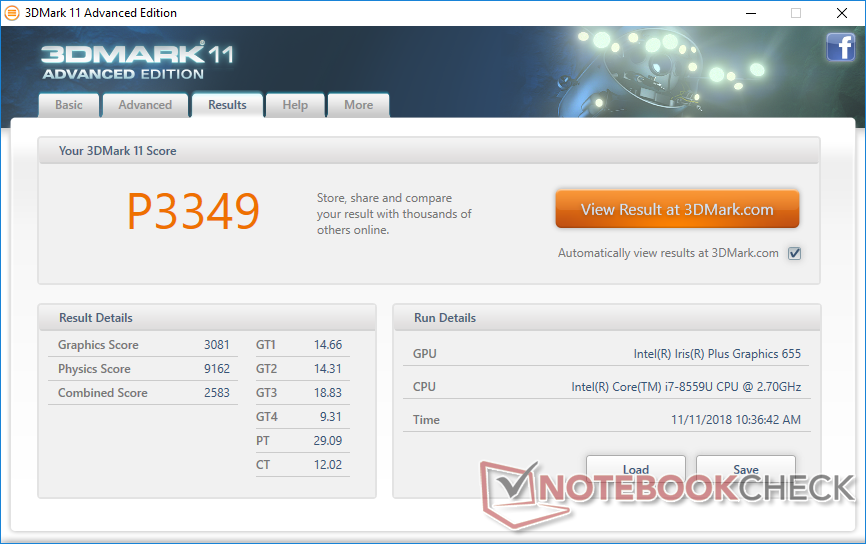
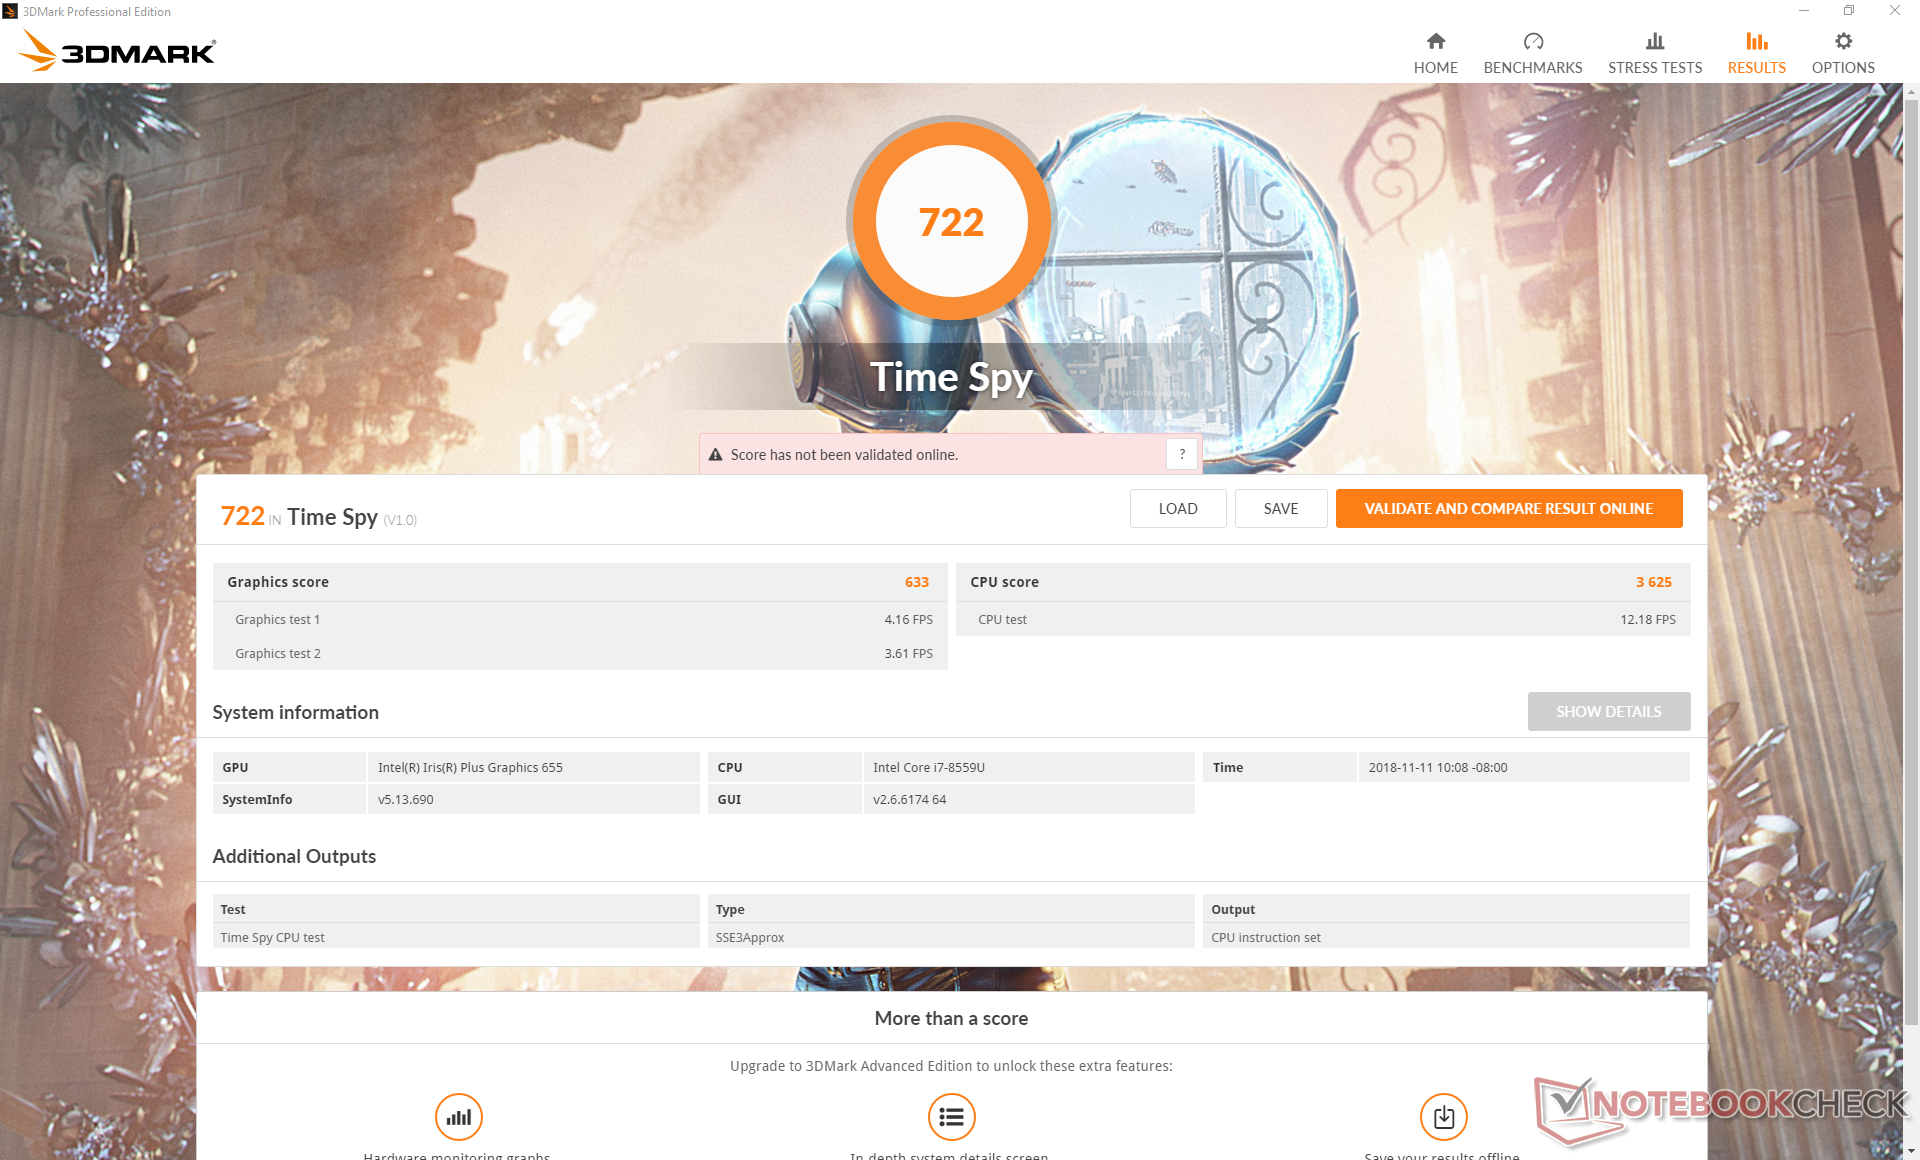
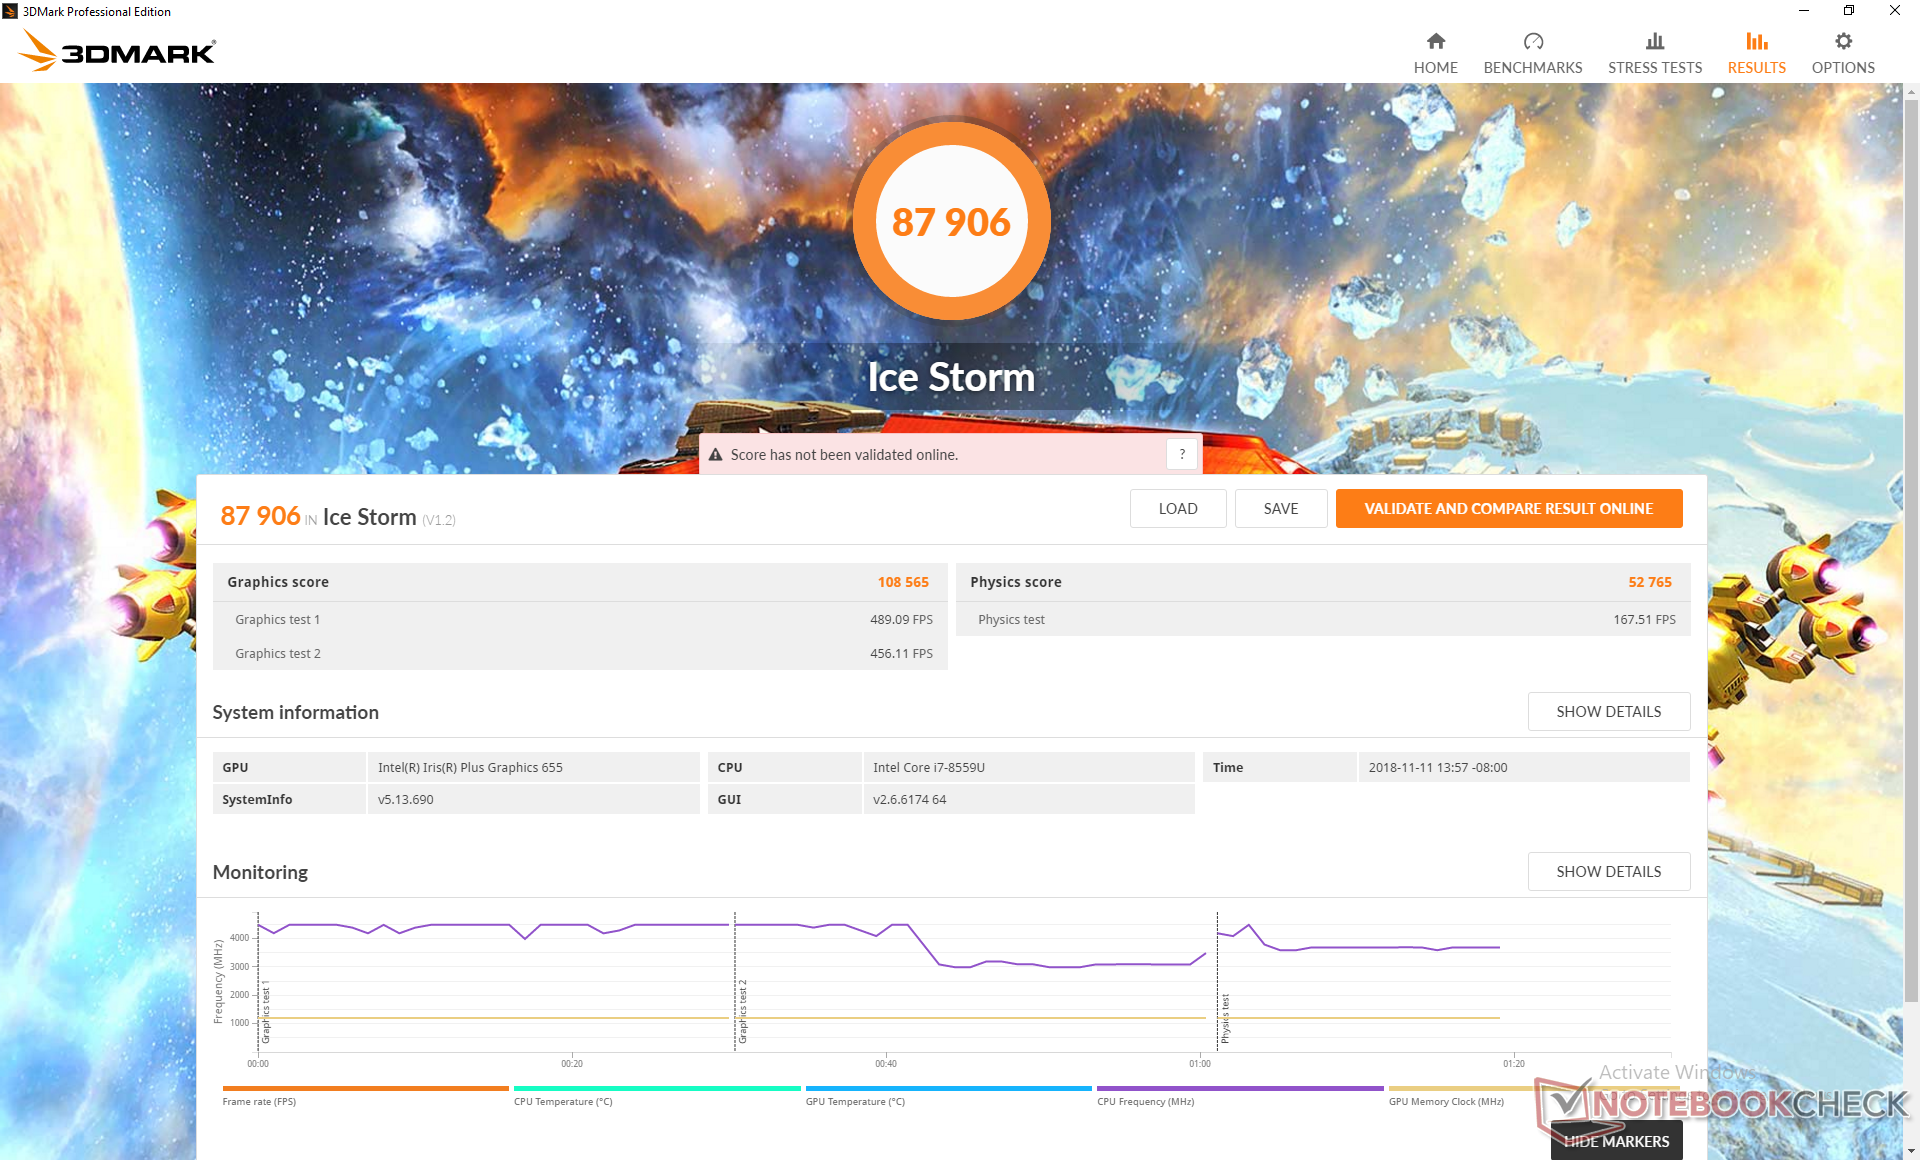
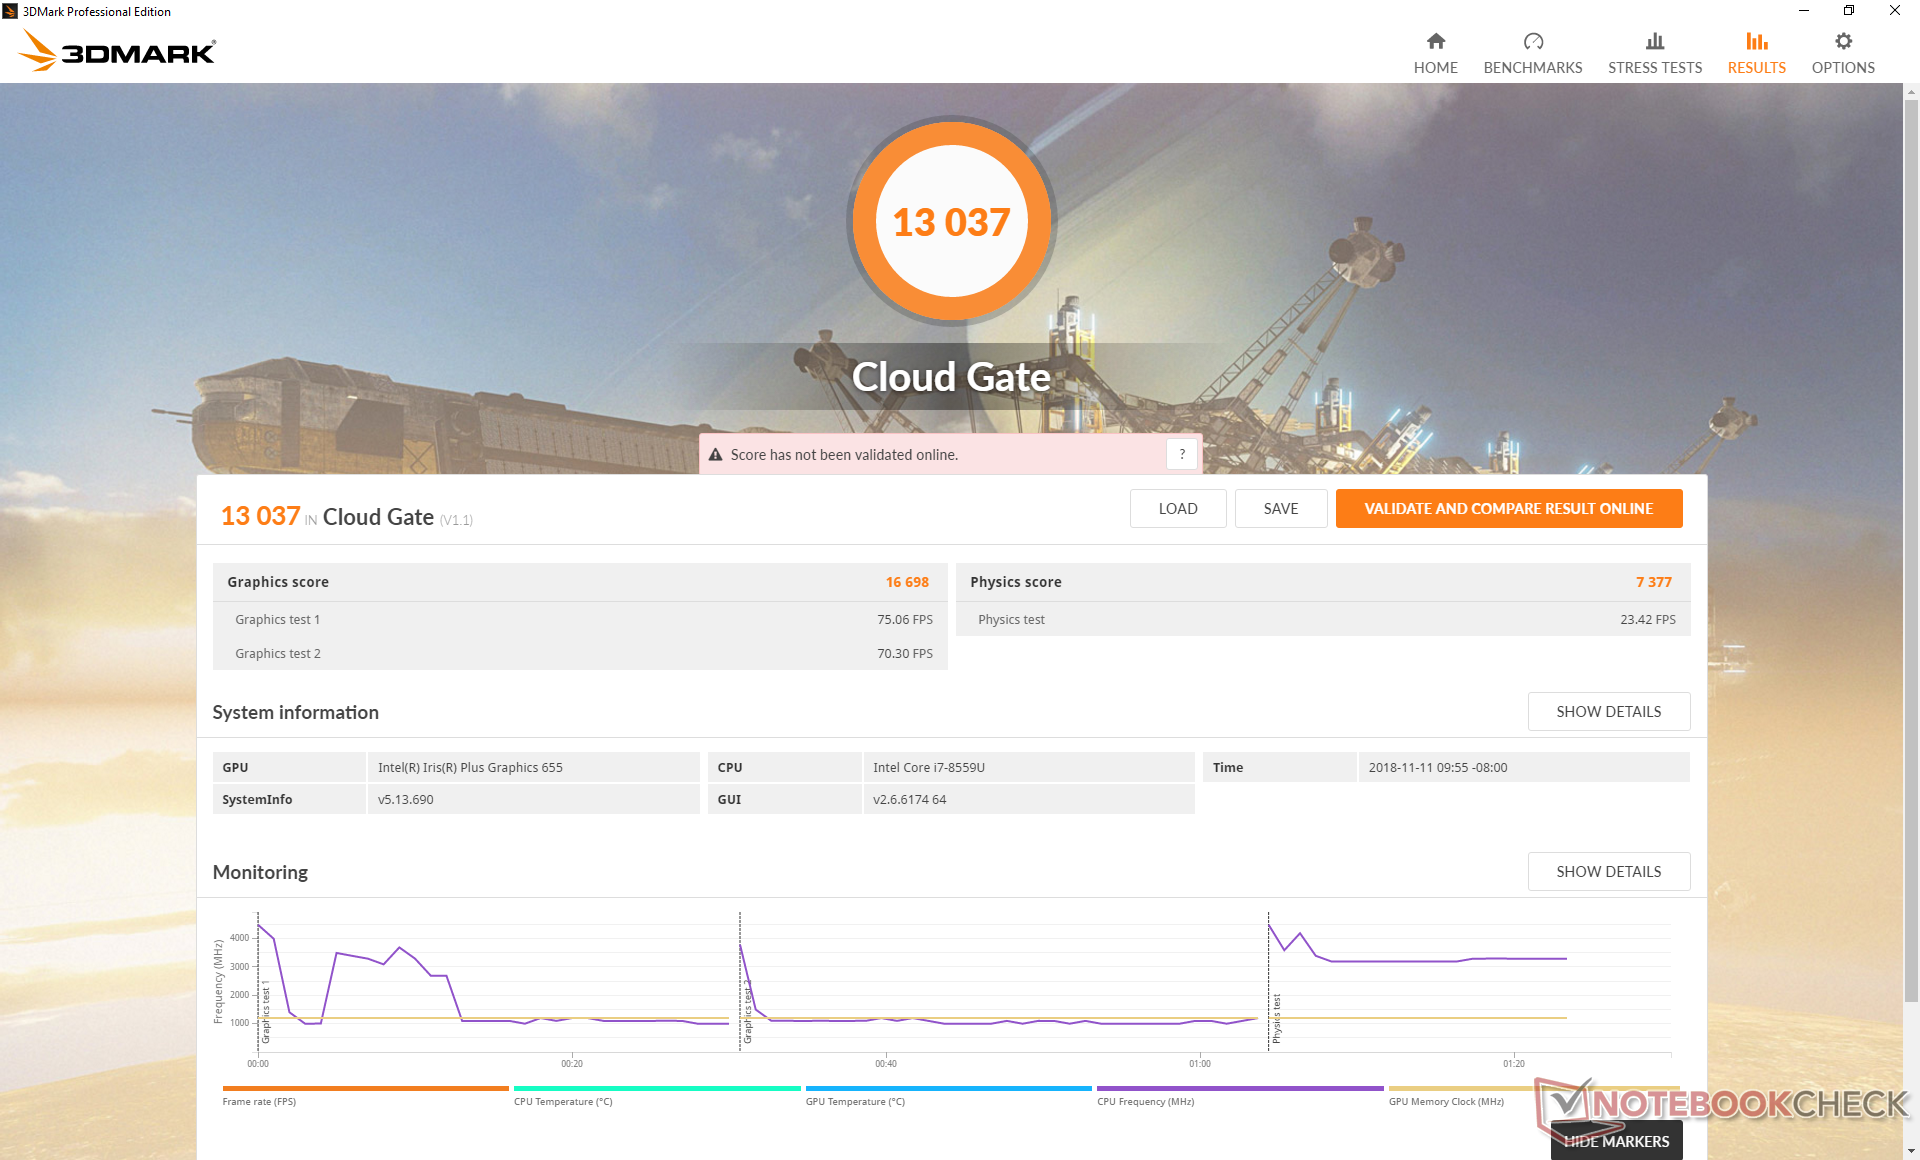
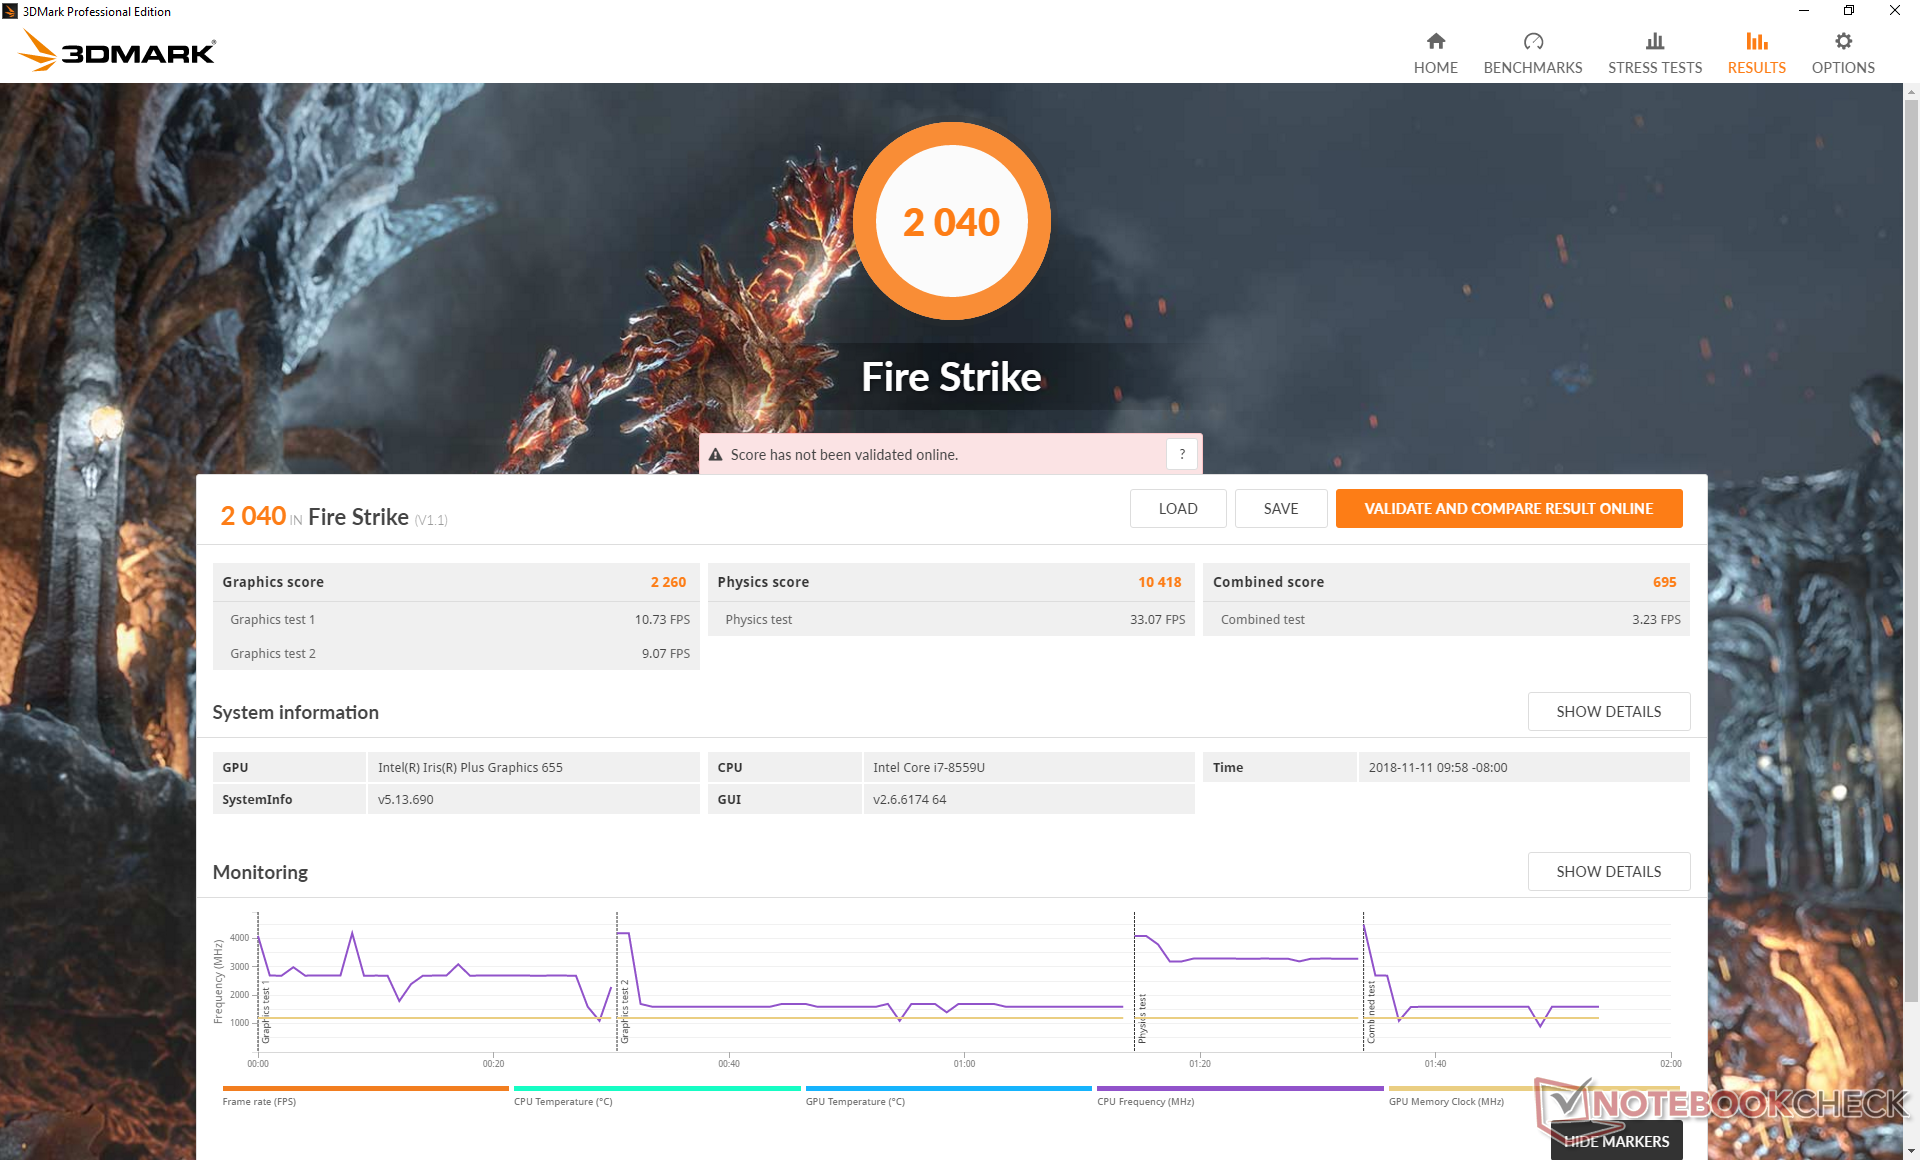
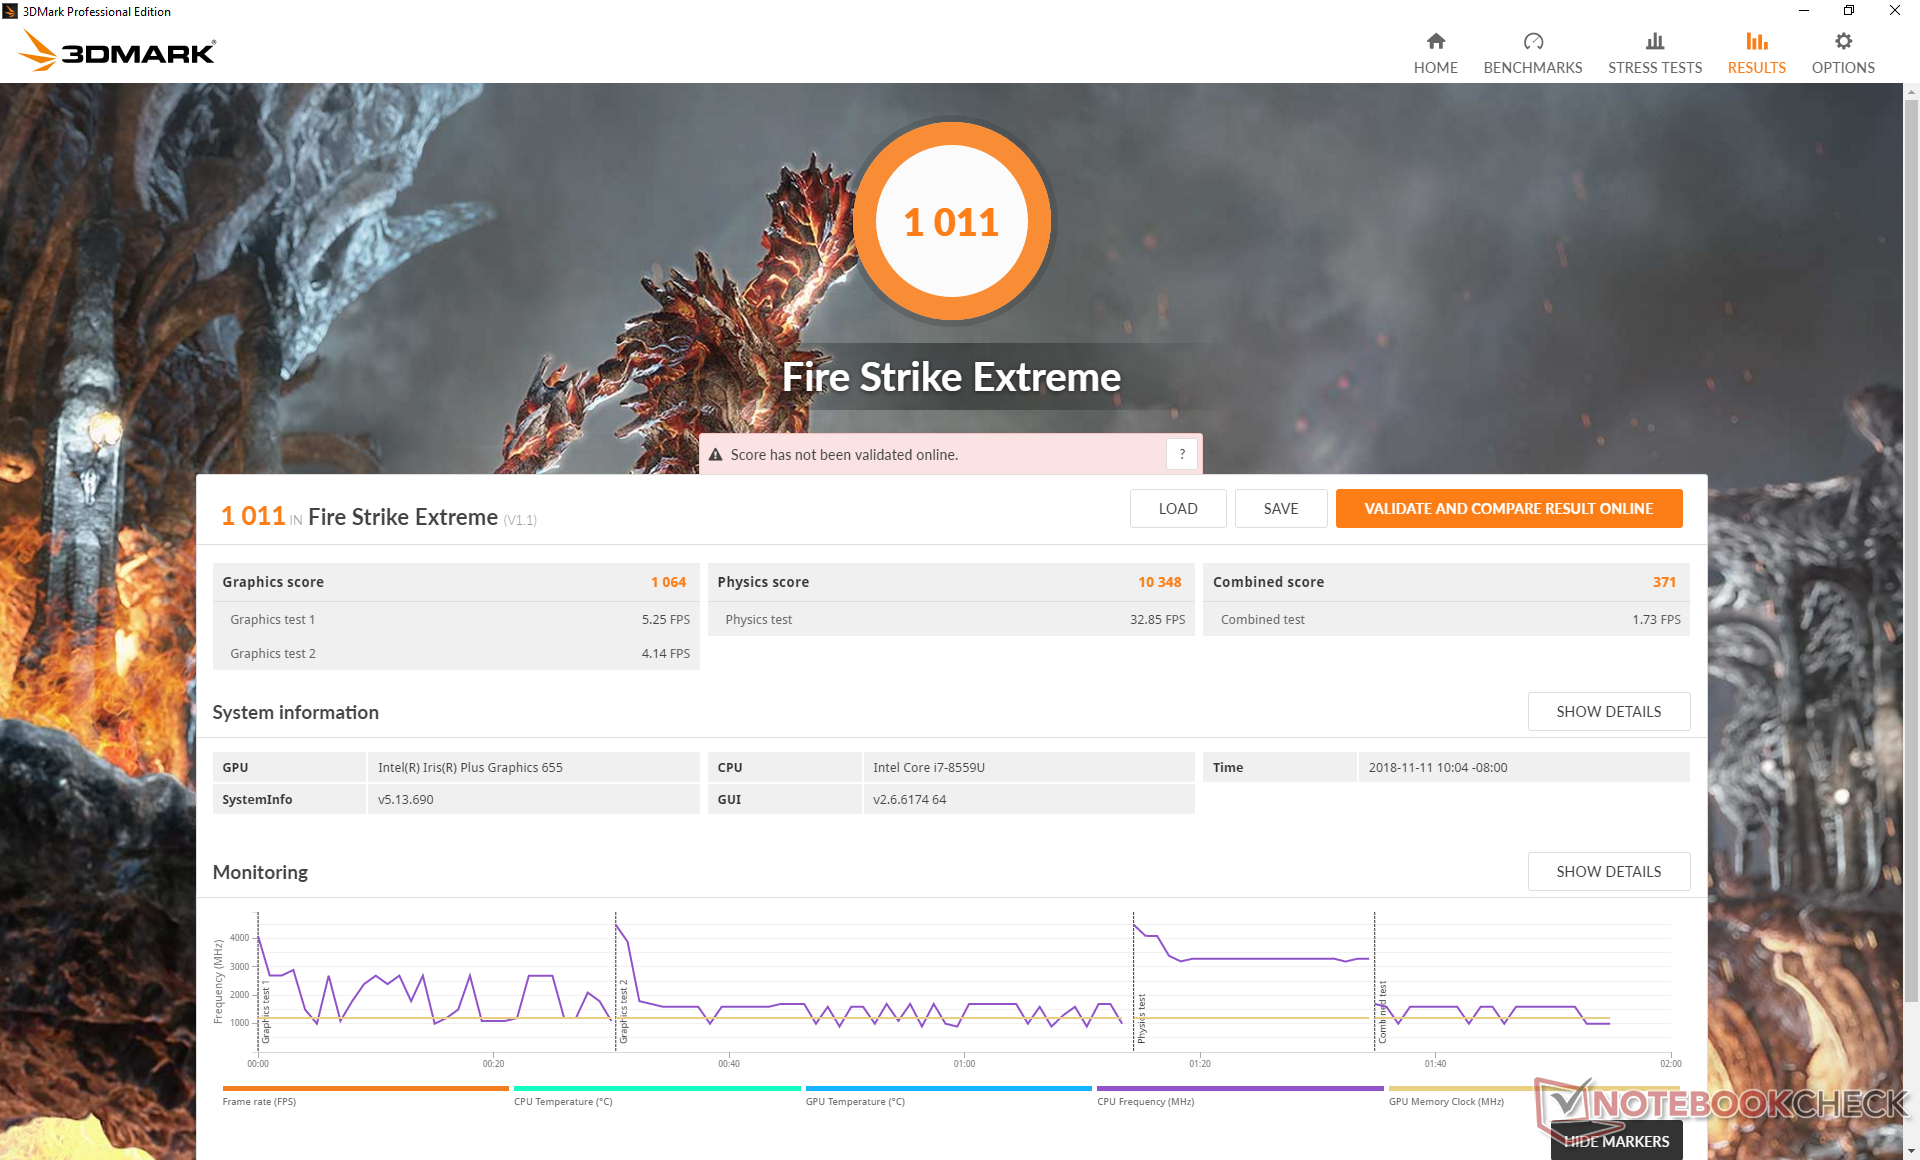
The i7-8559U is paired with the same Iris Plus Graphics 655 GPU as found on the 2018 MacBook Pro 13 and our 3DMark results confirm that both perform similarly in terms of graphics horsepower. Users can expect GPU performance to be about 10 to 20 percent faster than the aging GeForce 940MX and about 35 to 50 percent slower than a 25 W GeForce MX150. The UHD Graphics 620 as found on nearly every Ultrabook within the past two years is about 50 percent slower.
Gaming performance is similar to the GeForce 940MX or MX130 meaning that most modern titles are generally unplayable at 1080p. The GPU is primarily designed for light editing work and undemanding games like Rocket League or League of Legends.
See our dedicated page on the Iris Plus Graphics 655 for more technical information and benchmark comparisons.
| 3DMark Vantage P Result | 12093 points | |
| 3DMark 11 Performance | 3349 points | |
| 3DMark Ice Storm Standard Score | 87906 points | |
| 3DMark Cloud Gate Standard Score | 13037 points | |
| 3DMark Fire Strike Score | 2040 points | |
| 3DMark Fire Strike Extreme Score | 1011 points | |
| 3DMark Time Spy Score | 722 points | |
Help | ||
| The Witcher 3 - 1024x768 Low Graphics & Postprocessing | |
| Average of class Desktop (39.3 - 841, n=30, last 2 years) | |
| Intel NUC8i7BE | |
| Average Intel Iris Plus Graphics 655 (23.2 - 27.9, n=4) | |
| low | med. | high | ultra | QHD | 4K | |
|---|---|---|---|---|---|---|
| Counter-Strike: GO (2012) | 93.7 | 49.6 | 12.4 | |||
| BioShock Infinite (2013) | 116.6 | 64.8 | 55 | 17 | ||
| GTA V (2015) | 68 | 62.1 | 15.8 | 6.22 | 4.17 | |
| The Witcher 3 (2015) | 27.4 | |||||
| Dota 2 Reborn (2015) | 95 | 68 | 34.7 | 30.4 | 12.2 | |
| Rainbow Six Siege (2015) | 75.8 | 0 | ||||
| Rise of the Tomb Raider (2016) | 39.2 | 22.3 | 10.8 | 8.9 | ||
| Ashes of the Singularity (2016) | 19.4 | 11.3 | 10.5 | |||
| Deus Ex Mankind Divided (2016) | 28.7 | 21.1 | ||||
| For Honor (2017) | 41.3 | 16.1 | ||||
| Ghost Recon Wildlands (2017) | 22.7 | |||||
| Rocket League (2017) | 133.3 | 59.1 | 38.8 | |||
| Final Fantasy XV Benchmark (2018) | 16.9 | |||||
| X-Plane 11.11 (2018) | 32.6 | 23.3 | 19.8 | |||
| World of Tanks enCore (2018) | 15.7 | 40.3 | ||||
| Far Cry 5 (2018) | 23 | 11 | ||||
| Shadow of the Tomb Raider (2018) | 22 | |||||
| FIFA 19 (2018) | 82 | 45.8 | 40.3 | 36.7 | ||
| Assassin´s Creed Odyssey (2018) | 18 | |||||
| Battlefield V (2018) | 19.9 | |||||
| Far Cry New Dawn (2019) | 22 | 11 | ||||
| Metro Exodus (2019) | 18.3 | |||||
| Anthem (2019) | 16.6 | |||||
| Dirt Rally 2.0 (2019) | 64 | 22.8 | ||||
| The Division 2 (2019) | 35 | |||||
| Anno 1800 (2019) | 30.2 | |||||
| Rage 2 (2019) | 24.5 | |||||
| Total War: Three Kingdoms (2019) | 56.7 | 18.5 | 10.5 | |||
| F1 2019 (2019) | 51.2 | 21.9 | 19.3 | |||
| Control (2019) | 25 severe graphical problems | |||||
| Borderlands 3 (2019) | 23.5 | 10.2 | 6.4 | |||
| FIFA 20 (2019) | 92 | 55.9 | 46.3 | 34.9 | 26.5 | 13.6 |
| Ghost Recon Breakpoint (2019) | 0 game wont start | |||||
| GRID 2019 (2019) | 36 severe graphical problems | 20 severe graphical problems | ||||
| Call of Duty Modern Warfare 2019 (2019) | 0 game wont start | |||||
| Red Dead Redemption 2 (2019) | 15.8 | |||||
| Hearthstone (2020) | 59.8 | 27.2 | ||||
| Escape from Tarkov (2020) | 29.1 | 16.2 | 14.1 | 6.59 | ||
| Doom Eternal (2020) | 0 game wont start | |||||
| Gears Tactics (2020) | 54.8 | 17.3 | 11.6 |
Emissions
System Noise
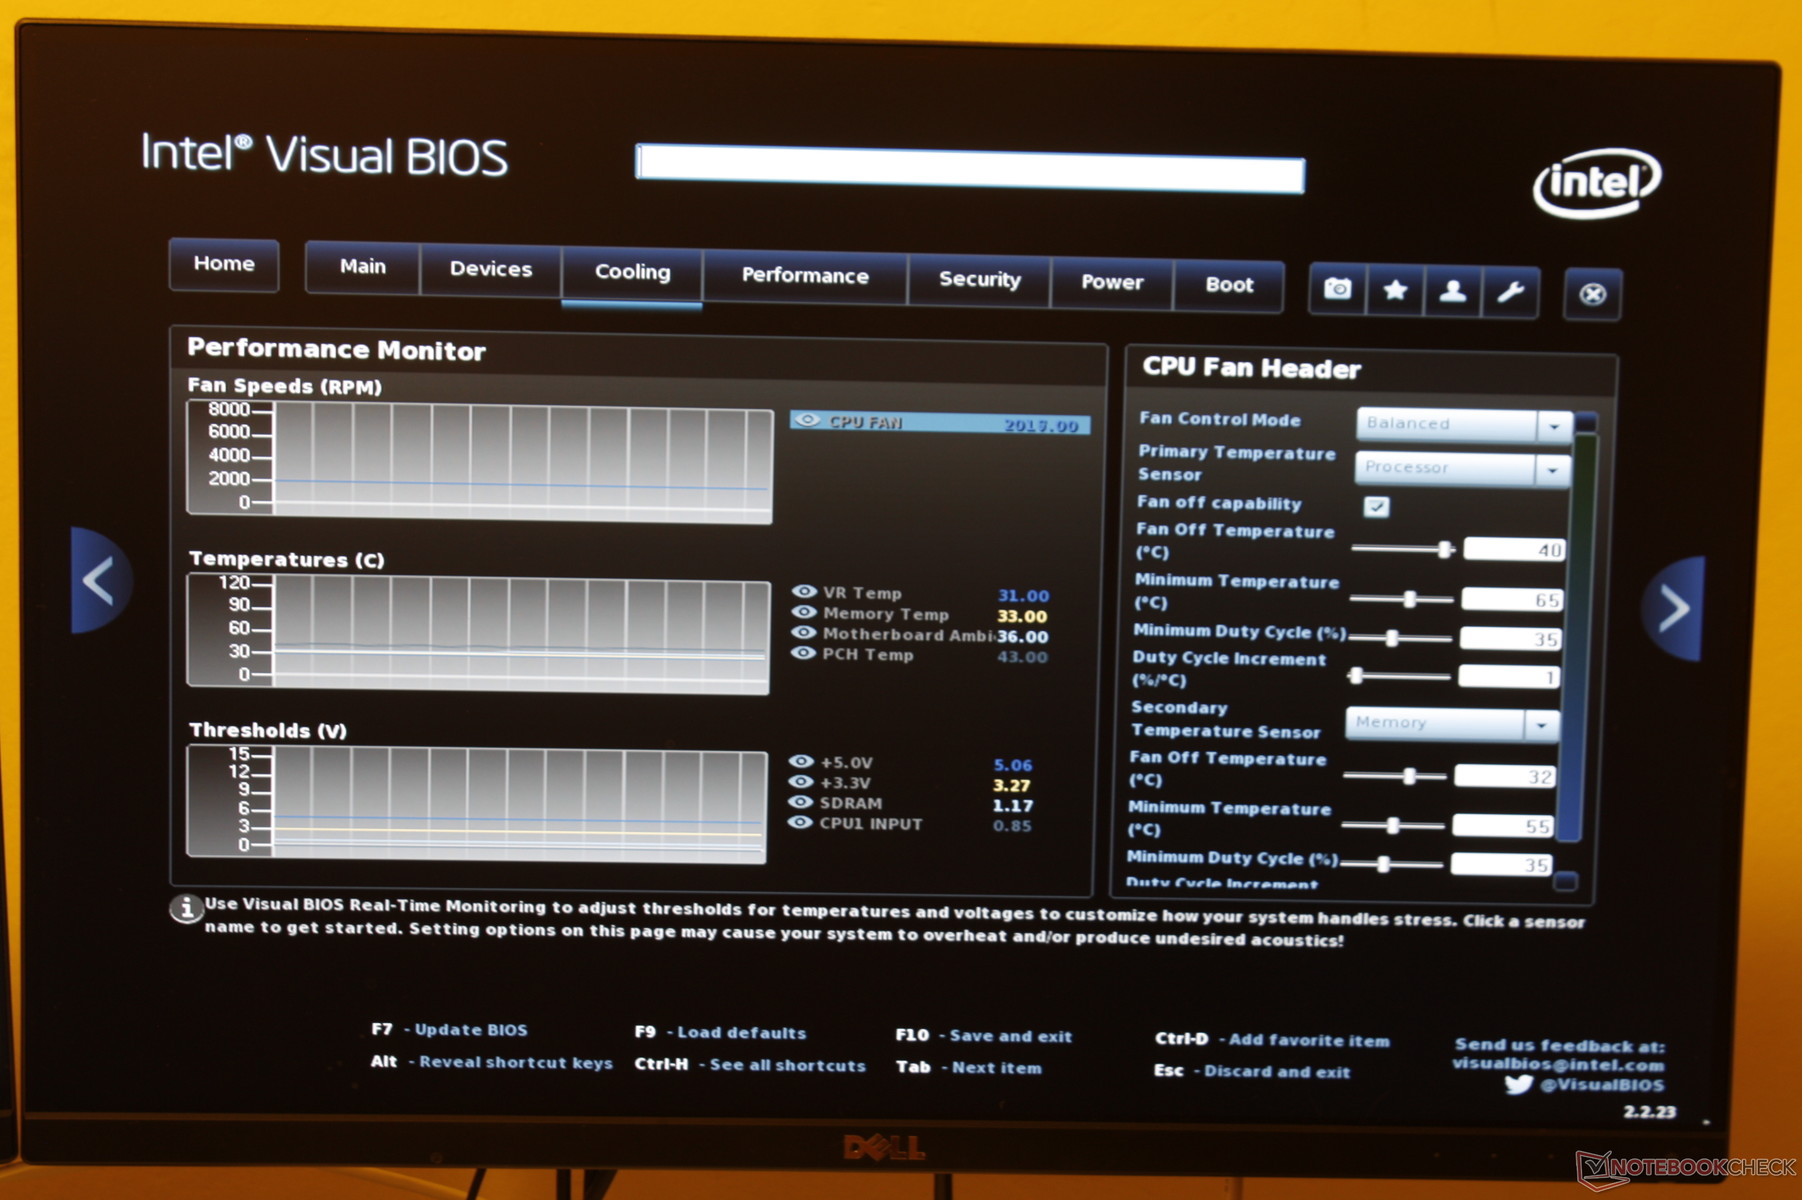
The system fan tends to pulsate between 29 dB(A) and 32 dB(A) during low loads on the High Performance profile setting. The results are comparable to most Ultrabooks if not a tad louder, but users would be less likely to notice on the NUC since mini PCs tend to sit farther away from the user.
Higher loads like gaming will bump fan noise to 39 dB(A) which is again slightly louder than most Ultrabooks under similar conditions. Because of throttling, however, fan noise when gaming may eventually drop to just 34 dB(A) and so the louder fan would only be temporary during the first few seconds of stress. The system is quieter than the last generation Skull Canyon in all cases.
| Intel NUC8i7BE Iris Plus Graphics 655, i7-8559U | Intel Hades Canyon NUC8i7HVK Vega M GH, i7-8809G, Intel Optane 120 GB SSDPEK1W120GA | Intel Skull Canyon NUC6i7KYK Iris Pro Graphics 580, 6770HQ, Samsung SSD 850 EVO m.2 120GB | Lenovo Yoga C930-13IKB 81C4 UHD Graphics 620, i5-8550U, SK hynix PC401 HFS256GD9TNG | Apple MacBook Pro 13 2018 Touchbar i5 Iris Plus Graphics 655, i5-8259U | |
|---|---|---|---|---|---|
| Noise | -1% | -7% | 7% | 1% | |
| off / environment * (dB) | 28.7 | 28.7 -0% | 29.5 -3% | 27.9 3% | 29.6 -3% |
| Idle Minimum * (dB) | 28.7 | 29 -1% | 31.6 -10% | 27.9 3% | 29.6 -3% |
| Idle Average * (dB) | 29.3 | 29 1% | 32.2 -10% | 27.9 5% | 29.6 -1% |
| Idle Maximum * (dB) | 31.8 | 29 9% | 32.3 -2% | 29.3 8% | 29.6 7% |
| Load Average * (dB) | 39 | 36 8% | 43 -10% | 32 18% | 36.7 6% |
| Witcher 3 ultra * (dB) | 39 | 42 -8% | 32.5 17% | ||
| Load Maximum * (dB) | 41.4 | 49.4 -19% | 43.2 -4% | 39.3 5% | 46.7 -13% |
* ... smaller is better
Noise level
| Idle |
| 28.7 / 29.3 / 31.8 dB(A) |
| Load |
| 39 / 41.4 dB(A) |
 | ||
30 dB silent 40 dB(A) audible 50 dB(A) loud |
||
min: | ||
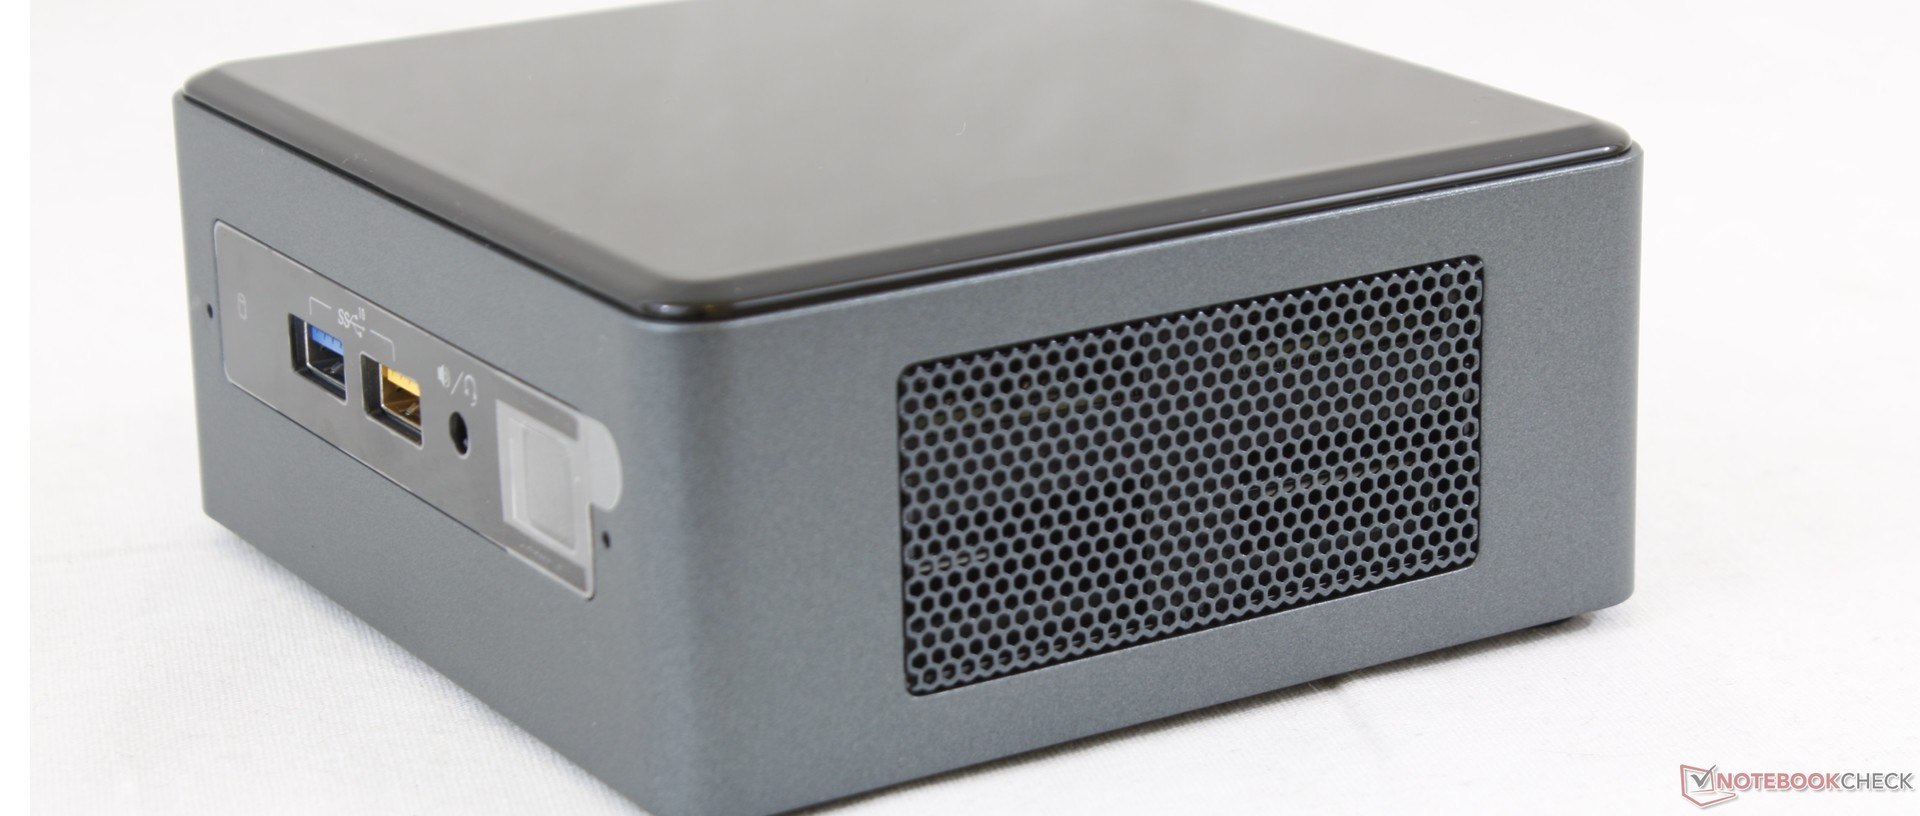
Temperature
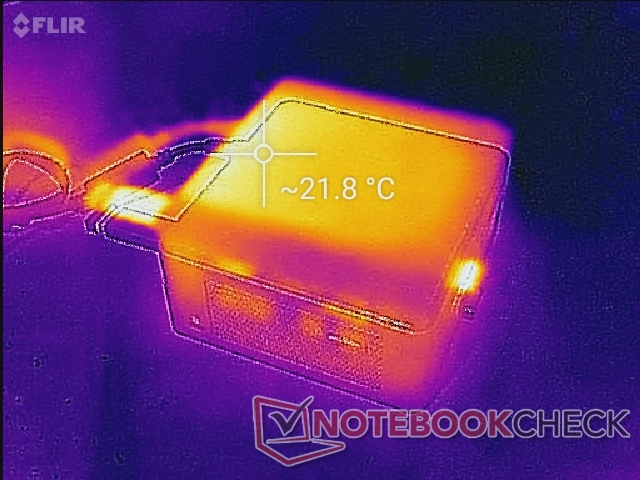
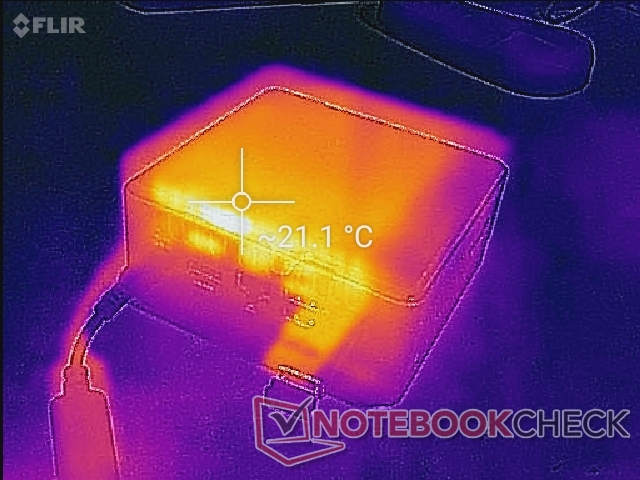
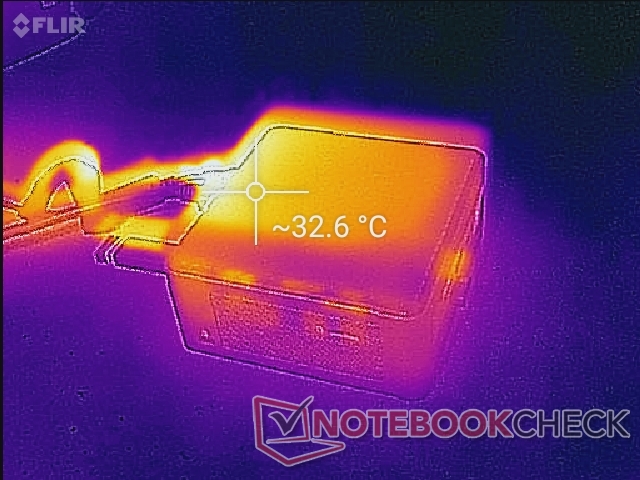
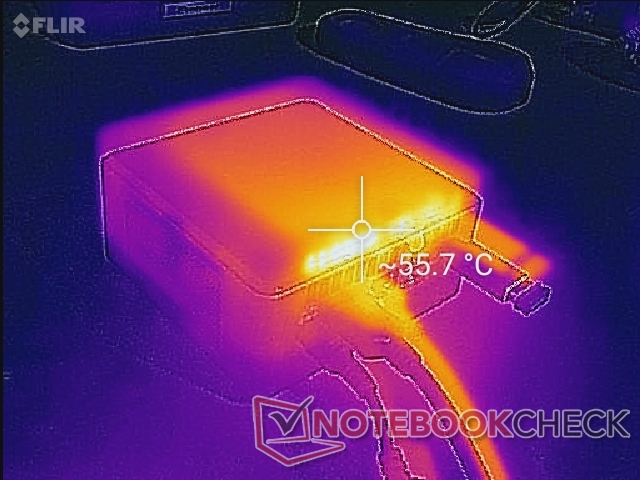
Surface temperatures when idling are in the low 20 C range while higher processing stress can cause hot spots to become as warm as 30 C. The rear ventilation grilles can be up to 55 C and so we don't recommend impeding airflow or standing the system on its side against its many grilles.
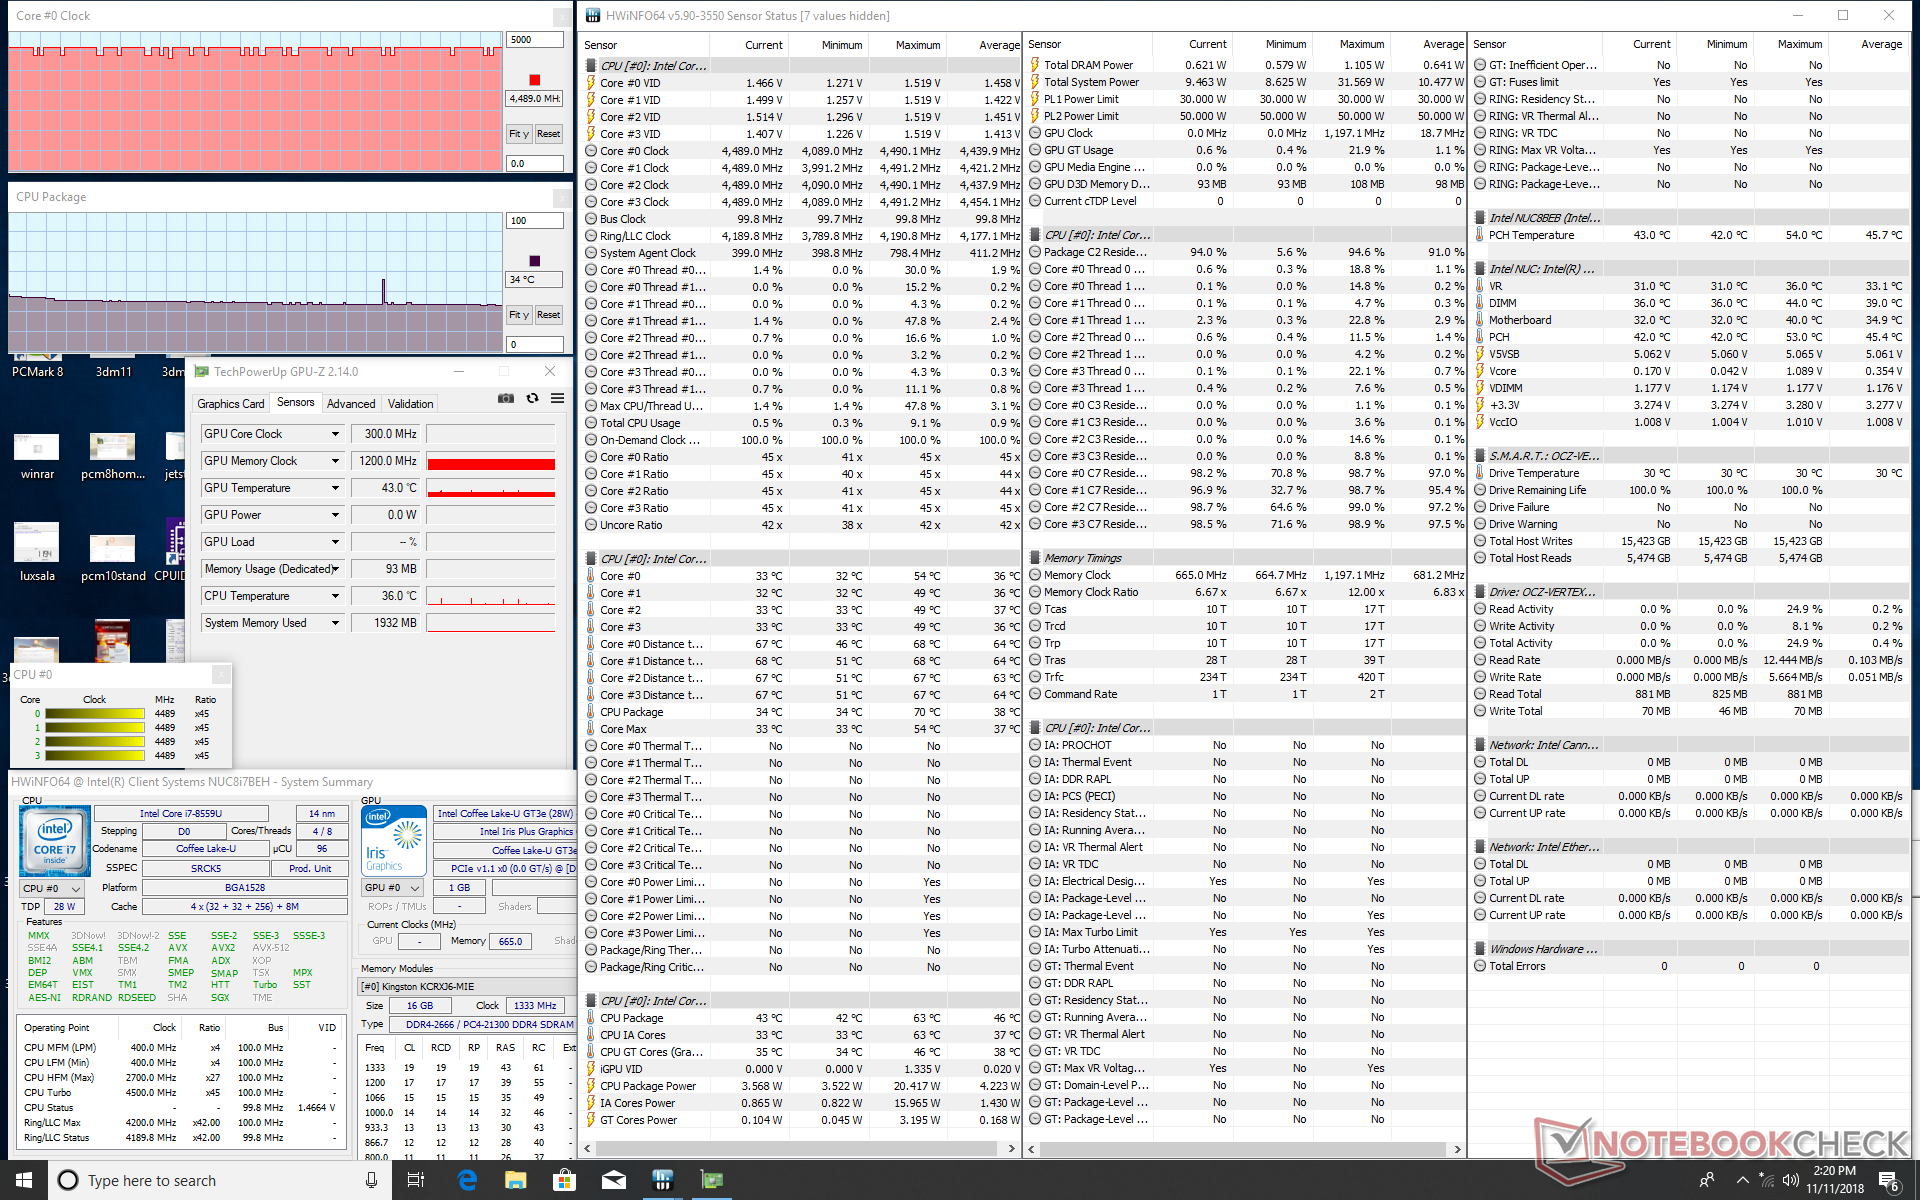
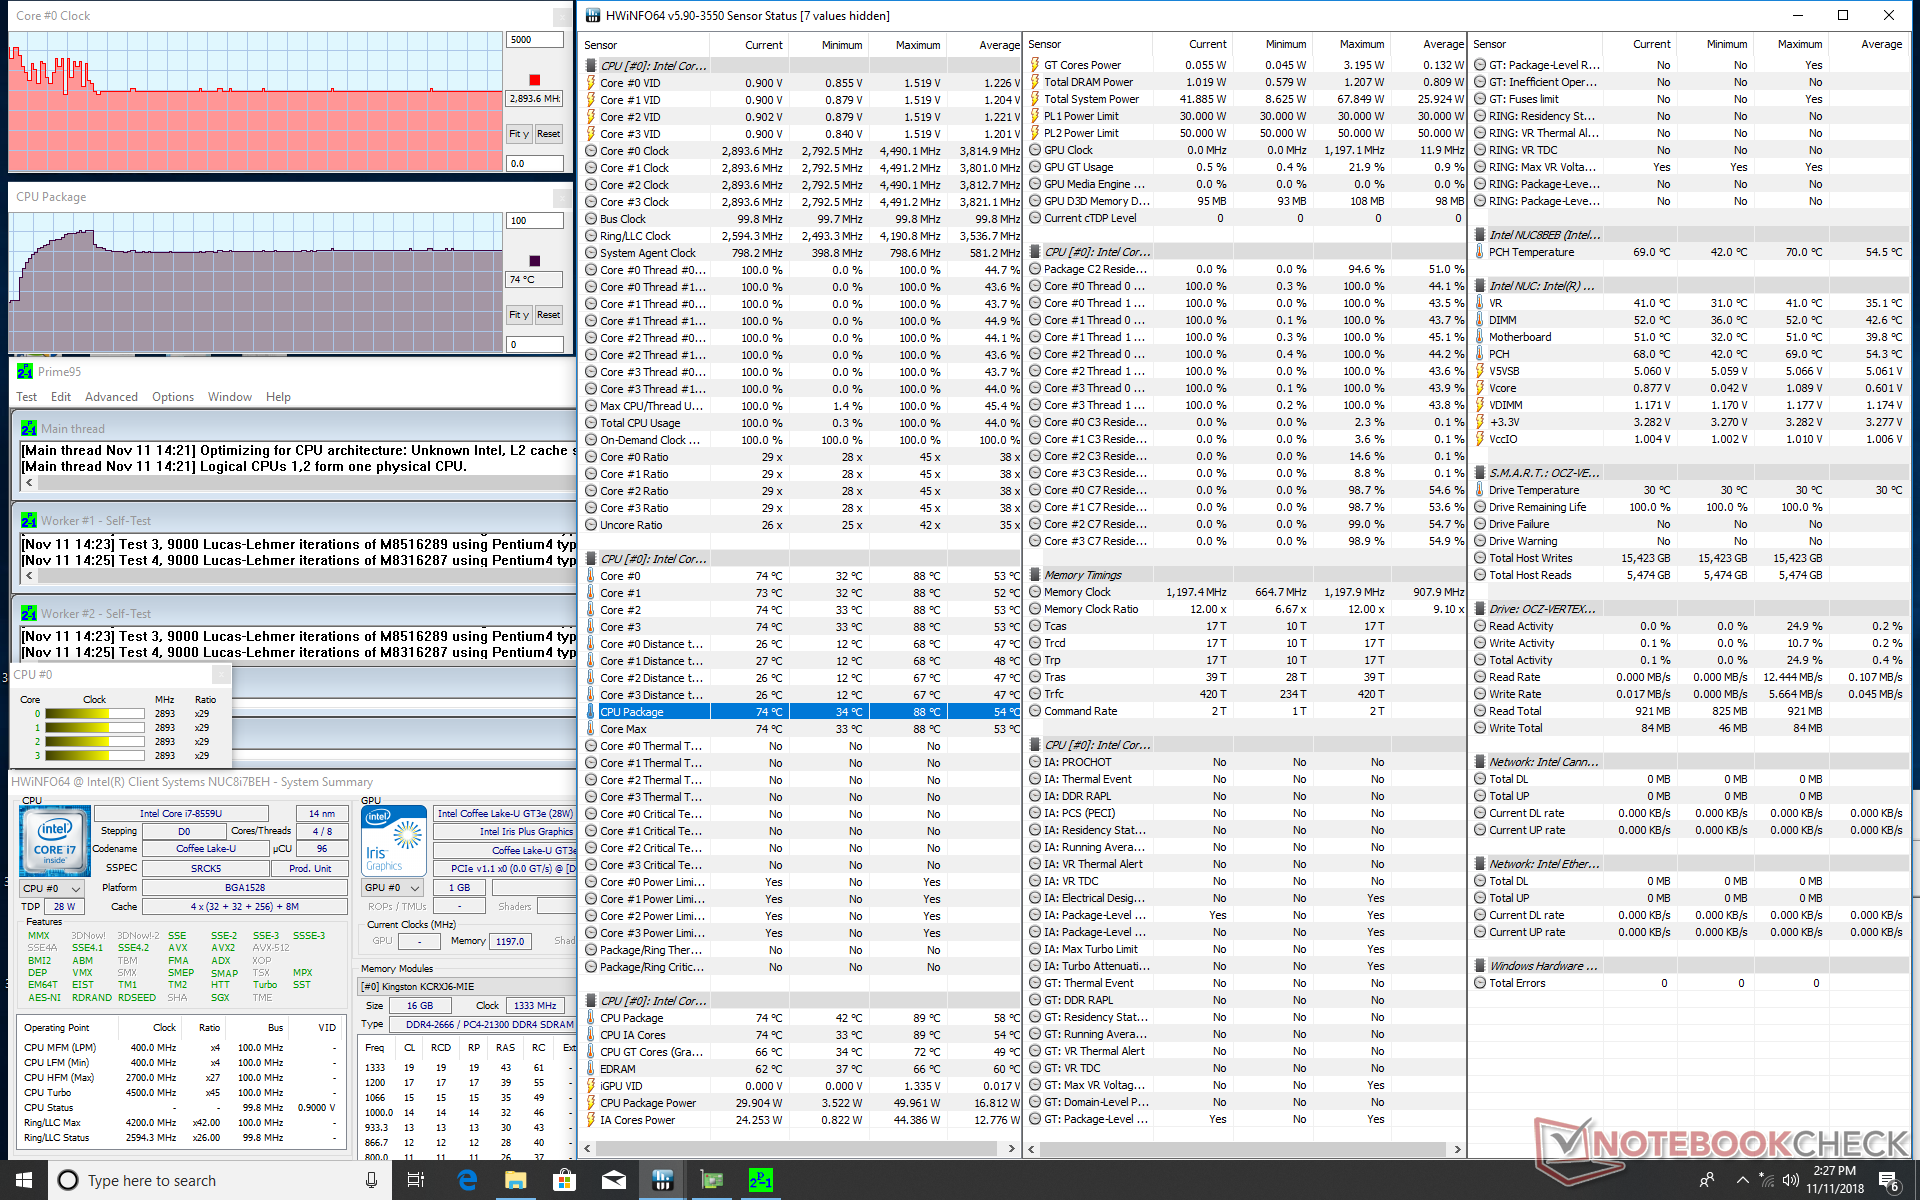
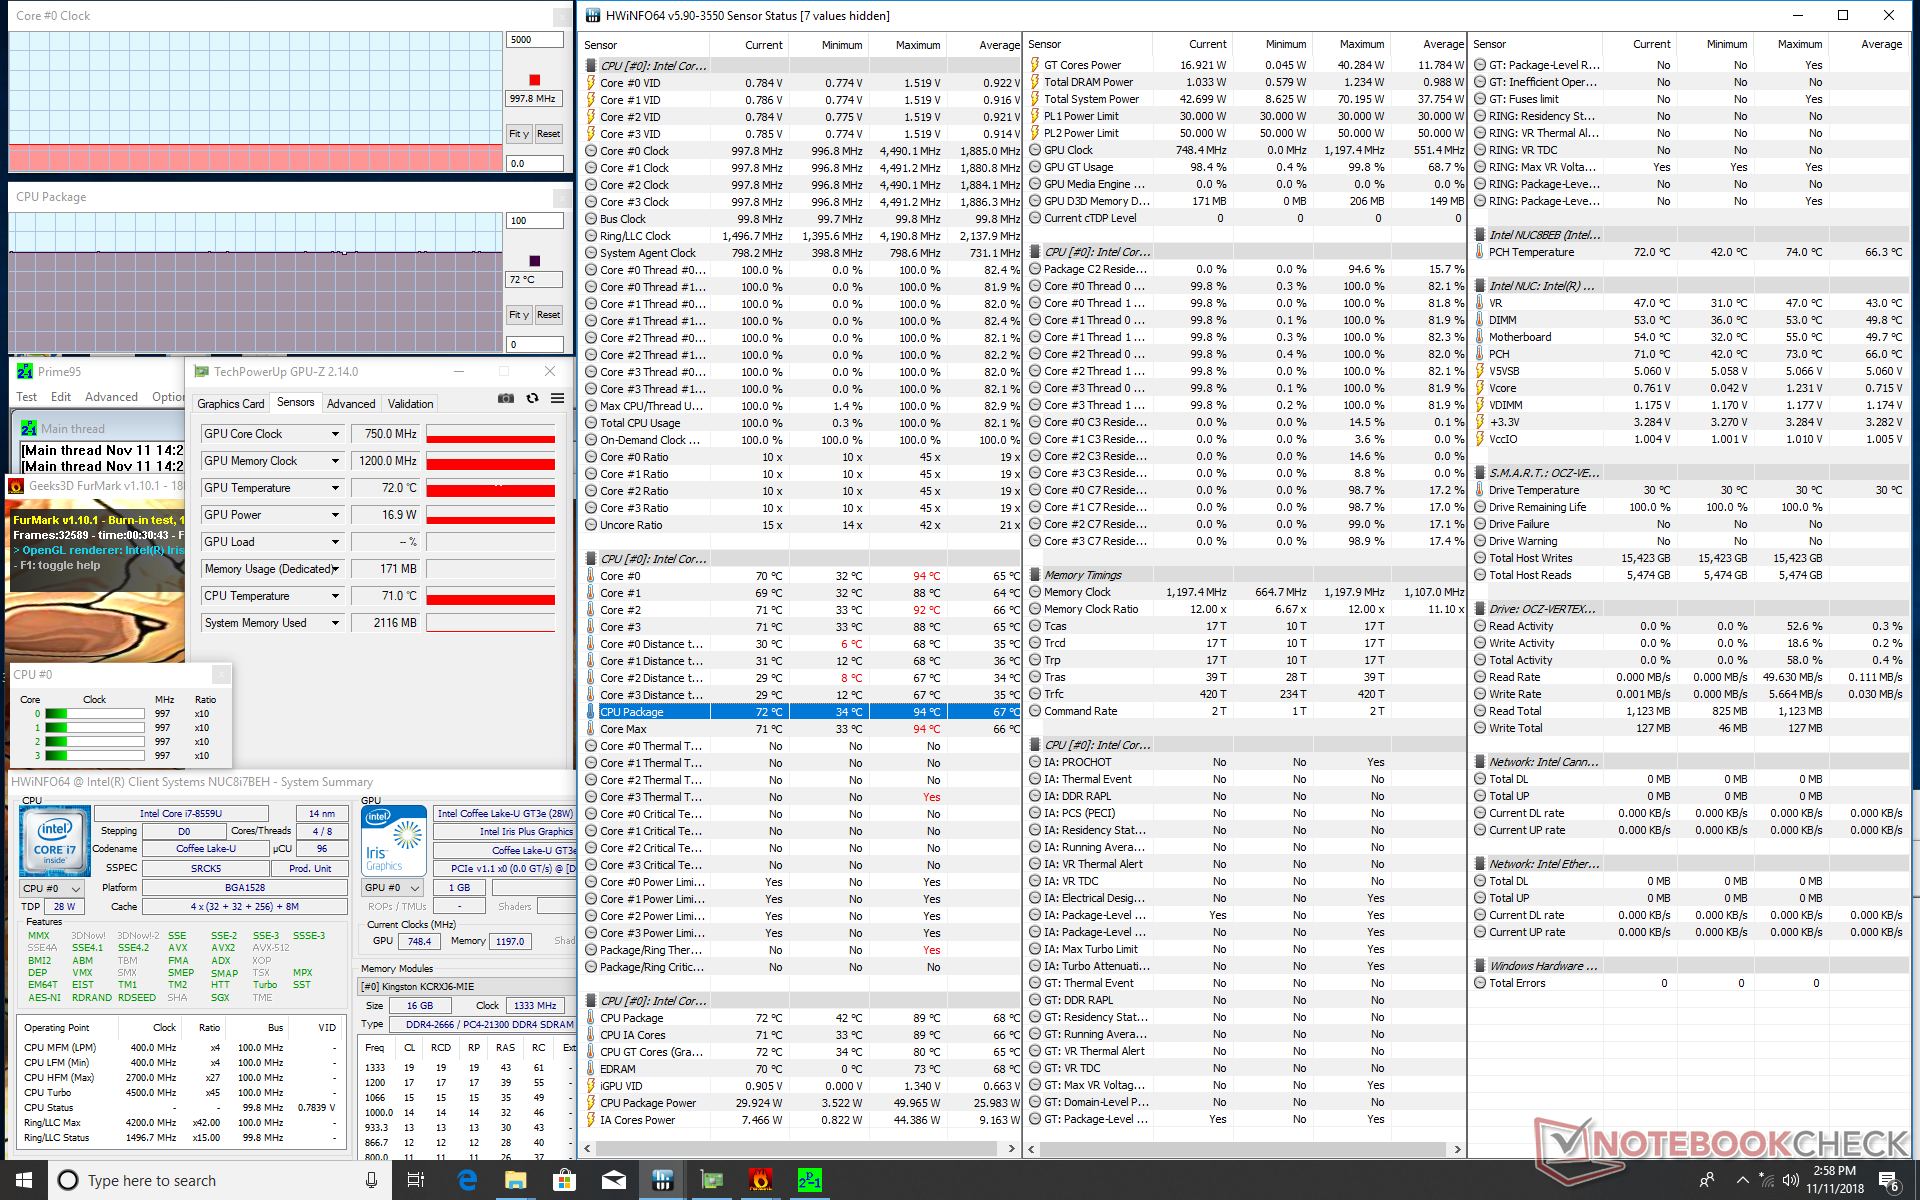
We run synthetic loads to stress the system and identify for any potential throttling or stability issues. When subjected to Prime95 load, the CPU can be observed running as fast as 4.0 GHz before hitting a temperature ceiling of 88 C. Thereafter, clock rate immediately drops to a steady 2.9 GHz to maintain a cooler core temperature of 74 C as shown by our screenshot below. When considering that the base clock rate of the i7-8559U is 2.7 GHz, this means that the NUC is only able to sustain a Turbo Boost clock of just +200 MHz with only a temporary boost to 4.0 GHz for just the first initial few seconds. The results line up with our CineBench loop test above where performance is fastest during the start of the test before immediately dropping. Running both Prime95 and FurMark simultaneously will throttle both the CPU and GPU.
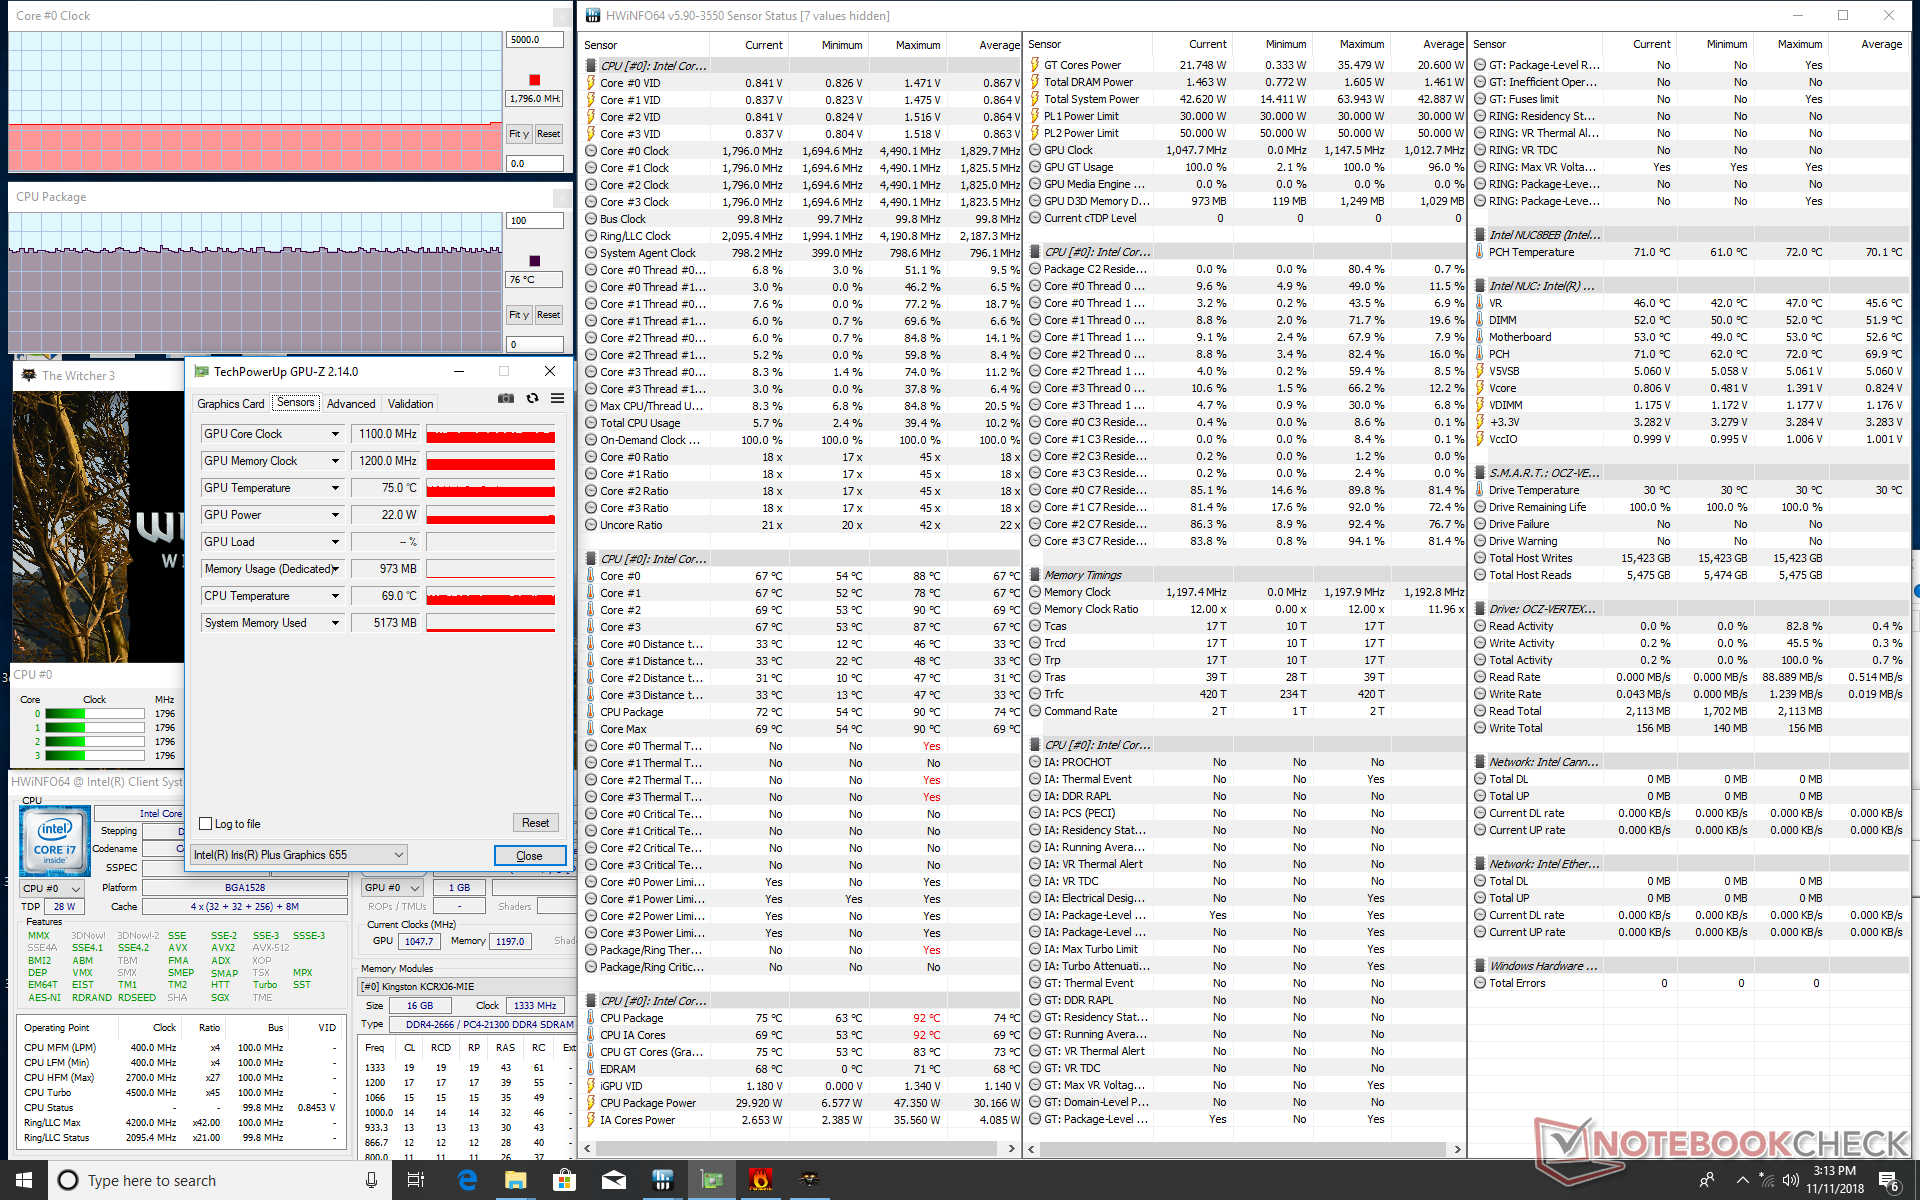
Running Witcher 3 is more representative of real-world gaming loads. Core temperature remains steady at 76 C, but a maximum of 90 C can be recorded during the first minute of our test to suggest that throttling is involved to maintain a core temperature in the 70 C range.
| CPU Clock (GHz) | GPU Clock (MHz) | Average CPU Temperature (°C) | |
| System Idle | -- | -- | 34 |
| Prime95 Stress | 2.9 | -- | 74 |
| Prime95 + FurMark Stress | 1.0 | 750 | 72 |
| Witcher 3 Stress | 1.8 | 1100 | 76 |
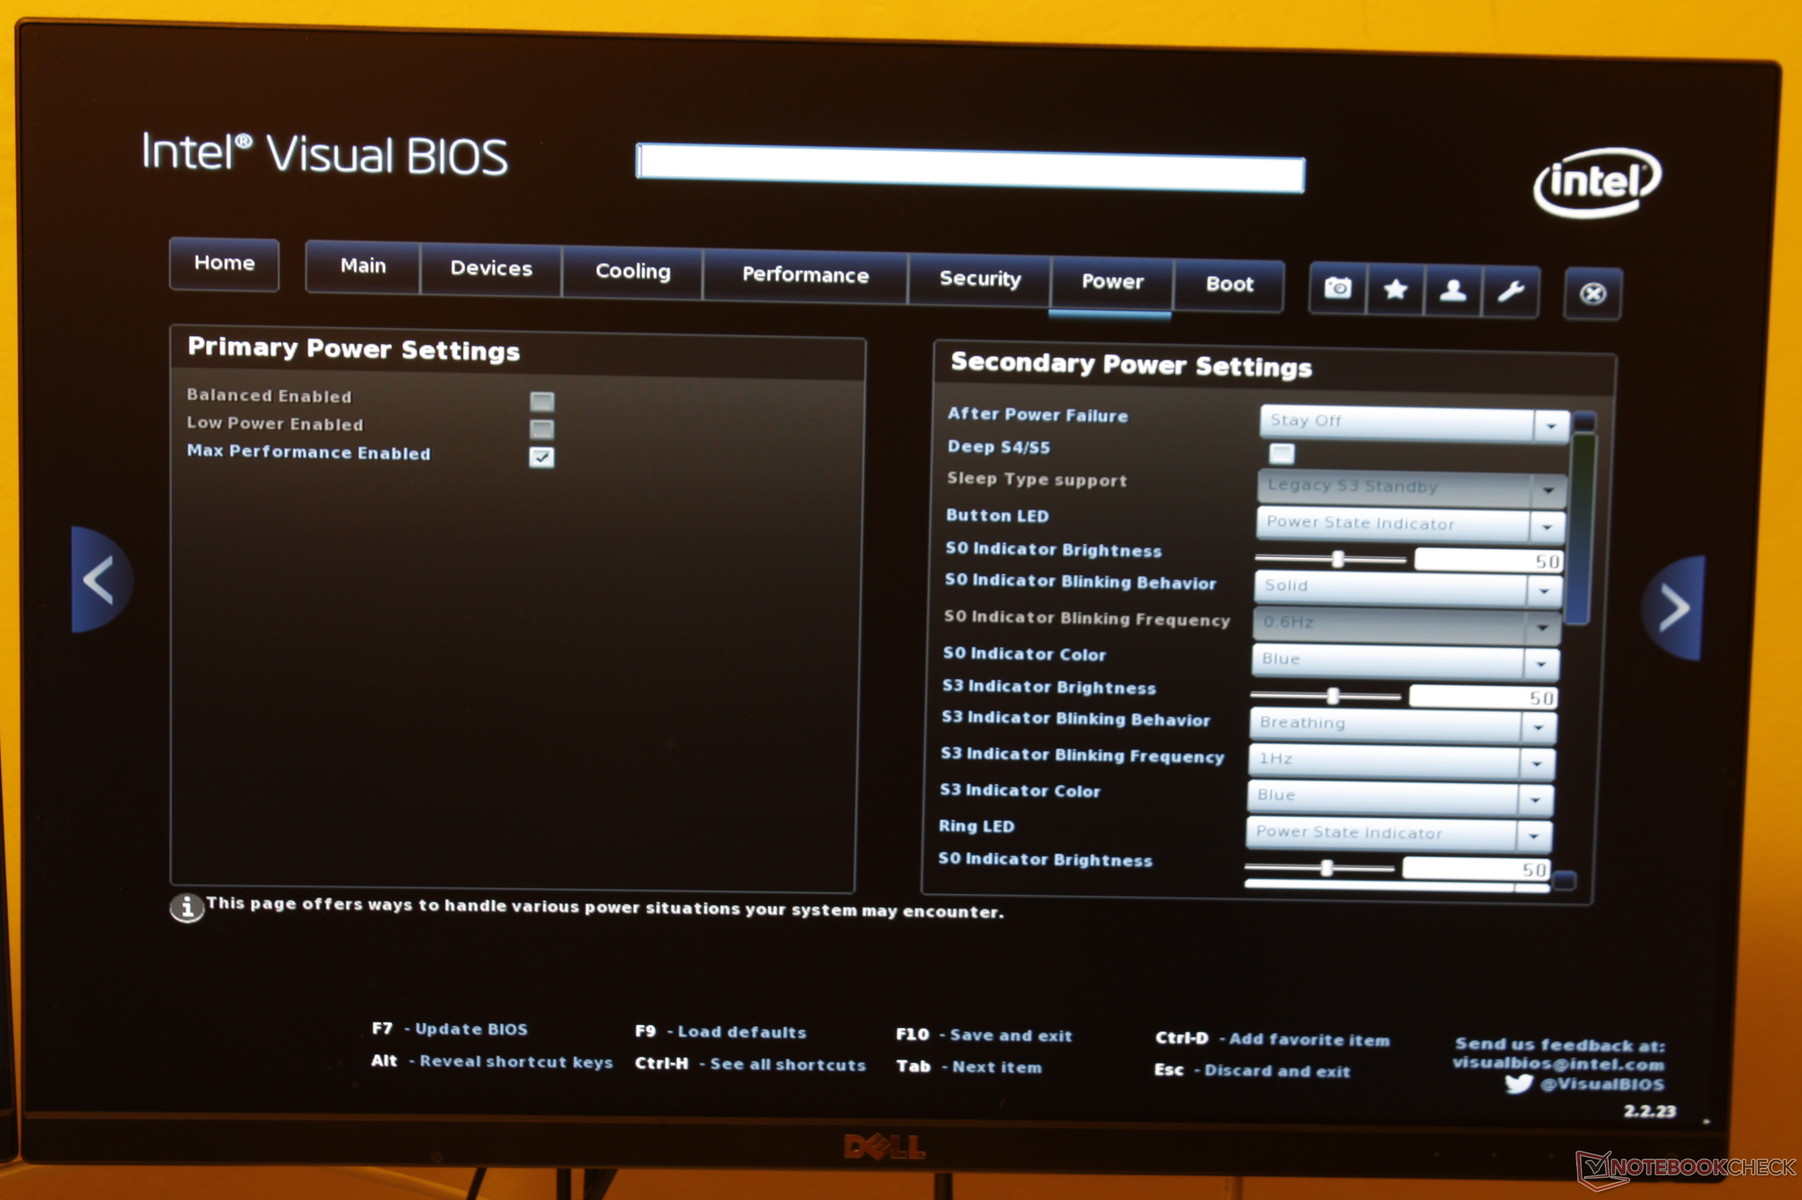
Energy Management
Power Consumption
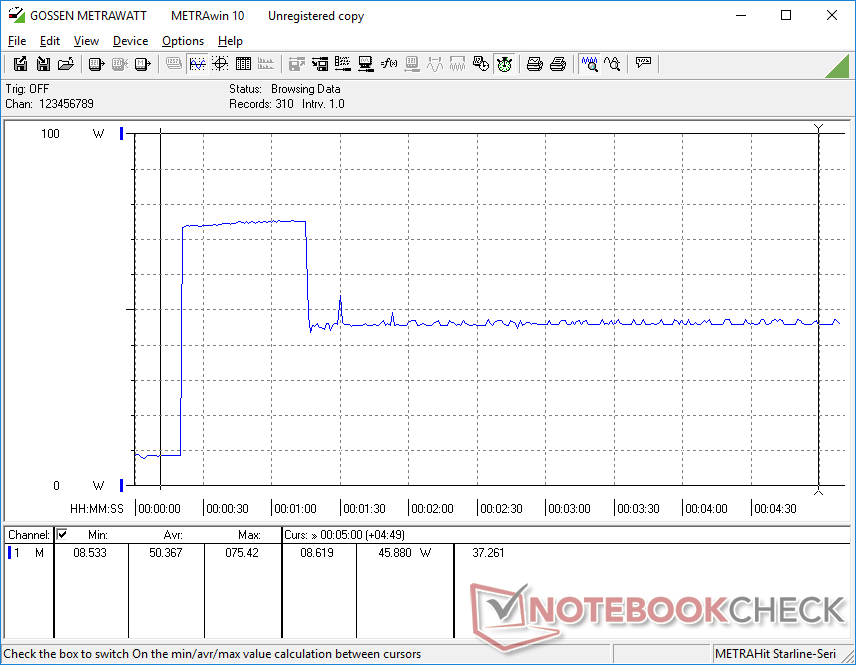
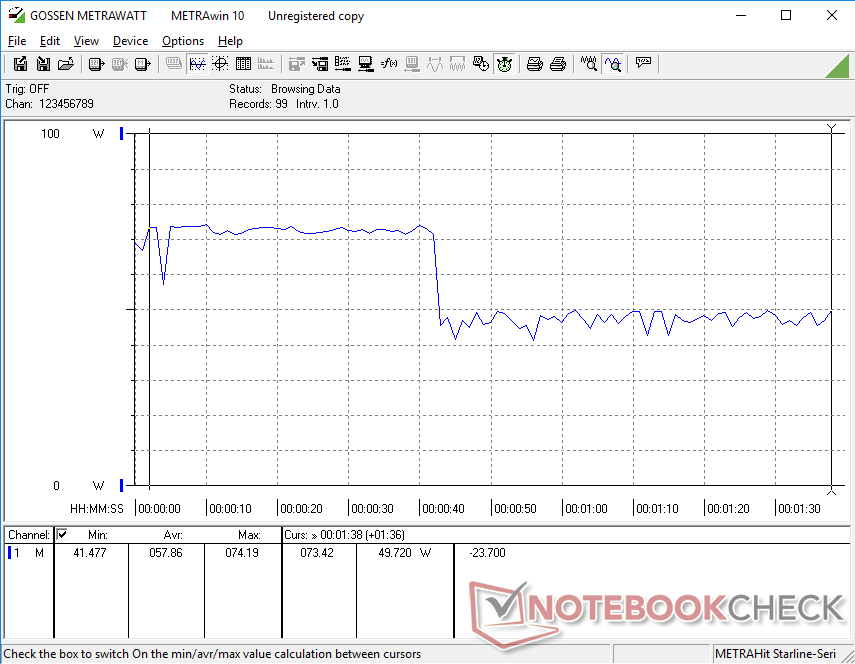
Power consumption when idling on desktop ranges from 3 W to 7 W or almost half of a laptop since there is no display. When under higher loads, consumption will jump to 47 W or higher.
The highest consumption we can record is 78 W from the small (~12.3 x 4.5 x 3.0 cm) 90 W AC adapter when running both Prime95 and FurMark simultaneously. Because of throttling, however, the system is unable to maintain a consumption of 78 W and it eventually stabilizes at just under 50 W to mirror our observations when running the CineBench R15 Multi-Thread loop test. Our NUC is not even able to run the first benchmark scene of 3DMark 06 at a steady clock rate to show poor Turbo Boost sustainability when gaming.
| Off / Standby | |
| Idle | |
| Load |
|
Key:
min: | |
| Intel NUC8i7BE i7-8559U, Iris Plus Graphics 655, , , x, | Intel Hades Canyon NUC8i7HVK i7-8809G, Vega M GH, Intel Optane 120 GB SSDPEK1W120GA, , x, | Intel NUC6i5SYH 6260U, Iris Graphics 540, Samsung SSD XP941 MZHPU256HCGL, , x, 0" | Zotac ZBOX-CI660 Nano i5-8550U, UHD Graphics 620, OCZ Vertex OCZSSD2-1VTX120G, , x, | Lenovo Yoga C930-13IKB i5-8250U, UHD Graphics 620, SK hynix PC401 HFS256GD9TNG, IPS, 1920x1080, 13.9" | Lenovo Ideapad 720S-13ARR R7 2700U, Vega 10, Samsung PM961 MZVLW256HEHP, IPS, 1920x1080, 13.3" | |
|---|---|---|---|---|---|---|
| Power Consumption | -230% | -64% | -106% | -27% | -59% | |
| Idle Minimum * (Watt) | 2.7 | 15.5 -474% | 8.7 -222% | 9.7 -259% | 3.3 -22% | 5.4 -100% |
| Idle Average * (Watt) | 3.1 | 16.2 -423% | 8.7 -181% | 9.8 -216% | 6.8 -119% | 9.8 -216% |
| Idle Maximum * (Watt) | 6.3 | 16.5 -162% | 8.7 -38% | 11.8 -87% | 9.5 -51% | 11.3 -79% |
| Load Average * (Watt) | 59.7 | 83.4 -40% | 18.2 70% | 51.6 14% | 40.8 32% | 29.3 51% |
| Witcher 3 ultra * (Watt) | 47.2 | 121.7 -158% | ||||
| Load Maximum * (Watt) | 78 | 173.5 -122% | 36.6 53% | 63.2 19% | 57 27% | 38.5 51% |
* ... smaller is better
Verdict
Pros
Cons
Users can expect a general performance level very close to that of the last generation Skull Canyon NUC while running quieter, cooler, and for a cheaper starting price. The addition of Thunderbolt 3 means users can pair the system with an external graphics dock for gaming or other demanding tasks to further expand the versatility of the system.
The NUC8 series will be notable for its Coffee Lake-U CPU options and results are more mixed in this regard. The Iris Plus Graphics 655 is 5 to 30 percent faster than an AMD Vega 10 provided that you equip the NUC with dual-channel RAM, but CPU performance is not all that much better than the less expensive i7-8550U. Its higher TDP is mostly for powering the Iris GPU and so the CPU benefits little from the higher TDP ceiling save for the initial short-lived burst of Turbo Boost speeds.
For 4K streaming and HTPC purposes, a cheaper ZBox or NUC7 mini PC with the i5-8250U or i7-8550U would be sufficient. The NUC8 is best for those who will exploit the Thunderbolt 3 port and push the Iris Plus graphics to its full potential.
Price comparison
