Dell Latitude 5591 (8850H, MX130, Touchscreen) Laptop Review
The Latitude 5591 is the Coffee Lake-H version of Dell’s business-oriented mid-range 15.6-inch Latitude 5590 series. The review notebook features a hexa-core i7-8850H CPU, 16 GB of RAM, a 512 GB SSD and Nvidia GeForce MX130 graphics. Just a few months ago we reviewed the Dell Latitude 5590 with i5-8250U, 8 GB of RAM, 256 GB SSD and integrated graphics. At least on paper, the 5591 with 45 W processor and dedicated GPU promises significant performance gains.
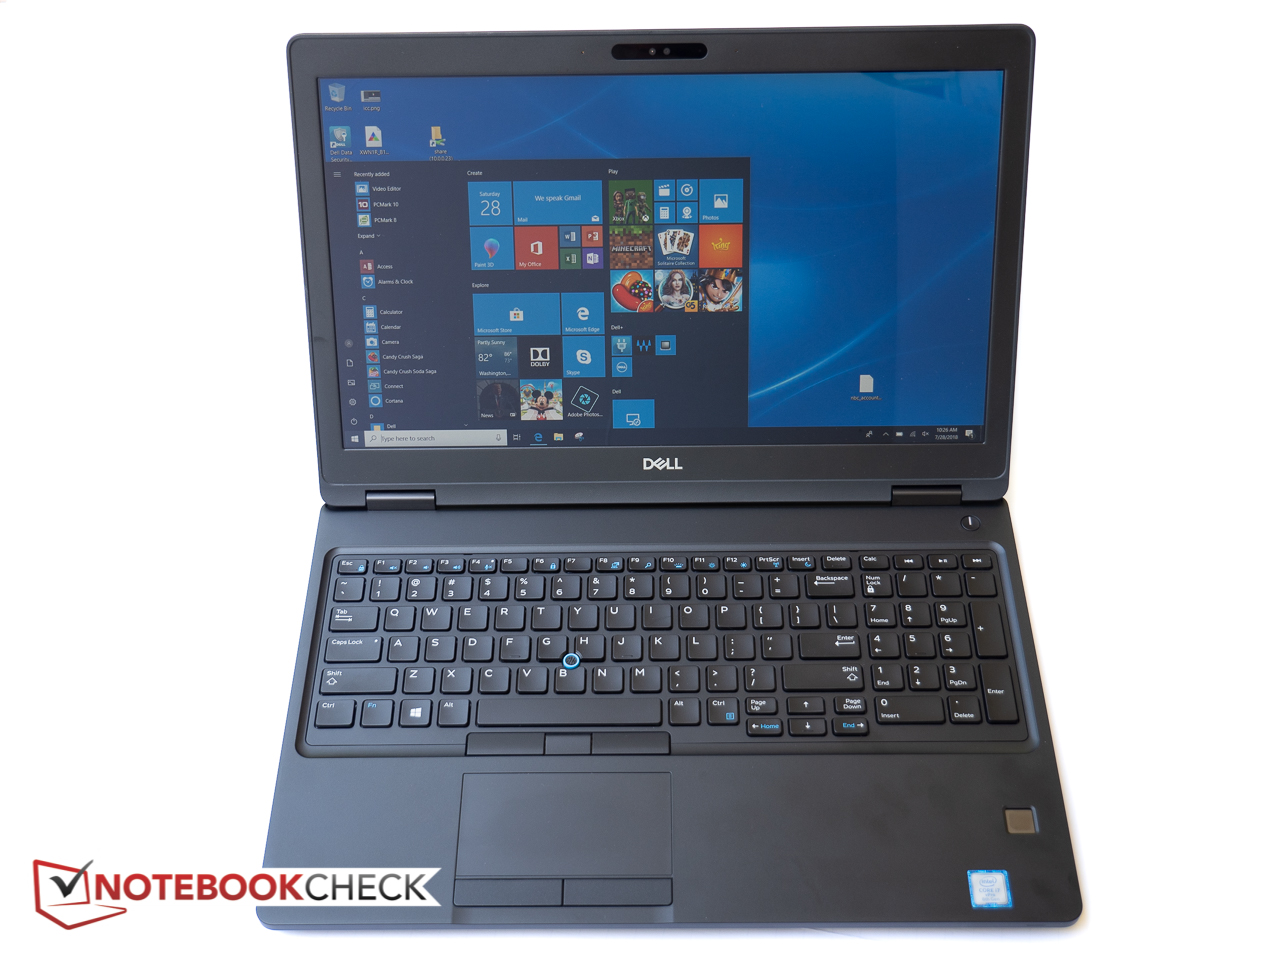
As far as the features, construction and build quality are concerned, the Latitude 5591 is virtually indistinguishable from the Latitude 5590, so we will skip certain review sections and will focus primarily on the differences between the two machines. In addition to the main competitors like the Lenovo ThinkPad T580 or the HP EliteBook 850 G5, we will also reference the smaller 14-inch Latitude 5491 with identical hardware.
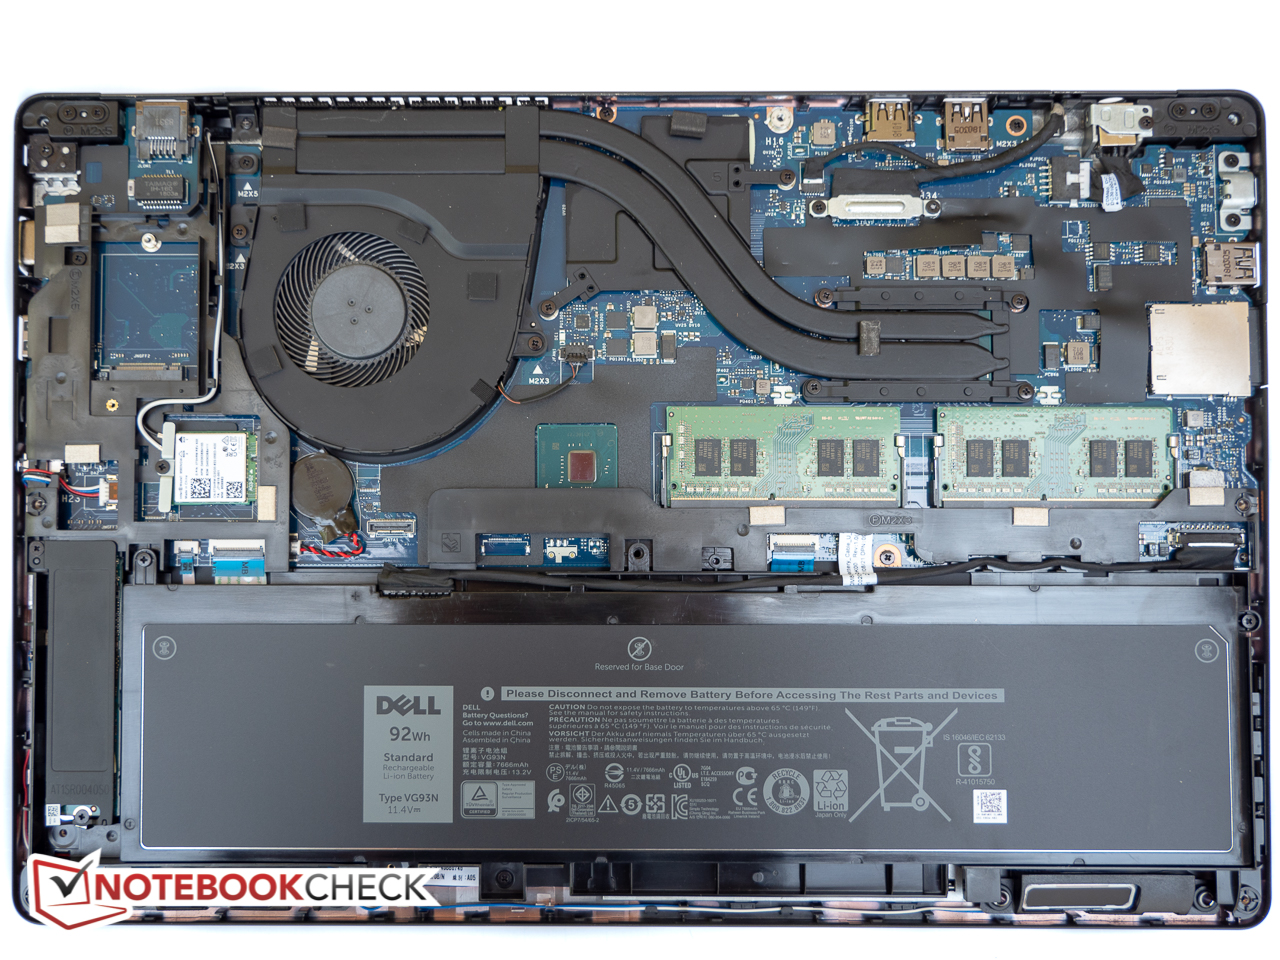
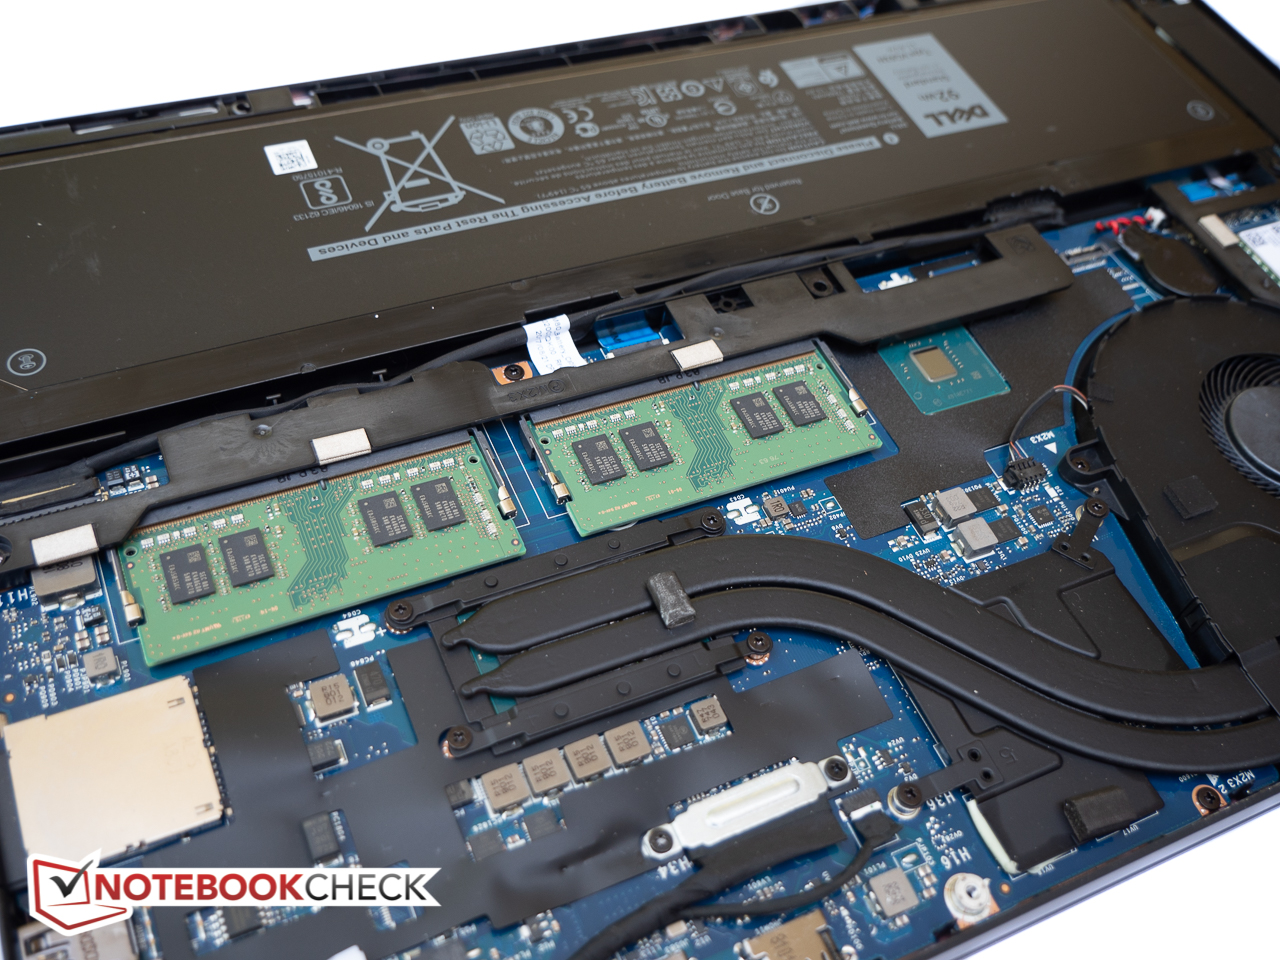
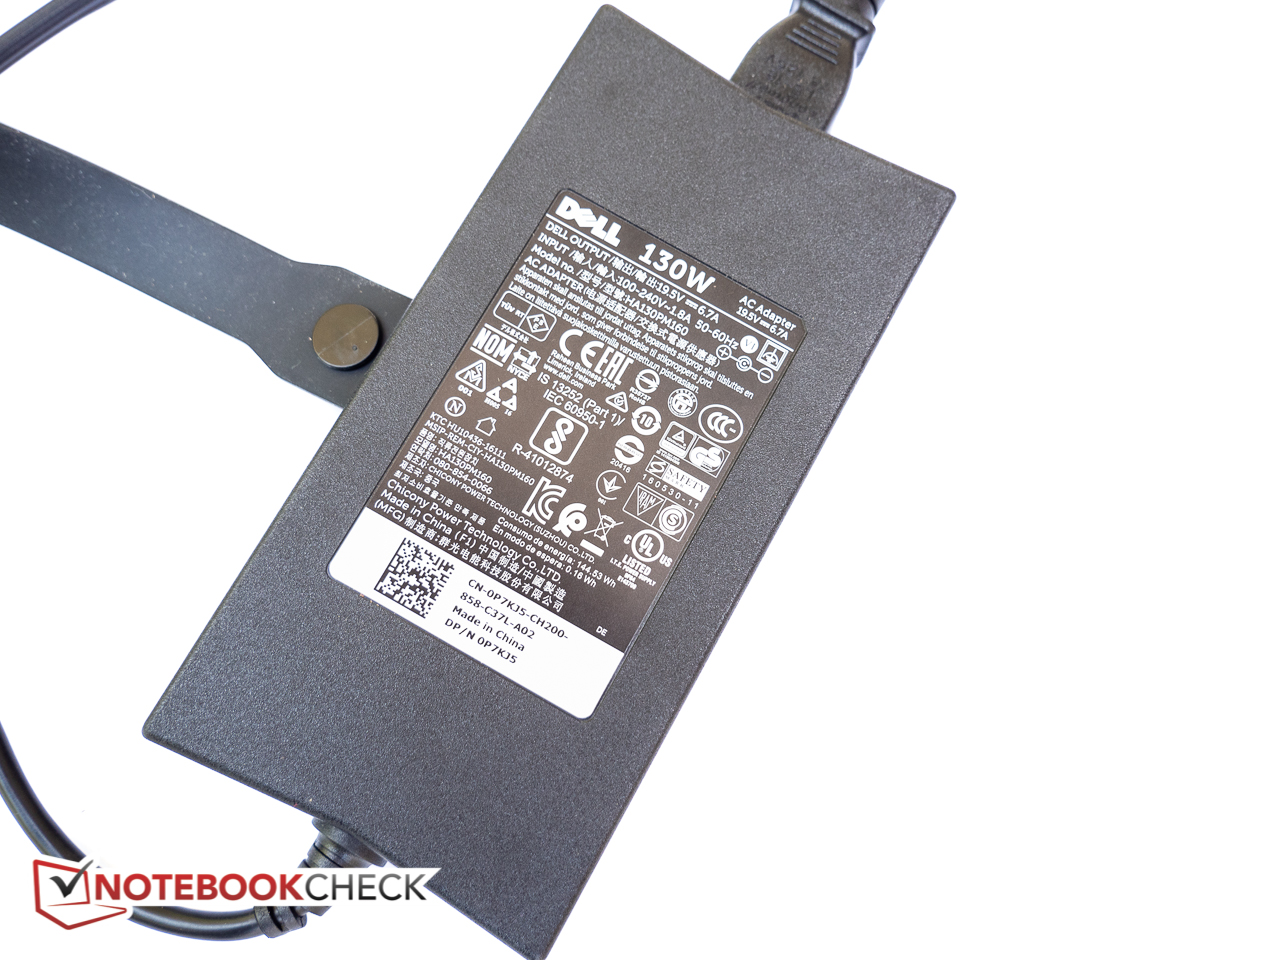
The touchscreen-equipped notebooks in the 5590/5591 series are 1 mm thicker than their non-touch counterparts, but in all other aspects, they are completely identical. Our particular test notebook features a much larger battery (92 vs 51 Wh) than our last review notebook, which makes sense given the potent hardware. It's unsurprising that the 5591 now weighs more as well: while our previous Latitude 5590 weighed in at 2 kg (~4.45 lbs) even, the new model is about 340 g (~12 oz) heavier. A 130 W power adapter replaces the 65 W unit and adds another 250 g (~9 oz) to the all-up carry weight.
Lenovo's competing ThinkPad T580 is not as wide, a little thinner and weighs slightly less than the Latitude. The prosumer Dell XPS 15 with i5 Coffee Lake-H CPU and GeForce GTX 1050 weighs under 2 kg and is in a league of its own as far as the footprint and thickness are concerned.
Connectivity
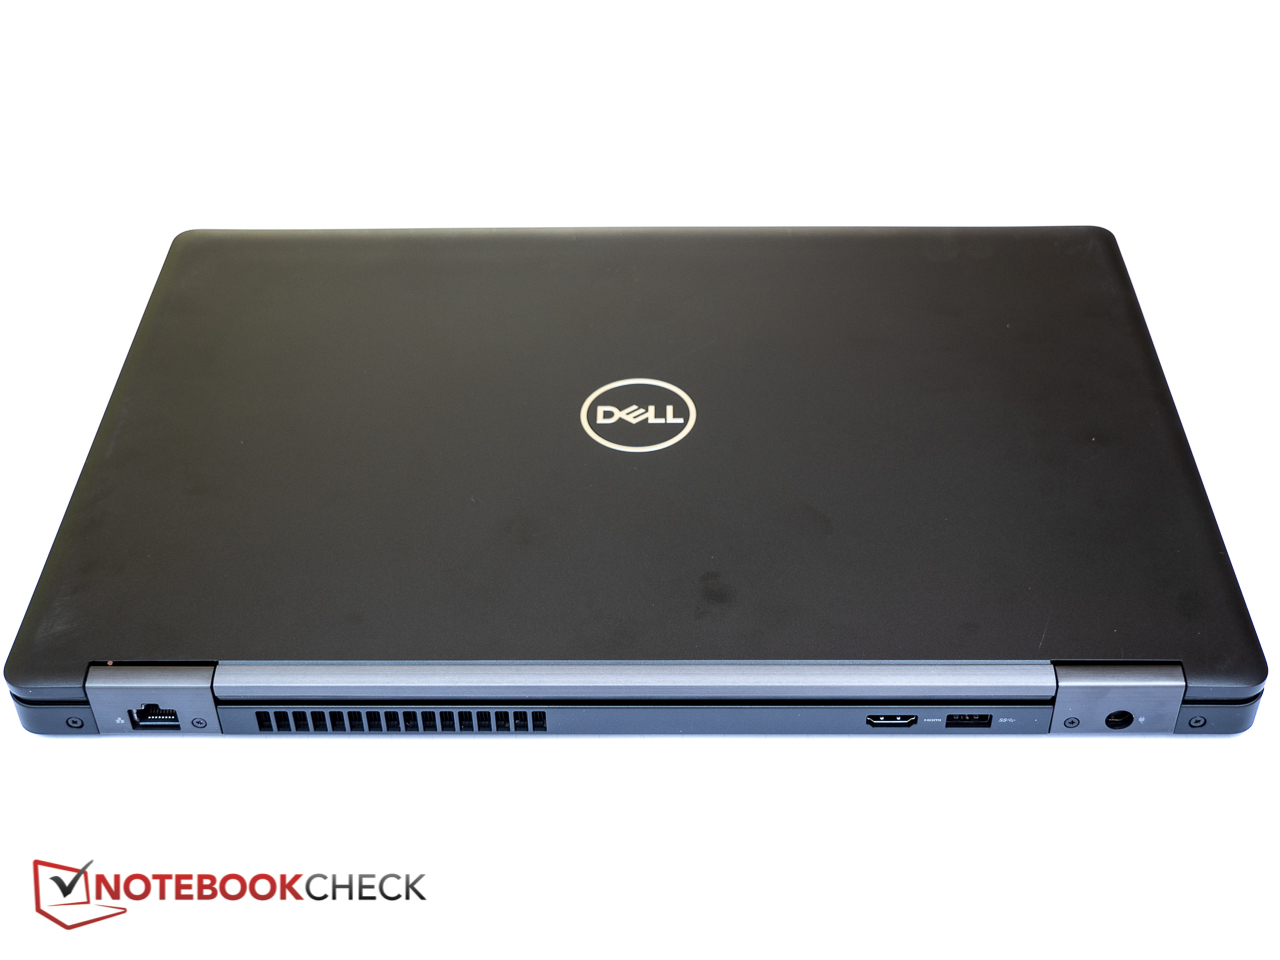
The main difference between our current review notebook and the previous test model as far as the physical ports are concerned is the addition of Thunderbolt 3 port in place of the USB Type-C port with DisplayPort support. All remaining physical ports are identical between the two versions.
SD Card Reader
SD card reader performance as measured with our Toshiba Exceria Pro SDXC 64 GB UHS-II reference card is outstanding with sequential transfer rates of 209 MB/s and thus on par with the Latitude 5590. Copying 1 GB worth of jpeg files from the SD card to the desktop takes exactly six seconds.
| SD Card Reader | |
| average JPG Copy Test (av. of 3 runs) | |
| Dell Latitude 5590 (Toshiba Exceria Pro SDXC 64 GB UHS-II) | |
| Dell Latitude 5591 (Toshiba Exceria Pro SDXC 64 GB UHS-II) | |
| Dell XPS 15 2018 i5 FHD 97Wh | |
| Lenovo ThinkPad T580-20LAS01H00 (Toshiba Exceria Pro SDXC 64 GB UHS-II) | |
| Acer TravelMate 2410-G2-MG-82E6 (Toshiba Exceria Pro SDXC 64 GB UHS-II) | |
| maximum AS SSD Seq Read Test (1GB) | |
| Dell Latitude 5591 (Toshiba Exceria Pro SDXC 64 GB UHS-II) | |
| Dell Latitude 5590 (Toshiba Exceria Pro SDXC 64 GB UHS-II) | |
| Dell XPS 15 2018 i5 FHD 97Wh | |
| Lenovo ThinkPad T580-20LAS01H00 (Toshiba Exceria Pro SDXC 64 GB UHS-II) | |
| Acer TravelMate 2410-G2-MG-82E6 (Toshiba Exceria Pro SDXC 64 GB UHS-II) | |
Communication
Like the smaller 14-inch sibling Latitude 5491, the 5591 features an updated Intel Dual Band Wireless AC 9560 a/b/g/n/ac 2x2 module with the longer-range Bluetooth 5.0 on board. We measured transmit and receive rates of 681 and 680 MBit/s at a distance of one meter from our Linksys EA8500 test router - are very good result. The 5591 outperforms the 5590 with Intel Dual Band Wireless-AC 8265 by a significant margin. We didn't encounter any connective issues or dropouts during the test period.
Warranty
Our review unit comes with a 3 Year Hardware Warranty with Onsite/In-Home Service after Remote Diagnosis. Dell offers many additional extensions and optional coverage: an upgrade to 5 Years of ProSupport with Next Business Day Onsite Service, to name an example, cost $160. Accidental Damage Service can be purchased for the same period for $125 more. Please see our Guarantees, Return policies and Warranties FAQ for country-specific information.
Display
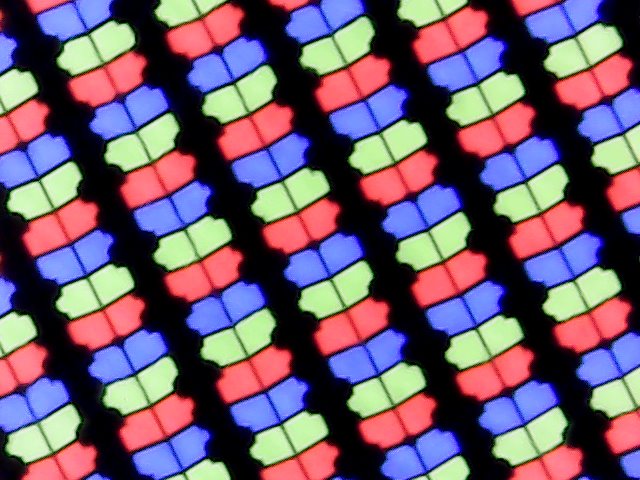
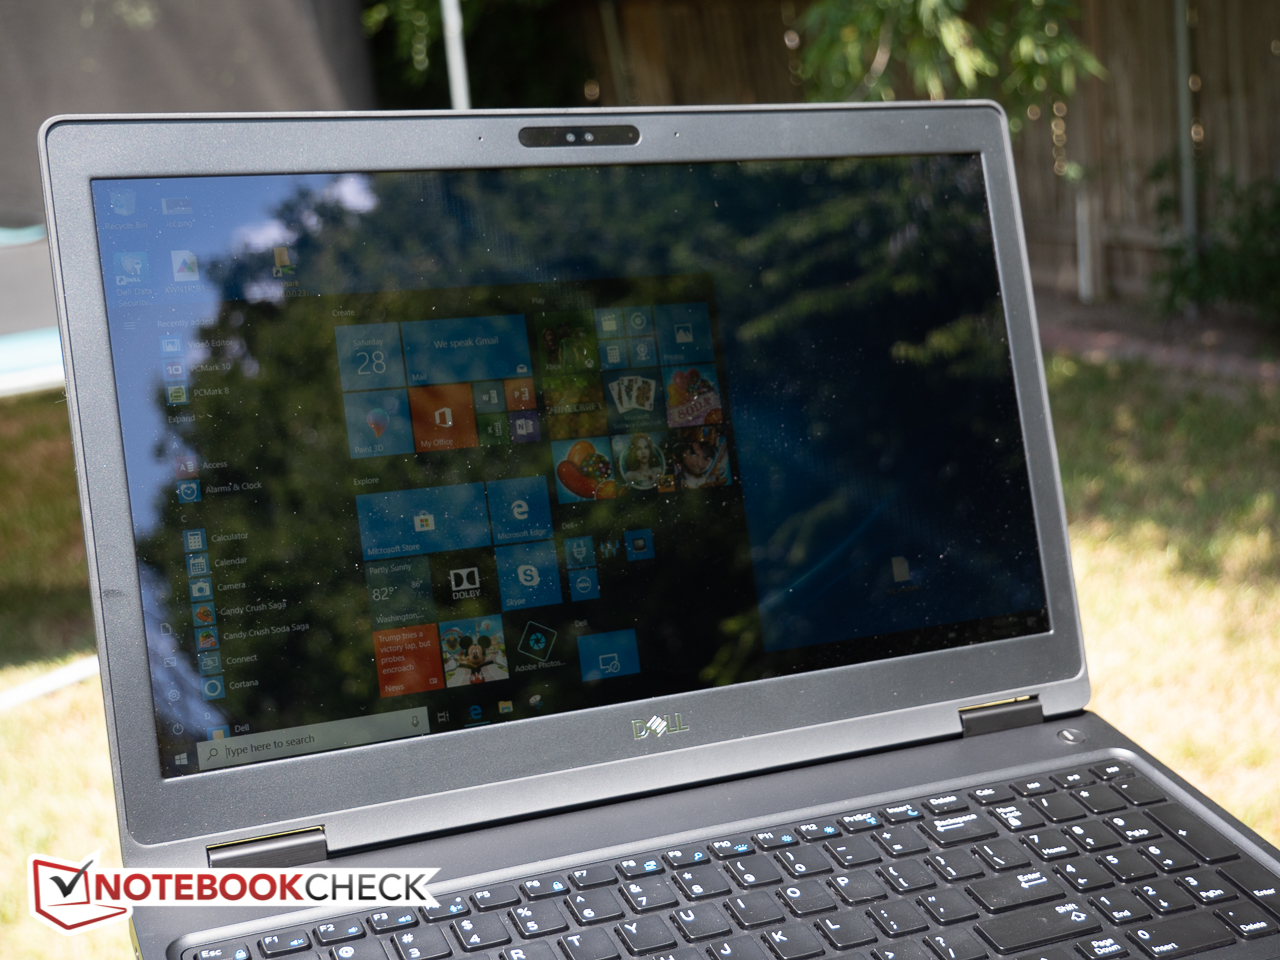
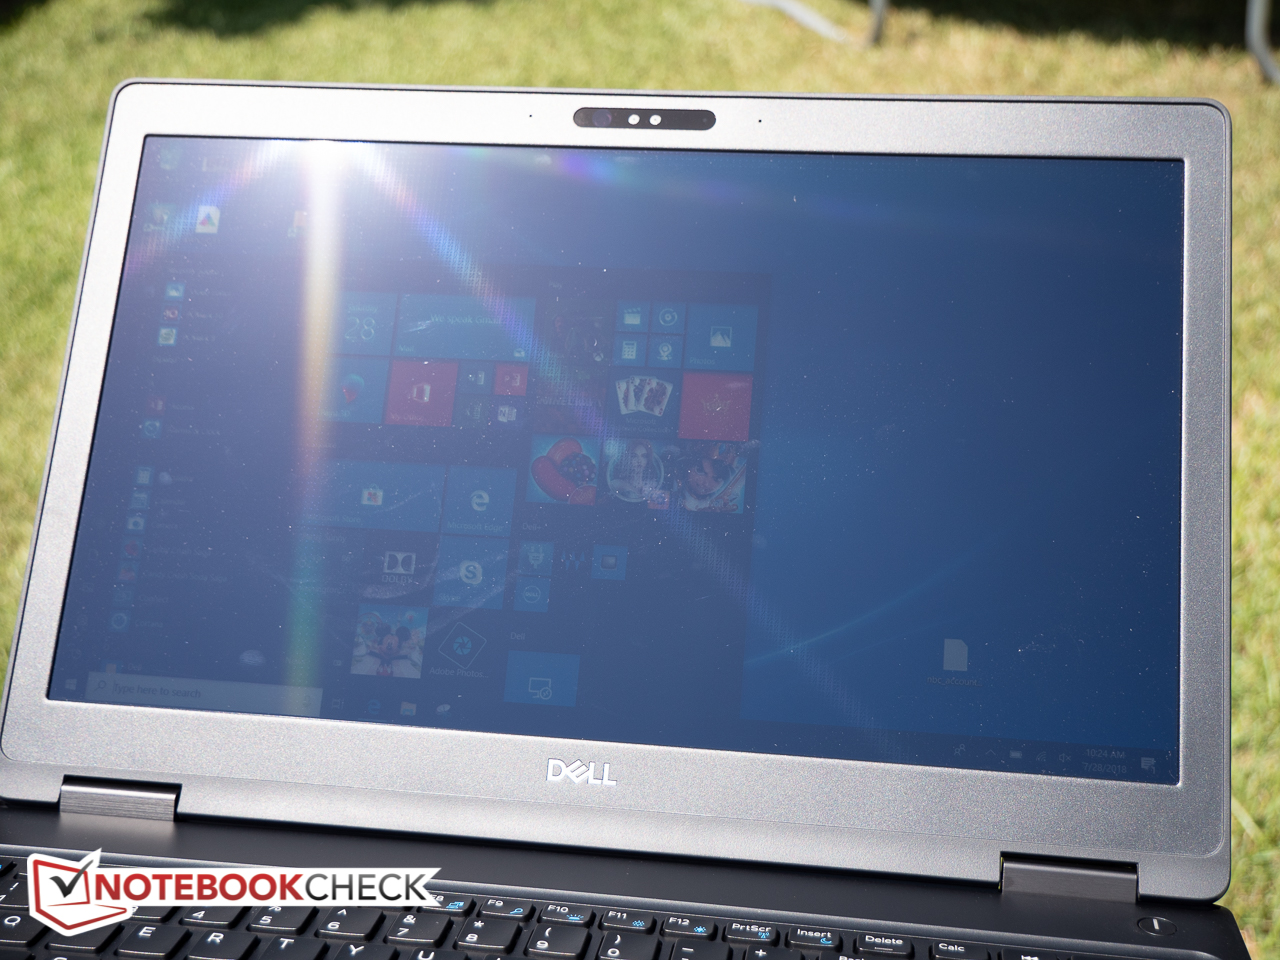
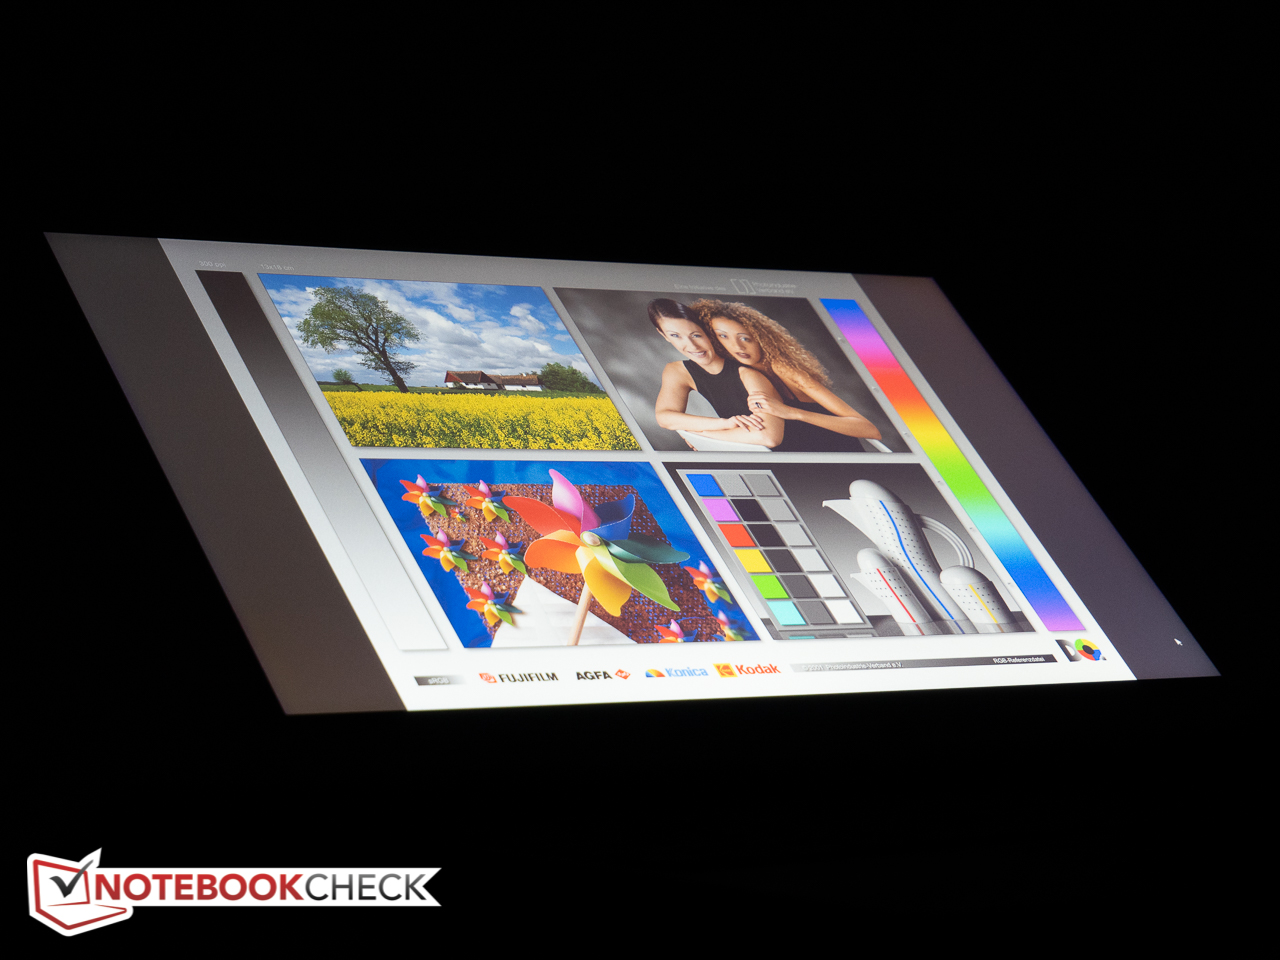
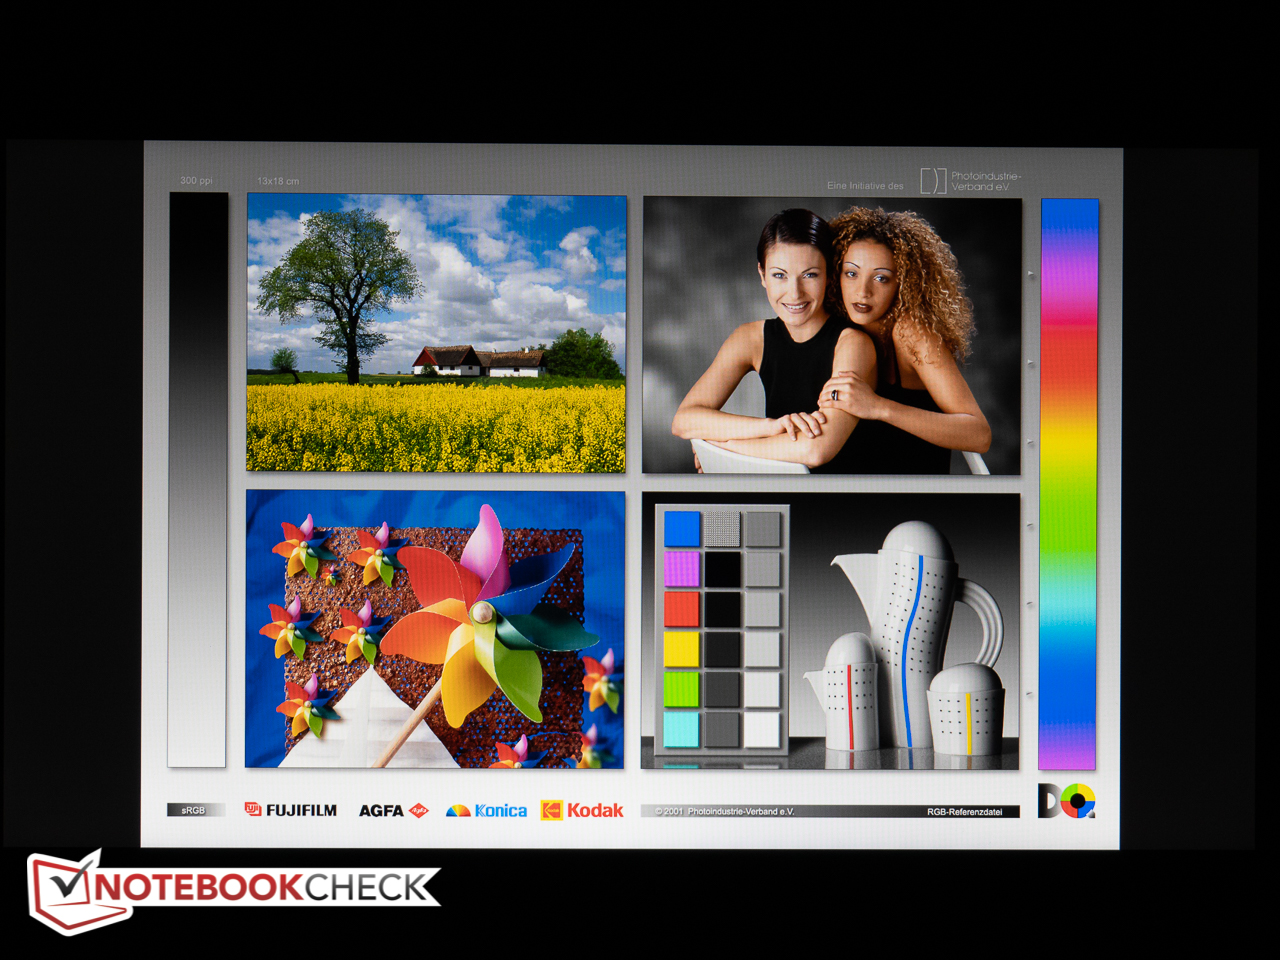
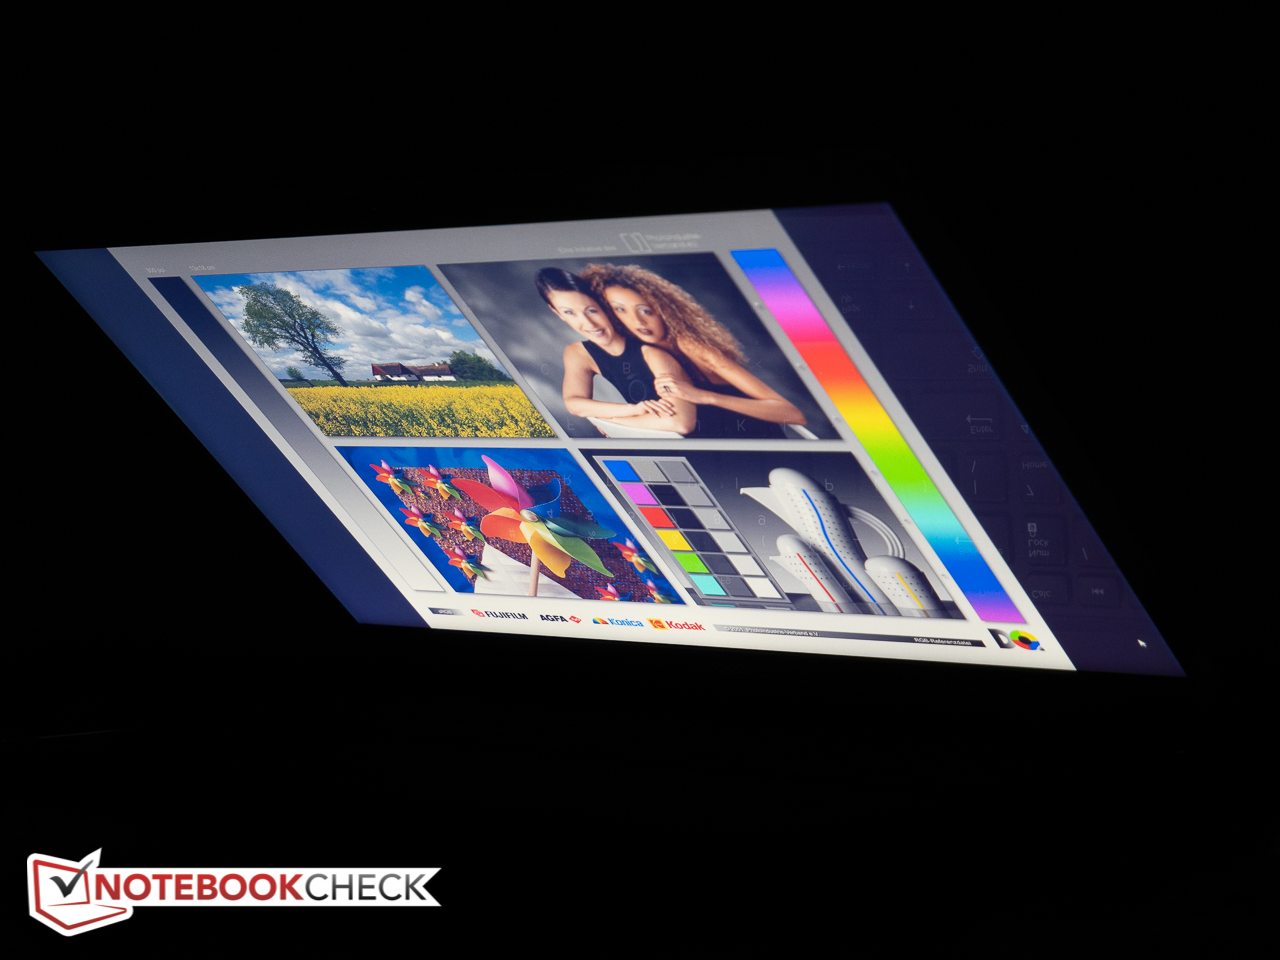
The IPS touchscreen panel (type B156HW03) is supplied by AU Optronics and features an FHD resolution of 1920 x 1080 pixels, which equates to a pixel density of 141 PPI. Subjectively, text and icons are crisp with none of the graininess we often encounter on matte panels. At just over 230 nits, the average brightness unfortunately is quite low, a situation worsened by the fact that we are dealing with a glare-type display here which is plagued by very noticeable reflections. HP's upscale and matte EliteBook 755 G5 reaches a brightness of 410 nits. Alternatively, Dell also offers a non-touch anti-glare FHD display for the 5591 - likely the same the Latitude 5590 is equipped with - and even an anti-glare HD panel with a behind-the-times resolution of only 1366 x 768 pixels.
The contrast ratio of about 950:1 is decent enough and comparable to most competitors. The brightness distribution is also acceptable at 88 percent, but the panel suffers from noticeable backlight bleeding particularly in the righthand corners, which can be distracting when watching movies. PWM isn't used, so users sensitive to flickering won't experience issues when adjusting the display brightness.

| |||||||||||||||||||||||||
Brightness Distribution: 88 %
Center on Battery: 245.4 cd/m²
Contrast: 944:1 (Black: 0.26 cd/m²)
ΔE ColorChecker Calman: 5.36 | ∀{0.5-29.43 Ø4.71}
calibrated: 4.06
ΔE Greyscale Calman: 3.5 | ∀{0.09-98 Ø4.96}
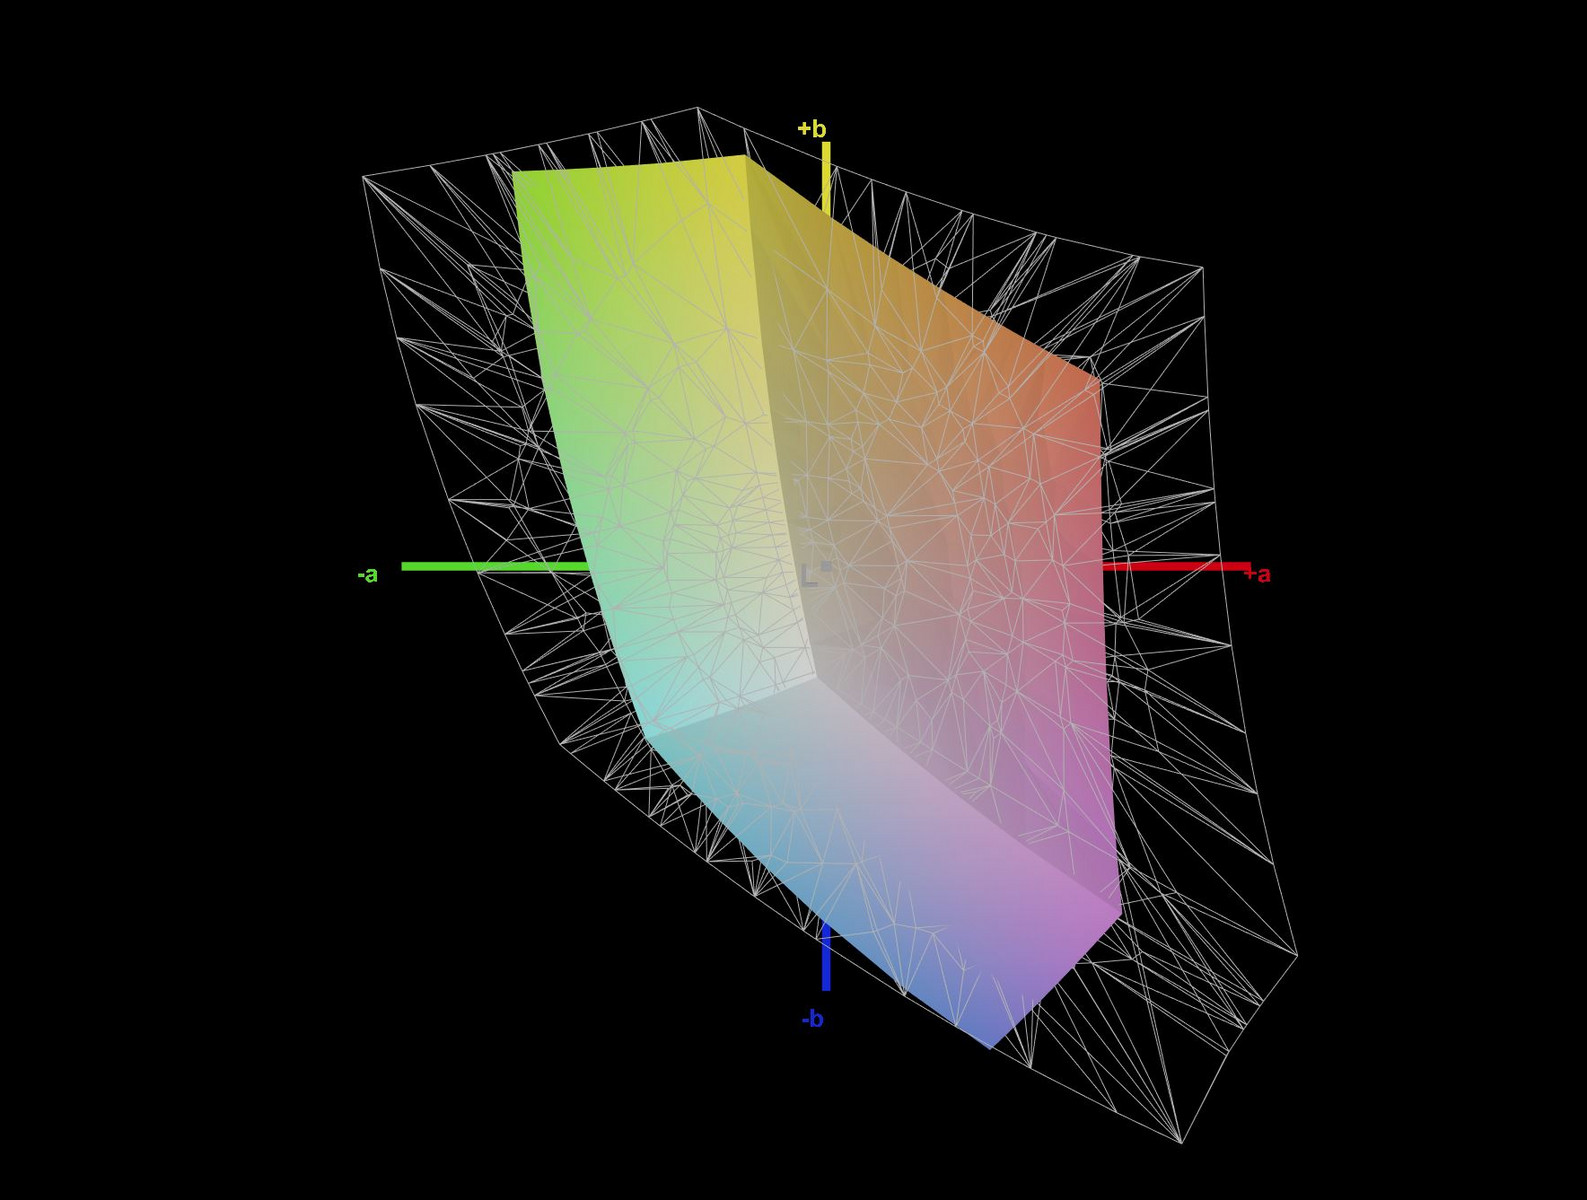
58.1% sRGB (Argyll 1.6.3 3D)
40% AdobeRGB 1998 (Argyll 1.6.3 3D)
40.03% AdobeRGB 1998 (Argyll 3D)
58.1% sRGB (Argyll 3D)
38.74% Display P3 (Argyll 3D)
Gamma: 2.53
CCT: 6430 K
| Dell Latitude 5591 AU Optronics B156HW03, IPS, 15.6", 1920x1080 | HP EliteBook 850 G5 3JX58EA AUO24ED, IPS LED, 15.6", 1920x1080 | Lenovo ThinkPad T580-20LAS01H00 NV156QUM-N44, IPS LED, 15.6", 3840x2160 | Acer TravelMate 2410-G2-MG-82E6 CMN N140HCA-EAB, IPS, 14", 1920x1080 | Dell Latitude 5590 NV15N42, IPS, 15.6", 1920x1080 | HP EliteBook 755 G5 3UN79EA BOE074E, IPS, 15.6", 1920x1080 | |
|---|---|---|---|---|---|---|
| Display | 59% | 67% | 4% | 7% | 64% | |
| Display P3 Coverage (%) | 38.74 | 63.4 64% | 69.2 79% | 40.28 4% | 41.56 7% | 66.9 73% |
| sRGB Coverage (%) | 58.1 | 88.8 53% | 90.7 56% | 60.4 4% | 61.3 6% | 90.2 55% |
| AdobeRGB 1998 Coverage (%) | 40.03 | 64.4 61% | 66.3 66% | 41.65 4% | 42.93 7% | 66.1 65% |
| Response Times | 6% | -14% | 17% | -35% | -5% | |
| Response Time Grey 50% / Grey 80% * (ms) | 45.2 ? | 42 ? 7% | 51.2 ? -13% | 34 ? 25% | 53.2 ? -18% | 39 ? 14% |
| Response Time Black / White * (ms) | 26 ? | 25 ? 4% | 29.6 ? -14% | 24 ? 8% | 39.6 ? -52% | 32 ? -23% |
| PWM Frequency (Hz) | 952 ? | 25000 ? | 1000 ? | 21000 ? | ||
| Screen | 17% | 34% | 7% | -5% | -6% | |
| Brightness middle (cd/m²) | 245.4 | 402 64% | 310 26% | 265 8% | 243 -1% | 456 86% |
| Brightness (cd/m²) | 234 | 383 64% | 283 21% | 239 2% | 234 0% | 410 75% |
| Brightness Distribution (%) | 88 | 88 0% | 87 -1% | 85 -3% | 83 -6% | 84 -5% |
| Black Level * (cd/m²) | 0.26 | 0.41 -58% | 0.24 8% | 0.37 -42% | 0.19 27% | 0.62 -138% |
| Contrast (:1) | 944 | 980 4% | 1292 37% | 716 -24% | 1279 35% | 735 -22% |
| Colorchecker dE 2000 * | 5.36 | 5.25 2% | 3.1 42% | 3.93 27% | 6.6 -23% | 7.09 -32% |
| Colorchecker dE 2000 max. * | 19.31 | 8.65 55% | 7.6 61% | 8.79 54% | 22.3 -15% | 12.64 35% |
| Colorchecker dE 2000 calibrated * | 4.06 | 5.19 -28% | 2.2 46% | 3.13 23% | 5 -23% | |
| Greyscale dE 2000 * | 3.5 | 4 -14% | 2.3 34% | 2.29 35% | 5.2 -49% | 9.15 -161% |
| Gamma | 2.53 87% | 2.68 82% | 2.21 100% | 2.33 94% | 2.24 98% | 2.31 95% |
| CCT | 6430 101% | 6756 96% | 6876 95% | 6951 94% | 6990 93% | 7195 90% |
| Color Space (Percent of AdobeRGB 1998) (%) | 40 | 58 45% | 59.1 48% | 38 -5% | 39.2 -2% | 59 48% |
| Color Space (Percent of sRGB) (%) | 58.1 | 89 53% | 90.1 55% | 60 3% | 60.8 5% | 90 55% |
| Total Average (Program / Settings) | 27% /
24% | 29% /
34% | 9% /
8% | -11% /
-6% | 18% /
8% |
* ... smaller is better
Color space covers less than 60 percent of sRGB and only about 40 percent of AdobeRGB, so the panel performs marginally better here than the AU Optronics unit Dell uses for the smaller 14-inch Latitude 5491 and about the same as the panel in the Latitude 5590. None of the laptops in our comparison are great for photo editing, which is to be expected, since business notebooks are not marketed for professional graphics artists. The Lenovo ThinkPad T580 and the HP 755 G5/850 G5 EliteBook twins reach at least 90 percent of the sRGB gamut, however, and would be a much better choice.
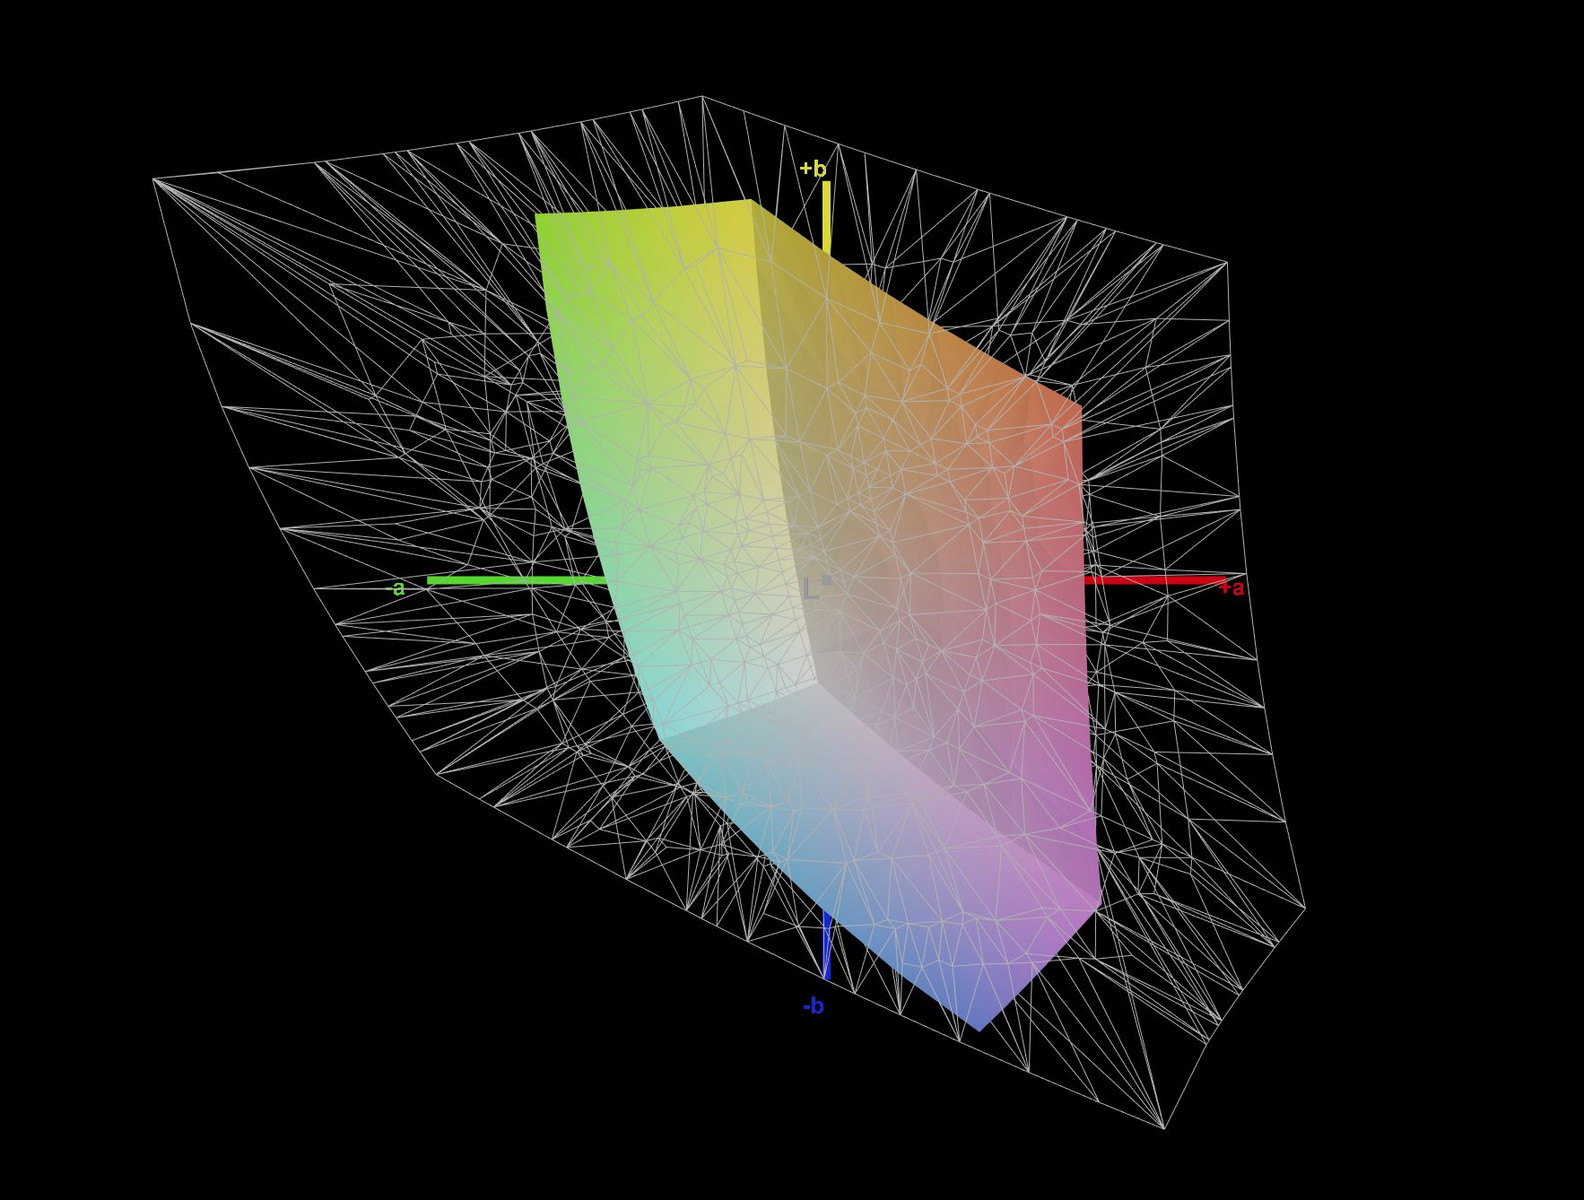
Additional measurements with a X-Rite spectrophotometer reveal acceptable grayscale, but poor colors out of the box. Our calibration efforts only marginally improved the colors and the maximum DeltaE deviation for blue remains around 20. For graphic artists we would recommend the Dell XPS 15 2018, as its FHD panel covers almost 100 percent of the sRGB color space and features much higher color and grayscale accuracy.
Display Response Times
| ↔ Response Time Black to White | ||
|---|---|---|
| 26 ms ... rise ↗ and fall ↘ combined | ↗ 15.2 ms rise | 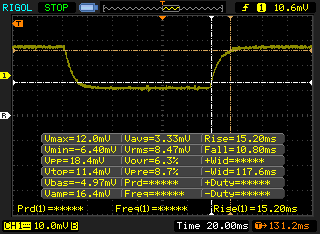 |
| ↘ 10.8 ms fall | ||
| The screen shows relatively slow response rates in our tests and may be too slow for gamers. In comparison, all tested devices range from 0.1 (minimum) to 240 (maximum) ms. » 63 % of all devices are better. This means that the measured response time is worse than the average of all tested devices (19.8 ms). | ||
| ↔ Response Time 50% Grey to 80% Grey | ||
| 45.2 ms ... rise ↗ and fall ↘ combined | ↗ 26.8 ms rise | 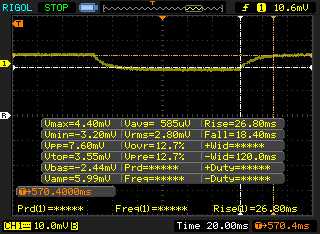 |
| ↘ 18.4 ms fall | ||
| The screen shows slow response rates in our tests and will be unsatisfactory for gamers. In comparison, all tested devices range from 0.165 (minimum) to 636 (maximum) ms. » 78 % of all devices are better. This means that the measured response time is worse than the average of all tested devices (30.9 ms). | ||
Screen Flickering / PWM (Pulse-Width Modulation)
| Screen flickering / PWM not detected | 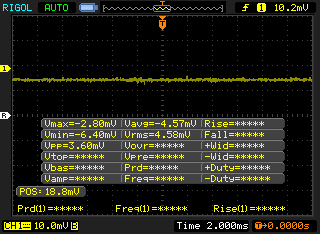 | ||
In comparison: 52 % of all tested devices do not use PWM to dim the display. If PWM was detected, an average of 7741 (minimum: 5 - maximum: 343500) Hz was measured. | |||
Outdoor visibility is just acceptable when under shade provided that the brightness is set to maximum and the display is adjusted properly. Direct sunlight will simply overpower the backlight and wash out the content. Still, the 5591 has an easier time with difficult lighting conditions than the smaller 14-inch Latitude 5491 with its is even dimmer panel. Since the display is based on IPS technology, the viewing angles are fairly wide without inversions or significant darkening, although we did notice some color shifts.
Performance
The Latitude 5591 can be purchased with the quad-core i5-8300H and i5-8400H or the hexa-core i7-8850H processor, 8 - 16 GB of RAM and either 2.5-inch SATA HDDs or PCIe NVMe SSDs up to 512 GB. Note that the large 92 Wh battery leaves no room for the 2.5-inch slot, so M.2 SSDs are the only option. The least expensive notebook in the lineup sells for $1070 and comes with the HD display, the i5-8300H processor, just 4 GB of RAM and a 500 GB SATA hard drive. As configured with FHD touch display, i7-8850H CPU, 16 GB of RAM, a 512 GB SSD and a Nvidia GeForce MX130 GPU, the notebook sells for $2400.
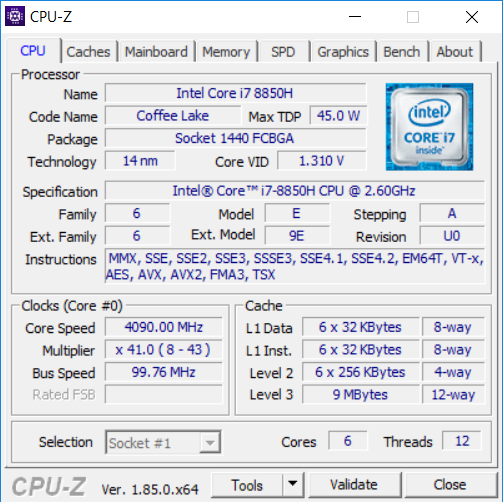
Processor
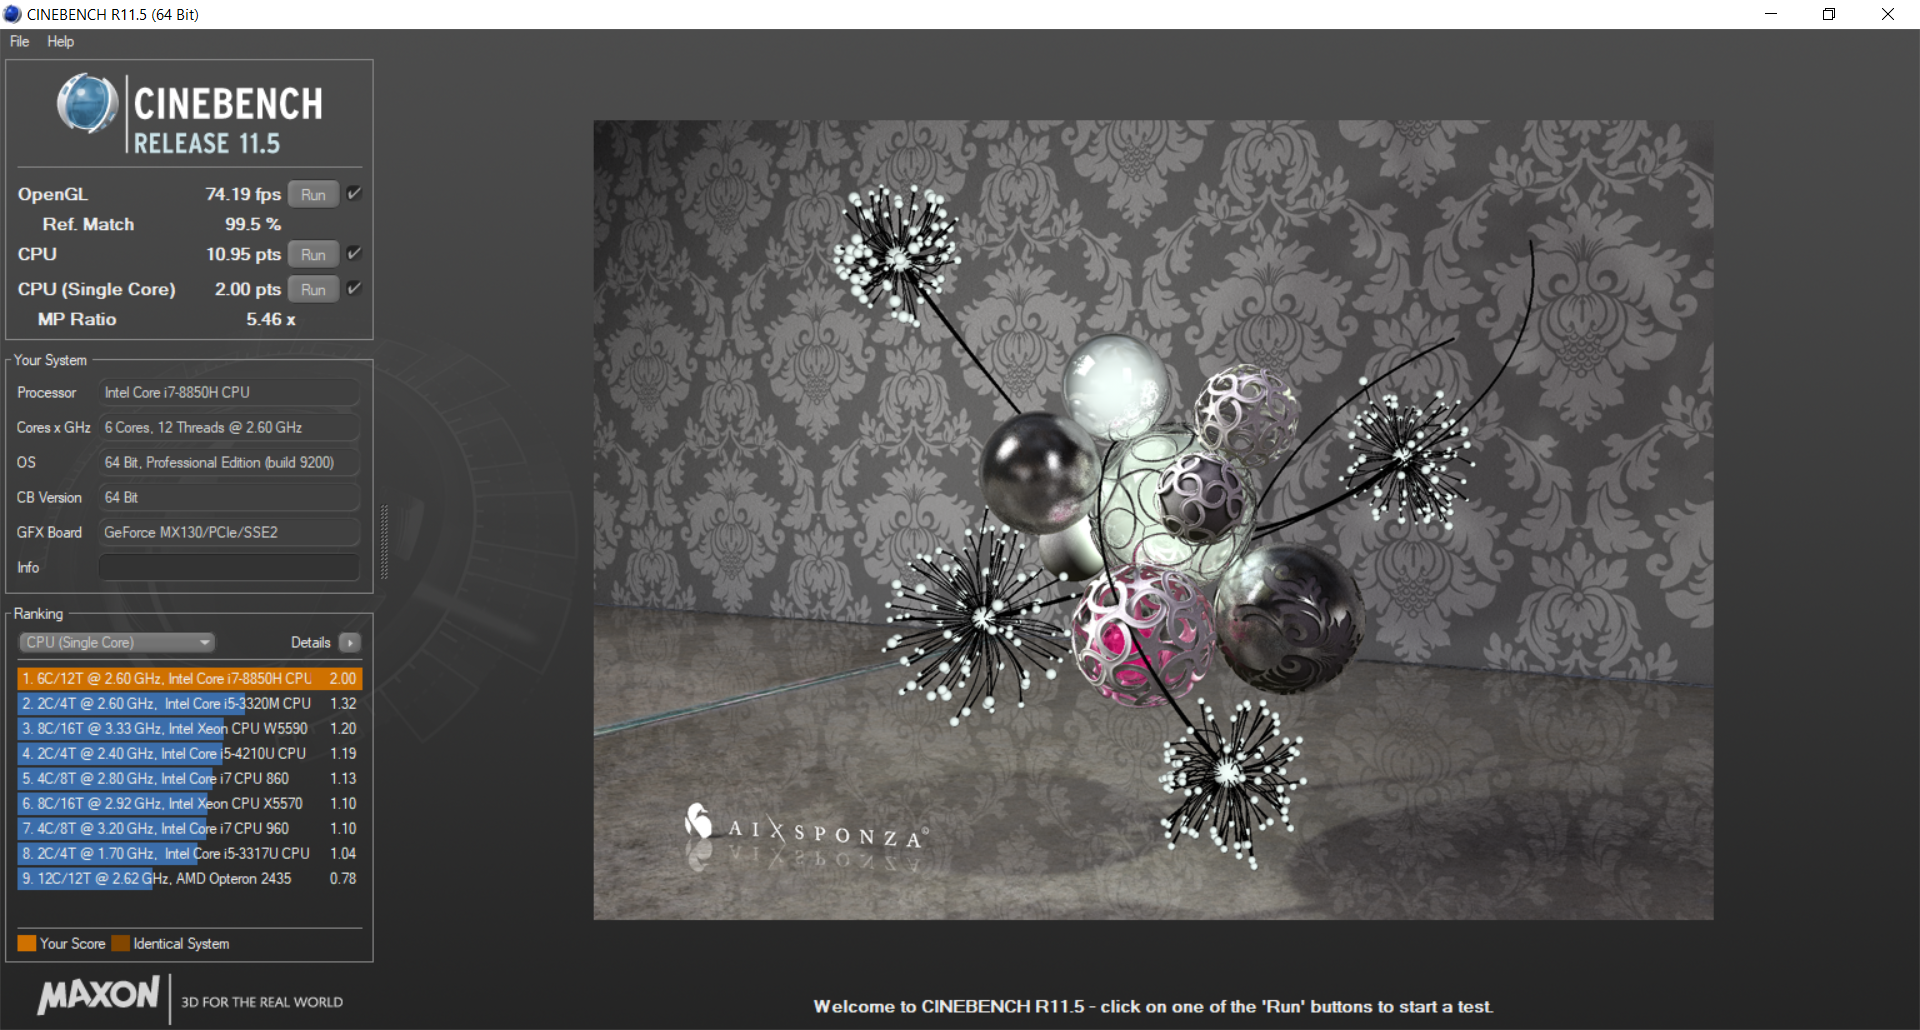
The hexa-core Coffee Lake-H i7-8850H processor runs at 2.2 - 4.1 GHz and has a TDP of 45 W. While the single-core performance hasn't improved compared to the previous generation, the theoretical multi-core performance is up by about 50 percent thanks to the two additional cores. Likely due to heat-related throttling, the performance of the i7-8850H in our 5591 does trail the average of the 5 i7-8850H CPUs in our database by about 10 percentage points. That said, ULV processors like the 15 W Kaby Lake Refresh Core i7-8550U in the Lenovo ThinkPad T580 are still up to 35 % slower.
Turbo Boost sustainability is far from great and running CineBench R15 Multi-Thread in a loop results in a substantial reduction of the performance, which stabilizes at an average of just under 900 points after the initial high score of 1090 points - a reduction of about 18 percent. The score of the smaller Latitude 5491 with the same hardware dropped by an even more substantial 22 percent, however.
See see our dedicated page on the Intel Core i7-8850H for more technical information and benchmark comparisons.

System Performance
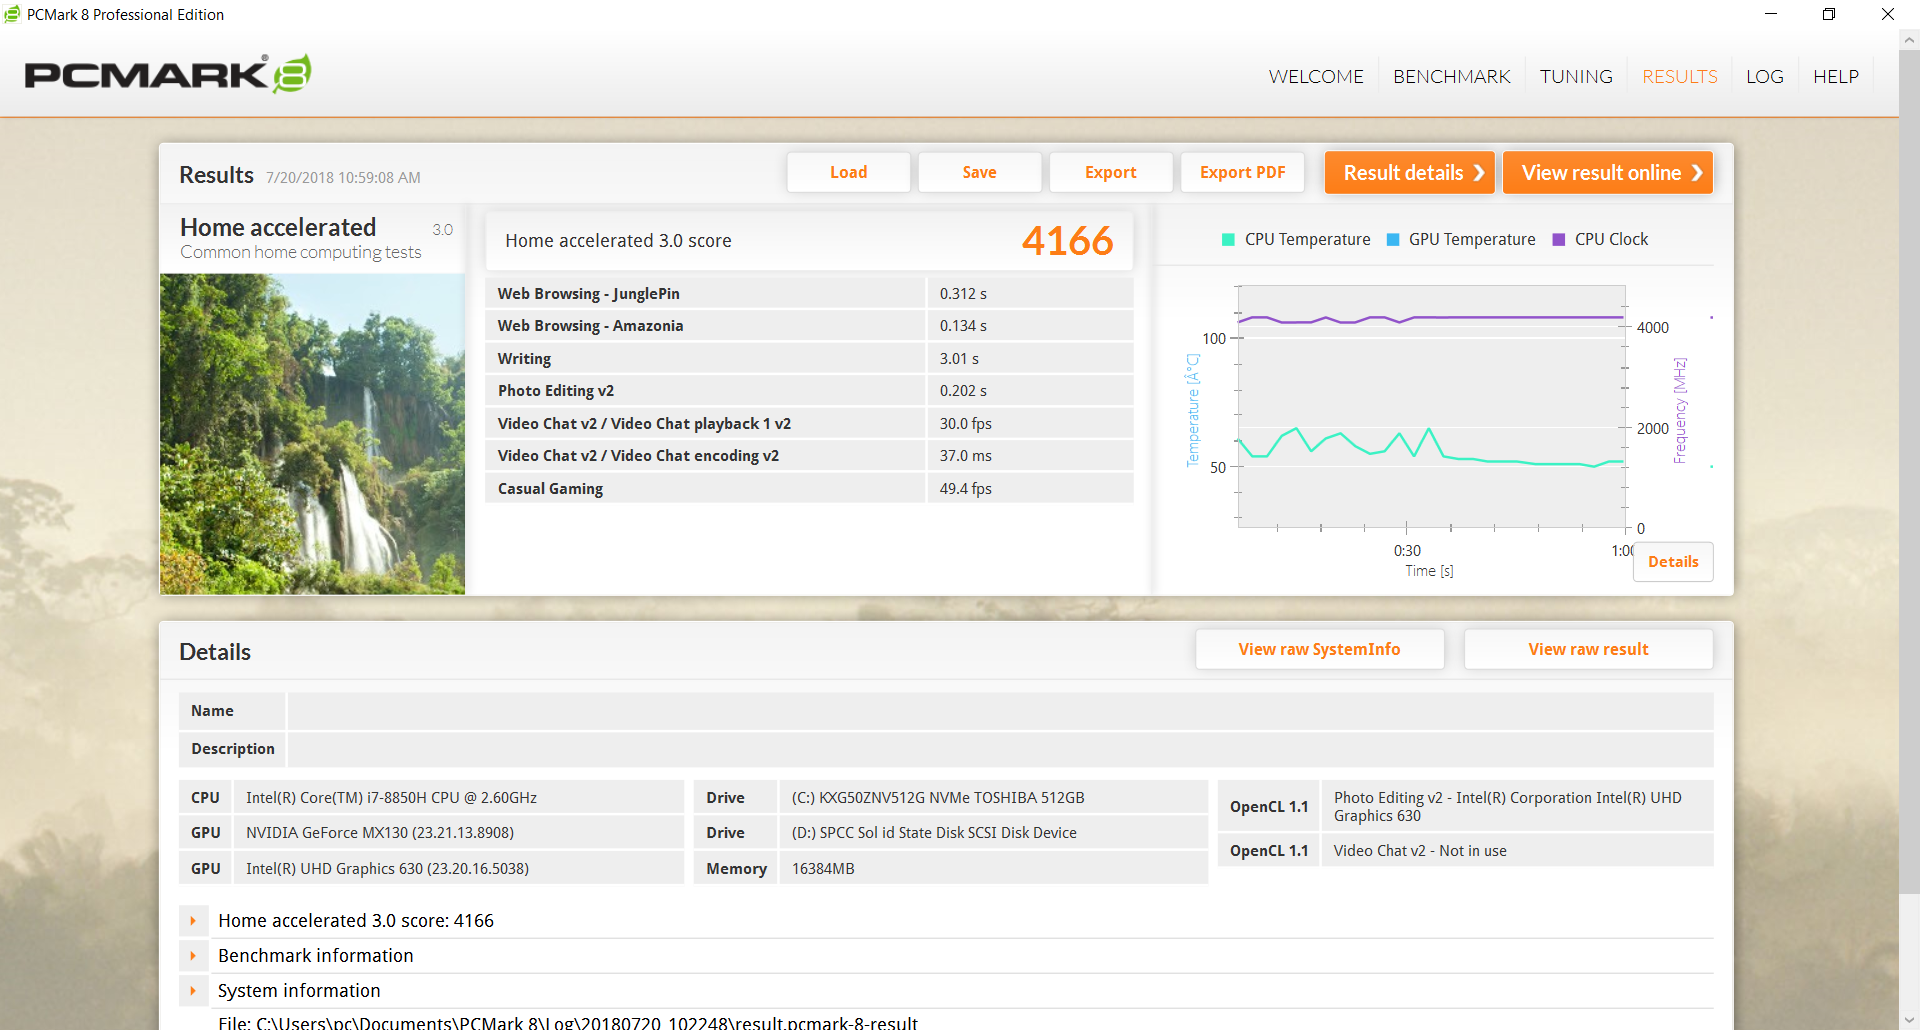
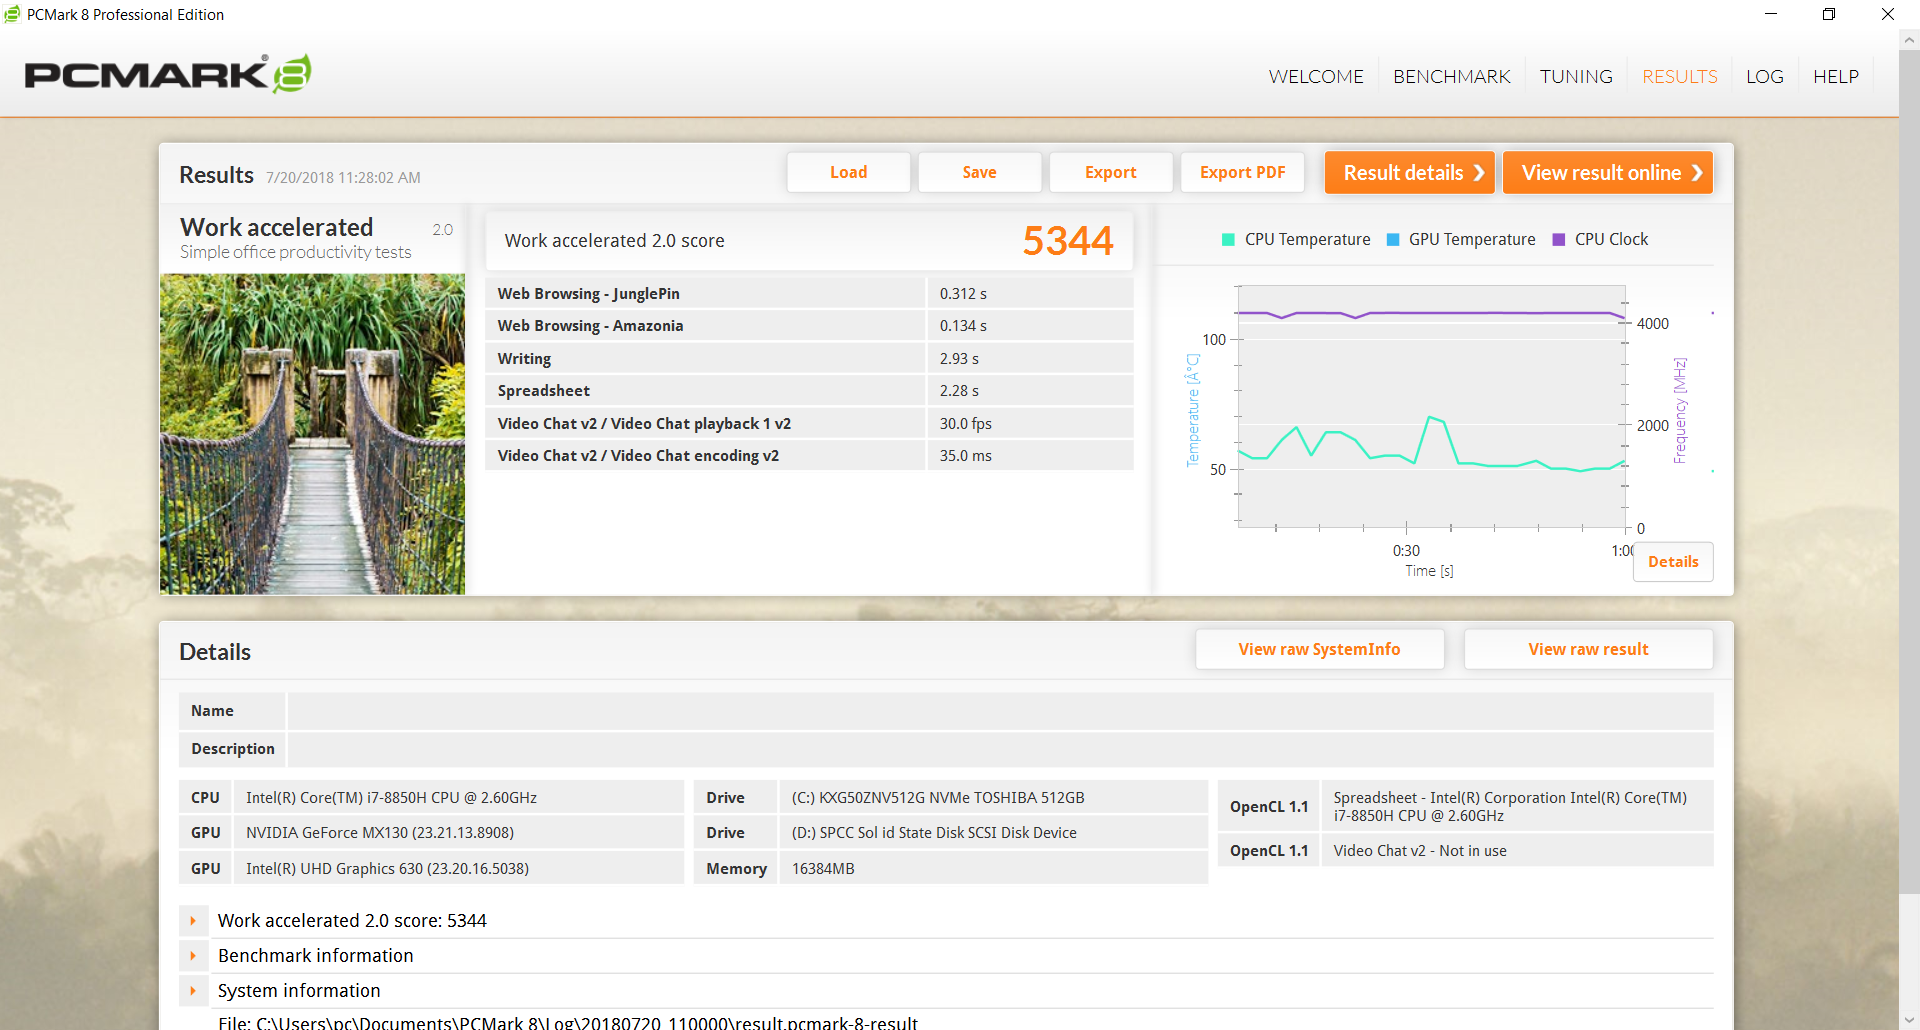
Compared to the Latitude 5590 with Kaby Lake Refresh i5-8250U, the PCMark scores are at least 10 to over 65 percent higher. Interesting is the fact that the Latitude 5491 with identical hardware outperforms the larger 5591 slightly - despite the fact that smaller 14-inch system is affected more by throttling under heavier load.

| PCMark 10 - Score | |
| Dell Latitude 5491 | |
| Dell Latitude 5591 | |
| HP EliteBook 850 G5 3JX58EA | |
| Lenovo ThinkPad T580-20LAS01H00 | |
| HP EliteBook 755 G5 3UN79EA | |
| Dell Latitude 5590 | |
| PCMark 8 Home Score Accelerated v2 | 4166 points | |
| PCMark 8 Work Score Accelerated v2 | 5344 points | |
| PCMark 10 Score | 4096 points | |
Help | ||
Storage Devices
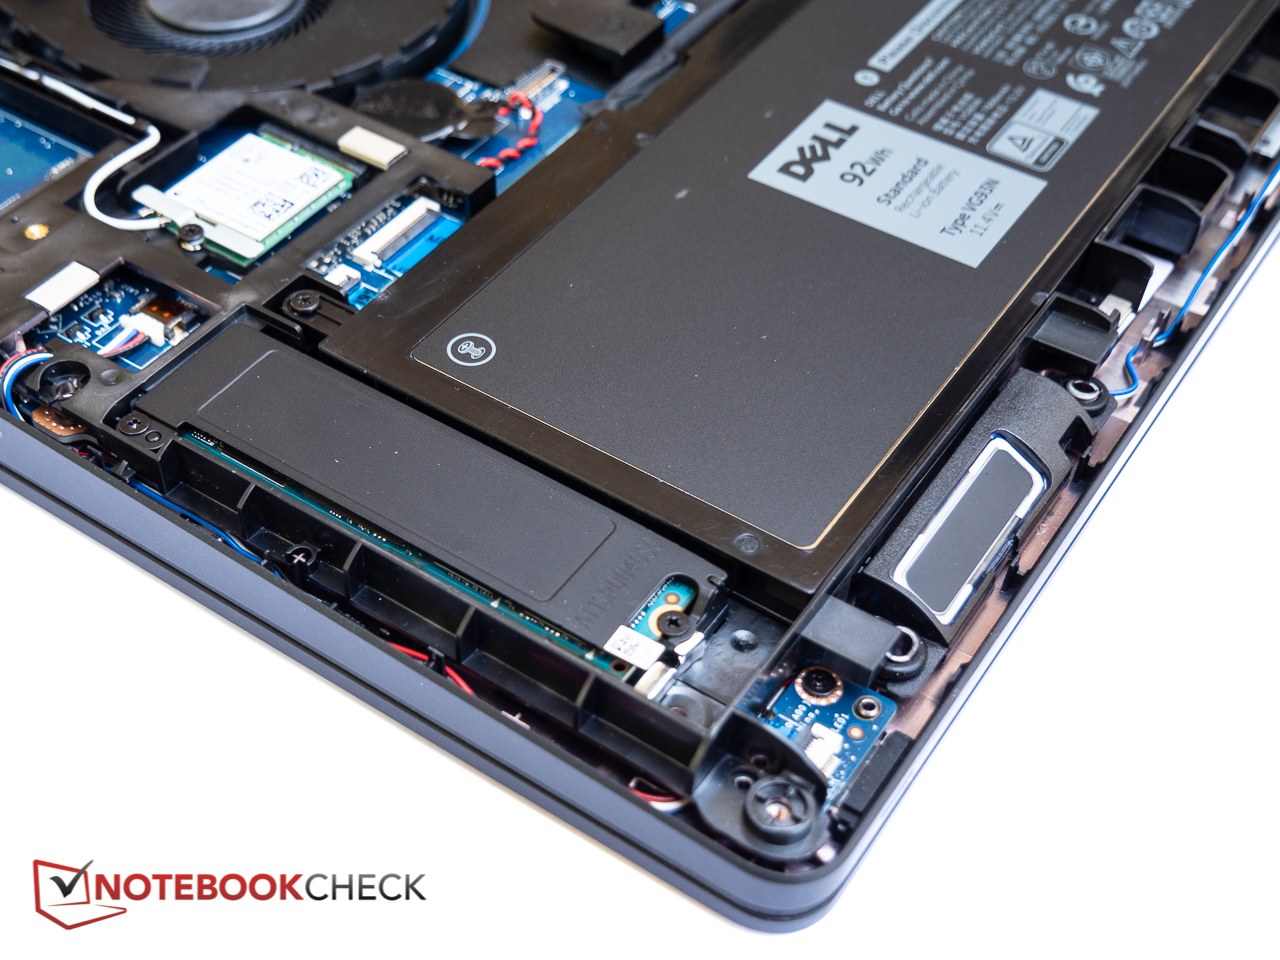
Performance of the PCIe/NVMe SSD once again follows the pattern we have seen from Toshiba's XG5 series with excellent read, but somewhat modest write rates. The SK Hynix SSD in the Latitude 5590 supports only SATA speeds, so it doesn't perform nearly as well.
As mentioned earlier, when the notebook is equipped with the large 6-cell 92 Wh battery, there is no 2.5-inch storage bay. According to the spec sheet, however, the Latitude 5591 also accepts M.2 2230 PCIe/NVMe SSDs up to a capacity of 256GB in the WWAN slot.
Please see our table of HDDs and SSDs for additional benchmark comparisons.

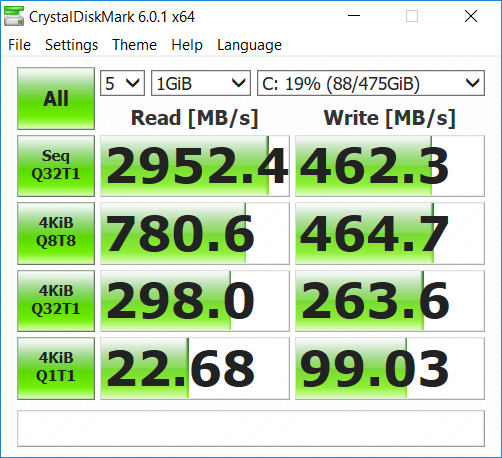
| Dell Latitude 5591 Toshiba XG5 KXG50ZNV512G | HP EliteBook 850 G5 3JX58EA Toshiba XG5 KXG50ZNV256G | Lenovo ThinkPad T580-20LAS01H00 Samsung SSD PM981 MZVLB512HAJQ | Dell Latitude 5590 SK hynix SC311 M.2 | Dell XPS 15 2018 i5 FHD 97Wh Lite-On CA3-8D256-Q11 | |
|---|---|---|---|---|---|
| AS SSD | -14% | 81% | -33% | -128% | |
| Copy Game MB/s (MB/s) | 457.9 | 343.8 -25% | 878 92% | 210 -54% | 465.9 2% |
| Copy Program MB/s (MB/s) | 365.7 | 274.4 -25% | 393.4 8% | 208.6 -43% | 117.2 -68% |
| Copy ISO MB/s (MB/s) | 782 | 337 -57% | 1533 96% | 311.5 -60% | 632 -19% |
| Score Total (Points) | 1971 | 1321 -33% | 3548 80% | 912 -54% | 750 -62% |
| Score Write (Points) | 570 | 444 -22% | 1515 166% | 326 -43% | 58 -90% |
| Score Read (Points) | 998 | 607 -39% | 1342 34% | 385 -61% | 492 -51% |
| Access Time Write * (ms) | 0.065 | 0.054 17% | 0.033 49% | 0.047 28% | 0.889 -1268% |
| Access Time Read * (ms) | 0.122 | 0.091 25% | 0.059 52% | 0.111 9% | 0.086 30% |
| 4K-64 Write (MB/s) | 430.3 | 286.6 -33% | 1278 197% | 212.7 -51% | 19.19 -96% |
| 4K-64 Read (MB/s) | 719 | 418.2 -42% | 1153 60% | 306 -57% | 301.8 -58% |
| 4K Write (MB/s) | 97.2 | 98.6 1% | 110.9 14% | 73.5 -24% | 5.12 -95% |
| 4K Read (MB/s) | 21.95 | 30.94 41% | 51.5 135% | 29.03 32% | 32.5 48% |
| Seq Write (MB/s) | 426.5 | 590 38% | 1262 196% | 393 -8% | 340.3 -20% |
| Seq Read (MB/s) | 2573 | 1579 -39% | 1373 -47% | 503 -80% | 1574 -39% |
* ... smaller is better

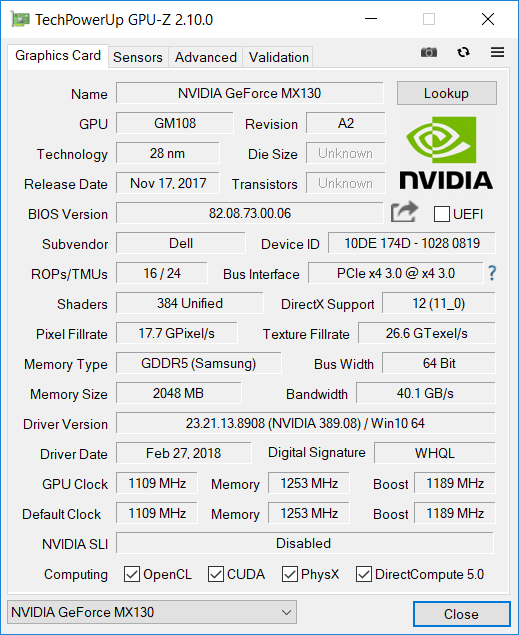
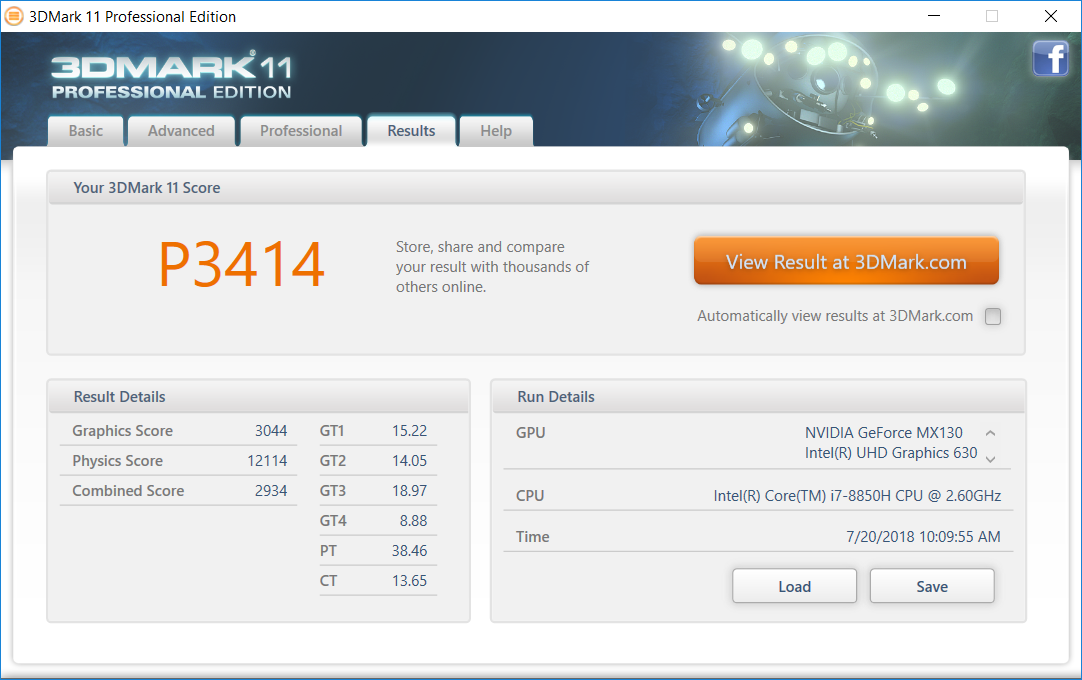
GPU Performance
The DirectX 12 capable Nvidia GeForce MX130 is based on the older Maxwell architecture and essentially a renamed GeForce 930MX. Although the graphics card tops out at a theoretical maximum speed of 1242 MHz, we never observed speeds higher than 1110 MHz during our various benchmark tests. With a TDP of between 15 to 30 W, the MX130 is nowhere near as capable as the Pascal-based GTX 1050 (up to 50 W), so its not surprising that the latter GPU at times outperforms the former by a factor of 2.5. Still, the MX130 offers a decent performance gain of at least 80 percent over the integrated Intel HD Graphics 620.
For additional technical information and benchmark comparisons, please see our dedicated page on the Nvidia GeForce MX130.

| 3DMark | |
| 1280x720 Cloud Gate Standard Graphics | |
| Dell XPS 15 2018 i5 FHD 97Wh | |
| Lenovo ThinkPad T580-20LAS01H00 | |
| Dell Latitude 5591 | |
| Average NVIDIA GeForce MX130 (12166 - 14880, n=13) | |
| HP EliteBook 755 G5 3UN79EA | |
| Dell Latitude 5590 | |
| HP EliteBook 850 G5 3JX58EA | |
| 1920x1080 Fire Strike Graphics | |
| Dell XPS 15 2018 i5 FHD 97Wh | |
| Lenovo ThinkPad T580-20LAS01H00 | |
| Dell Latitude 5591 | |
| Average NVIDIA GeForce MX130 (2149 - 2495, n=13) | |
| HP EliteBook 755 G5 3UN79EA | |
| HP EliteBook 850 G5 3JX58EA | |
| Dell Latitude 5590 | |
| 1920x1080 Ice Storm Extreme Graphics | |
| Average NVIDIA GeForce MX130 (n=1) | |
| Dell Latitude 5590 | |
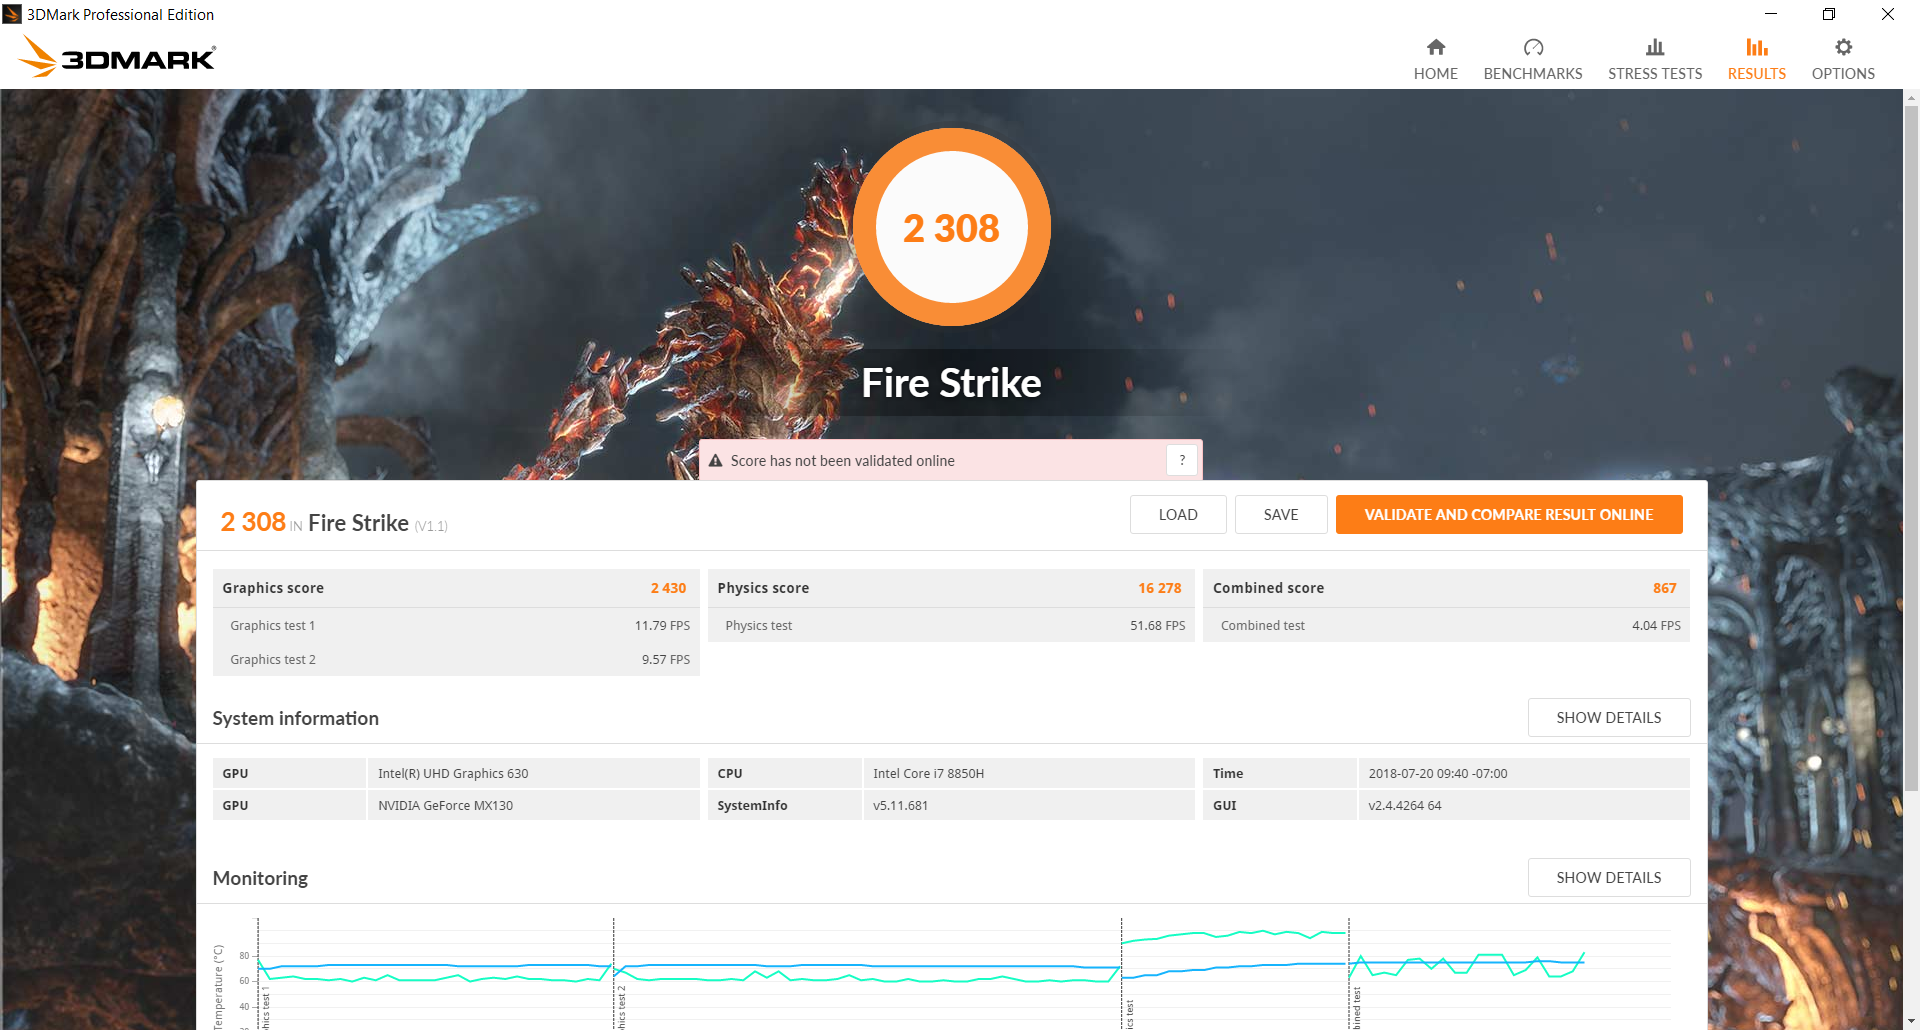
| 3DMark 11 Performance | 3414 points | |
| 3DMark Cloud Gate Standard Score | 13252 points | |
| 3DMark Fire Strike Score | 2308 points | |
Help | ||
Gaming Performance
Gaming performance is very similar to the 14-inch Latitude 5491 with near-identical frame rates. New games are more or less out of the question, but the performance is good enough for the occasional gaming session with older games and reduced resolution or quality settings.
| low | med. | high | ultra | |
|---|---|---|---|---|
| BioShock Infinite (2013) | 152.6 | 84.5 | 69 | 25 |
| Rise of the Tomb Raider (2016) | 51 | 31.3 | 16.8 | 13.9 |
Stress Test
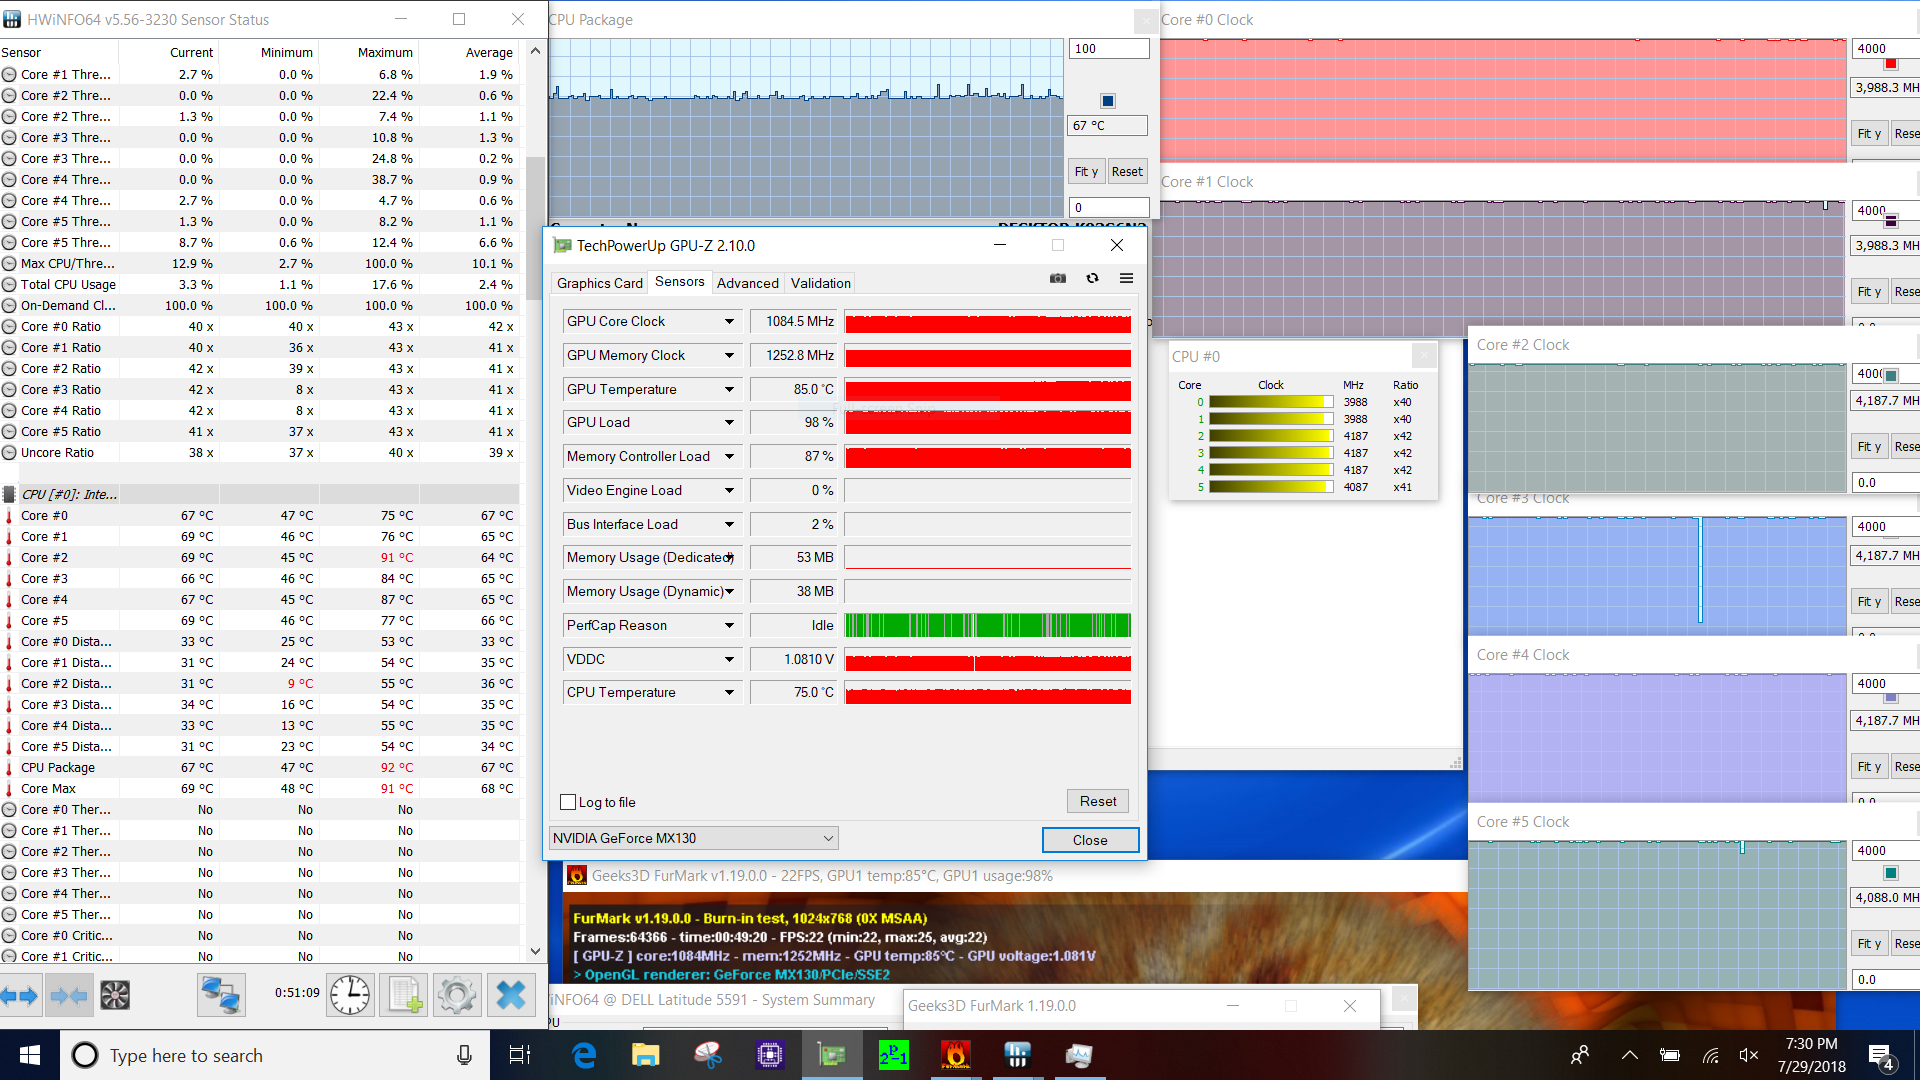
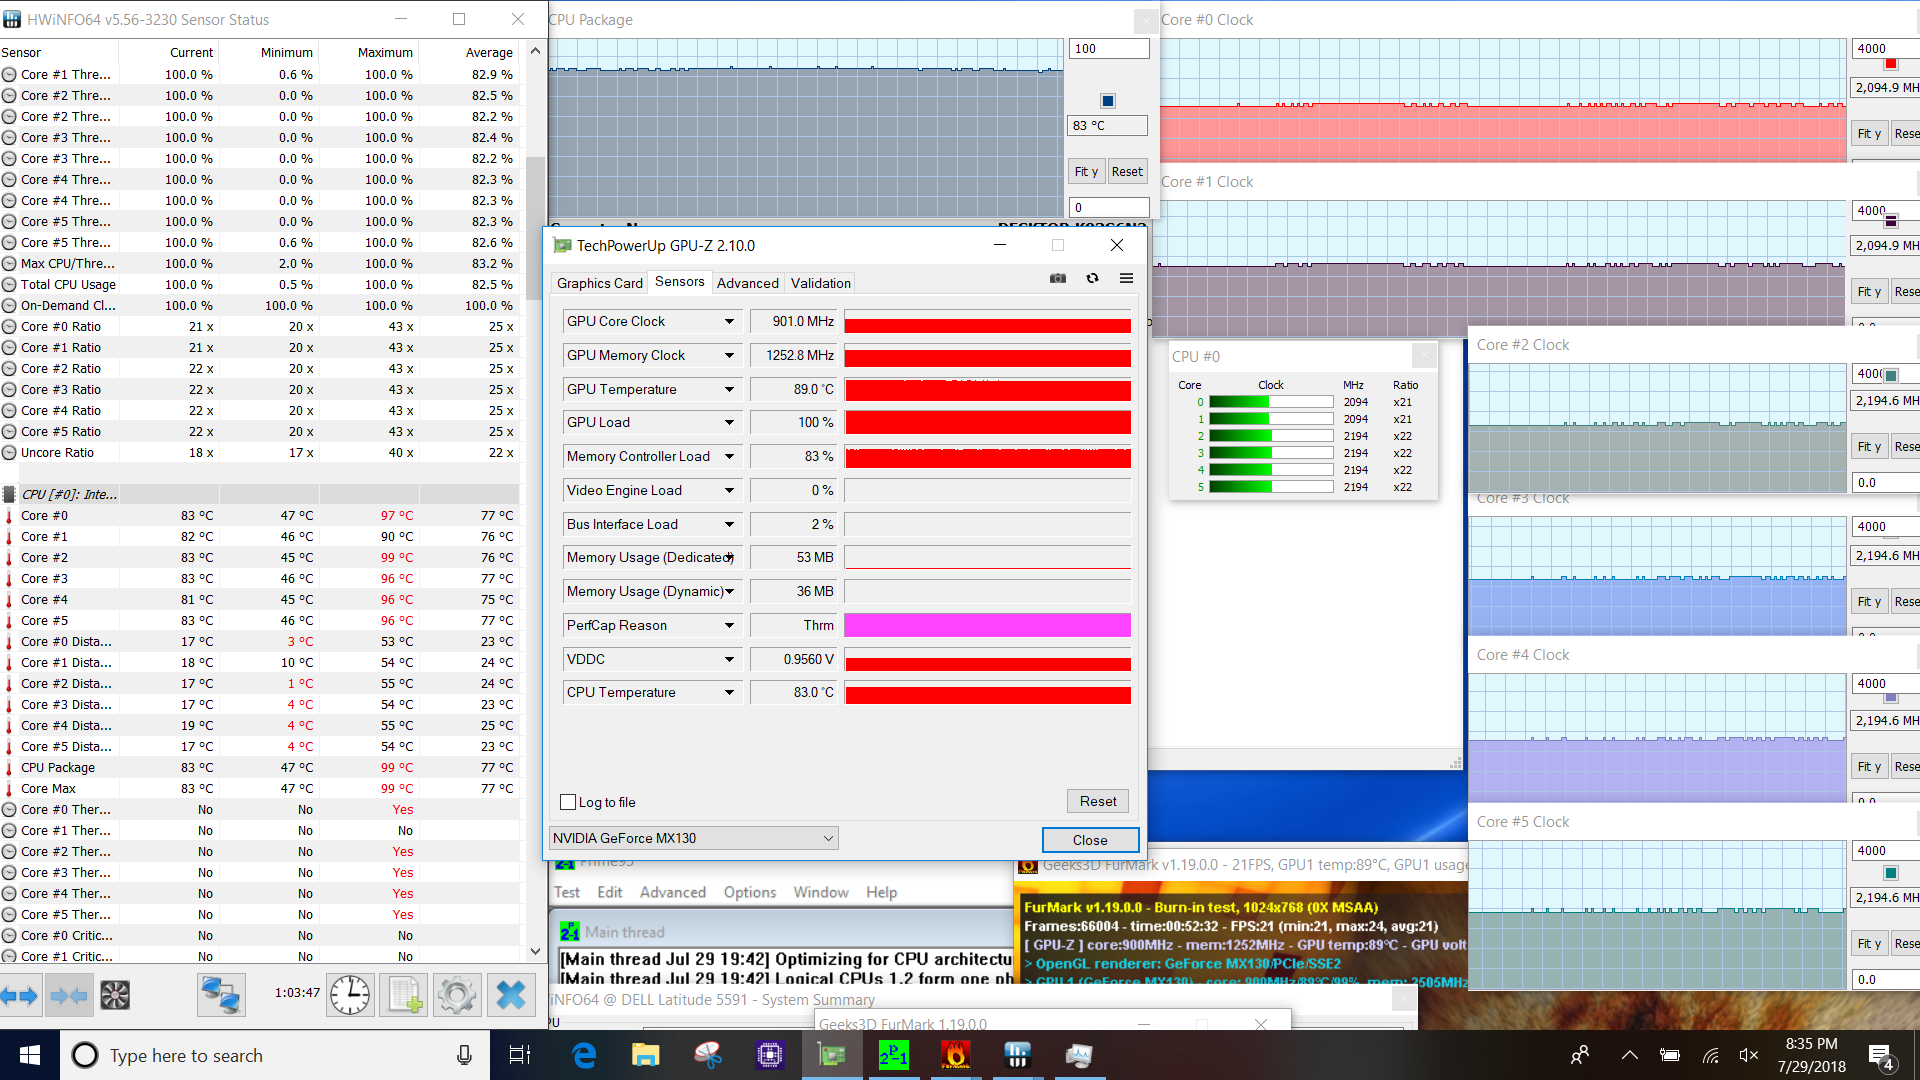
We stress our review laptops with Prime95 and Furmark to identify throttling and potential stability issues. When the CPU is maxed out, the temperature rises very quickly to 99 C and the CPU cores subsequently drop to under 3.0 GHz within the first 30 seconds, while the temperature falls to about 75 C. Two minutes later, the CPU can be observed running at 2.5 - 2.6 GHz with no changes in temperature. The cores eventually stabilize at 2.6 GHz at 78 C. With Furmark running on its own, the GPU cycles between 1058 and 1084 MHz at a temperature of 84 C. Stressing both the CPU and GPU with Prime95 and FurMark in parallel results in CPU clock rates of around 2.1 - 2.2 GHz at temperatures of 83 C, while the GPU runs steadily at 901 MHz at 89 C.
A comparison between the 15.6-inch Latitude 5591 and the smaller 14-inch Latitude 5491 with identical hardware shows somewhat better CPU and GPU performance, likely because of the improved cooling system with two separate heat pipes.
A repeat of 3DMark 11 on battery shows nearly unchanged GPU and CPU performance with Physics and Graphics scores within a couple of percent of our previous run and thus a near-identical final score.

| CPU Clock (GHz) | GPU Clock (MHz) | Average CPU Temperature (°C) | Average GPU Temperature (°C) | |
| Prime95 Stress | 2.6 | - | 78 | - |
| FurMark Stress | - | 1058-1084 | - | 84 |
| Prime95 + FurMark Stress | 2.1-2.2 | 901 | 83 | 89 |
Emissions
System Noise
The Latitude 5591 is quiet when idling on the desktop, as the fan generally won't turn on. Medium and maximum loads will bump the noise level to 46.5 and 48.6 dB, respectively, which also means that the 5591 is louder than all its peers by a fair margin. Even gaming systems like the Aorus X5 v8 with the same CPU and GeForce GTX 1070 graphics aren't any noisier. The HP EliteBook 850 G5 - admittedly not nearly as powerful as our review notebook - only reaches 43 dB and is whisper-quiet by comparison.
Even when running SSD benchmark tests, we cannot notice any coil whine or similar electronic noises on our test unit.
Noise level
| Idle |
| 29 / 29 / 30.3 dB(A) |
| Load |
| 46.5 / 48.6 dB(A) |
 | ||
30 dB silent 40 dB(A) audible 50 dB(A) loud |
||
min: | ||
| Dell Latitude 5591 GeForce MX130, i7-8850H, Toshiba XG5 KXG50ZNV512G | Lenovo ThinkPad T580-20LAS01H00 GeForce MX150, i5-8550U, Samsung SSD PM981 MZVLB512HAJQ | HP EliteBook 850 G5 3JX58EA UHD Graphics 620, i5-8250U, Toshiba XG5 KXG50ZNV256G | HP EliteBook 755 G5 3UN79EA Vega 10, R7 2700U, Toshiba XG5 KXG50ZNV512G | Acer TravelMate 2410-G2-MG-82E6 GeForce MX130, i5-8550U, SK Hynix HFS256G39TND-N210A | Dell Latitude 5491 GeForce MX130, i7-8850H, Toshiba XG5 KXG50ZNV512G | |
|---|---|---|---|---|---|---|
| Noise | 6% | 7% | 5% | 1% | -1% | |
| off / environment * (dB) | 29 | 29.3 -1% | 30 -3% | 30.5 -5% | 30.3 -4% | 29.5 -2% |
| Idle Minimum * (dB) | 29 | 29.3 -1% | 30 -3% | 30.5 -5% | 30.8 -6% | 29.5 -2% |
| Idle Average * (dB) | 29 | 29.3 -1% | 30 -3% | 30.5 -5% | 30.8 -6% | 29.5 -2% |
| Idle Maximum * (dB) | 30.3 | 31.8 -5% | 32.2 -6% | 30.5 -1% | 30.8 -2% | 31.5 -4% |
| Load Average * (dB) | 46.5 | 35.8 23% | 33.2 29% | 37.5 19% | 42.7 8% | 46.2 1% |
| Load Maximum * (dB) | 48.6 | 38 22% | 34.2 30% | 35 28% | 39.7 18% | 46.2 5% |
| Witcher 3 ultra * (dB) | 35.8 |
* ... smaller is better
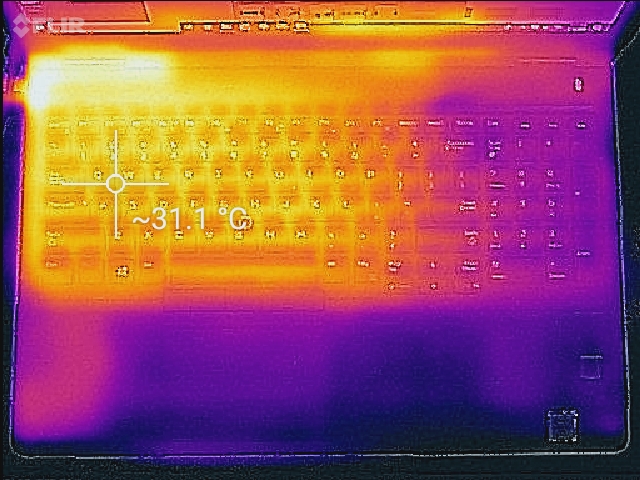
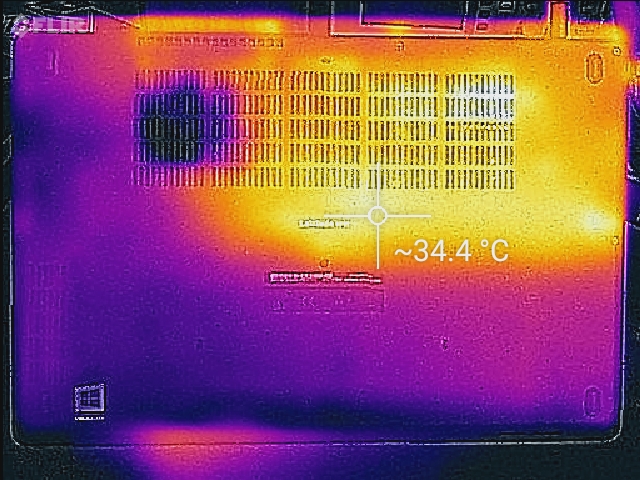
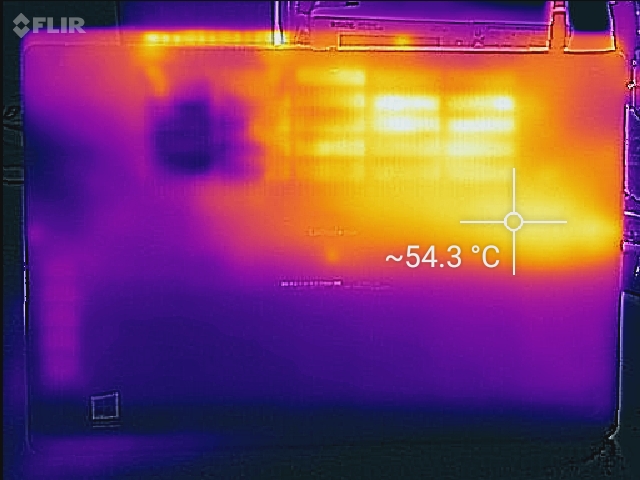
Temperature
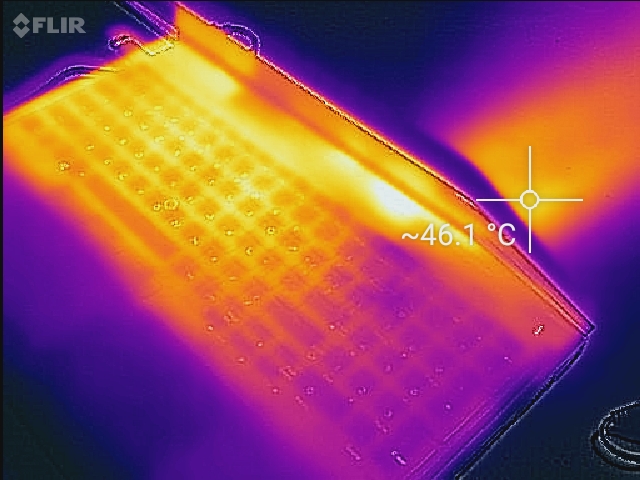
When idling on desktop, surface temperatures aren't flat with temperature differentials of almost 10 C between some quadrants. At high load levels, some hot spots can reach 54 C. This is not nearly as warm as the Latitude 5491, which can run as hot as 63 C, but it's still quite a bit warmer than we would prefer. Surface temperatures of the Lenovo ThinkPad T580 are similarly warm. Just like on the smaller sibling, the 5590's hot spot is located on the bottom left side due to the location of the CPU, which makes operation on the lap over prolonged periods quite uncomfortable. The left side of the keyboard will always be noticeably warmer than the right as well, but the palm rest remains completely unaffected.
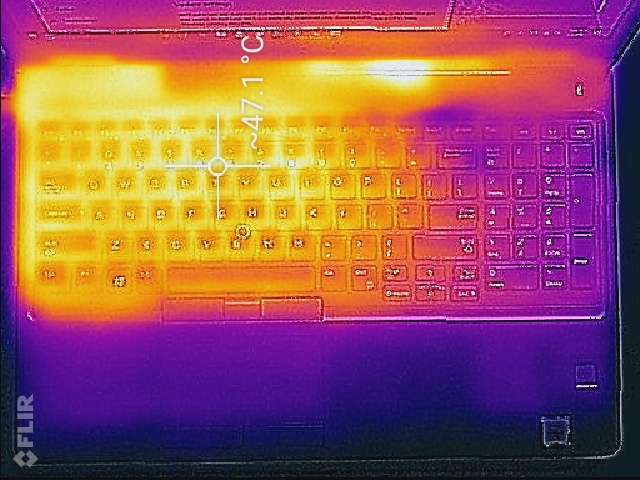
(-) The maximum temperature on the upper side is 46.4 °C / 116 F, compared to the average of 34.3 °C / 94 F, ranging from 21.2 to 62.5 °C for the class Office.
(-) The bottom heats up to a maximum of 54.4 °C / 130 F, compared to the average of 36.8 °C / 98 F
(+) In idle usage, the average temperature for the upper side is 26.8 °C / 80 F, compared to the device average of 29.5 °C / 85 F.
(+) The palmrests and touchpad are cooler than skin temperature with a maximum of 25.2 °C / 77.4 F and are therefore cool to the touch.
(+) The average temperature of the palmrest area of similar devices was 27.6 °C / 81.7 F (+2.4 °C / 4.3 F).
Speakers
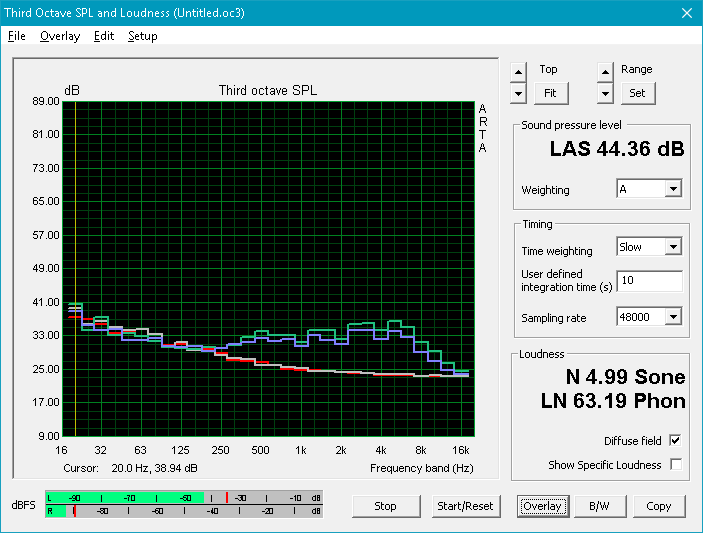
The speakers are slightly larger than on the 14-inch Latitude 5491 and produce better sound. Mids and highs are decently balanced, although bass is still lacking as evident by the rather steep drop-off below 250 Hz in the frequency diagram below. Speaker volume is loud enough for presentations in small to medium-sized rooms and there's no distortion even at maximum volume.


Dell Latitude 5591 audio analysis
(±) | speaker loudness is average but good (77.4 dB)
Bass 100 - 315 Hz
(-) | nearly no bass - on average 17.2% lower than median
(±) | linearity of bass is average (14.2% delta to prev. frequency)
Mids 400 - 2000 Hz
(±) | higher mids - on average 5.3% higher than median
(+) | mids are linear (6.2% delta to prev. frequency)
Highs 2 - 16 kHz
(+) | balanced highs - only 2.2% away from median
(+) | highs are linear (4.2% delta to prev. frequency)
Overall 100 - 16.000 Hz
(±) | linearity of overall sound is average (17.9% difference to median)
Compared to same class
» 30% of all tested devices in this class were better, 7% similar, 63% worse
» The best had a delta of 7%, average was 21%, worst was 53%
Compared to all devices tested
» 37% of all tested devices were better, 8% similar, 55% worse
» The best had a delta of 4%, average was 23%, worst was 134%
Apple MacBook 12 (Early 2016) 1.1 GHz audio analysis
(+) | speakers can play relatively loud (83.6 dB)
Bass 100 - 315 Hz
(±) | reduced bass - on average 11.3% lower than median
(±) | linearity of bass is average (14.2% delta to prev. frequency)
Mids 400 - 2000 Hz
(+) | balanced mids - only 2.4% away from median
(+) | mids are linear (5.5% delta to prev. frequency)
Highs 2 - 16 kHz
(+) | balanced highs - only 2% away from median
(+) | highs are linear (4.5% delta to prev. frequency)
Overall 100 - 16.000 Hz
(+) | overall sound is linear (10.2% difference to median)
Compared to same class
» 7% of all tested devices in this class were better, 2% similar, 90% worse
» The best had a delta of 5%, average was 18%, worst was 53%
Compared to all devices tested
» 5% of all tested devices were better, 1% similar, 94% worse
» The best had a delta of 4%, average was 23%, worst was 134%
Energy Management
Power Consumption
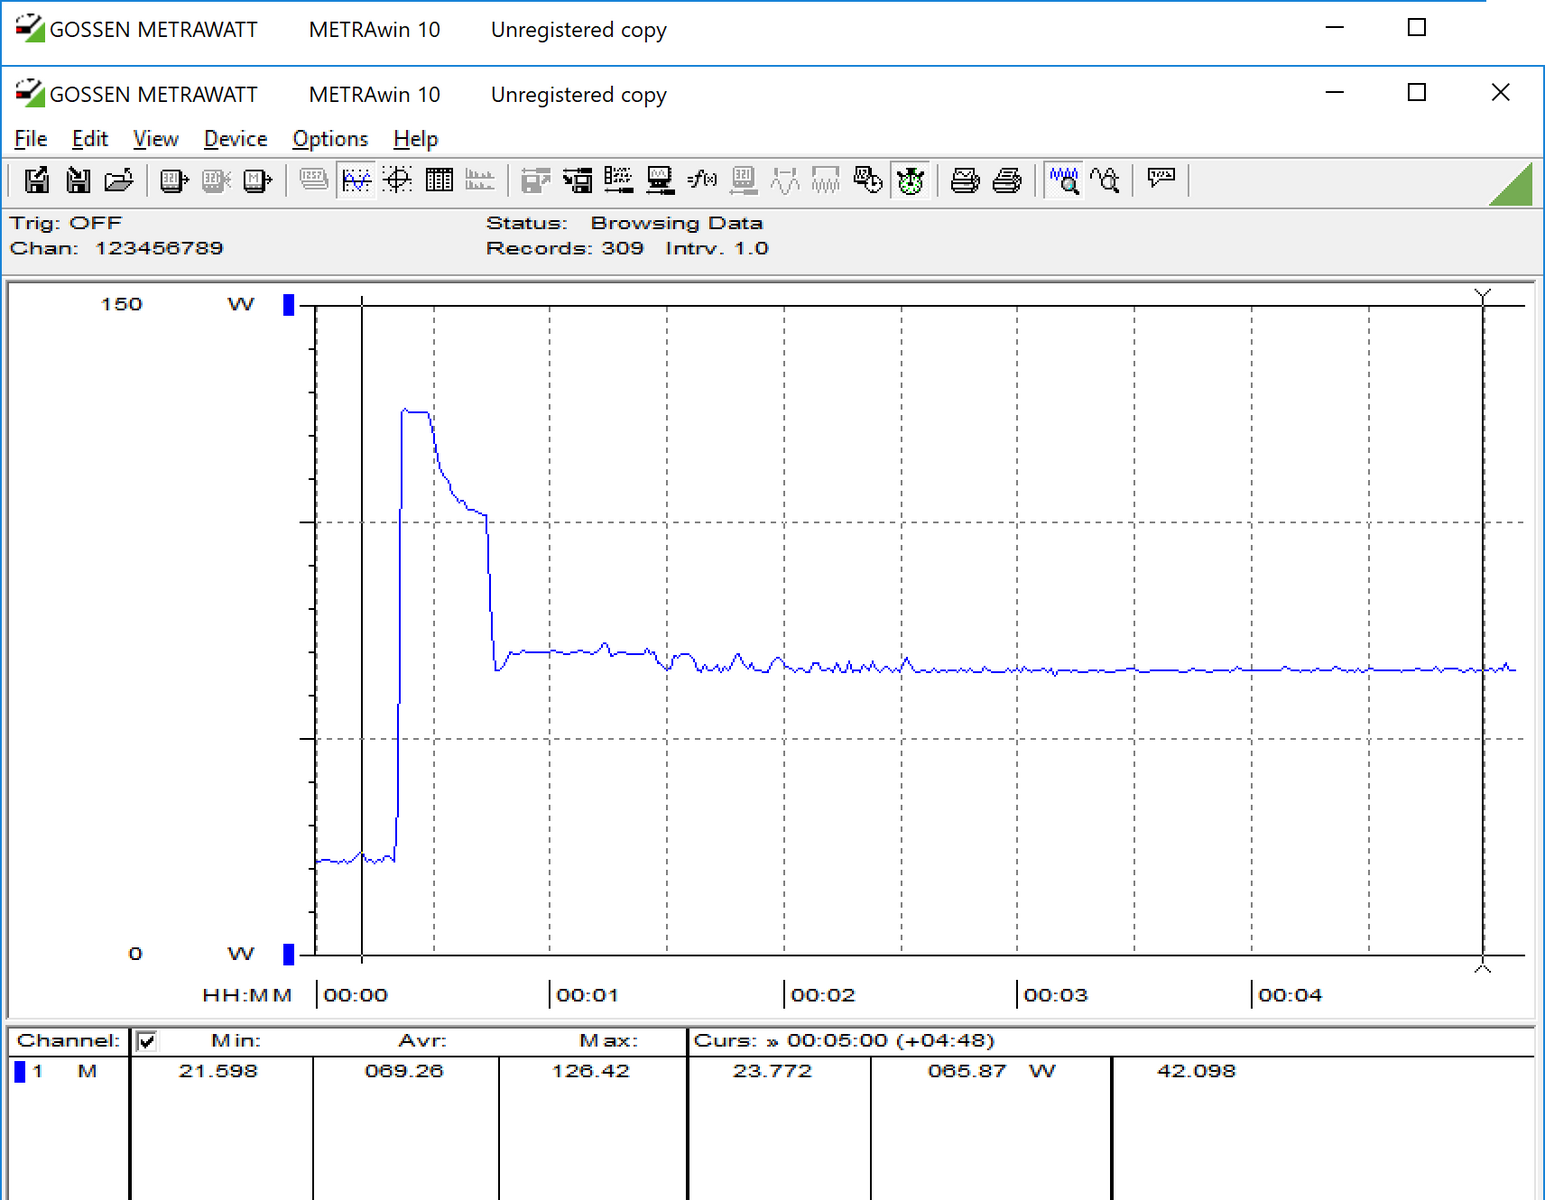
Idling on the desktop will draw between 4.4 - 10 W depending on the chosen profile and brightness setting - less than the smaller 5491, which requires up to 13 W. Medium and maximum load draw 70 and 100 W, respectively, so the 130 W AC adapter has more than enough overhead available. The Latitude 5590 with ULV CPU consumes at least 30 % less under load.
| Off / Standby | |
| Idle | |
| Load |
|
Key:
min: | |
| Dell Latitude 5591 i7-8850H, GeForce MX130, Toshiba XG5 KXG50ZNV512G, IPS, 1920x1080, 15.6" | Lenovo ThinkPad T580-20LAS01H00 i5-8550U, GeForce MX150, Samsung SSD PM981 MZVLB512HAJQ, IPS LED, 3840x2160, 15.6" | Dell XPS 15 2018 i5 FHD 97Wh i5-8300H, GeForce GTX 1050 Mobile, Lite-On CA3-8D256-Q11, LED IGZO IPS InfinityEdge, 1920x1080, 15.6" | Acer TravelMate 2410-G2-MG-82E6 i5-8550U, GeForce MX130, SK Hynix HFS256G39TND-N210A, IPS, 1920x1080, 14" | Dell Latitude 5590 i5-8250U, UHD Graphics 620, SK hynix SC311 M.2, IPS, 1920x1080, 15.6" | HP EliteBook 755 G5 3UN79EA R7 2700U, Vega 10, Toshiba XG5 KXG50ZNV512G, IPS, 1920x1080, 15.6" | Dell Latitude 5491 i7-8850H, GeForce MX130, Toshiba XG5 KXG50ZNV512G, IPS, 1920x1080, 14" | |
|---|---|---|---|---|---|---|---|
| Power Consumption | -4% | 15% | 26% | 27% | 6% | -25% | |
| Idle Minimum * (Watt) | 4.4 | 5.3 -20% | 2.9 34% | 3.5 20% | 3.6 18% | 5 -14% | 7.5 -70% |
| Idle Average * (Watt) | 8.4 | 10.2 -21% | 5.8 31% | 5.9 30% | 6.5 23% | 10.6 -26% | 9.7 -15% |
| Idle Maximum * (Watt) | 10.2 | 13.6 -33% | 7.5 26% | 8.2 20% | 7.2 29% | 12.9 -26% | 13 -27% |
| Load Average * (Watt) | 71 | 58.3 18% | 77.5 -9% | 57.3 19% | 46.2 35% | 40.6 43% | 74.3 -5% |
| Load Maximum * (Watt) | 100.1 | 65.3 35% | 107 -7% | 57.9 42% | 68.8 31% | 46.6 53% | 106.6 -6% |
| Witcher 3 ultra * (Watt) | 47.8 | 84 |
* ... smaller is better
Battery Life
Despite the larger 92 Wh battery, the review notebook doesn't last quite as long as we would have expected. With the screen brightness adjusted to 150 nits and the balanced profile active, users can expect about 12.5 hours of real-world WLAN use. Not that it couldn't be worse: the Lenovo ThinkPad T580 with 105 Wh battery requires recharging after only 8 hours and 45 minutes. The Dell XPS 15 on the other hand features a minimally larger 97 Wh battery, but lasts almost 16 hours.
| Dell Latitude 5591 i7-8850H, GeForce MX130, 92 Wh | HP EliteBook 850 G5 3JX58EA i5-8250U, UHD Graphics 620, 56 Wh | Lenovo ThinkPad T580-20LAS01H00 i5-8550U, GeForce MX150, 105 Wh | Dell XPS 15 2018 i5 FHD 97Wh i5-8300H, GeForce GTX 1050 Mobile, 97 Wh | Dell Latitude 5590 i5-8250U, UHD Graphics 620, 51 Wh | |
|---|---|---|---|---|---|
| Battery runtime | 29% | 10% | 27% | -23% | |
| Reader / Idle (h) | 22.4 | 17.8 -21% | 19.7 -12% | 17.4 -22% | |
| WiFi v1.3 (h) | 12.5 | 9.3 -26% | 8.7 -30% | 15.7 26% | 7.4 -41% |
| Load (h) | 1.5 | 3.5 133% | 2.6 73% | 1.9 27% | 1.4 -7% |
| Witcher 3 ultra (h) | 1 |
Pros
Cons
Verdict
The Latitude 5591 might seem rather utilitarian in its design approach, but it comes with the feature set desired by business professionals as well as the build quality and security features corporate IT departments demand. The chassis is MIL-STD 810G compliant and should last a long time, connectivity options are numerous and include Thunderbolt 3, and the keyboard is a pleasure to type on. The notebook with hexa-core i7-8850H CPU and Nvidia GeForce MX130 is clearly ahead of the Latitude 5590 with ULV CPU as far as performance is concerned and has enough power to even handle extremely demanding applications.
Unfortunately, there are drawbacks as well: the 5591 runs very warm under load and the heat it generates has a negative impact on the Turbo Boost sustainability. The noise level has gone up as well and the notebook doesn't run quite as long on a charge as we would've hoped for given the large battery capacity. The display is also disappointing given the price point, as it doesn't get all that bright and both gamut as well as color accuracy leave to be desired.
The Latitude 5591 features numerous security options and an ergonomic design, but users have to carefully evaluate if the added performance makes up for the mentioned drawbacks.
Home users looking for a powerful 15-inch notebook might want to consider the Dell XPS 15, which also comes with a Coffee Lake-H CPU and more potent graphics in form of a GTX 1050. The display is significantly better and the notebook easily lasts three hours longer on a charge.
Dell Latitude 5591
- 07/31/2018 v6 (old)
Bernie Pechlaner
Price comparison