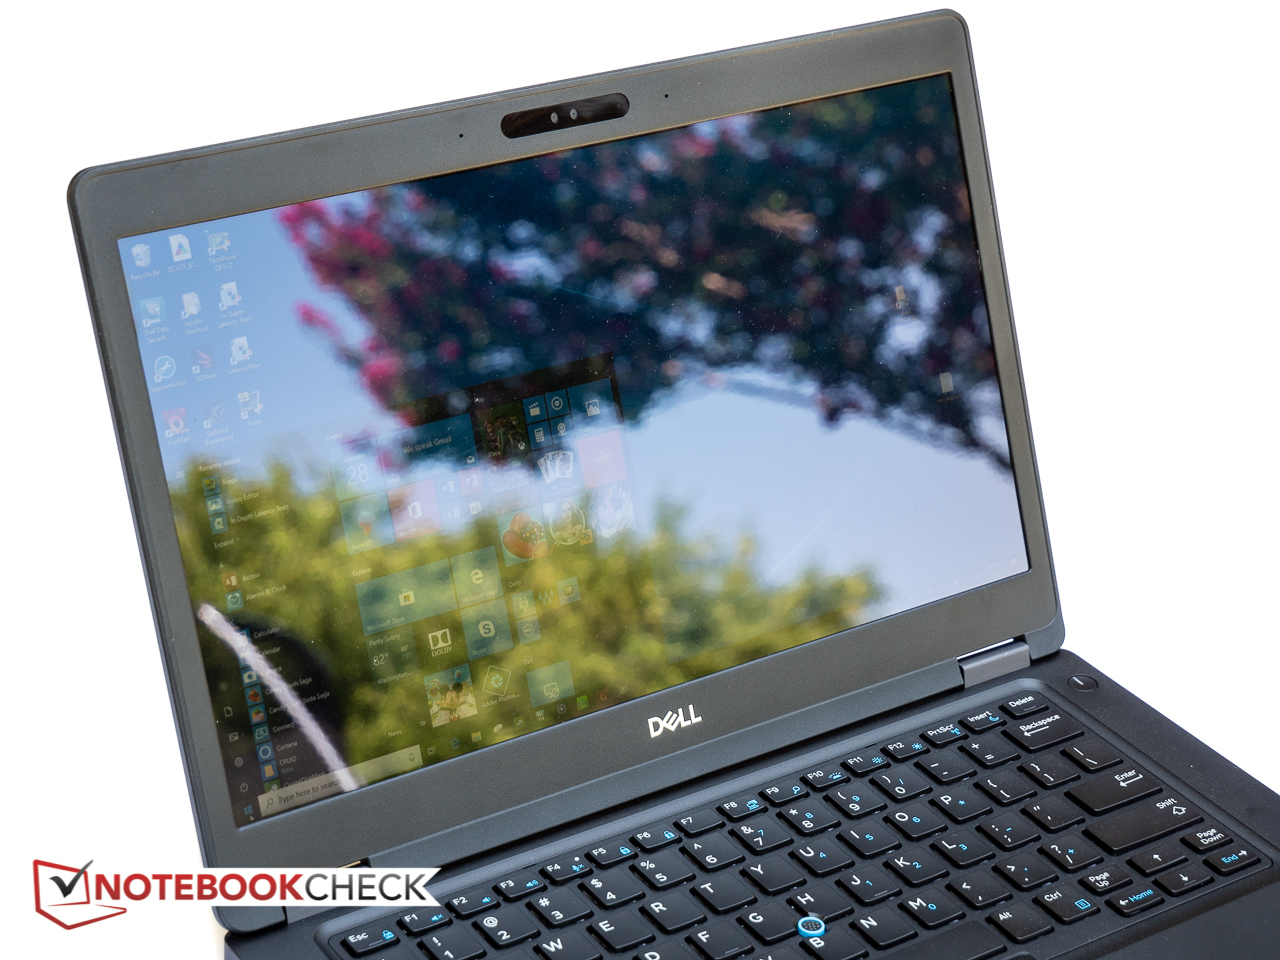
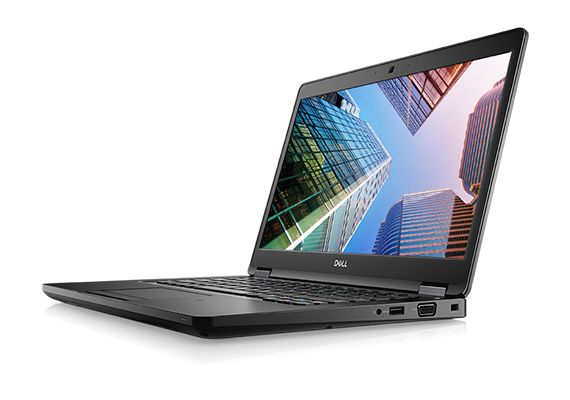
Dell Latitude 5491 (8850H, MX130, Touchscreen) Laptop Review
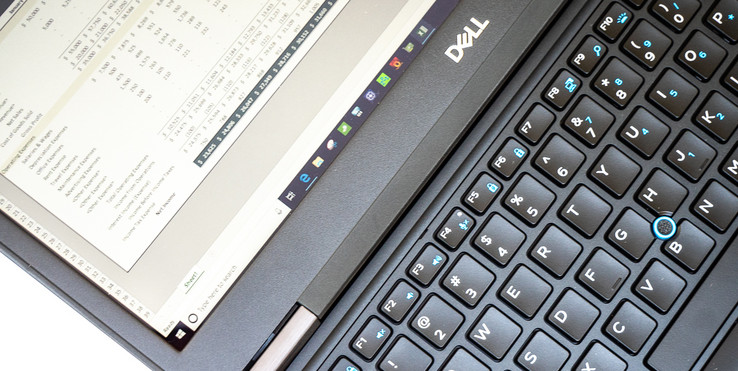
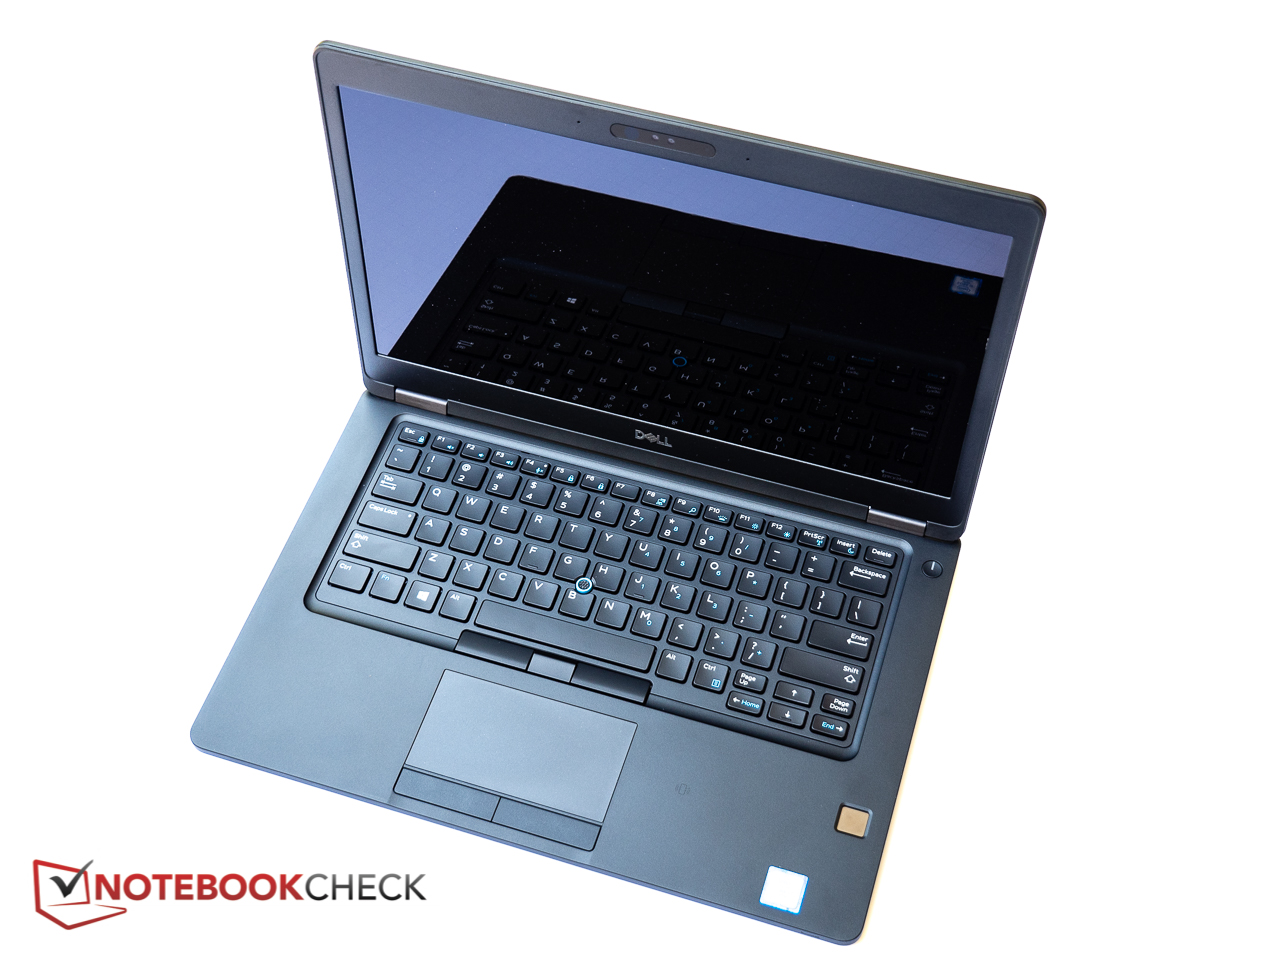
Billed by Dell as the “ultimate 14-inch productivity tool”, the Latitude 5491 is the Coffee Lake-H update of Dell’s venerable mid-range Latitude 5490 series designed for business professionals. Our test unit this time is equipped with a hexa-core i7-8850H CPU, 16 GB of RAM and a 512 GB SSD and features - unlike the two 5490 models we've reviewed in the last few months - an entry-level dedicated Nvidia GeForce MX130 instead of integrated graphics.
The new model isn't really a replacement and at the time of writing, Dell sells the 5490 with dual and quad-core 15 W processors alongside the Latitude 5491 with eight-generation hexa-core 45 W CPUs. The starting price $1070 for the latter model is deceptively low and skyrockets quickly: as configured, our touch-enabled notebook sells for about $2100. Other competing notebooks in this segment include Lenovo's ThinkPad T480 / T480s siblings, the HP EliteBook 840 G5 and Toshiba's Tecra X40, to just name a few.
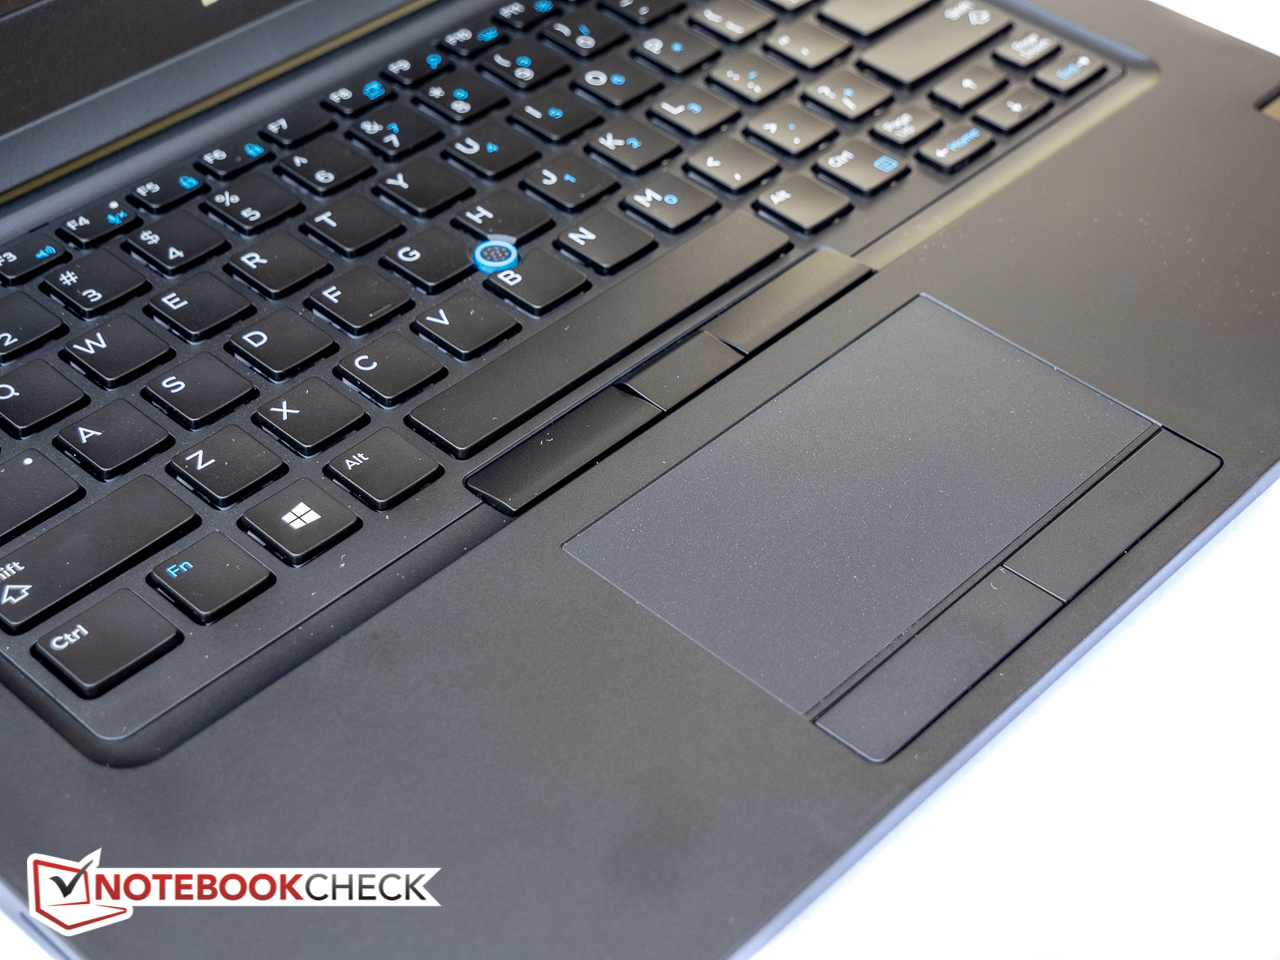
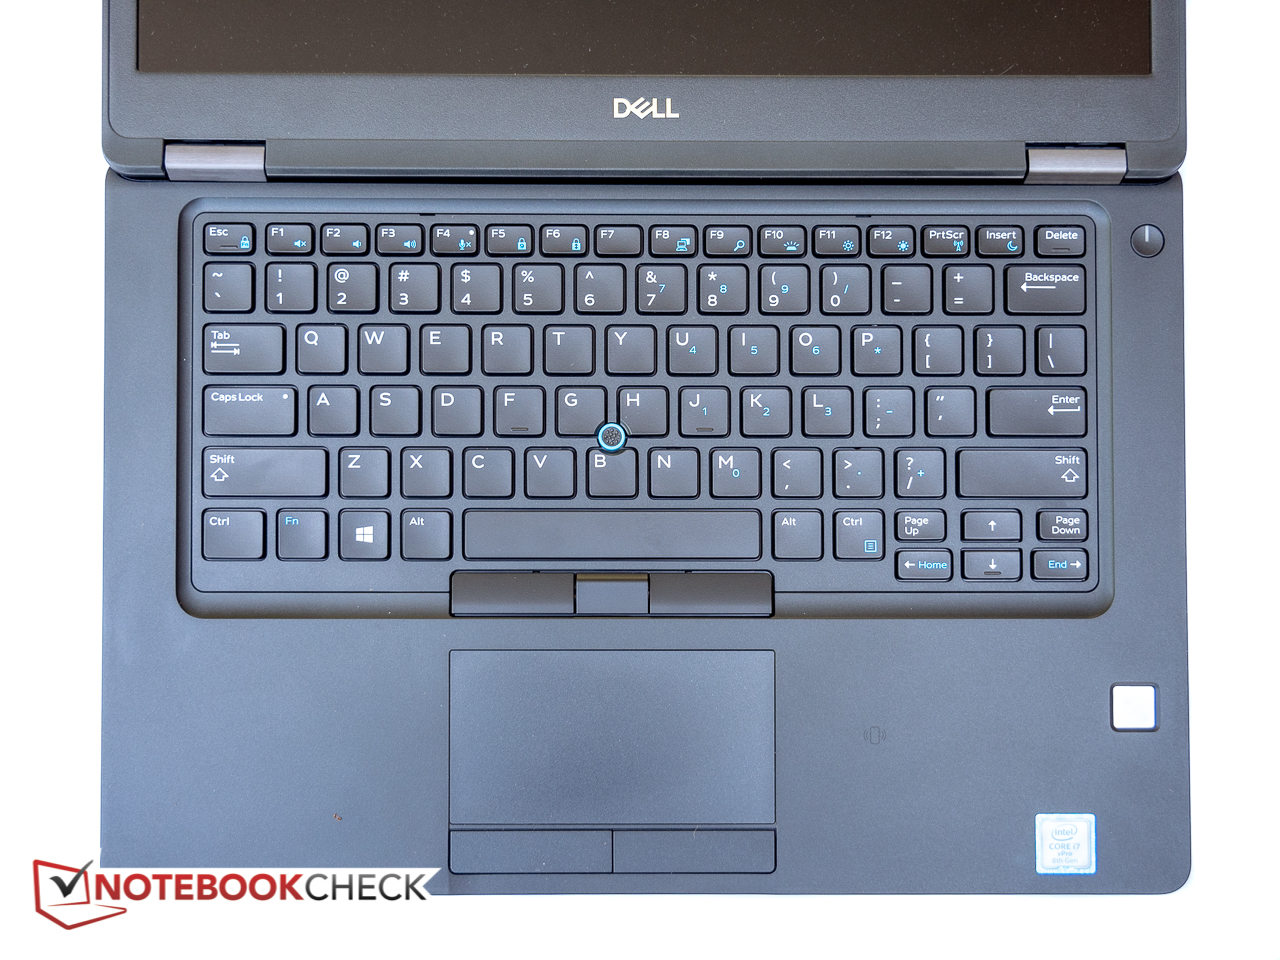
Since the review notebook is indistinguishable from the 5490 as far as the chassis and construction is concerned, we will drop some of our usual sections and focus primarily on the hardware and performance differences of the new addition to the lineup. For a more in-depth discussion of the case and the input devices, please refer to our reviews of the Latitude 5490 (i5-8350U, FHD) and Latitude 5490 (Core i7-8650U, Touchscreen).
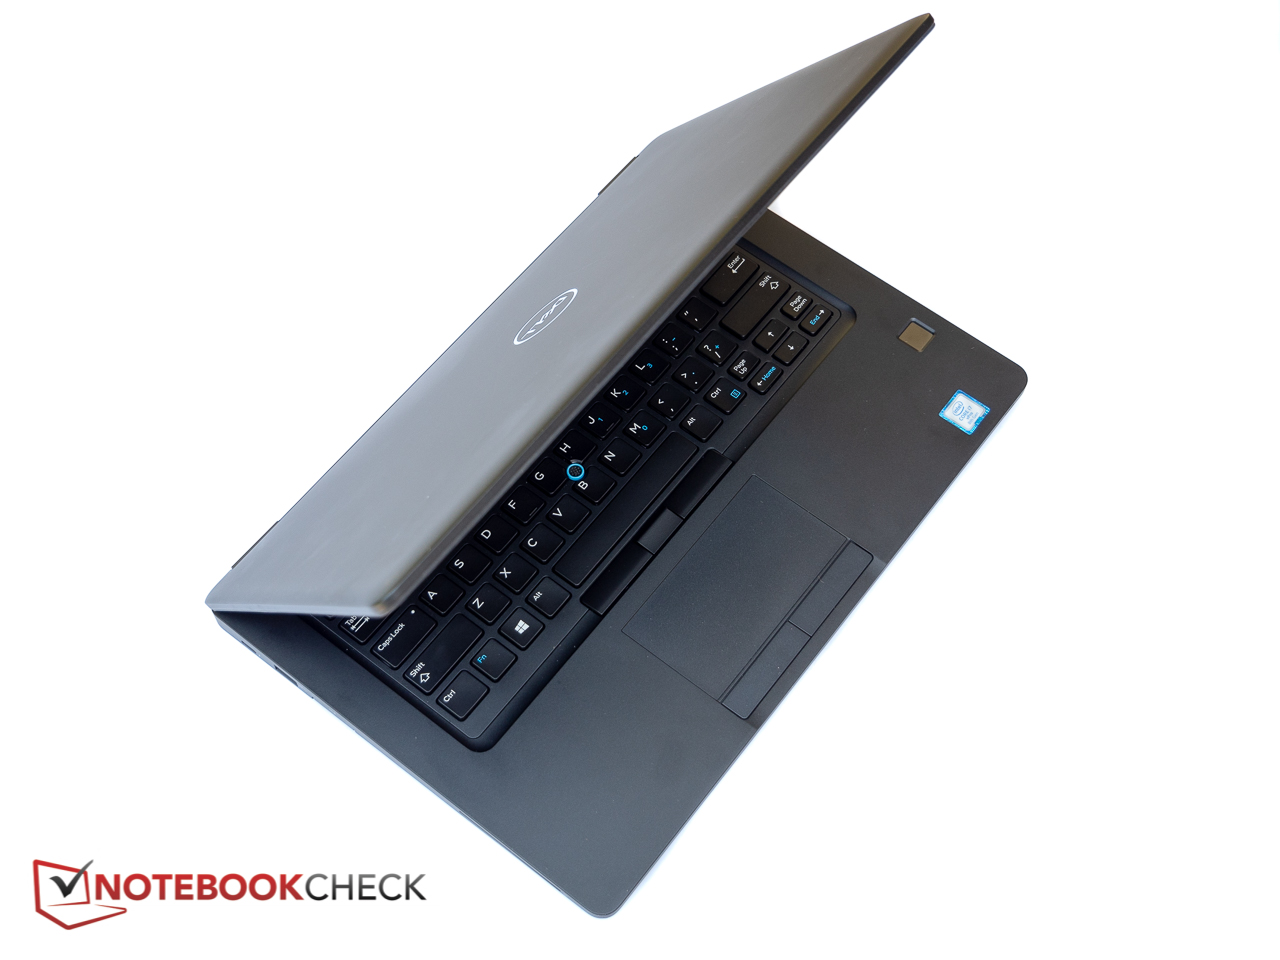
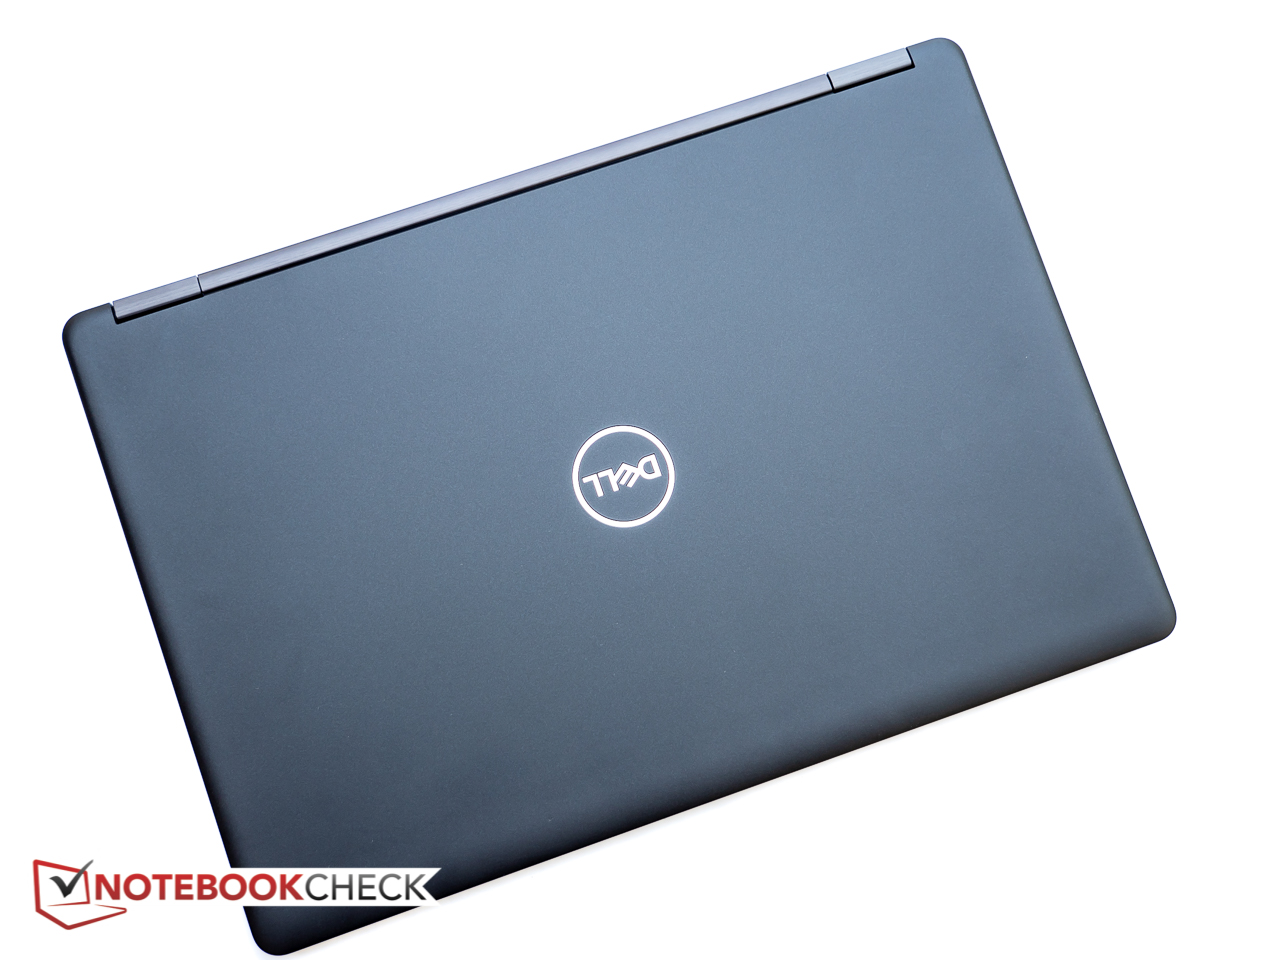
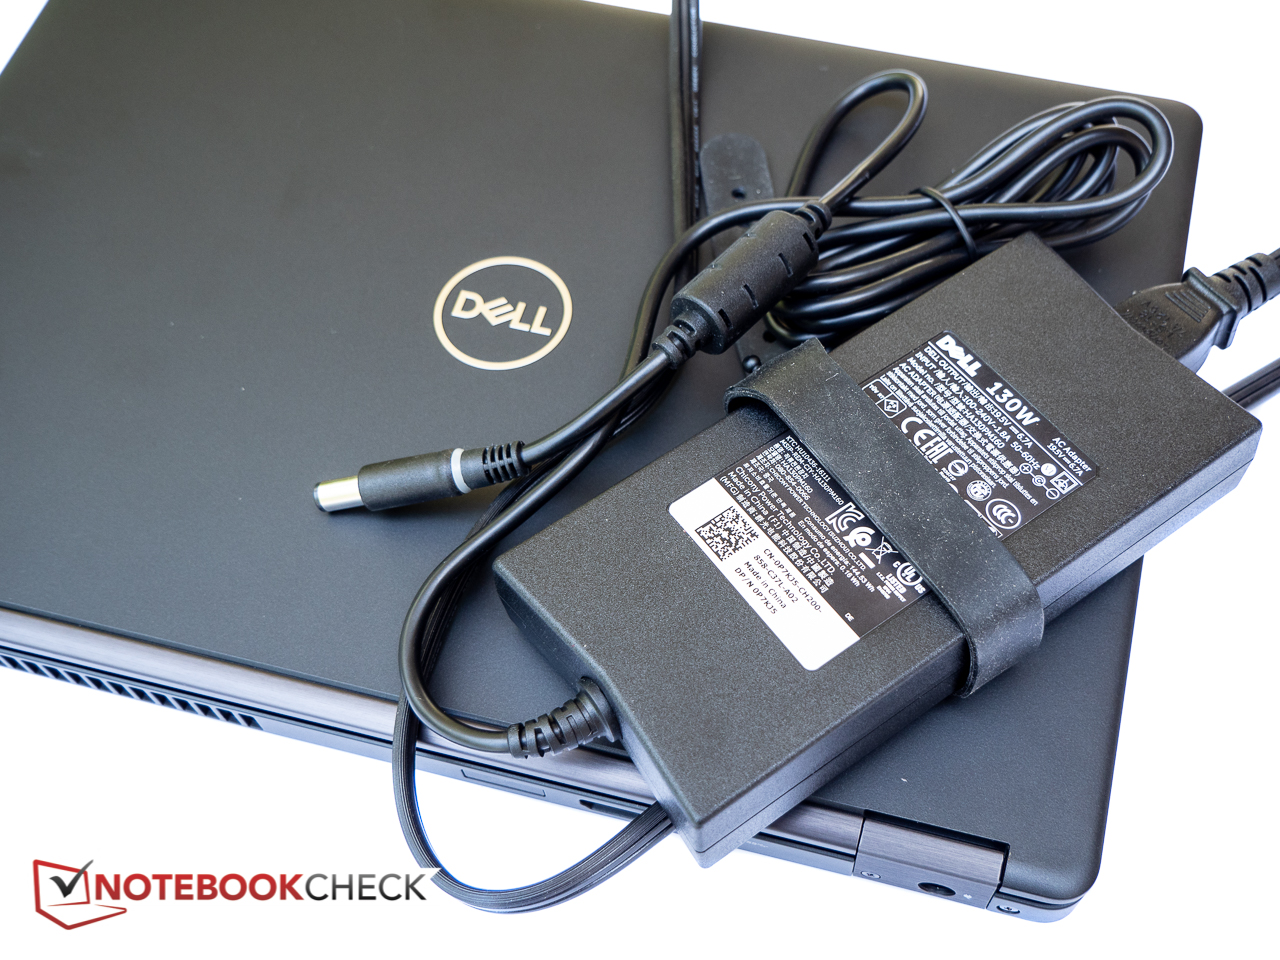
Neither the footprint nor the thickness have changed, but the new notebook is slightly heavier and now tips the scales at 1790 g / 3.95 lbs. While the difference of 90 g / 3 oz might not seem large enough to worry about, the more capable CPU in addition to dedicated graphics has prompted Dell to include their much beefier 130 W power adapter. The combined weight difference between the previous review unit and our current Latitude now amounts to over 340 g / 11 oz. The HP EliteBook 840 G5 features a similar footprint, is slightly thicker, but weighs over 15 percent less.
Connectivity
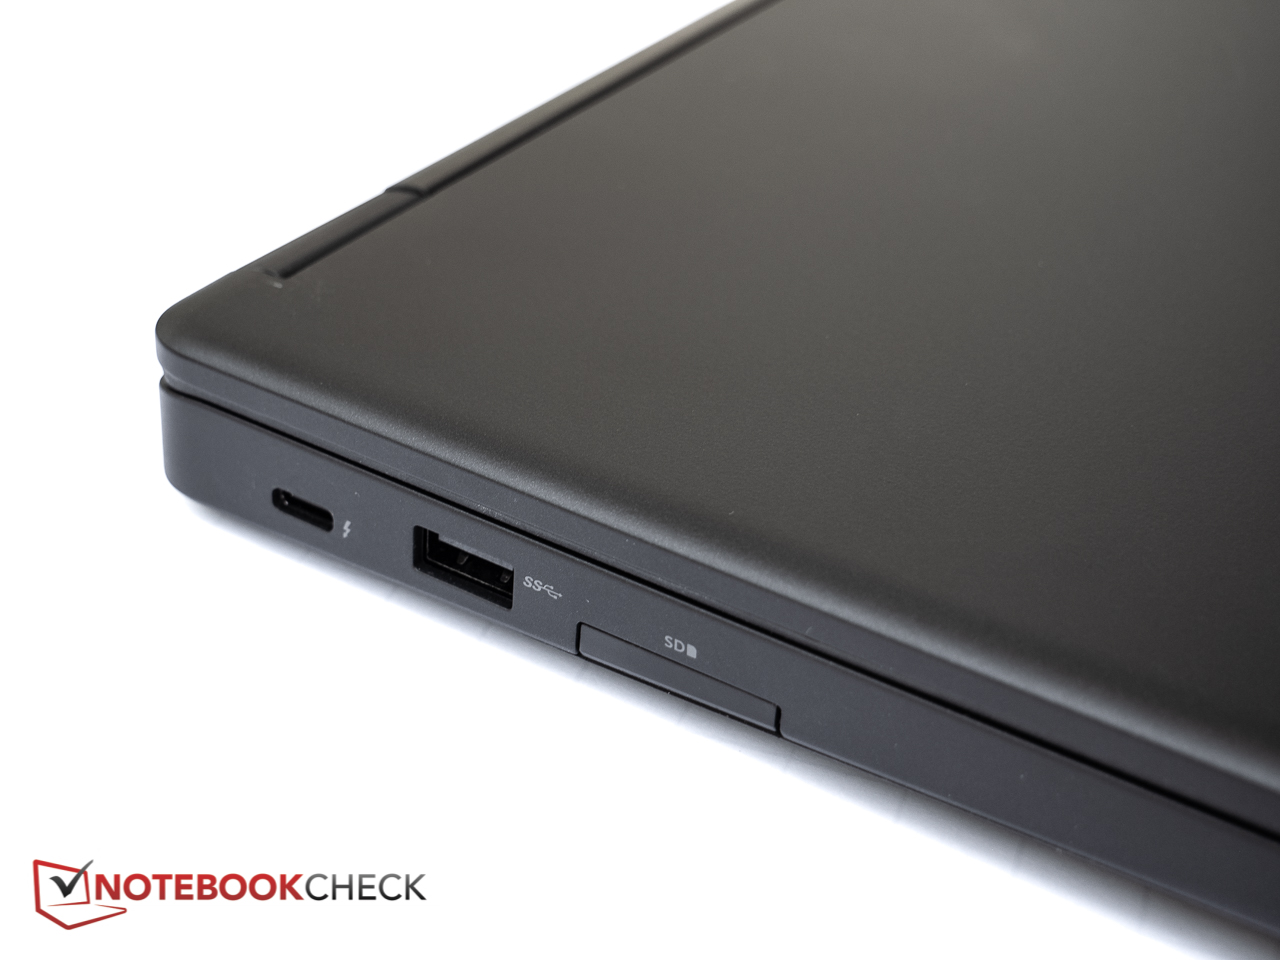
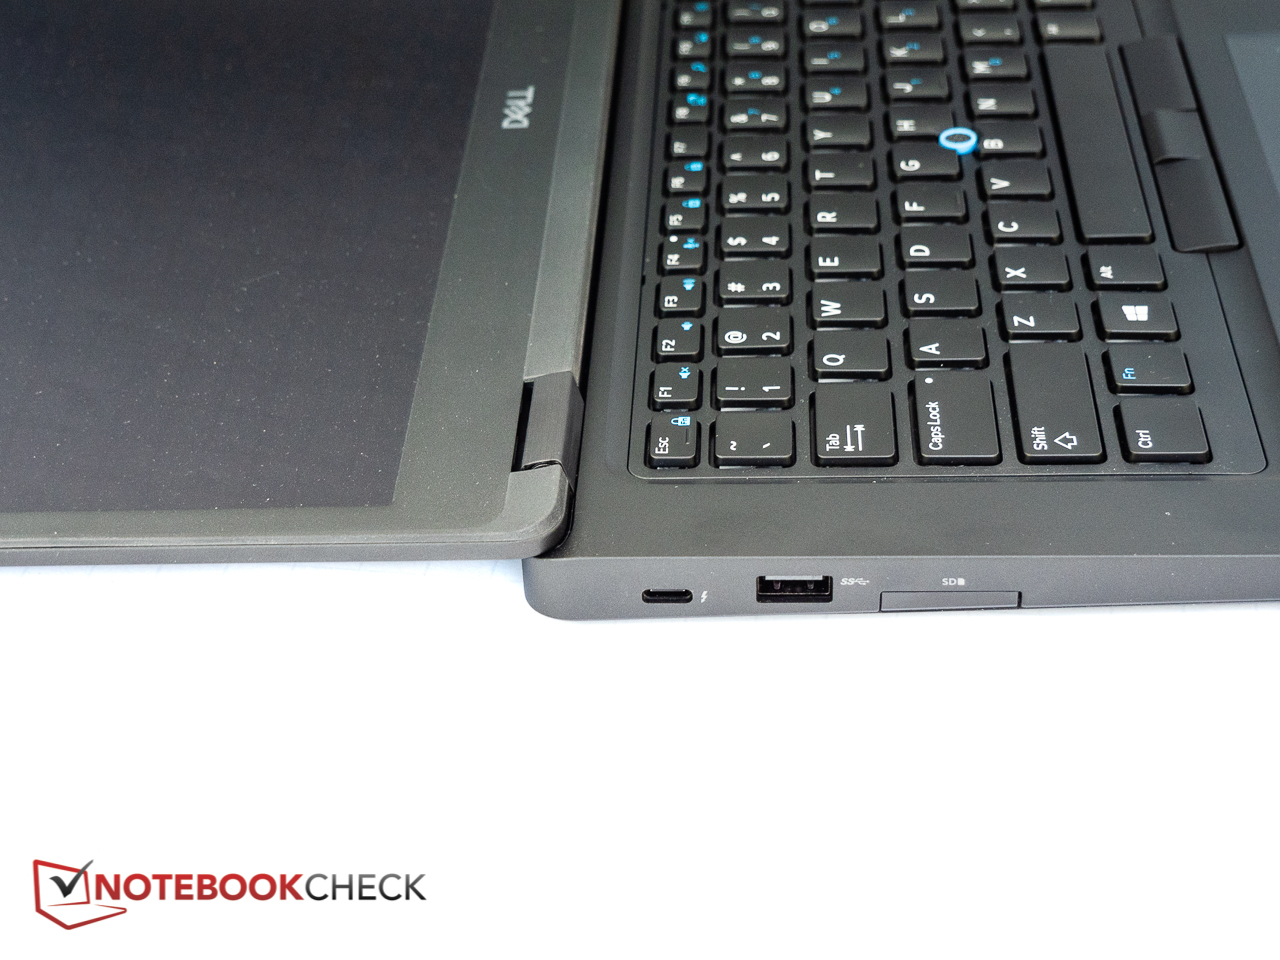
Unlike our previous test unit, which featured an USB Type-C port with DisplayPort support, our particular version of the 5491 comes with the optional Thunderbolt 3 port instead and thus supports connected accessories at speeds of up to 40 Gbit/s. As far as the remaining physical ports are concerned, the two laptops are identical.
SD Card Reader
SD card performance is top notch: AS SSD attests transfer speeds of 213 MB/s and copying 1 GB of jpeg files to the desktop takes just six seconds. As always, we use a Toshiba Exceria Pro SDXC 64 GB UHS-II reference card for our tests.
| SD Card Reader | |
| average JPG Copy Test (av. of 3 runs) | |
| Dell Latitude 5491 (Toshiba Exceria Pro SDXC 64 GB UHS-II) | |
| Acer TravelMate P648-G2-M-73T0 (Toshiba Exceria Pro SDXC 64 GB UHS-II) | |
| Lenovo ThinkPad T480-20L6S01V00 (Toshiba Exceria Pro SDXC 64 GB UHS-II) | |
| Lenovo ThinkPad T480s-20L8S02E00 (Toshiba Exceria Pro SDXC 64 GB UHS-II) | |
| Toshiba Tecra X40-E-10W (Toshiba Exceria Pro M501 microSDXC 64GB) | |
| Average of class Office (19.8 - 198.5, n=22, last 2 years) | |
| maximum AS SSD Seq Read Test (1GB) | |
| Dell Latitude 5491 (Toshiba Exceria Pro SDXC 64 GB UHS-II) | |
| Lenovo ThinkPad T480s-20L8S02E00 (Toshiba Exceria Pro SDXC 64 GB UHS-II) | |
| Acer TravelMate P648-G2-M-73T0 (Toshiba Exceria Pro SDXC 64 GB UHS-II) | |
| Toshiba Tecra X40-E-10W (Toshiba Exceria Pro M501 microSDXC 64GB) | |
| Lenovo ThinkPad T480-20L6S01V00 (Toshiba Exceria Pro SDXC 64 GB UHS-II) | |
| Average of class Office (27.4 - 249, n=21, last 2 years) | |
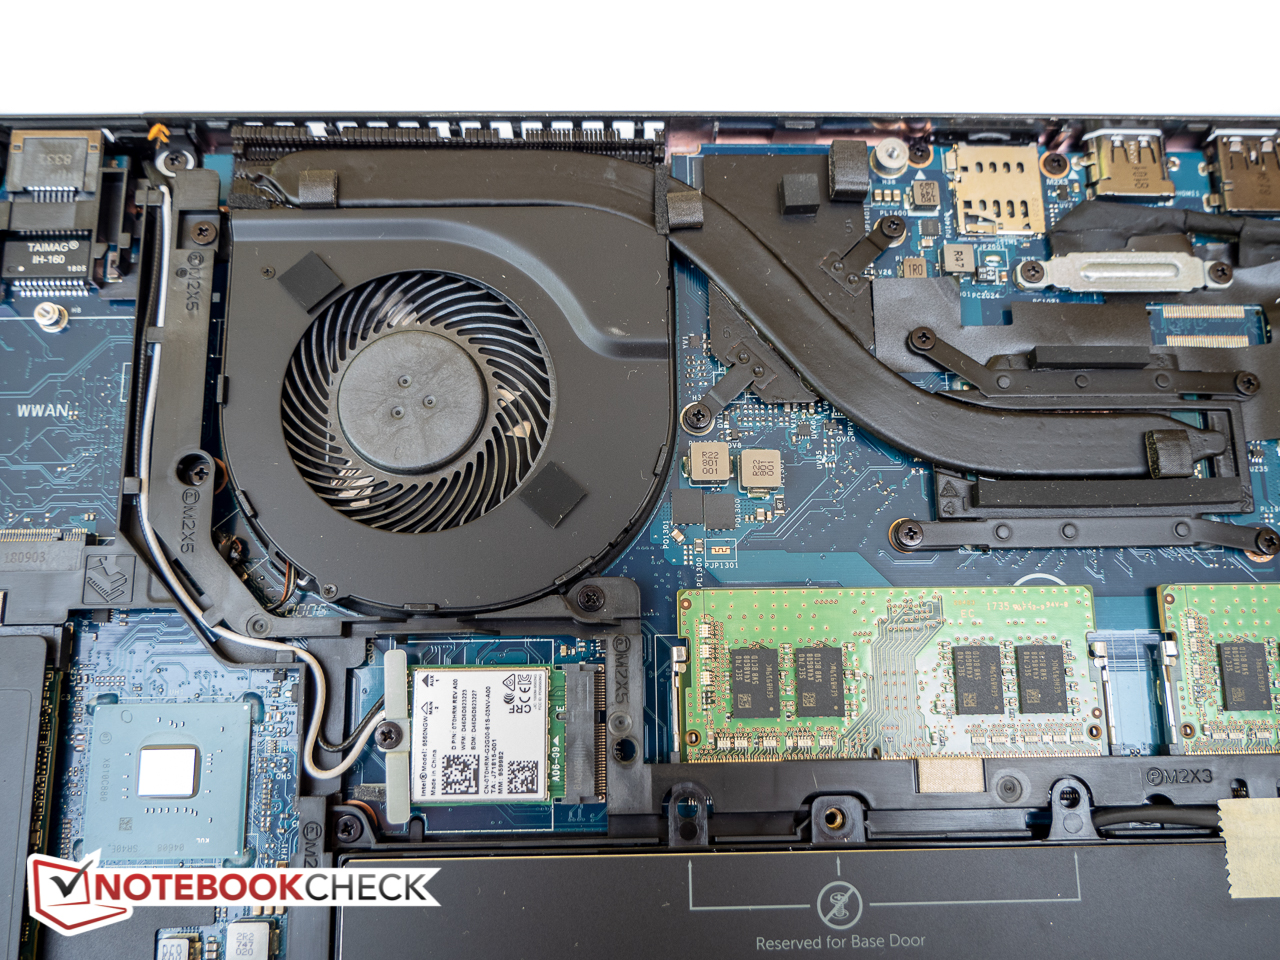
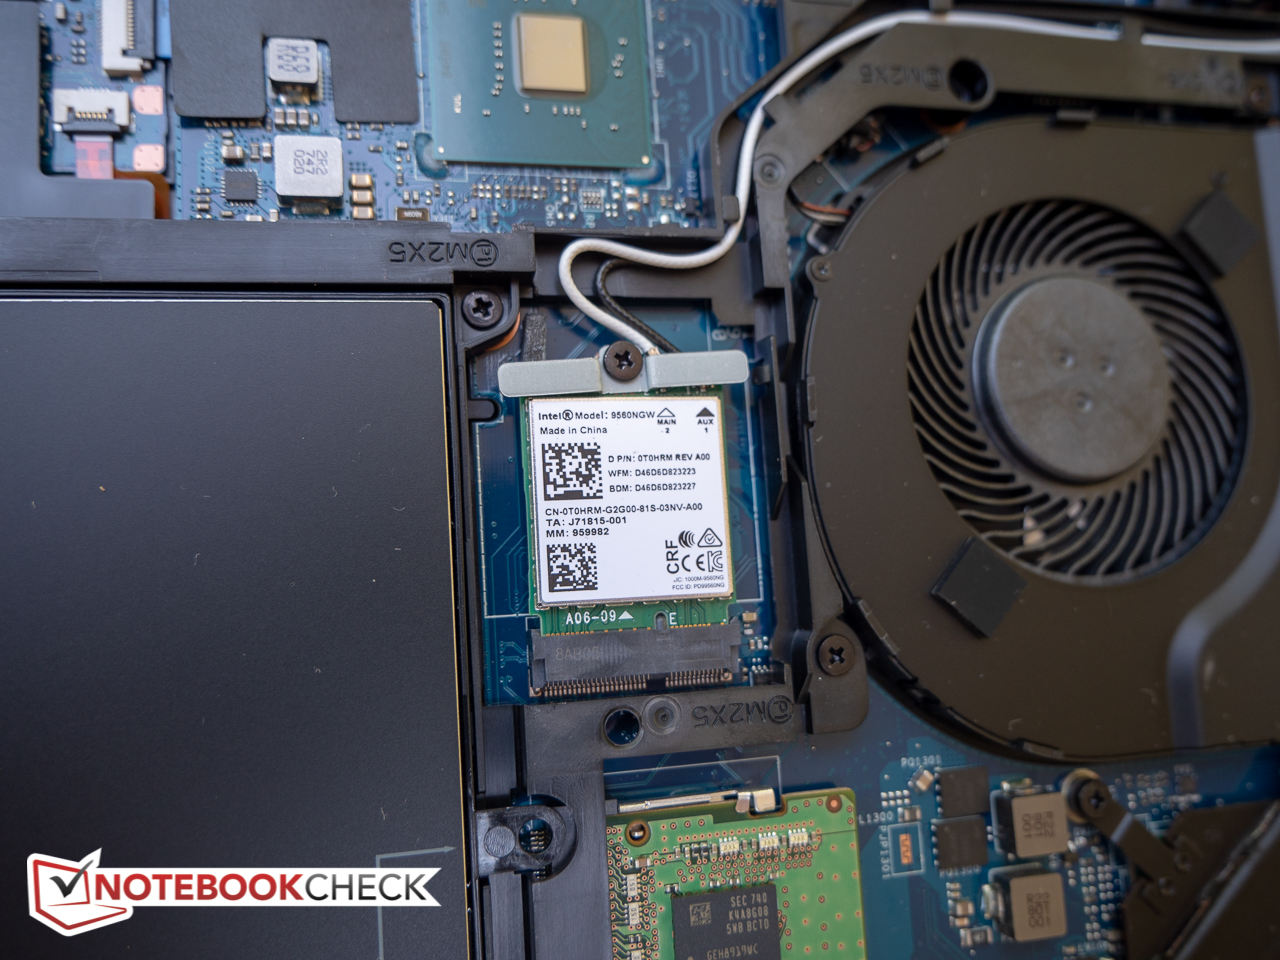
Communication
The updated Intel Dual Band Wireless AC 9560 module features a theoretical throughput of 1.73 Gbps. Transmit and receive rates one meter away from our Linksys EA8500 test router are good at about 644 and 669 MBit/s, respectively. We didn't experience any dropouts or other connectivity issues during the review period. As an added bonus, the WLAN module also supports the newer Bluetooth 5.0 standard with up to quadruple the range.
Warranty
Our Latitude comes with a 3 Year Hardware Warranty with Onsite/In-Home Service after Remote Diagnosis. An upgrade to 3 Years of ProSupport with Next Business Day Onsite Service cost $70; Accidental Damage Service for the same period can be purchased for $83, which seems very reasonable. Please see our Guarantees, Return policies and Warranties FAQ for country-specific information.
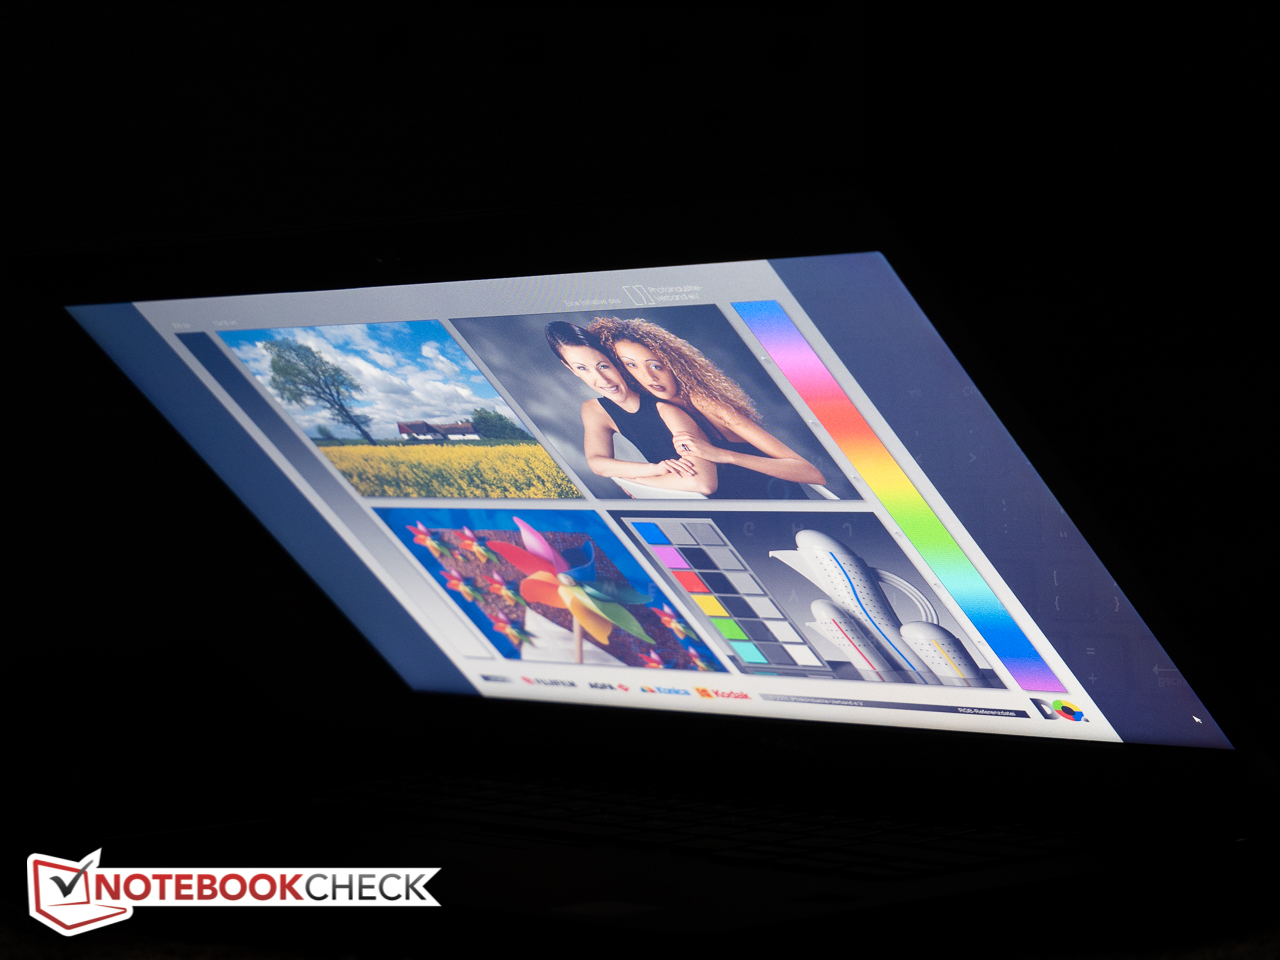
Display
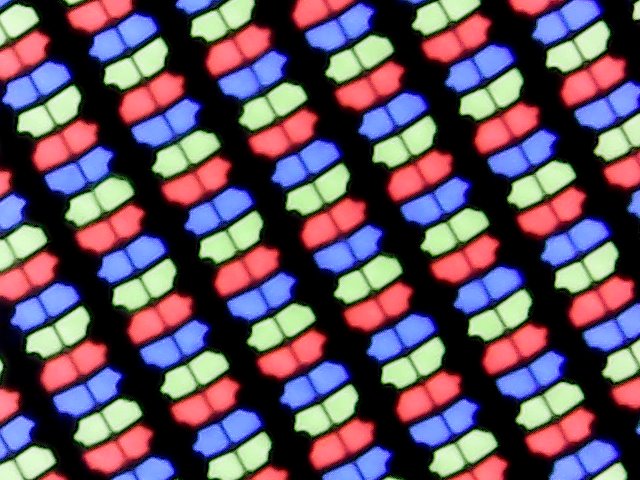
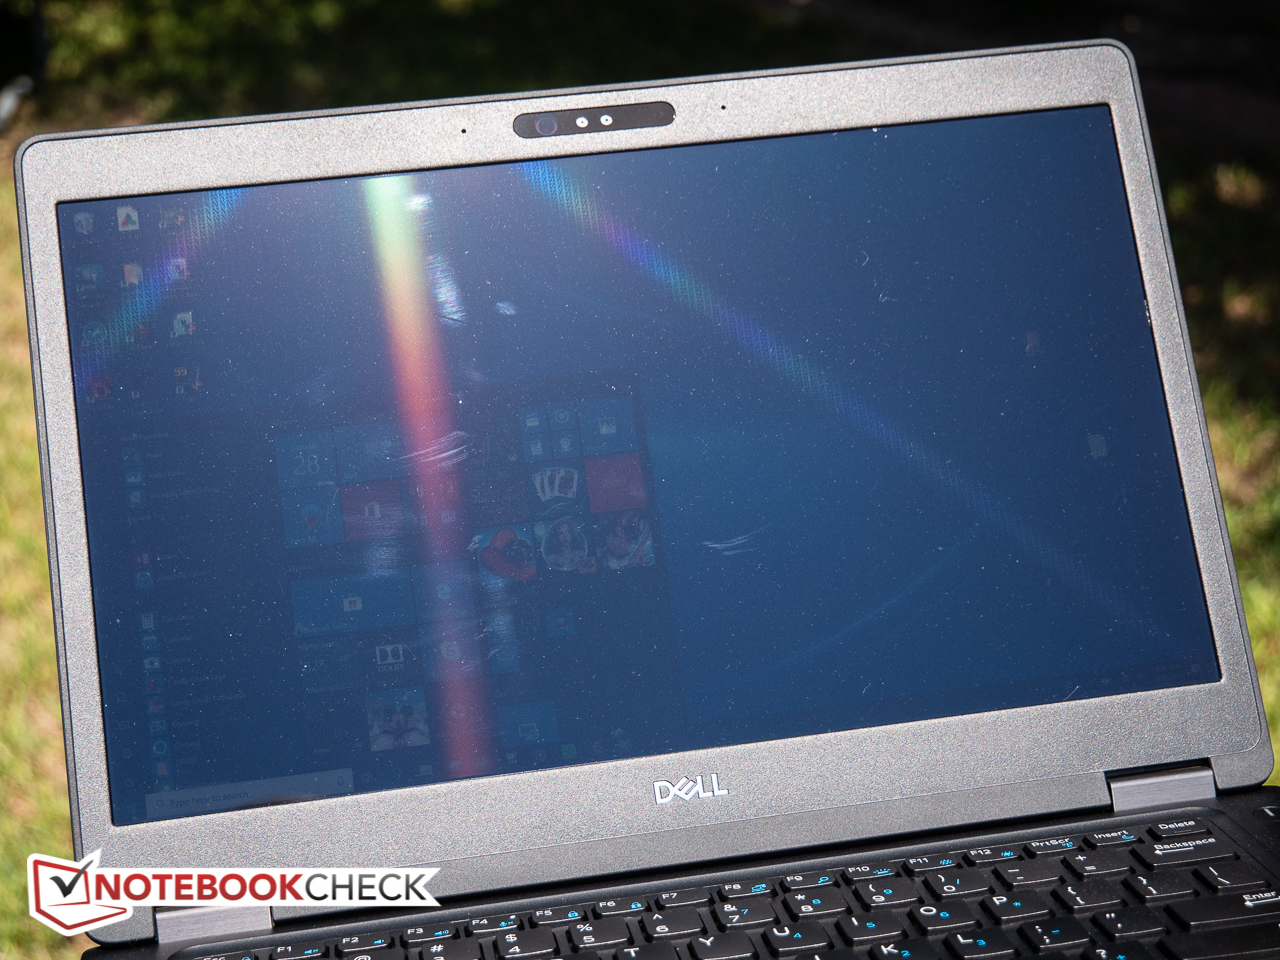
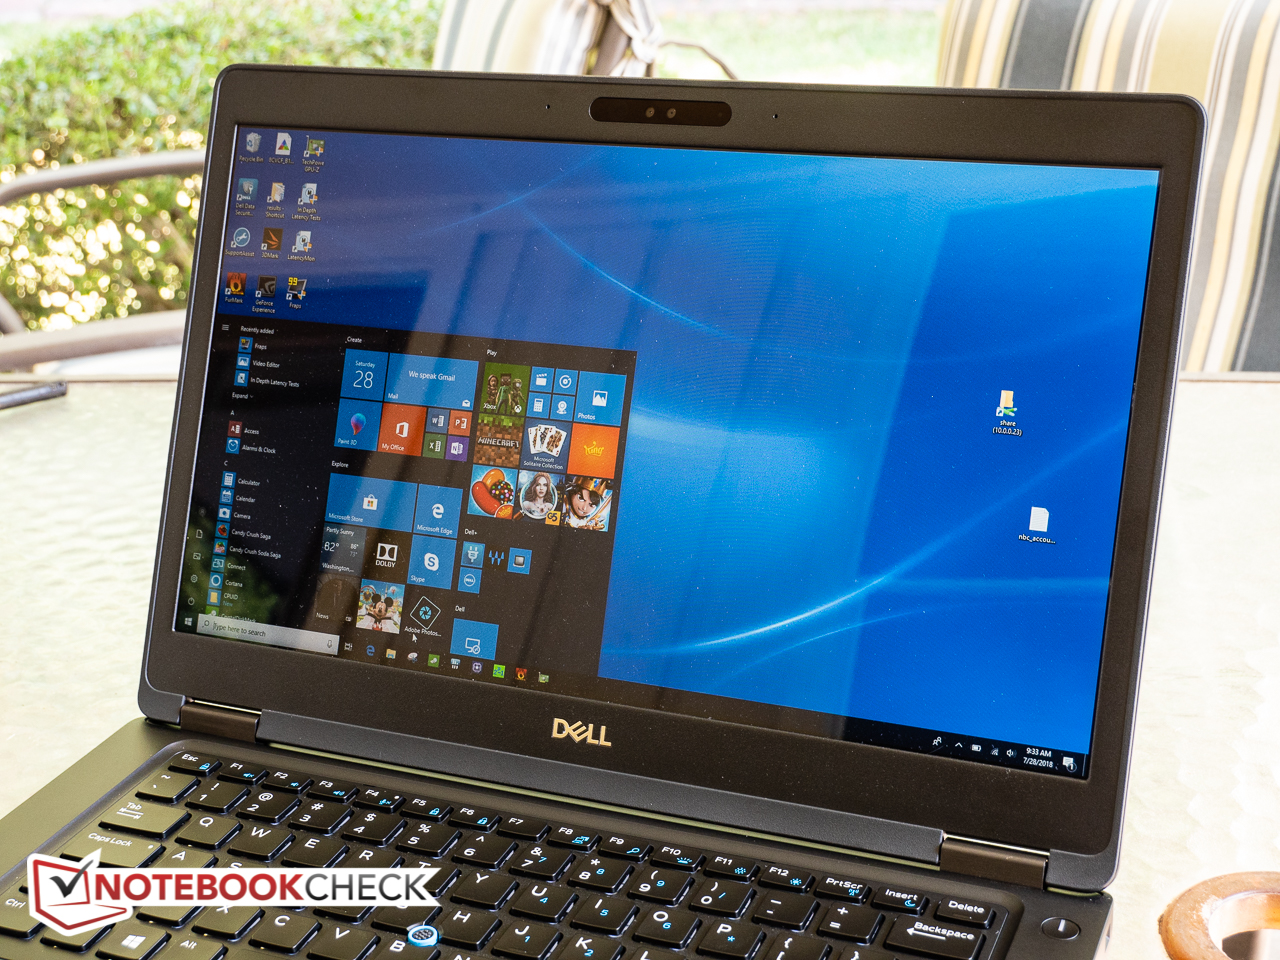
The Latitude 5491 is equipped with the same glossy touchscreen IPS display from AU Optronics (type AUO133D) as the Latitude 5490 we reviewed a couple months ago. At an average of under 200 nits, the panel is very dim - many notebooks like the ThinkPad T480 / T480s are roughly 100 nits brighter. The HP 840 G5 trounces all competitors in this regard, as its panel exceeds 600 nits. At 82 percent, the brightness distribution is rather poor as well and the right side of the panel gets brighter than the left, although that isn't a problem during normal use.
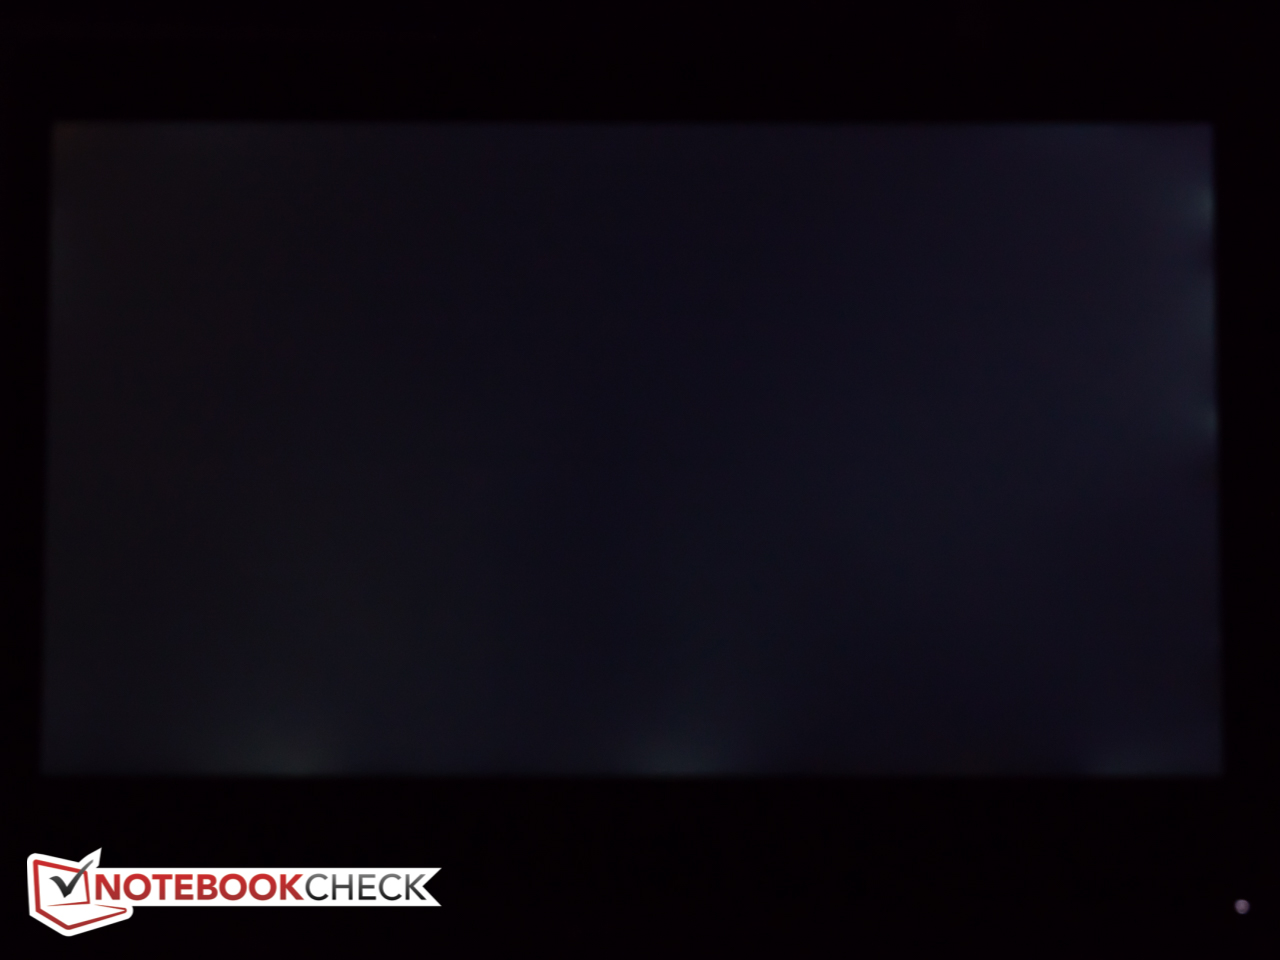
Our high-end model comes with the FHD (1920 x 1080) embedded touch display, but Dell also offers an anti-glare regular FHD panel and an anti-glare HD (1366 x 768) display. The review unit suffers from very noticeable screen bleeding, particularly on the right edge. Despite the low overall brightness, these areas are visible on black backgrounds even during the day. Dell doesn't use PWM to regulate the display brightness, so flicker-sensitive users can rest easy should they decide to purchase this notebook.
| |||||||||||||||||||||||||
Brightness Distribution: 82 %
Center on Battery: 189.4 cd/m²
Contrast: 947:1 (Black: 0.2 cd/m²)
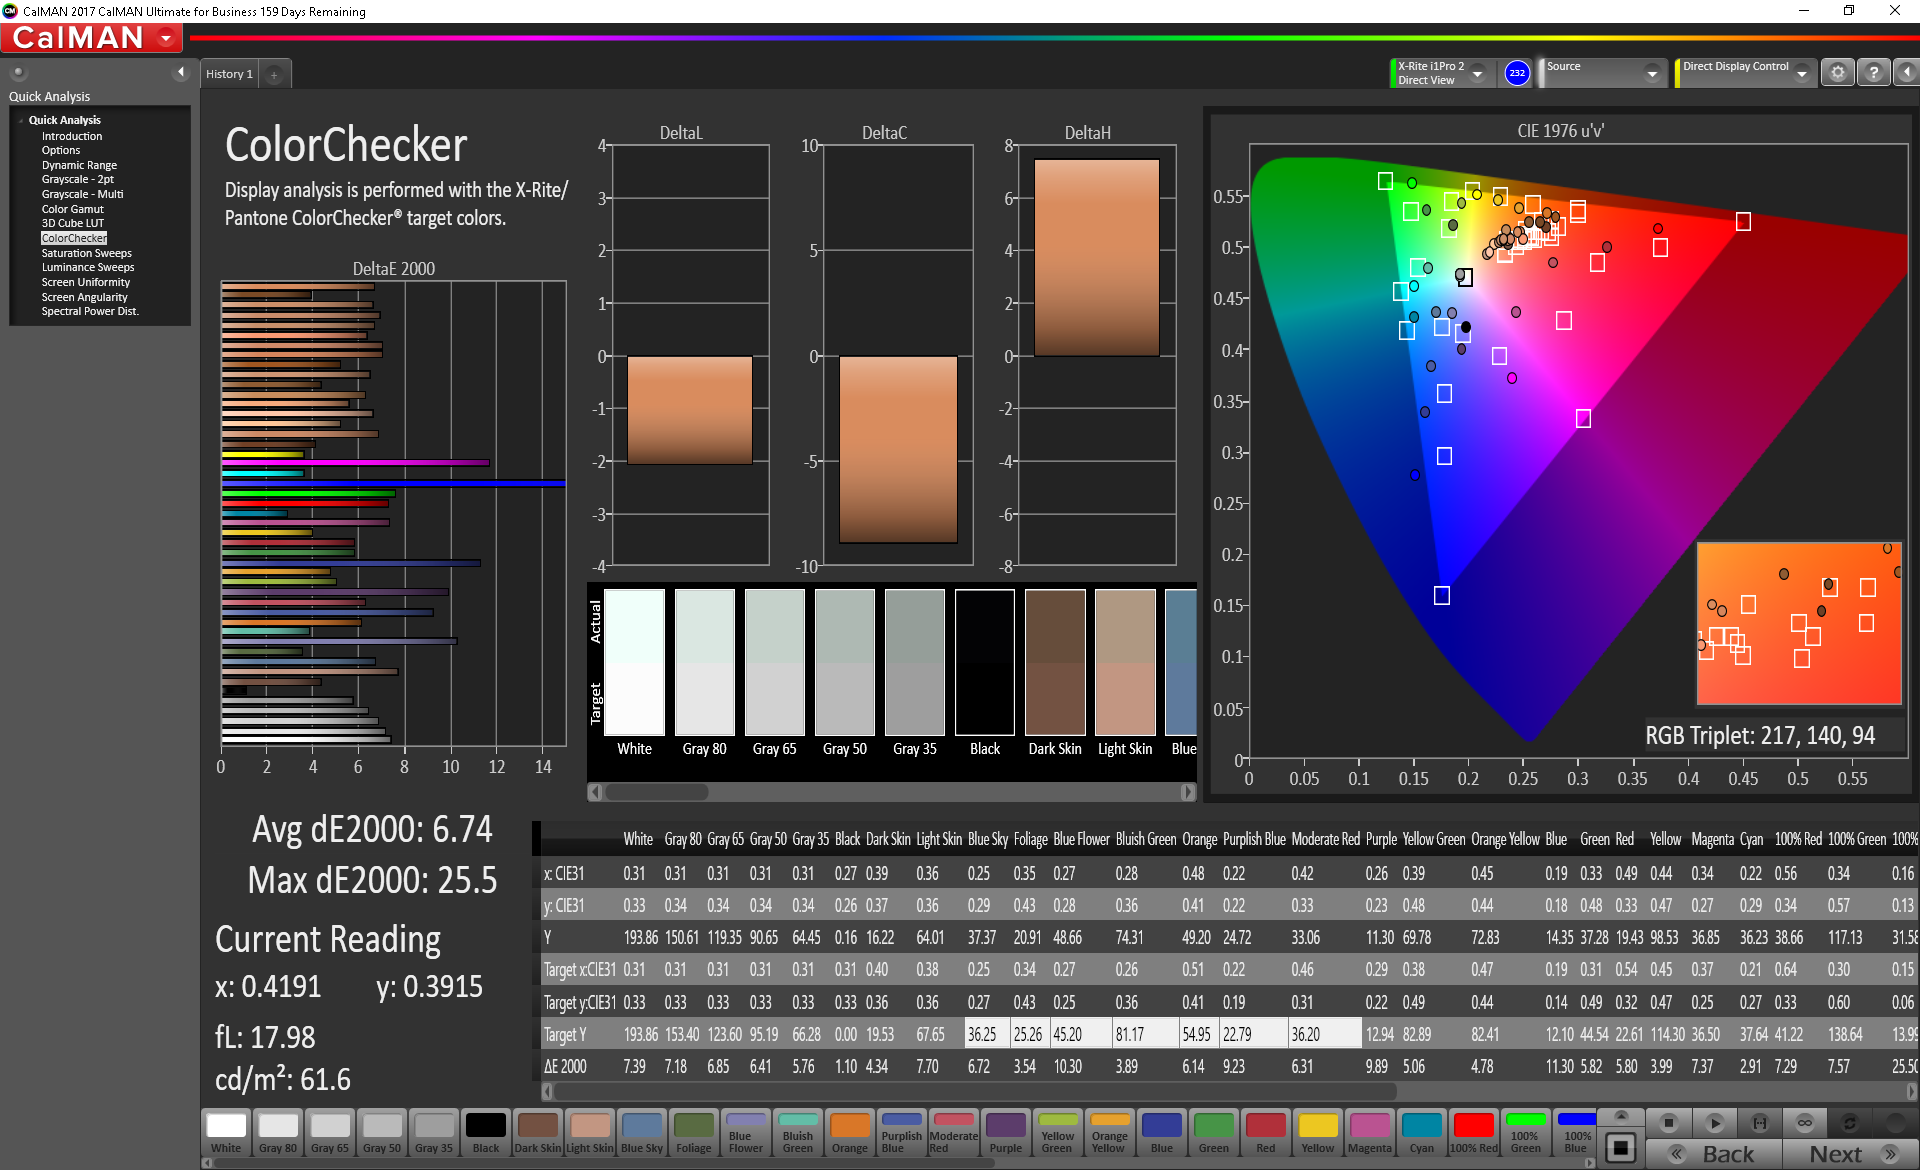
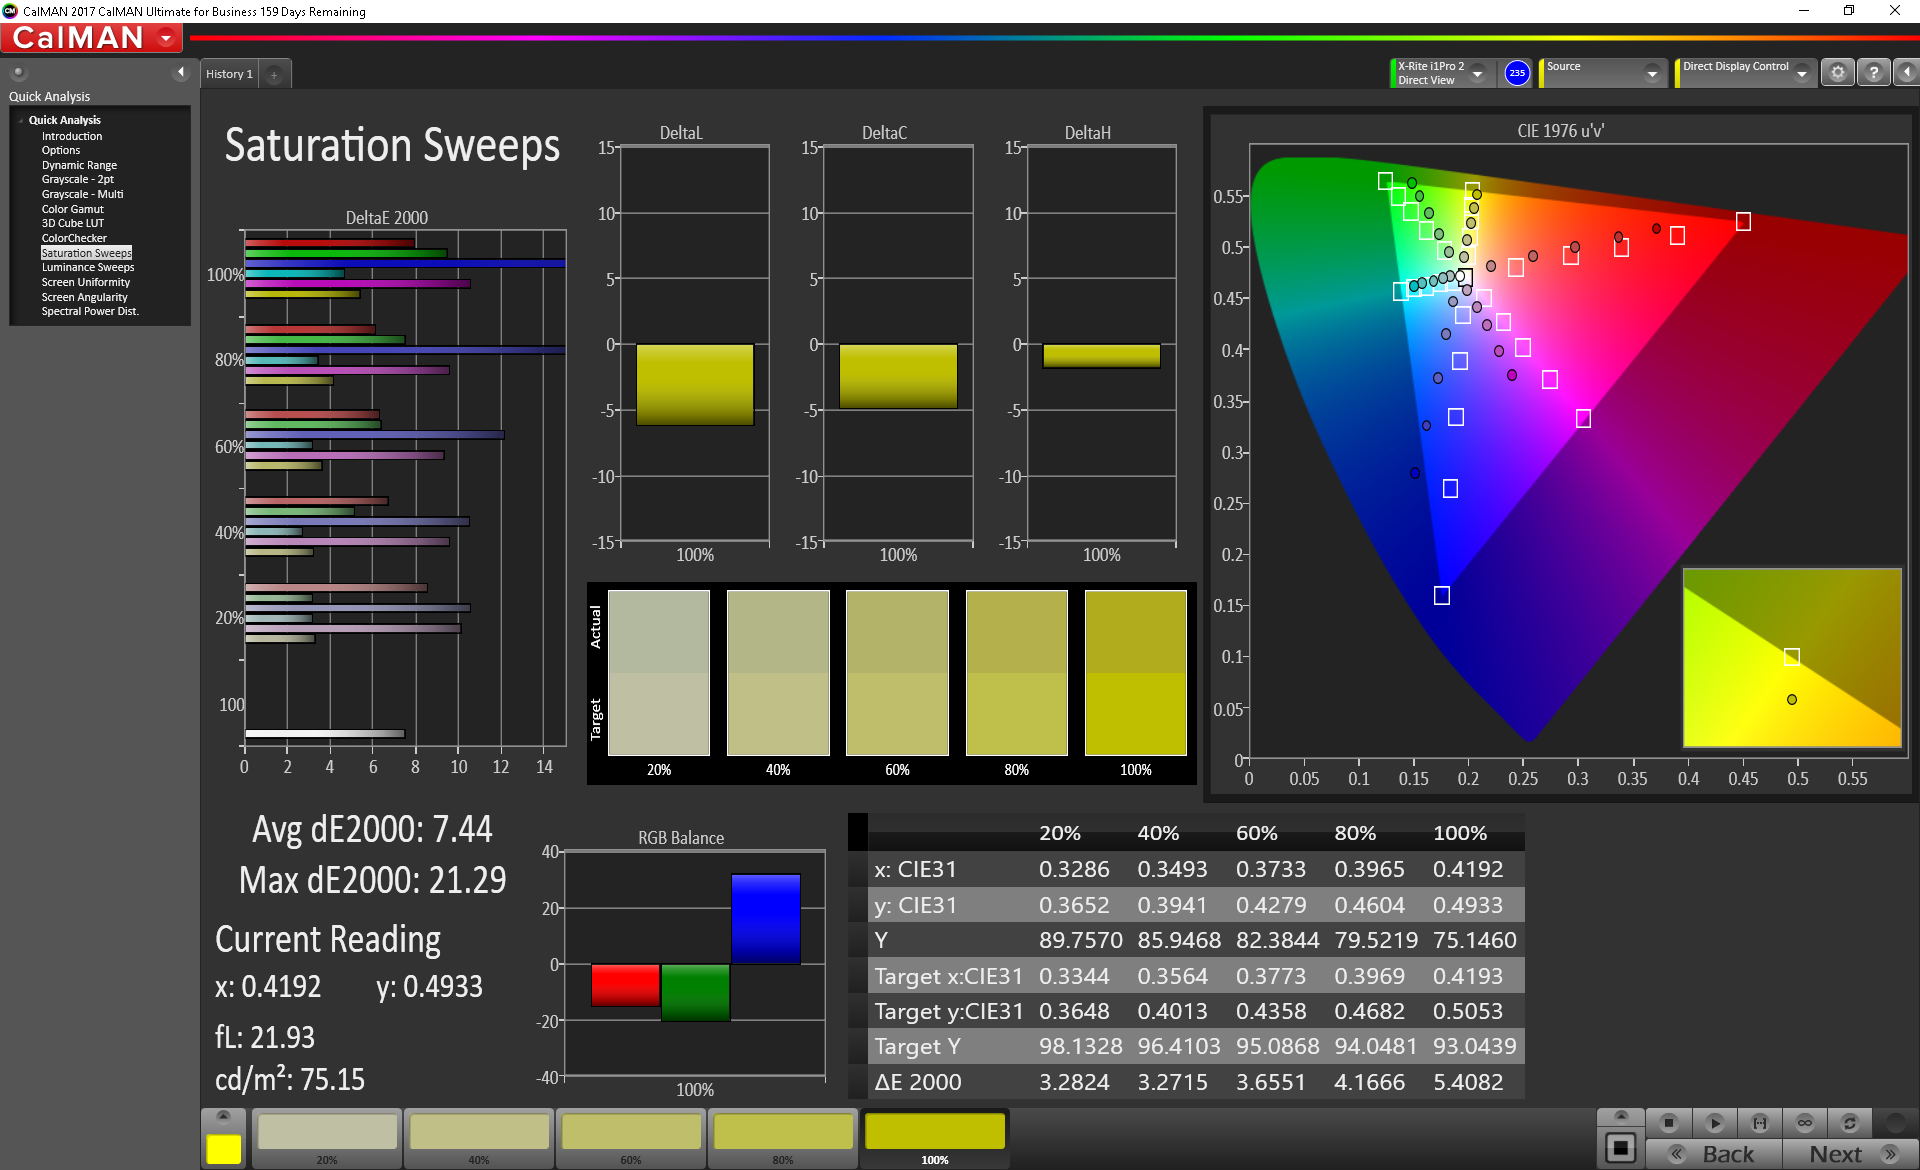
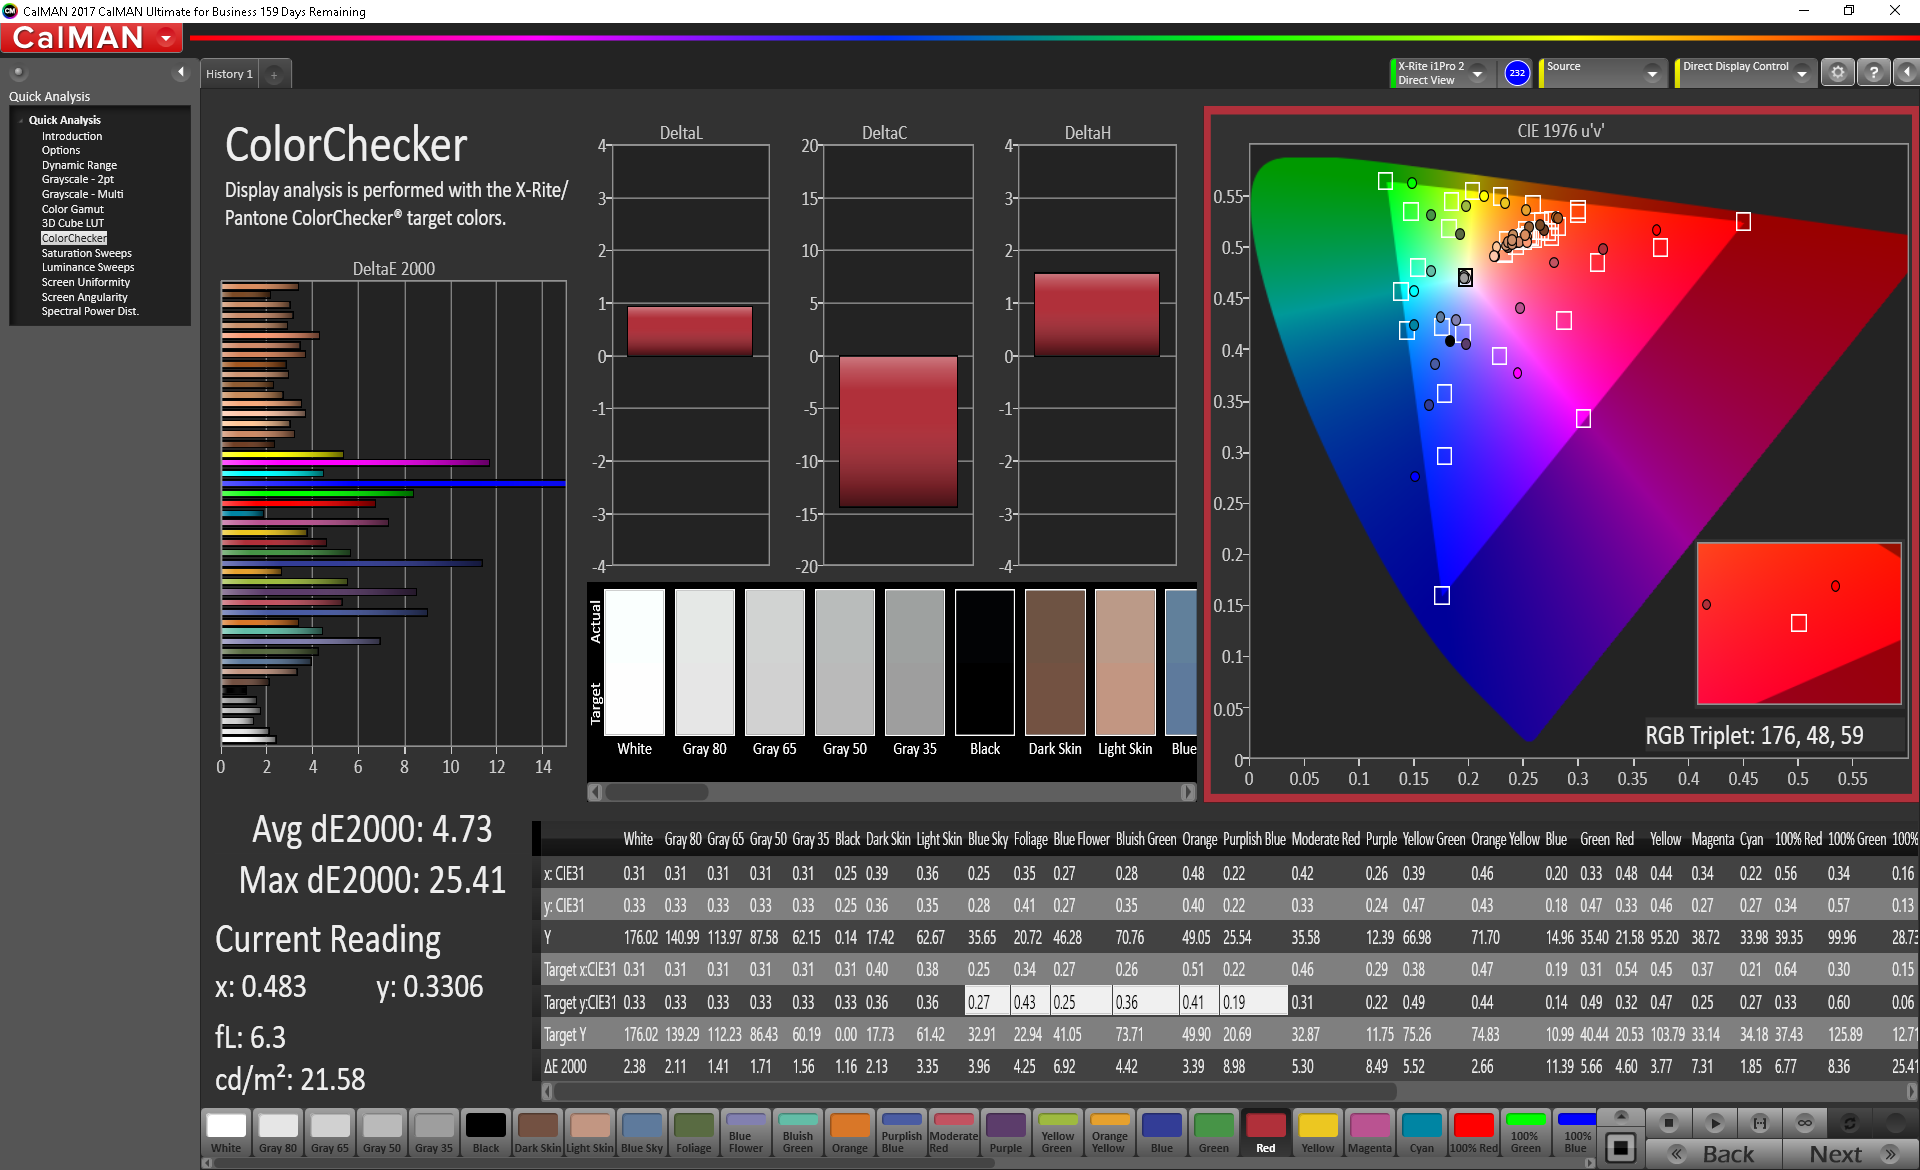
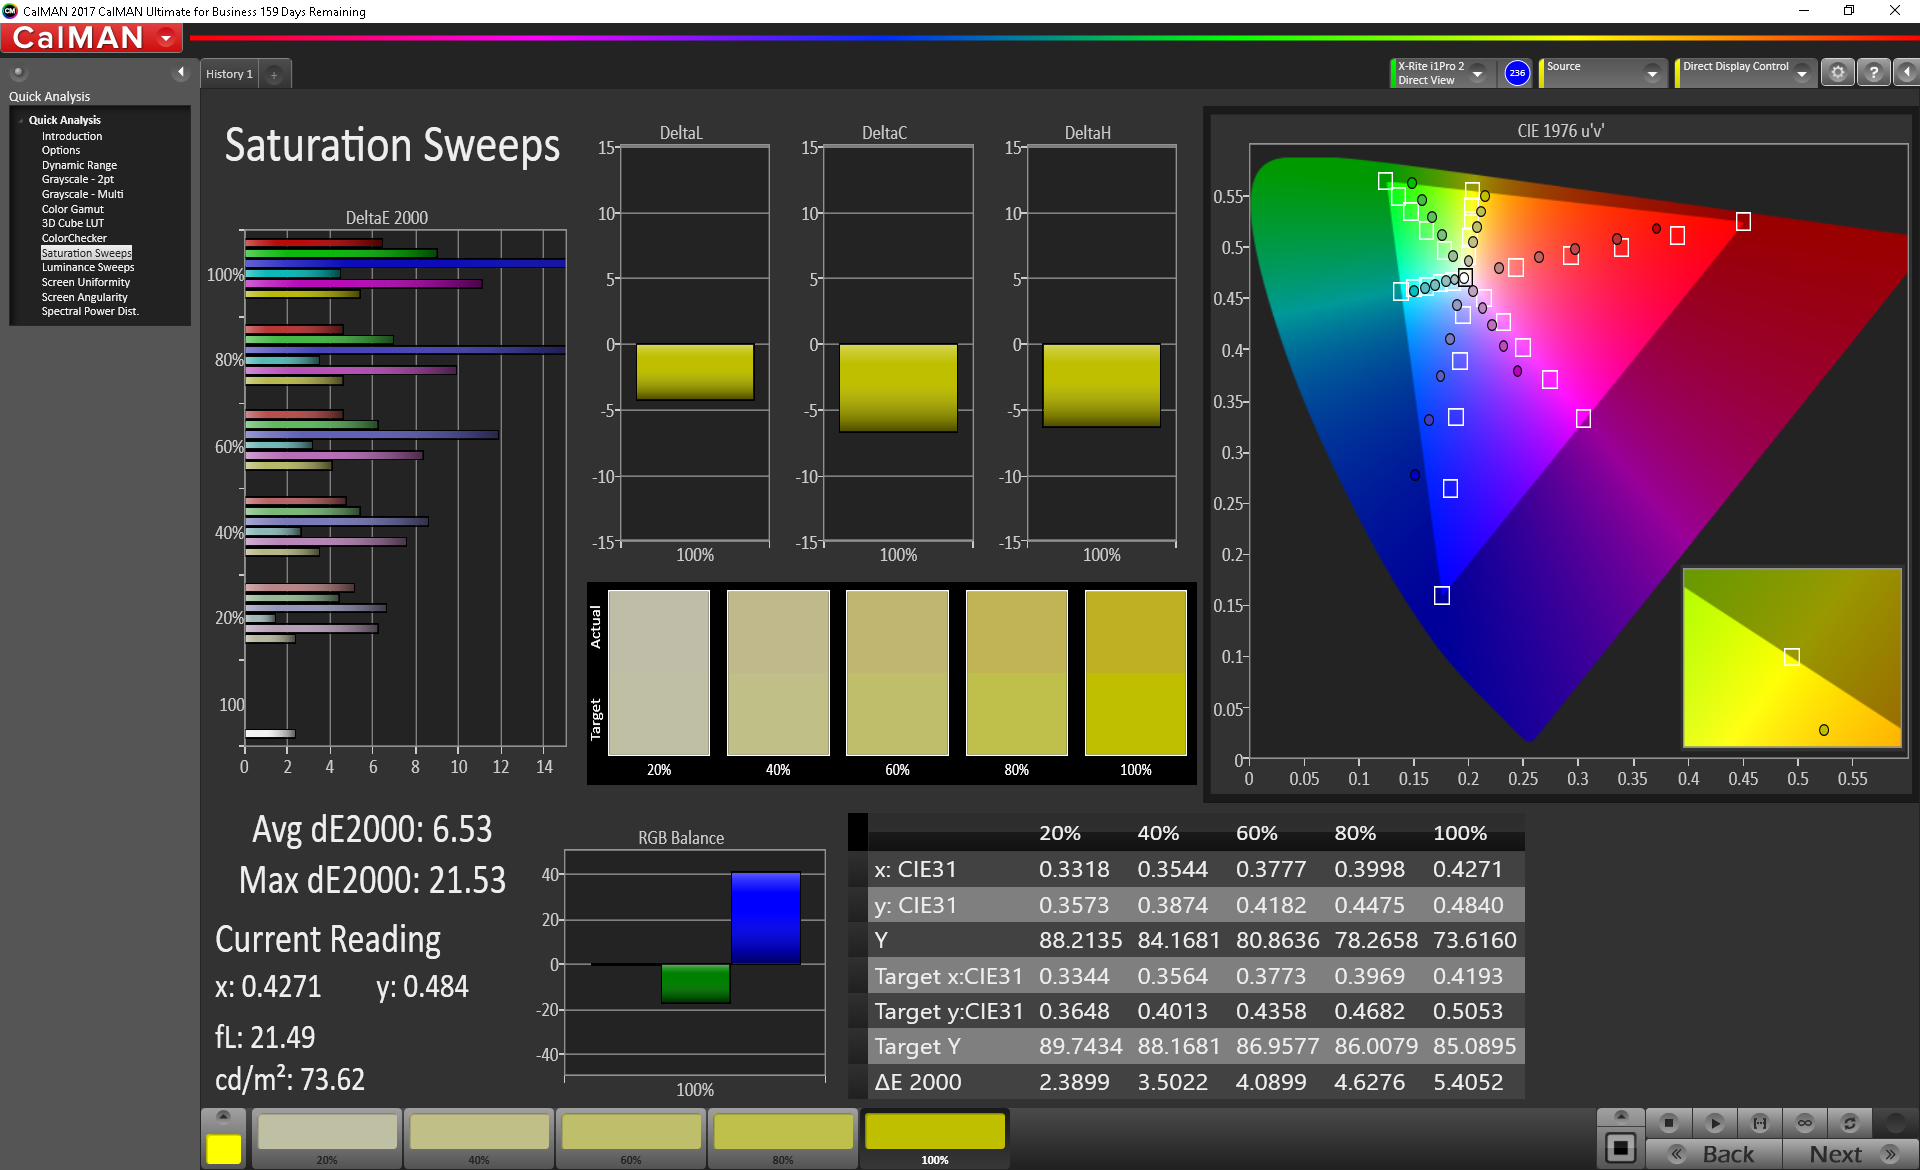
ΔE ColorChecker Calman: 6.74 | ∀{0.5-29.43 Ø4.71}
calibrated: 4.73
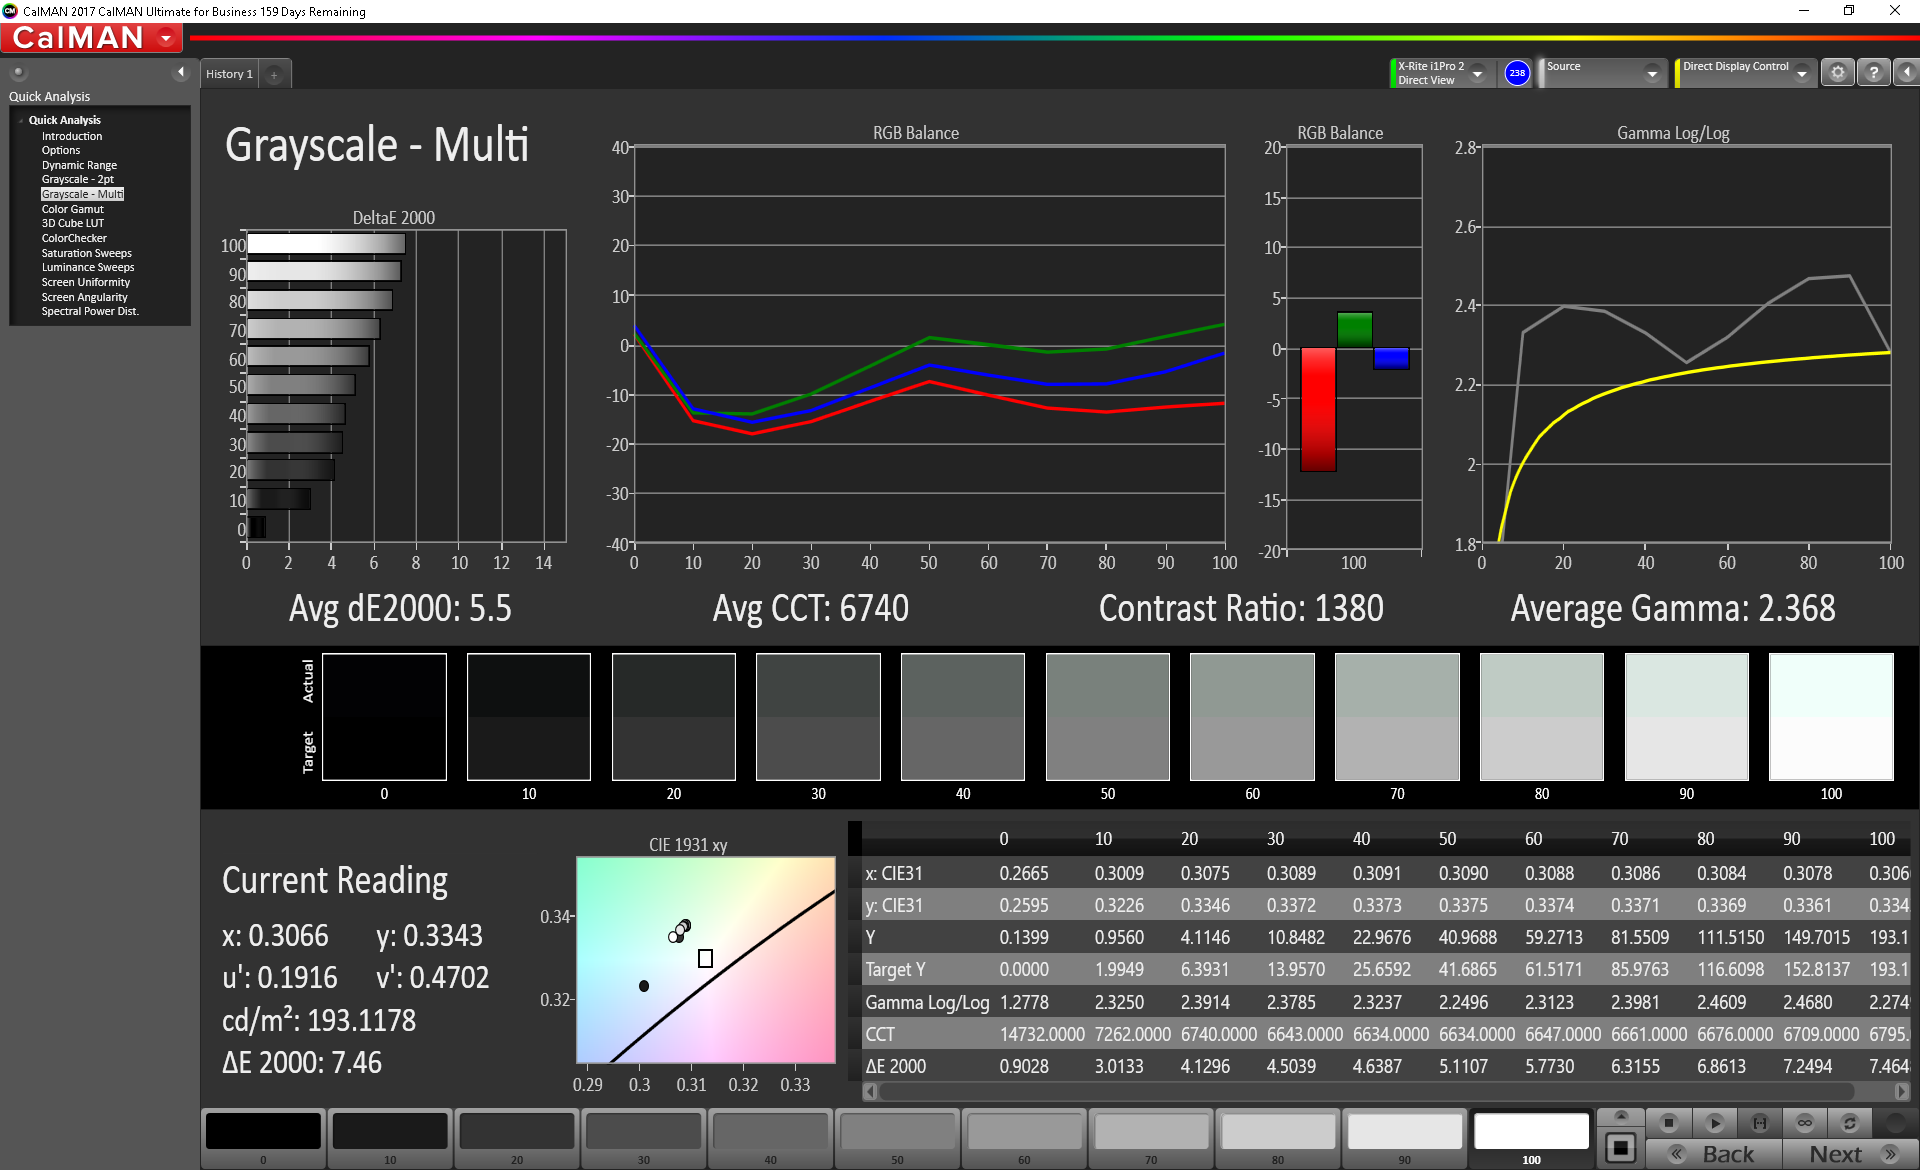
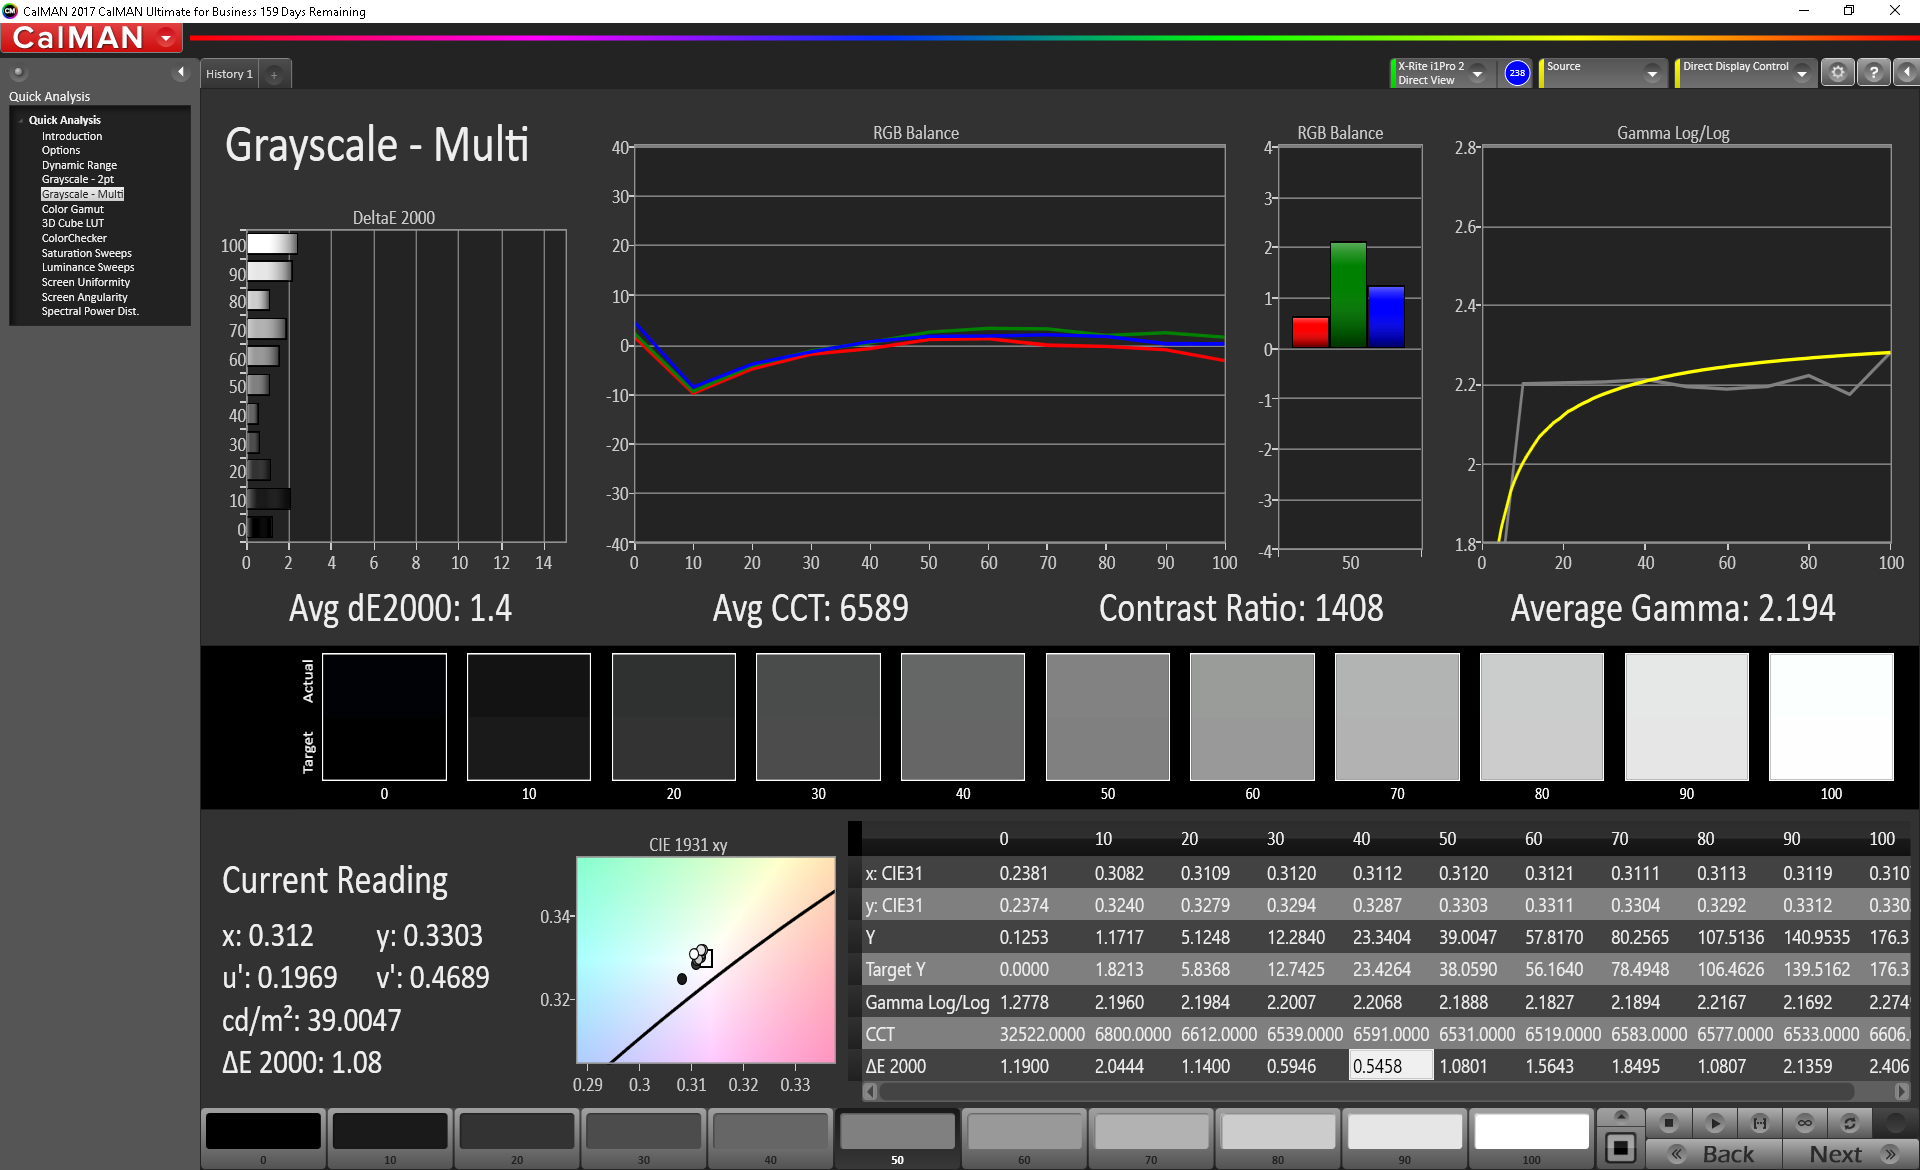
ΔE Greyscale Calman: 5.5 | ∀{0.09-98 Ø4.96}
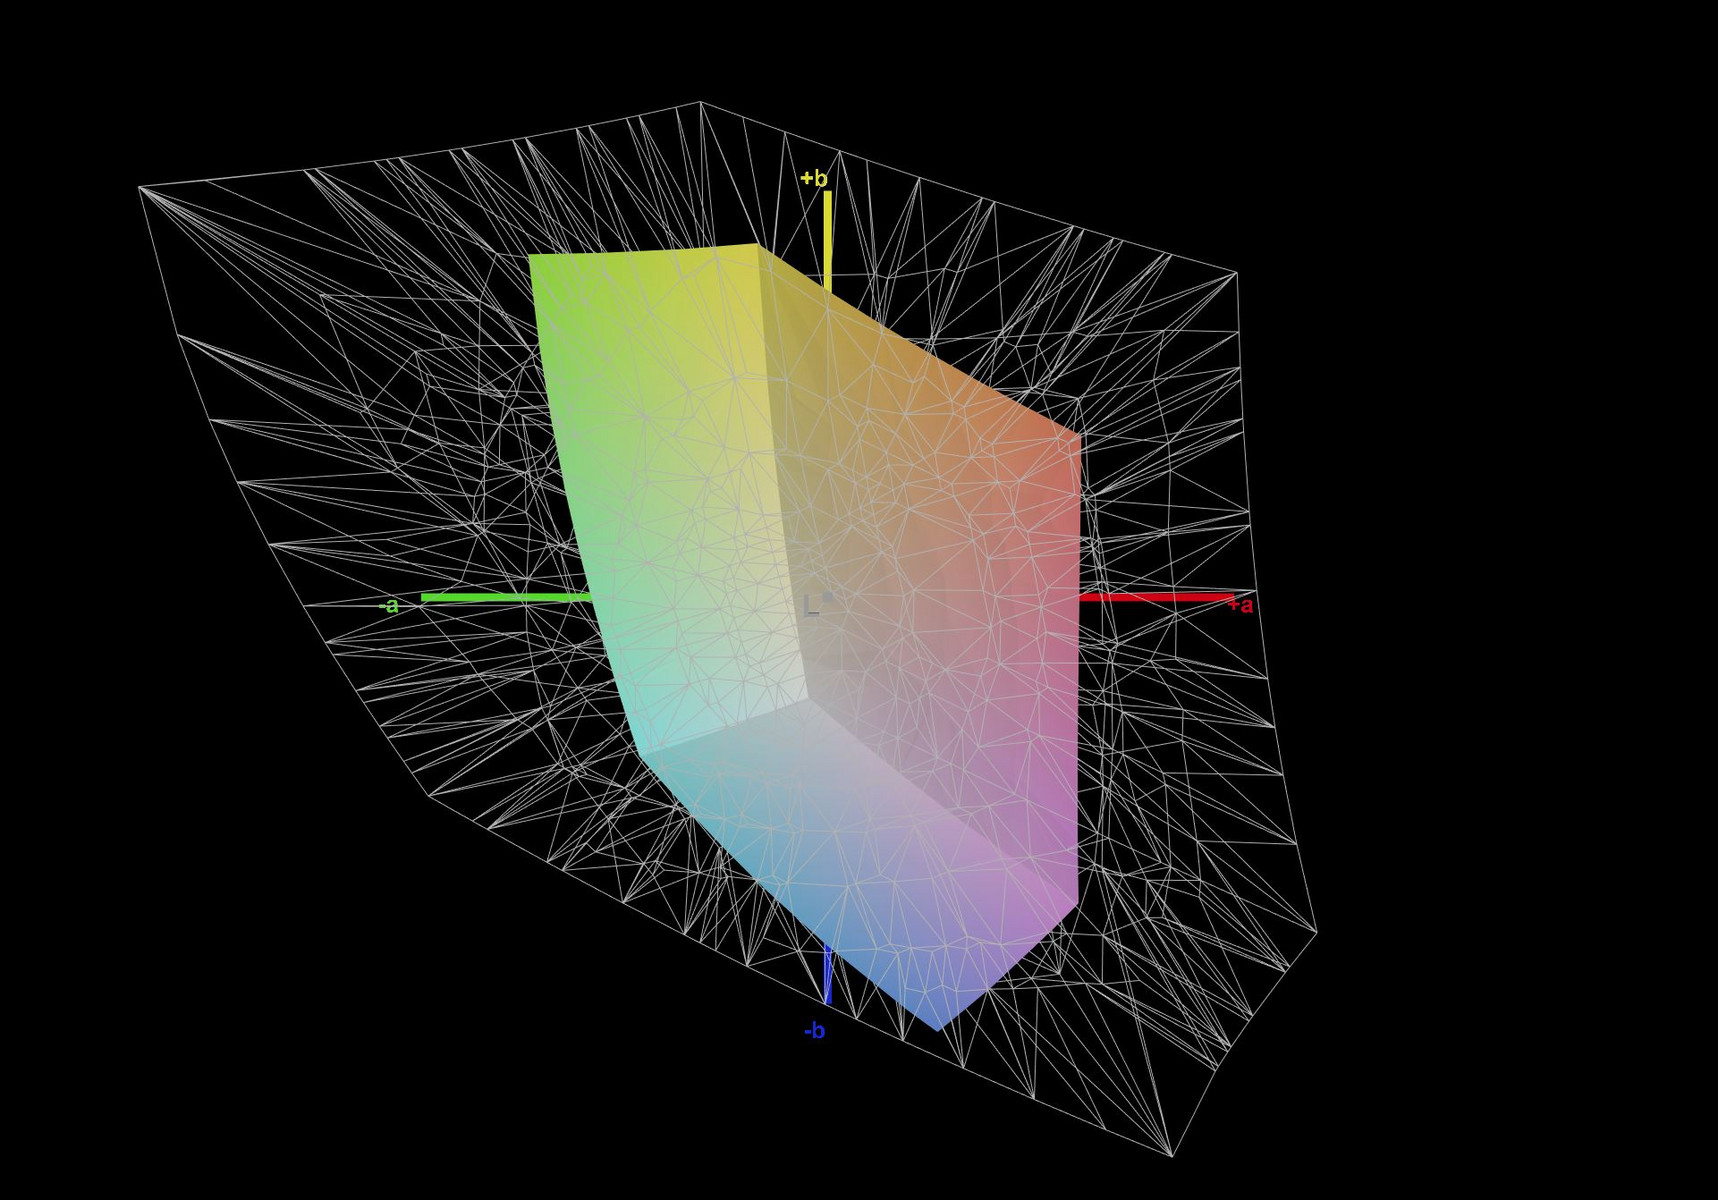
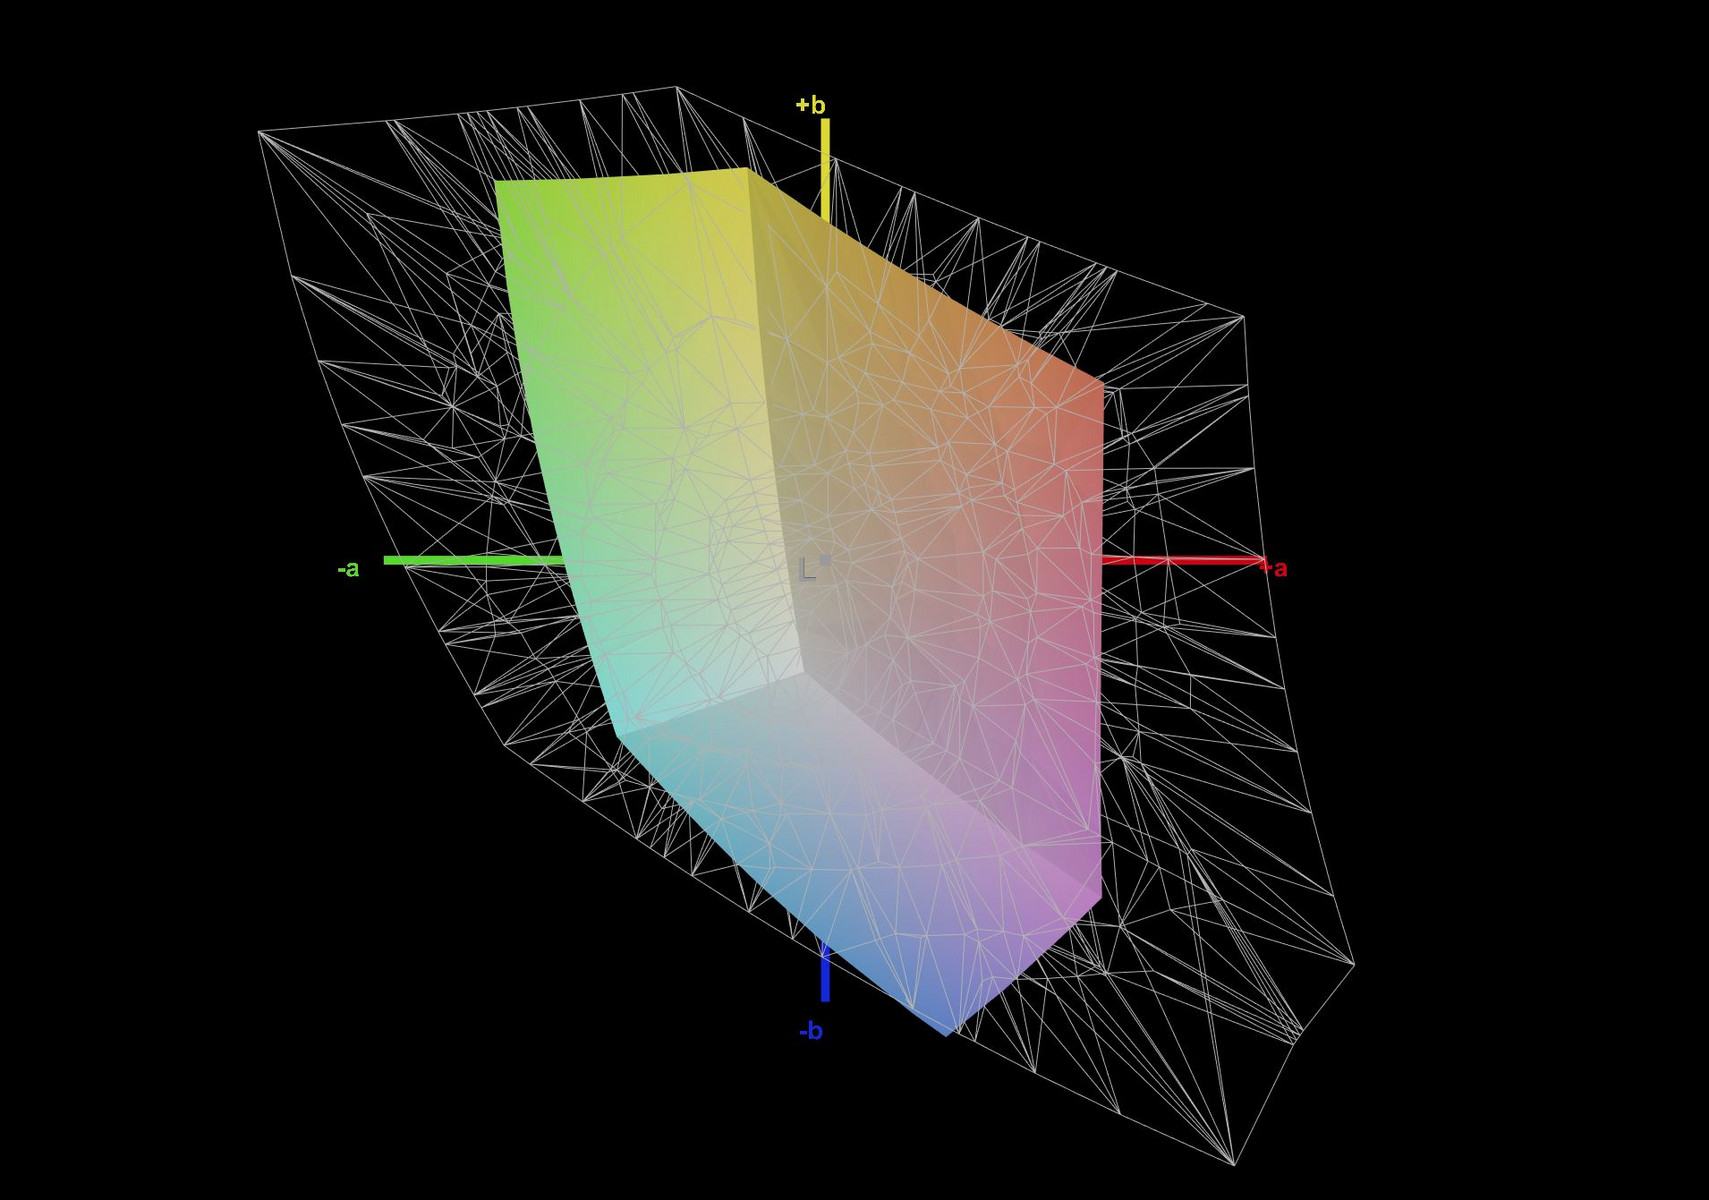
53.8% sRGB (Argyll 1.6.3 3D)
37% AdobeRGB 1998 (Argyll 1.6.3 3D)
36.96% AdobeRGB 1998 (Argyll 3D)
53.8% sRGB (Argyll 3D)
35.78% Display P3 (Argyll 3D)
Gamma: 2.37
CCT: 6740 K
| Dell Latitude 5491 AU Optronics AUO133D B140HAK, IPS, 14", 1920x1080 | Lenovo ThinkPad T480s-20L8S02E00 LP140QH2-SPB1, IPS LED, 14", 2560x1440 | Toshiba Tecra X40-E-10W Toshiba TOS508F, IPS, 14", 1920x1080 | HP EliteBook 840 G5-3JX61EA IVO M140NVF7 R0, IPS, 14", 1920x1080 | Acer TravelMate P648-G2-M-73T0 IPS, 14", 1920x1080 | |
|---|---|---|---|---|---|
| Display | 92% | 13% | 67% | 79% | |
| Display P3 Coverage (%) | 35.78 | 71.4 100% | 40.55 13% | 61 70% | 67.2 88% |
| sRGB Coverage (%) | 53.8 | 96.6 80% | 61 13% | 87.7 63% | 90.8 69% |
| AdobeRGB 1998 Coverage (%) | 36.96 | 72.1 95% | 41.9 13% | 62.1 68% | 66.4 80% |
| Response Times | 4% | 33% | 11% | 7% | |
| Response Time Grey 50% / Grey 80% * (ms) | 38.4 ? | 36 ? 6% | 22 ? 43% | 33 ? 14% | 38 ? 1% |
| Response Time Black / White * (ms) | 28.4 ? | 28 ? 1% | 22 ? 23% | 26 ? 8% | 25 ? 12% |
| PWM Frequency (Hz) | 21000 ? | 3125 ? | |||
| Screen | 38% | 25% | 59% | 33% | |
| Brightness middle (cd/m²) | 189.4 | 311 64% | 266 40% | 655 246% | 275 45% |
| Brightness (cd/m²) | 196 | 302 54% | 244 24% | 630 221% | 253 29% |
| Brightness Distribution (%) | 82 | 91 11% | 86 5% | 93 13% | 85 4% |
| Black Level * (cd/m²) | 0.2 | 0.36 -80% | 0.2 -0% | 0.56 -180% | 0.25 -25% |
| Contrast (:1) | 947 | 864 -9% | 1330 40% | 1170 24% | 1100 16% |
| Colorchecker dE 2000 * | 6.74 | 3 55% | 4.61 32% | 3.27 51% | 3.49 48% |
| Colorchecker dE 2000 max. * | 25.5 | 6.1 76% | 7.46 71% | 5.92 77% | 6.77 73% |
| Colorchecker dE 2000 calibrated * | 4.73 | 1.7 64% | 3.22 32% | ||
| Greyscale dE 2000 * | 5.5 | 4 27% | 4.31 22% | 2.85 48% | 4.91 11% |
| Gamma | 2.37 93% | 2.17 101% | 2.54 87% | 2.45 90% | 2.39 92% |
| CCT | 6740 96% | 6961 93% | 6848 95% | 6065 107% | 6271 104% |
| Color Space (Percent of AdobeRGB 1998) (%) | 37 | 66.7 80% | 39 5% | 57 54% | 59 59% |
| Color Space (Percent of sRGB) (%) | 53.8 | 96.7 80% | 61 13% | 88 64% | 91 69% |
| Total Average (Program / Settings) | 45% /
44% | 24% /
24% | 46% /
55% | 40% /
39% |
* ... smaller is better
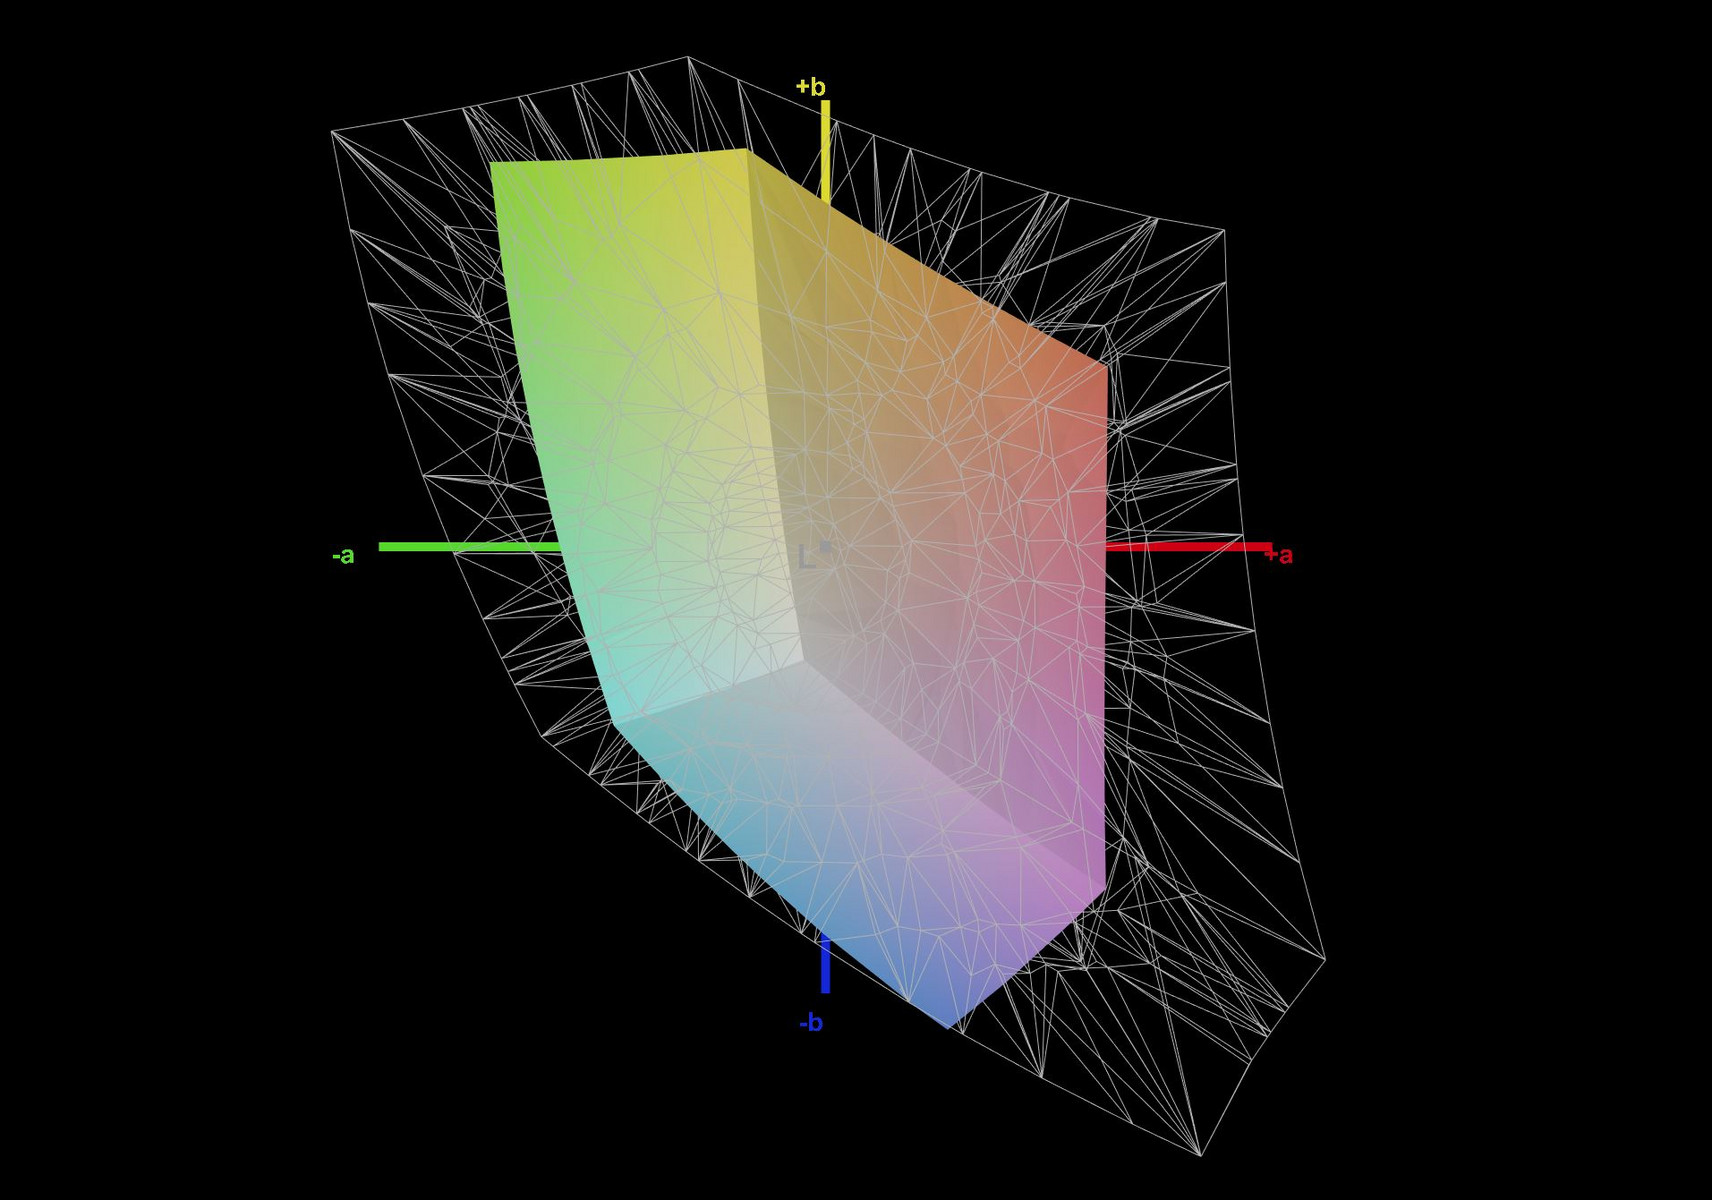
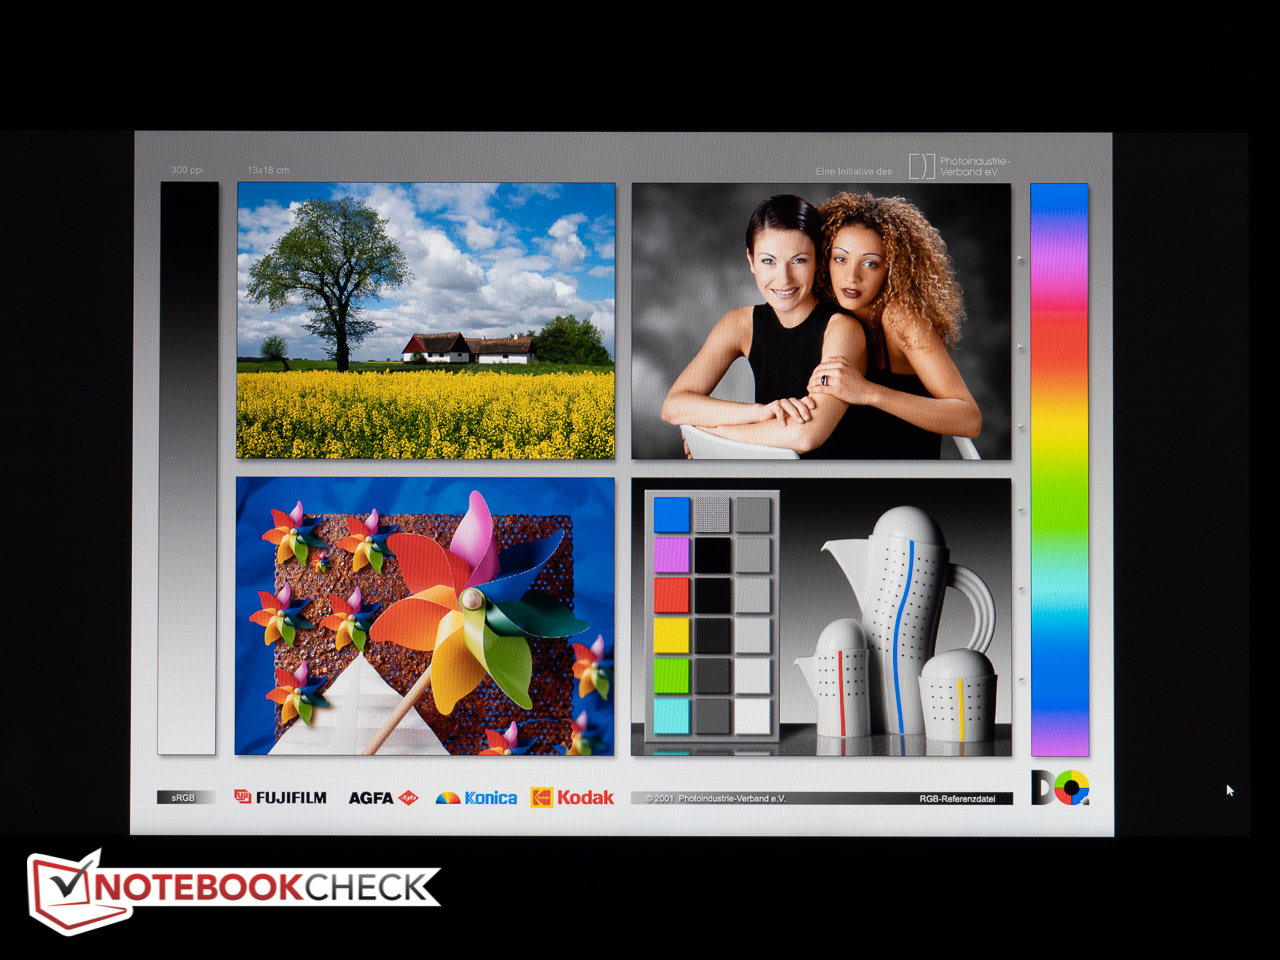
Color space coverage is very low at approximately 54 percent and 37 percent for the professional sRGB and AdobeRGB color spaces. Users interested in photo editing should opt for the Lenovo ThinkPad T480s, which reaches close to 100 percent of the sRGB color space and is therefore a much better choice for users seeking a wider gamut display.
A subsequent analysis with an X-Rite spectrophotometer reveals below average colors out of the box with an average DeltaE-deviation of over 6 and a maximum deviation of above 25 for the color blue. Our attempt to calibrate the display did little to improve the color accuracy, as the average DeltaE decreases by just a point. Grayscale accuracy improves by a larger margin with the DeltaE dropping to 1.4. Still, all other notebooks in our direct comparison offer better color and grayscale accuracy, which is disappointing given the high price point of our test unit. The aforementioned ThinkPad T480s is once again the best choice for aspiring digital artists.
Display Response Times
| ↔ Response Time Black to White | ||
|---|---|---|
| 28.4 ms ... rise ↗ and fall ↘ combined | ↗ 16.4 ms rise | 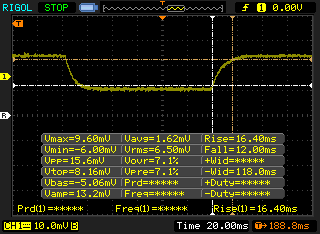 |
| ↘ 12 ms fall | ||
| The screen shows relatively slow response rates in our tests and may be too slow for gamers. In comparison, all tested devices range from 0.1 (minimum) to 240 (maximum) ms. » 75 % of all devices are better. This means that the measured response time is worse than the average of all tested devices (19.8 ms). | ||
| ↔ Response Time 50% Grey to 80% Grey | ||
| 38.4 ms ... rise ↗ and fall ↘ combined | ↗ 18.8 ms rise | 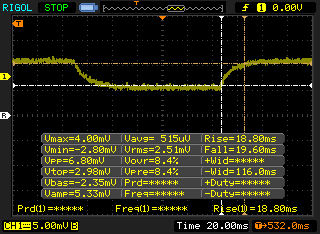 |
| ↘ 19.6 ms fall | ||
| The screen shows slow response rates in our tests and will be unsatisfactory for gamers. In comparison, all tested devices range from 0.165 (minimum) to 636 (maximum) ms. » 58 % of all devices are better. This means that the measured response time is worse than the average of all tested devices (30.9 ms). | ||
Screen Flickering / PWM (Pulse-Width Modulation)
| Screen flickering / PWM not detected | 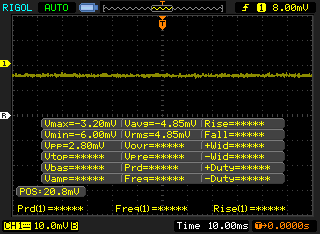 | ||
In comparison: 52 % of all tested devices do not use PWM to dim the display. If PWM was detected, an average of 7741 (minimum: 5 - maximum: 343500) Hz was measured. | |||
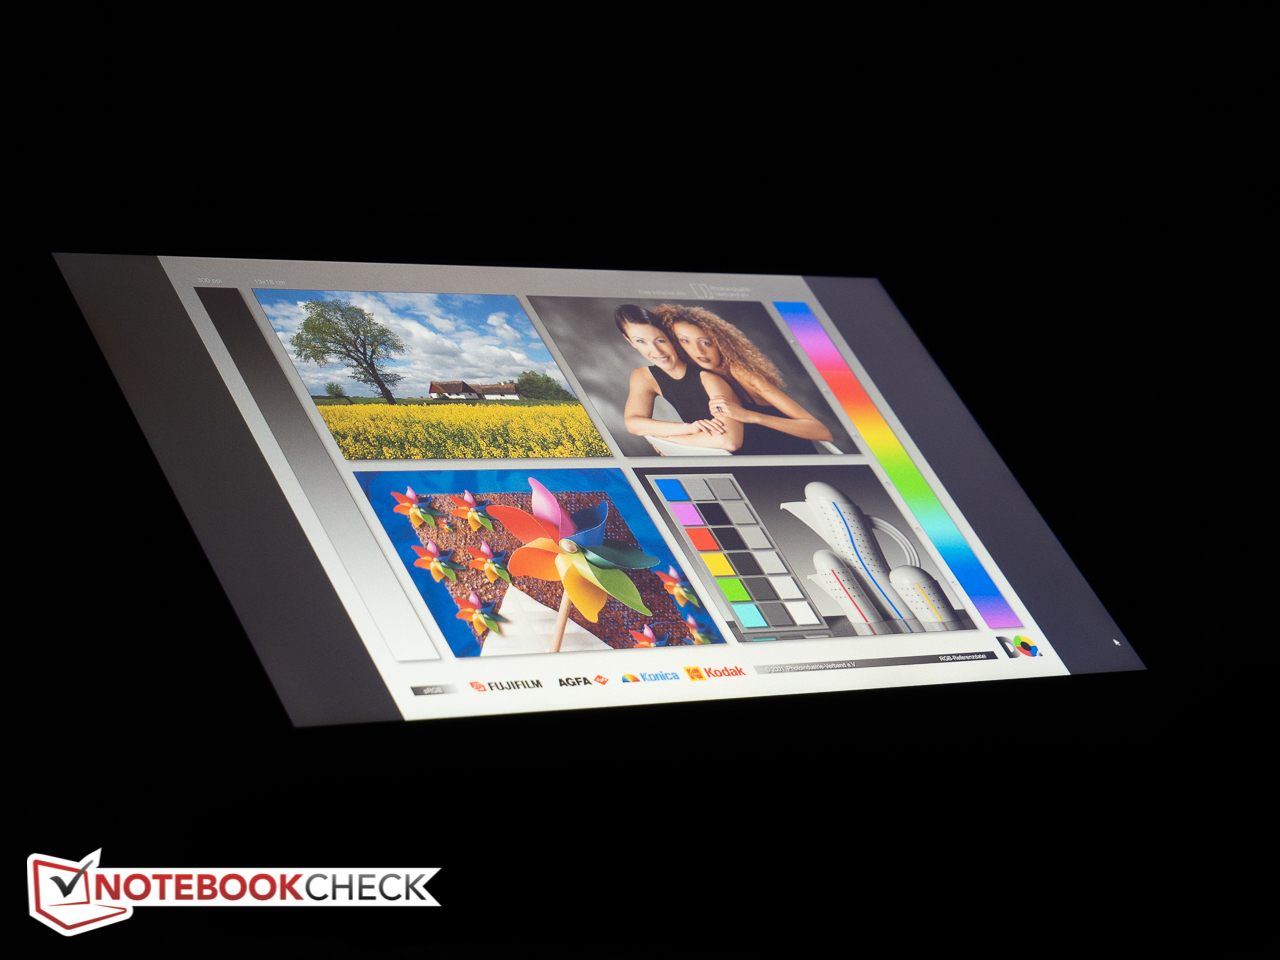
Because of the low brightness in combination with the glare-type display, the Latitude 5491 doesn't fare well outdoors. Even in the shade, care needs to be taken in adjusting the display to avoid distracting reflections. As expected, direct sunlight is out of the question, as the screen content washes out completely. Although the display is based on IPS technology and offers wide viewing angles, colors do shift particularly when the display is tilted downwards.
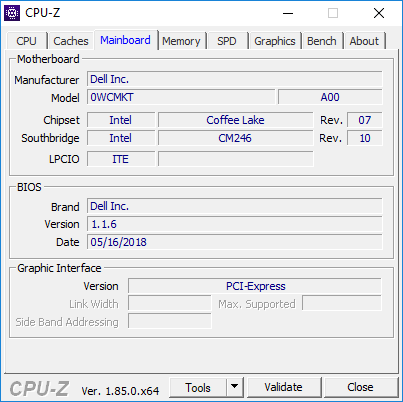
Performance
At the time of writing, Dell offers the Latitude 5491 with i5-8300H, i5-8400H , or i7-8850H processors, RAM ranging from 8 - 16 GB and either SATA or PCIe NVMe SSDs. The least expensive model in the lineup sells for $1070 and comes with the lowest-end CPU, 8 GB of RAM and a 2.5-inch 500GB 7200RPM SATA hard drive. Note that the 5491 SSD-equipped models feature "class 40" PCIe NVMe drives, while 5490-series notebooks with 15 W processor only come with the slower "Class 20" SSDs with SATA interface.
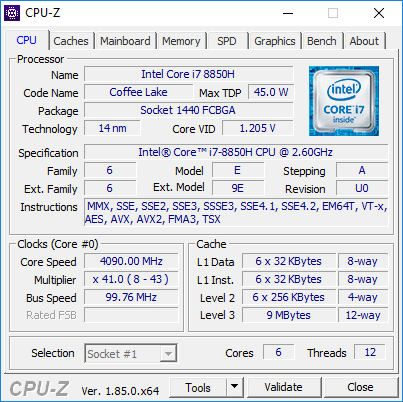
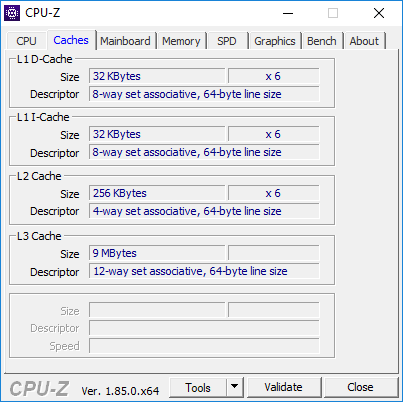

Processor
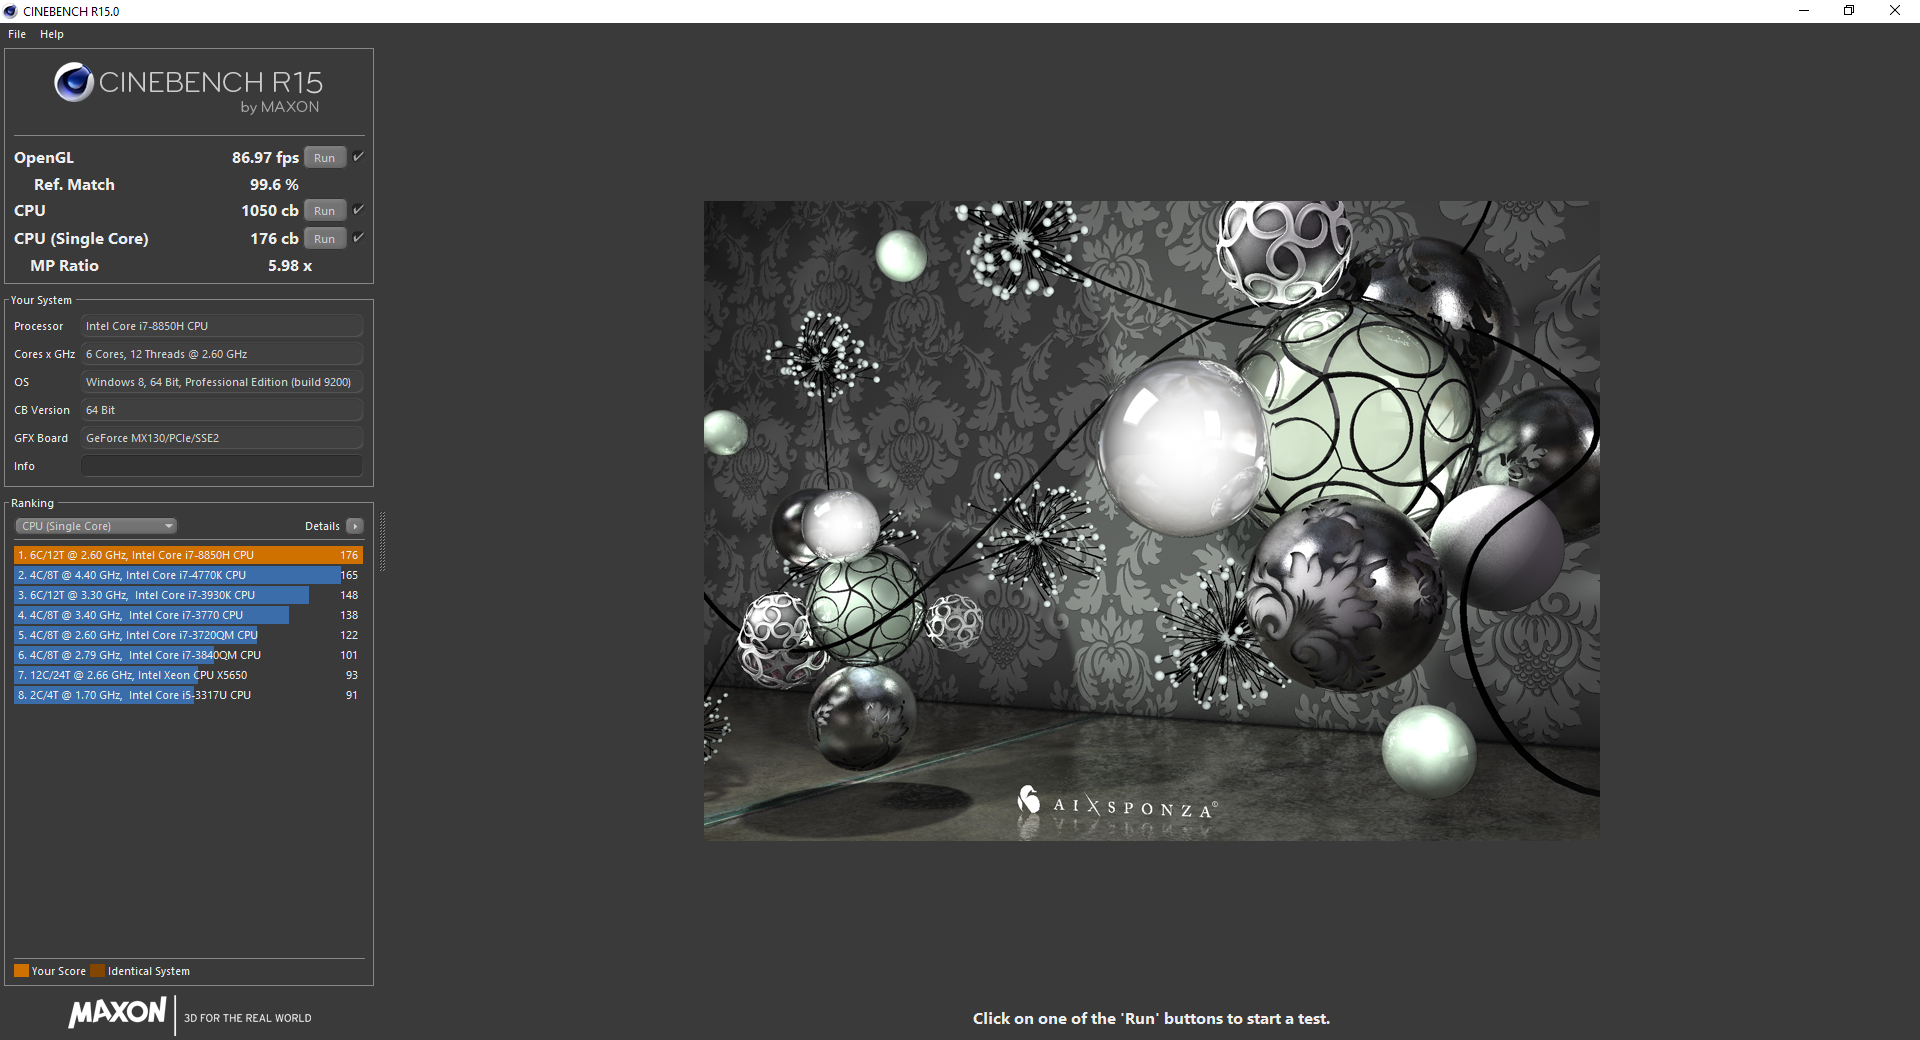
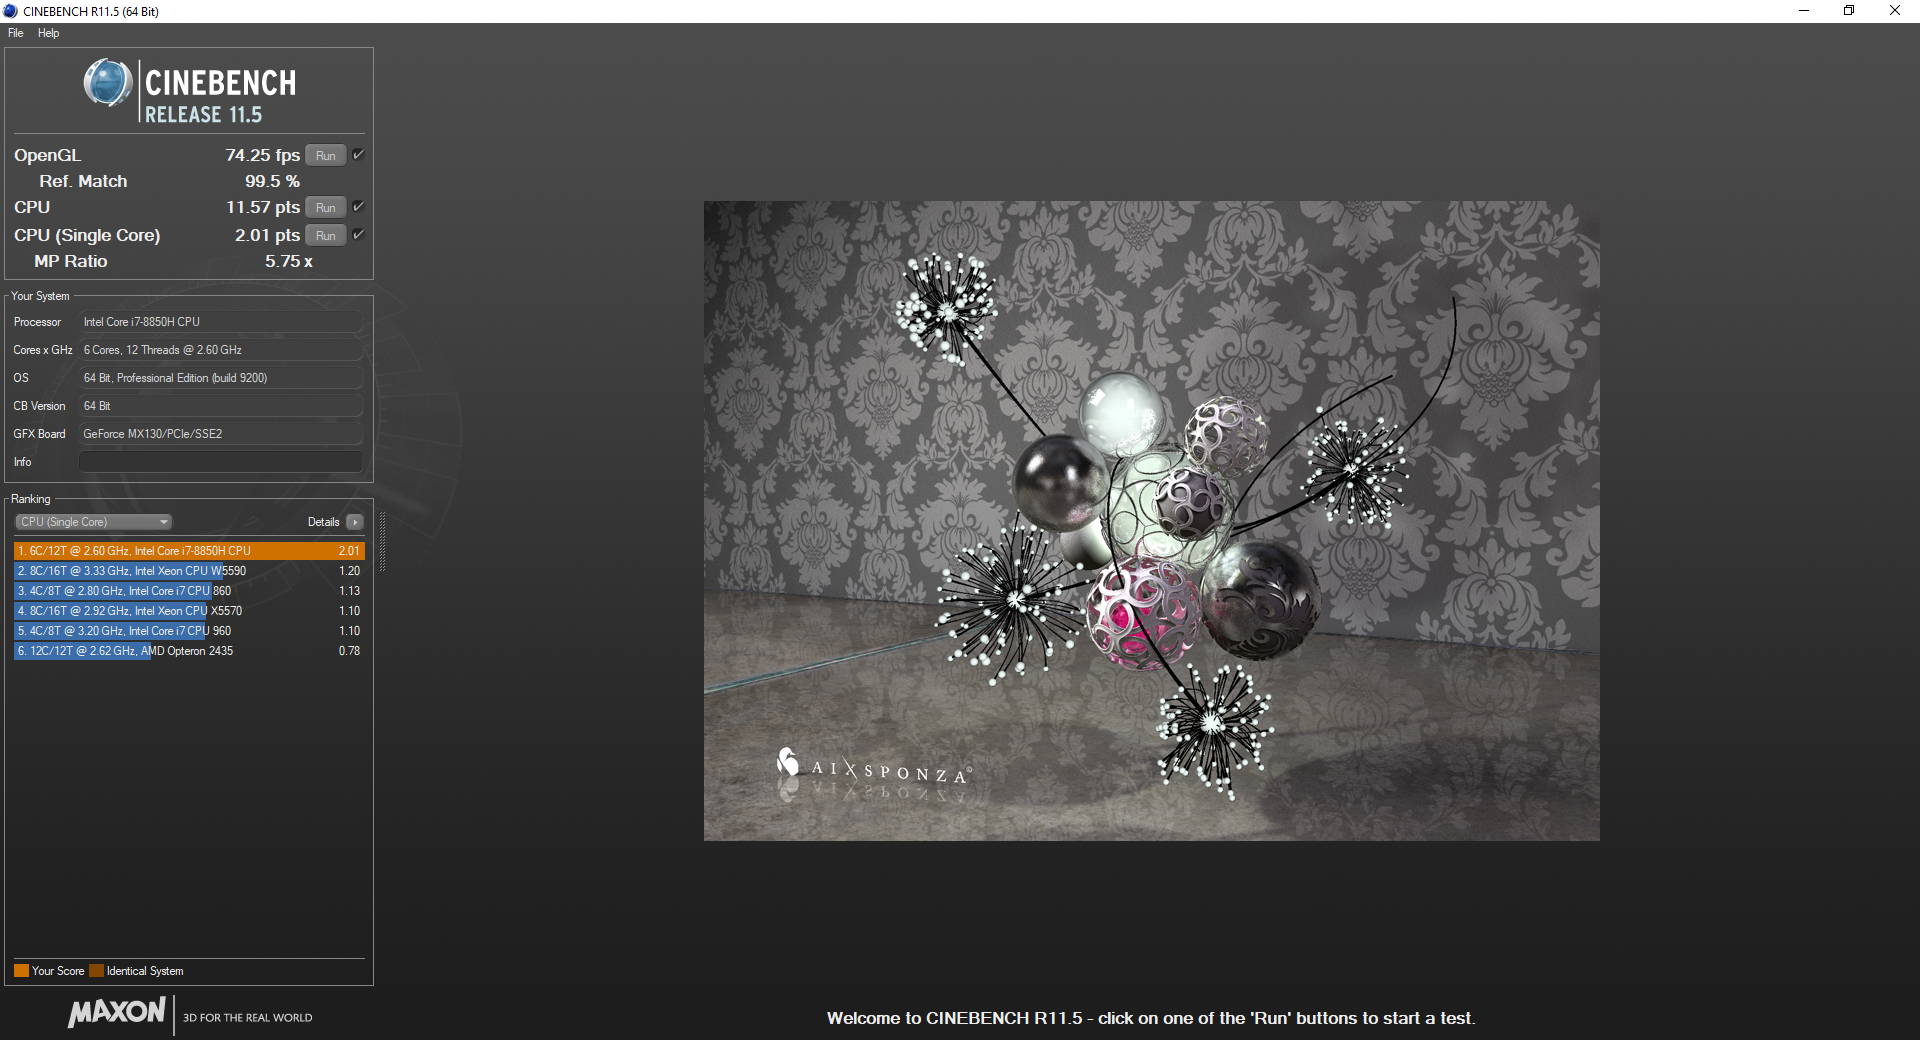
Our review unit is equipped with a Coffee Lake-H hexa-core i7-8850H processor. The 45 W CPU features 9 MB cache, runs at a nominal frequency of 2.6GHz and supports vPro as well. It's interesting that Dell decided to go with the Core i7-8850H (2.6 - 4.3 GHz) instead of the more common i7-8750H (2.2 - 4.1 GHz) processor. Performance, however, isn't top notch, as our Latitude trails gaming rigs - which admittedly feature much better cooling systems - with the lower-end i7-8750H by about 10 percent when it comes to multi-core performance. Notebooks with the 15 W (ULV) quad-core Intel Core i7-8560U processor - like the Latitude 5490 - are between 30 - 50 percent slower than the review candidate.
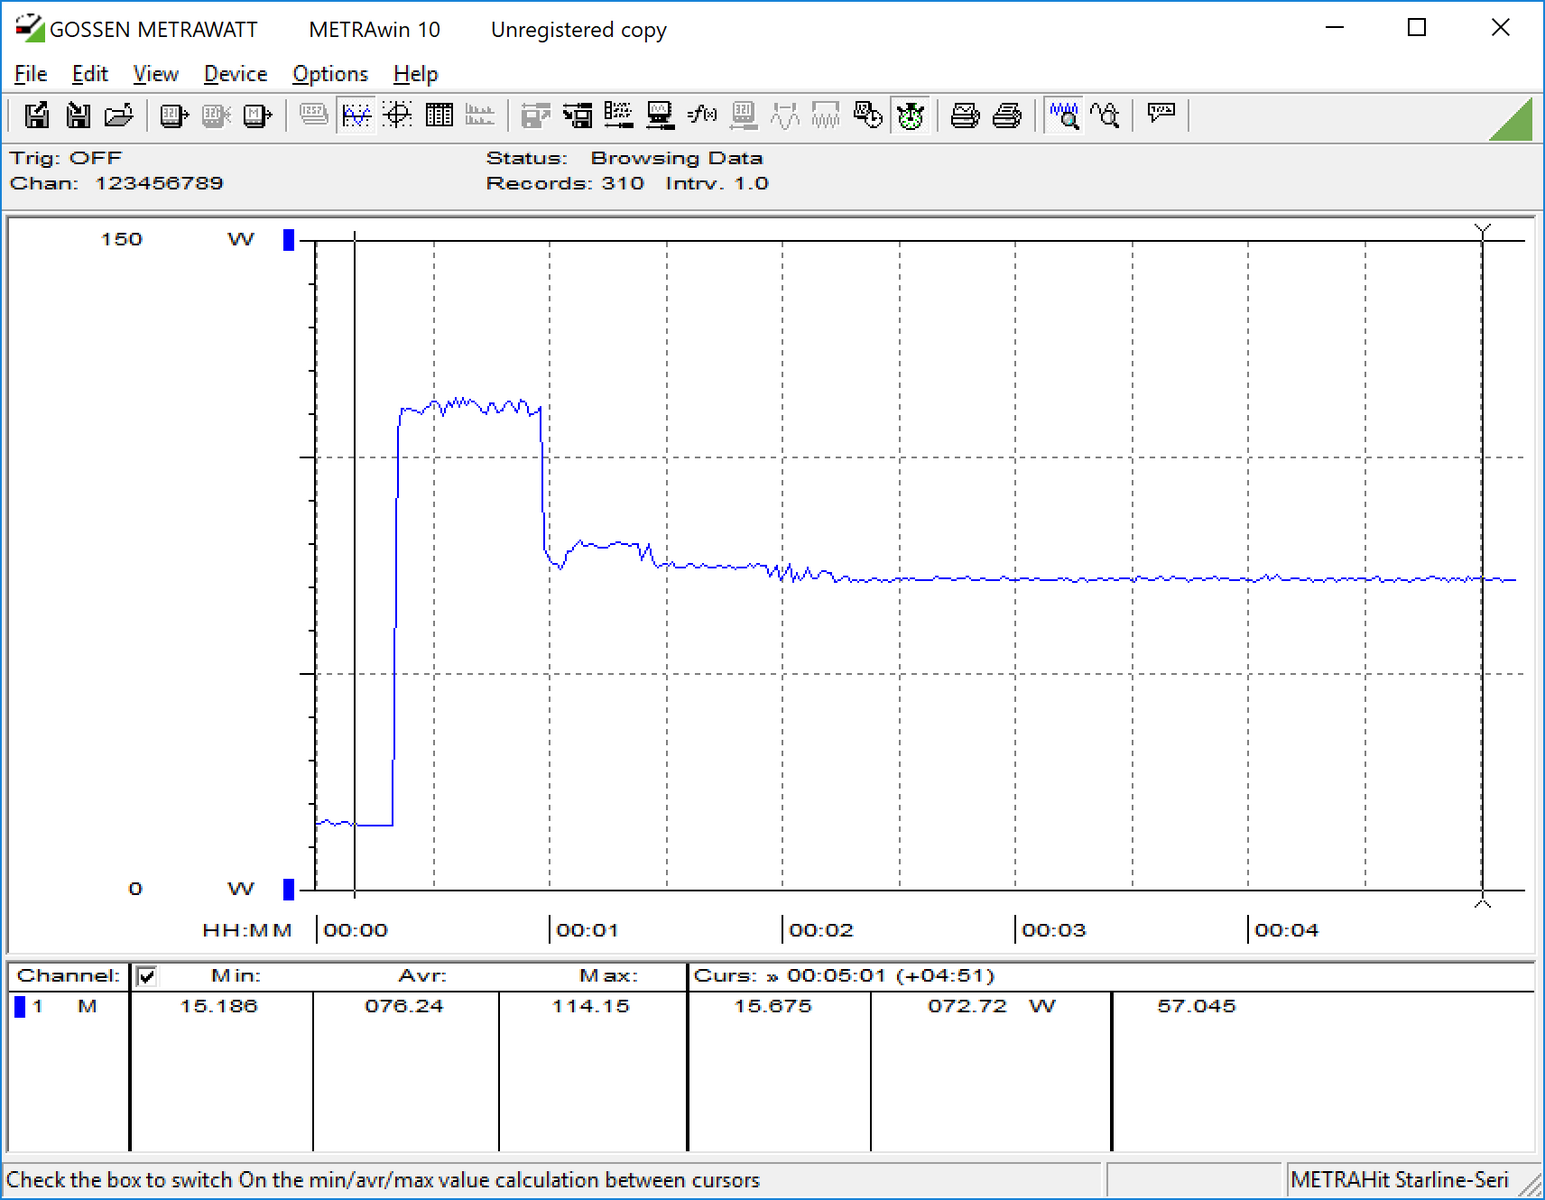
To determine sustained performance and Turbo utilization we run our Cinebench R15 Multi loop test. The graph below shows a very steep drop-off of over 15 percent during the first three loops with a more gradual reduction during the subsequent loops. The lowest score of 810 points during the test equates to a 25 percent reduction in performance. Of course, the Latitude 5491 still easily outperforms the competition with quad-core Kaby Lake Refresh processors.
See see our dedicated page on the Intel Core i7-8850H for more technical information and benchmark comparisons.

System Performance
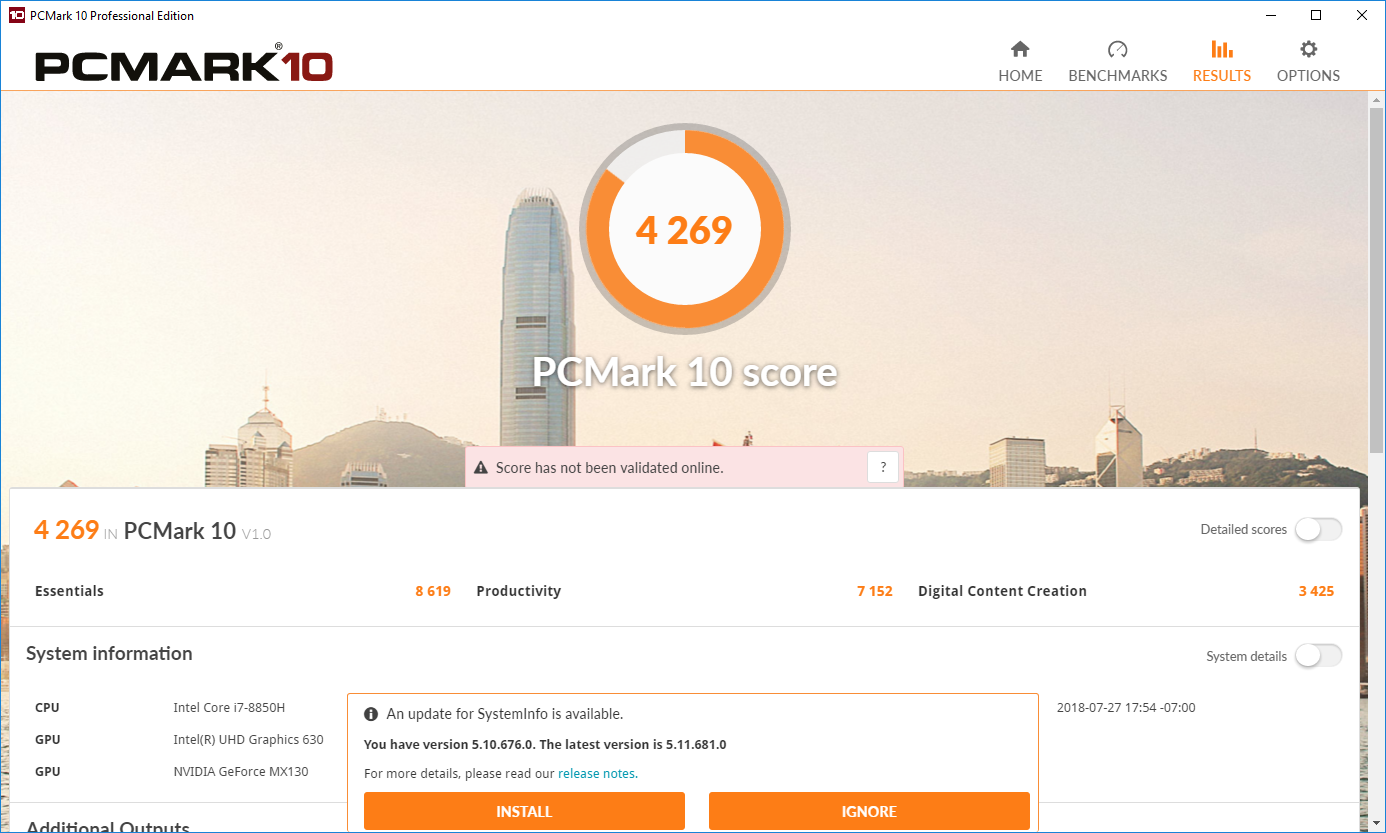
System performance as measured with the synthetic PCMark benchmark tests is decent, but not stellar. Interesting is the fact that the review notebook is only about 5 percent faster here than its counterpart Latitude 5490 with integrated GPU and 15 W quad-core CPU. The 15-inch Dell XPS 15 2018 9570 with slower quad-core i5-8300H CPU and GTX 1050 is either faster (PCMark 10) or performers about as well (PCMark 8 Home / Work) as the review notebook.
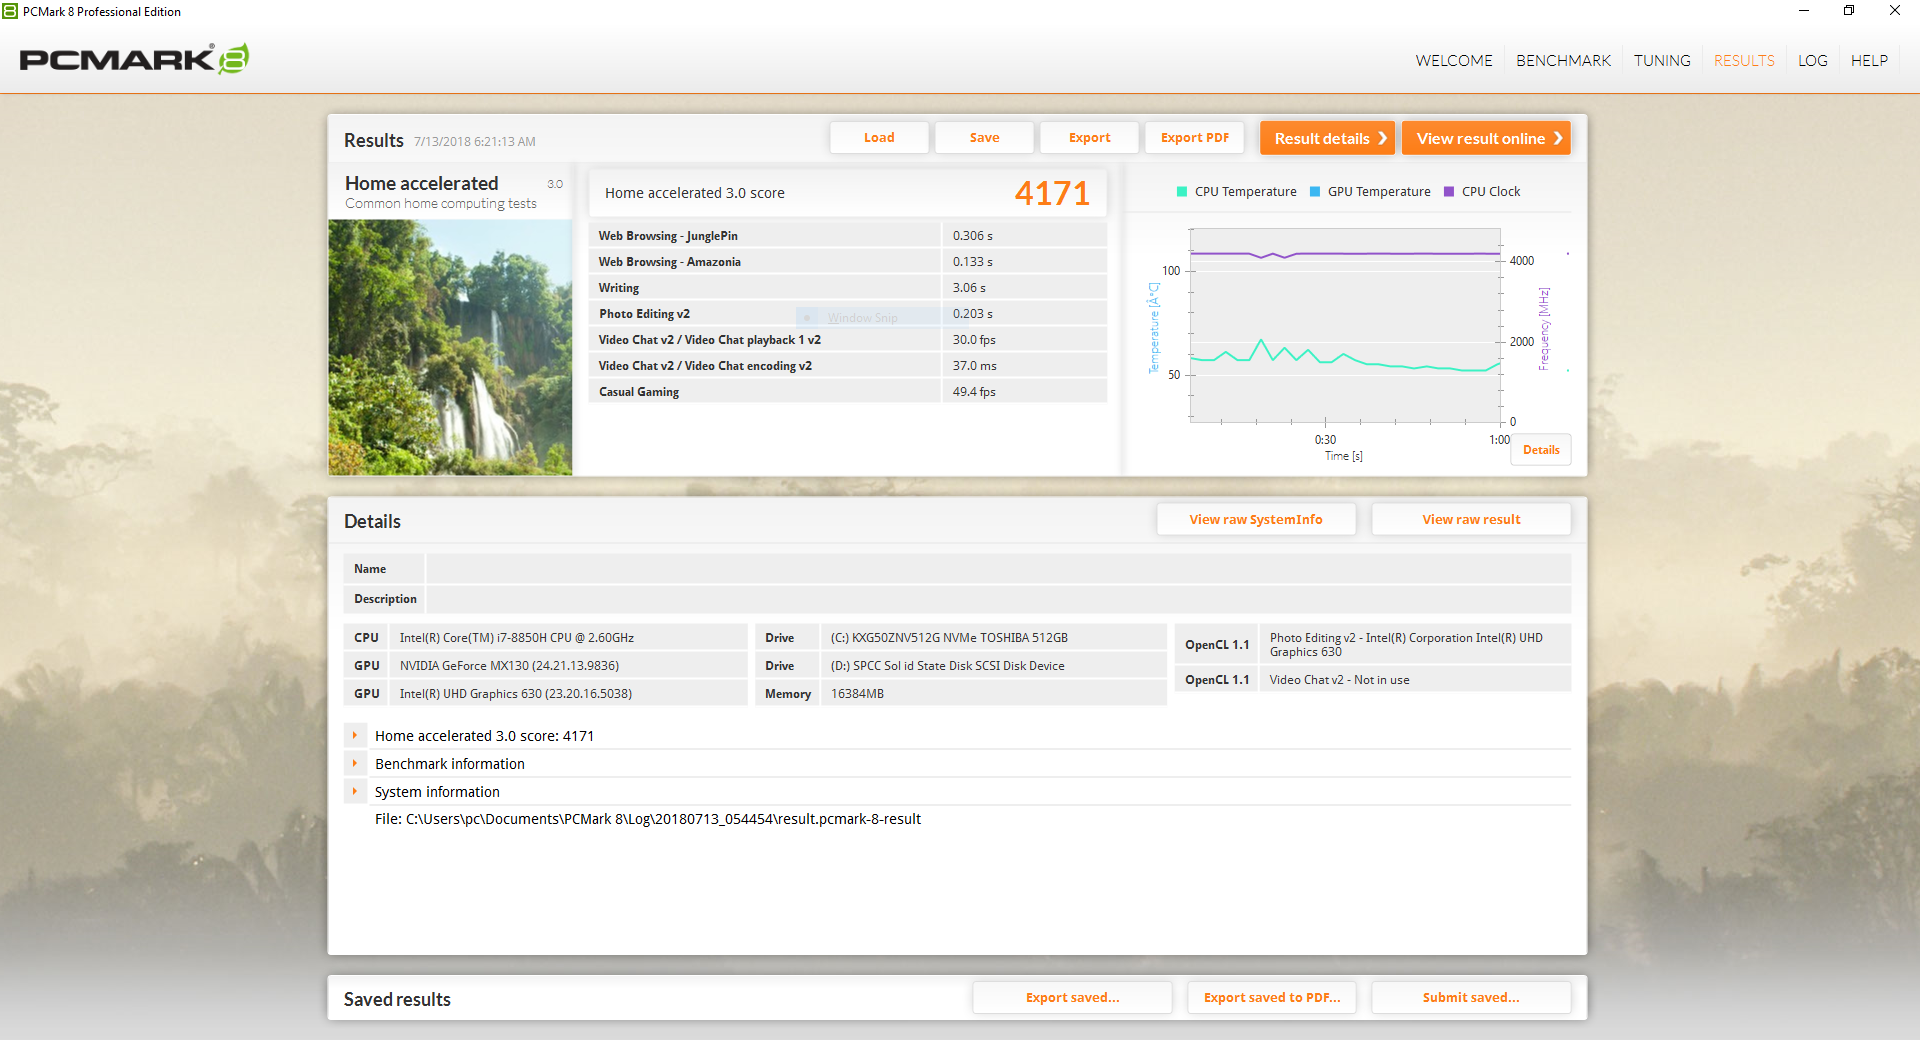
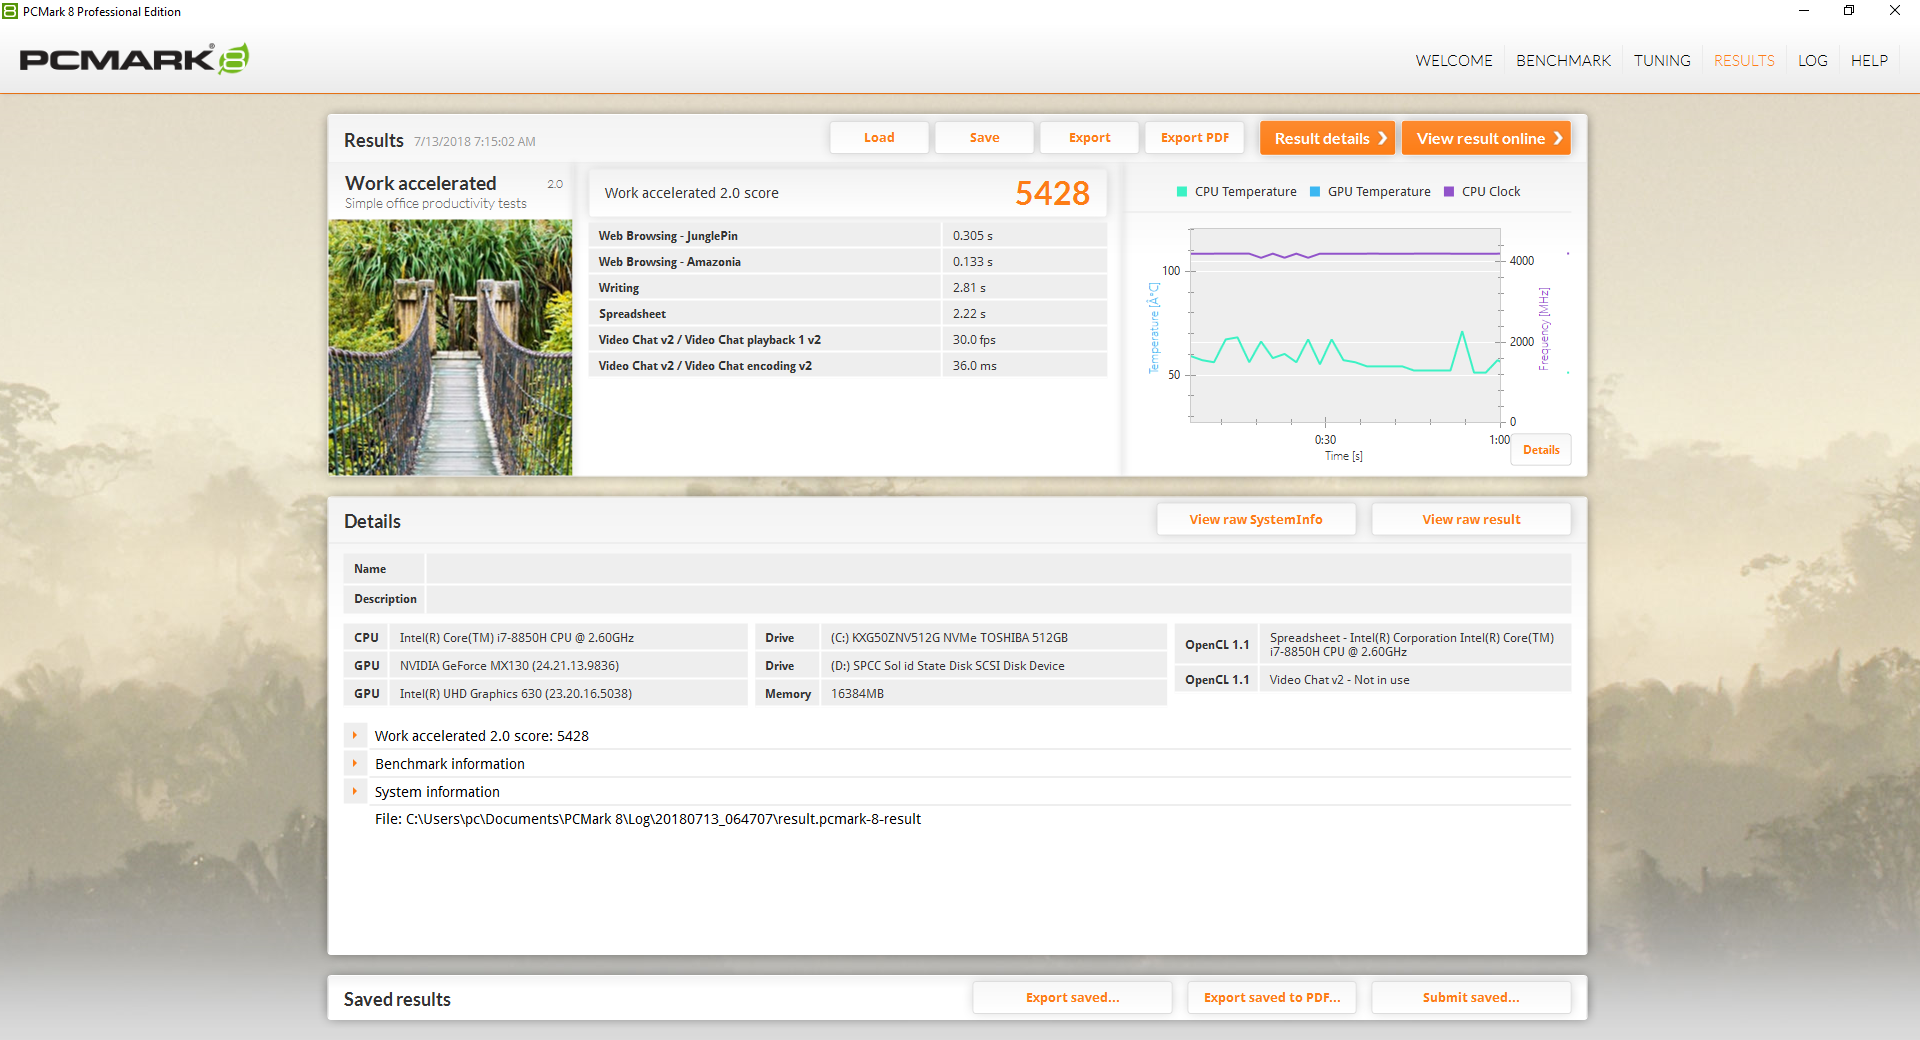
| PCMark 8 Home Score Accelerated v2 | 4174 points | |
| PCMark 8 Work Score Accelerated v2 | 5428 points | |
| PCMark 10 Score | 4269 points | |
Help | ||
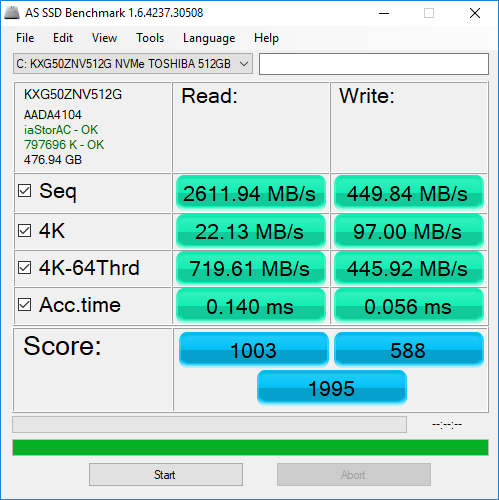
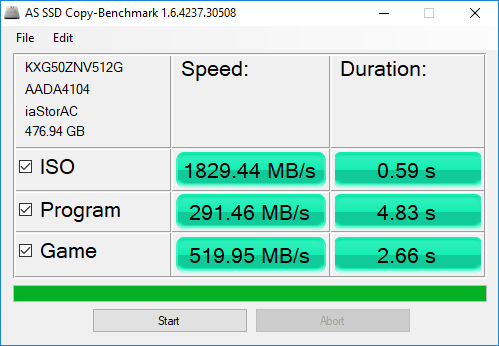
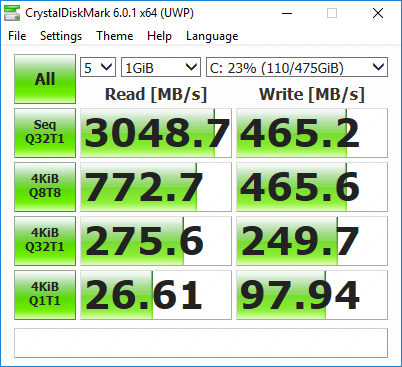
Storage Devices
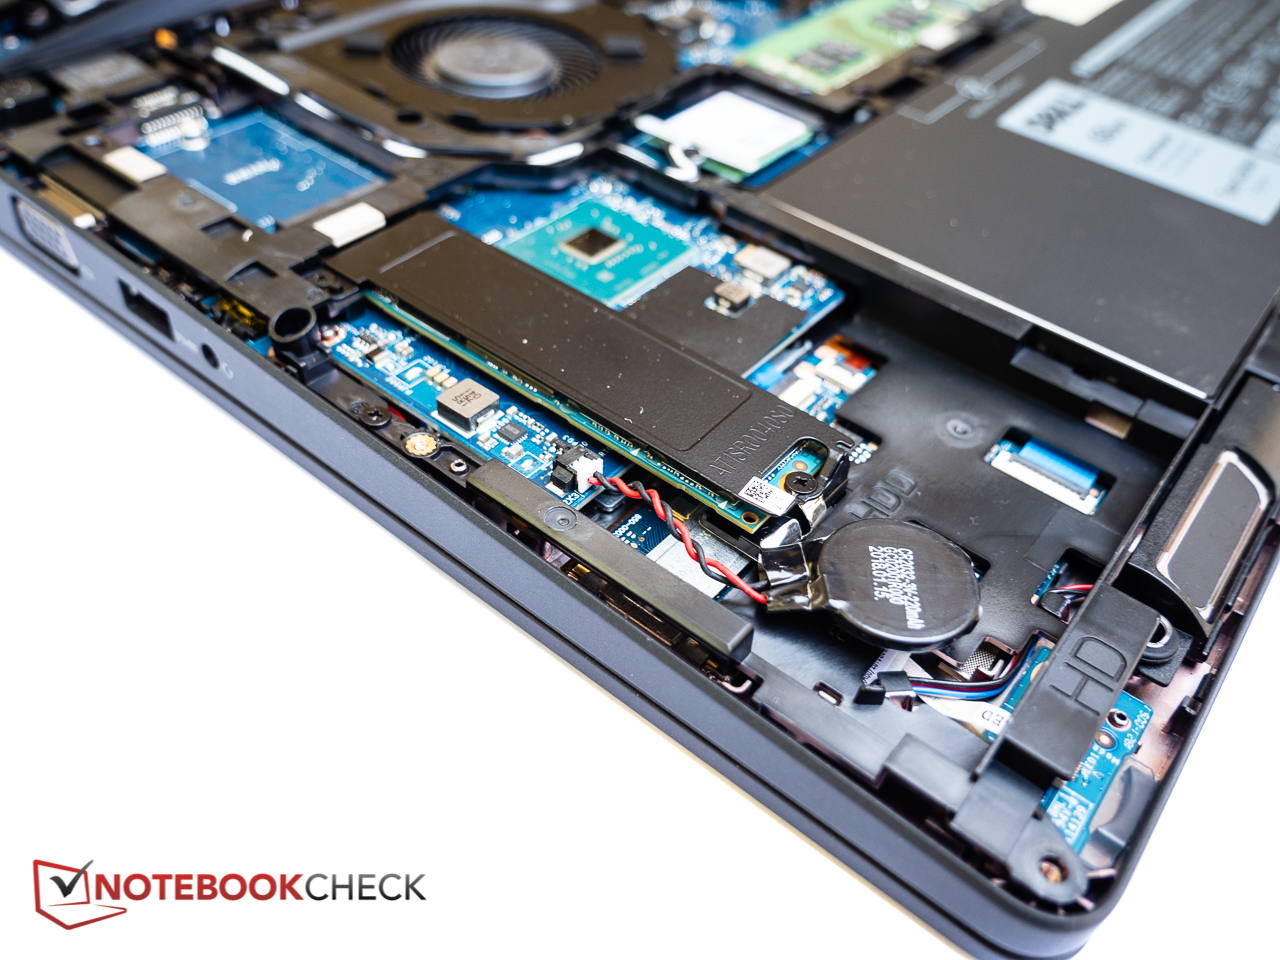
As far as PCIe NVMe drives go, the Toshiba XG5 SSD combines excellent read with less than stellar write rates. Performance compared to the Latitude 5490 with SATA-based SSD is significantly better, although the difference is not going to noticeable during normal use. At the time of writing, Dell offers drives with a maximum capacity of 512 GB.
Please see our table of HDDs and SSDs for additional benchmark comparisons.
| Dell Latitude 5491 Toshiba XG5 KXG50ZNV512G | Lenovo ThinkPad T480-20L6S01V00 Samsung SSD PM981 MZVLB512HAJQ | HP EliteBook 840 G5-3JX61EA Toshiba KXG50ZNV1T02 | Acer TravelMate P648-G2-M-73T0 SK Hynix HFS256G39TND-N210A | Dell Latitude 5490 Samsung PM961 MZVLW256HEHP | |
|---|---|---|---|---|---|
| AS SSD | -310% | 34% | -62% | -5% | |
| Copy Game MB/s (MB/s) | 520 | 676 30% | 905 74% | 172 -67% | 273.6 -47% |
| Copy Program MB/s (MB/s) | 291.5 | 254.8 -13% | 326.2 12% | 92.5 -68% | 214 -27% |
| Copy ISO MB/s (MB/s) | 1829 | 921 -50% | 1688 -8% | 216.6 -88% | 514 -72% |
| Score Total (Points) | 1995 | 2348 18% | 2630 32% | 969 -51% | 1834 -8% |
| Score Write (Points) | 588 | 147 -75% | 1084 84% | 283 -52% | 449 -24% |
| Score Read (Points) | 1003 | 1480 48% | 1070 7% | 456 -55% | 916 -9% |
| Access Time Write * (ms) | 0.056 | 2.515 -4391% | 0.055 2% | 0.229 -309% | 0.037 34% |
| Access Time Read * (ms) | 0.14 | 0.041 71% | 0.059 58% | 0.081 42% | 0.067 52% |
| 4K-64 Write (MB/s) | 445.9 | 96.2 -78% | 908 104% | 184.1 -59% | 300.9 -33% |
| 4K-64 Read (MB/s) | 720 | 1278 78% | 813 13% | 375.2 -48% | 793 10% |
| 4K Write (MB/s) | 97 | 1.76 -98% | 90 -7% | 73.7 -24% | 93.6 -4% |
| 4K Read (MB/s) | 22.13 | 58 162% | 26.75 21% | 30.07 36% | 45.99 108% |
| Seq Write (MB/s) | 449.8 | 487.1 8% | 856 90% | 248.1 -45% | 541 20% |
| Seq Read (MB/s) | 2612 | 1441 -45% | 2300 -12% | 511 -80% | 768 -71% |
* ... smaller is better

GPU Performance
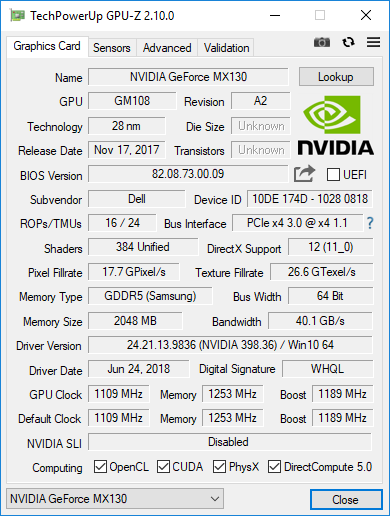
The Nvidia GeForce MX130 is the successor to the GeForce 930MX. In our case, the DirectX 12 GPU makes us of faster GDDR5 SSDRAM graphics memory and runs at a theoretical maximum speed of 1242 MHz. The performance of our particular review unit trails notebooks with the slightly higher-end GeForce MX150 like the Lenovo ThinkPad T480 and T480s by between 16 and 48 percent depending on the benchmark test. Notebooks with the integrated Intel HD Graphics 620 on the other hand are up to 40 percent slower.
For additional technical information and benchmark comparisons, please see our dedicated page on the Nvidia GeForce MX130.
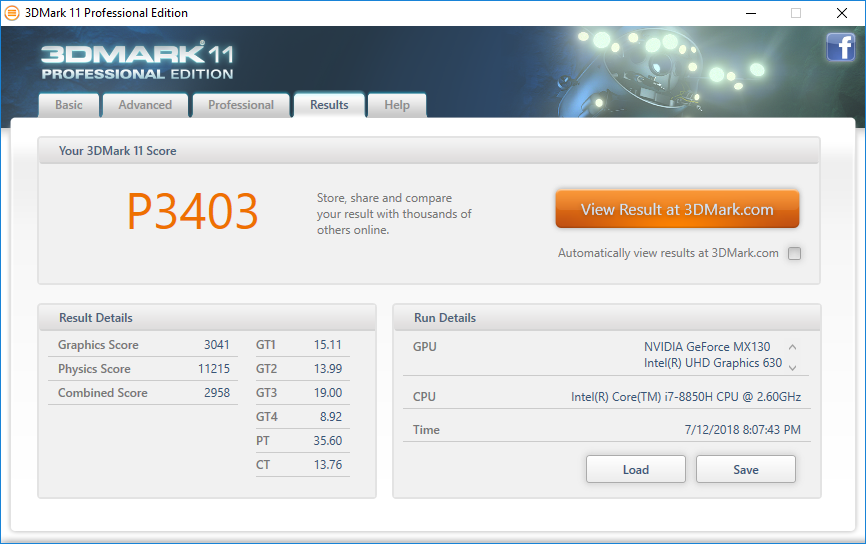
| 3DMark 11 Performance | 3403 points | |
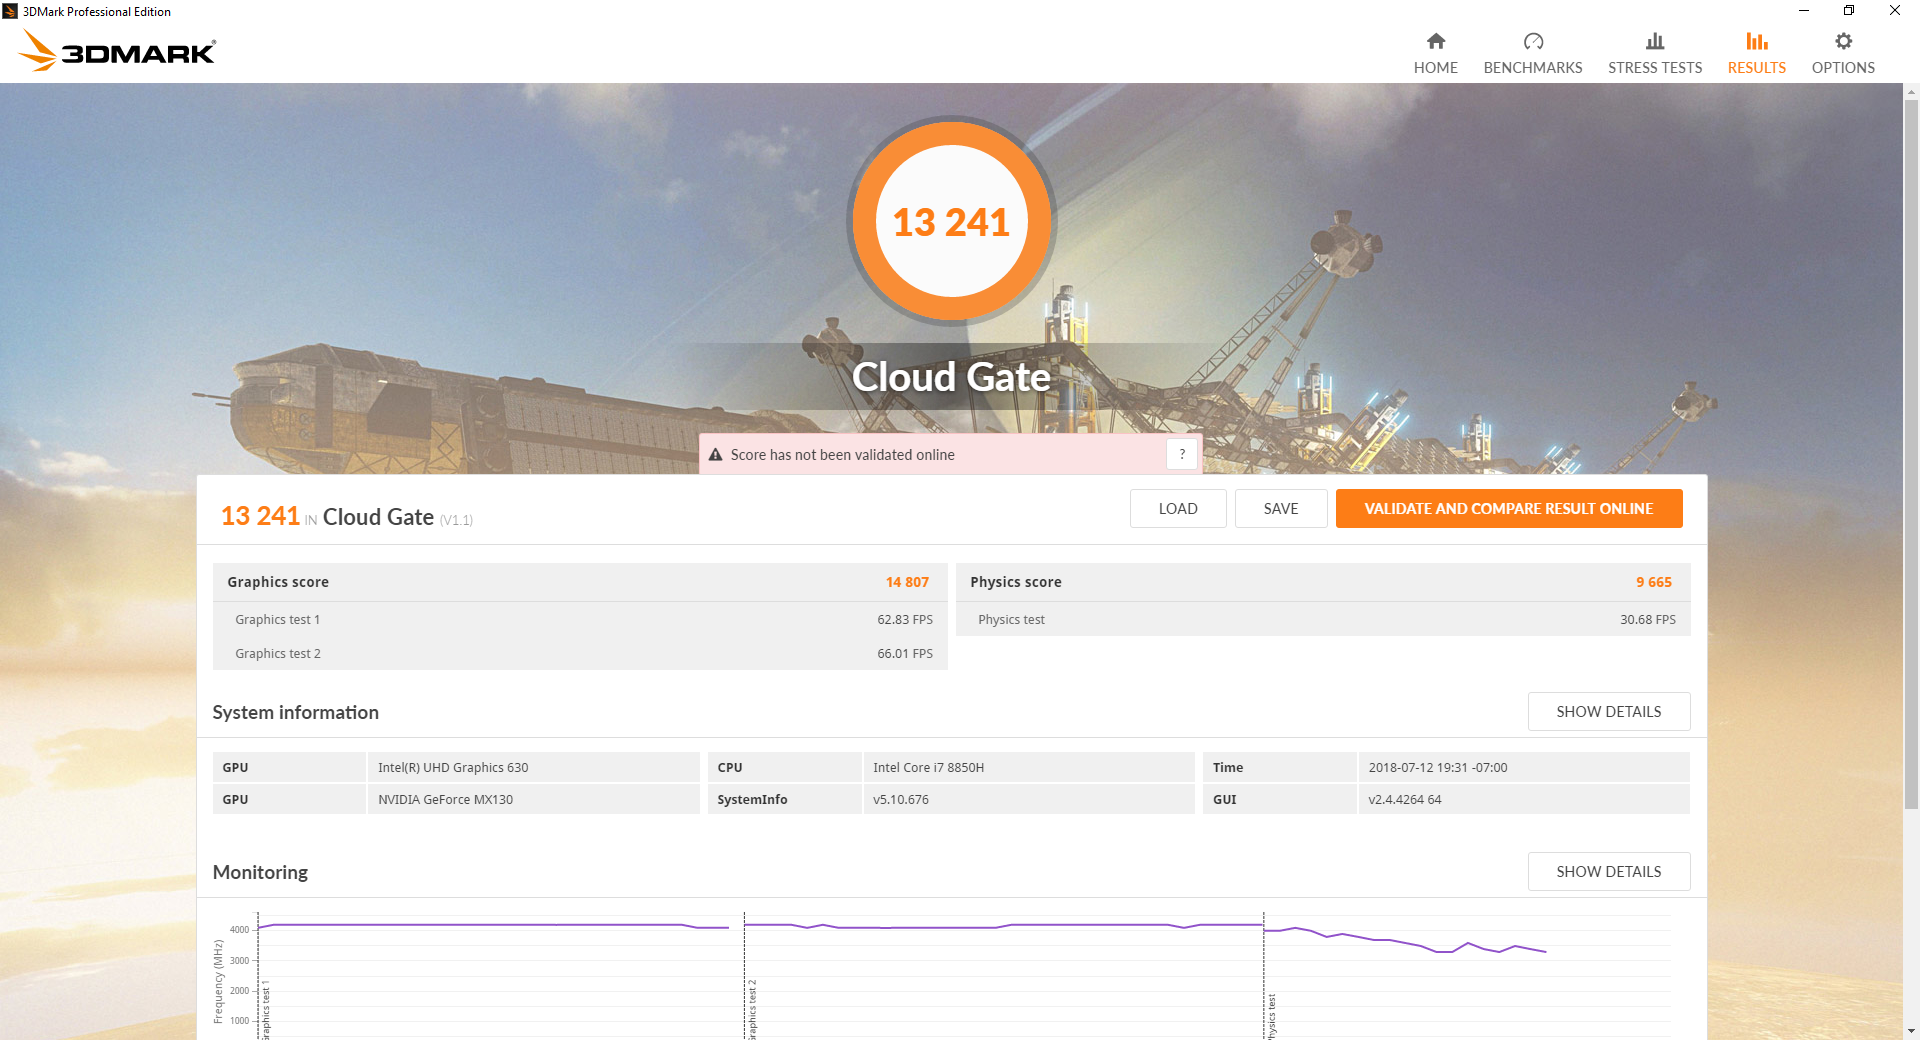
| 3DMark Cloud Gate Standard Score | 13241 points | |
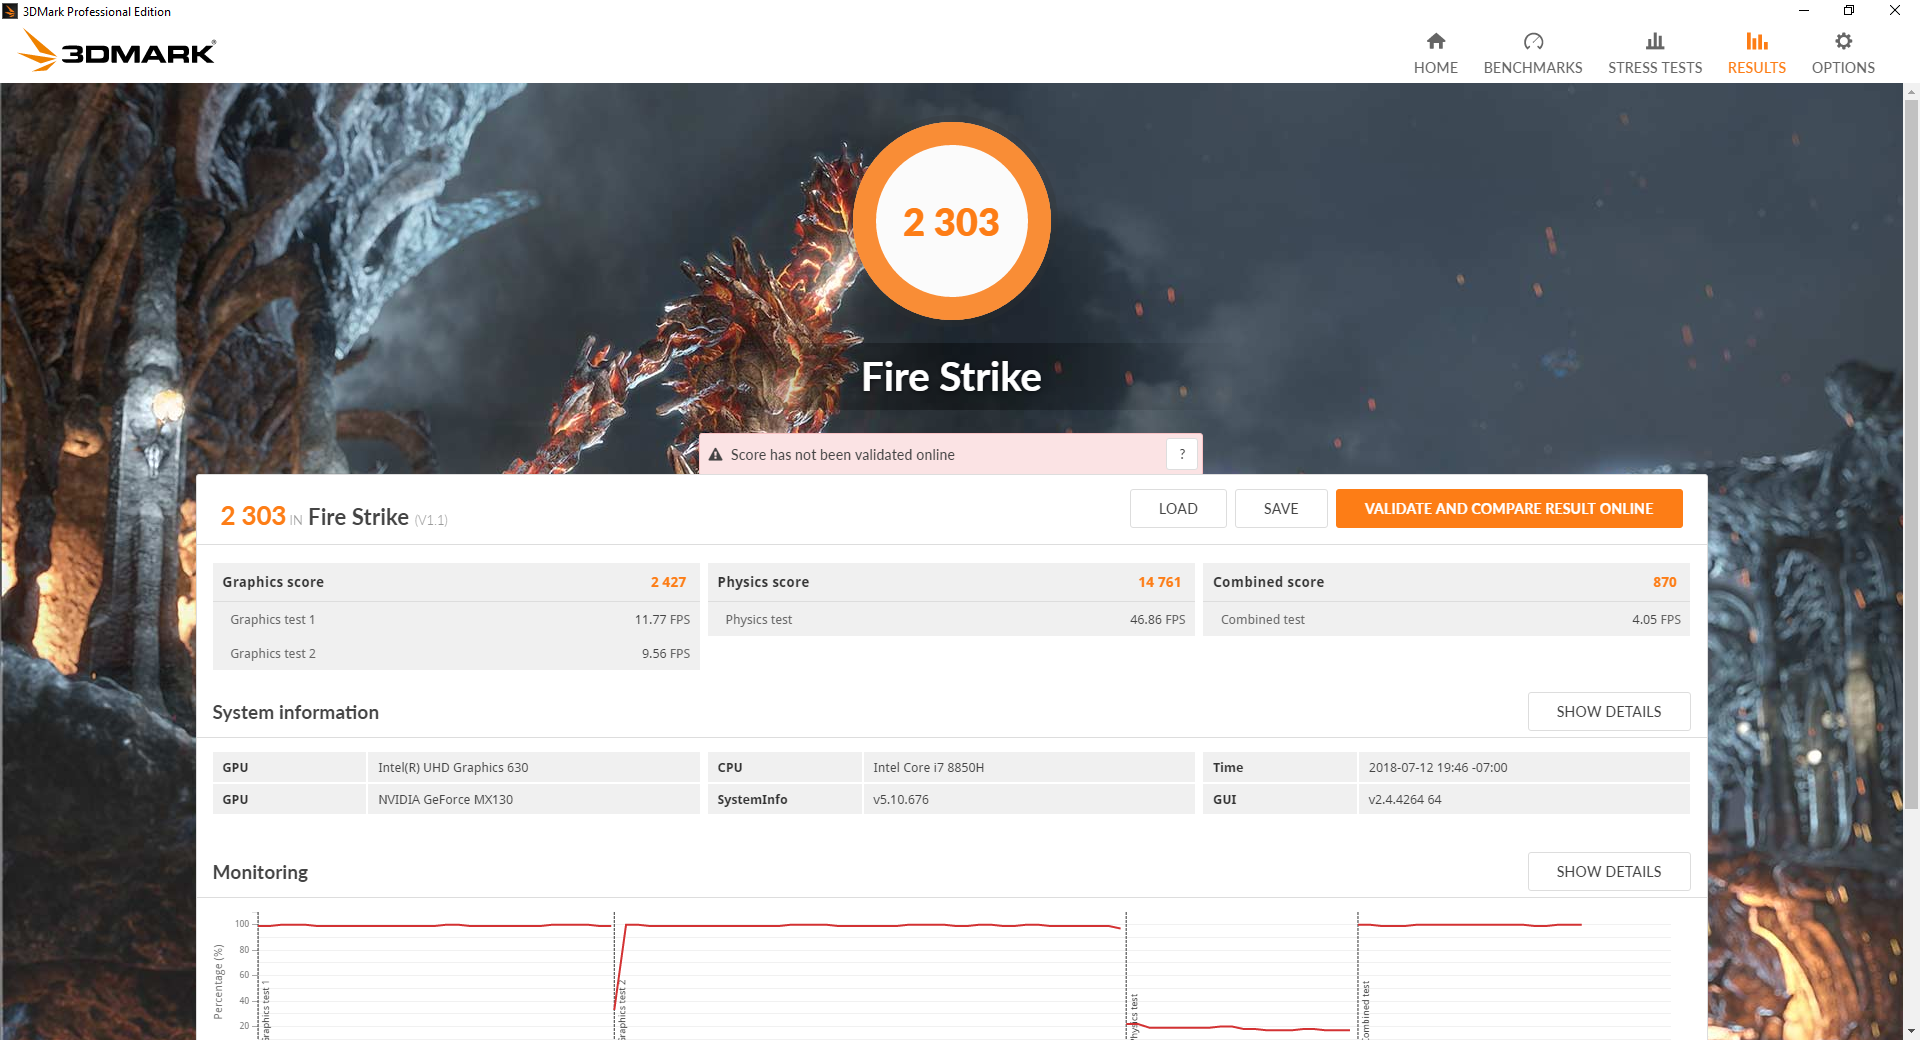
| 3DMark Fire Strike Score | 2303 points | |
Help | ||
Gaming Performance
The results of the synthetic benchmarks translate to the gaming performance as well. The Latitude 5491 with MX130 offers about twice the frame rates of notebooks which are only equipped with the integrated Intel UHD Graphics 620. The Dell XPS 15 with the more potent GeForce GTX 1050 pulls ahead by approximately the same margin. That said, the Latitude 5491 is only suitable for older games and at reduced quality settings and/or resolution.
| Rise of the Tomb Raider | |
| 1024x768 Lowest Preset (sort by value) | |
| Dell Latitude 5491 | |
| Lenovo ThinkPad T480-20L6S01V00 | |
| Acer TravelMate P2510-M-51ZQ | |
| Average NVIDIA GeForce MX130 (30.7 - 51.2, n=8) | |
| 1366x768 Medium Preset AF:2x (sort by value) | |
| Dell Latitude 5491 | |
| Lenovo ThinkPad T480-20L6S01V00 | |
| Dell XPS 15 2018 i5 FHD 97Wh | |
| Average NVIDIA GeForce MX130 (22.5 - 31.3, n=8) | |
| 1920x1080 High Preset AA:FX AF:4x (sort by value) | |
| Dell Latitude 5491 | |
| Lenovo ThinkPad T480-20L6S01V00 | |
| Dell XPS 15 2018 i5 FHD 97Wh | |
| Average NVIDIA GeForce MX130 (13.2 - 16.9, n=8) | |
| 1920x1080 Very High Preset AA:FX AF:16x (sort by value) | |
| Dell Latitude 5491 | |
| Lenovo ThinkPad T480-20L6S01V00 | |
| Dell XPS 15 2018 i5 FHD 97Wh | |
| Average NVIDIA GeForce MX130 (12.1 - 14, n=7) | |
| low | med. | high | ultra | |
|---|---|---|---|---|
| BioShock Infinite (2013) | 146.1 | 82.2 | 66 | 25.1 |
| Rise of the Tomb Raider (2016) | 50.7 | 31 | 16.9 | 14 |
Stress Test
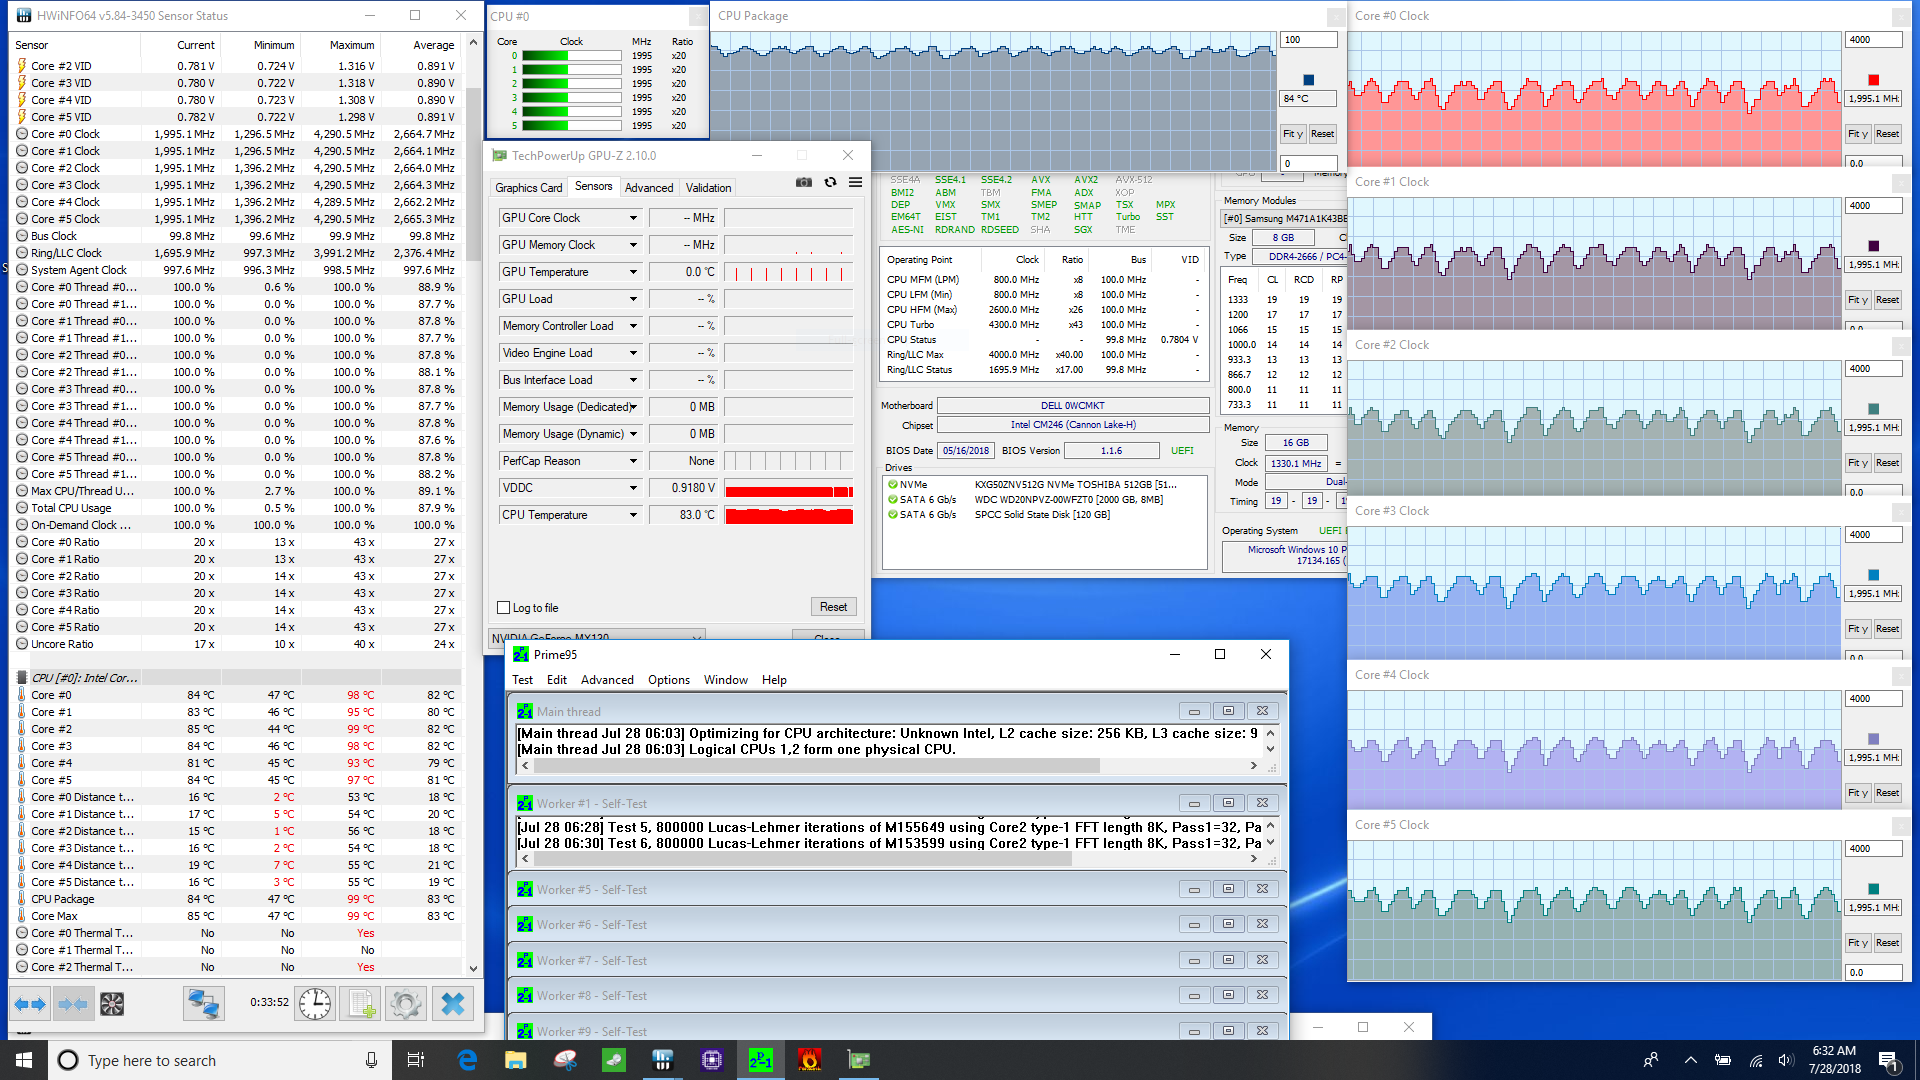
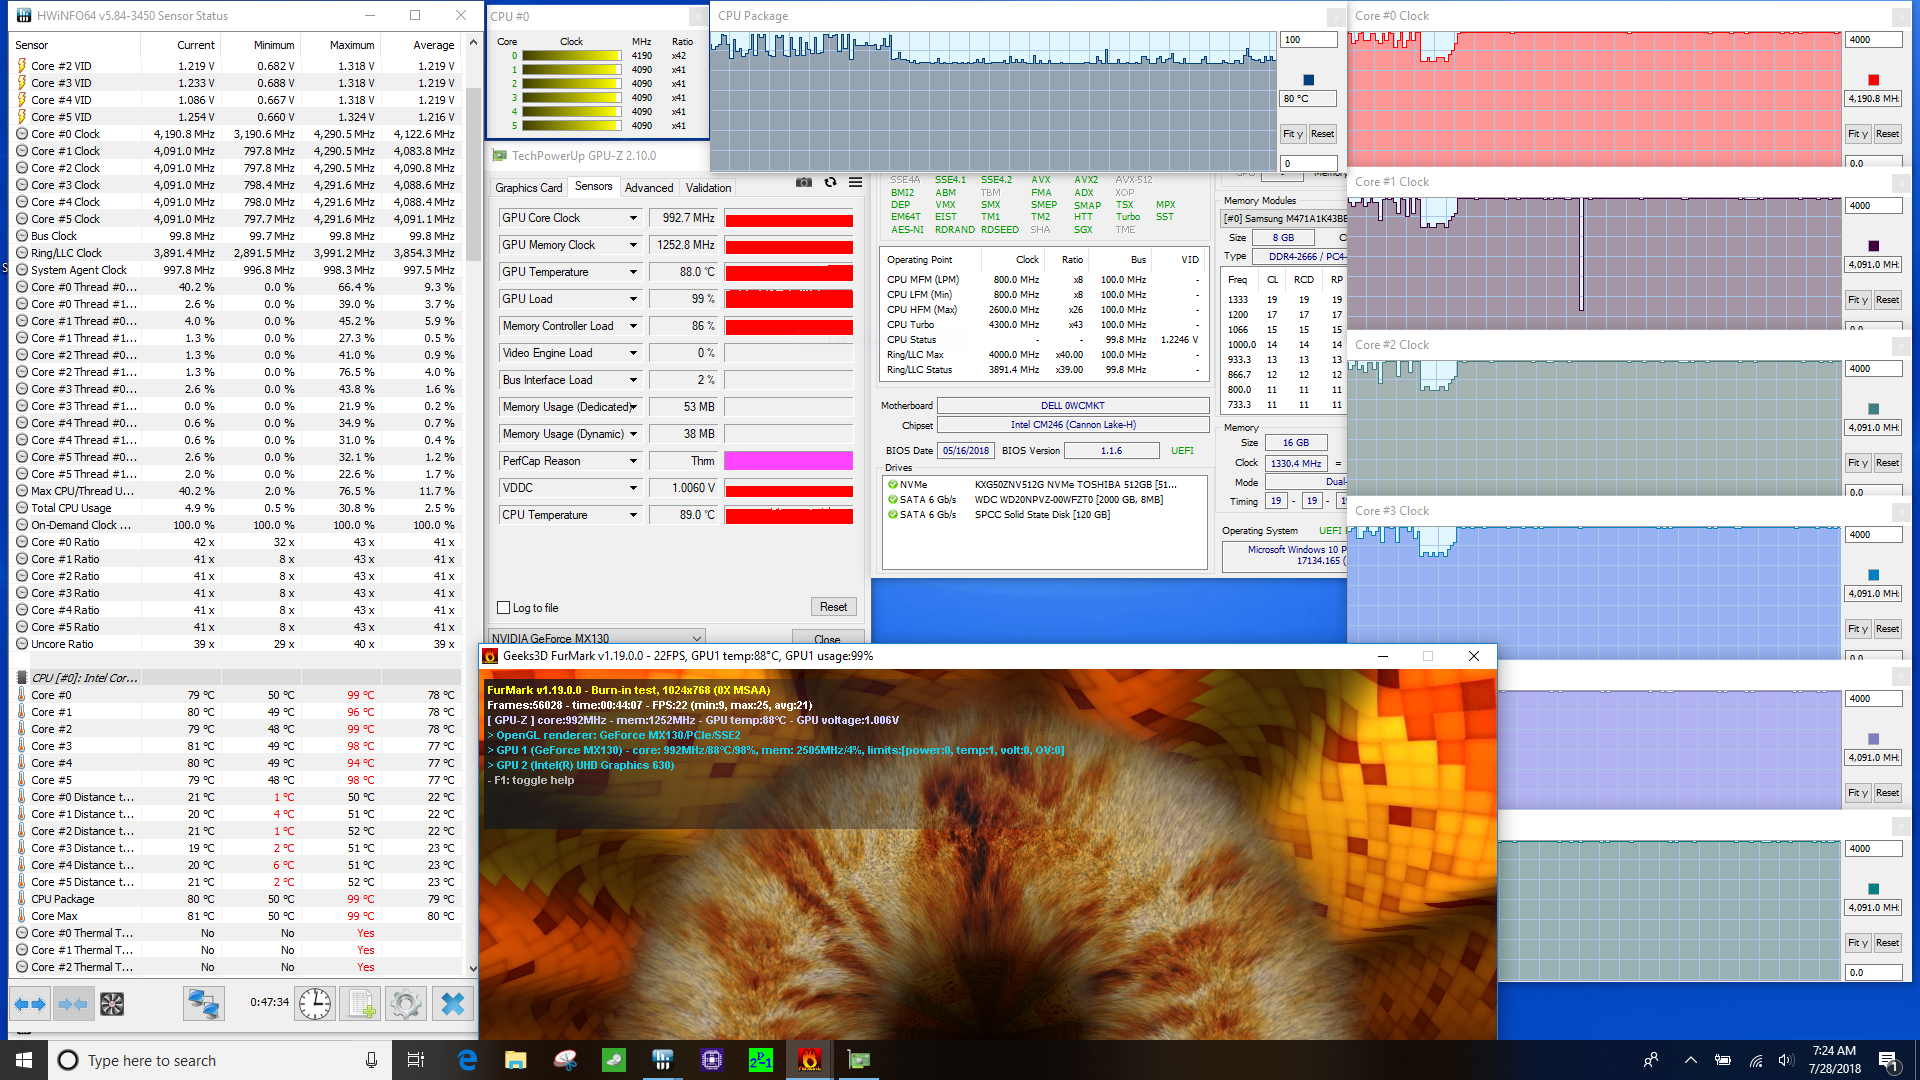
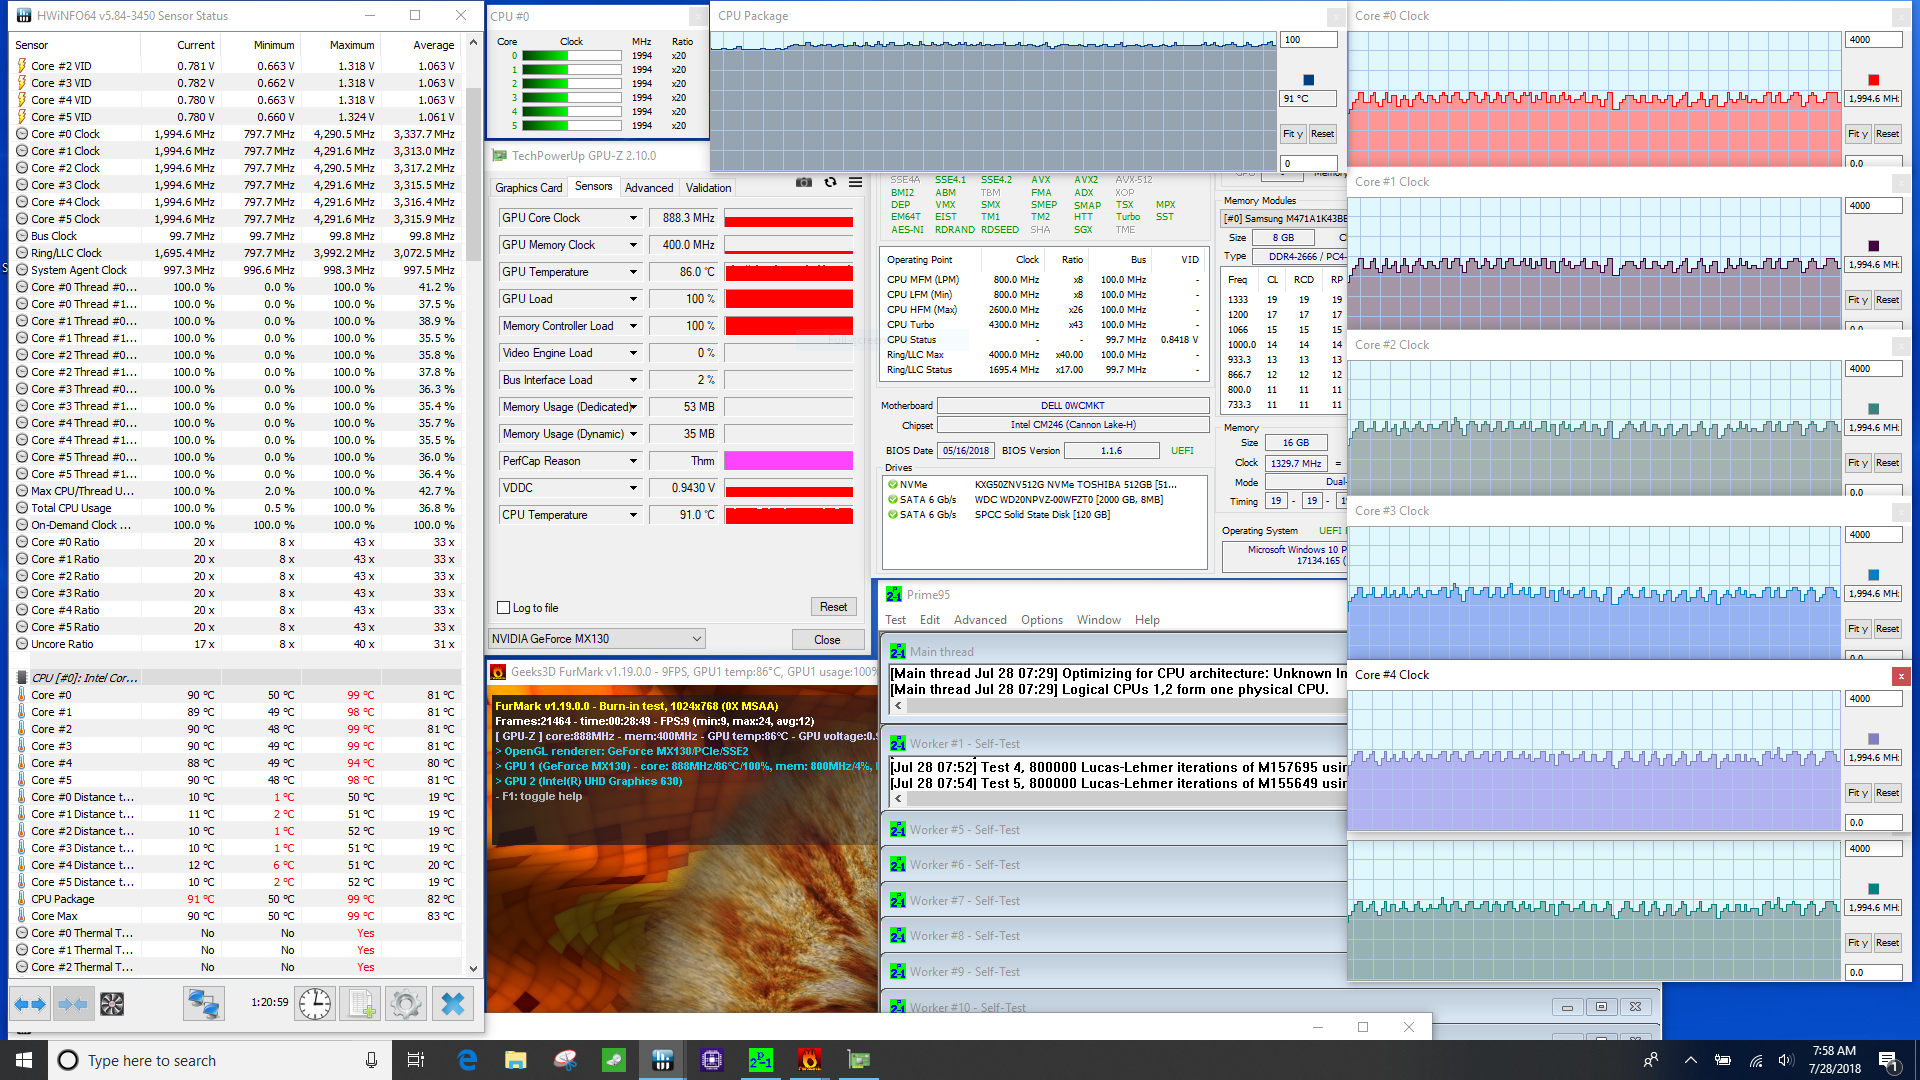
We subject our review units to unrealistically high CPU and GPU loads to identify stability issues and throttling. Under Prime95 stress, the temperature rises very quickly to 98 C and CPU cores subsequently drop to under 3.0 GHz within the first 30 seconds. Two minutes later, the CPU runs at between 2.6 - 2.8 GHz at a temperature of around 90 C. Half an hour after the start of the test, the cores cycle between 1.8 - 2.6 GHz at temperatures of 80 - 90 C. With Furmark running on its own, the GPU stabilizes at 990 MHz at a temperature of 86 C. Simultaneous CPU and GPU stress with Prime95 and FurMark results in CPU clock rates of 1.7 - 2.1 GHz at temperatures of 90 - 91 C, while the GPU runs steadily at 888 MHz at temperatures ranging from 85 - 87 C.
A quick comparison between the Latitude 5491 with 45 W processor and the 5490 with 15 W ULV CPU shows that the latter model experiences a similar initial reduction of the CPU performance, but its CPU cores stabilize at higher clock rates and at a lower temperature. A repeat of 3DMark 11 on battery shows nearly unchanged GPU and CPU performance with Physics and Graphics scores within a couple of percent of our previous run and thus a near-identical final score.
| CPU Clock (GHz) | GPU Clock (MHz) | Average CPU Temperature (°C) | Average GPU Temperature (°C) | |
| Prime95 Stress | 1.8 - 2.6 | - | 80-90 | - |
| FurMark Stress | - | 990 | - | 88 |
| Prime95 + FurMark Stress | 1.7-2.1 | 888 | 90-91 | 85-87 |
Emissions
System Noise
Since the CPU is rated at 45 W and the laptop features a dedicated - albeit comparatively low-end - graphics card as well, the fan system has to work harder to get rid of the generated heat and the 5491 is thus noisier than its sibling. We measured up to 46 dB under maximum load - the 5490 with 15 W CPU reached 43 dB. The Latitude 5491 is by far the loudest notebook in our comparison under heavy stress, but the fans remain mostly silent during normal tasks like word processing or browsing.
Coil whine is thankfully absent on our unit even when running SSD benchmark tests.
Noise level
| Idle |
| 29.5 / 29.5 / 31.5 dB(A) |
| Load |
| 46.2 / 46.2 dB(A) |
 | ||
30 dB silent 40 dB(A) audible 50 dB(A) loud |
||
min: | ||
| Dell Latitude 5491 GeForce MX130, i7-8850H, Toshiba XG5 KXG50ZNV512G | Dell Latitude 5490 UHD Graphics 620, i7-8650U, Samsung PM961 MZVLW256HEHP | Lenovo ThinkPad T480-20L6S01V00 GeForce MX150, i5-8550U, Samsung SSD PM981 MZVLB512HAJQ | Toshiba Tecra X40-E-10W UHD Graphics 620, i5-8250U, Samsung PM961 MZVLW256HEHP | HP EliteBook 840 G5-3JX61EA UHD Graphics 620, i5-8550U, Toshiba KXG50ZNV1T02 | Acer TravelMate P648-G2-M-73T0 HD Graphics 620, i7-7500U, SK Hynix HFS256G39TND-N210A | |
|---|---|---|---|---|---|---|
| Noise | 9% | 10% | 2% | 8% | 8% | |
| off / environment * (dB) | 29.5 | 27.8 6% | 29 2% | 30.5 -3% | 30.3 -3% | 30.6 -4% |
| Idle Minimum * (dB) | 29.5 | 27.8 6% | 29 2% | 30.5 -3% | 30.3 -3% | 30.6 -4% |
| Idle Average * (dB) | 29.5 | 27.8 6% | 29 2% | 30.5 -3% | 30.3 -3% | 30.6 -4% |
| Idle Maximum * (dB) | 31.5 | 31 2% | 29 8% | 31.2 1% | 30.3 4% | 31 2% |
| Load Average * (dB) | 46.2 | 34.2 26% | 35.6 23% | 43.9 5% | 33.8 27% | 34.5 25% |
| Load Maximum * (dB) | 46.2 | 42.7 8% | 35.6 23% | 40.1 13% | 33.8 27% | 32.4 30% |
| Witcher 3 ultra * (dB) | 32.5 |
* ... smaller is better
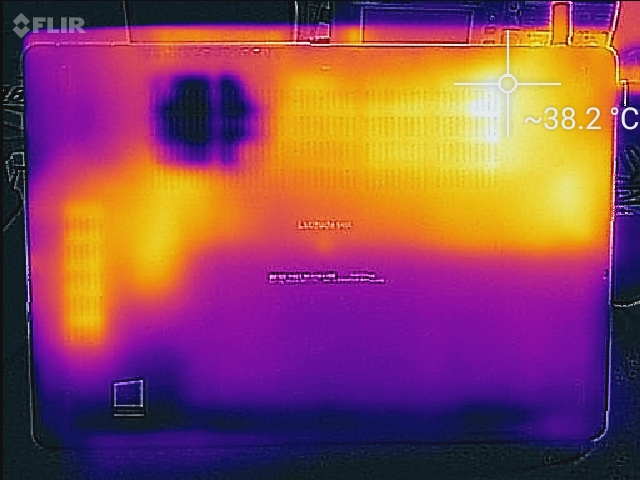
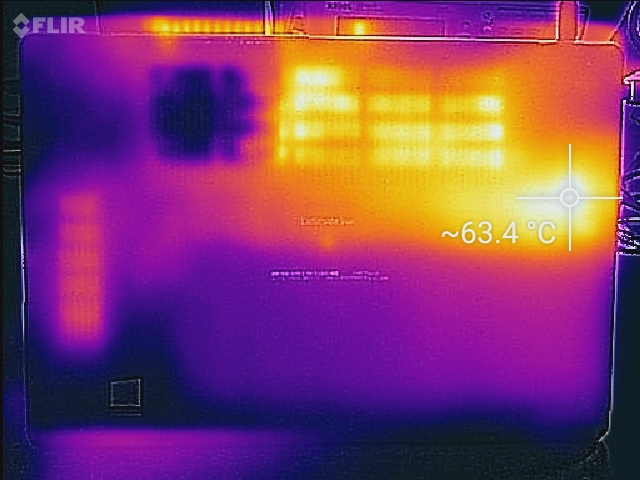
Temperature
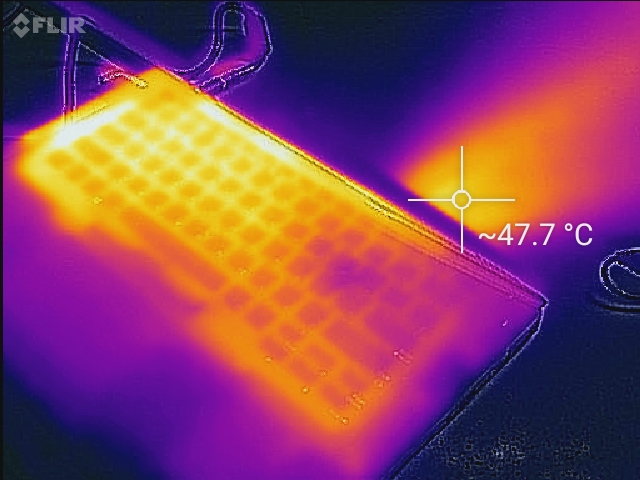
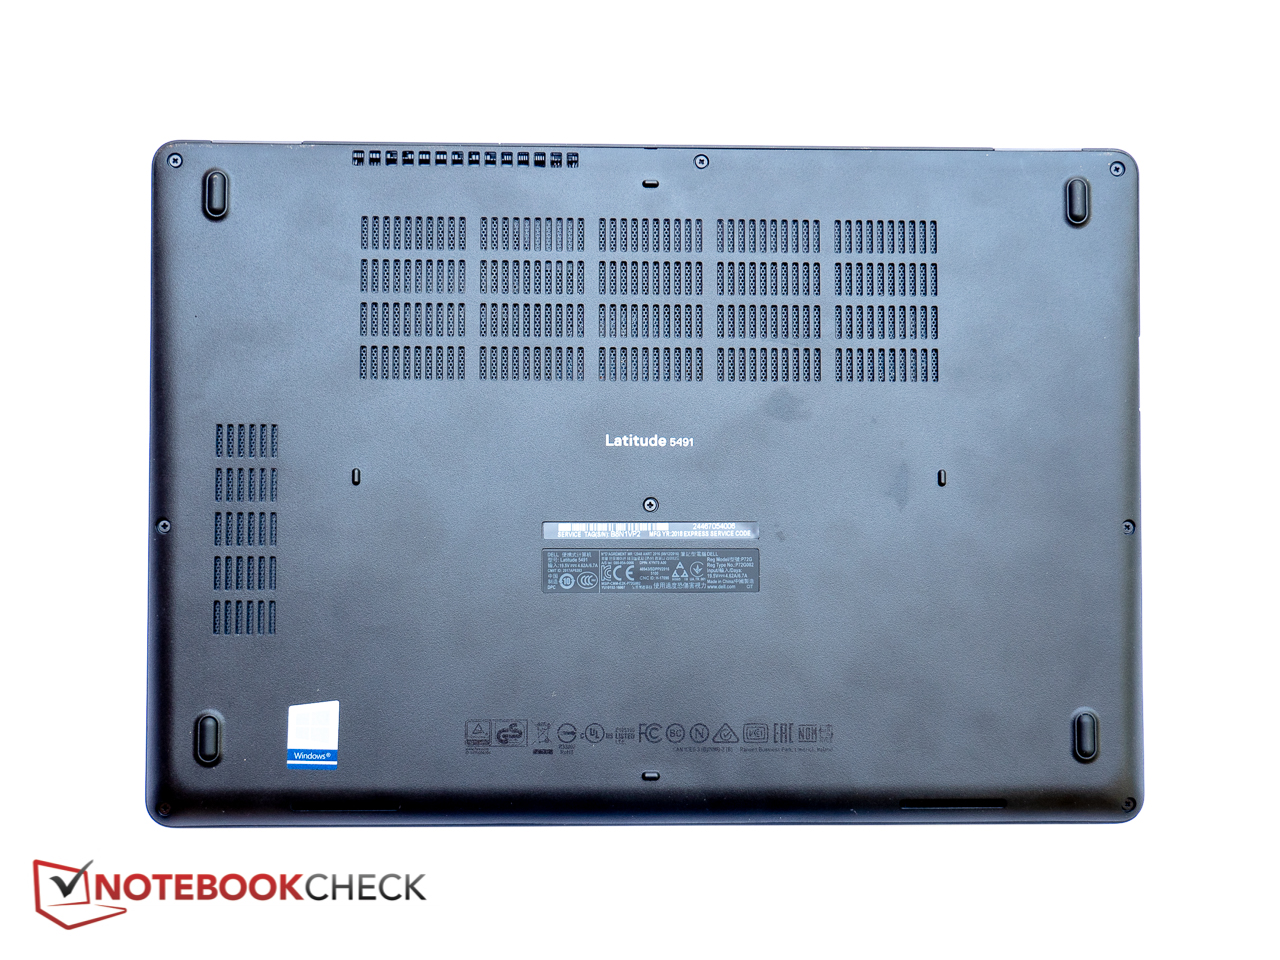
High internal temperatures and a fan system that seems to be struggling to keep the temperatures in check: the additional power draw of the hexa-core Coffee Lake-H CPU and MX130 GPU means that the Latitude 5491 gets hot - very hot. While reasonably flat at idle, the temperature differential between adjacent quadrants easily exceeds 30 C under load, although the palm rests remain cool to the touch. The hot spot of 63 C on the bottom left also means that it's next to impossible to work with the notebook on the lap under these conditions. The Latitude 5490 with Core i7-8650U tops out at a paltry 48 C by comparison, while the Lenovo ThinkPad T480 with ULV CPU and GeForce MX150 manages to reach 50 C just in one area.
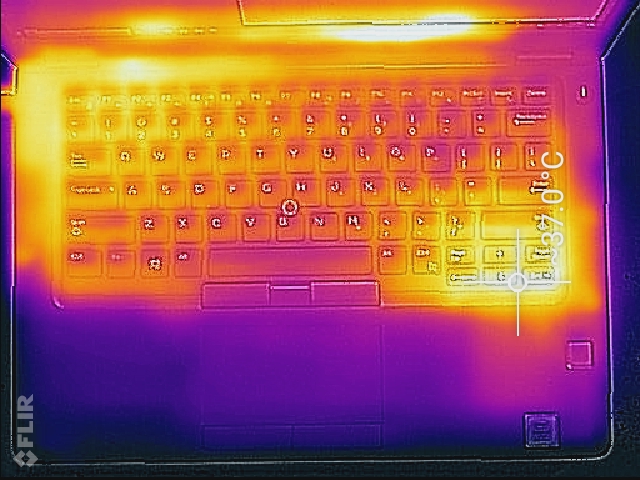
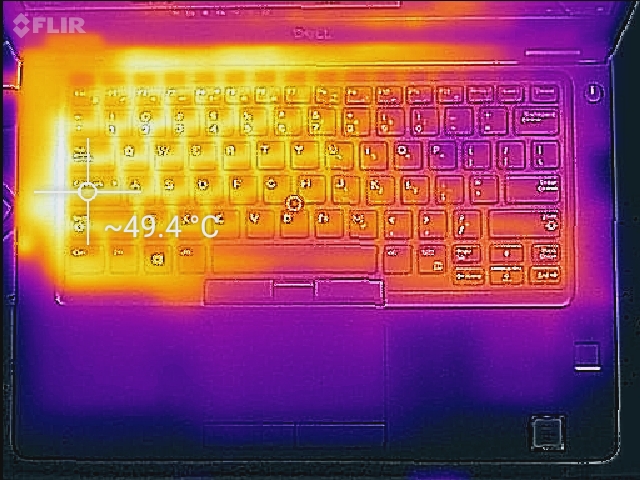
(-) The maximum temperature on the upper side is 48.6 °C / 119 F, compared to the average of 34.3 °C / 94 F, ranging from 21.2 to 62.5 °C for the class Office.
(-) The bottom heats up to a maximum of 62.8 °C / 145 F, compared to the average of 36.8 °C / 98 F
(+) In idle usage, the average temperature for the upper side is 31.1 °C / 88 F, compared to the device average of 29.5 °C / 85 F.
(+) The palmrests and touchpad are cooler than skin temperature with a maximum of 29 °C / 84.2 F and are therefore cool to the touch.
(±) The average temperature of the palmrest area of similar devices was 27.6 °C / 81.7 F (-1.4 °C / -2.5 F).
Speakers
The speakers located on the front edge project sit at an angle and are a direct carryover from the 5490. The sound quality is acceptable for a business notebook and the speakers get loud enough for medium-sized rooms. At maximum volume, the palm rests vibrate noticeably, but there is no rattling or excessive distortion. As always, we recommend headphones for a more satisfying audio experience.


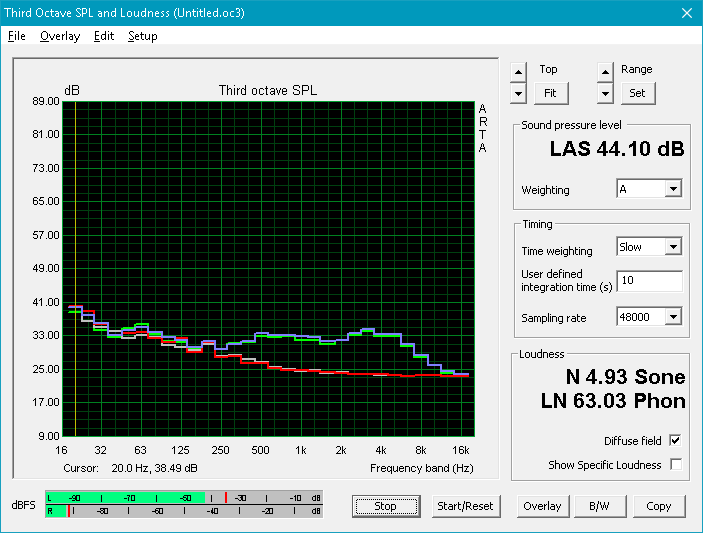
Dell Latitude 5491 audio analysis
(±) | speaker loudness is average but good (76.3 dB)
Bass 100 - 315 Hz
(-) | nearly no bass - on average 15.6% lower than median
(±) | linearity of bass is average (8.5% delta to prev. frequency)
Mids 400 - 2000 Hz
(±) | higher mids - on average 5.7% higher than median
(±) | linearity of mids is average (7.2% delta to prev. frequency)
Highs 2 - 16 kHz
(±) | higher highs - on average 6.8% higher than median
(±) | linearity of highs is average (13.4% delta to prev. frequency)
Overall 100 - 16.000 Hz
(±) | linearity of overall sound is average (22.4% difference to median)
Compared to same class
» 60% of all tested devices in this class were better, 9% similar, 32% worse
» The best had a delta of 7%, average was 21%, worst was 53%
Compared to all devices tested
» 66% of all tested devices were better, 6% similar, 29% worse
» The best had a delta of 4%, average was 23%, worst was 134%
Apple MacBook 12 (Early 2016) 1.1 GHz audio analysis
(+) | speakers can play relatively loud (83.6 dB)
Bass 100 - 315 Hz
(±) | reduced bass - on average 11.3% lower than median
(±) | linearity of bass is average (14.2% delta to prev. frequency)
Mids 400 - 2000 Hz
(+) | balanced mids - only 2.4% away from median
(+) | mids are linear (5.5% delta to prev. frequency)
Highs 2 - 16 kHz
(+) | balanced highs - only 2% away from median
(+) | highs are linear (4.5% delta to prev. frequency)
Overall 100 - 16.000 Hz
(+) | overall sound is linear (10.2% difference to median)
Compared to same class
» 7% of all tested devices in this class were better, 2% similar, 90% worse
» The best had a delta of 5%, average was 18%, worst was 53%
Compared to all devices tested
» 5% of all tested devices were better, 1% similar, 94% worse
» The best had a delta of 4%, average was 23%, worst was 134%
Energy Management
Power Consumption
Idle power draw is up significantly compared to Latitude 5490 and ranges between 7.5 and 13 W when idling on the desktop. Dell's own 15-inch Dell XPS 15 with i5-8300H and GeForce GTX 1050 tops out at 7.5 W here. The Latitude requires 75 W and 107 W at medium and high load levels, which is quite a lot for a business notebook and comparable to the draw of the XPS 15 as well as the larger 15-inch Latitude 5591, which features the same hardware. Notebooks with ULV CPUs like the ThinkPad T480 require 40 W less at maximum load levels.
The AC adapter is rated for 130 W and easily copes with the maximum power draw.
| Off / Standby | |
| Idle | |
| Load |
|
Key:
min: | |
| Dell Latitude 5491 i7-8850H, GeForce MX130, Toshiba XG5 KXG50ZNV512G, IPS, 1920x1080, 14" | Lenovo ThinkPad T480-20L6S01V00 i5-8550U, GeForce MX150, Samsung SSD PM981 MZVLB512HAJQ, IPS, 1920x1080, 14" | Lenovo ThinkPad T480s-20L8S02E00 i5-8550U, GeForce MX150, Samsung SSD PM981 MZVLB512HAJQ, IPS LED, 2560x1440, 14" | Toshiba Tecra X40-E-10W i5-8250U, UHD Graphics 620, Samsung PM961 MZVLW256HEHP, IPS, 1920x1080, 14" | HP EliteBook 840 G5-3JX61EA i5-8550U, UHD Graphics 620, Toshiba KXG50ZNV1T02, IPS, 1920x1080, 14" | Dell Latitude 5490 i7-8650U, UHD Graphics 620, Samsung PM961 MZVLW256HEHP, IPS, 1920x1080, 14" | Dell XPS 15 2018 i5 FHD 97Wh i5-8300H, GeForce GTX 1050 Mobile, Lite-On CA3-8D256-Q11, LED IGZO IPS InfinityEdge, 1920x1080, 15.6" | |
|---|---|---|---|---|---|---|---|
| Power Consumption | 31% | 31% | 43% | 40% | 44% | 28% | |
| Idle Minimum * (Watt) | 7.5 | 3.6 52% | 3.4 55% | 4.5 40% | 3.8 49% | 3.9 48% | 2.9 61% |
| Idle Average * (Watt) | 9.7 | 7.1 27% | 7.5 23% | 8.2 15% | 8.3 14% | 6.2 36% | 5.8 40% |
| Idle Maximum * (Watt) | 13 | 9.5 27% | 10.8 17% | 9.3 28% | 10.7 18% | 7.7 41% | 7.5 42% |
| Load Average * (Watt) | 74.3 | 63.9 14% | 55.4 25% | 30.4 59% | 35.5 52% | 43.9 41% | 77.5 -4% |
| Load Maximum * (Watt) | 106.6 | 67.3 37% | 70.3 34% | 30.4 71% | 37 65% | 47.7 55% | 107 -0% |
| Witcher 3 ultra * (Watt) | 53.9 | 34 | 84 |
* ... smaller is better
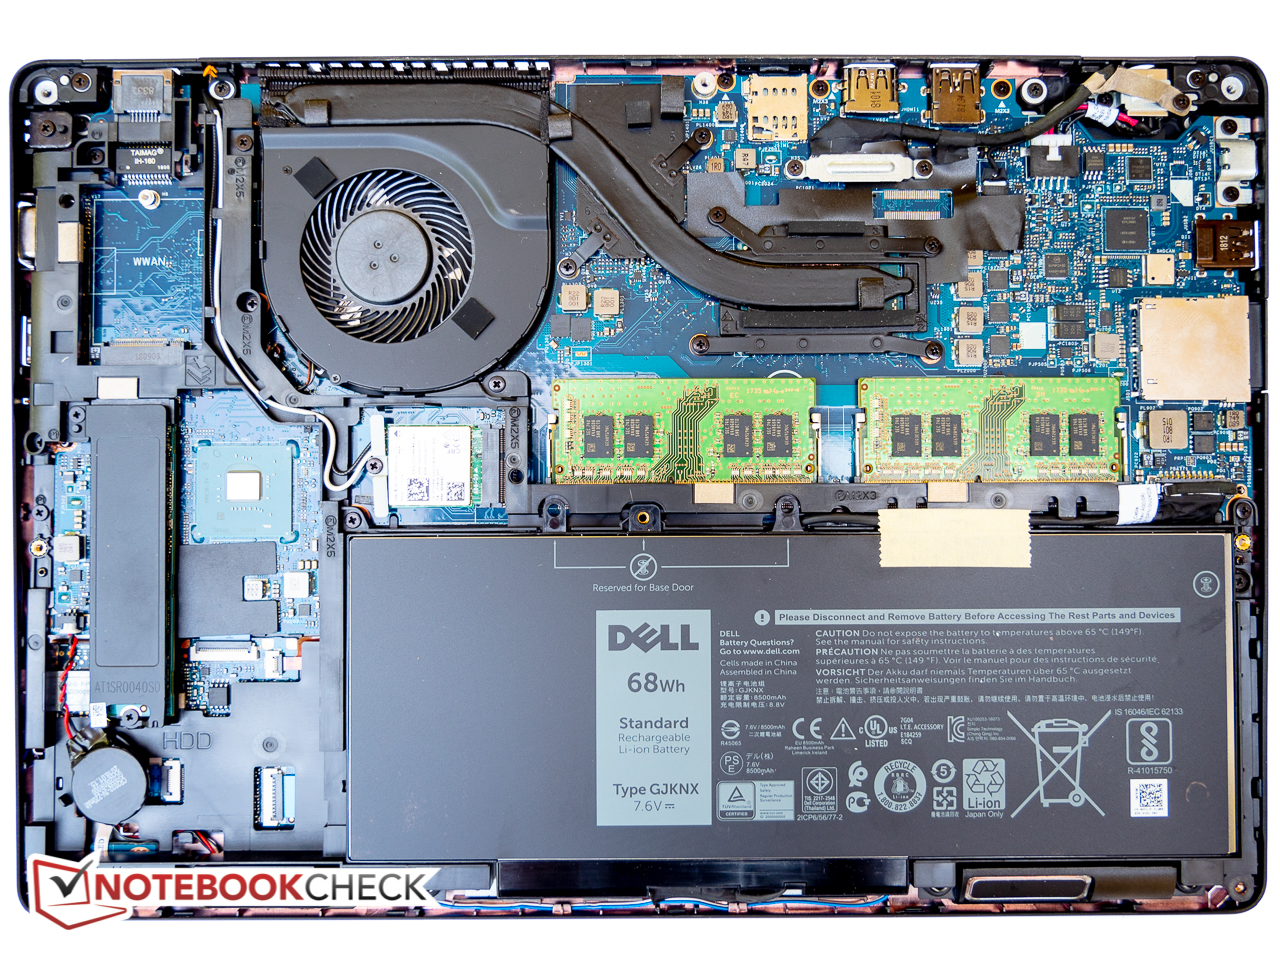
Battery Life
Since the battery capacity remains unchanged at 68 Wh, the higher power draw has a negative impact on the battery life. Under normal condition, users can expect about 9.5 hours of real-world WLAN use with a screen brightness of 150 nits and the balanced profile active. The Latitude 5490 with i7-8650U and integrated graphics lasted a good 2 hours longer. The ThinkPad T480 with ULV i7 processor and GeForce MX150 has a slightly larger battery (72 Wh) and lasts over 13 hours on a charge.
| Dell Latitude 5491 i7-8850H, GeForce MX130, 68 Wh | Lenovo ThinkPad T480-20L6S01V00 i5-8550U, GeForce MX150, 72 Wh | Toshiba Tecra X40-E-10W i5-8250U, UHD Graphics 620, 48 Wh | HP EliteBook 840 G5-3JX61EA i5-8550U, UHD Graphics 620, 50 Wh | Dell Latitude 5490 i7-8650U, UHD Graphics 620, 68 Wh | Lenovo ThinkPad T480s-20L8S02E00 i5-8550U, GeForce MX150, 57 Wh | |
|---|---|---|---|---|---|---|
| Battery runtime | 71% | -14% | -23% | 21% | 9% | |
| Reader / Idle (h) | 16.8 | 27.9 66% | 22.8 36% | |||
| WiFi v1.3 (h) | 9.6 | 13.2 38% | 8.3 -14% | 7.4 -23% | 11.6 21% | 8.8 -8% |
| Load (h) | 1.3 | 2.7 108% | 1.3 0% |
Pros
Cons
Verdict
The Latitude 5491 with hexa-core i7-8850H CPU and Nvidia GeForce MX130 outperforms the Latitude 5490 models with ULV CPUs and integrated graphics - at times substantially so. Of course, in order to benefit from the two additional CPU cores, the application has to be designed to take advantage of the additional threads. Aside from the considerable boost in performance, the Latitude 5491 ticks all the right check boxes, as it is still the same well-designed and secure business notebook with great input devices and good ergonomics.
That said, there's definitely room for improvement: the new Latitude runs very hot under load and the turbo boost sustainability is rather poor as a result. The fans have to work harder and the system is noisier than before. Dell also decided to go with the same glossy FHD touchscreeen display the Latitude 5490 is equipped with. The panel leaves much to be desired, as the brightness is way too low for outdoor use and both the gamut as well as the color accuracy fail to impress. In addition, the new notebook ships with a larger and much heavier power adapter and lasts shorter on a charge.
Road warriors who primarily focus on word processing, spreadsheets and web browsing are likely better off with the Latitude 5490, which features a longer battery life and doesn't get nearly as hot or noisy. Users who are content with the performance a ULV CPU has to offer might also consider Lenovo's excellent ThinkPad T480 or T480s.
Dell Latitude 5491
- 07/30/2018 v6 (old)
Bernie Pechlaner
Price comparison