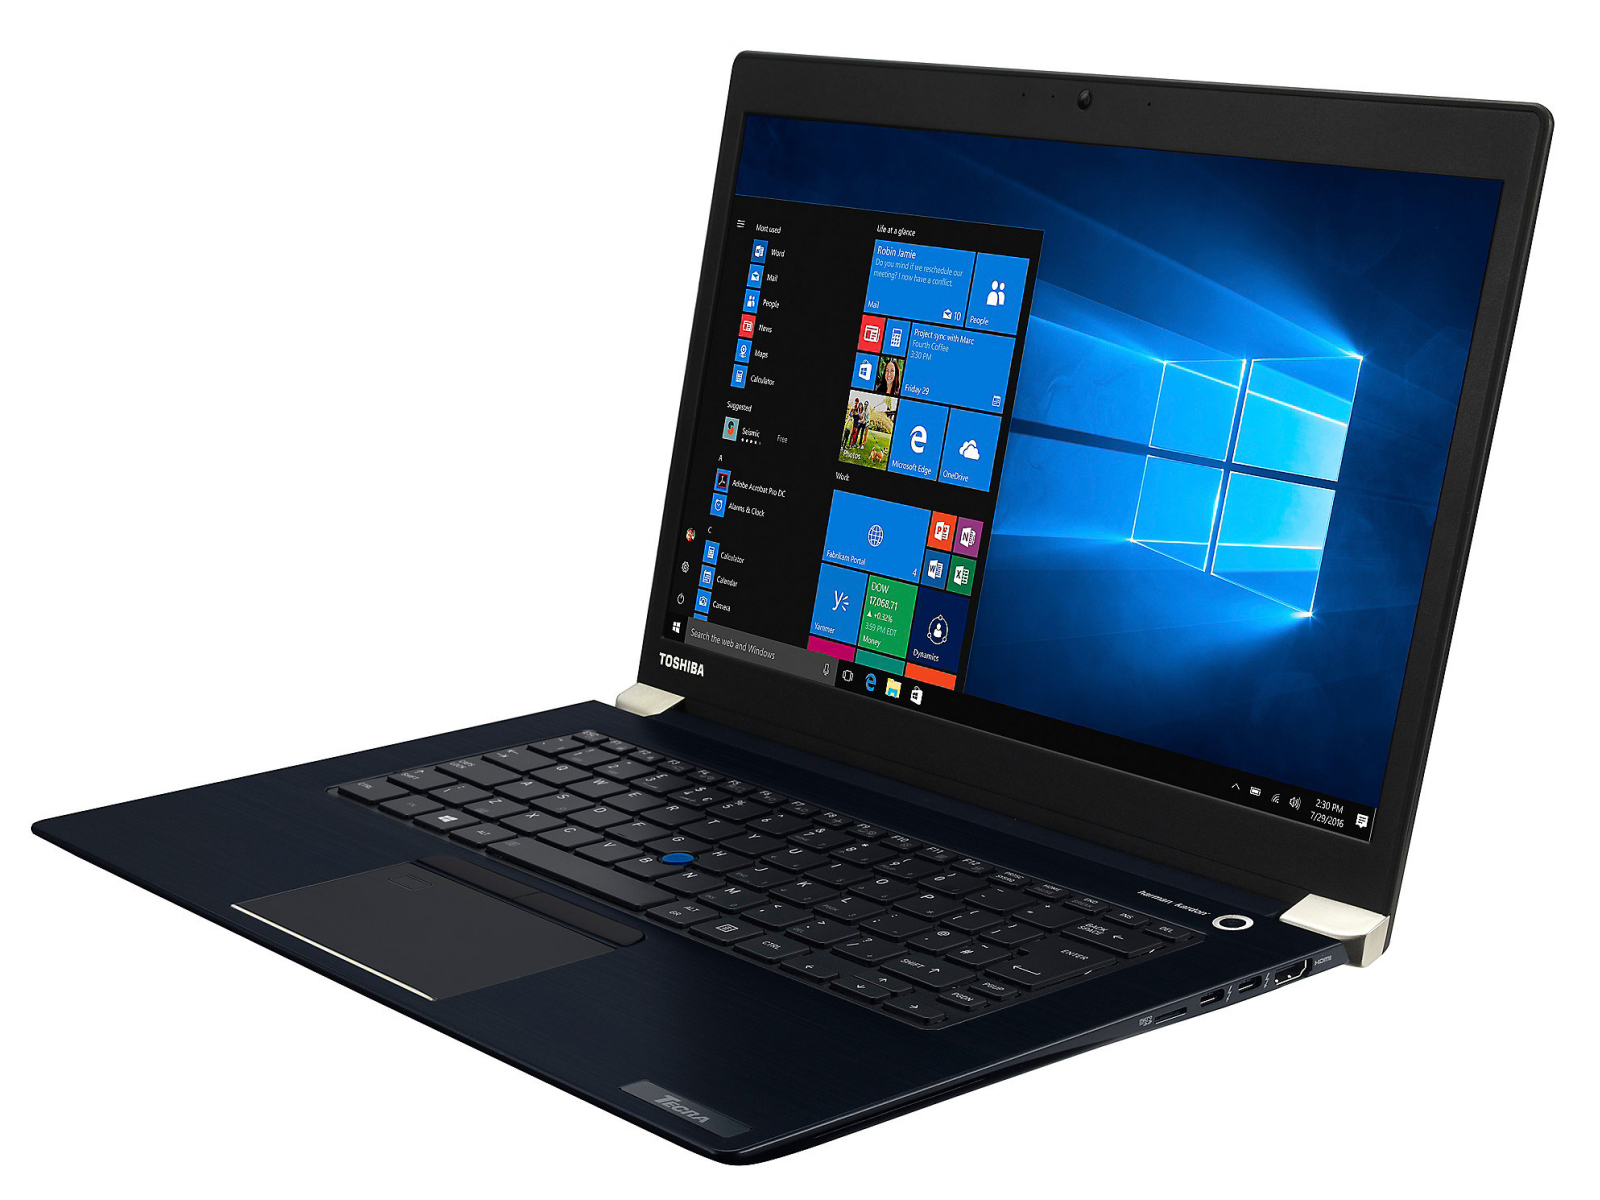
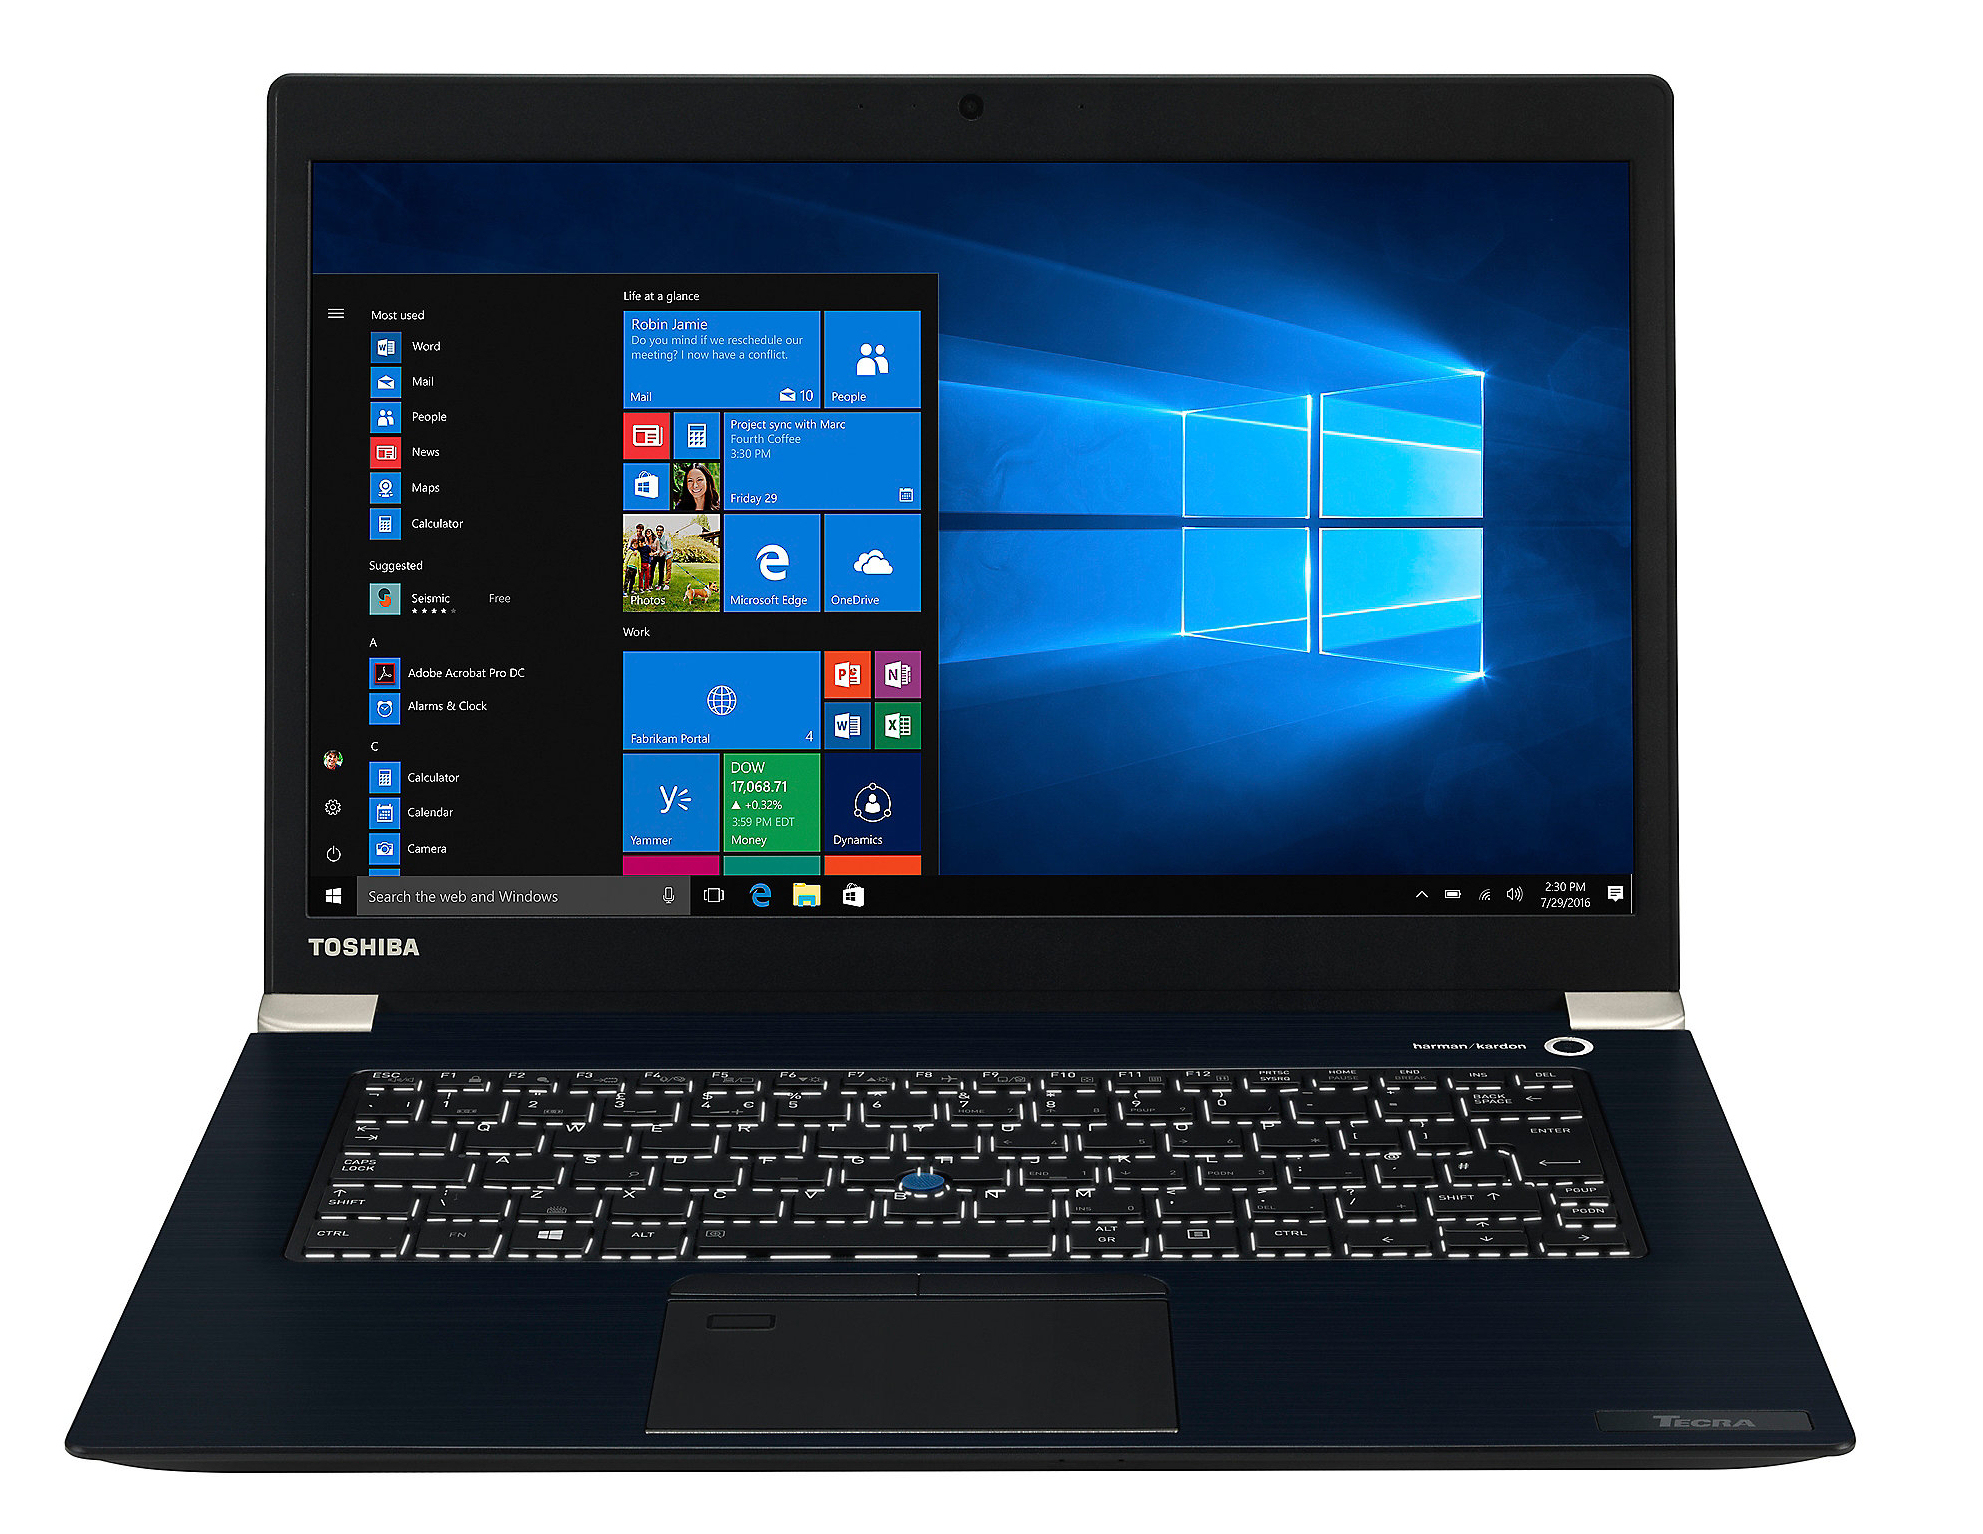
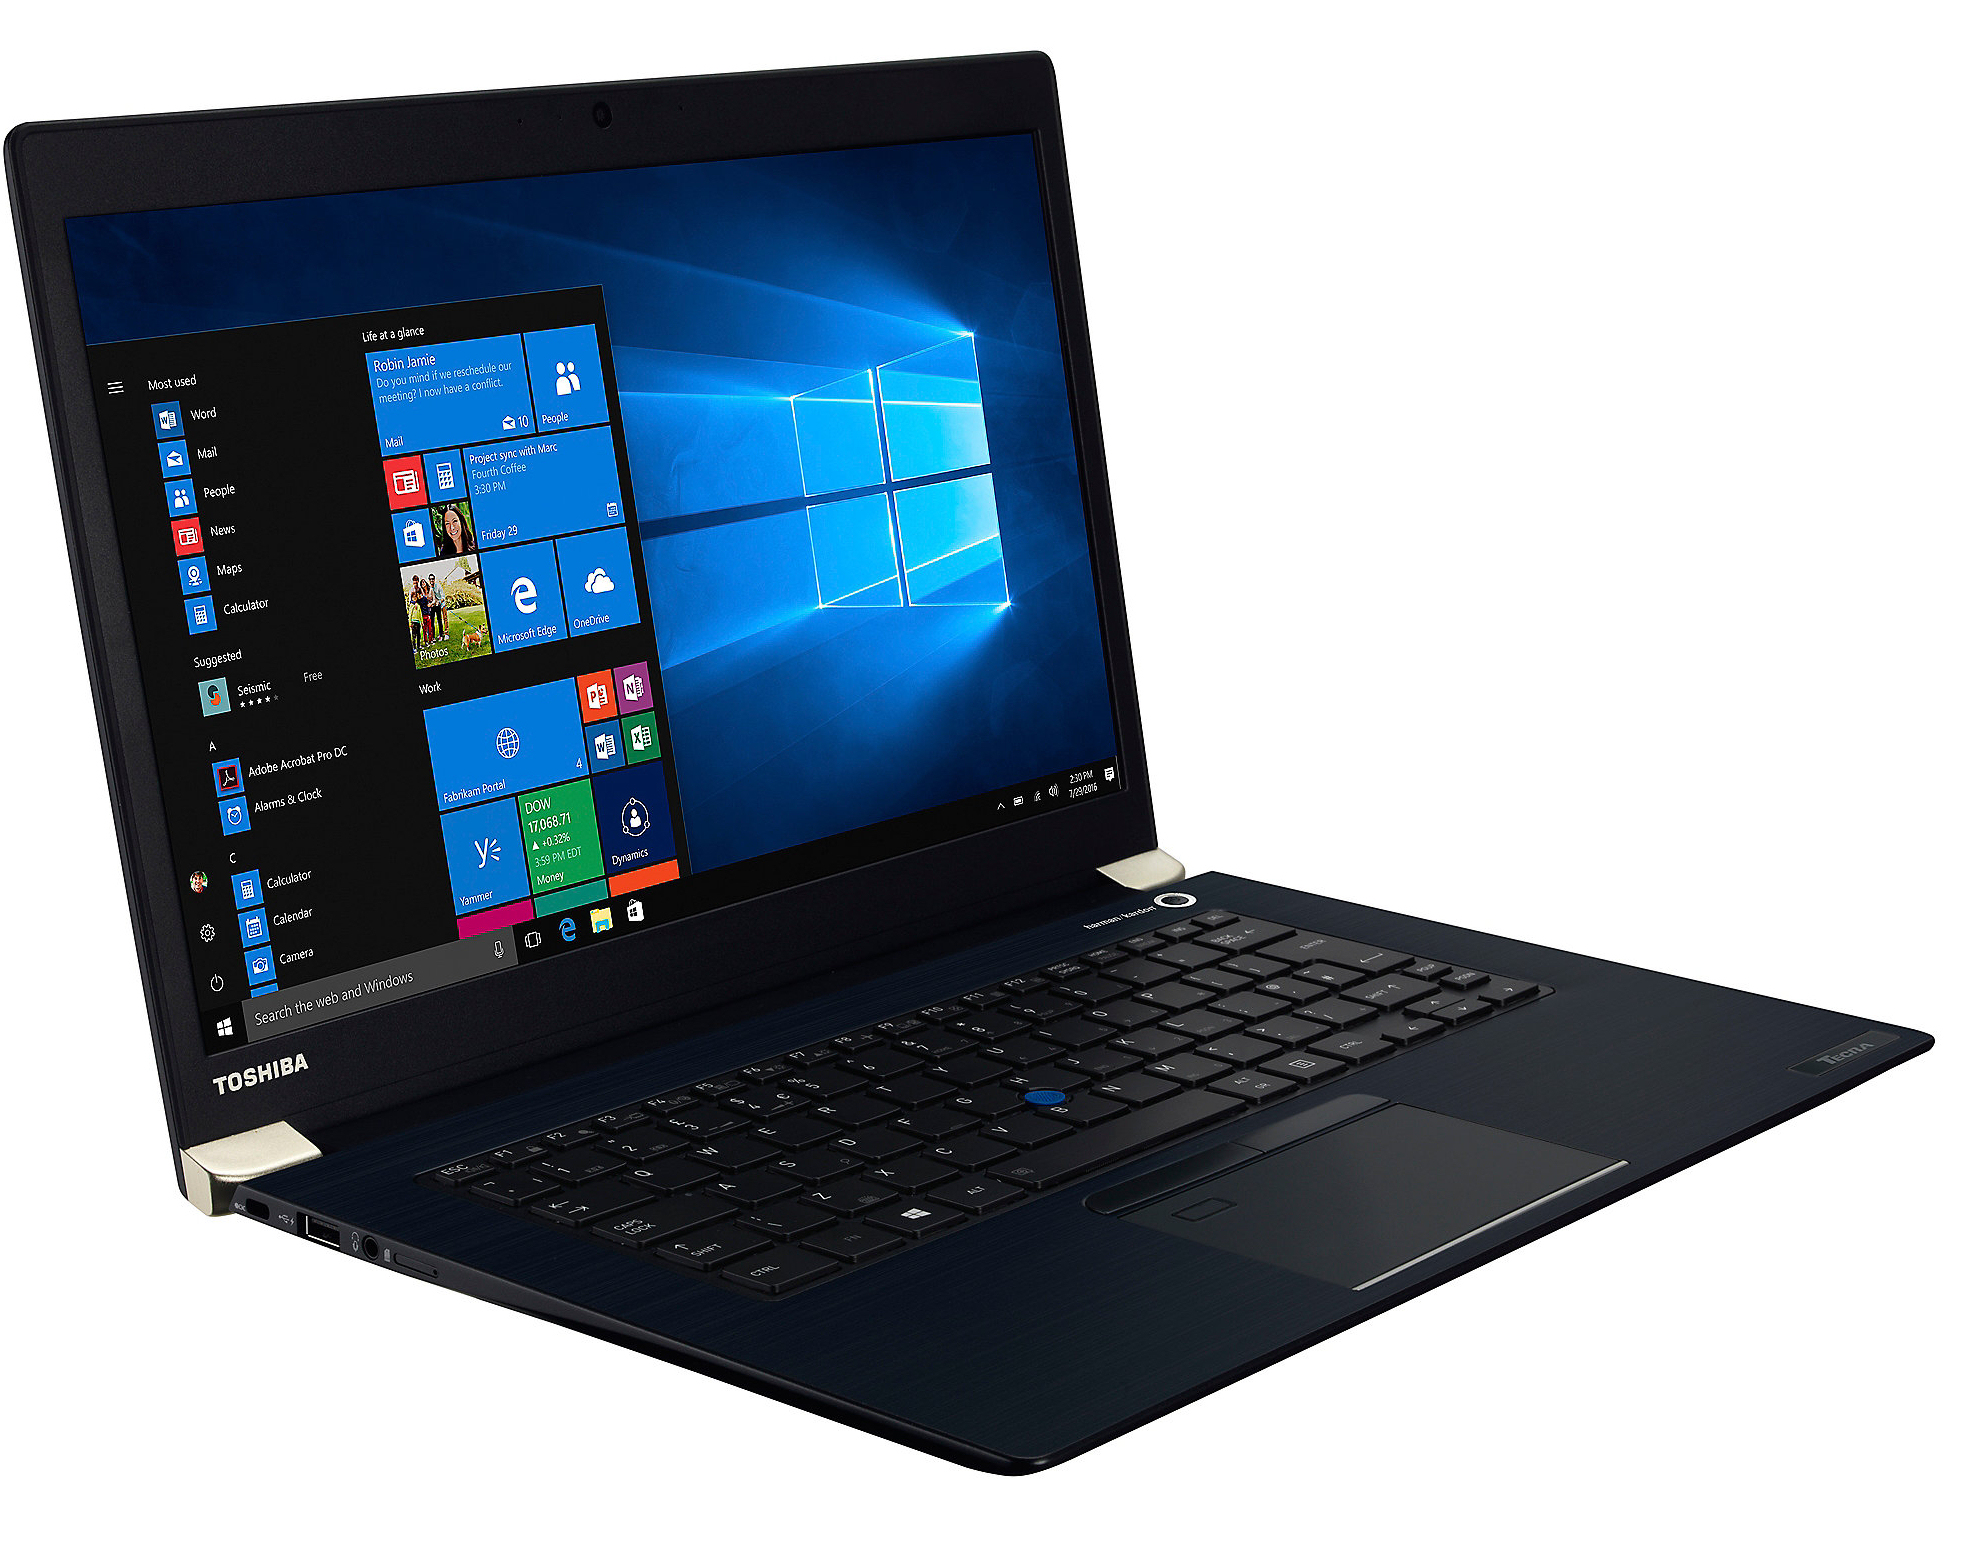
Toshiba Tecra X40-E (i5-8250U, SSD, LTE, FHD) Laptop Review
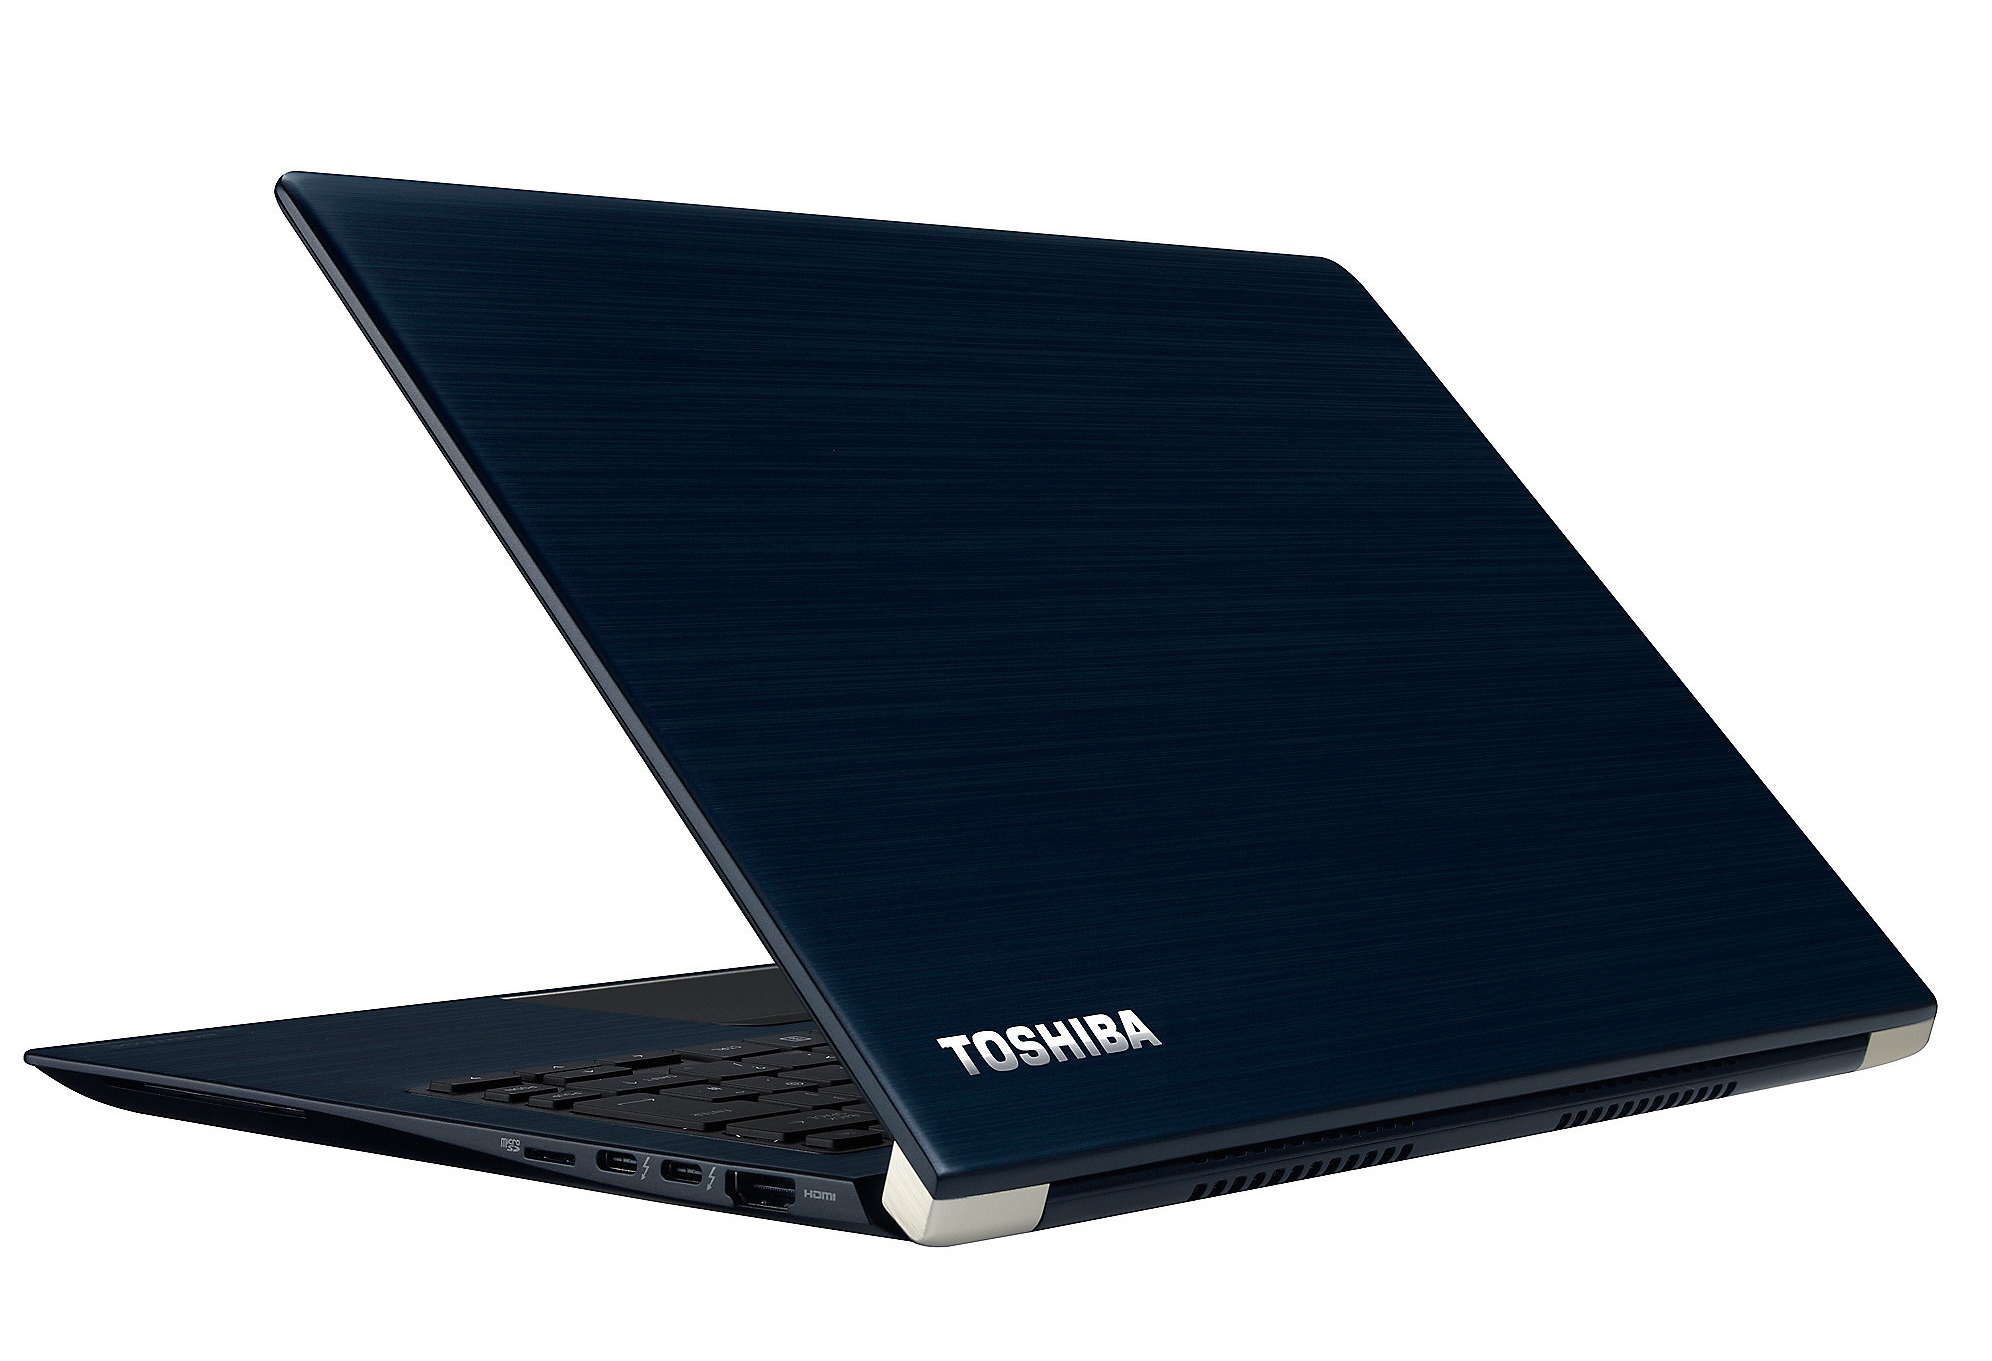
With the Tecra X40-E, Toshiba presents the successor of the Tecra X40-D 14-inch business notebook. The only difference between the two devices lies inside, and the new models are equipped with quad-core processors of the Kaby-Lake-Refresh generation. Otherwise, the two models have an identical build. The Tecra competitors are notebooks such as the Fujitsu LifeBook U748, the Dell Latitude 7490, the HP EliteBook 840 G5, and the Lenovo ThinkPad X1 Carbon.
Since the Tecra X40-E and the Tecra X40-D share an identical build, we are not addressing the case, features, input devices, display, and speakers again here. You can find this information in the Tecra X40-D review.
| SD Card Reader | |
| average JPG Copy Test (av. of 3 runs) | |
| Lenovo ThinkPad X1 Carbon 2018-20KGS03900 (Toshiba Exceria Pro M501) | |
| Dell Latitude 7490 (Toshiba Exceria Pro M501 UHS-II) | |
| Toshiba Tecra X40-D | |
| Fujitsu LifeBook U748 (Toshiba Exceria Pro SDXC 64 GB UHS-II) | |
| Toshiba Tecra X40-E-10W (Toshiba Exceria Pro M501 microSDXC 64GB) | |
| Average of class Office (22.4 - 198.5, n=21, last 2 years) | |
| maximum AS SSD Seq Read Test (1GB) | |
| Lenovo ThinkPad X1 Carbon 2018-20KGS03900 (Toshiba Exceria Pro M501) | |
| Dell Latitude 7490 (Toshiba Exceria Pro M501 UHS-II) | |
| Toshiba Tecra X40-D | |
| Toshiba Tecra X40-E-10W (Toshiba Exceria Pro M501 microSDXC 64GB) | |
| Fujitsu LifeBook U748 (Toshiba Exceria Pro SDXC 64 GB UHS-II) | |
| Average of class Office (27.4 - 249, n=20, last 2 years) | |
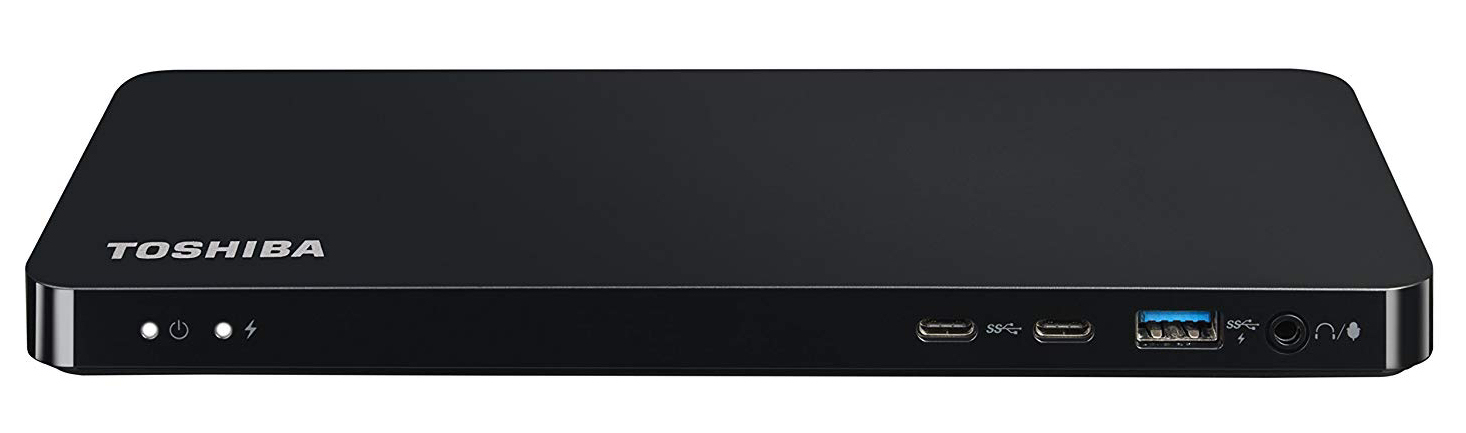
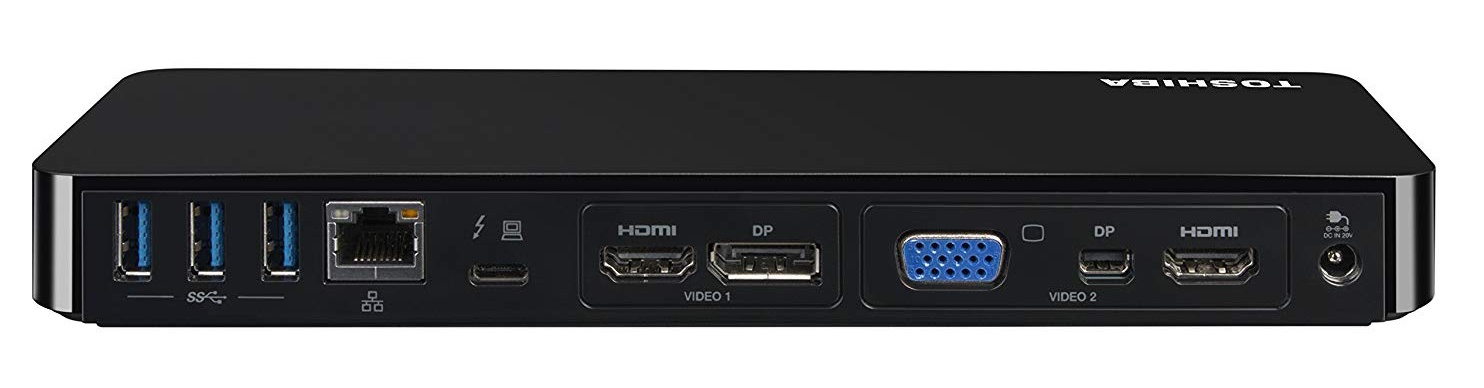
Accessories
You can expand the limited number of offered connections of the Tecra by using a docking station. With the Thunderbolt 3 Dock (PA5281E-1PRP), Toshiba offers the corresponding model that was also provided to us. In addition to the docking station, there is also a connection cable and a 100-Watt power supply.
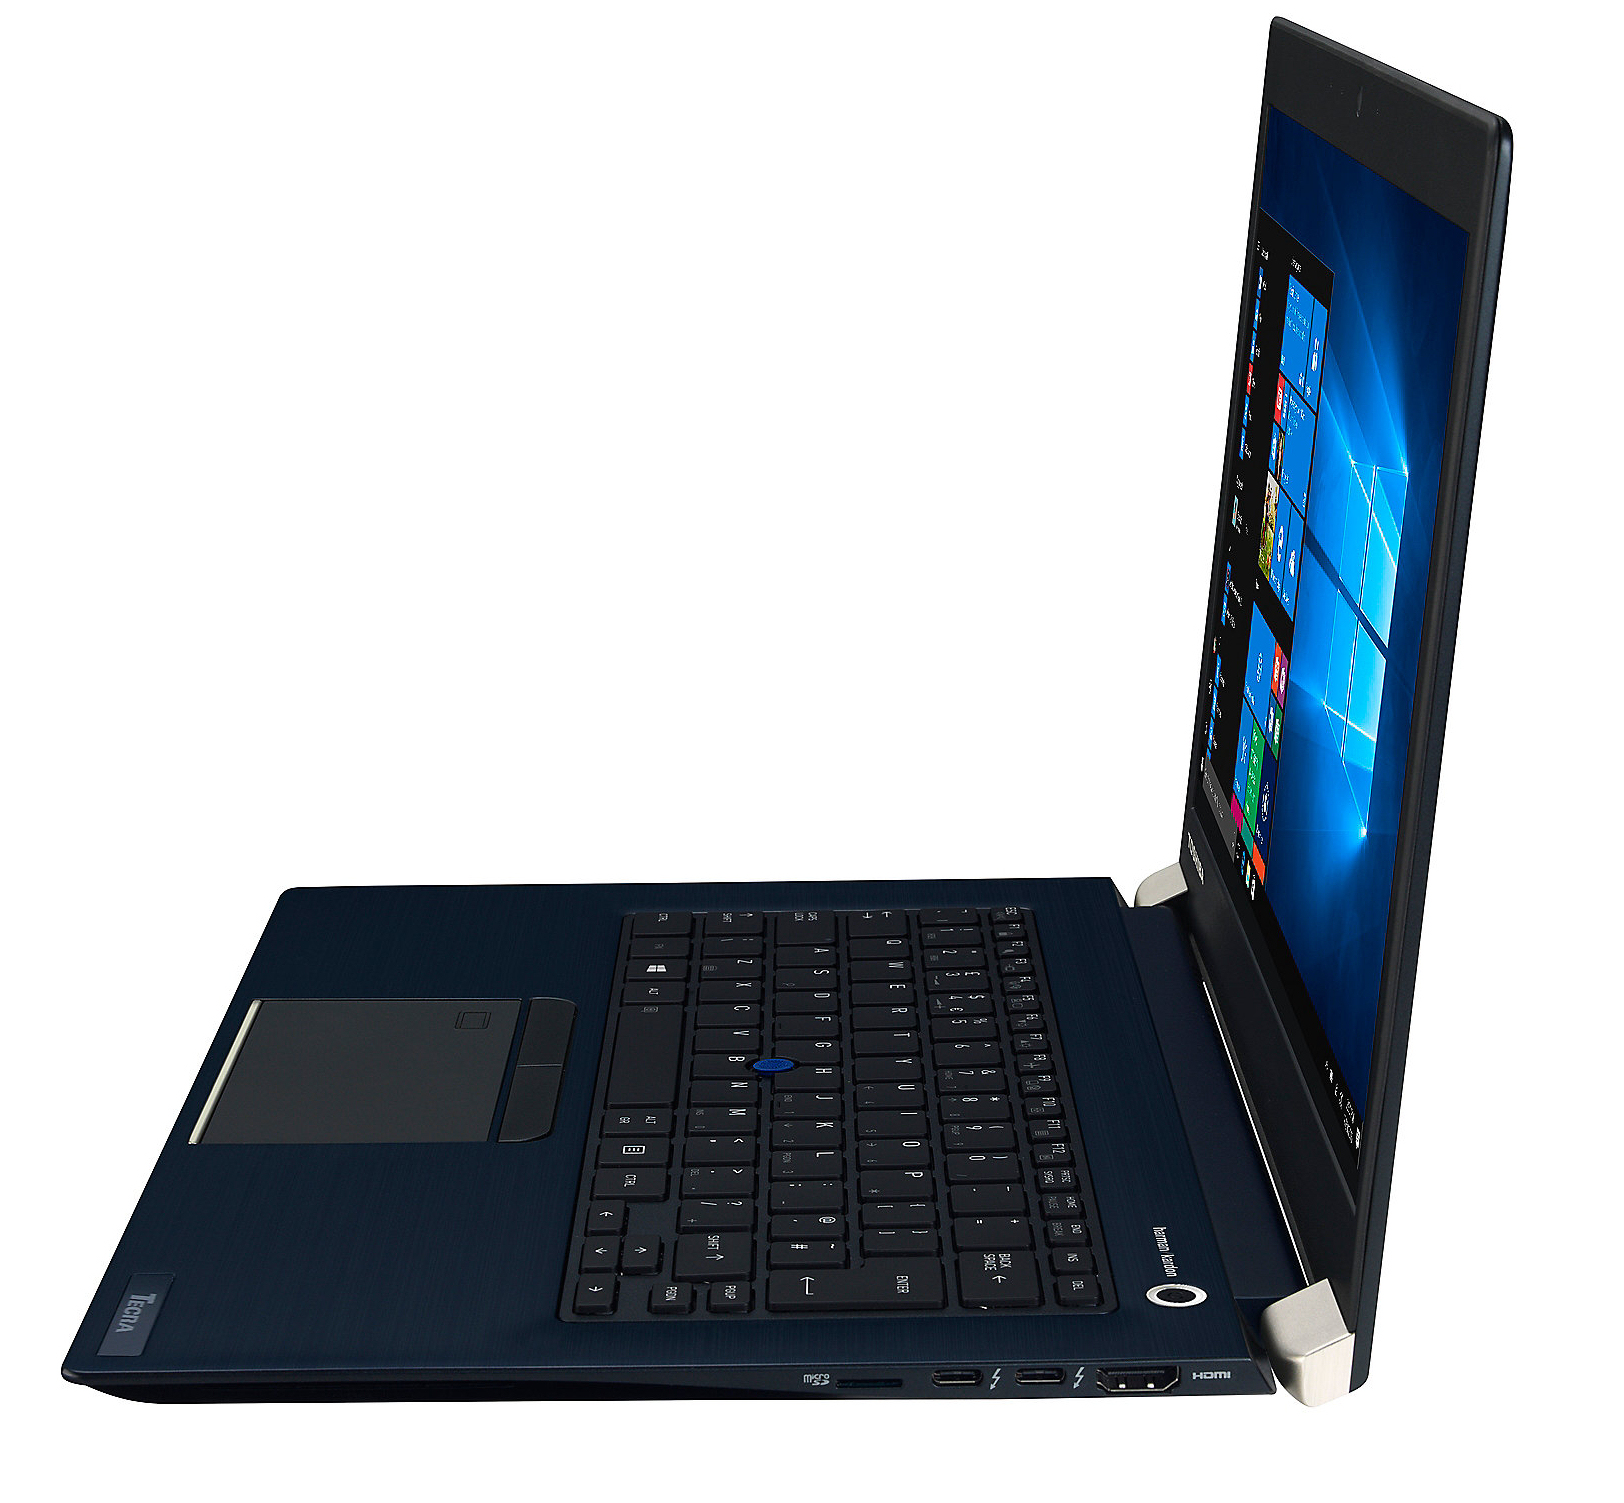
Display - Toshiba is using an In-Cell touchscreen display
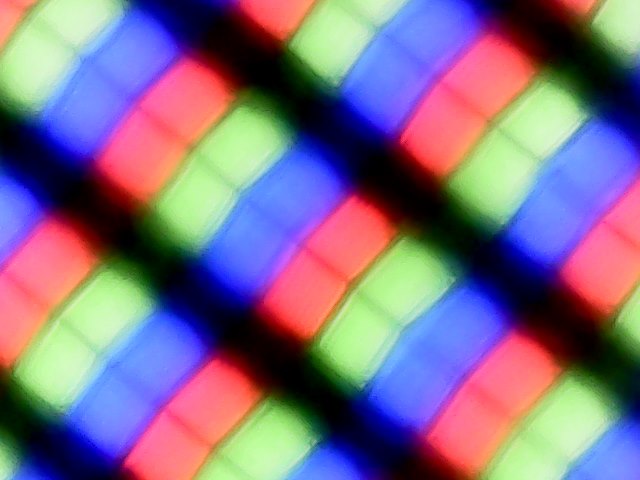
Toshiba has equipped the Tecra with a 14-inch touchscreen display that has a native resolution of 1920x1080 pixels. At 1330:1, the contrast is good. In terms of its brightness (244.4 cd/m²), the display is disappointing and remains clearly behind the values of the competitors. The price level of the Tecra would demand a value beyond 300 cd/m², and we consider values that are in that range to be good.
At brightness levels of 90% and below, the display shows PWM with a frequency of 21,000 Hz. Such a high frequency should not lead to any headaches or eye problems even for sensitive people.
The Tecra X40-E is equipped with the same display that is also in the predecessor model we tested before. Nonetheless, the measured values are slightly different. This is normal, since two displays of an identical build will never be 100% the same.
| |||||||||||||||||||||||||
Brightness Distribution: 86 %
Center on Battery: 266 cd/m²
Contrast: 1330:1 (Black: 0.2 cd/m²)
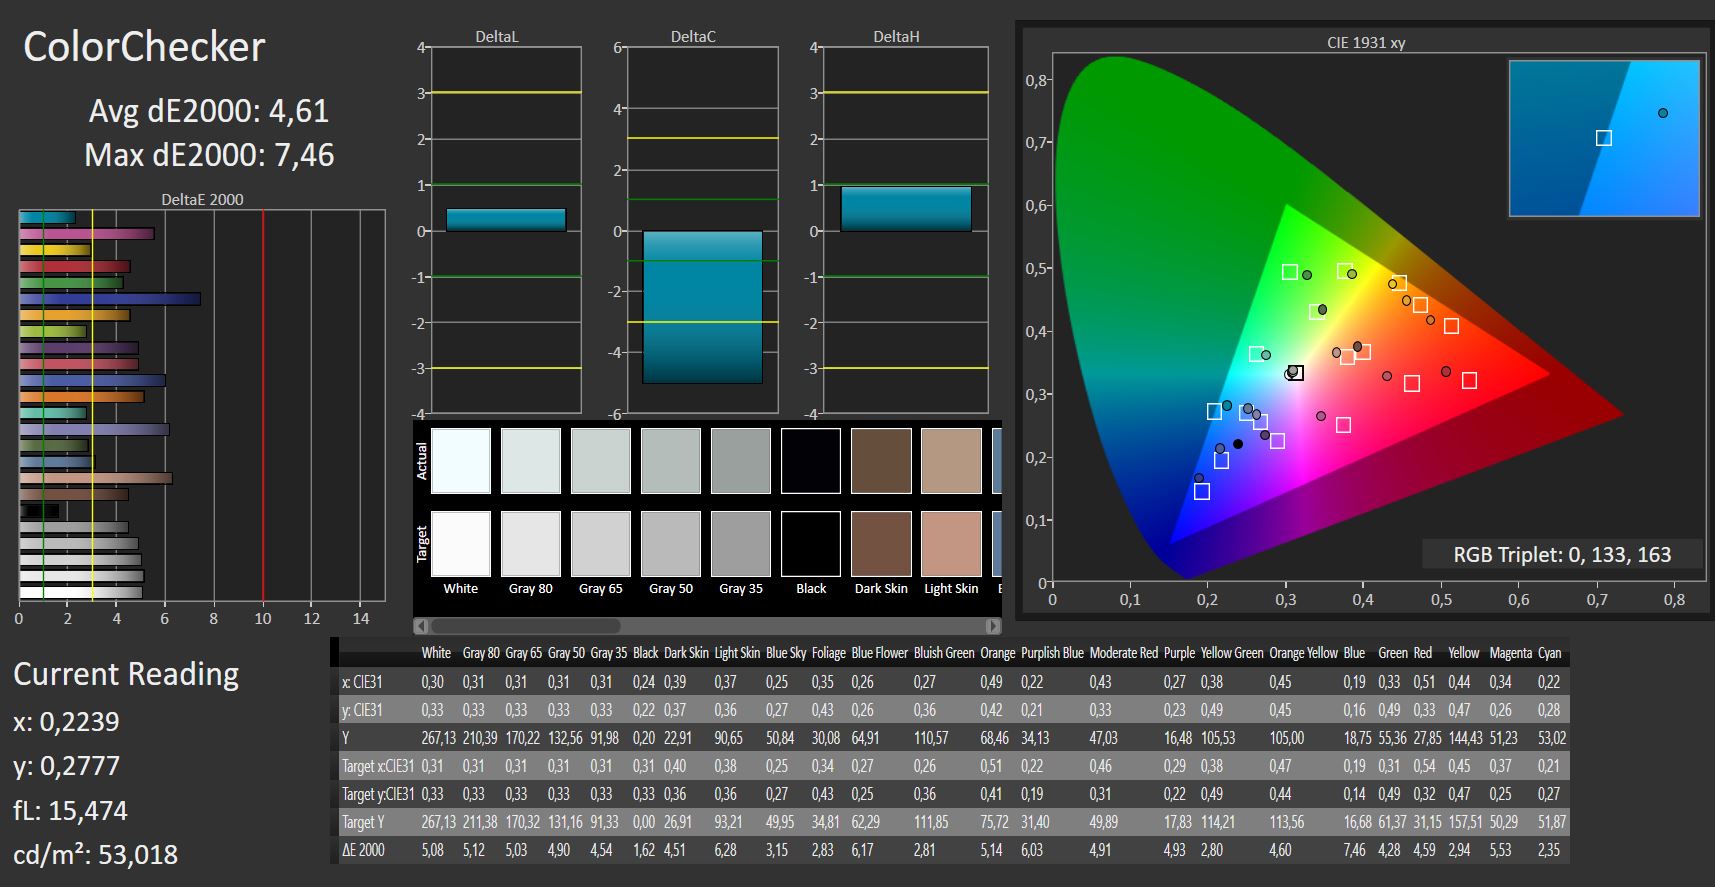
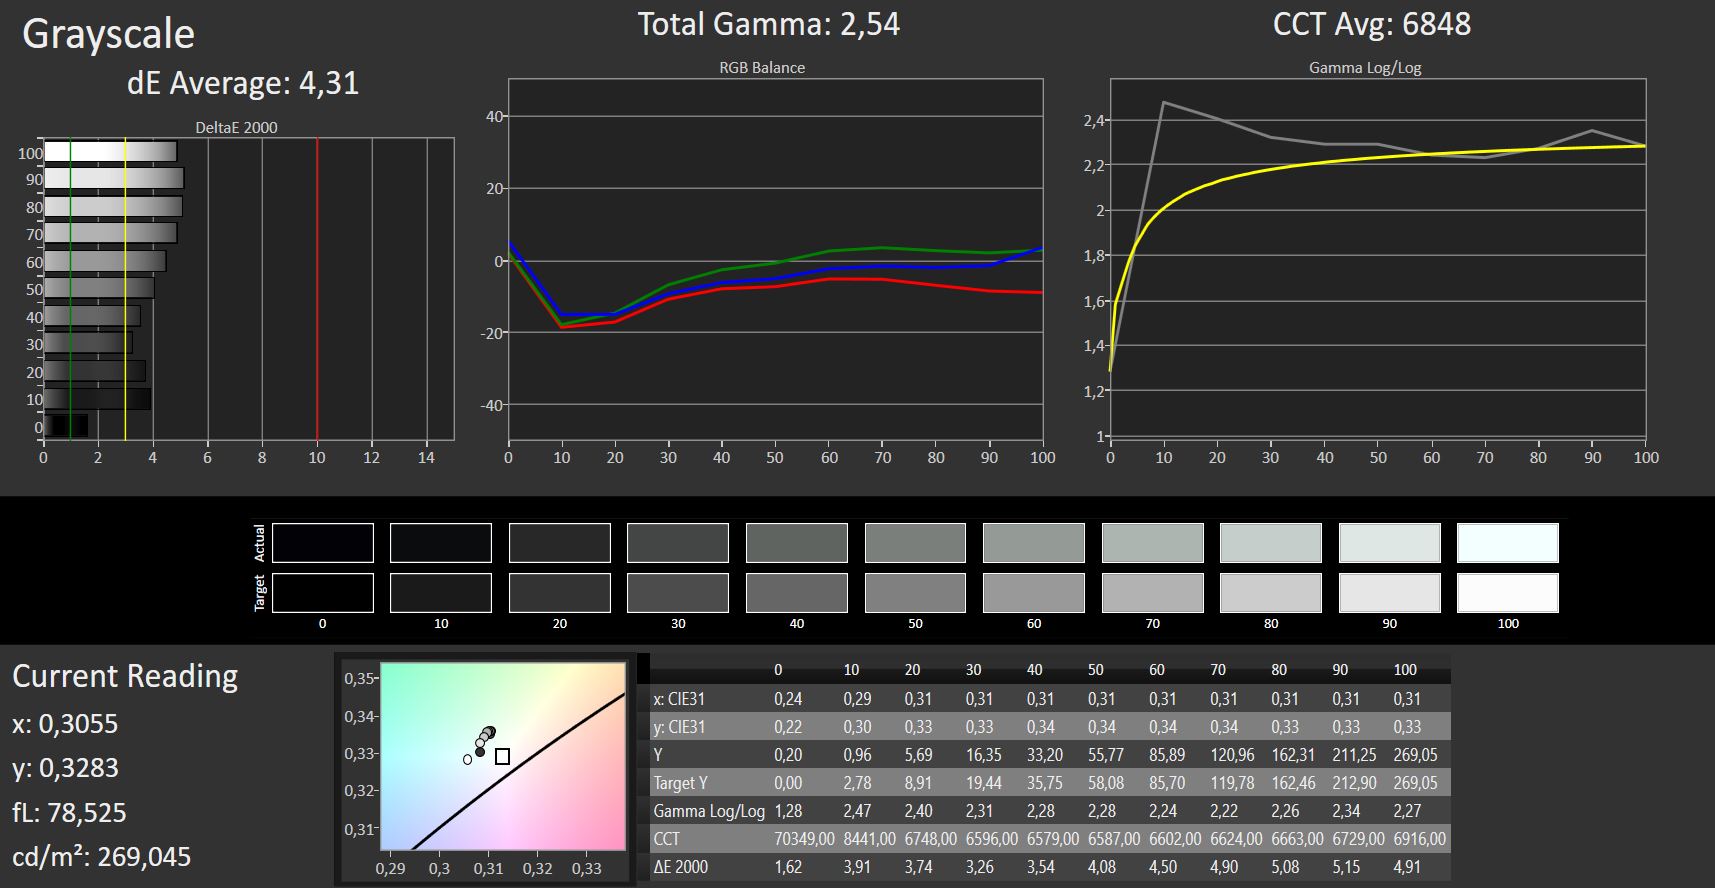
ΔE ColorChecker Calman: 4.61 | ∀{0.5-29.43 Ø4.73}
ΔE Greyscale Calman: 4.31 | ∀{0.09-98 Ø4.97}
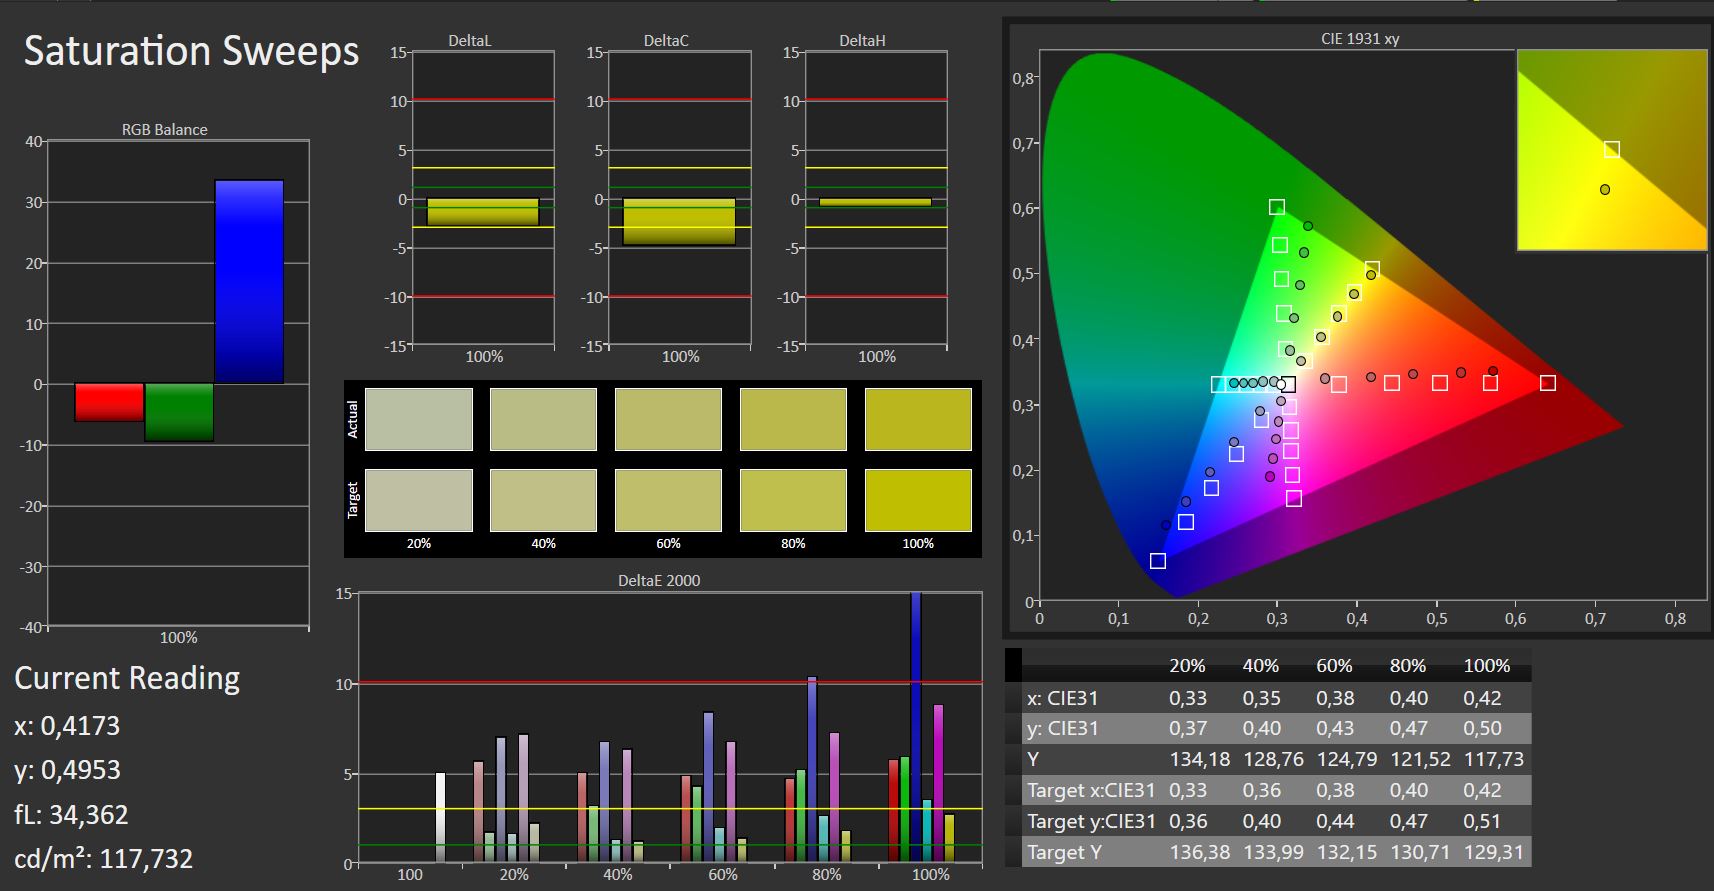
61% sRGB (Argyll 1.6.3 3D)
39% AdobeRGB 1998 (Argyll 1.6.3 3D)
41.9% AdobeRGB 1998 (Argyll 3D)
61% sRGB (Argyll 3D)
40.55% Display P3 (Argyll 3D)
Gamma: 2.54
CCT: 6848 K
| Toshiba Tecra X40-E-10W IPS, 1920x1080, 14" | Toshiba Tecra X40-D IPS, 1920x1080, 14" | Dell Latitude 7490 IPS, 1920x1080, 14" | Lenovo ThinkPad X1 Carbon 2018-20KGS03900 IPS, 2560x1440, 14" | Fujitsu LifeBook U748 IPS, 1920x1080, 14" | HP EliteBook 840 G5-3JX66EA IPS, 1920x1080, 14" | |
|---|---|---|---|---|---|---|
| Display | 0% | 62% | 106% | 46% | ||
| Display P3 Coverage (%) | 40.55 | 40.55 0% | 66.6 64% | 87.7 116% | 60.2 48% | |
| sRGB Coverage (%) | 61 | 61 0% | 96.8 59% | 100 64% | 88.2 45% | |
| AdobeRGB 1998 Coverage (%) | 41.9 | 41.89 0% | 67.9 62% | 99.9 138% | 61.3 46% | |
| Response Times | -48% | -67% | -113% | -45% | -69% | |
| Response Time Grey 50% / Grey 80% * (ms) | 22 ? | 38 ? -73% | 41.6 ? -89% | 59.2 ? -169% | 39.2 ? -78% | 42.4 ? -93% |
| Response Time Black / White * (ms) | 22 ? | 26.8 ? -22% | 32 ? -45% | 34.4 ? -56% | 24.4 ? -11% | 31.6 ? -44% |
| PWM Frequency (Hz) | 21000 ? | 20410 ? | ||||
| Screen | -27% | 0% | 49% | 14% | 11% | |
| Brightness middle (cd/m²) | 266 | 283.9 7% | 308.6 16% | 578 117% | 334 26% | 414 56% |
| Brightness (cd/m²) | 244 | 261 7% | 294 20% | 533 118% | 313 28% | 387 59% |
| Brightness Distribution (%) | 86 | 85 -1% | 89 3% | 84 -2% | 89 3% | 87 1% |
| Black Level * (cd/m²) | 0.2 | 0.25 -25% | 0.23 -15% | 0.38 -90% | 0.41 -105% | 0.25 -25% |
| Contrast (:1) | 1330 | 1136 -15% | 1342 1% | 1521 14% | 815 -39% | 1656 25% |
| Colorchecker dE 2000 * | 4.61 | 6.4 -39% | 6.07 -32% | 1.9 59% | 2.2 52% | 5.5 -19% |
| Colorchecker dE 2000 max. * | 7.46 | 18.7 -151% | 10.58 -42% | 3.8 49% | 5.7 24% | 9.9 -33% |
| Greyscale dE 2000 * | 4.31 | 6.3 -46% | 7.3 -69% | 3 30% | 2.9 33% | 6.4 -48% |
| Gamma | 2.54 87% | 2.39 92% | 2.061 107% | 2.14 103% | 2.34 94% | 2.31 95% |
| CCT | 6848 95% | 6511 100% | 7269 89% | 6377 102% | 6855 95% | 7811 83% |
| Color Space (Percent of AdobeRGB 1998) (%) | 39 | 38 -3% | 62 59% | 88.8 128% | 65.3 67% | 56.9 46% |
| Color Space (Percent of sRGB) (%) | 61 | 60 -2% | 97 59% | 100 64% | 91.8 50% | 88.1 44% |
| Colorchecker dE 2000 calibrated * | 1.67 | 0.8 | 2.3 | |||
| Total Average (Program / Settings) | -25% /
-24% | -2% /
3% | 14% /
39% | -16% /
4% | -4% /
7% |
* ... smaller is better
Screen Flickering / PWM (Pulse-Width Modulation)
| Screen flickering / PWM detected | 21000 Hz | ≤ 90 % brightness setting | 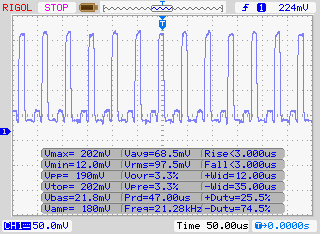 |
The display backlight flickers at 21000 Hz (worst case, e.g., utilizing PWM) Flickering detected at a brightness setting of 90 % and below. There should be no flickering or PWM above this brightness setting. The frequency of 21000 Hz is quite high, so most users sensitive to PWM should not notice any flickering. In comparison: 52 % of all tested devices do not use PWM to dim the display. If PWM was detected, an average of 7794 (minimum: 5 - maximum: 343500) Hz was measured. | |||
Display Response Times
| ↔ Response Time Black to White | ||
|---|---|---|
| 22 ms ... rise ↗ and fall ↘ combined | ↗ 12 ms rise | 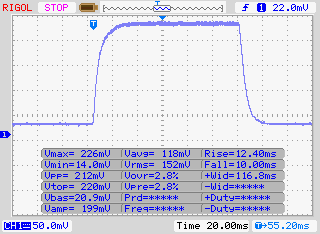 |
| ↘ 10 ms fall | ||
| The screen shows good response rates in our tests, but may be too slow for competitive gamers. In comparison, all tested devices range from 0.1 (minimum) to 240 (maximum) ms. » 48 % of all devices are better. This means that the measured response time is worse than the average of all tested devices (19.9 ms). | ||
| ↔ Response Time 50% Grey to 80% Grey | ||
| 22 ms ... rise ↗ and fall ↘ combined | ↗ 12 ms rise | 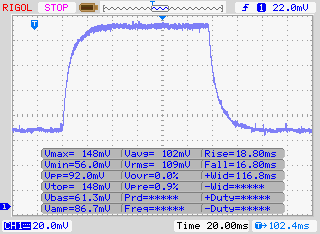 |
| ↘ 10 ms fall | ||
| The screen shows good response rates in our tests, but may be too slow for competitive gamers. In comparison, all tested devices range from 0.165 (minimum) to 636 (maximum) ms. » 33 % of all devices are better. This means that the measured response time is better than the average of all tested devices (31.1 ms). | ||
Performance - The power of quad-core
With the Tecra X40-E, Toshiba offers a mobile 14-inch notebook that provides sufficient performance for applications in the office and Internet areas. Our test unit can be purchased for about 1500 - 1600 Euros (~$1756-1873; starting from ~$1200 in the US with about $1630 for a similar configuration with an i5-8350U processor). At the time of this testing, there are no other configuration options available (in Germany).
Processor
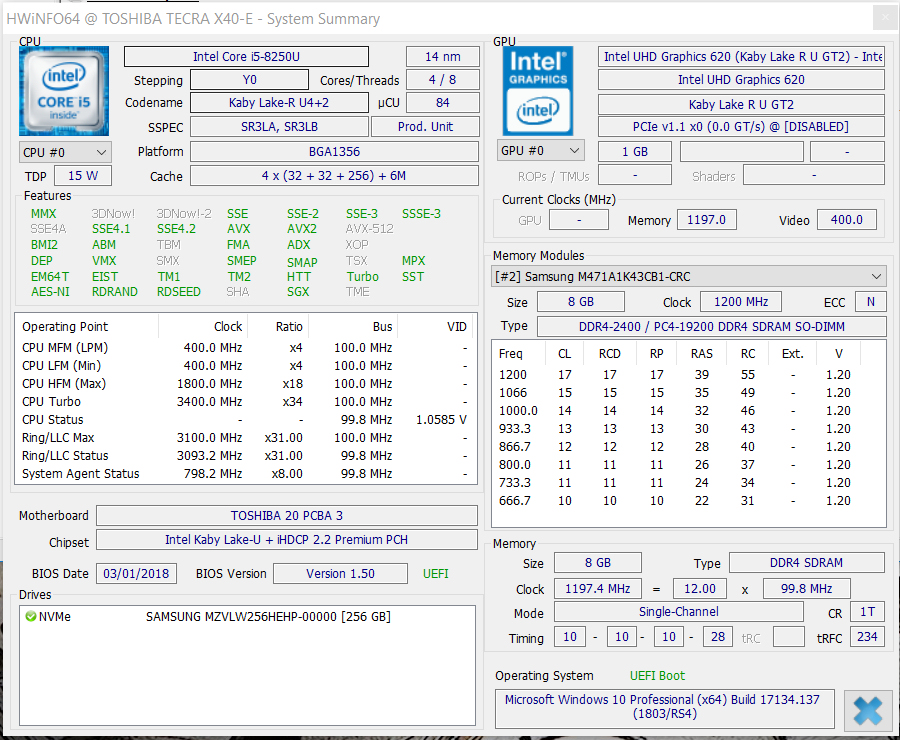
Toshiba uses the quad-core processors of the Kaby-Lake-Refresh generation in the Tecra X40-E models. This already represents the whole extent of improvements and constitutes the single update compared to the Tecra-X40-D models that are equipped with Kaby-Lake dual-core processors. Our test unit has an Intel Core i5-8250U quad-core processor on board. This is a ULV model (TDP: 15 watts) that presents a good figure in all the usual application areas. The processor operates at a basic speed of 1.6 GHz, and you can increase this up to 3.4 GHz via Turbo.
During our multithread tests of the Cinebench benchmarks, the processor runs at 3.4 GHz for a few seconds, before the speed drops down to 2 - 2.3 GHz. It runs through the single-thread tests at 3.4 GHz. So much for the behavior in mains operation. In battery operation, the multithread tests of the Cinebench benchmarks run at 2.3 - 2.8 GHz for a few seconds, and then the speed drops to 2.2 - 2.3 GHz. The single-thread tests are executed at 2.5 - 3.4 GHz.
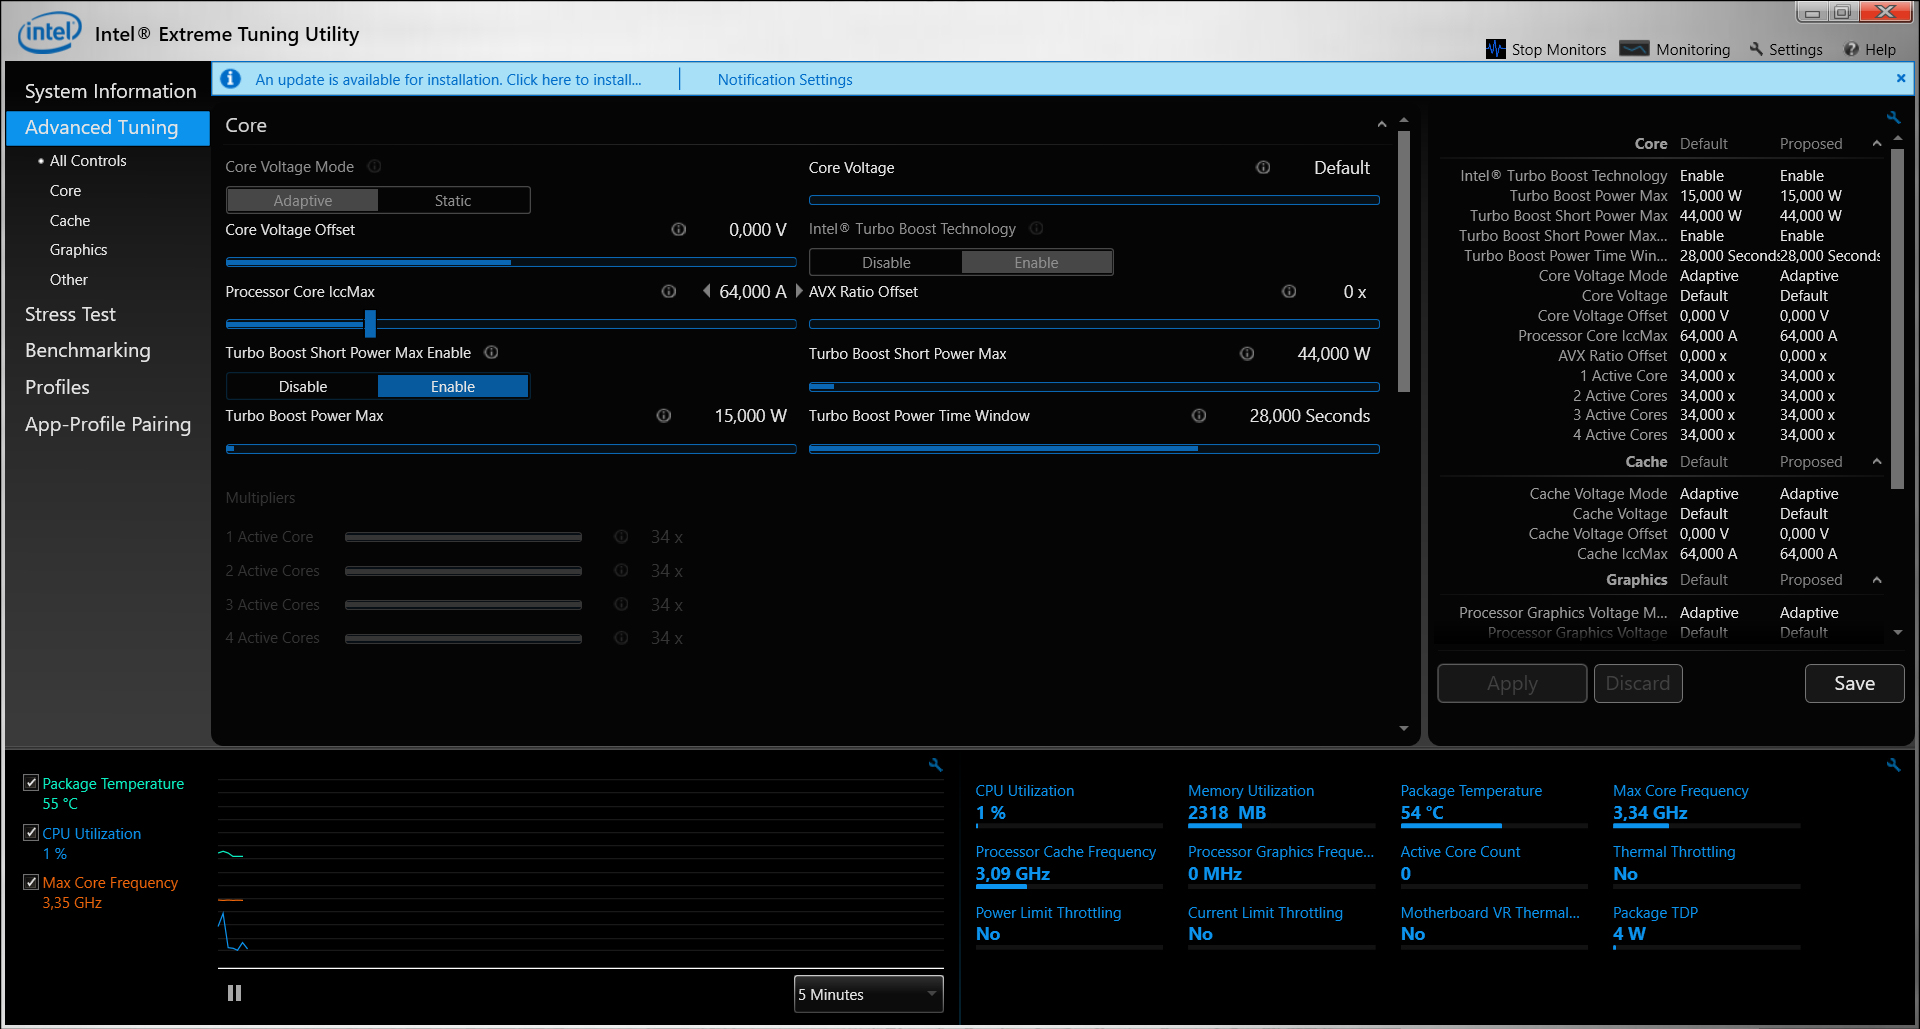
We test whether the Turbo is also used continuously by running the multithread test of the Cinebench-R15 benchmark for about 30 minutes in a constant loop. The results drop from the first to the second run and then remain at a constant level. Although the Turbo is used, it runs at a low speed.
| Geekbench 3 | |
| 32 Bit Multi-Core Score | |
| Average Intel Core i5-8250U (10893 - 13553, n=18) | |
| Toshiba Tecra X40-E-10W | |
| 32 Bit Single-Core Score | |
| Average Intel Core i5-8250U (3148 - 3503, n=18) | |
| Toshiba Tecra X40-E-10W | |
| Geekbench 4.0 | |
| 64 Bit Multi-Core Score | |
| Average of class Office (15873 - 41046, n=4, last 2 years) | |
| Average Intel Core i5-8250U (10751 - 13486, n=19) | |
| Toshiba Tecra X40-E-10W | |
| 64 Bit Single-Core Score | |
| Average of class Office (4598 - 7721, n=4, last 2 years) | |
| Average Intel Core i5-8250U (3924 - 4243, n=19) | |
| Toshiba Tecra X40-E-10W | |
| Geekbench 4.4 | |
| 64 Bit Multi-Core Score | |
| Average of class Office (23754 - 41544, n=9, last 2 years) | |
| Average Intel Core i5-8250U (11269 - 14228, n=25) | |
| Toshiba Tecra X40-E-10W | |
| 64 Bit Single-Core Score | |
| Average of class Office (4564 - 8042, n=9, last 2 years) | |
| Average Intel Core i5-8250U (3453 - 4330, n=25) | |
| Toshiba Tecra X40-E-10W | |
| JetStream 1.1 - 1.1 Total | |
| Toshiba Tecra X40-E-10W (Edge 42) | |
| Dell Latitude 7490 (Microsoft Edge 42.17134.1.0) | |
| Average Intel Core i5-8250U (151.5 - 256, n=78) | |
| Fujitsu LifeBook U748 (Edge 41.16299.248.0) | |
| HP EliteBook 840 G5-3JX66EA (EDGE 41.16299.248.0) | |
System Performance
The 14-incher does not suffer from a lack of system performance, and the quad-core processor offers more than sufficient computing performance for applications in the office and Internet areas. This is confirmed by the very good results in the PCMark benchmarks. A slight increase of the overall performance should be possible by adding a second module of working memory (activating dual-channel mode).
The fact that dual-channel mode is not active is also the reason for the PCMark results of the X40-E to slightly lag behind those of the X40-D, which is equipped with a Core i5-7600U dual-core processor. How is that possible? The stronger multithread performance of the Core i5-8250U processor has hardly any effect on the test results. The single-thread performance has a much stronger effect and is similar for the Core i5-8250U and Core i5-7600U. So since the working memory of the X40-D operates in dual-channel mode, it fares slightly better than the X40-E.
| PCMark 8 Home Score Accelerated v2 | 3516 points | |
| PCMark 8 Creative Score Accelerated v2 | 4512 points | |
| PCMark 8 Work Score Accelerated v2 | 4706 points | |
| PCMark 10 Score | 3574 points | |
Help | ||
Storage Solution
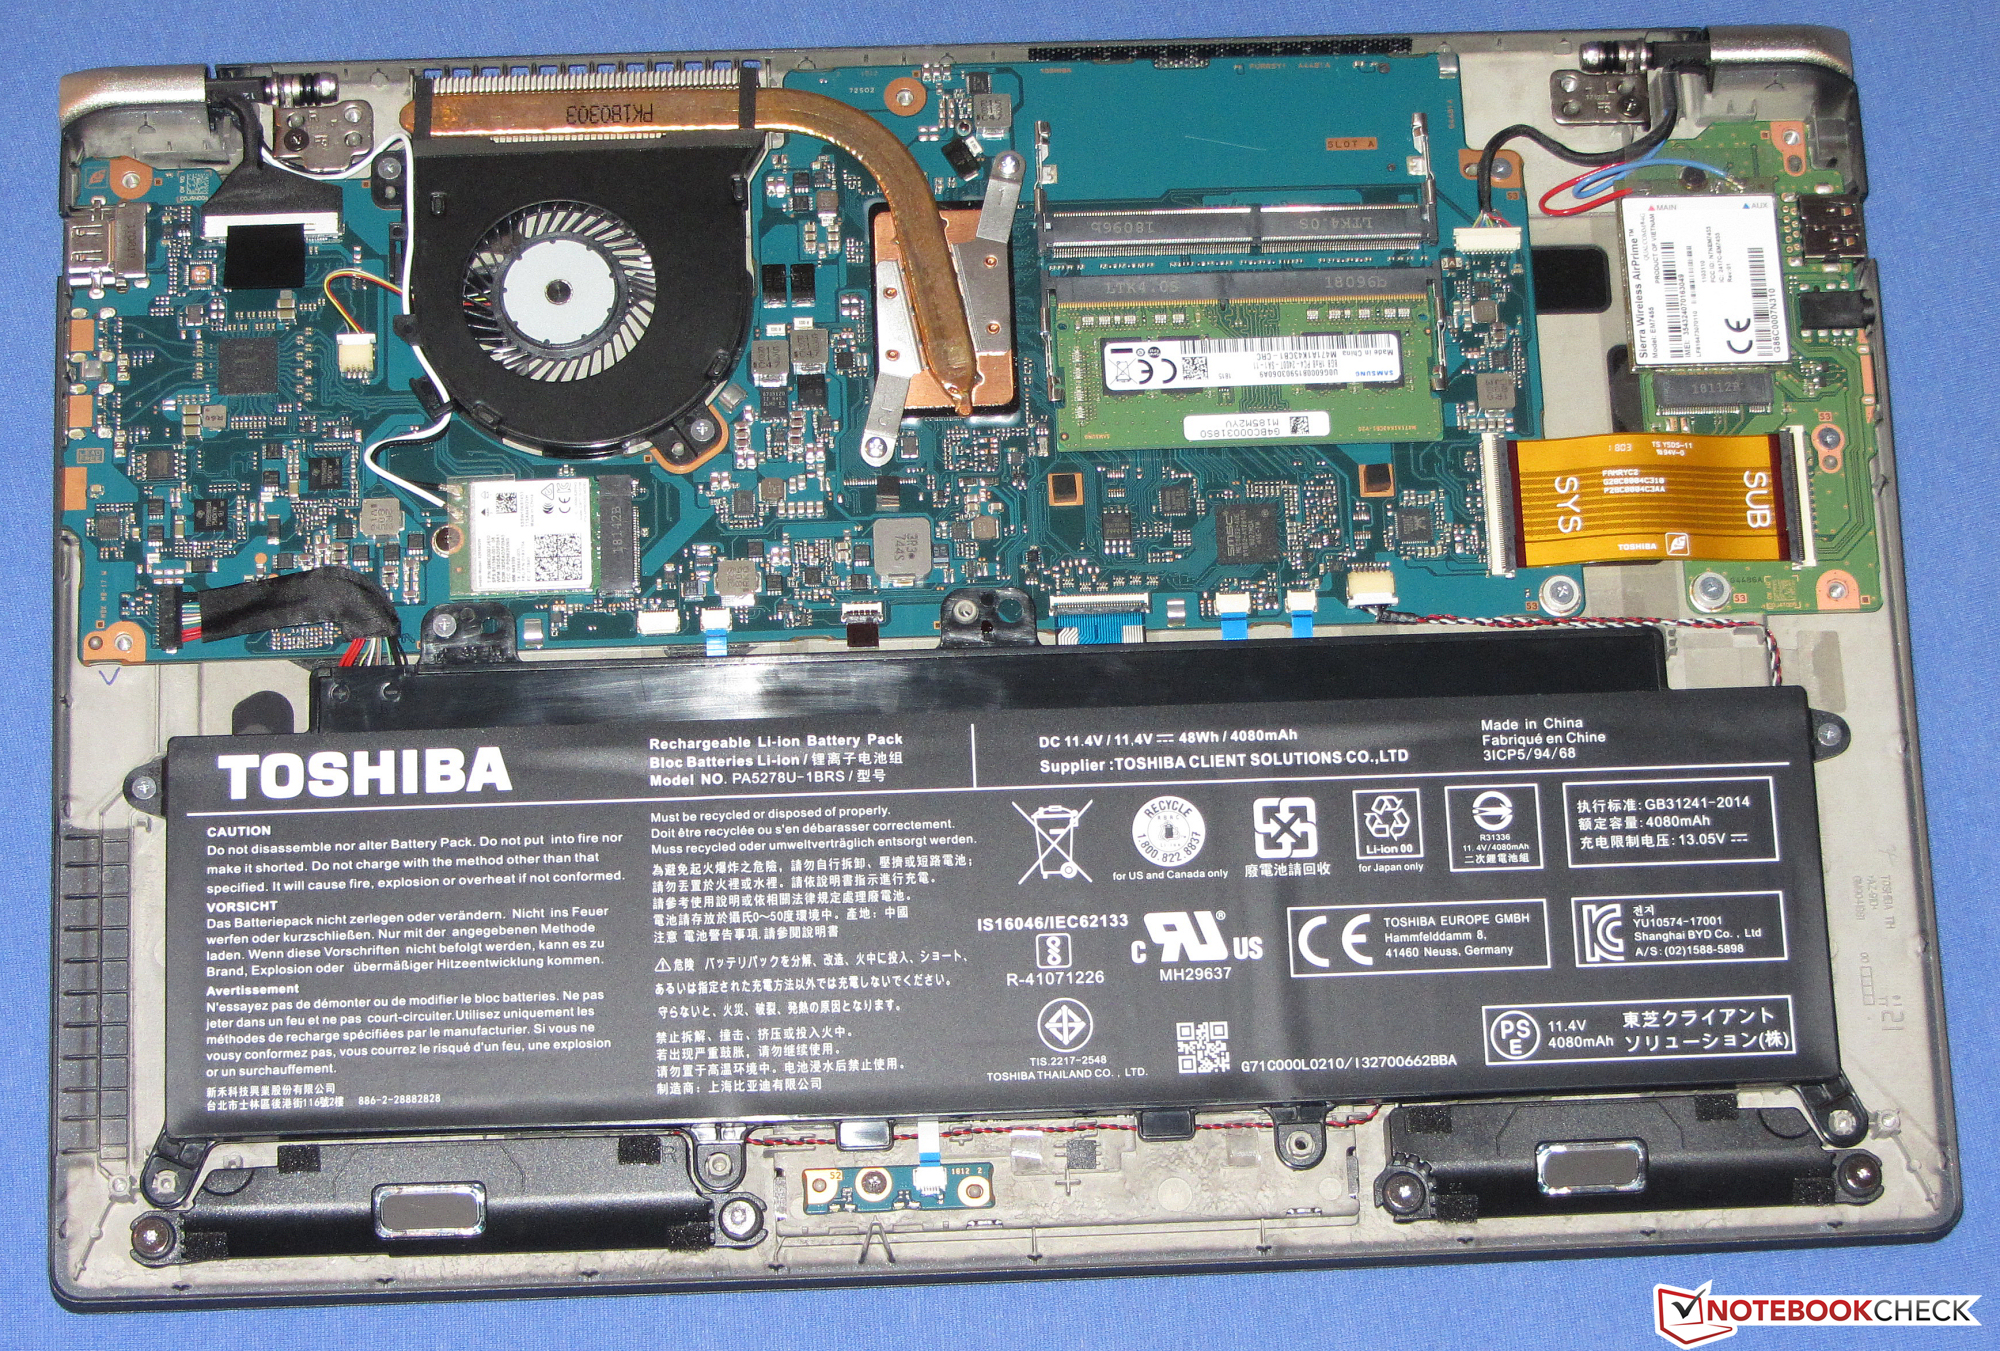
An NVMe SSD from Samsung serves as the system drive. This is a model in the M.2-2280 format that offers a total of 256 GB of storage. At the time of delivery, about 195 GB is still usable and the rest of the storage space is occupied by the recovery partition and the Windows installation. The transfer rates are very good. We did not expect anything else: NVMe SSDs achieve significantly higher transfer rates than SATA-III models, since they are connected via PCI Express 3.0 x4.

| Toshiba Tecra X40-E-10W Samsung PM961 MZVLW256HEHP | Toshiba Tecra X40-D Samsung PM961 MZVLW256HEHP | Dell Latitude 7490 Toshiba KSG60ZMV256G | Lenovo ThinkPad X1 Carbon 2018-20KGS03900 Samsung SSD PM981 MZVLB512HAJQ | Fujitsu LifeBook U748 Samsung PM961 MZVLW256HEHP | HP EliteBook 840 G5-3JX66EA Toshiba XG5 KXG50ZNV256G | Average Samsung PM961 MZVLW256HEHP | Average of class Office | |
|---|---|---|---|---|---|---|---|---|
| CrystalDiskMark 5.2 / 6 | 50% | -49% | 34% | 36% | -13% | 15% | 104% | |
| Write 4K (MB/s) | 100.1 | 195.1 95% | 79.4 -21% | 131.9 32% | 135.5 35% | 92.8 -7% | 127.7 ? 28% | 151.4 ? 51% |
| Read 4K (MB/s) | 40.03 | 48.5 21% | 27.37 -32% | 44.6 11% | 43.76 9% | 30.67 -23% | 42.4 ? 6% | 72.8 ? 82% |
| Write Seq (MB/s) | 1259 | 1226 -3% | 343.9 -73% | 1824 45% | 1006 -20% | 353.2 -72% | 1099 ? -13% | 2558 ? 103% |
| Read Seq (MB/s) | 1296 | 1763 36% | 472.7 -64% | 2163 67% | 1761 36% | 1937 49% | 1373 ? 6% | 3237 ? 150% |
| Write 4K Q32T1 (MB/s) | 228.1 | 547 140% | 206 -10% | 338.1 48% | 660 189% | 358 57% | 398 ? 74% | 424 ? 86% |
| Read 4K Q32T1 (MB/s) | 292.9 | 633 116% | 188.3 -36% | 351.9 20% | 432.6 48% | 253.1 -14% | 403 ? 38% | 509 ? 74% |
| Write Seq Q32T1 (MB/s) | 1286 | 1226 -5% | 343.3 -73% | 1972 53% | 1231 -4% | 359.6 -72% | 1210 ? -6% | 3999 ? 211% |
| Read Seq Q32T1 (MB/s) | 3411 | 3421 0% | 533 -84% | 3387 -1% | 3220 -6% | 2613 -23% | 2984 ? -13% | 5962 ? 75% |
Graphics Card
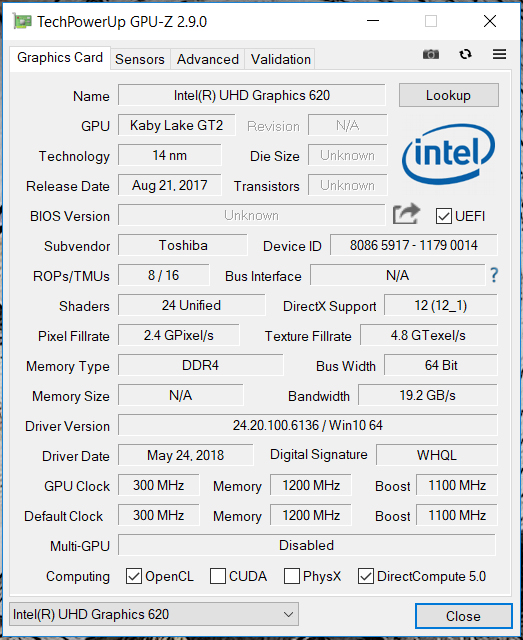
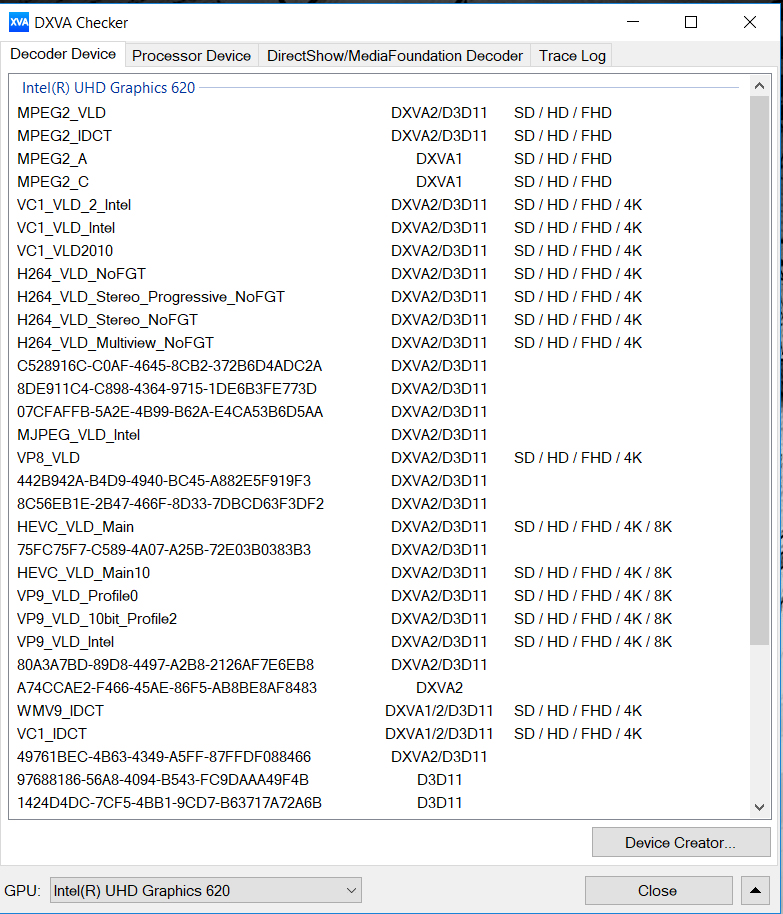
Intel's UHD Graphics 620 graphics core handles the graphics output. The GPU supports DirectX 12 and runs at speeds between 300 and 1100 MHz. The results in the 3DMark benchmarks are on a normal level for this GPU. An increase of the performance should be possible by installing a second module of working memory (activating dual-channel mode).
| 3DMark 11 Performance | 1840 points | |
| 3DMark Cloud Gate Standard Score | 7290 points | |
| 3DMark Fire Strike Score | 968 points | |
Help | ||
Gaming Performance
While the Tecra is not a gaming notebook, it can nonetheless bring some games to the screen smoothly. This includes games that only put little demand on the hardware. However, you still need to be content with low resolutions and low quality settings. Adding a second module of the working memory (dual-channel mode) should ensure an increase in the frame rates. But even then, you would not be able to play a power-hungry game such as Far Cry 5.
| low | med. | high | ultra | |
|---|---|---|---|---|
| BioShock Infinite (2013) | 46.8 | 27.6 | 22.8 | 7.6 |
Emissions and Power - The battery life turns out to be good
Noise Emissions
While during idle, the fan is often quiet and there is silence, it revs up under load. During the stress test, we measure a noise level of up to 40.1 dB(A), and under medium load it becomes even slightly louder. The noise level while running the 3DMark06 benchmark is 43.9 dB(A). With this, the X40-E produces more noise across the whole load range than the predecessor model.
Noise level
| Idle |
| 30.5 / 30.5 / 31.2 dB(A) |
| Load |
| 43.9 / 40.1 dB(A) |
 | ||
30 dB silent 40 dB(A) audible 50 dB(A) loud |
||
min: | ||
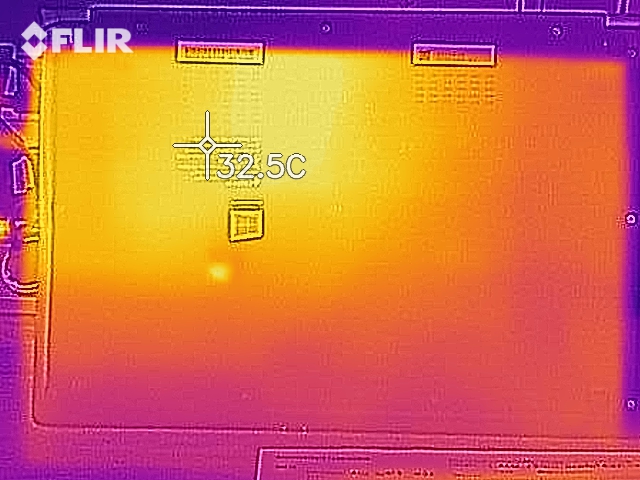
Temperature
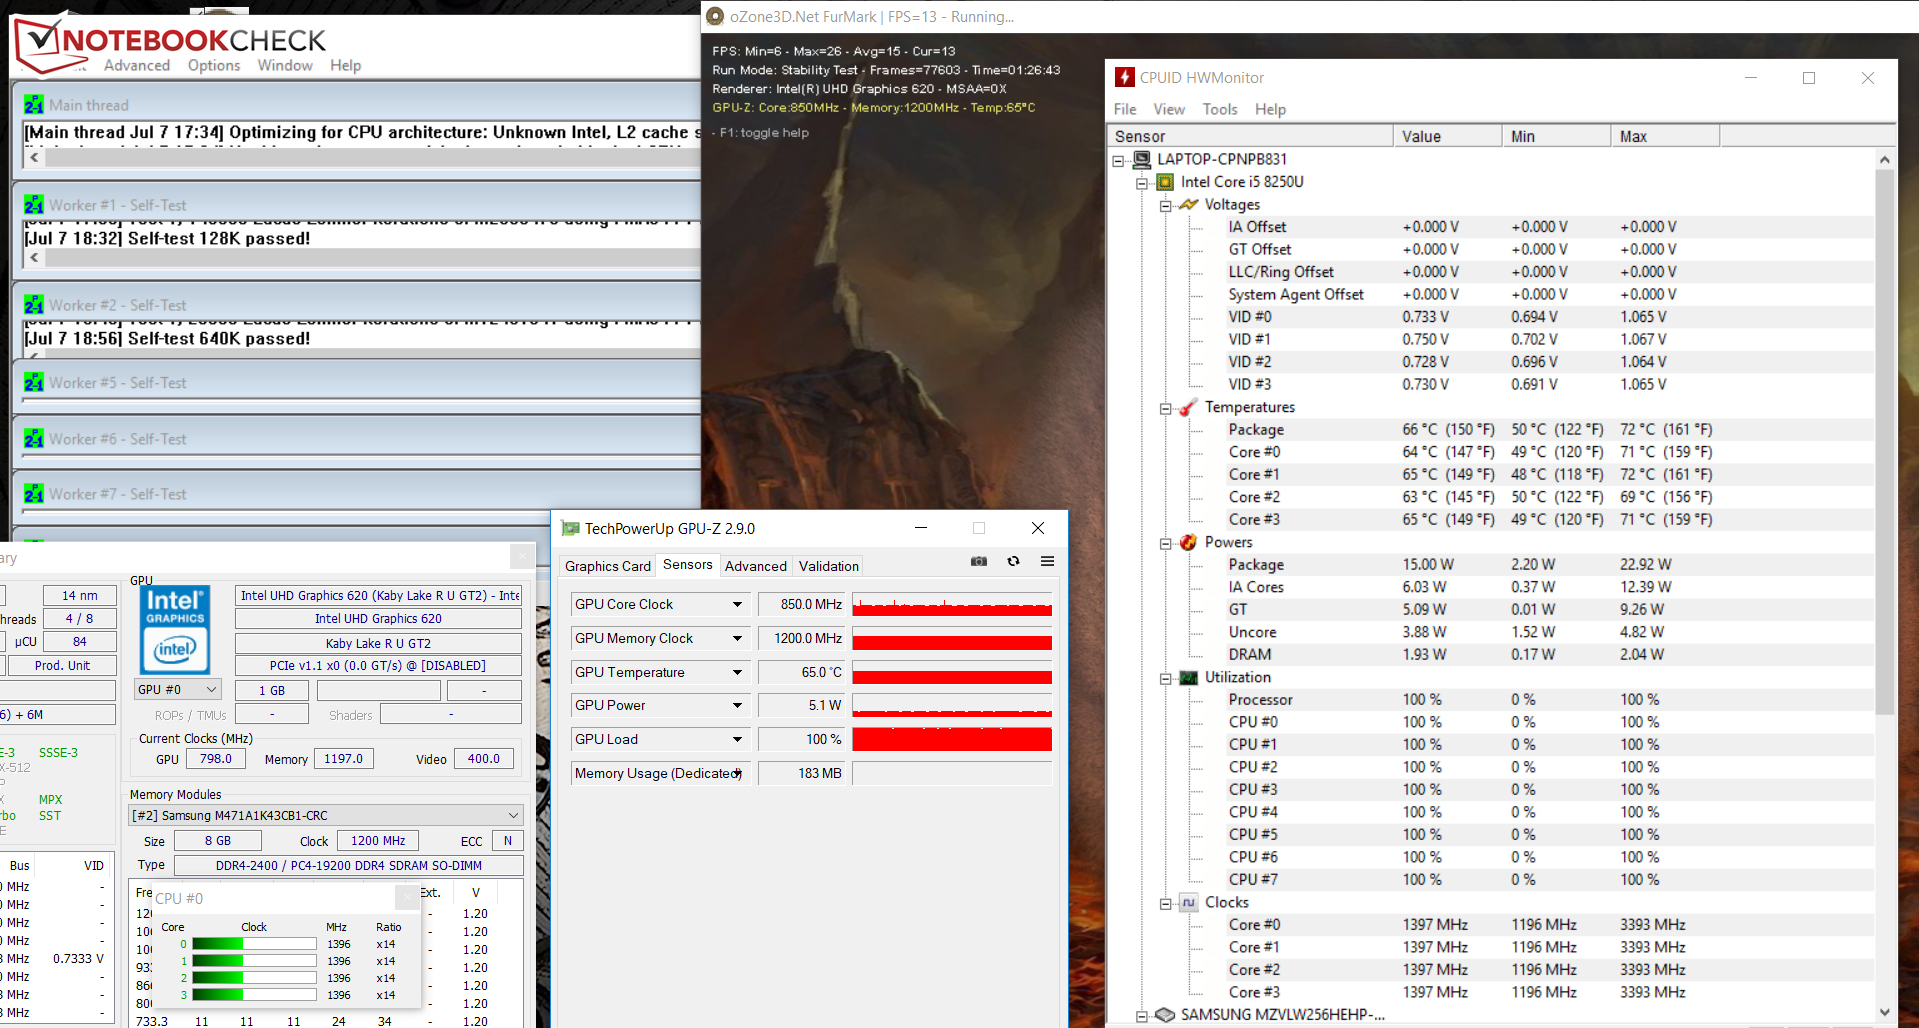
The Tecra runs through our stress test (Prime95 and Furmark running for at least one hour) in different ways during mains and battery operation. In mains operation, the processor and graphics core run at 1.2 - 1.4 GHz and 750 - 850 MHz, respectively. In battery operation, these values are at 1.9 GHz (CPU) and 250 MHz (GPU).
While the notebook does not get too hot, the 40-°C mark (104 °F) is exceeded at several measurement points. Overall, the notebook does warm up slightly more than the predecessor, which is equipped with a dual-core processor. The stress test represents an extreme scenario that does not occur like this in everyday life. We evaluate in this test whether the system also runs stably during full load.
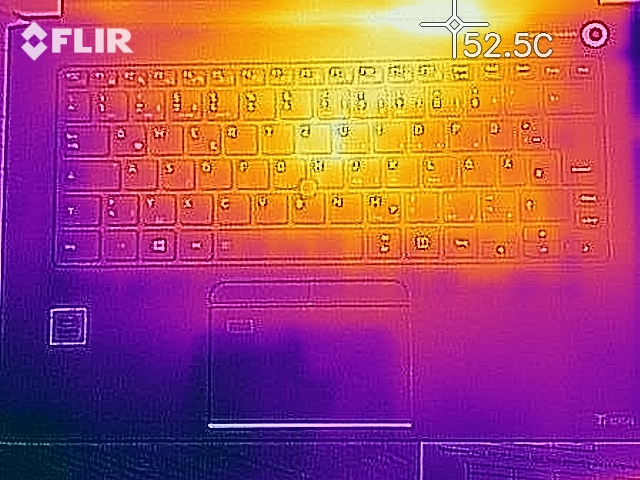
(±) The maximum temperature on the upper side is 44 °C / 111 F, compared to the average of 34.3 °C / 94 F, ranging from 21.2 to 62.5 °C for the class Office.
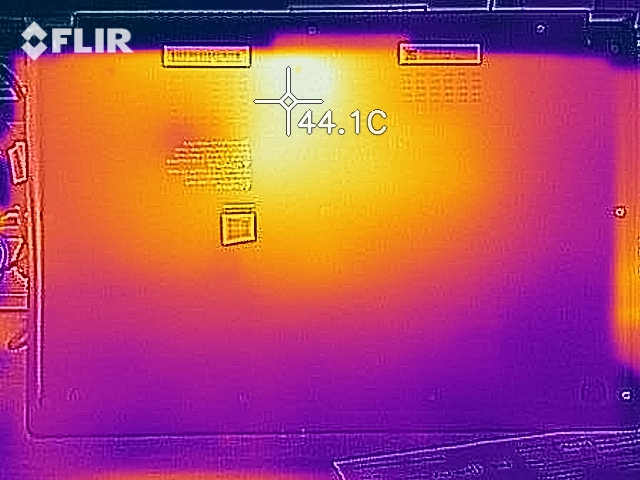
(-) The bottom heats up to a maximum of 47.2 °C / 117 F, compared to the average of 36.8 °C / 98 F
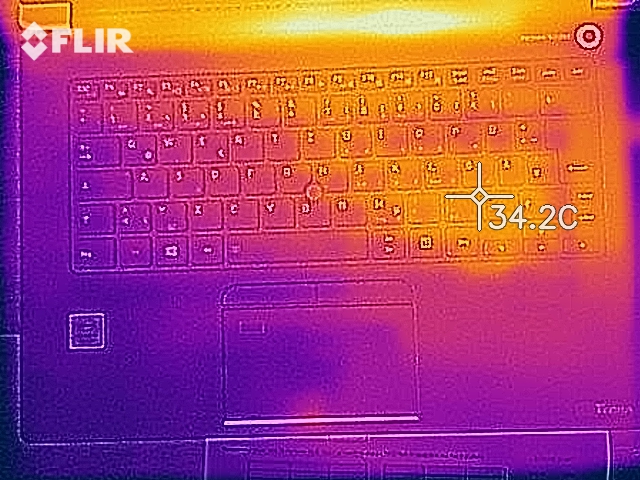
(+) In idle usage, the average temperature for the upper side is 26.1 °C / 79 F, compared to the device average of 29.5 °C / 85 F.
(+) The palmrests and touchpad are reaching skin temperature as a maximum (34.4 °C / 93.9 F) and are therefore not hot.
(-) The average temperature of the palmrest area of similar devices was 27.5 °C / 81.5 F (-6.9 °C / -12.4 F).
Speaker
Toshiba Tecra X40-E-10W audio analysis
(-) | not very loud speakers (70.7 dB)
Bass 100 - 315 Hz
(-) | nearly no bass - on average 26.6% lower than median
(±) | linearity of bass is average (11% delta to prev. frequency)
Mids 400 - 2000 Hz
(+) | balanced mids - only 3.4% away from median
(+) | mids are linear (6.1% delta to prev. frequency)
Highs 2 - 16 kHz
(+) | balanced highs - only 3.5% away from median
(+) | highs are linear (6.2% delta to prev. frequency)
Overall 100 - 16.000 Hz
(±) | linearity of overall sound is average (22.6% difference to median)
Compared to same class
» 61% of all tested devices in this class were better, 8% similar, 31% worse
» The best had a delta of 7%, average was 21%, worst was 53%
Compared to all devices tested
» 67% of all tested devices were better, 6% similar, 28% worse
» The best had a delta of 4%, average was 24%, worst was 134%
Apple MacBook 12 (Early 2016) 1.1 GHz audio analysis
(+) | speakers can play relatively loud (83.6 dB)
Bass 100 - 315 Hz
(±) | reduced bass - on average 11.3% lower than median
(±) | linearity of bass is average (14.2% delta to prev. frequency)
Mids 400 - 2000 Hz
(+) | balanced mids - only 2.4% away from median
(+) | mids are linear (5.5% delta to prev. frequency)
Highs 2 - 16 kHz
(+) | balanced highs - only 2% away from median
(+) | highs are linear (4.5% delta to prev. frequency)
Overall 100 - 16.000 Hz
(+) | overall sound is linear (10.2% difference to median)
Compared to same class
» 7% of all tested devices in this class were better, 2% similar, 91% worse
» The best had a delta of 5%, average was 18%, worst was 53%
Compared to all devices tested
» 5% of all tested devices were better, 1% similar, 94% worse
» The best had a delta of 4%, average was 24%, worst was 134%
Power Consumption
During idle, we register a maximum consumption of 9.3 watts. This value is slightly too high for a 14-inch notebook with a ULV processor. The built-in NVMe SSD is responsible for this. Notebooks that use SATA-III SSDs are significantly more efficient during idle. For example, the power consumption of the Dell Latitude 7490, which is equipped with a SATA-III SSD, turns out about 2 to 3.6 watts lower than for the Tecra. During the stress test, the power consumption of the Tecra only increases up to 30.4 watts, since the CPU and GPU run at relatively low speeds under full load. We measure the same value under medium load.
| Off / Standby | |
| Idle | |
| Load |
|
Key:
min: | |
Battery Life
Our realistic WLAN test simulates the load when loading websites via a script. The "Balanced" power profile is activated, the display brightness is adjusted to about 150 cd/m², and the power-saving functions are turned off. The Tecra achieves a runtime of 8:18 hours.
| Battery Runtime - WiFi Websurfing | |
| Average of class Office (3.83 - 31.5, n=74, last 2 years) | |
| Dell Latitude 7490 | |
| Lenovo ThinkPad X1 Carbon 2018-20KGS03900 (Edge) | |
| Toshiba Tecra X40-E-10W (Edge 42) | |
| HP EliteBook 840 G5-3JX66EA (EDGE 41.16299.248.0) | |
| Fujitsu LifeBook U748 (Edge 41.16299.248.0) | |
| Toshiba Tecra X40-D | |
Pros
Cons
Verdict
The Tecra X40-E cannot offer many updates or changes compared to the Tecra X40-D. Only the processor has changed, and the new Tecra-X40 models have ULV quad-core processors on board.
The built-in Core i5-8250U quad-core processor ensures sufficient computing performance for all the usual application areas. However, it is only able to make use of its full computing performance in single-thread applications. While the use of the Turbo is limited in multithread applications, this is no different in competing notebooks that are equipped with the same CPU.
With the Tecra X40-E, Toshiba primarily offers a model update. However, the opportunity to remedy the weaknesses that we already saw in the predecessor model remains unused.
An NVMe SSD ensures a fast-running system. You should be able to replace the SSD, but in order to do that, you have to remove the bottom of the case. The keyboard left a good impression overall. The fact that there is a keyboard backlight is a positive point. The battery life turns out to be good overall and ranges at the same level as the values of the competitors. The integrated LTE modem provides mobile access to the Internet or a company network.
While the 14-inch touchscreen display pleases with stable viewing angles and a good contrast, the brightness turns out too low. The competitors offer more in this regard. The Tecra is also unable to keep up with its competitors in terms of the color-space coverage. We consider the fact that Toshiba only provides the Tecra with a single module of working memory a reason for complaint. Since the dual-channel mode is not active, it loses a few percentage points in the performance.
Toshiba Tecra X40-E-10W
- 07/15/2018 v6 (old)
Sascha Mölck
Price comparison
