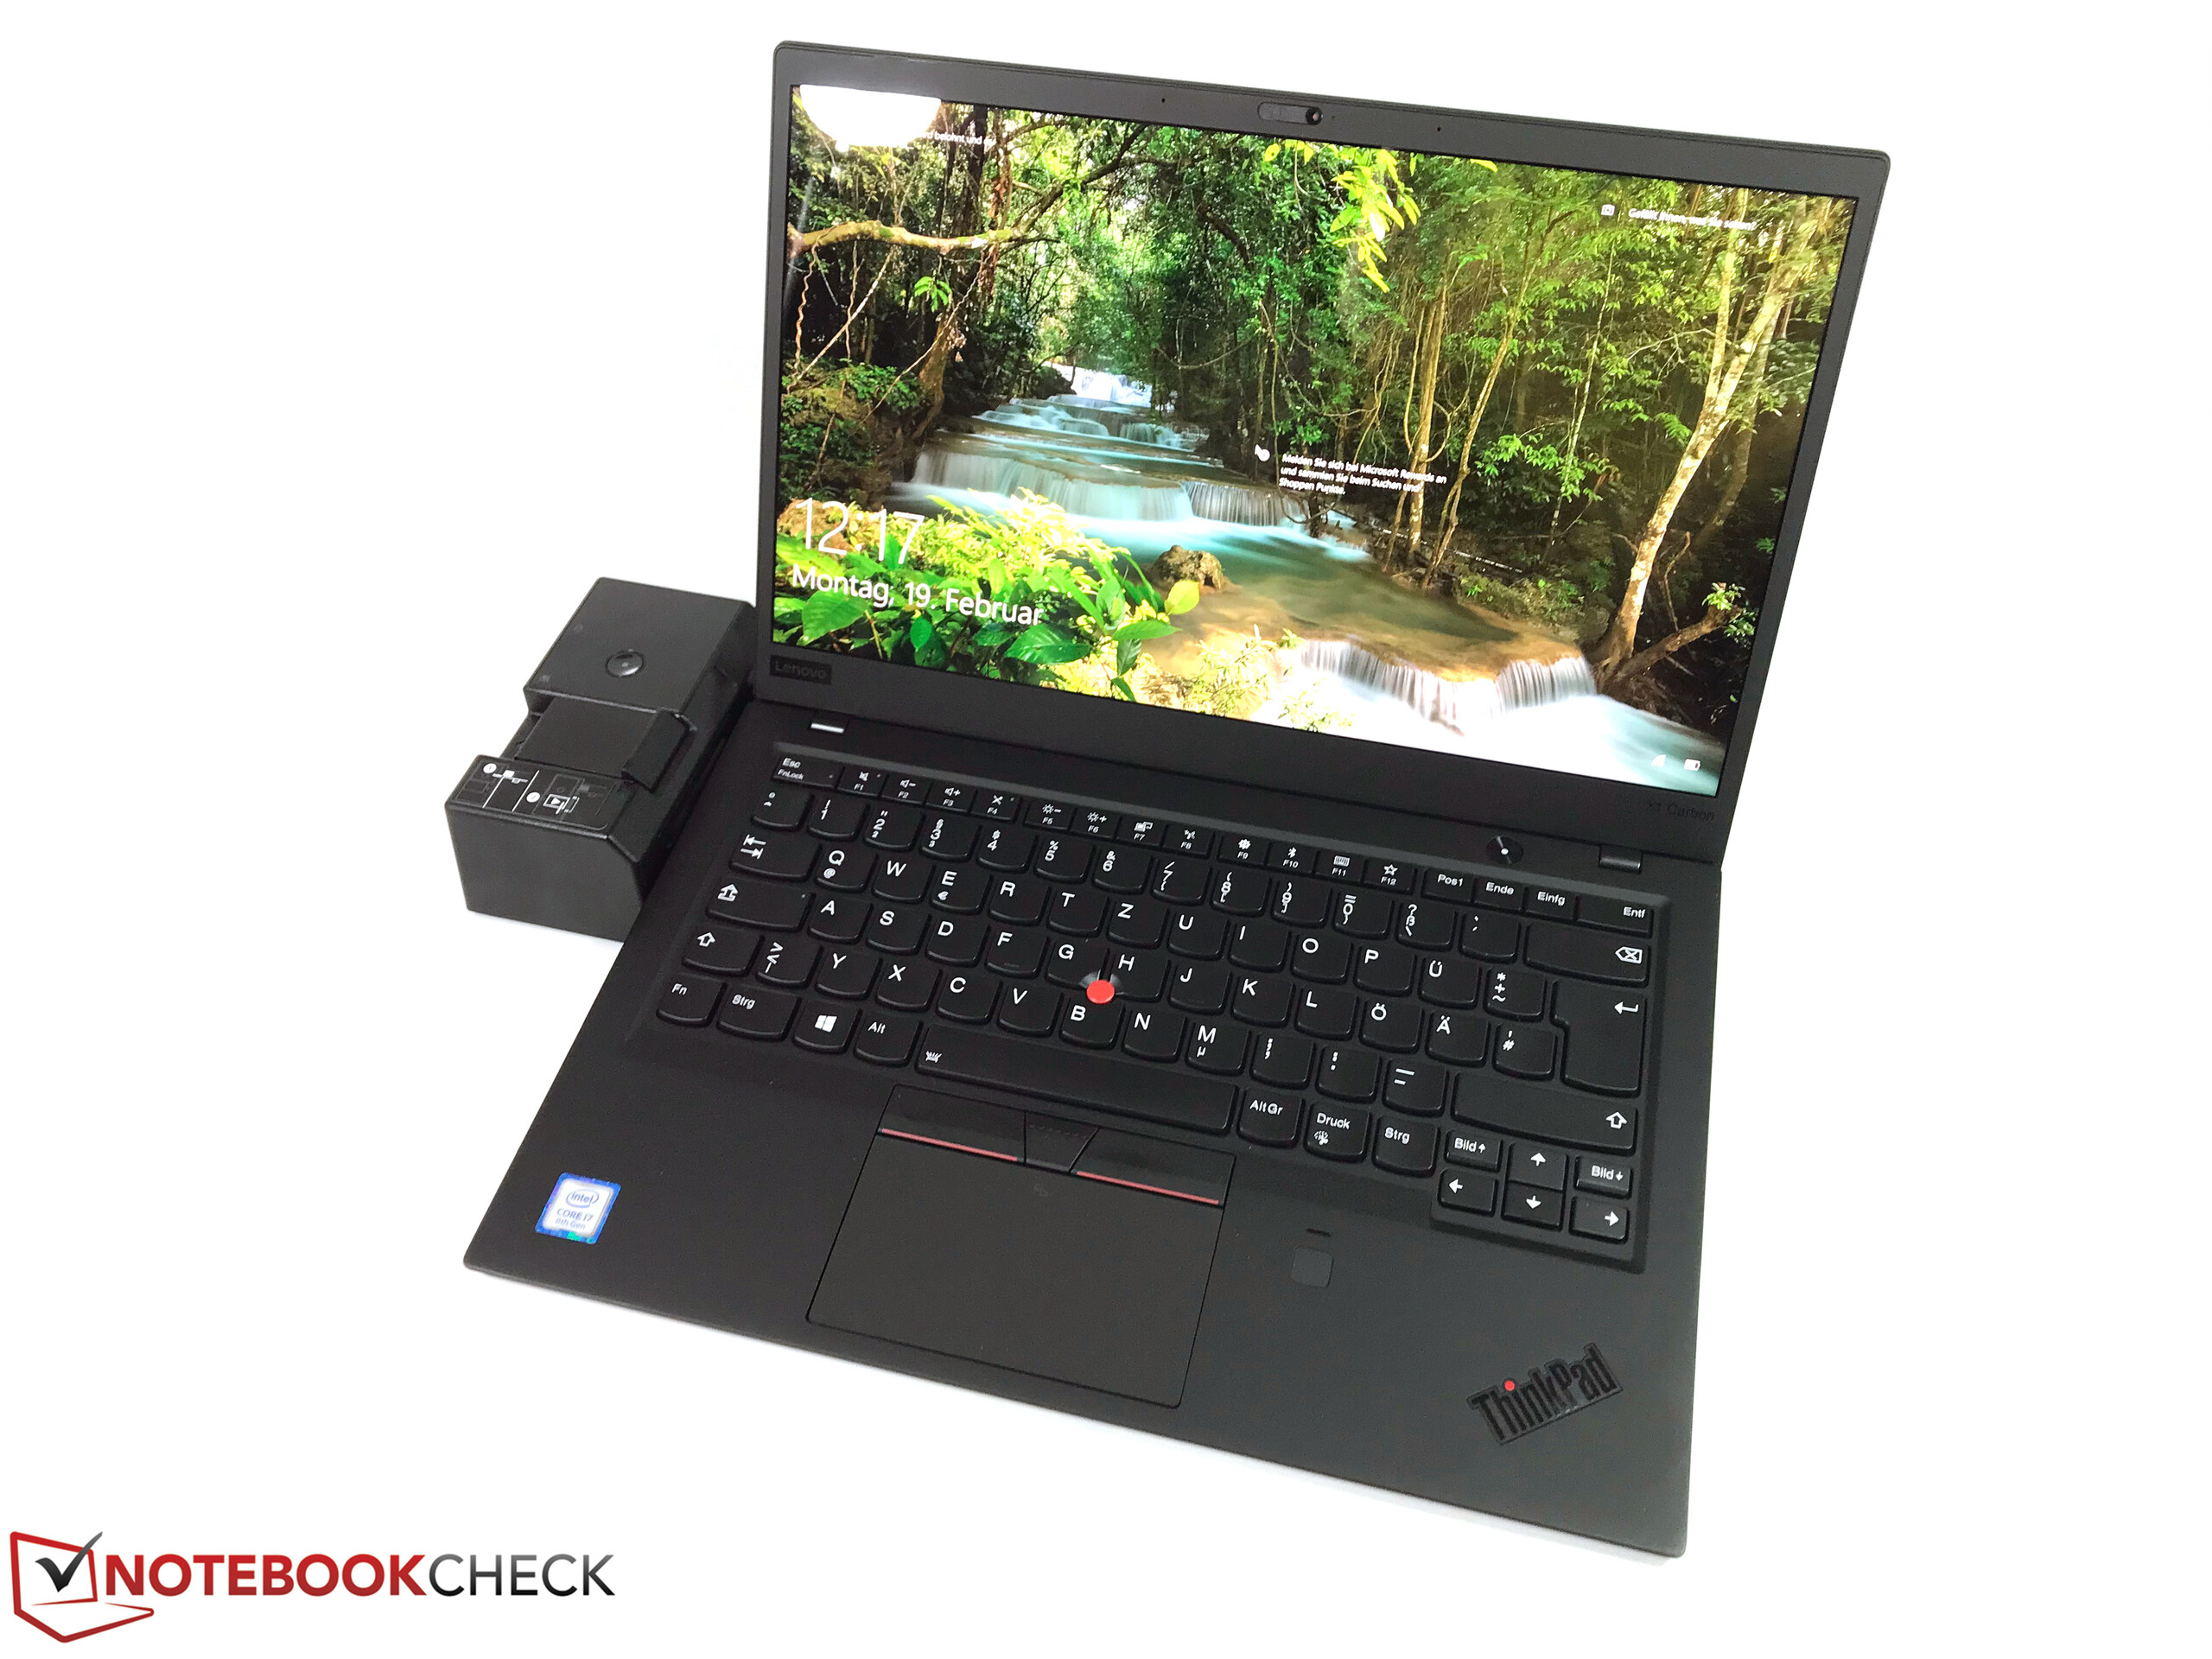
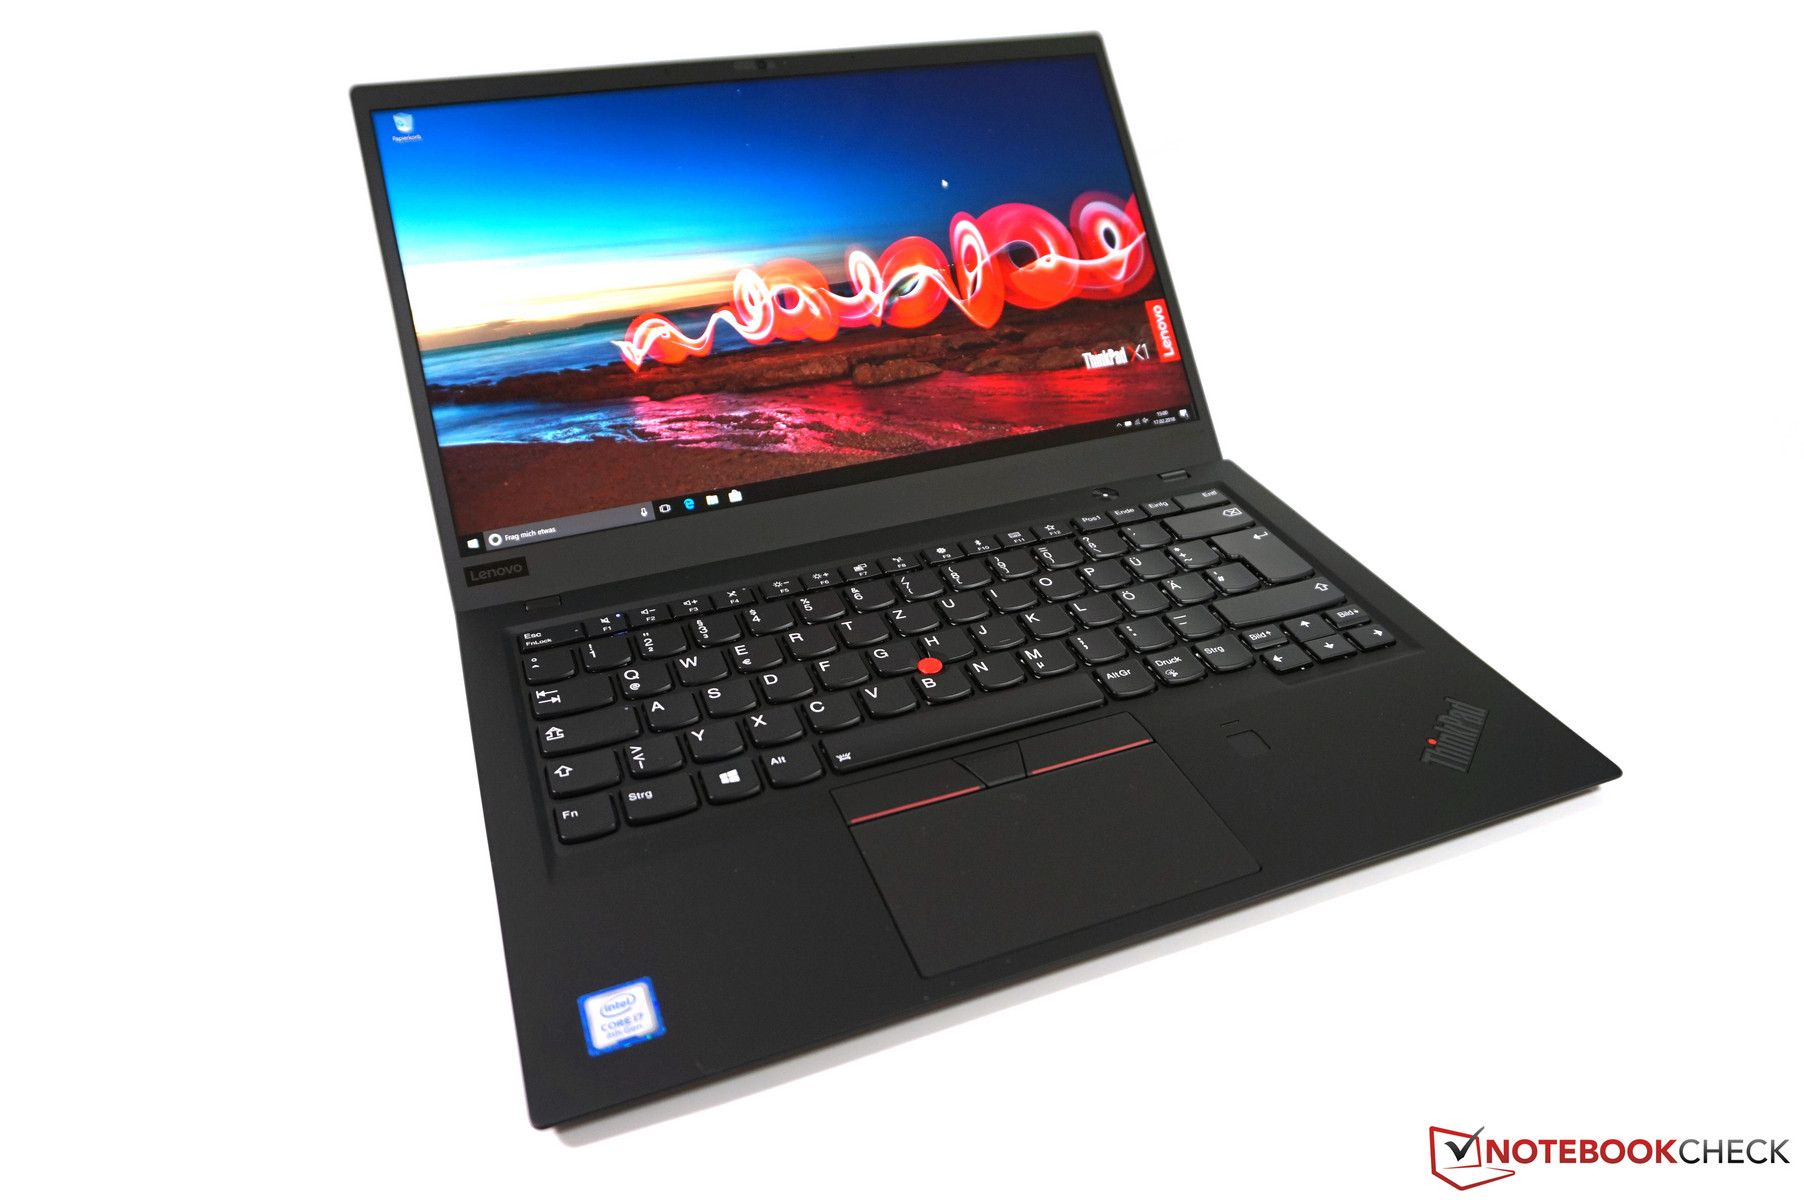
Lenovo ThinkPad X1 Carbon 2018 (WQHD HDR, i7) Laptop Review
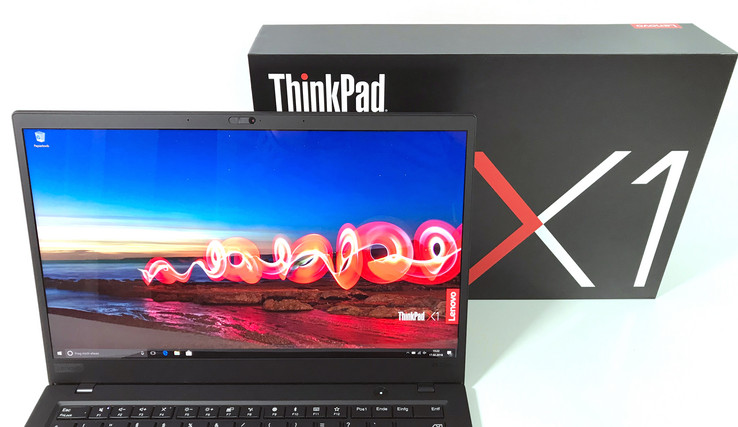
Following on from the complete redesign of last year's fifth-generation ThinkPad X1 Carbon, the new sixth-generation device sticks to upgrading the internals this time around. These include new Core i5 and i7 quad-core ULV processors, a new mechanical docking connection and an optional new WQHD display with HDR support and a huge 500 cd/m² brightness. The only obvious drawback is that, by default, the display comes with a glossy finish. Thankfully, Lenovo continues to offer a matte option for both Full HD and WQHD variants.
Our test device is called the ThinkPad X1 Carbon 6th 20KG-S03900 and is exclusively available for students and academic staff for 1,839 Euros (~$2282). This includes a Core i7-8550U, 16 GB RAM, 512 GB PCIe SSD, Windows 10 Pro, and the WQHD HDR display. While the TopSeller model is not yet available generally, an equivalent device can be configured on Lenovo's online shop for just under 2,400 Euros (~$2978).
Our previous reviews for the aesthetically identical X1 Carbon 2017 are available if you would like more information:
Changelog
- 02/21: Comparison with 2018 ThinkPads, ports, SD-reader, WLAN, docking, outdoor, fan, temperatures, battery runtime
- 03/06: Comparison with ThinkPad T480, case, security, input devices, HDR, GPU performance, speakers, verdict, pros & cons, rating
- 04/11: Undervolting Core i7, measurements FHD panel, WLAN runtime FHD model
- 20/09: HDR, fan noise with BIOS 1.27, Thunderbolt dock with eGPU
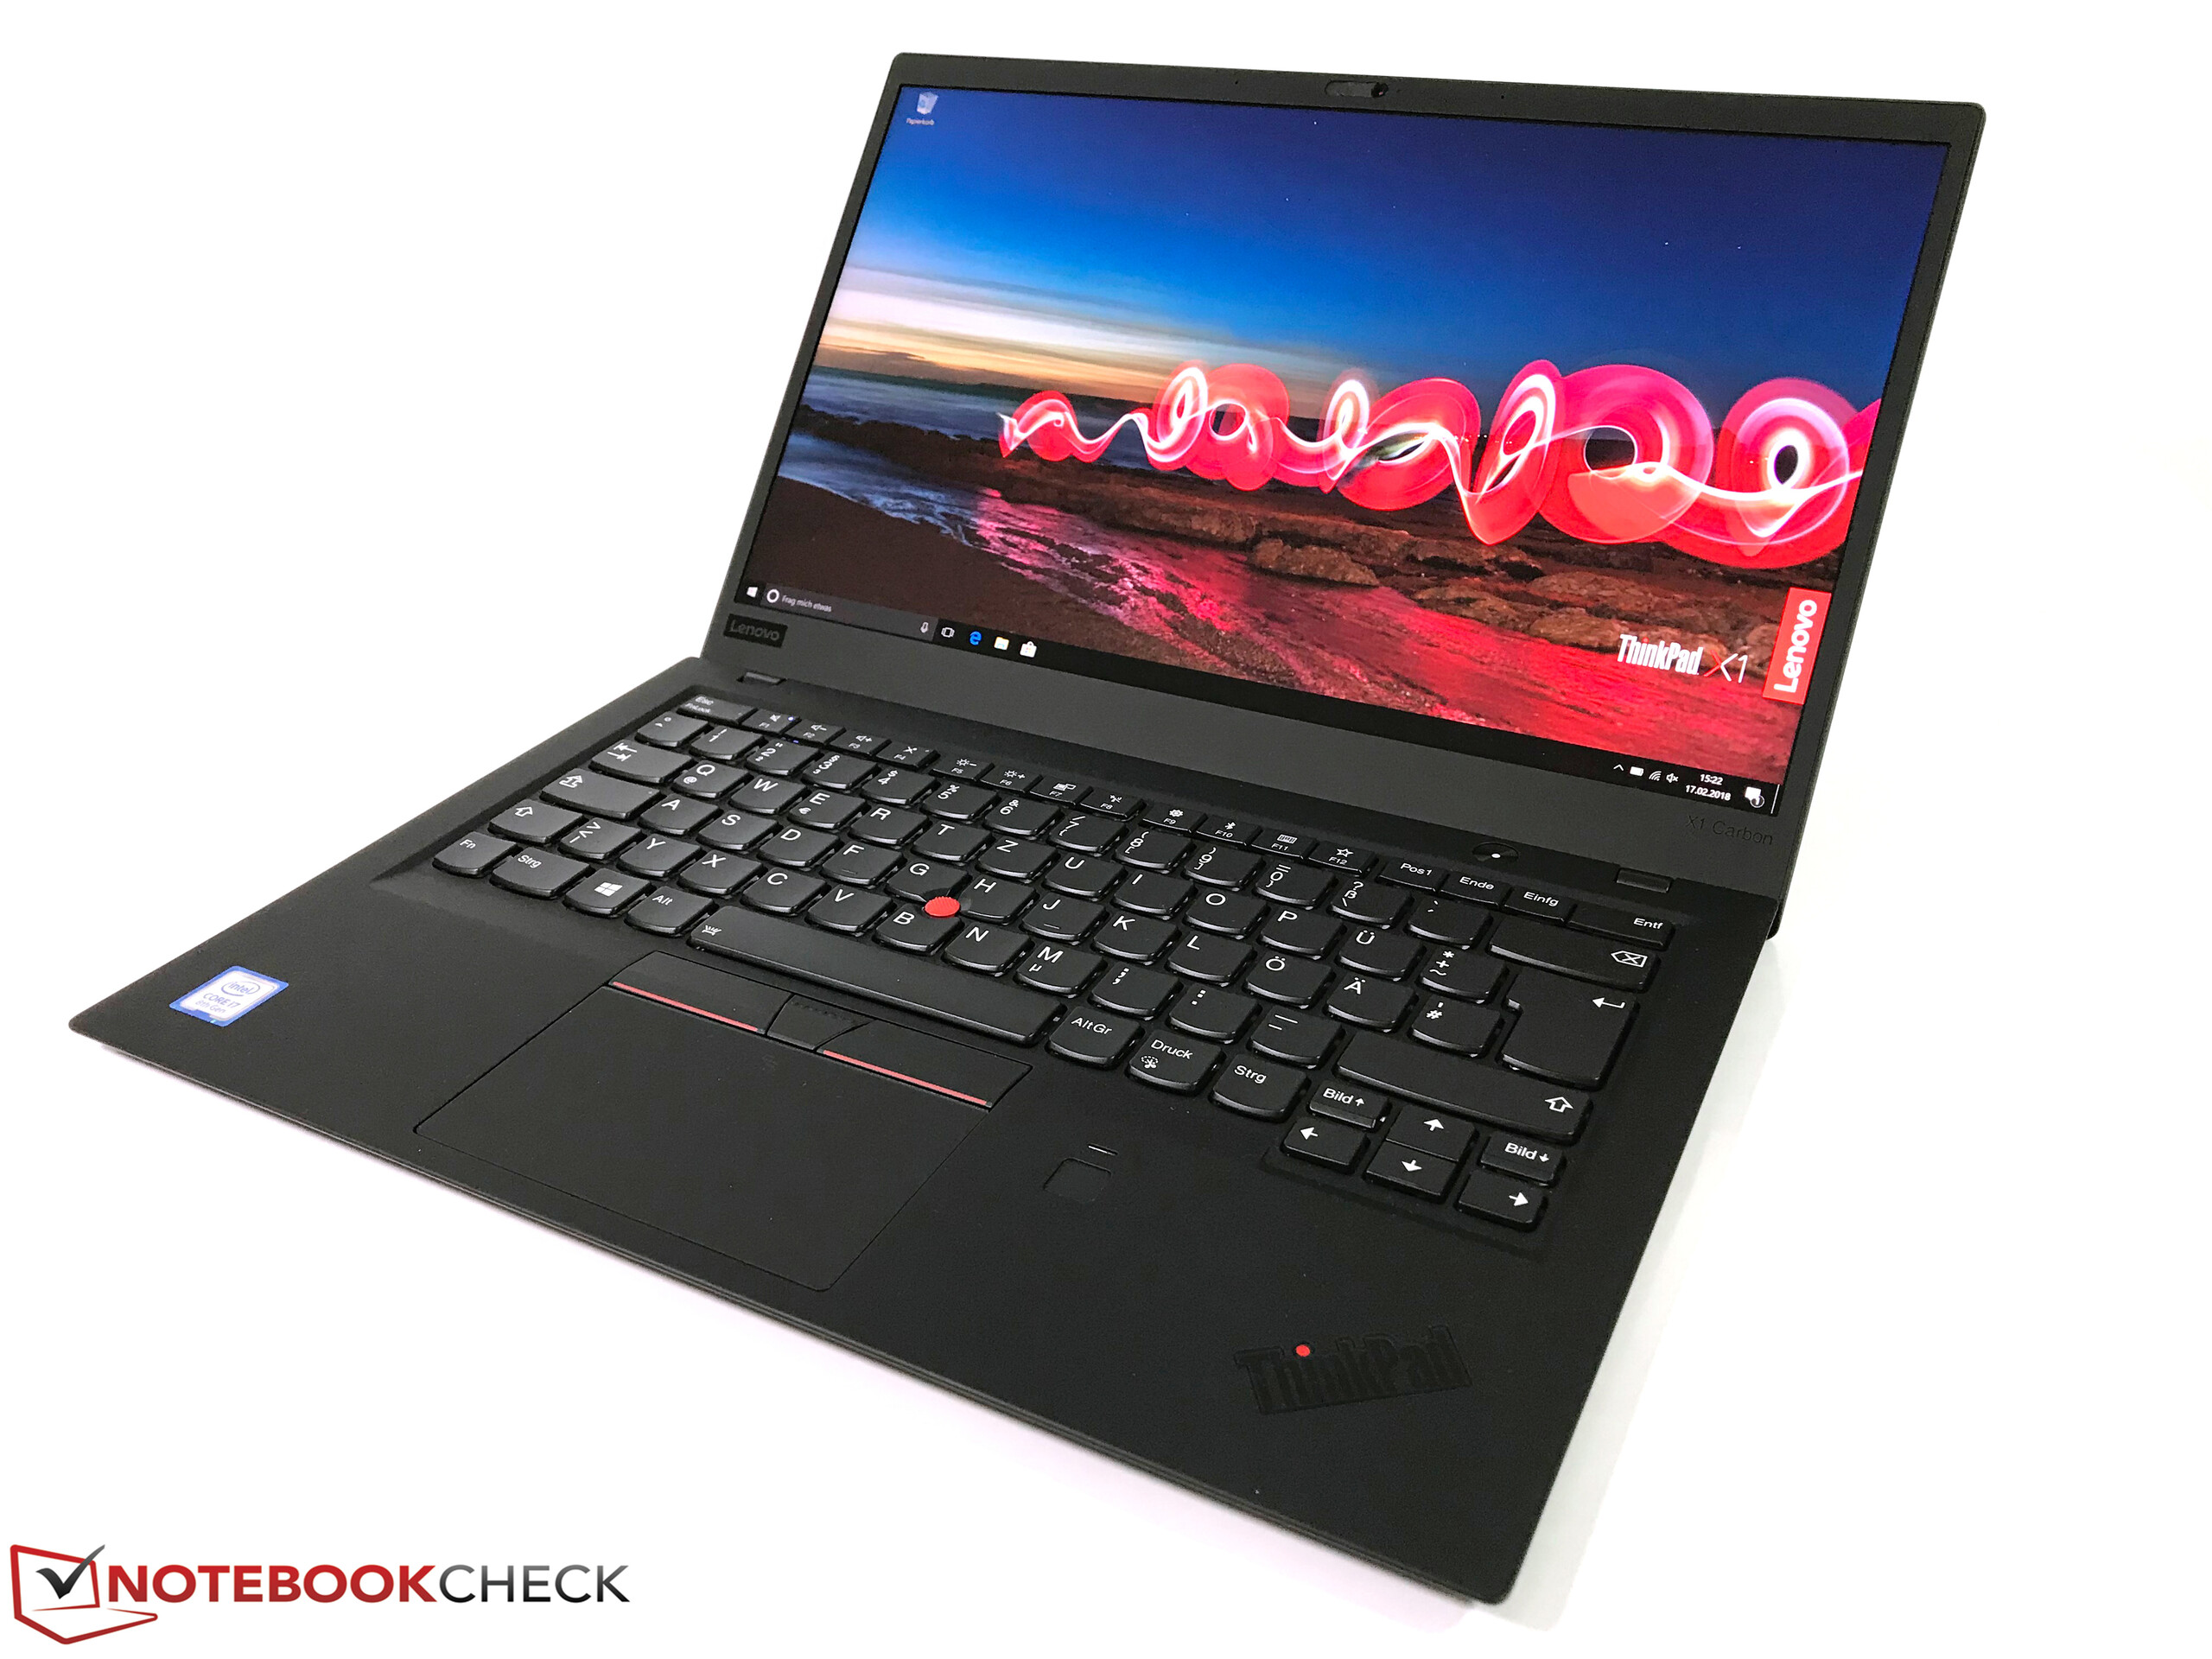
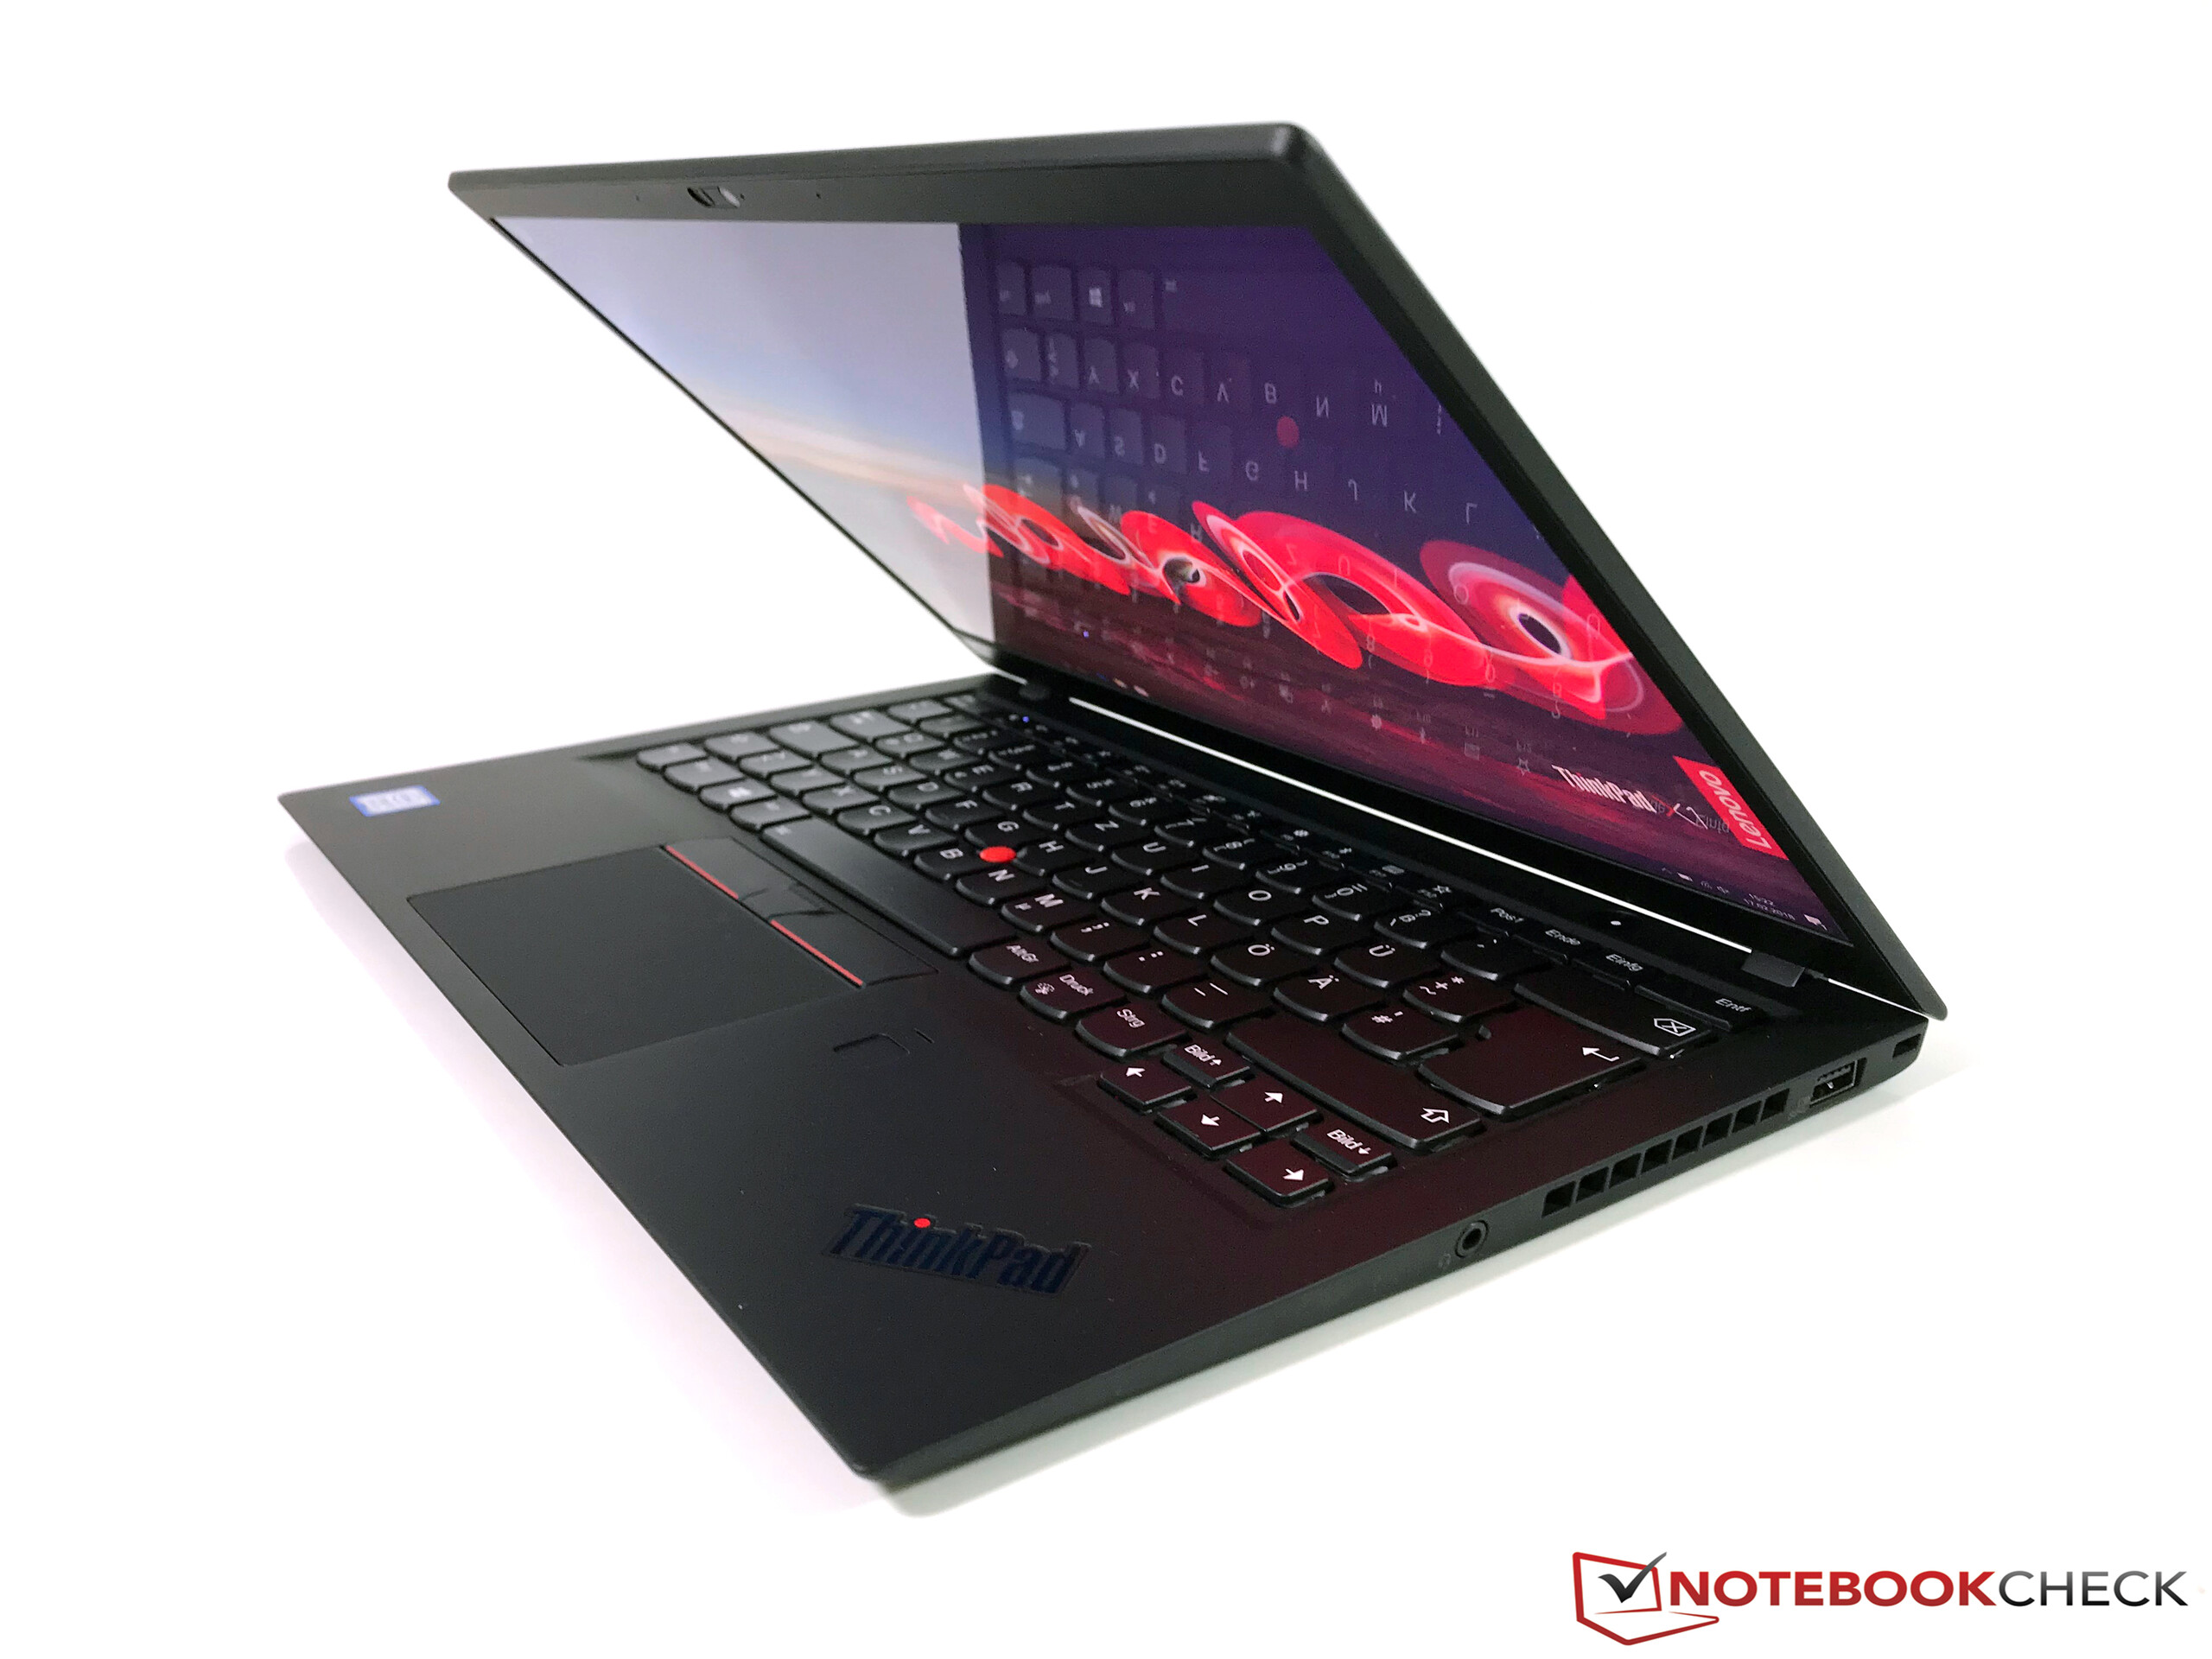
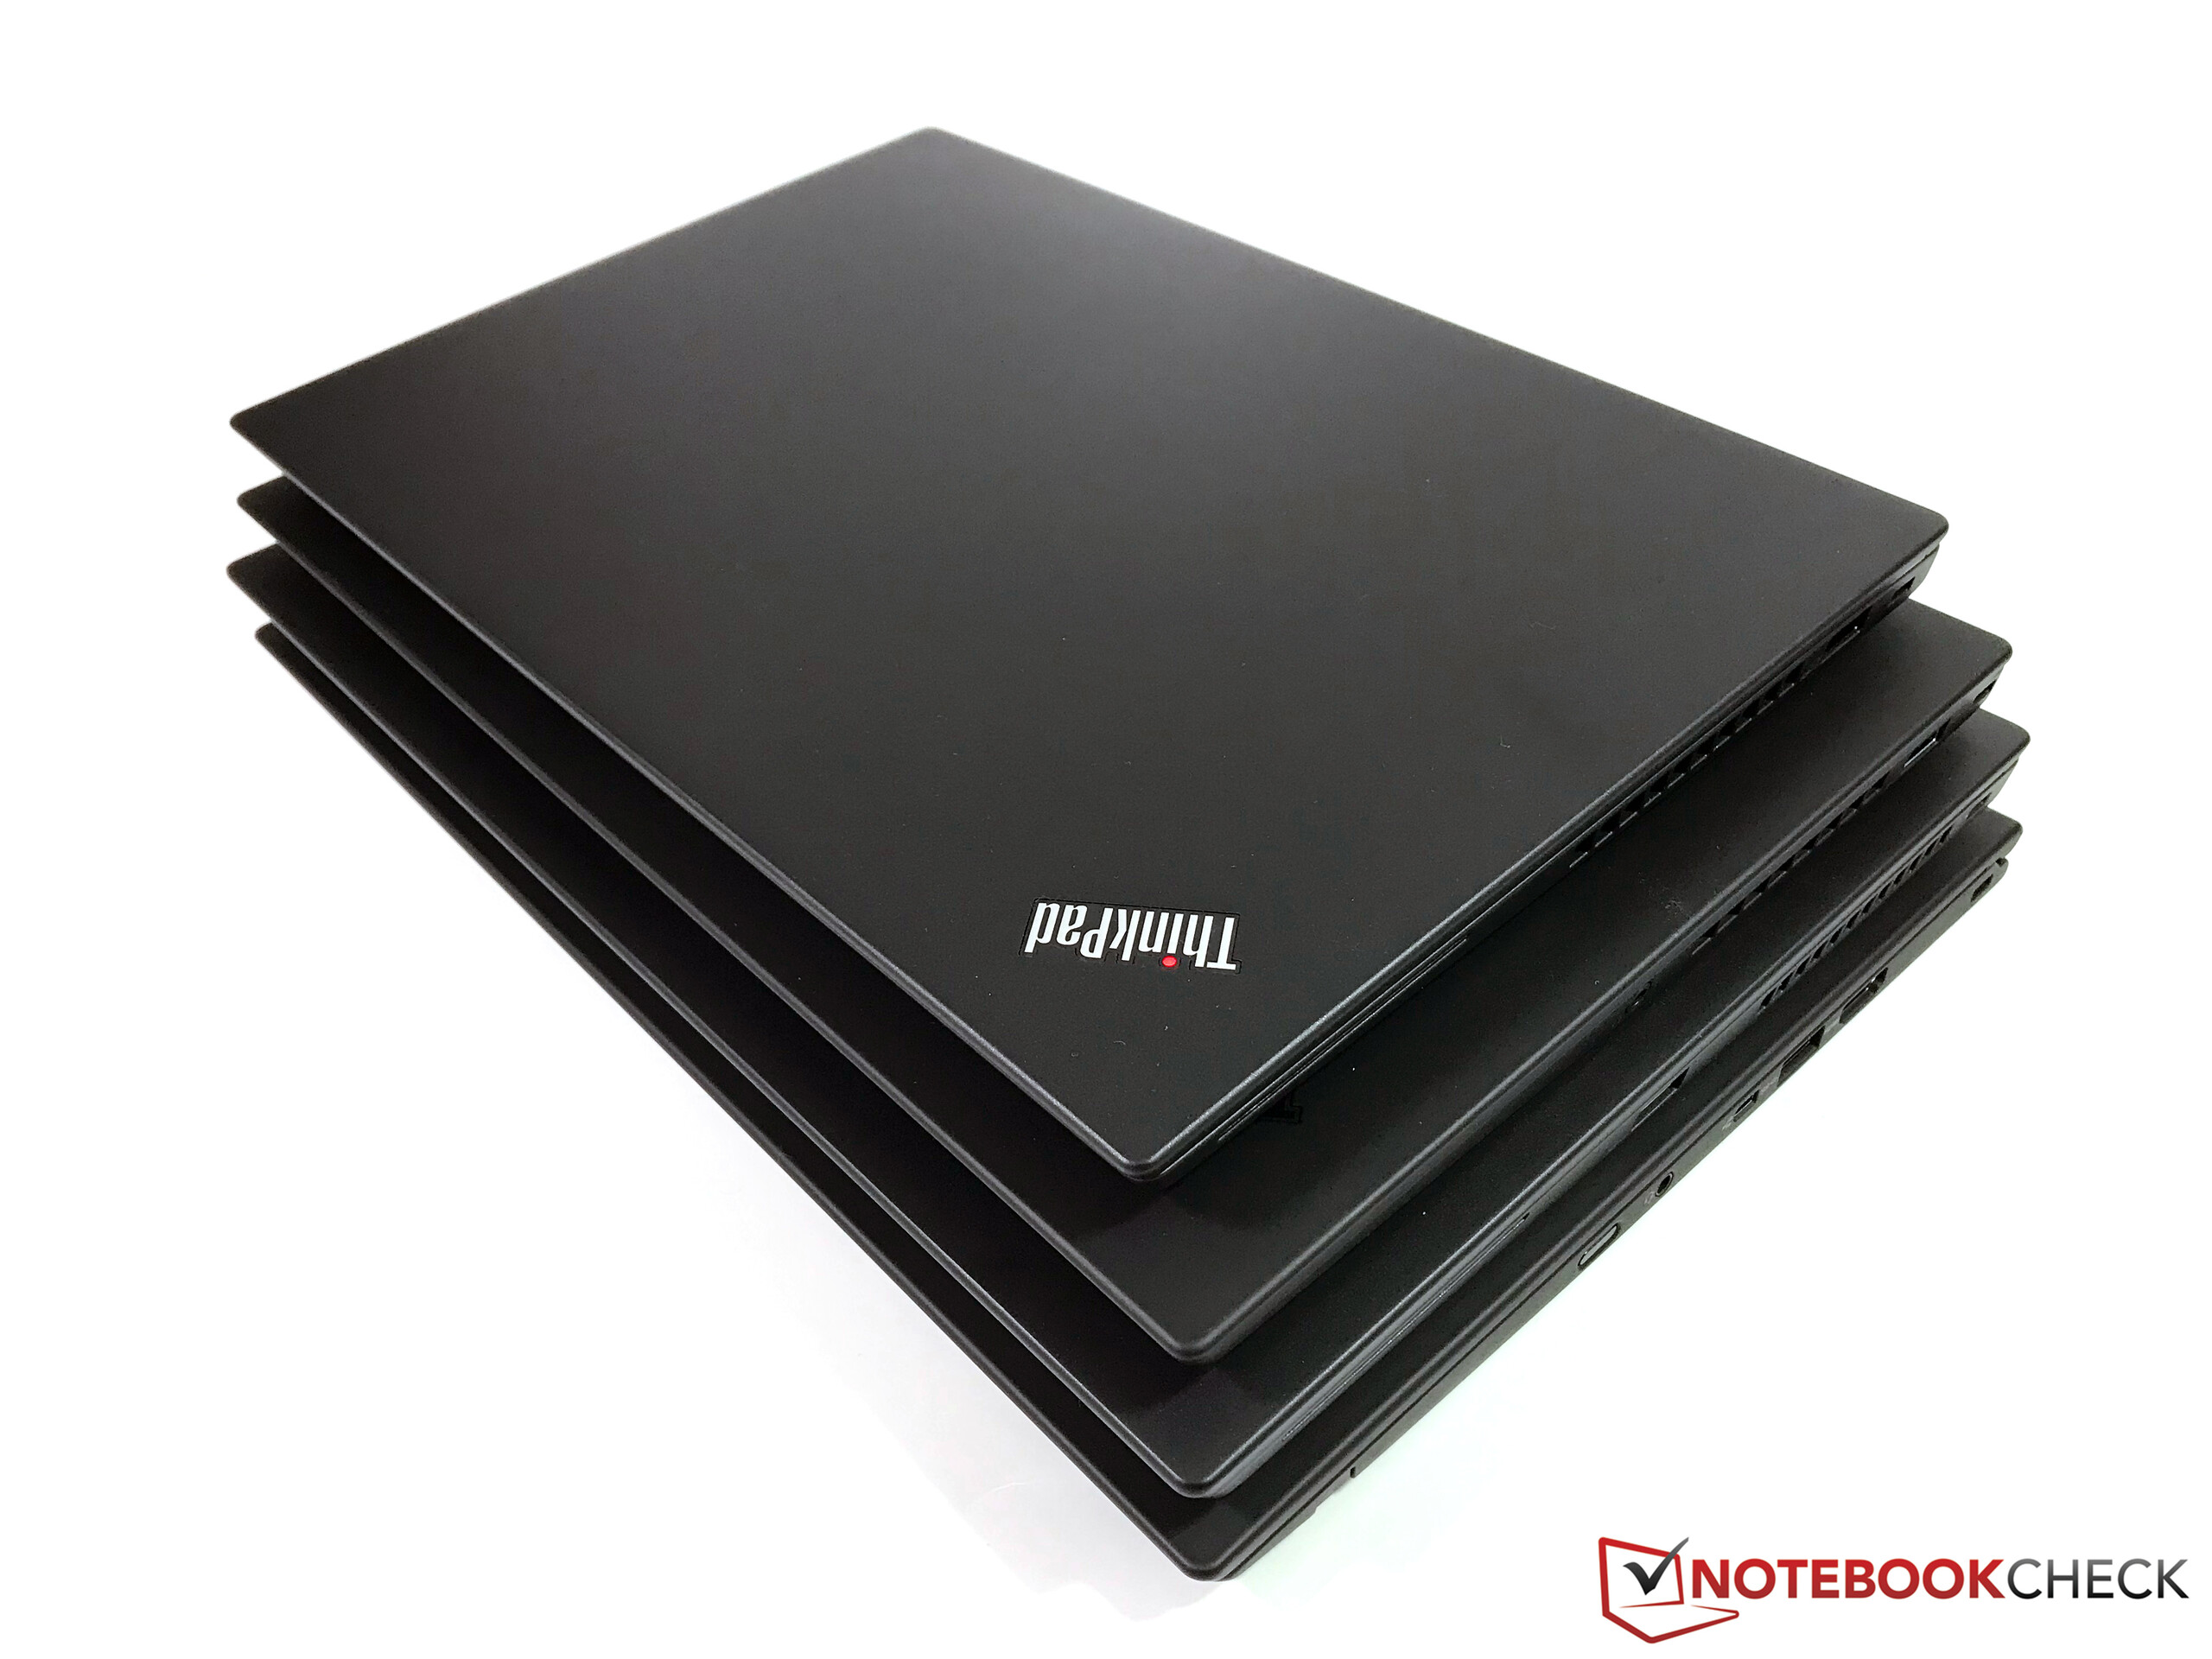
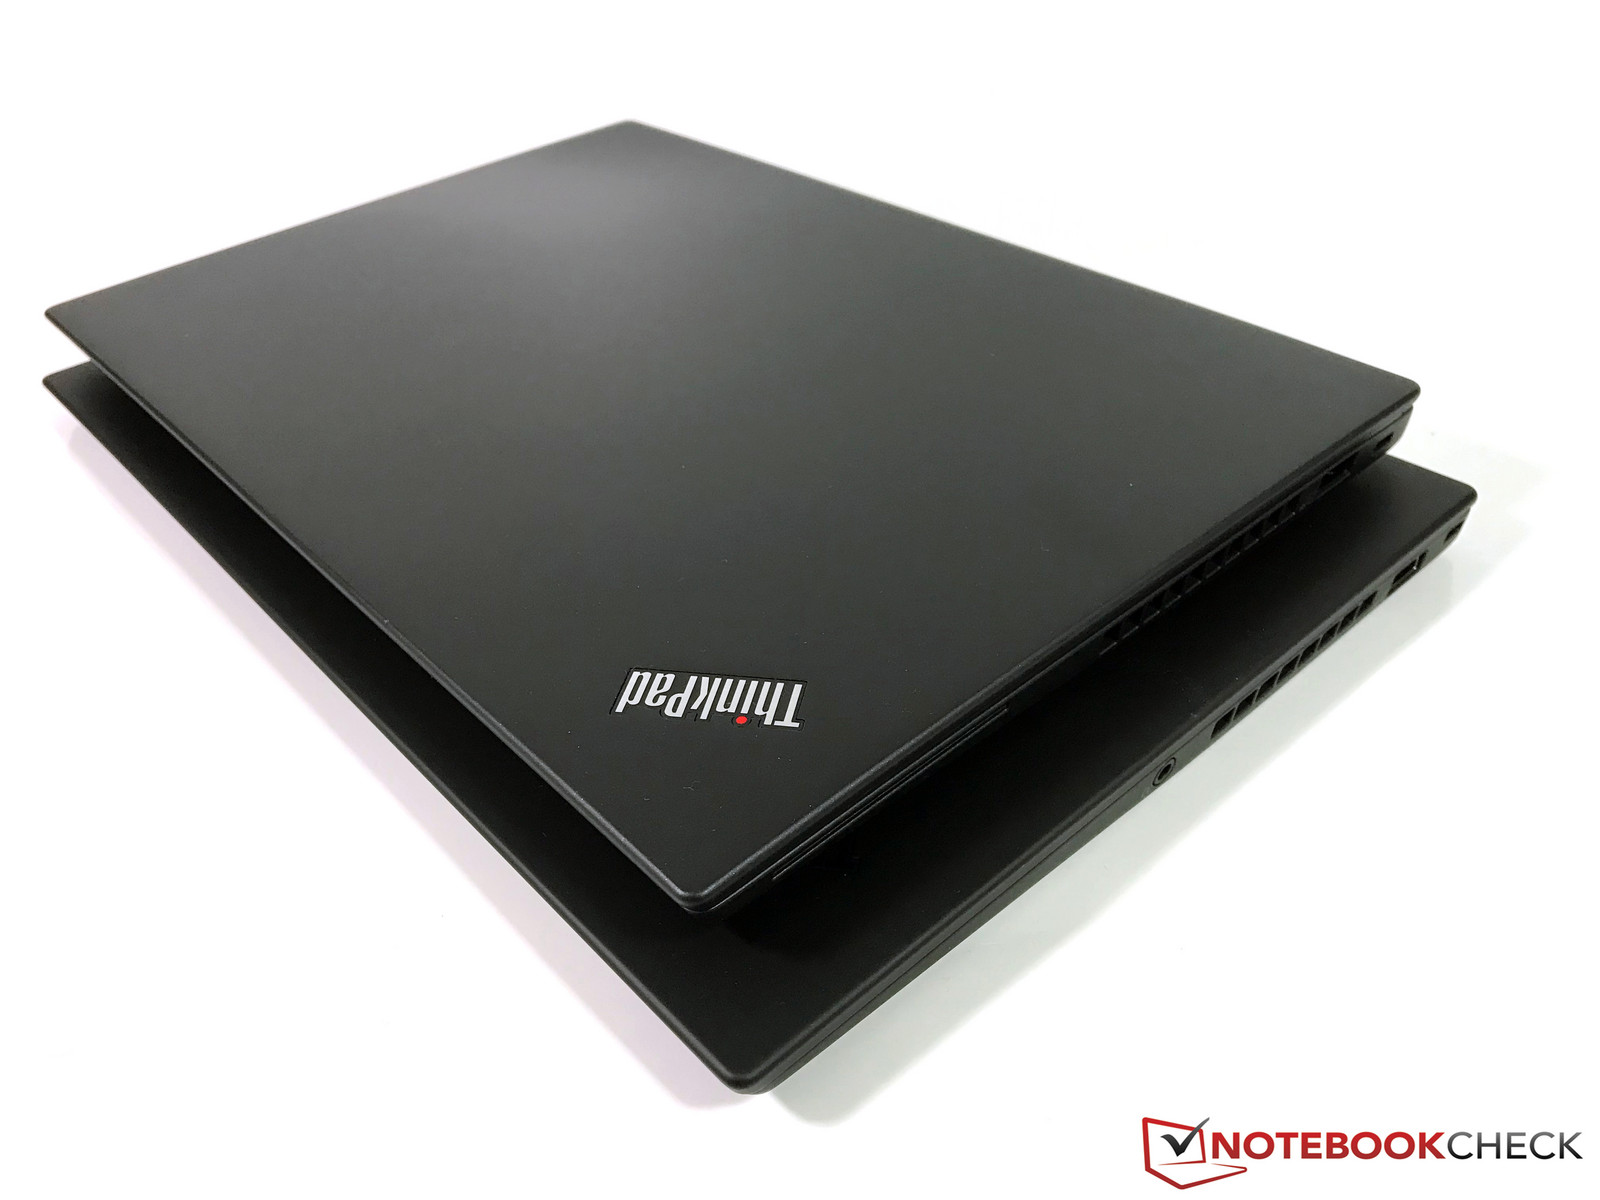
Case – ThinkPad X1 Carbon
The case is nearly identical to the previous generation. Lenovo still uses a combination of hybrid magnesium alloy for the base unit and a carbon/glass fiber reinforced plastic (CFRP/GFRP) for the lid. We still like the stability a lot, and the weakness of the predecessor at the rear left corner of the bottom cover (was not perfectly integrated) is fixed as well. We once again want to refer to our review of the X1 Carbon 2017, where we had a detailed look at the chassis.
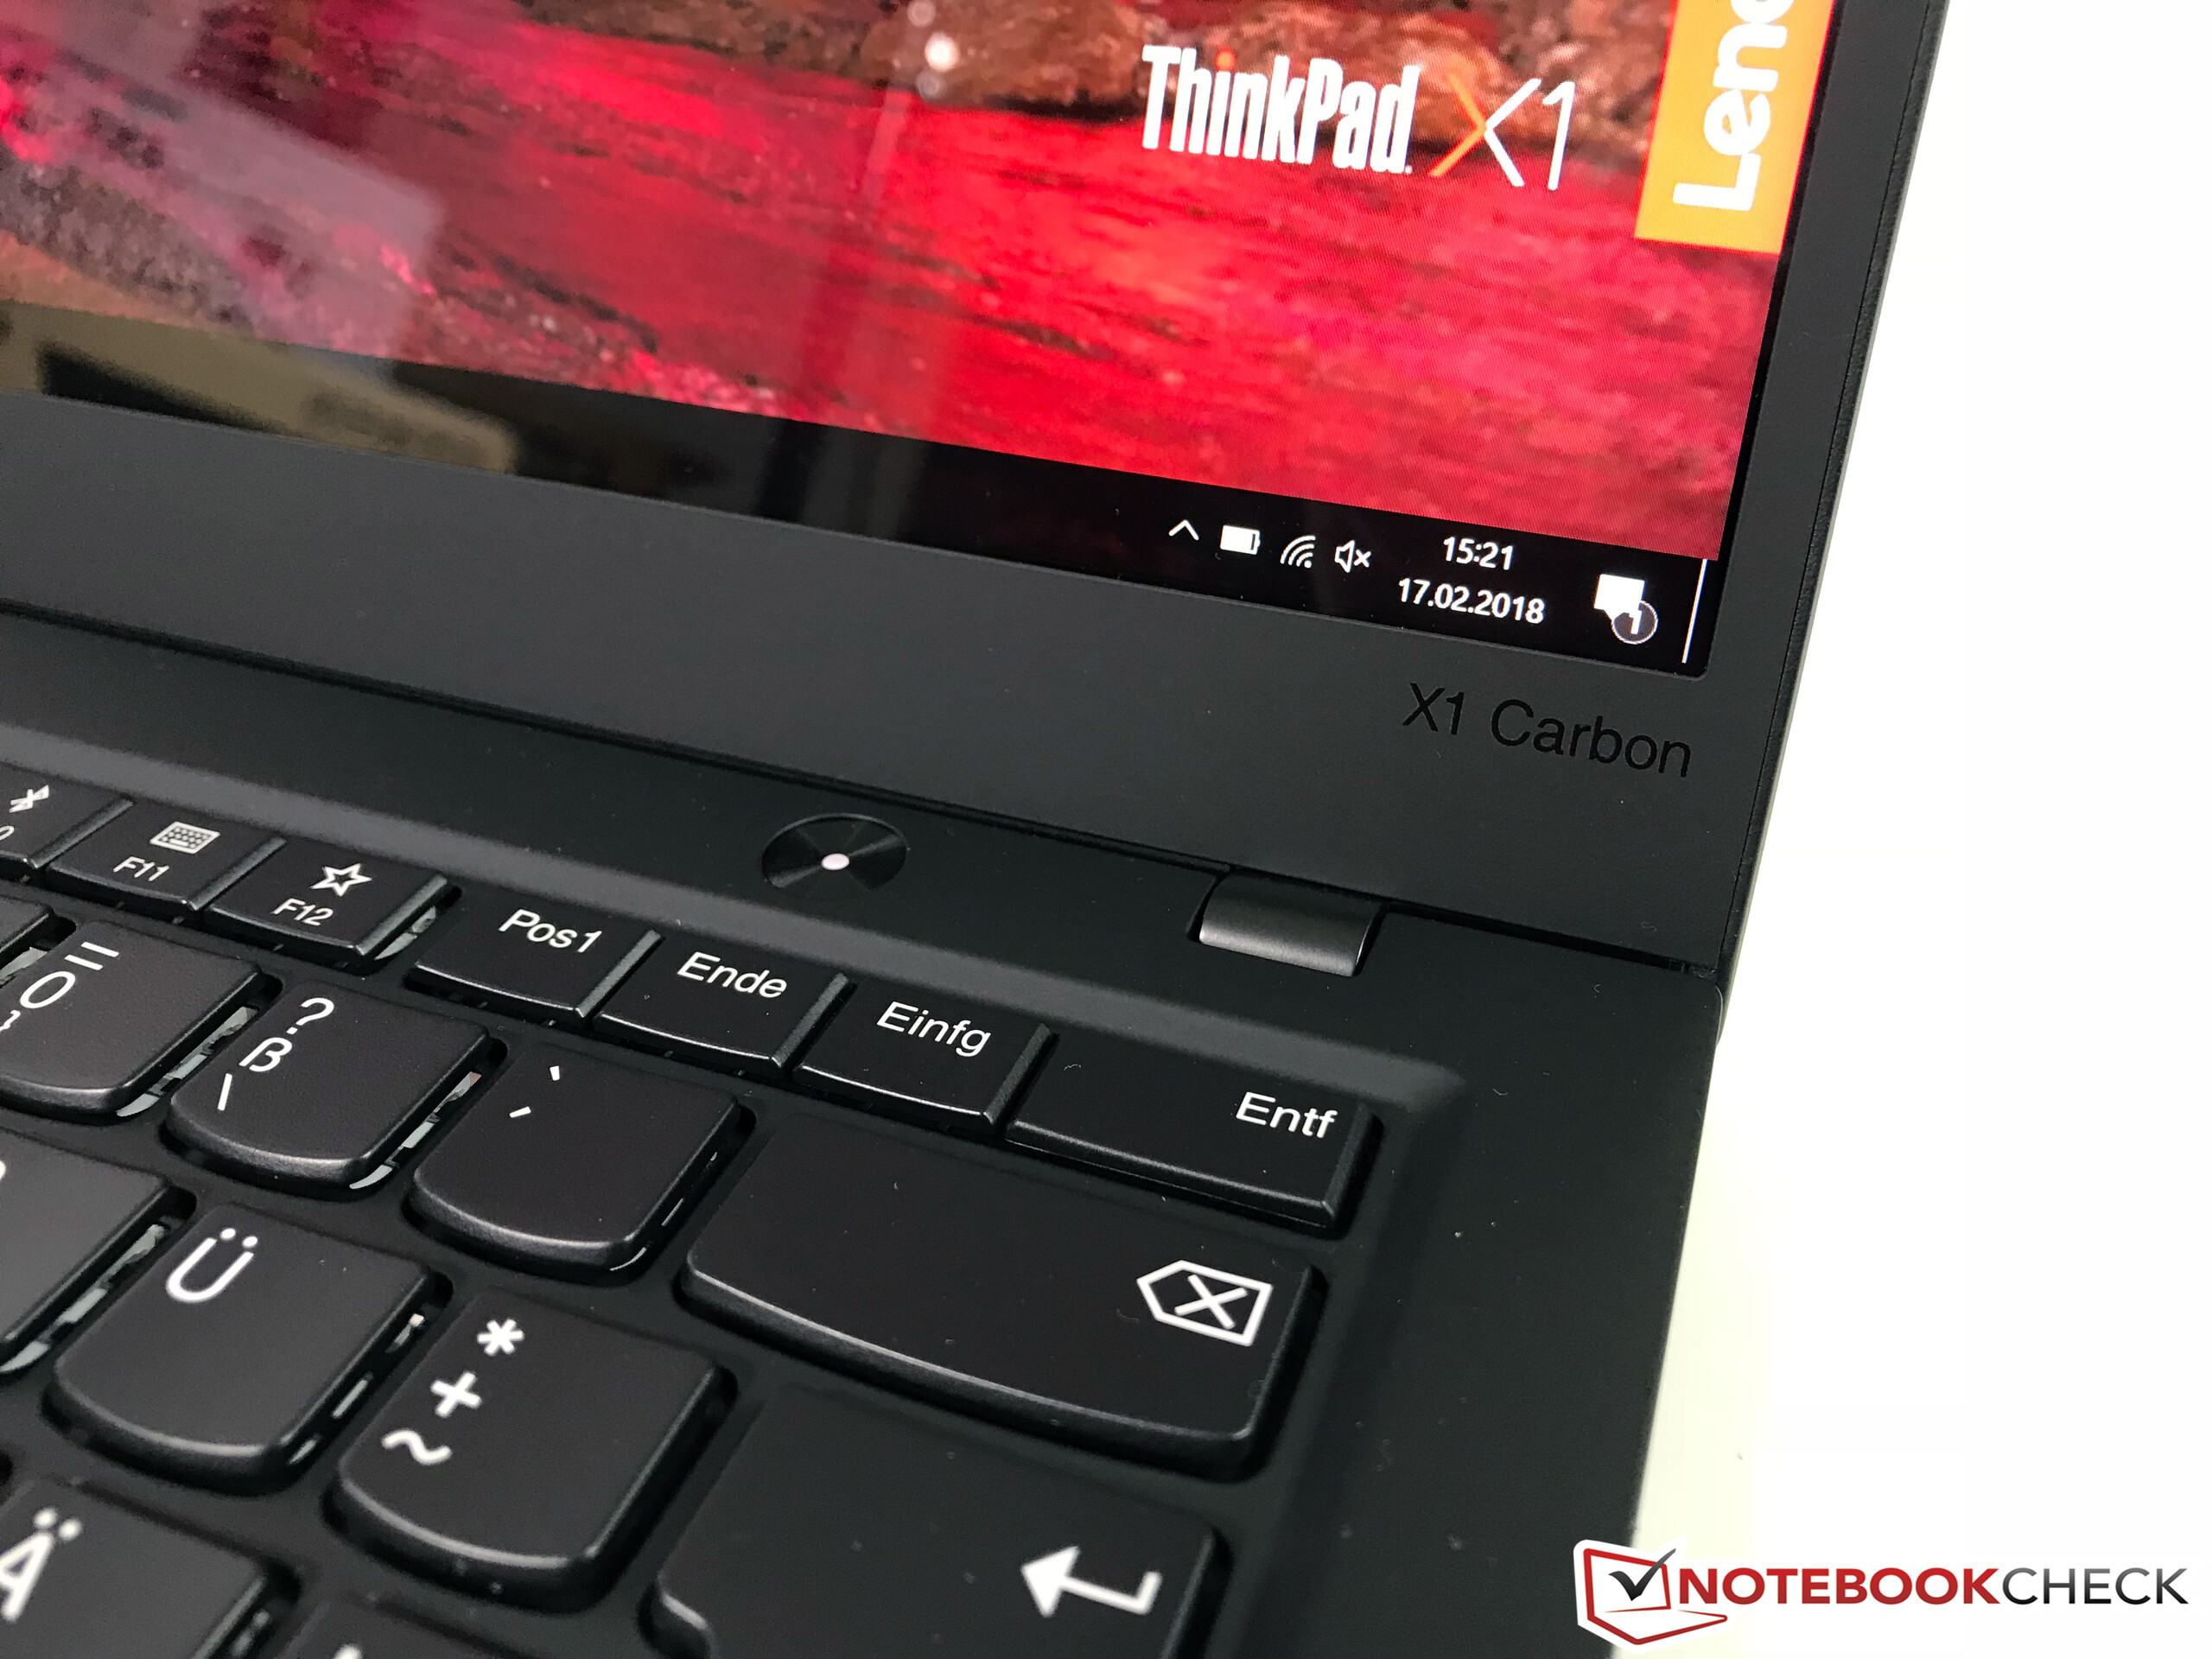
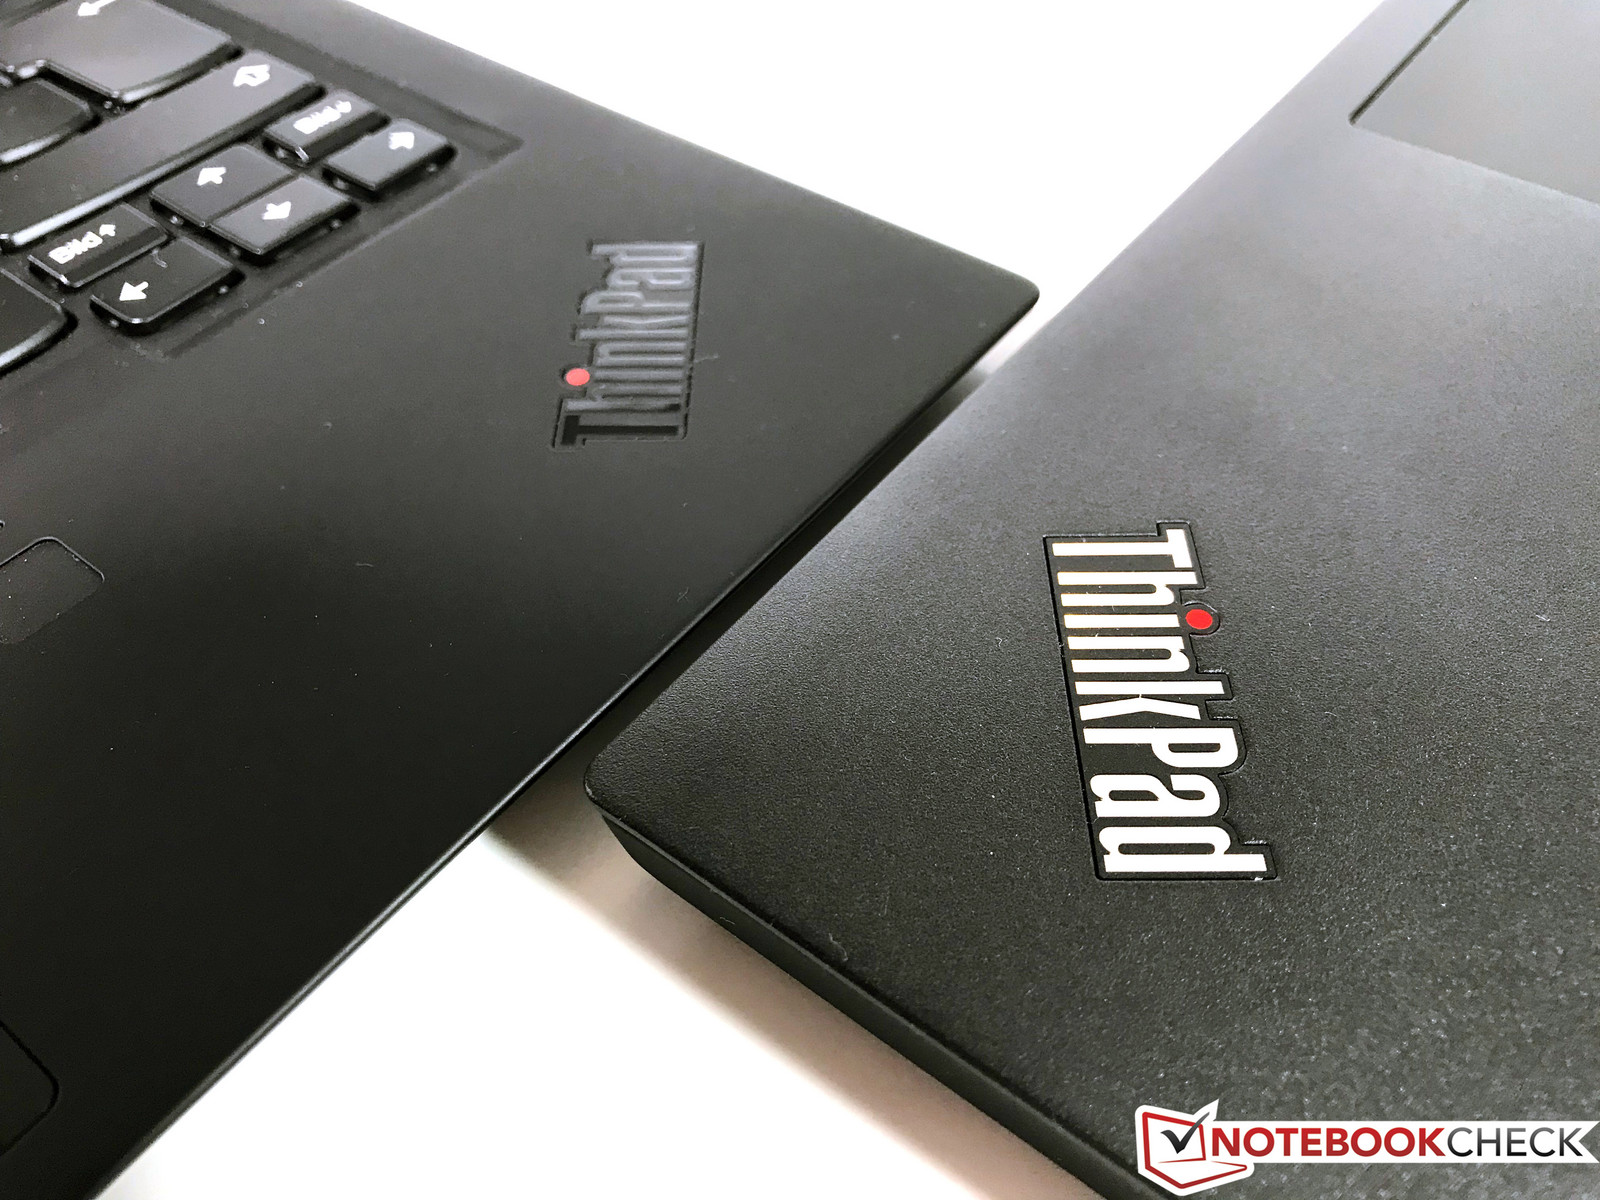
We were a bit surprised that Lenovo made some visual adjustments. The two ThinkPad logos are not silver anymore but are in a glossy black, which suits the black color of the metal hinges. This is certainly a matter of taste, just like the silver-red X1 logo on the lid. It is easy to spot and shows you are using a device from the X1 series (also on the X1 Yoga 3rd), but we would have preferred a more subtle approach without an additional logo.
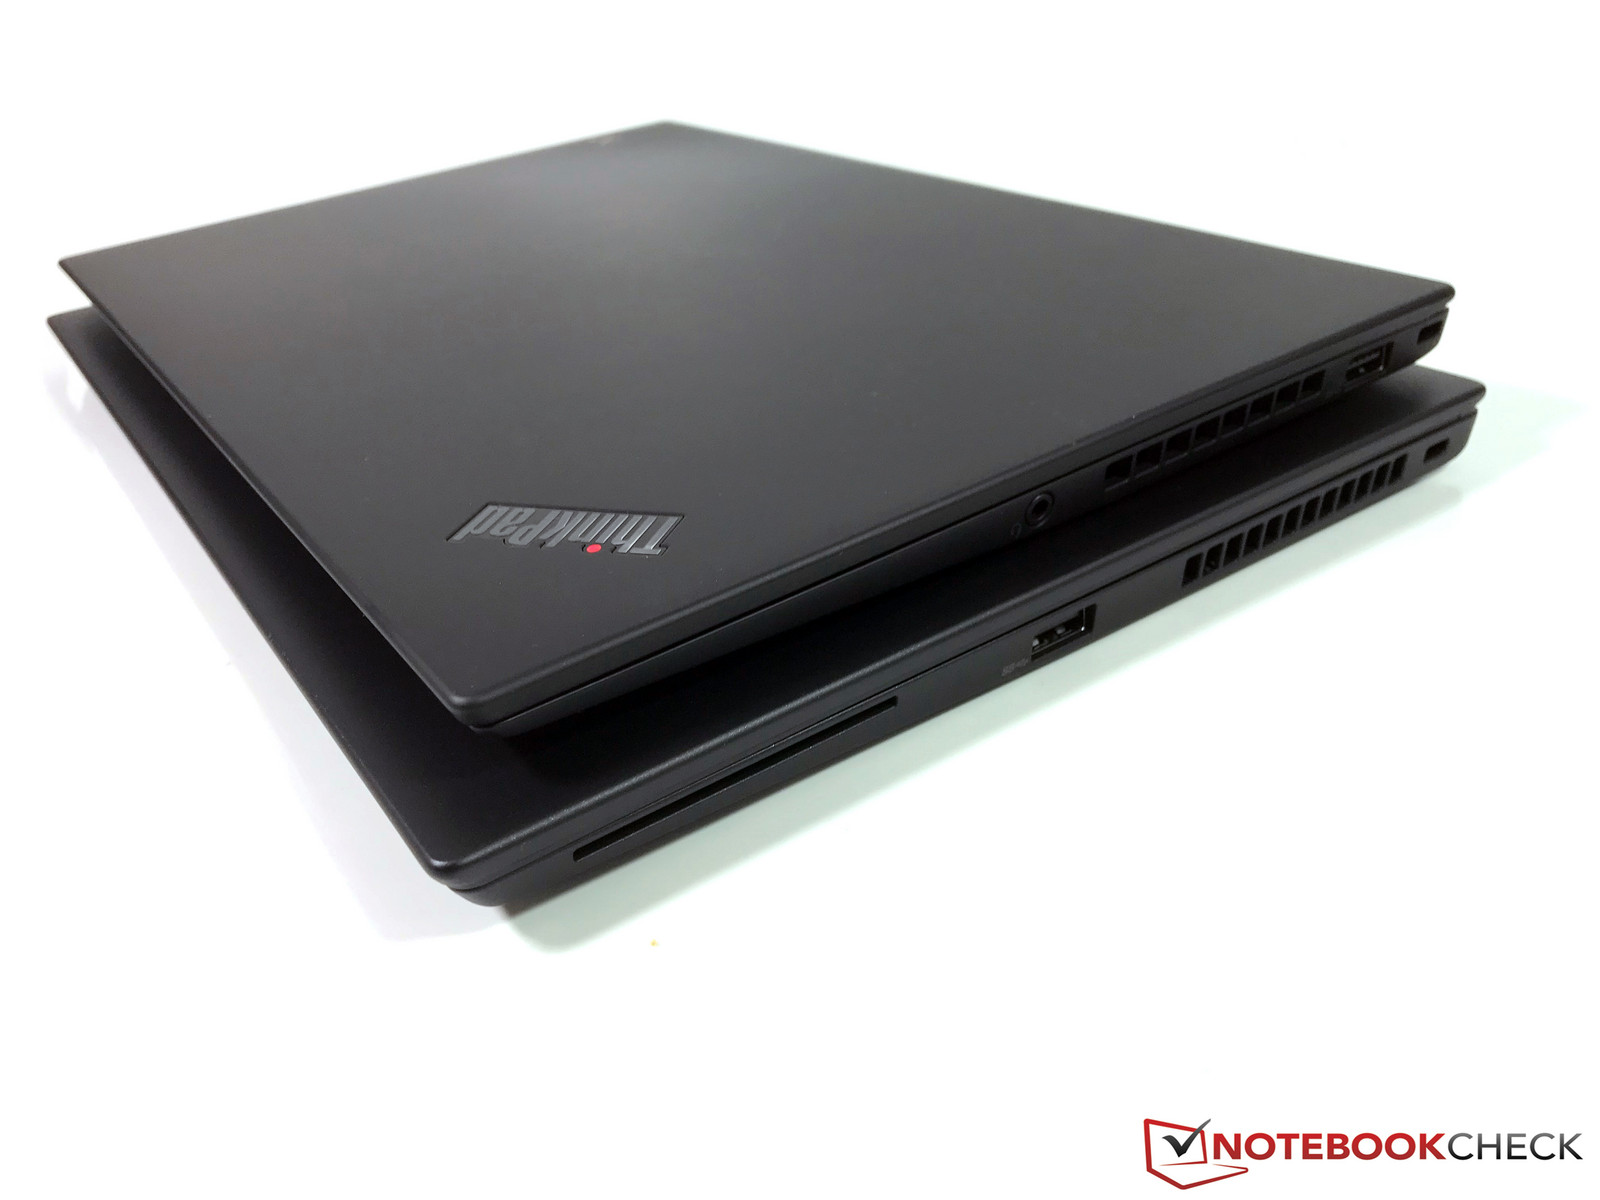
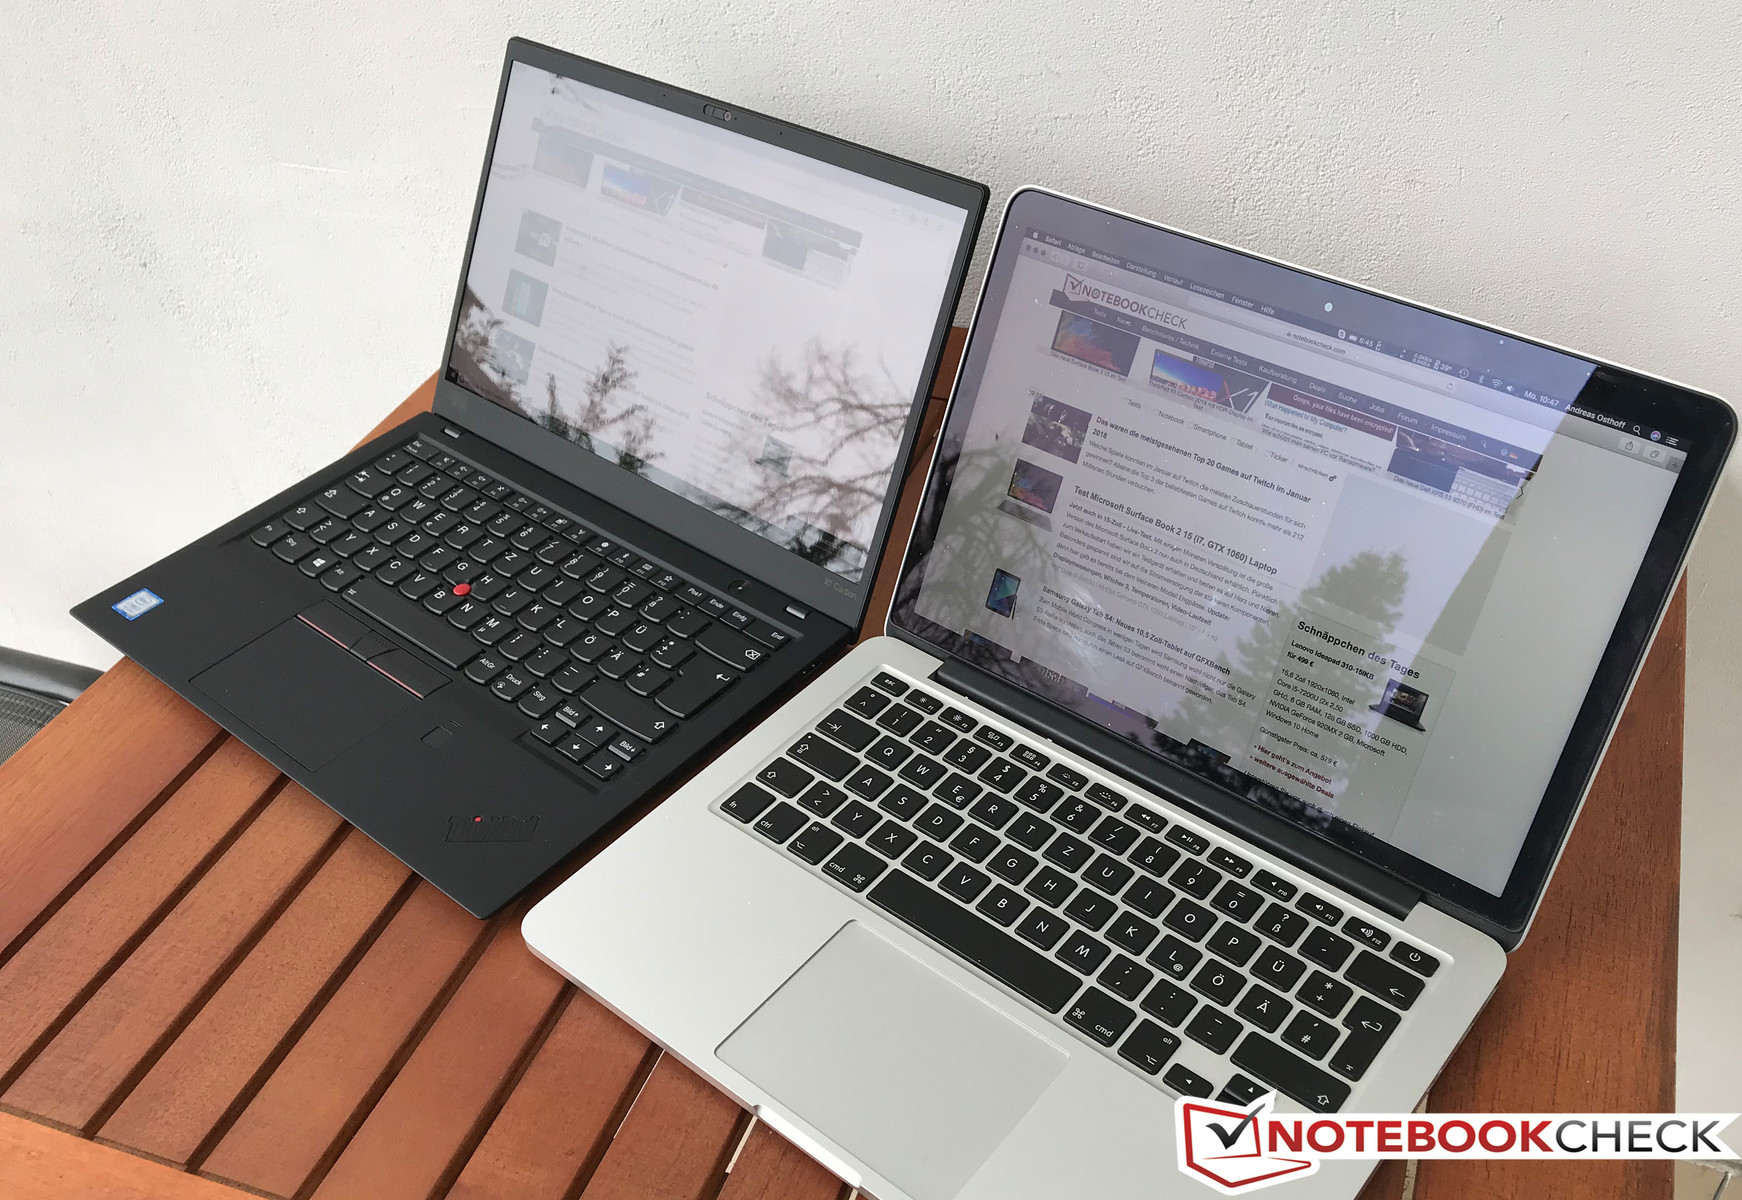
The ThinkPad X1 Carbon is still one of the lightest and most compact business laptops in 2018. It is also the smallest 14-inch laptop in our comparison group; only the two 13.3-inch systems have a smaller footprint. Storing the X1 Carbon 2018 in your backpack or suitcase is no problem at all, and the handling is also easy thanks to the low weight.
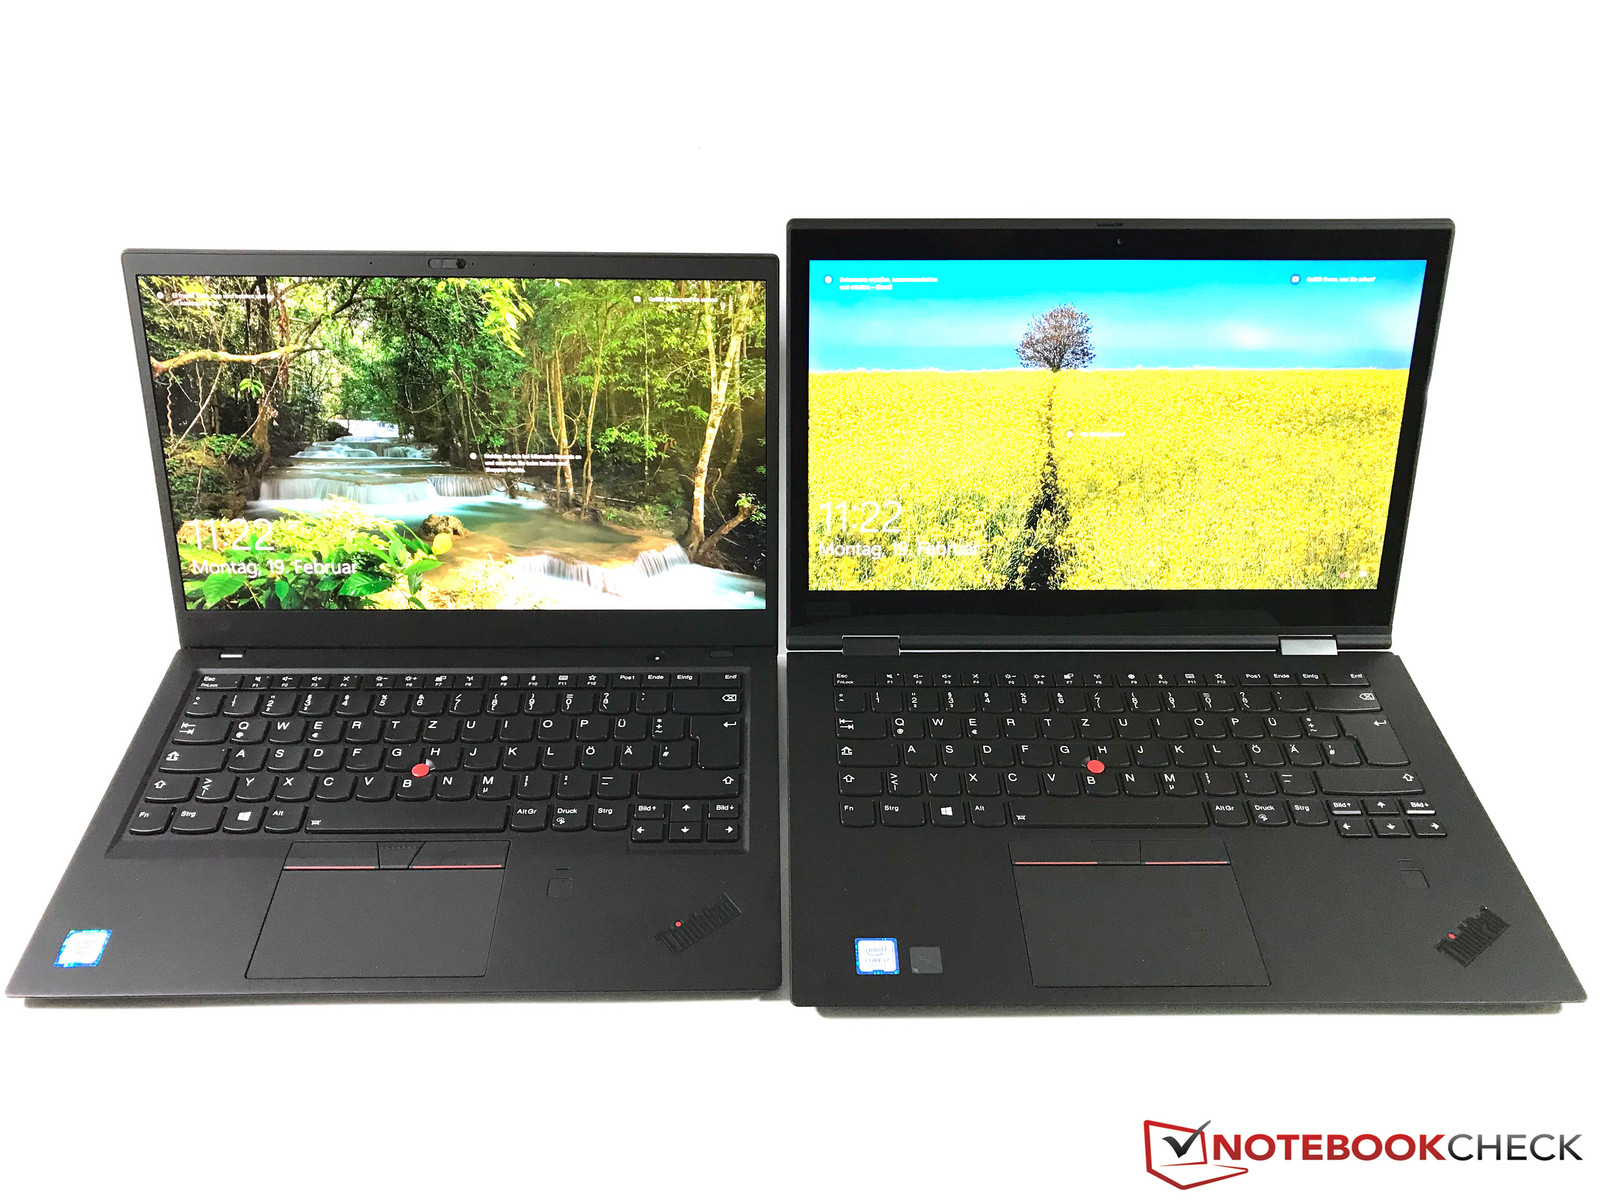
Comparison of 2018 ThinkPads
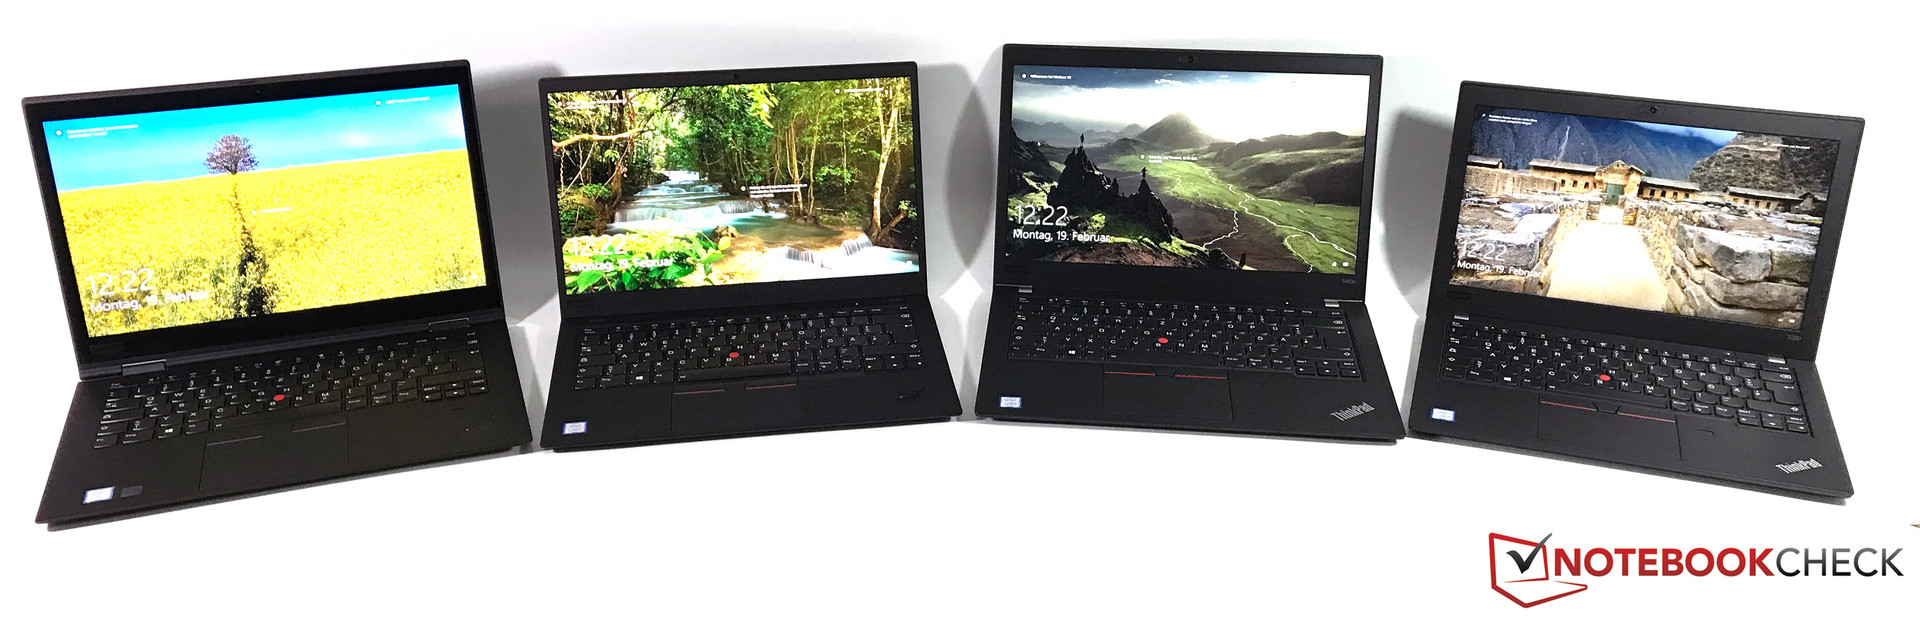
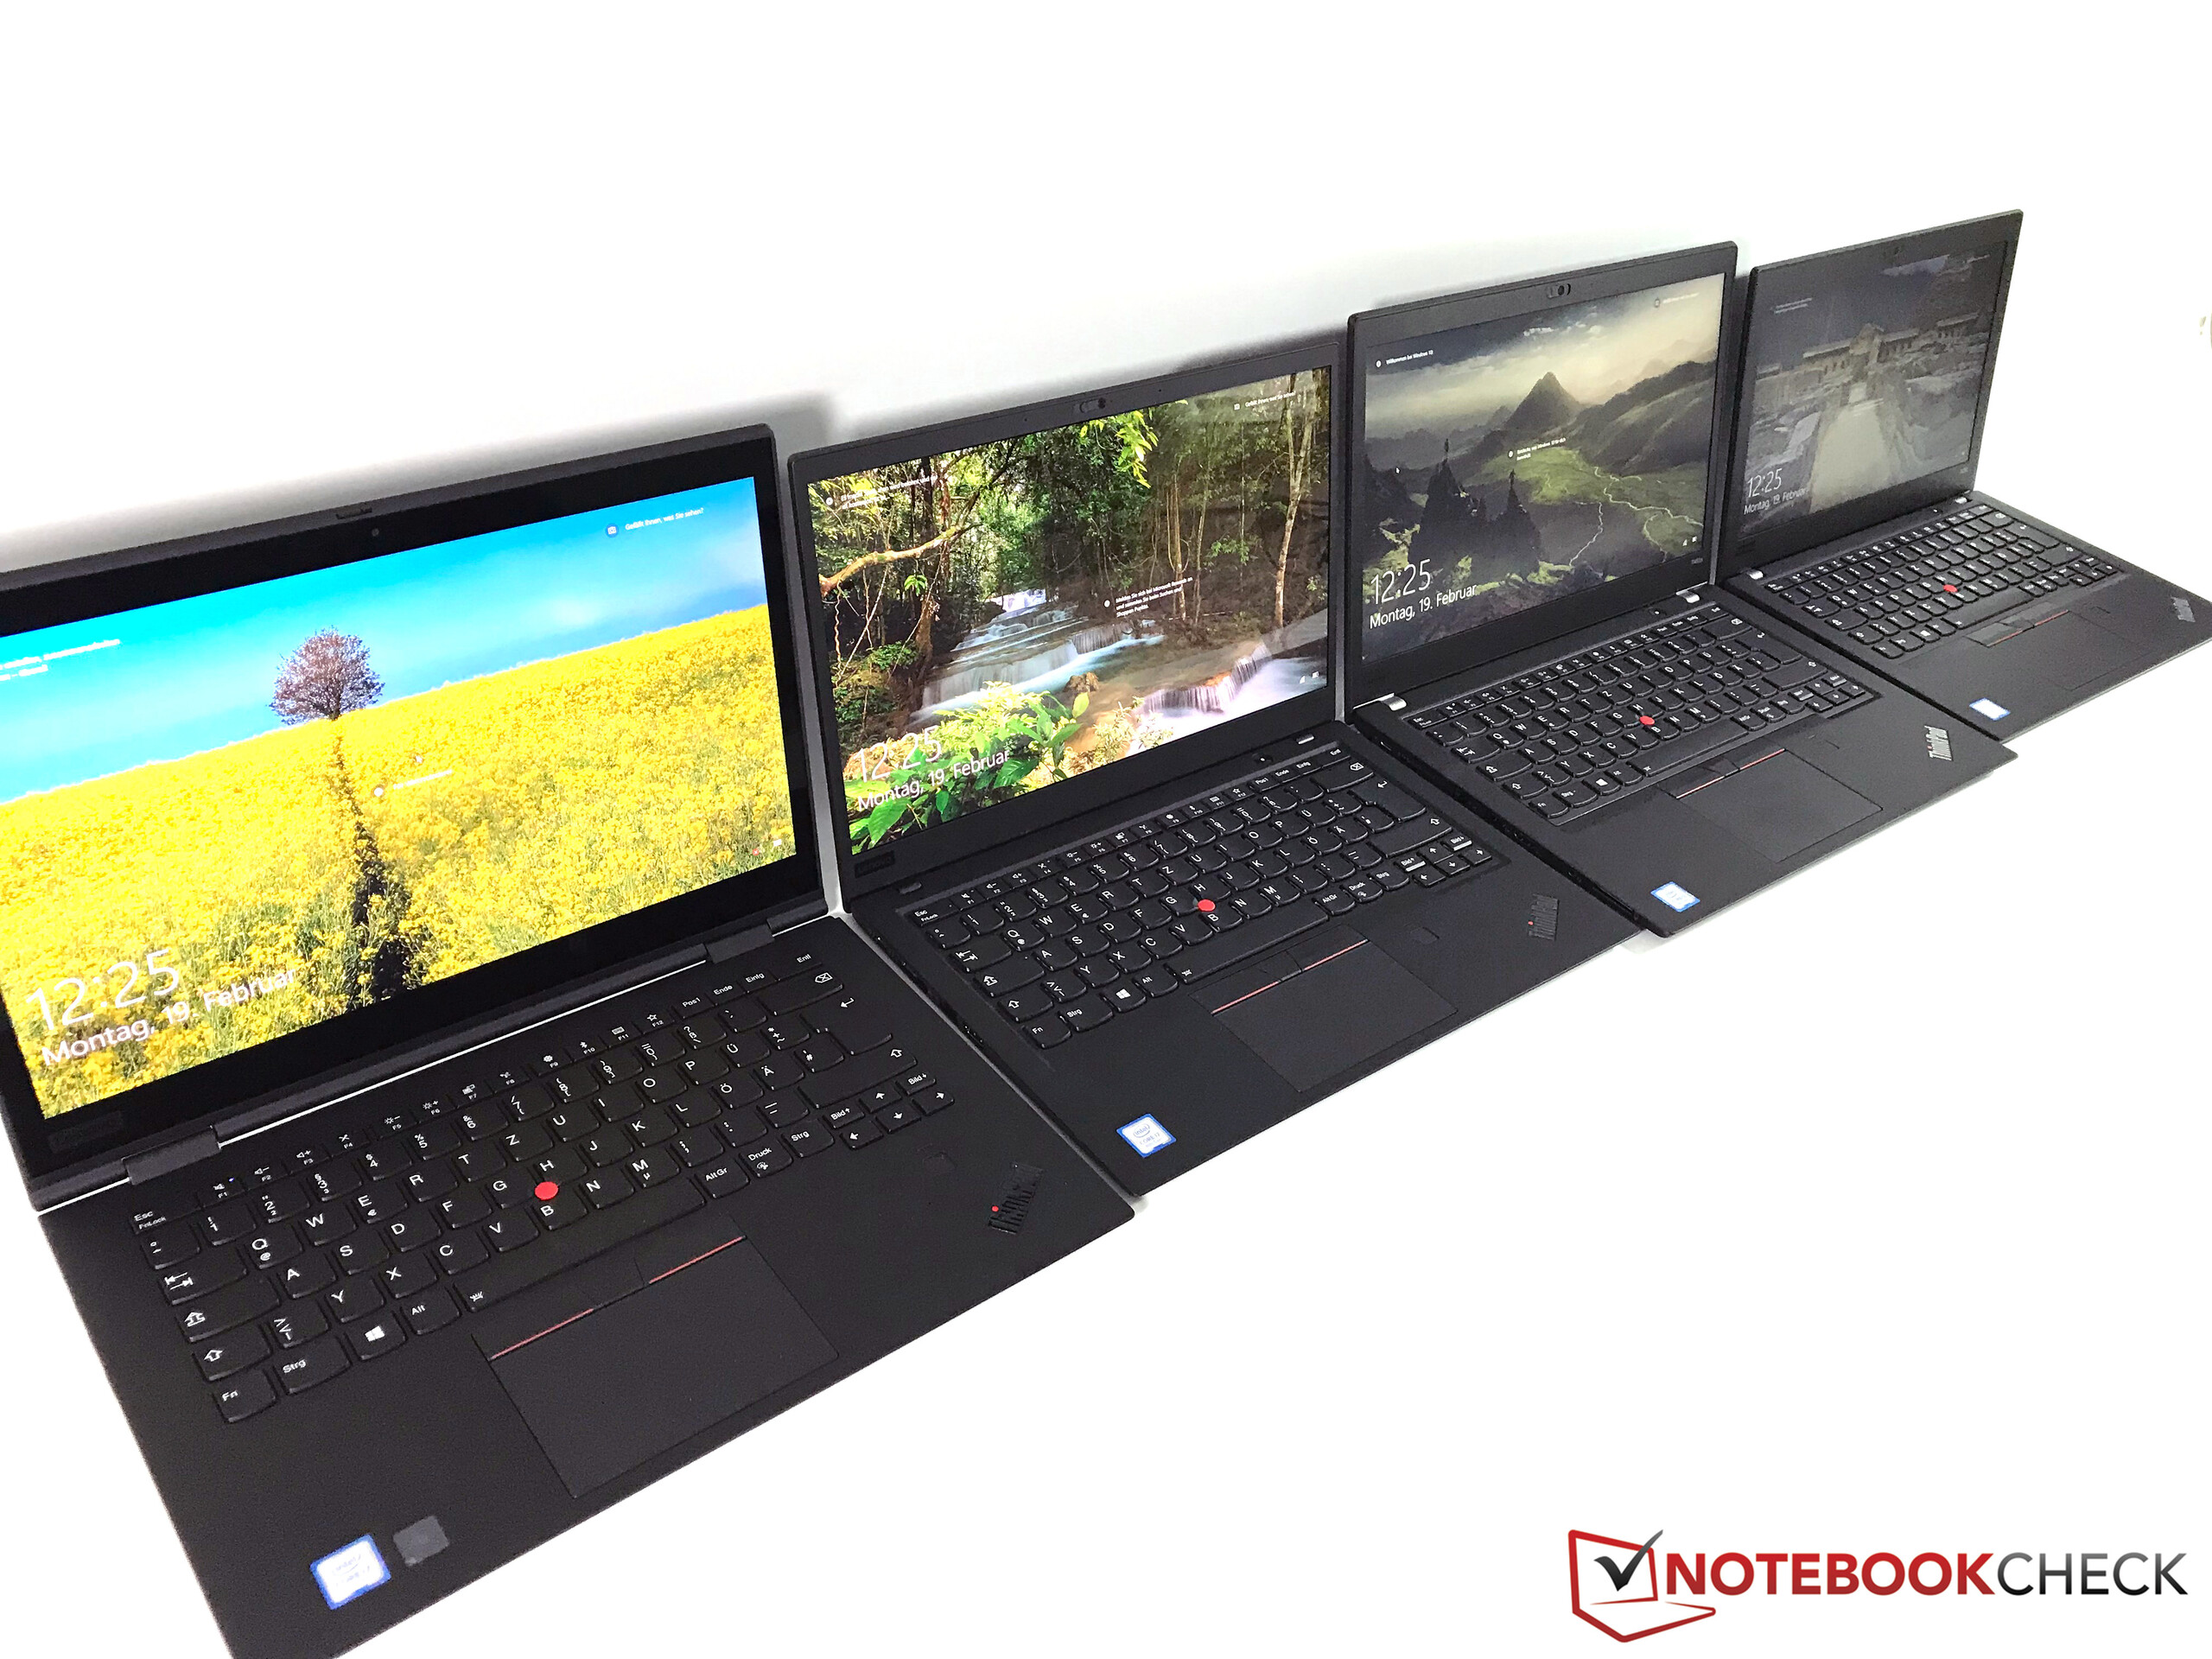
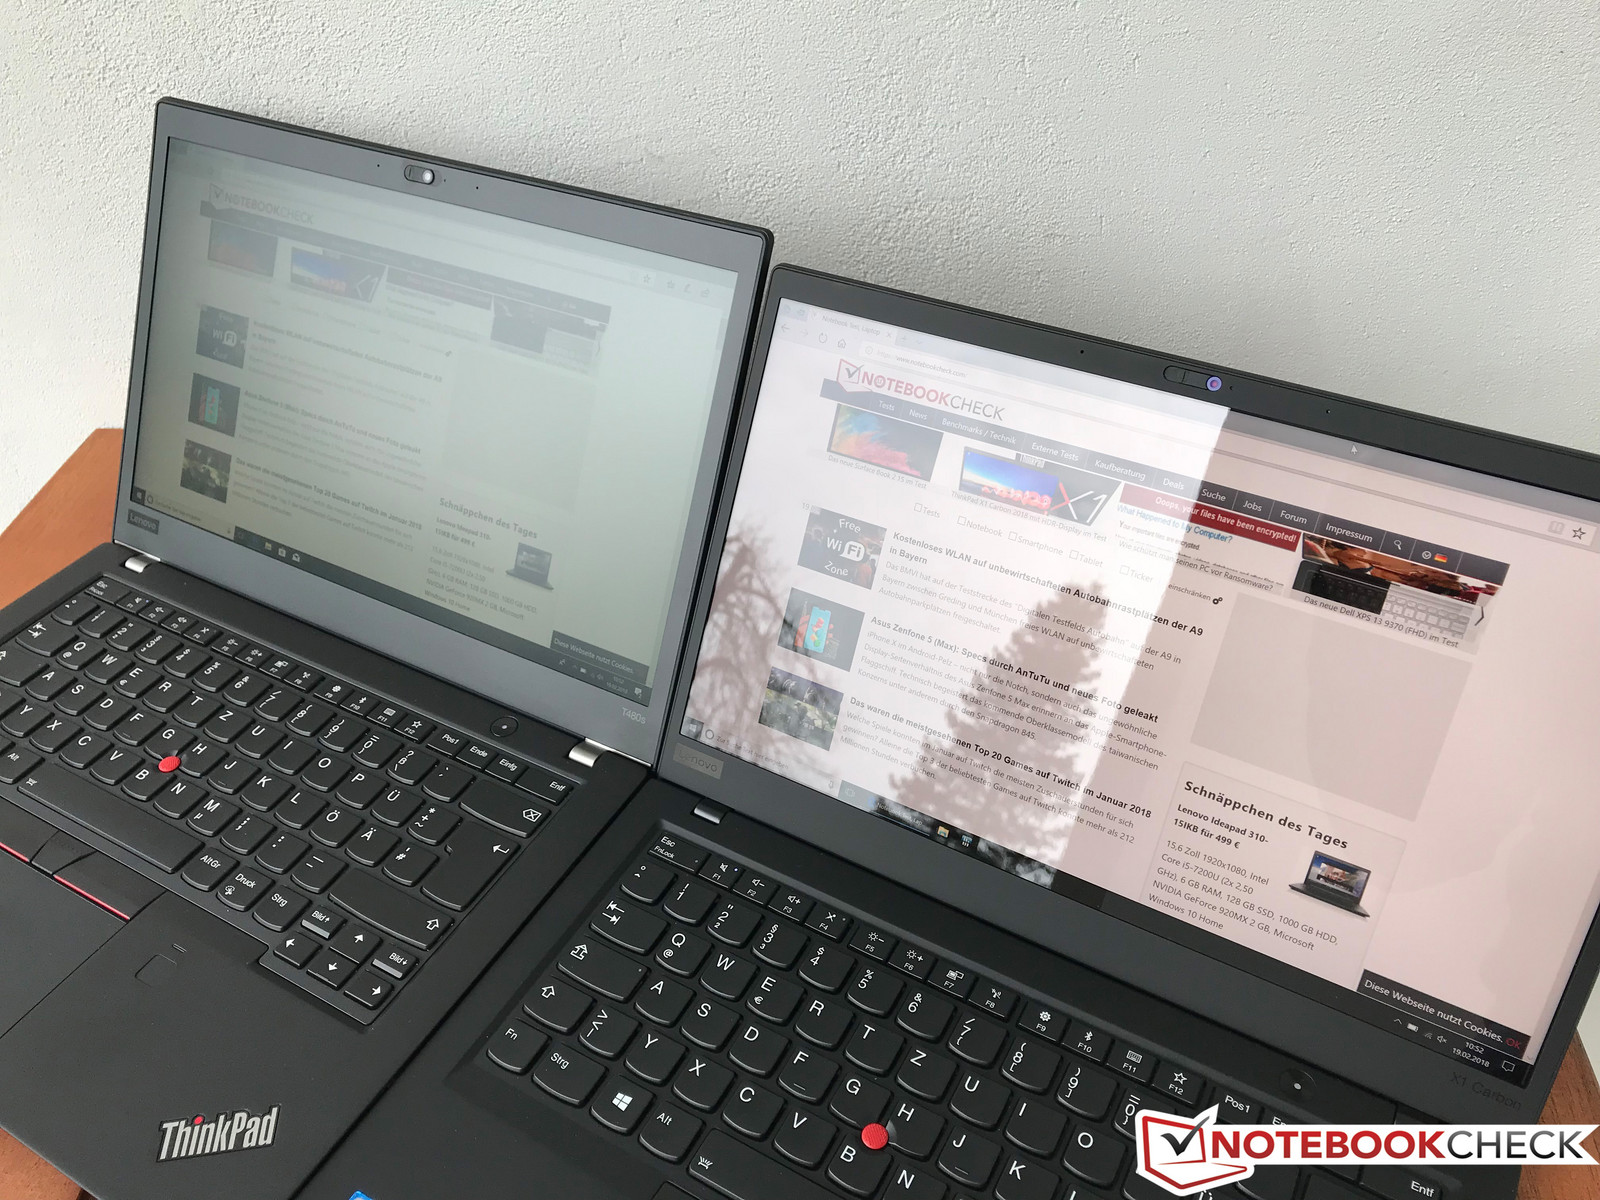
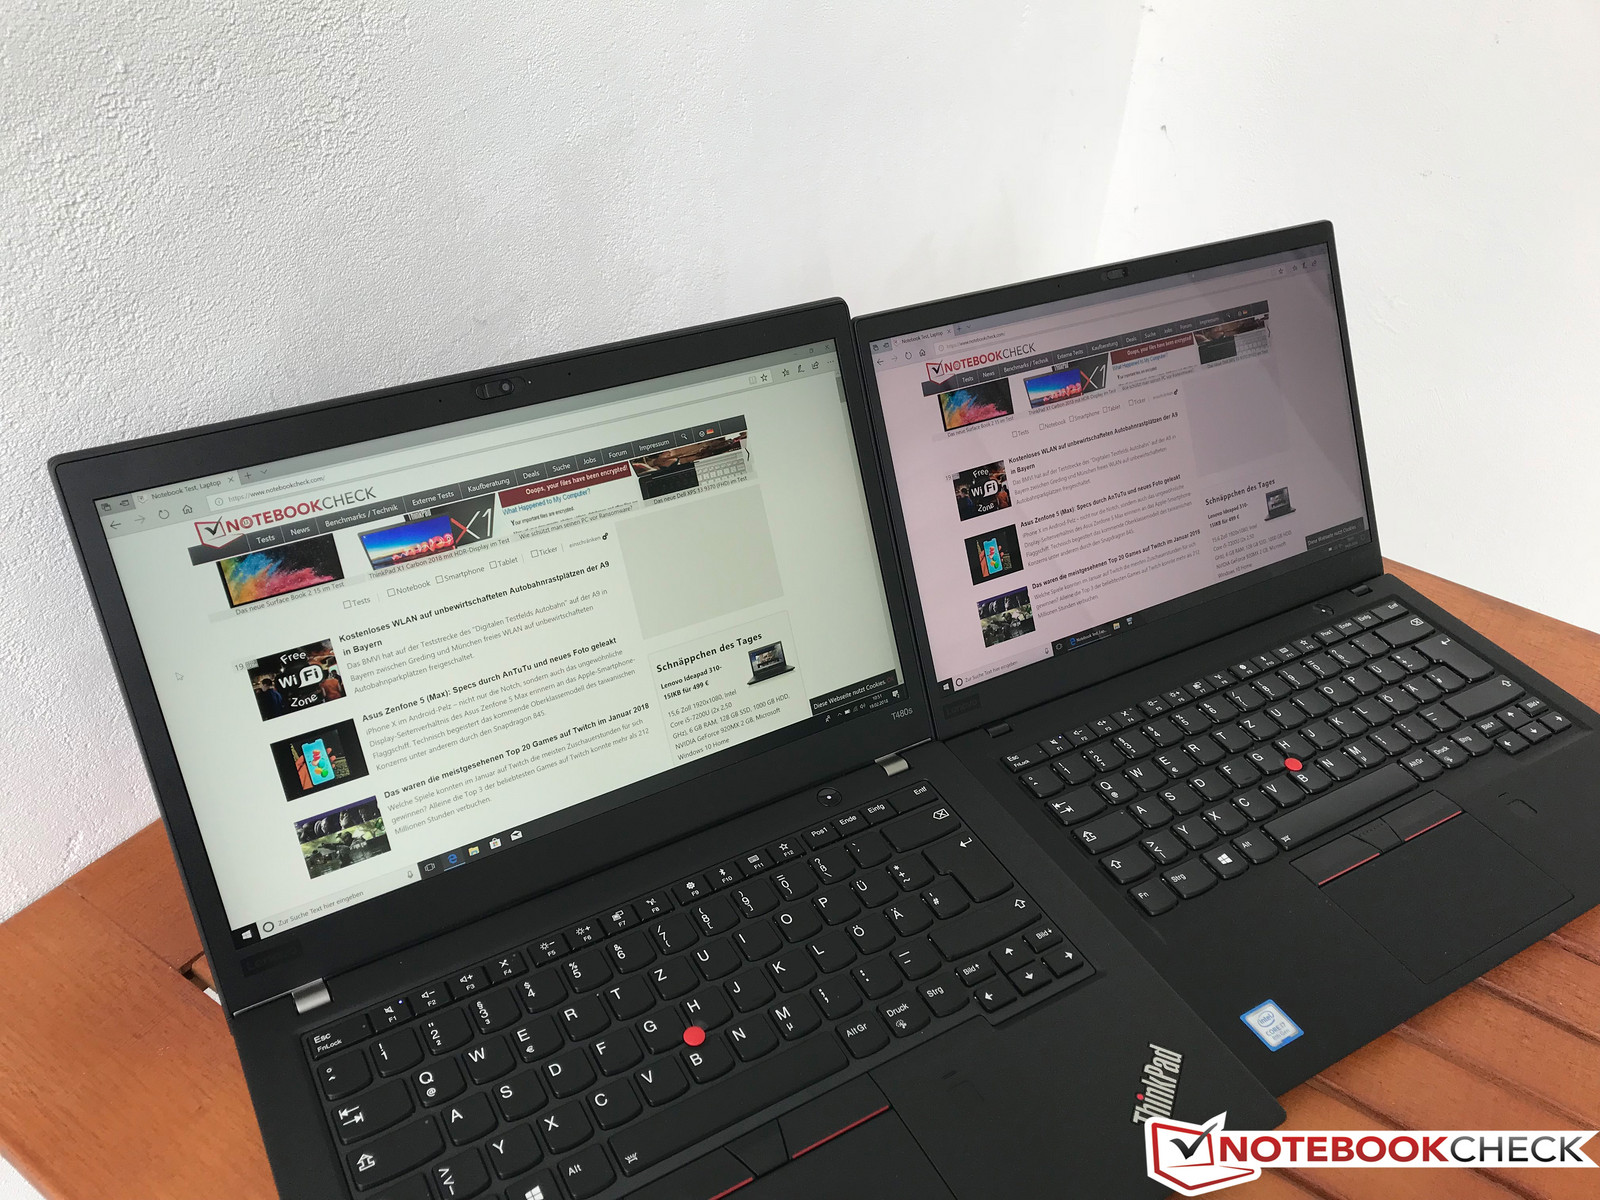
We currently have four new mobile 2018 ThinkPads in our editorial office, so we compared them with each other. The following picture shows the ThinkPad X1 Yoga HDR, ThinkPad X1 Carbon HDR, ThinkPad T480s WQHD, and ThinkPad X280 FHD (from left to right).
X1 Carbon vs. T480s
The ThinkPad T480s got a new chassis this year, but it is still slightly bigger and heavier. However, the differences are not huge. The tactile feel of the T480s was improved as well, and the surfaces are only slightly rougher compared to the X1 Carbon.
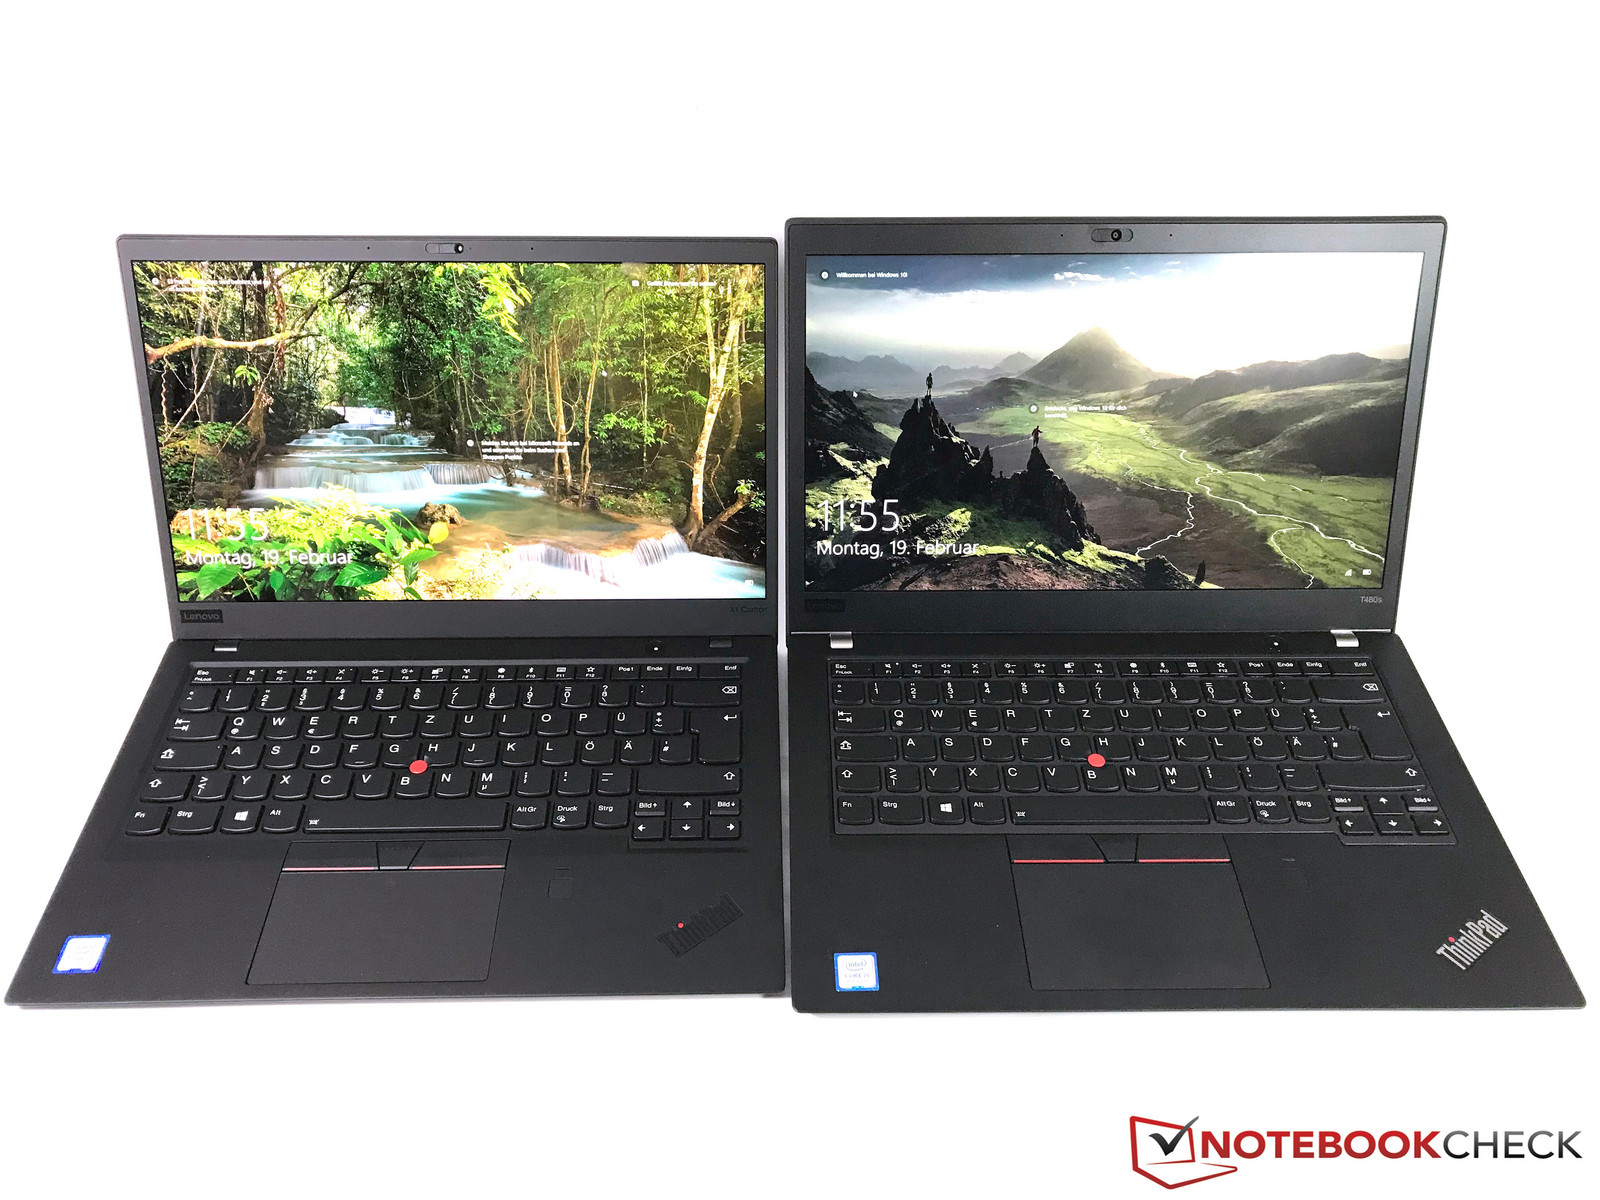
X1 Carbon vs. X280
A bit smaller, but with a slightly thicker base unit – the ThinkPad X280 can also be called baby X1 thanks to its new chassis. The tactile feel between the two is identical. The X280 is the right choice when you need the laptop with the smallest footprint, but the wider bezels are very noticeable compared to the X1 Carbon. A 13.3-inch display would be a nice addition for the X280.
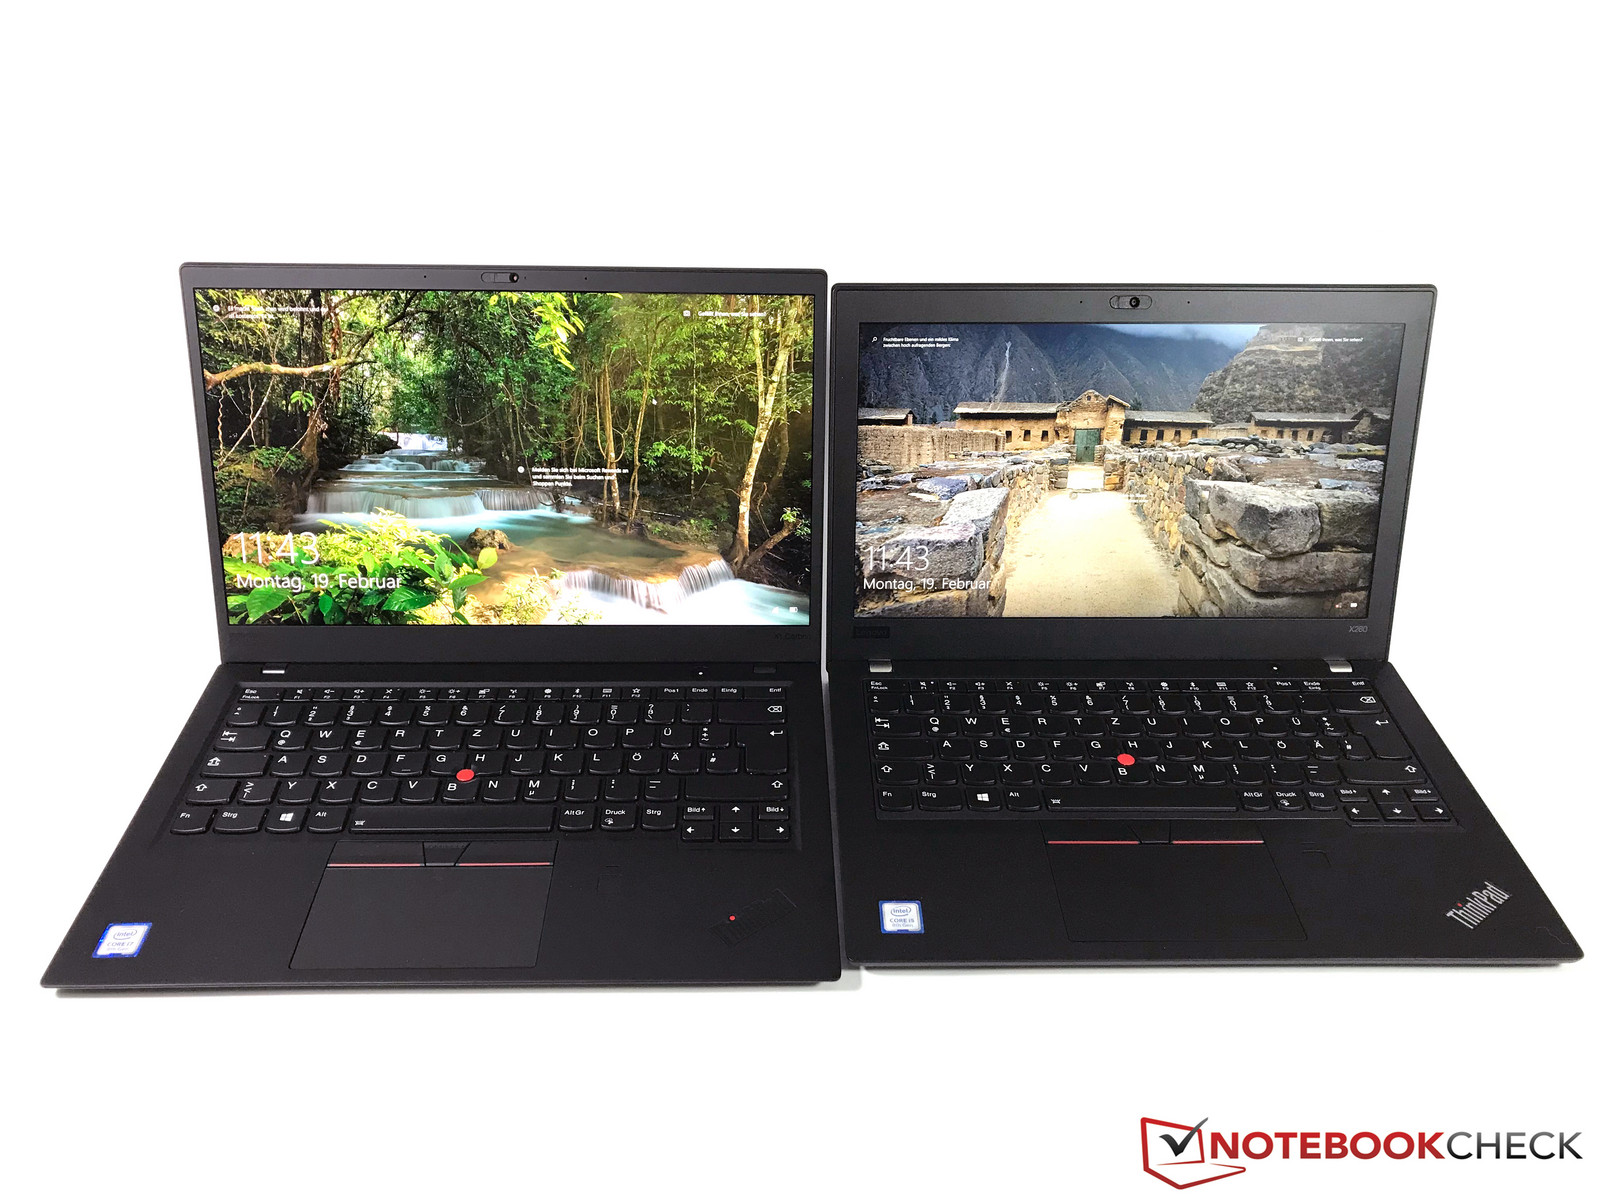
X1 Carbon vs. X1 Yoga
The ThinkPad X1 Yoga convertible is quite a bit deeper than the X1 Carbon and also 300 grams heavier, which is very noticeable when you carry it around. The base unit is also slightly thicker, which is probably a result of the retractable keyboard. The design (including the new X1 logo on the lid and the black ThinkPad logo) and the tactile feel are identical.
X1 Carbon vs. T480
The ThinkPad T480 is not really a direct competitor for the X1 Carbon due to the large price difference. Both models are equipped with 14-inch panels, but the X1 Carbon is much more compact and lighter. There is a difference of more than 600 grams between the two models, but the T480 is also equipped with the extended battery. You can also notice the price difference when you touch the surfaces since the T480 uses much rougher plastic in the area of the base unit.

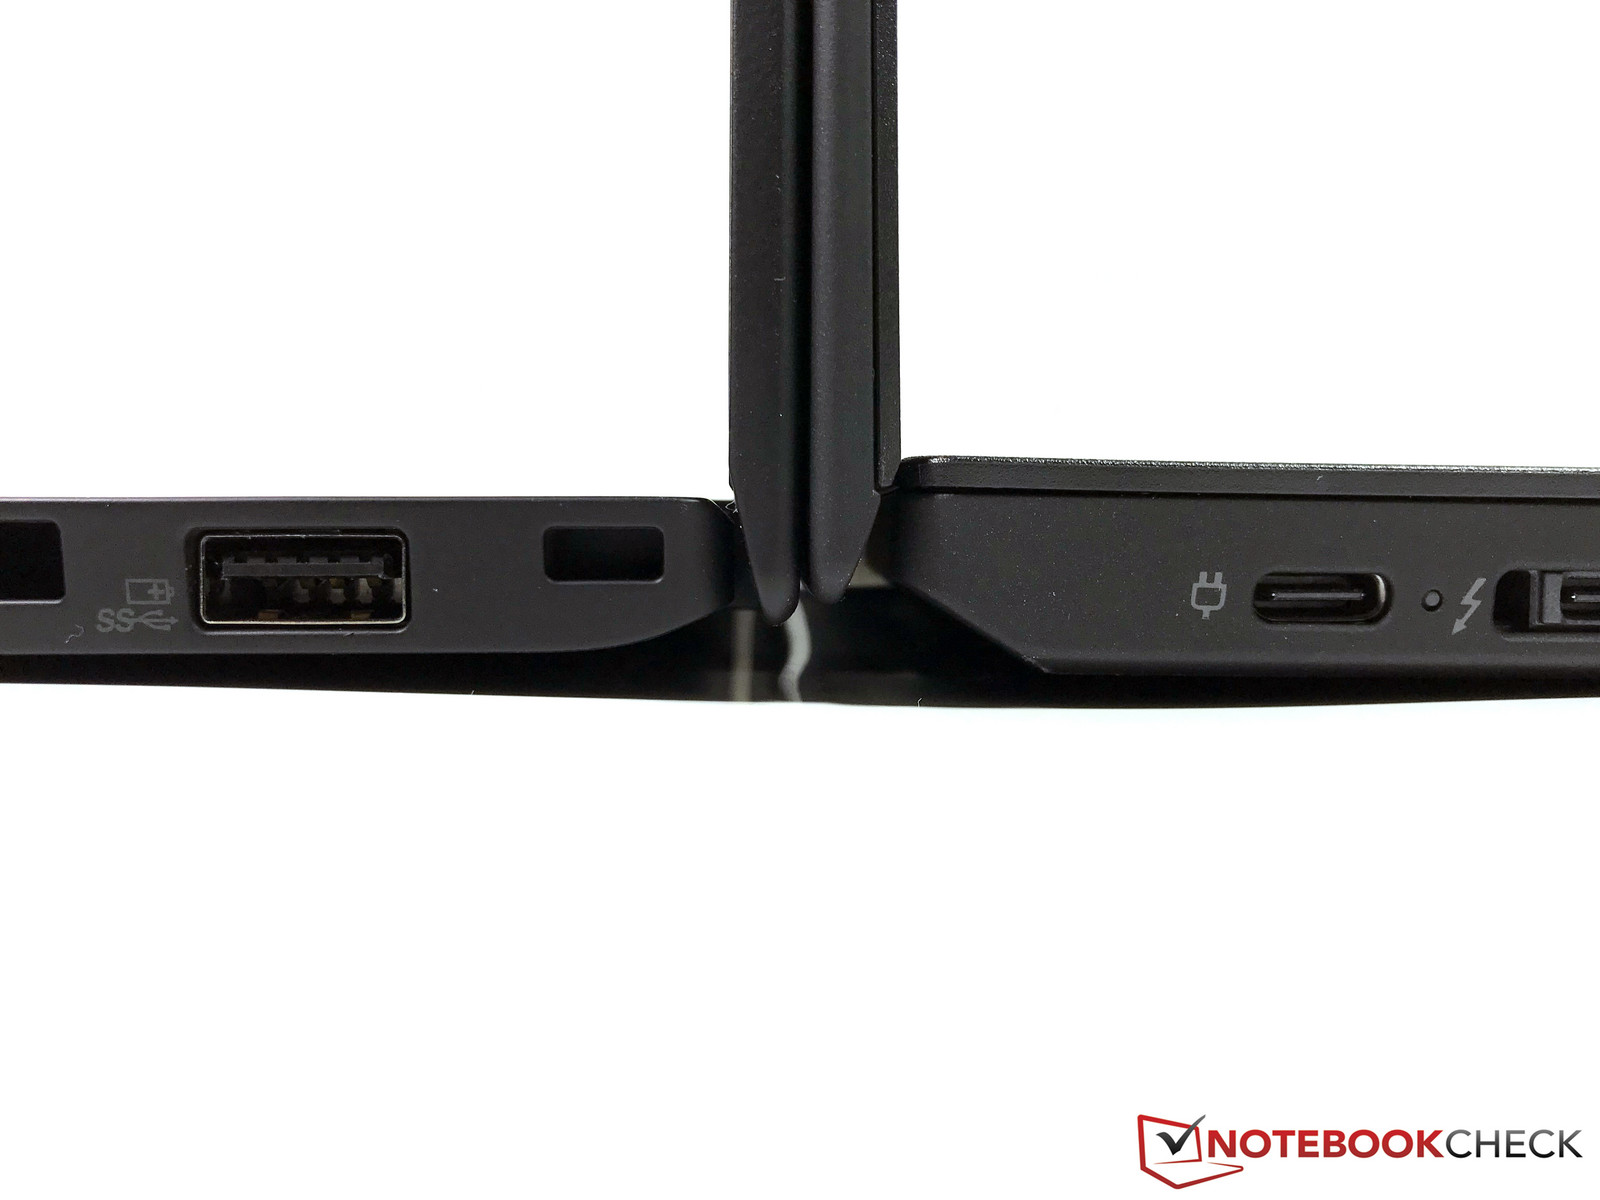
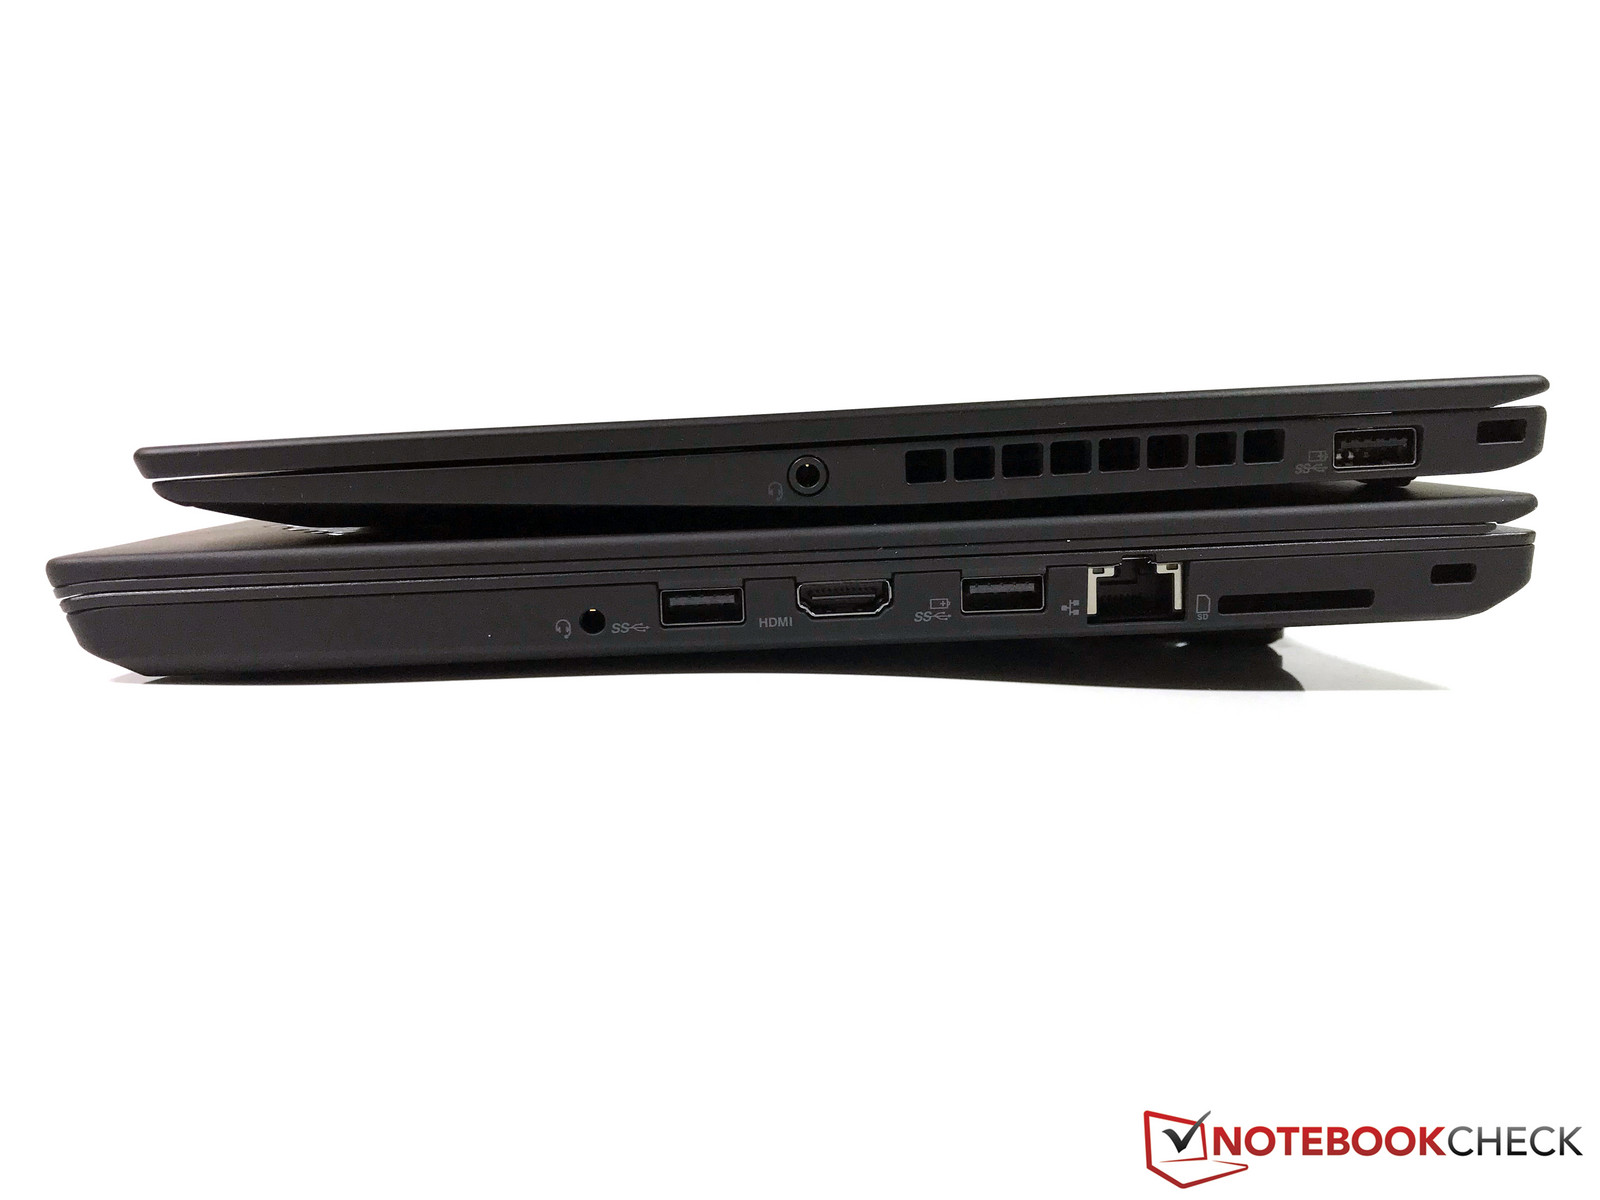
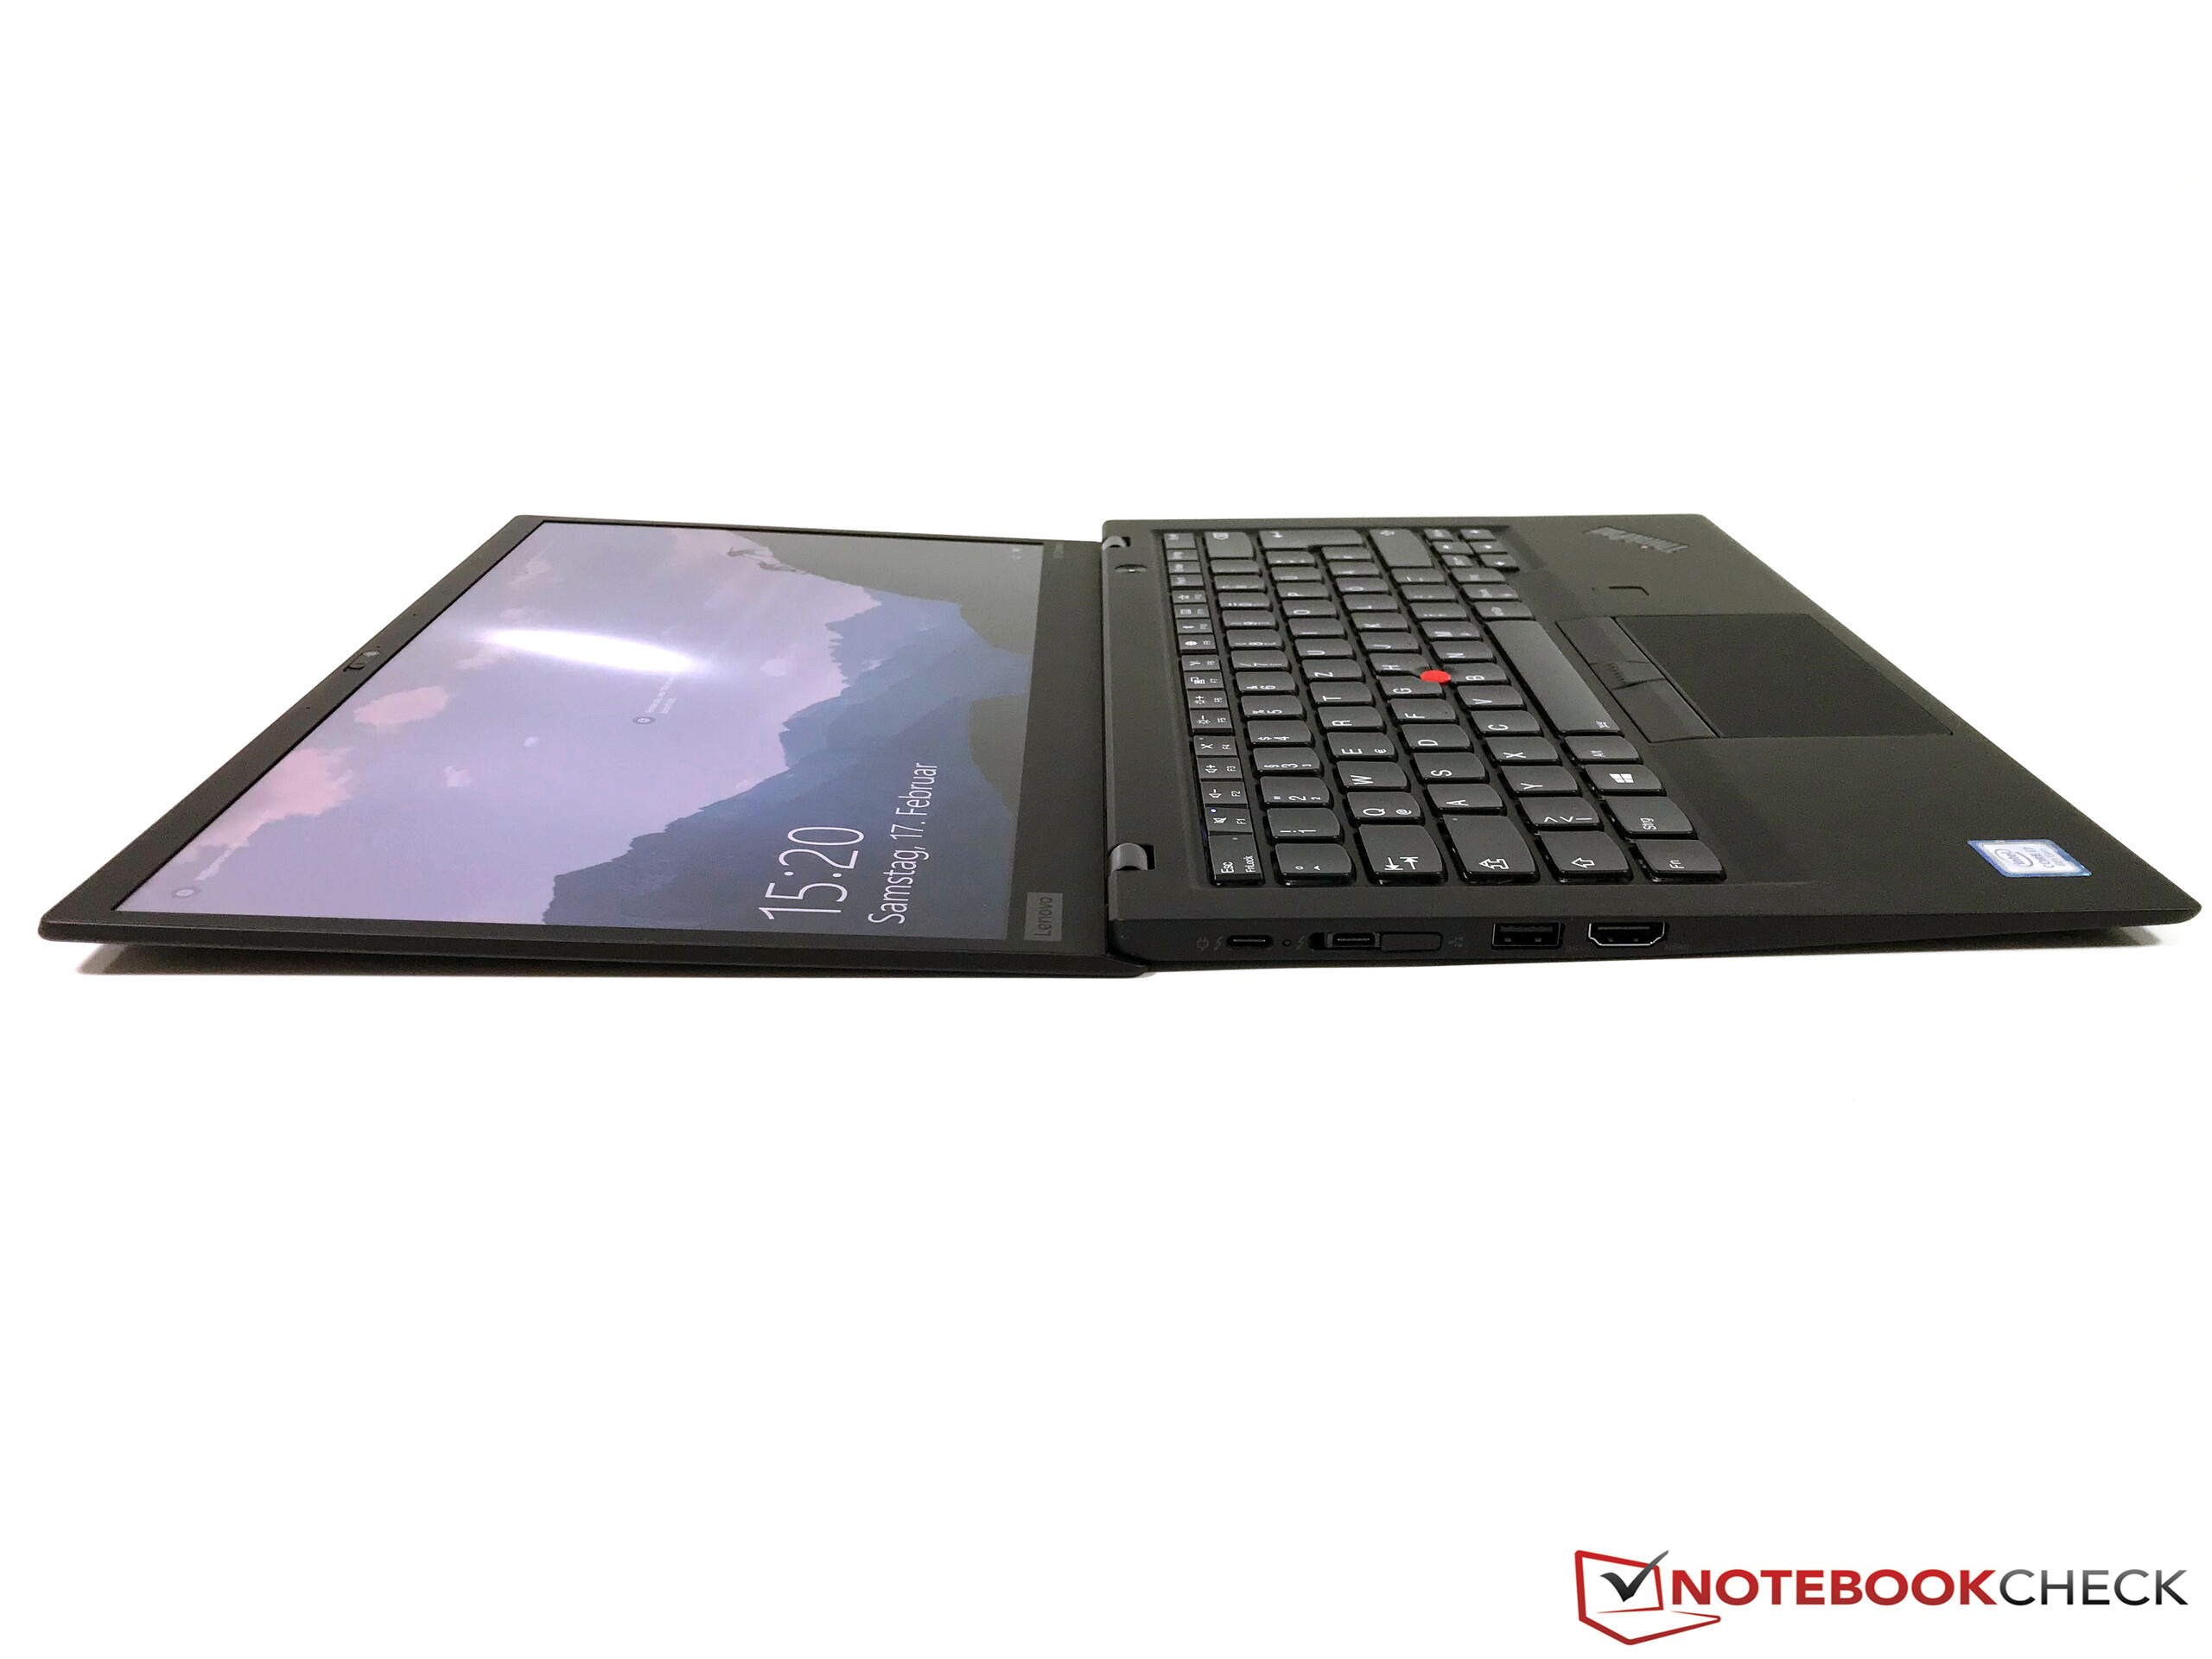
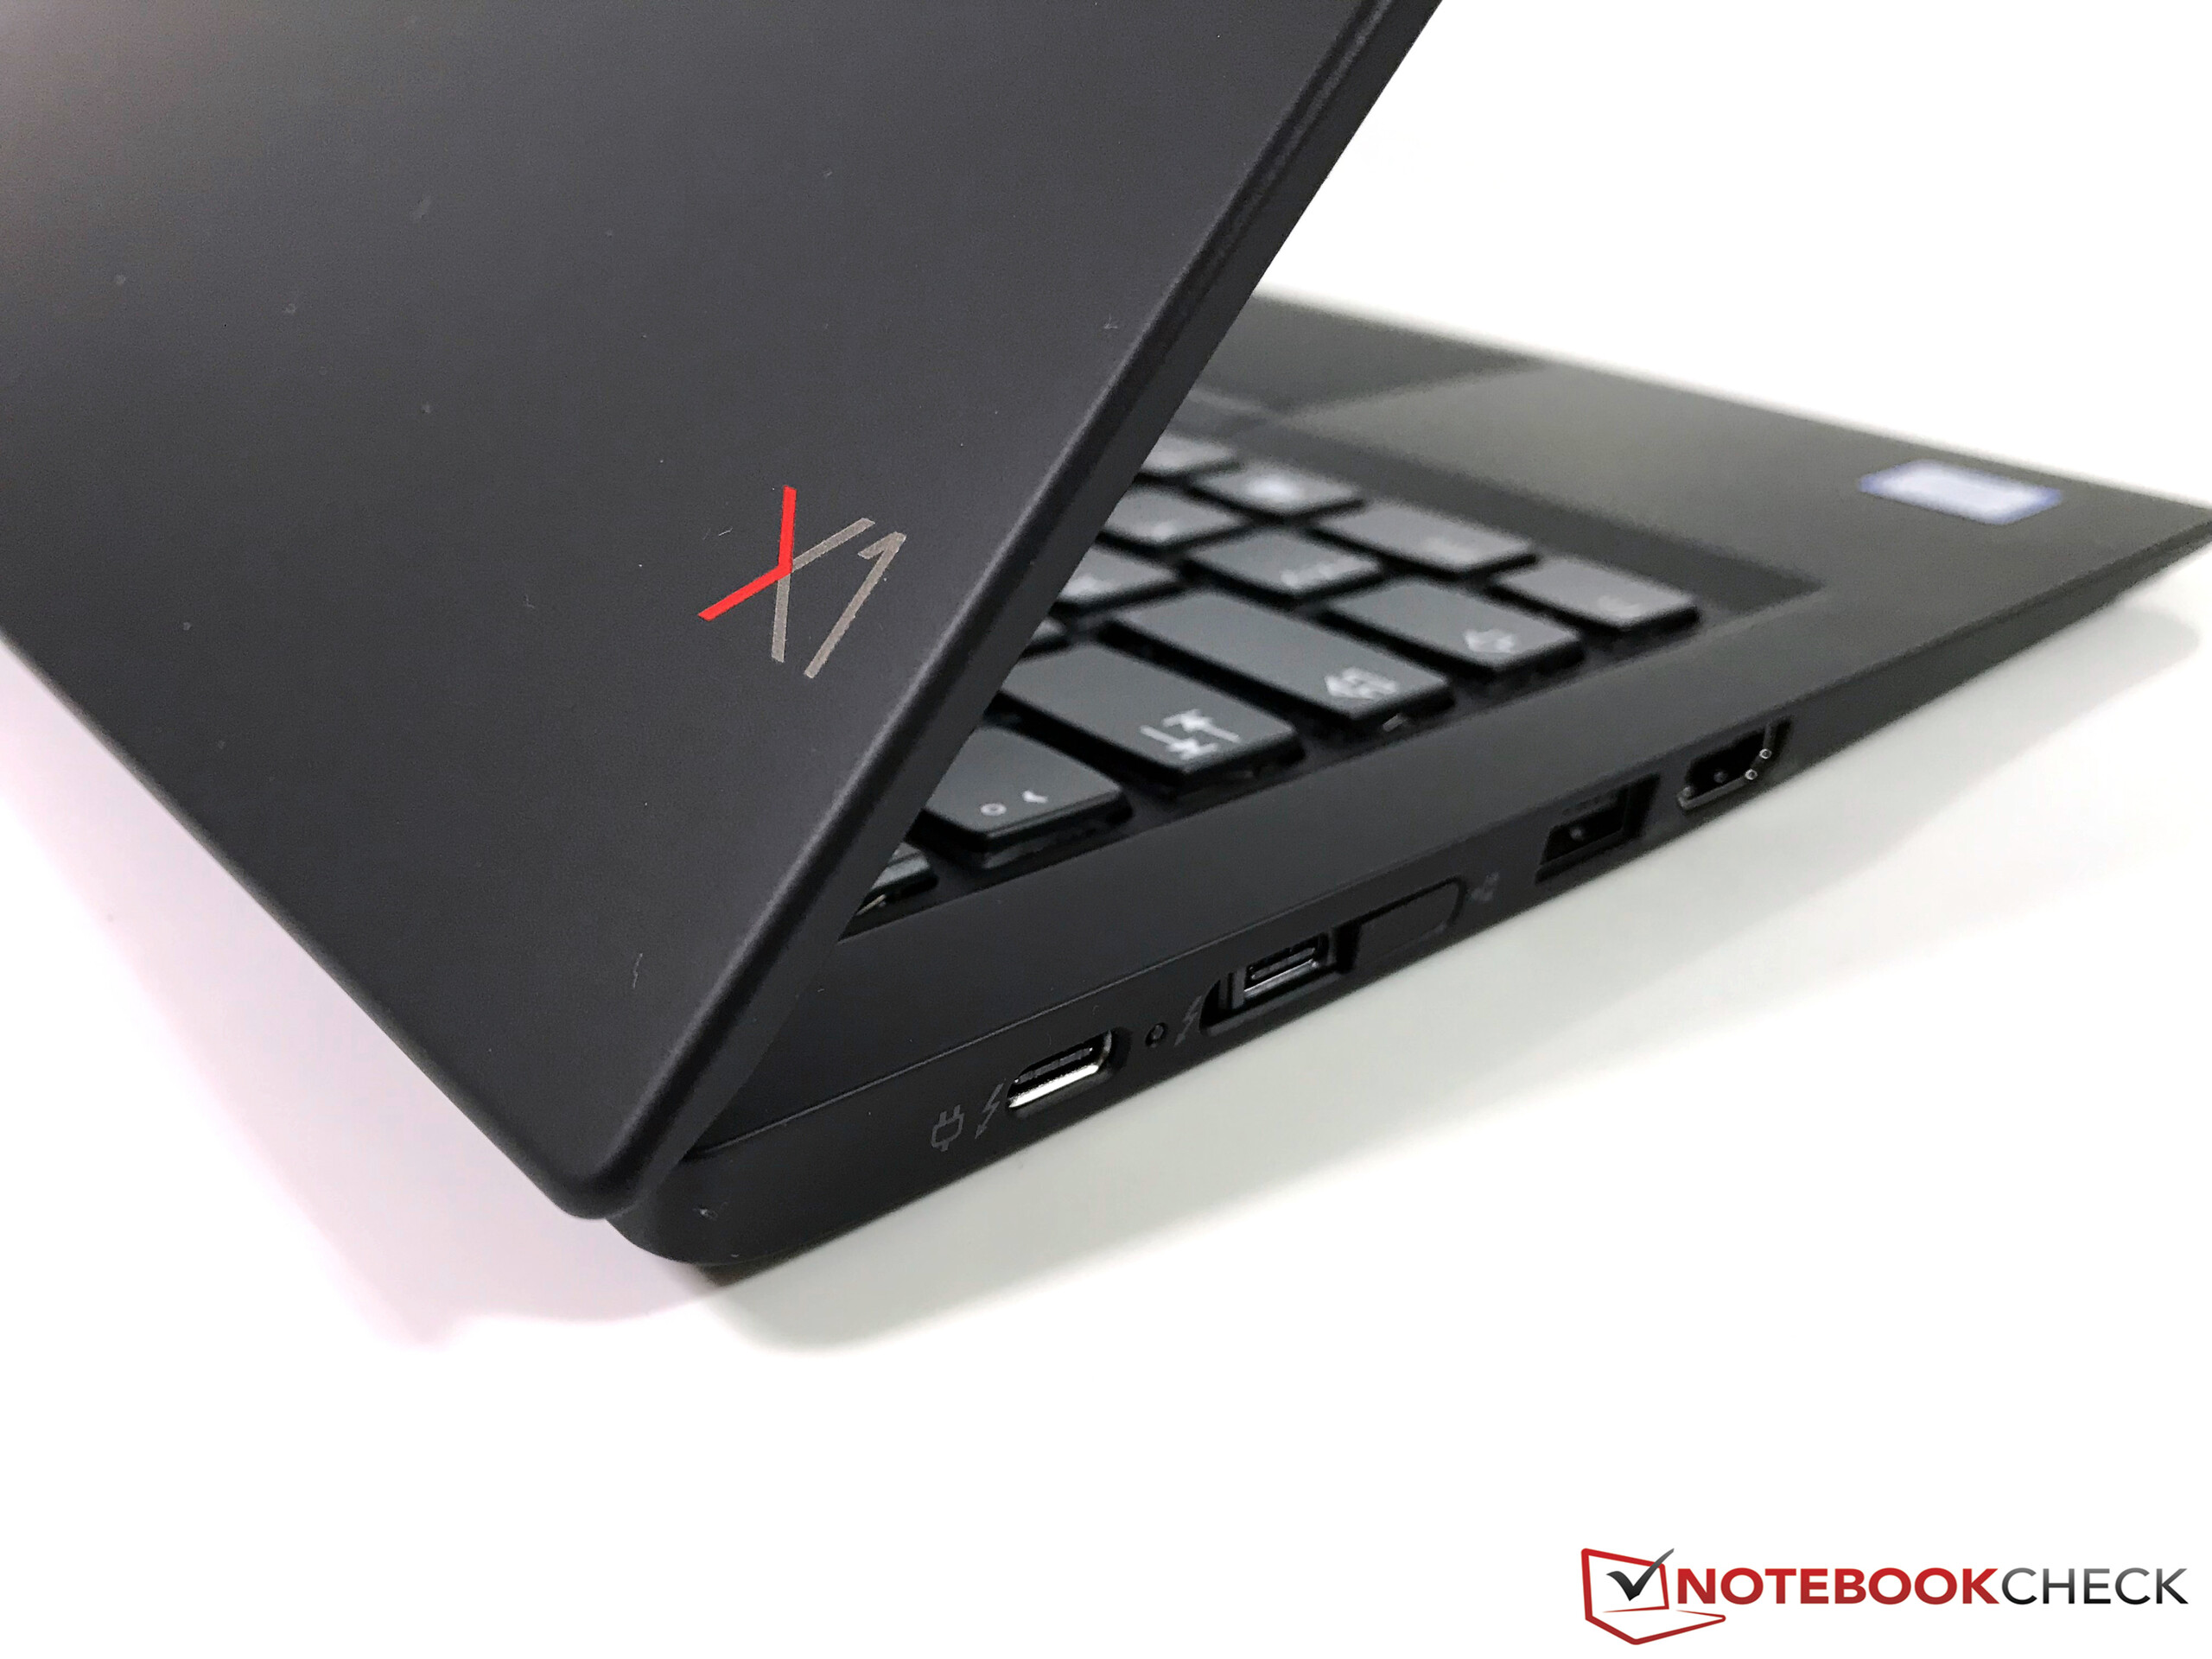
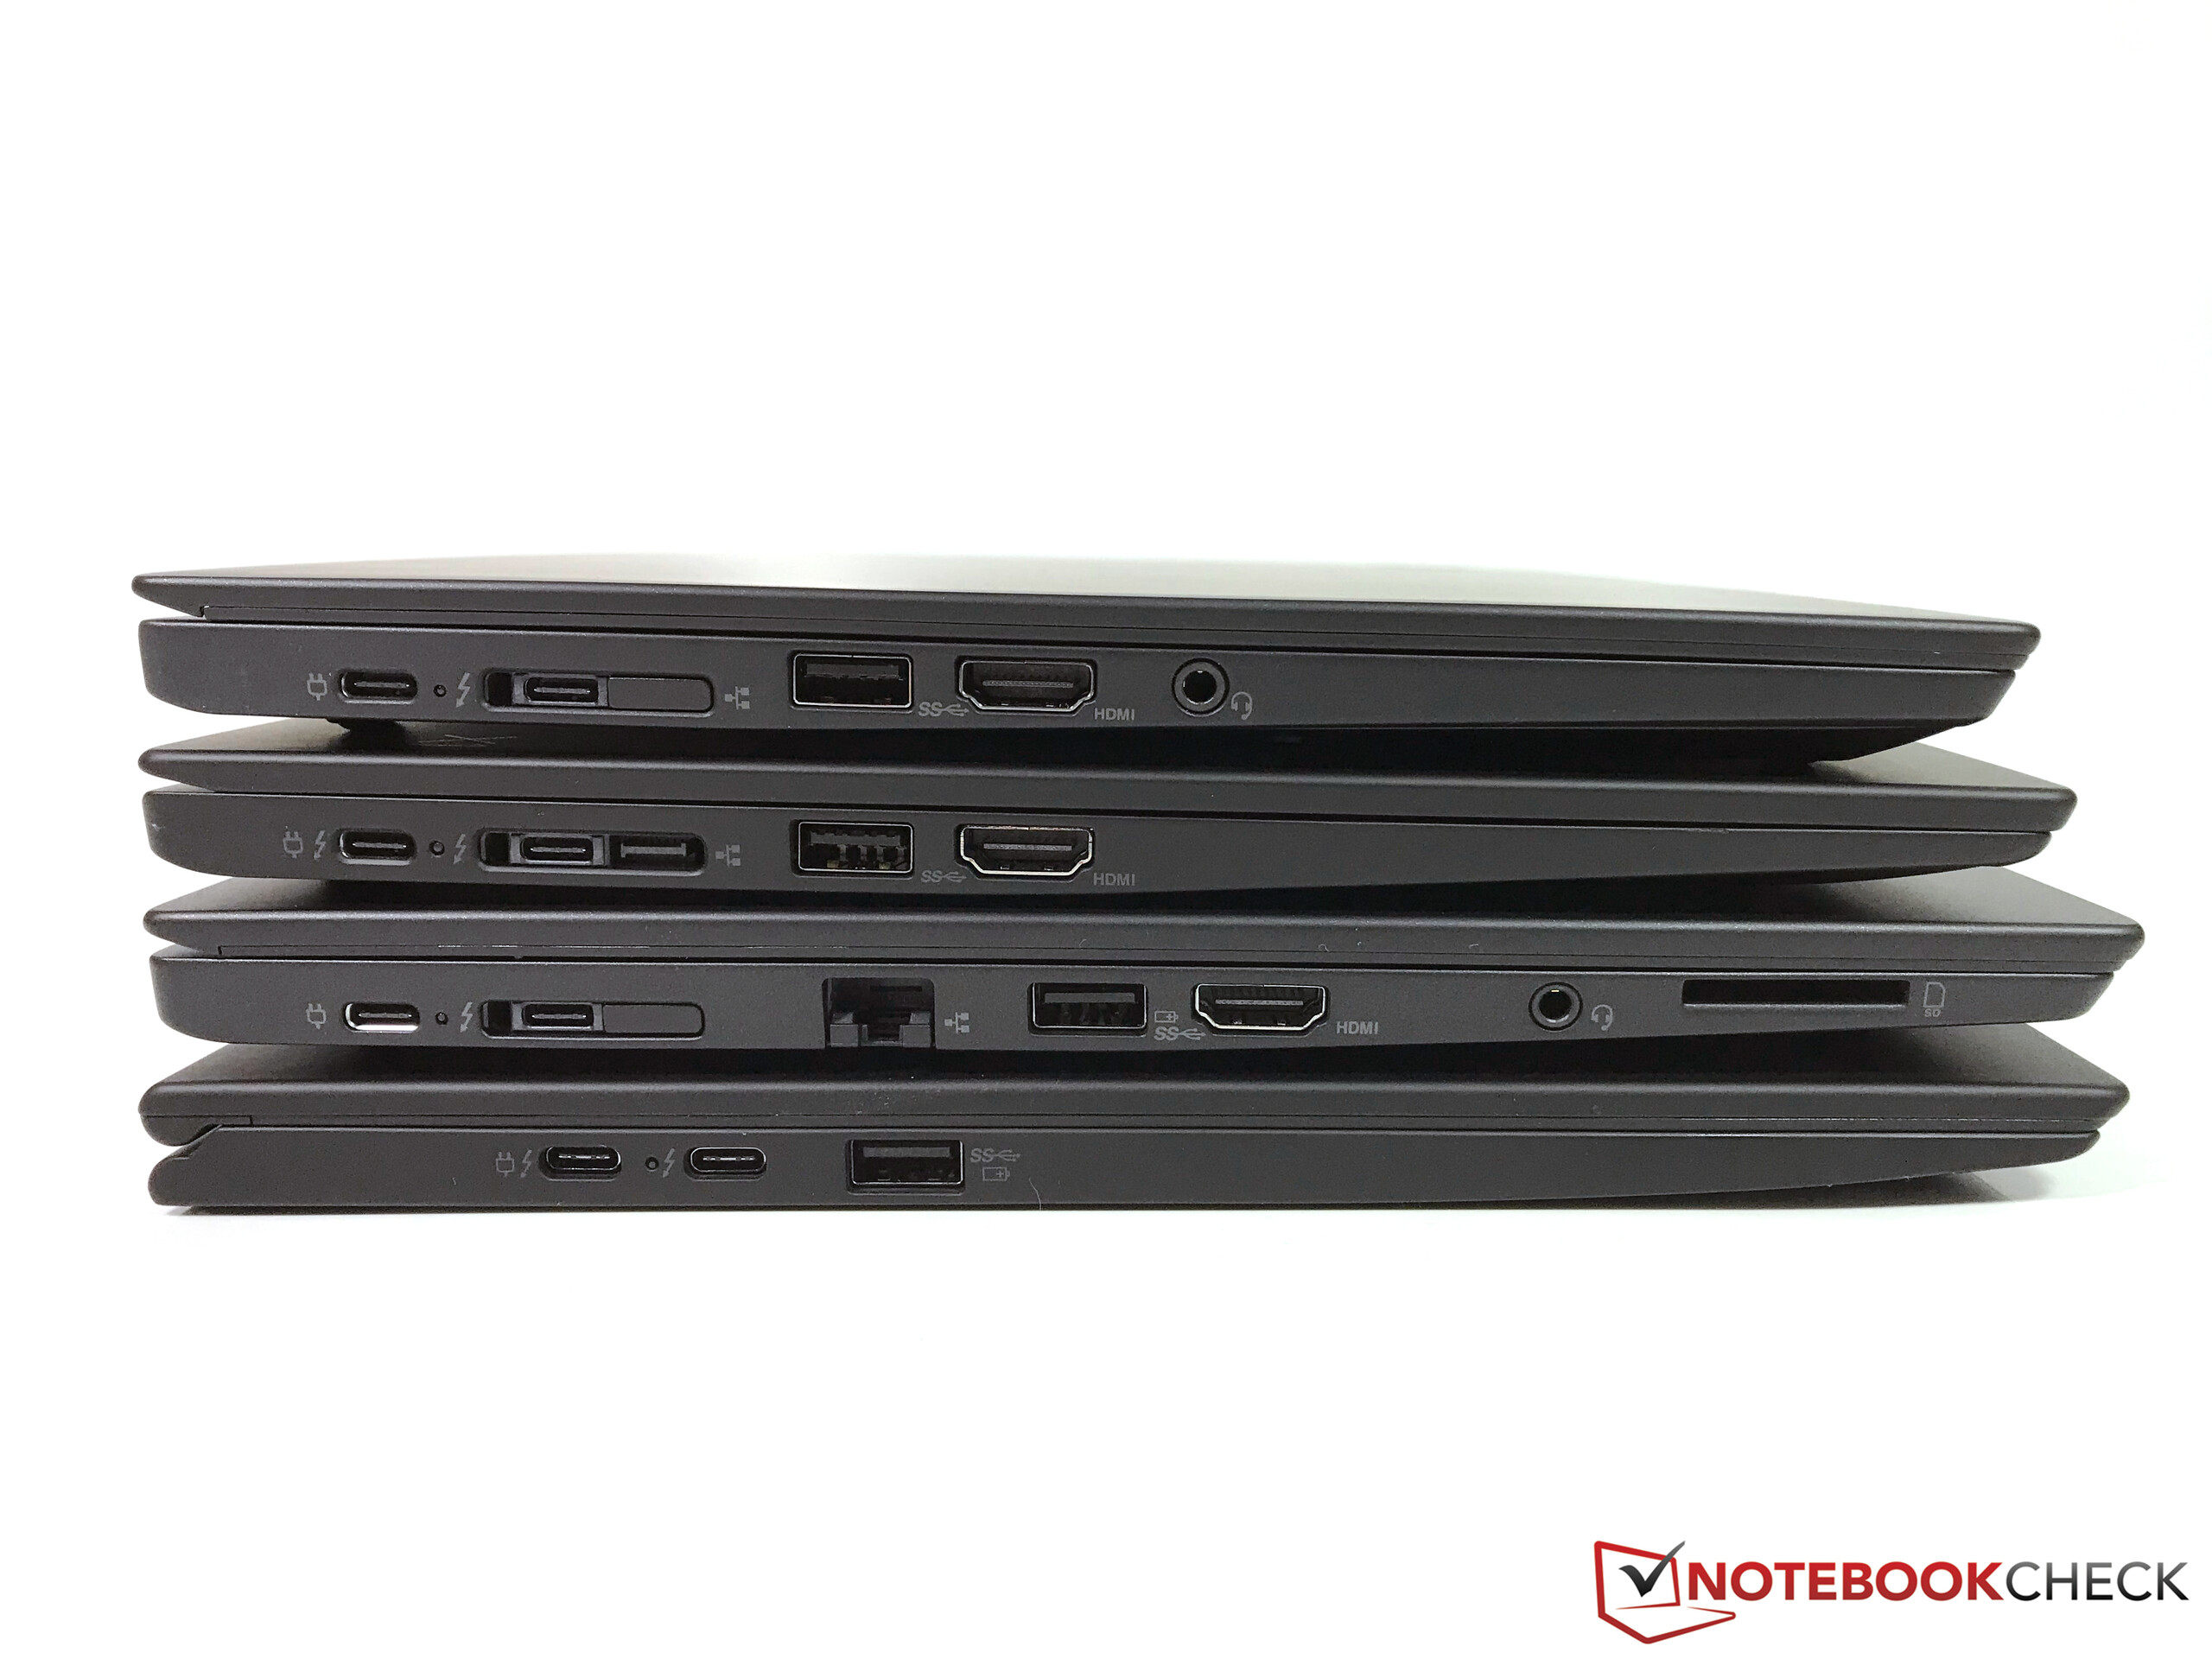
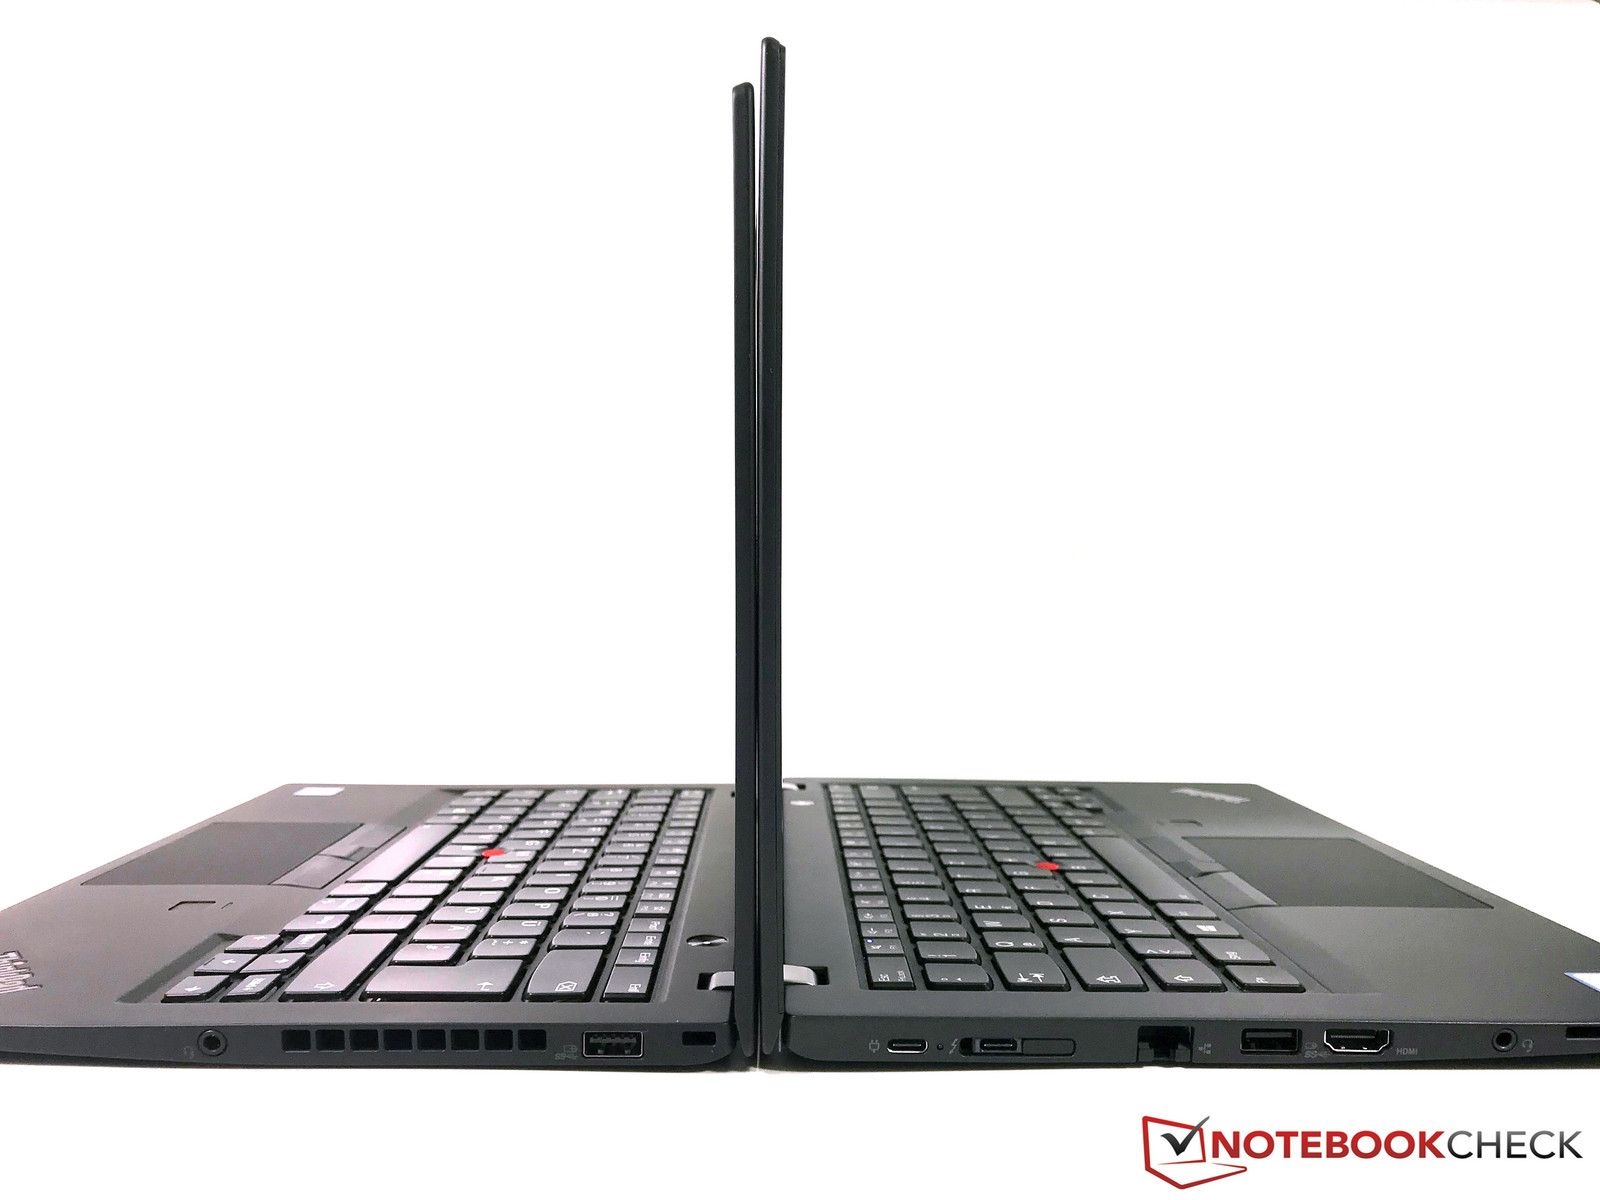
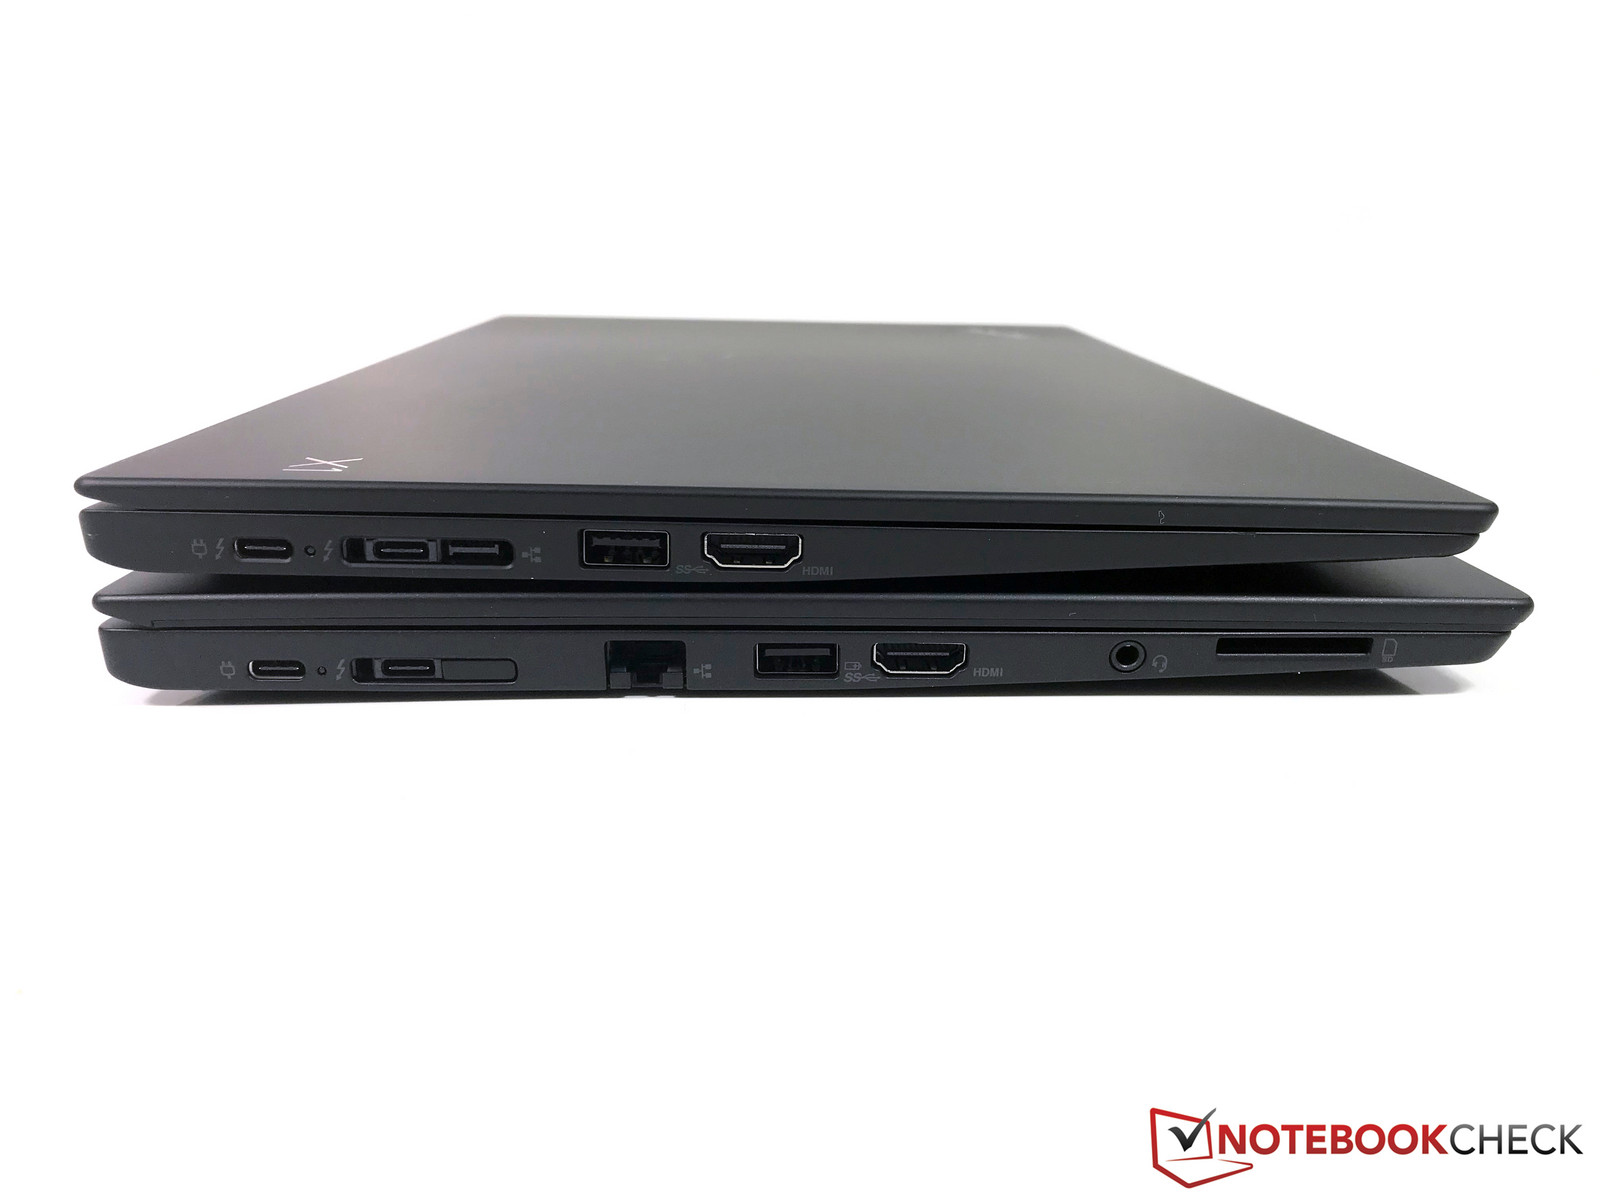
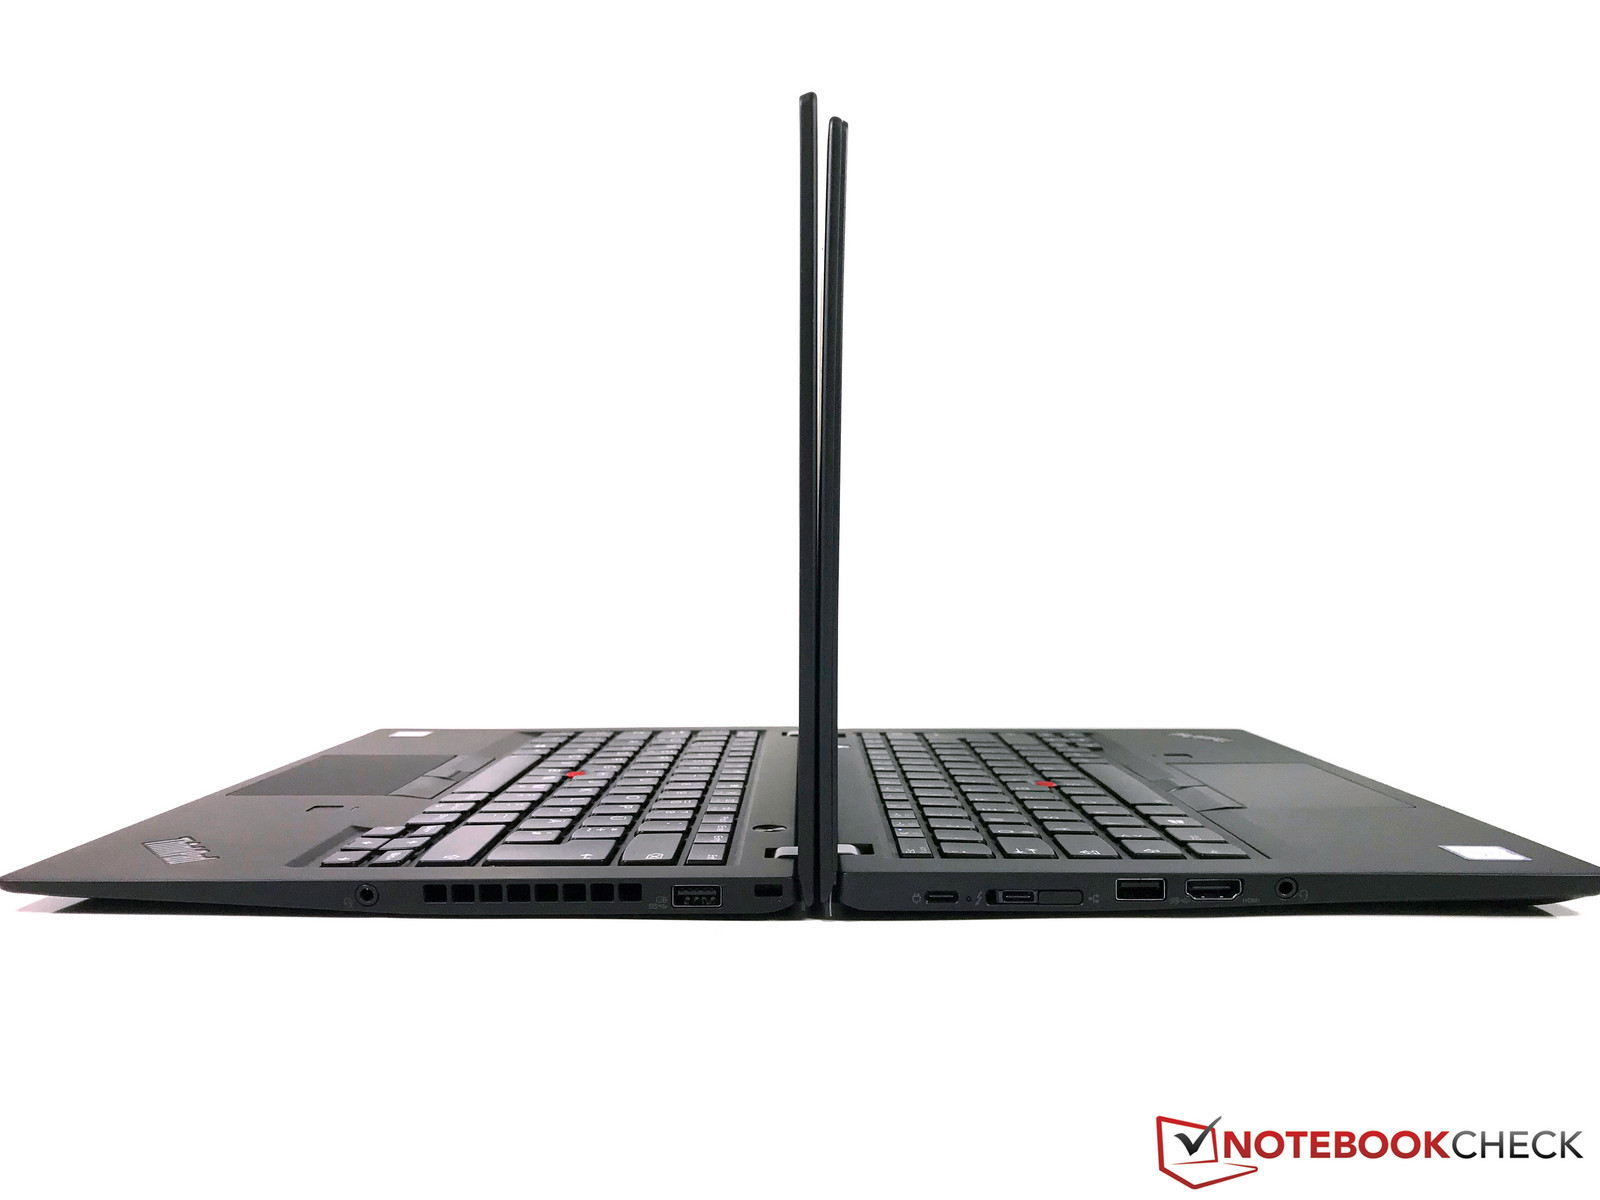
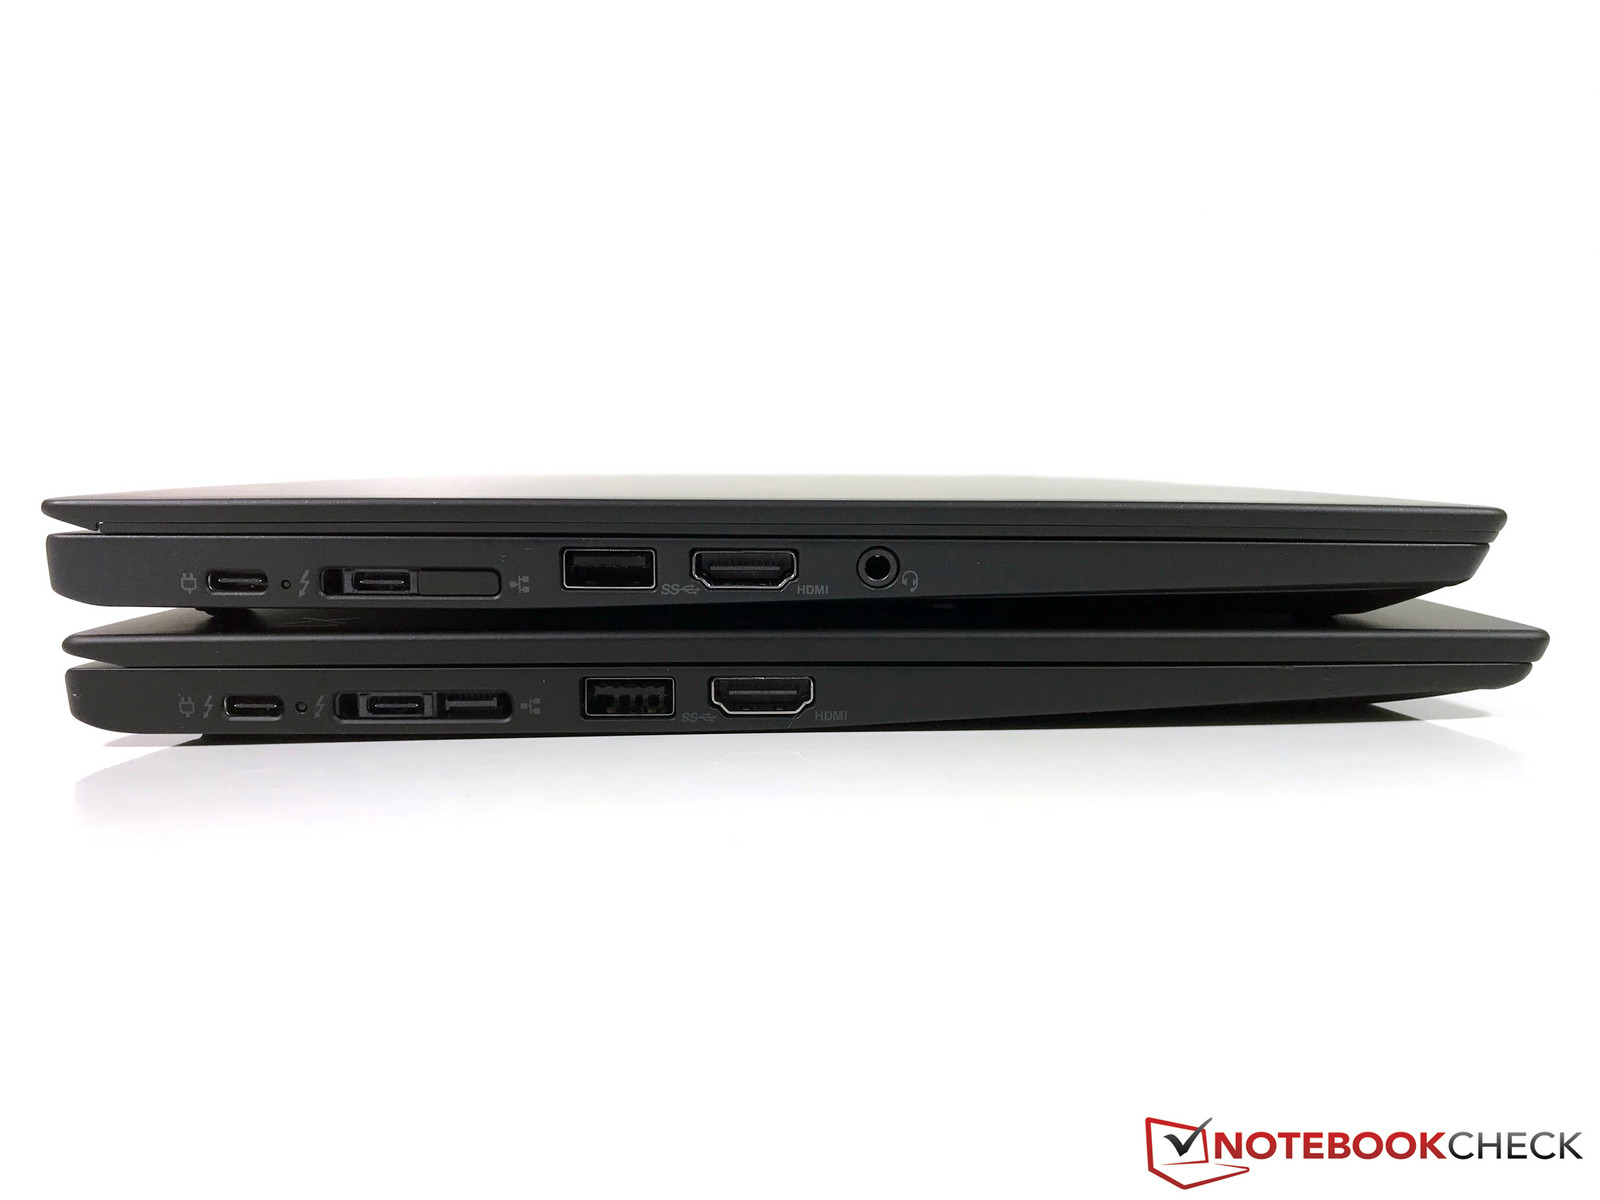
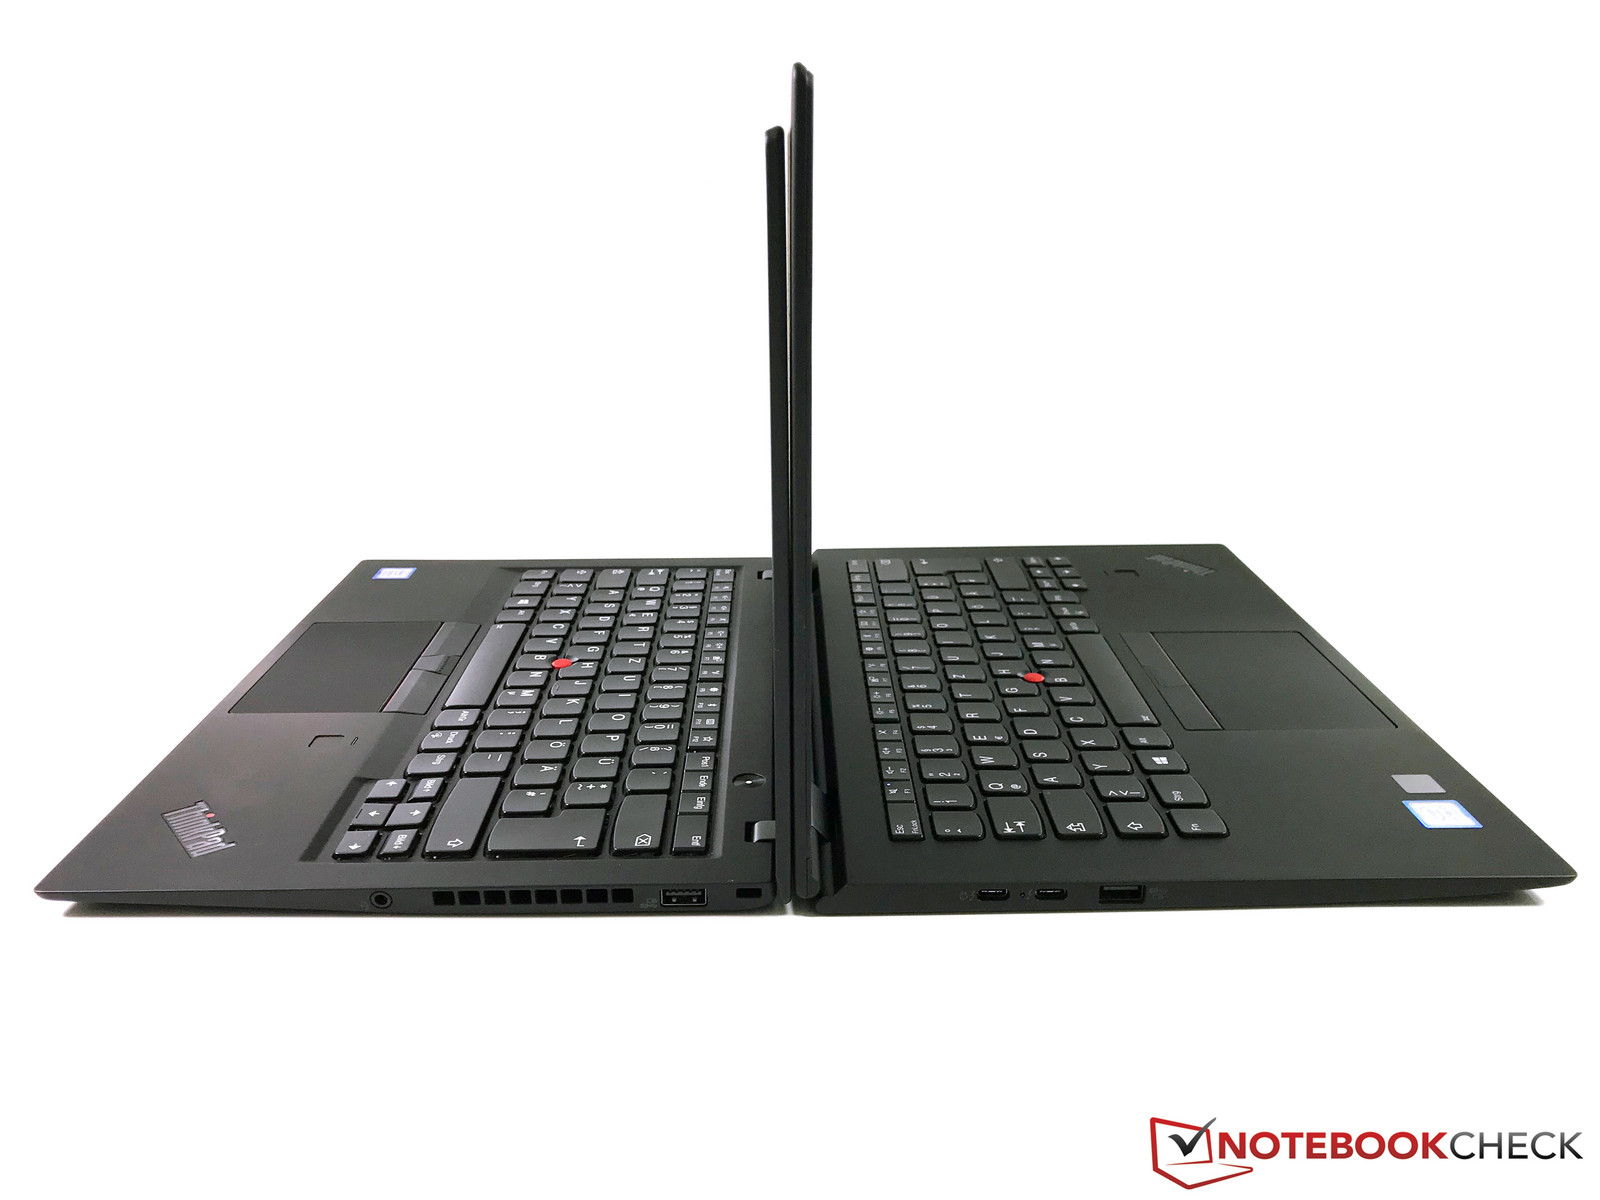
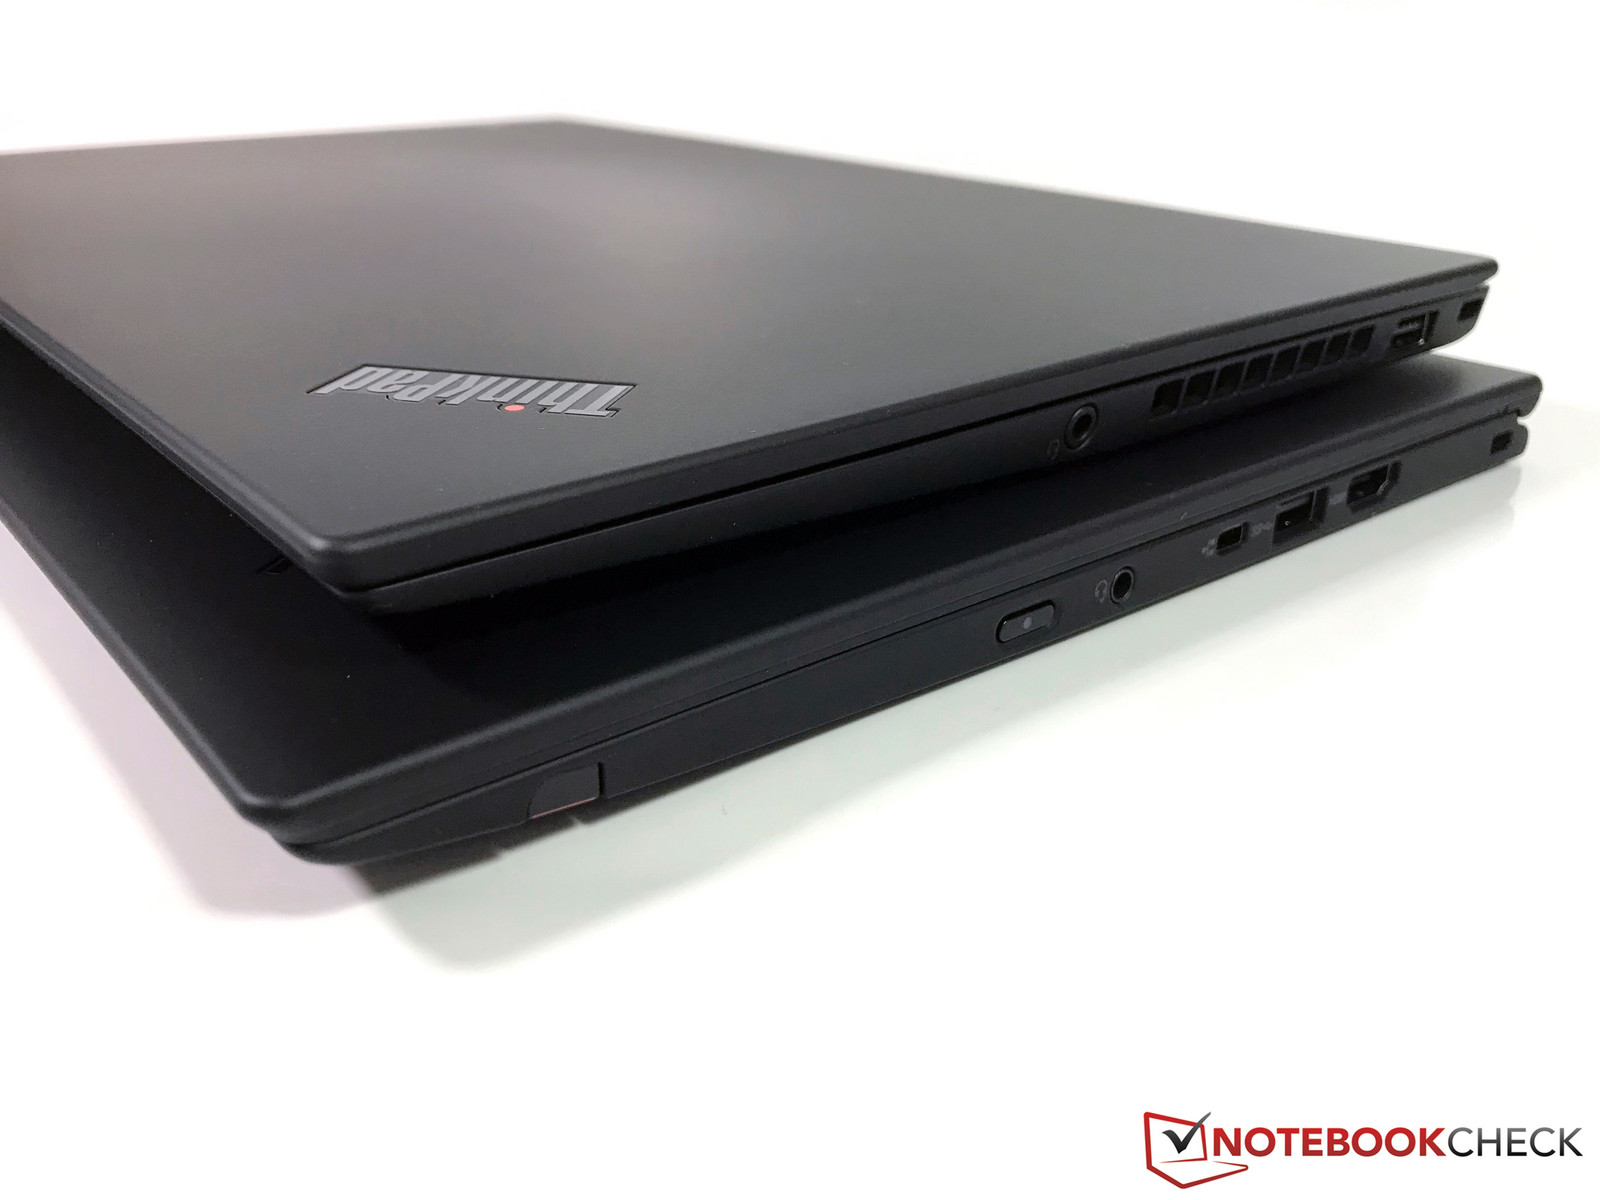
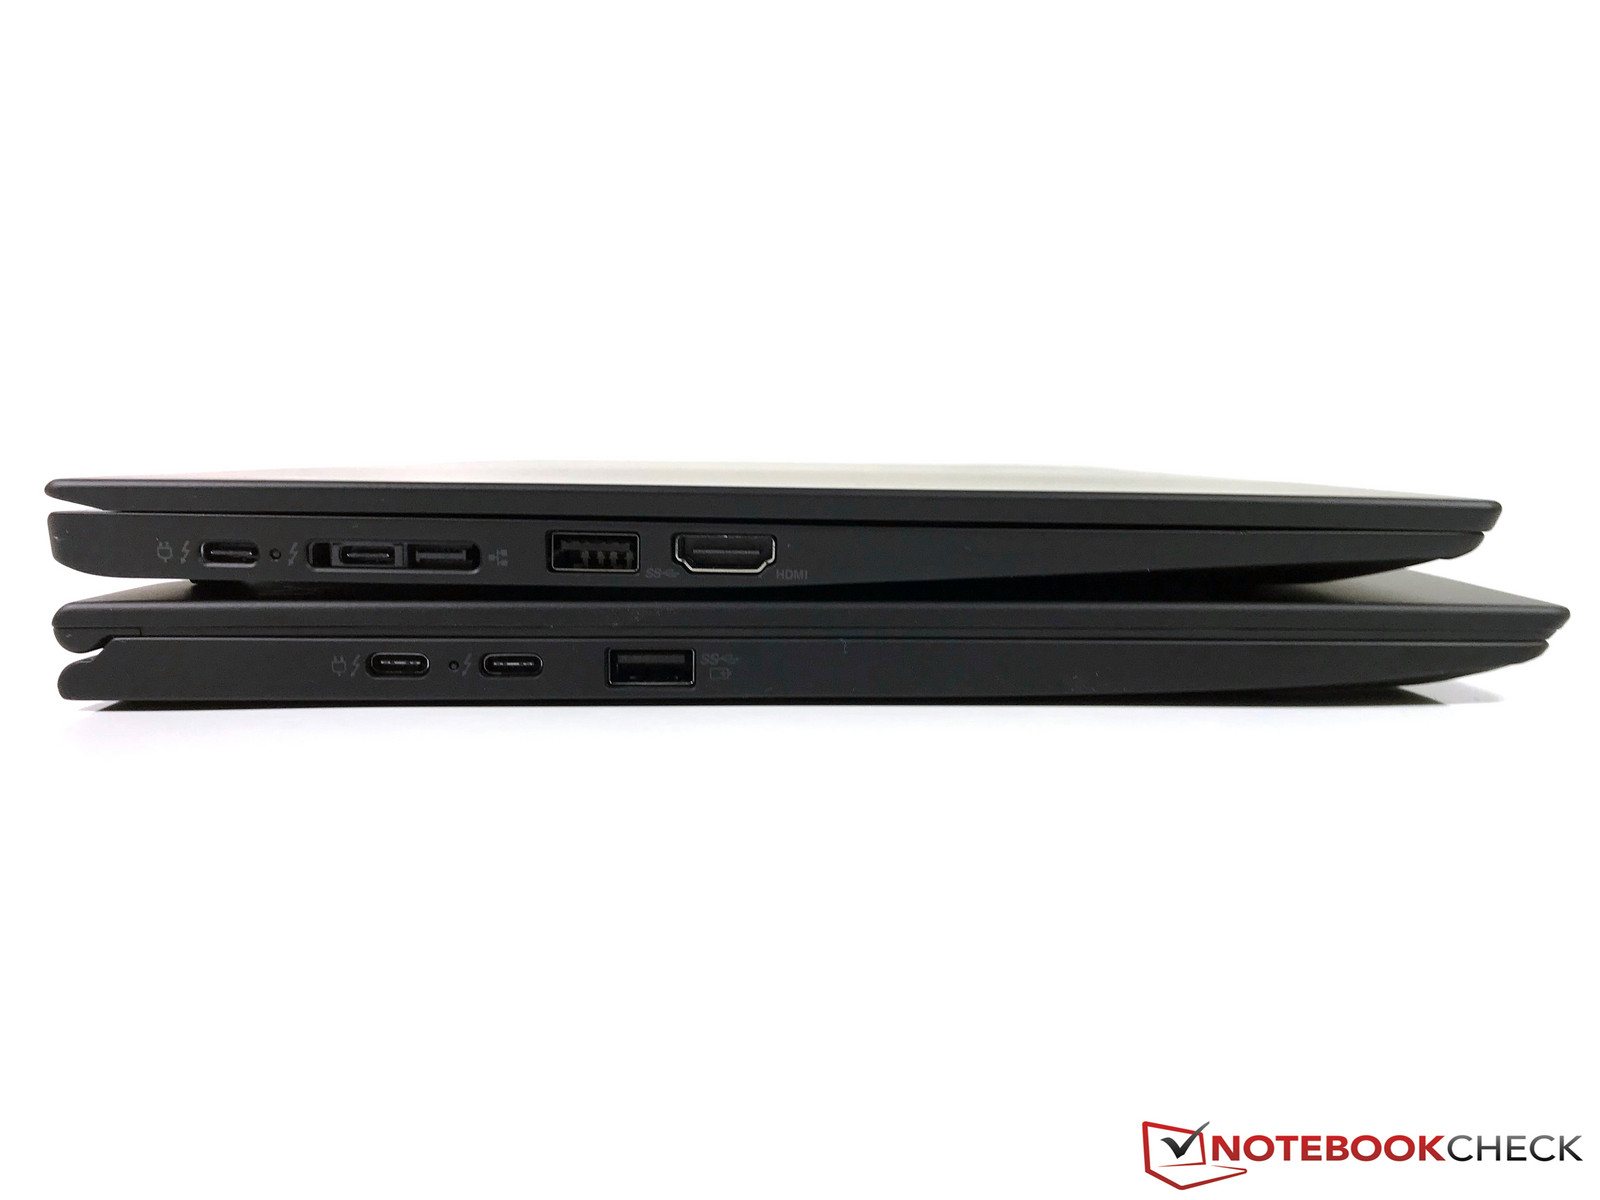
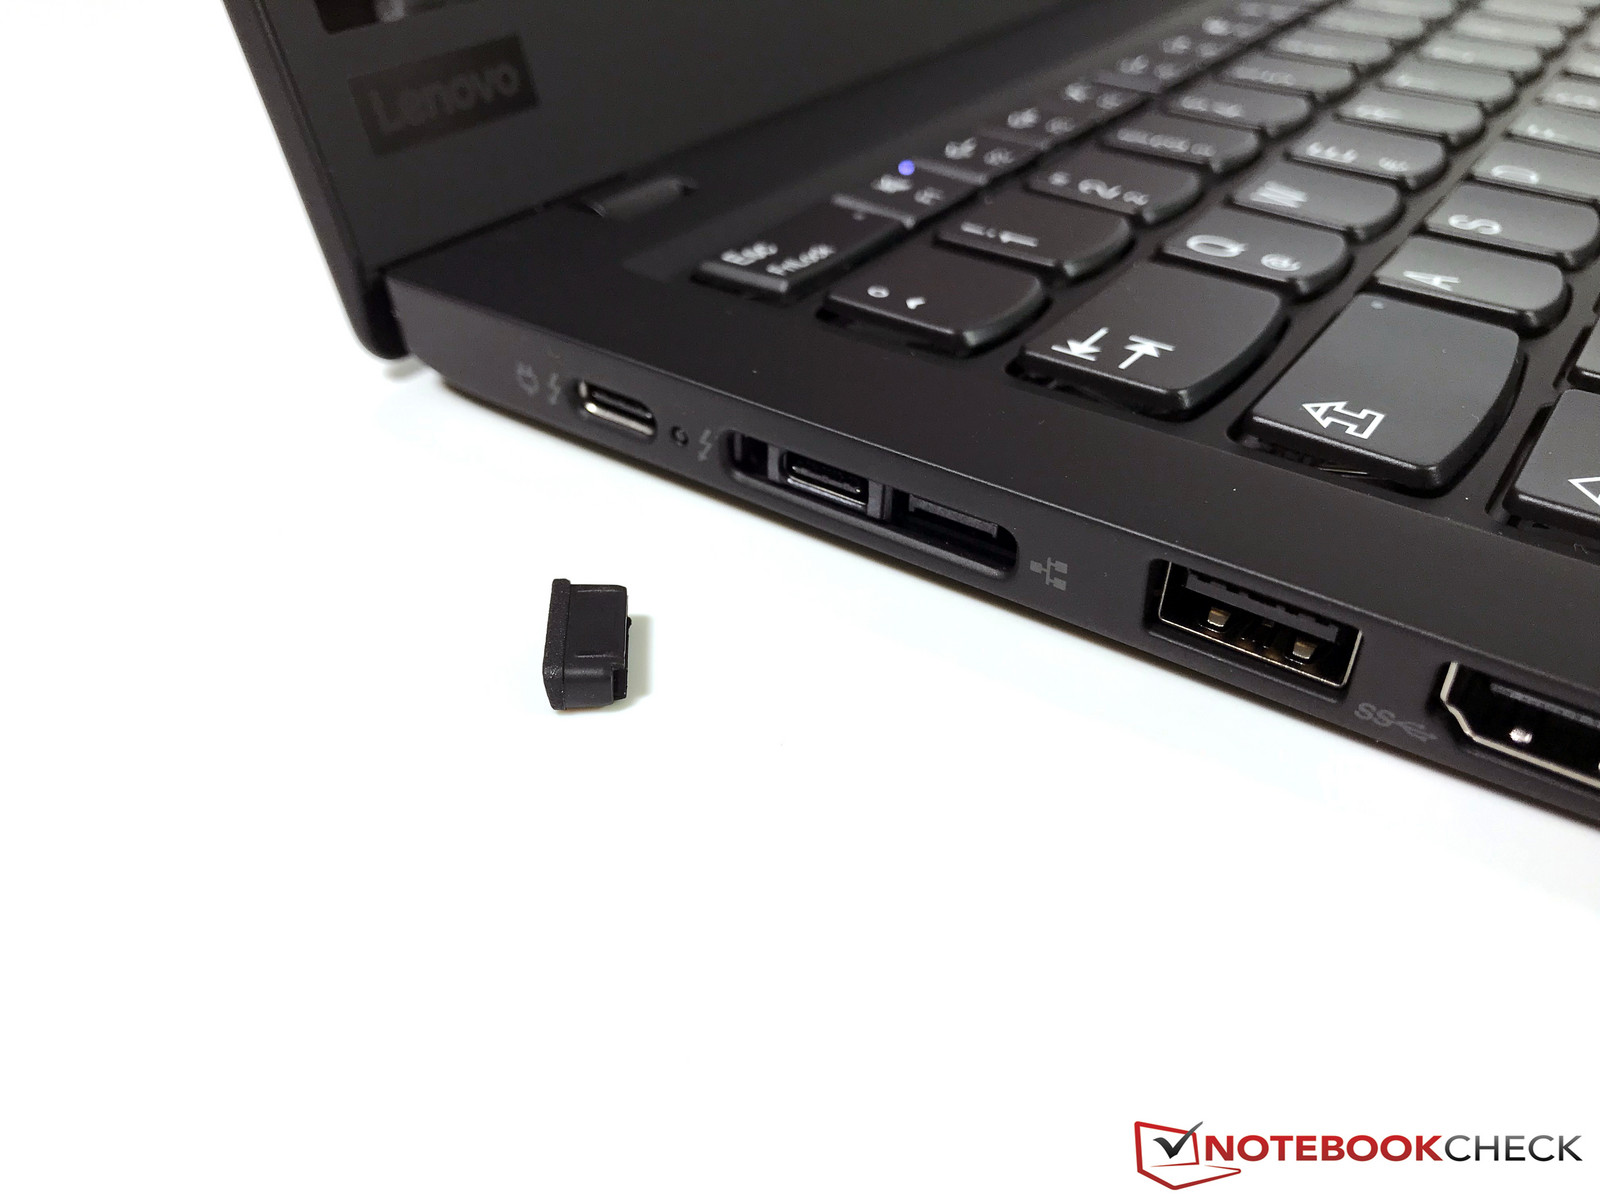
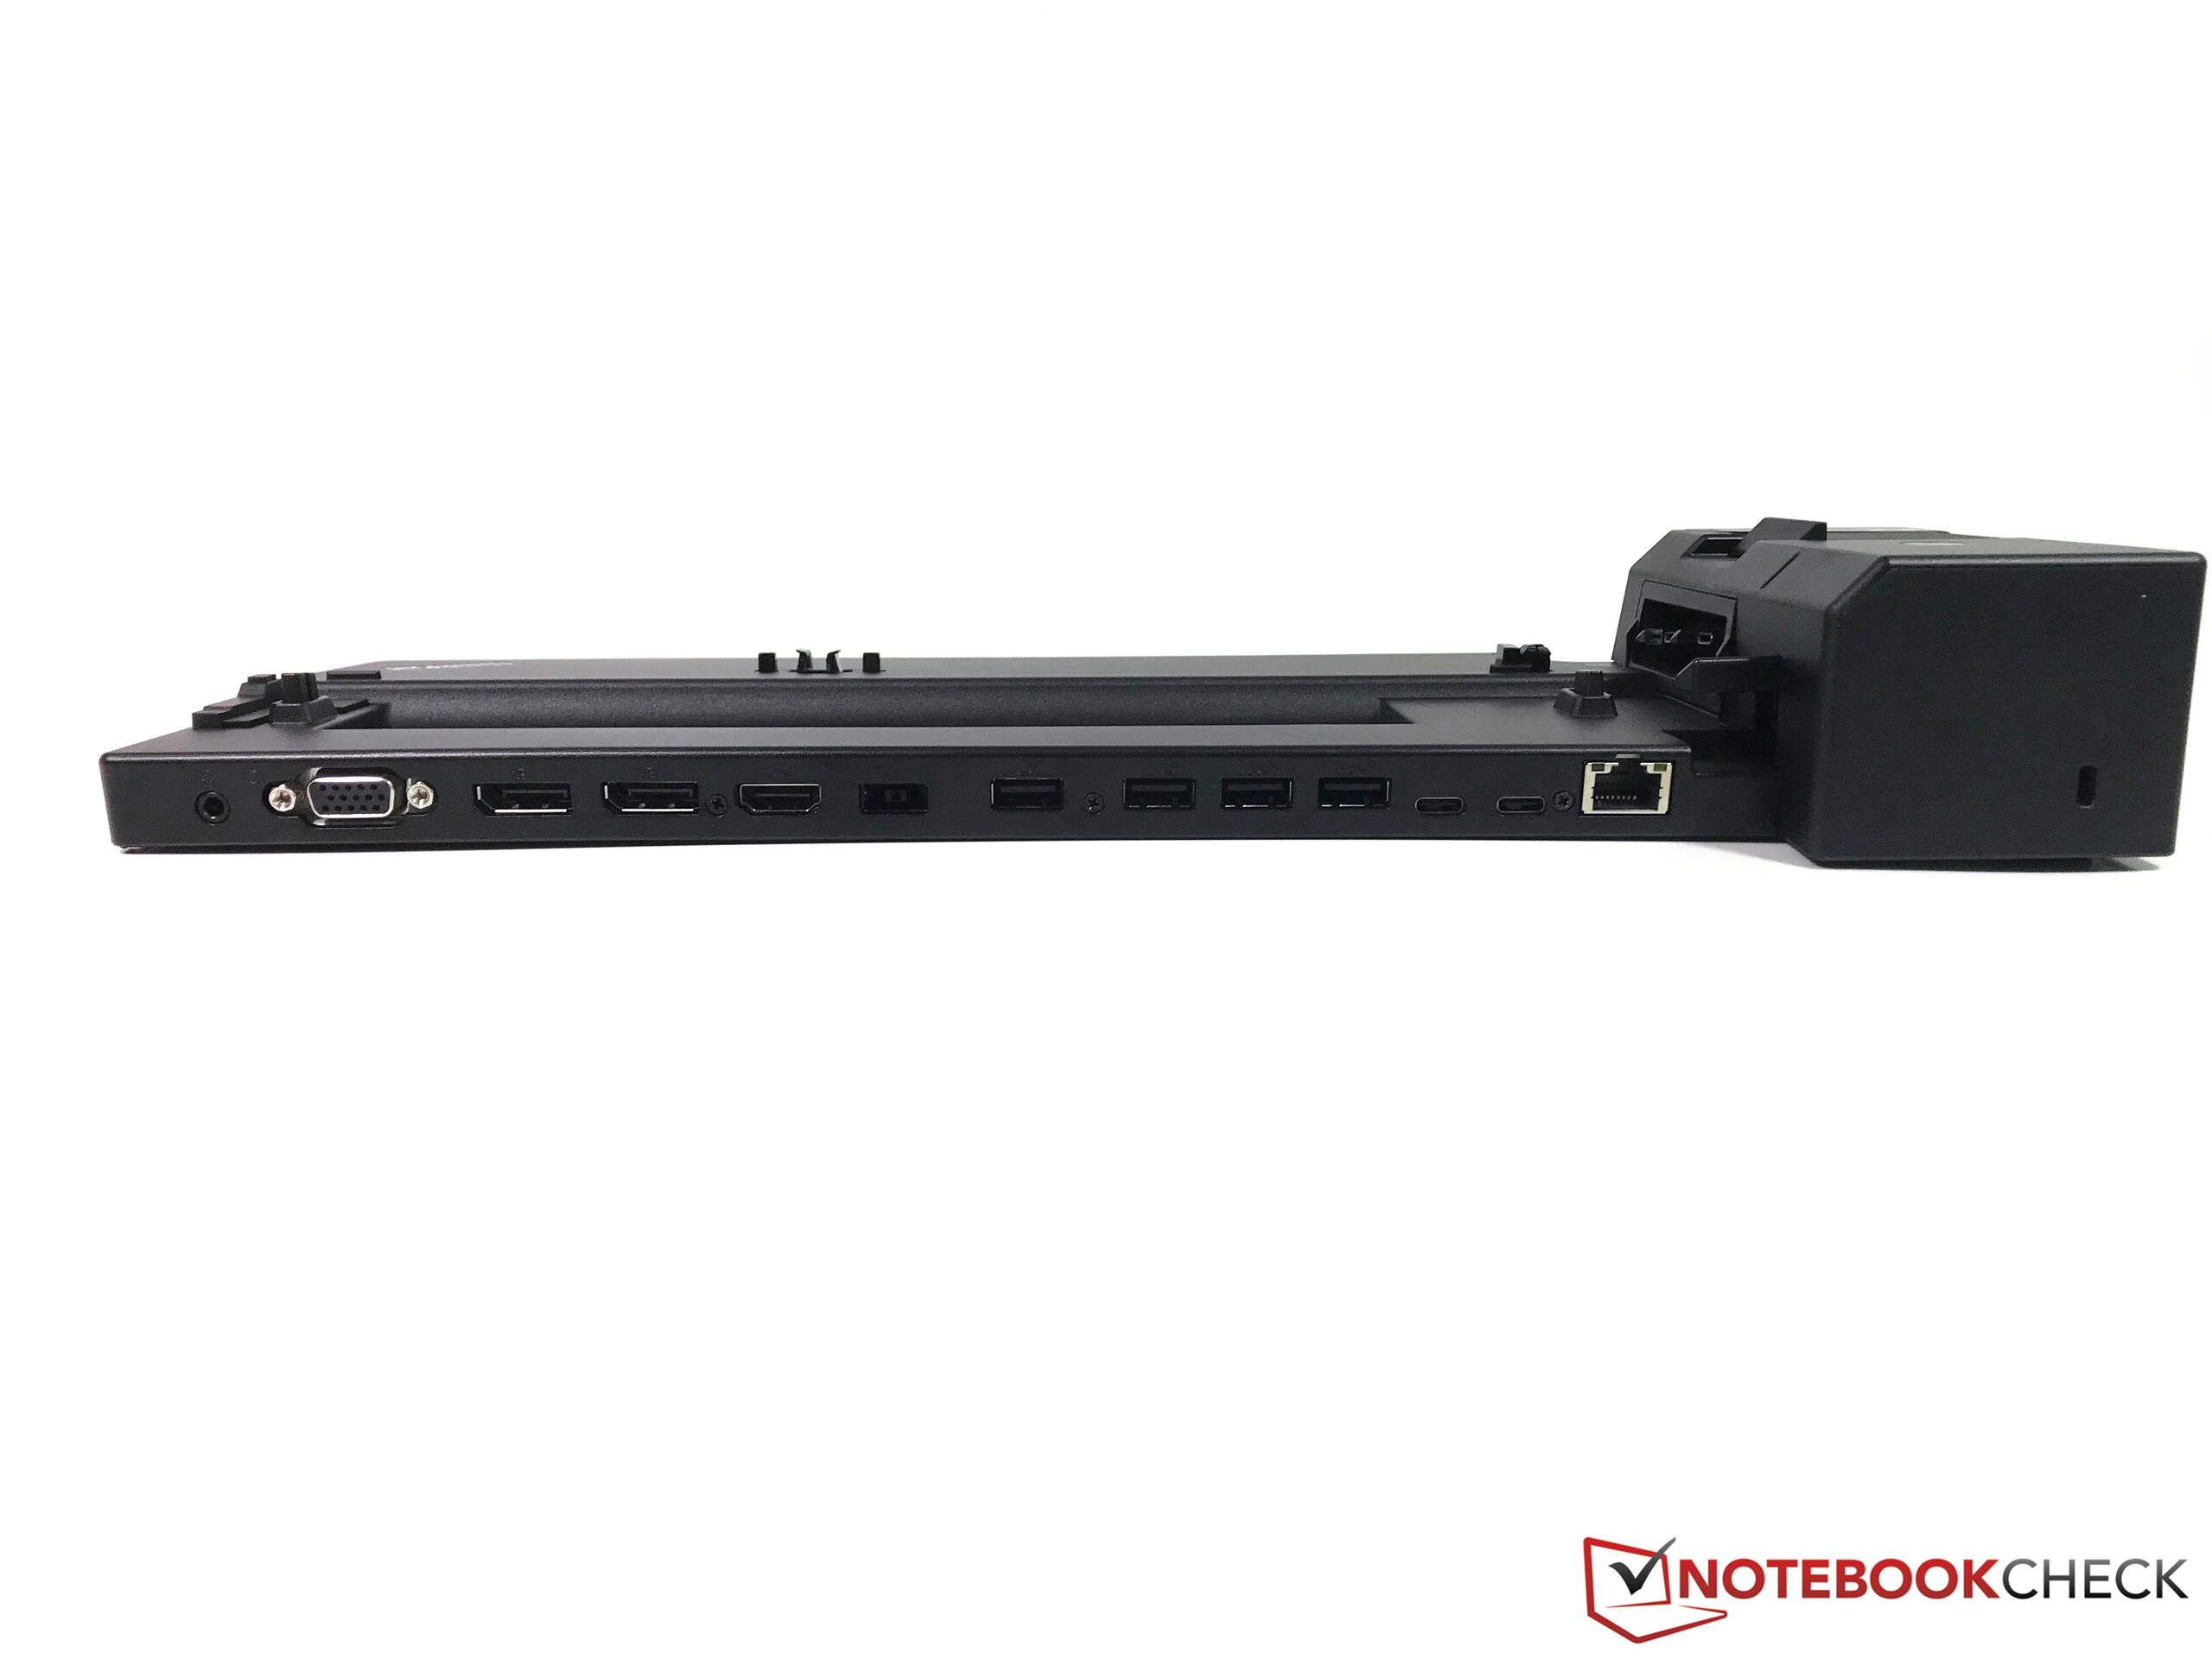
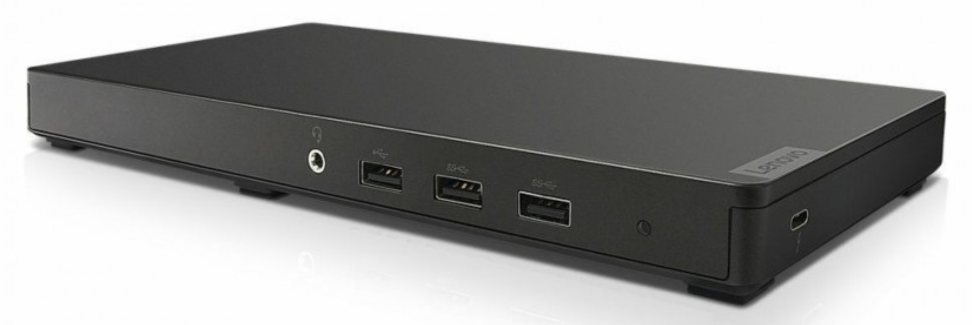
Connectivity - Thunderbolt & USB Type-A
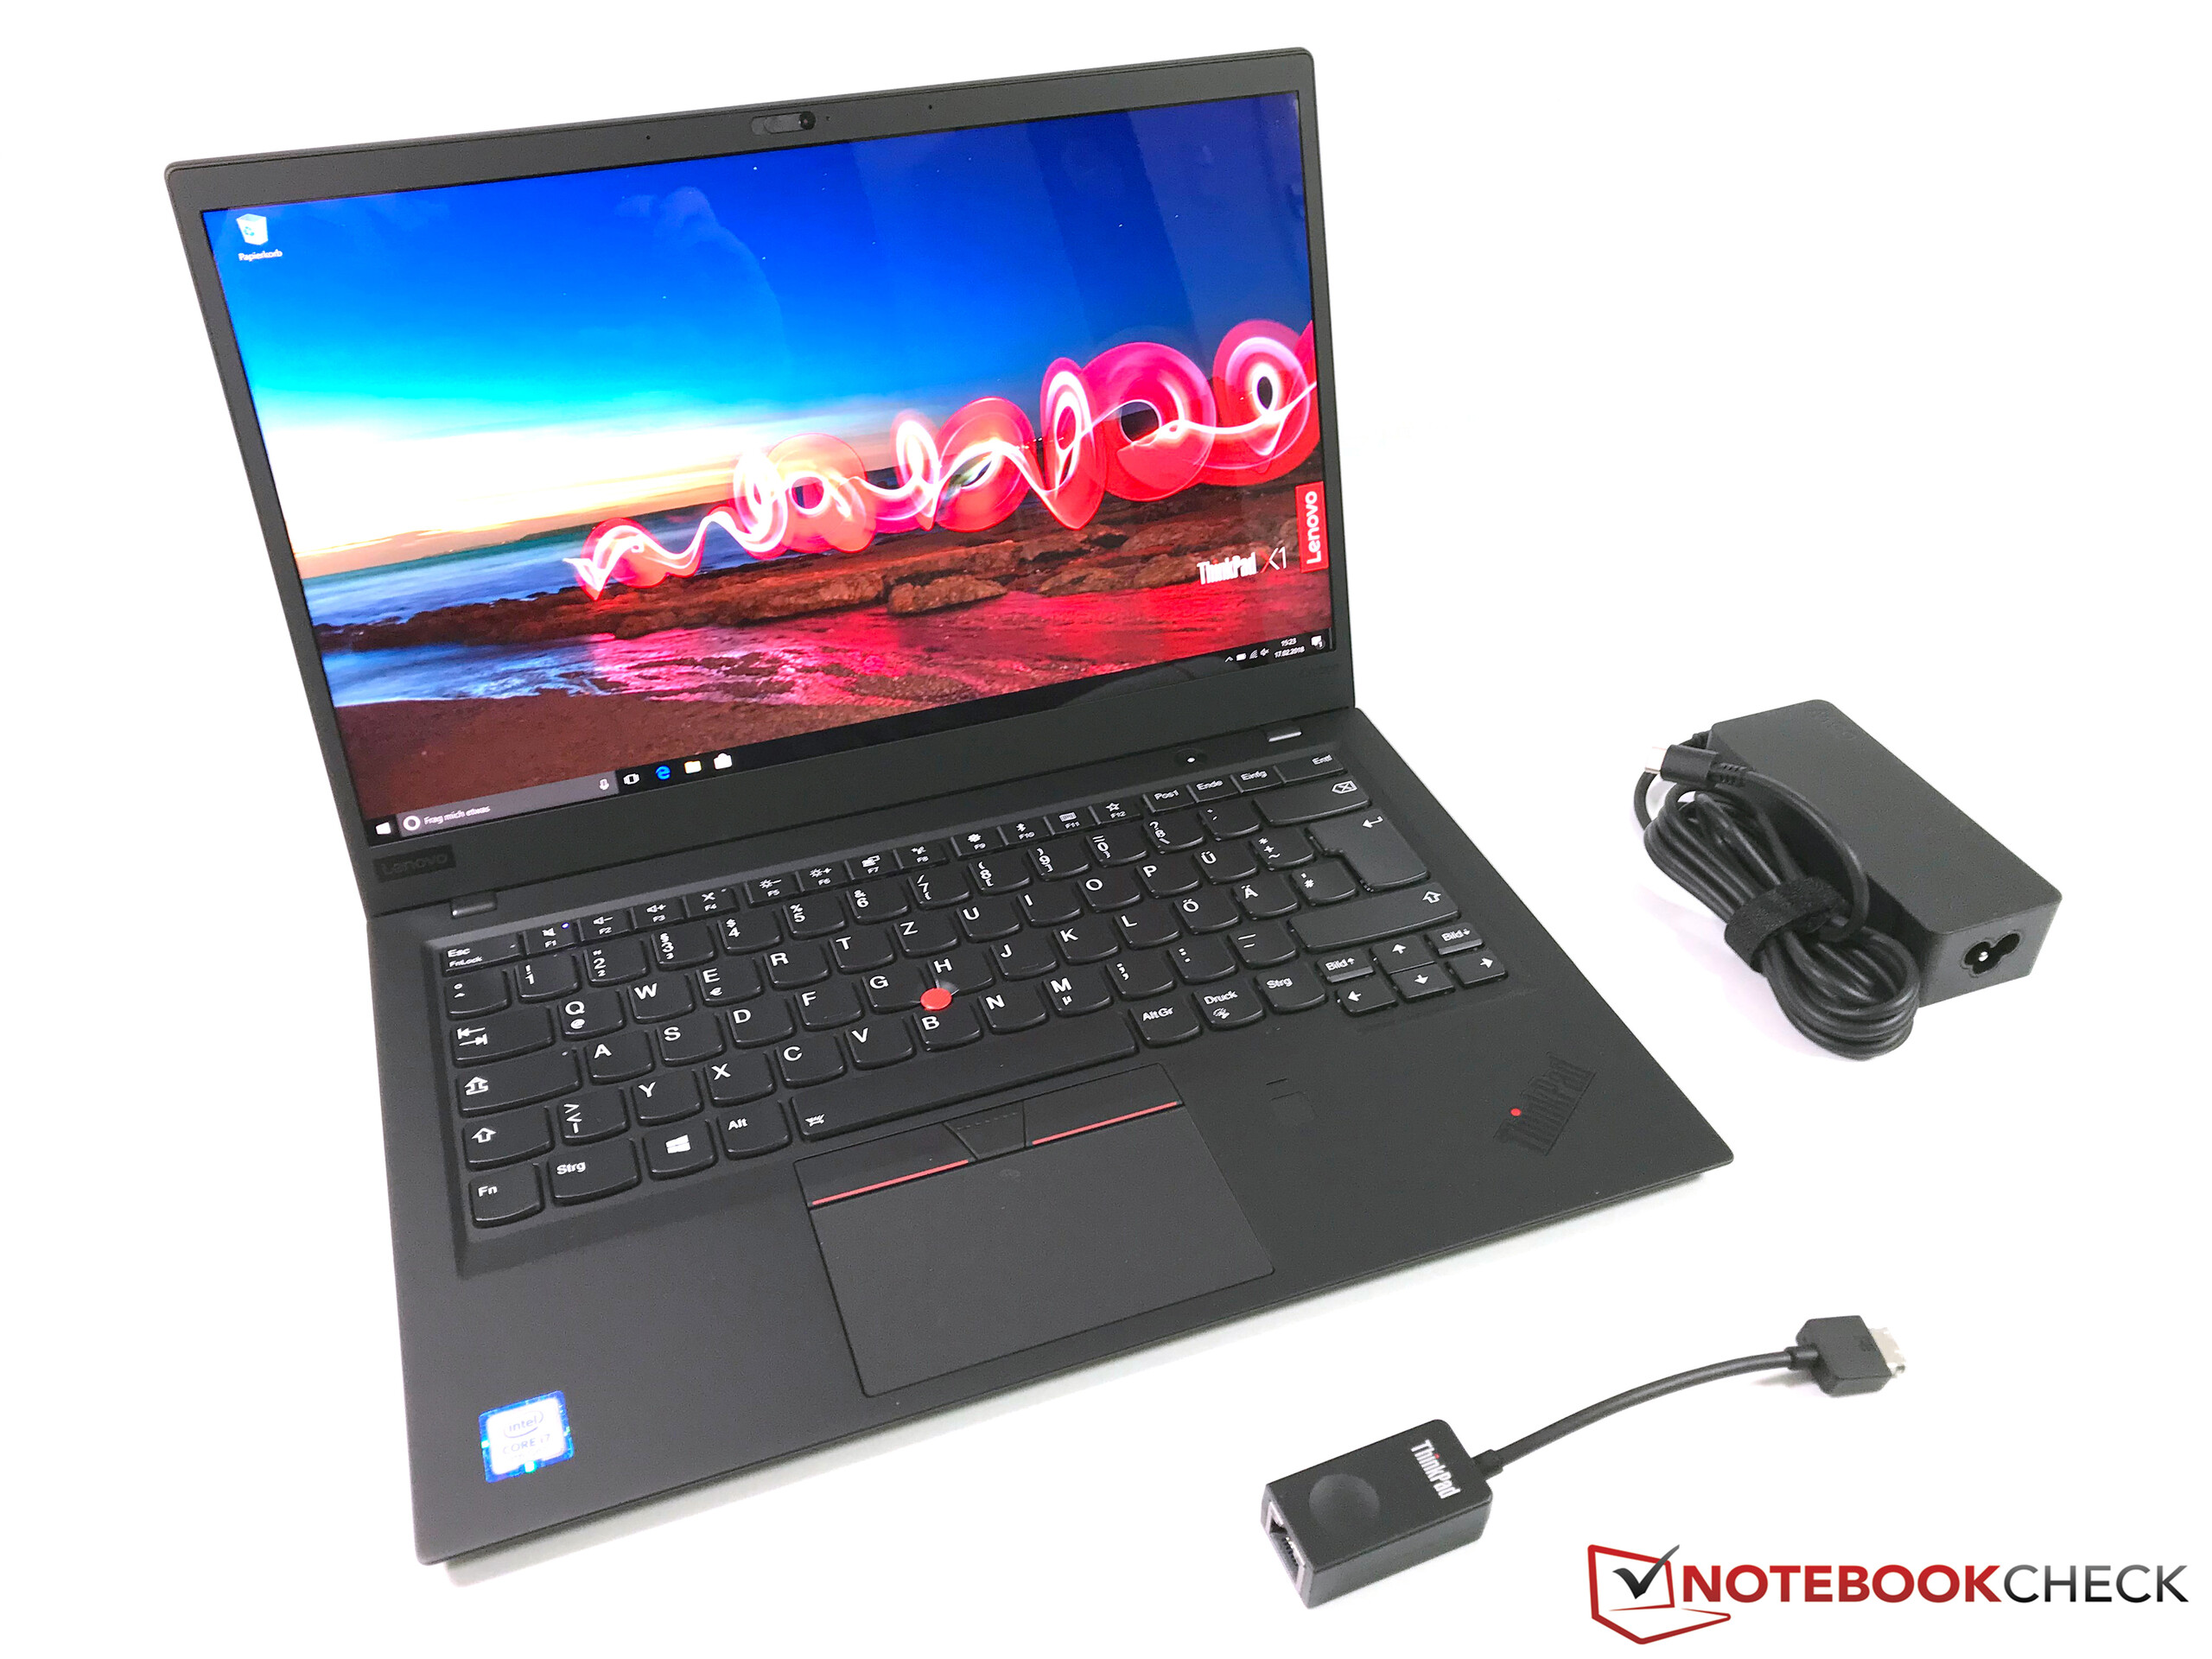
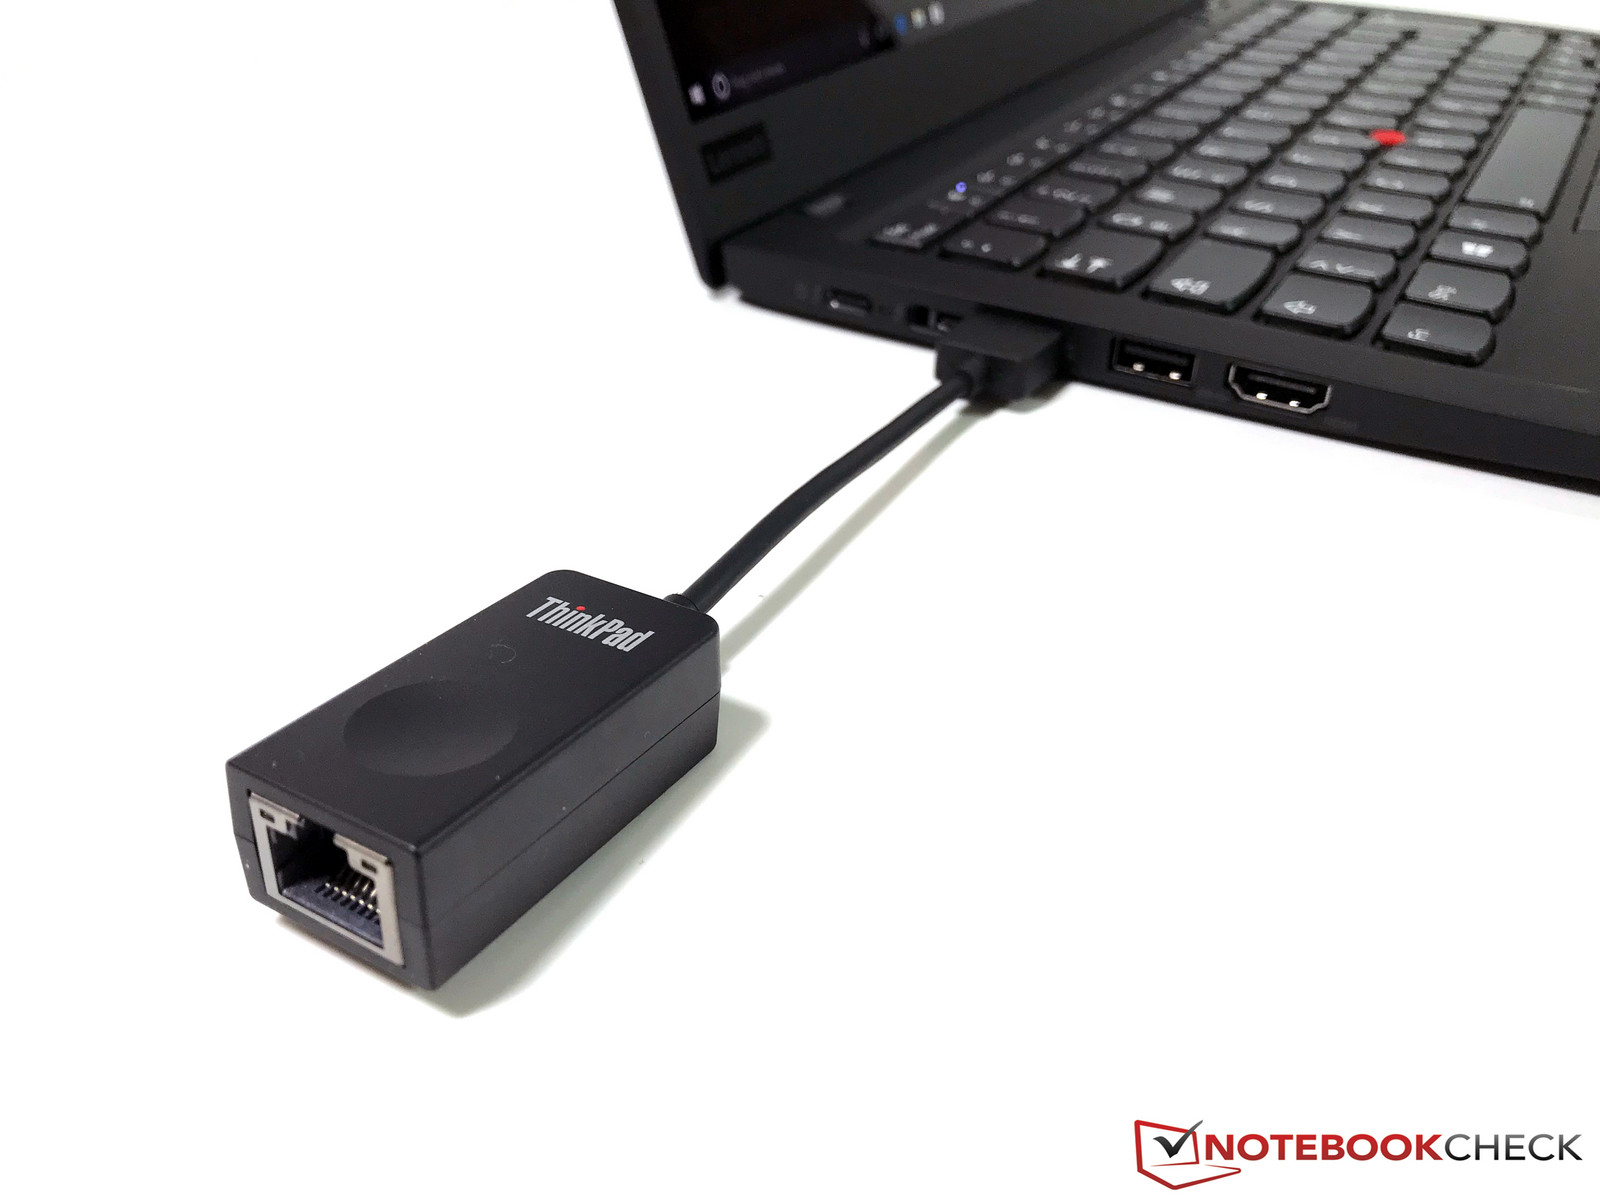
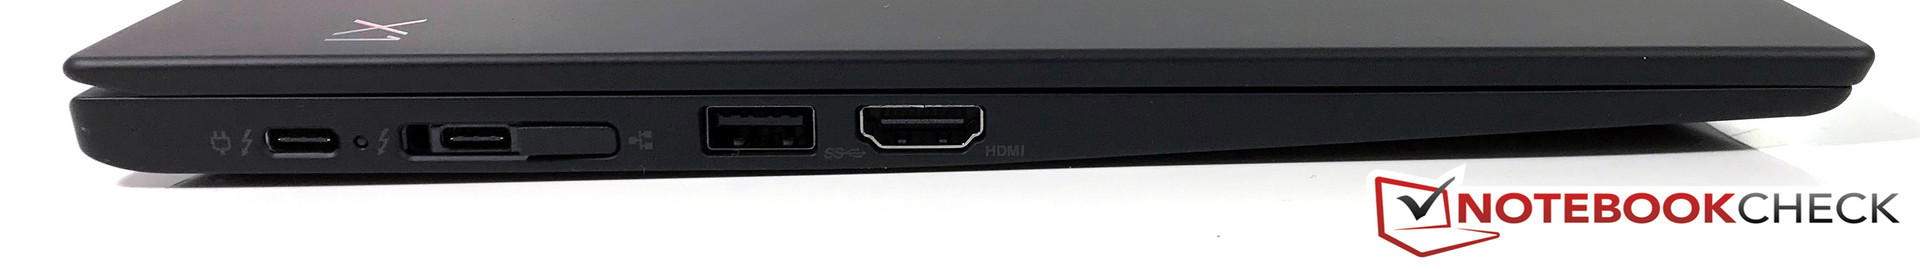
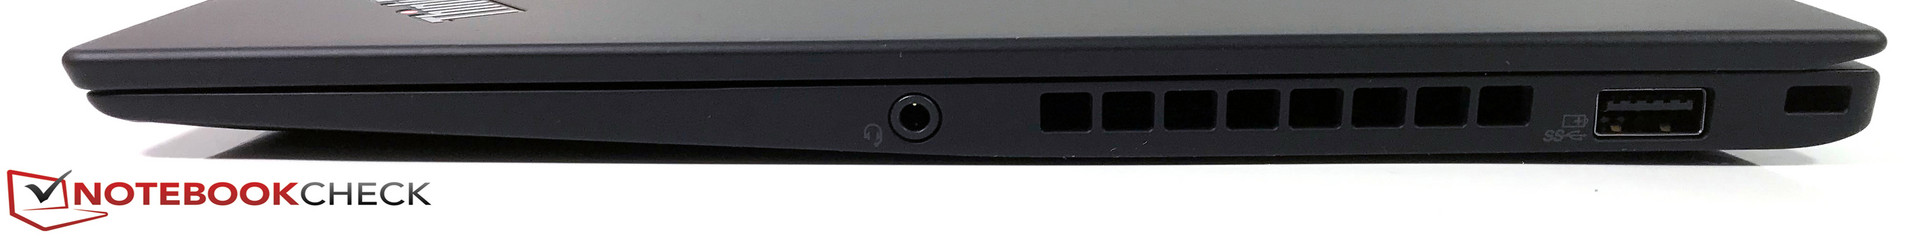
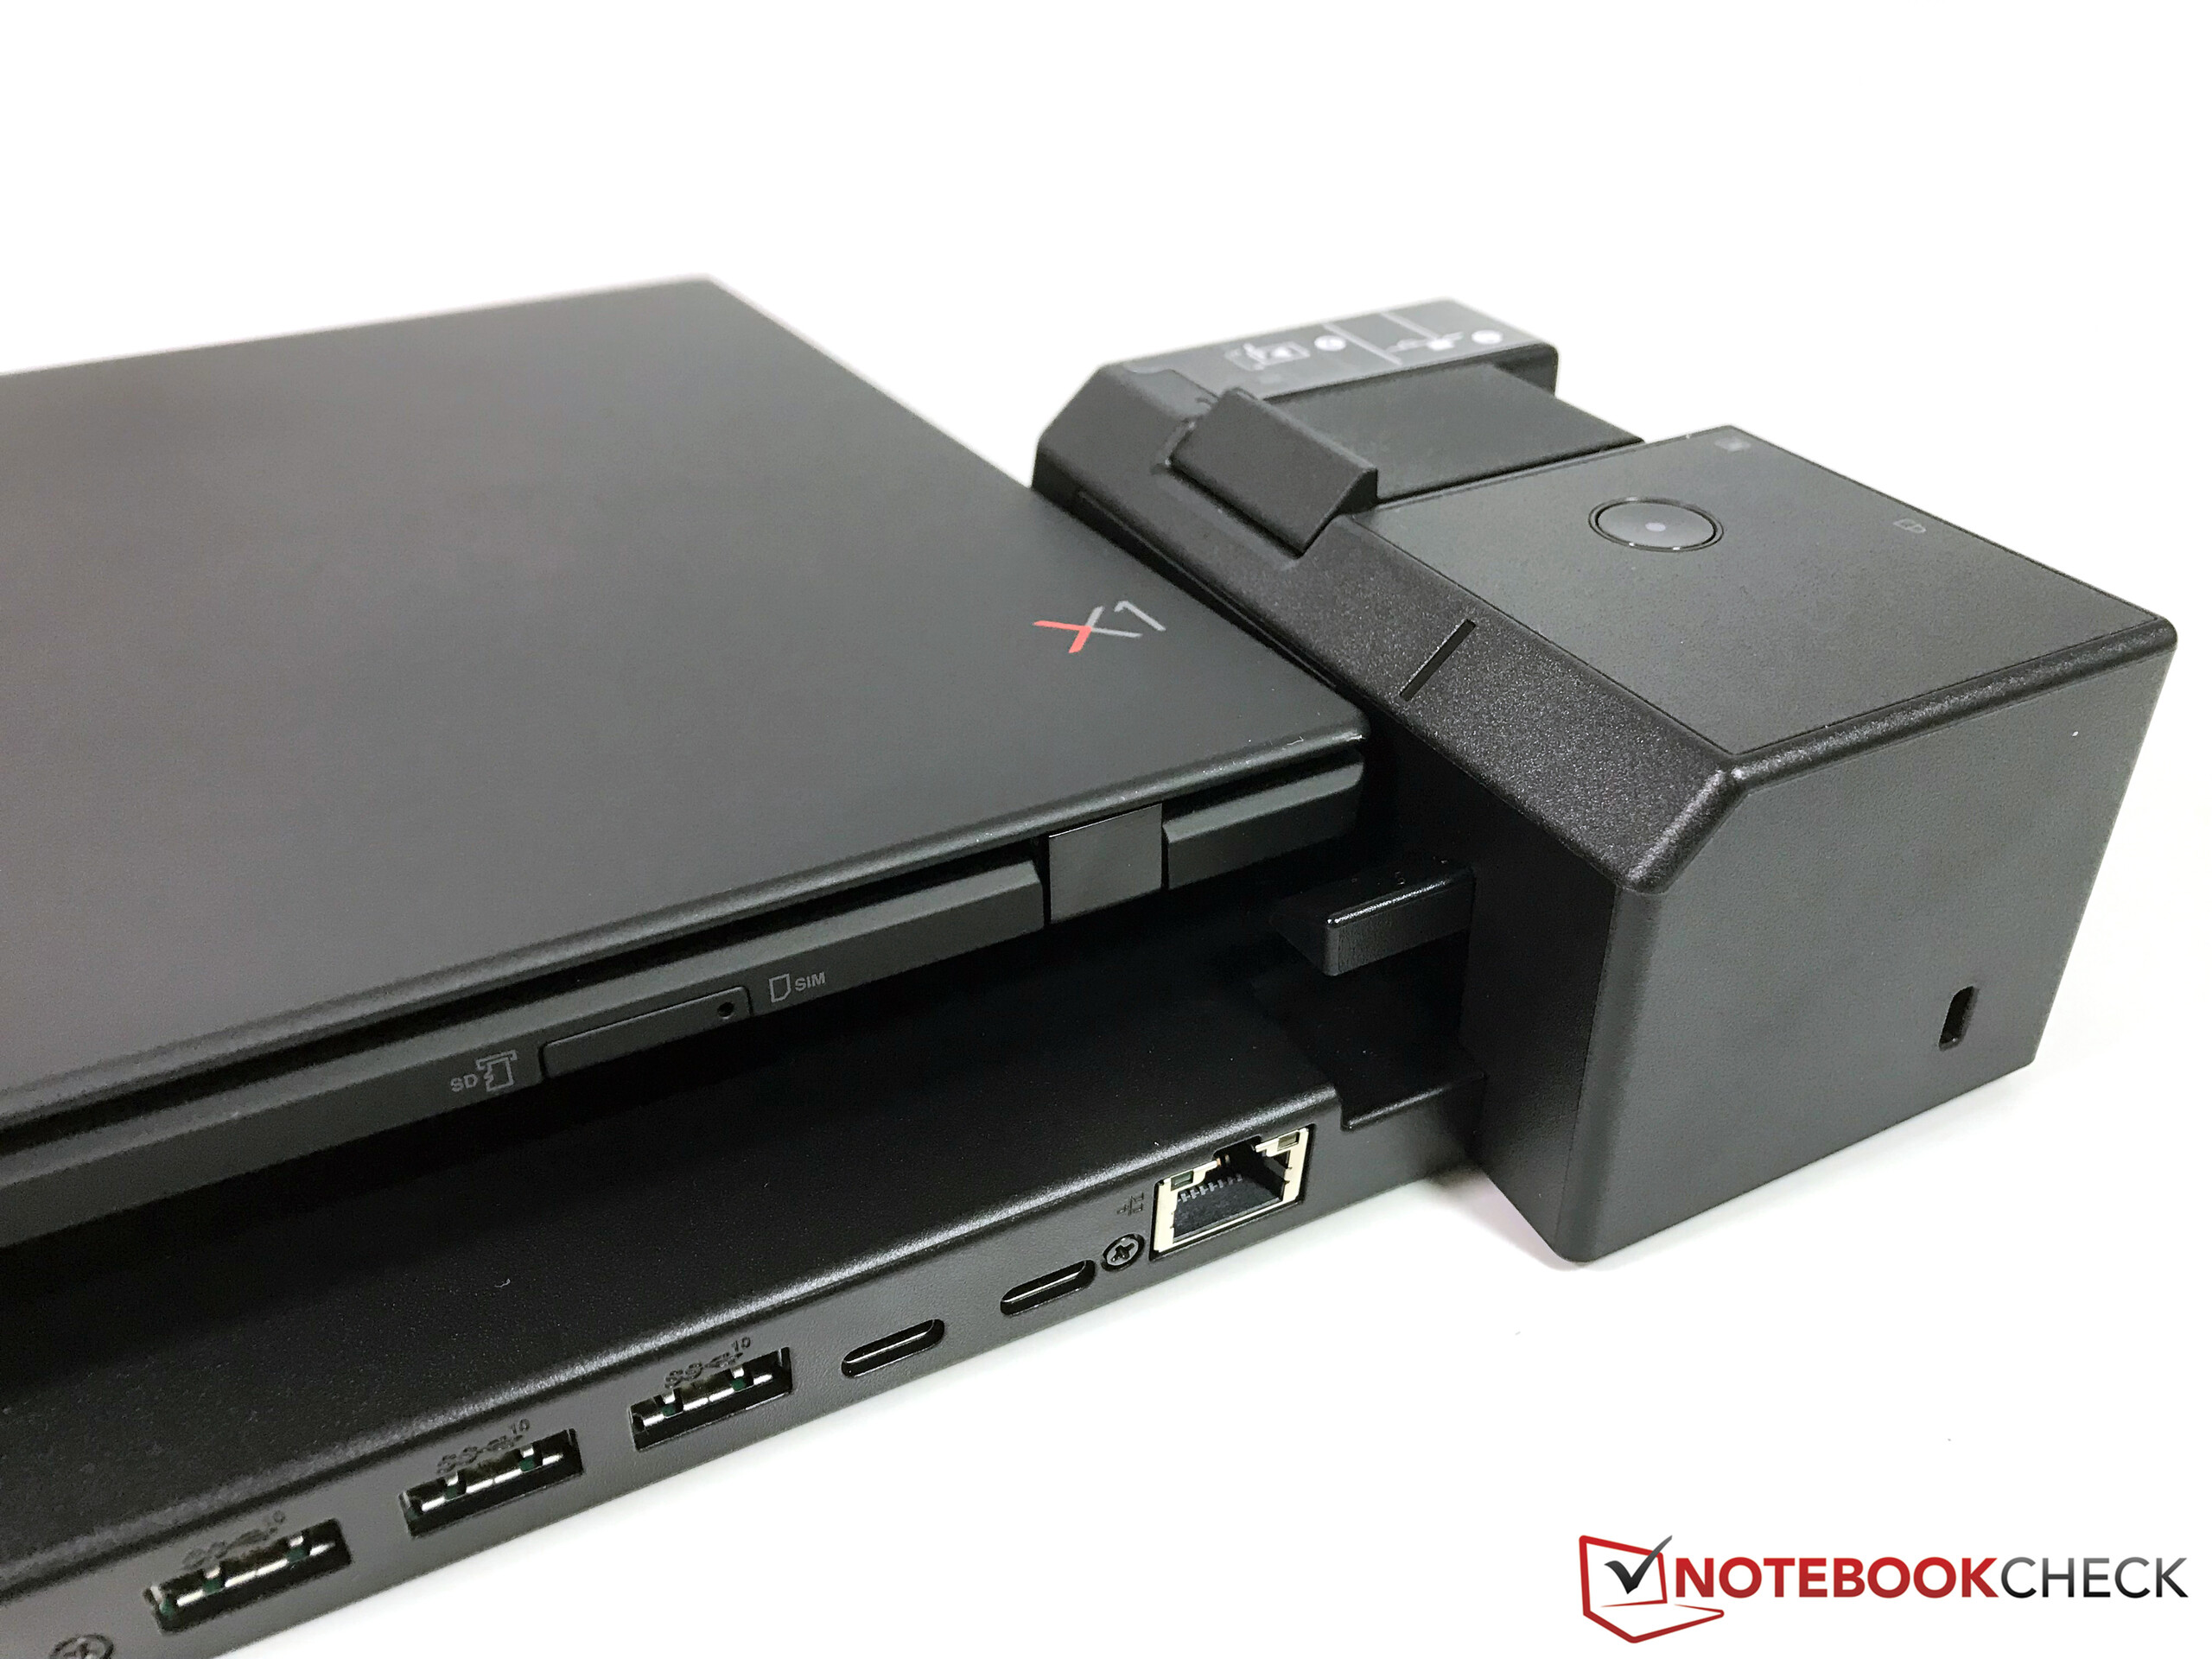
The port situation only changed at the left side. You still get two Thunderbolt 3 ports, but the Side-Dock connector is a new addition. The actual docking port is covered underneath a small cap by default. The docking port replaces the Mini-Ethernet port of the previous model and a corresponding adapter is in the box (see picture). Two standard USB 3.0 Type-A ports are a relief at a time where many slim devices have switched to USB-C only.
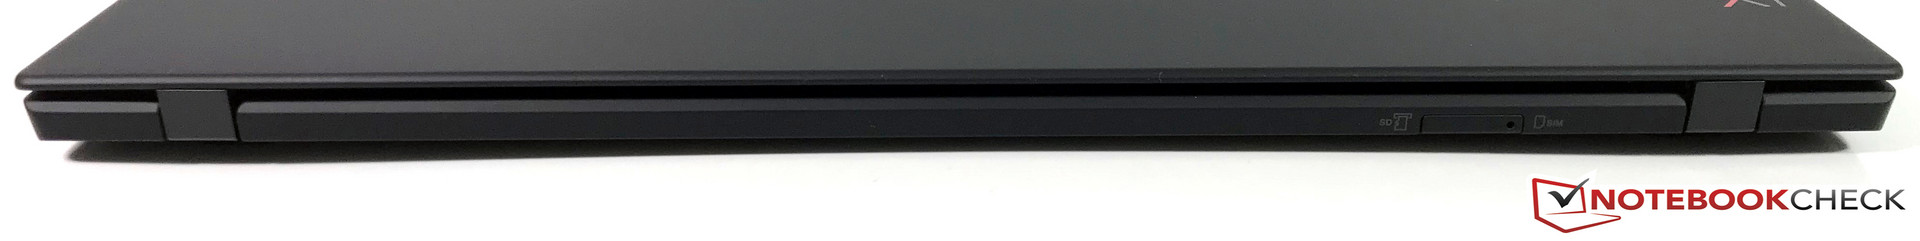
SD Card Reader
The microSD reader is still located at the rear edge of the base unit, and it also accommodates a micro-SIM card (both can be used at the same time). You need a sharp object or preferably a SIM tool that you get with many smartphones to open the slot, and the lid has to be closed as well. The performance is at least no problem, because we can determine more than 220 MB/s with our reference card from Toshiba (Exceria Pro M501 64 GB UHS-II); pictures are copied at an excellent speed of 191 MB/s. This easily beats the rivals, including the T480s with its full-size SD reader.
| SD Card Reader | |
| average JPG Copy Test (av. of 3 runs) | |
| Lenovo ThinkPad X1 Carbon 2018-20KGS03900 (Toshiba Exceria Pro M501) | |
| Lenovo ThinkPad T480s-20L8S02D00 (Toshiba Exceria Pro SDXC 64 GB UHS-II) | |
| Lenovo ThinkPad X280-20KES01S00 (Toshiba Excerie Pro M501) | |
| Dell Latitude 7480 (Toshiba (Exceria Pro SDXC UHS-II 64 GB) | |
| HP EliteBook 840 G4-Z2V49ET ABD (Toshiba Exceria Pro SDXC 64 GB UHS-II) | |
| Average of class Office (22.4 - 198.5, n=22, last 2 years) | |
| maximum AS SSD Seq Read Test (1GB) | |
| Lenovo ThinkPad X1 Carbon 2018-20KGS03900 (Toshiba Exceria Pro M501) | |
| Dell Latitude 7480 (Toshiba (Exceria Pro SDXC UHS-II 64 GB) | |
| Lenovo ThinkPad T480s-20L8S02D00 (Toshiba Exceria Pro SDXC 64 GB UHS-II) | |
| Lenovo ThinkPad X280-20KES01S00 (Toshiba Excerie Pro M501) | |
| HP EliteBook 840 G4-Z2V49ET ABD (Toshiba Exceria Pro SDXC 64 GB UHS-II) | |
| Average of class Office (27.4 - 249, n=20, last 2 years) | |
Communication
Lenovo once again uses the familiar Intel chip Wireless-AC 8265 instead of the new 9260 module, which supports higher transfer rates as well as Bluetooth 5.0. We determine normal results for the 8265 in the X1 Carbon and did not experience any connectivity issues so far.
The WWAN issues from the previous 2017 model are still with us. You once again have to decide whether you want an LTE module when you buy the device. It is not possible (or at least difficult) to implement a WWAN module since the required antennas are not already installed. The sibling T480s has an advantage in this respect.
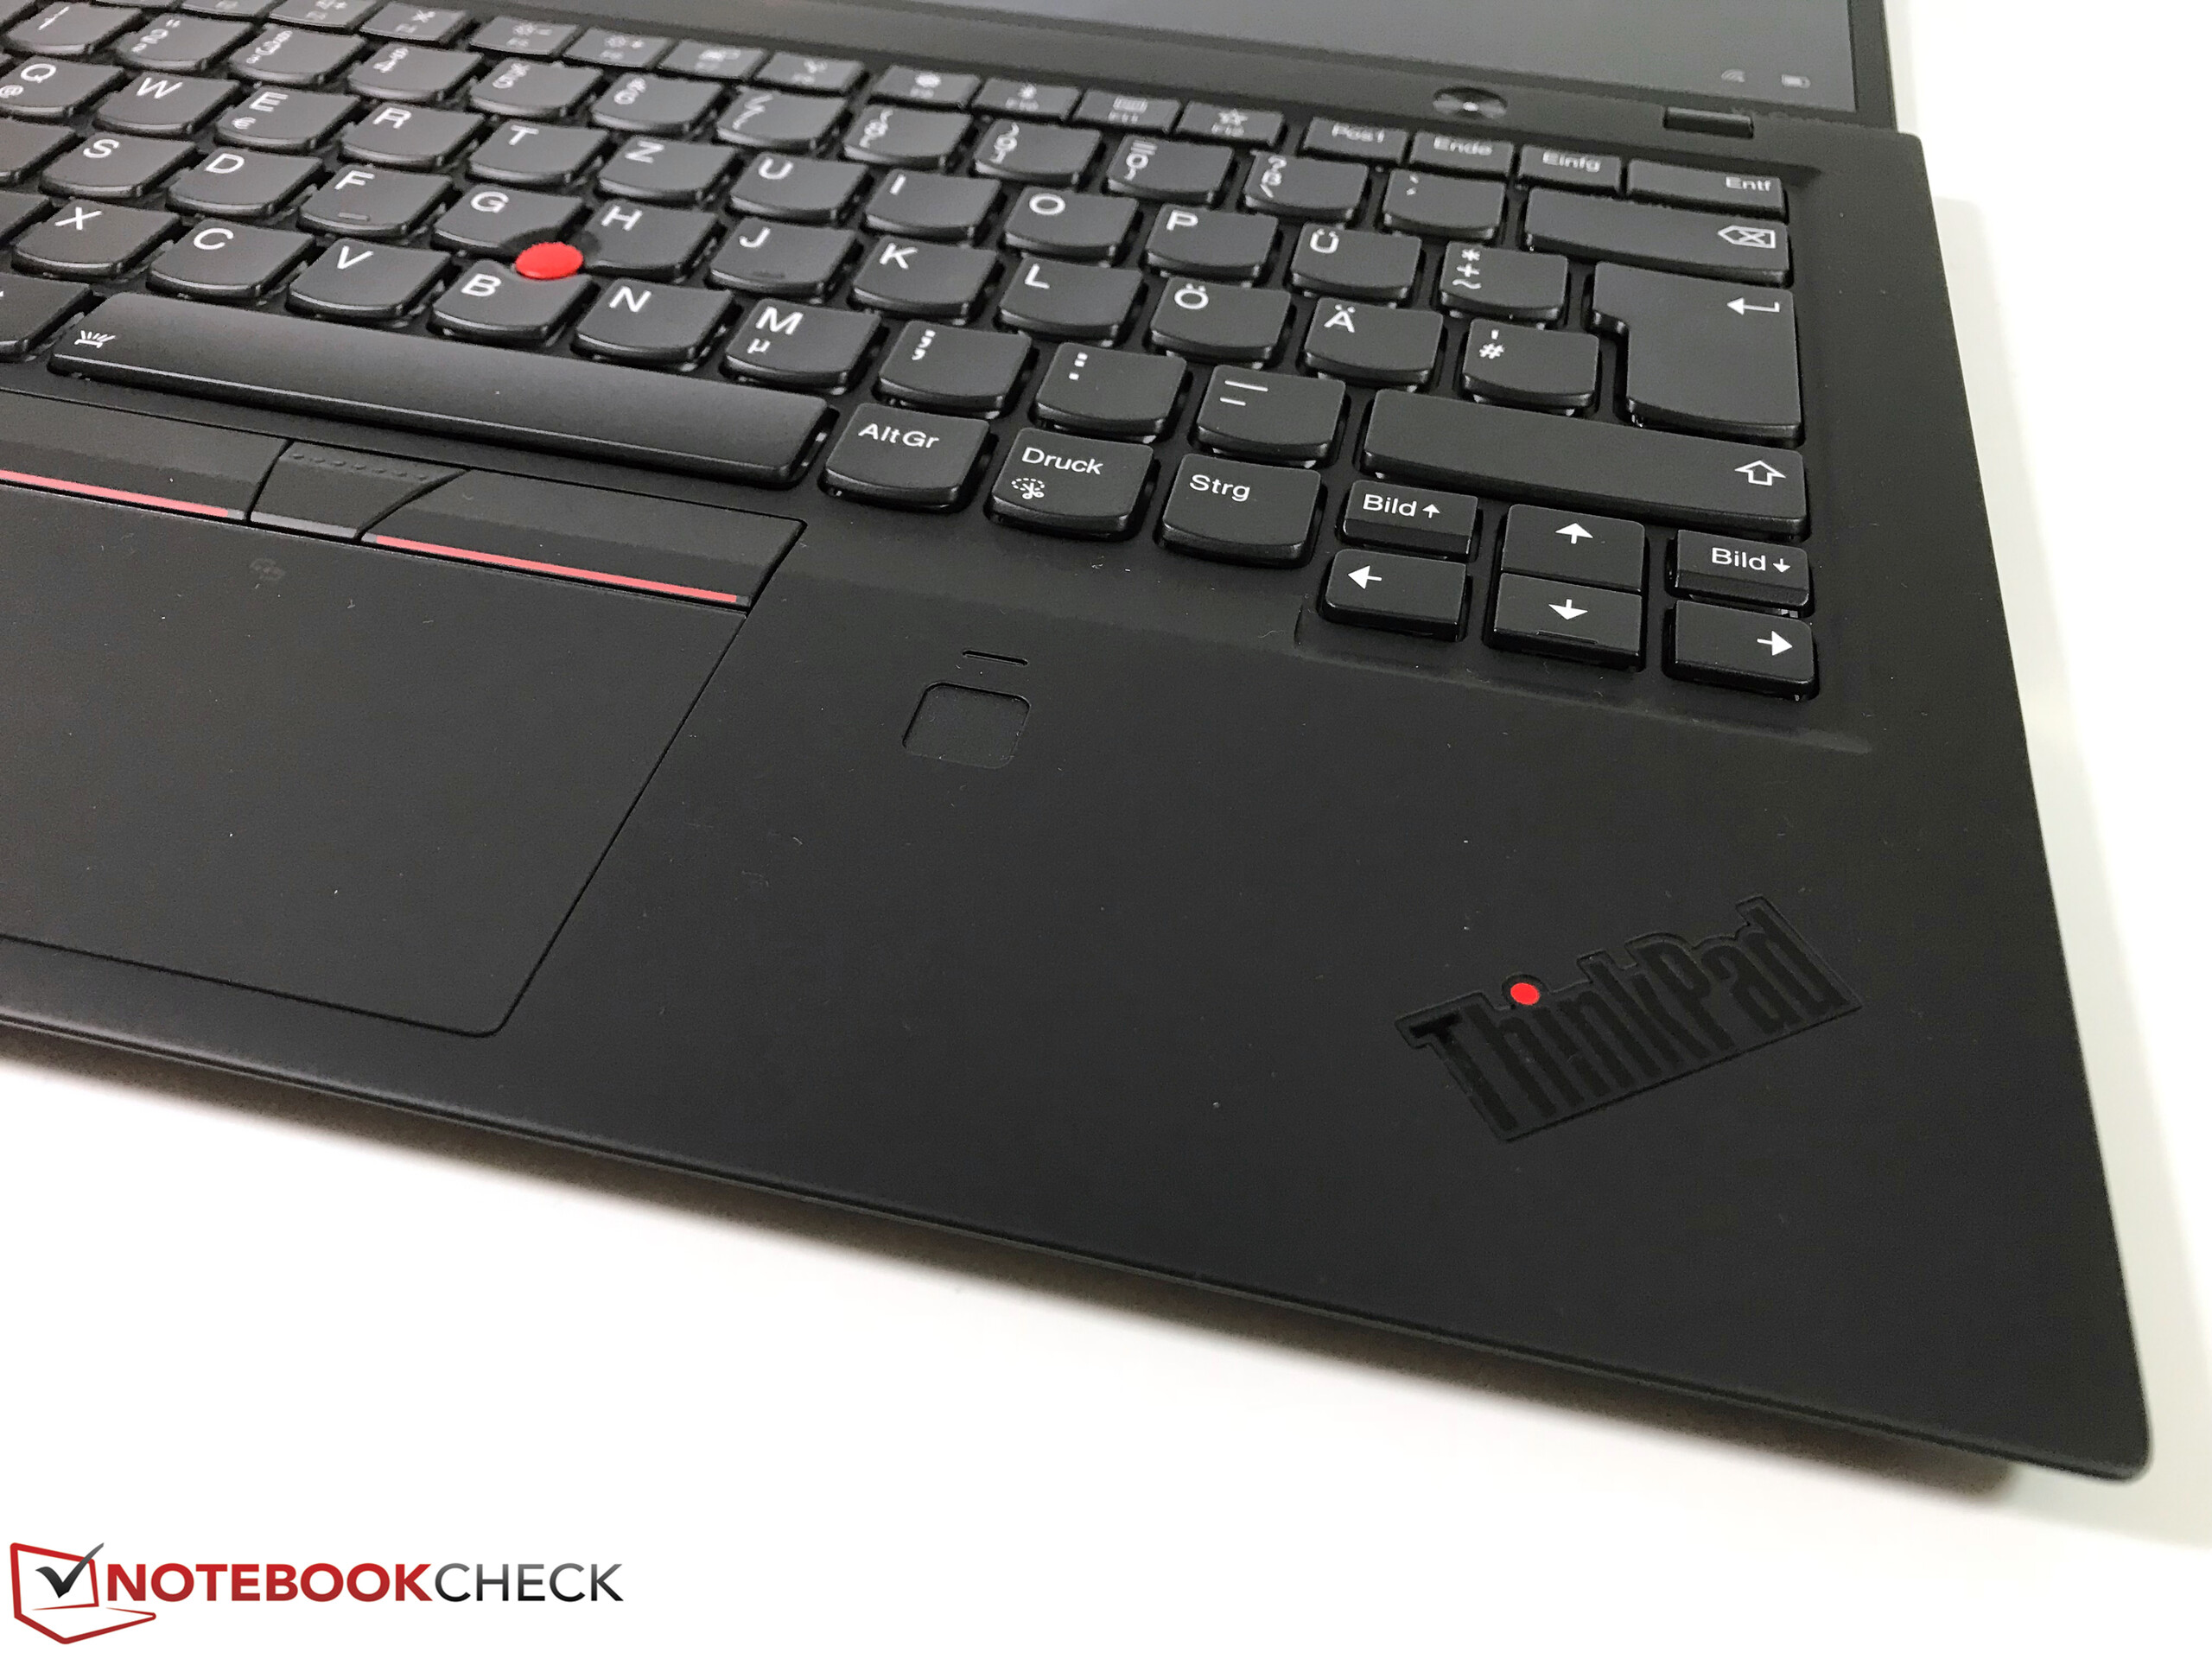
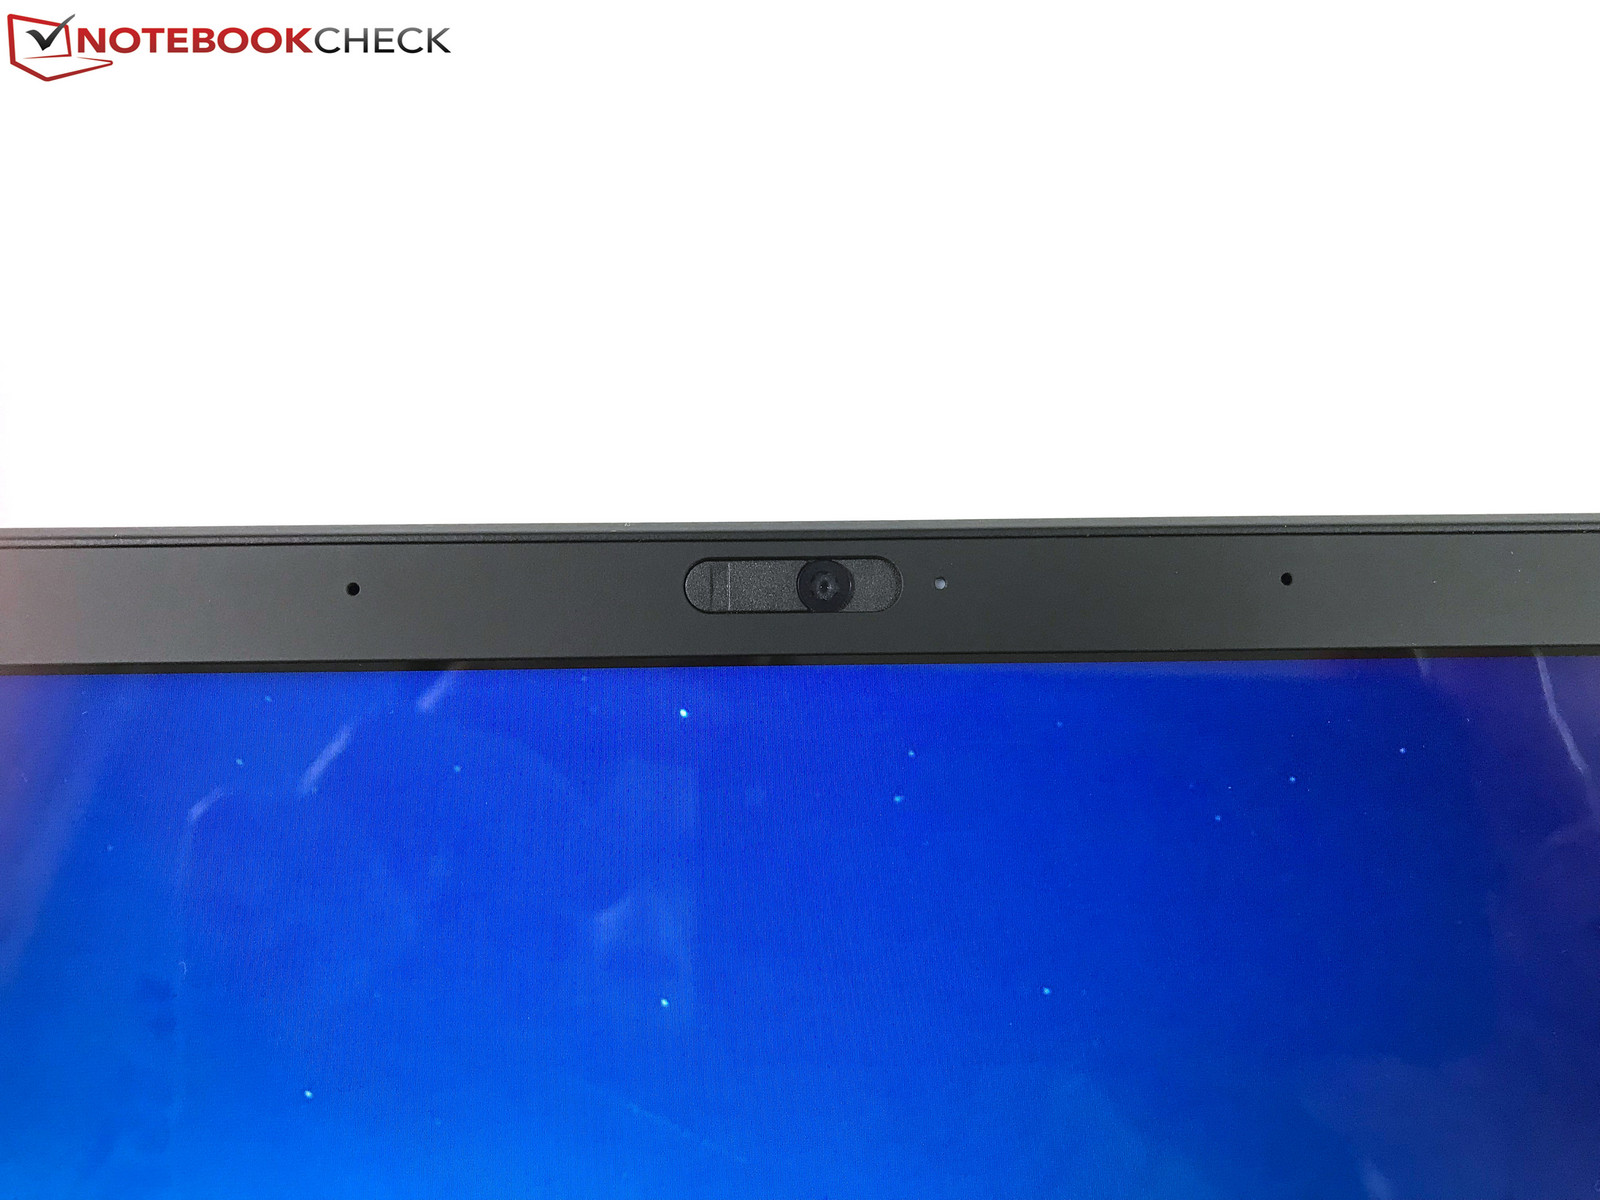
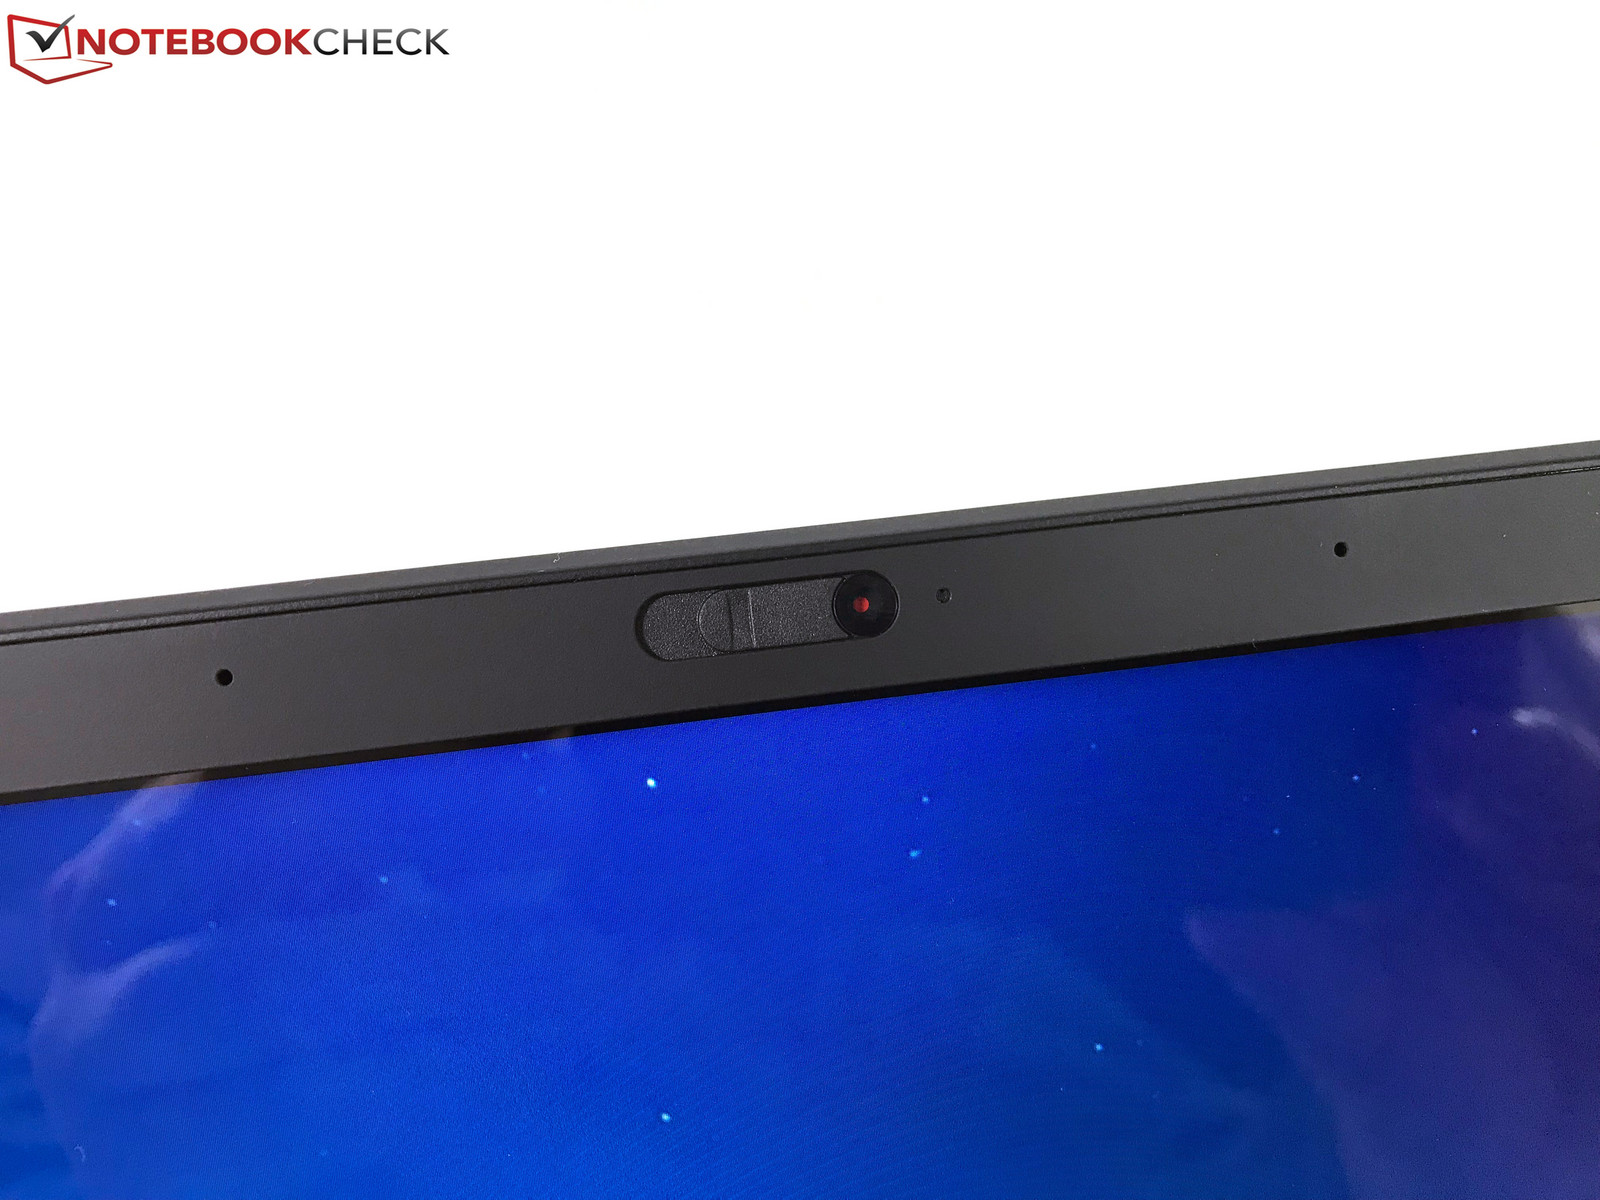
Security – ThinkShutter camera cover
The basic security equipment of the ThinkPad X1 Carbon 2018 did not change. Lenovo implements a TPM 2.0 chip and you can set several passwords (BIOS, hard drive, boot). You can either use a password, SmartCard (optional) or the fingerprint scanner to log into Windows. The latter is touch based and operates very reliably.
Some models are equipped with an infrared webcam, which supports facial recognition in combination with Windows Hello. The other option is a regular 720p webcam with a new mechanical cover called ThinkShutter. The following two pictures show the two positions of the cover. The quality of the camera did not change though. It does its job for video conferences and the like, but that's about it.
Accessories
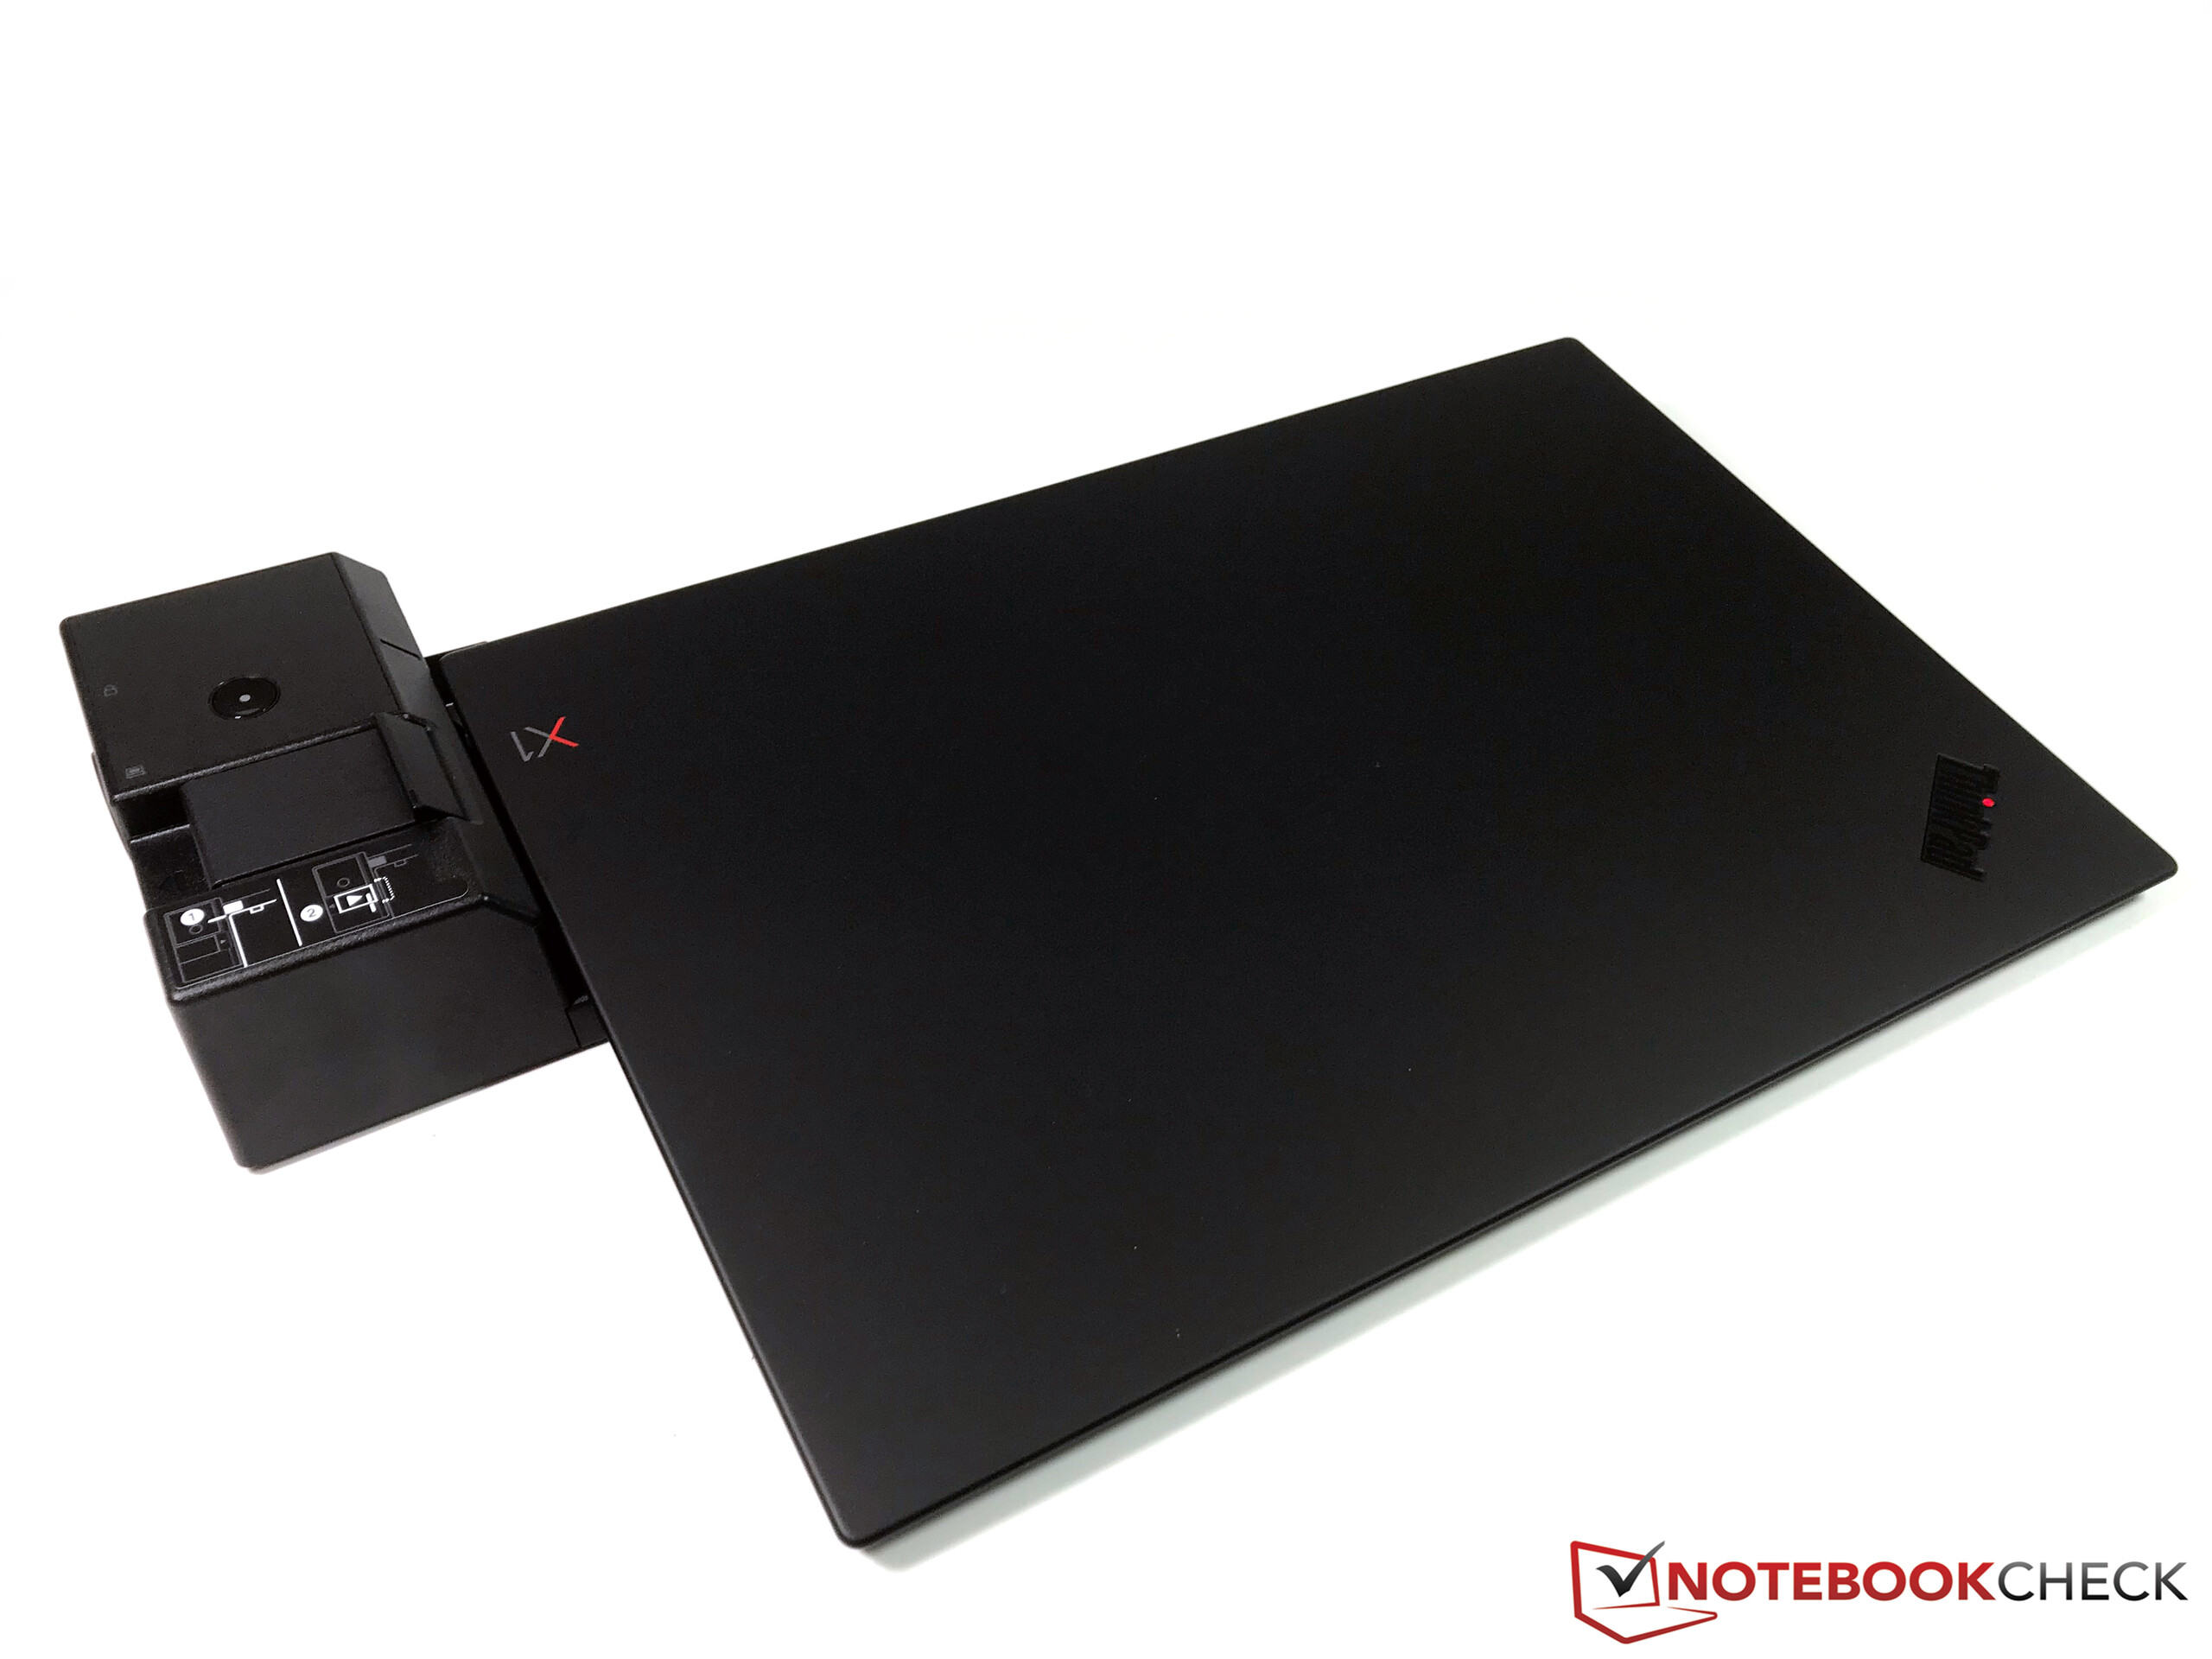
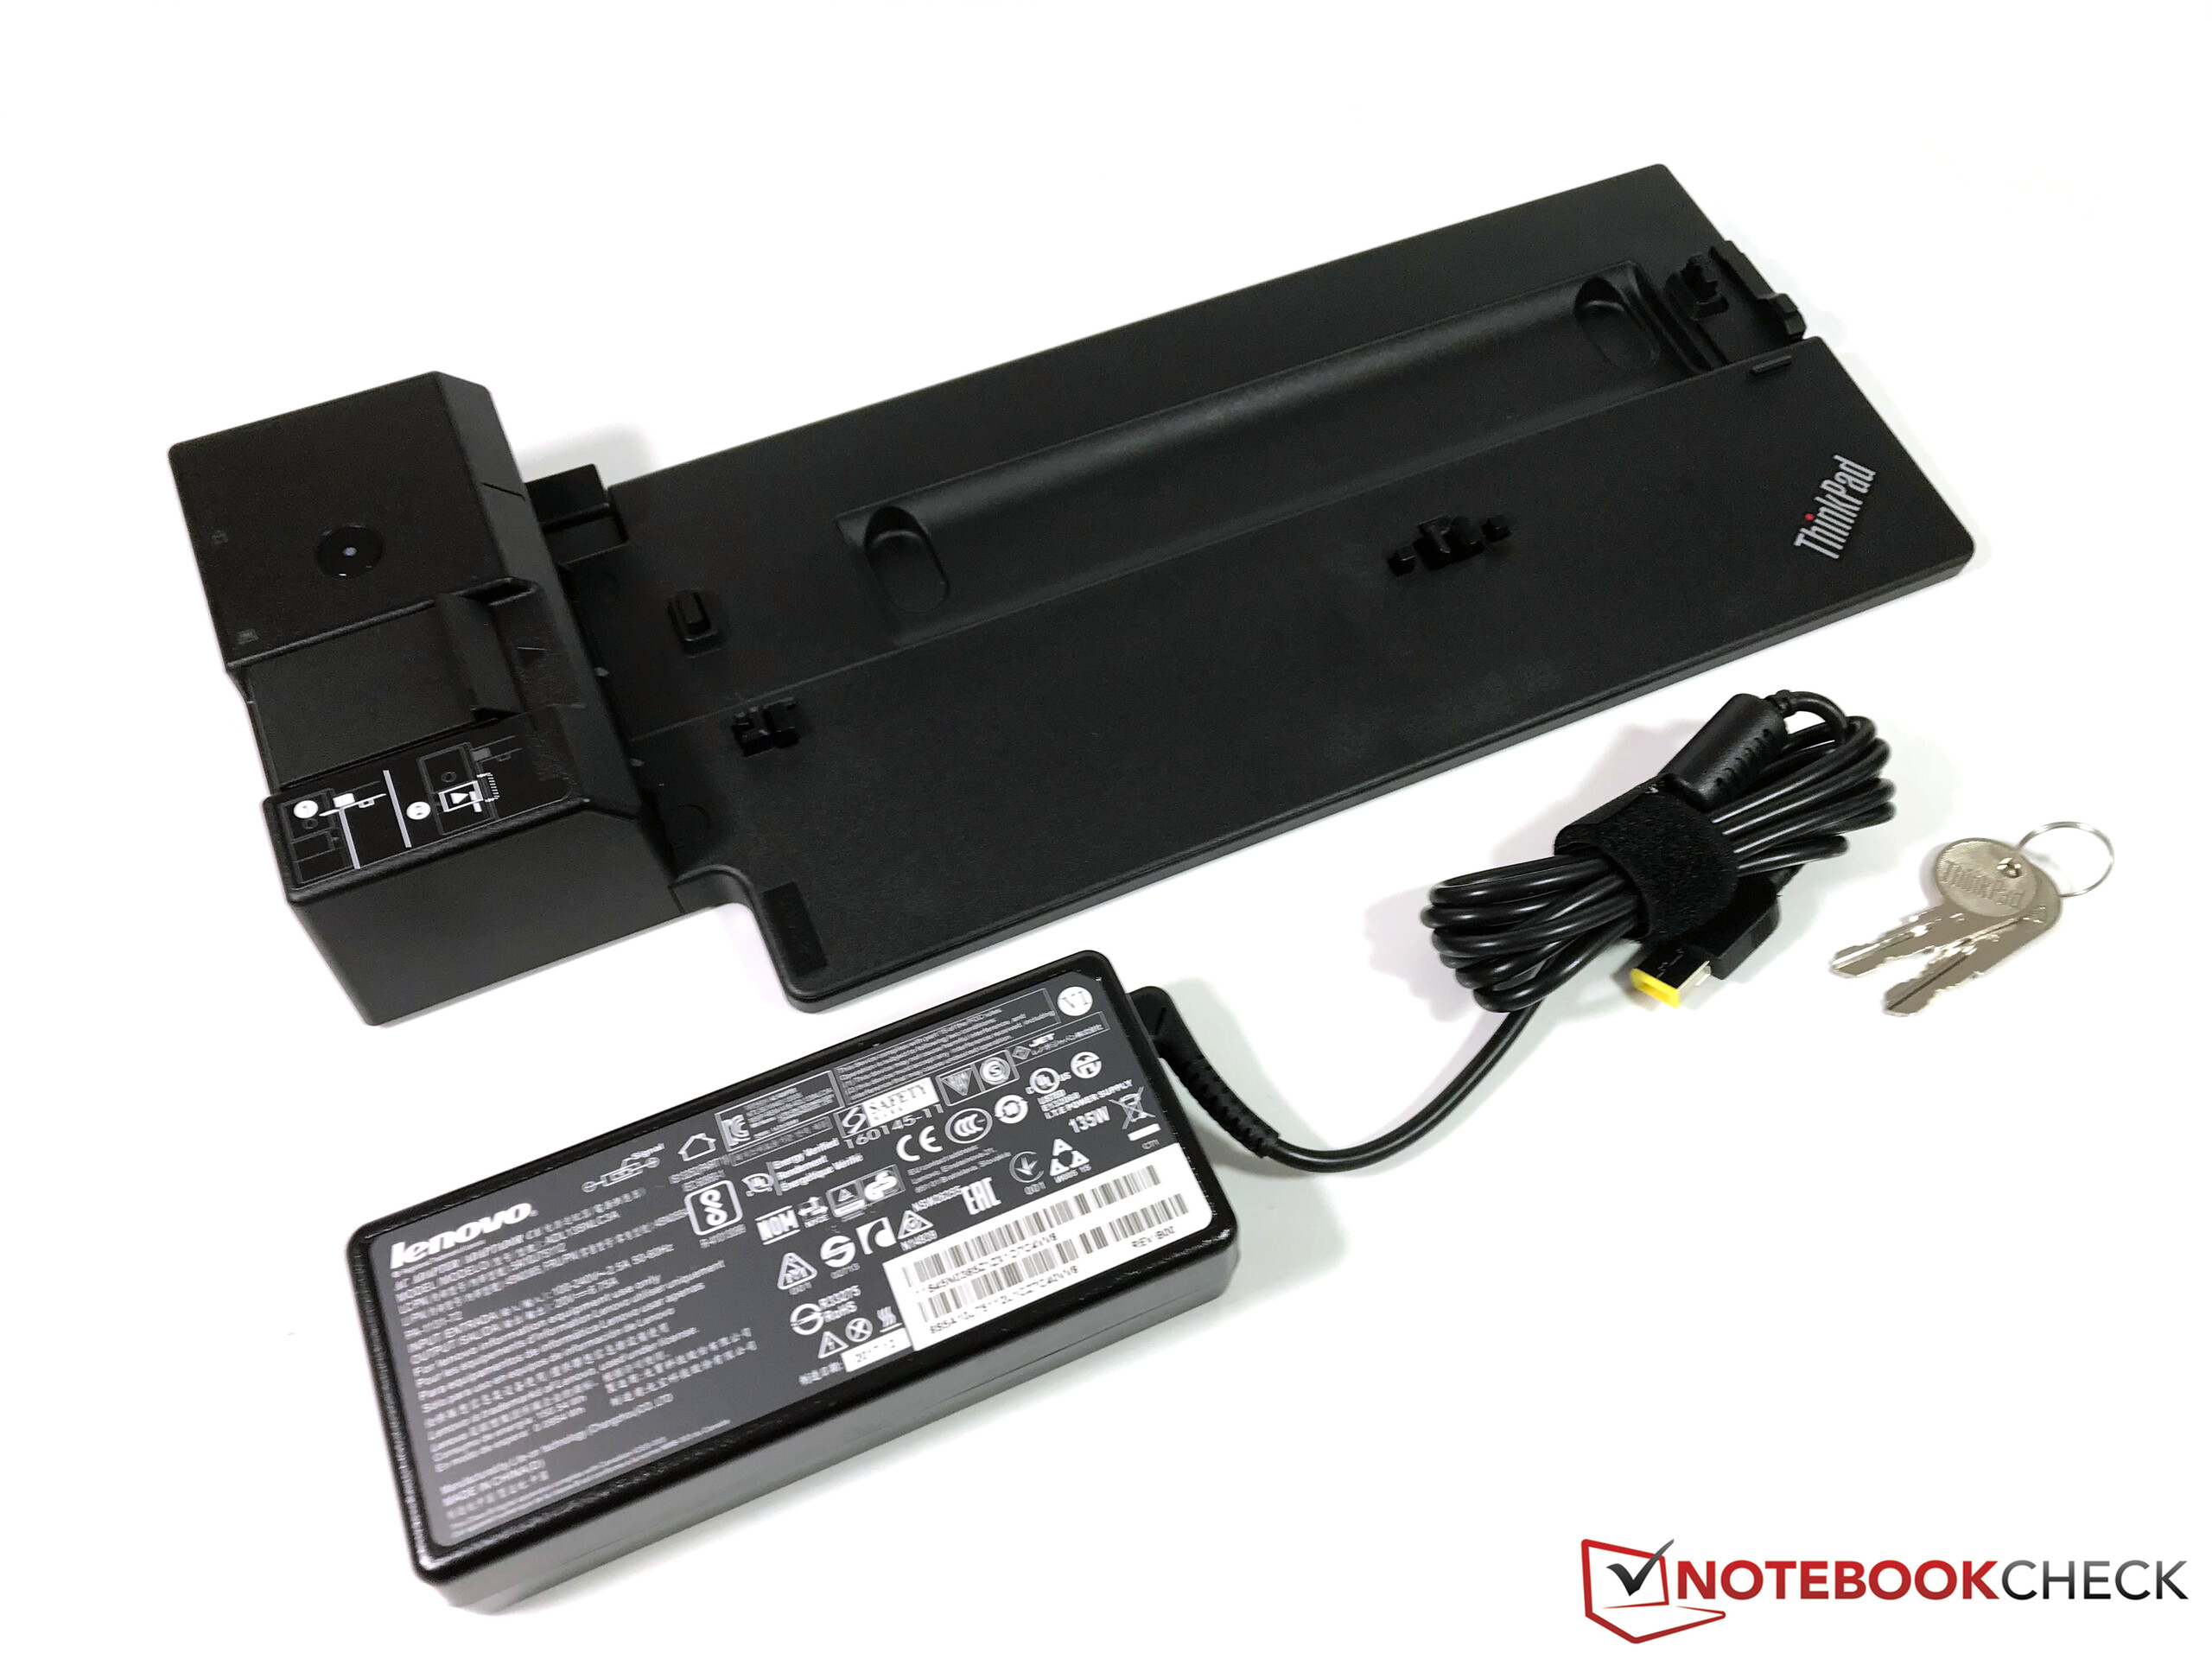
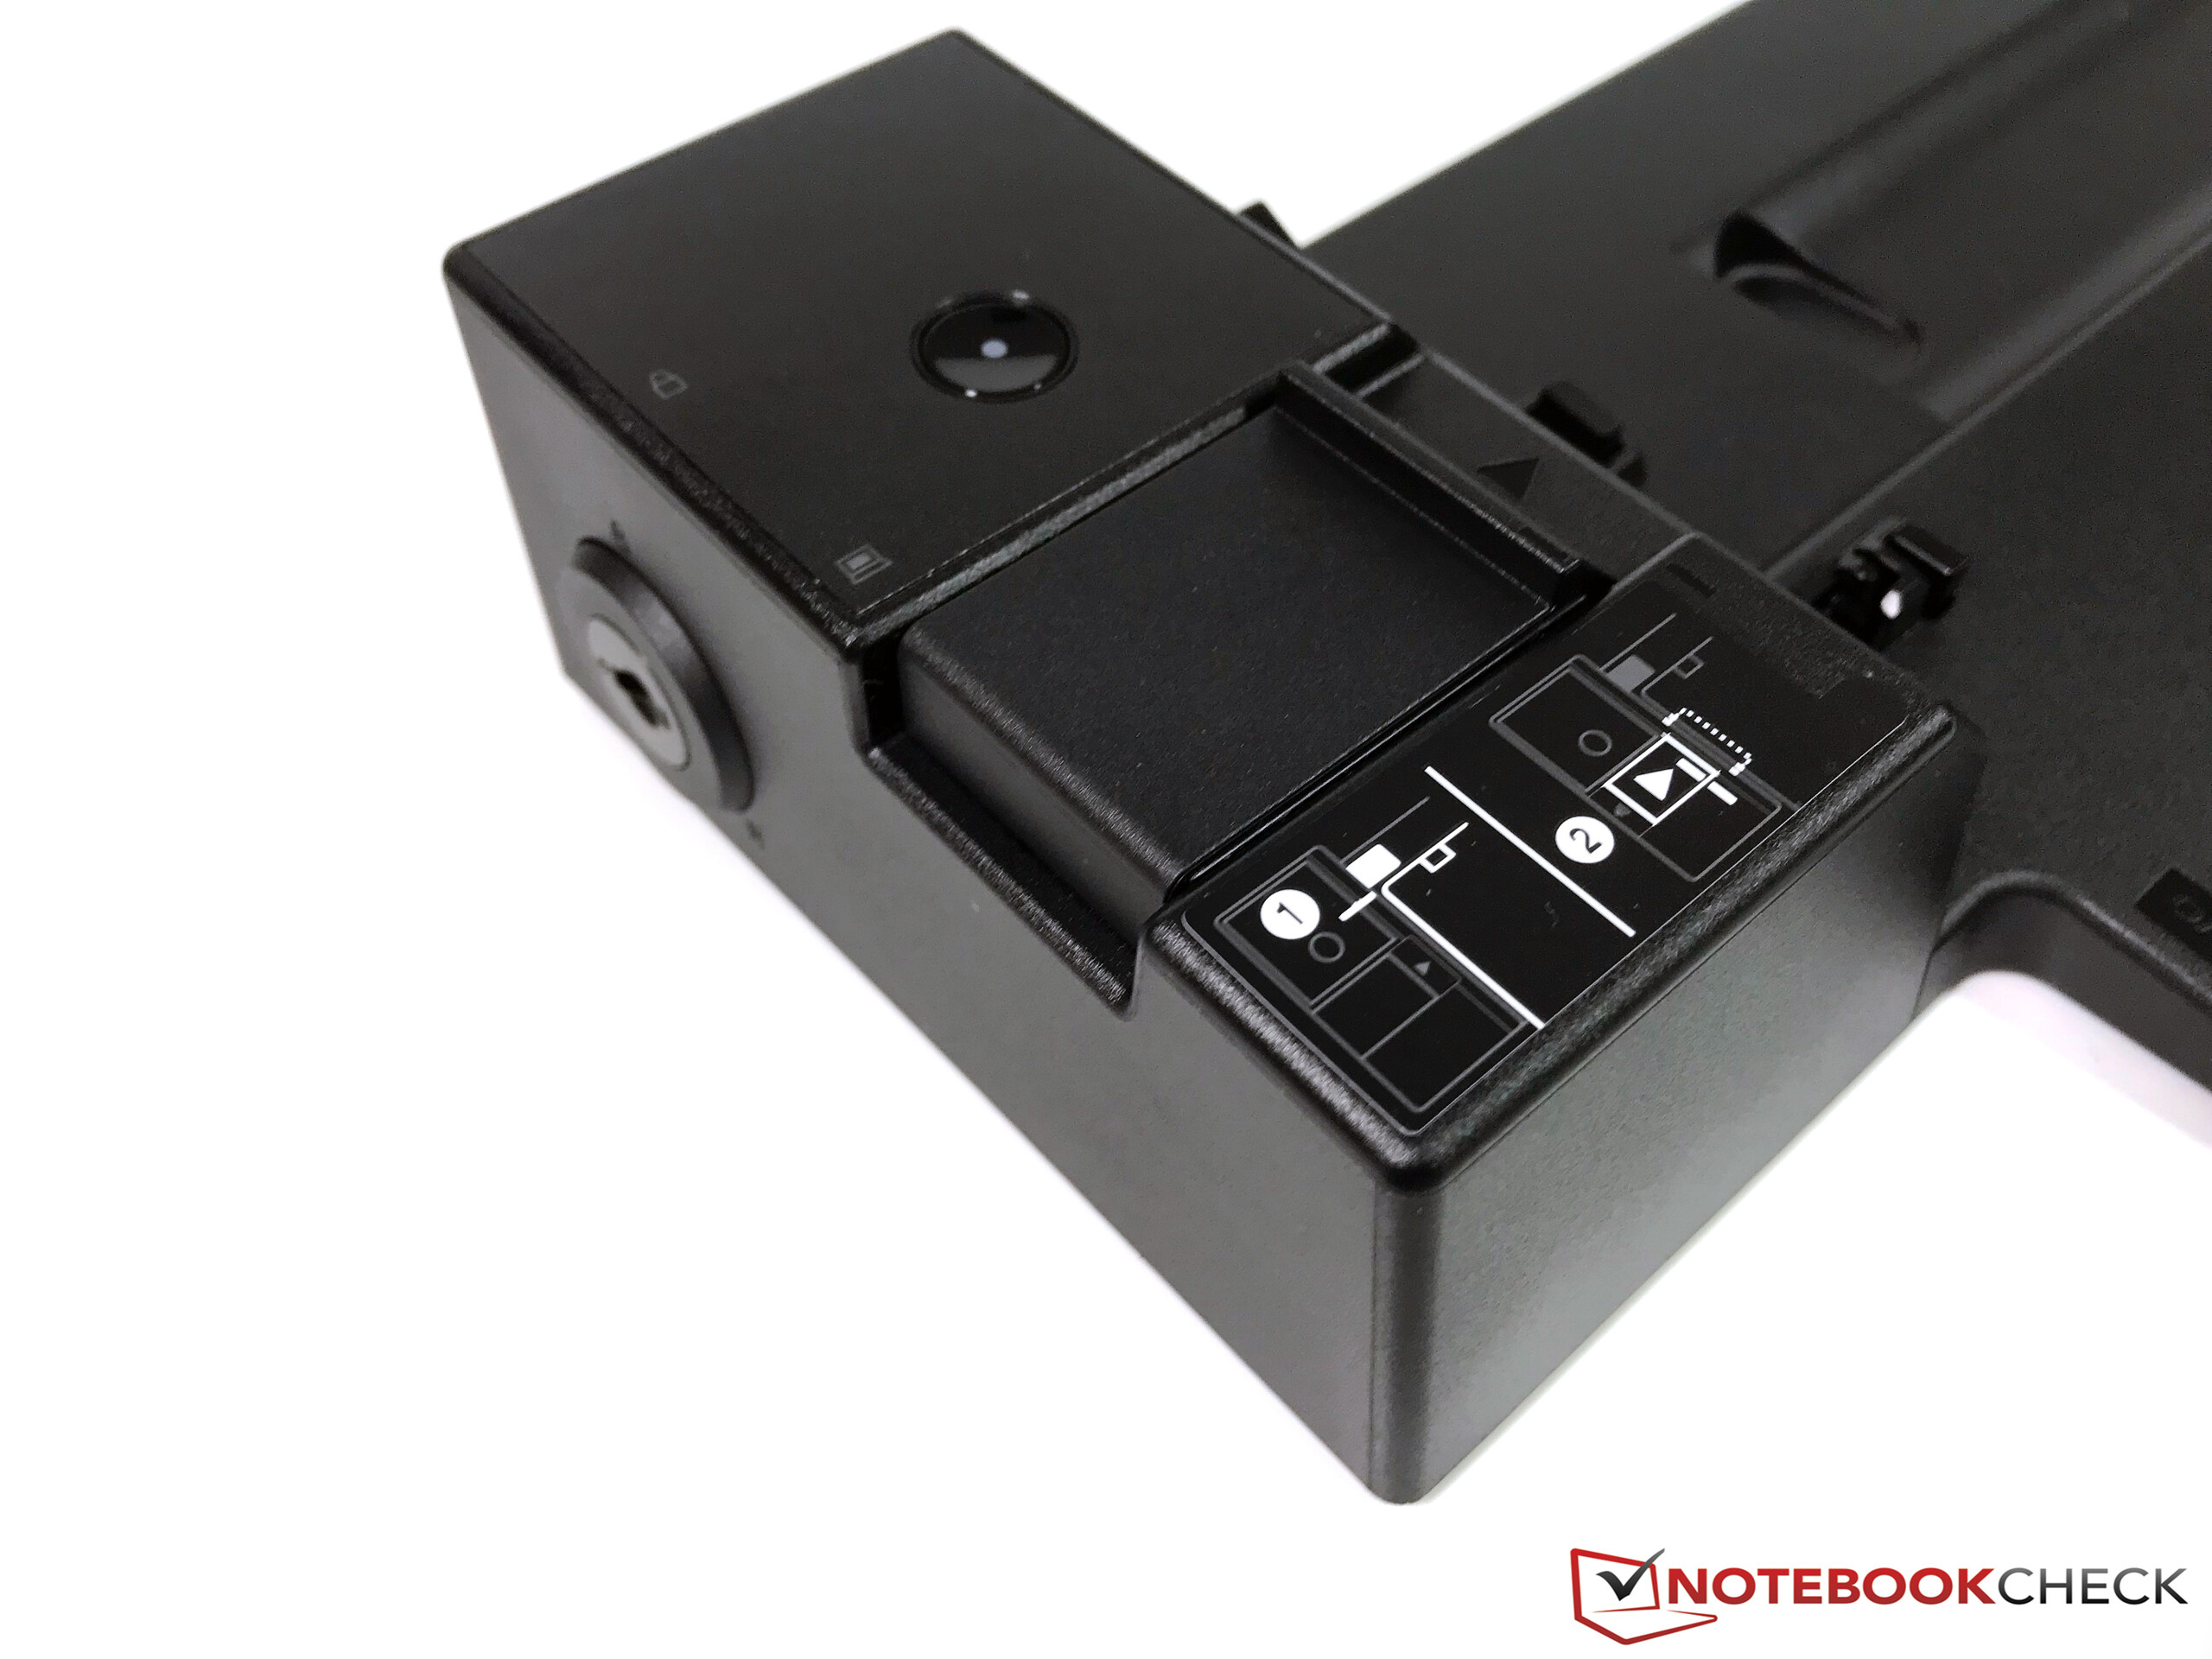
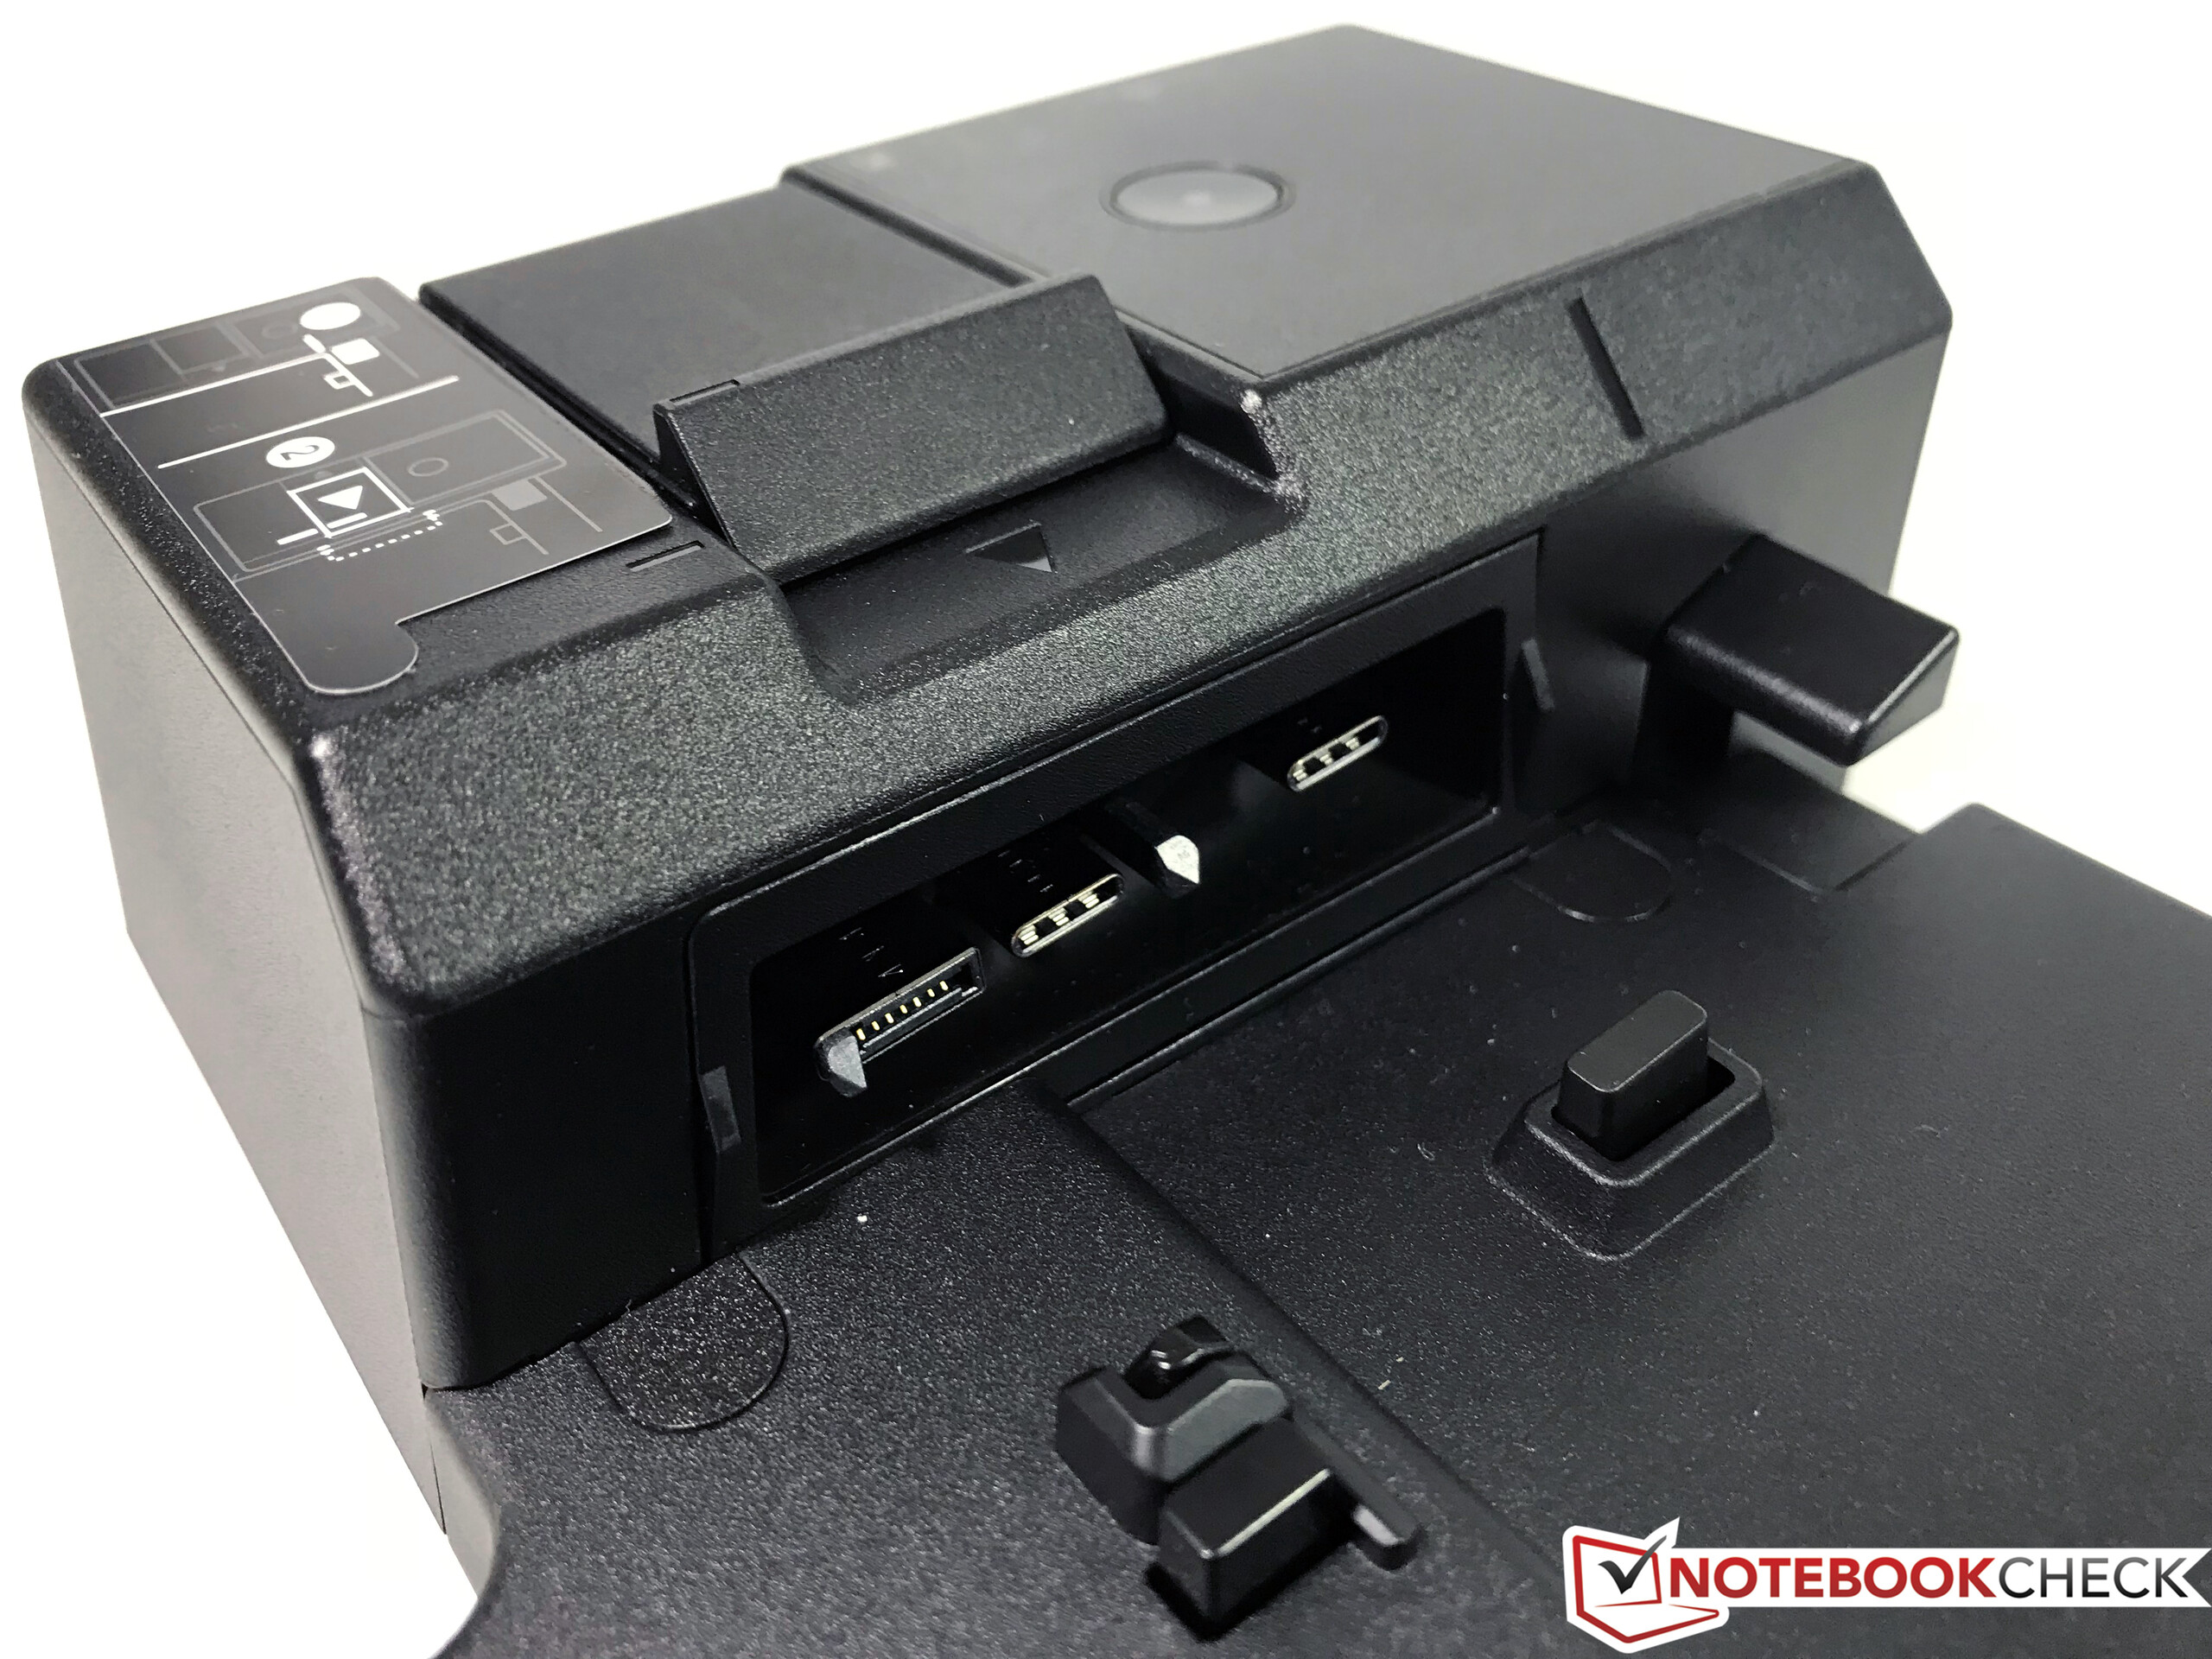
The 2017 ThinkPad X1 Carbon was already compatible with USB-C and Thunderbolt docking stations. Most 2018 ThinkPads are equipped with the new Side-Dock connector, which obviously means new docking stations as well. These new models are very similar to the old models, and we already had the chance to take a look at the new ThinkPad Ultra Docking Station, which is the most expensive option out of three new versions (Basic, Pro & Ultra) at a price of 320 Euros (~$397). You put your ThinkPad onto the docking station (hence the new indentations at the bottom) before you slide the connector from the docking station (via lever) into the ThinkPad.
The docking station features many ports (see pictures below) as well as a bigger indentation for models with protruding batteries. A ThinkPad P52s, which is currently in review as well, fits perfectly with its bigger secondary battery. You get two keys to lock the docking station, which is already familiar from the old models. The Ultra docking station is shipped with a 135 W power adapter (SlimTip).
Last year's USB-C and Thunderbolt 3 docking stations are obviously still compatible.

Maintenance
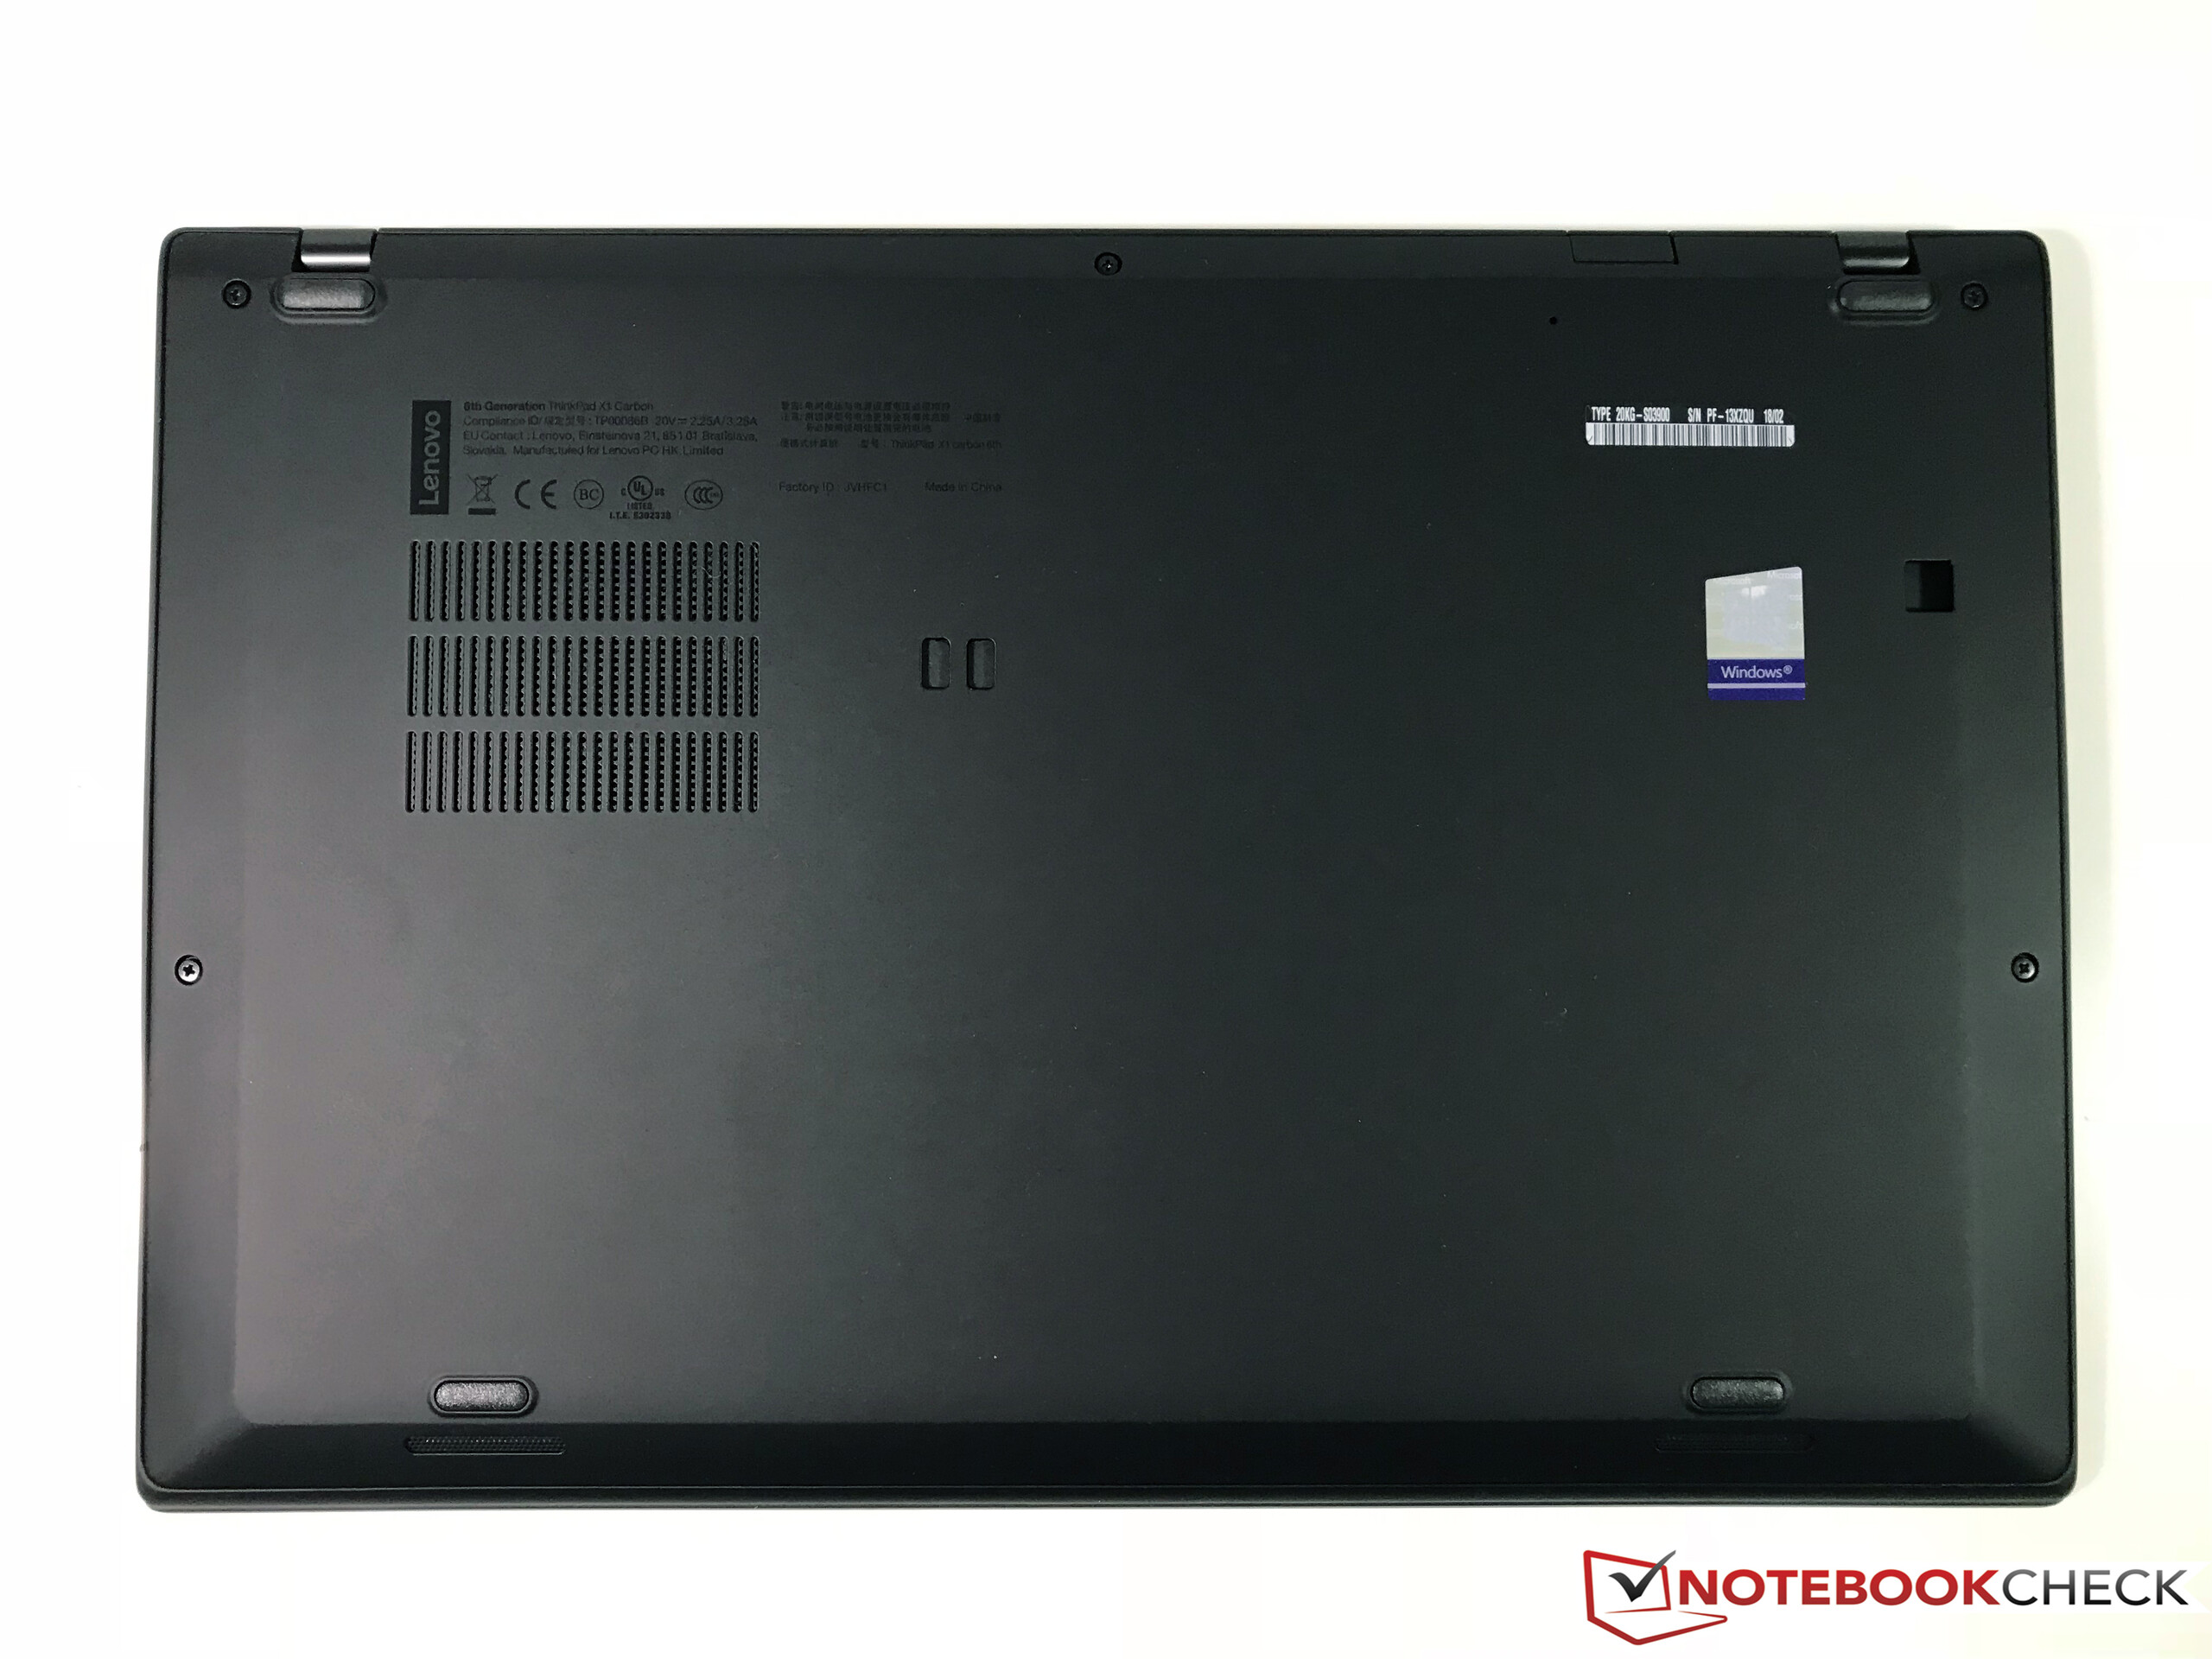
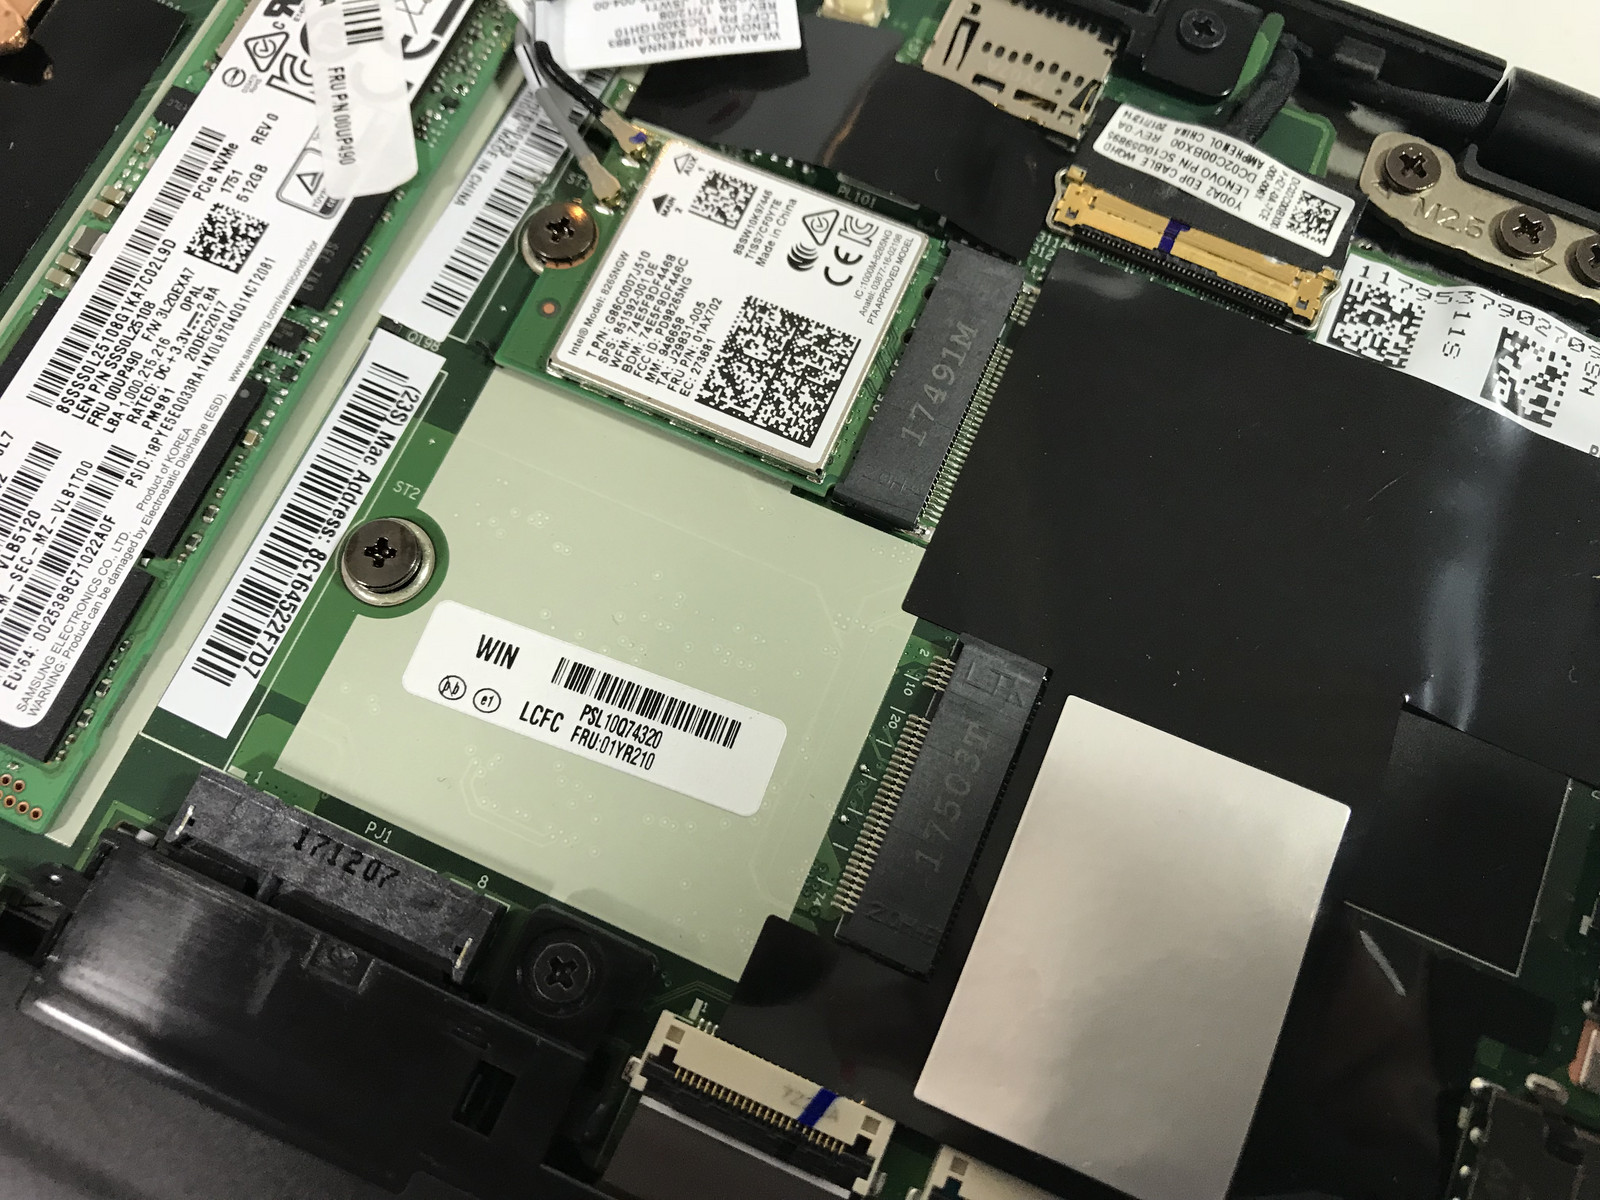
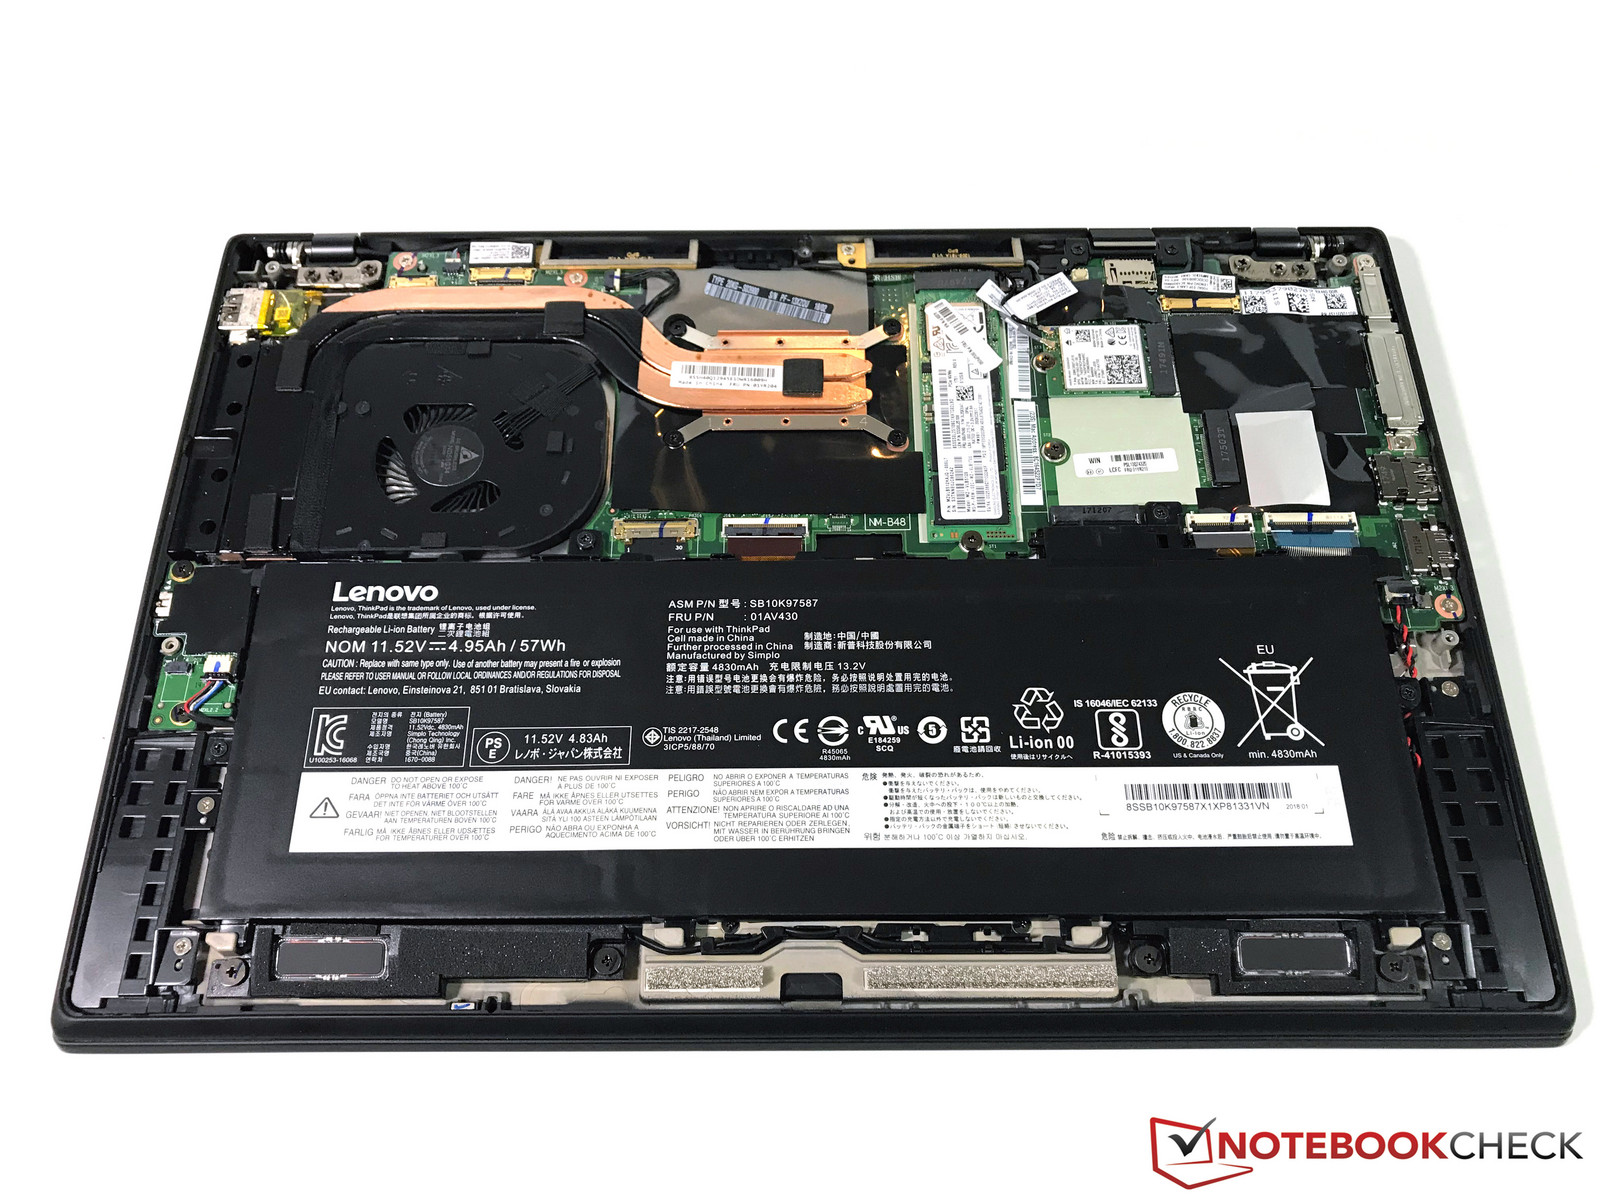
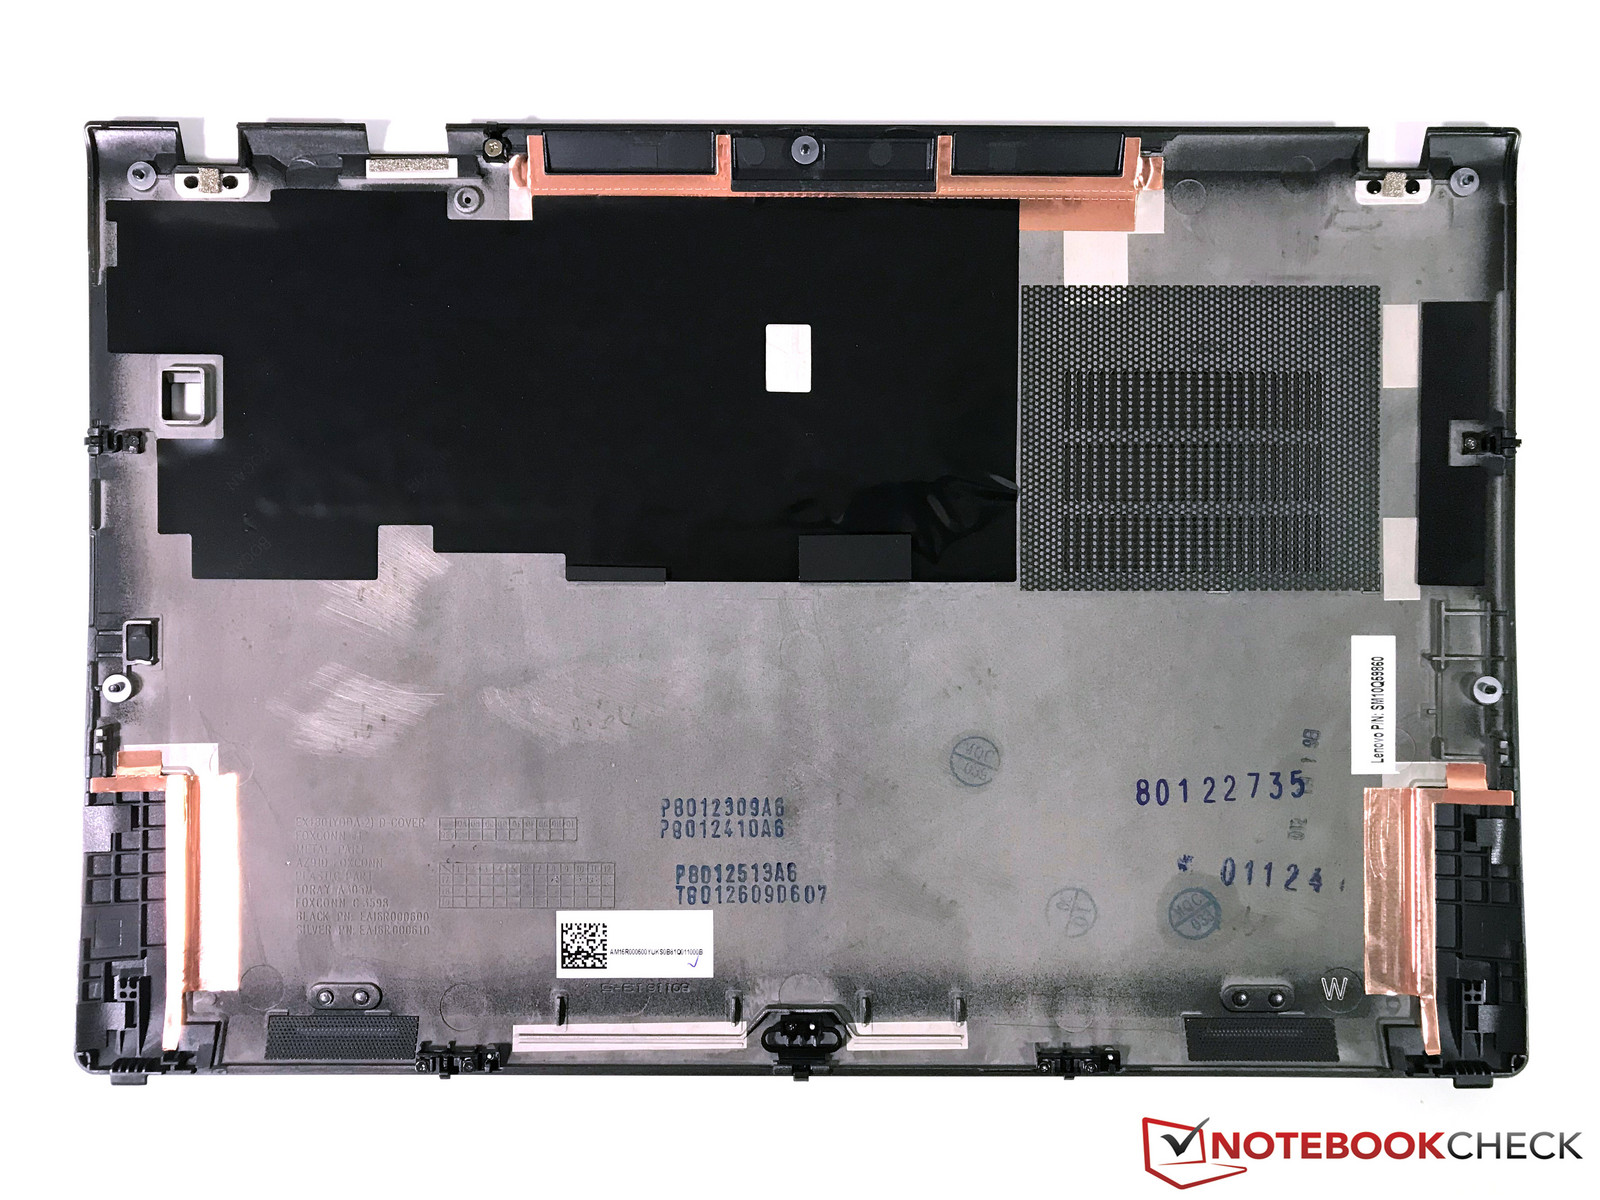
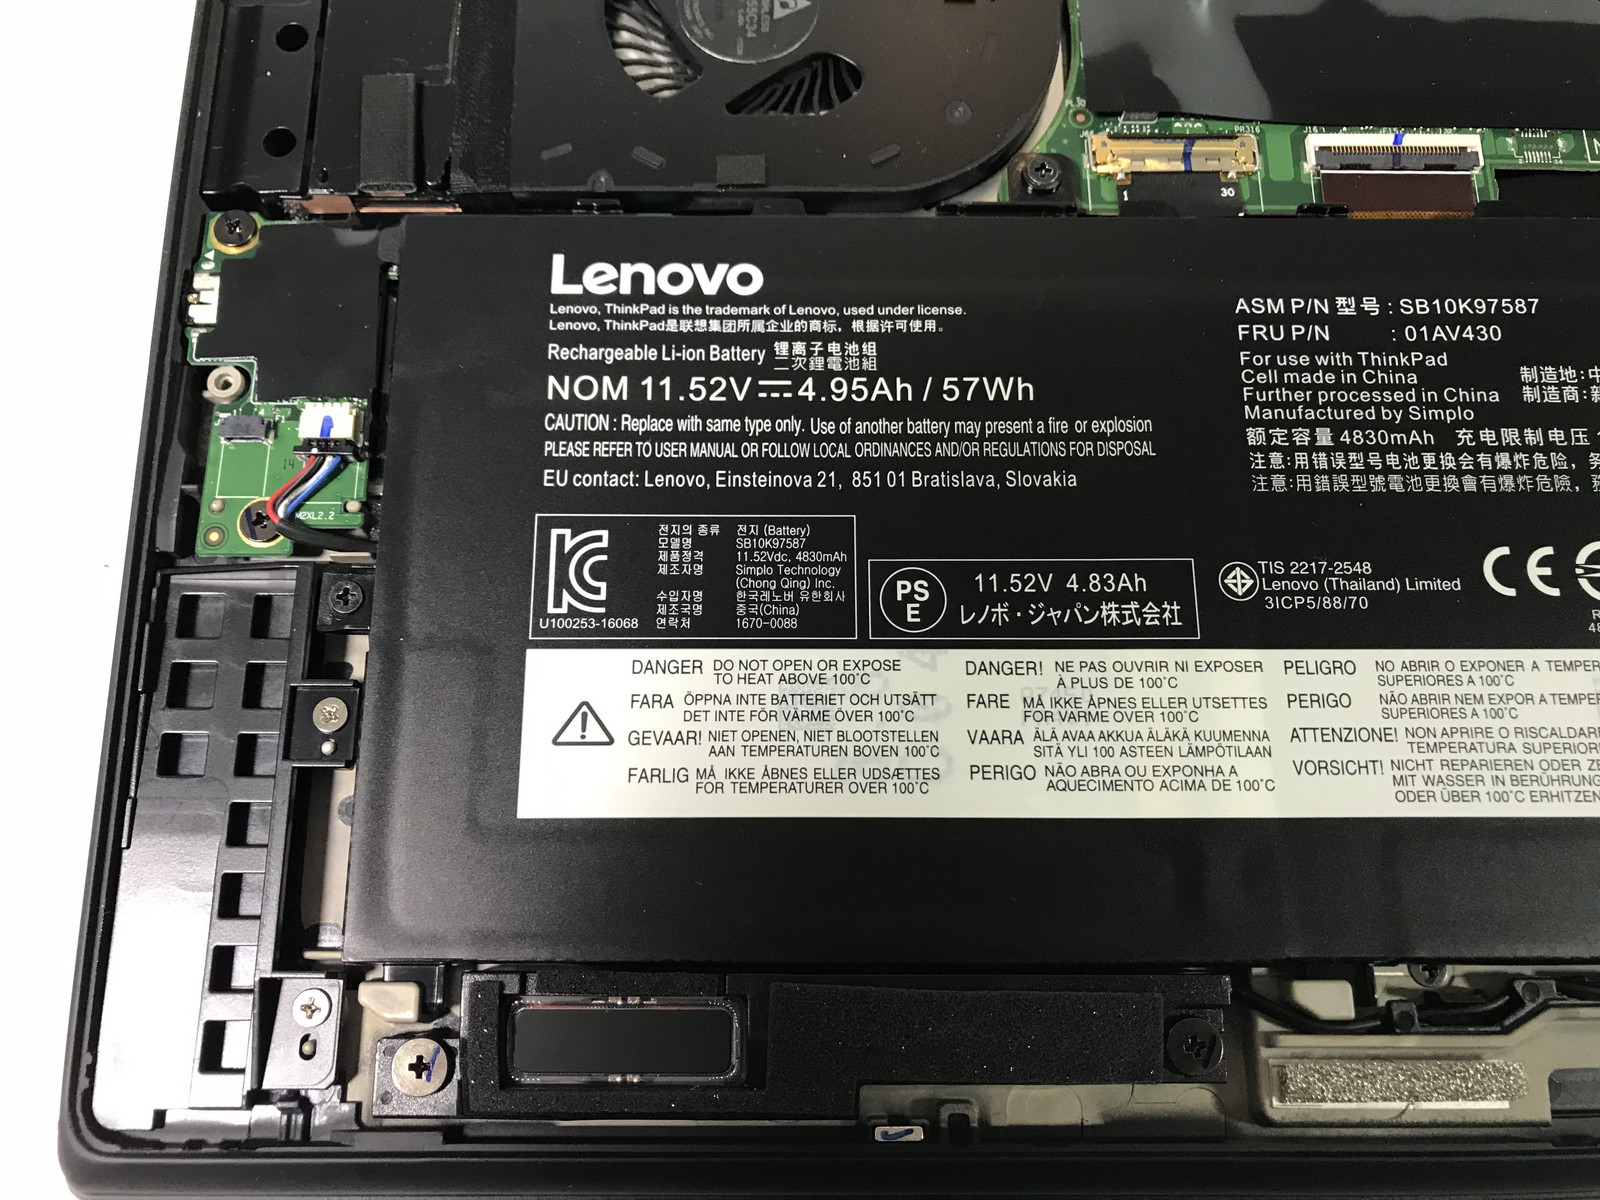
As with its predecessor, the X1 Carbon's bottom case can be easily removed with a small crosshead screwdriver. Loosening the screws is enough to allow the bottom case to be removed; there is no need to completely unscrew them. Keep in mind though that there are only a few modular components. The M.2-2280 SSD, Wi-Fi module, battery and fan are the only components that can be individually removed as everything else is soldered to the motherboard. The WWAN module can also be removed in variants that it is included in.
Warranty
Lenovo ships the ThinkPad X1 Carbon with a three-year warranty including an on-site service. The battery on the other hand is only covered for 12 months. Both the scope and time of the warranty can be extended during the purchase or afterwards (up to five years).
Please see our Guarantees, Return Policies and Warranties FAQ for country-specific information.
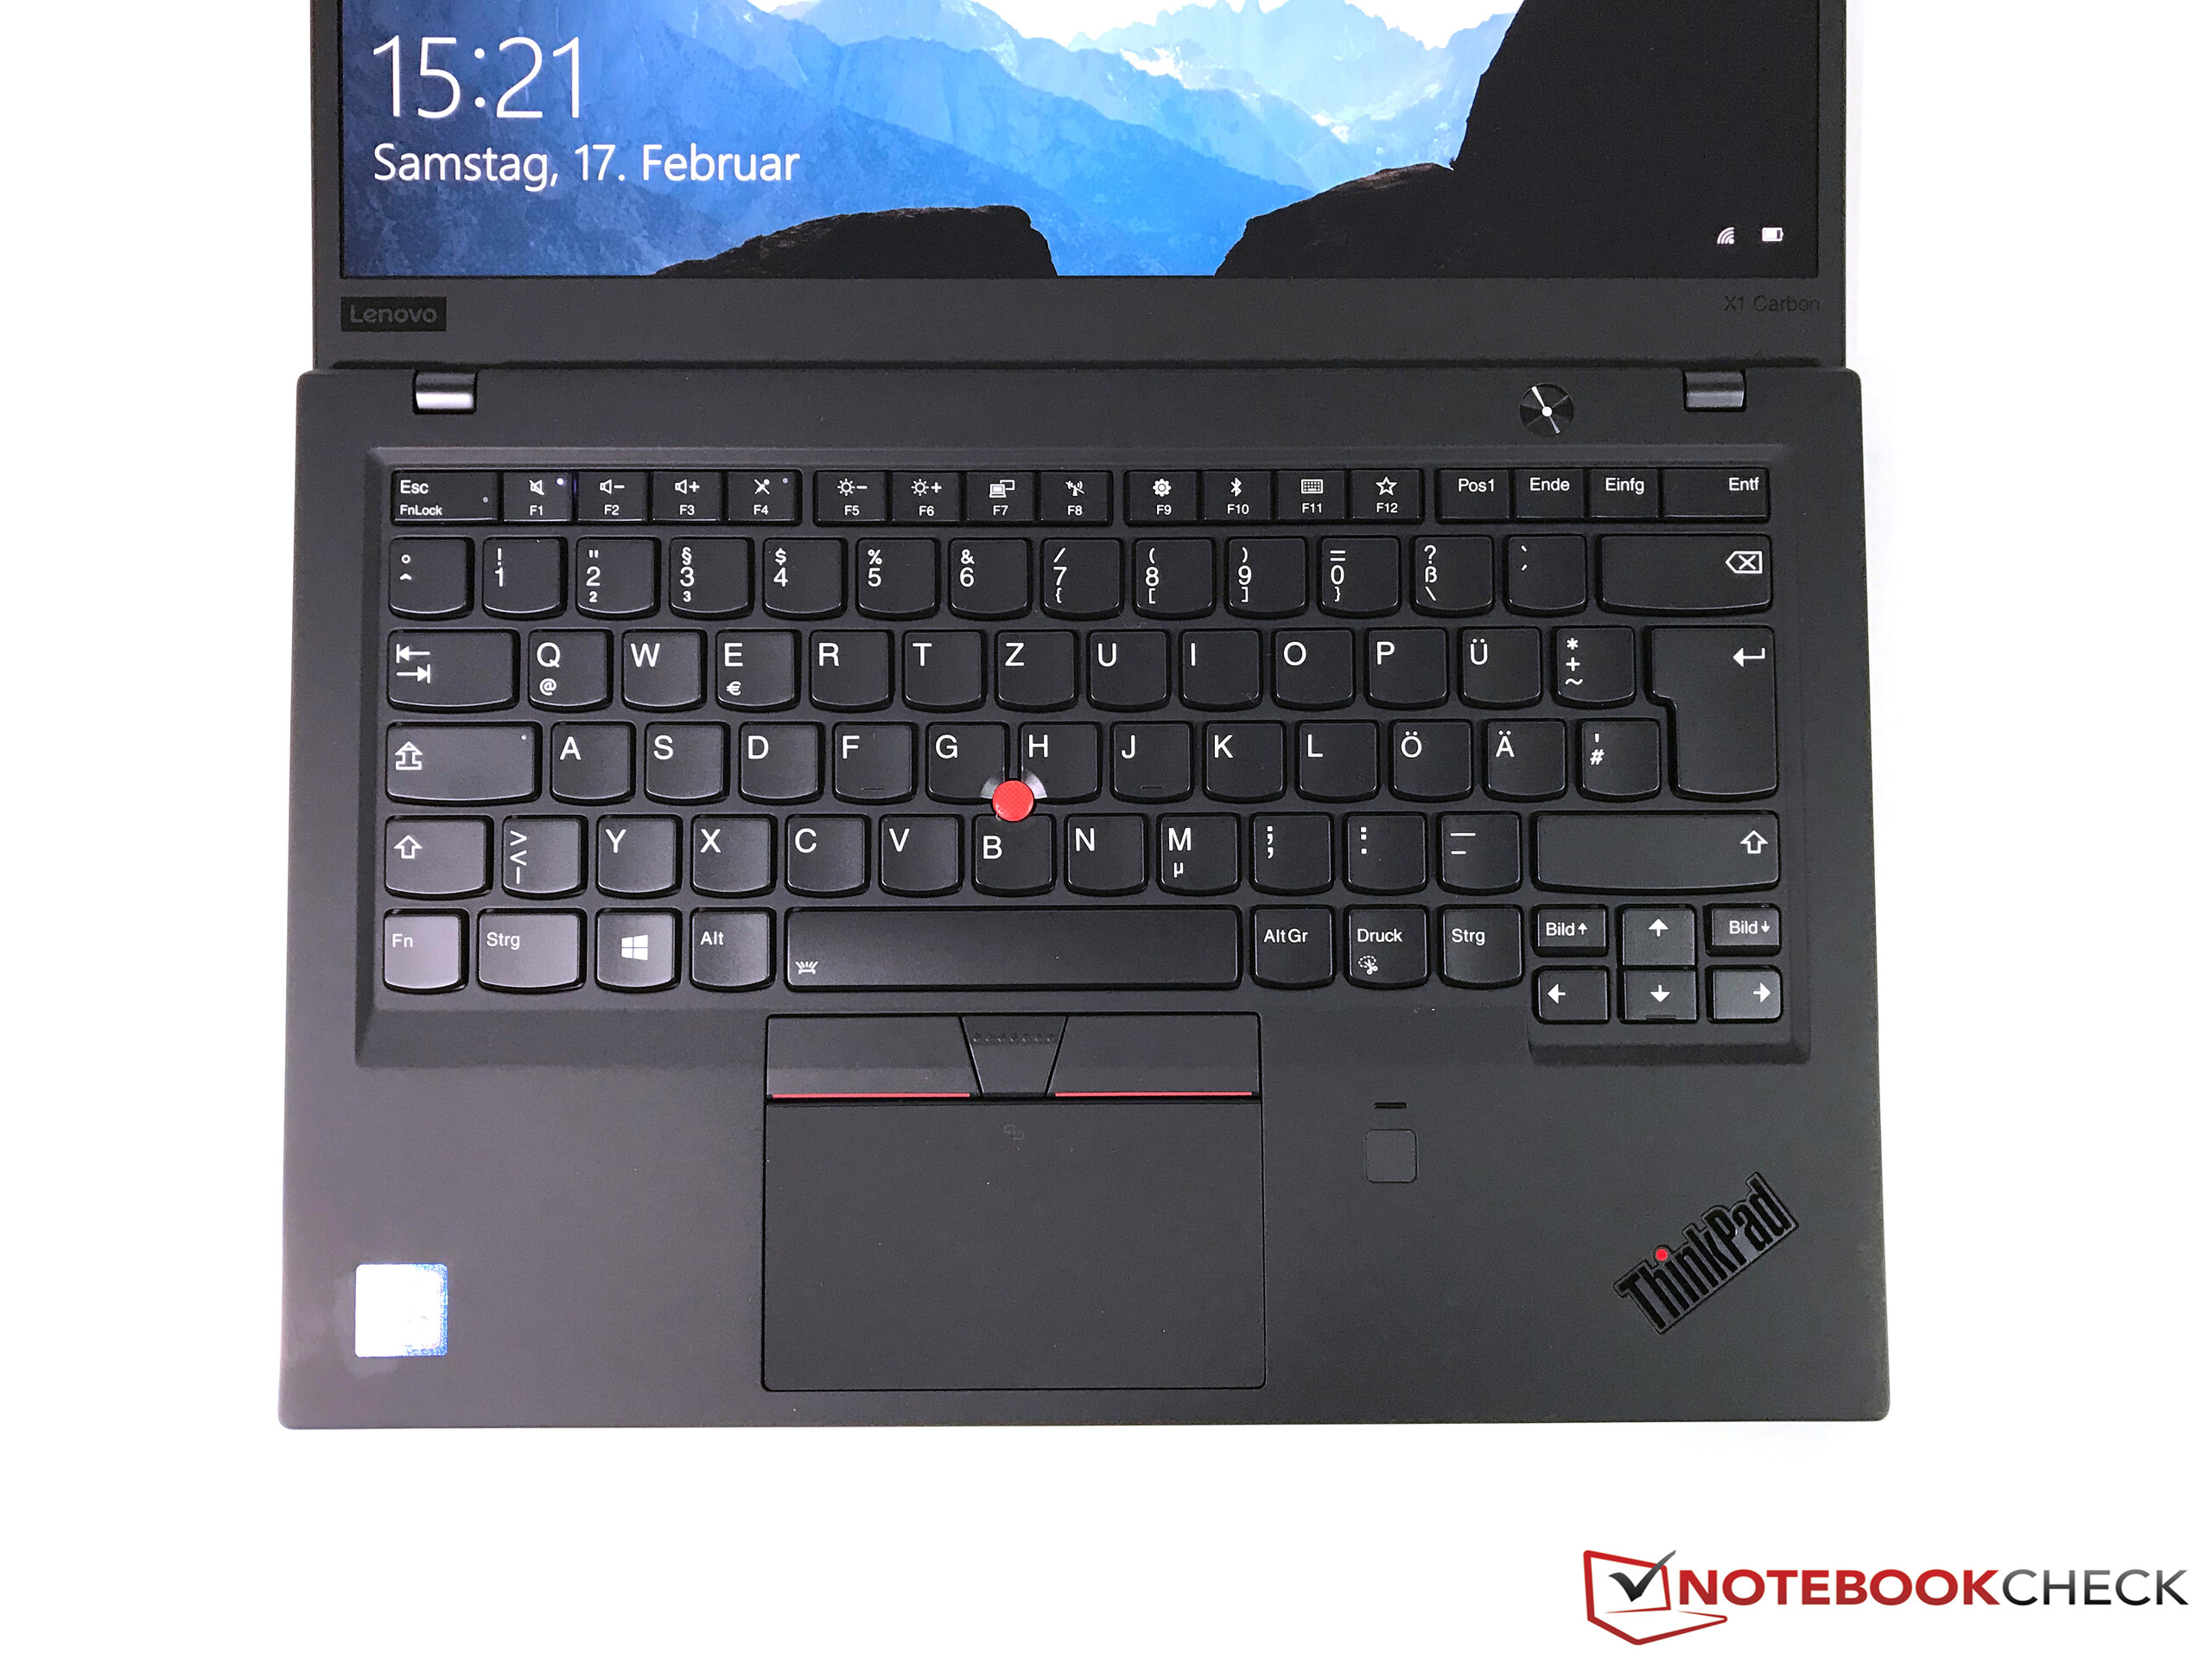
Input Devices – Still the benchmark
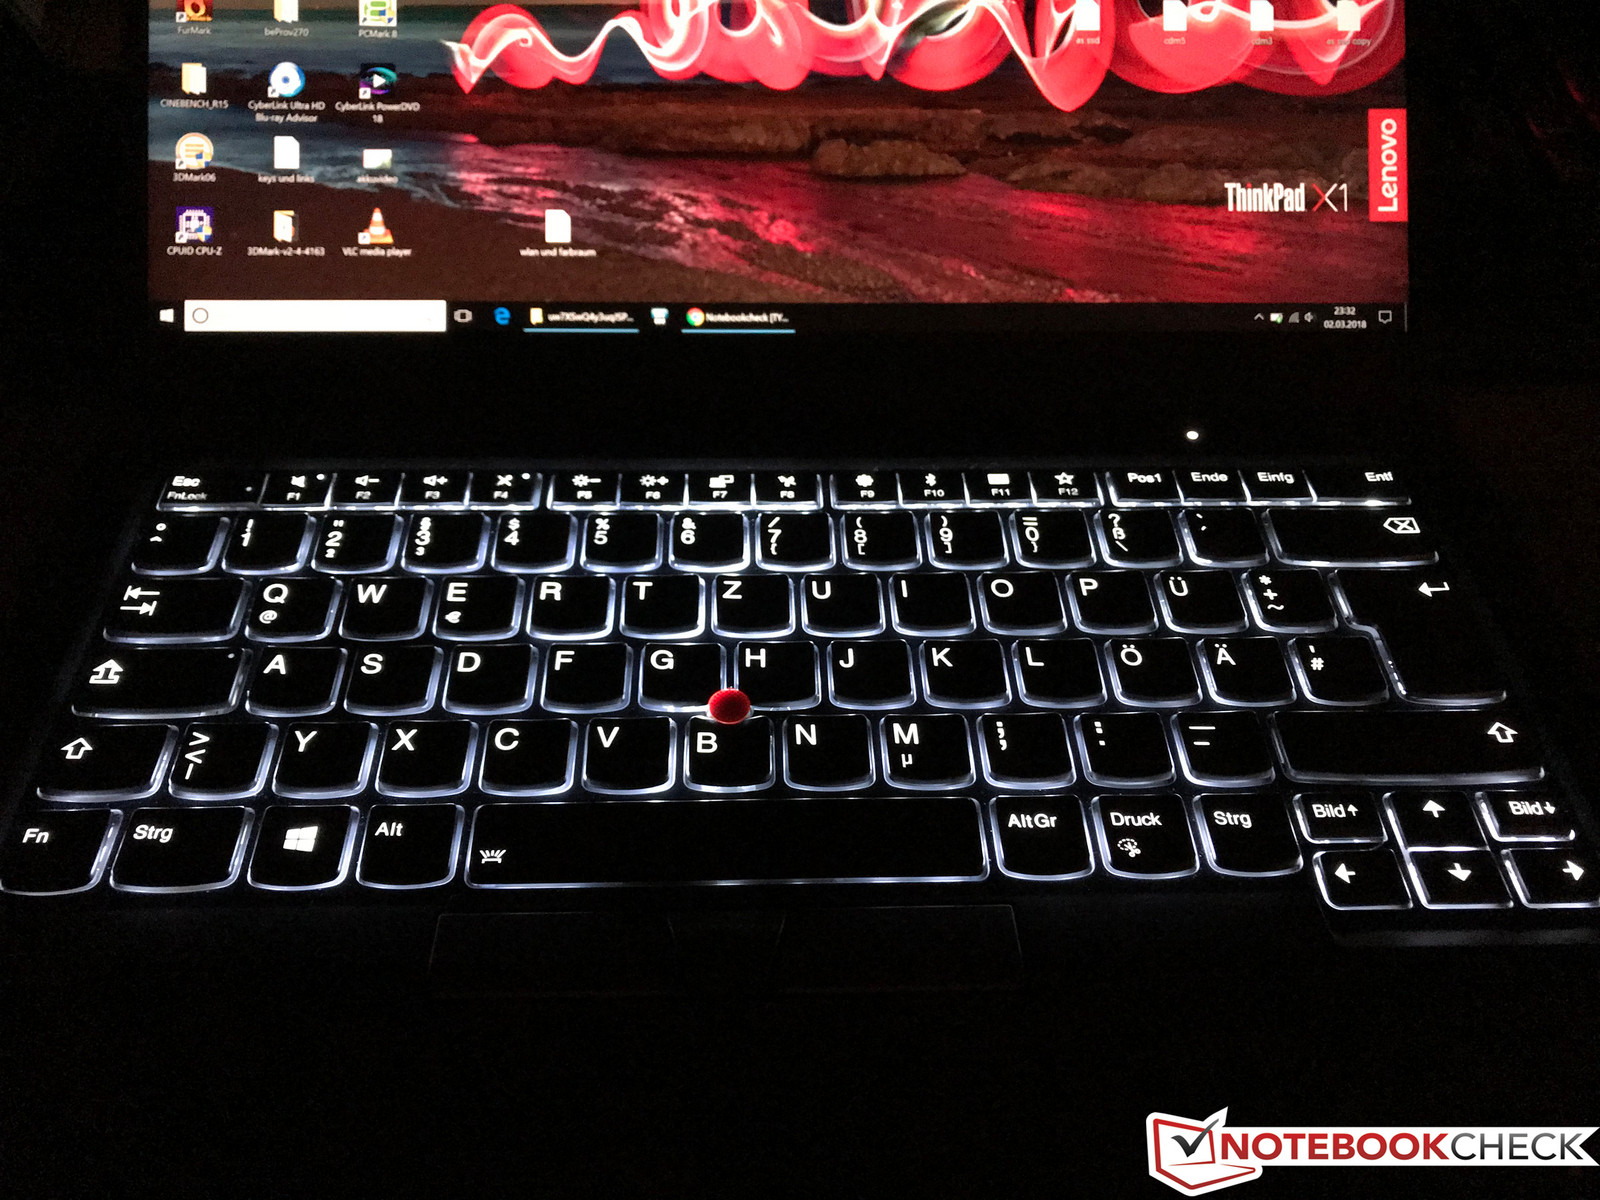
Keyboard
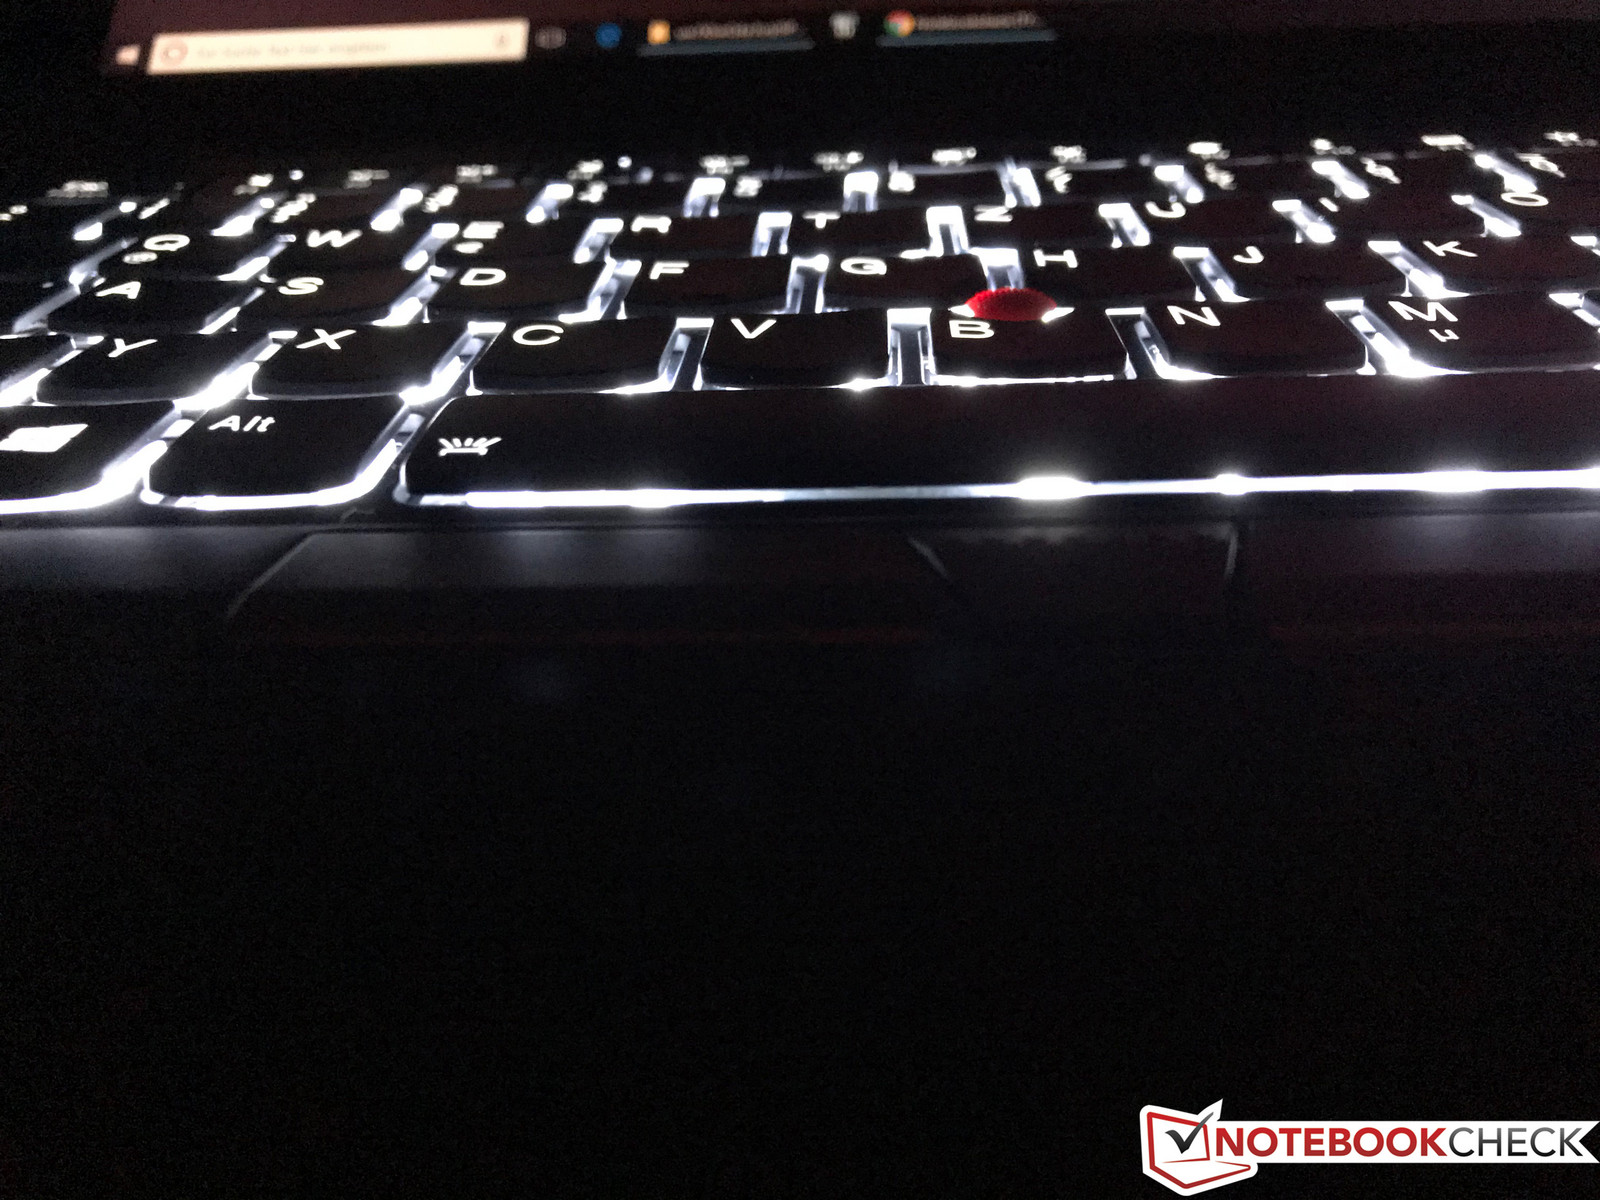
Lenovo did not change the keyboard of the X1 Carbon, but this is no problem. You can once again enjoy a very rich and mechanical feedback, and the keys offer sufficient travel despite the slim chassis. This raises the question why many other manufacturers cannot seem to implement decent keyboards into slim devices.
However, even the keyboard of the ThinkPad X1 Carbon is not perfect. The white background illumination could be a bit brighter or have a third setting, and it can also dazzle a bit from very flat viewing angles. A brightness sensor that automatically adjusts the intensity would be nice as well. Still, these are minor flaws, because you won't find a better keyboard in a slim laptop at the moment.
Touchpad/TrackPoint
The touchpad with its glass surface did not change, either. The gliding capabilities are very good, but the surface is not very big at 10 x 5.8 cm. This is a result of the additional mouse buttons for the TrackPoint, which sits between the keys B, G, and H. Both methods allow precise control of the cursor.
Please have a look at our review of the X1 Carbon 2017 for more detailed information on the input devices.
Display - WQHD with Dolby Vision HDR
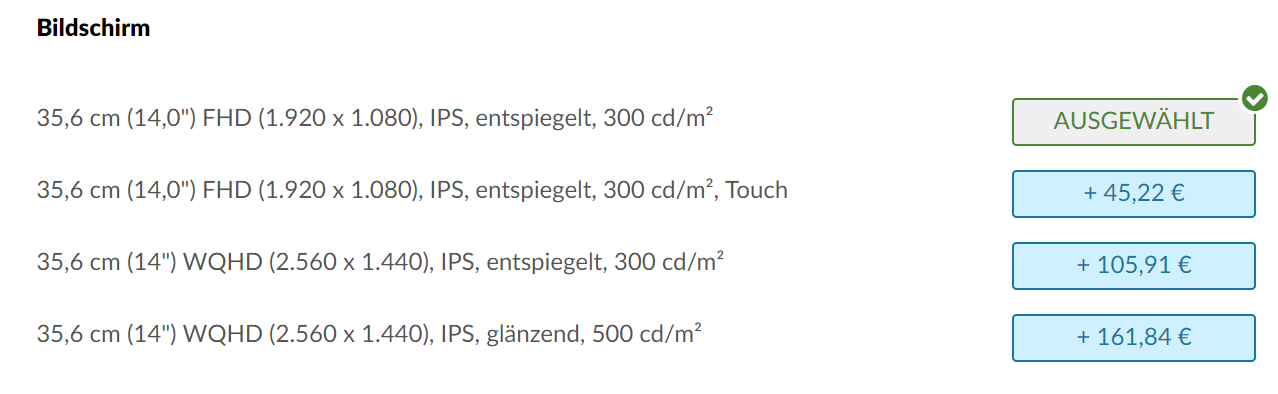
This year, Lenovo is upgrading its displays, the highlight of which is clearly the WQHD HDR panel in our test device. Improving upon last year where we had to wait a few months for the higher resolution display variant, this year Lenovo have made all four of the X1 Carbon display variants available from the outset. The base display is a Full HD matte panel with 300 cd/m² brightness. A 45-Euro (~$55) surcharge gives you a touchscreen while a WQHD 300 cd/m² matte panel costs an additional 106 Euros (~$131) from the base model. We were impressed with the cost of adding a WQHD HDR panel though. A 162-Euro (~$201) surcharge over the standard FHD screen is very reasonable in our opinion given the additional technical complexities that go into making a WQHD HDR panel.
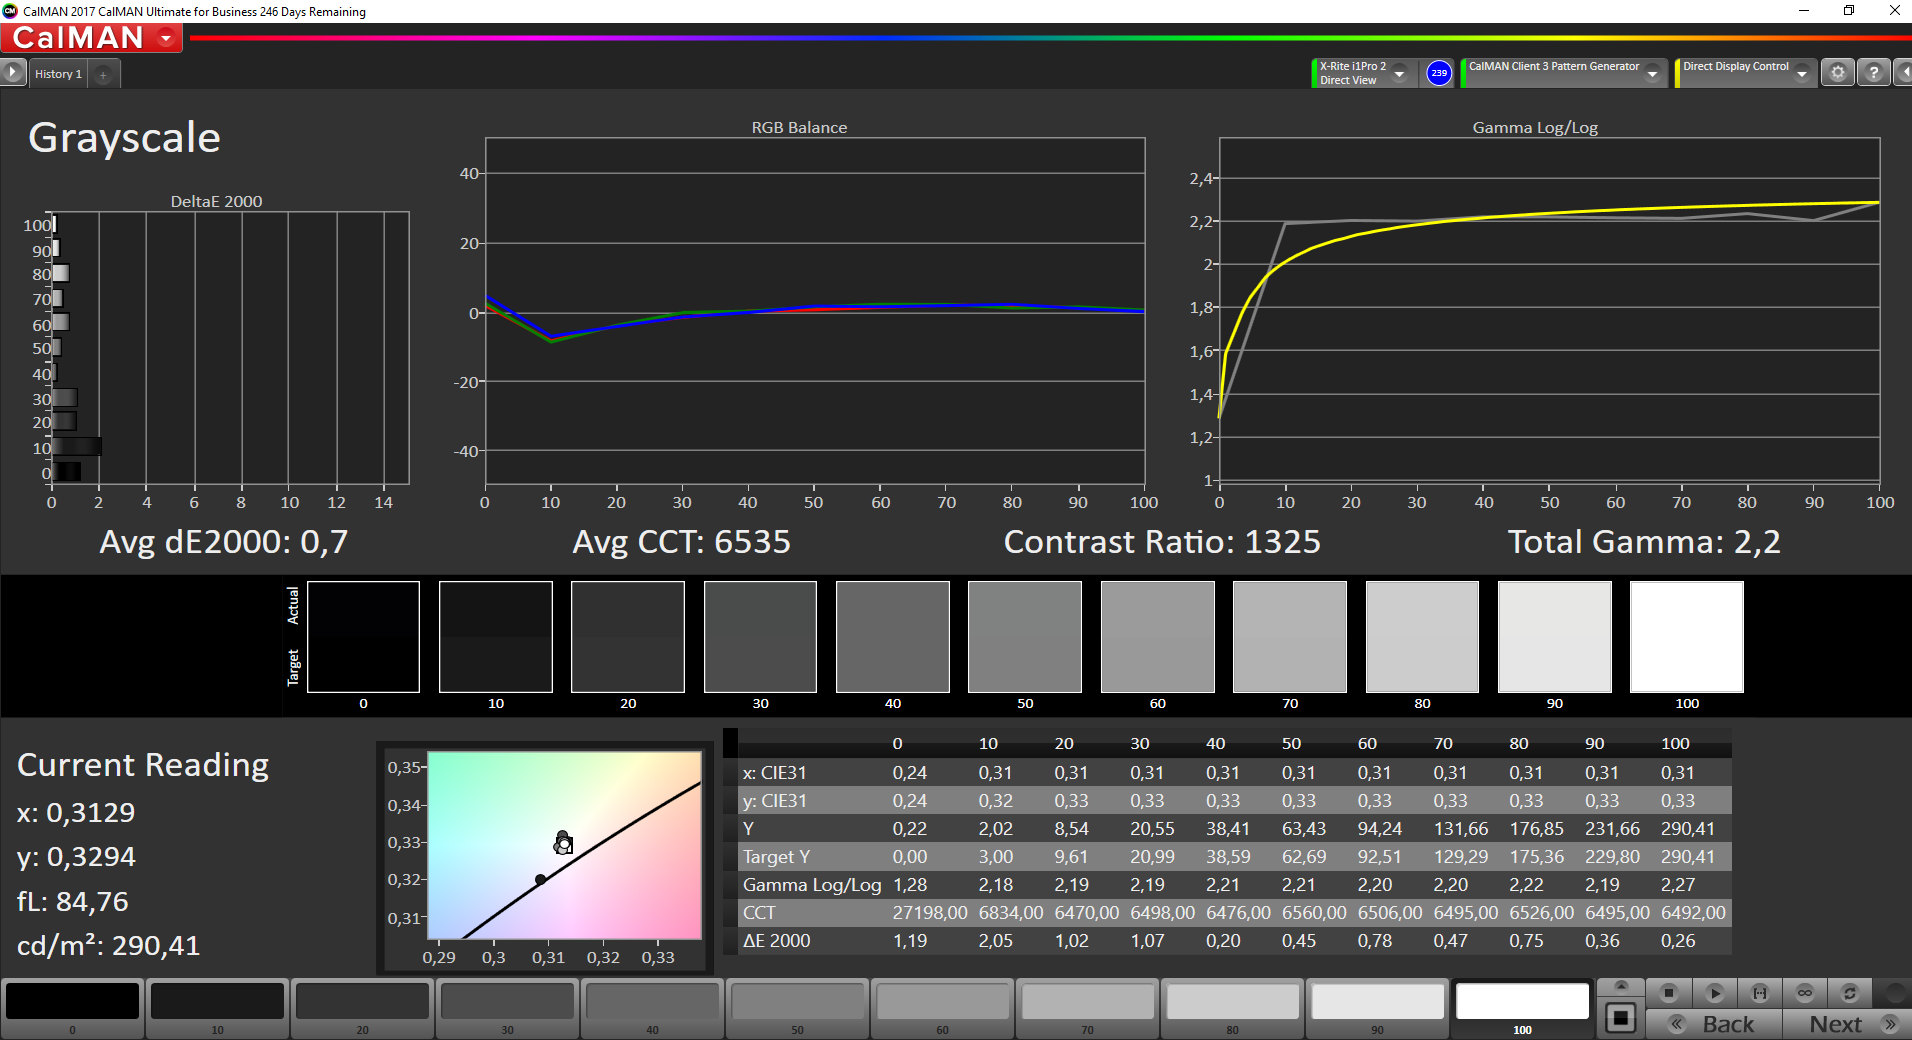
There is one trade off with the WQHD HDR panel though, which is that it has a glossy rather than matte finish. There are alternatives if you are not a fan of glossy displays, but you would be missing out on a great panel. Our initial impression of the AUO B140QAN02.0 panel is that it makes for an excellent display. Images are sharp and colors are great; finally, there is a high-quality panel in a relatively small form factor laptop from Lenovo. The resolution is 2560x1440, which combined with the 14-inch screen size yields a pixel density of 210 PPI. Our initial tests disproved our initial skepticism at the advertised 500 cd/m² brightness level as we measured a maximum value of 578 cd/m² with a still excellent average of 532 cd/m². This average is mainly reduced by the darker upper-right corner, which while being noticeable, is not of any great concern.
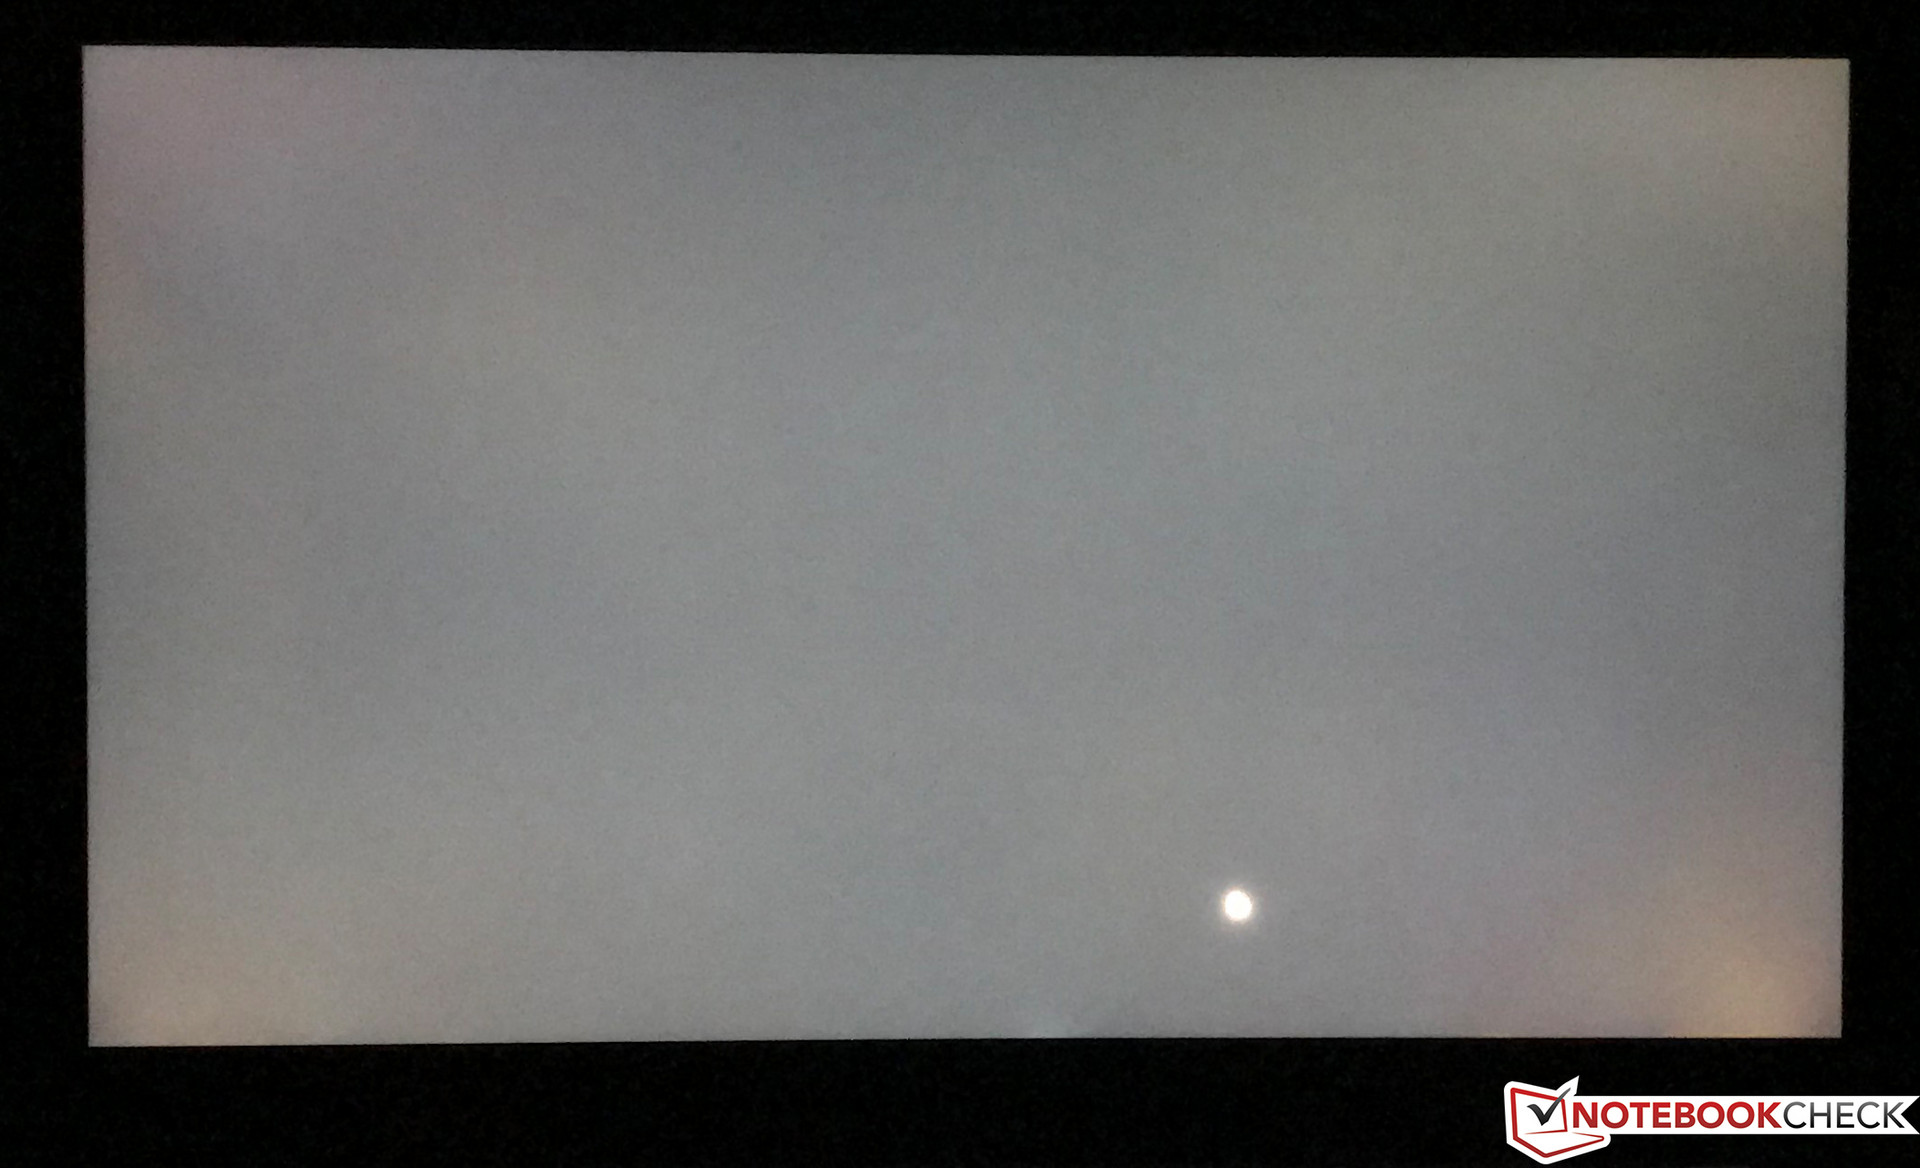
Despite the high brightness the black level is 0.38, which yields a very good contrast ratio of greater than 1,500:1. Even with a completely black image at the highest brightness there are still only minimal bright spots at the bottom of the screen, something which is not a problem in daily use. Another positive of the WQHD HDR display is that there is absolutely no PWM.
| |||||||||||||||||||||||||
Brightness Distribution: 84 %
Center on Battery: 579 cd/m²
Contrast: 1521:1 (Black: 0.38 cd/m²)
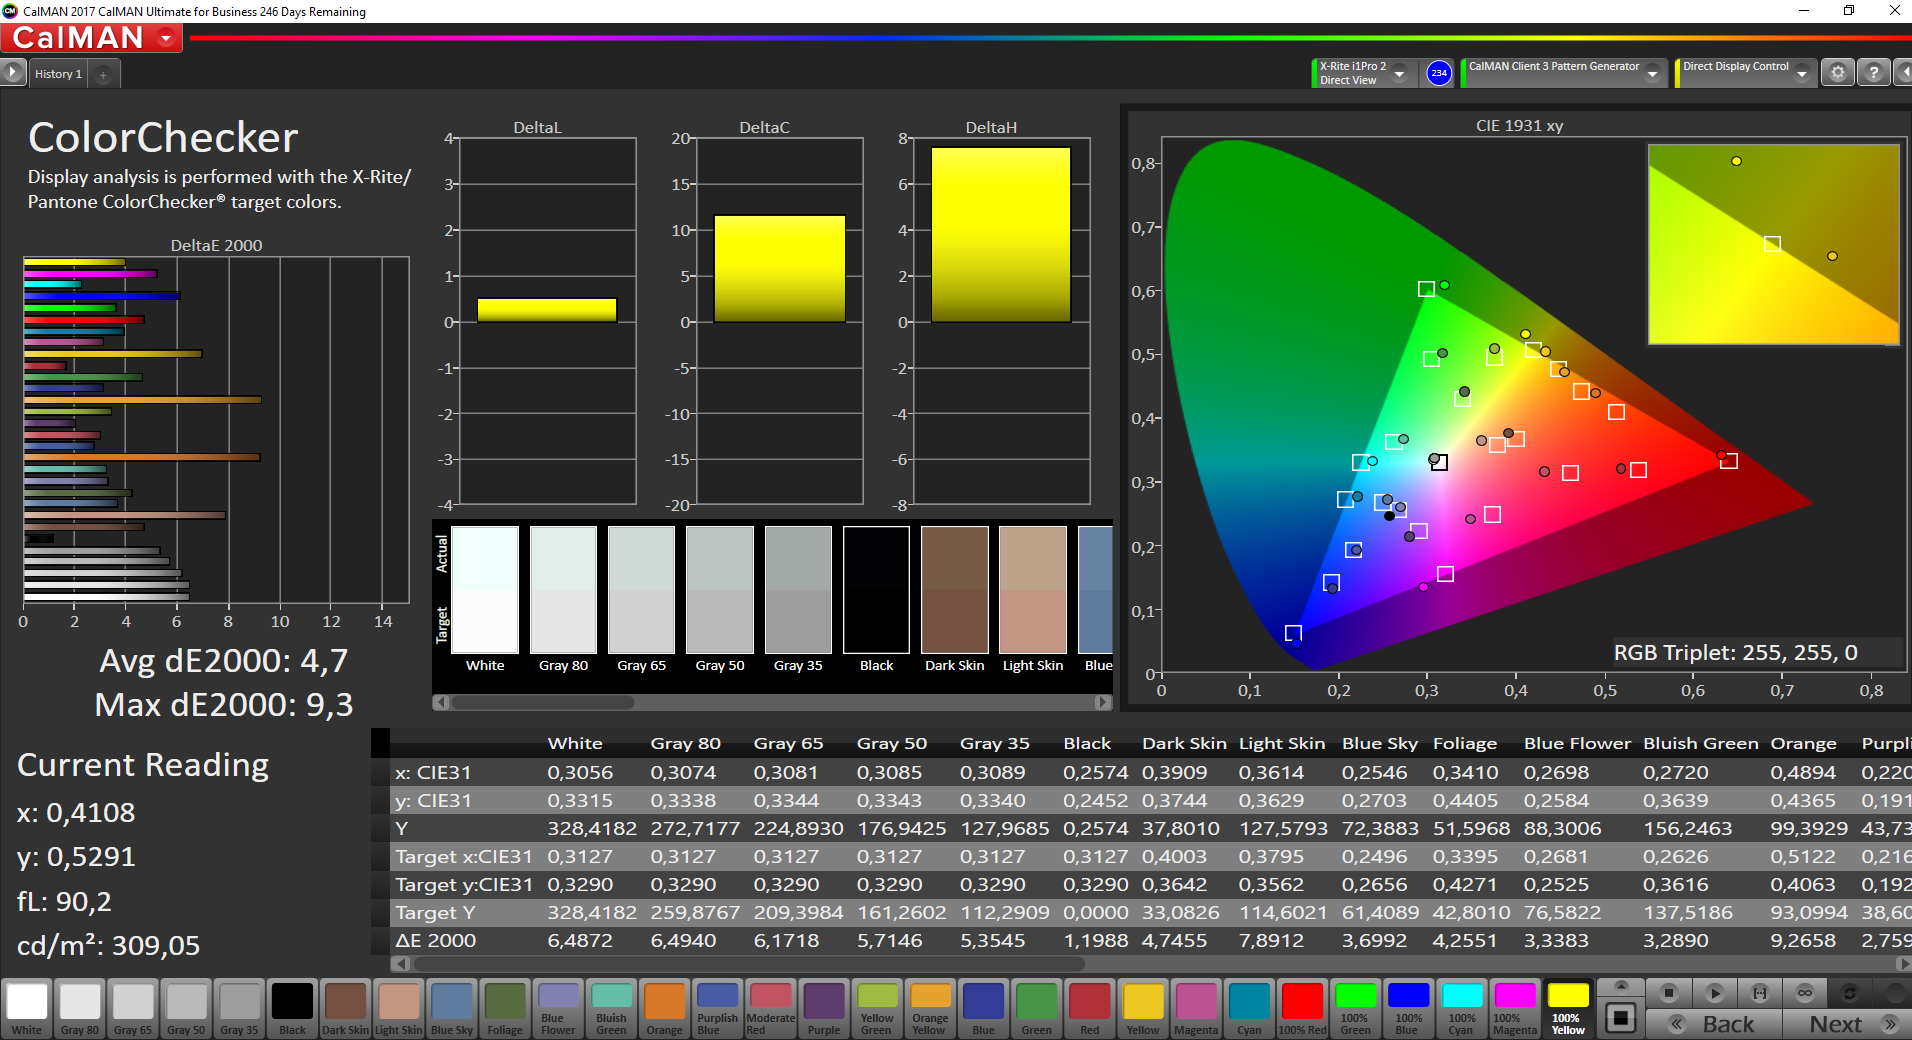
ΔE ColorChecker Calman: 1.9 | ∀{0.5-29.43 Ø4.73}
calibrated: 0.8
ΔE Greyscale Calman: 3 | ∀{0.09-98 Ø4.97}
100% sRGB (Argyll 1.6.3 3D)
88.8% AdobeRGB 1998 (Argyll 1.6.3 3D)
99.9% AdobeRGB 1998 (Argyll 3D)
100% sRGB (Argyll 3D)
87.7% Display P3 (Argyll 3D)
Gamma: 2.14
CCT: 6377 K
| Lenovo ThinkPad X1 Carbon 2018-20KGS03900 B140QAN02.0, , 2560x1440, 14" | Lenovo ThinkPad X1 Carbon 2018-20KGS03800 B140HAN03.1, , 1920x1080, 14" | Lenovo ThinkPad X1 Carbon 2017-20HR006FGE LEN40AA (LP140QH2-SPB1), , 2560x1440, 14" | Lenovo ThinkPad X1 Carbon 2017-20HQS03P00 B140HAN03_1, , 1920x1080, 14" | HP EliteBook 840 G4-Z2V49ET ABD AUO123D, , 1920x1080, 14" | Dell Latitude 13 7380 LGD0589, , 1920x1080, 13.3" | Apple MacBook Pro 13 2017 Touchbar i5 APPA034, , 2560x1600, 13.3" | Dell Latitude 7480 LG Philips LGD0557, , 1920x1080, 14" | Fujitsu LifeBook U747 LG LP140WF3, , 1920x1080, 14" | |
|---|---|---|---|---|---|---|---|---|---|
| Display | -25% | -14% | -27% | -32% | -22% | -0% | -22% | -26% | |
| Display P3 Coverage (%) | 87.7 | 63.3 -28% | 73.5 -16% | 61.4 -30% | 55.8 -36% | 65.5 -25% | 98.6 12% | 65.4 -25% | 66.1 -25% |
| sRGB Coverage (%) | 100 | 89.4 -11% | 98.4 -2% | 85.9 -14% | 80.7 -19% | 91.8 -8% | 100 0% | 92.3 -8% | 84.8 -15% |
| AdobeRGB 1998 Coverage (%) | 99.9 | 64.4 -36% | 74.5 -25% | 62.4 -38% | 57.7 -42% | 65.8 -34% | 86.5 -13% | 65.8 -34% | 62 -38% |
| Response Times | 20% | 38% | 19% | 34% | 29% | 11% | 20% | 36% | |
| Response Time Grey 50% / Grey 80% * (ms) | 59.2 ? | 45.6 ? 23% | 35.6 ? 40% | 41.6 ? 30% | 39 ? 34% | 34 ? 43% | 48 ? 19% | 40.8 ? 31% | 36 ? 39% |
| Response Time Black / White * (ms) | 34.4 ? | 28.8 ? 16% | 22.4 ? 35% | 31.6 ? 8% | 23 ? 33% | 29.6 ? 14% | 33.6 ? 2% | 31.2 ? 9% | 23.2 ? 33% |
| PWM Frequency (Hz) | 119000 ? | ||||||||
| Screen | -56% | -42% | -55% | -123% | -70% | 17% | -26% | -44% | |
| Brightness middle (cd/m²) | 578 | 330 -43% | 342 -41% | 311 -46% | 346 -40% | 317 -45% | 551 -5% | 344 -40% | 291 -50% |
| Brightness (cd/m²) | 533 | 311 -42% | 337 -37% | 288 -46% | 317 -41% | 295 -45% | 514 -4% | 321 -40% | 296 -44% |
| Brightness Distribution (%) | 84 | 87 4% | 87 4% | 85 1% | 86 2% | 87 4% | 88 5% | 85 1% | 84 0% |
| Black Level * (cd/m²) | 0.38 | 0.21 45% | 0.37 3% | 0.24 37% | 0.86 -126% | 0.3 21% | 0.48 -26% | 0.32 16% | 0.32 16% |
| Contrast (:1) | 1521 | 1571 3% | 924 -39% | 1296 -15% | 402 -74% | 1057 -31% | 1148 -25% | 1075 -29% | 909 -40% |
| Colorchecker dE 2000 * | 1.9 | 4.7 -147% | 3.6 -89% | 5.5 -189% | 8.64 -355% | 6.3 -232% | 0.8 58% | 2.6 -37% | 4.3 -126% |
| Colorchecker dE 2000 max. * | 3.8 | 9.3 -145% | 7.7 -103% | 9 -137% | 13.58 -257% | 10.4 -174% | 1.4 63% | 7.8 -105% | 7.5 -97% |
| Colorchecker dE 2000 calibrated * | 0.8 | 2.4 -200% | |||||||
| Greyscale dE 2000 * | 3 | 4.5 -50% | 5.8 -93% | 6.2 -107% | 11.24 -275% | 7.8 -160% | 1 67% | 2.6 13% | 4.3 -43% |
| Gamma | 2.14 103% | 1.99 111% | 2.2 100% | 2.02 109% | 2.62 84% | 1.81 122% | 2.16 102% | 2.28 96% | 2.31 95% |
| CCT | 6377 102% | 6710 97% | 6693 97% | 5950 109% | 12530 52% | 7120 91% | 6672 97% | 7050 92% | 6529 100% |
| Color Space (Percent of AdobeRGB 1998) (%) | 88.8 | 58.2 -34% | 68.8 -23% | 55.96 -37% | 52 -41% | 61 -31% | 65.82 -26% | 55.46 -38% | |
| Color Space (Percent of sRGB) (%) | 100 | 89.3 -11% | 98.5 -1% | 85.77 -14% | 80 -20% | 92 -8% | 92.27 -8% | 84.77 -15% | |
| Total Average (Program / Settings) | -20% /
-41% | -6% /
-26% | -21% /
-40% | -40% /
-84% | -21% /
-47% | 9% /
12% | -9% /
-19% | -11% /
-30% |
* ... smaller is better
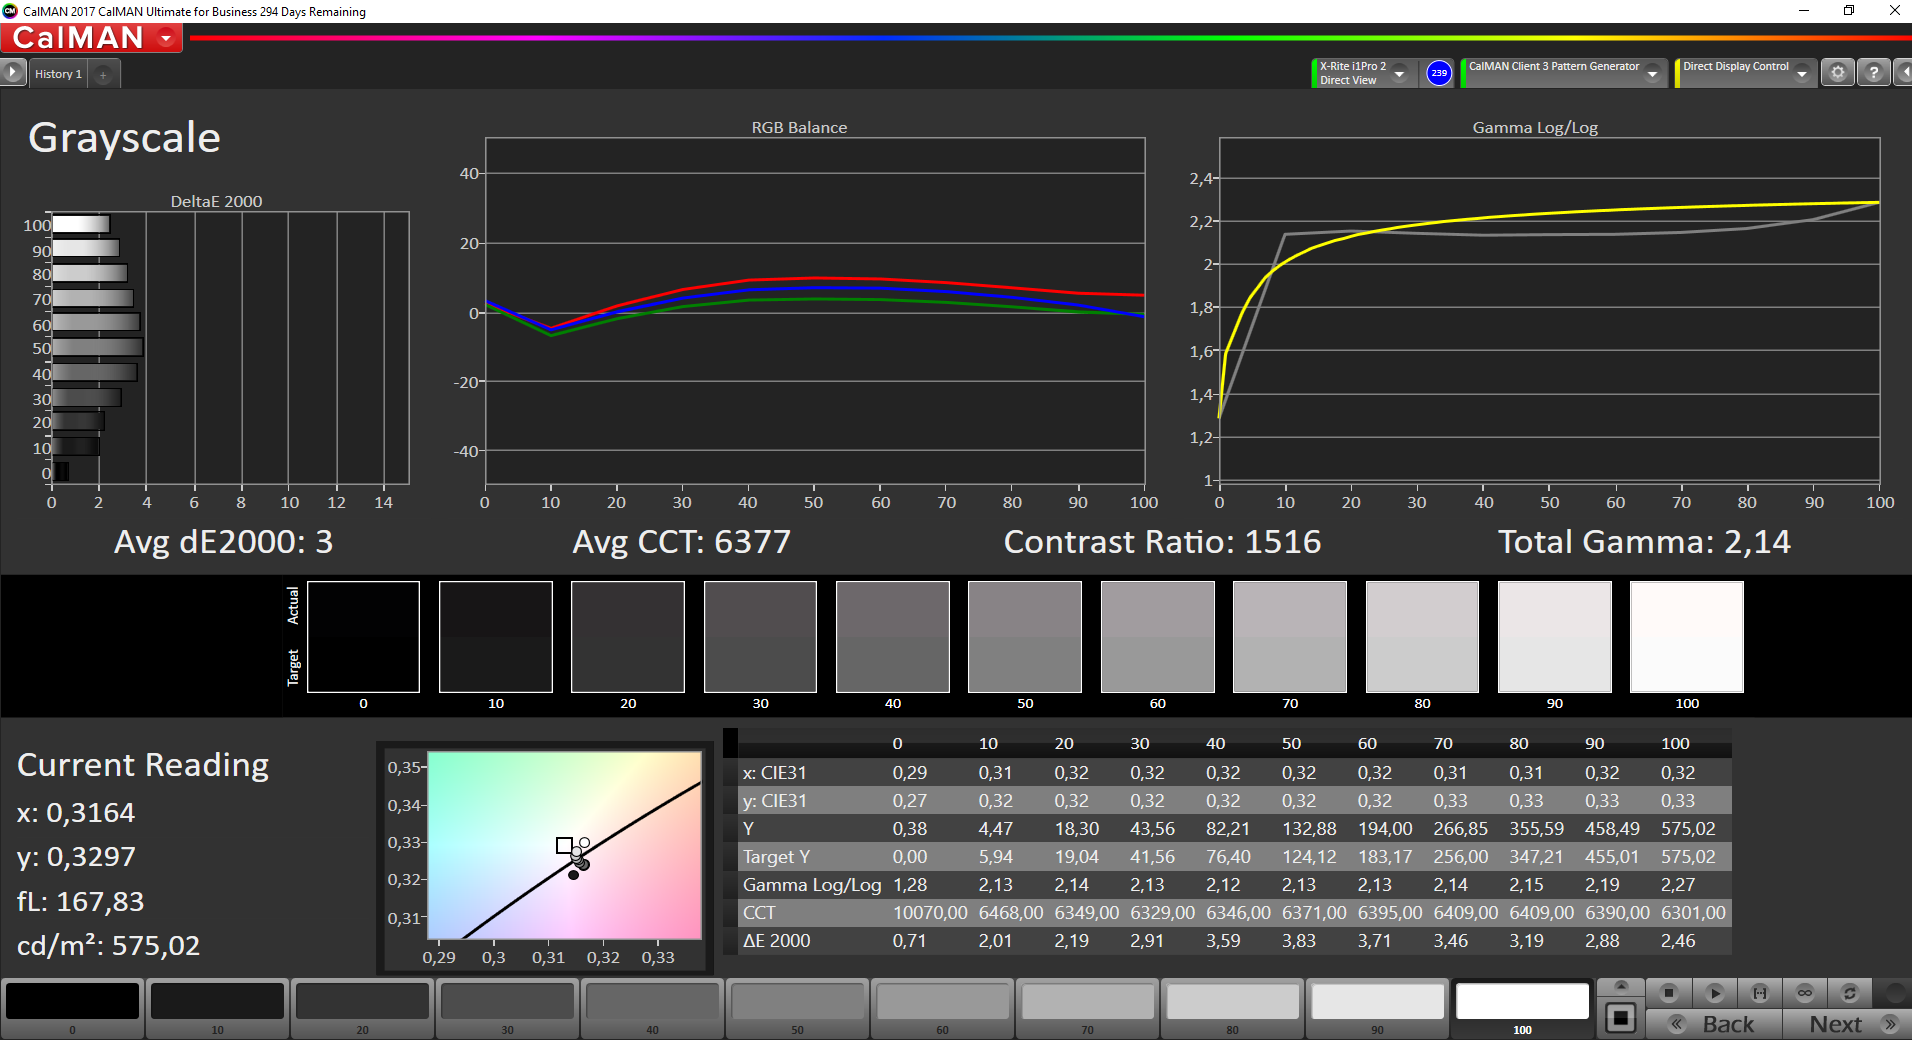
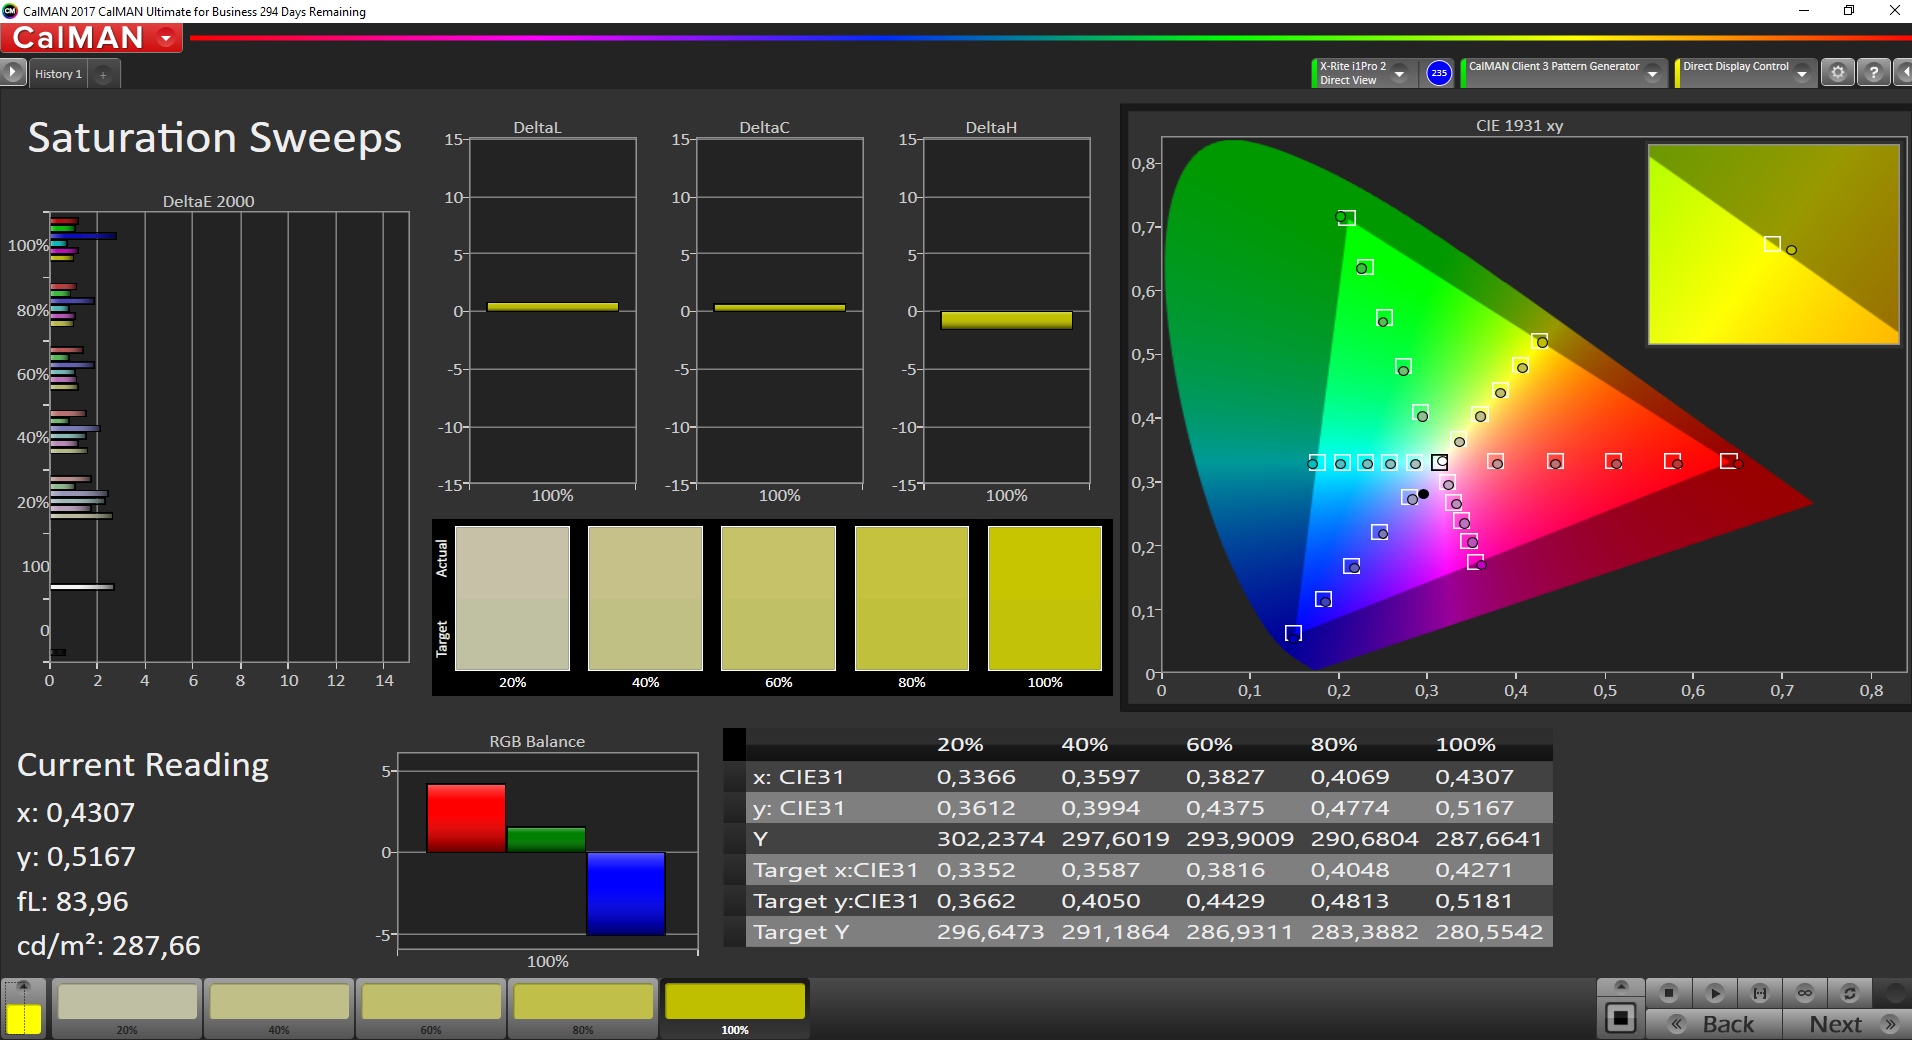
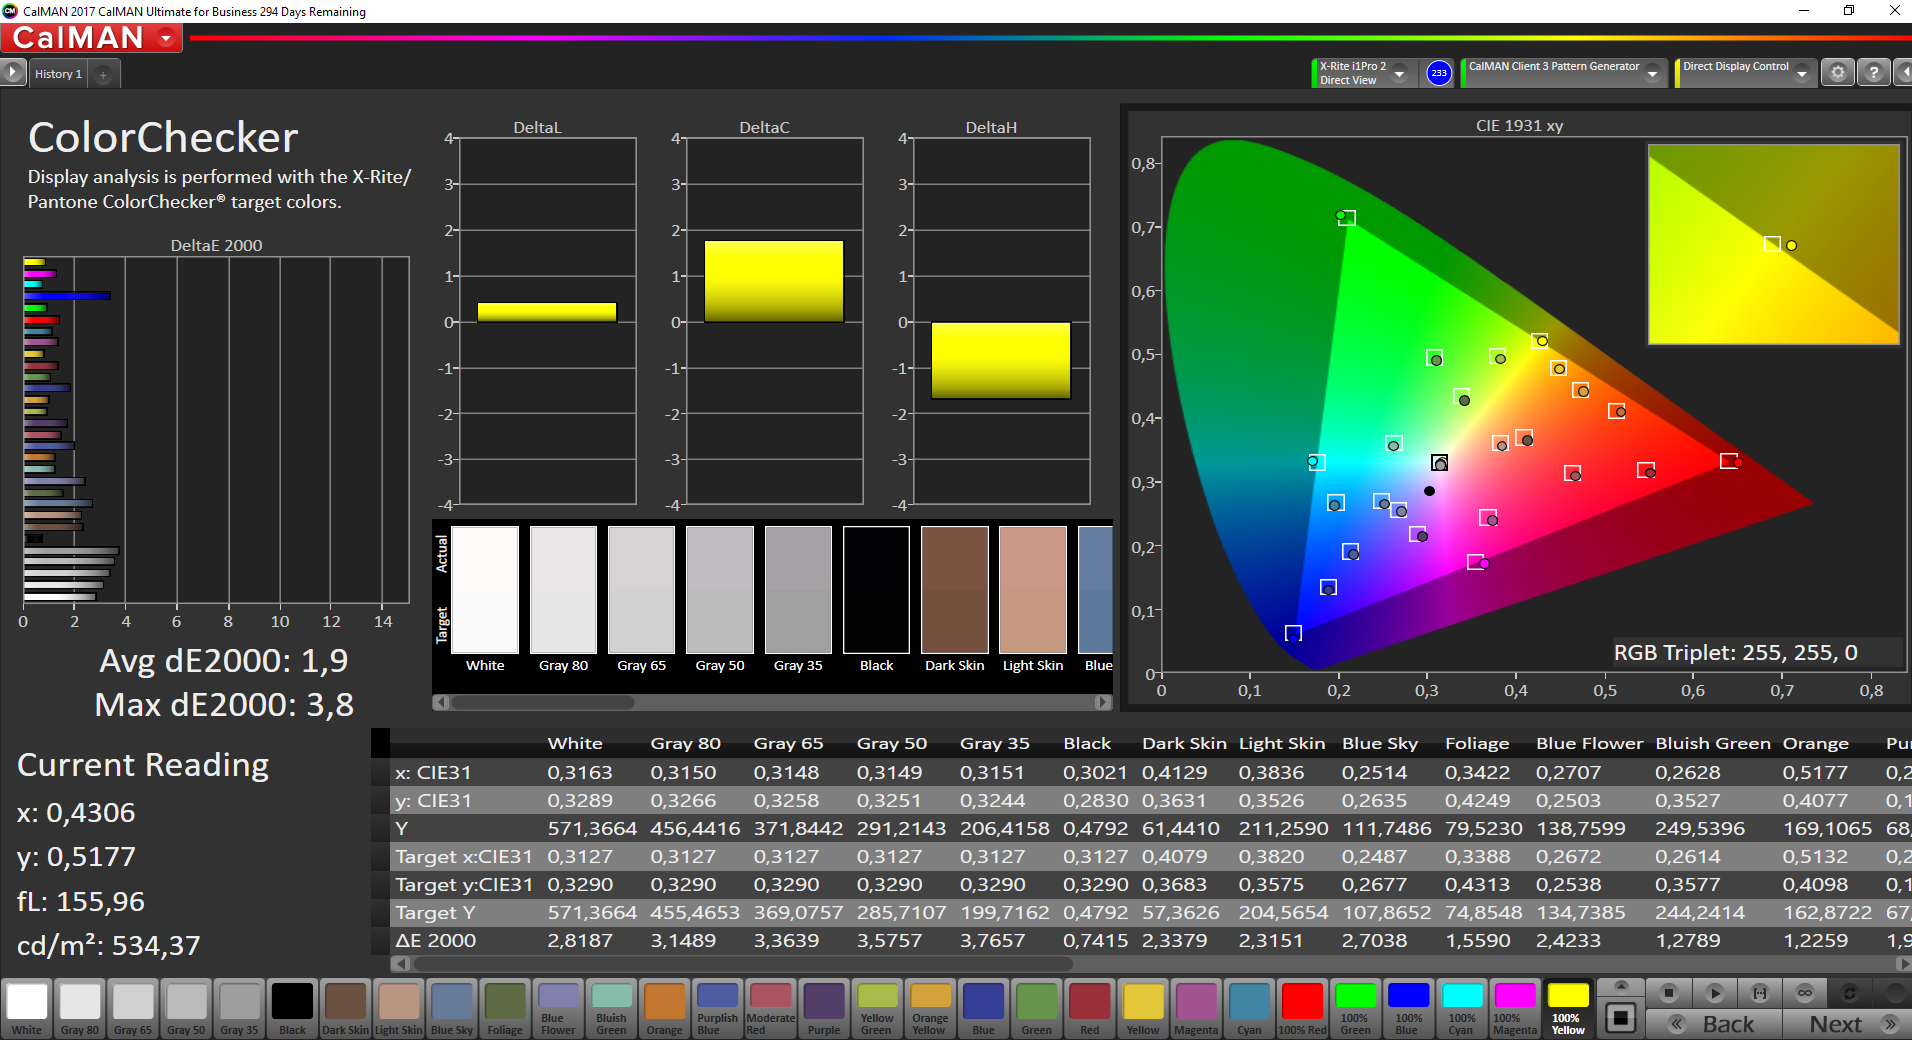
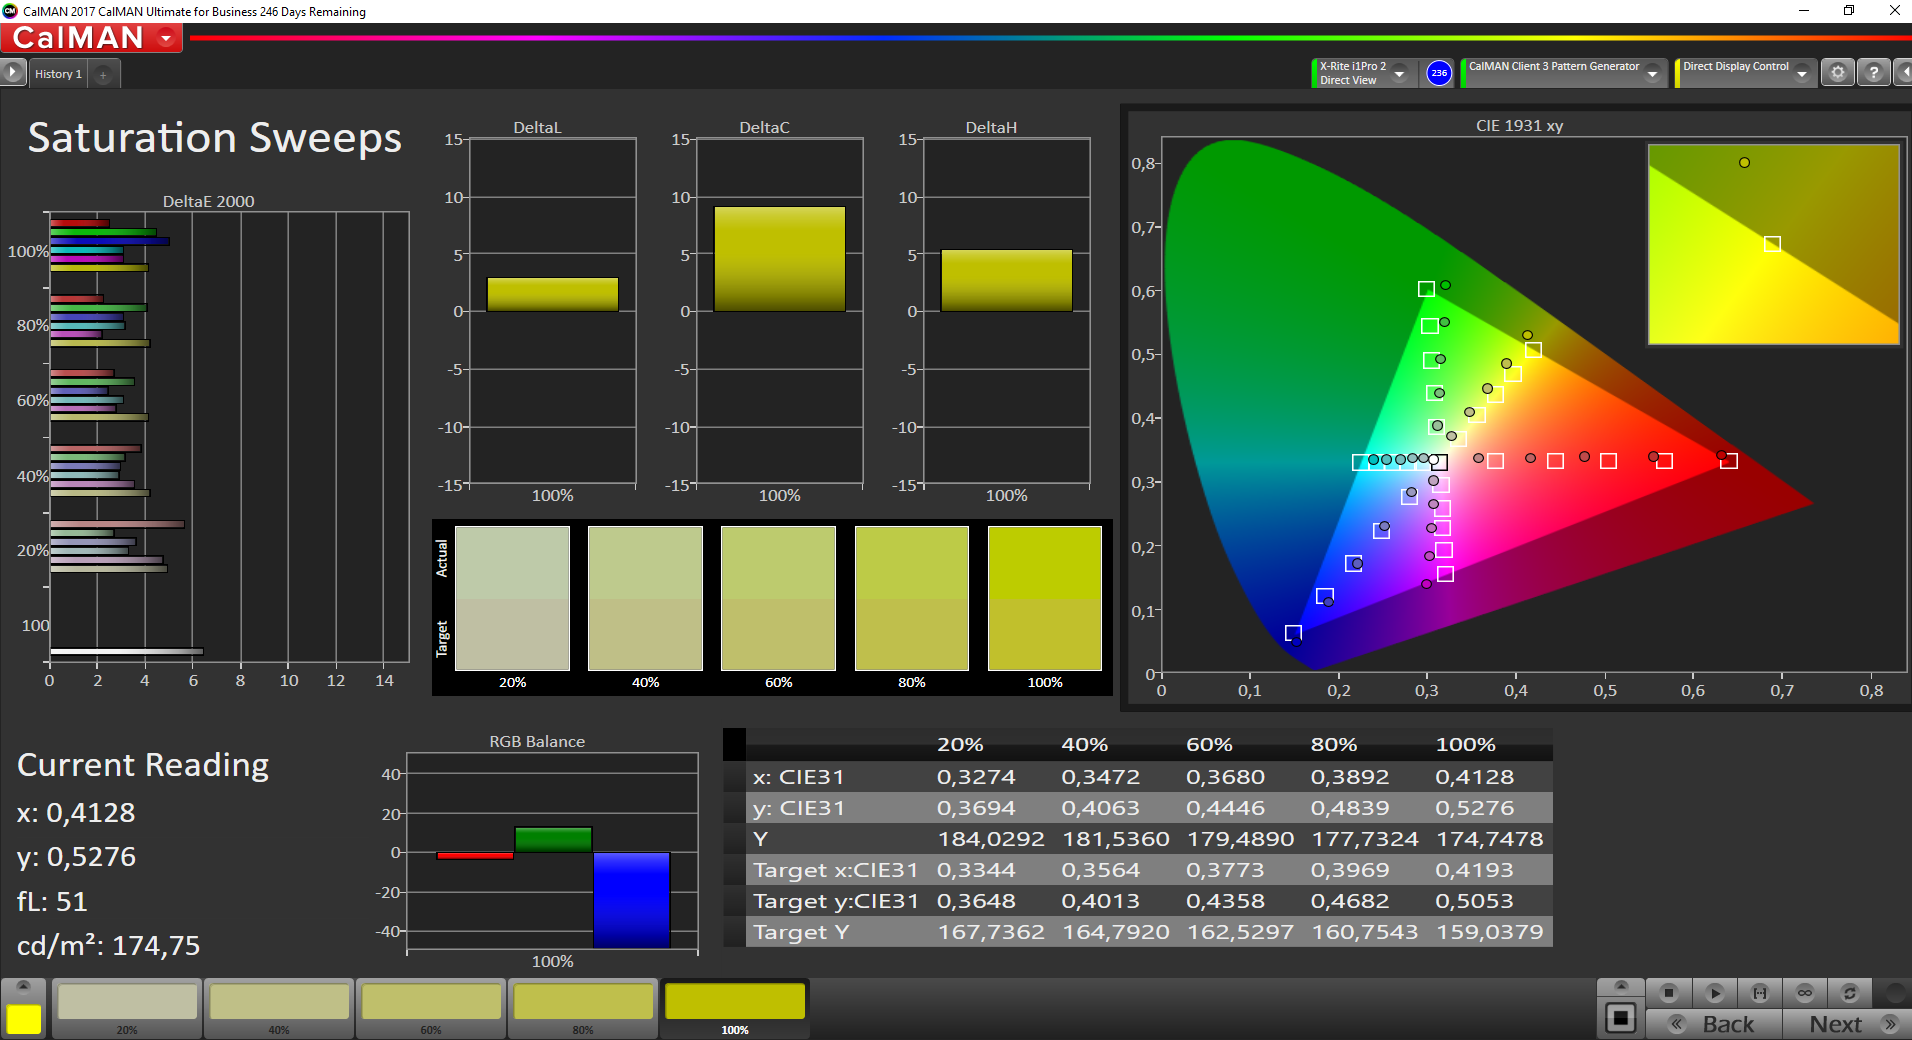
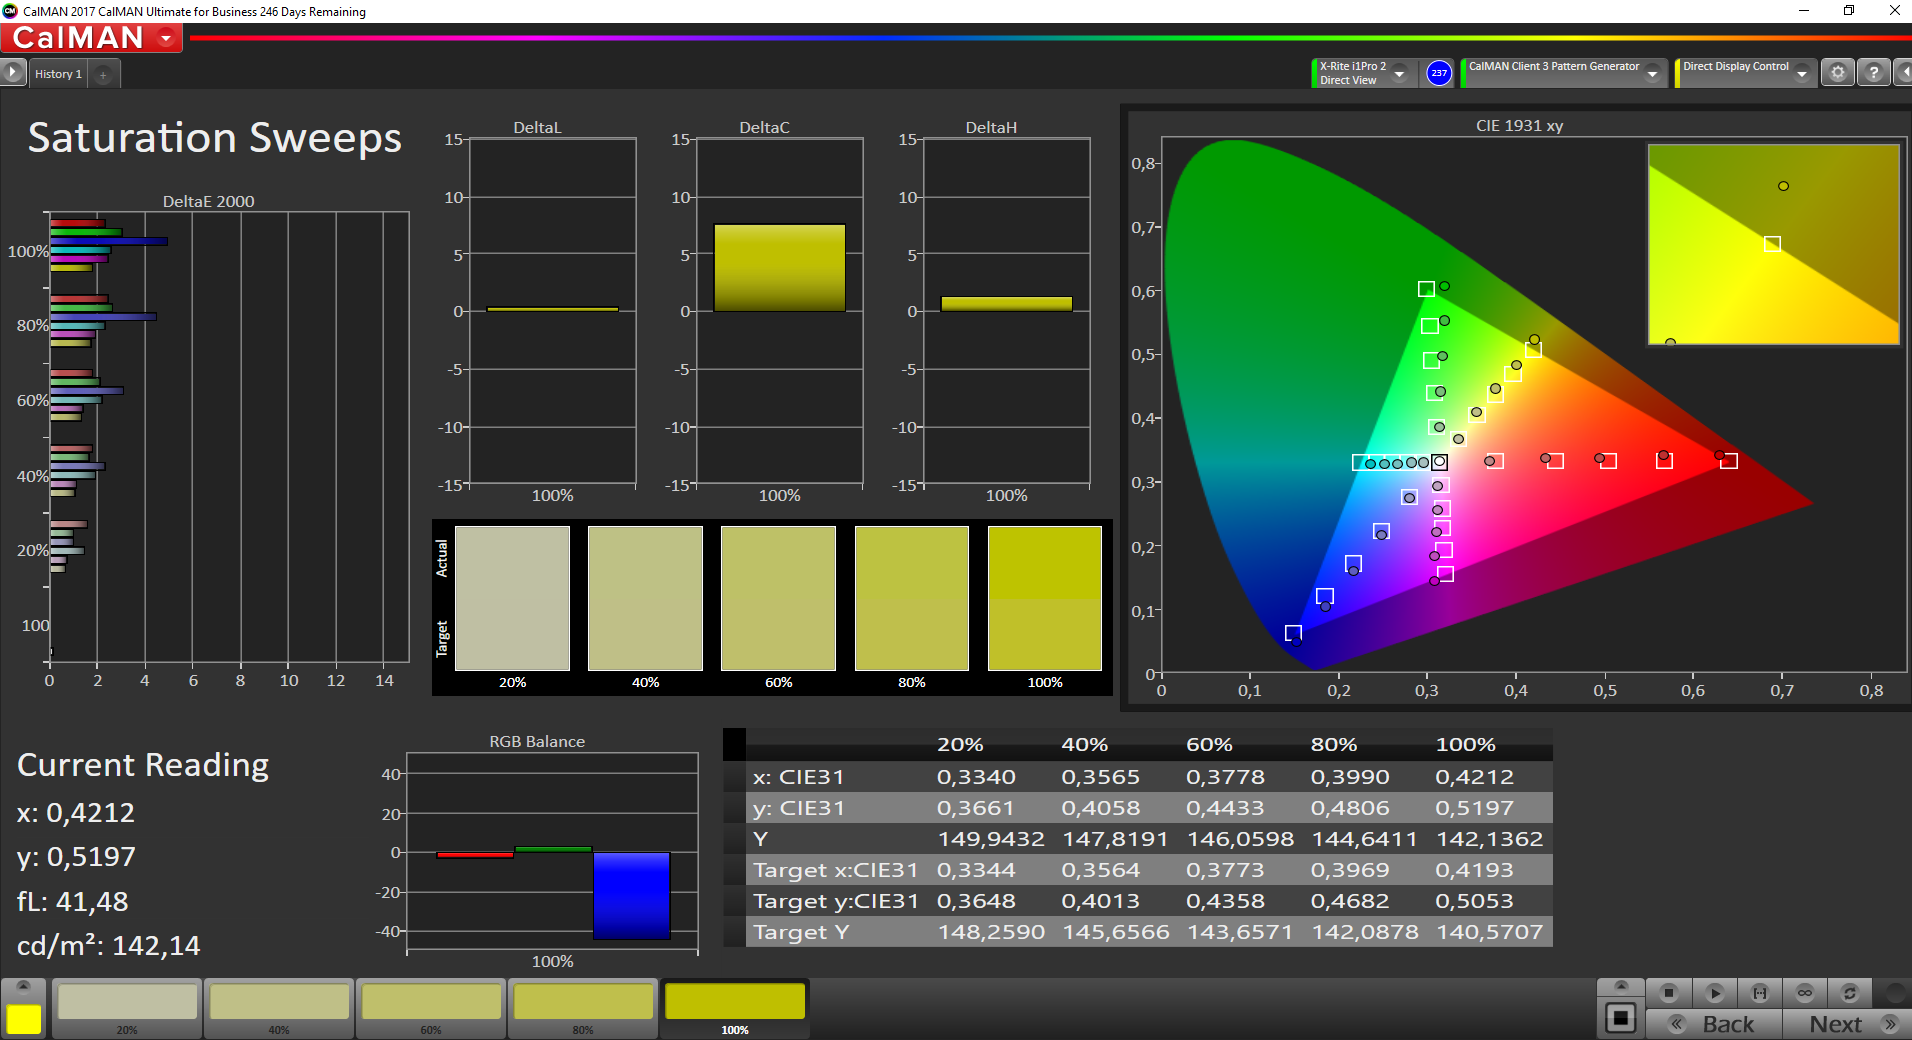
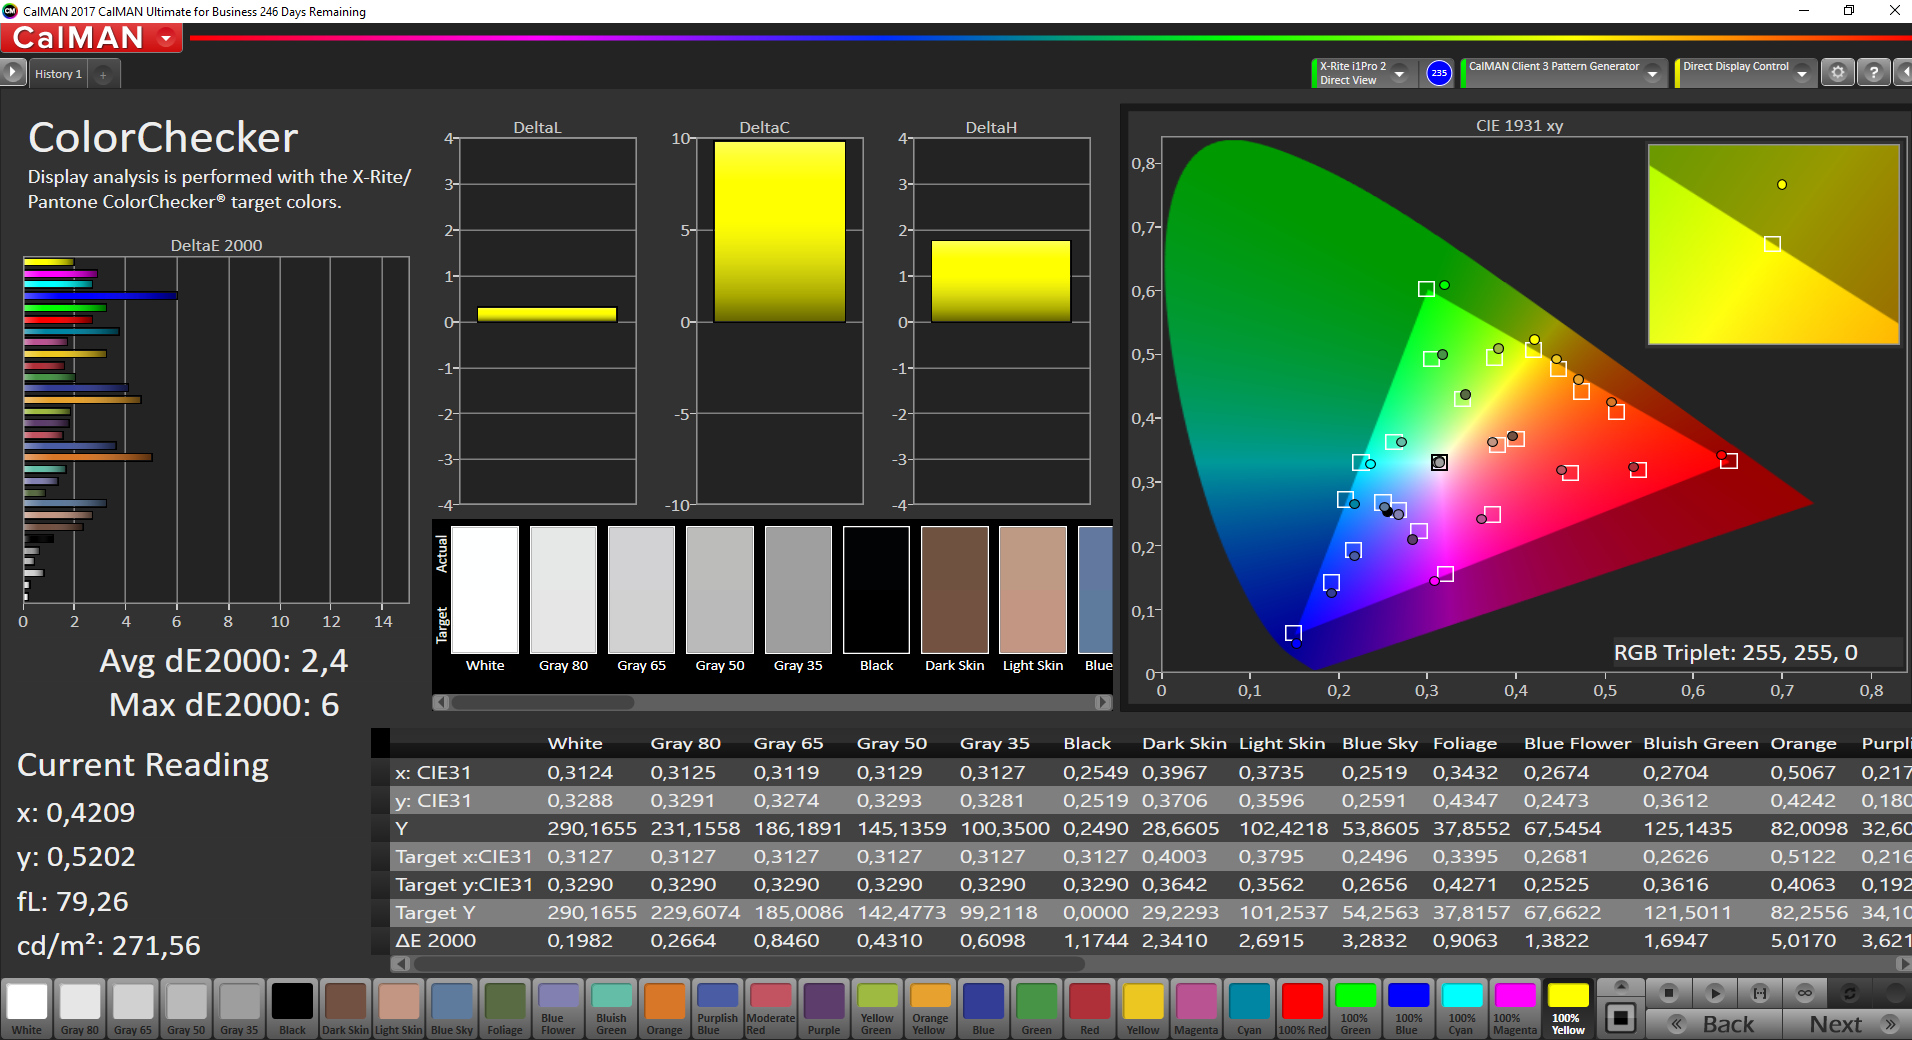
The good news continues with the results from our X-Rite i1Pro2 spectrophotometer and professional CalMAN software. Out of the factory, the average DeltaE-2000 deviations from the AdobeRGB color space for grayscale and colors are 3 and 1.9, respectively. These colors are within target variances. Unfortunately, blue is an outlier here with an average deviation of 3.8. In saying this, the WQHD HDR panel does not necessarily need calibrating despite this wider blue divergence.
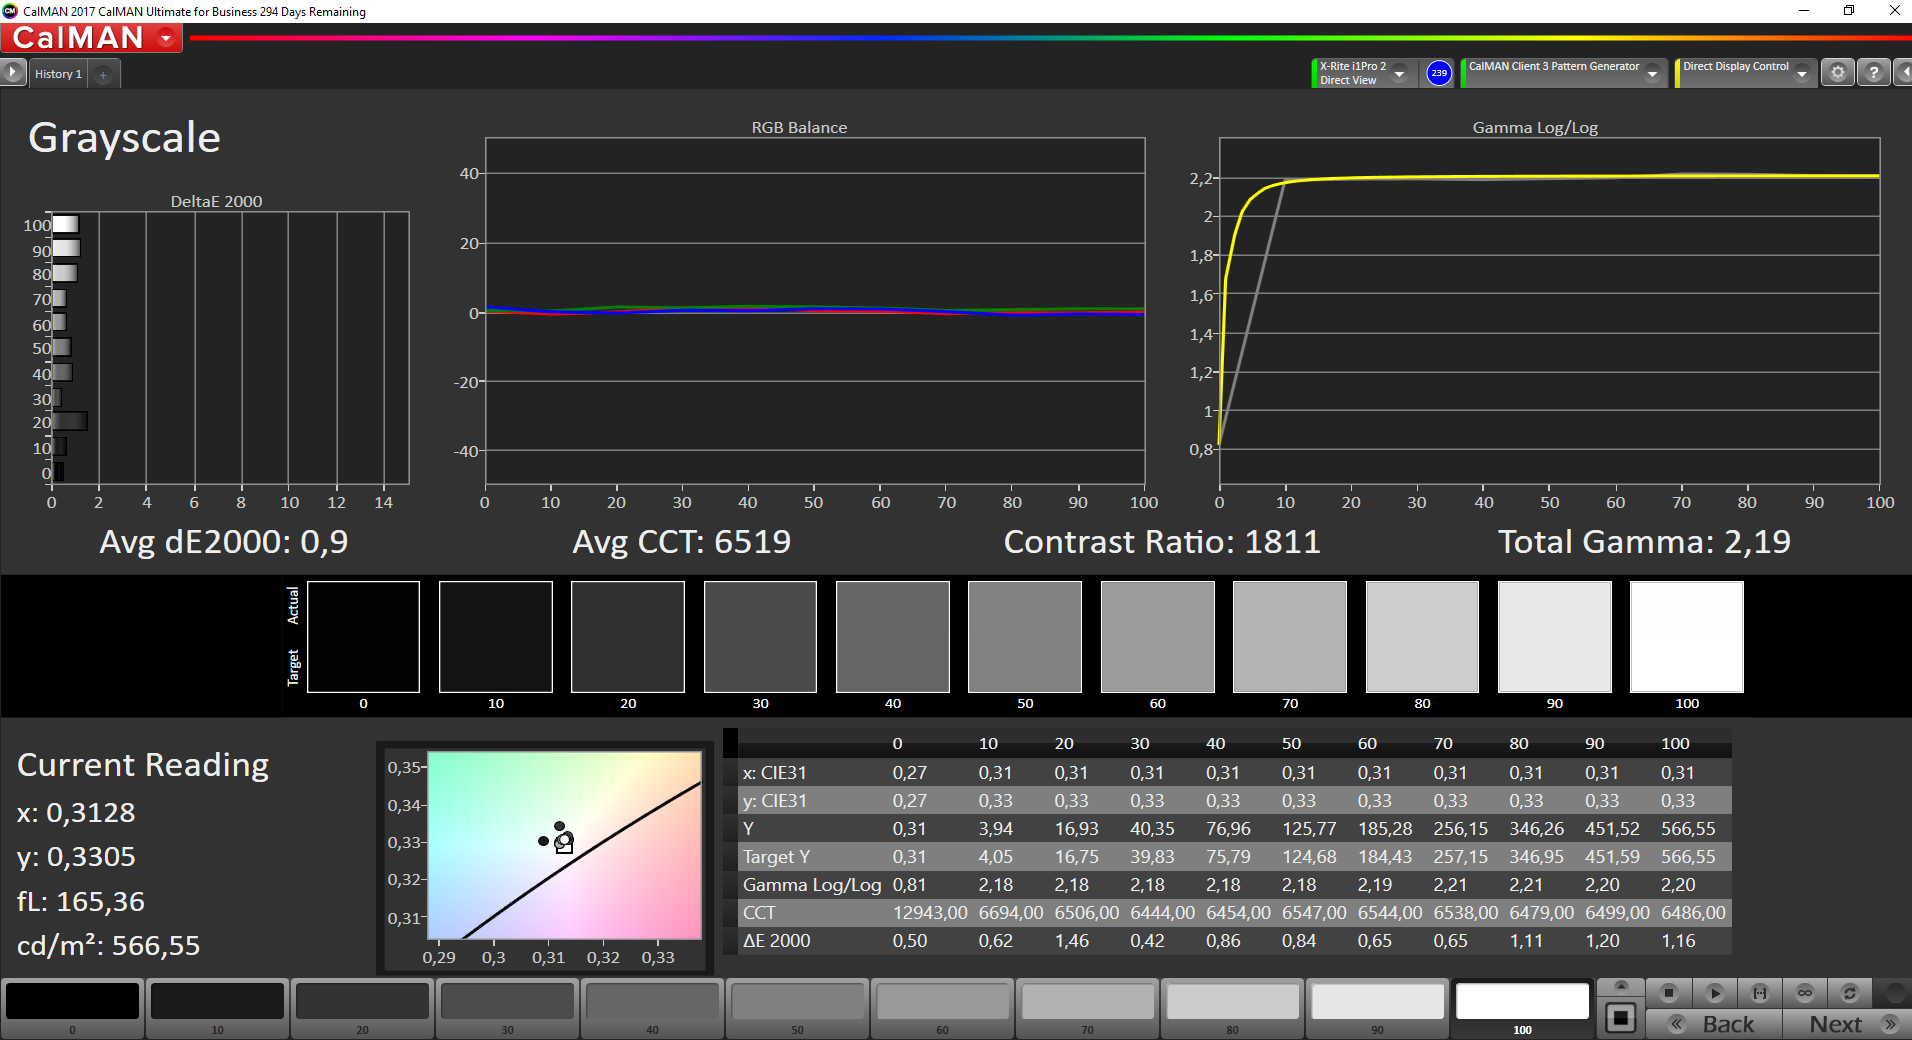

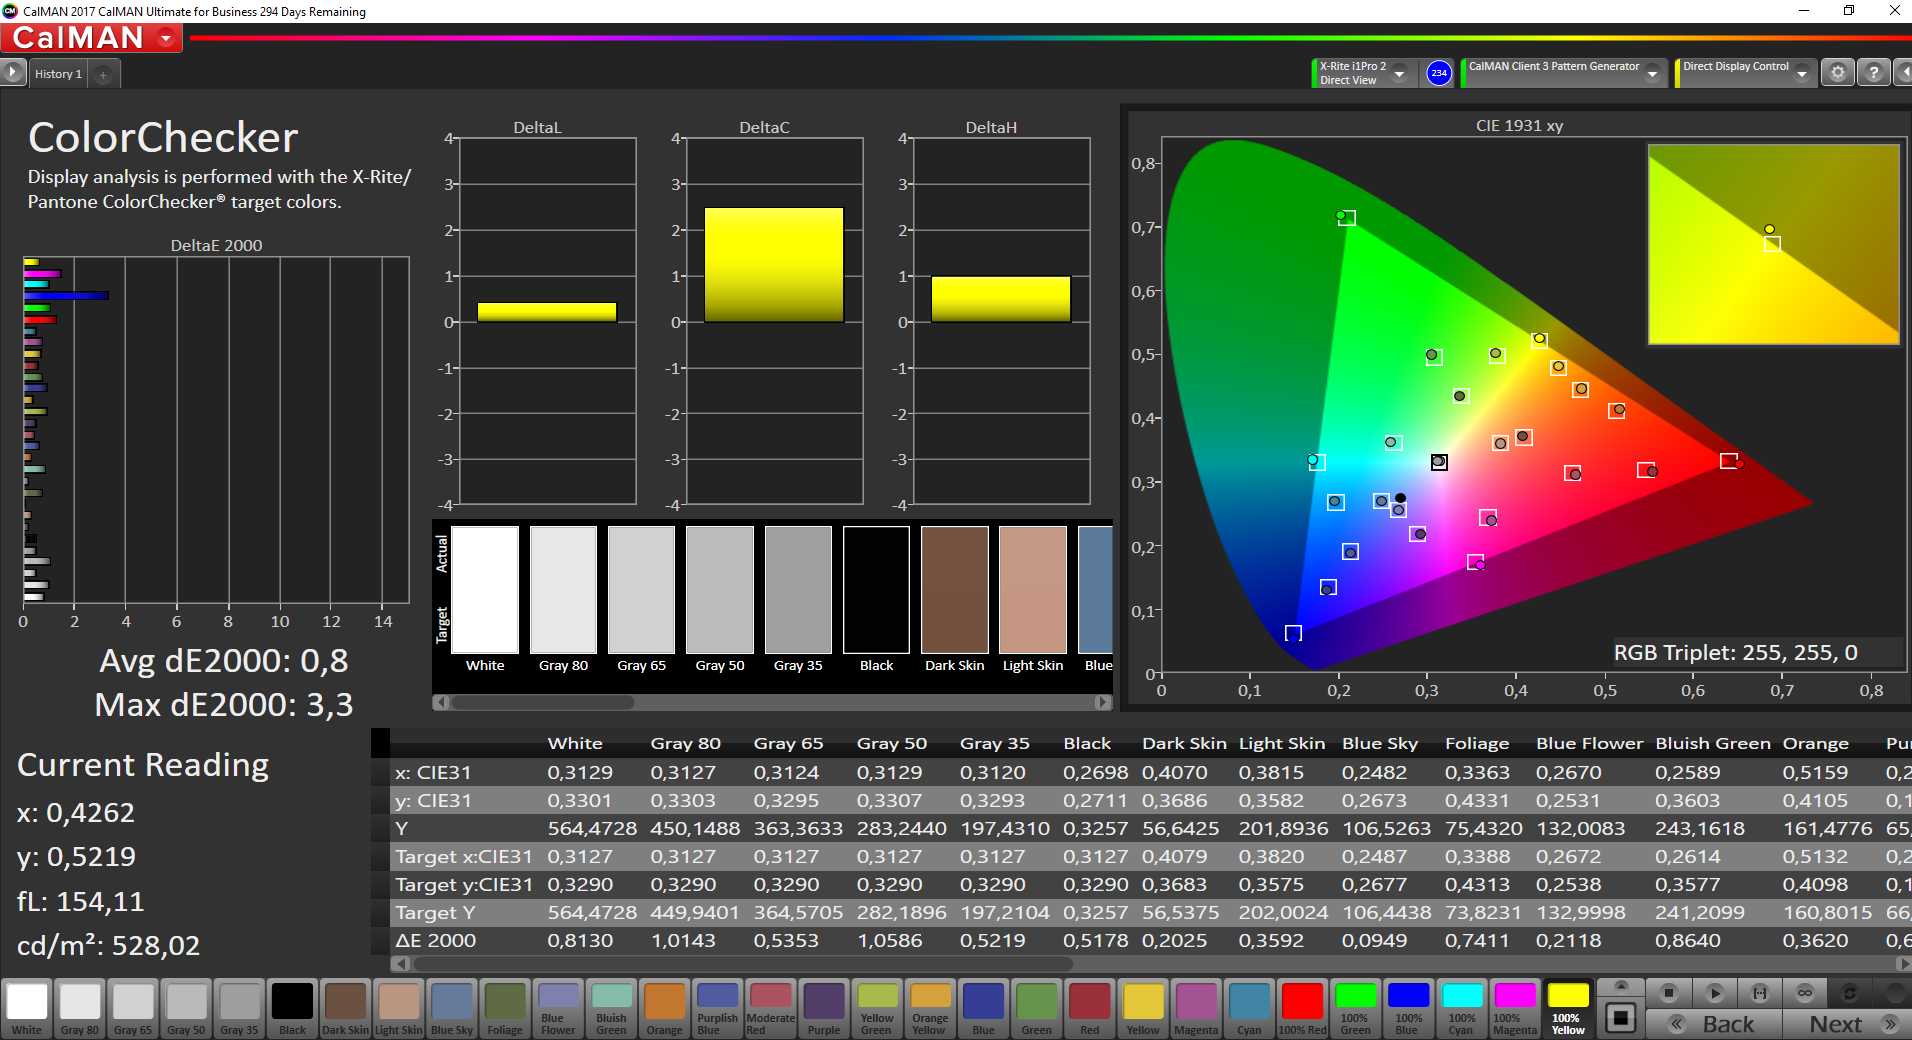
Calibrating will improve the results even further though. The average grayscale divergence falls to 0.9 and while the blue variance is still an oddity, it too falls to 3.3. The WQHD HDR panel has perfect RGB balance, practically ideal color temperature and gamma values. Additionally, the black level drops to 0.31, which helps to increase the contrast ratio to greater than 1,800:1.
Last year's X1 Carbon already had an impressive optional WQHD panel, but the new WQHD HDR panel has sRGB and AdobeRGB values usually reserved for the most expensive panels on mobile workstations. While the 2017 WQHD panel almost fully covers sRGB and manages 69% AdobeRGB, the 2018 WQHD HDR panel dramatically improves upon these values, achieving full sRGB and 88.8% AdobeRGB. By way of a comparison, even the very good 4K panel in the ThinkPad P71 only scores 77% AdobeRGB. The new WQHD HDR X1 Carbon variant is therefore a great choice for the best possible color reproduction in 2018.
There is one drawback though, namely the slow reaction times. This is especially true with gray-to-gray reaction times, which causes the mouse pointer to leave a slight trace, or ghost, as it moves across the screen. This is hardly noticeable on light surfaces, but fans of very fast and old shooters will still probably not be thrilled. As such, do not be put off the X1 Carbon 2018 based on the WQHD HDR's slow reaction times alone.
Display Response Times
| ↔ Response Time Black to White | ||
|---|---|---|
| 34.4 ms ... rise ↗ and fall ↘ combined | ↗ 16.4 ms rise | 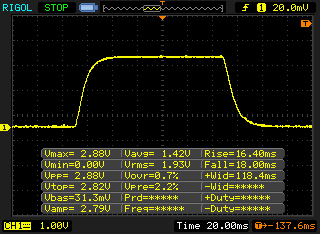 |
| ↘ 18 ms fall | ||
| The screen shows slow response rates in our tests and will be unsatisfactory for gamers. In comparison, all tested devices range from 0.1 (minimum) to 240 (maximum) ms. » 92 % of all devices are better. This means that the measured response time is worse than the average of all tested devices (19.9 ms). | ||
| ↔ Response Time 50% Grey to 80% Grey | ||
| 59.2 ms ... rise ↗ and fall ↘ combined | ↗ 28.4 ms rise | 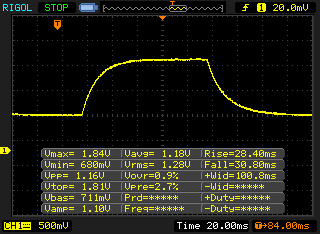 |
| ↘ 30.8 ms fall | ||
| The screen shows slow response rates in our tests and will be unsatisfactory for gamers. In comparison, all tested devices range from 0.165 (minimum) to 636 (maximum) ms. » 95 % of all devices are better. This means that the measured response time is worse than the average of all tested devices (31.1 ms). | ||
Screen Flickering / PWM (Pulse-Width Modulation)
| Screen flickering / PWM not detected | 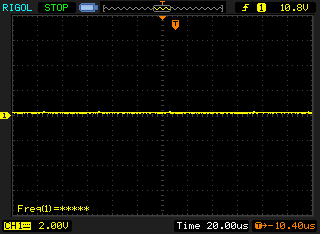 | ||
In comparison: 52 % of all tested devices do not use PWM to dim the display. If PWM was detected, an average of 7798 (minimum: 5 - maximum: 343500) Hz was measured. | |||
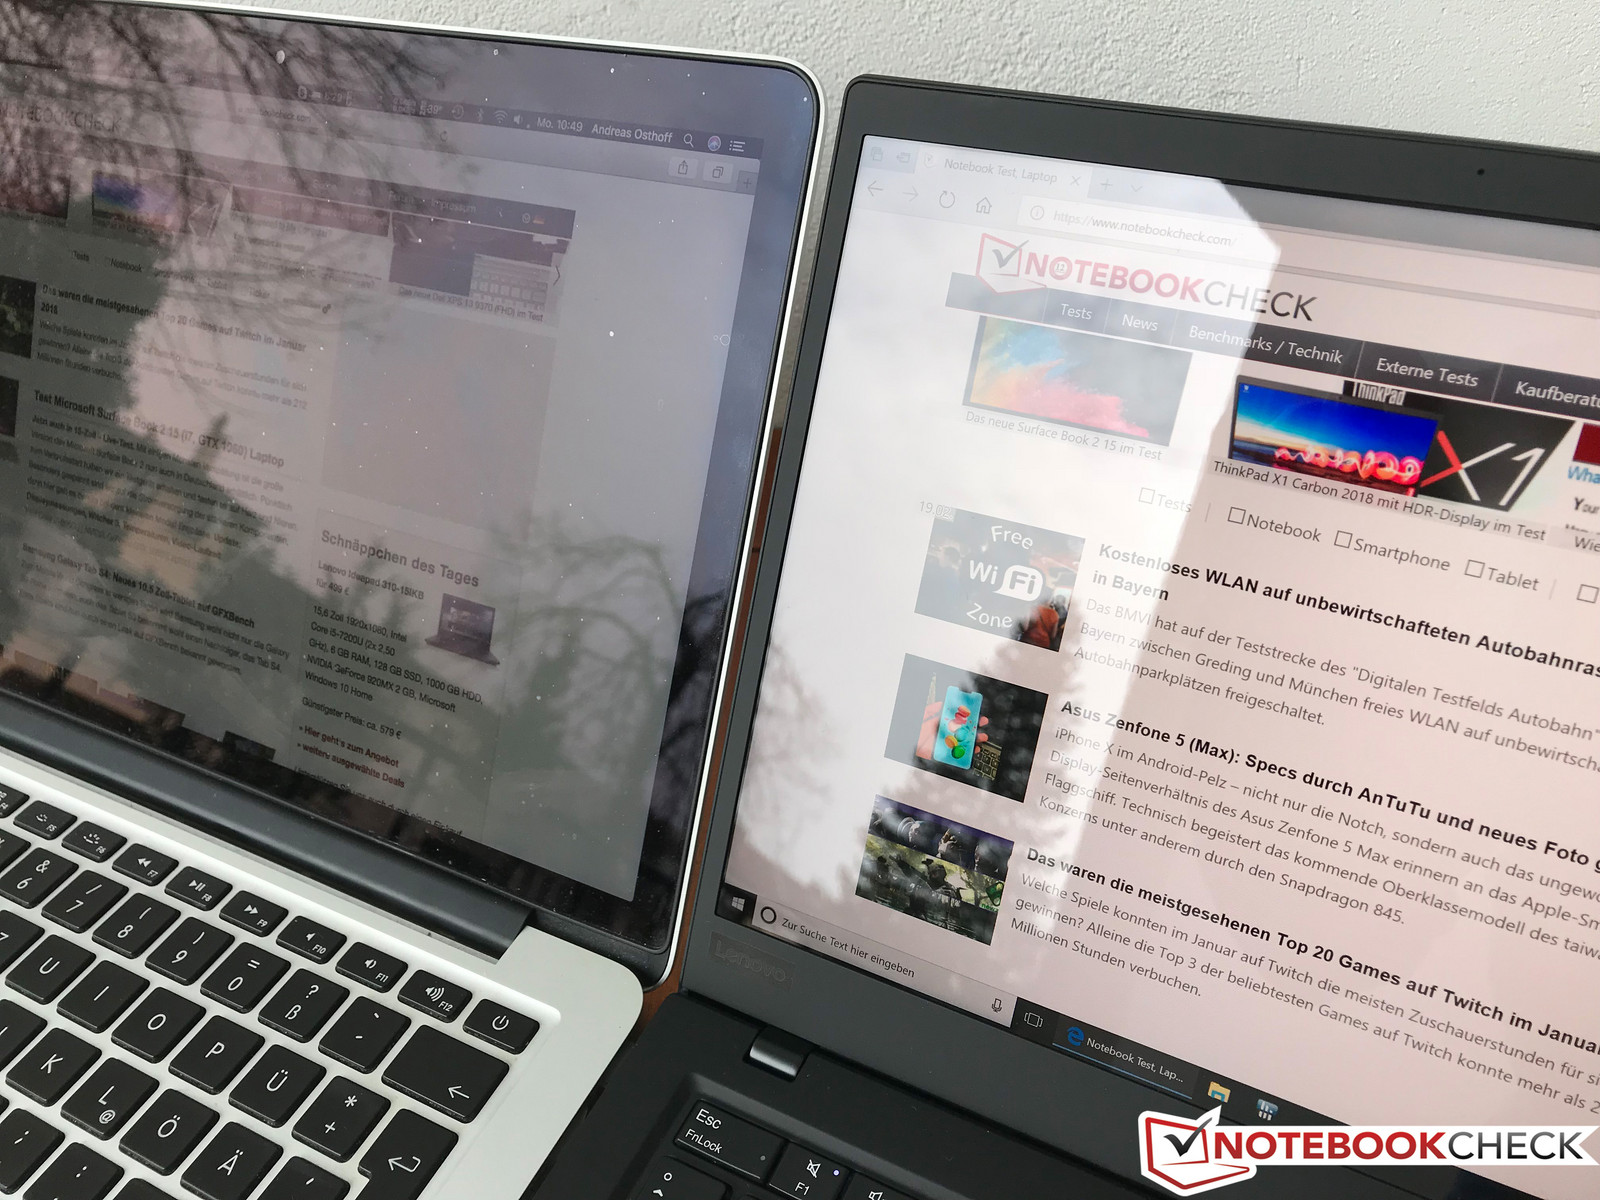
The outdoor performance is another problem. We repeatedly compared the new X1 Carbon with our old Apple MacBook Pro Retina 13 (Late 2013) over the last few days and the panel of the X1 Carbon is definitely slightly more reflective. You can also see some sort of ripples when objects or light sources are reflected on the panel, which is not the case with the MacBook. You can see this phenomenon on the following pictures (especially the right one) where the reflection ends.
We took the following pictures on a cloudy day and not under direct sunlight. This environment obviously favors the matte panel of the ThinkPad T480s, despite the lower luminance.
The viewing-angle stability is basically very good, but there is a slight red hue from extreme angles, especially at angles from above and below. The glossy surface is another limiting factor. All in all not a bad performance, but there are better IPS panels in this respect.
Dolby Vision HDR
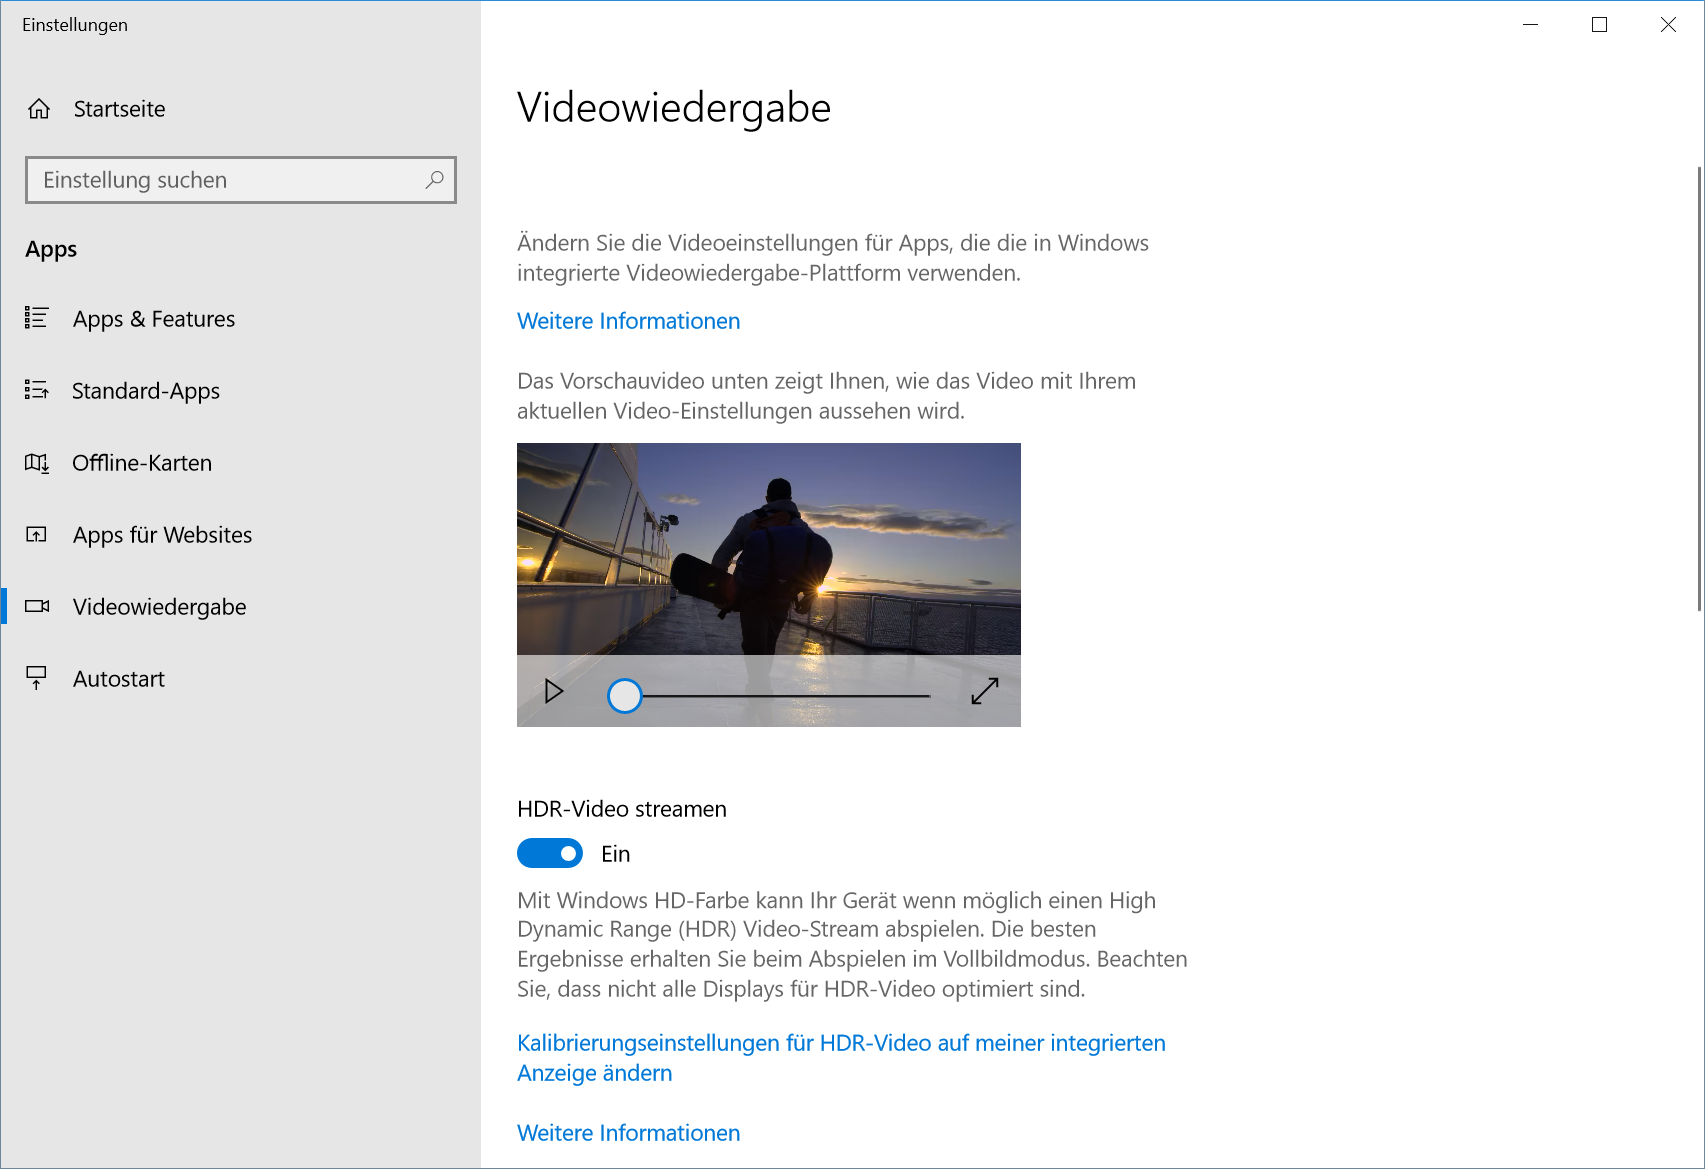
Both Microsoft and Intel provided software updates and the HDR functionality of the ThinkPad X1 Carbon now works as intended. The corresponding menu item in the Windows settings can now be activated.
Once you start an HDR video, the brightness will automatically increase to the maximum value in full-screen mode and return to the original setting when you stop the playback. It is still possible to adjust the luminance manually during playback, but we recommend the maximum brightness to get the best HDR experience. You also notice the advantage of TVs in this situation, which are even brighter than the X1 Carbon 2018. However, the quality is still very good and HDR movies look great on the 14-inch panel.
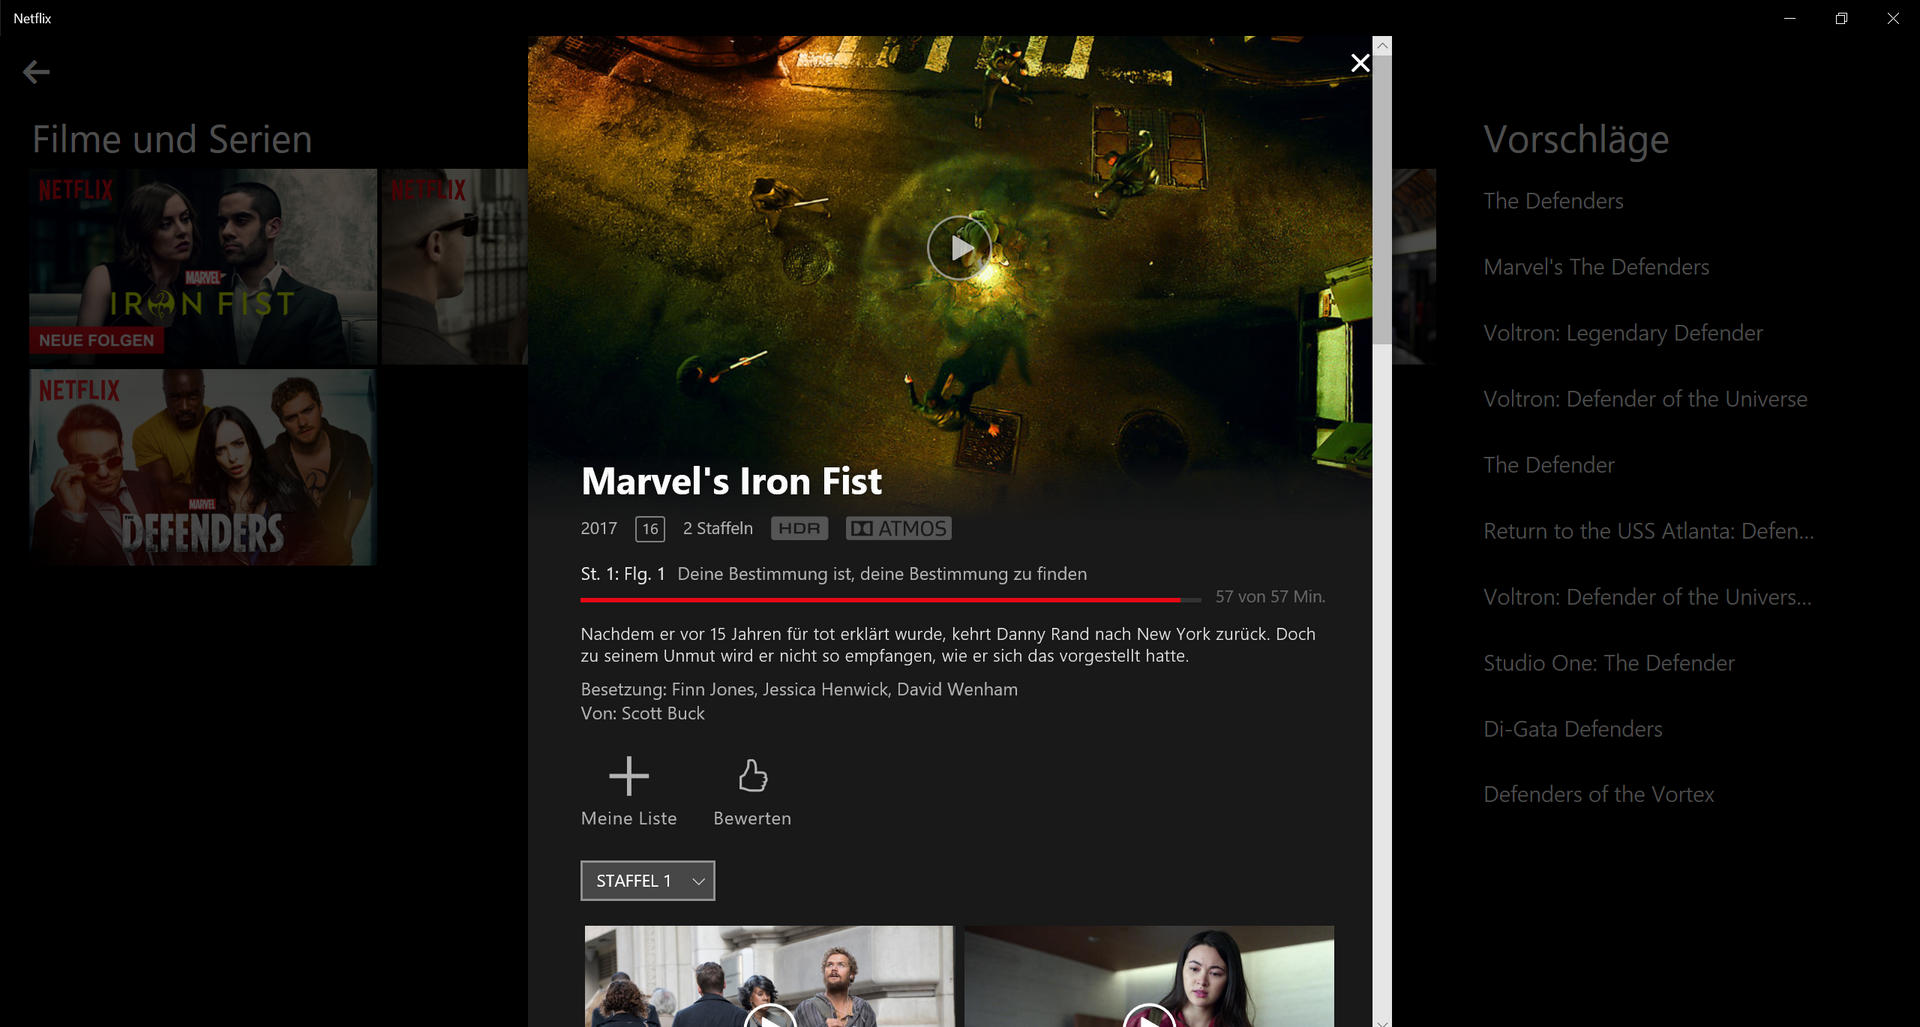
The automatic recognition of HDR contents also works with other apps like Netflix, Amazon or YouTube, and you can now enjoy HDR contents when provided (or included in the subscription). We also checked the battery runtime with Netflix. The playback of Daredevil Season 1 (full-screen with maximum brightness) ran for ~6.5 hours, but this can differ depending on the content. Movies/TV series with very bright scenes can consume more power.

X1 Carbon 2018 with the FHD panel
We had the chance to check the 1080p model of the current ThinkPad X1 Carbon 2018. It is a matte IPS screen from AUO (B140HAN03.1), which is already familiar from the previous 2017 model. However, the current model is a bit better in most categories, but this might just be regular manufacturing variation.
The subjective picture impression is good and the screen is not too grainy. We determine an average luminance of more than 300 nits and the black value (0.21) is very low for an IPS screen, which results in a excellent contrast ratio. Backlight bleeding is no problem for our test model and we did not detect a PWM regulation of the screen, either.
| |||||||||||||||||||||||||
Brightness Distribution: 87 %
Center on Battery: 334 cd/m²
Contrast: 1571:1 (Black: 0.21 cd/m²)
ΔE ColorChecker Calman: 4.7 | ∀{0.5-29.43 Ø4.73}
calibrated: 2.4
ΔE Greyscale Calman: 4.5 | ∀{0.09-98 Ø4.97}
89.3% sRGB (Argyll 1.6.3 3D)
58.2% AdobeRGB 1998 (Argyll 1.6.3 3D)
Gamma: 1.99
CCT: 6710 K

The IPS panel suffers from a slight color cast (blue-green), which can be fixed by a calibration. The grayscale performance benefits from that as well, even though the default settings should be sufficient for common office tasks. The color deviations are also quite high and there are still outliers after the calibration. The color gamut is also considerably narrower compared to the HDR unit. You will not be very happy with the matte FHD panel if you need accurate colors for your work.
So is the optional HDR panel the better choice? Not for every use, because the matte 1080p screen is also a good choice for office scenarios. There are no problems with annoying reflections, either, so it is even superior outdoors, despite the lower luminance.
Performance
While Lenovo offers the X1 Carbon in preconfigured Campus and TopSeller versions, their online shop allows you to configure the device relatively freely. For example, it is possible to combine a Core i5-8350U with 16 GB RAM or a large SSD. Customization is limited to the current Intel Kaby Lake R processors, 8/16 GB RAM and 256, 512 or 1024 GB PCIe SSDs. Dedicated graphics cards are unavailable, but the integrated UHD Graphics are good enough for most multimedia applications. Overall, the X1 Carbon 2018 packs powerful hardware which will cover most usage scenarios.
Processor - Core i7-8550U
The Core i7-8550U comes from Intel's current Kaby Lake-R range and is the direct successor to the Core i7-7500U, which we tested in last year's X1 Carbon. The big advantage of these new chips is the two additional cores, which means that the Core i7-8550U can run eight threads simultaneously at a base clock of 1.8 GHz. The lower base clock speed is the only difference between the 8550U and the more power-hungry 45 W chips. Thanks to Turbo-Boost the 8550U can increase its clock speed up to 4.0 GHz. This is 4.0 GHz for cores one and two and 3.7 GHz for cores three and four. The length of time by which the clock speed can be boosted depends on the extent to which the device can keep itself cool.
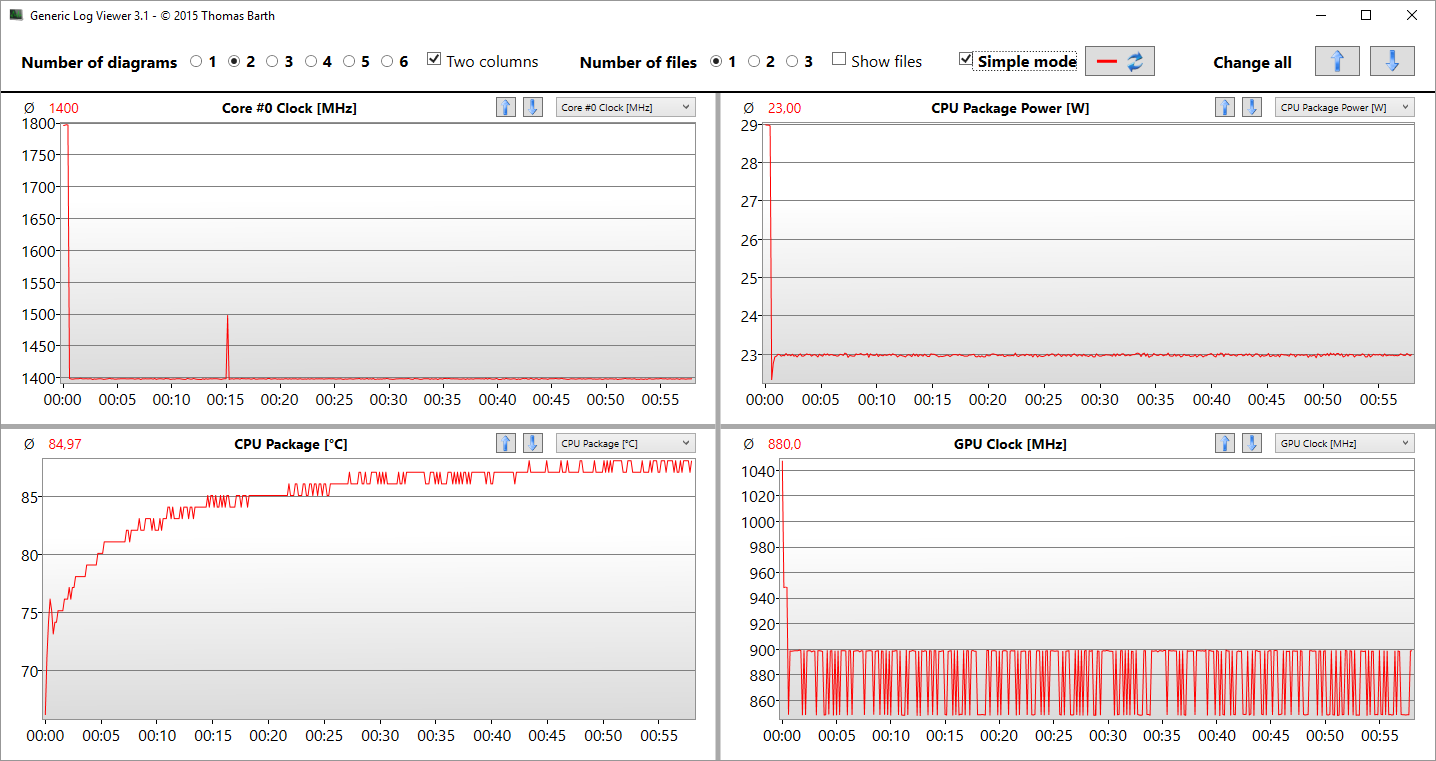
With last year's X1 Carbon, Lenovo raised the permanent thermal design power (TDP) to 25 W, while setting a rather conservative 75 °C temperature limit. This year, Lenovo has further increased the X1 Carbon's TDP and temperature limits, allowing the processor to boost up to 29 W for 28 seconds. This corresponds with a clock speed of between 3.1 and 3.2 GHz across all four cores. After this time, or once the laptop has reached 90 °C, the processor drops to 23 W and throttles down to 2.8 GHz across all cores. In the benchmarks, the X1 Carbon 2018 positions itself well among its competitors. It is worth bearing in mind that the Core i5-8250U is only marginally slower, especially in tests with multiple passes. While the Core i7-7500U keeps pace to some extent, it has less chance of doing so in multi-tests given that it only has half the number of cores and threads than the i7-8550U.
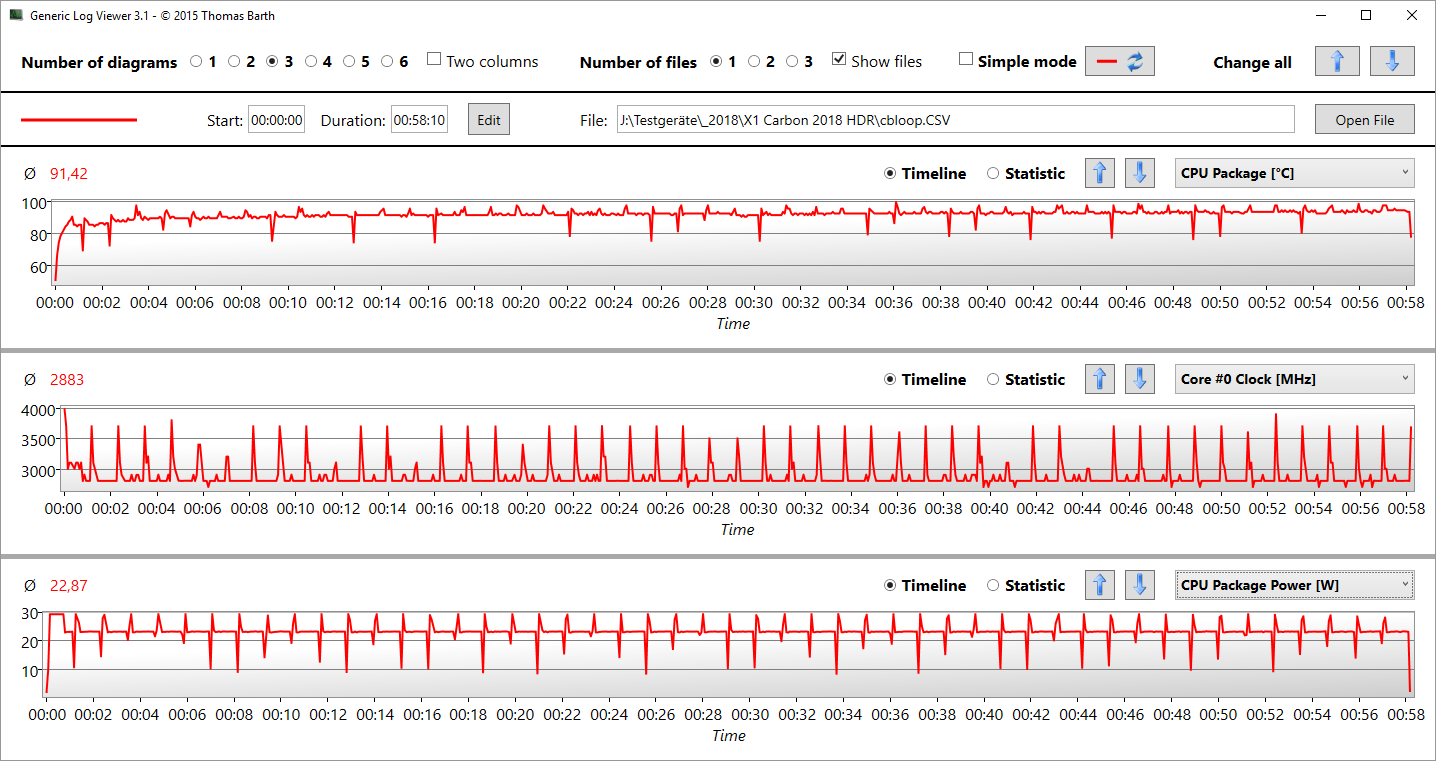
Using our Cinebench multi-loop we test the extent to which a laptop can maintain its initial performance. Thin devices such as the X1 Carbon often have problems here, typically thermal throttling by the second pass of the test. The good news is that Lenovo has removed the conservative 75 °C temperature limit of last year's X1 Carbon. In our tests we observed that CPU temperatures can reach beyond 90 °C. This corresponds to the increase in TDP too.
Note undervolting: We were able to reduce the processor core voltage by 110 mV, which increases the performance with similar temperatures and consumption figures. All the results are available in our dedicated article.
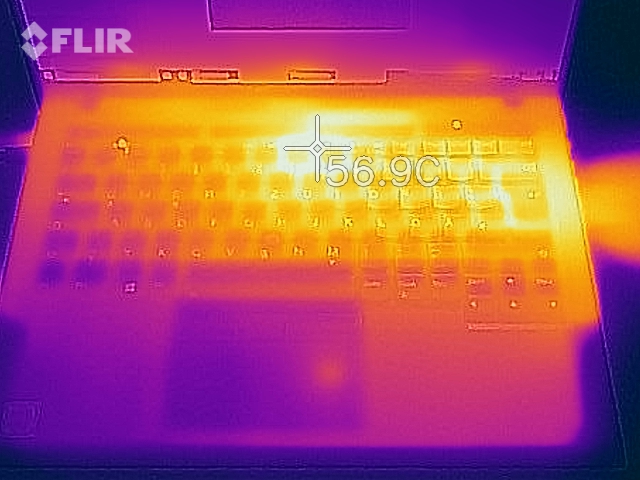
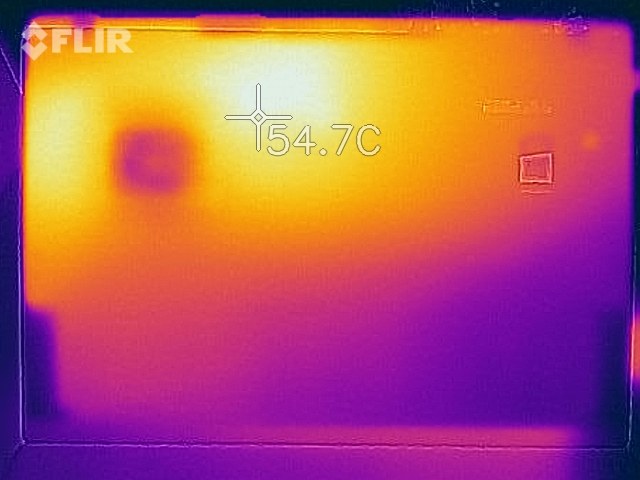
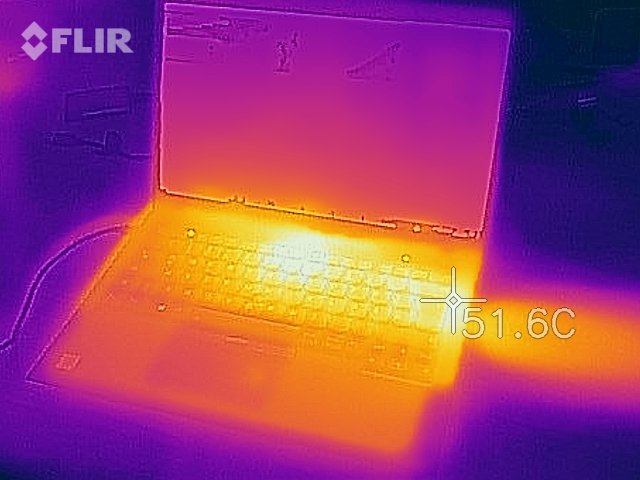
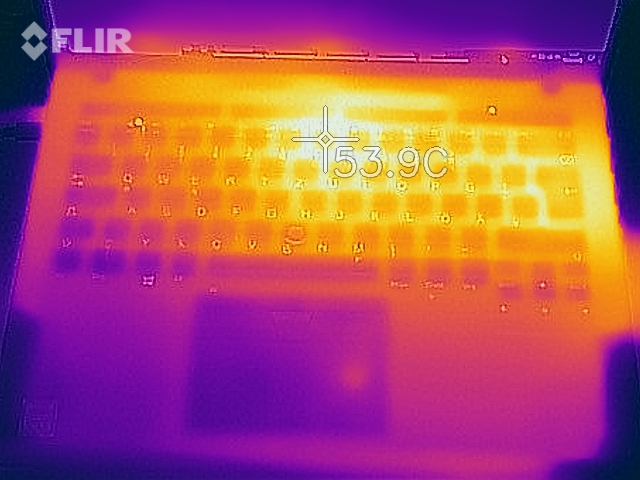
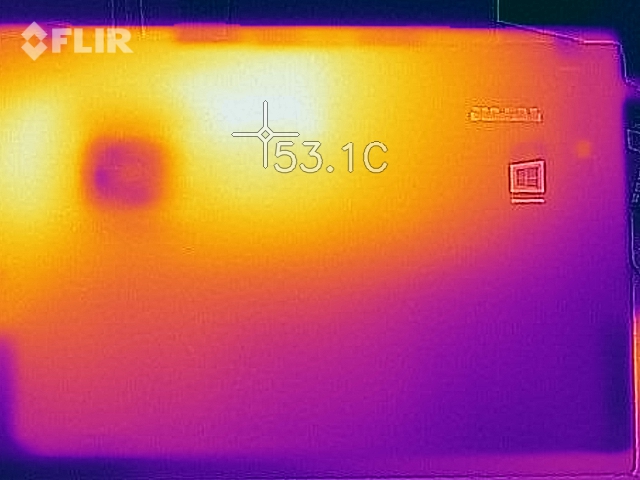
The processor can stably maintain a clock speed of 2.8 GHz across all cores at 23 W, but this comes at a cost of CPU temperatures reaching up to 99 °C. The following graphic shows the results of almost an hour's stress test. On average, the processor runs at just under 2.9 GHz and draws around 23 W, while consistently maintaining temperatures above 91 °C. These high CPU temperatures affect surface temperatures, as demonstrated by our thermal-imaging camera. When stress testing we measured the area around the F8 key at 54 °C, 50.3 °C above the fan grille, and 50.8 °C on the bottom case. Given these high temperatures we would recommend avoiding using the X1 Carbon on your lap if you are constantly stressing the system, and to ensure that it has good airflow too.
System Performance
You expect a smooth and responsive system when you buy an expensive business laptop, and the ThinkPad X1 Carbon 2018 does not disappoint. We did not experience any issues during our review and all our inputs were always executed without any delays. The test model also performs well in the synthetic PCMark 8 benchmarks, but it is only average in the Home and Work sub-scores. The brand-new SSD from Samsung might play a role, but you won't notice any practical effects.
| PCMark 8 Home Score Accelerated v2 | 3752 points | |
| PCMark 8 Creative Score Accelerated v2 | 5027 points | |
| PCMark 8 Work Score Accelerated v2 | 4664 points | |
| PCMark 10 Score | 3905 points | |
Help | ||
Storage devices - Samsung PM981
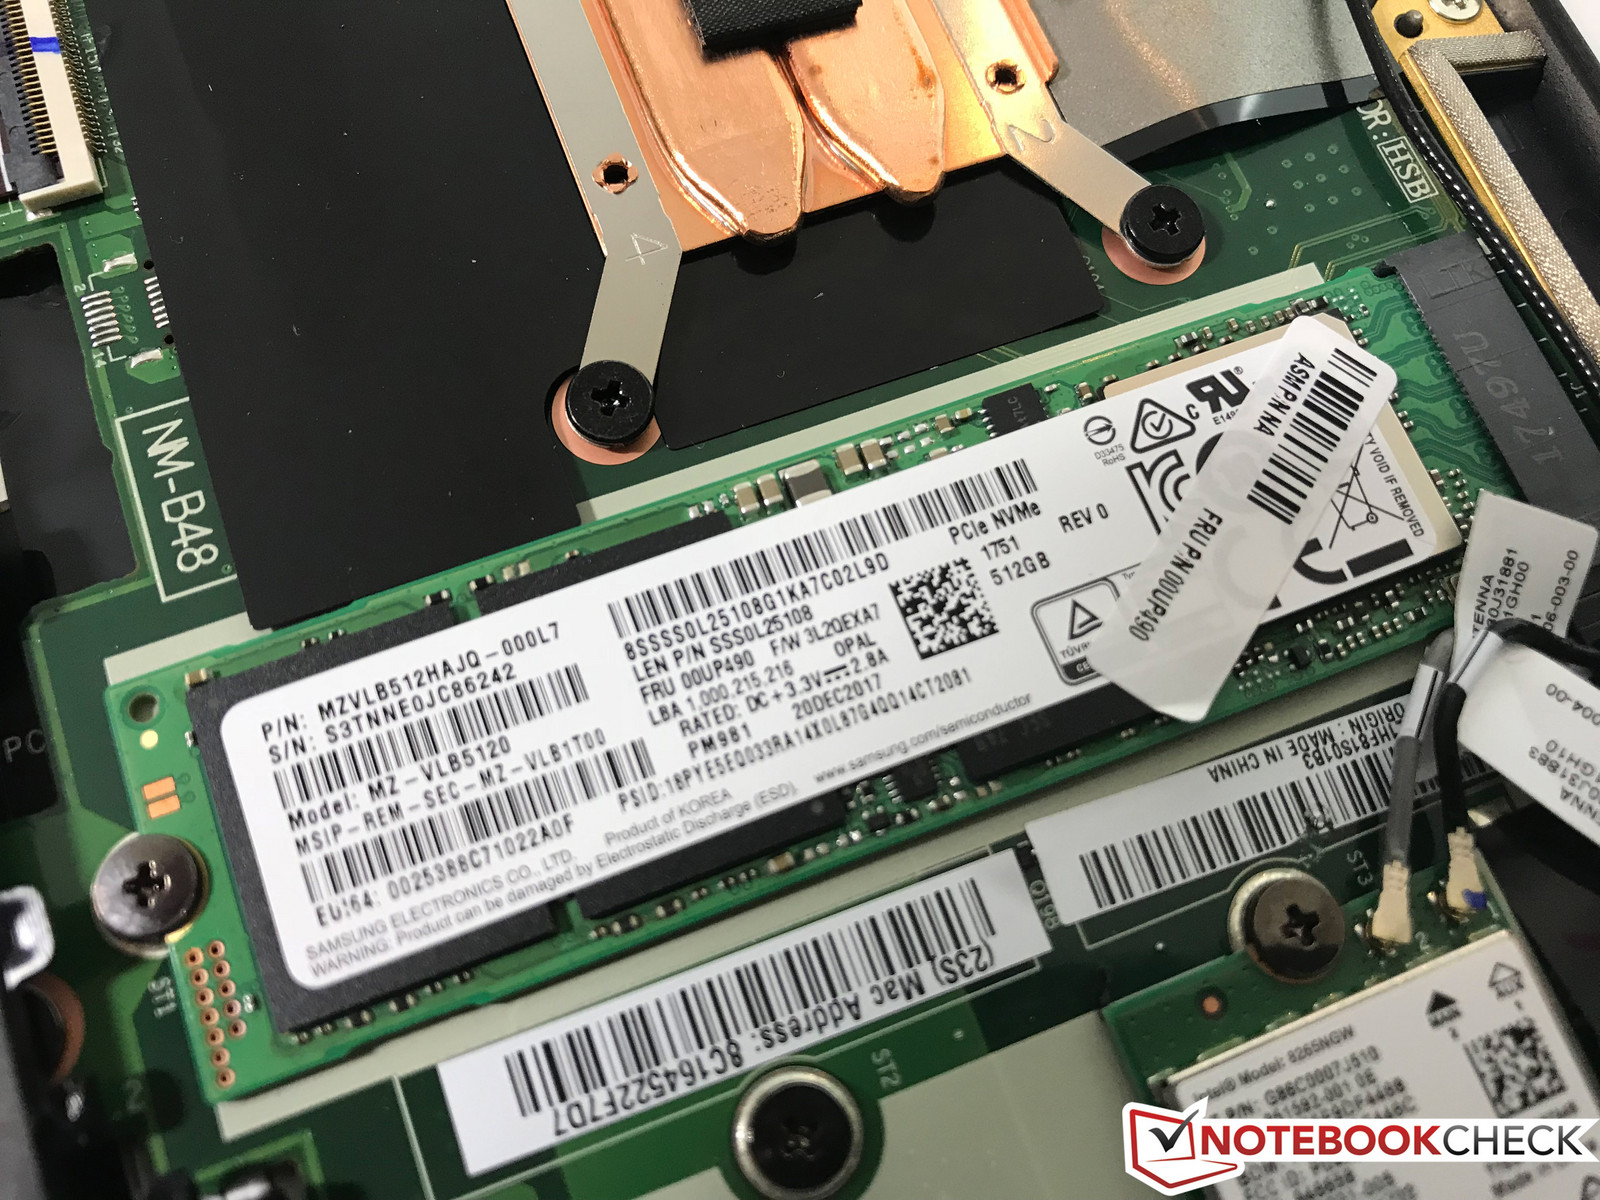
While the X1 Carbon ships with only fast PCIe SSDs, experience tells us that not all devices will contain the same SSD and that manufacturers sometimes even vary the brand of SSD that is used. Our test device has a 512 GB M.2-2280 SSD from Samsung. We were surprised to see that this is the PM981, which is the successor to the popular PM961. The PM981 includes a new Polaris V2 controller and has a 64-layer TLC 3D NAND.
The CrystalDiskMark 5 benchmark results are excellent and even exceed the stated 3,000 MB/s sequential read and 1,800 MB/s sequential write speeds. Currently then it would only make sense to replace the SSD if you needed more storage. There are no electronic noises from the drive either. Further comparisons with other drives can be found in our technical section.

GPU Performance
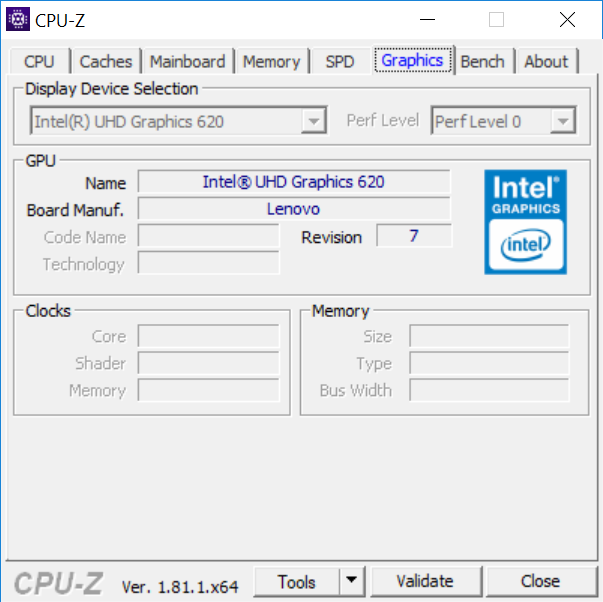
The integrated graphics adapter of the Kaby Lake Refresh processors is not very interesting. It is now called UHD Graphics 620, but it is just a rebranded HD Graphics 620. Only the core clock is a bit higher depending on the CPU model, but that's not really noticeable in this performance class. The X1 Carbon 2018 can utilize the full performance of the iGPU thanks to the dual-channel memory configuration, and our test model is only beaten by the more powerful Iris Plus 650 GPU in the MacBook Pro 13 and obviously the dedicated GTX 1050 GPU in the Surface Book 2. You can also attach an external GPU via Thunderbolt 3 if you need more graphics power.
The UHD Graphics 620 is still a solid choice for a business laptop. It performs really well in multimedia scenarios and even high-resolution videos are no problem for the integrated decoder. Small CAD projects are possible as well.
The 3DMark 11 performance is a bit lower on battery power (-7 %), and both the Graphics as well as the Physics result are affected. More technical information and benchmarks for the UHD Graphics 620 are available here.
| 3DMark 11 Performance | 2143 points | |
| 3DMark Cloud Gate Standard Score | 9271 points | |
| 3DMark Fire Strike Score | 1178 points | |
Help | ||
Gaming Performance
Gaming enthusiast will not be happy with the UHD Graphics 620, but older or less-demanding titles run pretty well when you reduce the graphics details. DOTA 2 and Overwatch are two good examples, and we did not experience any major limitations due to the higher response times, either. More gaming benchmarks for the UHD Graphics 620 are listed in our tech section.
| low | med. | high | ultra | |
|---|---|---|---|---|
| BioShock Infinite (2013) | 56.9 | 36.2 | 30.4 | 10.4 |
| Dota 2 (2013) | 68.5 | 50.9 | 17.4 | |
| The Witcher 3 (2015) | 10.3 | |||
| Rise of the Tomb Raider (2016) | 110.7 | 49.3 | 32 | 14.5 |
| Overwatch (2016) | 71.6 | 36.4 | 17.5 |
Lenovo Thunderbolt Dock - Gaming with the GTX 1050
The ThinkPad X1 Carbon is definitely a device, which is often hooked to a docking station at your desk (in the office or at home). Besides the more traditional docking stations we had a look at in the Accessories section above, you can also use the Thunderbolt 3 port for more possibilities. Lenovo's Thunderbolt 3 Graphics Dock is one example. It takes care of the power supply, can drive up to three different displays, and you can attach multiple USB devices. The highlight is the integrated Nvidia GeForce GTX 1050 graphics, which increases the GPU performance of the X1 Carbon significantly. We will cover all the details of the Thunderbolt 3 Graphics Dock in a separate article.
The setup in combination with the X1 Carbon is unfortunately not only plug & play, because you can only use the charging functionality (65W similar to the original PSU) without the corresponding Lenovo drivers. After the installation, Microsoft shows the GTX 1050 graphics adapter and you can just download the latest GPU drivers from Nvidia. There are two ways to use the eGPU: in combination with the internal or external screen. The performance suffers a bit when you just use the internal display, but this also depends on the game. Most users will probably use the docking station in combination with an external screen, so we used this scenario for our gaming benchmarks.
There were no problems whatsoever during the benchmarks and the whole system was running very stable. The games also recognized the GTX 1050 and we were able to play without stutters or dropped frames. We even attached multiple hard drives to the docking station, but this did not cause any problems, either. The combination of Core i7-8550U and GeForce GTX 1050 can handle many modern games in medium/high settings at 1080p. The X1 Carbon is still no gaming laptop, but Lenovo's solution is interesting if you need a docking station anyway and would like to have more GPU performance.
| low | med. | high | ultra | |
|---|---|---|---|---|
| BioShock Infinite (2013) | 203.7 | 145.2 | 127.9 | 54.8 |
| Dota 2 (2013) | 116.4 | 101 | 82.3 | |
| The Witcher 3 (2015) | 81.7 | 50.3 | 31.7 | 16.4 |
| Rise of the Tomb Raider (2016) | 94.1 | 53.5 | 32.9 | 28.9 |
| Battlefield 1 (2016) | 104 | 71 | 38.5 | 35.2 |
| For Honor (2017) | 142.2 | 55.8 | 53 | 40.5 |
| Ghost Recon Wildlands (2017) | 62.2 | 31.7 | 29.2 | 13.8 |
| F1 2018 (2018) | 64 | 52 | 36 | 24 |
| Shadow of the Tomb Raider (2018) | 61 | 27 | 25 | 22 |
Emissions
System Noise
The fan control of the X1 Carbon 2018 does not work perfectly yet. The fan often starts spinning without any apparent reason and also reacts to load very quickly. One example: We wrote some parts of this review on the X1 Carbon with our web interface. We only had two Chrome tabs running and wrote some text, but the fan still kicked in from time to time for about 5-10 seconds (also on battery). This behavior should improve with upcoming BIOS revision, at least based on our experiences with the 2017 X1 Carbon.
The next problem, which is probably not going to change, is the high-pitched sound from the fan. You can also see it in our diagram below (sharp peak at lower-highs). The two fan speeds are not loud at 32.5 and 35.1 dB(A), respectively, but they are a bit a annoying due to the high-pitched characteristics.
Positive: We did not detect any electronic noises or coil whine on our test model.
Update BIOS 1.27: The fan behavior is improved on battery power and we cannot notice any unnecessary activity, but the subjective impression did not change on mains. The fan will occasionally ramp up for a short time even while idling (independent of the power profile).
Noise level
| Idle |
| 28.9 / 28.9 / 32.5 dB(A) |
| Load |
| 35.1 / 35.1 dB(A) |
 | ||
30 dB silent 40 dB(A) audible 50 dB(A) loud |
||
min: | ||
Temperature
We already saw the temperature development during our Cinebench loop, and we can confirm the behavior with our stress test. Up to 52 °C at the top of the base unit and up to 48 °C at the bottom is just slightly cooler compared to the CPU loop. The following diagram illustrates the behavior of the SoC during the stress test: The power consumption is steady at 23 W (1.4 GHz GPU, 850-900 MHz GPU), while the performance is further reduced to 15 W on battery power (1.2 GHz CPU, 700 MHz GPU).
Once again, we want to emphasize that these high temperatures only occur under sustained high workloads. We still prefer this solution compared to last year's very conservative temperature limit. The target audience for the X1 Carbon 2018 will most likely only experience high workloads for short amounts of time, where the processor can at least utilize more of its performance potential.
Idling or light workloads, including high-res video playback or text-editing, do not really warm up the device at all and you can use it on your lap without reservations.
(-) The maximum temperature on the upper side is 52.6 °C / 127 F, compared to the average of 34.3 °C / 94 F, ranging from 21.2 to 62.5 °C for the class Office.
(-) The bottom heats up to a maximum of 48.2 °C / 119 F, compared to the average of 36.8 °C / 98 F
(+) In idle usage, the average temperature for the upper side is 22.8 °C / 73 F, compared to the device average of 29.5 °C / 85 F.
(±) The palmrests and touchpad can get very hot to the touch with a maximum of 37.5 °C / 99.5 F.
(-) The average temperature of the palmrest area of similar devices was 27.5 °C / 81.5 F (-10 °C / -18 F).
Speakers
Movies look great on the HDR panel, but the two speakers located in the front section of the bottom panel cannot keep up. They are quite loud at up to 83 dB(A), but the sound just lacks power and dynamic range. The modules work well for typical office tasks including video conferences, but we recommend headphones or external speakers during music or video playback.
Lenovo ThinkPad X1 Carbon 2018-20KGS03900 audio analysis
(+) | speakers can play relatively loud (83.6 dB)
Bass 100 - 315 Hz
(-) | nearly no bass - on average 25.9% lower than median
(±) | linearity of bass is average (9.8% delta to prev. frequency)
Mids 400 - 2000 Hz
(+) | balanced mids - only 3.8% away from median
(±) | linearity of mids is average (9% delta to prev. frequency)
Highs 2 - 16 kHz
(+) | balanced highs - only 2.1% away from median
(+) | highs are linear (4% delta to prev. frequency)
Overall 100 - 16.000 Hz
(±) | linearity of overall sound is average (18.7% difference to median)
Compared to same class
» 34% of all tested devices in this class were better, 7% similar, 59% worse
» The best had a delta of 7%, average was 21%, worst was 53%
Compared to all devices tested
» 43% of all tested devices were better, 8% similar, 50% worse
» The best had a delta of 4%, average was 24%, worst was 134%
Apple MacBook Pro 13 2017 Touchbar i5 audio analysis
(+) | speakers can play relatively loud (86.2 dB)
Bass 100 - 315 Hz
(±) | reduced bass - on average 11.5% lower than median
(±) | linearity of bass is average (10.8% delta to prev. frequency)
Mids 400 - 2000 Hz
(±) | higher mids - on average 5.2% higher than median
(+) | mids are linear (6.4% delta to prev. frequency)
Highs 2 - 16 kHz
(+) | balanced highs - only 2.2% away from median
(+) | highs are linear (5.7% delta to prev. frequency)
Overall 100 - 16.000 Hz
(+) | overall sound is linear (11.9% difference to median)
Compared to same class
» 13% of all tested devices in this class were better, 5% similar, 82% worse
» The best had a delta of 5%, average was 18%, worst was 53%
Compared to all devices tested
» 9% of all tested devices were better, 2% similar, 89% worse
» The best had a delta of 4%, average was 24%, worst was 134%
Frequency diagram in comparison
Energy Management
Power Consumption
We were pleasantly surprised at the degree to which the X1 Carbon draws power given that it has an ultra-bright WQHD HDR display. Jumping from minimum to maximum brightness increases power consumption by around 5 W. The idle-max values were around 11.9 W even with keyboard backlighting turned on. A good comparison is with the Apple MacBook Pro 13 (Touch Bar). The resolution is slightly higher, but the panel is marginally smaller. Despite having similar brightness levels, the MBP 13 draws more power than the X1 Carbon at maximum brightness.
The increased TDP limit noticeably affects energy consumption under load. 52.5 W is needed for the first 28 seconds of our stress tests, after which the energy consumption settles at 43 W. While our test device comes with a more than sufficient 65 W USB-C power supply, the standard one only measures 45 W. The additional 1.19 Euros (~$1.47) for the 65 W version is negligible, and one which we recommend you purchasing.
| Off / Standby | |
| Idle | |
| Load |
|
Key:
min: | |
| Lenovo ThinkPad X1 Carbon 2018-20KGS03900 i5-8550U, UHD Graphics 620, Samsung SSD PM981 MZVLB512HAJQ, IPS, 2560x1440, 14" | HP EliteBook 840 G4-Z2V49ET ABD i5-7200U, HD Graphics 620, Samsung PM961 MZVLW256HEHP, TN, 1920x1080, 14" | Dell Latitude 13 7380 i7-7600U, HD Graphics 620, Samsung PM961 MZVLW256HEHP, IPS, 1920x1080, 13.3" | Apple MacBook Pro 13 2017 Touchbar i5 i5-7267U, Iris Plus Graphics 650, Apple SSD AP0256, IPS, 2560x1600, 13.3" | Dell Latitude 7480 i7-7600U, HD Graphics 620, Intel SSDSCKKF256H6, IPS, 1920x1080, 14" | Fujitsu LifeBook U747 i5-7200U, HD Graphics 620, Samsung MZYTY256HDHP, IPS LED, 1920x1080, 14" | |
|---|---|---|---|---|---|---|
| Power Consumption | 34% | 36% | -4% | 28% | 21% | |
| Idle Minimum * (Watt) | 3.8 | 2.9 24% | 3.2 16% | 2.8 26% | 4.32 -14% | 4.11 -8% |
| Idle Average * (Watt) | 8.9 | 5.6 37% | 5.5 38% | 10.9 -22% | 6.27 30% | 7.87 12% |
| Idle Maximum * (Watt) | 11.9 | 8.15 32% | 6.1 49% | 11.4 4% | 6.35 47% | 8.74 27% |
| Load Average * (Watt) | 47.5 | 30.6 36% | 29.5 38% | 55.4 -17% | 29.82 37% | 30.2 36% |
| Load Maximum * (Watt) | 52.5 | 31 41% | 32 39% | 57.5 -10% | 30.64 42% | 32.4 38% |
* ... smaller is better
Battery Runtime
Lenovo did not change the battery capacity for the 2018 model (still 57 Wh). This is sufficient for just 106 minutes under load, but this was also the case for the (much darker) 2017 SKU. The maximum runtime (idle, minimum brightness) is 22 hours.
However, we are more interested in our tests at an adjusted luminance of 150 nits (61% for our test model). The WLAN test determines about 8.5 hours, which just beats the 2017 FHD SKU. The old WQHD X1 Carbon on the other hand lasted almost 1.5 hours longer. We might see an improvement with upcoming BIOS revision, but it is also possible that the WQHD panel was just a bit more efficient at 150 nits. By the way, the stamina in the WLAN is identical to the current MacBook Pro 13 (TouchBar). Our video test runs for about 9.5 hours – all in all very decent results.
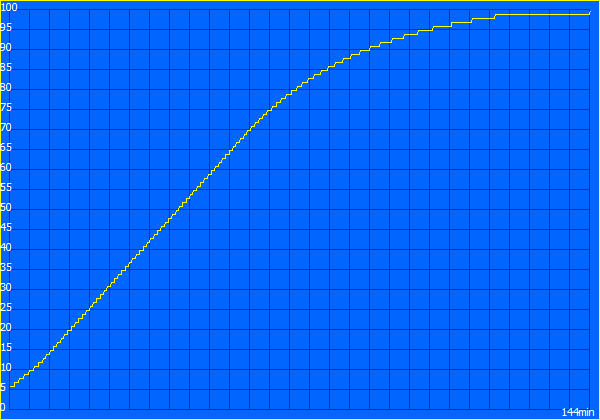
Lenovo states that the battery capacity will reach 80% after just 60 minutes of charging. We cannot quite confirm that, because it took 70 minutes in our test. The full capacity is available after 144 minutes. The charging time is not reduced when the X1 Carbon is sitting in the docking station with the 135 W power adapter.
Update: The FHD model of the ThinkPad X1 Carbon 2018 (otherwise identical components) lasts around 10 hours (601 minutes) in the WLAN test.
| Lenovo ThinkPad X1 Carbon 2018-20KGS03900 i5-8550U, UHD Graphics 620, 57 Wh | Lenovo ThinkPad X1 Carbon 2018-20KGS03800 i5-8550U, UHD Graphics 620, Wh | Lenovo ThinkPad X1 Carbon 2017-20HQS03P00 i7-7500U, HD Graphics 620, 57 Wh | Lenovo ThinkPad X1 Carbon 2017-20HR006FGE i5-7200U, HD Graphics 620, 57 Wh | Lenovo ThinkPad T480s-20L8S02D00 i5-8250U, UHD Graphics 620, 57 Wh | Dell Latitude 7480 i7-7600U, HD Graphics 620, 60 Wh | HP EliteBook 840 G4-Z2V49ET ABD i5-7200U, HD Graphics 620, 51 Wh | Fujitsu LifeBook U747 i5-7200U, HD Graphics 620, 50 Wh | Apple MacBook Pro 13 2017 Touchbar i5 i5-7267U, Iris Plus Graphics 650, 49.2 Wh | |
|---|---|---|---|---|---|---|---|---|---|
| Battery runtime | 15% | 7% | 16% | 16% | 50% | 29% | -6% | -20% | |
| H.264 (h) | 9.4 | 11.9 27% | 12 28% | 9.9 5% | 8.2 -13% | 6.9 -27% | |||
| WiFi v1.3 (h) | 8.7 | 10 15% | 8.3 -5% | 10.1 16% | 9 3% | 12 38% | 9.5 9% | 7.2 -17% | 8.7 0% |
| Load (h) | 1.8 | 1.8 0% | 2.1 17% | 2.9 61% | 3.1 72% | 2 11% | 1.2 -33% |
Verdict
Pros
Cons
The 2018 version of the ThinkPad X1 Carbon did not change that much compared to the previous model. The chassis is basically identical, and Lenovo only changed some visual details. We like the black logos and hinges, but the new colored X1 logo on the lid takes time getting used to. The 14-inch chassis is extremely mobile with a weight of just 1.1 kg, but this does not really affect the stability. Lenovo reworked the ports, because the Thunderbolt ports and the proprietary network connector at the left act as the new mechanical docking connector.
The optional HDR WQHD panel is one of the two new major features. Lenovo advertises a luminance of 500 nits, and our measurements determine an even brighter panel. The color gamut is also very good and the additional price for the HDR option is very fair. However, we cannot recommend the screen for every user. The biggest problem is the very glossy panel surface, which can also be an issue indoors. There is also a slight red hue depending on the viewing angle. The playback of HDR content has been updated as well and platforms like YouTube, Netflix, or Amazon recognize the HDR screen and provide the corresponding quality. The X1 Carbon cannot quite keep up with expensive TVs, but HDR movies still look great on the 14-inch screen.
Intel's new mobile quad-core ULV processor is the second new component. We have already seen many different results from the latest generation of ULV processors, and there are also big changes in Lenovo's own product lineup when it comes to the performance utilization. Last year's X1 Carbon had a pretty conservative temperature limit, but Lenovo leaves much more headroom for the CPU this time. This results in higher surface temperatures under sustained workloads, but you can also use more performance. The performance utilization is decent for a slim device, but it begs the questions whether the Core i7 makes much sense over the Core i5. The high clocks of the i7 (up to 4 GHz) quickly result in high temperatures, so the fan kicks in sooner. Upcoming BIOS updates should help in this respect, though.
Lenovo's optional HDR panel is a very good display, but it is not the right choice for all users due to the very glossy surface. The matte WQHD panel might be the better option if you are often on the road. Every SKU is equipped with an excellent keyboard, and they also come with the combination of modern USB Type-C (TB3) and standard USB Type-A ports.
The battery runtime did not change all that much, but our previous WQHD SKU lasted a bit longer. There is a trend towards slimmer devices with all the good and bad stuff connected with this development, and there are two aspects we really appreciate with this in mind. Lenovo not only includes modern Thunderbolt 3 ports but also includes regular USB Type-A connectors, which makes the handling of USB drives or other peripherals that much more convenient. You also get one of the best keyboards around (not only compared to other slim laptops) and it is a joy to use, especially for frequent writers.
Unfortunately, Lenovo sticks with the complicated situation for the WWAN modules. You have to buy a model with LTE included if you need it, because the required antennas are otherwise not integrated. We would have also liked to see Intel's latest Wi-Fi modules for Lenovo's flagship Ultrabook.
Lenovo ThinkPad X1 Carbon 2018-20KGS03900
- 03/04/2018 v6 (old)
Andreas Osthoff
Price comparison

