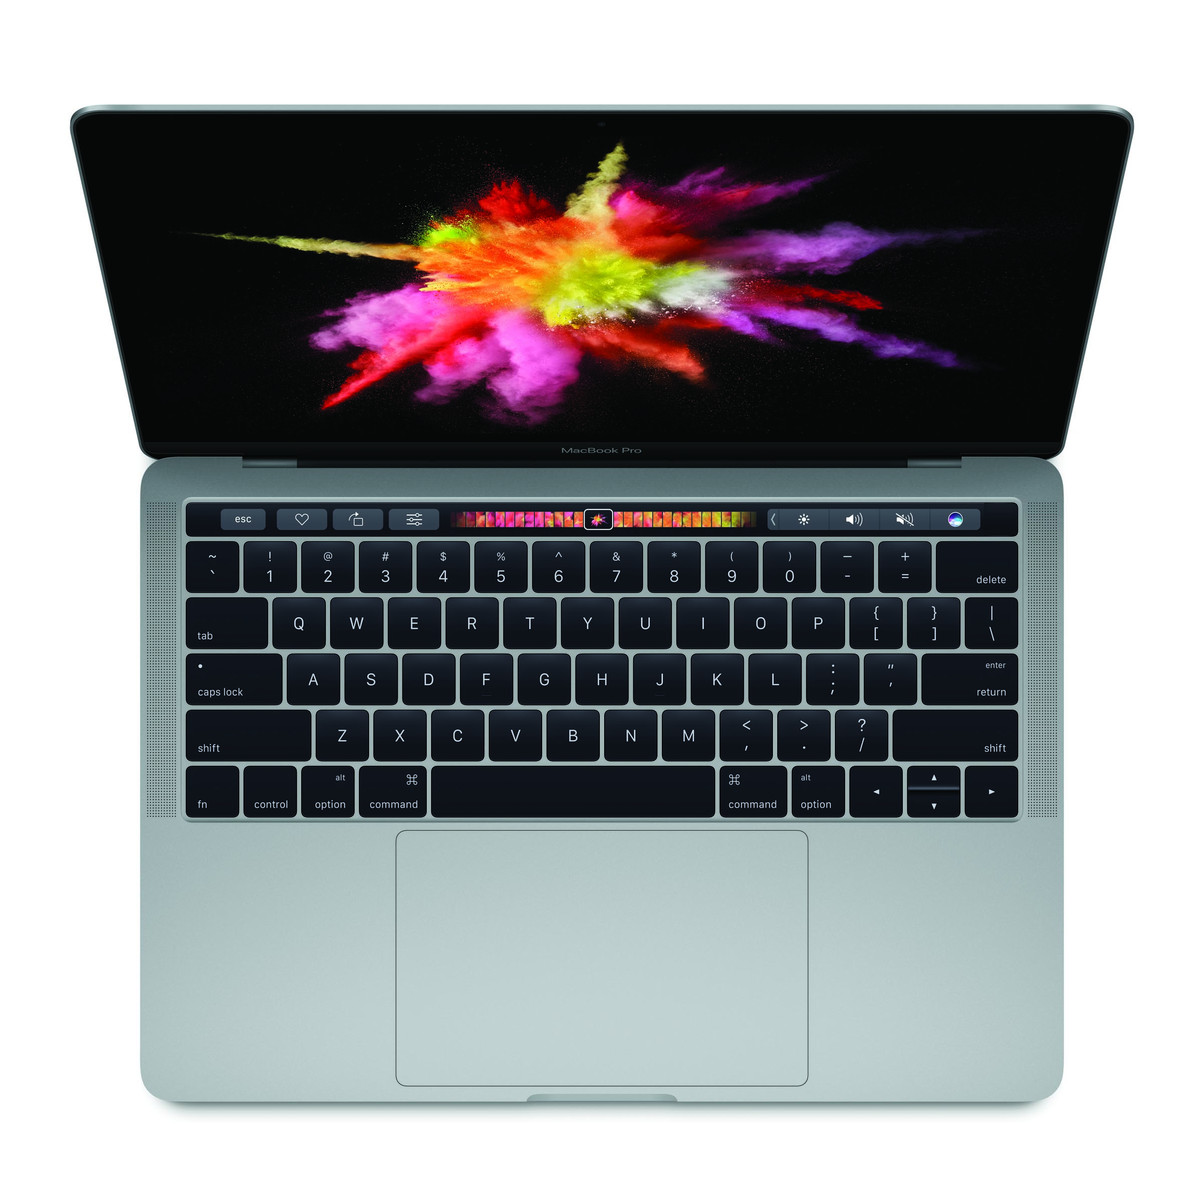
Apple MacBook Pro 13 (Mid 2017, i5, Touch Bar) Review

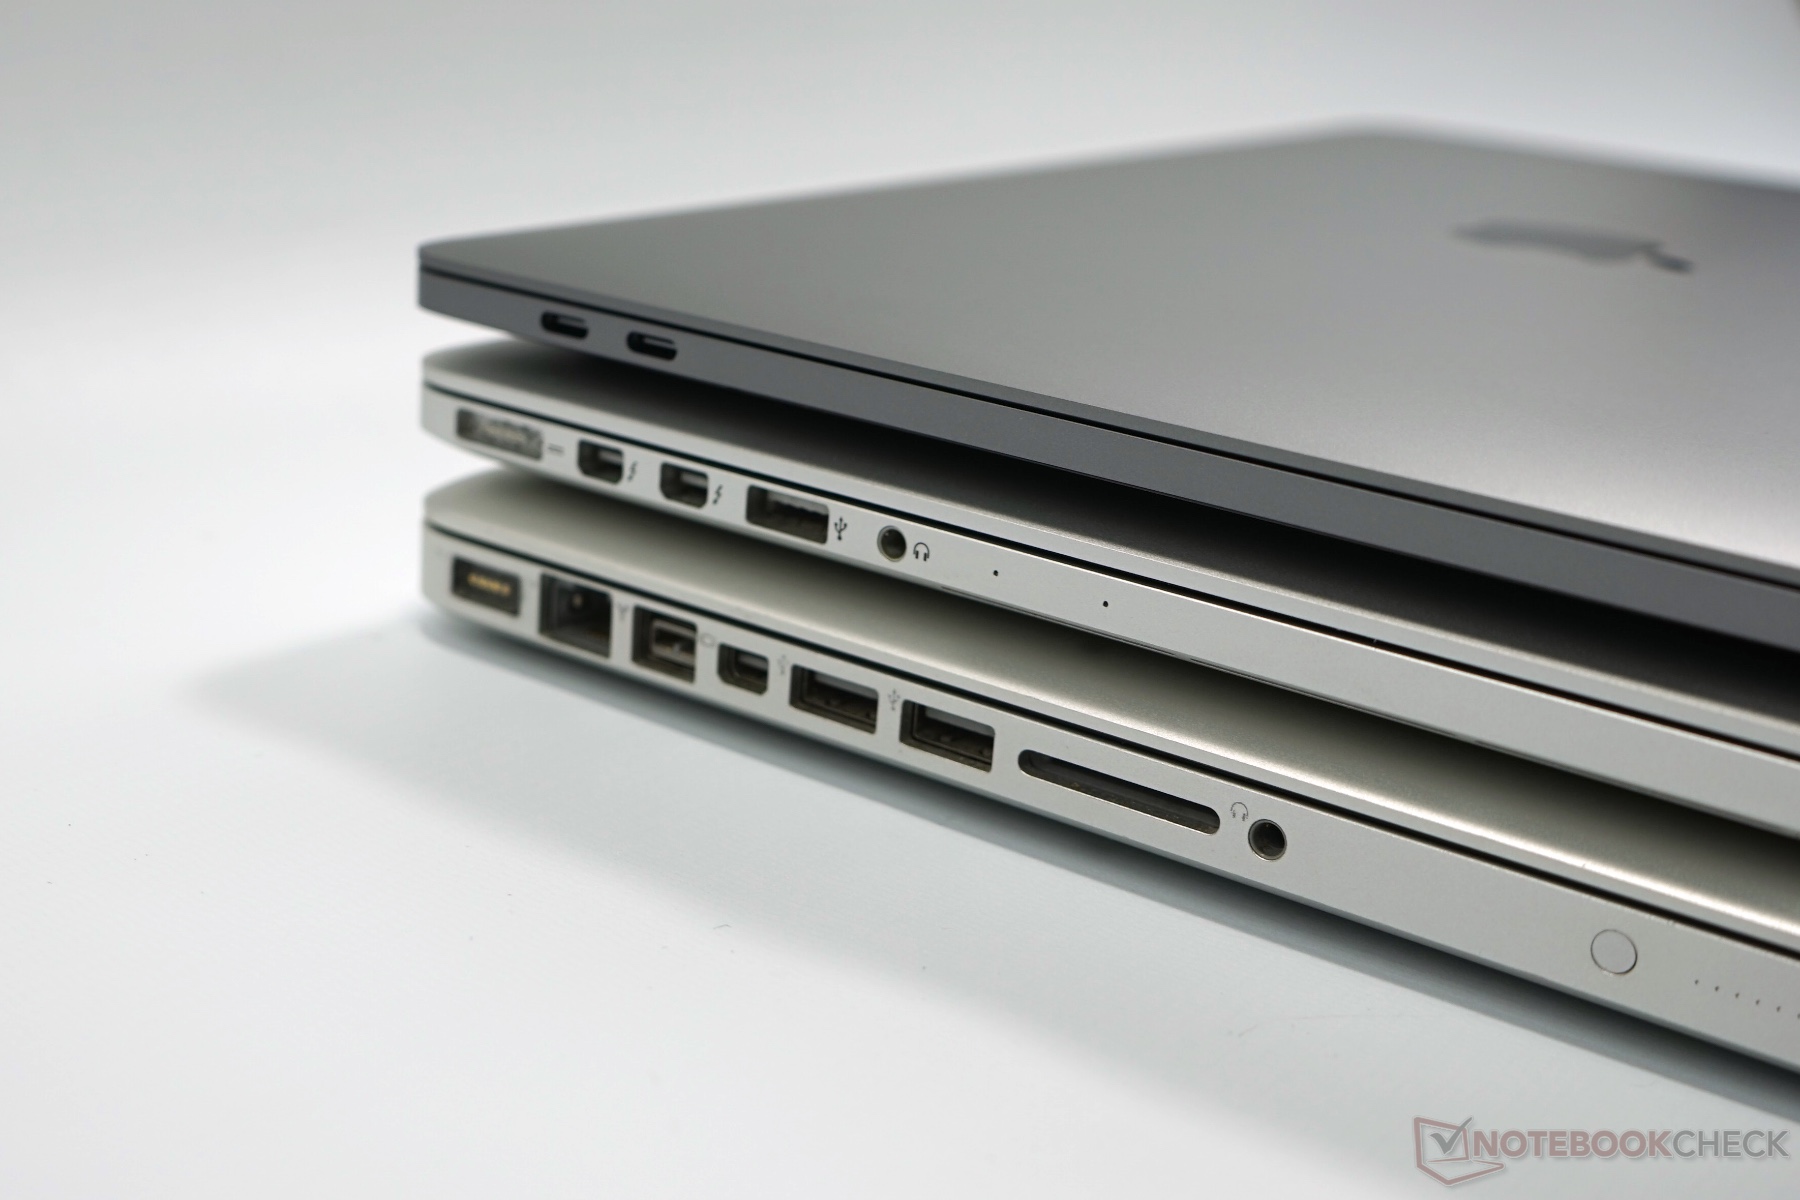
The Kaby Lake chips were not ready for the redesign of the Apple MacBook Pro 13 at the end of 2016, so Apple launches an update after just 8 months. Besides the mentioned Kaby Lake processors, including the integrated Iris Plus Graphics 650 GPU, the manufacturer also includes faster SSDs. The other components, including the case, did not change. Apple once again offers two models of the 13-inch system, one with the Touch Bar and one without. The more expensive model with the OLED strip above the keyboard also gets more powerful 28-watt processors (vs. 15 watts for the model without Touch Bar), more Thunderbolt ports and a slightly smaller battery. The old MacBook Pro 13 (old design, Broadwell) was discontinued and is not available anymore.
| MacBook Pro 13 without Touch Bar | MacBook Pro 13 with Touch Bar | |
| Processor | Core i5 2.3 GHz (Kaby Lake, 15 W) Core i7 2.5 GHz (Kaby Lake, 15 W) |
Core i5 3.1 GHz (Kaby Lake, 28 W) Core i5 3.3 GHz (Kaby Lake, 28 W) Core i7 3.5 GHz (Kaby Lake, 28 W) |
| GPU | Intel Iris Plus Graphics 640 | Intel Iris Plus Graphics 650 |
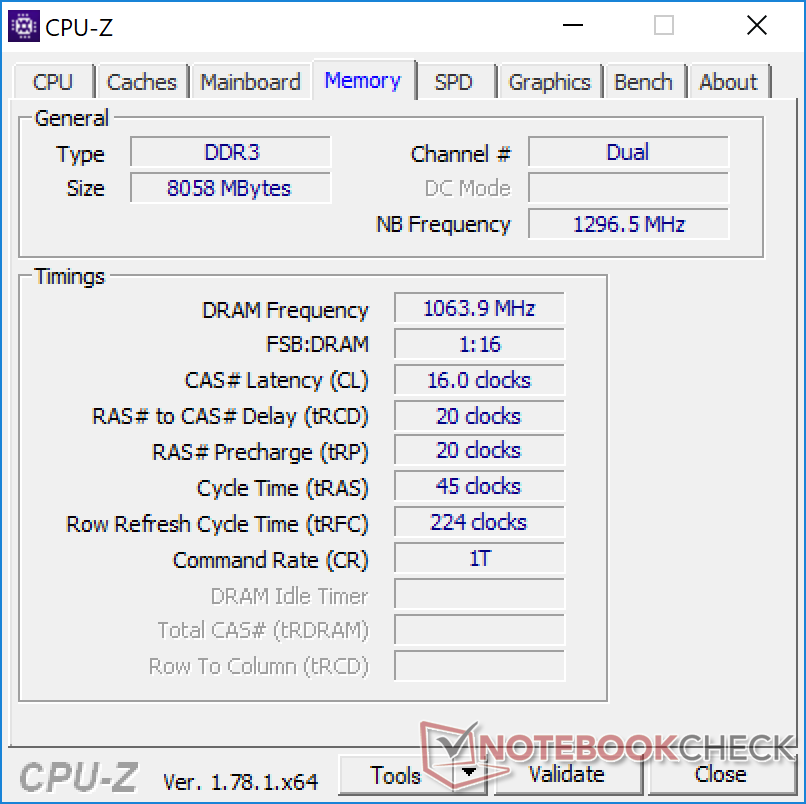
| RAM | 8 GB LPDDR3-2133 16 GB LPDDR3-2133 |
8 GB LPDDR3-2133 16 GB LPDDR3-2133 |
| SSD | 128 GB / 256 GB / 512 GB / 1 TB | 256 GB / 512 GB / 1 TB |
| Display | 13.3-inch IPS 2560x1600 pixels | 13.3-inch IPS 2560x1600 pixels |
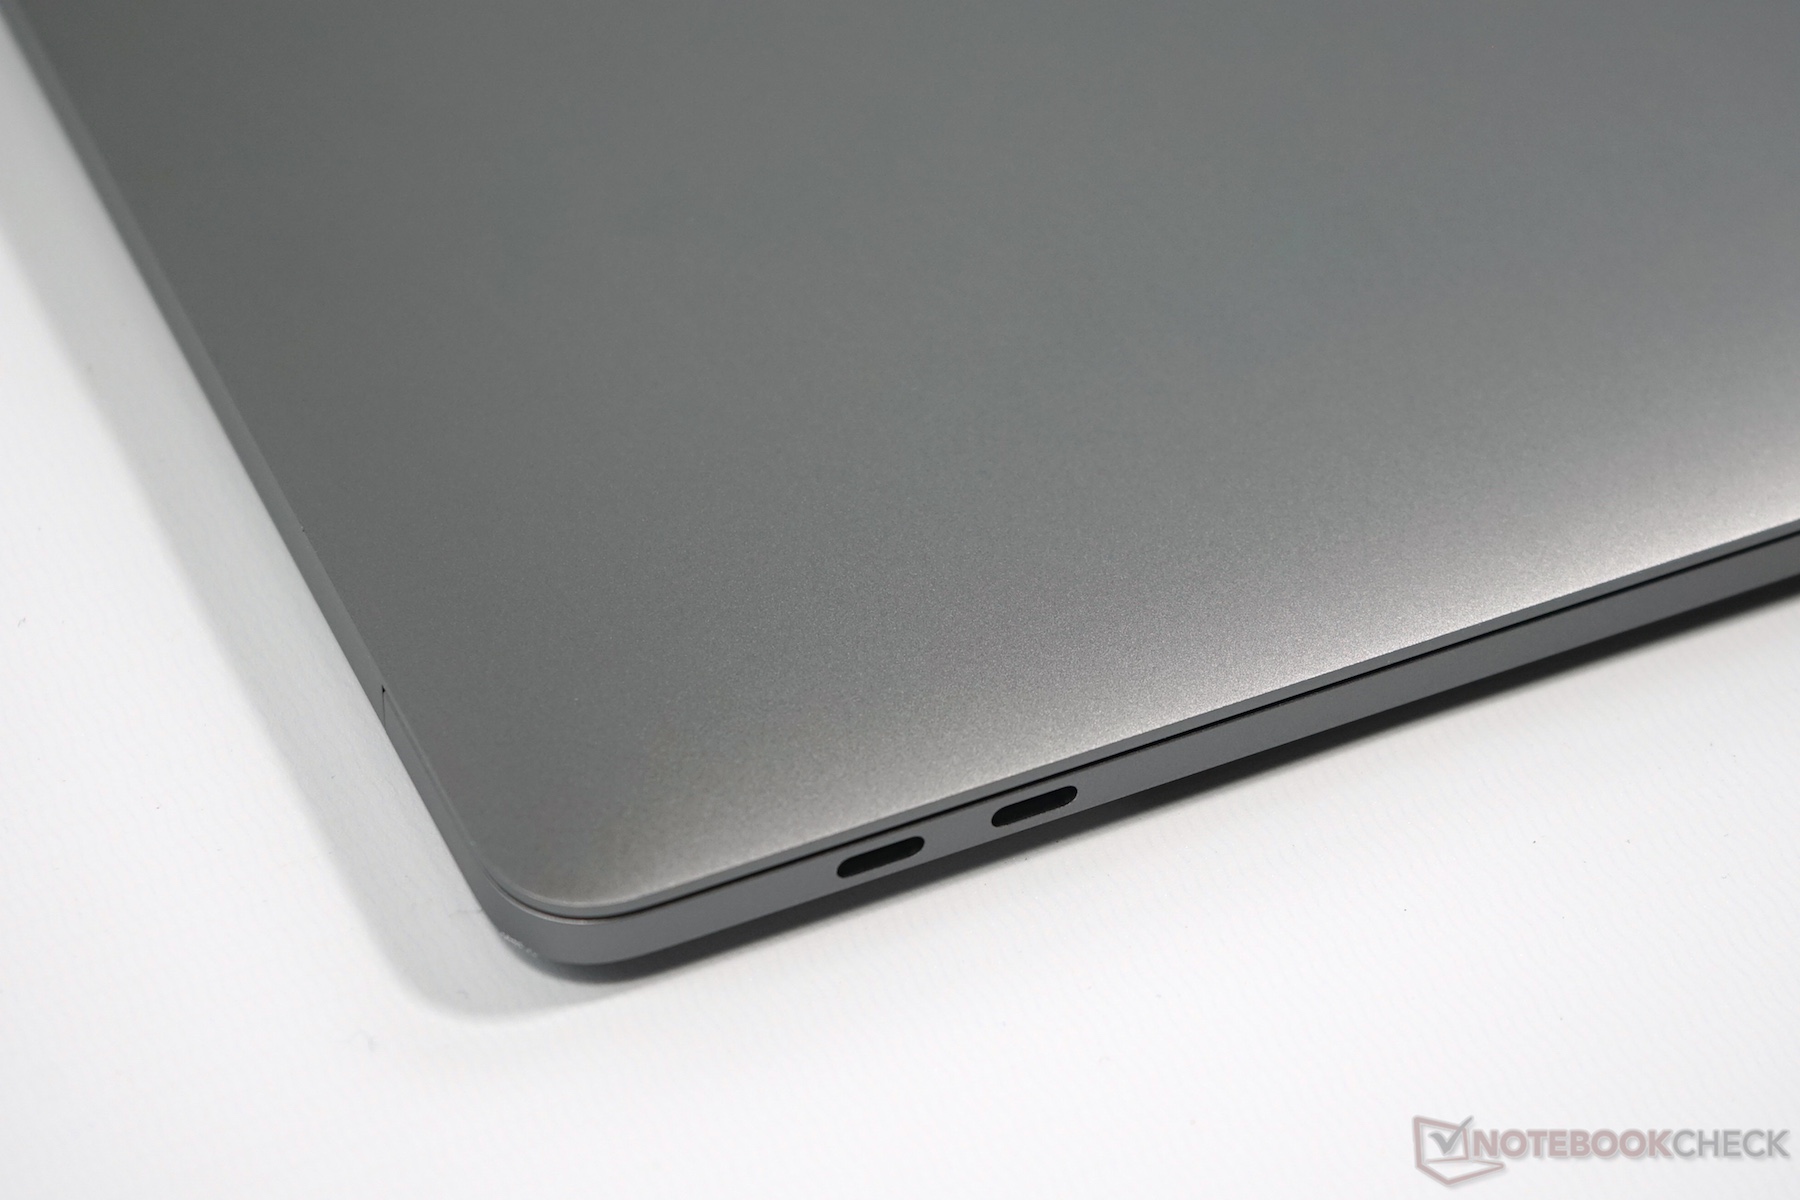
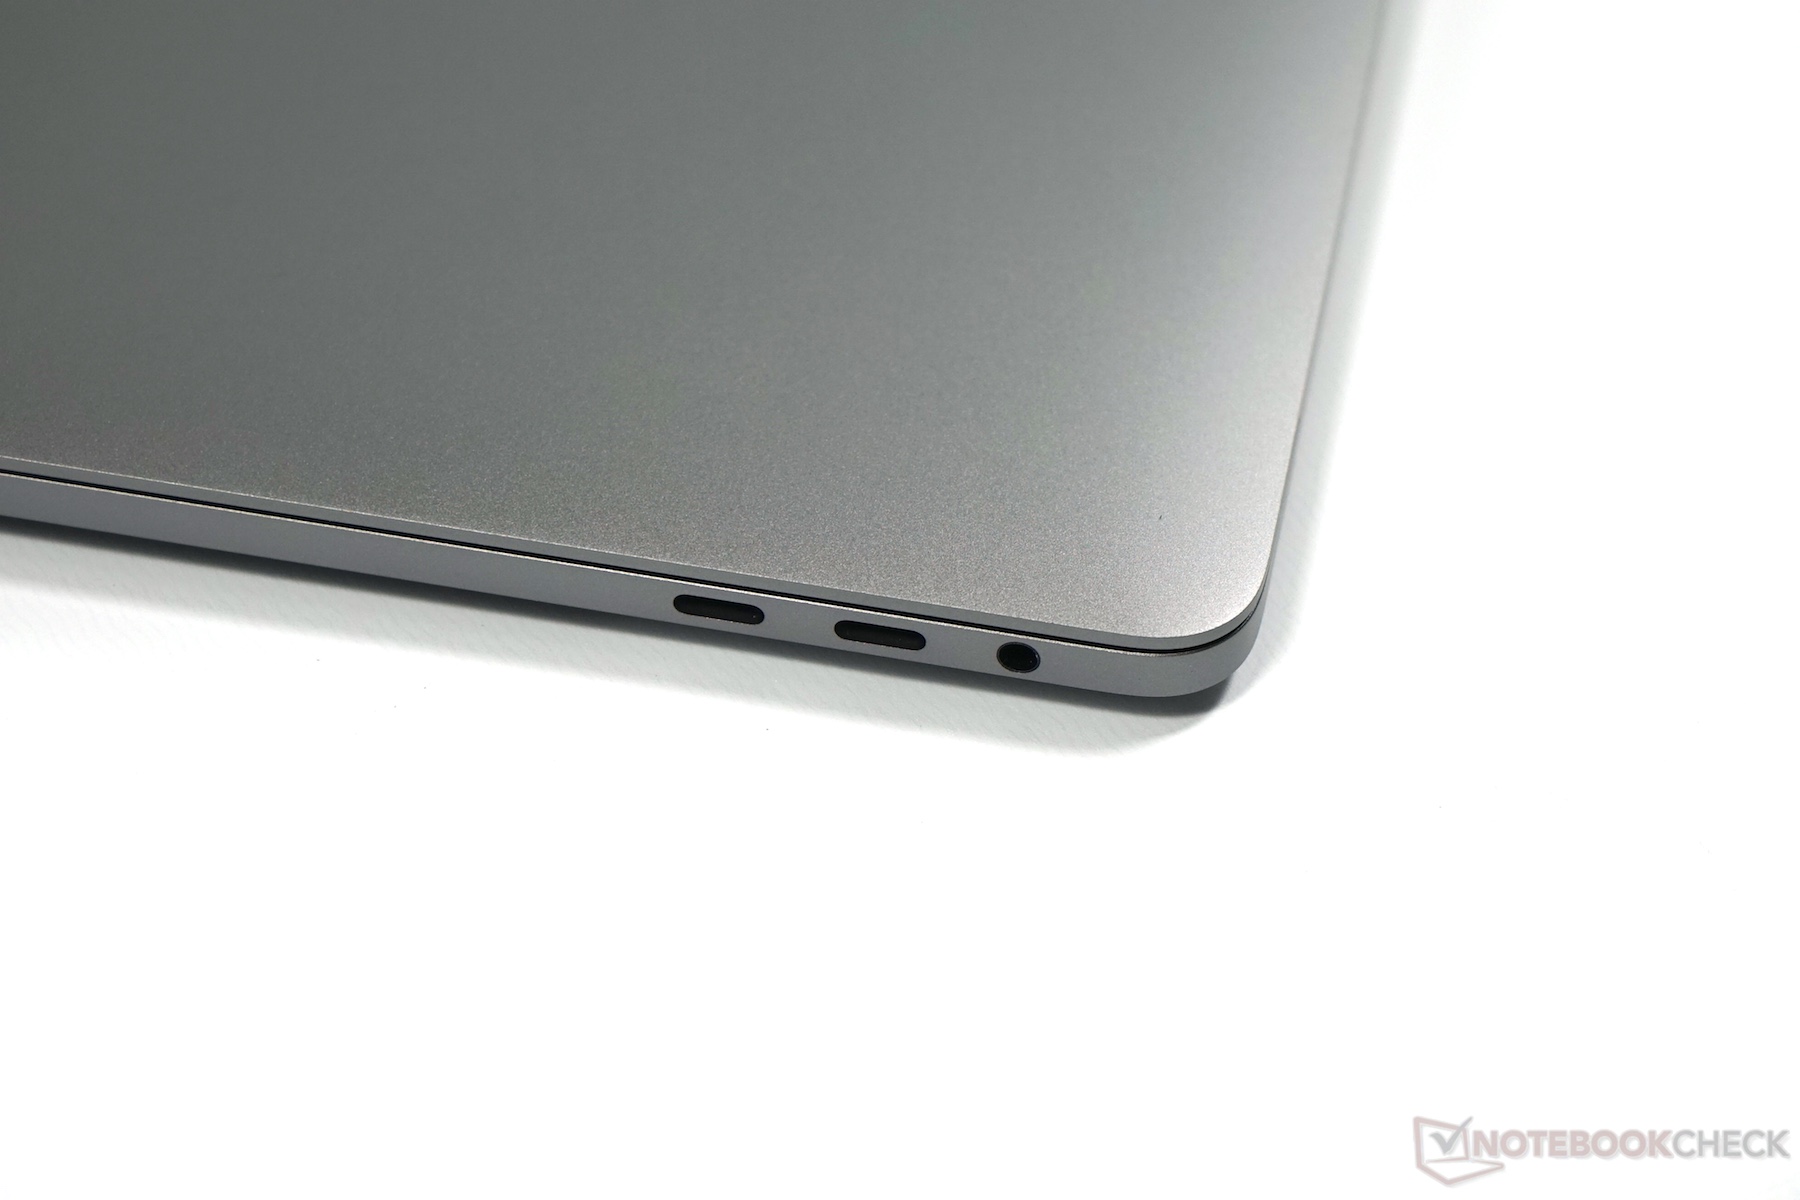
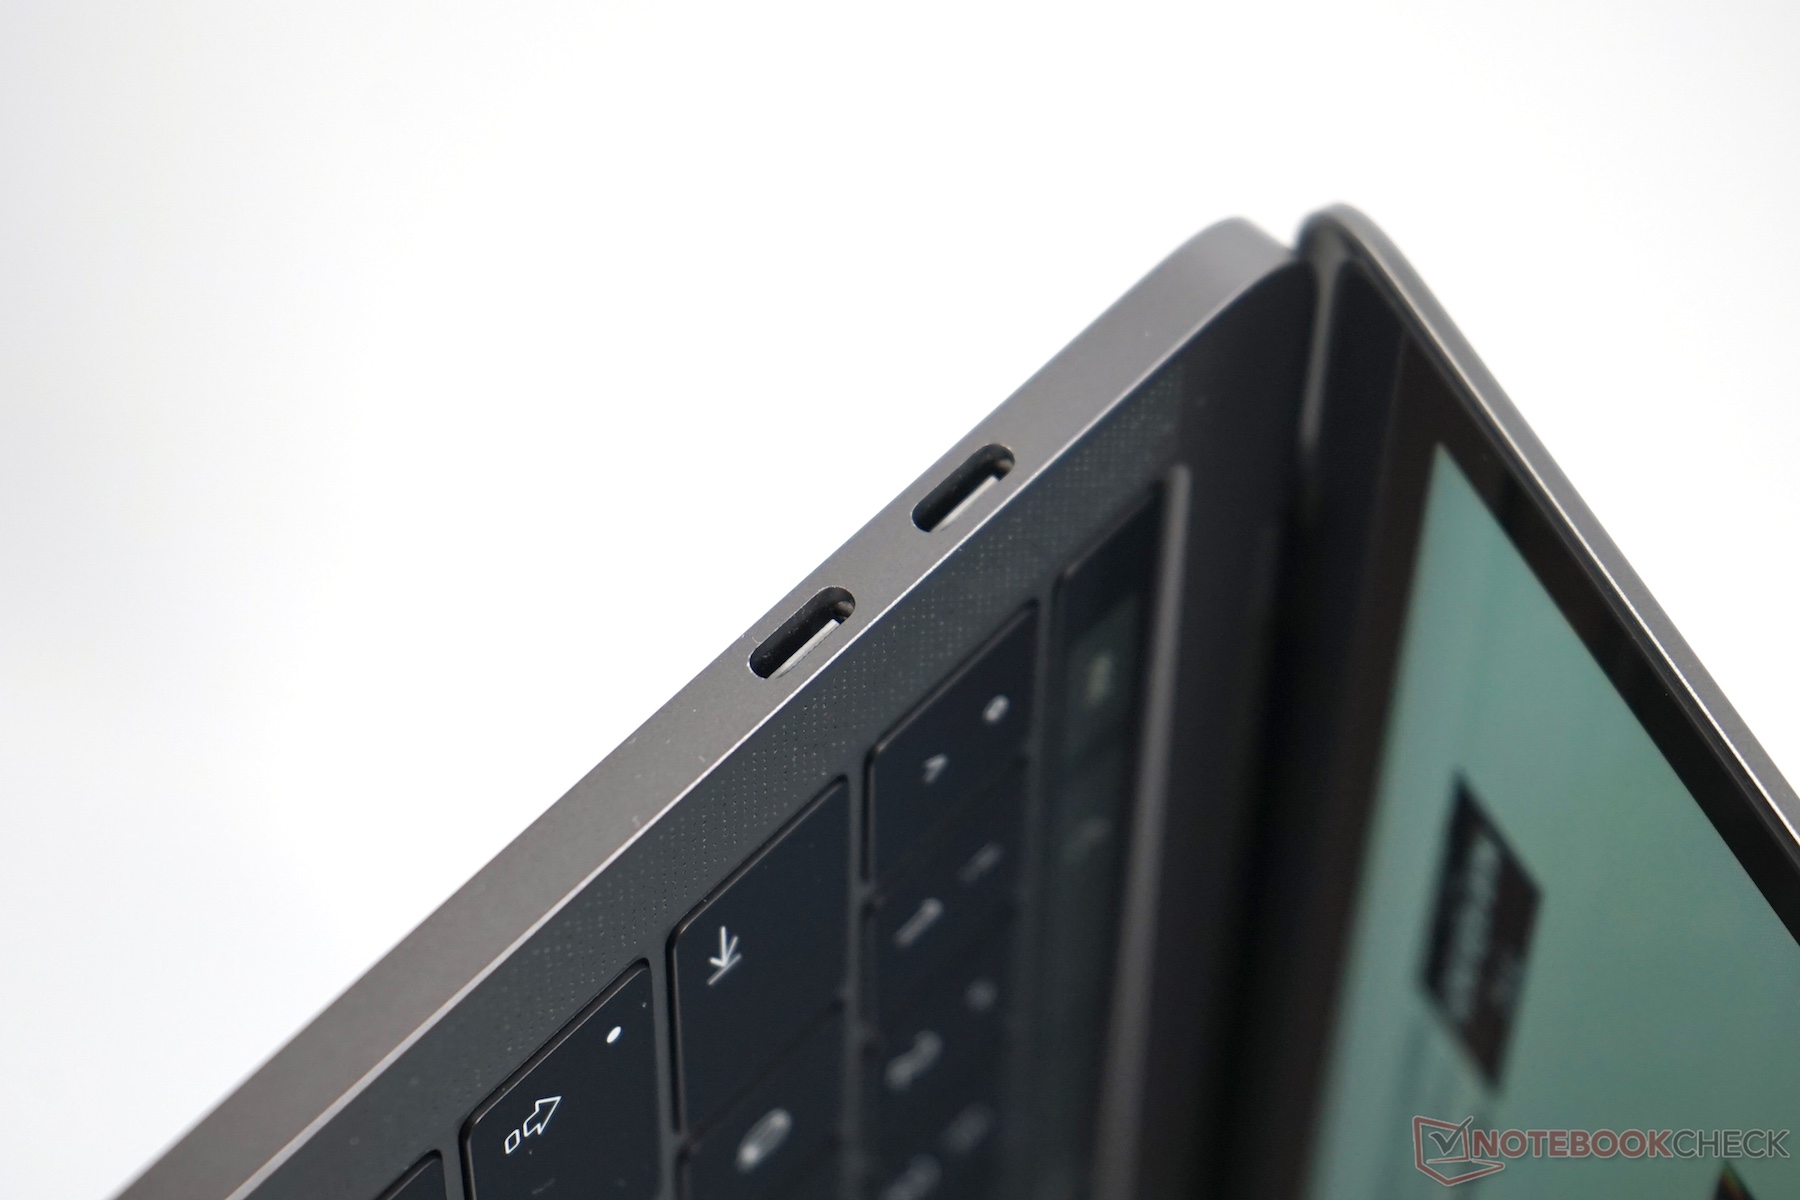
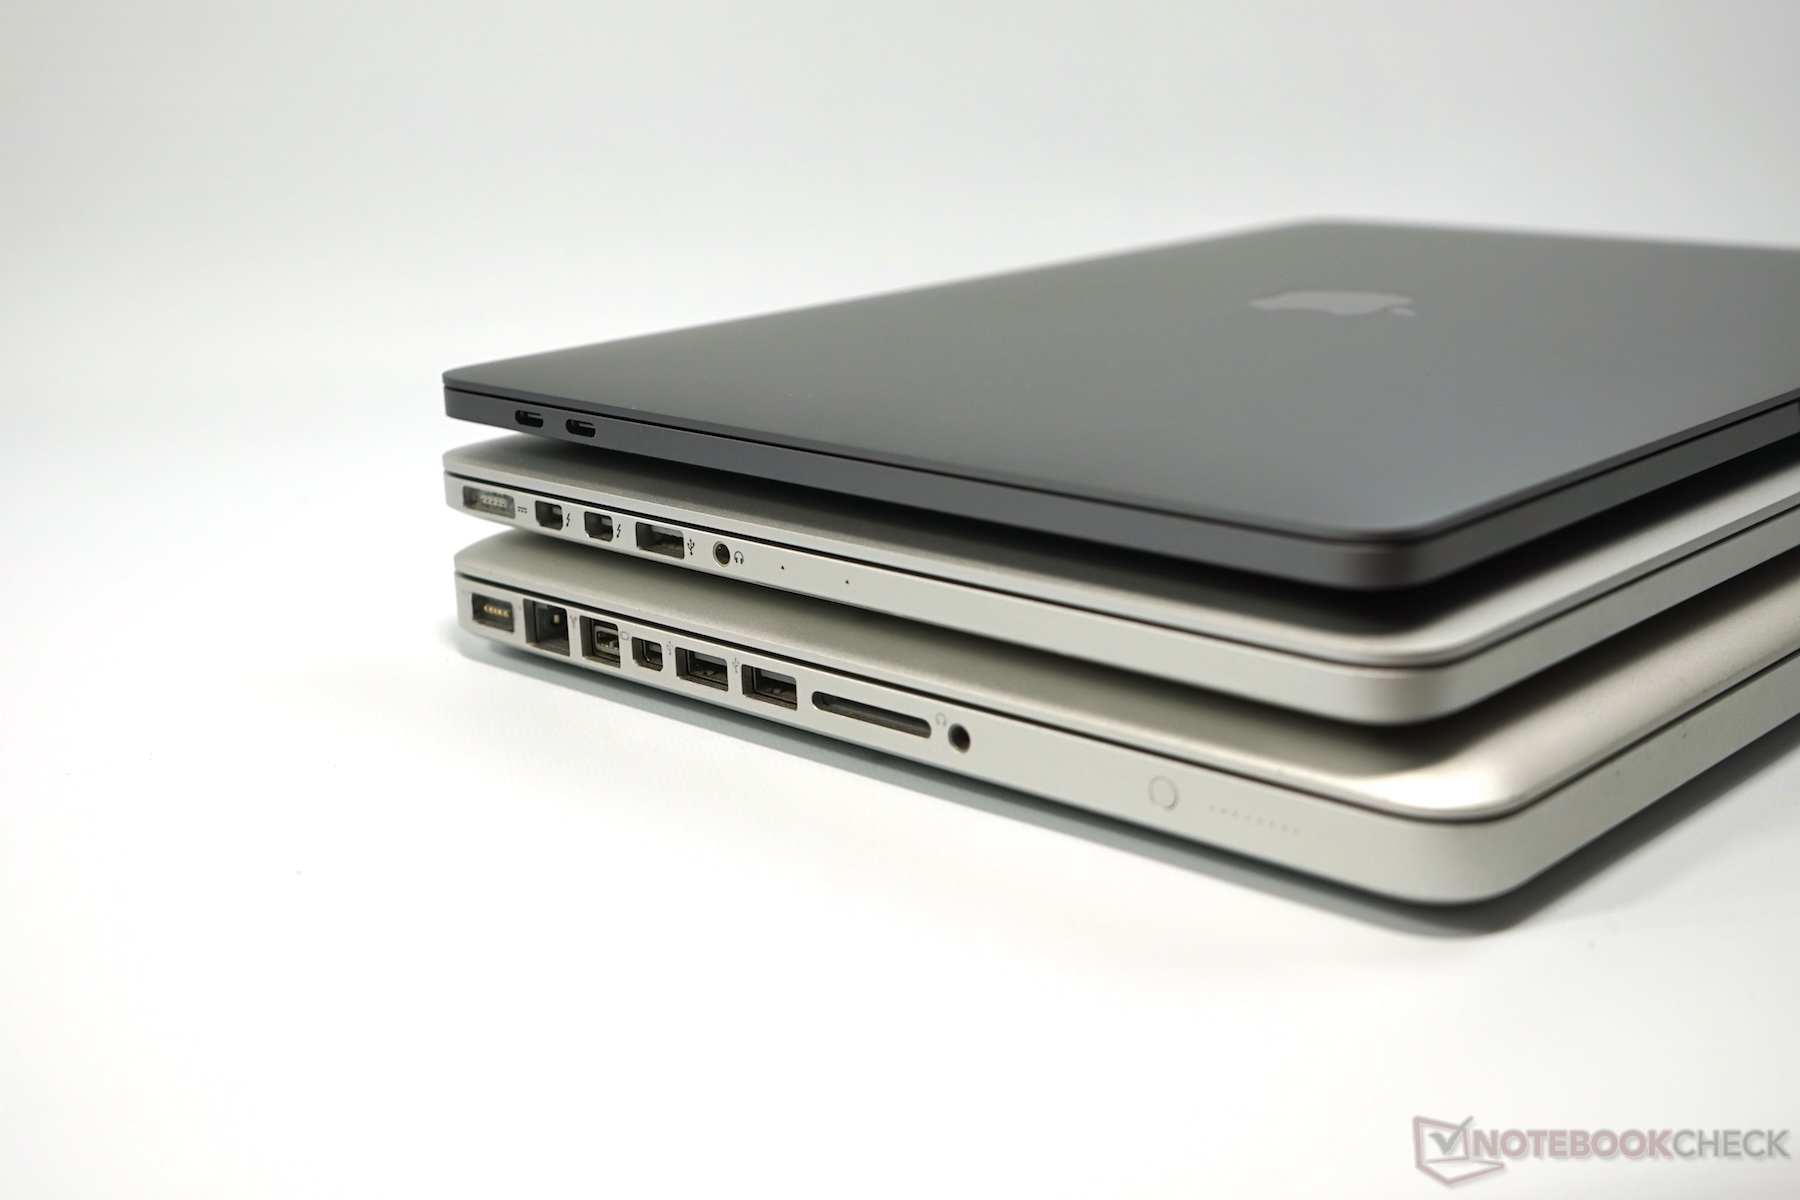
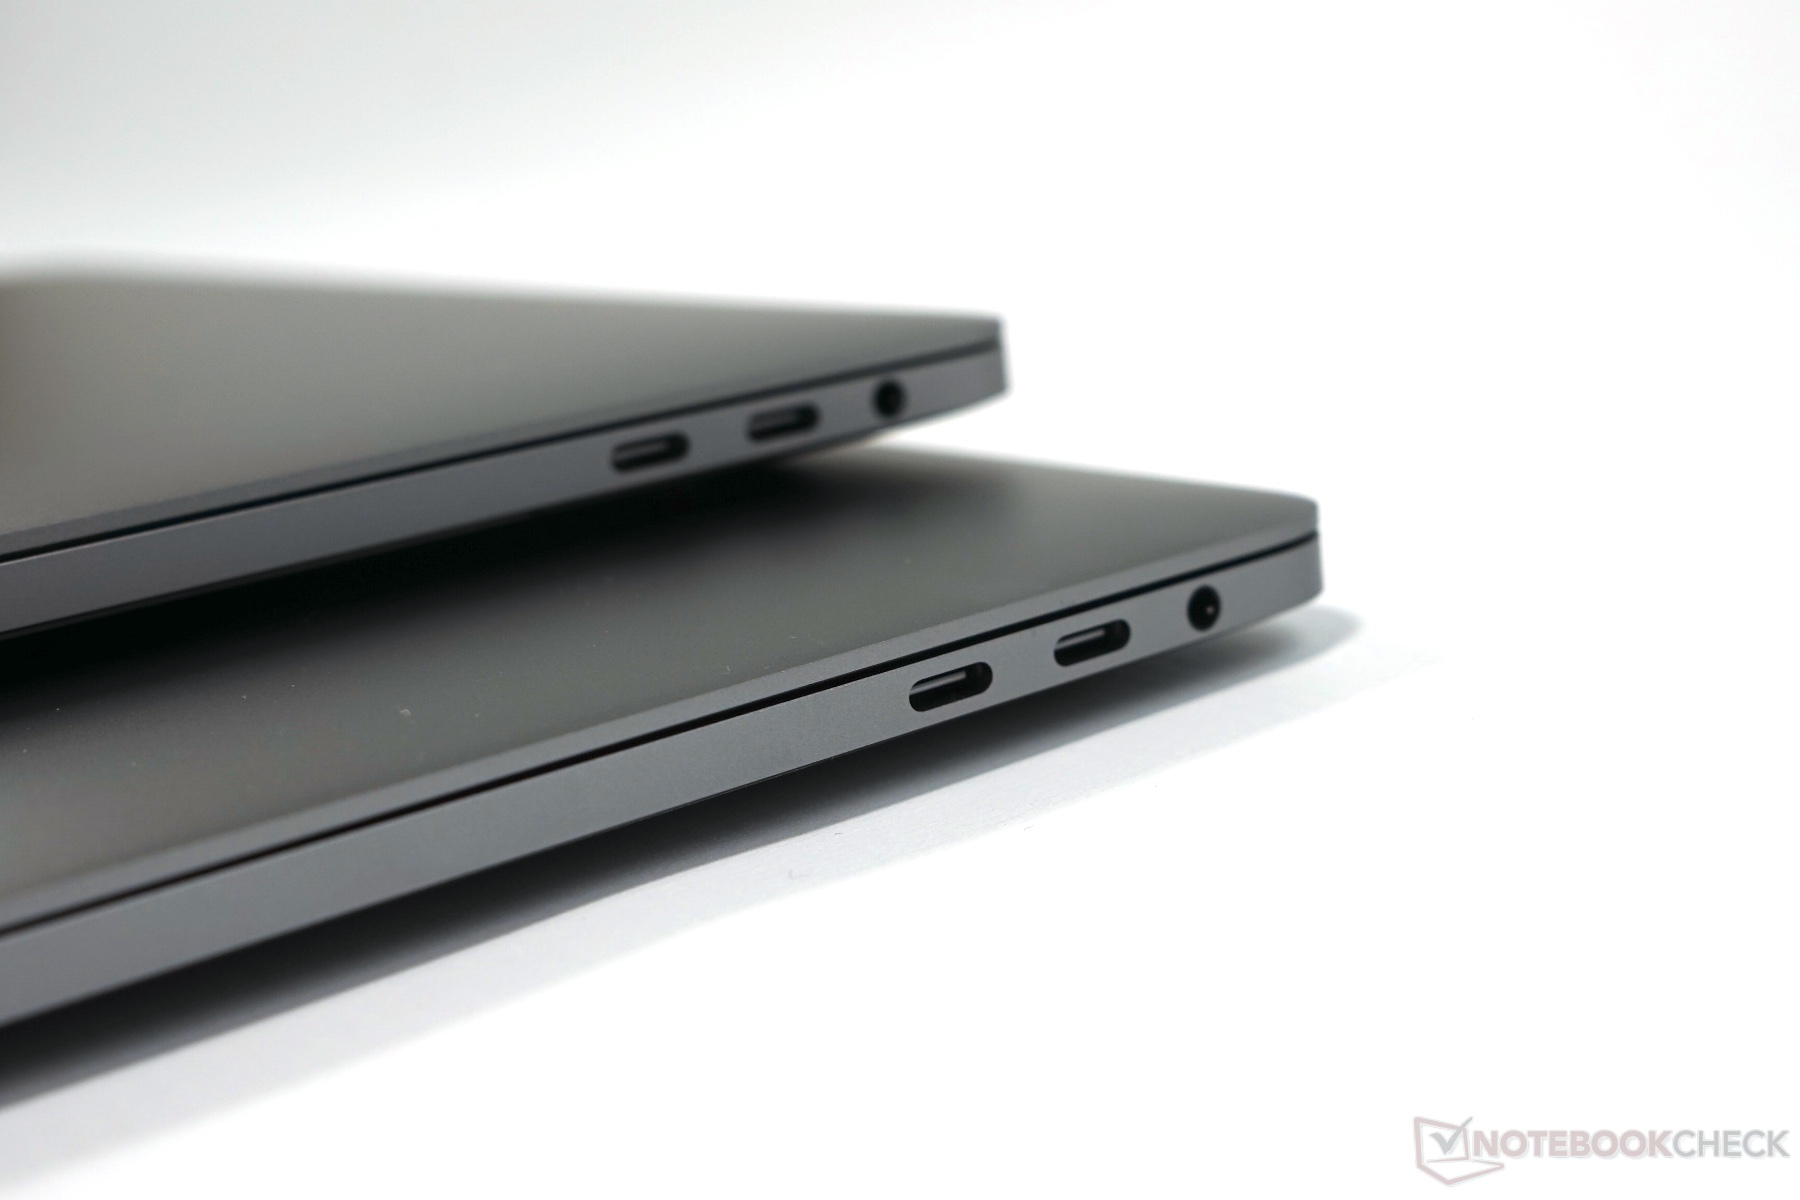
| Ports | 2x Thunderbolt 3 with USB-C 3.5 mm headset |
4x Thunderbolt 3 with USB-C 3.5 mm headset |
| Price | from $1299 | from $1799 |
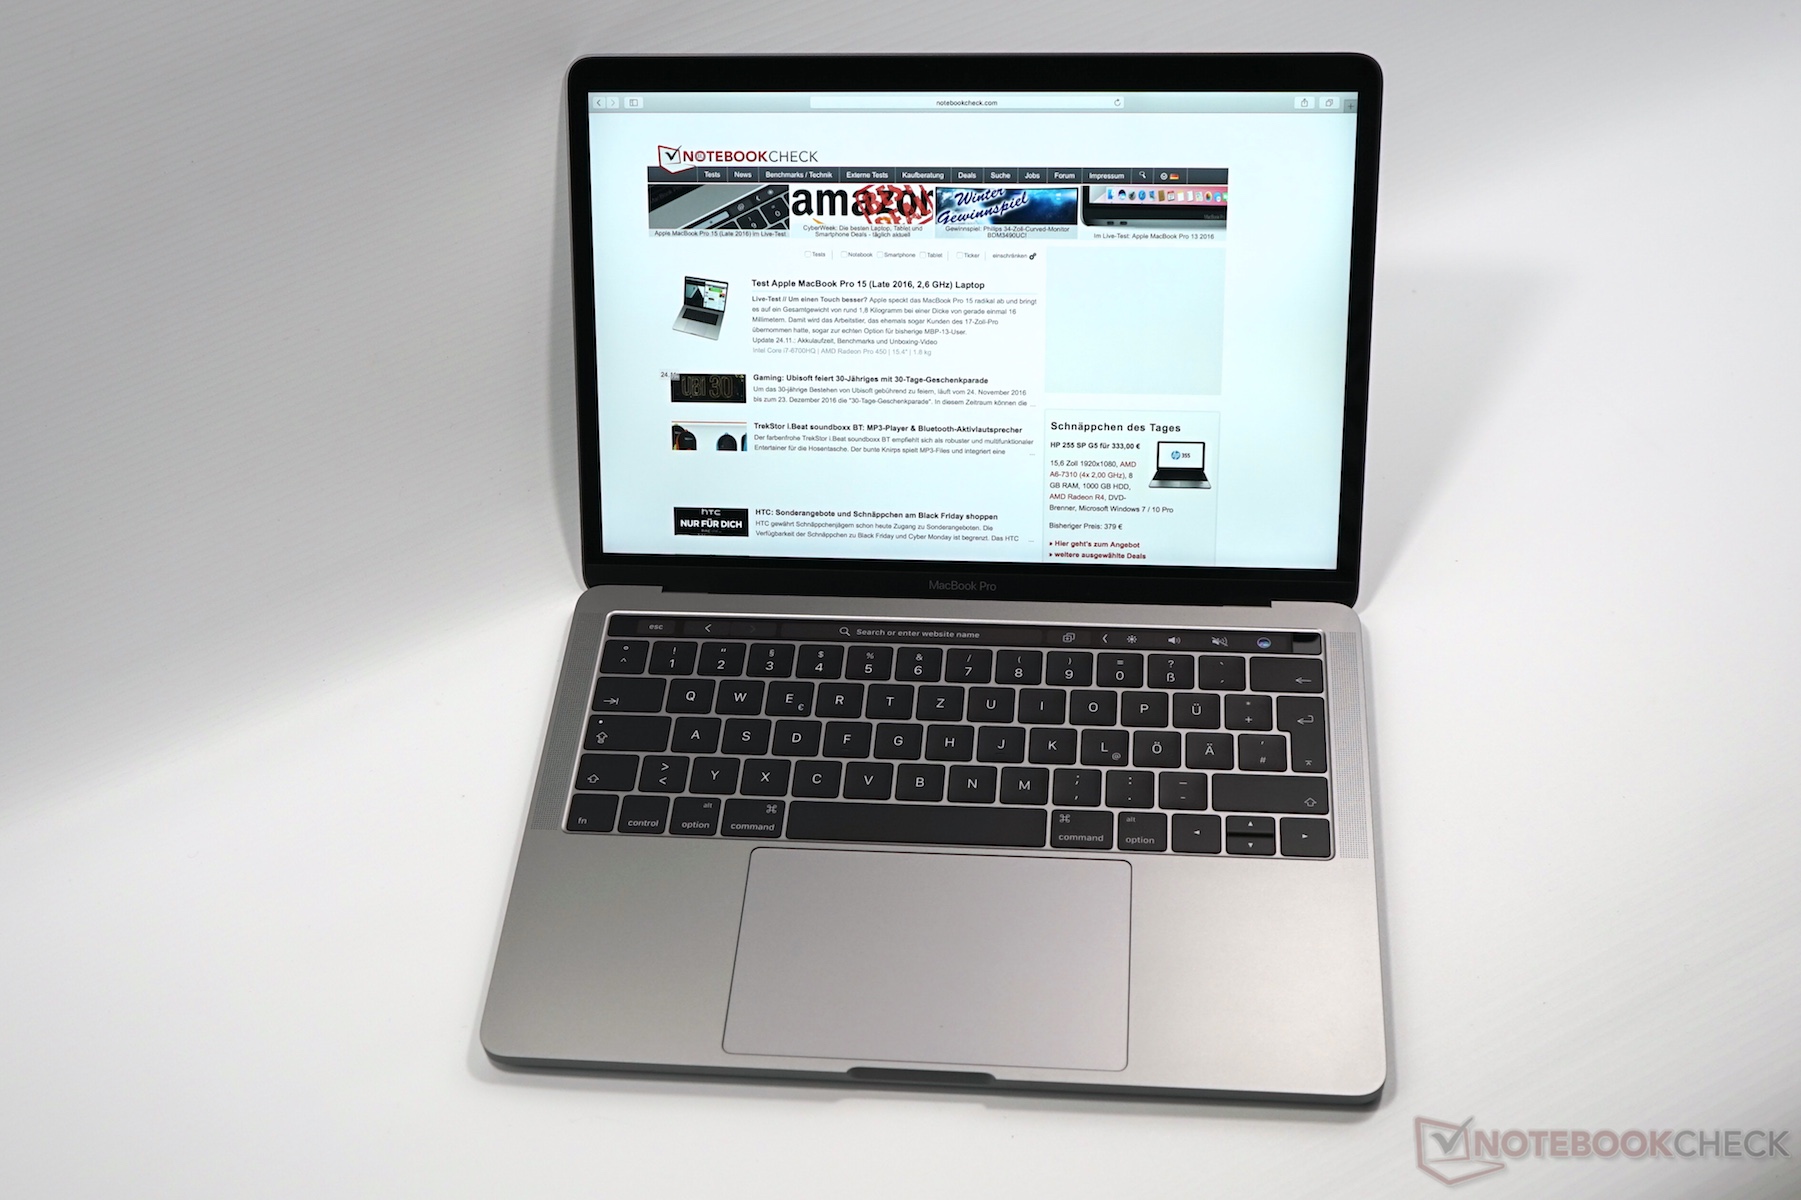
Our test model is the entry-level SKU of the MacBook Pro 13 Touch Bar for 1999 Euros (~$2282) that we bought in Apple's online store. Except for the processor and the SSD, there are no changes compared to the 2016 model, so we will not cover all sections in this article. All the corresponding information is available in our in-depth review of the MacBook Pro 13 (Touch Bar, Late 2016). The following pictures are from the 2016 model as well.
We got a second test model (i5, 512 GB) from the online retailer Cyberport. We repeated the runtime tests and performed additional benchmarks with the 512 GB SSD.
Change log:
- 06/15: SSD performance, temperature, Wi-Fi runtime
- 06/17: fan noise, battery runtime load & video
- 06/21: input devices, color accuracy, PWM, gaming performance, power consumption
- 06/29: communication, several additions, pros/cons, verdict, rating
- 07/07: 2.4 GHz Wi-Fi problem specified
Communication
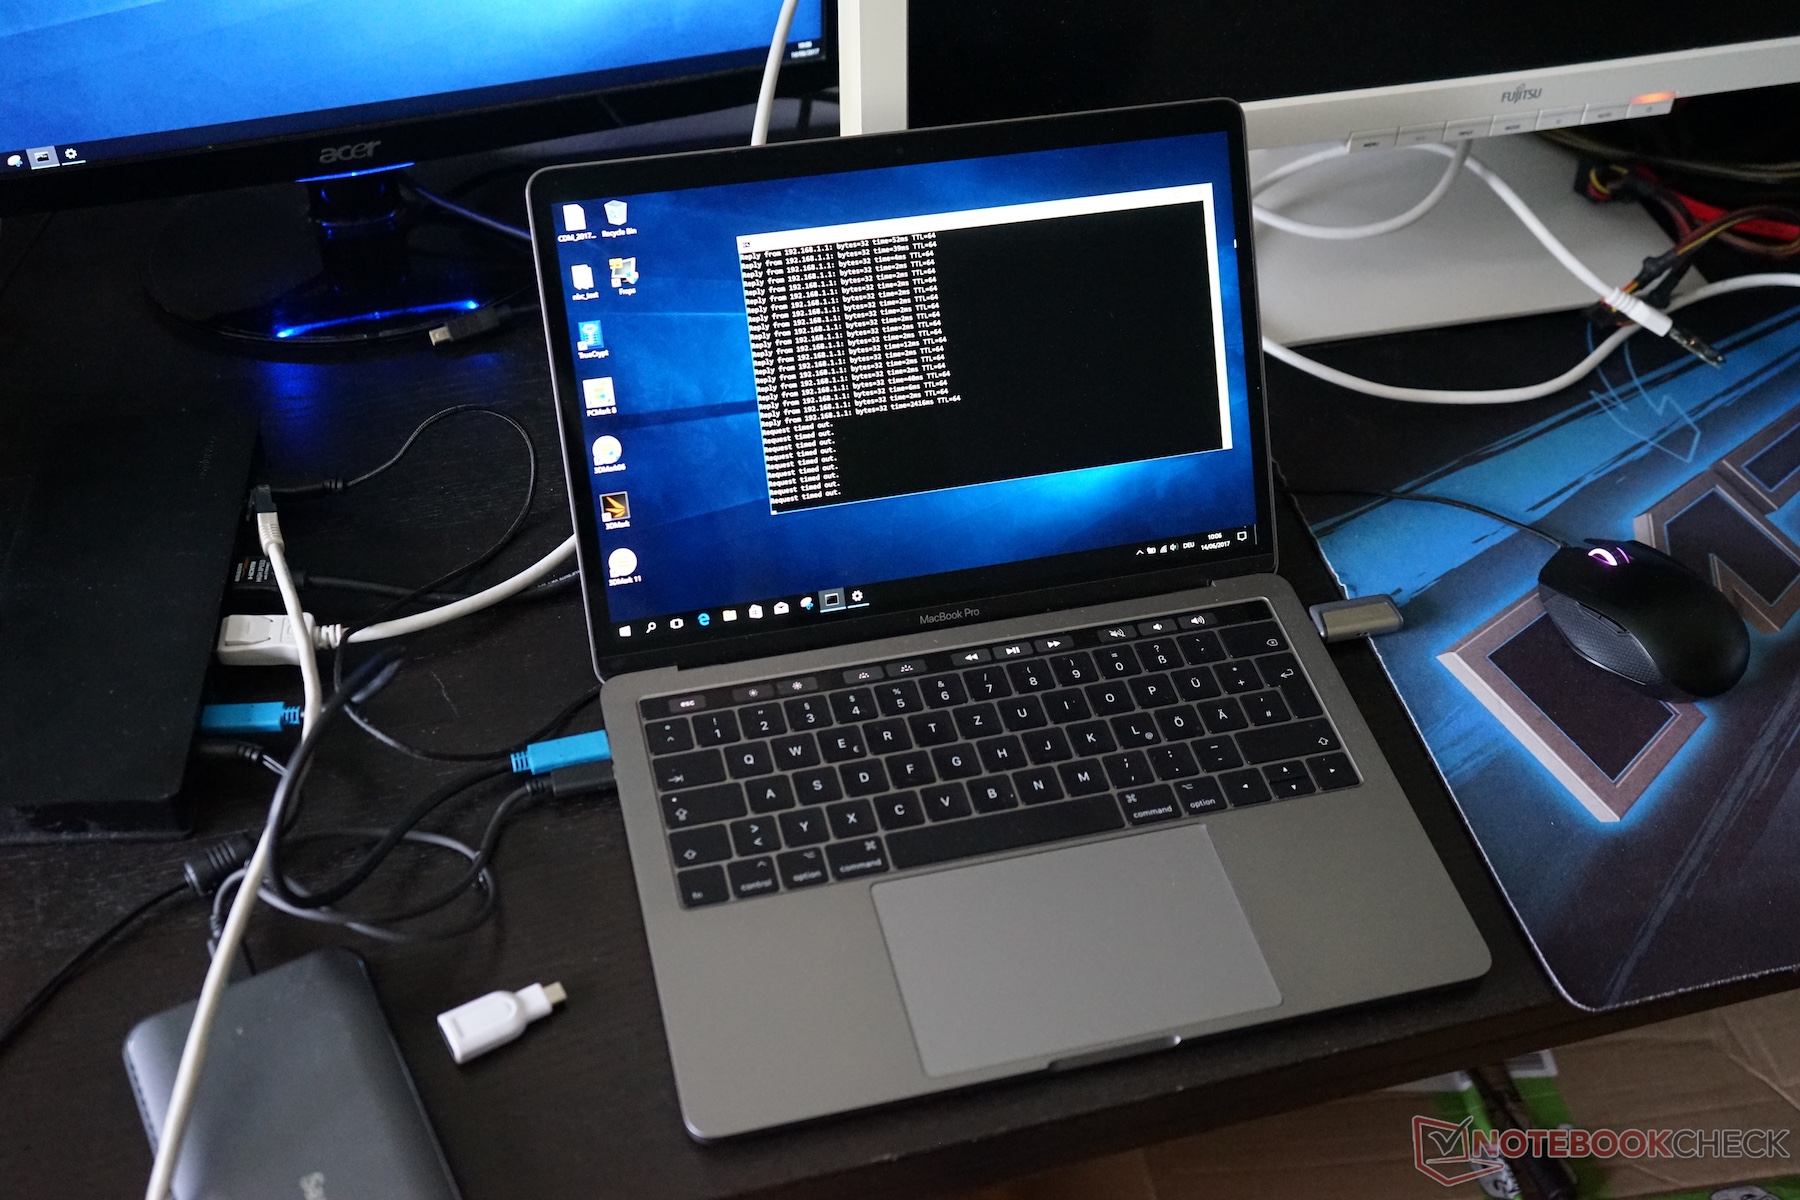
The transfer rates of the MacBook Pro 13 Touch Bar are once again excellent. However, we can still notice the Wi-Fi problem with 2.4 GHz networks when USB-C devices are attached. However, the issue was limited to certain constellations. We noticed connection problems with the Anker Premium USB-C Hub, for example, as well as a maximum equipment with Kensington USB-C Hub, SanDisk 900 USB-C SSD, DisplayPort monitor, USB thumb drive, and other peripherals running Windows (Bootcamp). However, we could not always reproduce the problem, and both the Kensington hub as well as the USB-C SSD worked without problems. The 2017 MBP 15 is affected as well; the Razer Stealth (Kaby Lake) not. The latter does not support Power Delivery via USB-C though, so this might be the issue.
| Networking | |
| iperf3 transmit AX12 | |
| Apple MacBook Pro 13 2016 (2.9 GHz) | |
| Apple MacBook Pro 13 2017 Touchbar i5 | |
| Dell XPS 13 9360 QHD+ i5 | |
| Apple MacBook Pro 13 2016 (Klaus I211) | |
| Dell XPS 13 9360 FHD i7 Iris | |
| iperf3 receive AX12 | |
| Apple MacBook Pro 13 2016 (2.9 GHz) | |
| Apple MacBook Pro 13 2017 Touchbar i5 | |
| Apple MacBook Pro 13 2016 (Klaus I211) | |
| Dell XPS 13 9360 QHD+ i5 | |
| Dell XPS 13 9360 FHD i7 Iris | |
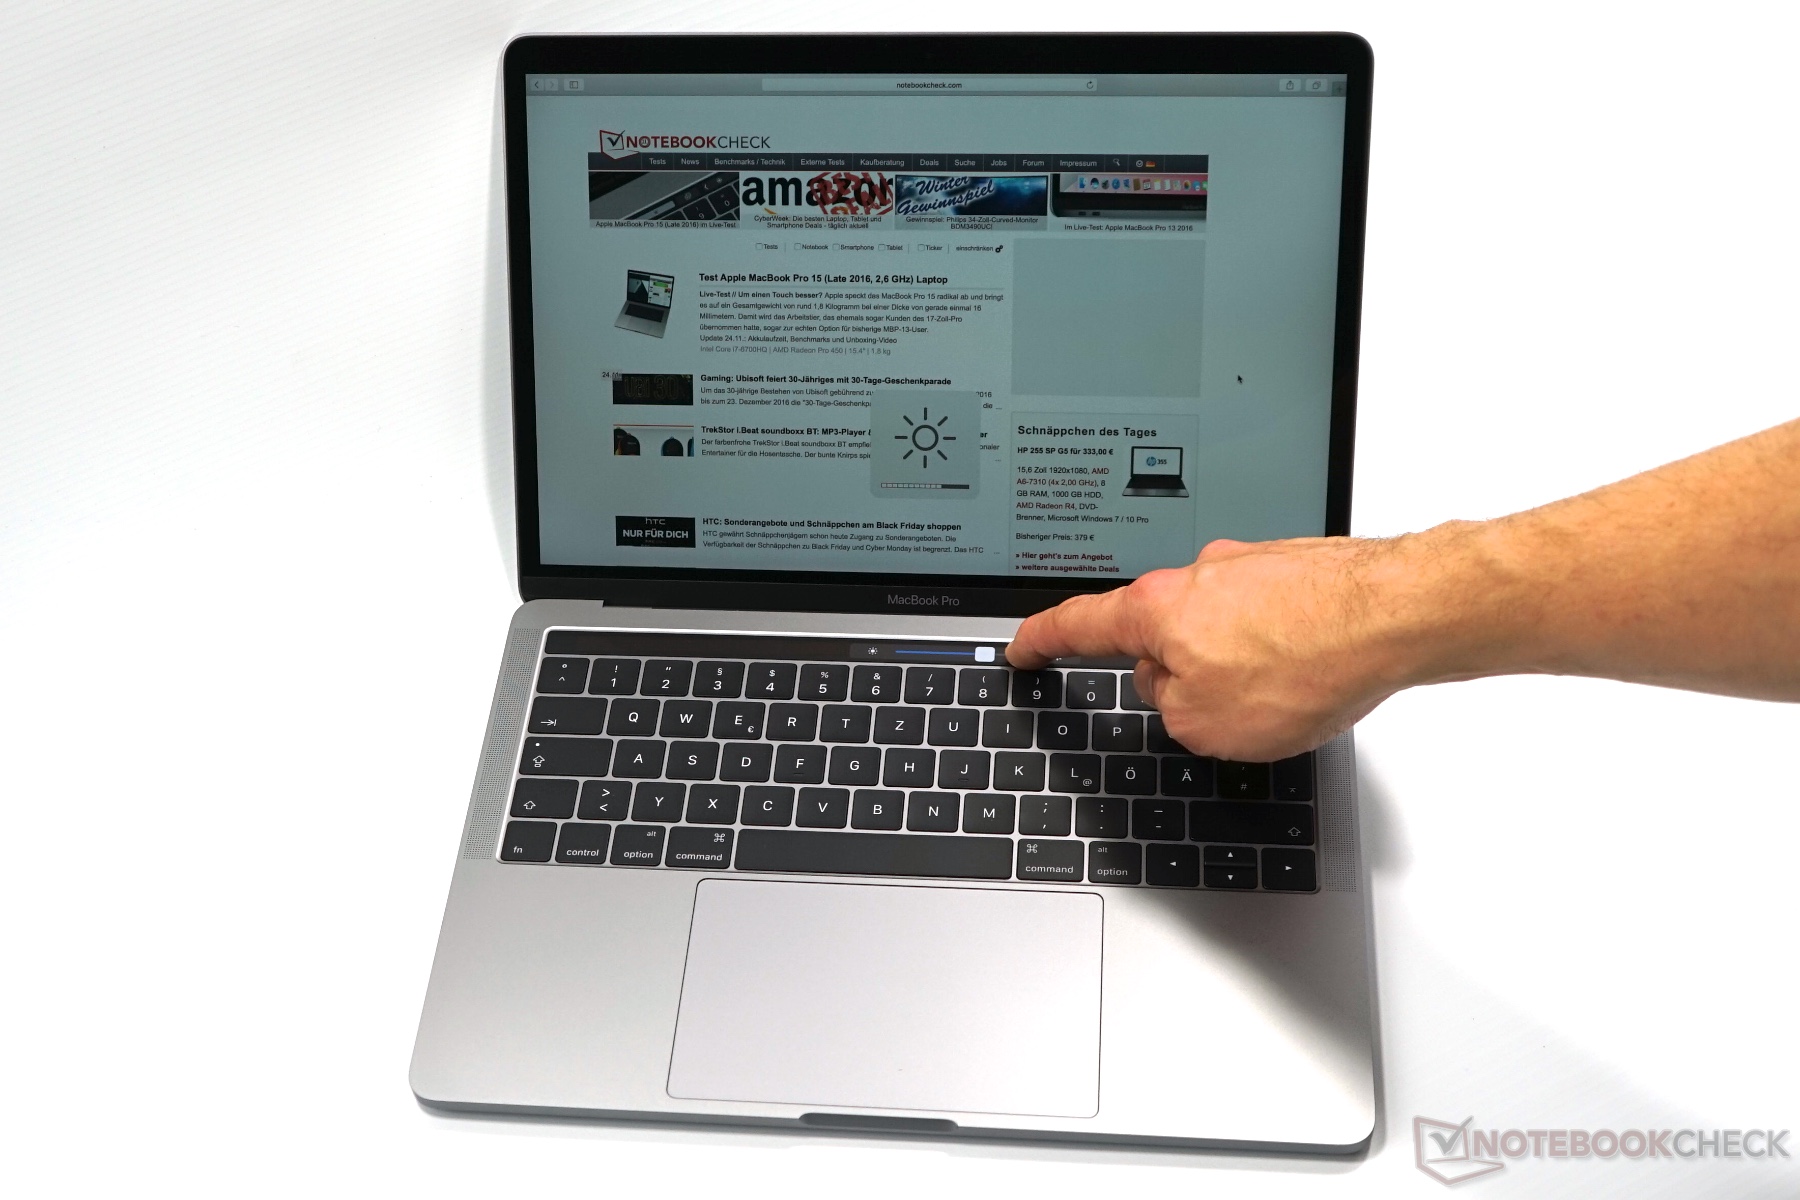
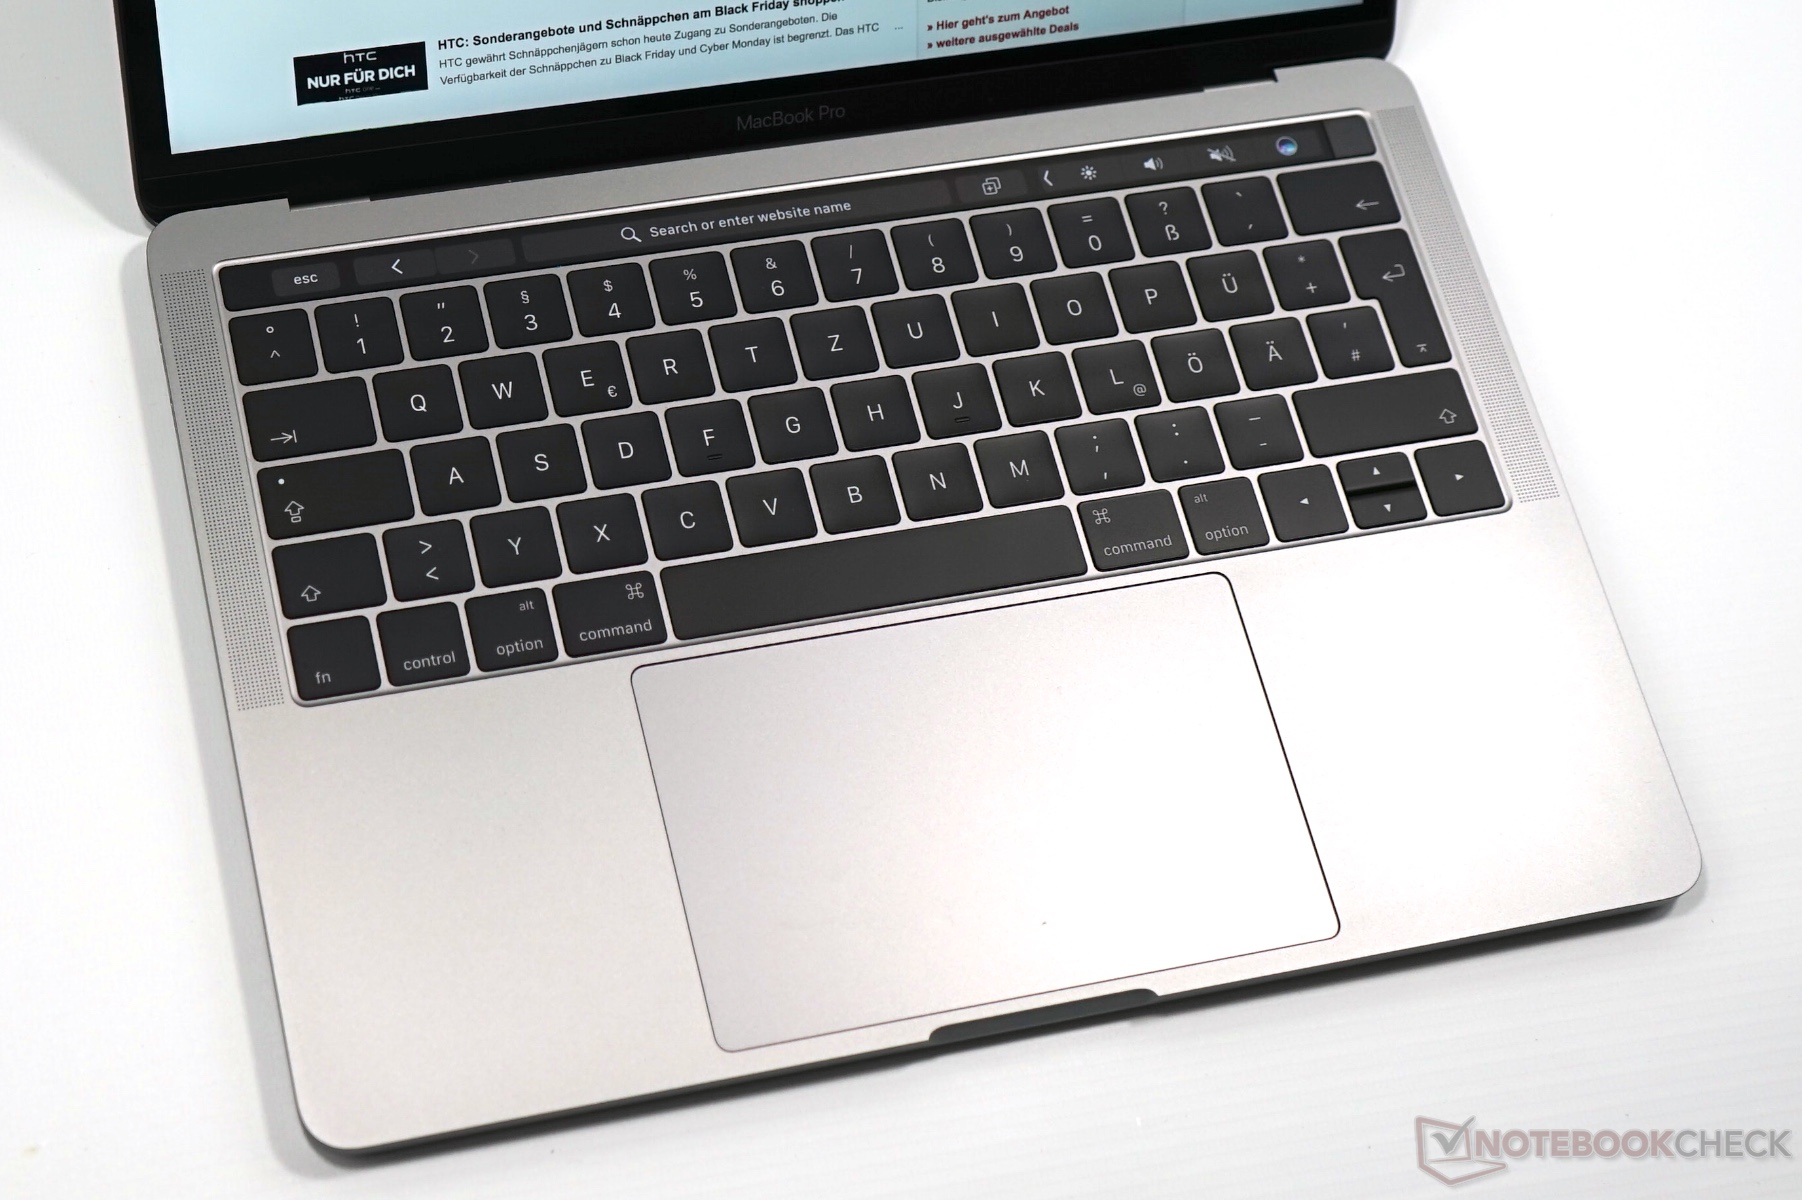
Input Devices
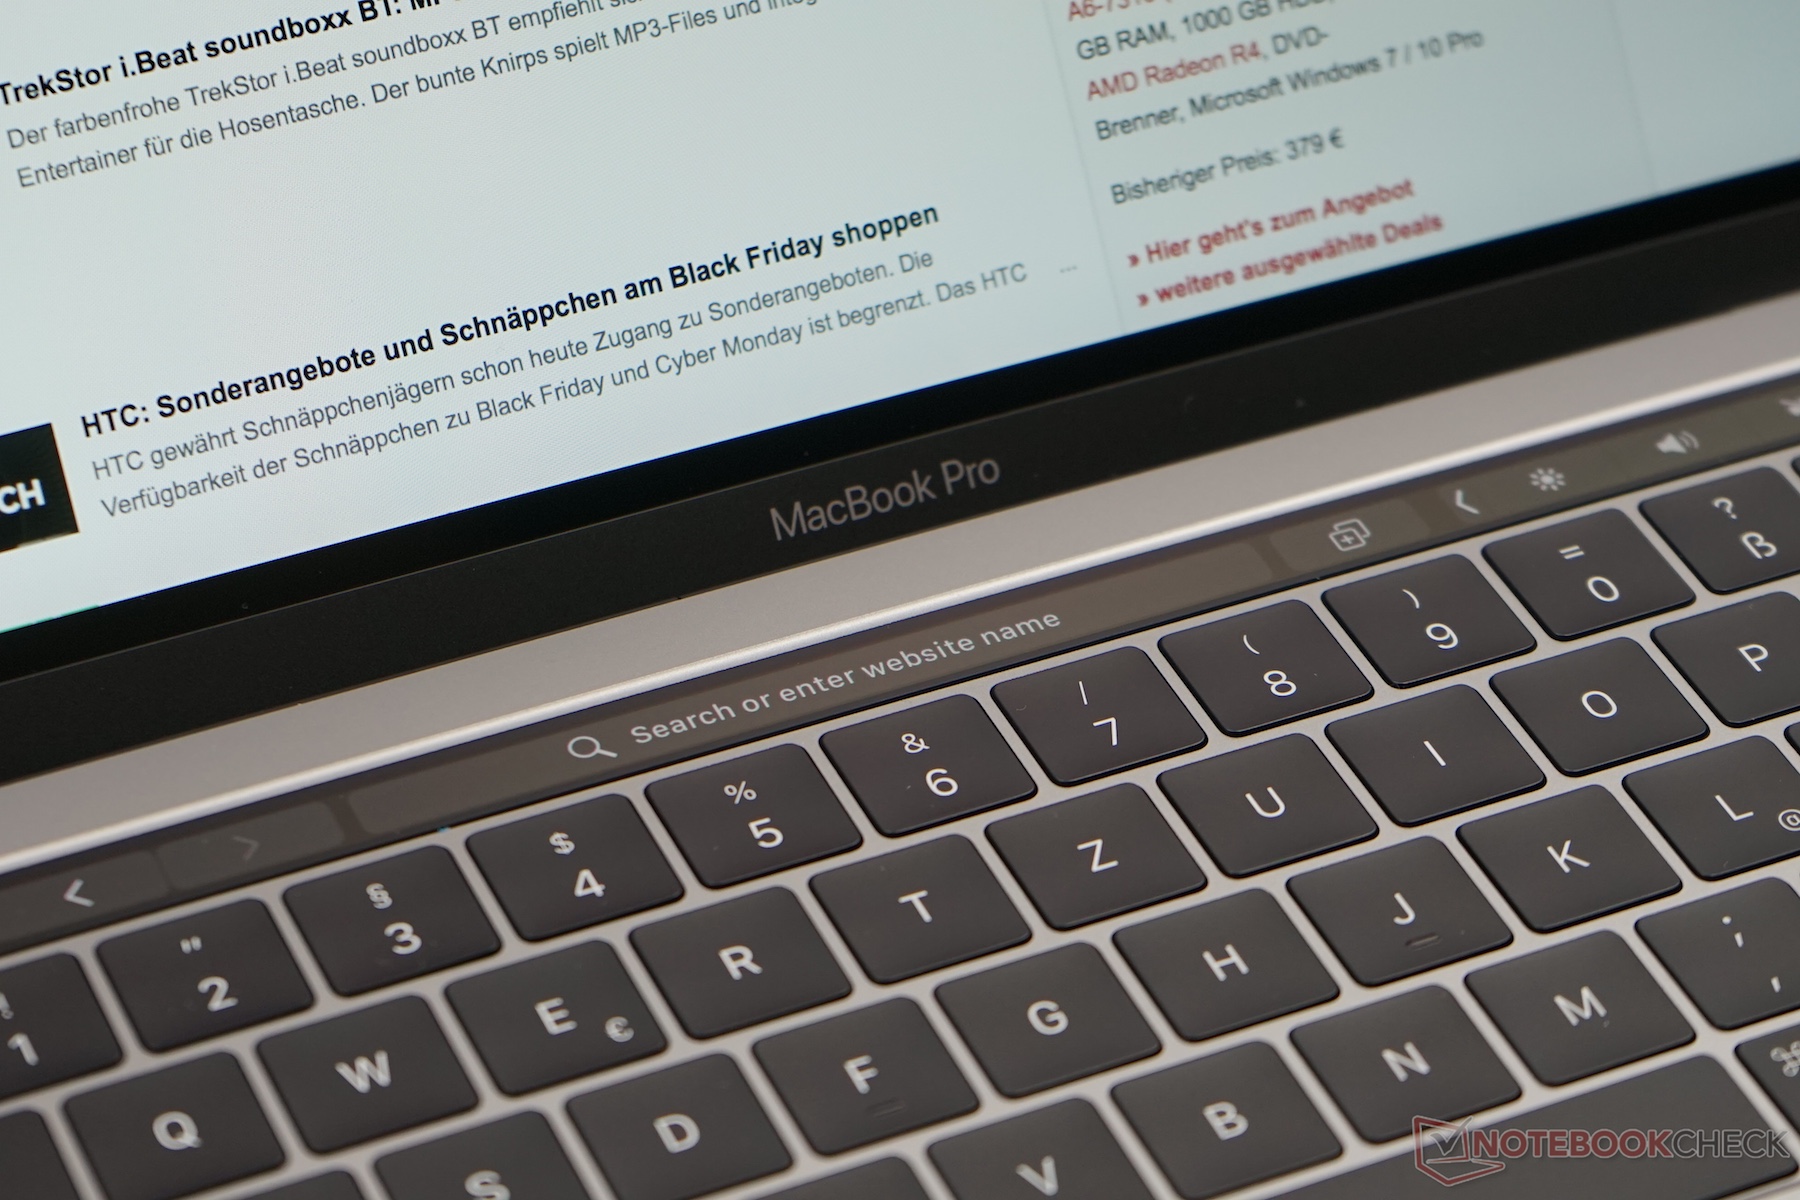
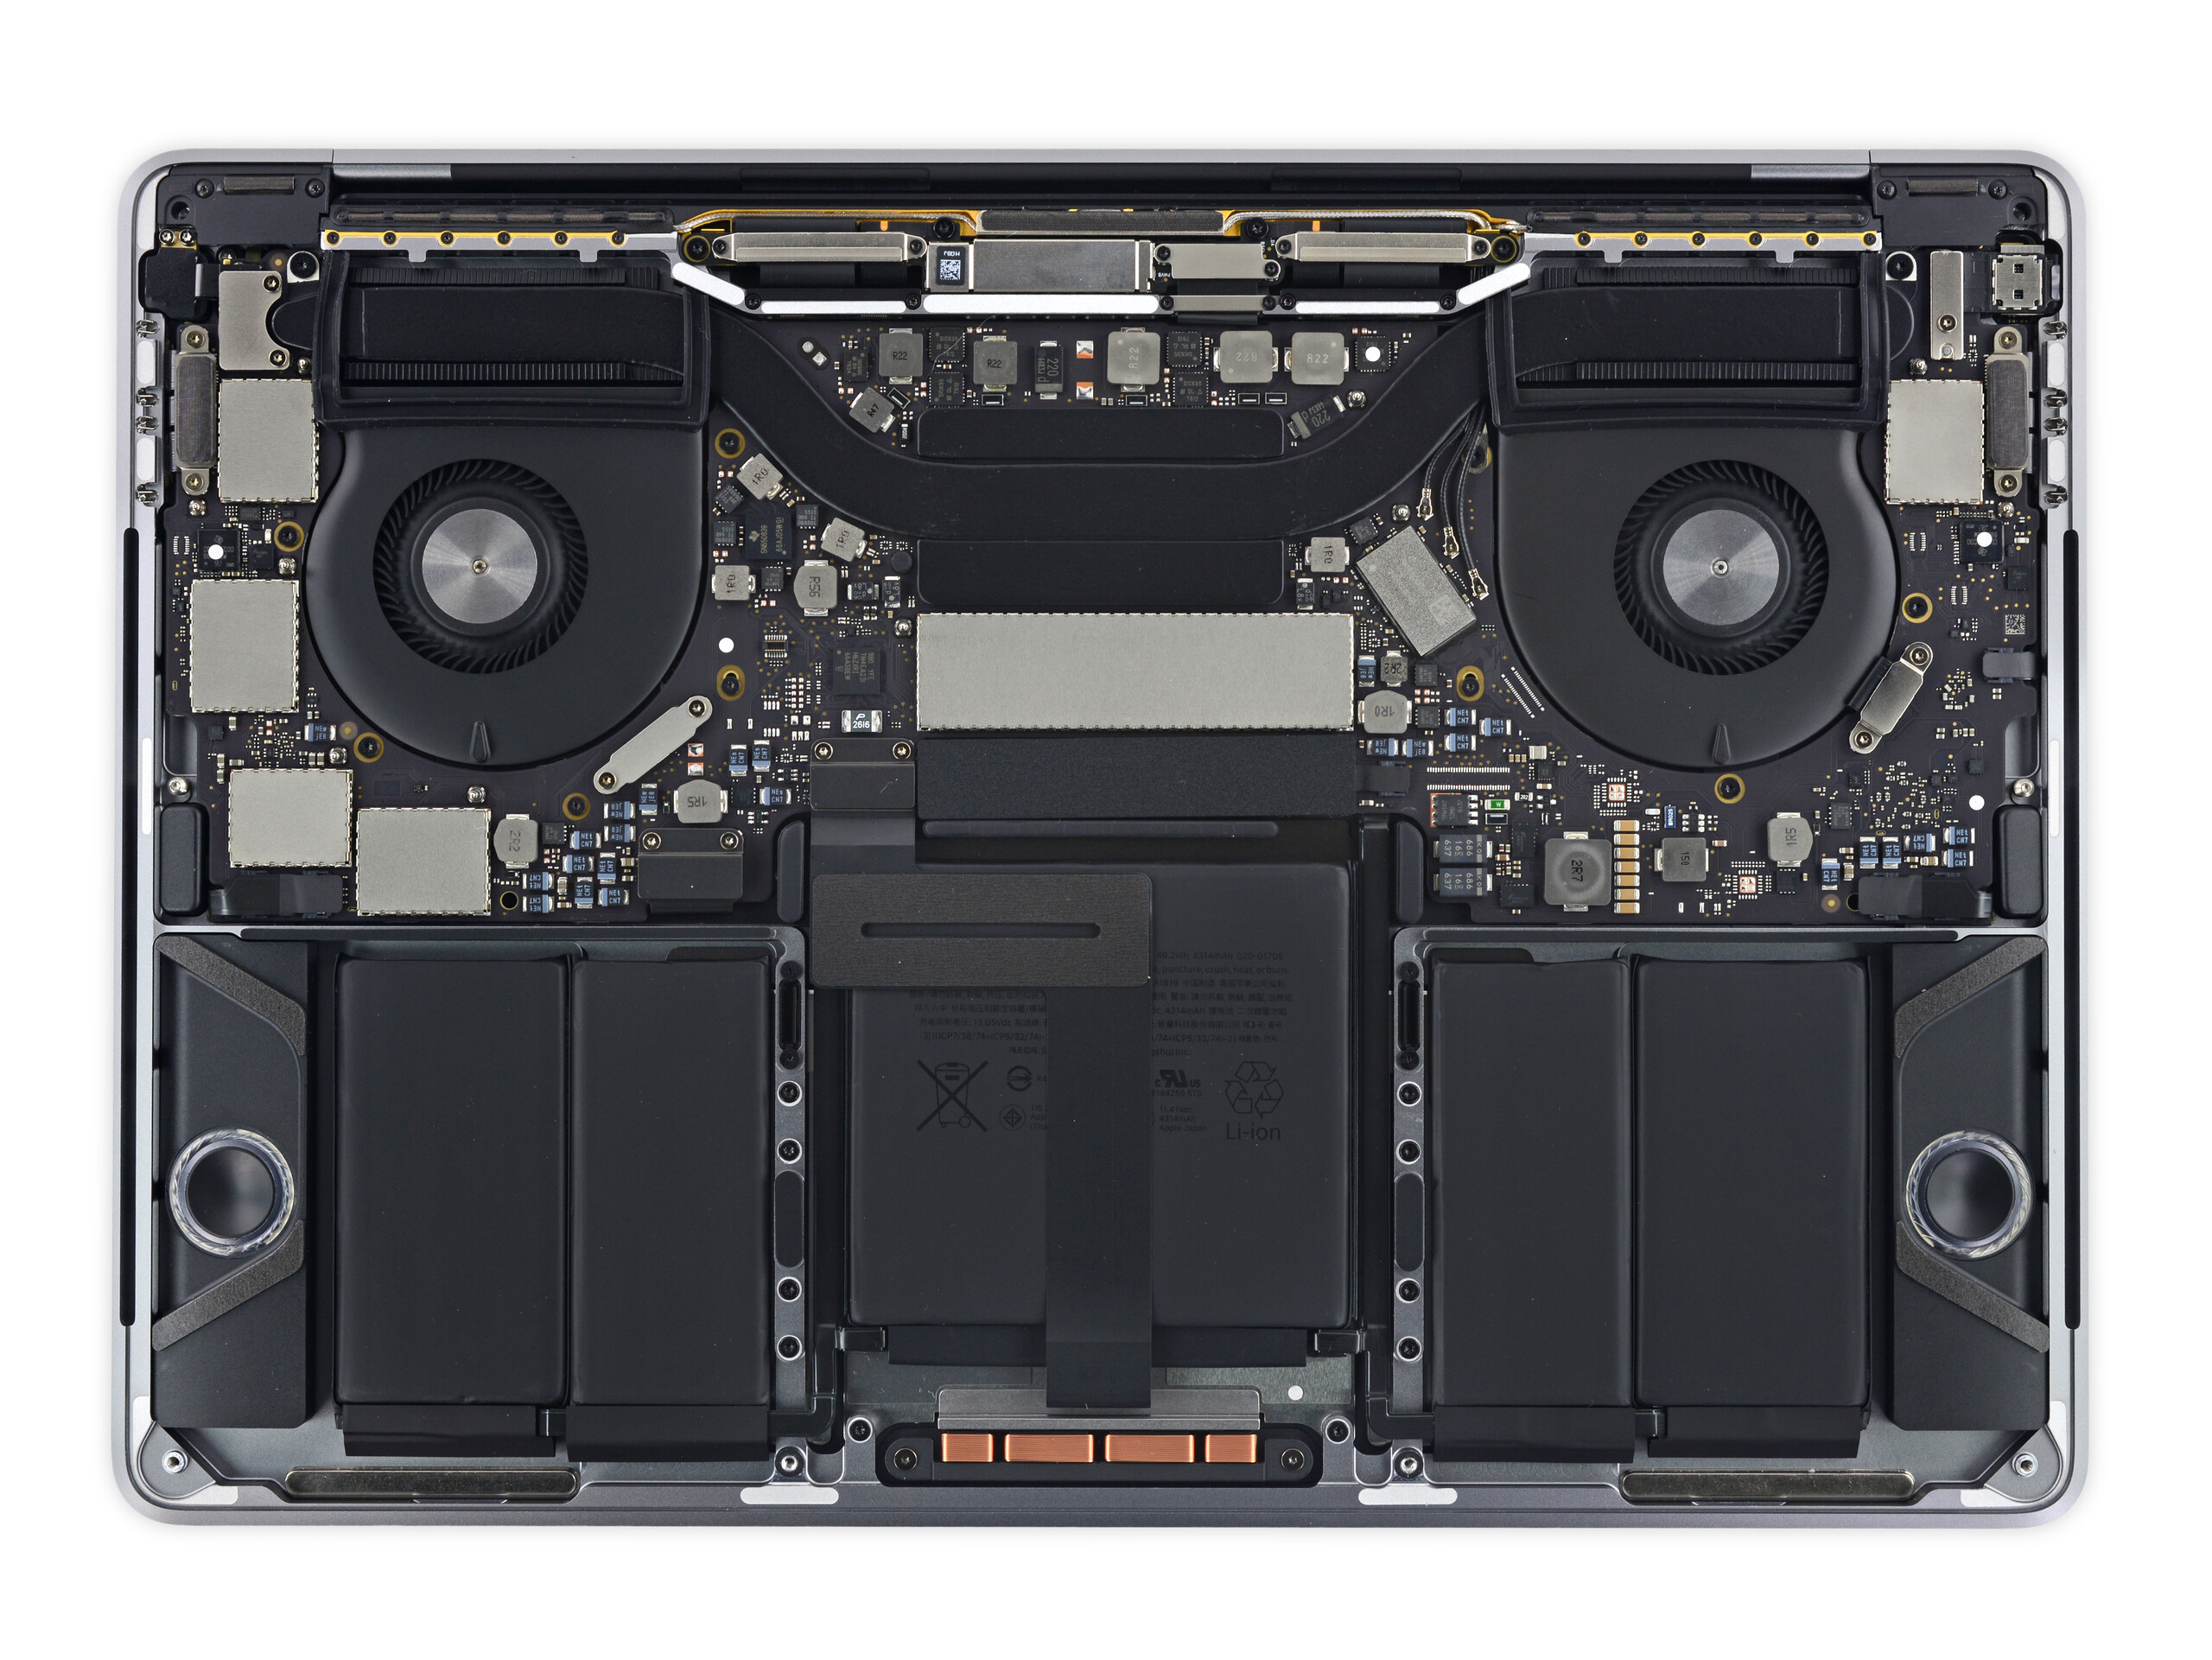
The keyboard looks identical and Apple still uses second-generation Butterfly keys, but our colleagues from iFixit noticed a slightly changed construction in their teardown. In addition to the 12-inch MacBook there were also reports about keyboard problems on the Pro models. Our MacBook Pro 15 (Late 2016) we use in the office also had some problem with the "S" key recently. The key stroke was either not triggered or triggered twice. However, the problem was gone after a while. Obviously, we cannot say whether there will be any long-term issues, but it does not leave the best impression. Subjectively, the typing experience did not change compared to the previous model in a direct comparison.
Display
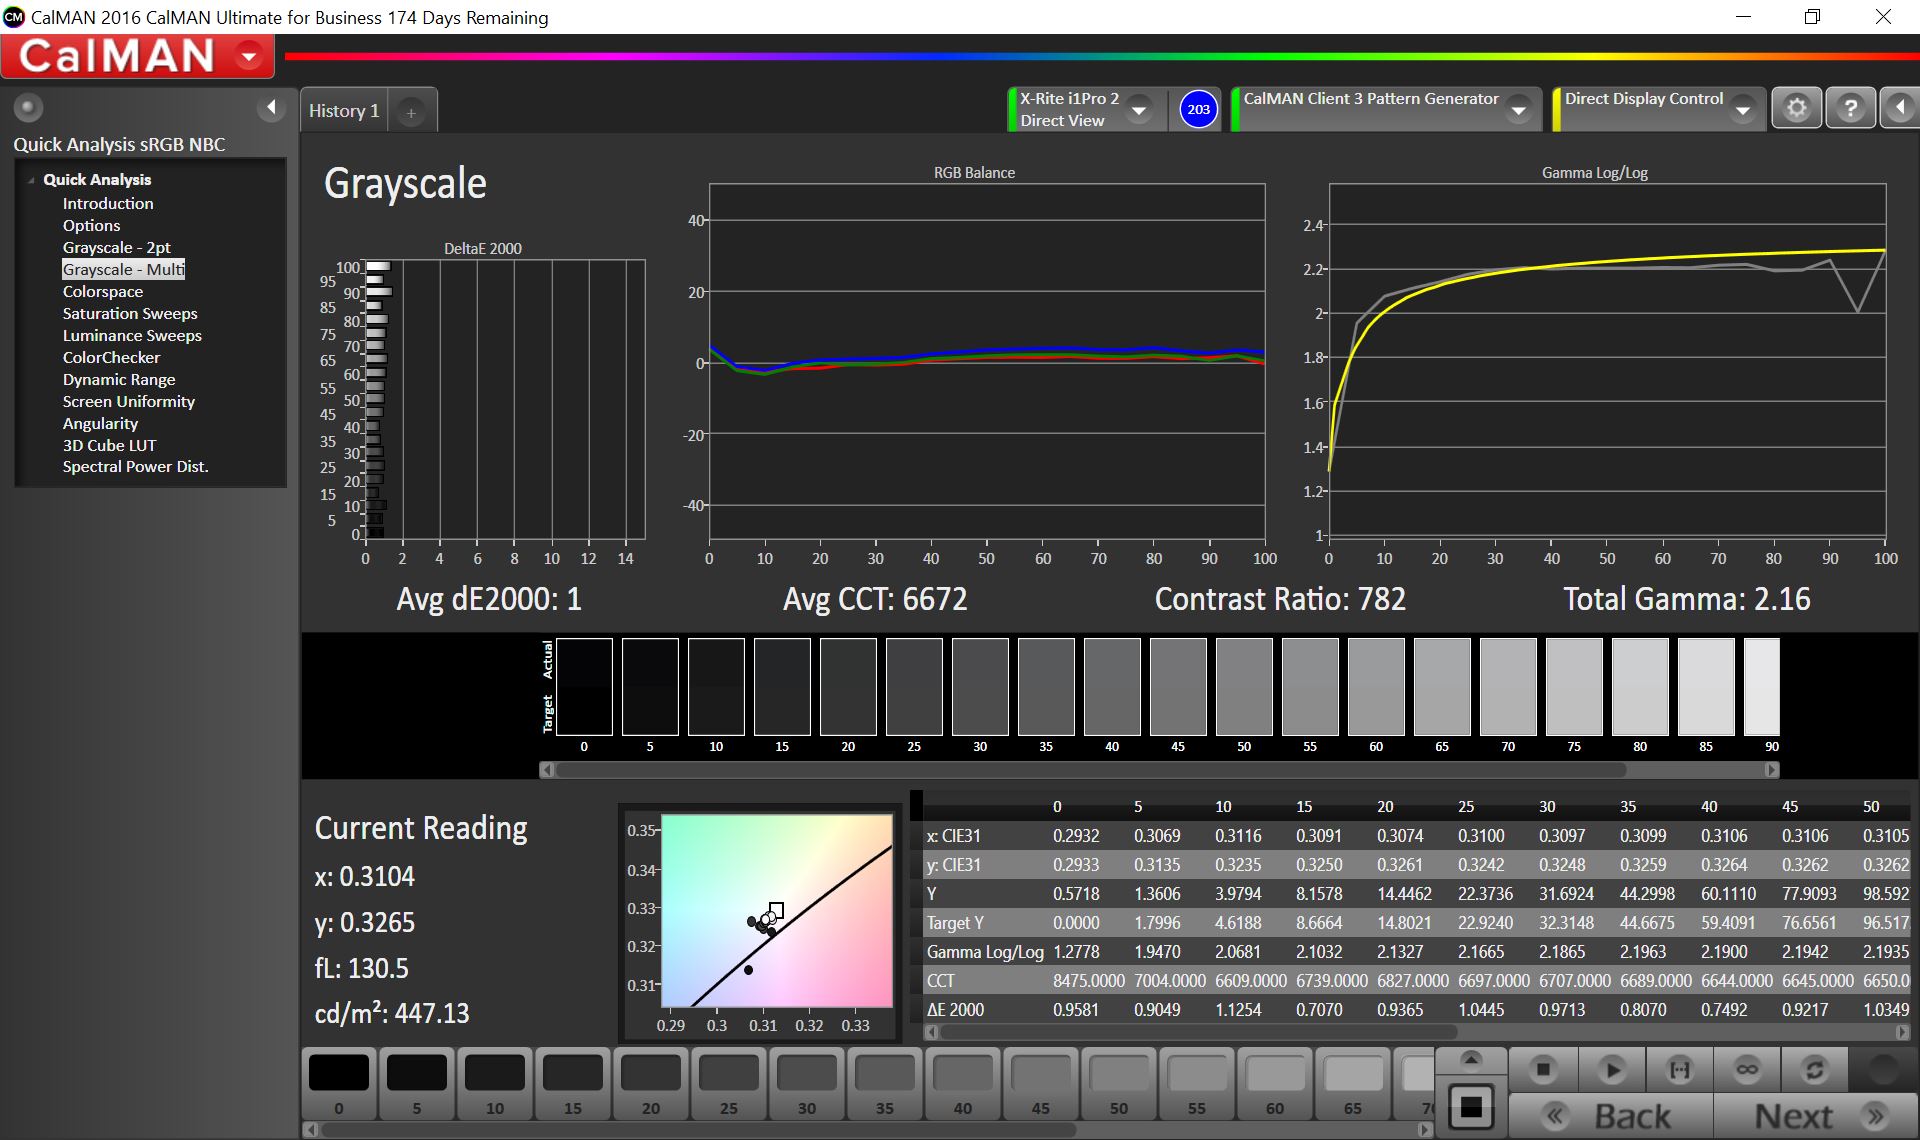
The display did not change. The 13.3-inch screen still has a resolution of 2560x1600 pixels, which results in a pixel density of 227 PPI. The Panel-ID is APPA034 and is therefore identical to the 2016 model without the Touch Bar. The maximum luminance in the center is 551 nits and the average result is still very good at 514 nits, which surpasses Apple's claimed 500 nits. That the contrast is still "just" 1148:1 is a result of the slightly increased black value (0.48). The battery is reduced on battery power, because the center value drops to 502 nits. However, this result easily surpasses the Windows competition.
| |||||||||||||||||||||||||
Brightness Distribution: 88 %
Center on Battery: 502 cd/m²
Contrast: 1148:1 (Black: 0.48 cd/m²)
ΔE ColorChecker Calman: 0.8 | ∀{0.5-29.43 Ø4.71}
ΔE Greyscale Calman: 1 | ∀{0.09-98 Ø4.96}
86.5% AdobeRGB 1998 (Argyll 3D)
100% sRGB (Argyll 3D)
98.6% Display P3 (Argyll 3D)
Gamma: 2.16
CCT: 6672 K
| Apple MacBook Pro 13 2017 Touchbar i5 APPA034, , 2560x1600, 13.3" | Apple MacBook Pro 13 2016 (2.9 GHz) APPA033, , 2560x1600, 13.3" | Apple MacBook Pro 13 2016 APPA034, , 2560x1600, 13.3" | Dell XPS 13 9360 QHD+ i5 Sharp SHP144A, , 3200x1800, 13.3" | Lenovo ThinkPad X1 Carbon 2017-20HQS03P00 B140HAN03_1, , 1920x1080, 14" | |
|---|---|---|---|---|---|
| Display | 1% | -1% | -22% | -27% | |
| Display P3 Coverage (%) | 98.6 | 99.2 1% | 97.1 -2% | 64.6 -34% | 61.4 -38% |
| sRGB Coverage (%) | 100 | 99.9 0% | 99.8 0% | 91.6 -8% | 85.9 -14% |
| AdobeRGB 1998 Coverage (%) | 86.5 | 87.6 1% | 86.7 0% | 66.5 -23% | 62.4 -28% |
| Response Times | -28% | -26% | 21% | 10% | |
| Response Time Grey 50% / Grey 80% * (ms) | 48 ? | 47.2 ? 2% | 47.2 ? 2% | 31 ? 35% | 41.6 ? 13% |
| Response Time Black / White * (ms) | 33.6 ? | 53 ? -58% | 51.6 ? -54% | 31.2 ? 7% | 31.6 ? 6% |
| PWM Frequency (Hz) | 119000 ? | ||||
| Screen | -35% | -38% | -129% | -210% | |
| Brightness middle (cd/m²) | 551 | 569 3% | 600 9% | 444 -19% | 311 -44% |
| Brightness (cd/m²) | 514 | 542 5% | 564 10% | 393 -24% | 288 -44% |
| Brightness Distribution (%) | 88 | 90 2% | 89 1% | 82 -7% | 85 -3% |
| Black Level * (cd/m²) | 0.48 | 0.56 -17% | 0.57 -19% | 0.33 31% | 0.24 50% |
| Contrast (:1) | 1148 | 1016 -11% | 1053 -8% | 1345 17% | 1296 13% |
| Colorchecker dE 2000 * | 0.8 | 1.4 -75% | 1.5 -88% | 4 -400% | 5.5 -588% |
| Colorchecker dE 2000 max. * | 1.4 | 2.9 -107% | 2.9 -107% | 7.7 -450% | 9 -543% |
| Greyscale dE 2000 * | 1 | 1.8 -80% | 2 -100% | 2.83 -183% | 6.2 -520% |
| Gamma | 2.16 102% | 2.16 102% | 2.27 97% | 2.05 107% | 2.02 109% |
| CCT | 6672 97% | 6877 95% | 6855 95% | 6963 93% | 5950 109% |
| Color Space (Percent of AdobeRGB 1998) (%) | 78.4 | 77 | 59.3 | 55.96 | |
| Color Space (Percent of sRGB) (%) | 99.3 | 92 | 91.4 | 85.77 | |
| Total Average (Program / Settings) | -21% /
-26% | -22% /
-27% | -43% /
-81% | -76% /
-134% |
* ... smaller is better
The MacBook Pro 13 already manages excellent color accuracy results out of the box. We determine average DeltaE-2000 deviations compared to the P3 reference of just 1 for the grayscale and 0.8 (up to 1.4) for the colors with the spectrophotometer X-Rite i1Pro2 and the professional software CalMAN. The average DeltaE value drops to 0.56 (up to 1.29) in the ColorChecker test (24 patches) after the calibration with the i1Profiler software of our spectrophotometer.

Display Response Times
| ↔ Response Time Black to White | ||
|---|---|---|
| 33.6 ms ... rise ↗ and fall ↘ combined | ↗ 16.4 ms rise | 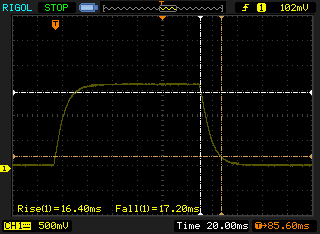 |
| ↘ 17.2 ms fall | ||
| The screen shows slow response rates in our tests and will be unsatisfactory for gamers. In comparison, all tested devices range from 0.1 (minimum) to 240 (maximum) ms. » 90 % of all devices are better. This means that the measured response time is worse than the average of all tested devices (19.8 ms). | ||
| ↔ Response Time 50% Grey to 80% Grey | ||
| 48 ms ... rise ↗ and fall ↘ combined | ↗ 23.6 ms rise | 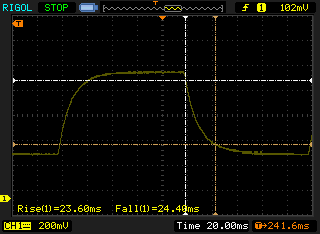 |
| ↘ 24.4 ms fall | ||
| The screen shows slow response rates in our tests and will be unsatisfactory for gamers. In comparison, all tested devices range from 0.165 (minimum) to 636 (maximum) ms. » 82 % of all devices are better. This means that the measured response time is worse than the average of all tested devices (30.9 ms). | ||
We have used a more sensitive measuring device since the beginning of this year, which can detect higher frequencies. We can measure brightness fluctuations at a very high frequency of 119 kHz for the MacBook Pro 13 for brightness levels of 80% or below. We also checked the old 2016 MacBook Pro 15 with the new sensor and got a similar result. Because of the very high frequency, there should not be any problems even for sensitive users.
Screen Flickering / PWM (Pulse-Width Modulation)
| Screen flickering / PWM detected | 119000 Hz | ≤ 80 % brightness setting | 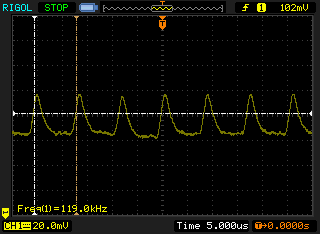 |
The display backlight flickers at 119000 Hz (worst case, e.g., utilizing PWM) Flickering detected at a brightness setting of 80 % and below. There should be no flickering or PWM above this brightness setting. The frequency of 119000 Hz is quite high, so most users sensitive to PWM should not notice any flickering. In comparison: 52 % of all tested devices do not use PWM to dim the display. If PWM was detected, an average of 7741 (minimum: 5 - maximum: 343500) Hz was measured. | |||
Performance
The MacBook Pro 13 with the Touch Bar is once again the more powerful model out of the two 13-inch systems since Apple uses dual-core processors with a TDP of 28 watts. This is an advantage for the GPU in particular, because the higher consumption limit gives more headroom for the Turbos of the two components. However, you should not expect a revolution from the Kaby Lake generation, because it is only a small update compared to Skylake.
All in all, the current MacBook Pro 13 Touch Bar is suited for many applications. If you need a lot of CPU/GPU performance though, you are still better off with a real quad-core and a dedicated graphics card.
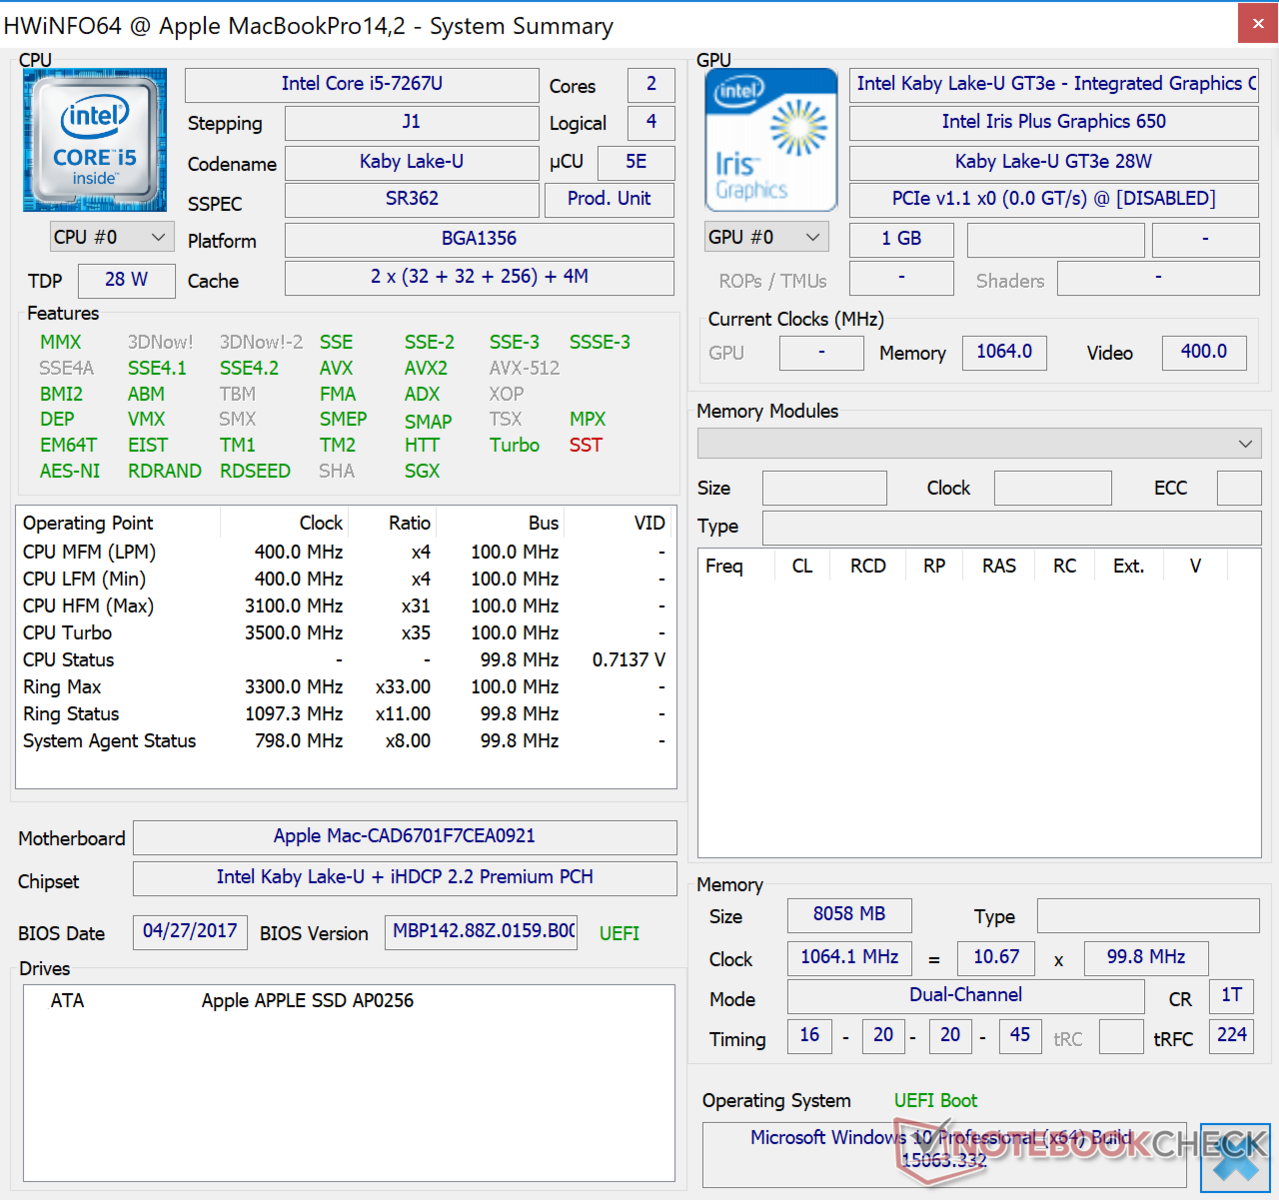

Processor
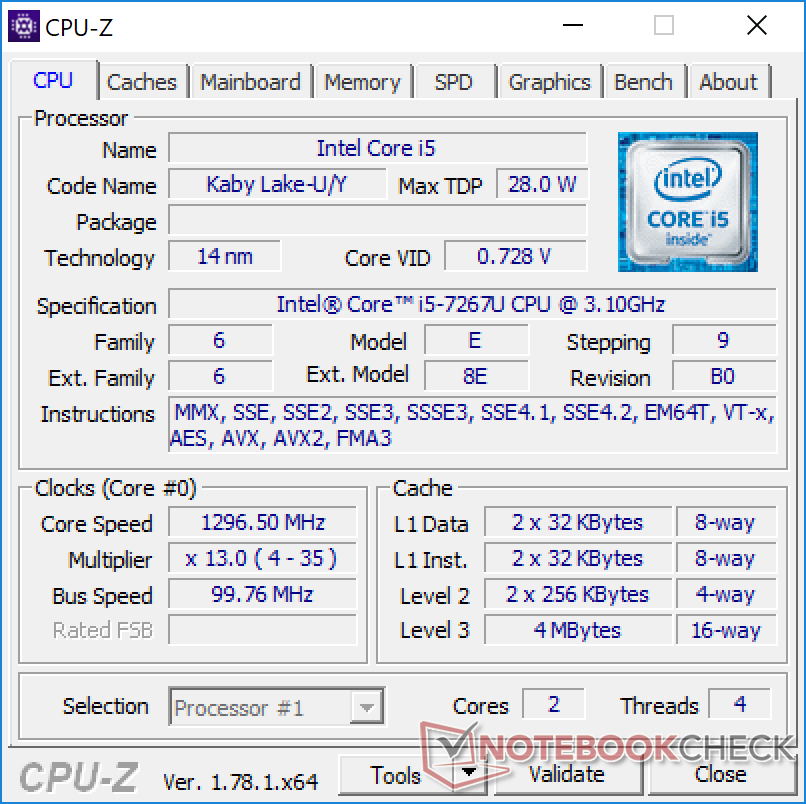
The entry-level processor of the new Apple MacBook Pro 13 Touch Bar carries the designation Core i5-7267U. The Kaby Lake processor has two cores with a base frequency of 3.1 GHz, but it can be raised up to 3.5 GHz via Turbo Boost (for one and two active cores). The i5-7267U is therefore comparable to the regular Core i7-7500U (also up to 3.5 GHz), but the latter should be a bit slower due to the lower TDP and the lack of eDRAM cache.
This is supported by the benchmarks. While the Core i7-7500U in the Lenovo ThinkPad X1 Carbon has a small advantage in the Single-Core test of the current Cinebench R15, the new MacBook Pro 15 is 6% faster in the Multi-Test. The advantage over the old MacBook Pro 13 from 2016 is 8 or 13%, respectively (Single/Multi), so owners of the Skylake model do not have to upgrade. We also included the Acer Predator 17; it is equipped with the Core i7-7700HQ, which is the new entry-level CPU of the bigger Apple MacBook Pro 15 (review soon). The quad-core is obviously much more powerful when you stress multiple cores.
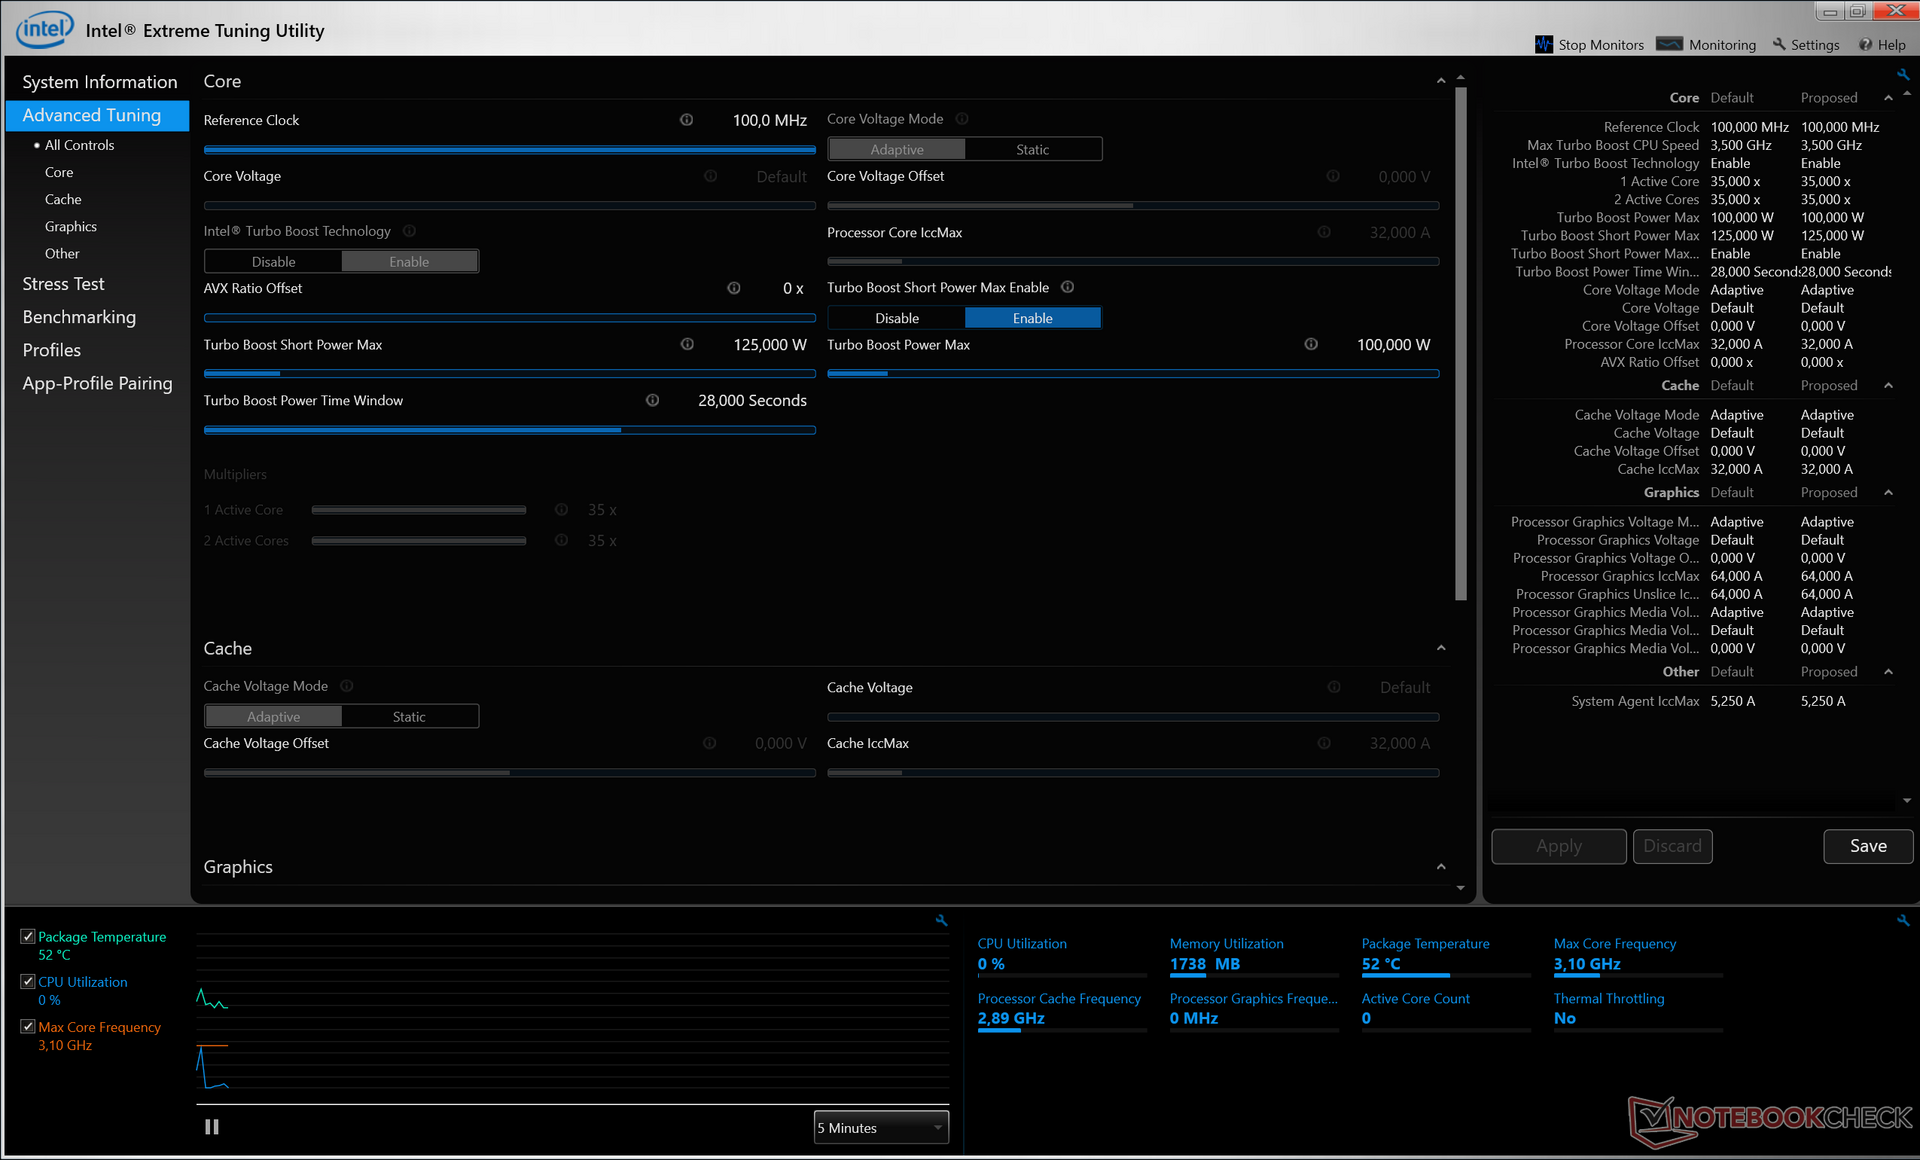
Apple does not limit the processor at the specified 28 watts. The tool Intel Extreme Tuning Utility shows a permanent consumption limit at 100 Watts (even 125 watts for a short time), so the temperature is the only limiting factor.

The processor can maintain its performance under sustained workloads. A loop of the Cinebench R15 Multi Test determines a steady score after 20 runs; the only small outlier was probably affected by a background process. The CPU performance is not reduced on battery power.
More benchmarks and technical specifications for the Intel Core i5-7267U are available in our Tech section.
System Performance
We performed the synthetic PCMark benchmarks running on Windows (BootCamp). You should note that the results also depend on the drivers, which are provided by Apple. All comparison devices are still pretty close in the Home Test, but the two Windows-based models are clearly ahead (+20%) in the Work Test. The new MacBook Pro 13 also falls behind the direct predecessor, despite the more powerful hardware.
So what does this mean? Subjectively, you cannot notice a difference and the MacBook Pro 13 is extremely responsive and there are hardly any delays when you launch applications.
| PCMark 8 Home Score Accelerated v2 | 3829 points | |
| PCMark 8 Creative Score Accelerated v2 | 5188 points | |
| PCMark 8 Work Score Accelerated v2 | 4081 points | |
| PCMark 10 Score | 3427 points | |
Help | ||
Storage Devices
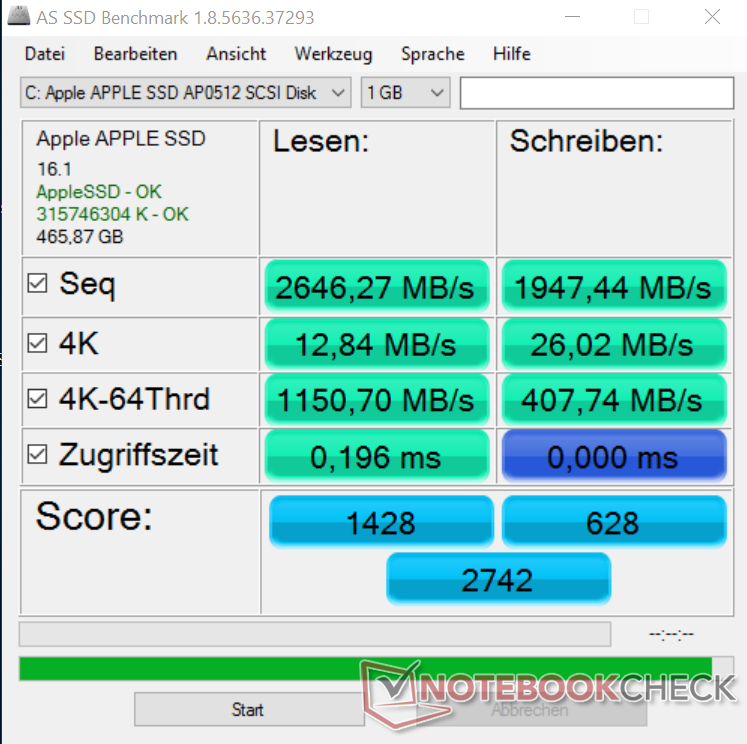
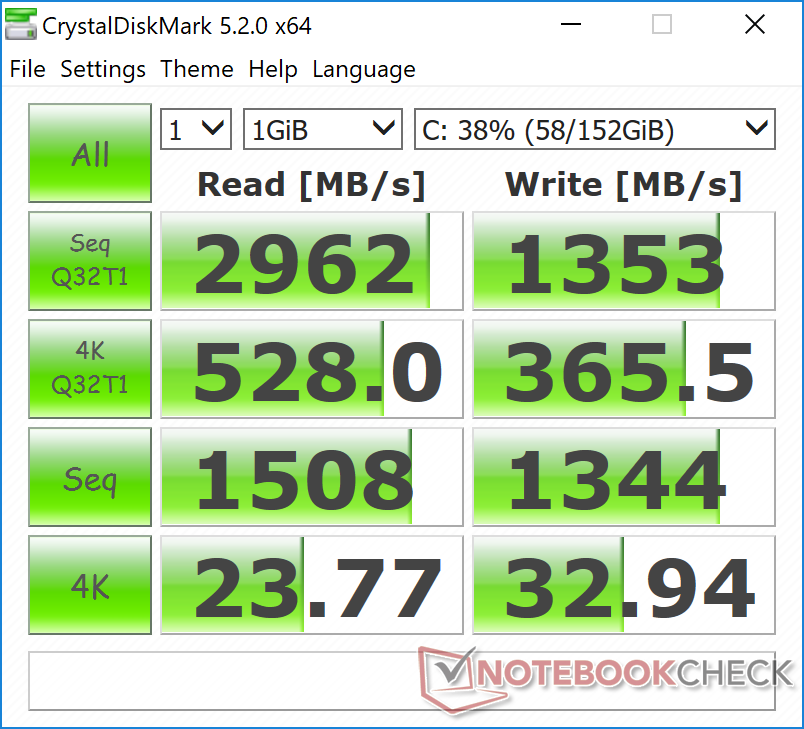
Our test model is equipped with the 256 GB PCIe-SSD with the designation AP0256. Not only the designation is similar to the predecessor; we can also see similar performance results. AS SSD running on Windows still has some issues (also the case for the previous models), but all three drives are basically on the same – good – performance level.
| Apple MacBook Pro 13 2017 Touchbar i5 Apple SSD AP0256 | Apple MacBook Pro 13 2016 (2.9 GHz) Apple SSD AP0256 | Apple MacBook Pro 13 2016 Apple SSD AP0256 | Lenovo ThinkPad X1 Carbon 2017-20HQS03P00 Samsung PM961 NVMe MZVLW512HMJP | Dell XPS 13 9360 QHD+ i5 Toshiba NVMe THNSN5256GPUK | |
|---|---|---|---|---|---|
| CrystalDiskMark 3.0 | 42% | 36% | 263% | 148% | |
| Read Seq (MB/s) | 1540 | 1662 8% | 1345 -13% | 1827 19% | 1168 -24% |
| Write Seq (MB/s) | 1353 | 1336 -1% | 1320 -2% | 1383 2% | 329 -76% |
| Read 512 (MB/s) | 926 | 1183 28% | 831 -10% | 814 -12% | 1015 10% |
| Write 512 (MB/s) | 698 | 1481 112% | 1486 113% | 1098 57% | 307 -56% |
| Read 4k (MB/s) | 9.92 | 16.1 62% | 31.68 219% | 61 515% | 33 233% |
| Write 4k (MB/s) | 10.74 | 23.5 119% | 11.02 3% | 172.2 1503% | 132 1129% |
| Read 4k QD32 (MB/s) | 618 | 657 6% | 533 -14% | 601 -3% | 525 -15% |
| Write 4k QD32 (MB/s) | 403.8 | 419 4% | 362 -10% | 495.6 23% | 325 -20% |
| AS SSD | 21% | -2% | 181% | -68% | |
| Seq Read (MB/s) | 2327 | 2405 3% | 2275 -2% | 2434 5% | 1412 -39% |
| Seq Write (MB/s) | 1364 | 1499 10% | 1435 5% | 1506 10% | 46 -97% |
| 4K Read (MB/s) | 12.7 | 18.8 48% | 13.3 5% | 56.8 347% | |
| 4K Write (MB/s) | 19.3 | 26.1 35% | 15.4 -20% | 151.1 683% | |
| 4K-64 Read (MB/s) | 852 | 894 5% | 904 6% | 1022 20% | |
| 4K-64 Write (MB/s) | 419 | 448 7% | 417 0% | 905 116% | |
| Access Time Read * (ms) | 0.26 | 0.156 40% | 0.288 -11% | 0.028 89% | |
| Access Time Write * (ms) | 0.027 | ||||
| Total Average (Program / Settings) | 32% /
32% | 17% /
18% | 222% /
225% | 40% /
105% |
* ... smaller is better

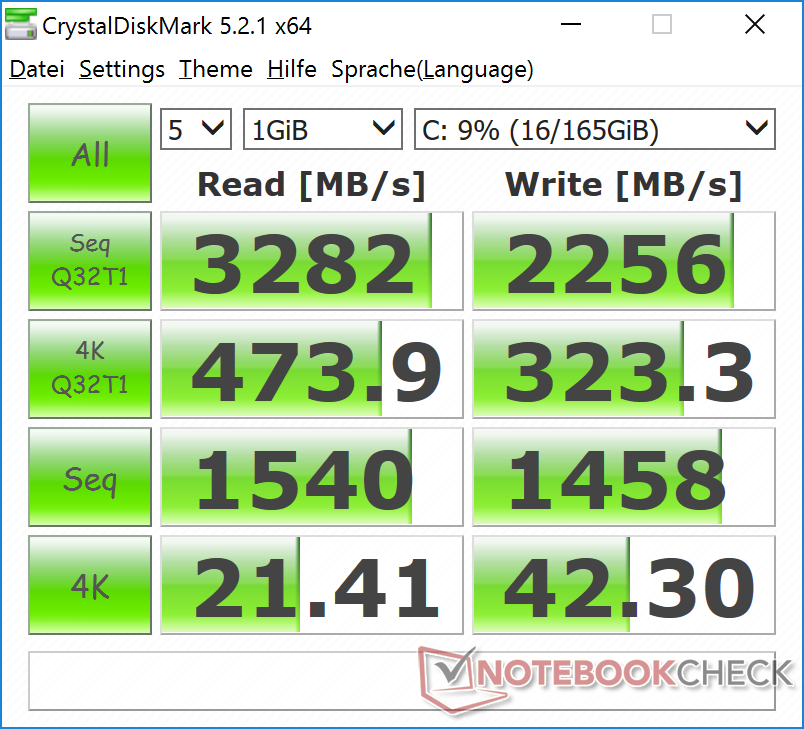
Our second test model is equipped with the 512 GB SSD (AP0512). The results – especially the maximum write performance – are a bit higher in both benchmarks. CrystalDiskMark 5 even determines sequential transfer rates of almost 3300 MB/s (read) and 2500 MB/s (write), respectively. You will have a hard time finding a faster drive right now.
GPU Performance
The integrated GPU Intel Iris Plus Graphics 650 is the direct successor to the 550 inside the 2016 model. The basic architecture of the GT3e chip did not really change with the switch to Kaby Lake and the synthetic 3DMarks also determine almost identical scores. Apple's new video standard HEVC was already supported by the old Iris Plus Graphics 550, but the new GPU now also decodes HEVC Main10 with a color depth of 10-bit as well as Google's VP9 codec.
The GPU performance is not reduced on battery power. More technical information and benchmarks for the Iris Plus Graphics 650 is available here.
| 3DMark 06 Standard Score | 15175 points | |
| 3DMark 11 Performance | 2924 points | |
| 3DMark Cloud Gate Standard Score | 8403 points | |
| 3DMark Fire Strike Score | 1586 points | |
| 3DMark Time Spy Score | 623 points | |
Help | ||
Gaming Performance
The gaming performance of the Intel Iris Plus Graphics 650 is between the two dedicated chips Nvidia GeForce 930MX and 940MX, depending on the game. Modern titles are usually limited to low details and resolutions if you want to reach smooth frame rates. Less-demanding titles like Overwatch or Battlefield 1 can also be played at medium settings. The Iris Plus Graphics 650 is generally best suited to older titles.
| low | med. | high | ultra | |
|---|---|---|---|---|
| BioShock Infinite (2013) | 84 | 54.4 | 46.5 | 13.3 |
| GTA V (2015) | 56.5 | 49.9 | 11.6 | 5 |
| The Witcher 3 (2015) | 21.4 | |||
| Dota 2 Reborn (2015) | 95 | 64 | 29.7 | 25 |
| Rainbow Six Siege (2015) | 54.2 | 35.6 | 20.8 | |
| Rise of the Tomb Raider (2016) | 25.9 | 18.3 | ||
| Far Cry Primal (2016) | 32 | 15 | ||
| The Division (2016) | 30 | |||
| Overwatch (2016) | 79.2 | 57.4 | 25.6 | 21.4 |
| Deus Ex Mankind Divided (2016) | 19.2 | 14.6 | 8.2 | |
| Battlefield 1 (2016) | 46.1 | 29.5 | ||
| Civilization 6 (2016) | 42.2 | 20.2 | ||
| Farming Simulator 17 (2016) | 36.8 | 19.9 | ||
| Titanfall 2 (2016) | 54.1 | 37.9 | ||
| Call of Duty Infinite Warfare (2016) | 32.4 | |||
| Dishonored 2 (2016) | 15 | |||
| For Honor (2017) | 39.7 | 15.2 | ||
| Ghost Recon Wildlands (2017) | 17.6 | |||
| Mass Effect Andromeda (2017) | 25.8 | 10.5 | ||
| Prey (2017) | 51.4 | 20.2 | ||
| Rocket League (2017) | 113 | 56.8 | 38.9 | |
| Dirt 4 (2017) | 64 | 21.3 | 14.2 |
Emissions
System Noise
The fan control is one advantage of the small 13-inch MacBook Pro. The two fans don't run while the device is idling or with light workloads, so the system is silent. This is also a big advantage over the 15-inch models, where the fan is always spinning (albeit hardly audible). The fan speed is seamlessly adjusted to the workload. We can only measure 33.3 dB(A) in the first 3DMark06 run, but more in the second run than even in the extreme load scenario with FurMark and Prime95 (43.2 dB(A)). It will then level off at the result of the stress test. We even measured 48 dB(A) for a short while (only CPU load by Prime95) and we even noticed slight vibrations on the desk (see the peak in the fan noise diagram at low frequencies). The fans are generally quieter in macOS; we can only determine between 32-34 dB(A) (3000 / 3200-3600 / 3900 rpm) in the Unigine Valley test.
Noise level
| Idle |
| 30.6 / 30.6 / 30.6 dB(A) |
| HDD |
| 30.6 dB(A) |
| Load |
| 41.8 / 41.8 dB(A) |
 | ||
30 dB silent 40 dB(A) audible 50 dB(A) loud |
||
min: | ||
Temperature
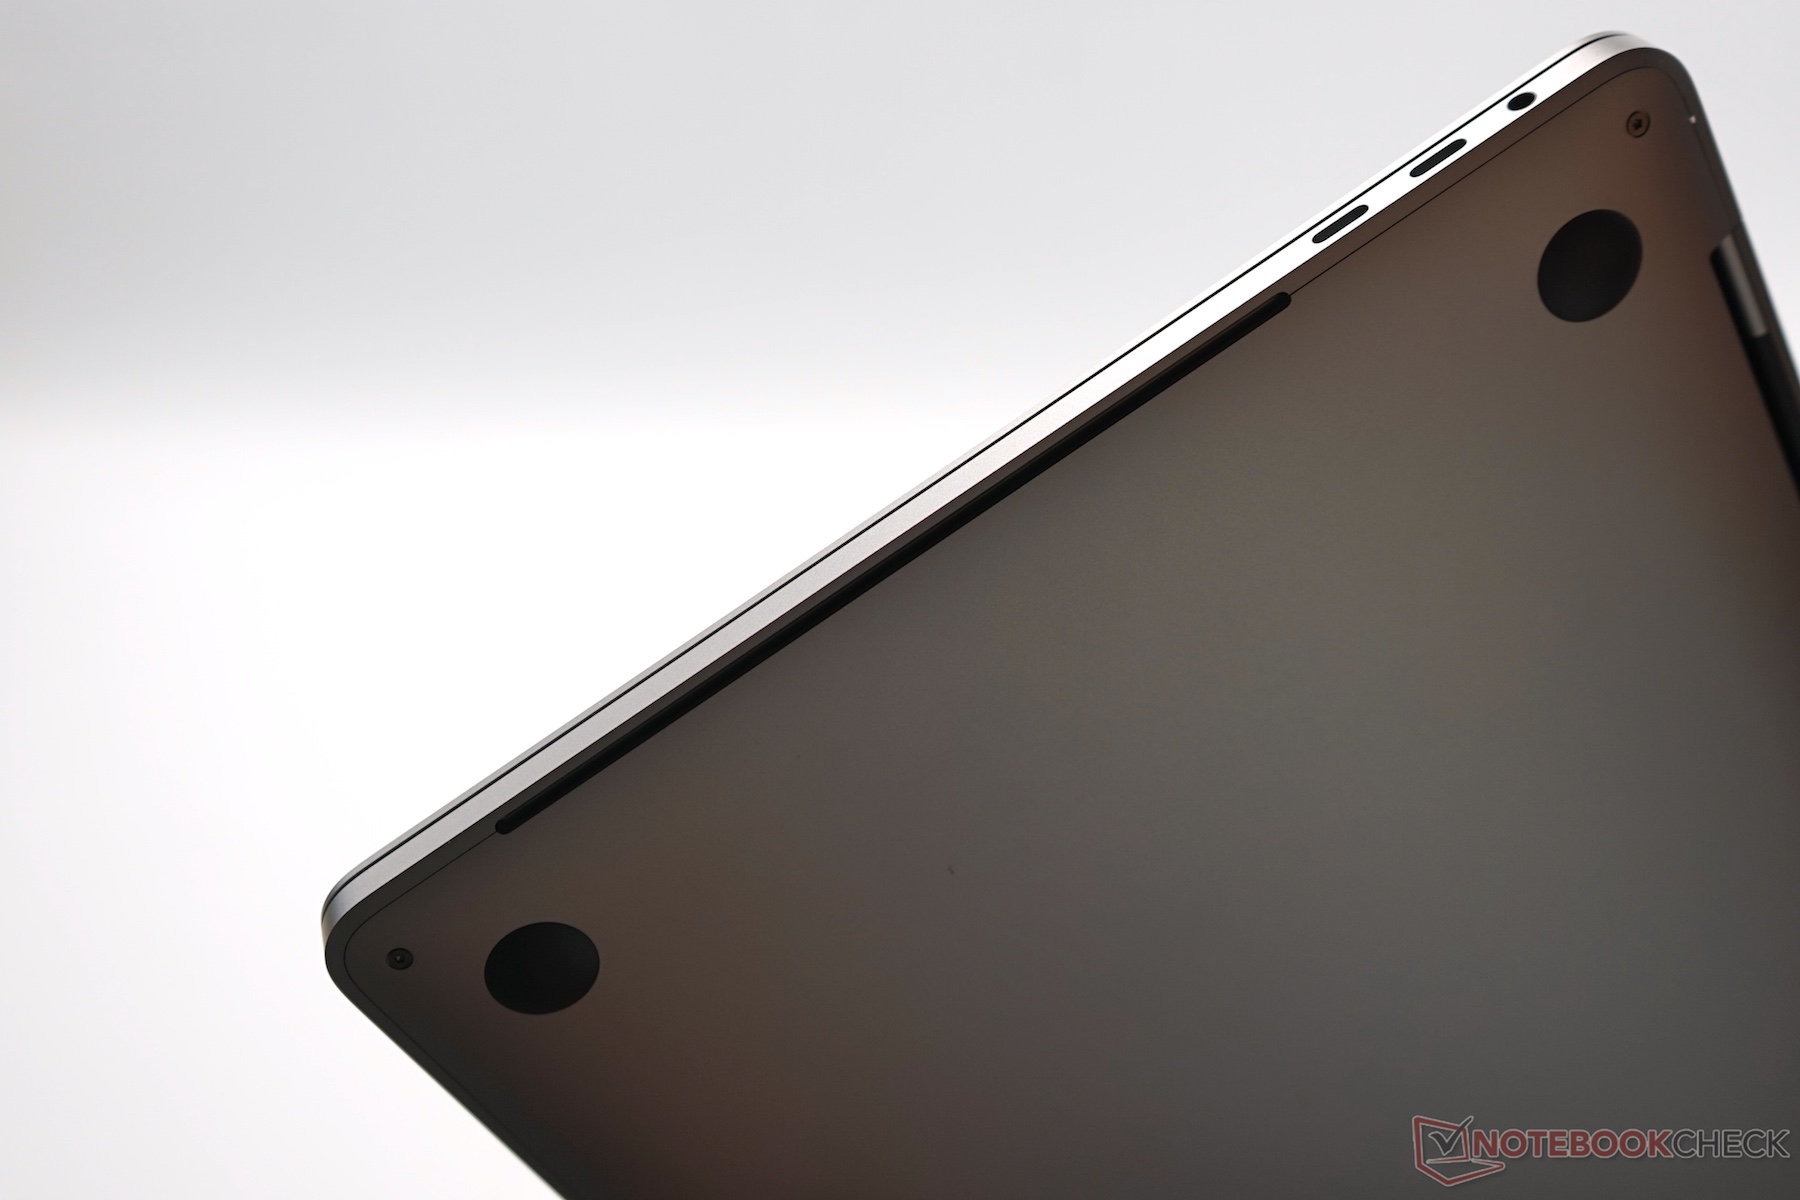
The surface temperatures of the Apple MacBook Pro 13 2017 are not too high and there are only small differences compared to the predecessor. It is possible to use the MacBook on your lap, even under maximum load or when you play games, since we only measure up to 39 °C at the bottom. The maximum temperature at the top is 43 °C in the upper area of the keyboard. The Dell XPS 13 QHD+ i5 gets similarly warm, but we recorded higher load temperatures for the Lenovo X1 Carbon 2017.
As per usual, Apple tolerates high CPU temperatures to provide the highest possible performance in load scenarios. We can see CPU temperatures between 90-100 °C running on macOS as well as Windows. It is not easy to see exact clocks, especially with Windows. The stress test with the two tools Prime95 and FurMark is executed with a CPU clock of 2.1 GHz (~10 watts). The consumption of the GT cores (GPU) is 18-19 watts in this case. For comparison: The GPU consumes 22-25 watts when we only stress the GPU via FurMark, so the stress test clock should be a bit lower. This behavior changes a bit on battery: The graphics card is slightly throttled (~15 watts), which gives the CPU a bit more headroom (2.3 GHz, ~12 watts).
(±) The maximum temperature on the upper side is 43 °C / 109 F, compared to the average of 35.9 °C / 97 F, ranging from 21.4 to 59 °C for the class Subnotebook.
(+) The bottom heats up to a maximum of 39 °C / 102 F, compared to the average of 39.2 °C / 103 F
(+) In idle usage, the average temperature for the upper side is 23.7 °C / 75 F, compared to the device average of 30.8 °C / 87 F.
(±) Playing The Witcher 3, the average temperature for the upper side is 35.6 °C / 96 F, compared to the device average of 30.8 °C / 87 F.
(+) The palmrests and touchpad are cooler than skin temperature with a maximum of 31 °C / 87.8 F and are therefore cool to the touch.
(-) The average temperature of the palmrest area of similar devices was 28.2 °C / 82.8 F (-2.8 °C / -5 F).
| Apple MacBook Pro 13 2017 Touchbar i5 Iris Plus Graphics 650, i5-7267U, Apple SSD AP0256 | Apple MacBook Pro 13 2016 (2.9 GHz) Iris Graphics 550, 6267U, Apple SSD AP0256 | Apple MacBook Pro 13 2016 Iris Graphics 540, 6360U, Apple SSD AP0256 | Lenovo ThinkPad X1 Carbon 2017-20HQS03P00 HD Graphics 620, i7-7500U, Samsung PM961 NVMe MZVLW512HMJP | Dell XPS 13 9360 QHD+ i5 HD Graphics 620, i5-7200U, Toshiba NVMe THNSN5256GPUK | |
|---|---|---|---|---|---|
| Heat | -2% | -4% | -5% | -11% | |
| Maximum Upper Side * (°C) | 43 | 45 -5% | 42 2% | 48 -12% | 40 7% |
| Maximum Bottom * (°C) | 39 | 39 -0% | 41 -5% | 47.2 -21% | 42 -8% |
| Idle Upper Side * (°C) | 25 | 26 -4% | 26 -4% | 23.5 6% | 28 -12% |
| Idle Bottom * (°C) | 24 | 24 -0% | 26 -8% | 22.6 6% | 31 -29% |
* ... smaller is better
Speakers
The speakers did not change compared to the previous model, but there was no reason to change them. Despite their small size, they manage excellent results in our measurements and also convince subjectively.
Apple MacBook Pro 13 2017 Touchbar i5 audio analysis
(+) | speakers can play relatively loud (86.2 dB)
Bass 100 - 315 Hz
(±) | reduced bass - on average 11.5% lower than median
(±) | linearity of bass is average (10.8% delta to prev. frequency)
Mids 400 - 2000 Hz
(±) | higher mids - on average 5.2% higher than median
(+) | mids are linear (6.4% delta to prev. frequency)
Highs 2 - 16 kHz
(+) | balanced highs - only 2.2% away from median
(+) | highs are linear (5.7% delta to prev. frequency)
Overall 100 - 16.000 Hz
(+) | overall sound is linear (11.9% difference to median)
Compared to same class
» 13% of all tested devices in this class were better, 5% similar, 82% worse
» The best had a delta of 5%, average was 18%, worst was 53%
Compared to all devices tested
» 9% of all tested devices were better, 2% similar, 89% worse
» The best had a delta of 4%, average was 23%, worst was 134%
Apple MacBook 12 (Early 2016) 1.1 GHz audio analysis
(+) | speakers can play relatively loud (83.6 dB)
Bass 100 - 315 Hz
(±) | reduced bass - on average 11.3% lower than median
(±) | linearity of bass is average (14.2% delta to prev. frequency)
Mids 400 - 2000 Hz
(+) | balanced mids - only 2.4% away from median
(+) | mids are linear (5.5% delta to prev. frequency)
Highs 2 - 16 kHz
(+) | balanced highs - only 2% away from median
(+) | highs are linear (4.5% delta to prev. frequency)
Overall 100 - 16.000 Hz
(+) | overall sound is linear (10.2% difference to median)
Compared to same class
» 7% of all tested devices in this class were better, 2% similar, 90% worse
» The best had a delta of 5%, average was 18%, worst was 53%
Compared to all devices tested
» 5% of all tested devices were better, 1% similar, 94% worse
» The best had a delta of 4%, average was 23%, worst was 134%
Frequency comparison (checkboxes select/deselectable!)
Energy Management
Power Consumption
We can measure higher idle consumption results compared to the predecessor. This also corresponds with the shorter battery runtime we determined (next section). Both models are on par under load though.
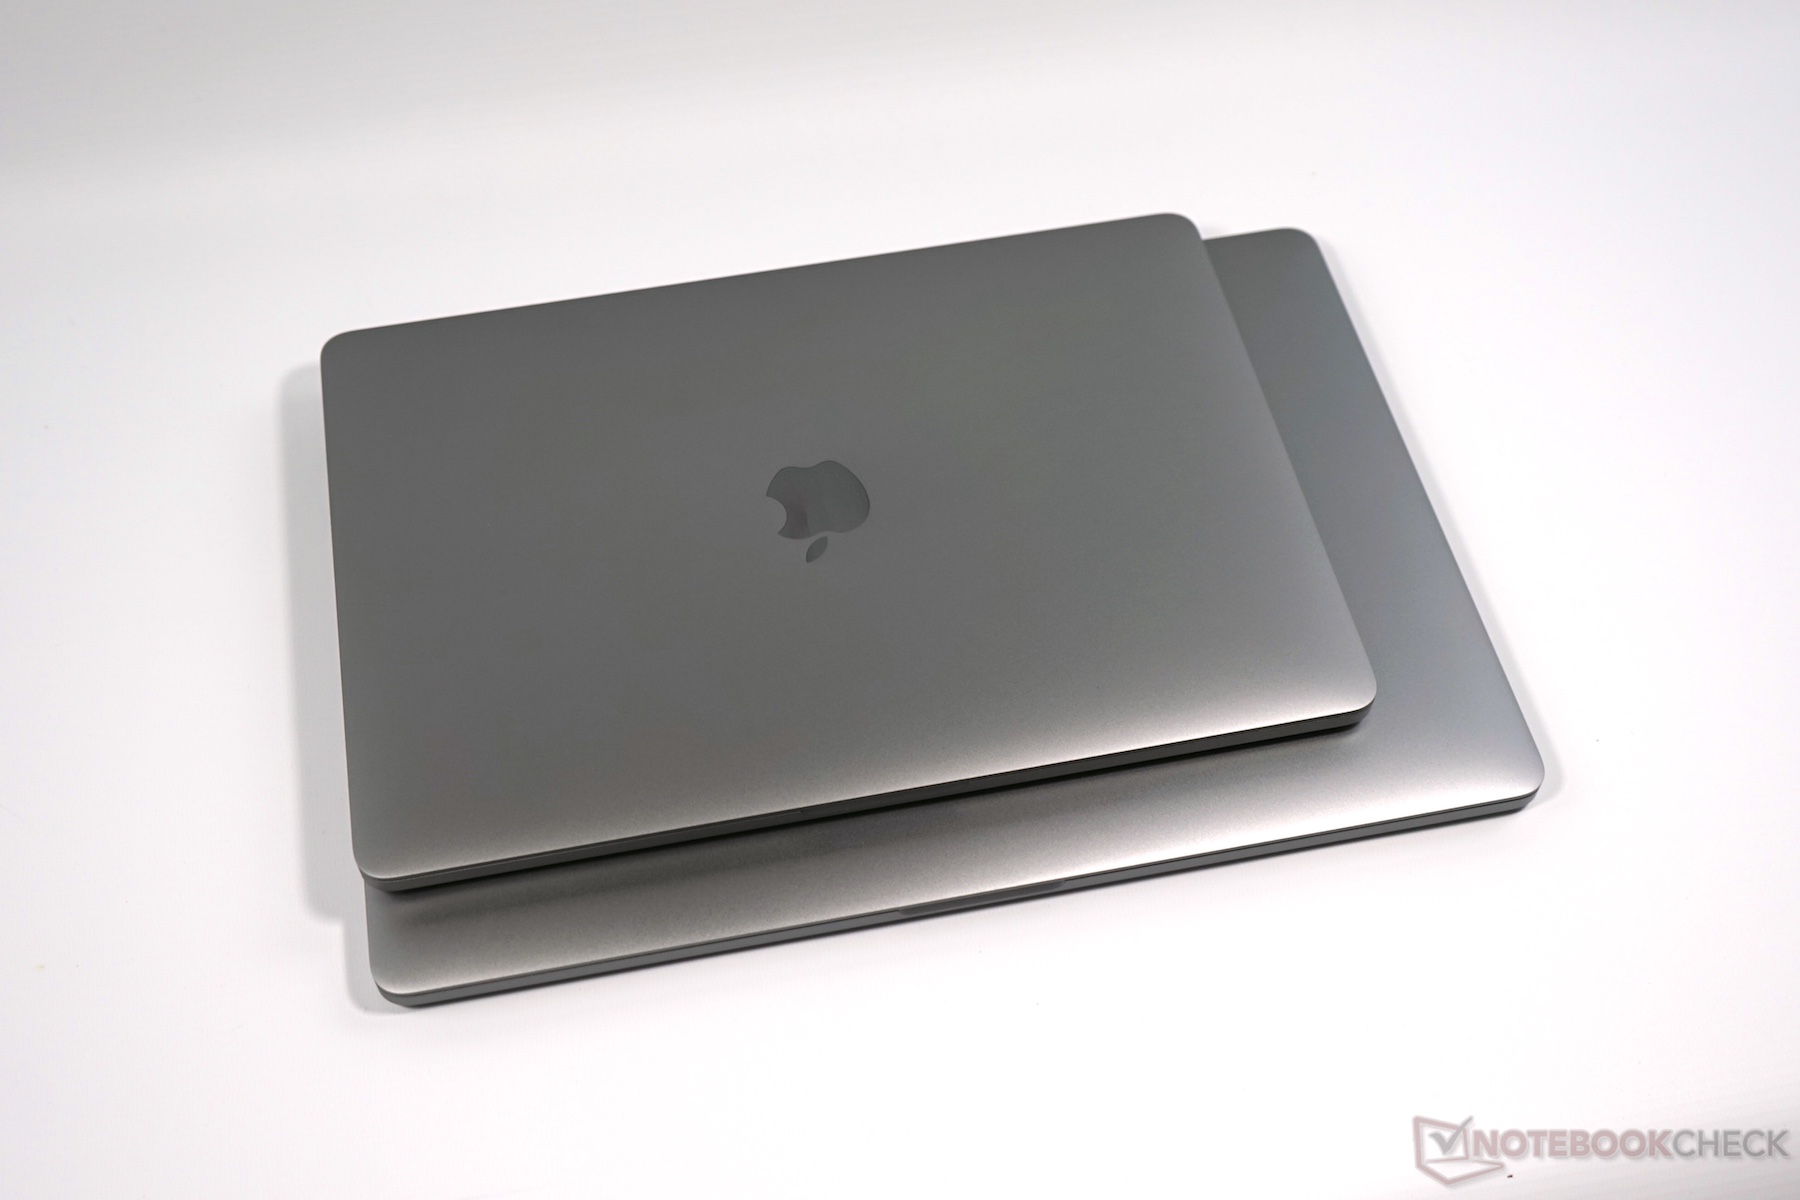
It is also very interesting to compare the power consumption when you are working with an external monitor. The display is eliminated as a consumer and we can compare the consumption of the hardware under load. A test with The Witcher 3 (Ultra) shows that the two MacBook Pro models (13 & 15-inch) are basically on par. This shows that the internal Iris Plus Graphics (4.8 fps) is a powerful iGPU, but it is not very efficient compared to the dedicated Radeon Pro 555 (13 fps).
| Off / Standby | |
| Idle | |
| Load |
|
Key:
min: | |
| Power Consumption - 1920x1080 The Witcher 3 ultra (external Monitor) | |
| Apple MacBook Pro 15 2017 (2.8 GHz, 555) (13 fps, Idle: 13.2 W) | |
| Apple MacBook Pro 13 2017 Touchbar i5 (4.8 fps, Idle: 7.5 W) | |
* ... smaller is better
| Apple MacBook Pro 13 2017 Touchbar i5 i5-7267U, Iris Plus Graphics 650, 2560x1600, 13.3" | Apple MacBook Pro 13 2016 (2.9 GHz) 6267U, Iris Graphics 550, 2560x1600, 13.3" | Apple MacBook Pro 13 2016 6360U, Iris Graphics 540, 2560x1600, 13.3" | Lenovo ThinkPad X1 Carbon 2017-20HQS03P00 i7-7500U, HD Graphics 620, 1920x1080, 14" | Dell XPS 13 9360 QHD+ i5 i5-7200U, HD Graphics 620, 3200x1800, 13.3" | Apple MacBook Pro 15 2016 (2.6 GHz, 450) 6700HQ, Radeon Pro 450, 2880x1800, 15.4" | |
|---|---|---|---|---|---|---|
| Power Consumption | 15% | 16% | 14% | 29% | -11% | |
| Idle Minimum * (Watt) | 2.8 | 2.1 25% | 3 -7% | 3.84 -37% | 3.7 -32% | 2.9 -4% |
| Idle Average * (Watt) | 10.9 | 7.6 30% | 8.9 18% | 6.3 42% | 6.1 44% | 9.7 11% |
| Idle Maximum * (Watt) | 11.4 | 8.2 28% | 8.9 22% | 8.6 25% | 6.5 43% | 10.1 11% |
| Load Average * (Watt) | 55.4 | 56.4 -2% | 43.4 22% | 41.9 24% | 29.5 47% | 65 -17% |
| Load Maximum * (Watt) | 57.5 | 59.8 -4% | 42.1 27% | 48.7 15% | 33 43% | 89.5 -56% |
* ... smaller is better
Battery Runtime
The battery capacity is still 49.2 Wh. The Kaby Lake processor is manufactured in an optimized process (14 nm+) compared to its Skylake predecessor, so it should consume less power. We expected longer battery runtimes from the new model, but this is not the case in our Wi-Fi test. The previous model still lasted almost 9.5 hours at an adjusted luminance of 150 nits, but the current model only manages ~8:40 hours. We repeated the test three times, but the result was the same with a couple of minutes' tolerance. This means the MBP Pro 13 is on par with the ThinkPad X1 Carbon and Dell XPS 13 QHD+, but they also feature bigger batteries and different resolutions.
This trend continues in the video test, where the short movie Big Buck Bunny (H.264, FHD) runs in a loop at 150 nits. The result of almost 7 hours is not only beaten by the predecessor, but all the other comparison devices are significantly more enduring as well. The load test determines a couple of minutes more compared to the 2016 model, but you still have to recharge it after 70 minutes. We can see the impact of the 28-watt processor in this scenario and the ULV systems from Dell and Lenovo manage longer runtimes.
A second test model, which is also equipped with the Core i5 processor, managed 08:38 h in the Wi-Fi test and therefore confirms our initial result. The Wi-Fi runtime running Windows (BootCamp) is a bit shorter at 06:54 h. The charging time is around 2 hours, but 50% of the capacity is available after little more than 30 minutes.
| Apple MacBook Pro 13 2017 Touchbar i5 i5-7267U, Iris Plus Graphics 650, 49.2 Wh | Apple MacBook Pro 13 2016 (2.9 GHz) 6267U, Iris Graphics 550, 49.2 Wh | Apple MacBook Pro 13 2016 6360U, Iris Graphics 540, 54 Wh | Lenovo ThinkPad X1 Carbon 2017-20HQS03P00 i7-7500U, HD Graphics 620, 57 Wh | Dell XPS 13 9360 QHD+ i5 i5-7200U, HD Graphics 620, 60 Wh | |
|---|---|---|---|---|---|
| Battery runtime | 6% | 41% | 39% | 42% | |
| H.264 (h) | 6.9 | 8.1 17% | 10.3 49% | 11.9 72% | 9.1 32% |
| WiFi v1.3 (h) | 8.7 | 9.4 8% | 11.4 31% | 8.3 -5% | 8.8 1% |
| Load (h) | 1.2 | 1.1 -8% | 1.7 42% | 1.8 50% | 2.3 92% |
Verdict
Pros
Cons
We could just repeat the verdict from last year's model at this point, because not much changed with this update. The new Kaby Lake processor is a bit faster, but the GPU performance did not change. The efficiency aspect on the other hand is interesting, because the larger MacBook Pro 15 with the dedicated (and much faster) GPU consumes the same amount of power during gaming, for example. Maybe Apple should use dedicated GPUs for upcoming models of the MBP 13 as well.
The current MacBook Pro 13 is still a very good, but also very expensive, subnotebook. The case and display are among the best you can get, the fans are very quiet, and the performance is very steady. You still have to get used to the shallow, yet precise keyboard, and you need adapters in practice. The Touch Bar still depends on the software support, but it will remain a gimmick for most users, which can even make things more complicated in practice. We can still notice the 2.4 GHz Wi-Fi problem. Similar to the previous model, we will deduct 2% from the final rating.
We were quite surprised about the reduced battery runtimes in practical scenarios, even though Kaby Lake chips should be more efficient. Maybe the new CPUs still need some optimization by Apple, which might be what's happening with the new OS High Sierra.
Apple MacBook Pro 13 2017 Touchbar i5
- 06/29/2017 v6 (old)
Klaus Hinum, Andreas Osthoff
Price comparison
