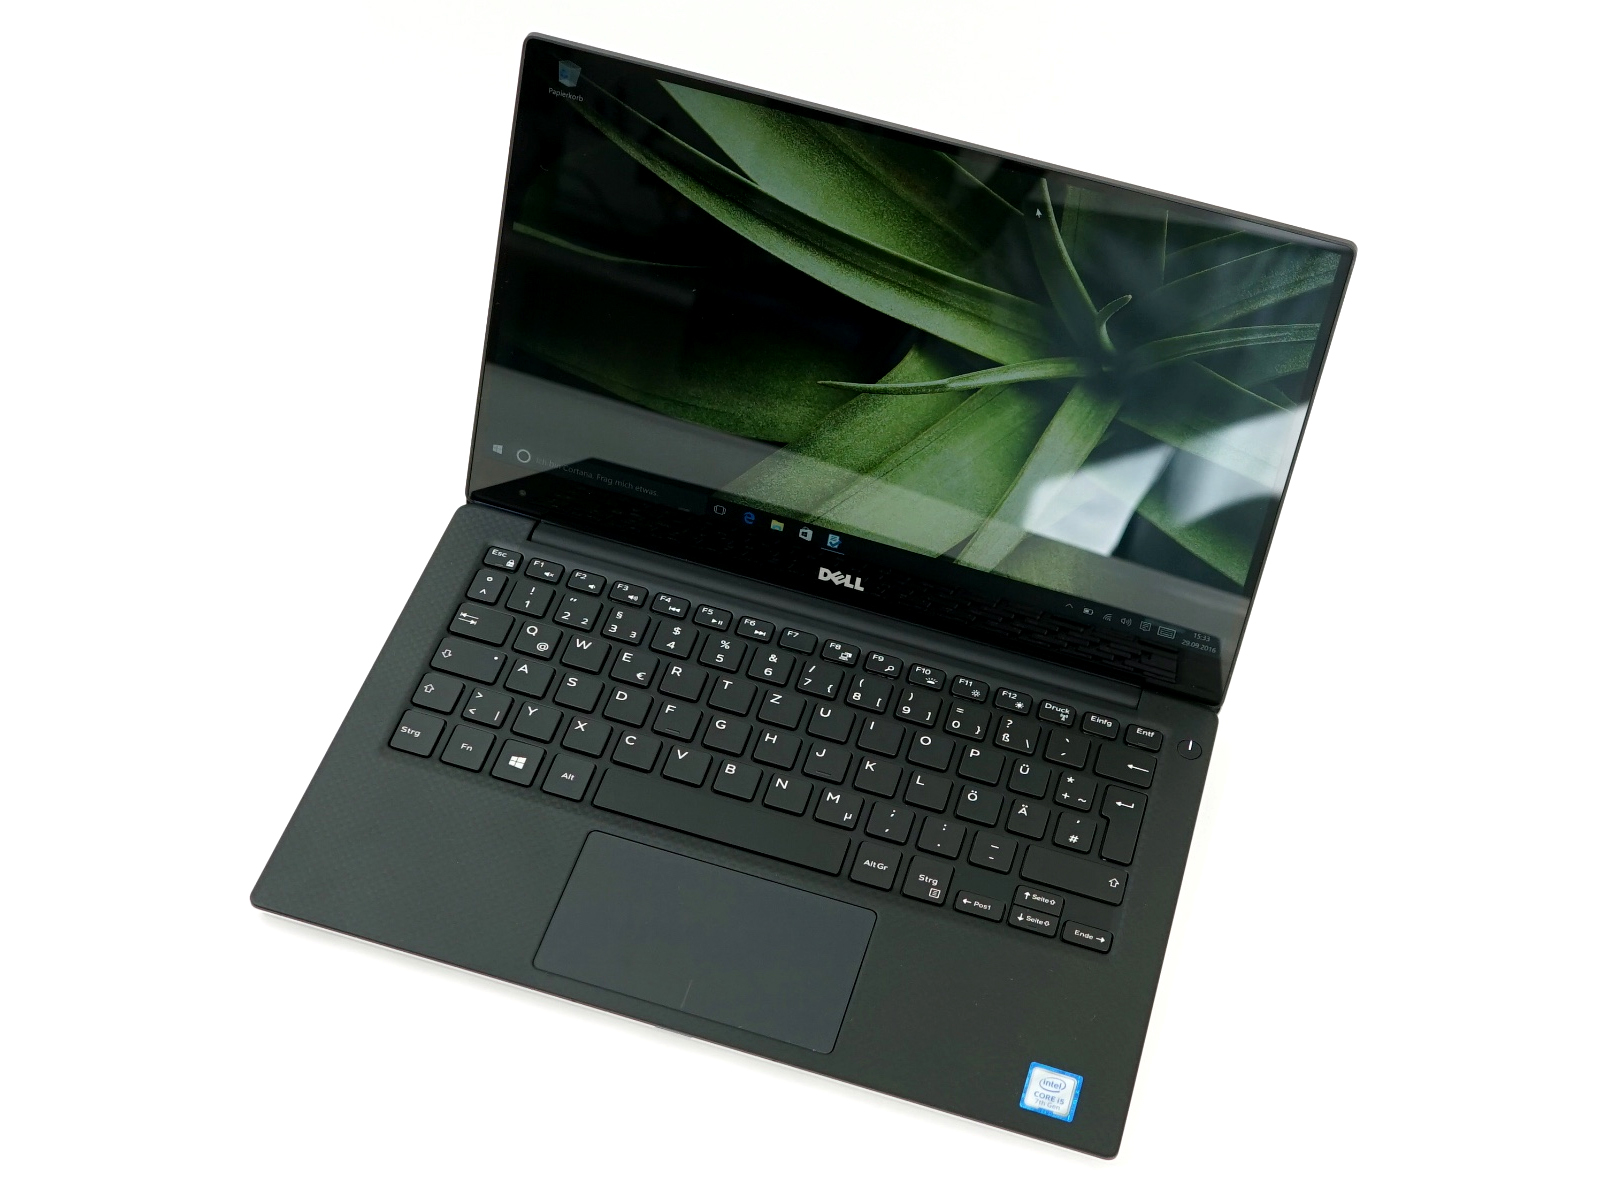
Dell XPS 13 9360 (FHD, i7, Iris) Laptop Review
For the original German review, see here.
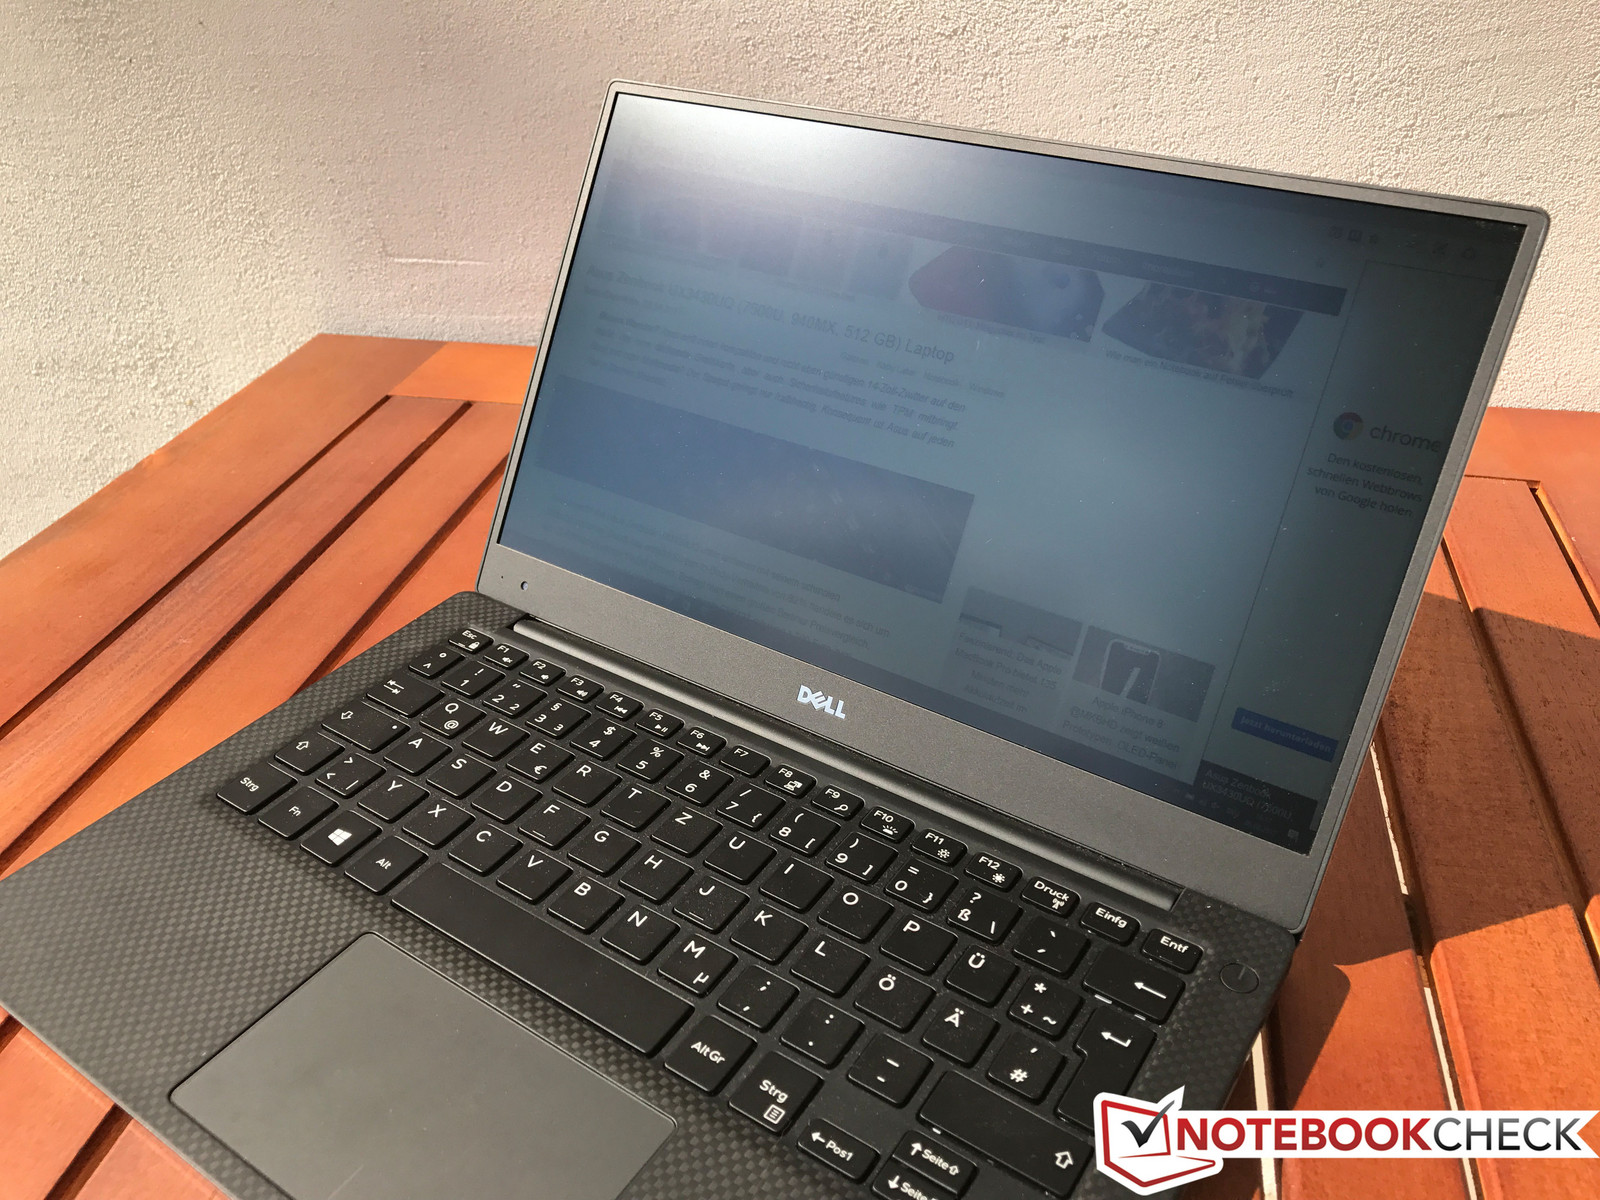
Dell's compact XPS 13 is still one of the most popular Ultrabooks. It is also available with a slightly more powerful processor as well as faster Iris GPU from Intel. We check whether this is a good upgrade or not. This is an interesting question right now, especially with the new Kaby Lake-Refresh chips. They provide more CPU performance, but there is not much going on the GPU side.
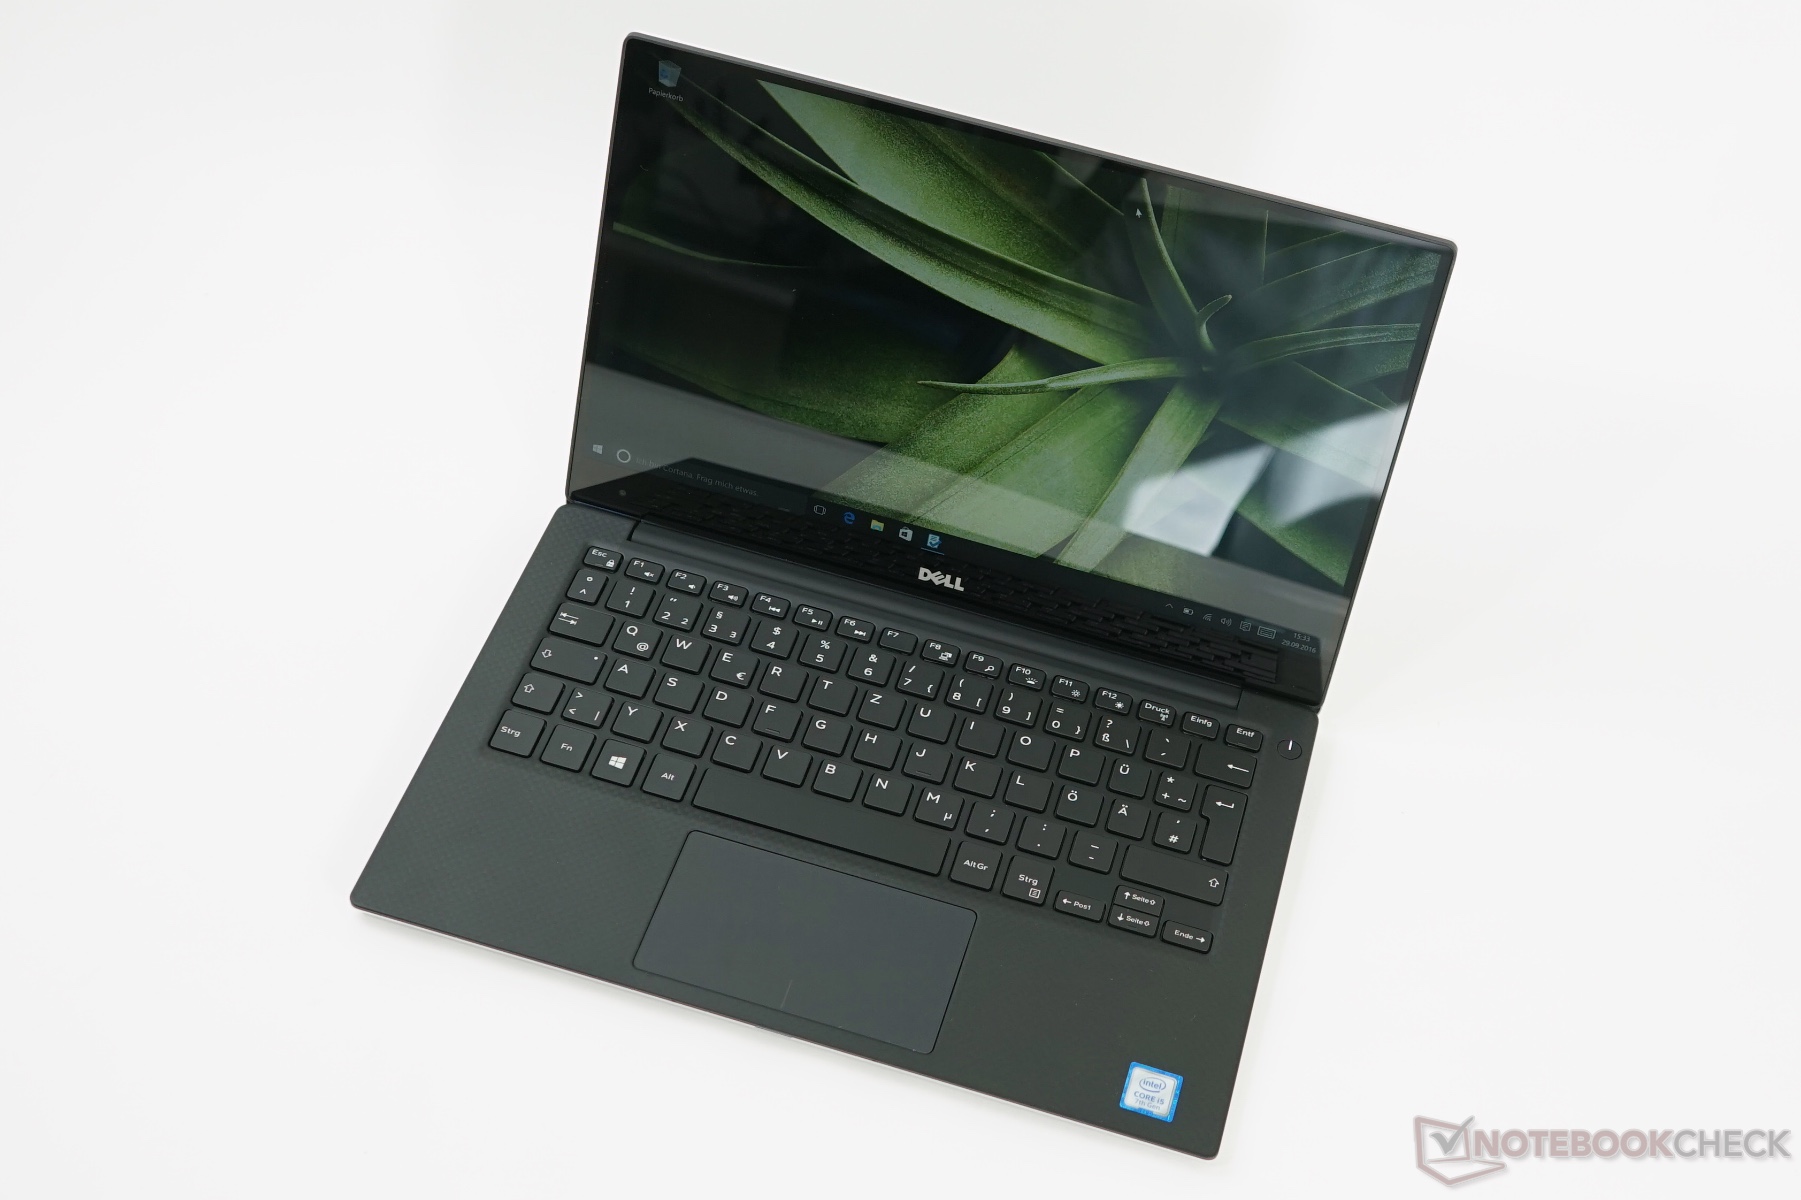
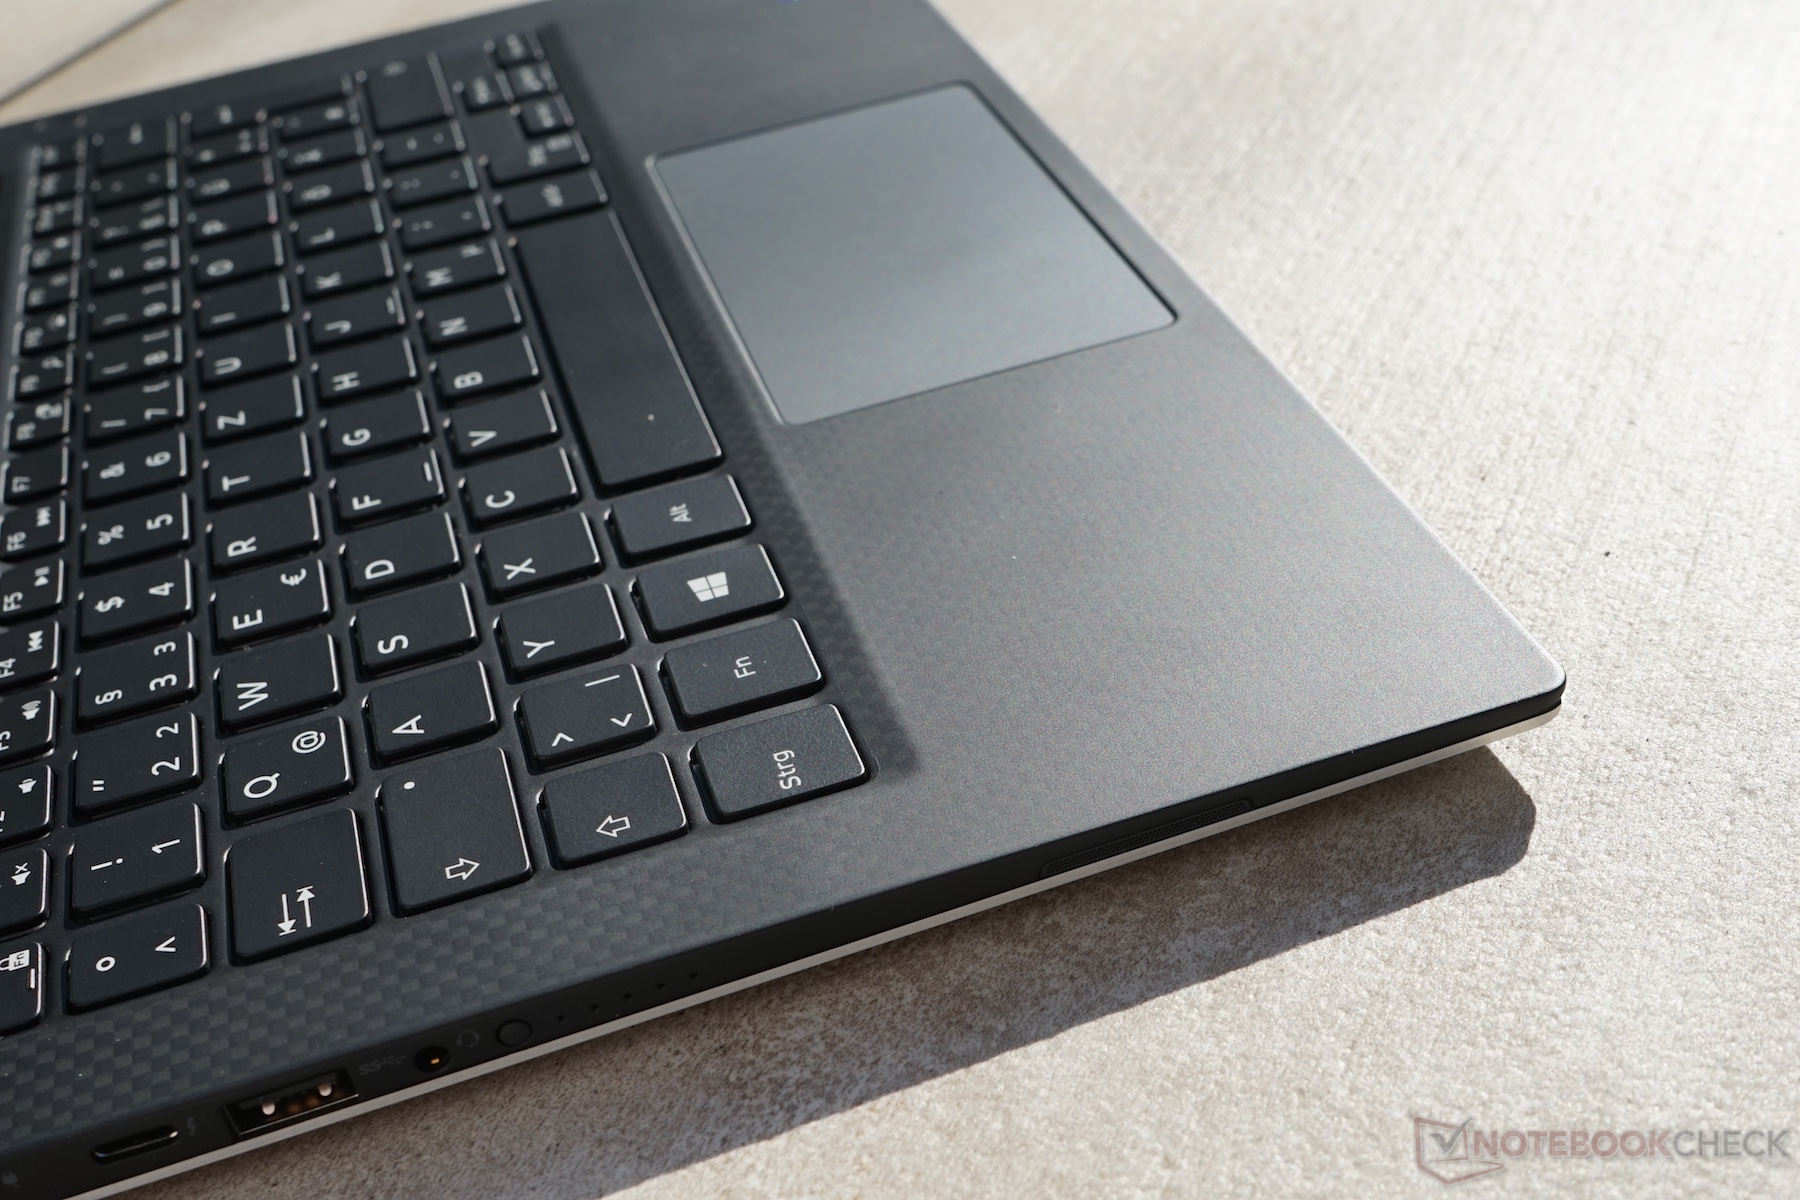
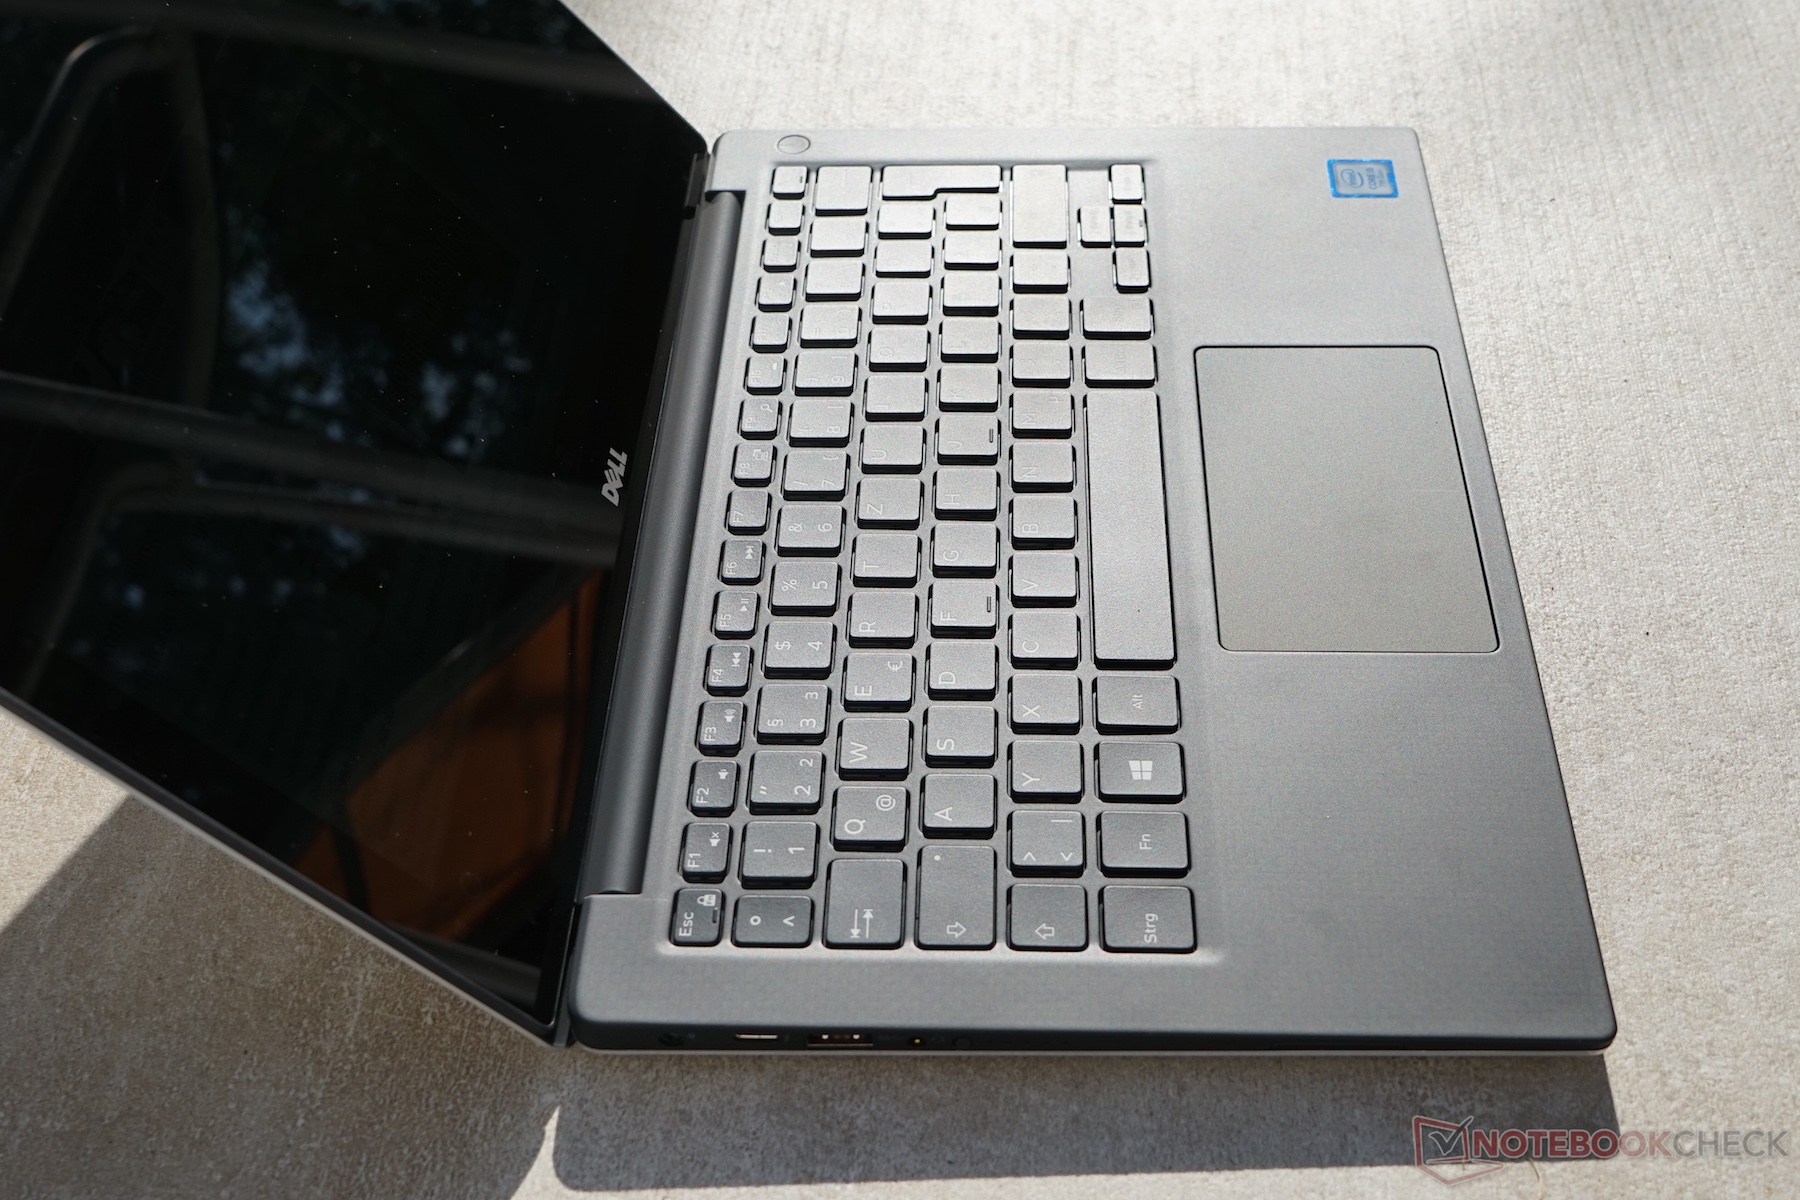
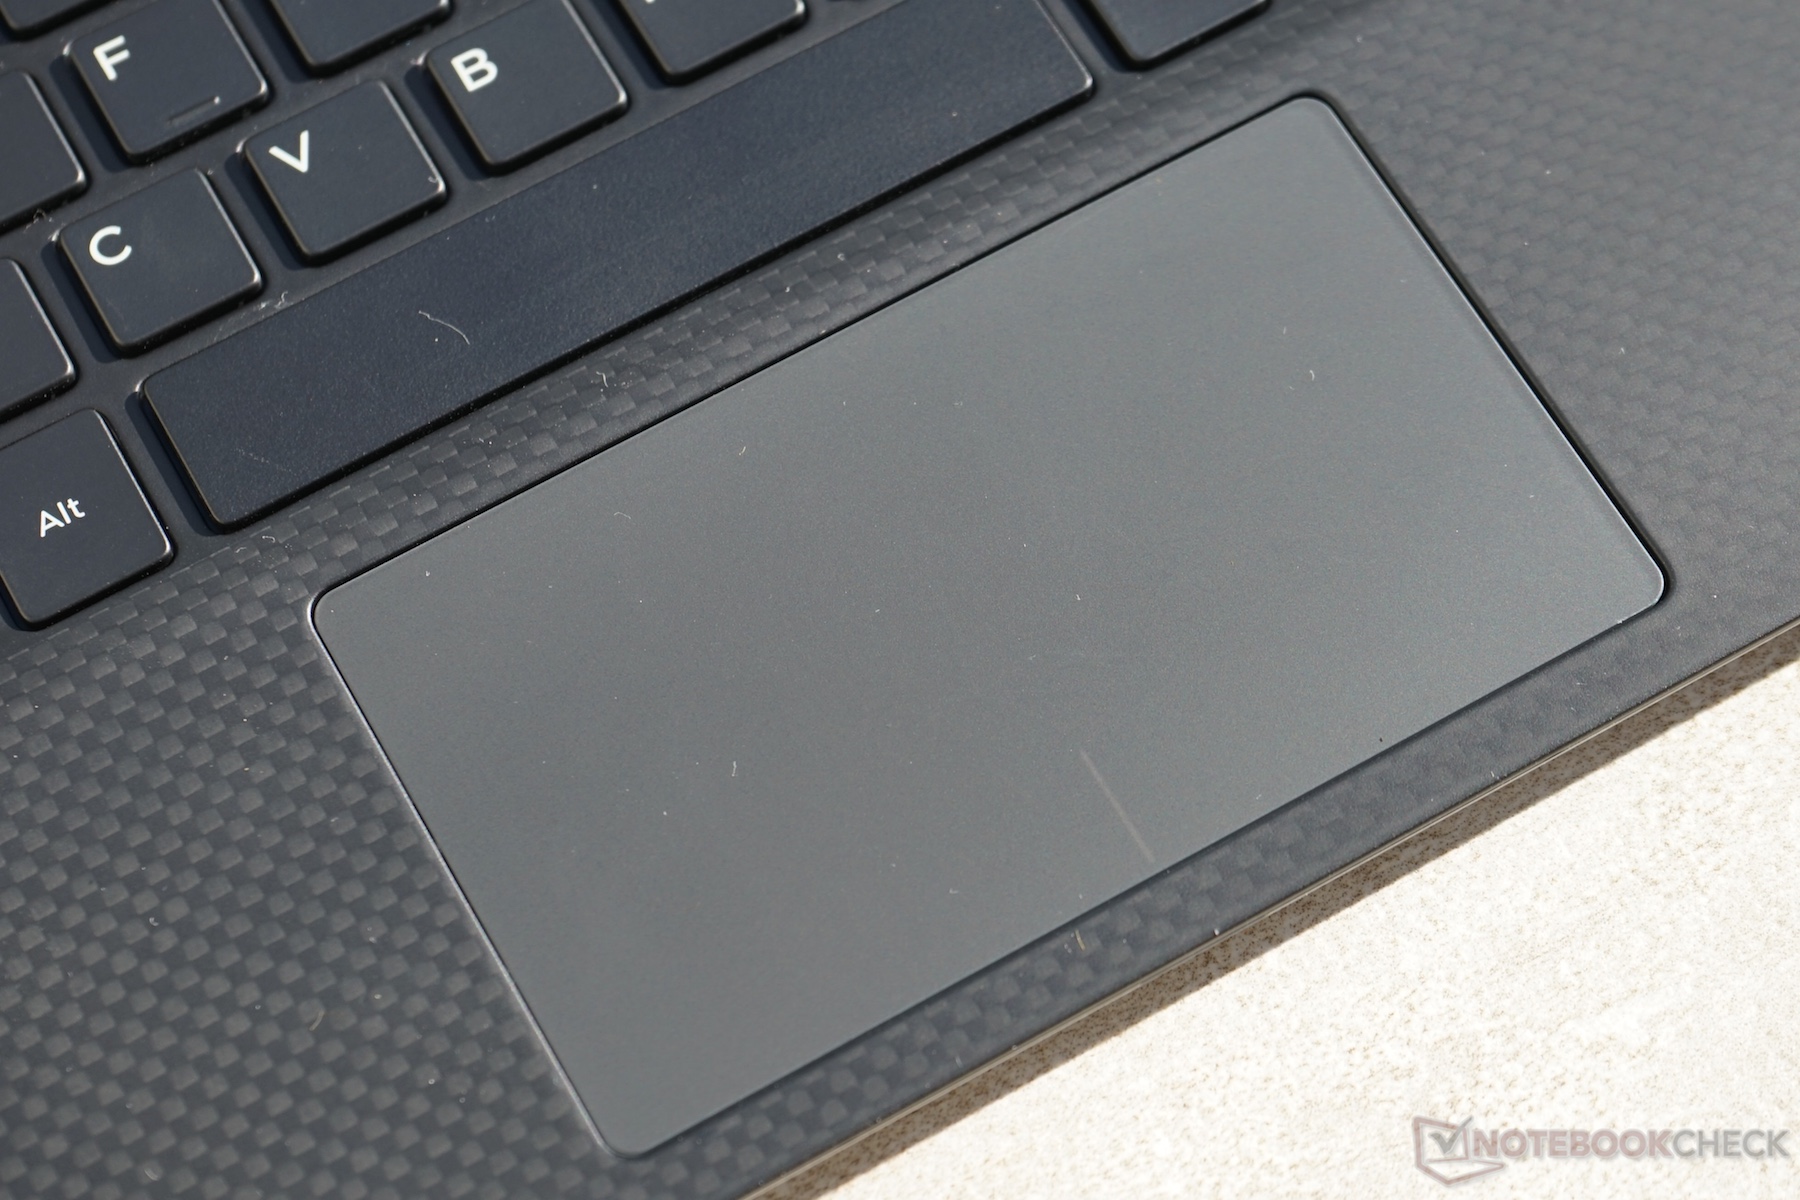
We have already reviewed the current Dell XPS 13 9360 and its predecessor 9350 a few times. There are no changes in terms of the case, the ports, the input devices or the speakers, so we will not cover these sections in the following article. All the corresponding information is available in the previous reviews. The chassis pictures below were taken from a previous review as well. A major redesign of the XPS 13 is expected for next year.
- Dell XPS 13 9360 (Core i7 Kaby Lake-R, QHD+)
- Dell XPS 13 9360 (Core i5, QHD+)
- Dell XPS 13 9360 (Core i7, QHD+)
- Dell XPS 13 9360 (Core i5, FHD)
Connectivity
SD Card Reader
The XPS 13 is still one of few consumer devices with a fast card reader. We measured a maximum transfer rate of almost 220 MB/s in combination with our reference card from Toshiba (Exceria Pro UHS-II 64 GB), and pictures are still copied at more than 180 MB/s. This means that you do not need an external USB 3.0 card reader if you frequently copy pictures or videos from a memory card.
| SD Card Reader | |
| average JPG Copy Test (av. of 3 runs) | |
| Dell XPS 13 9360 FHD i7 Iris | |
| Dell XPS 15 9560 (i7-7700HQ, UHD) | |
| HP Envy 13-ad065nr | |
| maximum AS SSD Seq Read Test (1GB) | |
| Dell XPS 15 9560 (i7-7700HQ, UHD) | |
| Dell XPS 13 9360 FHD i7 Iris | |
| HP Envy 13-ad065nr | |
| Networking | |
| iperf3 transmit AX12 | |
| Huawei MateBook X | |
| Dell XPS 13 9360 FHD i7 Iris | |
| Apple MacBook Pro 13 2017 | |
| HP Envy 13-ad065nr | |
| iperf3 receive AX12 | |
| Apple MacBook Pro 13 2017 | |
| HP Envy 13-ad065nr | |
| Dell XPS 13 9360 FHD i7 Iris | |
| Huawei MateBook X | |
Display
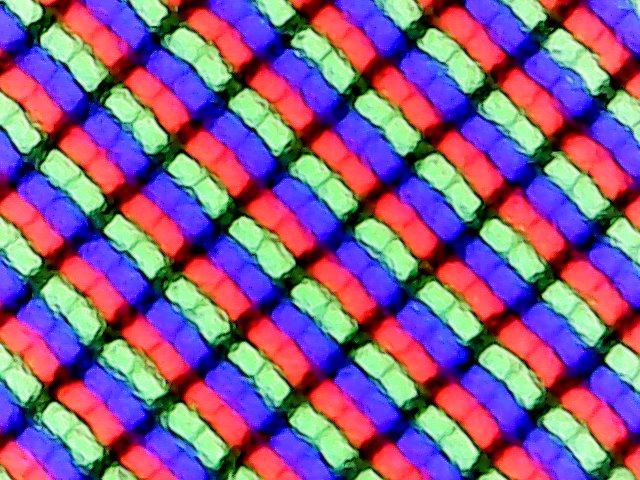
The display options remain unchanged. As well as the matte 1080p panel of the test model, you can also get the QHD+ touchscreen we have reviewed here. The CABC control is still active, too, so the luminance is automatically adjusted to the content. You can hardly notice this in practice; usually during transitions from bright to dark contents and vice versa. This also complicated our usual measurements a bit. We took a closer look at the CABC control and how it works in the review of the previous XPS 13 9350.
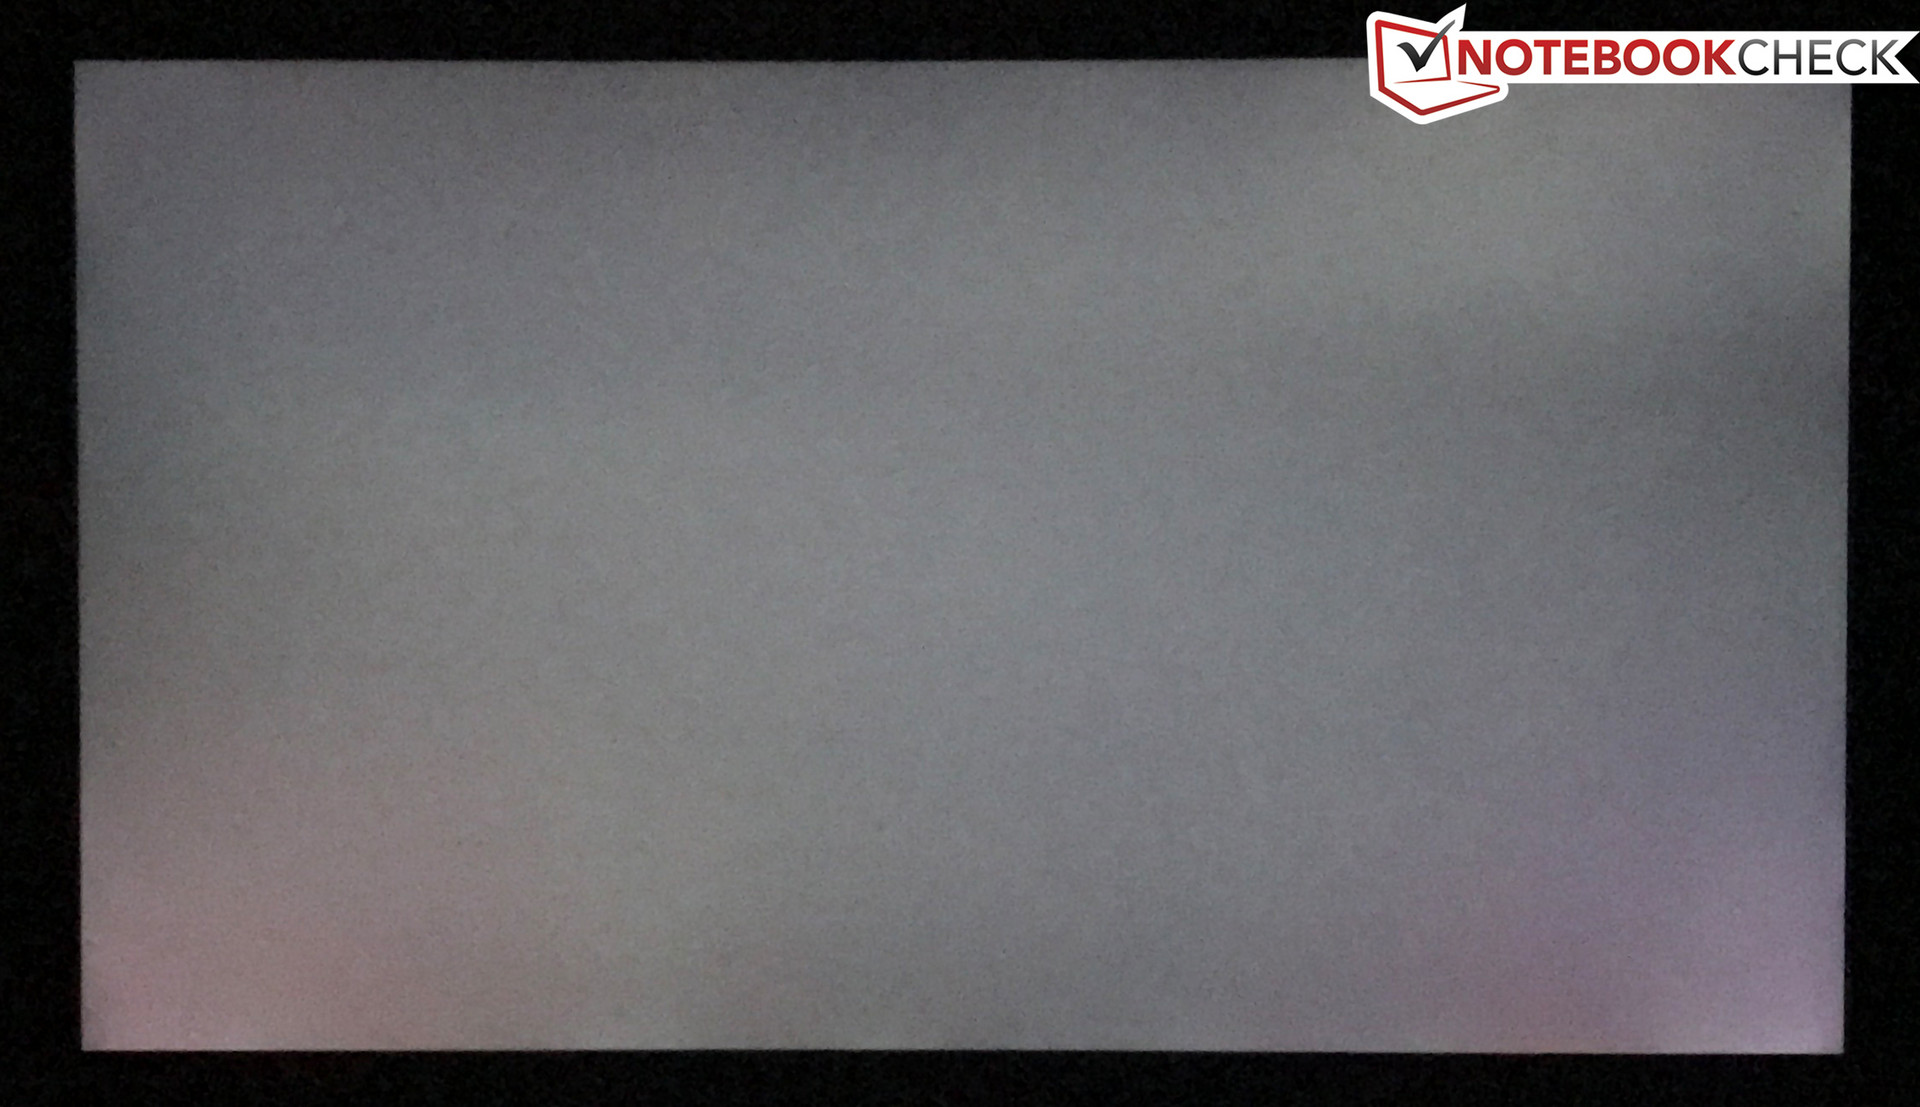
The average luminance is almost 420 nits with a low black value of just 0.2 cd/m², which results in an excellent contrast ratio of more than 2300:1. Subjectively, we really like the picture. However, we detect PWM at brightness levels of 80% and lower, but the high frequency at more than 19 kHz should not be an issue even for very sensitive users. There is only minor backlight bleeding at the lower edge, despite the high luminance.
Screen Flickering / PWM (Pulse-Width Modulation)
| Screen flickering / PWM detected | 19530 Hz | ≤ 80 % brightness setting | 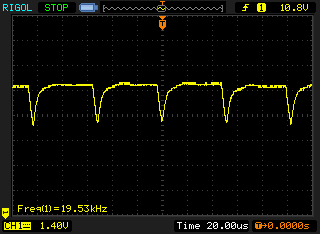 |
The display backlight flickers at 19530 Hz (worst case, e.g., utilizing PWM) Flickering detected at a brightness setting of 80 % and below. There should be no flickering or PWM above this brightness setting. The frequency of 19530 Hz is quite high, so most users sensitive to PWM should not notice any flickering. In comparison: 52 % of all tested devices do not use PWM to dim the display. If PWM was detected, an average of 7798 (minimum: 5 - maximum: 343500) Hz was measured. | |||
| |||||||||||||||||||||||||
Brightness Distribution: 85 %
Center on Battery: 461 cd/m²
Contrast: 2305:1 (Black: 0.2 cd/m²)
ΔE ColorChecker Calman: 5.4 | ∀{0.5-29.43 Ø4.73}
ΔE Greyscale Calman: 5.4 | ∀{0.09-98 Ø4.97}
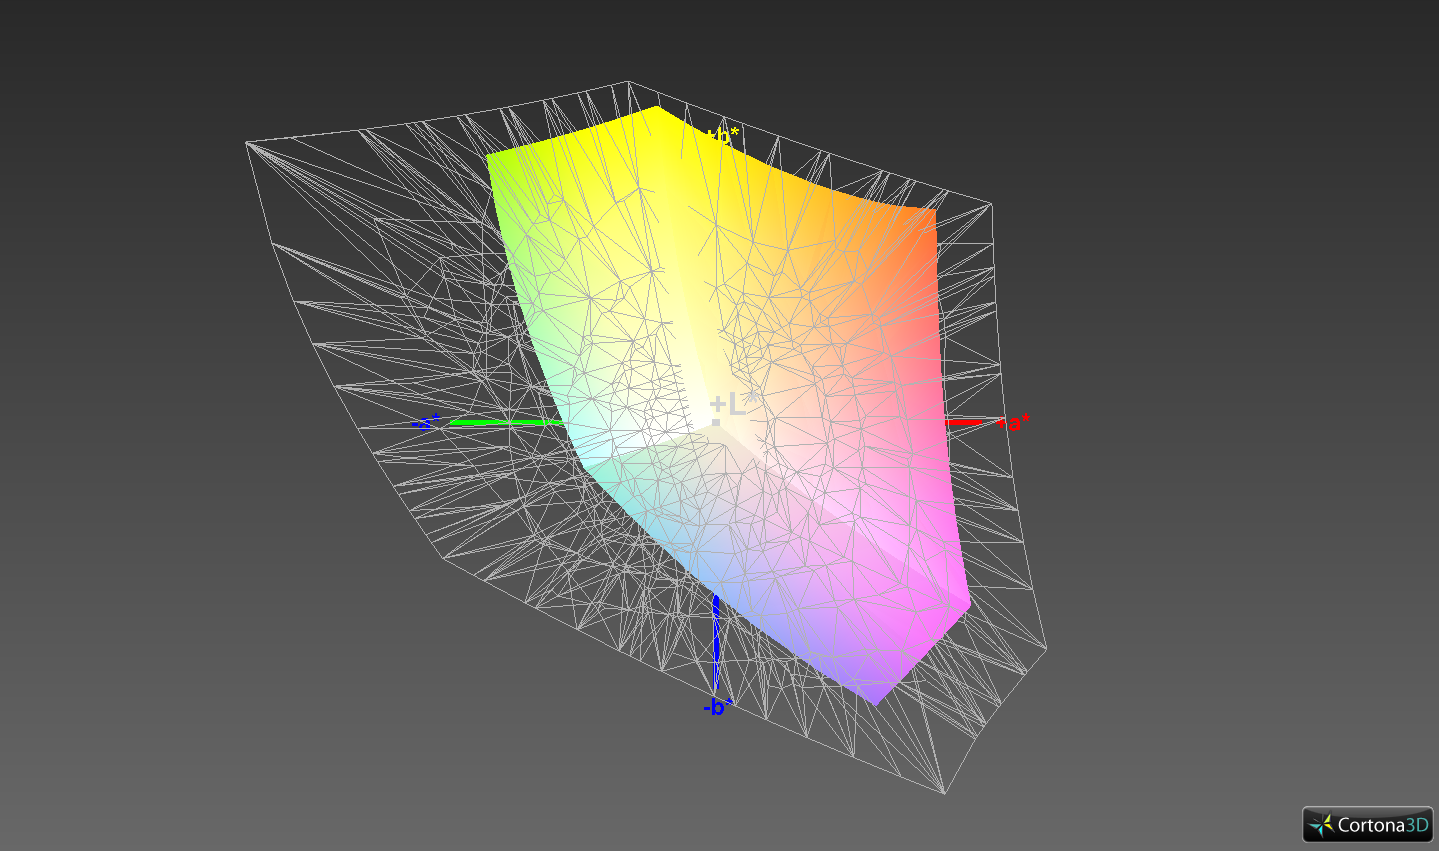
76.9% sRGB (Argyll 1.6.3 3D)
48.6% AdobeRGB 1998 (Argyll 1.6.3 3D)
53.3% AdobeRGB 1998 (Argyll 3D)
77.4% sRGB (Argyll 3D)
51.6% Display P3 (Argyll 3D)
Gamma: 2.15
CCT: 7258 K
| Dell XPS 13 9360 FHD i7 Iris SHP1449, , 1920x1080, 13.3" | Dell XPS 13 i7-8550U ID: Sharp SHP144A, Name: LQ133Z1, , 3200x1800, 13.3" | Apple MacBook Pro 13 2017 APPA033, , 2560x1600, 13.3" | Razer Blade Stealth QHD i7-7500U Sharp SHP1493 (LQ133Z1JW26), , 3200x1800, 13.3" | Huawei MateBook X Chi Mei CMN8201 / P130ZDZ-EF1, , 2160x1440, 13.3" | HP Envy 13-ad065nr LG Philips LGD0576, , 1920x1080, 13.3" | |
|---|---|---|---|---|---|---|
| Display | 22% | 61% | 26% | 26% | 17% | |
| Display P3 Coverage (%) | 51.6 | 63.6 23% | 99.2 92% | 65.6 27% | 65.8 28% | 65.5 27% |
| sRGB Coverage (%) | 77.4 | 93 20% | 99.9 29% | 95.5 23% | 96.2 24% | 83.8 8% |
| AdobeRGB 1998 Coverage (%) | 53.3 | 65.4 23% | 87.1 63% | 67.6 27% | 66.8 25% | 61.3 15% |
| Response Times | 12% | 0% | -8% | 20% | 29% | |
| Response Time Grey 50% / Grey 80% * (ms) | 41.2 ? | 35.6 ? 14% | 42.8 ? -4% | 46 ? -12% | 33 ? 20% | 28 ? 32% |
| Response Time Black / White * (ms) | 30 ? | 27.2 ? 9% | 28.8 ? 4% | 31.2 ? -4% | 24 ? 20% | 22.4 ? 25% |
| PWM Frequency (Hz) | 19530 ? | 19690 ? | 19380 ? | 10200 ? | ||
| Screen | -5% | 20% | 3% | 7% | -11% | |
| Brightness middle (cd/m²) | 461 | 386.1 -16% | 588 28% | 406 -12% | 408 -11% | 290 -37% |
| Brightness (cd/m²) | 418 | 357 -15% | 561 34% | 373 -11% | 395 -6% | 270 -35% |
| Brightness Distribution (%) | 85 | 83 -2% | 92 8% | 84 -1% | 88 4% | 78 -8% |
| Black Level * (cd/m²) | 0.2 | 0.33 -65% | 0.45 -125% | 0.25 -25% | 0.45 -125% | 0.32 -60% |
| Contrast (:1) | 2305 | 1170 -49% | 1307 -43% | 1624 -30% | 907 -61% | 906 -61% |
| Colorchecker dE 2000 * | 5.4 | 4.2 22% | 1.7 69% | 4.5 17% | 1.55 71% | 4.8 11% |
| Colorchecker dE 2000 max. * | 12.2 | 7.6 38% | 3.5 71% | 8.2 33% | 2.19 82% | 11.2 8% |
| Greyscale dE 2000 * | 5.4 | 5.7 -6% | 1.9 65% | 5.2 4% | 1.91 65% | 2.8 48% |
| Gamma | 2.15 102% | 2.28 96% | 2.33 94% | 2.11 104% | 2.34 94% | 2.19 100% |
| CCT | 7258 90% | 7336 89% | 6738 96% | 7709 84% | 6491 100% | 6382 102% |
| Color Space (Percent of AdobeRGB 1998) (%) | 48.6 | 59 21% | 77.92 60% | 61.3 26% | 61 26% | 54.9 13% |
| Color Space (Percent of sRGB) (%) | 76.9 | 92.2 20% | 99.94 30% | 95.4 24% | 96 25% | 83.5 9% |
| Total Average (Program / Settings) | 10% /
2% | 27% /
25% | 7% /
6% | 18% /
12% | 12% /
-0% |
* ... smaller is better
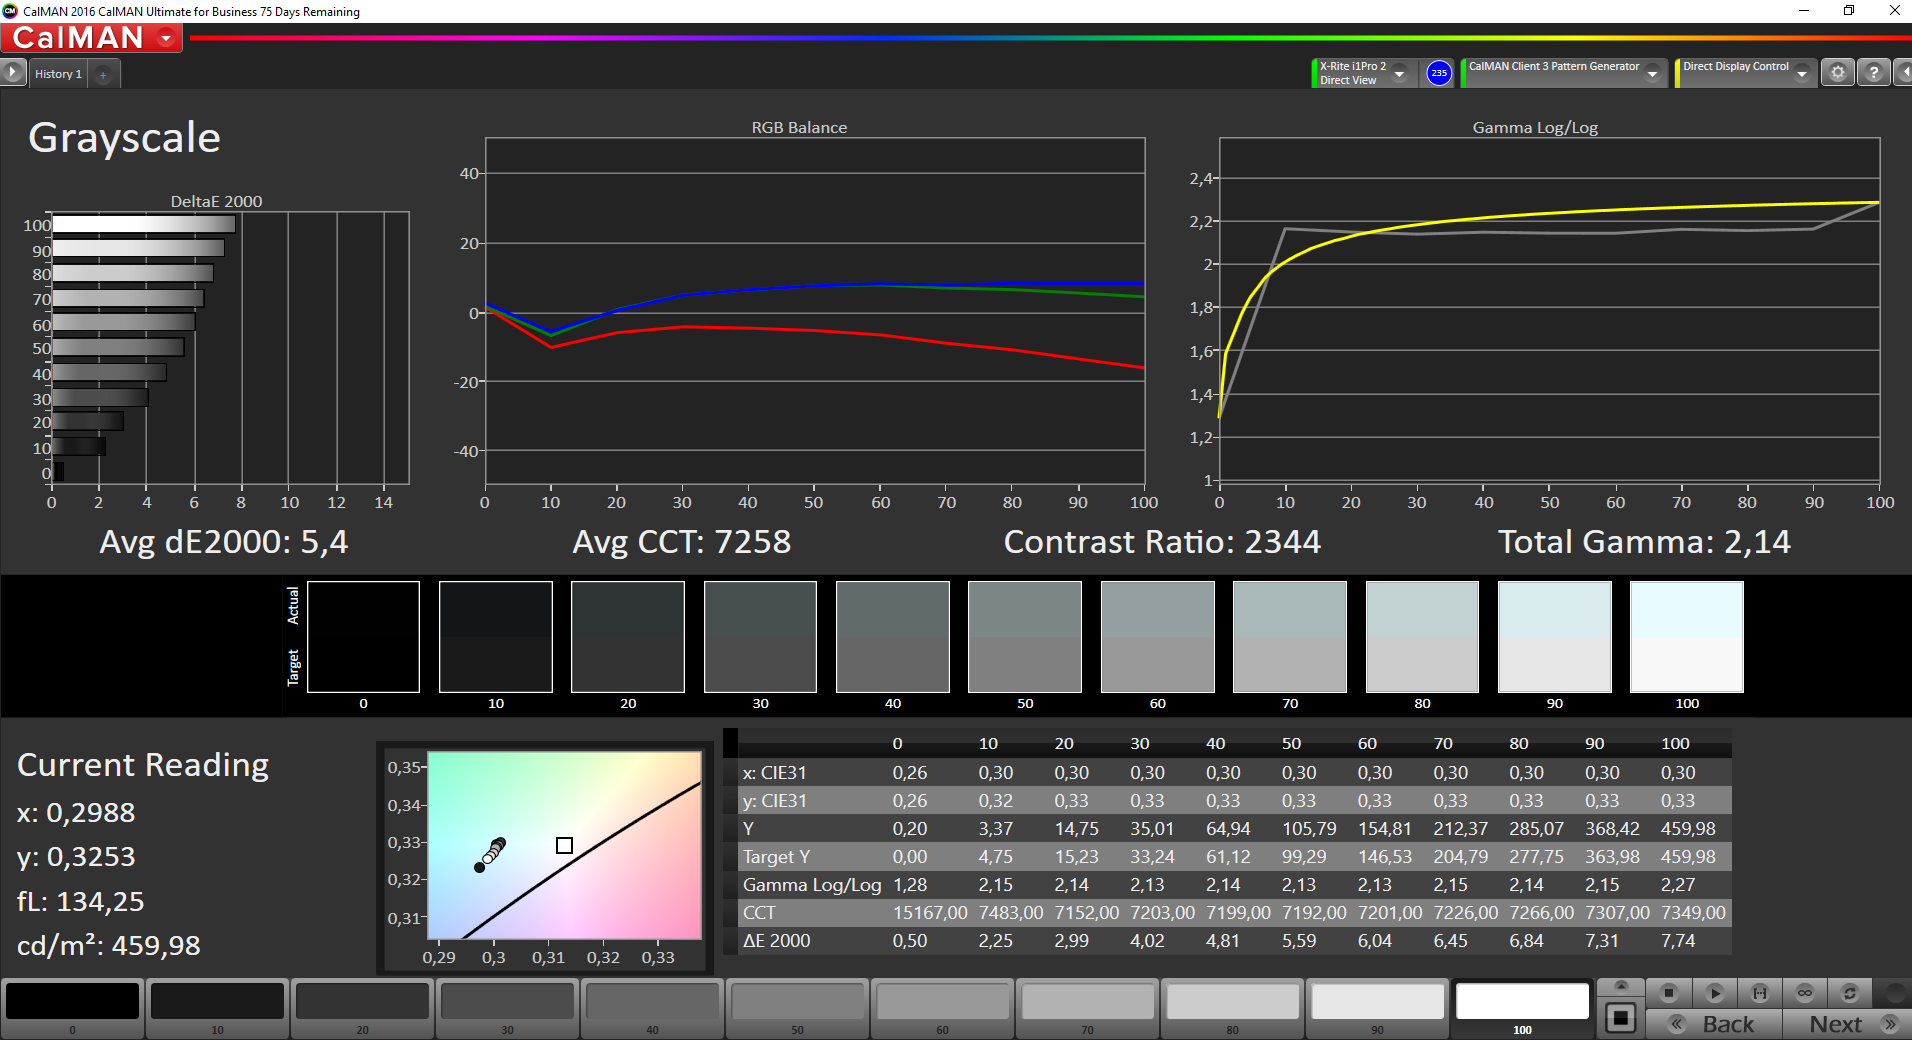

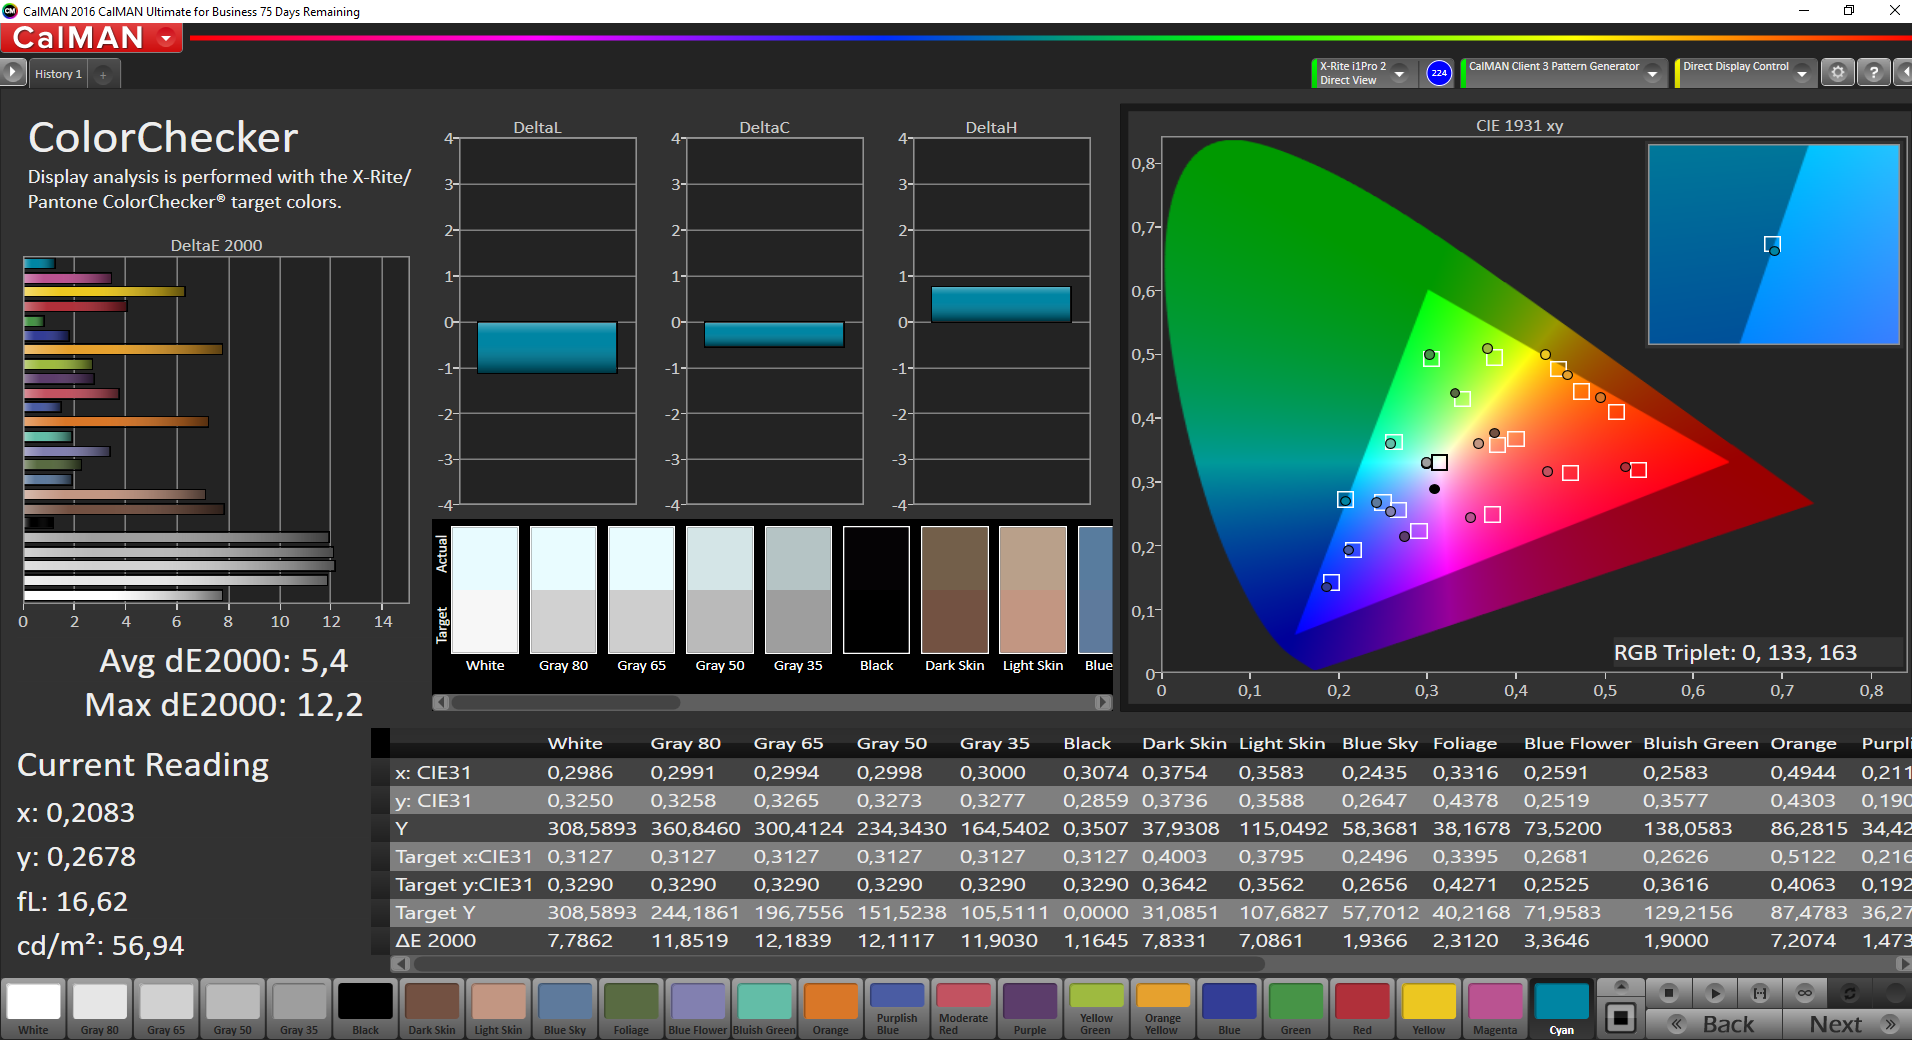
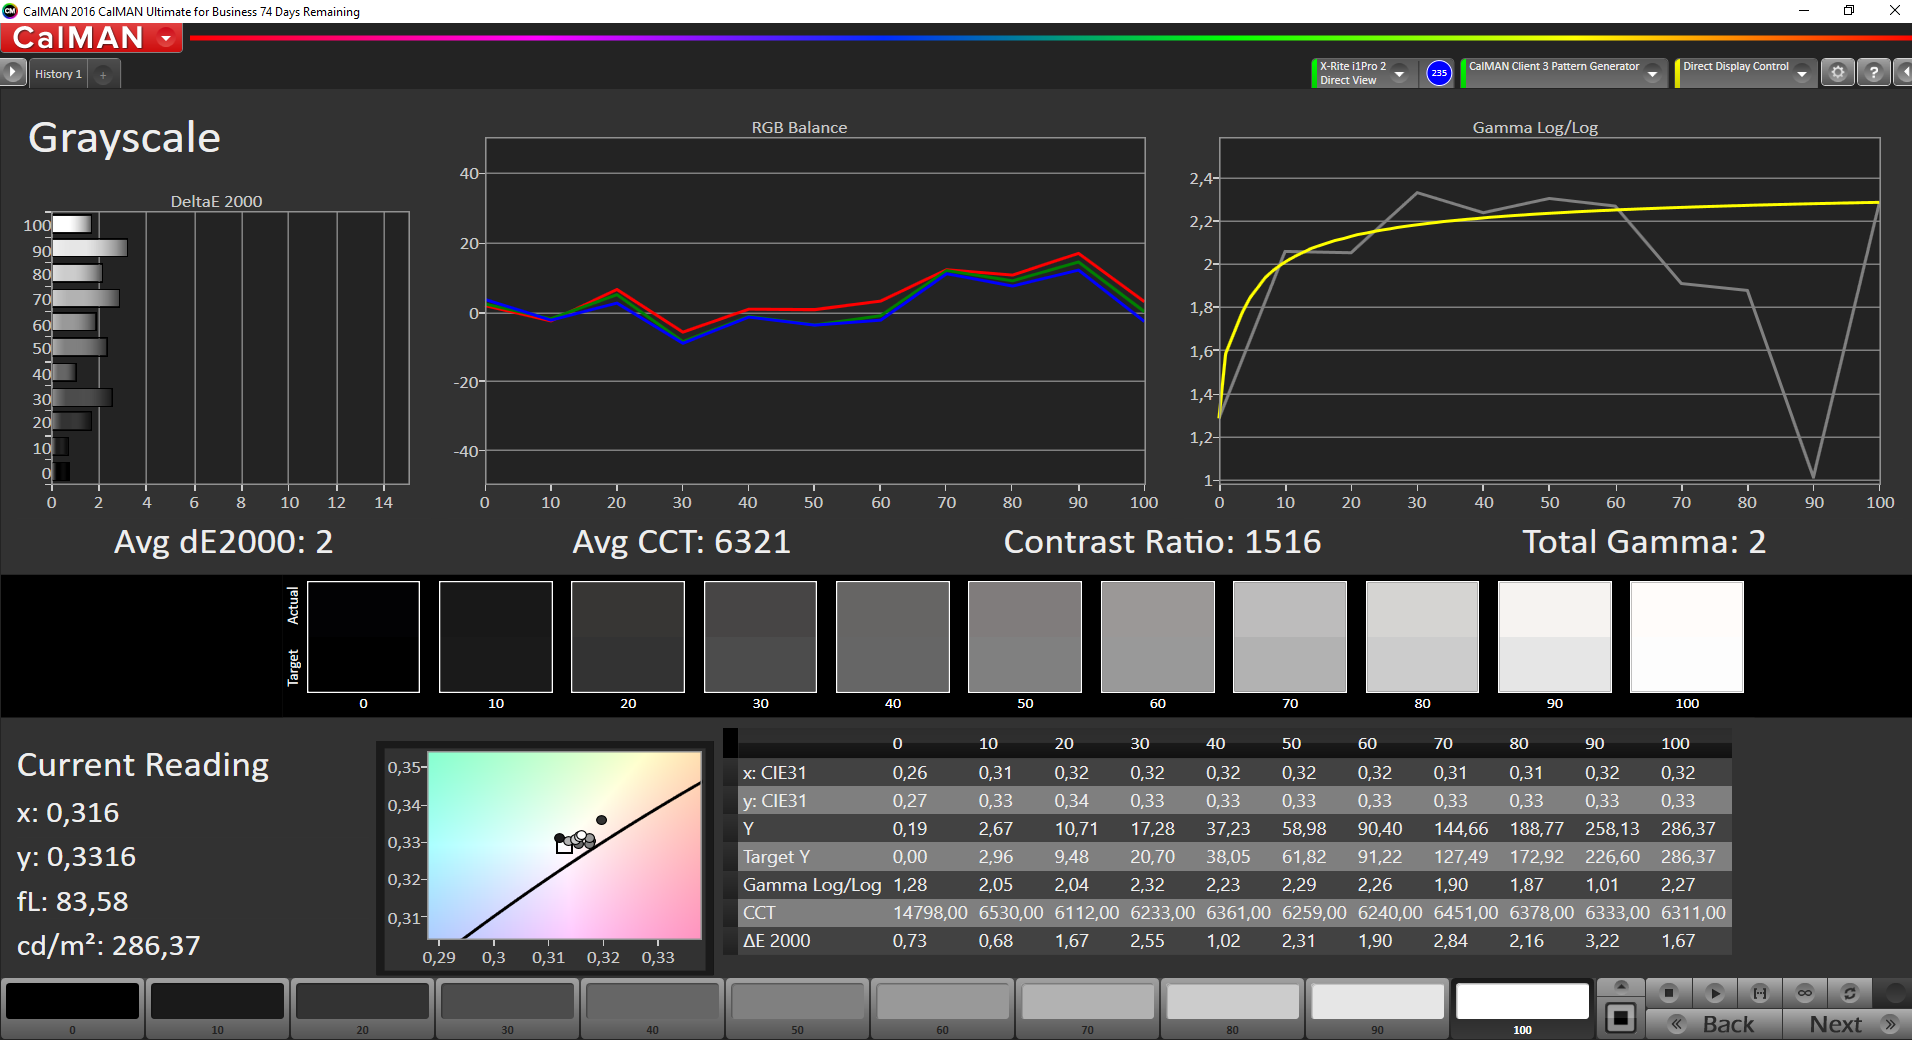
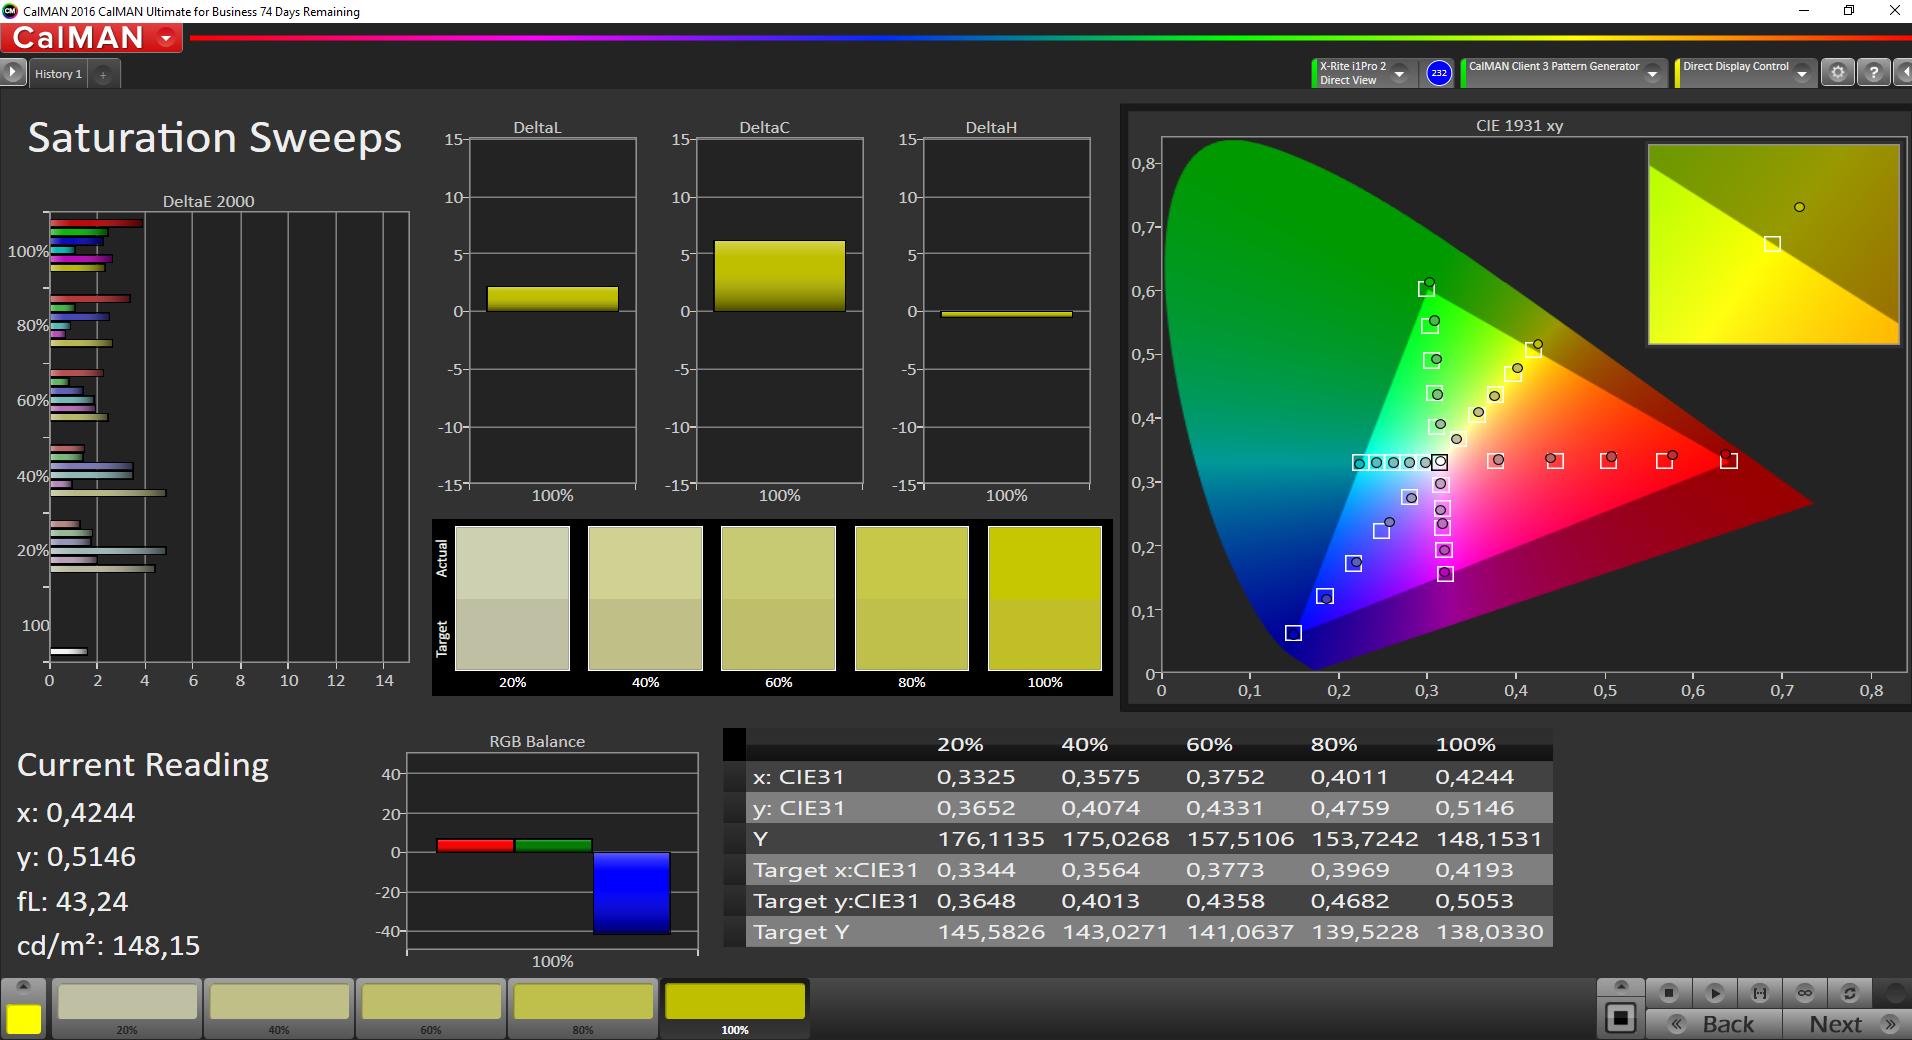
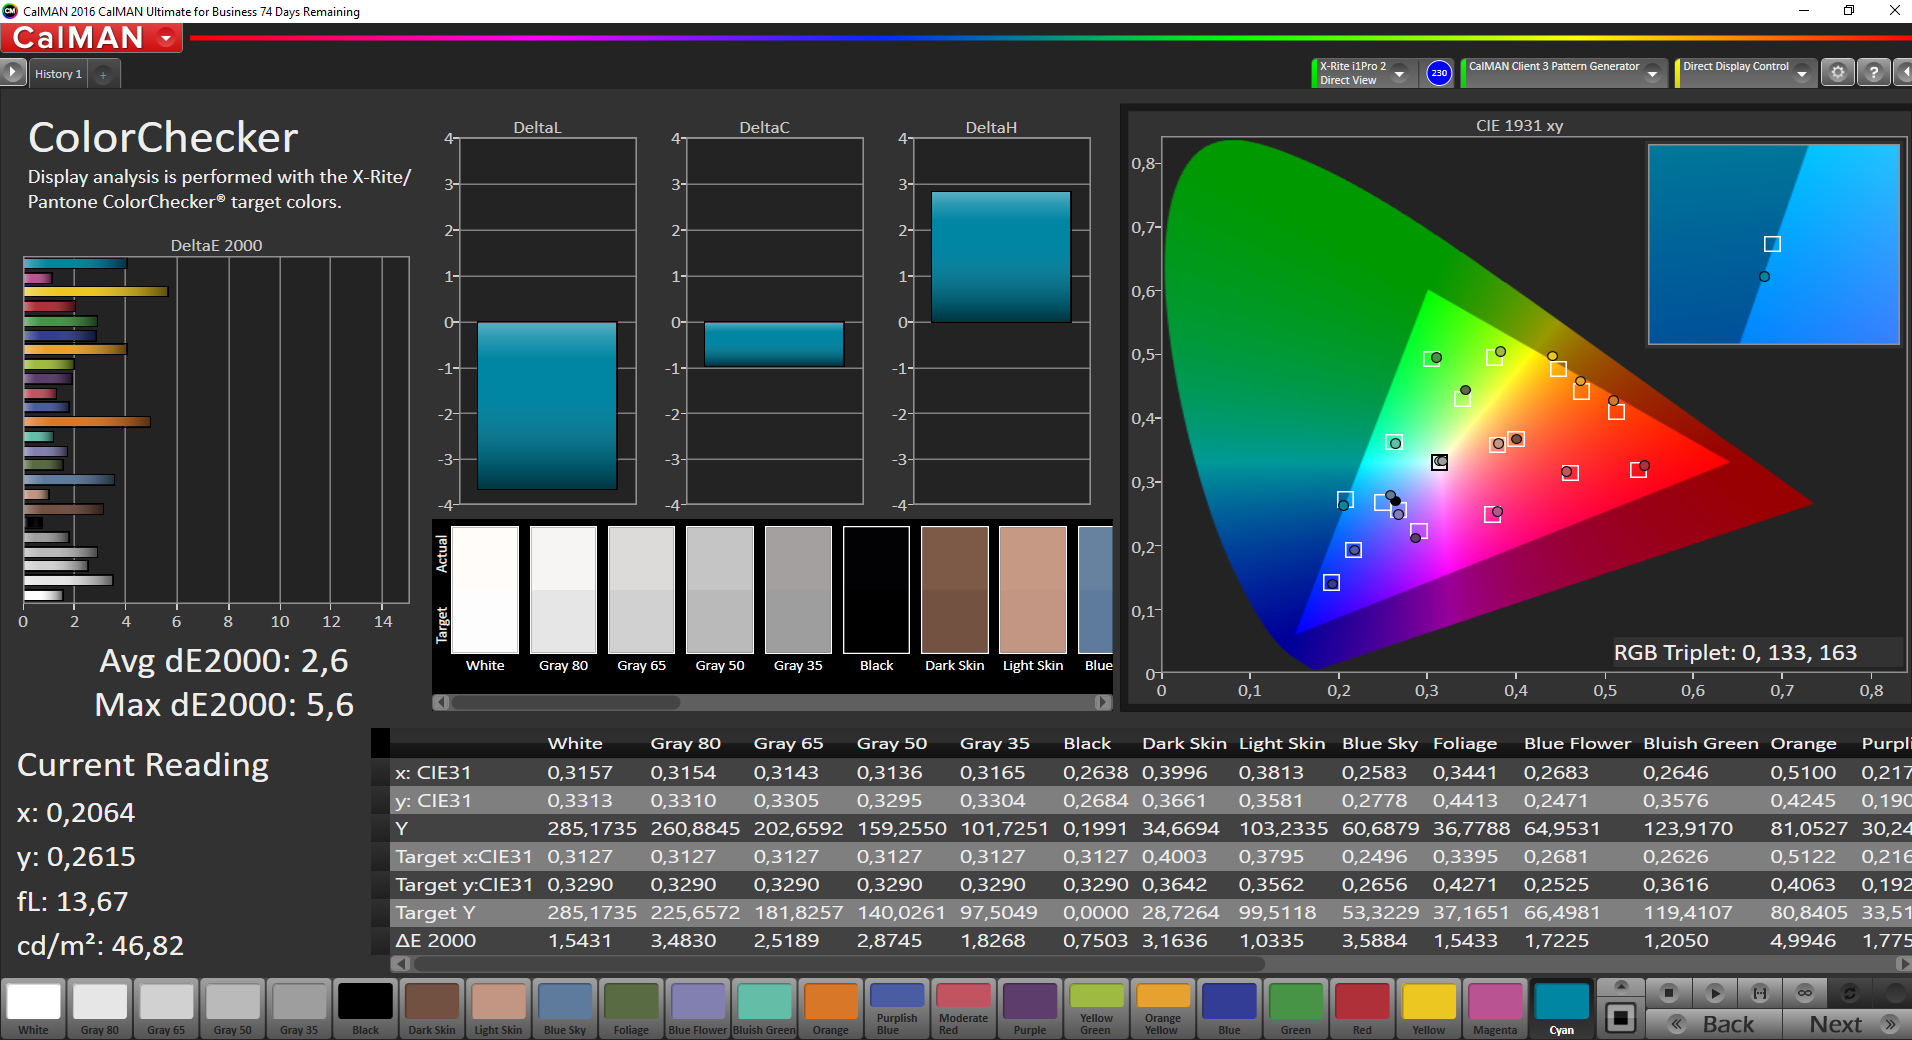
We determine average DeltaE-2000 deviations of 5.4 both for the grayscale as well as the colors, even though there are some outliers at up to 12 for the latter. Our calibration was successful after the first attempt failed. The results are improved, but they are still not perfect due to the CABC control.
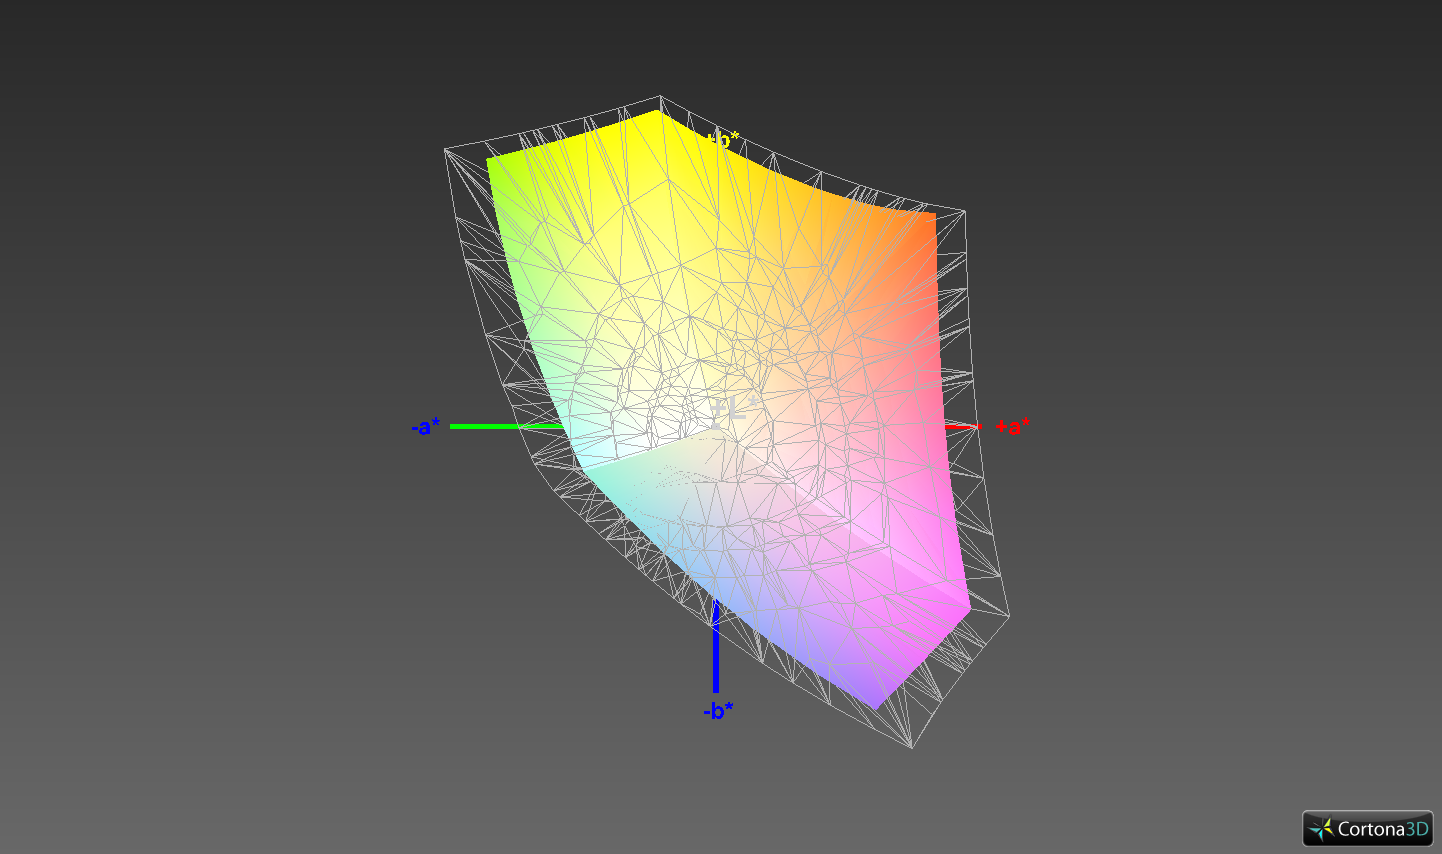
The color gamut is one key difference compared to the optional QHD+ touchscreen. Our 1080p model covers about 77% of the sRGB reference. The QHD+ model manages more than 90% and is therefore better suited for picture and video editing.
Display Response Times
| ↔ Response Time Black to White | ||
|---|---|---|
| 30 ms ... rise ↗ and fall ↘ combined | ↗ 17.6 ms rise | 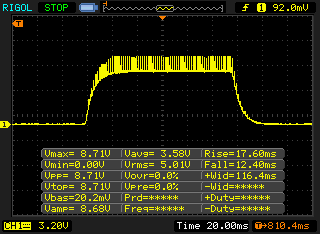 |
| ↘ 12.4 ms fall | ||
| The screen shows slow response rates in our tests and will be unsatisfactory for gamers. In comparison, all tested devices range from 0.1 (minimum) to 240 (maximum) ms. » 80 % of all devices are better. This means that the measured response time is worse than the average of all tested devices (19.9 ms). | ||
| ↔ Response Time 50% Grey to 80% Grey | ||
| 41.2 ms ... rise ↗ and fall ↘ combined | ↗ 22.8 ms rise | 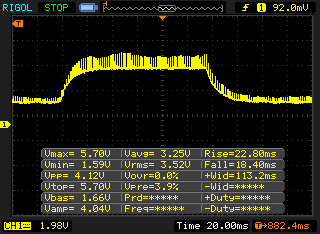 |
| ↘ 18.4 ms fall | ||
| The screen shows slow response rates in our tests and will be unsatisfactory for gamers. In comparison, all tested devices range from 0.165 (minimum) to 636 (maximum) ms. » 66 % of all devices are better. This means that the measured response time is worse than the average of all tested devices (31.1 ms). | ||
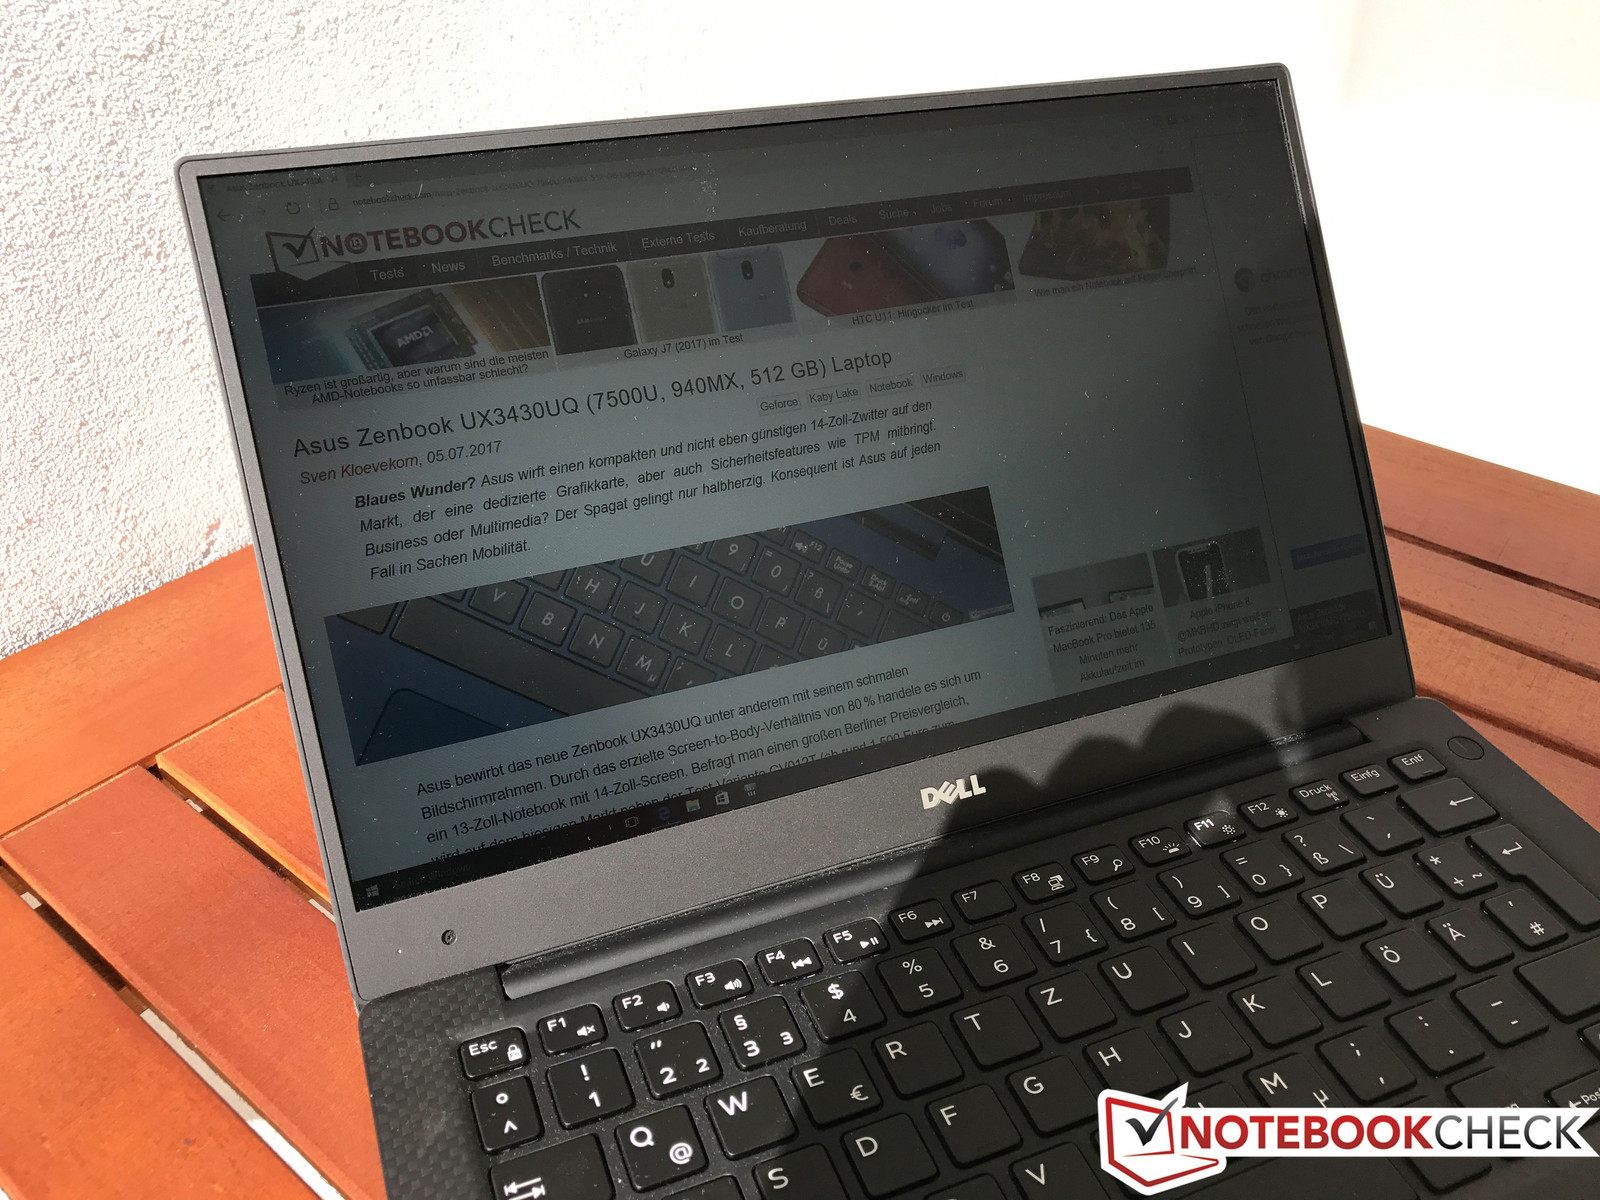
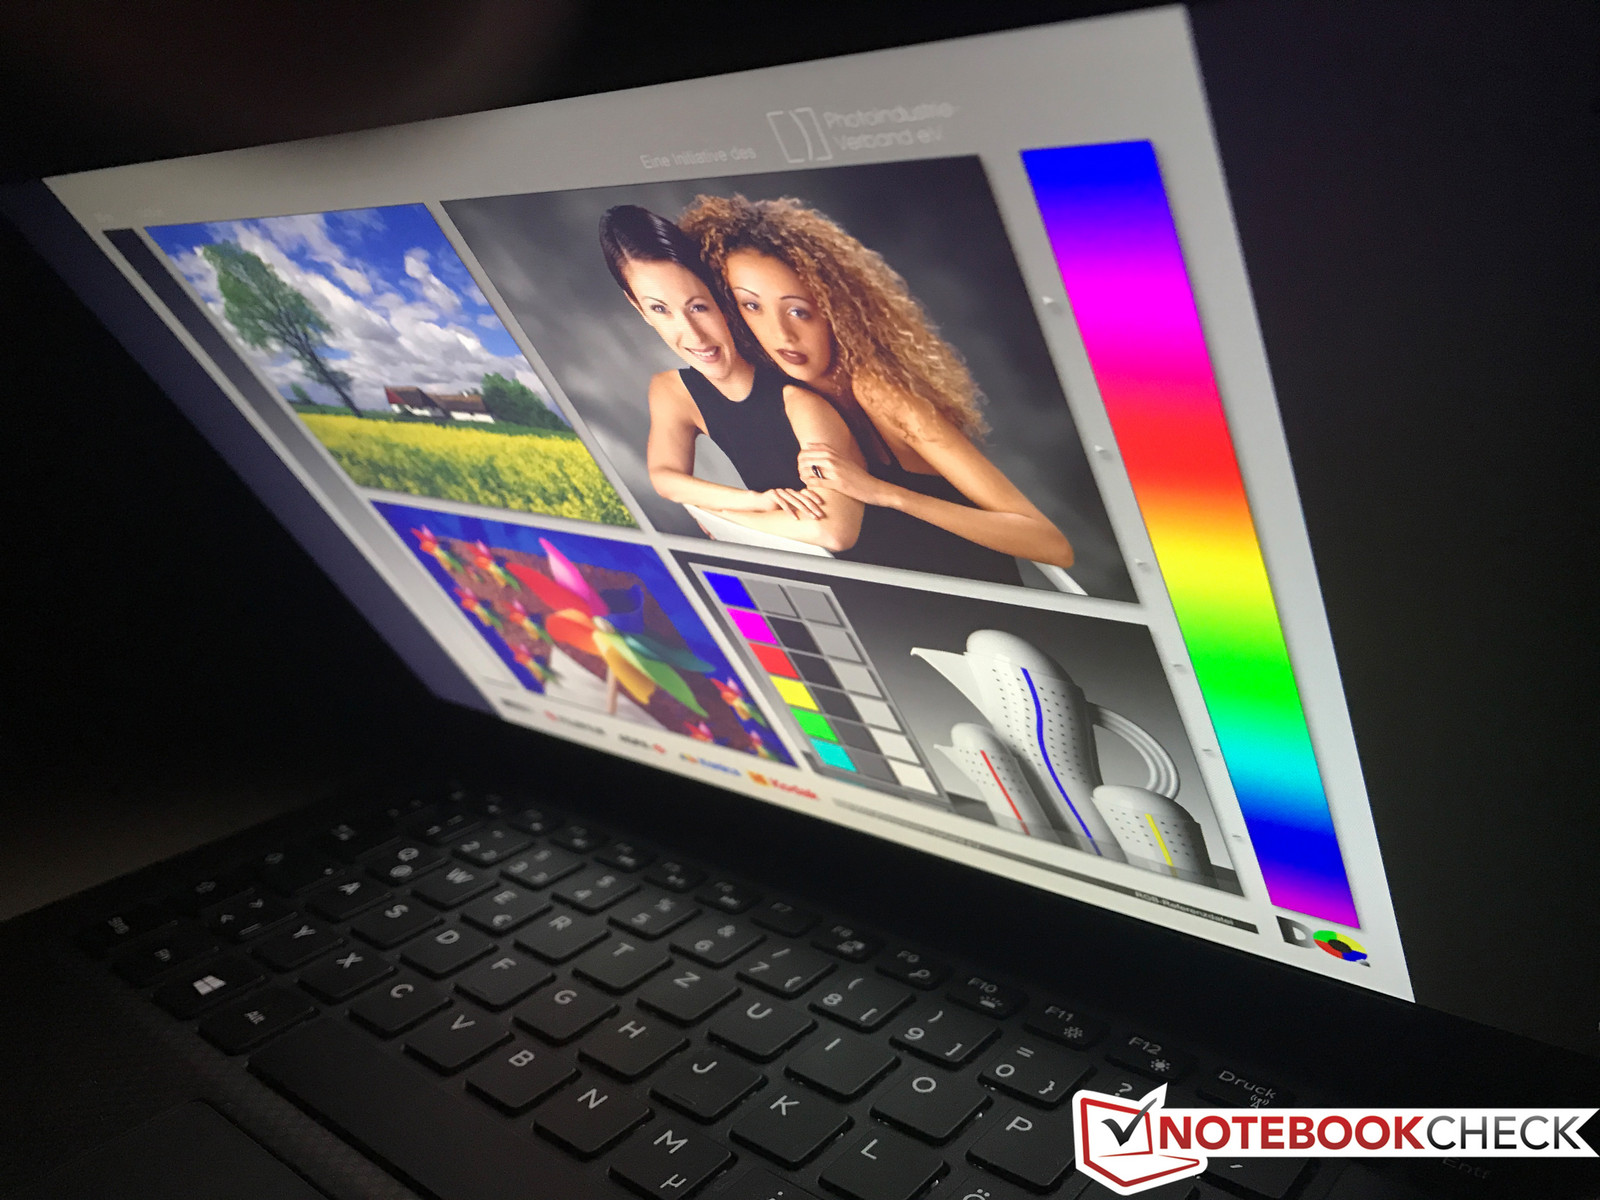
The outdoor capabilities benefit from the high luminance in combination with the matte panel. Our two pictures below were taken on a very sunny day, but you can still see the content comfortably when you adjust your position. There are absolutely no problems in the shade. The IPS panel provides very wide viewing angles – as expected.
Performance
Processor
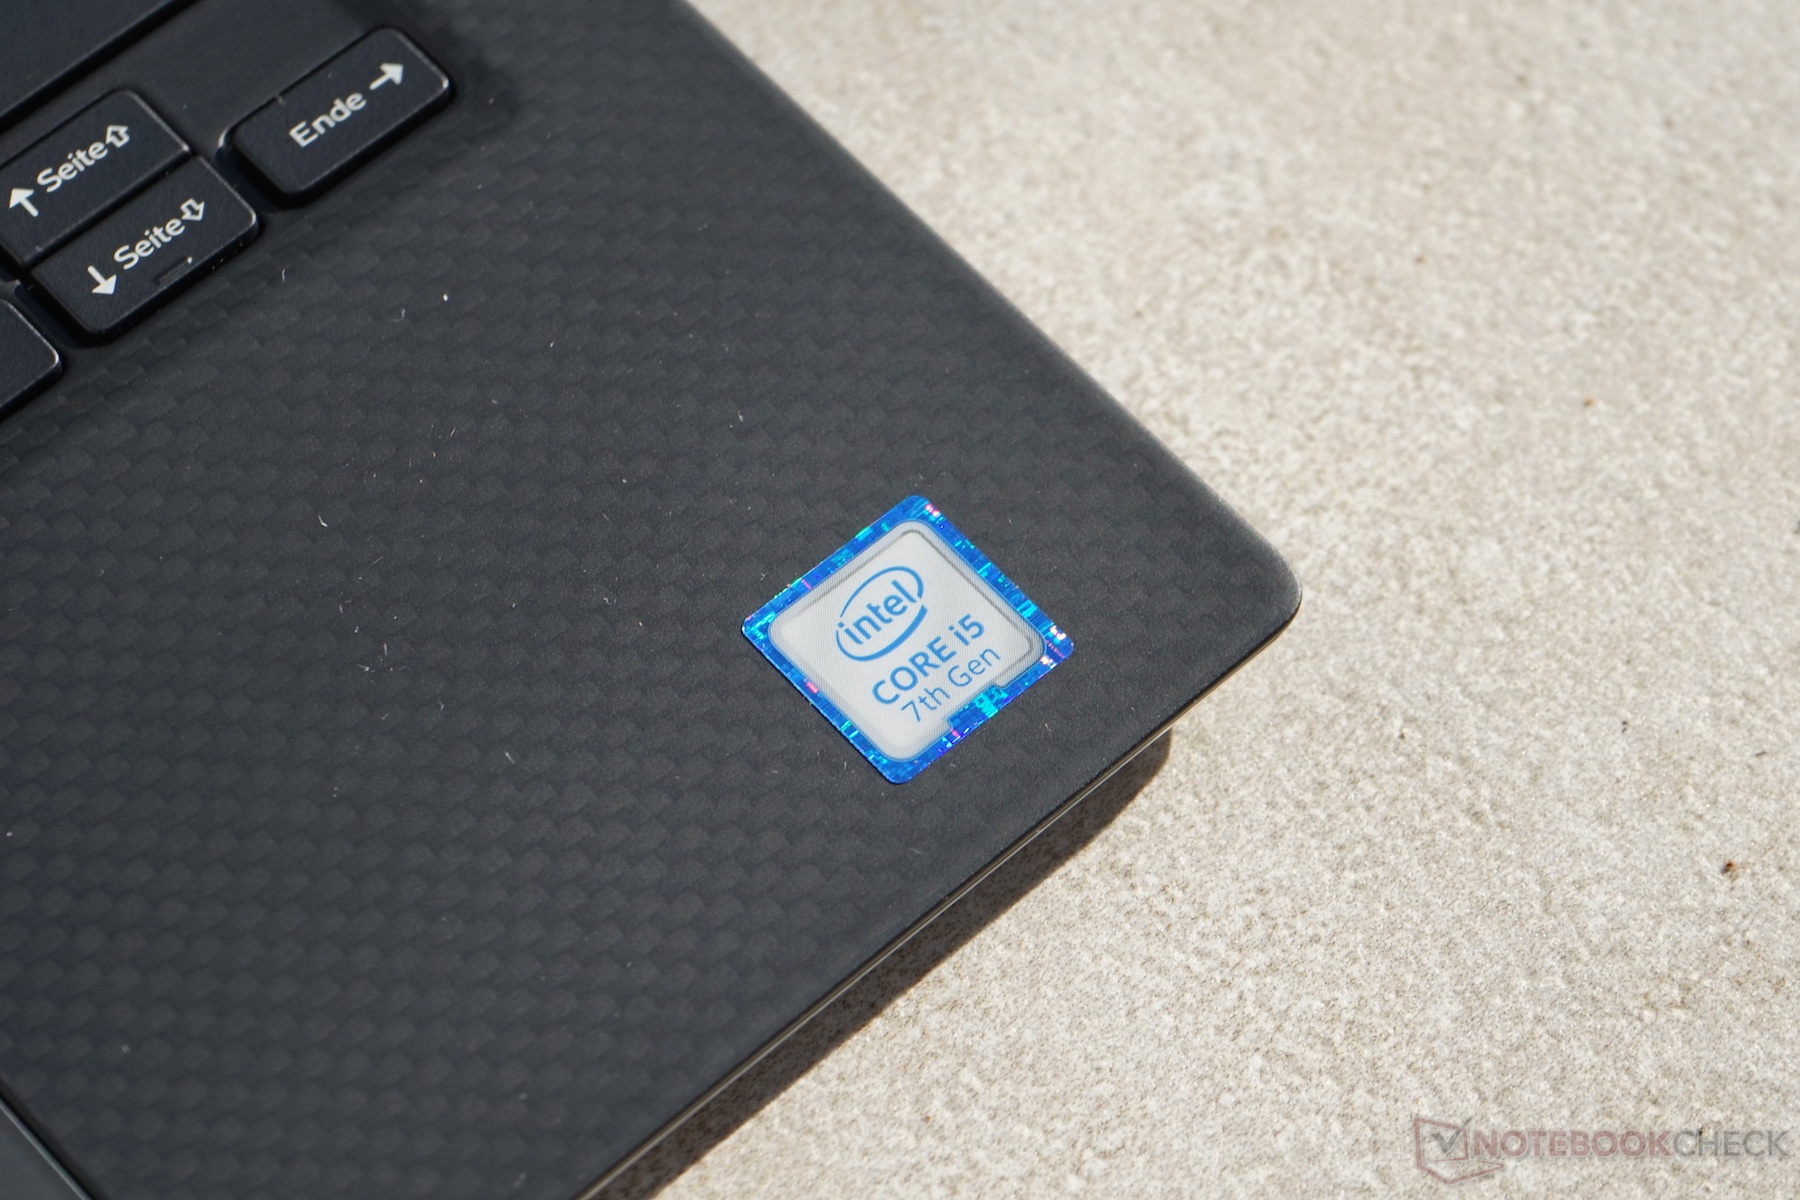
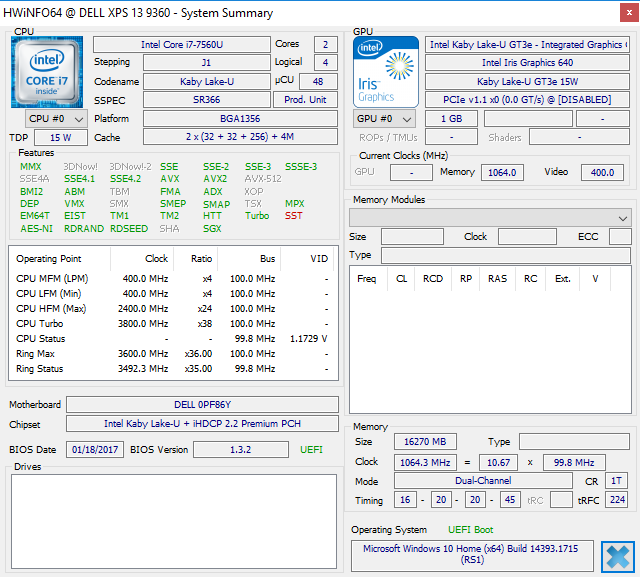
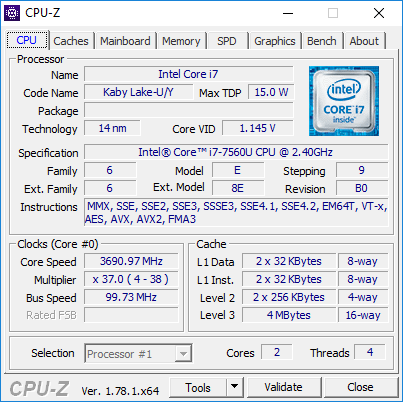
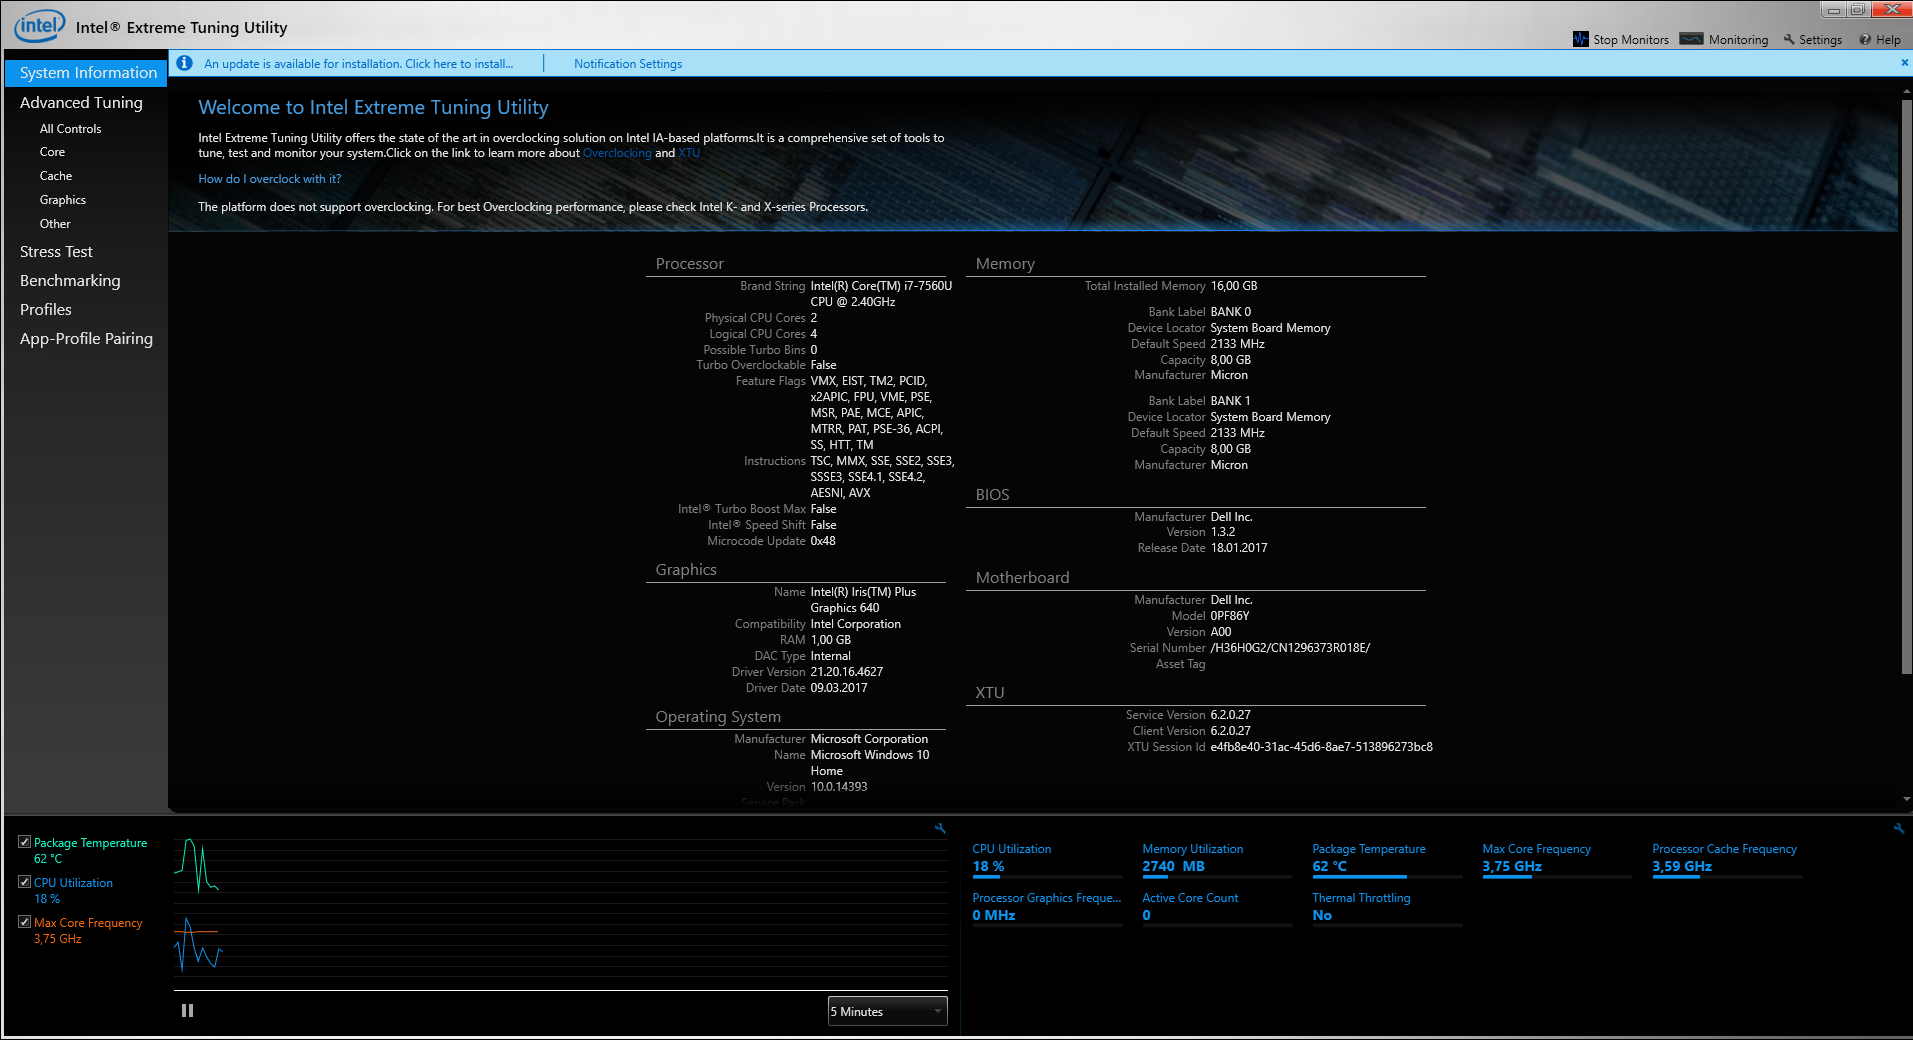
Our test model is equipped with the Core i7-7560U. This ULV processor is based on Intel's Kaby Lake architecture (14nm) and offers higher Turbo clocks (single: 3.8, multi: 3.7 GHz) compared to the standard Core i7-7500U that can be found on many high-end Ultrabooks. The CPU also includes the faster integrated Iris GPU, but we will have a closer look at this component later in the review.
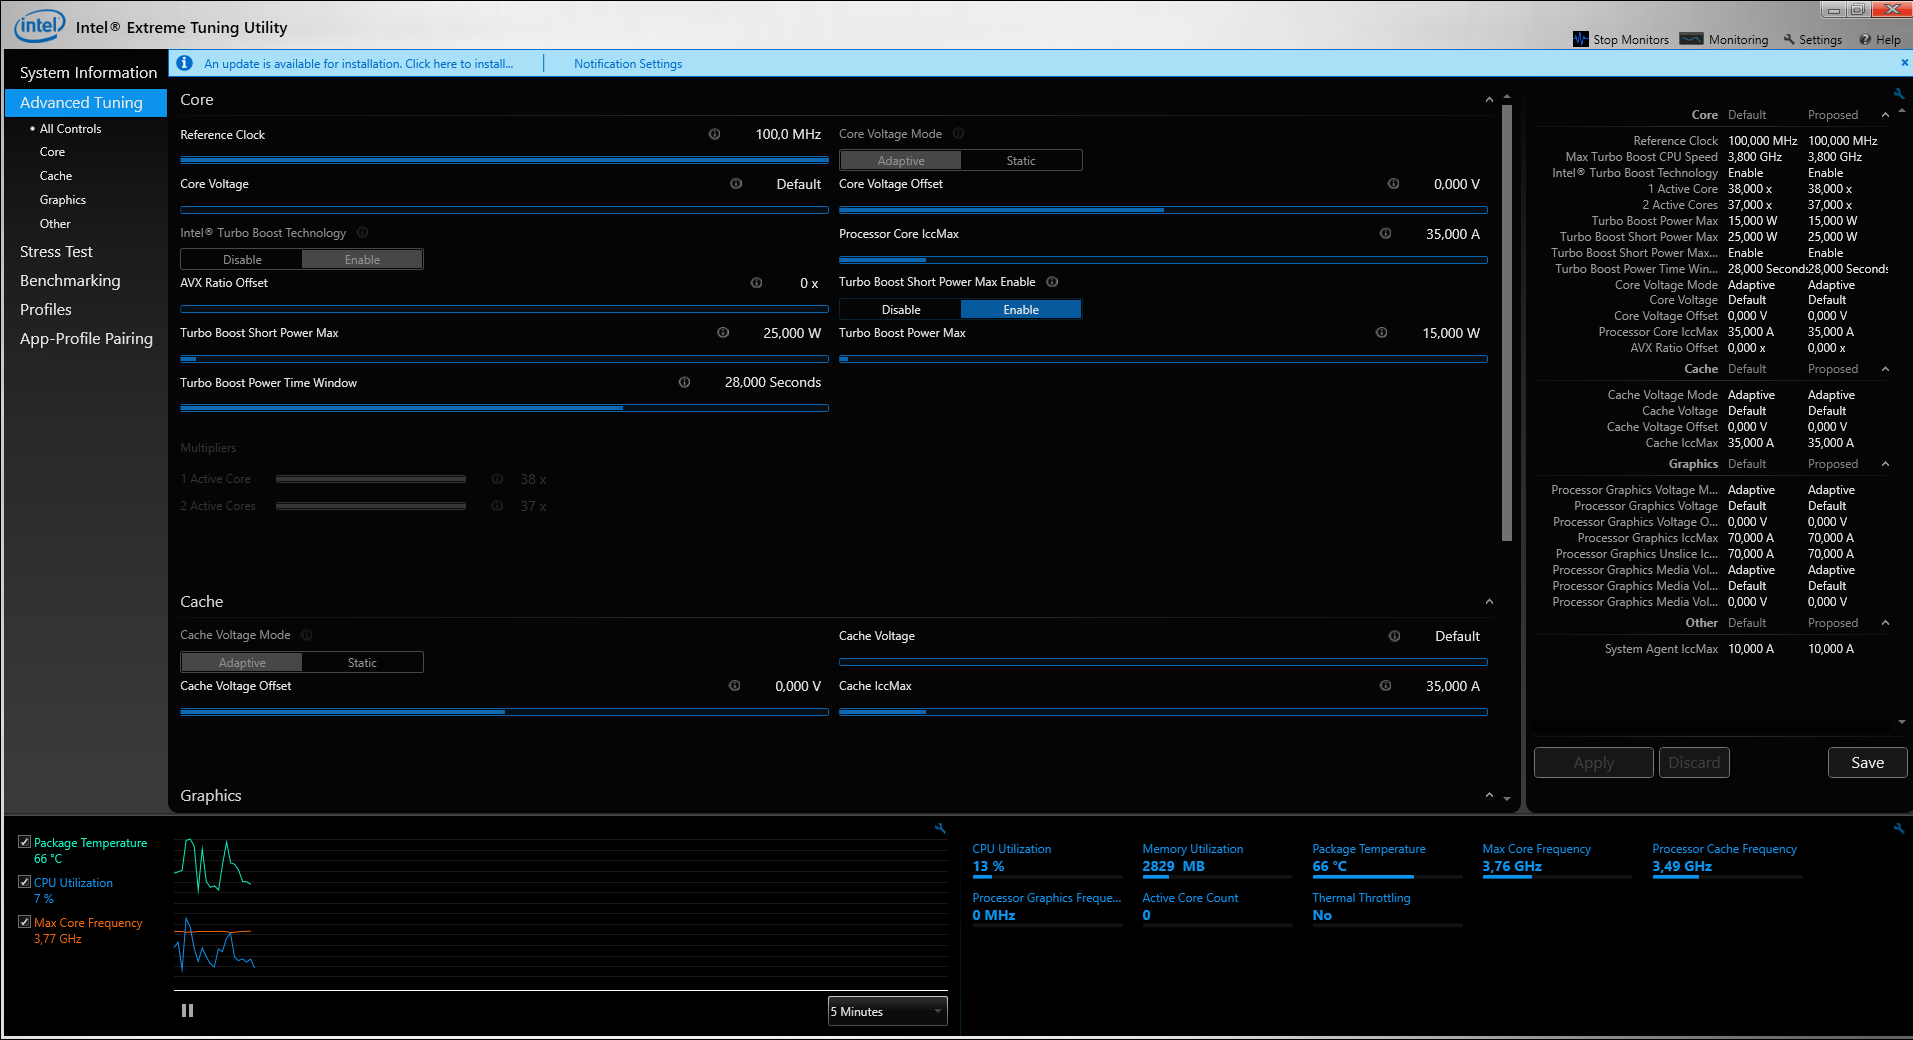
The Core i7 quickly develops temperature problems in the CPU benchmarks. Even the brief 25 W limit (usually possible for 28 seconds) is throttled to 15 W after a few seconds as soon as the processor temperature reaches 98 °C (~208 °F). The Core i7 still benefits from its high frequency in the Cinebench R15 Single test, but it is on par with the regular Core i7-7500U in the Multi test at best. Sustained workloads, simulated by a loop of the CB R15 Multi test, result in scores between 325 and 330 points (3.1 to 3.2 GHz), which is just ahead of the bread & butter Core i5-7200U. The Core i7-7560U is therefore not a good upgrade for the XPS 13 in terms of CPU performance.
The new Core i7-8550U cannot maintain its initial performance in the XPS 13 either, but still benefits from the two additional CPU cores (+4 threads). The maximum performance advantage is 80% in the Multi test, and still at 60% under sustained workloads.
The processor clock quickly drops from the initial 3.5 GHz to just 3.0 GHz (305 points) on battery power. More information and benchmarks for the Core i7-7560U are listed on our dedicated page.
System Performance
The XPS 13 performs very well in the synthetic PCMarks, at least in PCMark 8. The modern PCMark 10 did not run properly, which was already the case for the XPS 13 with the new Kaby Lake-R CPU. However, we did not experience any other issues or limitations during our time with the device and the system is unsurprisingly very fast and responsive.
| PCMark 8 Home Score Accelerated v2 | 3902 points | |
| PCMark 8 Creative Score Accelerated v2 | 5083 points | |
| PCMark 8 Work Score Accelerated v2 | 4890 points | |
Help | ||
Storage Devices
Our test model is shipped with a 512 GB NVMe-SSD from Toshiba with the designation XG4 (THNSN5512GPUK). It cannot keep up with the fastest drives from Samsung in the sequential tests (compare Yoga 920), but the performance of the Toshiba drive is still decent and you will hardly notice any differences during your day-to-day tasks. For more comparisons and benchmarks, please see our SSD/HDD list.
| Dell XPS 13 9360 FHD i7 Iris Toshiba XG4 NVMe (THNSN5512GPUK) | Dell XPS 13 i7-8550U Toshiba XG5 KXG50ZNV256G | Huawei MateBook X LITEON CB1-SD256 | Lenovo Yoga 920-13IKB-80Y7 Samsung PM961 MZVLW256HEHP | |
|---|---|---|---|---|
| CrystalDiskMark 5.2 / 6 | -28% | -35% | 28% | |
| Write 4K (MB/s) | 131.9 | 121.5 -8% | 68.1 -48% | 142.1 8% |
| Read 4K (MB/s) | 46.72 | 24.92 -47% | 28.95 -38% | 44.19 -5% |
| Write Seq (MB/s) | 1036 | 345 -67% | 529 -49% | 1112 7% |
| Read Seq (MB/s) | 1352 | 1313 -3% | 711 -47% | 1884 39% |
| Write 4K Q32T1 (MB/s) | 487.7 | 346.1 -29% | 306.4 -37% | 747 53% |
| Read 4K Q32T1 (MB/s) | 443.9 | 389.4 -12% | 501 13% | 446.8 1% |
| Write Seq Q32T1 (MB/s) | 1048 | 334.7 -68% | 496.9 -53% | 1255 20% |
| Read Seq Q32T1 (MB/s) | 1699 | 1840 8% | 1297 -24% | 3400 100% |

GPU Performance
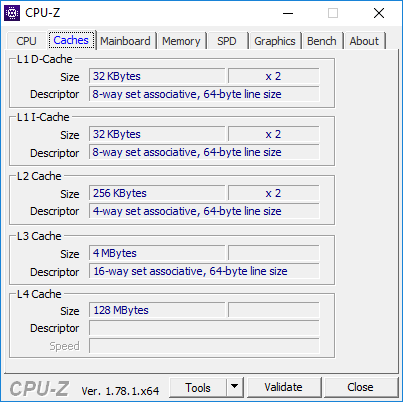
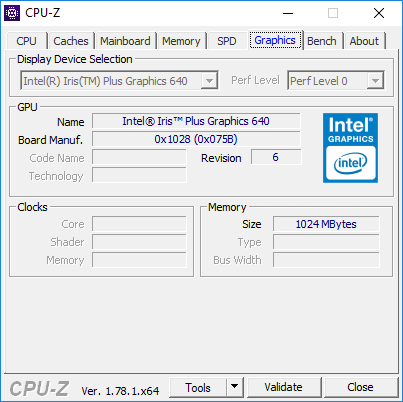
The key difference between the regular ULV chips and the processor in the test model is the integrated graphics adapter. While standard models such as the HD Graphics 620 use the system memory, the Iris Plus 640 is equipped with 64 MB eDRAM cache. This is the GT3e version of the Kaby Lake GPU with 48 Execution Units and a maximum core clock of 1050 MHz.
But let us get to the most important part, the performance. The first thing we can see is the limited performance utilization – similar to the processor. The same GPU in the current Apple MacBook Pro 13 is up to 13% ahead in the 3DMarks, for instance. The advantage over the regular HD Graphics 620 in combination with the Kaby Lake CPUs (such as the i7-7500U) is about 30%. The new i7-8550U, however, is only 15% slower. Intel says the iGPU has not changed, but the Turbo utilization probably benefits from the improved 14nm+ process.
The GPU performance is not reduced on battery power. More benchmarks for the Iris Plus Graphics 640 are listed here.
| 3DMark 11 Performance | 2275 points | |
| 3DMark Cloud Gate Standard Score | 7685 points | |
| 3DMark Fire Strike Score | 1265 points | |
| 3DMark Fire Strike Extreme Score | 577 points | |
| 3DMark Time Spy Score | 467 points | |
Help | ||
Gaming Performance
The situation is similar when you play games. The HD Graphics 620 from the old Kaby Lake chips is clearly beaten (sometimes by up to 80%), but the new i7-8550U is much closer. The XPS 13 is no gaming notebook to begin with, so the small difference should not be too important when you consider a purchase.
| Tomb Raider | |
| 1920x1080 Ultra Preset AA:FX AF:16x | |
| Apple MacBook Pro 13 2017 | |
| Dell XPS 13 9360 FHD i7 Iris | |
| Dell XPS 13 9360 FHD i5 | |
| 1366x768 High Preset AA:FX AF:8x | |
| Apple MacBook Pro 13 2017 | |
| Dell XPS 13 9360 FHD i7 Iris | |
| Dell XPS 13 9360 FHD i5 | |
| 1366x768 Normal Preset AA:FX AF:4x | |
| Apple MacBook Pro 13 2017 | |
| Dell XPS 13 9360 FHD i7 Iris | |
| Dell XPS 13 9360 FHD i5 | |
| 1024x768 Low Preset | |
| Apple MacBook Pro 13 2017 | |
| Dell XPS 13 9360 FHD i7 Iris | |
| Dell XPS 13 9360 FHD i5 | |
| Overwatch | |
| 1920x1080 Epic (Render Scale 100 %) AA:SM AF:16x | |
| Apple MacBook Pro 13 2017 | |
| 1920x1080 High (Render Scale 100 %) AA:SM AF:4x | |
| Apple MacBook Pro 13 2017 | |
| Dell XPS 13 9360 FHD i7 Iris | |
| Dell XPS 13 9360 QHD+ i7 | |
| Dell XPS 13 i7-8550U | |
| Acer Spin 5 SP513-52N-566U | |
| 1366x768 Medium (Render Scale 100 %) AA:FX AF:2x | |
| Apple MacBook Pro 13 2017 | |
| Dell XPS 13 9360 FHD i7 Iris | |
| Dell XPS 13 9360 QHD+ i7 | |
| Dell XPS 13 i7-8550U | |
| Acer Spin 5 SP513-52N-566U | |
| HP Envy 13-ad065nr | |
| 1280x720 Low (Render Scale 100 %) AA:FX AF:1x | |
| Apple MacBook Pro 13 2017 | |
| Dell XPS 13 9360 FHD i7 Iris | |
| Dell XPS 13 9360 QHD+ i7 | |
| Dell XPS 13 i7-8550U | |
| Acer Spin 5 SP513-52N-566U | |
| HP Envy 13-ad065nr | |
| Rocket League | |
| 1920x1080 High Quality AA:High FX | |
| Apple MacBook Pro 13 2017 | |
| Dell XPS 13 9360 FHD i7 Iris | |
| 1920x1080 Quality AA:Medium FX | |
| Apple MacBook Pro 13 2017 | |
| Dell XPS 13 9360 FHD i7 Iris | |
| Acer Spin 5 SP513-52N-566U | |
| 1280x720 Performance | |
| Apple MacBook Pro 13 2017 | |
| Acer Spin 5 SP513-52N-566U | |
| Dell XPS 13 9360 FHD i7 Iris | |
| low | med. | high | ultra | |
|---|---|---|---|---|
| Tomb Raider (2013) | 103 | 54.1 | 37 | 17.2 |
| BioShock Infinite (2013) | 61 | 40.2 | 33.5 | 10.7 |
| Battlefield 4 (2013) | 43.1 | 29.7 | 23.2 | 8.2 |
| The Witcher 3 (2015) | 17.5 | |||
| Rainbow Six Siege (2015) | 50.5 | 29 | 16.4 | |
| Overwatch (2016) | 56.1 | 36.5 | 29.9 | |
| Rocket League (2017) | 69.3 | 35.8 | 25.3 | |
| F1 2017 (2017) | 33 | 15 |
Emissions
System Noise
The noise development is actually an annoying problem for Dell's XPS models. We are not talking about the fan, which is usually very quiet and not too loud under high workloads. This is also the case here, even though the fan is sensitive to RPM changes. And then there is the coil whining, which can get much louder when you stress the GPU. It seems there are differences between individual devices, and we suggest you check the unit after the purchase.
Noise level
| Idle |
| 29.9 / 29.9 / 30.3 dB(A) |
| Load |
| 33.9 / 34.9 dB(A) |
 | ||
30 dB silent 40 dB(A) audible 50 dB(A) loud |
||
min: | ||
Temperature
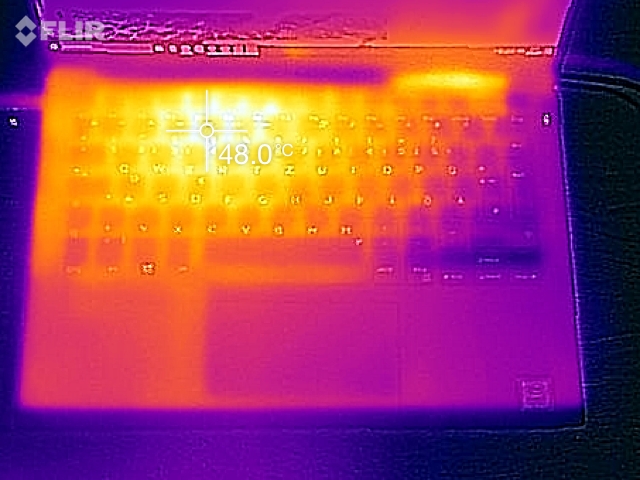
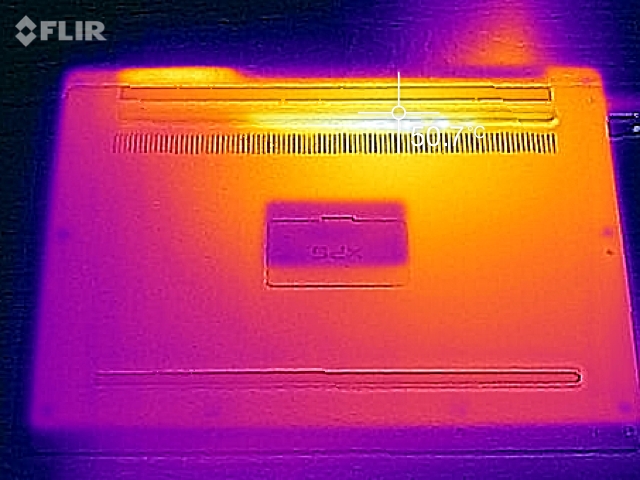
Dell manages the surface temperatures of the XPS 13 well. Both the top and bottom temperatures are very flat while idling and under light workloads, and we did not measure more than 30 °C (~86 °F) at any spot. You can see two hot spots under high load. One is located at the top of the base unit around the number keys 3 & 4 at 46 °C (~115 °F), and one spot in the center of the bottom at 48 °C (~118 °F). You will definitely feel the warmer keyboard, but it is still not uncomfortable. The large rubberized support foot at the bottom also helps to avoid direct contact with the surface.
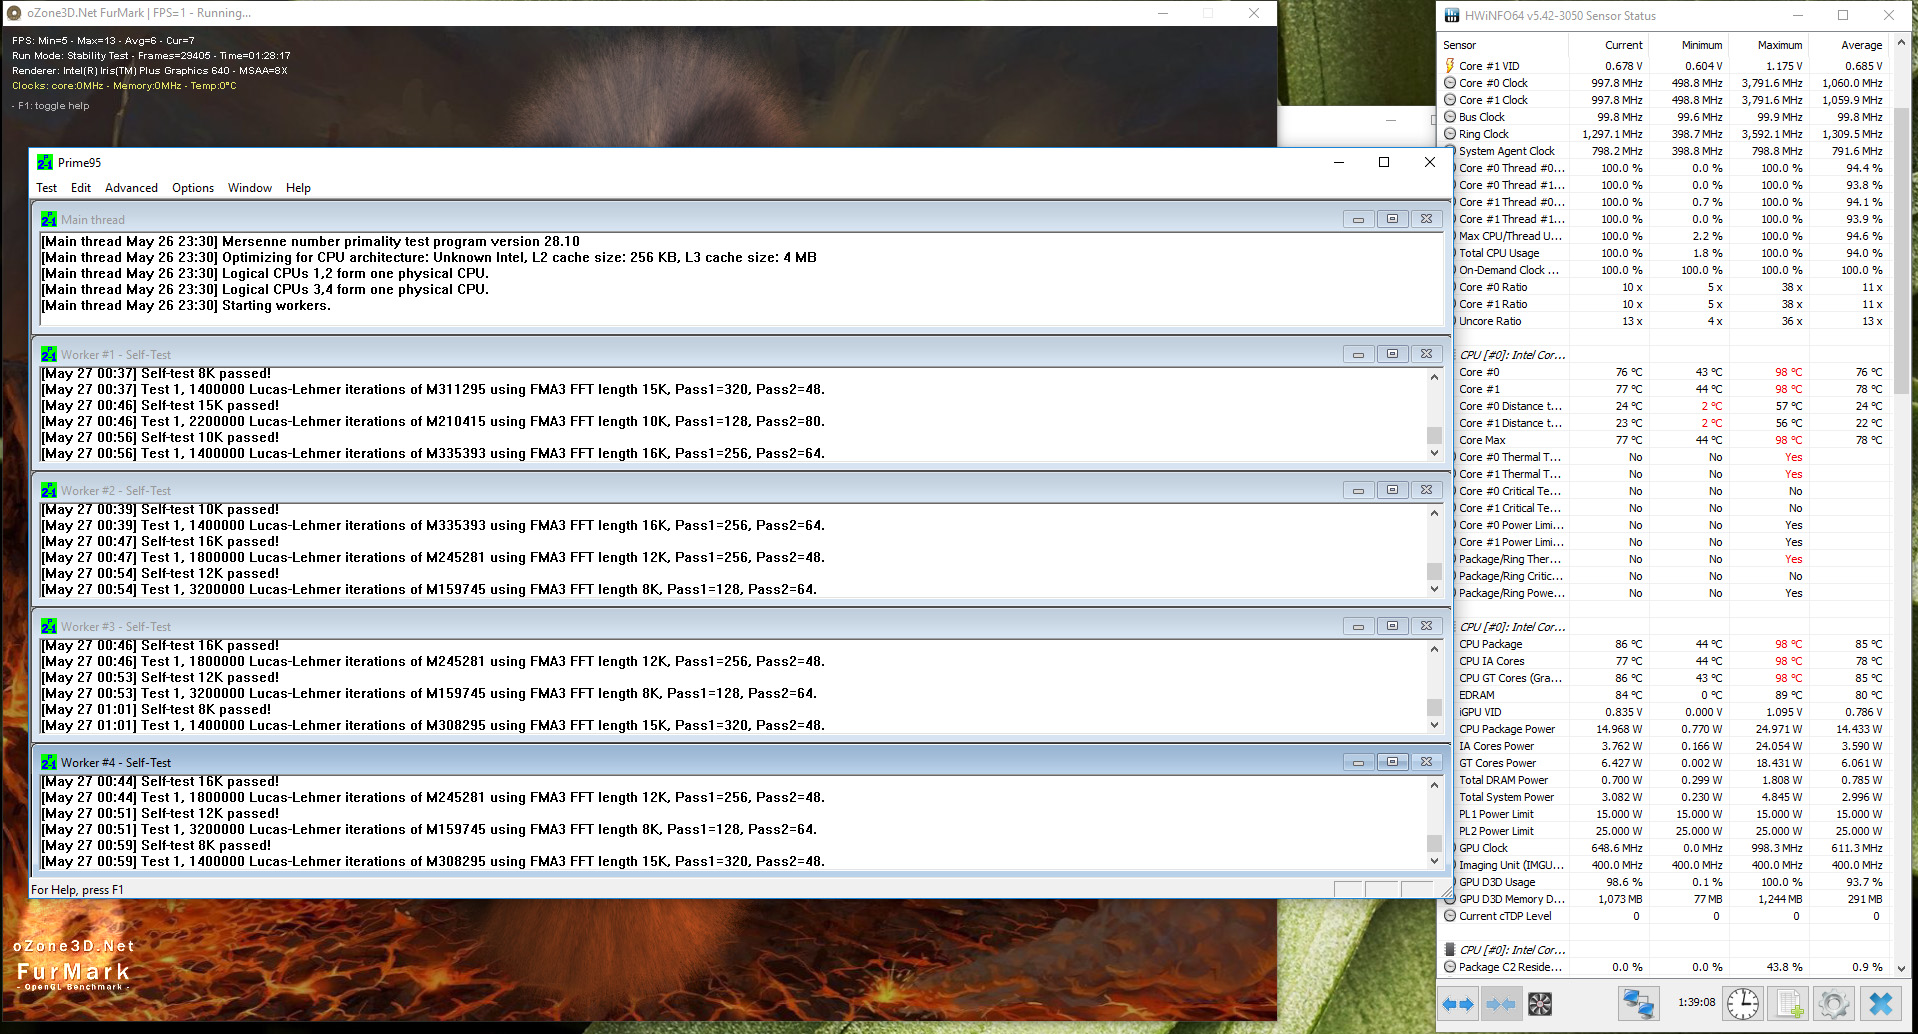
The XPS 13 starts the stress test with a CPU frequency of 2.4 GHz, while the GPU runs at 650 to 800 MHz (25 W). However, the temperature rises to 98 °C (~208 °F) after a few seconds, which results in immediate throttling to 1 GHz (CPU) and 650 MHz (GPU). A 3DMark 11 run immediately after the stress test did not determine a reduced score.
(-) The maximum temperature on the upper side is 46.2 °C / 115 F, compared to the average of 35.9 °C / 97 F, ranging from 21.4 to 59 °C for the class Subnotebook.
(-) The bottom heats up to a maximum of 48.8 °C / 120 F, compared to the average of 39.2 °C / 103 F
(+) In idle usage, the average temperature for the upper side is 26.7 °C / 80 F, compared to the device average of 30.8 °C / 87 F.
(+) The palmrests and touchpad are reaching skin temperature as a maximum (33.6 °C / 92.5 F) and are therefore not hot.
(-) The average temperature of the palmrest area of similar devices was 28.2 °C / 82.8 F (-5.4 °C / -9.7 F).
Energy Management
Power Consumption
Dell ships the XPS 13 with only two power plans by default: Dell and Balanced. We activated the other profiles via registry to ensure comparability with other test models. You will have to switch the Connected-Standby via registry key CsEnabled from 1 to 0 (HKEY_LOCAL_MACHINE -> SYSTEM -> Current -> ControlSet -> Control -> Power) and then restart the device. The CABC display control also has an effect on the power consumption, but the differences are not huge. We performed the idle measurements with the default background image (green leaves), which is neither particularly bright, nor dark. We determined a deviation of up to 9% for very bright or dark contents.
The XPS 13 is very efficient while idling at 3.32 up to 6.32 W. You notice the more powerful processor under load, because our measurement device indicates up to 45.9 W during the first few seconds of the stress test. However, this value drops to 29.7 W after the throttling sets in, so the provided 45 W power adapter is sufficient.
| Off / Standby | |
| Idle | |
| Load |
|
Key:
min: | |
| Dell XPS 13 9360 FHD i7 Iris i7-7560U, Iris Plus Graphics 640, IPS, 1920x1080, 13.3" | Dell XPS 13 i7-8550U i5-8550U, UHD Graphics 620, IGZO IPS, 3200x1800, 13.3" | Dell XPS 13 9360 FHD i5 i5-7200U, HD Graphics 620, IPS, 1920x1080, 13.3" | Dell XPS 13 9360 QHD+ i7 i7-7500U, HD Graphics 620, IPS, 3200x1800, 13.3" | Huawei MateBook X i5-7200U, HD Graphics 620, , 2160x1440, 13.3" | HP Envy 13-ad065nr i5-7200U, HD Graphics 620, IPS, 1920x1080, 13.3" | Apple MacBook Pro 13 2017 i5-7360U, Iris Plus Graphics 640, IPS, 2560x1600, 13.3" | |
|---|---|---|---|---|---|---|---|
| Power Consumption | -10% | 17% | -17% | -47% | 8% | -14% | |
| Idle Minimum * (Watt) | 3.32 | 4.1 -23% | 4.1 -23% | 6.4 -93% | 4.6 -39% | 2.8 16% | 3.7 -11% |
| Idle Average * (Watt) | 5.27 | 5.8 -10% | 4.2 20% | 6.6 -25% | 11 -109% | 5.8 -10% | 5.2 1% |
| Idle Maximum * (Watt) | 6.32 | 6 5% | 5.1 19% | 6.8 -8% | 12 -90% | 6.4 -1% | 7.6 -20% |
| Load Average * (Watt) | 32 | 42.5 -33% | 22.1 31% | 27.5 14% | 39.5 -23% | 31.3 2% | 41.6 -30% |
| Load Maximum * (Watt) | 45.9 | 41.4 10% | 29.4 36% | 32.4 29% | 34.6 25% | 31.7 31% | 50.5 -10% |
* ... smaller is better
Battery Runtime
The integrated 60 Wh battery is still one of the biggest modules in this category. Thanks to the lower panel resolution, the test model can also beat the QHD+ model. Overall, the runtimes are excellent and you should not have any problems to cover a whole business day. The test model is only just beaten by the current MacBook Pro 13 (without TouchBar) in the WLAN test.
The battery is drained within 2.5 hours when you really stress the laptop. A full recharge also takes around 2.5 hours, but the last 10% is really slow. About 50% of the capacity is available after little more than an hour.
| Dell XPS 13 9360 FHD i7 Iris i7-7560U, Iris Plus Graphics 640, 60 Wh | Dell XPS 13 i7-8550U i5-8550U, UHD Graphics 620, 60 Wh | Razer Blade Stealth QHD i7-7500U i7-7500U, HD Graphics 620, 53.6 Wh | Huawei MateBook X i5-7200U, HD Graphics 620, 40 Wh | HP Envy 13-ad065nr i5-7200U, HD Graphics 620, 53.6 Wh | Dell XPS 13 9360 FHD i5 i5-7200U, HD Graphics 620, 60 Wh | Dell XPS 13 9360 QHD+ i7 i7-7500U, HD Graphics 620, 60 Wh | Apple MacBook Pro 13 2017 i5-7360U, Iris Plus Graphics 640, 54.5 Wh | |
|---|---|---|---|---|---|---|---|---|
| Battery runtime | -15% | -41% | -37% | -11% | -4% | -22% | -23% | |
| Reader / Idle (h) | 25.4 | 18.5 -27% | 8.5 -67% | 24.8 -2% | 21.6 -15% | 17.6 -31% | ||
| H.264 (h) | 15 | 11.4 -24% | ||||||
| WiFi v1.3 (h) | 10.9 | 9.8 -10% | 6.4 -41% | 5.6 -49% | 9.5 -13% | 11.3 4% | 8.6 -21% | 11.4 5% |
| Load (h) | 2.6 | 2.4 -8% | 2.7 4% | 2.1 -19% | 2.6 0% | 2.2 -15% | 1.3 -50% |
Verdict
Pros
Cons
Potential buyers of the Dell XPS 13 are facing an interesting decision right now. The new Kaby Lake-R processors provide much more CPU performance, while the Iris GPU in combination with the "old" Kaby Lake CPUs promises more GPU performance. At least in theory, because the decision is actually pretty easy after the review.
The new ULV quad-core is superior to the old dual-cores if you can utilize the additional cores/threads. The GPU performance is a bit higher as well. Another deciding factor is the limited performance utilization of the i7-7560U in the XPS 13. There is not much left of the performance advantages due to the usual limitation at 15 W. Our recommendation is therefore easy: If you plan on buying the XPS 13, get it with one of the new Kaby Lake-R chips.
The Kaby Lake in combination with the more powerful Iris GPU does not make much sense for the XPS 13, because you cannot utilize its full potential. The new 8th Gen processors (Kaby Lake-Refresh) are superior in terms of CPU performance, and the GPU is not significantly slower either.
Otherwise, there is not much to say about the XPS 13 anymore. Unfortunately, Dell still has not resolved the coil whining issues, and it is more distracting on this particular unit.
Dell XPS 13 9360 FHD i7 Iris
- 11/06/2017 v6 (old)
Andreas Osthoff
Price comparison
