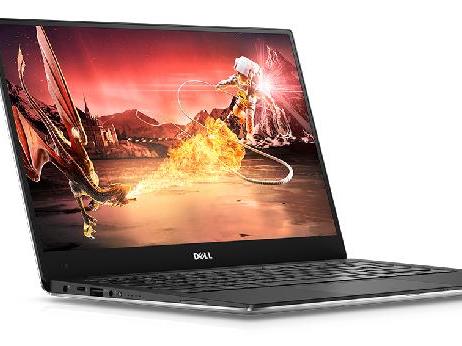
Dell XPS 13 (i7-8550U, QHD) Laptop Review
The late 2017 XPS 13 with Kaby Lake-R is expected to be the final iteration before Dell will introduce a brand new chassis design at CES 2018. Current SKUs in the US include only the Core i7-8550U with no i5-8250U in sight. Users can select the lower-end SKU with 8 GB of RAM and FHD 1080p matte display for $1300 USD or the higher-end SKU with 16 GB of RAM and QHD+ 1800p glossy touchscreen for $1750 USD. Our test unit today is equipped with a QHD+ touchscreen and 8 GB of RAM.
Beyond the CPU swap, the new XPS 13 is essentially identical to the existing lineup with added temperature sensors to squeeze out slightly more performance. As such, we recommend checking out our existing XPS 13 pages for more details on the chassis, connectivity features, keyboard, speakers, and more. This review page will focus on the performance of the new XPS 13 and how the 8th gen CPU influences fan noise, temperature, power consumption, and battery life.
Case
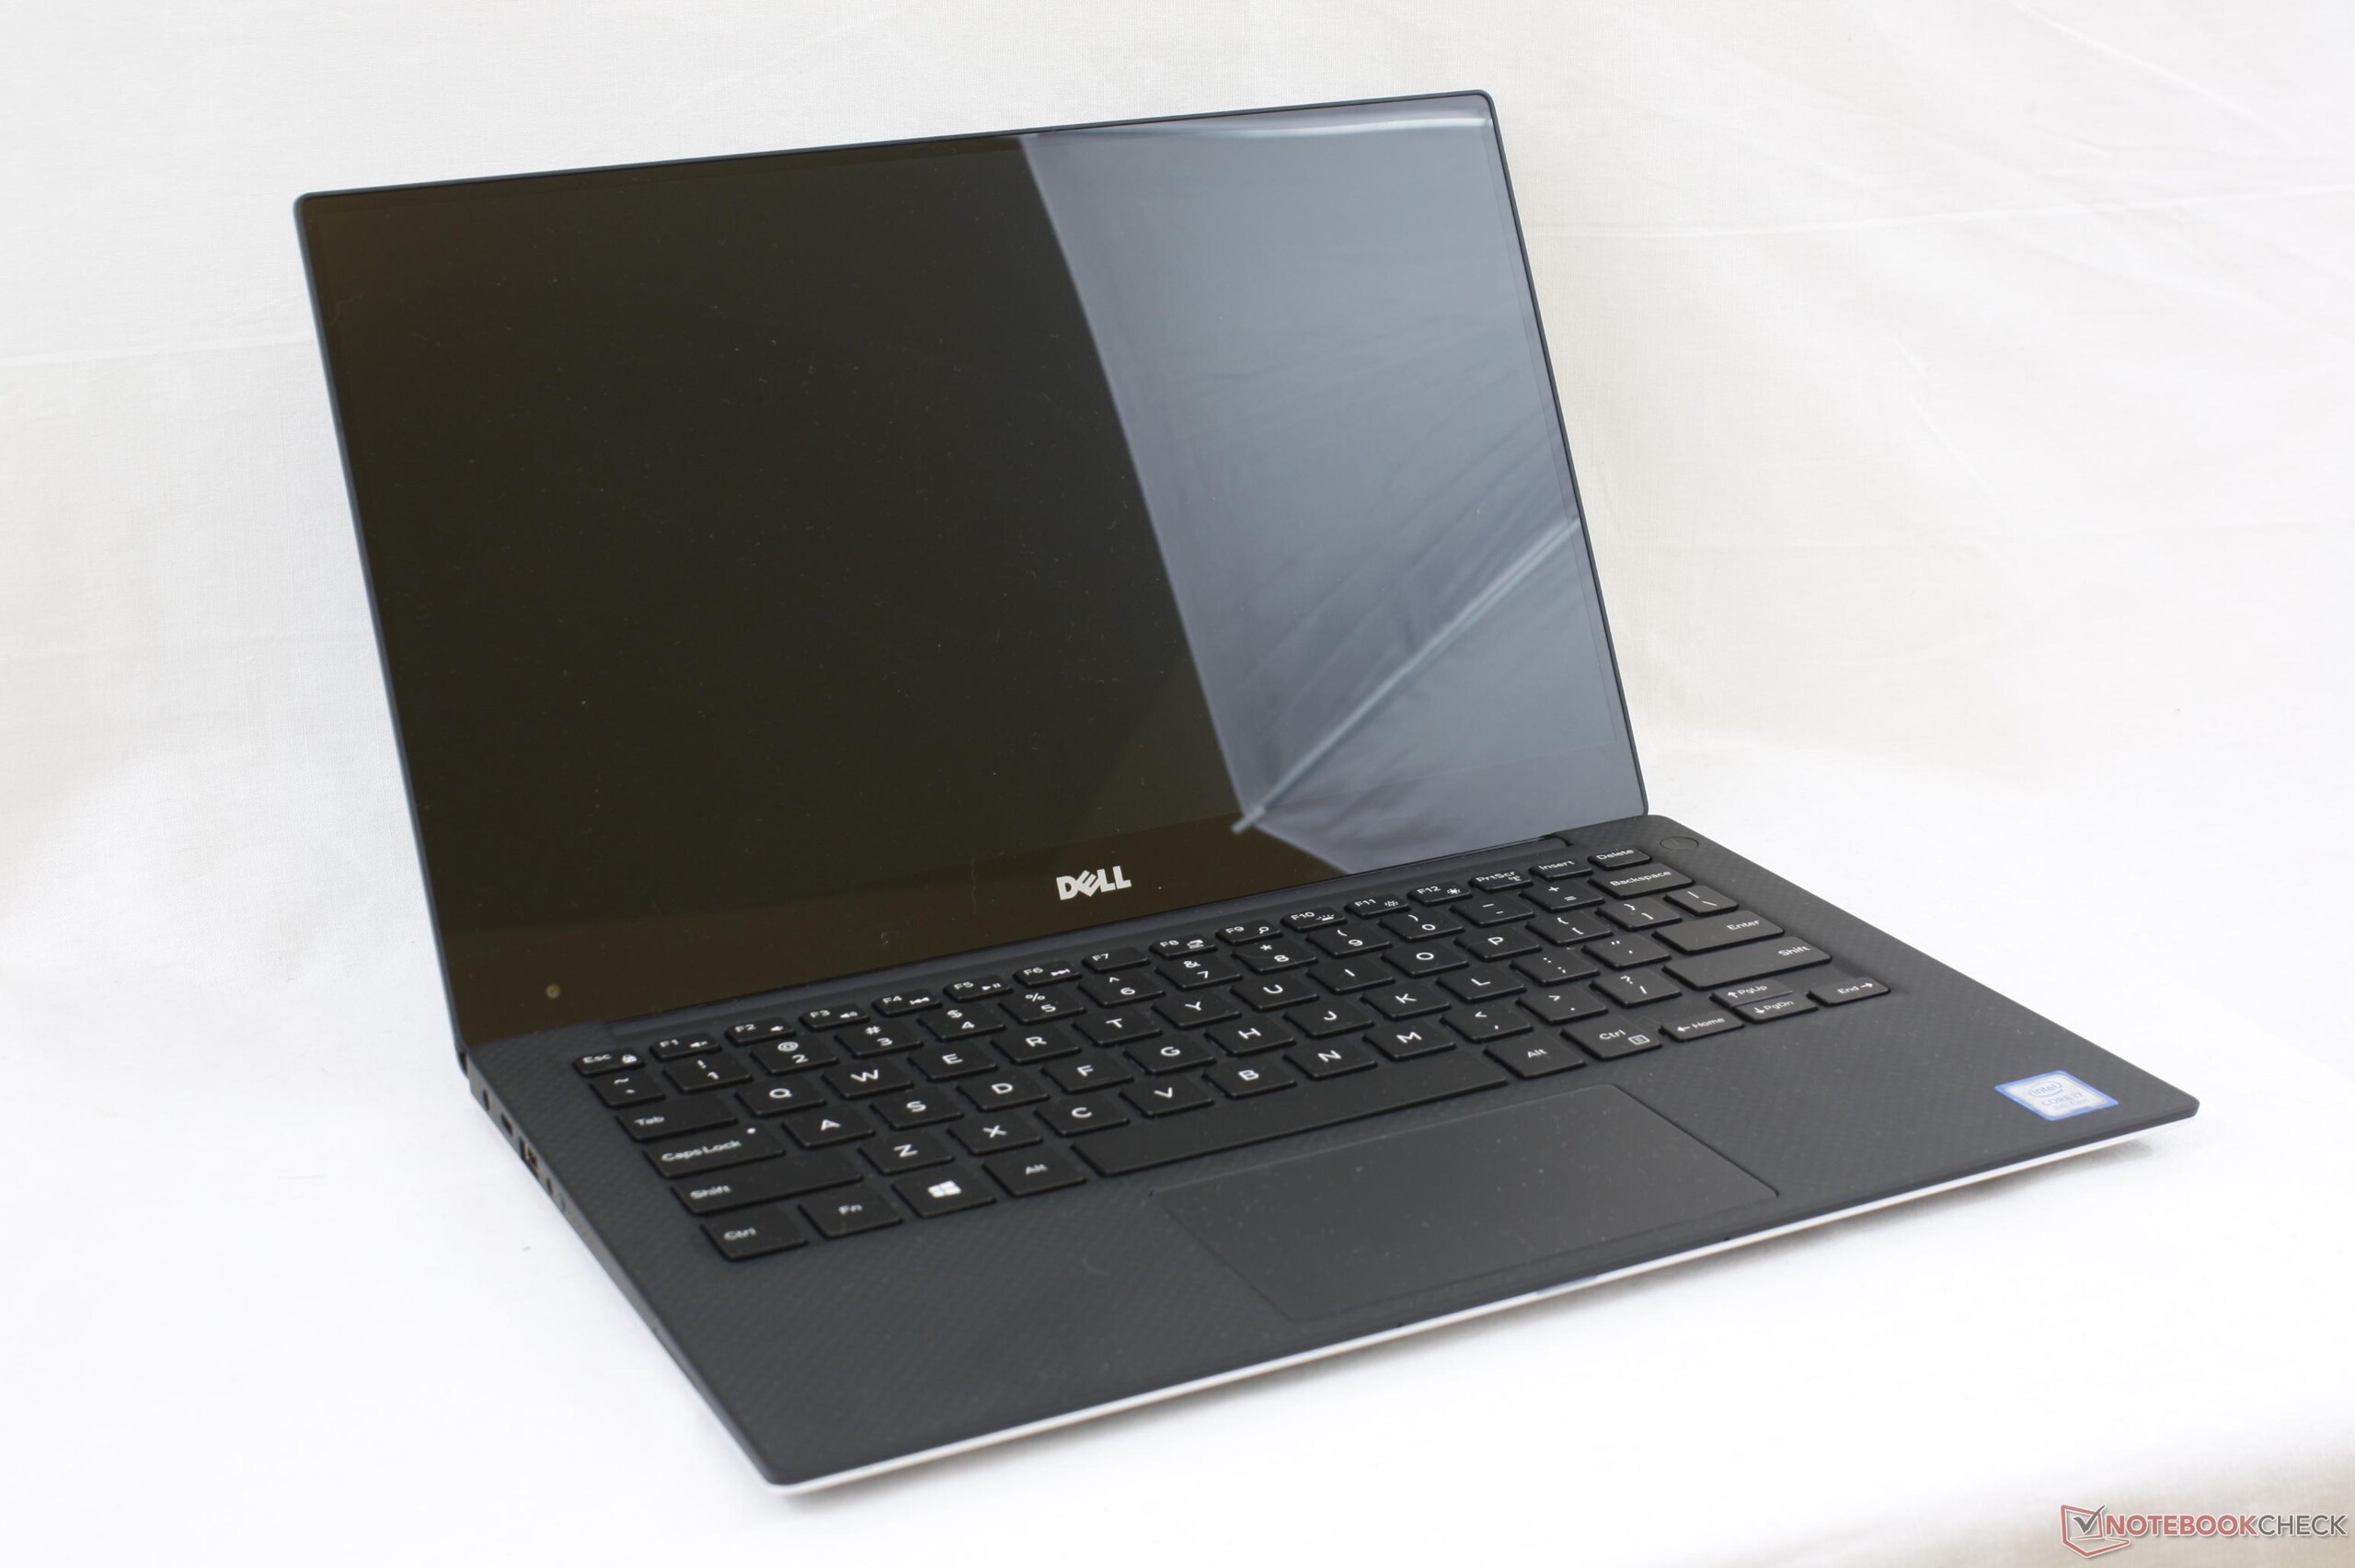
The current InfinityEdge design is approaching three years of age and has had no major external changes ever since the original XPS 13 9343. Competitors have been slowly catching up with their own narrow bezel designs, but Dell still remains a favorite amongst the press largely due to the rigidity and quality of both the base and lid. Newer alternatives are notably lighter than the dense XPS 13 like the Spectre 13 or MateBook X and we suspect that the next generation refresh will address this disadvantage.
Connectivity
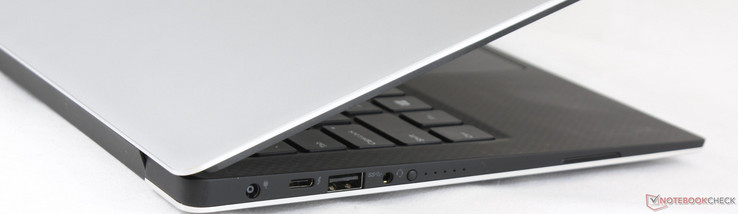
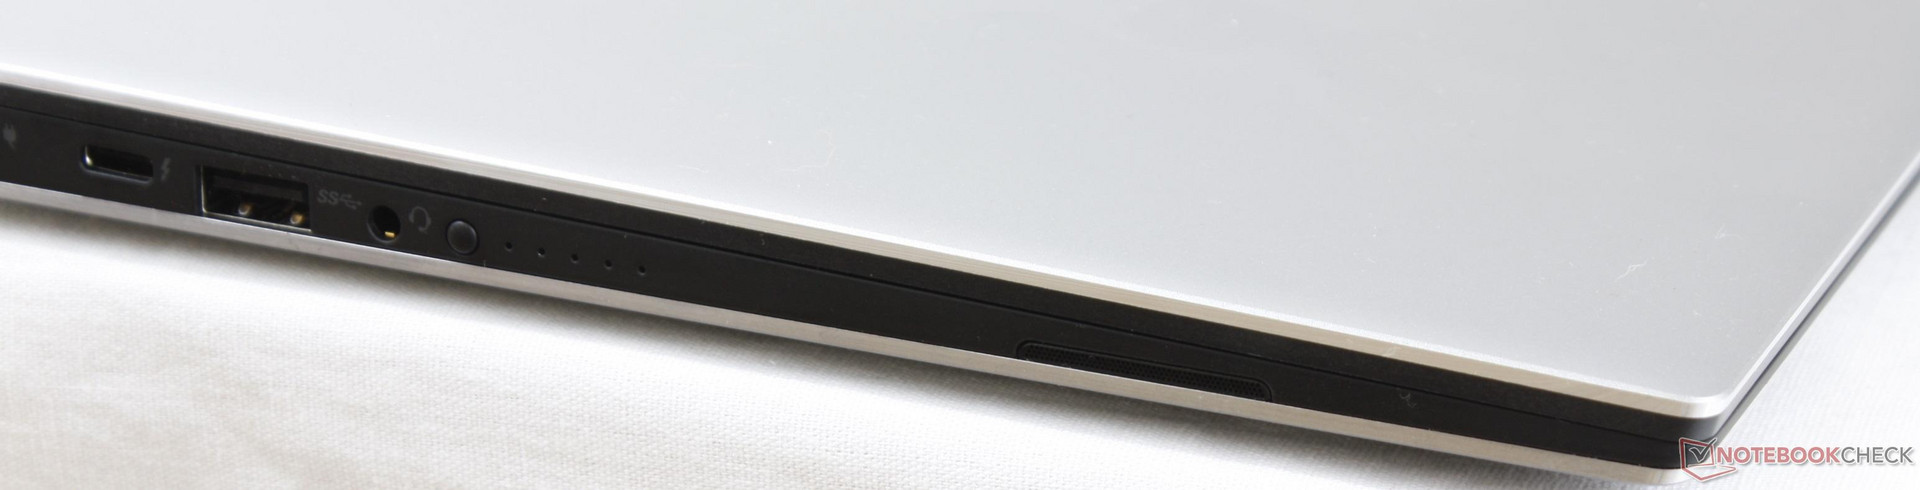
Since no changes have been made to connectivity, the Thunderbolt 3 port is still utilizing half the PCIe lanes for half the theoretical speed of “true” Thunderbolt 3.
SD Card Reader
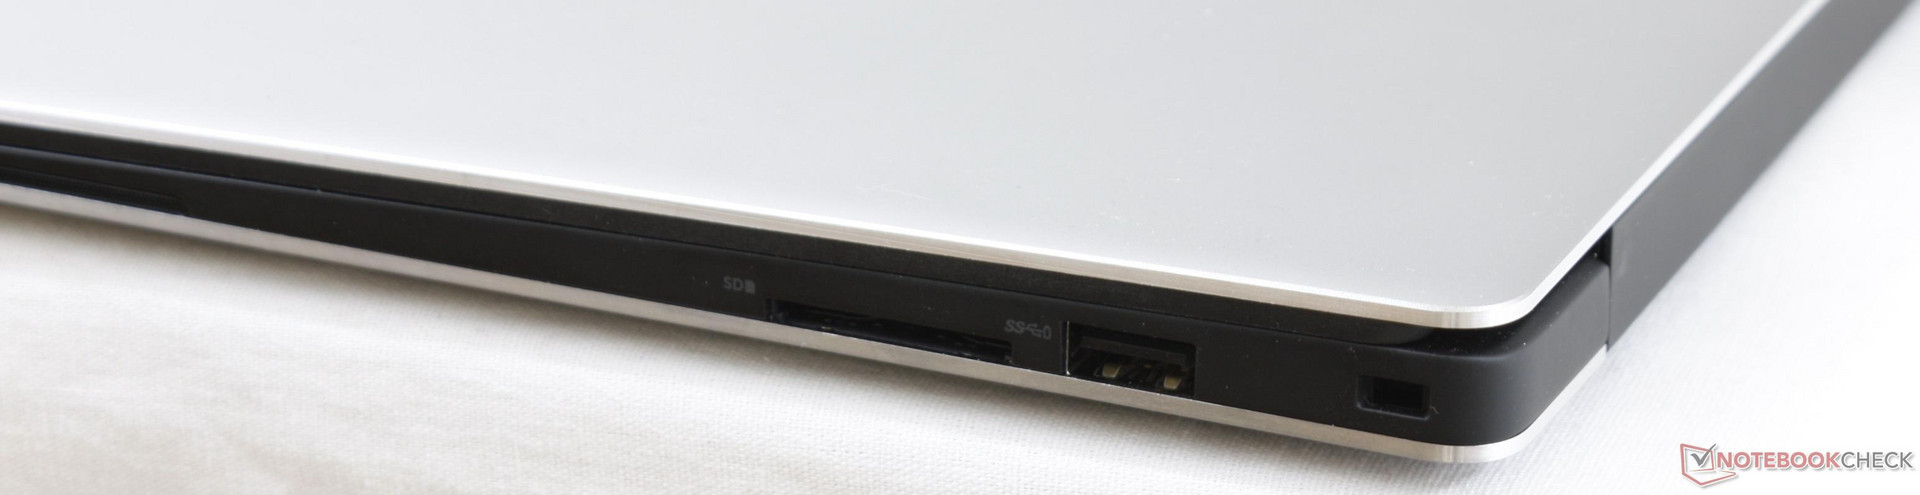
Dell outfits its XPS 13 and XPS 15 series with faster SD card readers than most gaming notebooks. Transferring 1 GB worth of images from our Toshiba UHS-II SDXC test card to desktop takes about 6 seconds compared to over 40 seconds on the Acer Swift 3. The card reader itself is not spring-loaded and a fully inserted SD card will protrude by about one-third of its length.
| SD Card Reader | |
| average JPG Copy Test (av. of 3 runs) | |
| Dell XPS 13 i7-8550U | |
| Dell XPS 15 9560 (i7-7700HQ, UHD) | |
| Acer Swift 3 SF315-51G-57E5 | |
| maximum AS SSD Seq Read Test (1GB) | |
| Dell XPS 15 9560 (i7-7700HQ, UHD) | |
| Dell XPS 13 i7-8550U | |
| Acer Swift 3 SF315-51G-57E5 | |
Communication
The gaming-centric 2x2 Killer 1535 is standard across all available XPS 13 SKUs. We are able to record a real-world transfer rate of 618 Mbps when standing one meter away from our Linksys EA8500 test router to be comparable to the Intel 8260 or 8265. See our review on the Killer 1535 for more information on its features.
| Networking | |
| iperf3 transmit AX12 | |
| Dell XPS 13 i7-8550U | |
| Samsung Notebook 9 NP900X3N-K01US | |
| HP Spectre x360 13-ac033dx | |
| iperf3 receive AX12 | |
| Samsung Notebook 9 NP900X3N-K01US | |
| HP Spectre x360 13-ac033dx | |
| Dell XPS 13 i7-8550U | |
Maintenance
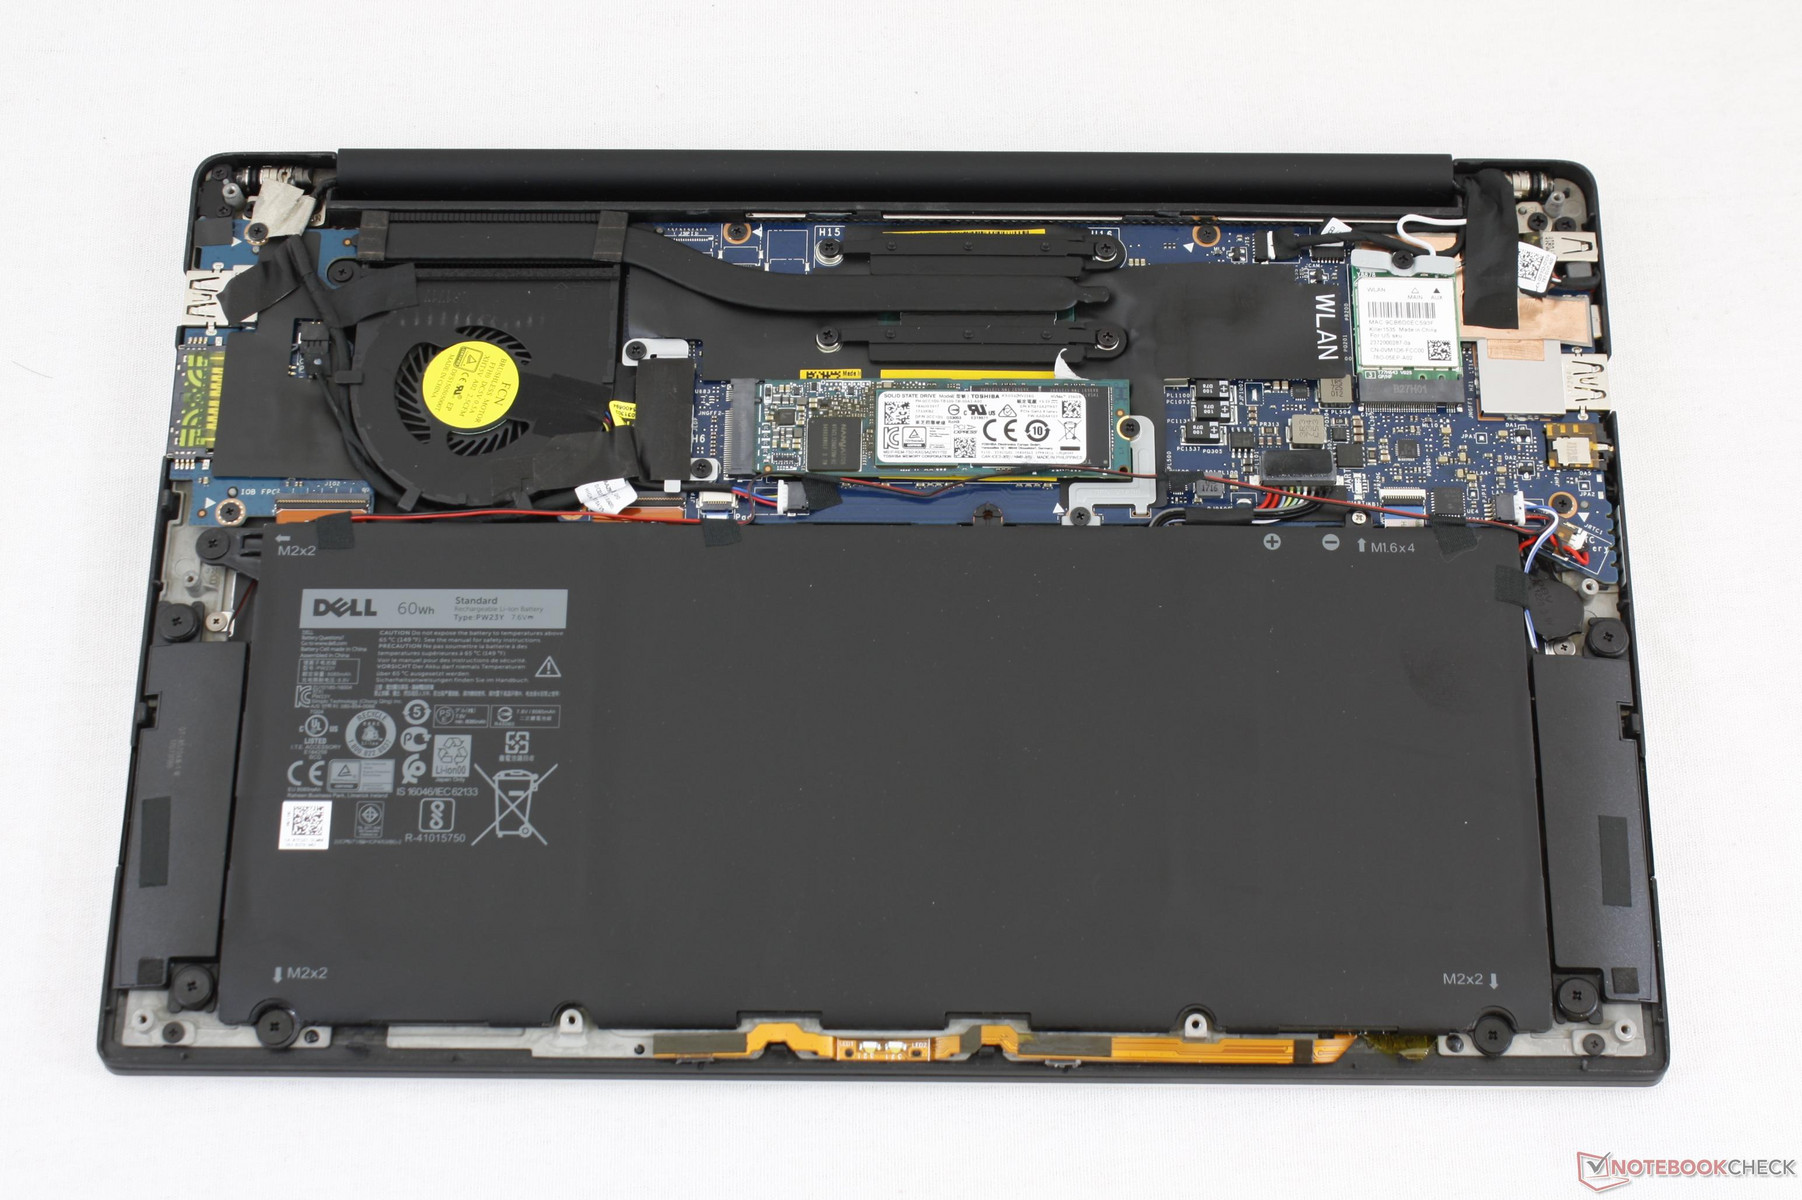
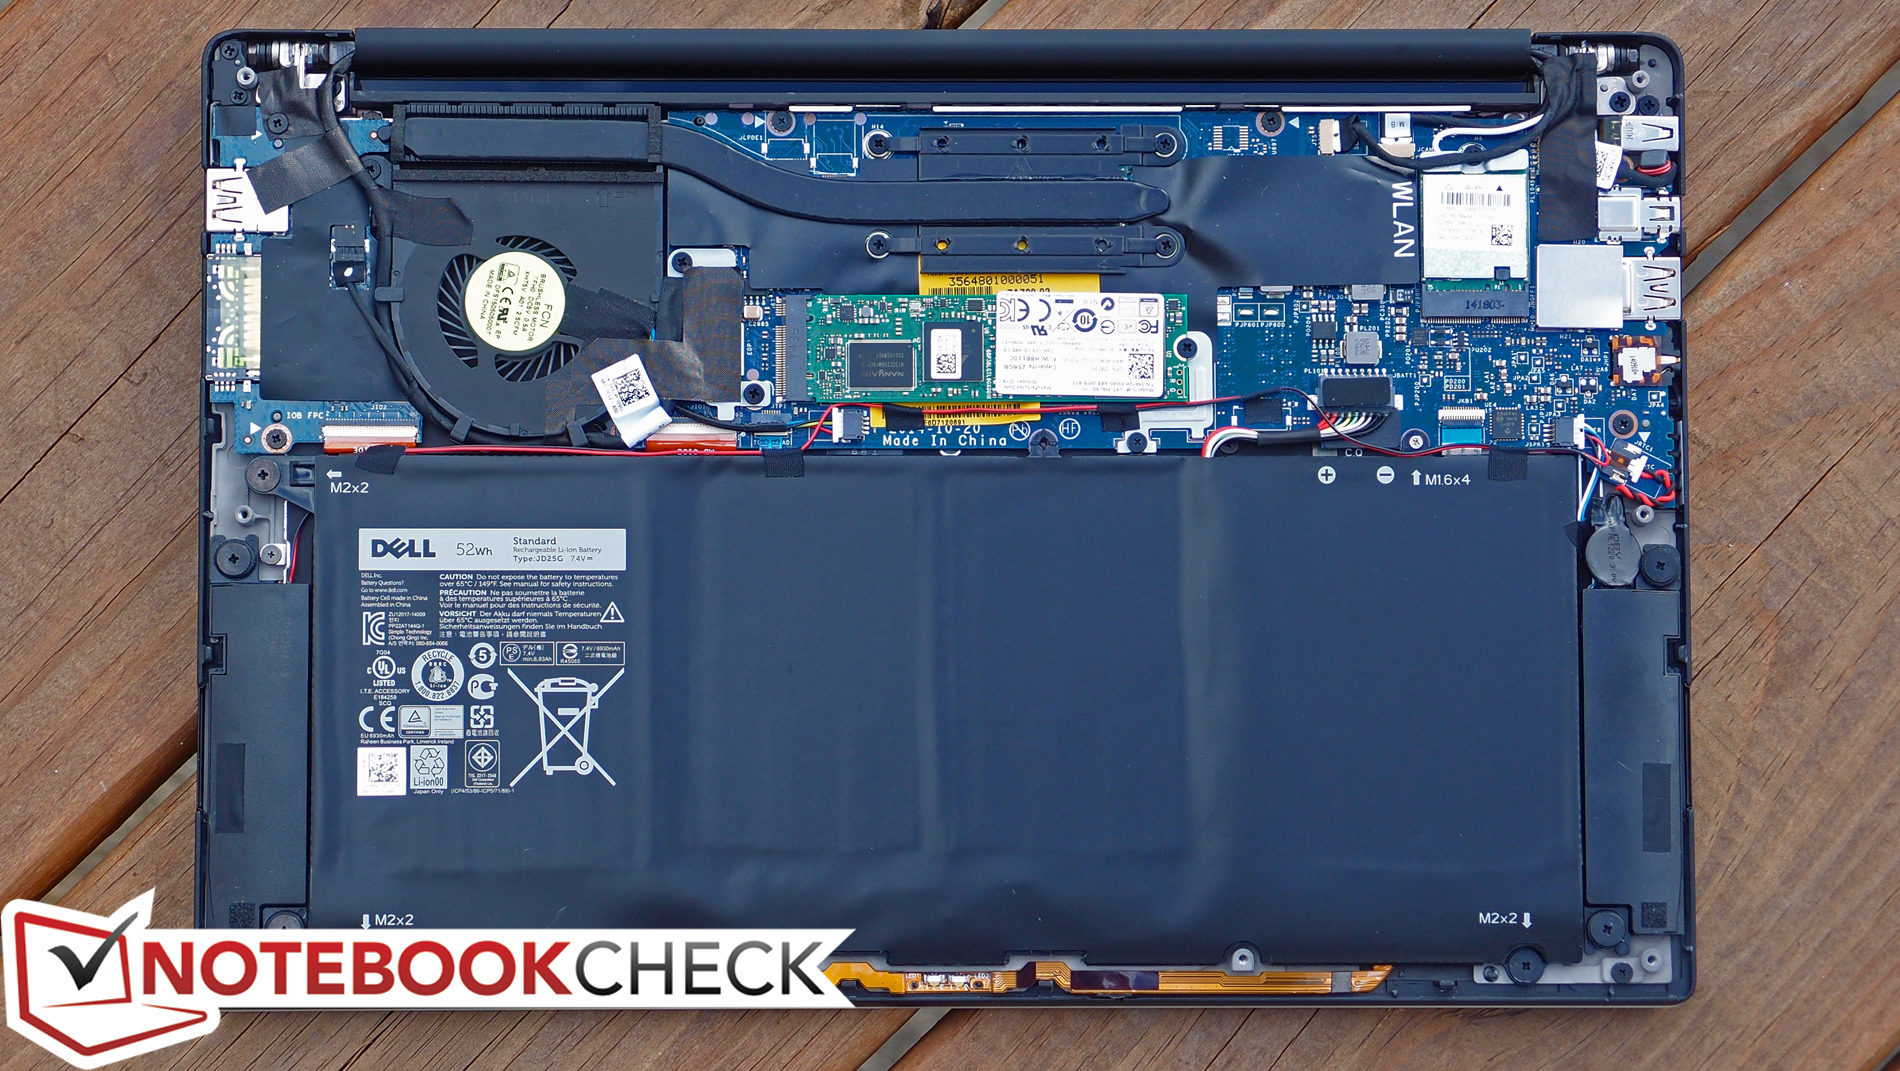
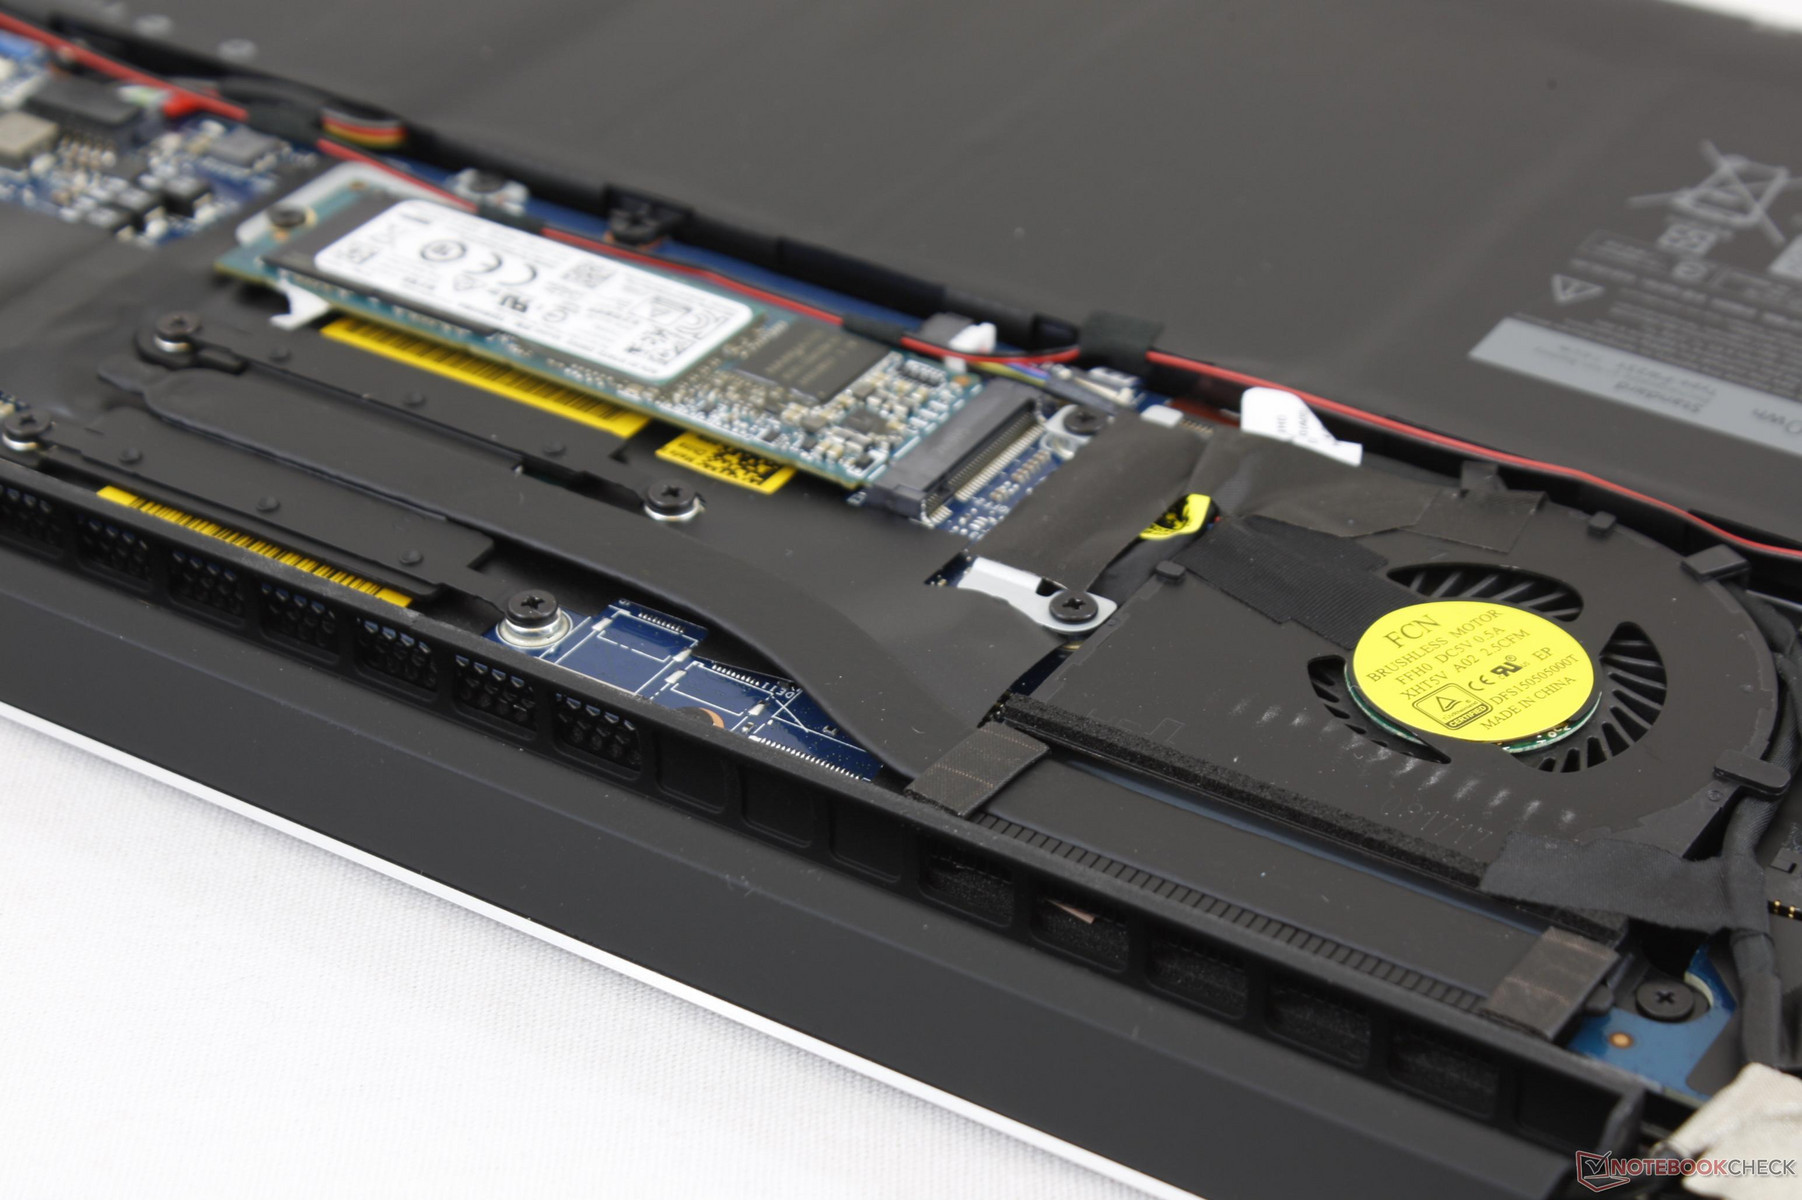
The back panel can be easily removed with a Philips screwdriver and T5 Hex wrench to reveal an essentially identical internal layout. Dell says its new XPS 13 SKUs with 8th gen Kaby Lake-R are sporting thermistors on specific locations around the chassis, but further disassembly is likely required to spot the individual resistors.
Warranty
The standard one-year limited warranty applies with options extending up to four years. Please see our Guarantees, Return Policies & Warranties FAQ for country-specific information.
Input Devices
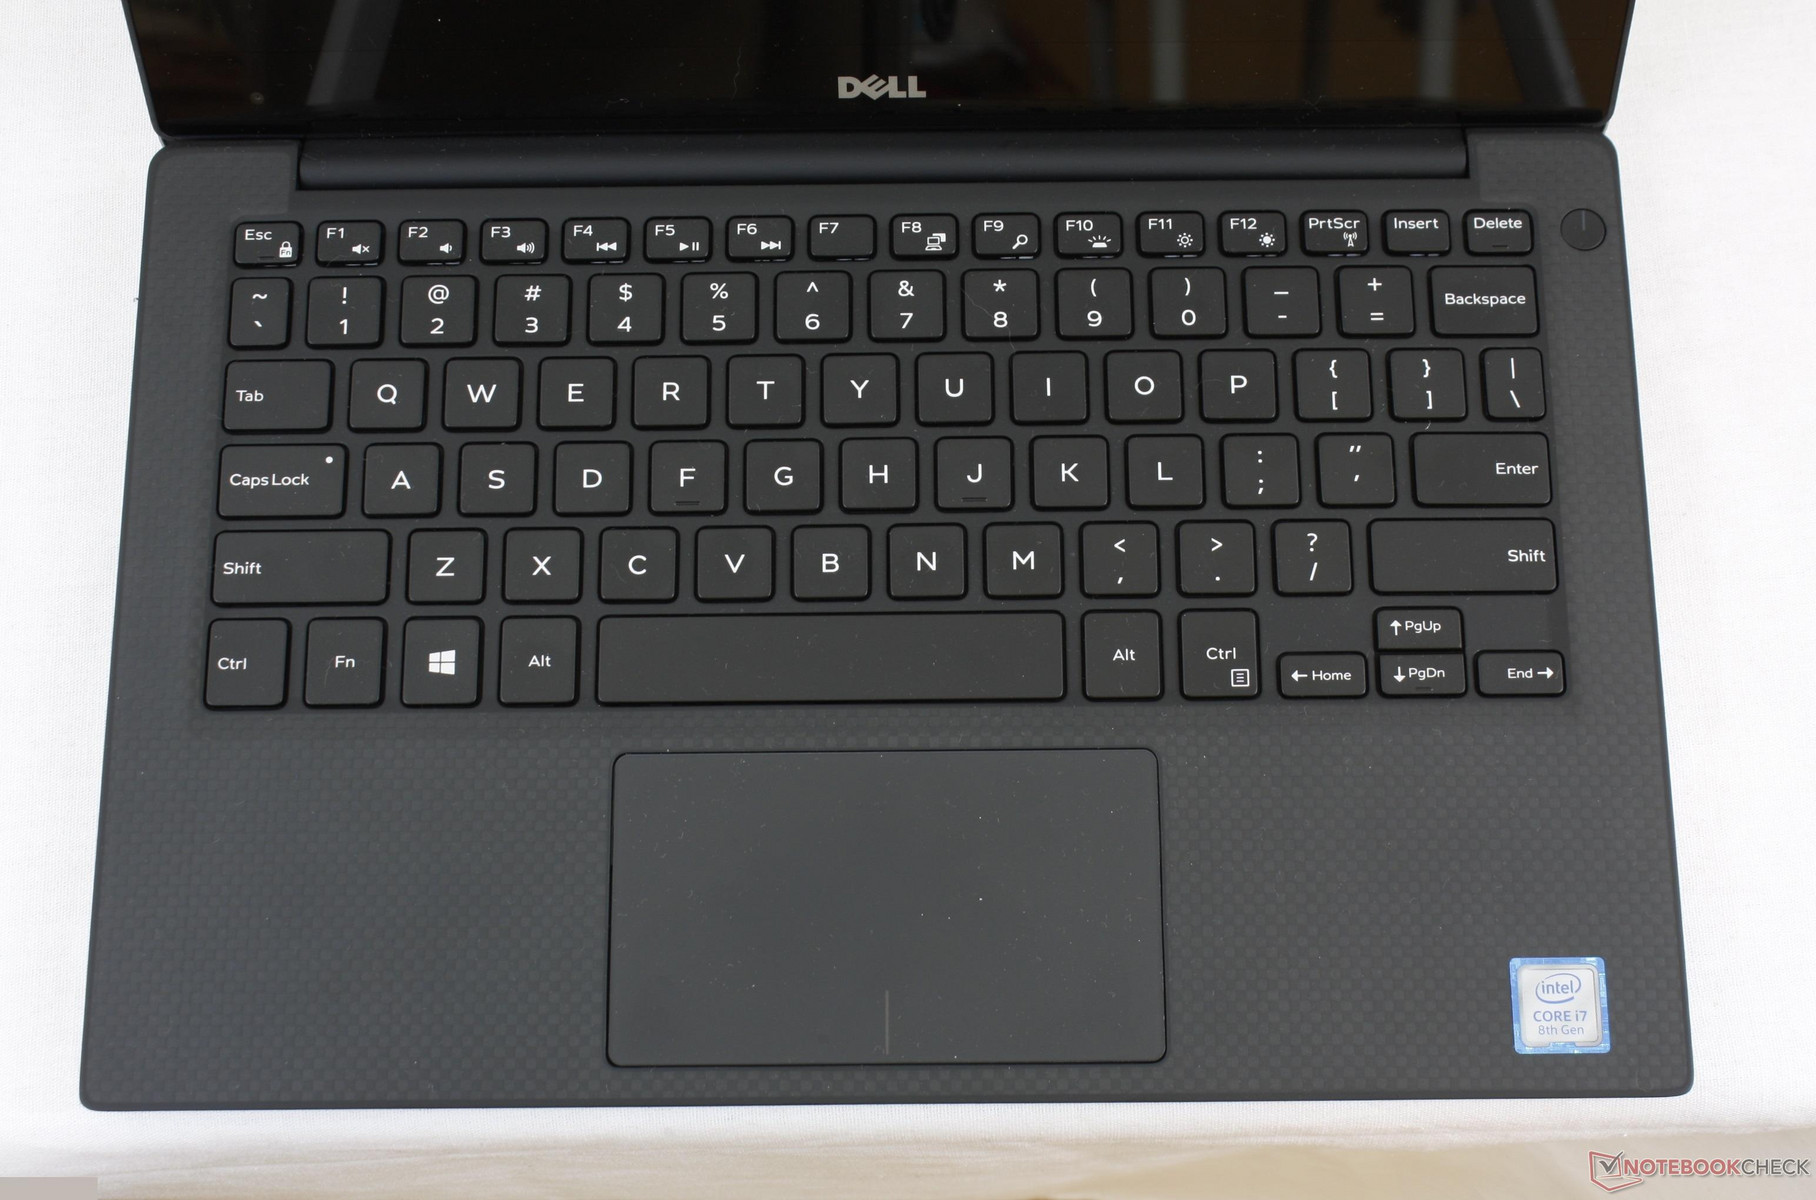
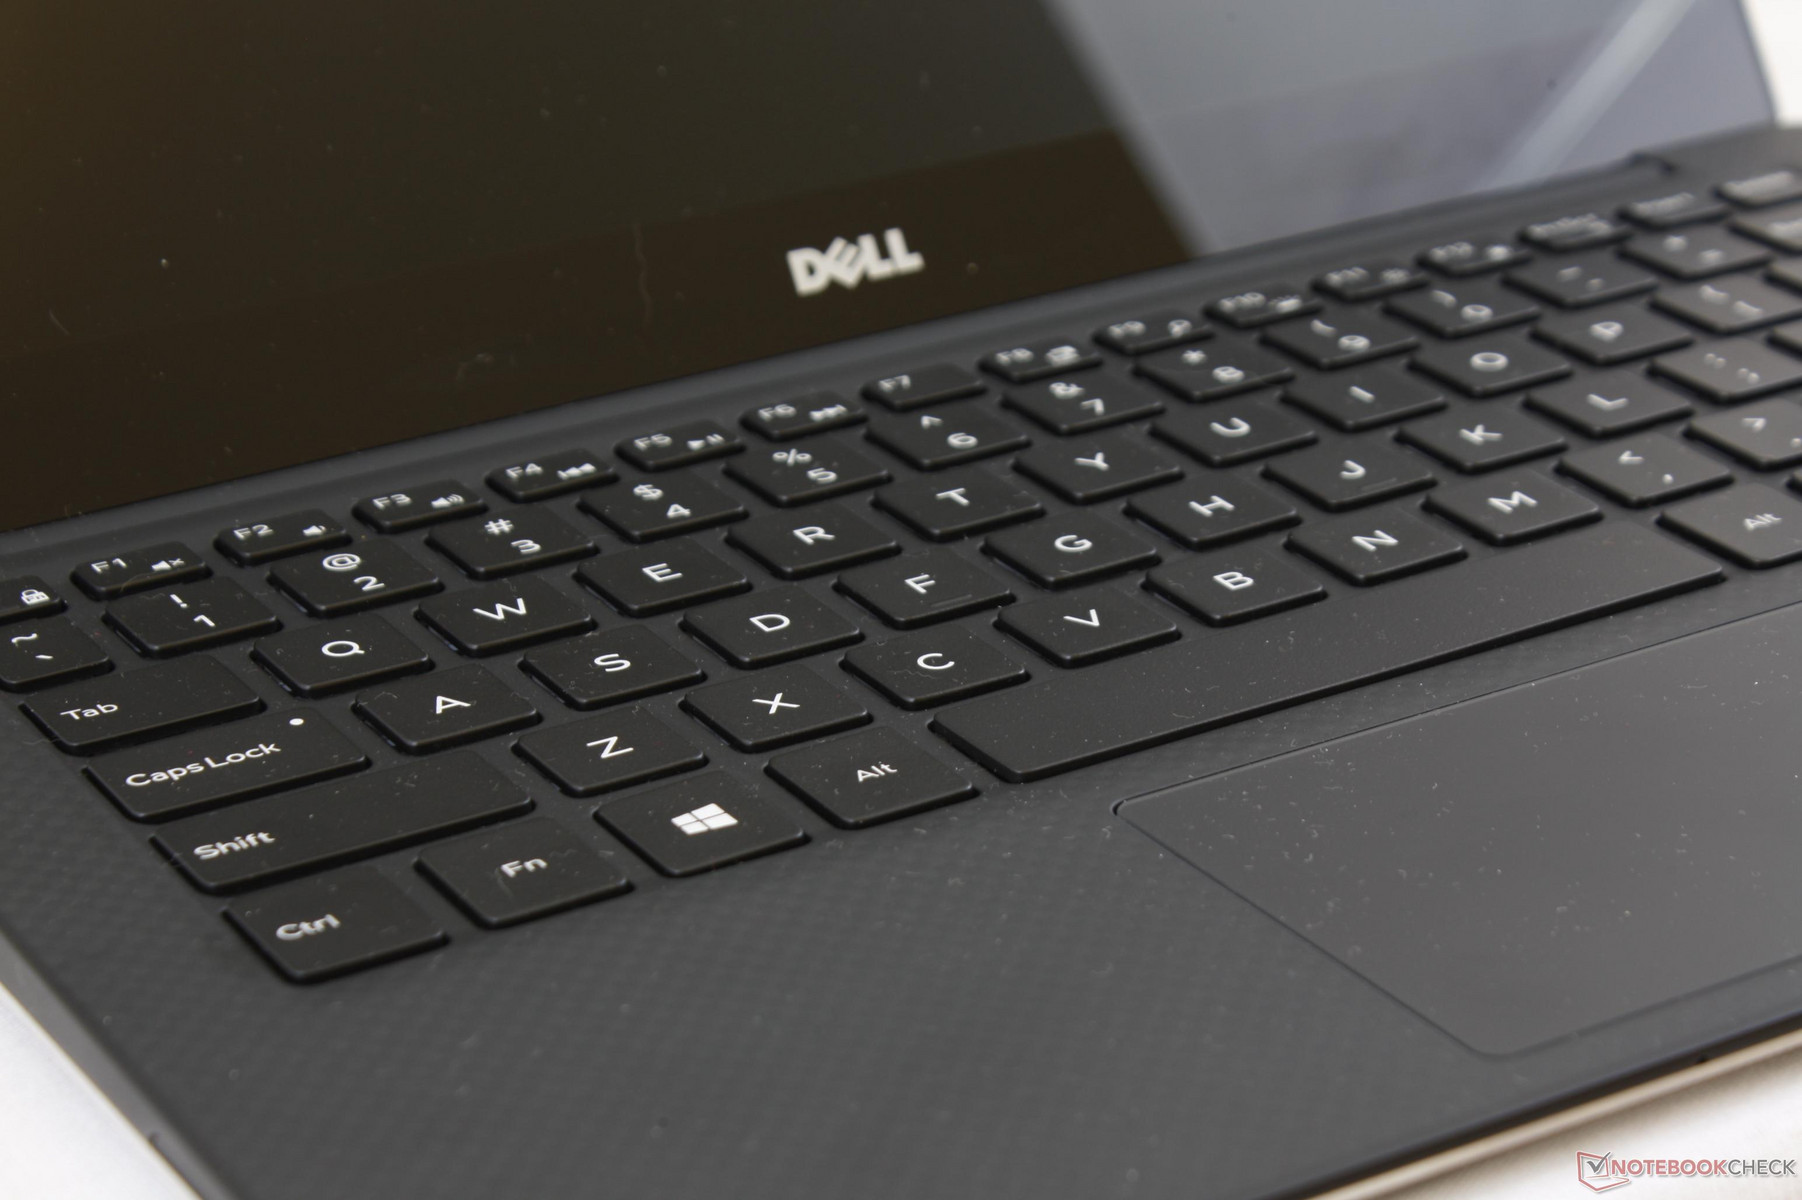
Keyboard and trackpad (~10.5 x 6.0 cm) remain identical. Key feedback is on the soft side with light-moderate clatter compared to the ThinkPad 25 while the integrated mouse keys are much firmer and louder when clicked.
Display
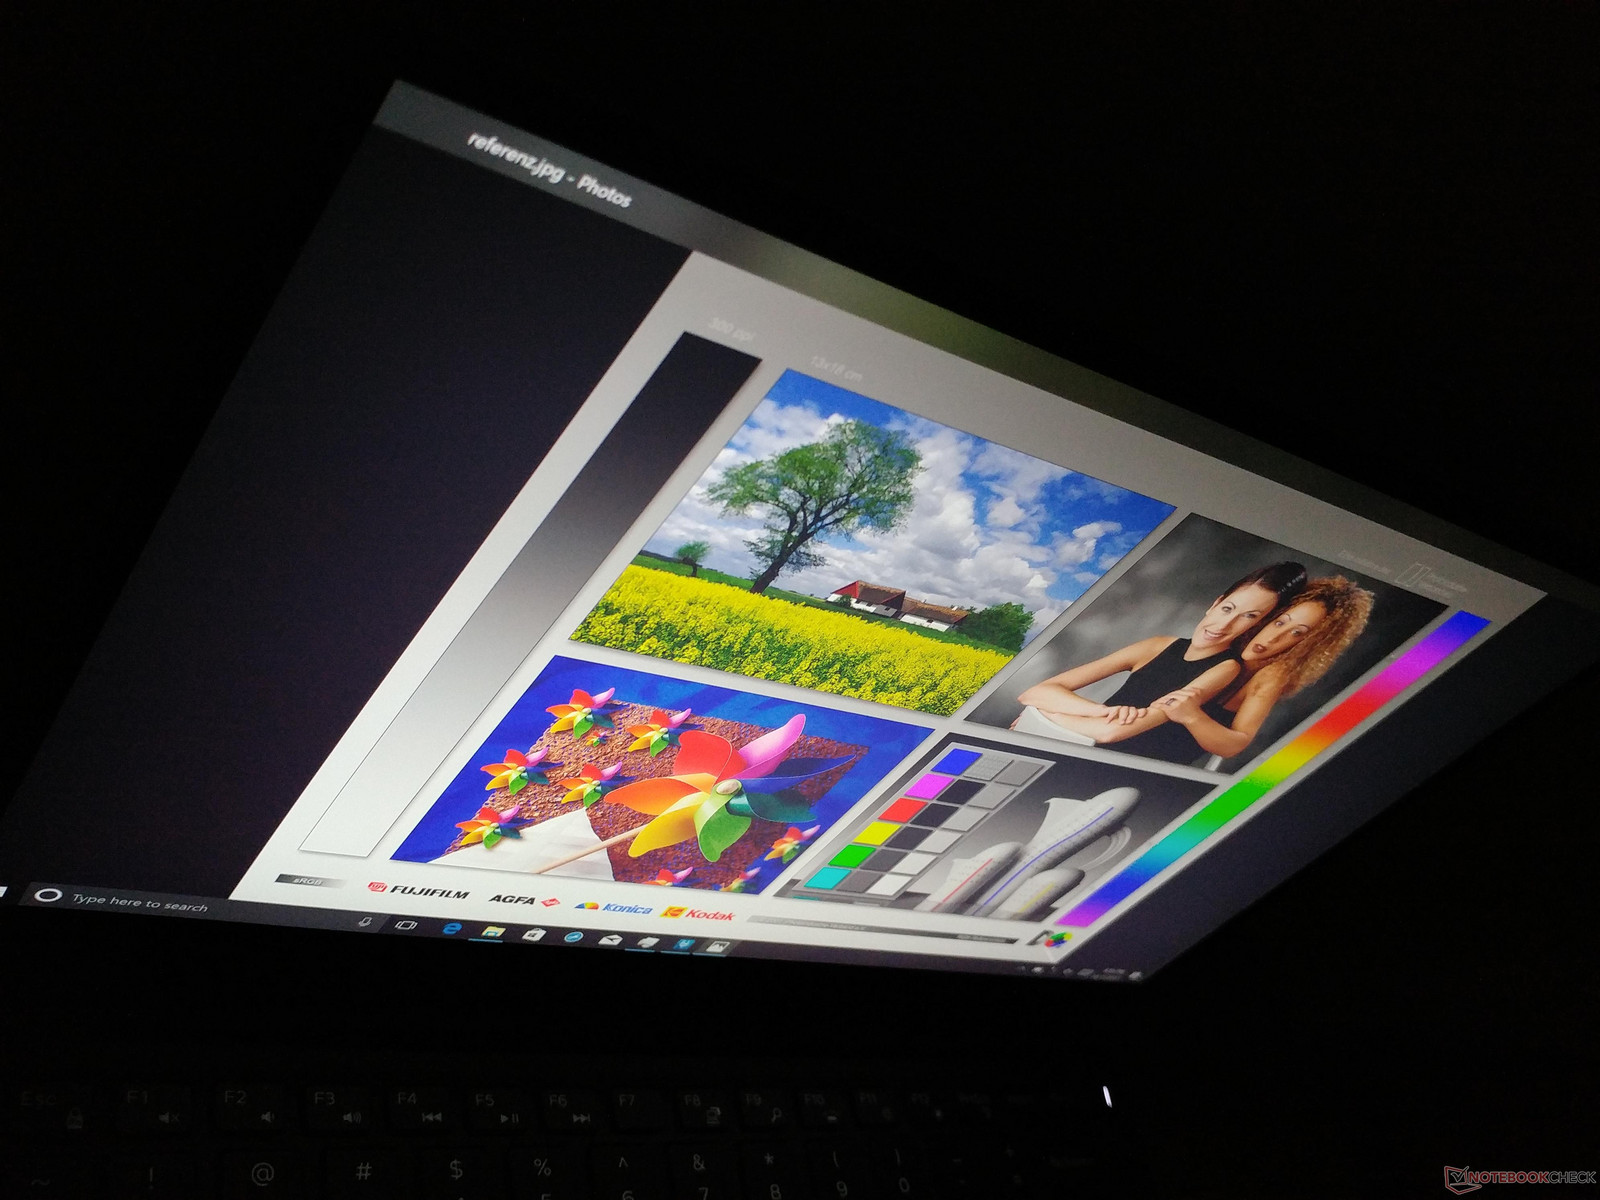
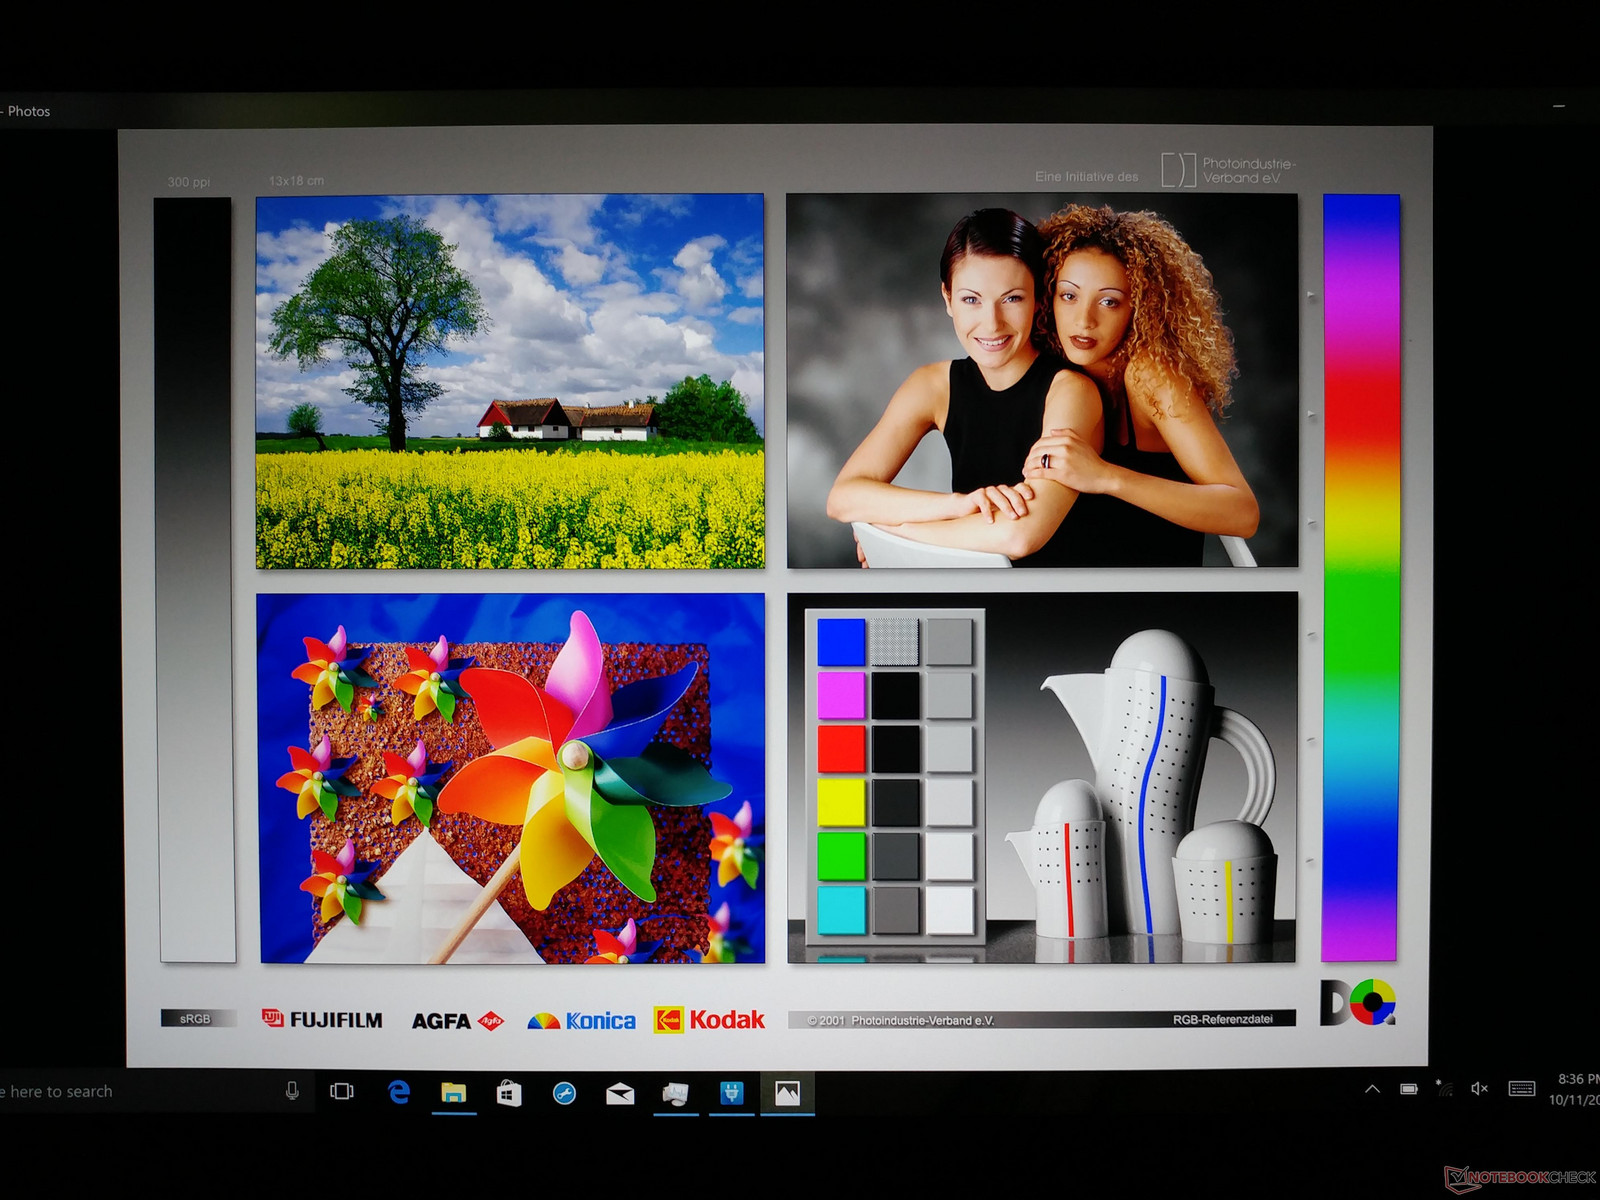
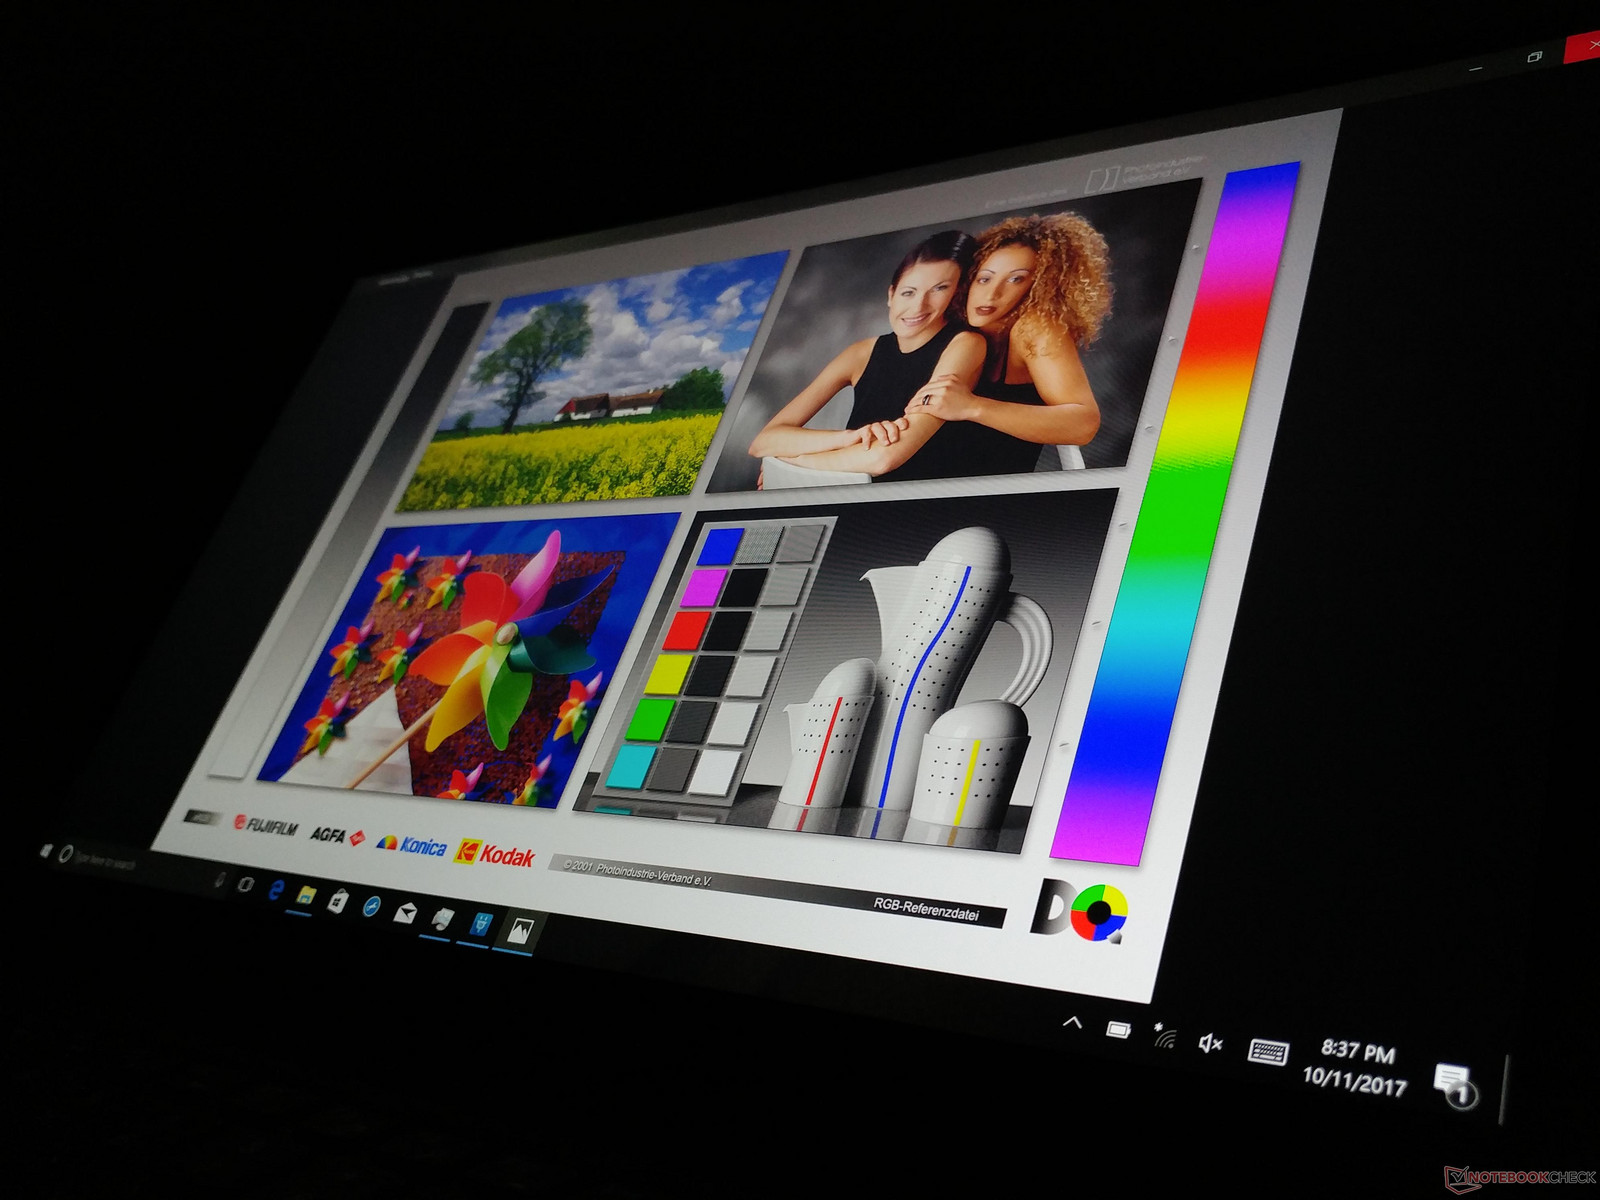
The new XPS 13 utilizes the same SHP144A IGZO touchscreen from Sharp as on the older XPS 13 for a nearly identical viewing experience. Brightness, color gamut, gamma, and response times are quite similar while grayscale is a bit cooler on the new model. The panel remains competitive when up against the lower resolution Chi Mei and AU Optronics panels on the MateBook X and ZenBook Flip S, respectively.
We are able to detect a very high pulse-width modulation of 19.69 KHz on all brightness levels including on the maximum setting. Dell has confirmed with us that this is normal behavior for the XPS 13 and that most users will not notice the flickering since the frequency is so high. Note that we recorded no PWM on last year’s QHD+ XPS 13 as we’ve since updated to more sensitive instrumentation.
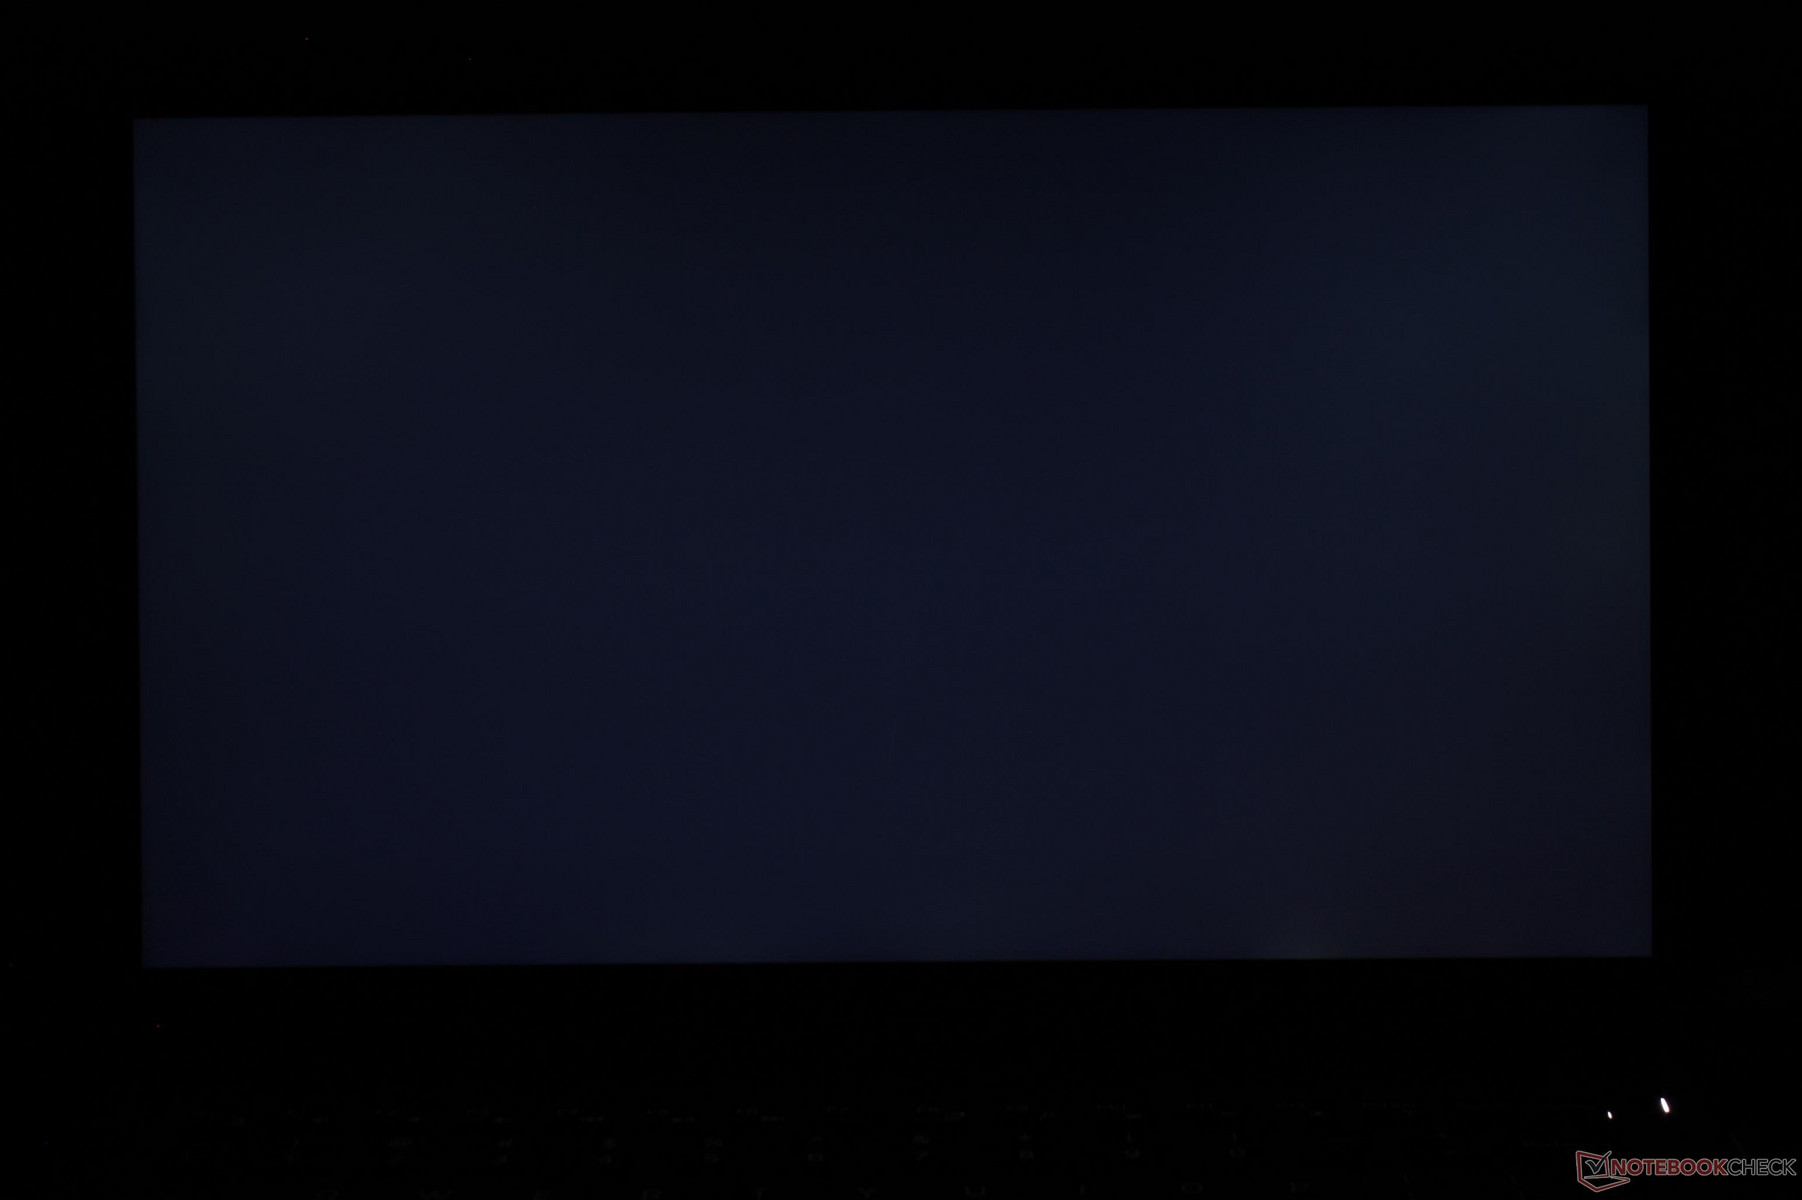
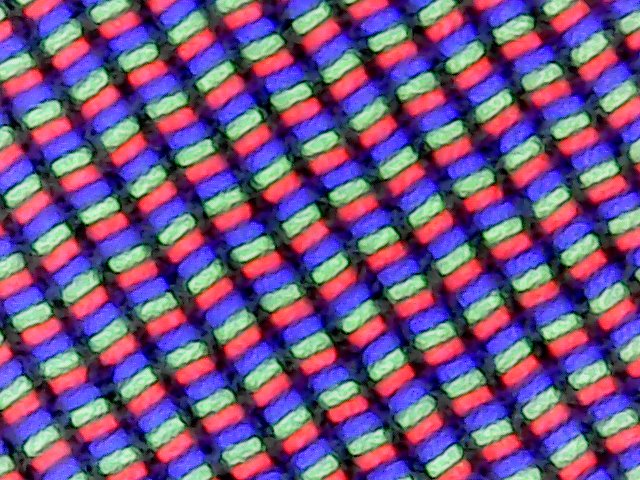
Subjectively, text and images appear very sharp owing to the high pixel count from the uncommon 1800p native resolution. Graininess is not an issue on the glossy panel and backlight bleeding is kept to a minimum.
| |||||||||||||||||||||||||
Brightness Distribution: 83 %
Center on Battery: 386.1 cd/m²
Contrast: 1170:1 (Black: 0.33 cd/m²)
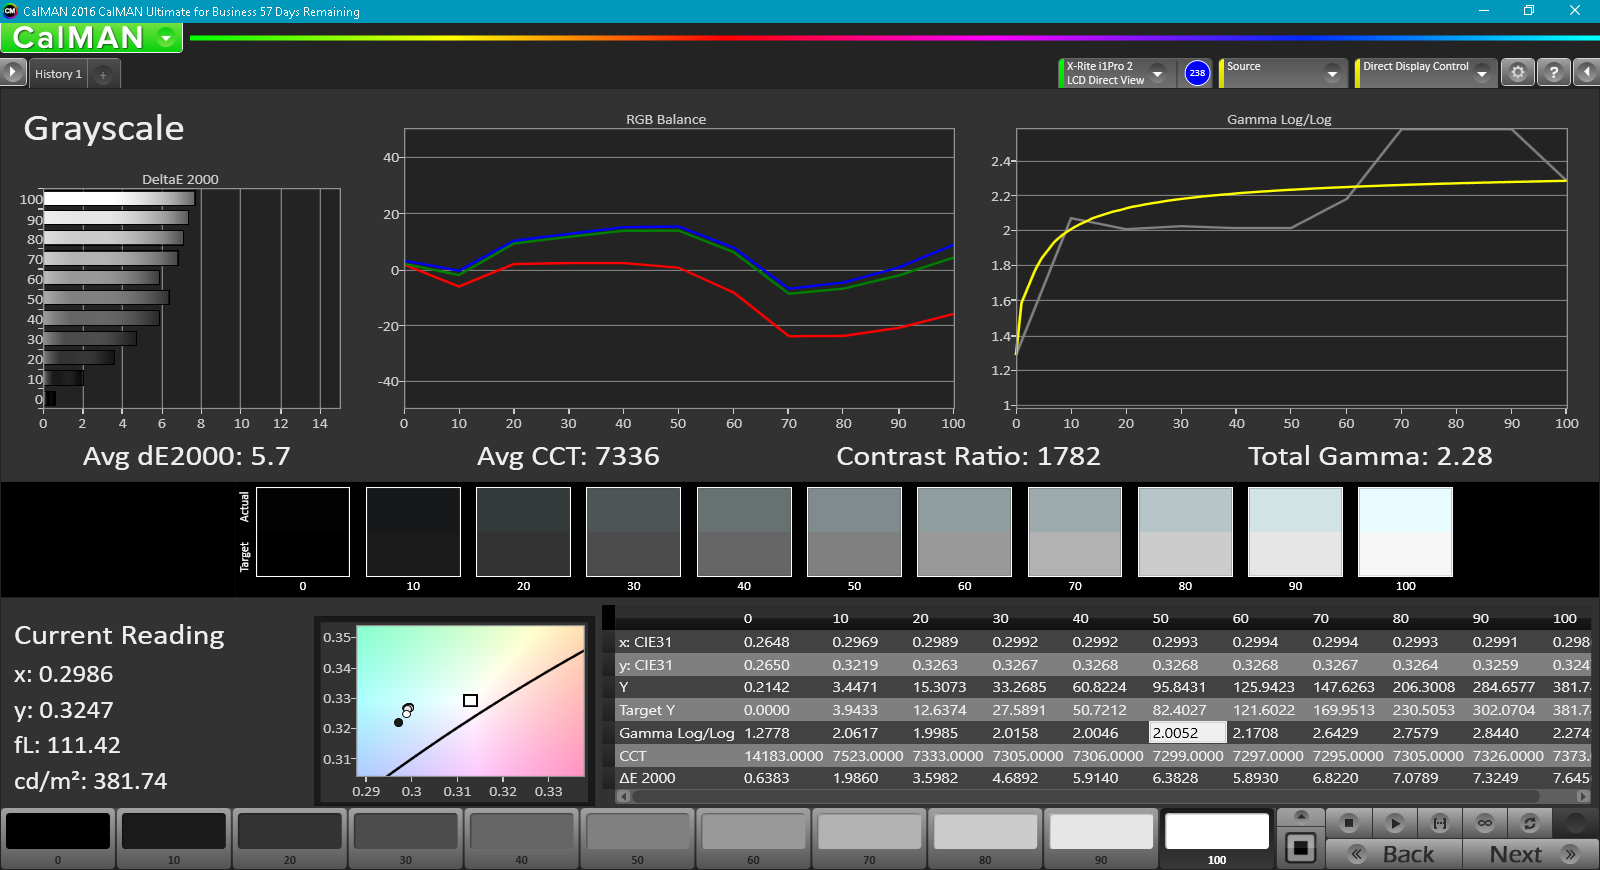
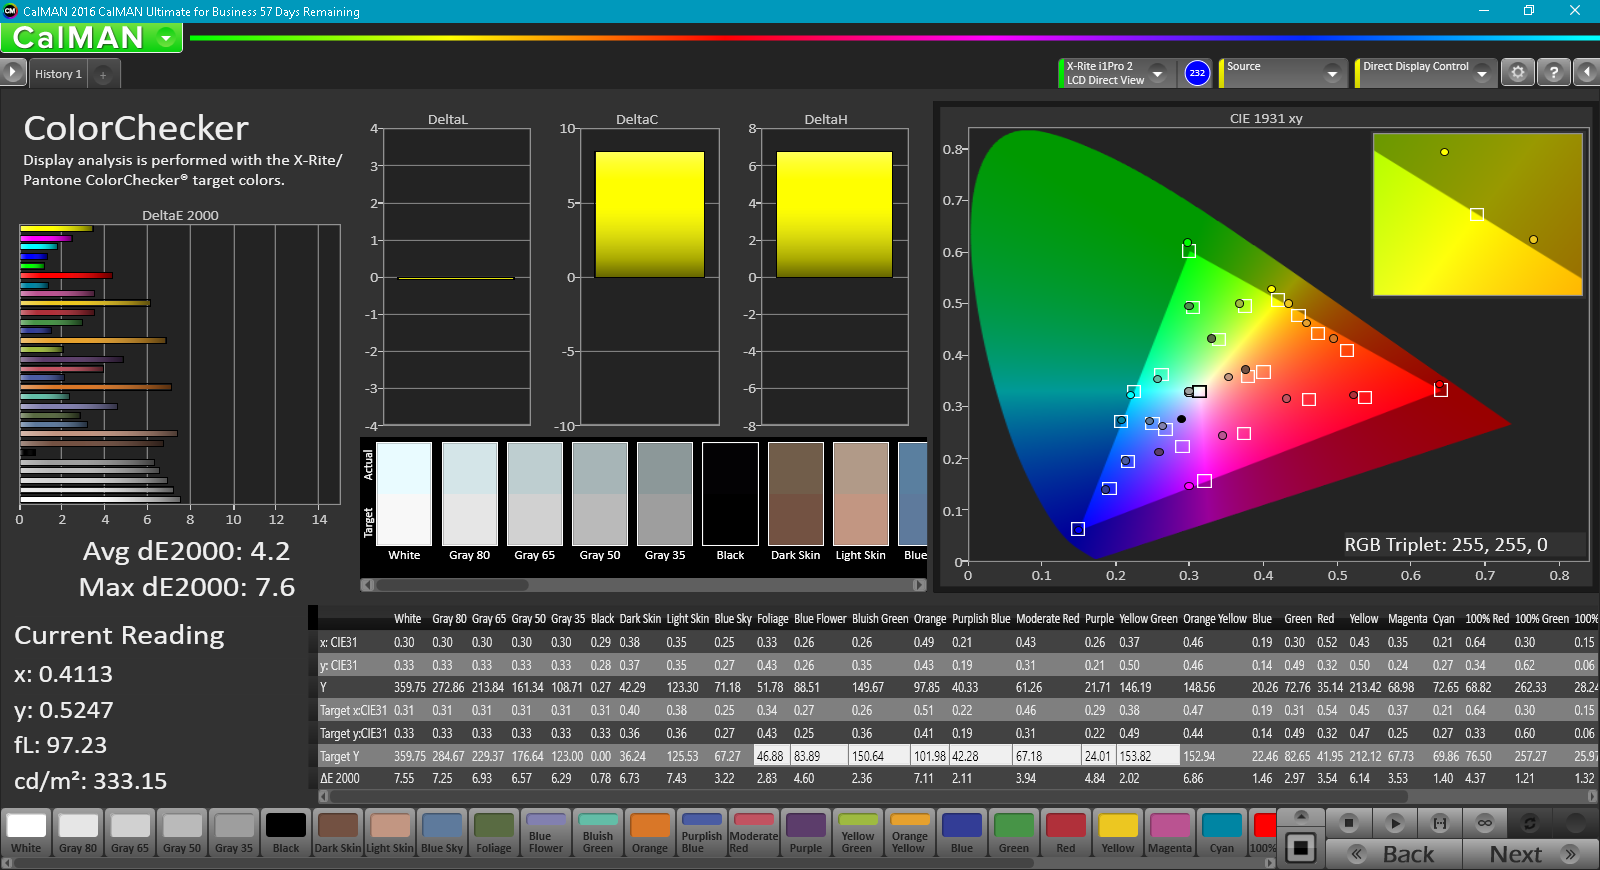
ΔE ColorChecker Calman: 4.2 | ∀{0.5-29.43 Ø4.73}
ΔE Greyscale Calman: 5.7 | ∀{0.09-98 Ø4.97}
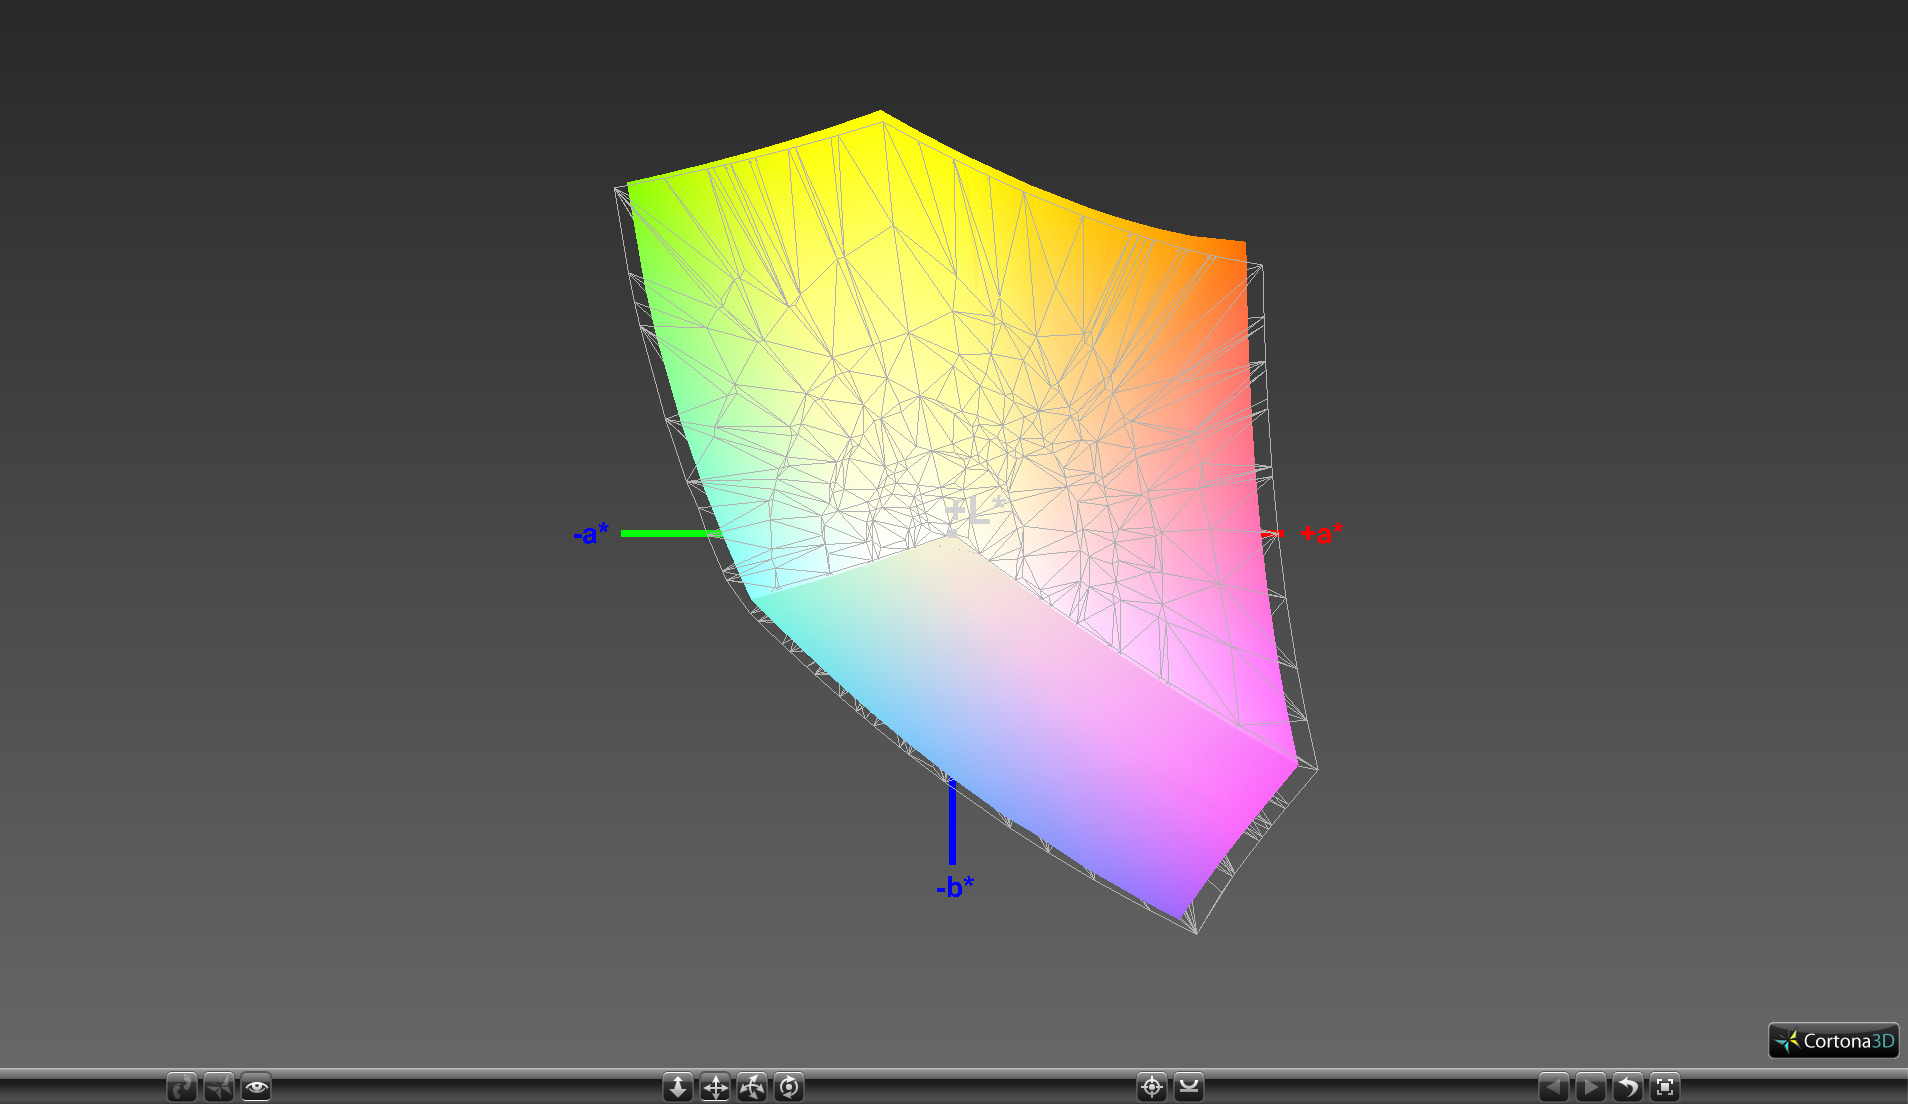
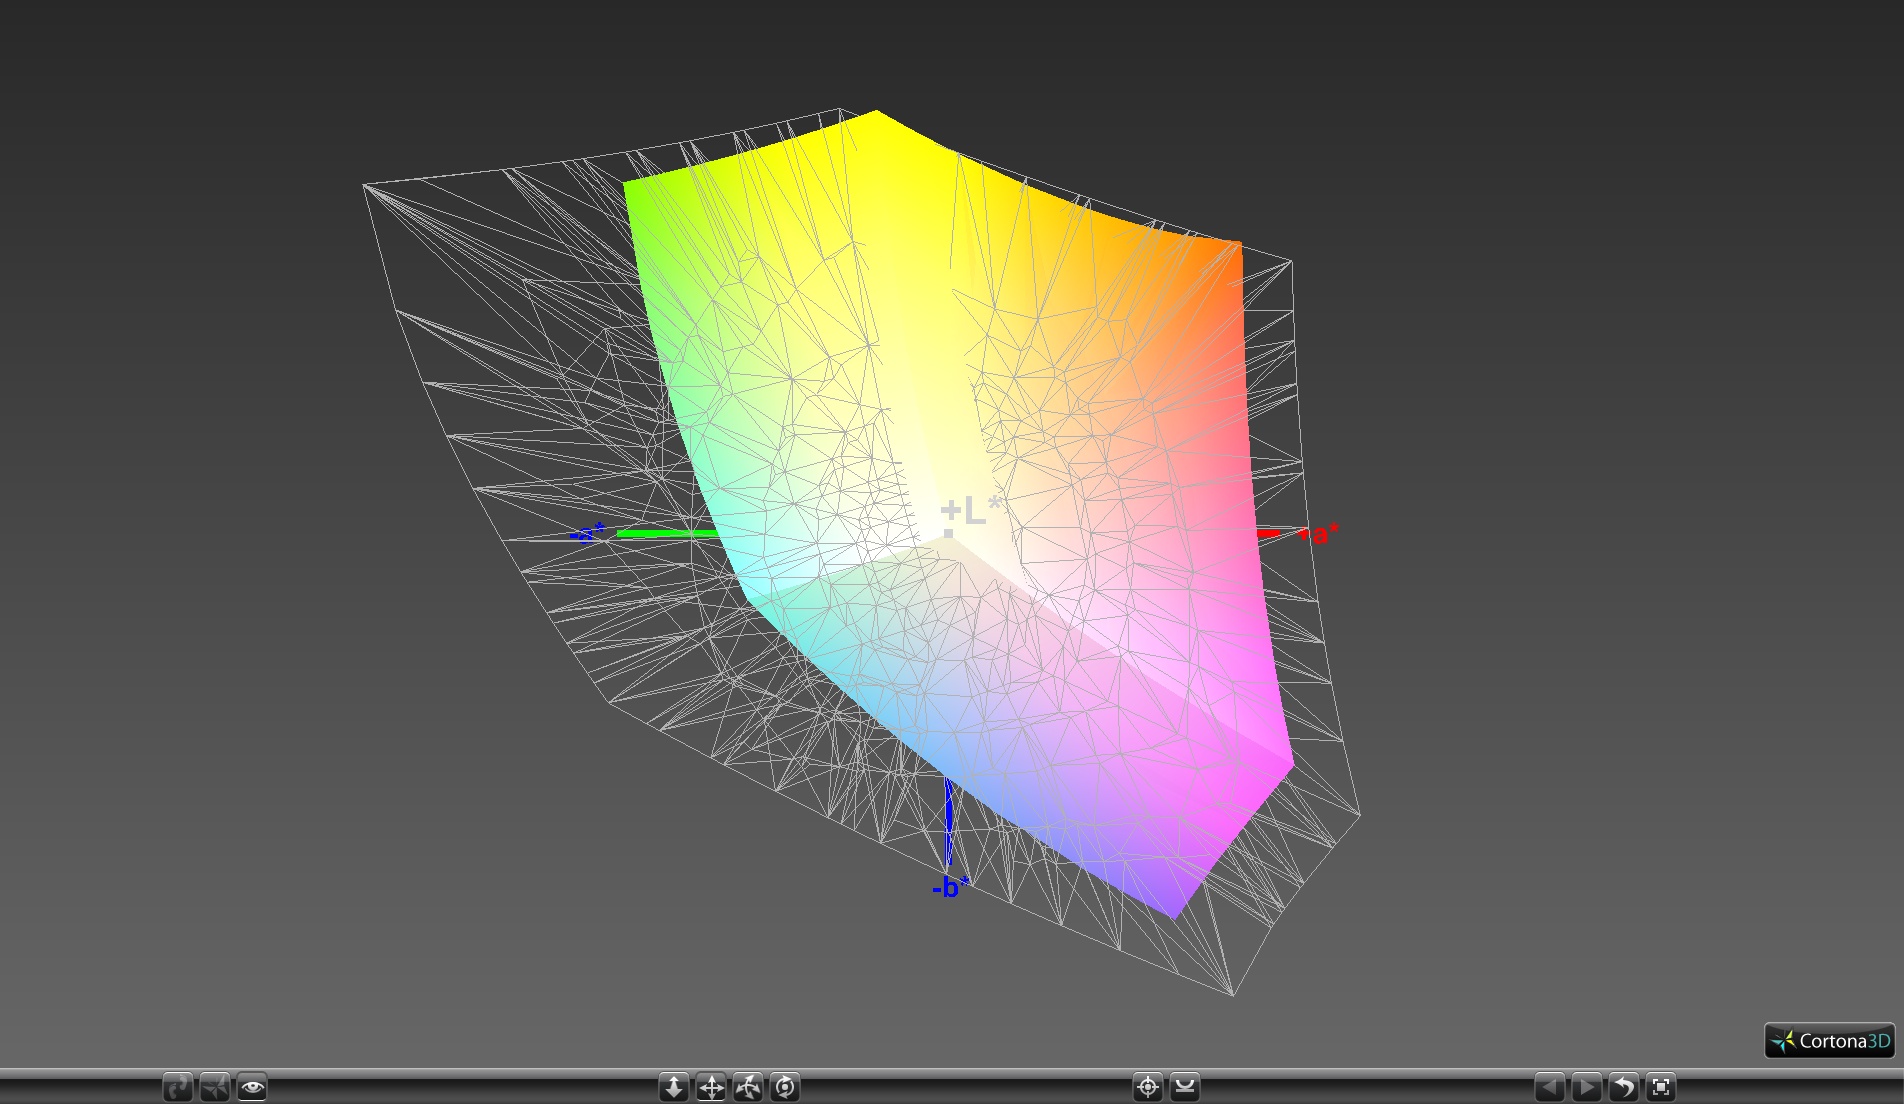
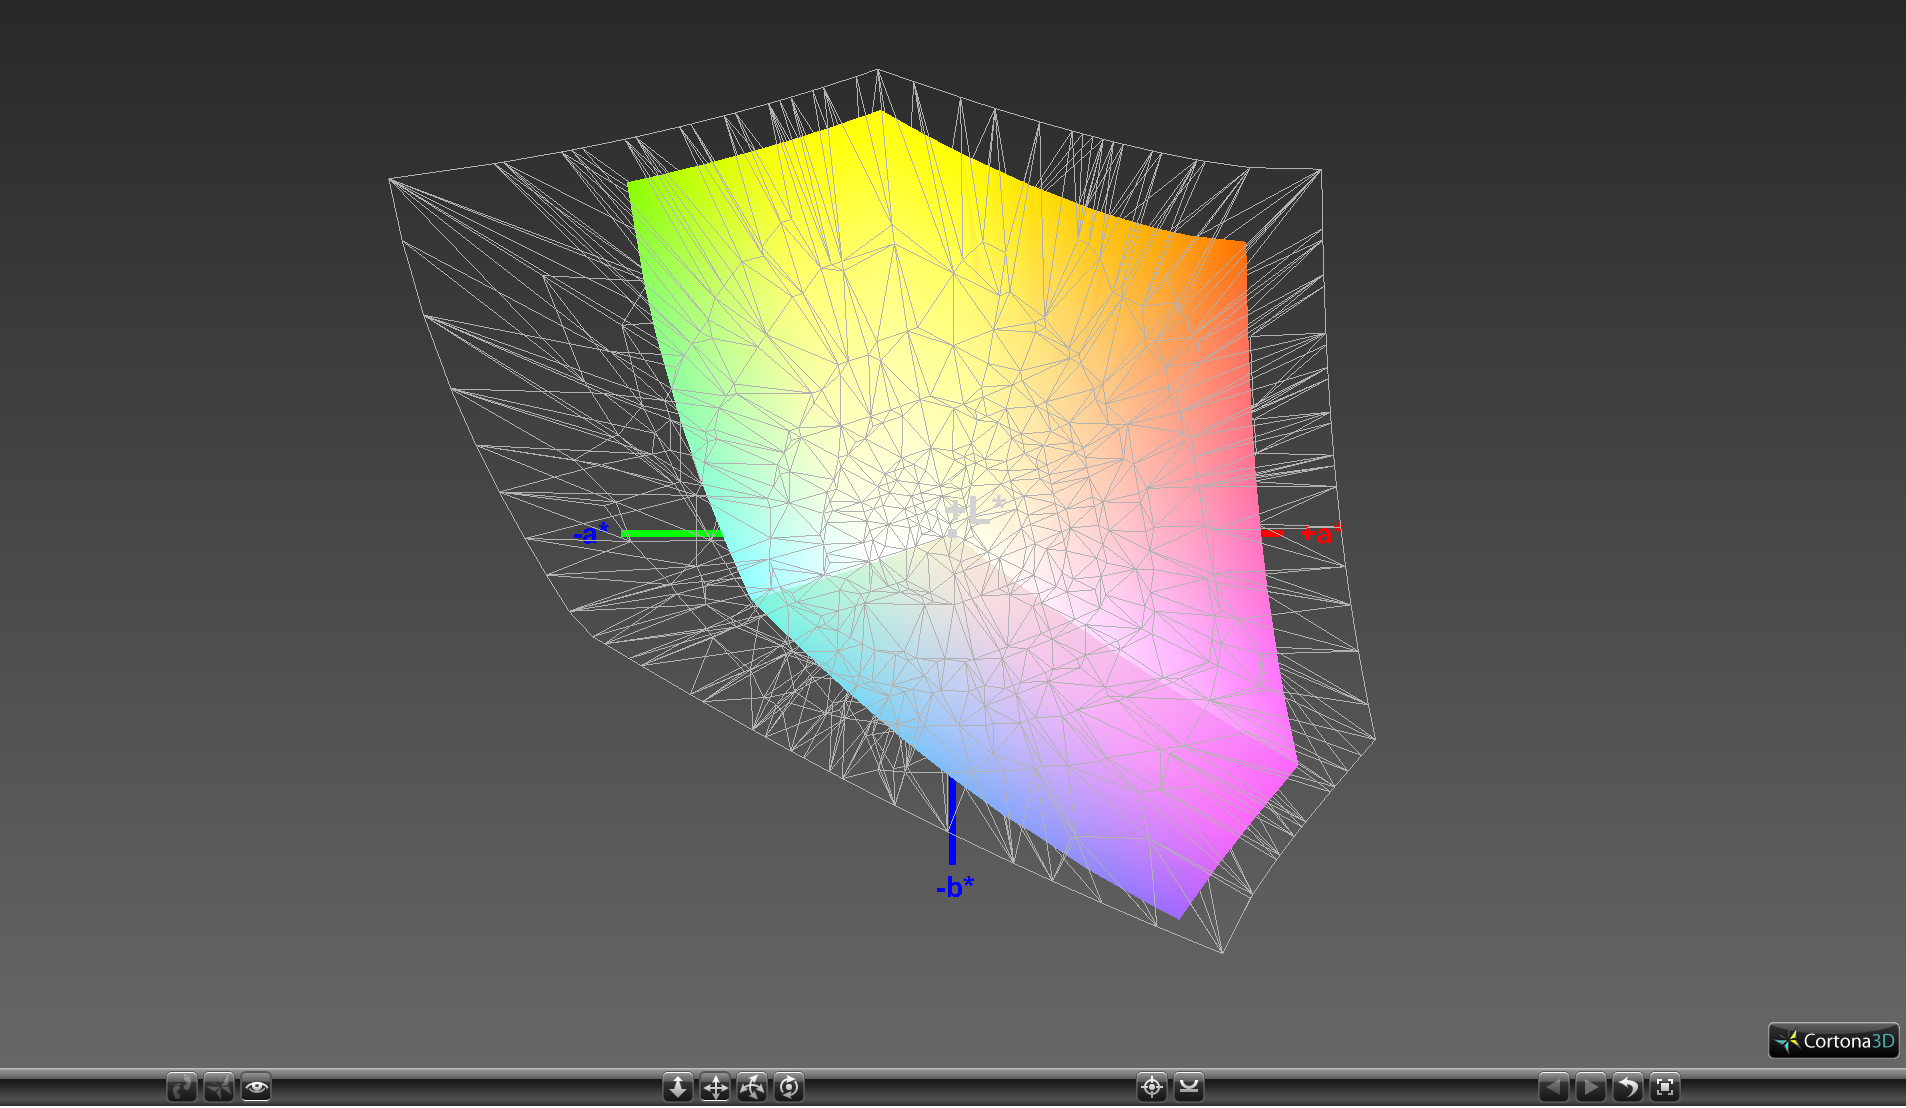
92.2% sRGB (Argyll 1.6.3 3D)
59% AdobeRGB 1998 (Argyll 1.6.3 3D)
65.4% AdobeRGB 1998 (Argyll 3D)
93% sRGB (Argyll 3D)
63.6% Display P3 (Argyll 3D)
Gamma: 2.28
CCT: 7336 K
| Dell XPS 13 i7-8550U ID: Sharp SHP144A, Name: LQ133Z1, IGZO IPS, 13.3", 3200x1800 | Samsung Notebook 9 NP900X3N-K01US ID: BOE06E1, Name: NV133FHB-N31, IPS, 13.3", 1920x1080 | Huawei MateBook X Chi Mei CMN8201 / P130ZDZ-EF1, , 13.3", 2160x1440 | Asus ZenBook Flip S UX370 AUO B133HAN04.2, a-Si TFT-LCD, WLED, 13.3", 1920x1080 | Razer Blade Stealth QHD i7-7500U Sharp SHP142F (LQ125T1JW02), , 12.5", 2560x1440 | Dell XPS 13 9360 QHD+ i7 Sharp SHP144A, IPS, 13.3", 3200x1800 | |
|---|---|---|---|---|---|---|
| Display | -2% | 3% | -1% | 6% | -2% | |
| Display P3 Coverage (%) | 63.6 | 63.4 0% | 65.8 3% | 64 1% | 68.7 8% | 62.8 -1% |
| sRGB Coverage (%) | 93 | 88.6 -5% | 96.2 3% | 90 -3% | 95.8 3% | 89.4 -4% |
| AdobeRGB 1998 Coverage (%) | 65.4 | 64 -2% | 66.8 2% | 64.9 -1% | 69.9 7% | 64.6 -1% |
| Response Times | -21% | 10% | -16% | -14% | -15% | |
| Response Time Grey 50% / Grey 80% * (ms) | 35.6 ? | 41.6 ? -17% | 33 ? 7% | 44 ? -24% | 37 ? -4% | 43.6 ? -22% |
| Response Time Black / White * (ms) | 27.2 ? | 34 ? -25% | 24 ? 12% | 29 ? -7% | 33.4 ? -23% | 29.2 ? -7% |
| PWM Frequency (Hz) | 19690 ? | 210.1 ? | 200 ? | |||
| Screen | 4% | 17% | 7% | 1% | 8% | |
| Brightness middle (cd/m²) | 386.1 | 510.7 32% | 408 6% | 334 -13% | 402 4% | 396.2 3% |
| Brightness (cd/m²) | 357 | 481 35% | 395 11% | 321 -10% | 382 7% | 357 0% |
| Brightness Distribution (%) | 83 | 90 8% | 88 6% | 86 4% | 88 6% | 84 1% |
| Black Level * (cd/m²) | 0.33 | 0.66 -100% | 0.45 -36% | 0.25 24% | 0.45 -36% | 0.266 19% |
| Contrast (:1) | 1170 | 774 -34% | 907 -22% | 1336 14% | 893 -24% | 1489 27% |
| Colorchecker dE 2000 * | 4.2 | 2.4 43% | 1.55 63% | 4.24 -1% | 3.6 14% | 3.9 7% |
| Colorchecker dE 2000 max. * | 7.6 | 7.3 4% | 2.19 71% | 6.03 21% | 7.5 1% | 7.58 -0% |
| Greyscale dE 2000 * | 5.7 | 2.4 58% | 1.91 66% | 3.92 31% | 4.3 25% | 4.16 27% |
| Gamma | 2.28 96% | 2.23 99% | 2.34 94% | 2.68 82% | 2.1 105% | 2.31 95% |
| CCT | 7336 89% | 6747 96% | 6491 100% | 6758 96% | 6572 99% | 6514 100% |
| Color Space (Percent of AdobeRGB 1998) (%) | 59 | 57 -3% | 61 3% | 58 -2% | 62.3 6% | 57.5 -3% |
| Color Space (Percent of sRGB) (%) | 92.2 | 88.1 -4% | 96 4% | 90 -2% | 95.7 4% | 88.7 -4% |
| Total Average (Program / Settings) | -6% /
-1% | 10% /
13% | -3% /
2% | -2% /
-0% | -3% /
3% |
* ... smaller is better
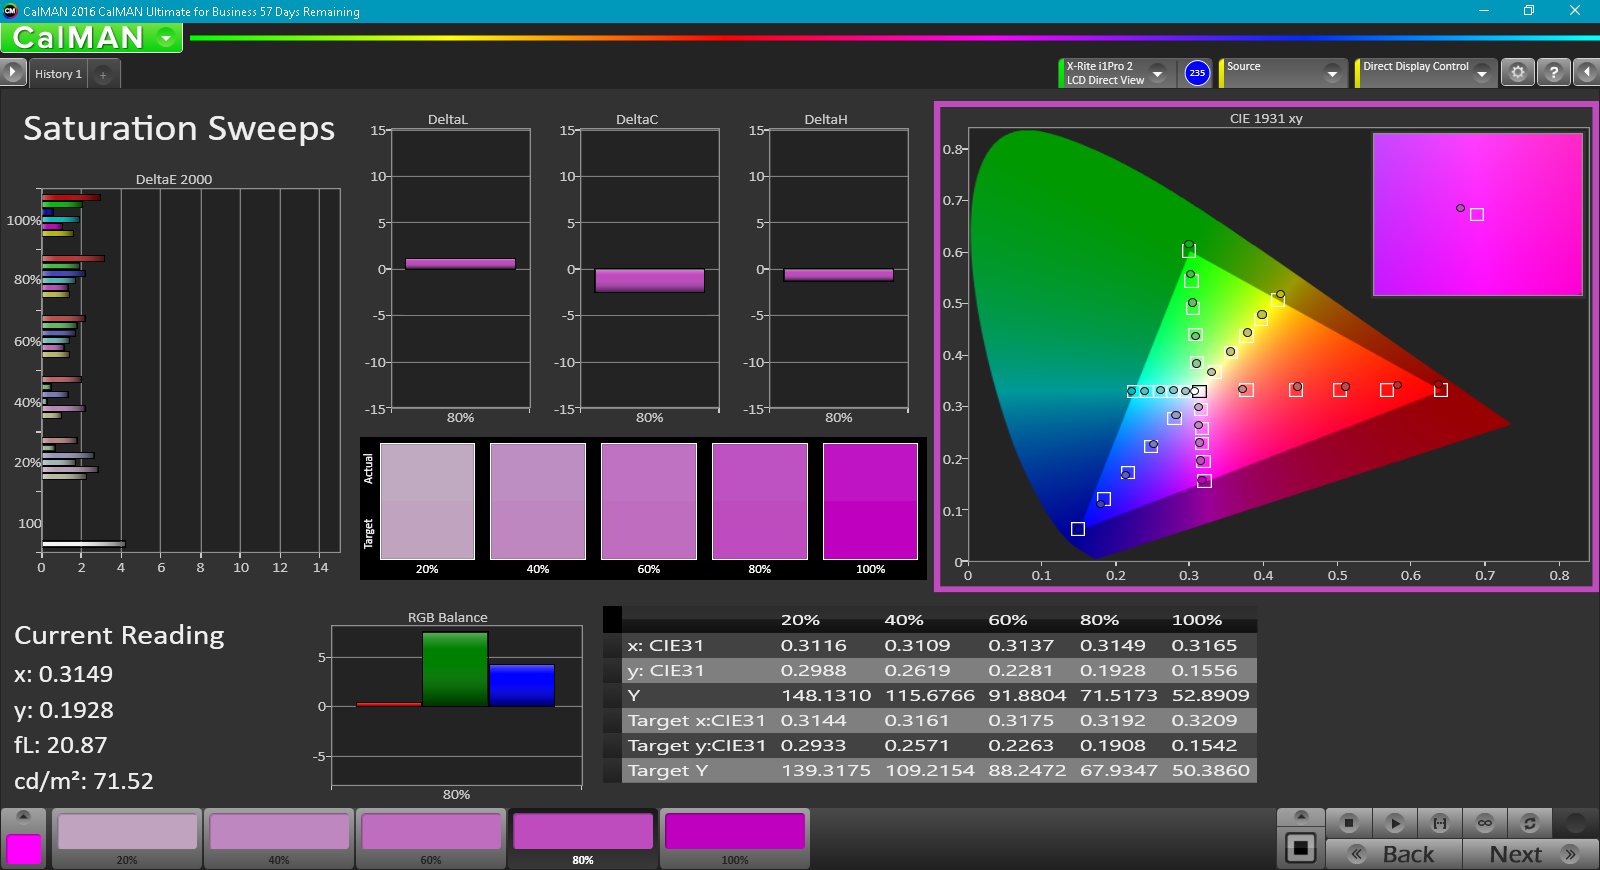
Color space is approximately 92 percent and 59 percent of the sRGB and AdobeRGB standards, respectively. The IGZO panel on the larger 4K UHD XPS 15 has a significantly wider gamut for full sRGB coverage if color accuracy is a priority.
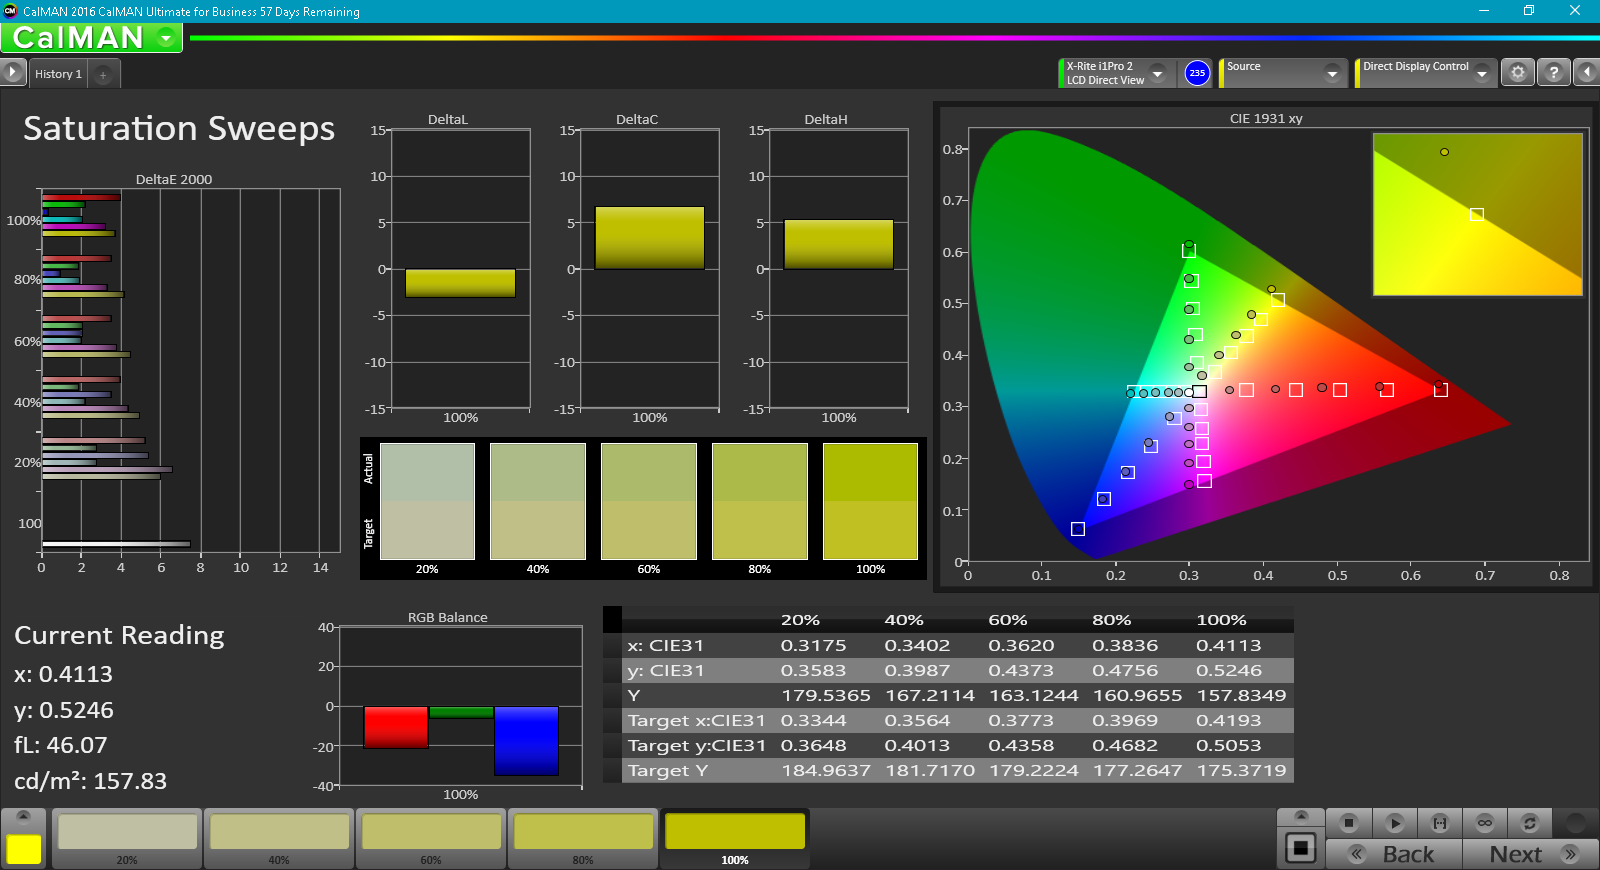
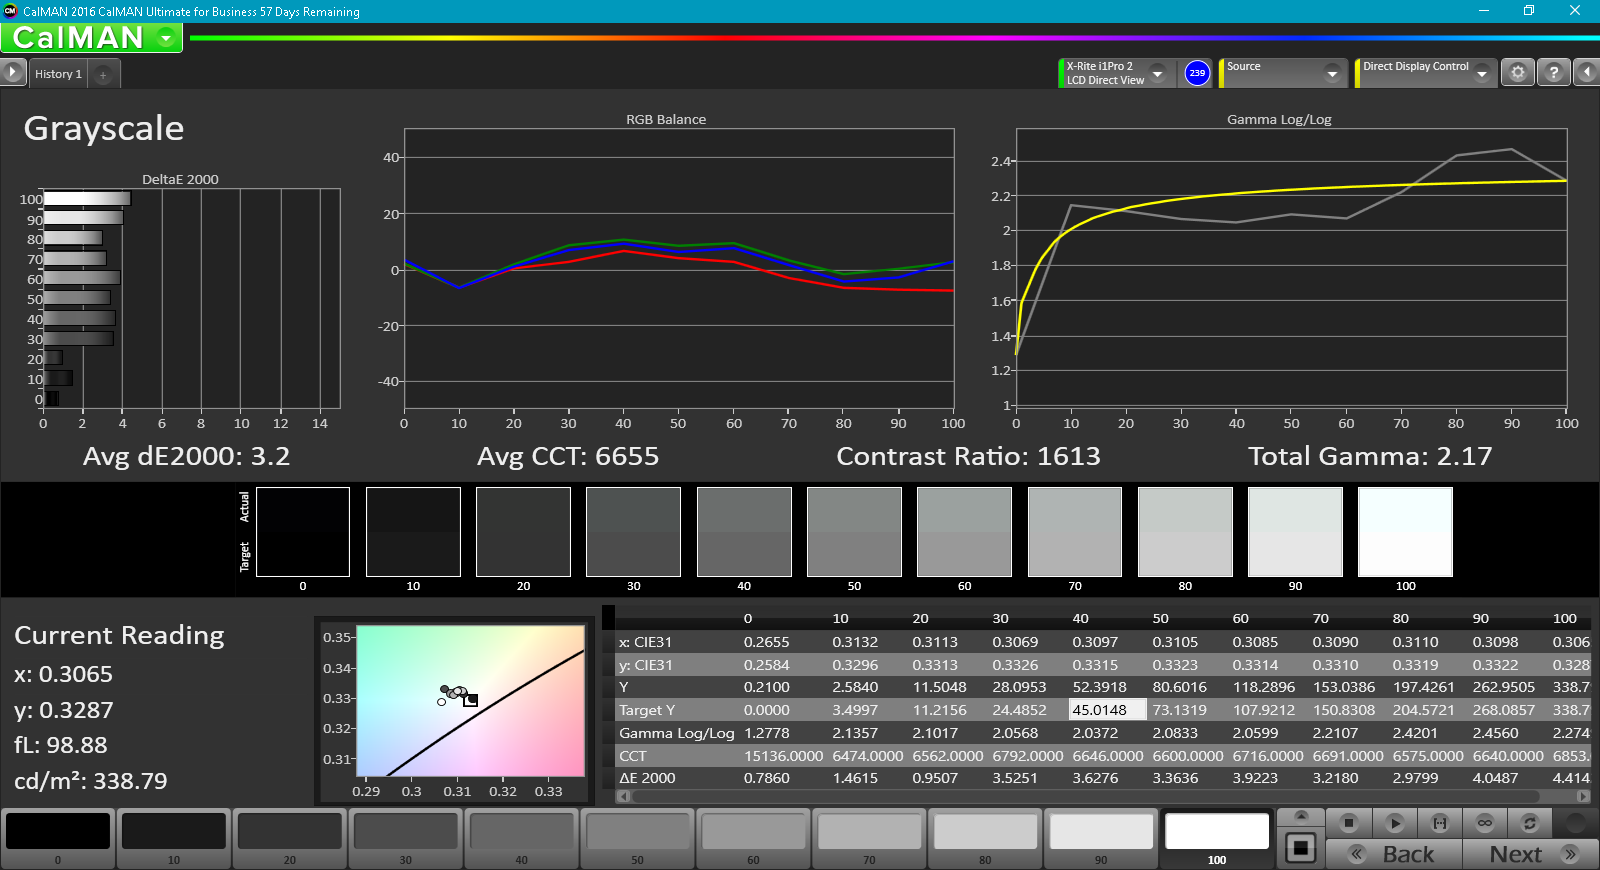
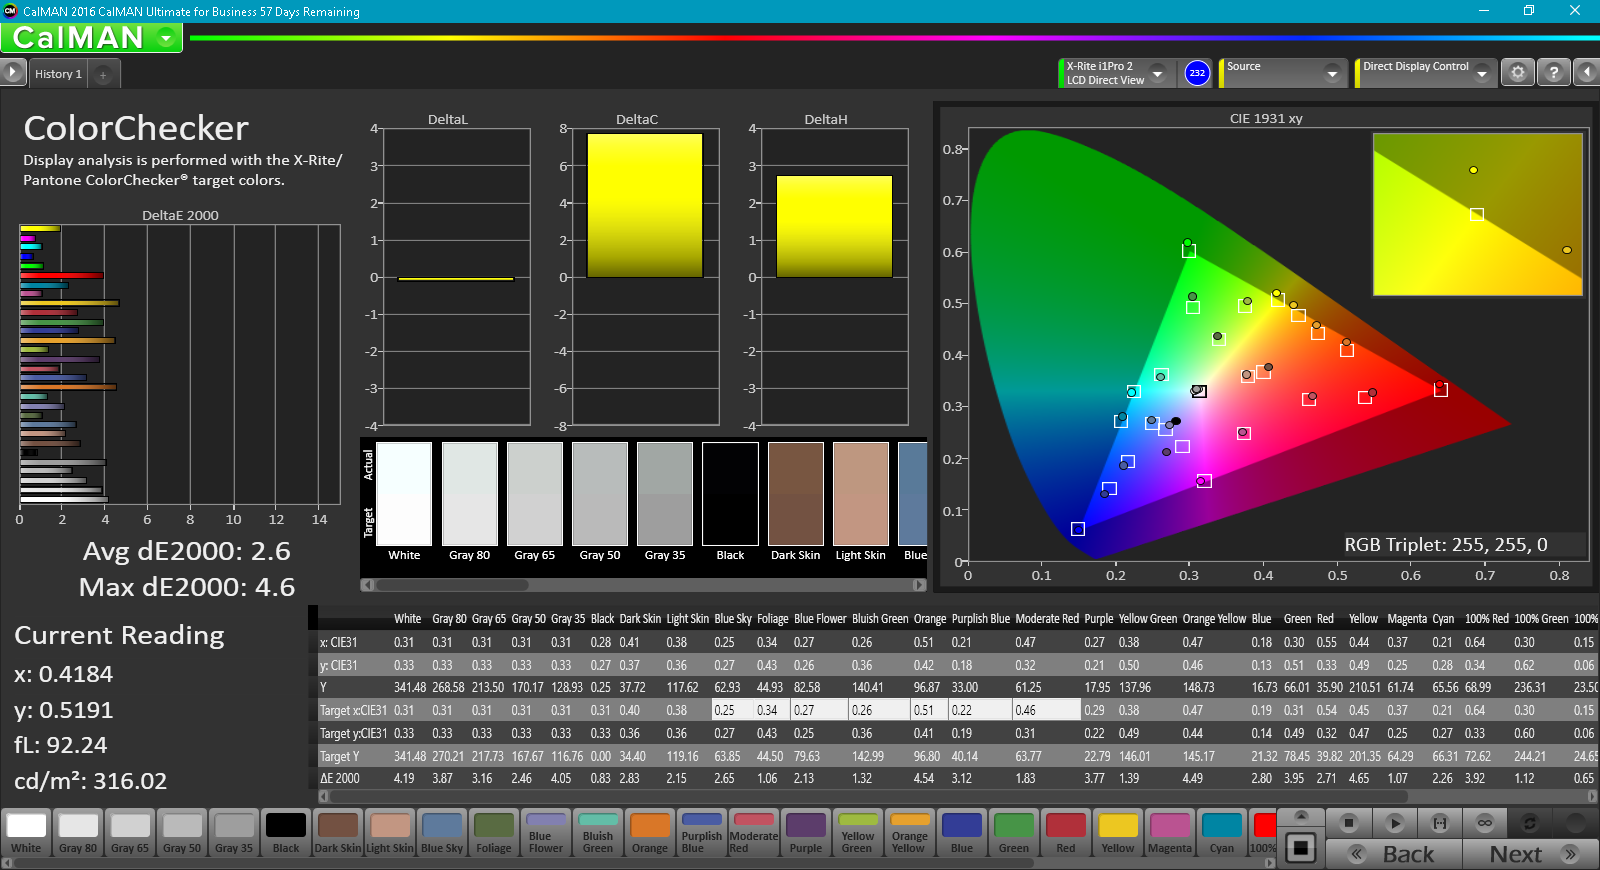
X-Rite spectrophotometer measurements reveal an average grayscale with slightly inaccurate colors at lower saturation levels. The results would have been perfectly acceptable for a less expensive notebook, but this is a bit of a surprise for the XPS. Luckily, our calibration efforts both flatten RGB balance and lower color temperature for improved accuracy. Red is notably slightly less accurate than other colors at deeper saturation levels.
Display Response Times
| ↔ Response Time Black to White | ||
|---|---|---|
| 27.2 ms ... rise ↗ and fall ↘ combined | ↗ 16 ms rise | 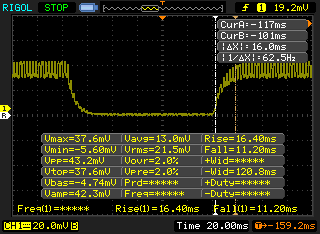 |
| ↘ 11.2 ms fall | ||
| The screen shows relatively slow response rates in our tests and may be too slow for gamers. In comparison, all tested devices range from 0.1 (minimum) to 240 (maximum) ms. » 69 % of all devices are better. This means that the measured response time is worse than the average of all tested devices (19.9 ms). | ||
| ↔ Response Time 50% Grey to 80% Grey | ||
| 35.6 ms ... rise ↗ and fall ↘ combined | ↗ 18.4 ms rise | 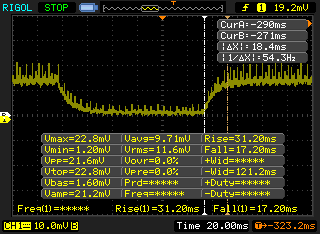 |
| ↘ 17.2 ms fall | ||
| The screen shows slow response rates in our tests and will be unsatisfactory for gamers. In comparison, all tested devices range from 0.165 (minimum) to 636 (maximum) ms. » 50 % of all devices are better. This means that the measured response time is worse than the average of all tested devices (31.1 ms). | ||
Screen Flickering / PWM (Pulse-Width Modulation)
| Screen flickering / PWM detected | 19690 Hz | ≤ 100 % brightness setting | 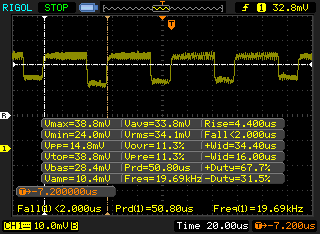 |
The display backlight flickers at 19690 Hz (worst case, e.g., utilizing PWM) Flickering detected at a brightness setting of 100 % and below. There should be no flickering or PWM above this brightness setting. The frequency of 19690 Hz is quite high, so most users sensitive to PWM should not notice any flickering. In comparison: 52 % of all tested devices do not use PWM to dim the display. If PWM was detected, an average of 7816 (minimum: 5 - maximum: 343500) Hz was measured. | |||
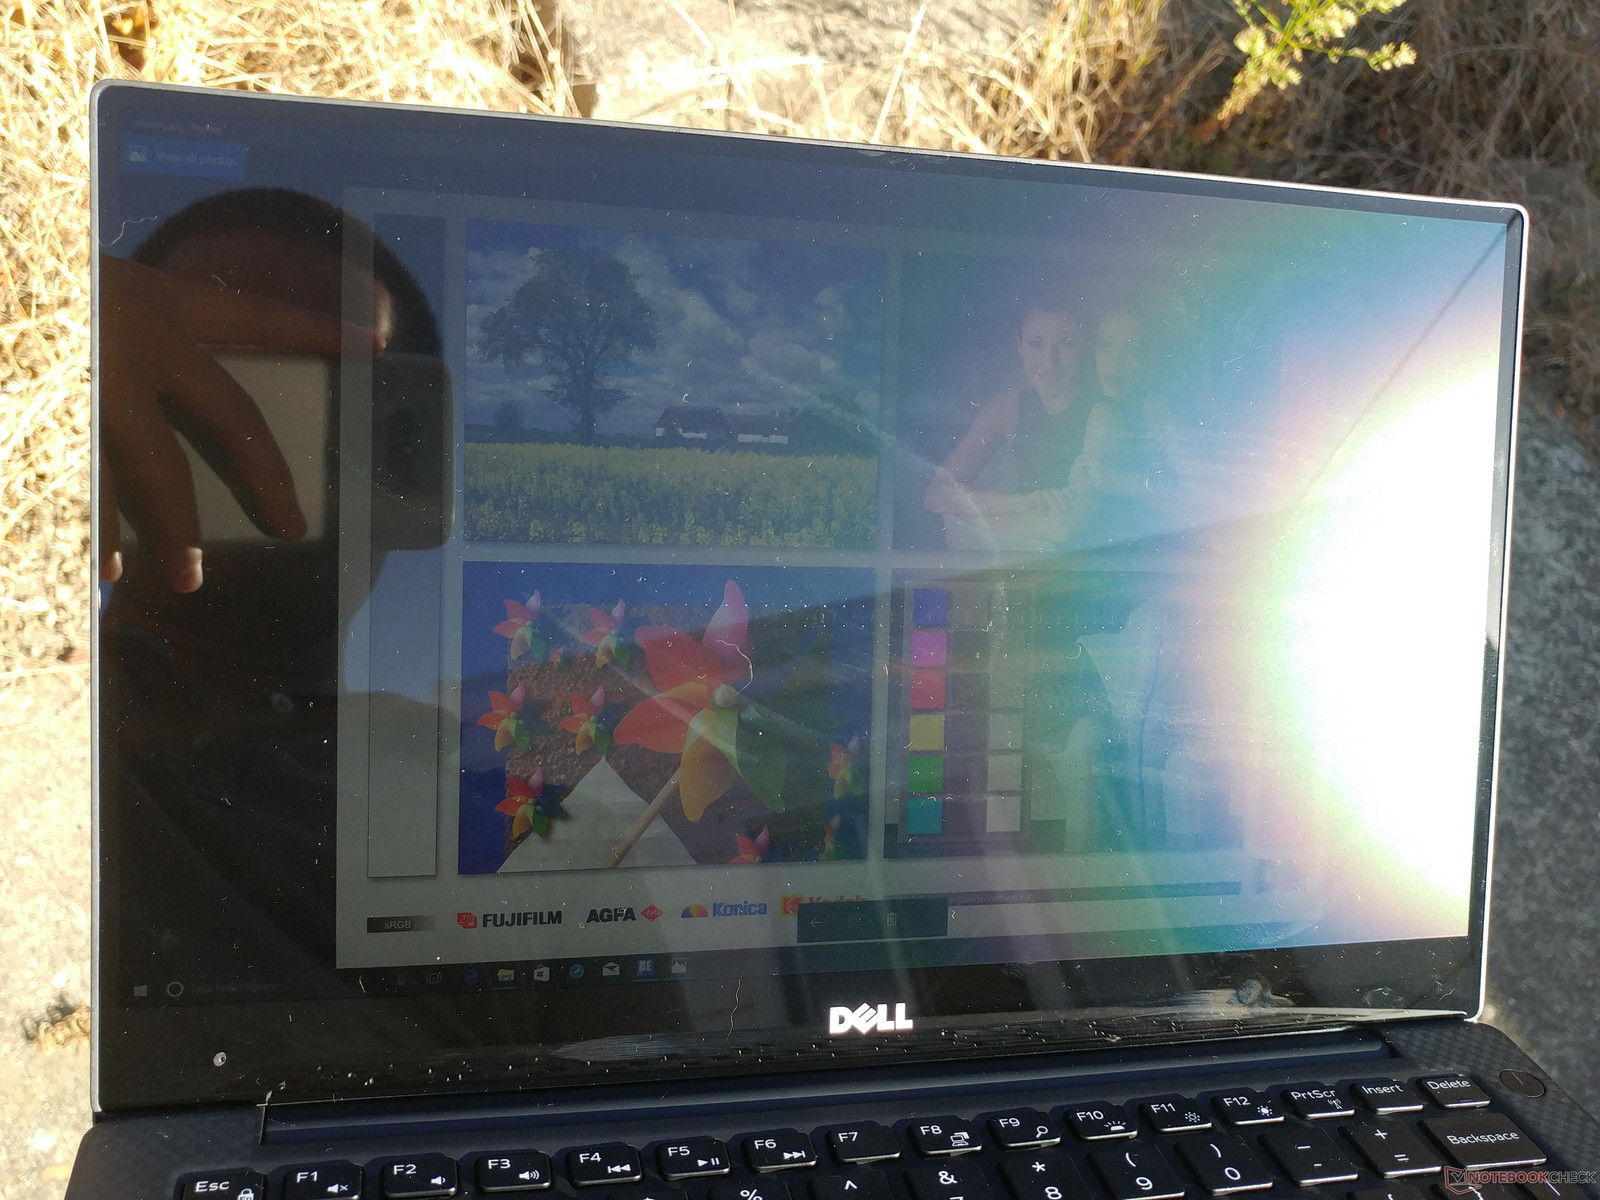
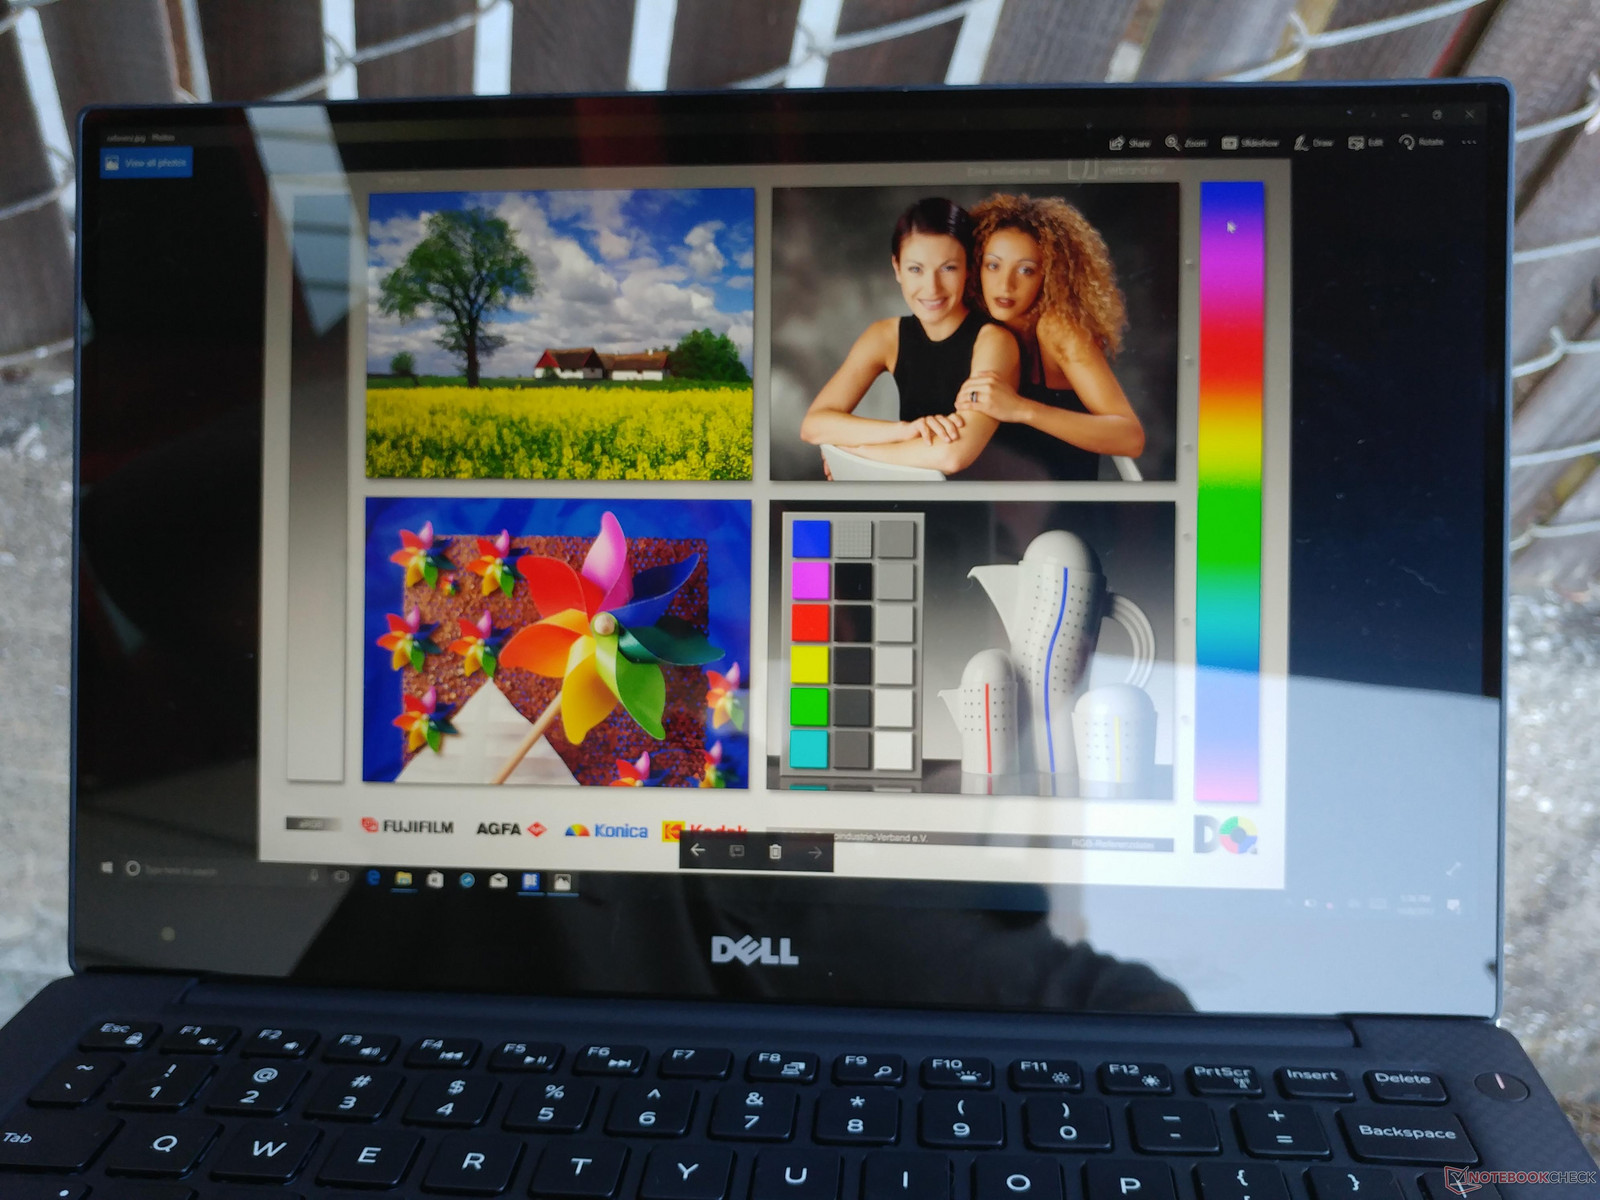
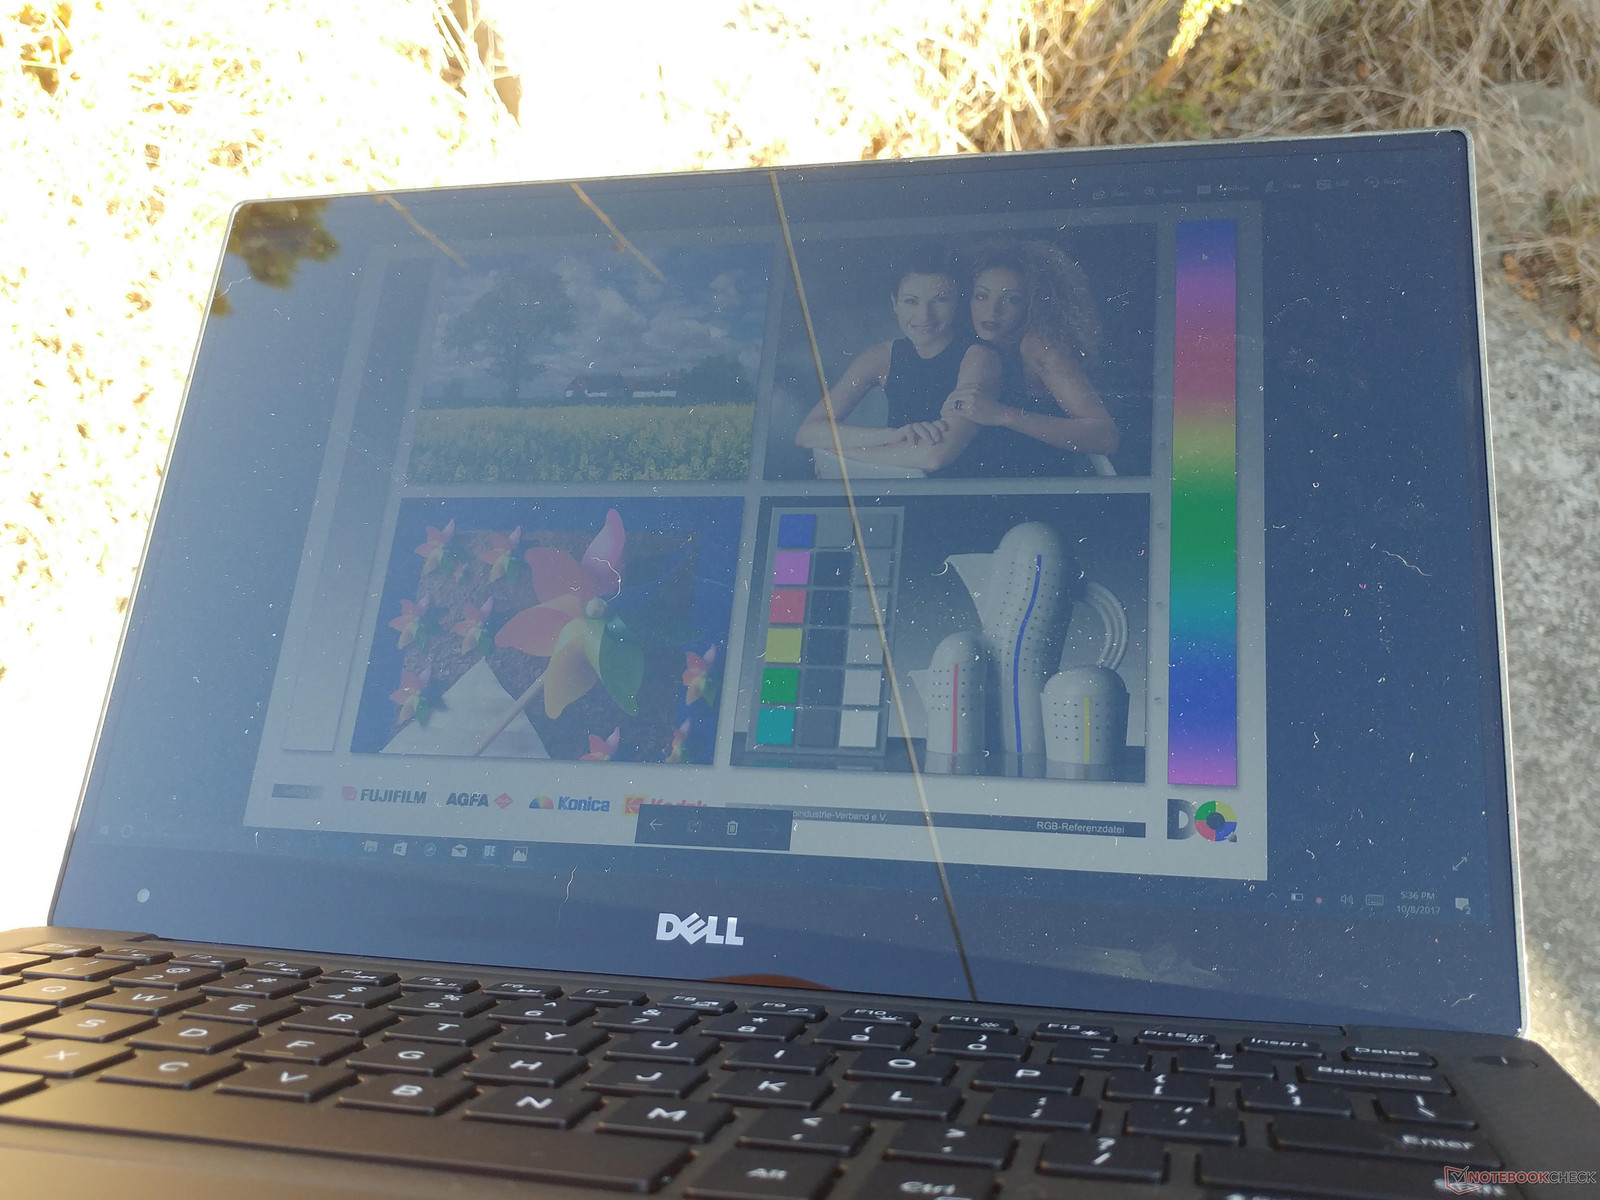
Outdoor visibility in unchanged. The glossy panel and dense pixel count work against the user in this case and we recommend cranking up the scaling to avoid squinting. The wide IPS viewing angles help in reducing glare as much as possible.
Performance
The Core i7-8550U is indubitably the star of the show. Dell could have easily skipped this late 2017 update and saved the 8th gen CPU for the early 2018 XPS 13 refresh, but the CPU update was likely necessary in order to remain competitive during the Holiday season. Other major manufacturers have already begun shipping notebooks sporting the same quad-core CPU including Lenovo, HP, Clevo, and Acer.
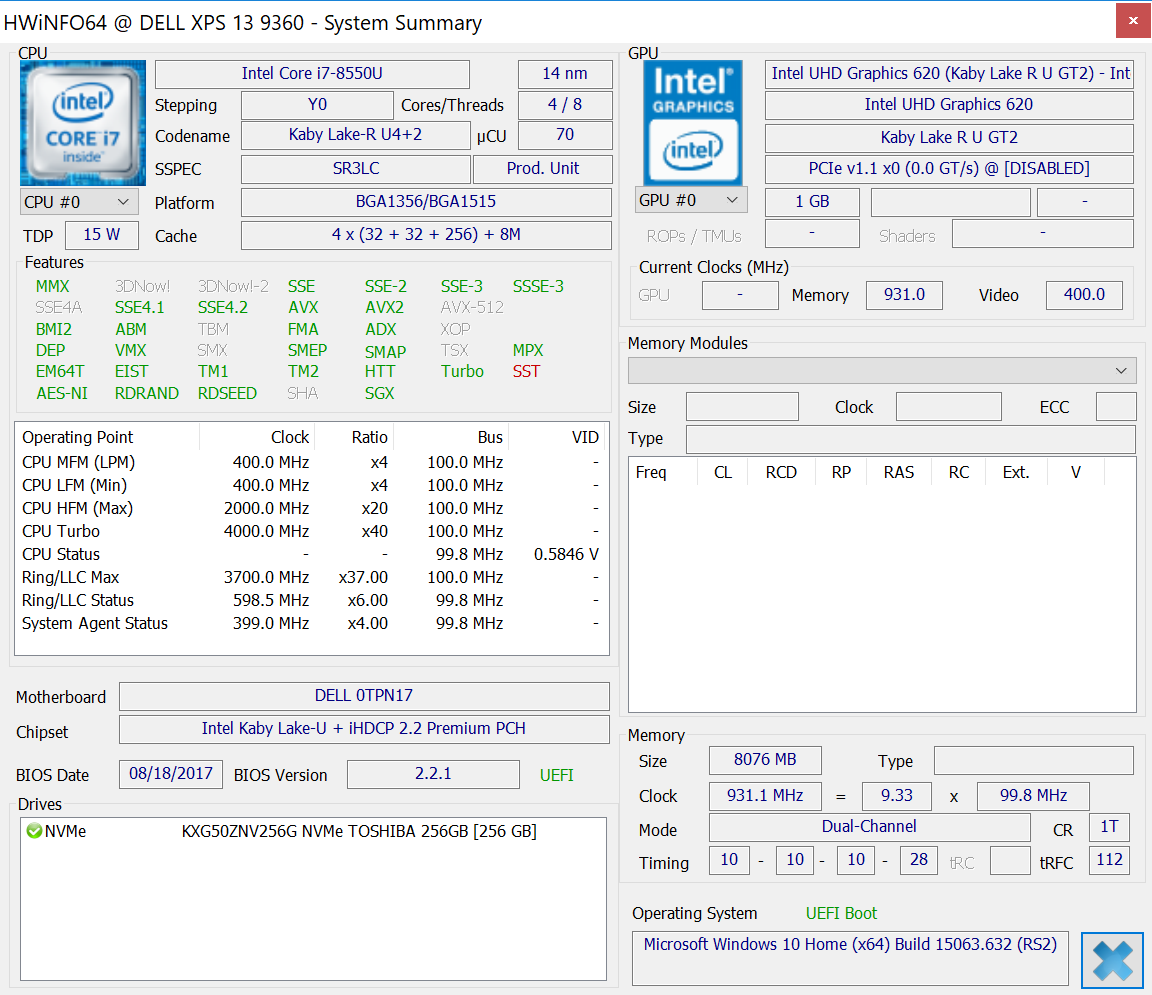
Processor
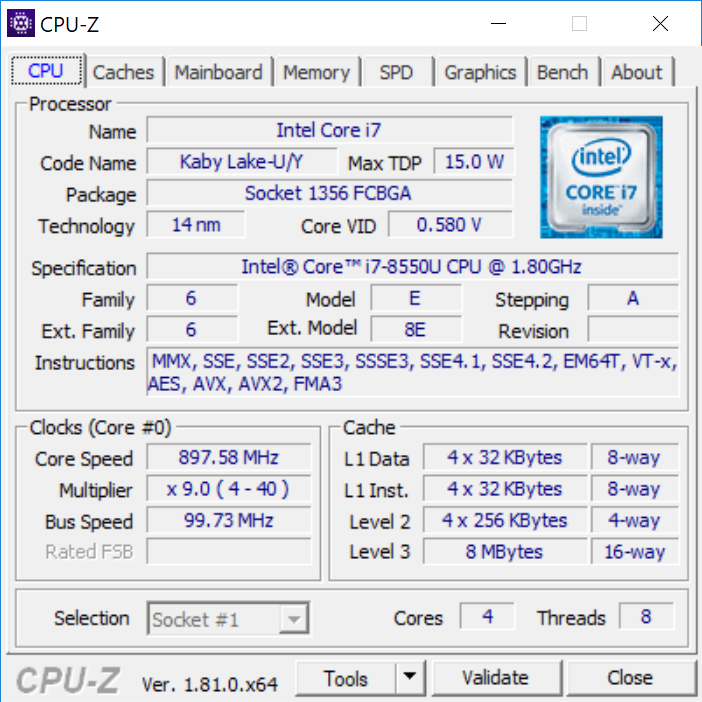
CPU performance should be the biggest reason to upgrade to the latest XPS 13. With a base clock of 1.8 GHz and a rated Turbo Boost of up to 4.0 GHz, the i7-8550U has a very wide operating range depending on the processing load and cooling solution. On the XPS 13, quad-core clock rates can be up to 3.7 GHz before quickly stabilizing at 2.5 GHz as shown in our Stress Test section.
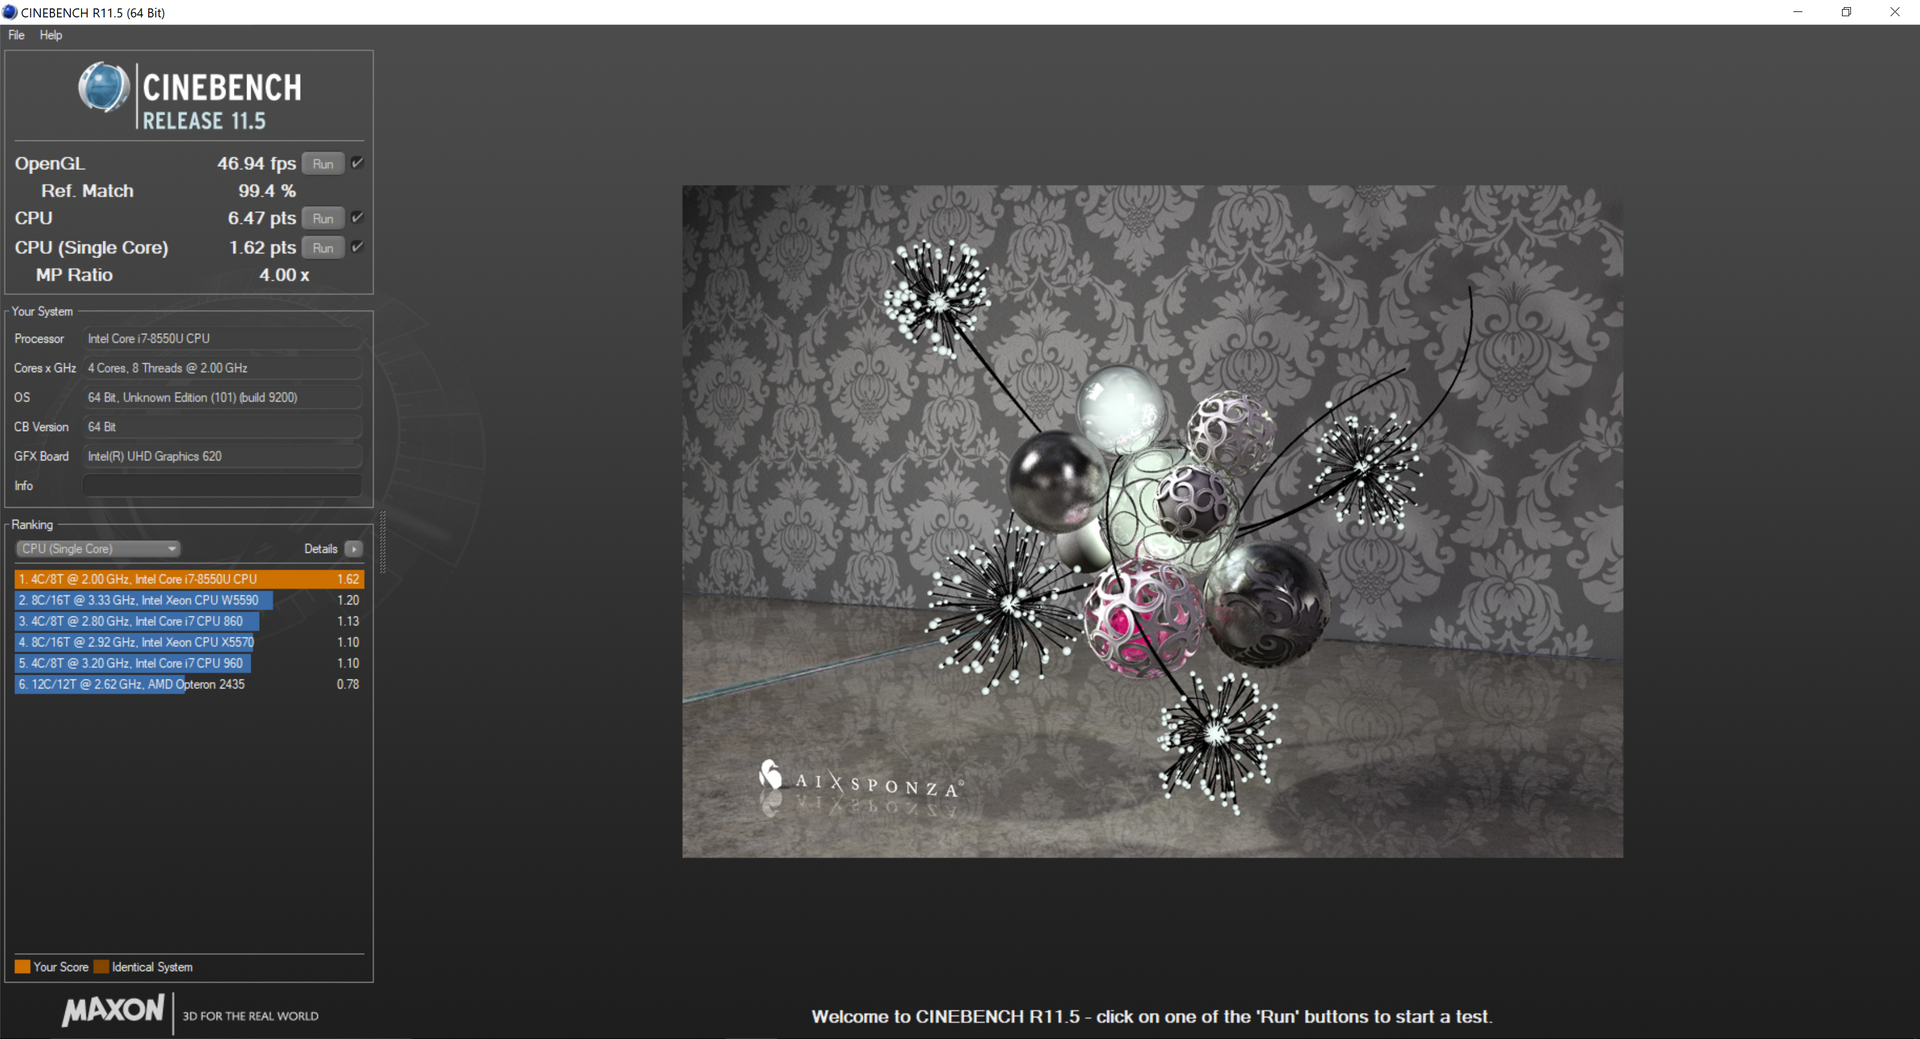
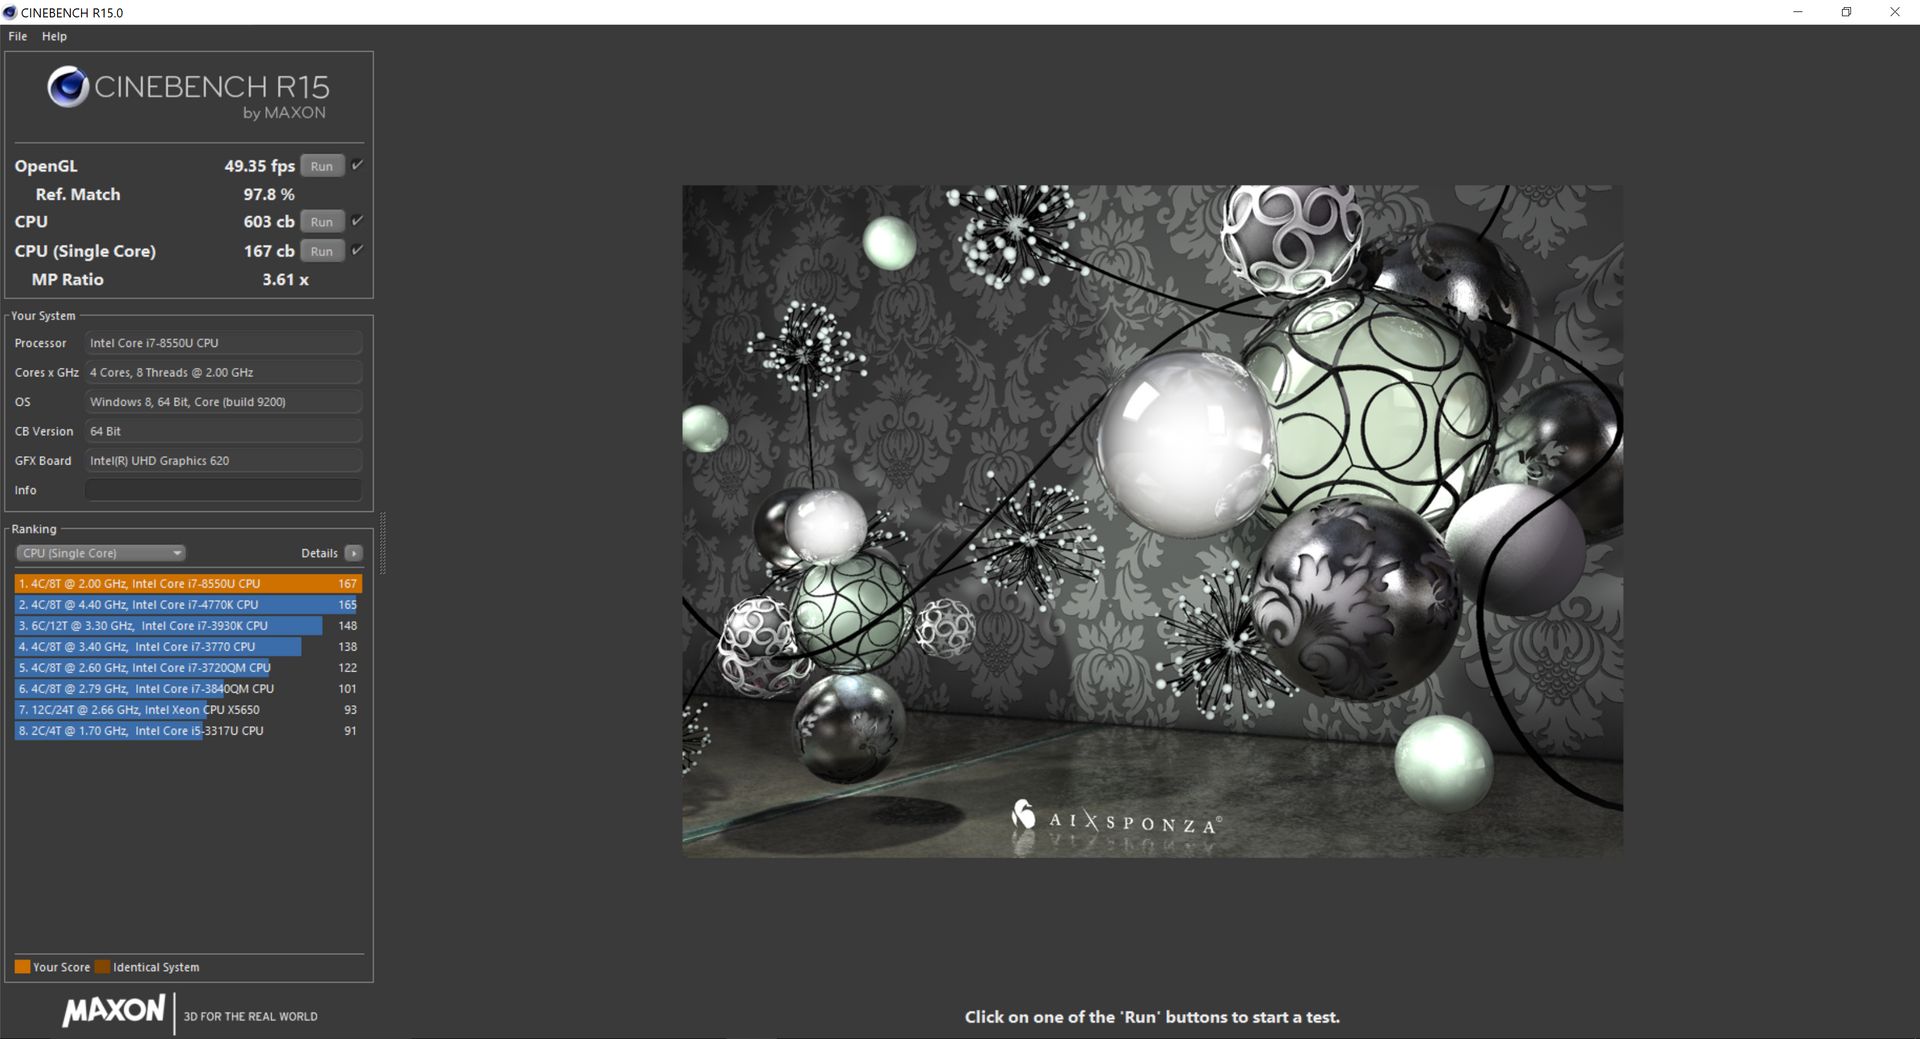
The fluctuating Turbo Boost clock rates can be observed by running CineBench R15 Multi-Thread in a loop. The initial score of 619 points is nothing short of incredible at over 80 percent the performance of the Kaby Lake i7-7500U in the older XPS 13 compared to just 11 percent from the Skylake i7-6500U to the i7-7500U. After a single run of CineBench, however, the score drops to just 572 points and never bounces back up pass the 600 mark. A more realistic score is about 570 points to represent a performance drop of about 8 percent. Though slightly disappointing, this which would put the XPS 13 more in line with the Tuxedo InfinityBook Pro sporting the same CPU.
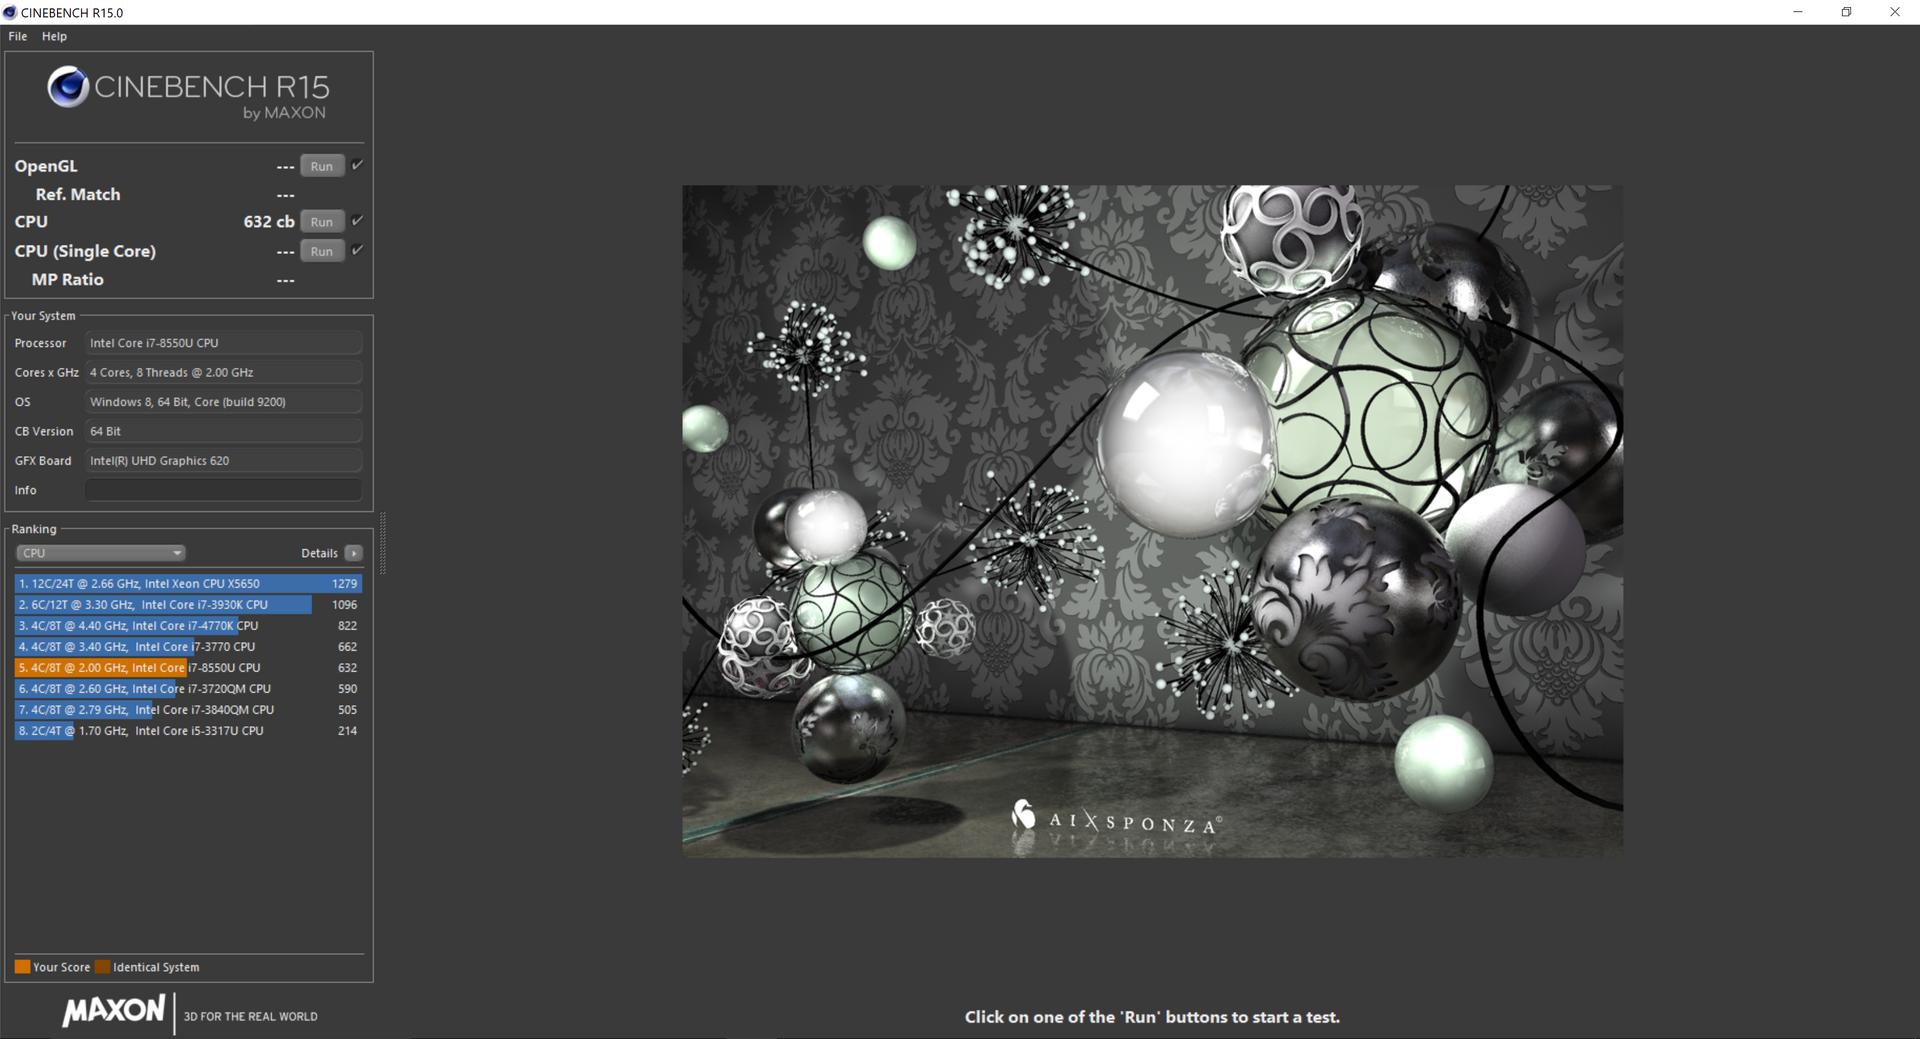
To prove how sensitive the Turbo Boost is, we ran the CineBench R15 Multi-Thread benchmark on a cold boot for a very high score of 632 points. Then, in another cold boot, we would run the OpenGL benchmark followed by the same Multi-Thread benchmark for a final score of 603 points. The OpenGL test lasts for only under a minute and the CPU can already be observed throttling by about 5 percent.
See our dedicated Core i7-8550U CPU page for more technical information and benchmarks.
| wPrime 2.10 - 1024m | |
| Dell XPS 13-9343 Non-Touch | |
| Dell XPS 13 9360-4764 | |
| Tuxedo InfinityBook Pro 13 2017 | |
| Acer Spin 5 SP513-52N-566U | |
| MSI WS63VR 7RL-023US | |
| Eurocom Tornado F5 | |
* ... smaller is better
System Performance
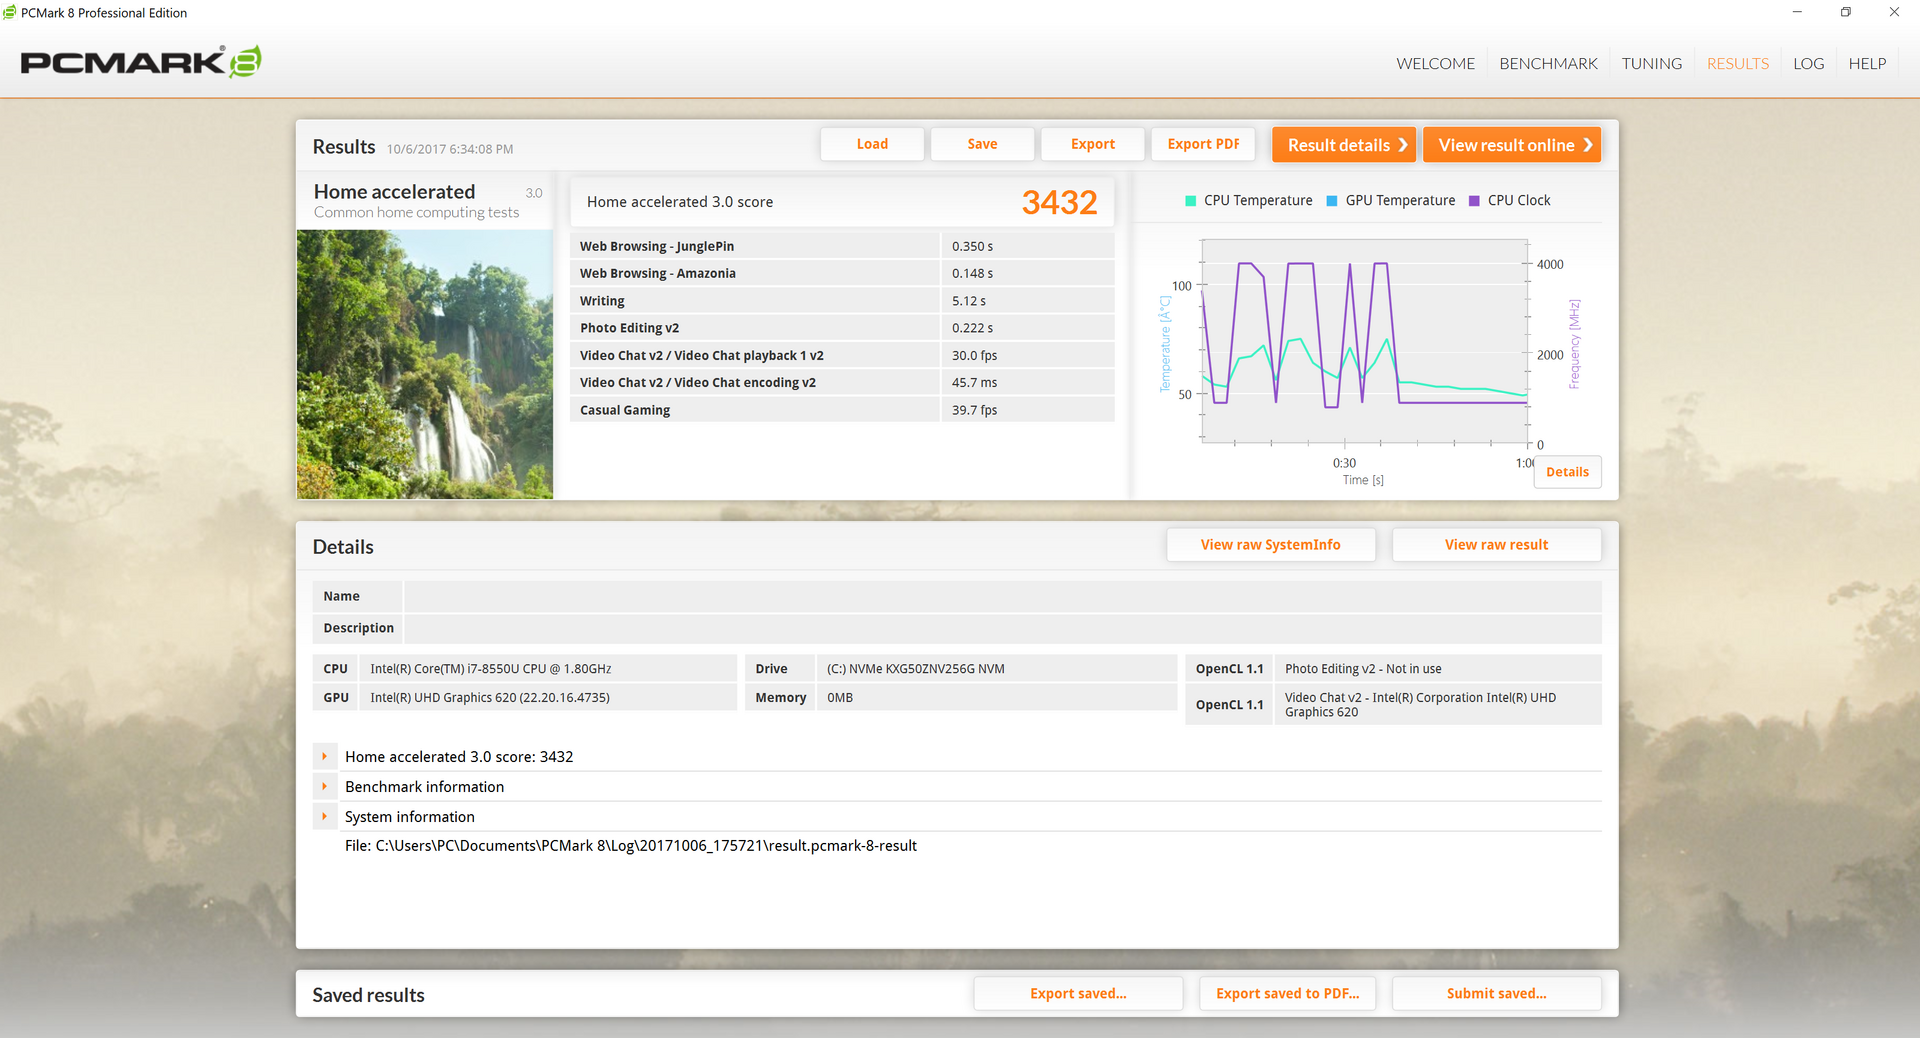
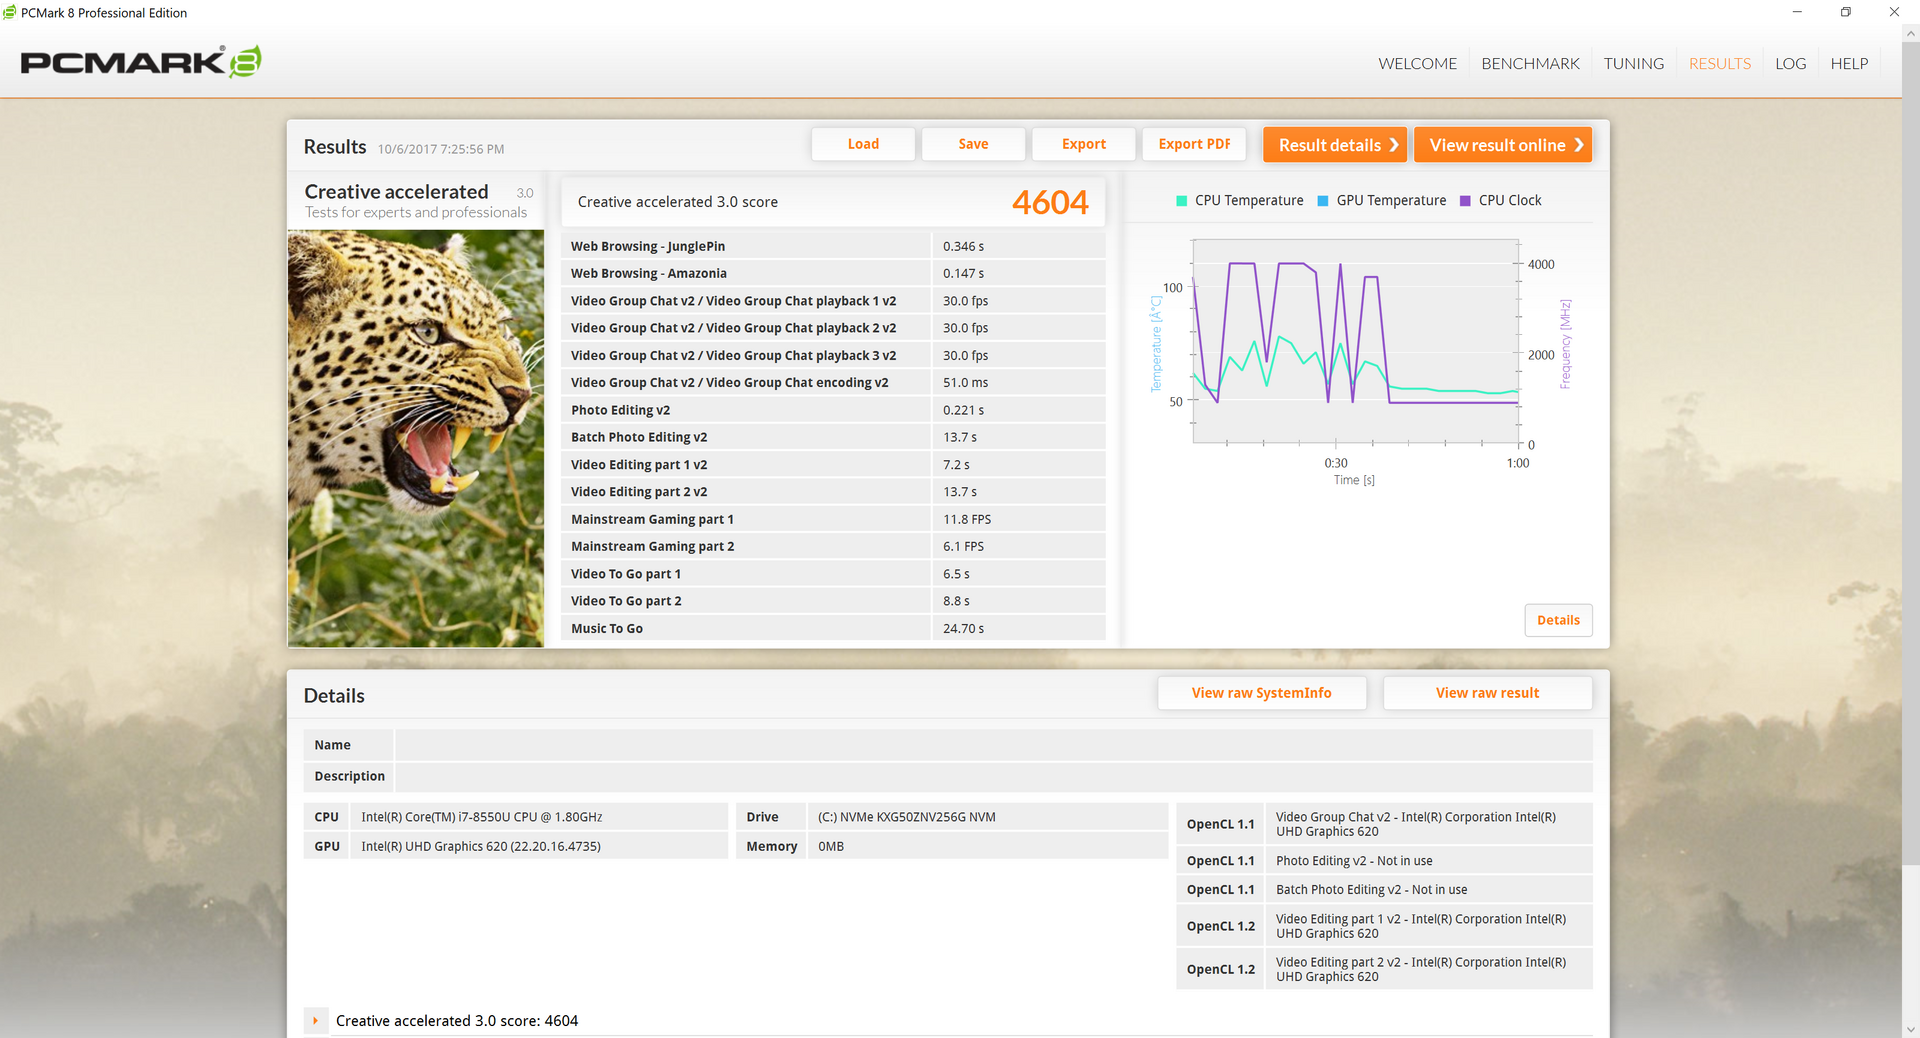
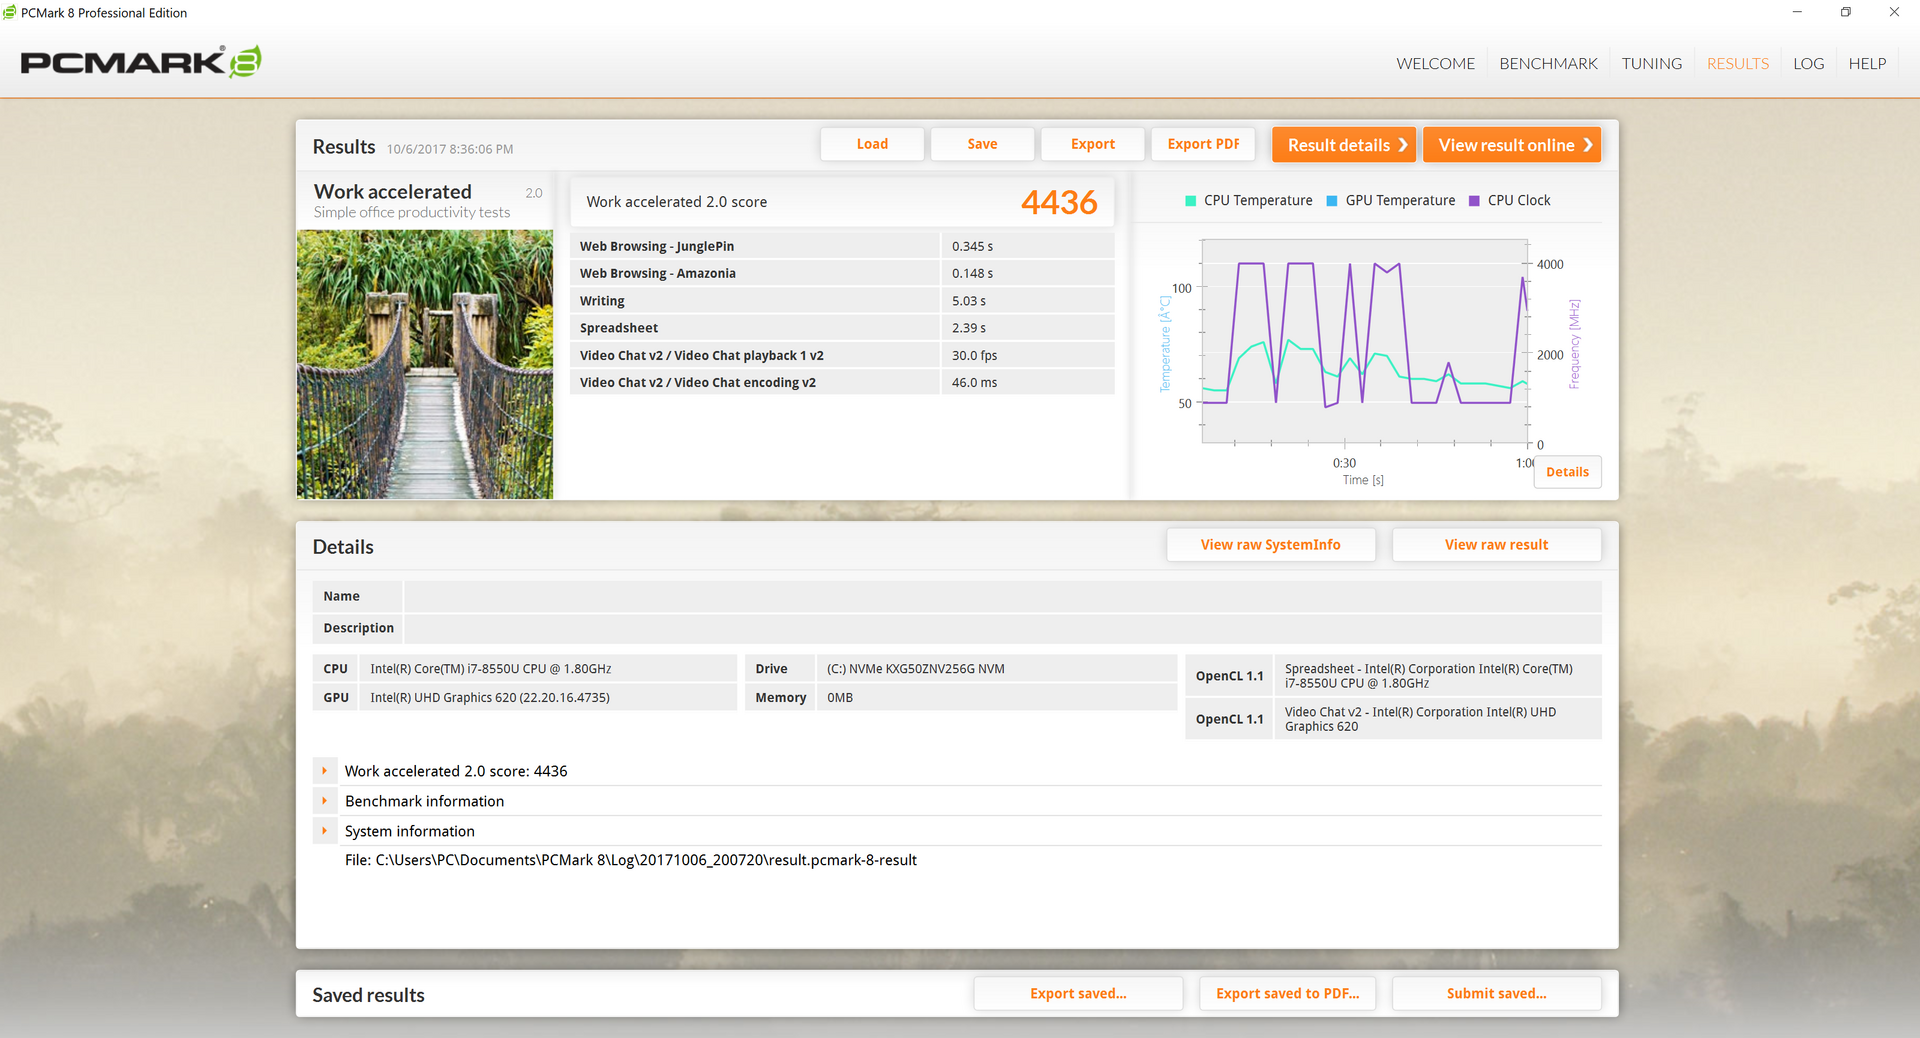
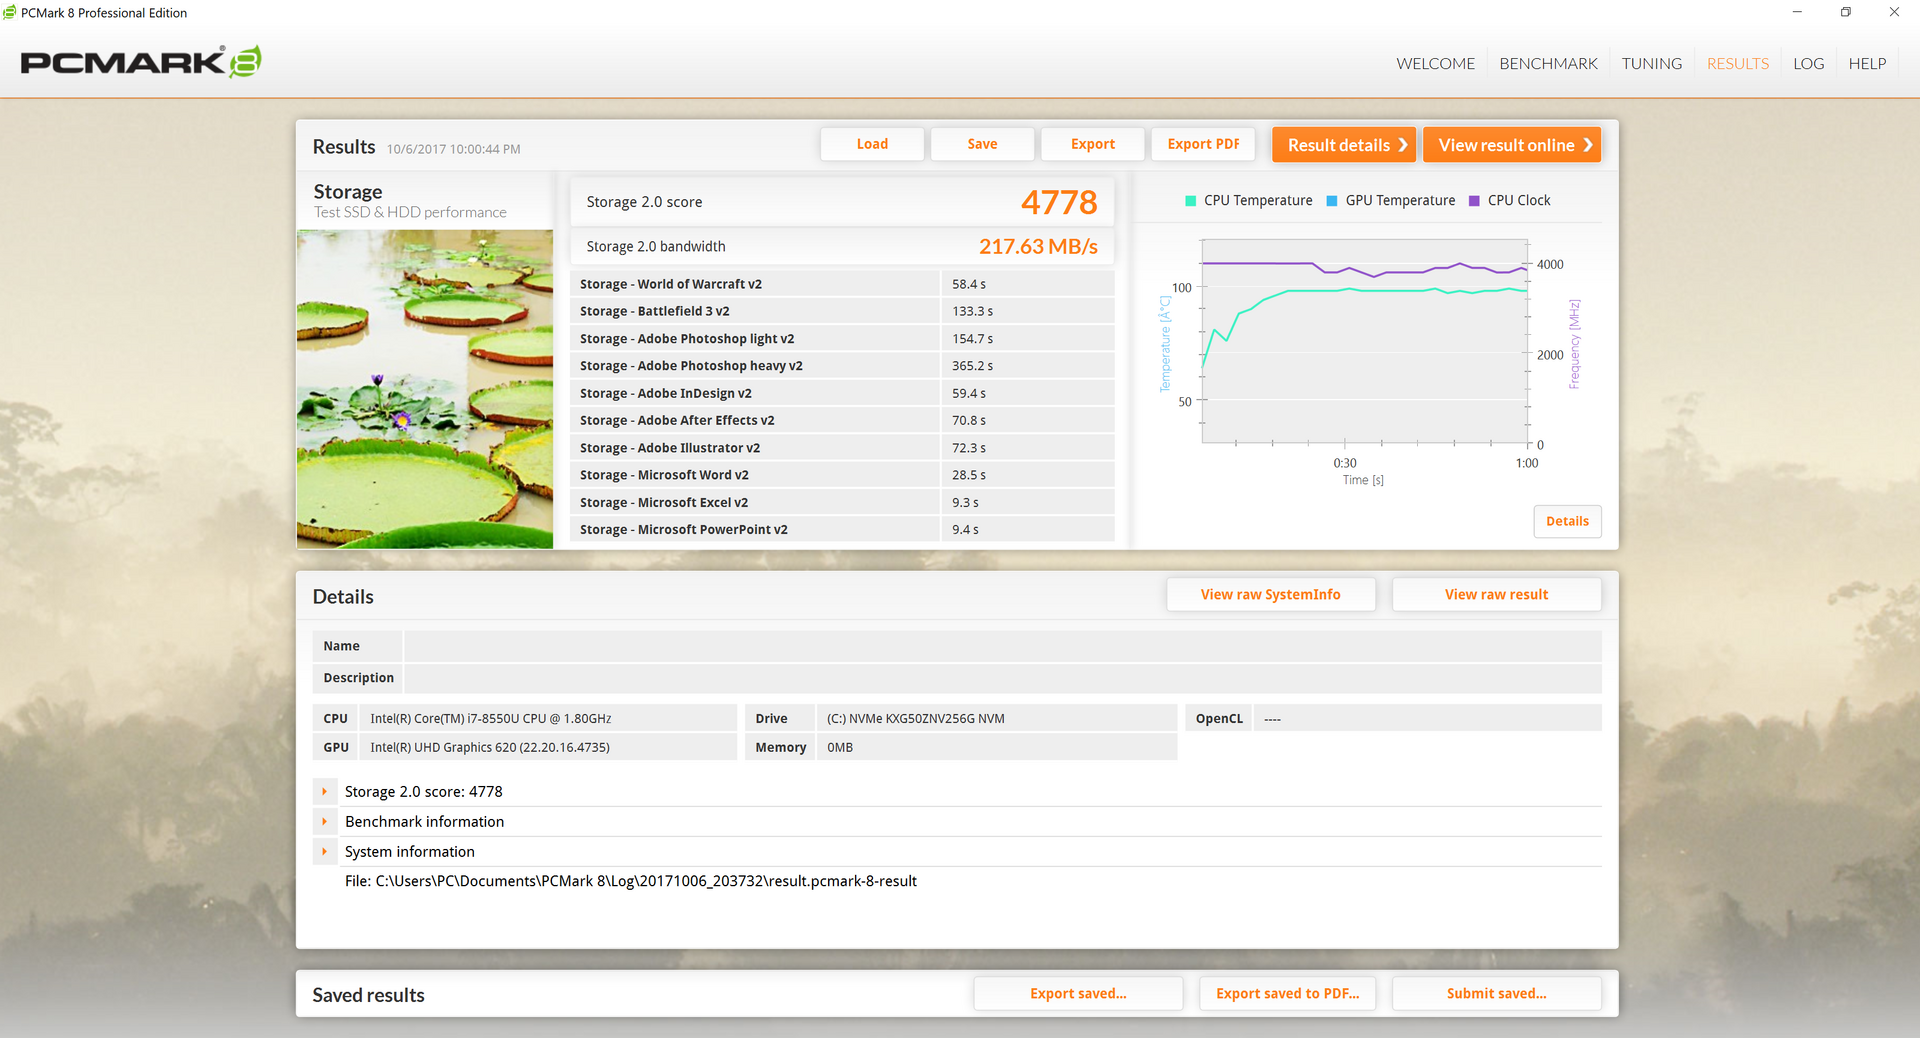
PCMark benchmarks rank the new XPS 13 slightly faster than the older i7-7500U SKU but slower than the i7-7560U SKU likely due to both the graphics advantages of the integrated Iris GPU and lower native FHD resolution. We experienced no notable slowdowns or software related issues during our time with the test unit.
We should note that PCMark 10 runs unsuccessfully on our test machine even after updating to the latest version at the time of review (1.0.1275).
| PCMark 8 | |
| Home Score Accelerated v2 | |
| Dell XPS 13 9360 FHD i7 Iris | |
| Dell XPS 13 9360 FHD i5 | |
| Dell XPS 13 i7-8550U | |
| Dell XPS 13 9360 QHD+ i7 | |
| Work Score Accelerated v2 | |
| Dell XPS 13 9360 FHD i7 Iris | |
| Dell XPS 13 9360 FHD i5 | |
| Dell XPS 13 i7-8550U | |
| Dell XPS 13 9360 QHD+ i7 | |
| Creative Score Accelerated v2 | |
| Dell XPS 13 9360 FHD i7 Iris | |
| Dell XPS 13 i7-8550U | |
| Dell XPS 13 9360 FHD i5 | |
| Dell XPS 13 9360 QHD+ i7 | |
| PCMark 8 Home Score Accelerated v2 | 3432 points | |
| PCMark 8 Creative Score Accelerated v2 | 4604 points | |
| PCMark 8 Work Score Accelerated v2 | 4436 points | |
Help | ||
Storage Devices
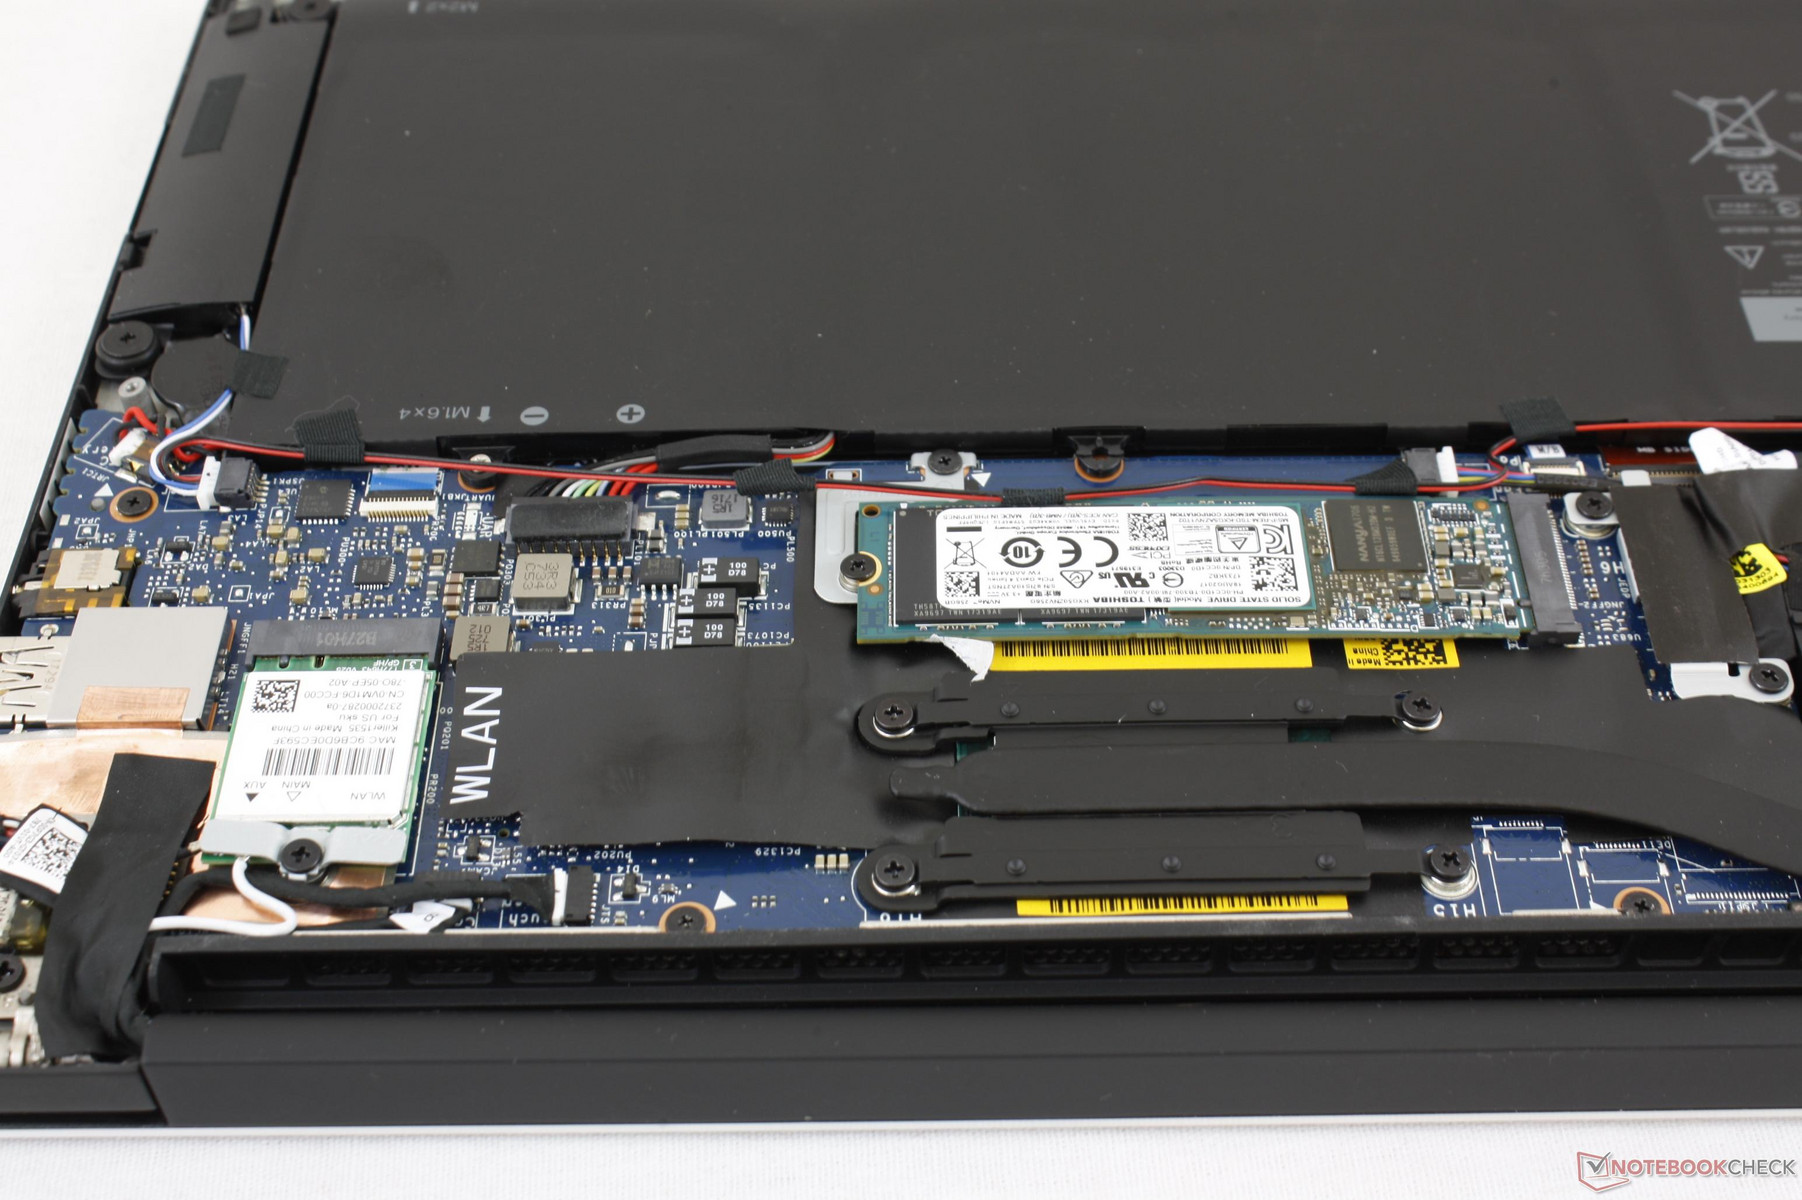
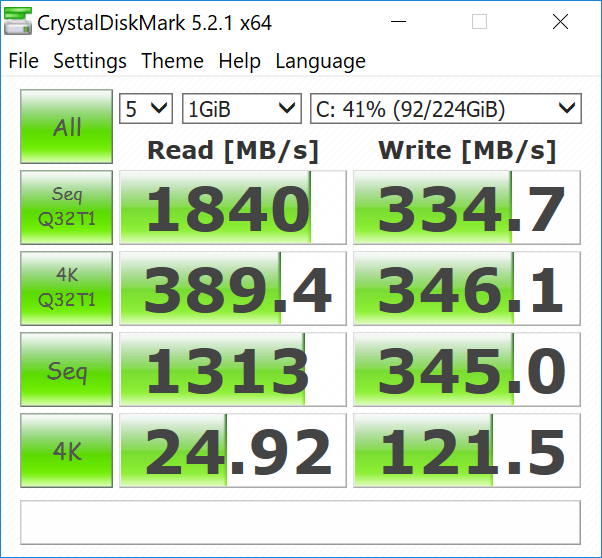
Dell has sourced Toshiba for the 256 GB KXG50ZNV256G M.2 NVMe SSD in our unit. Unfortunately, sequential transfer rates are just a fraction of the theoretical 2700 MB/s read and 1050 MB/s write rates of this particular Toshiba SSD according to both CrystalDiskMark 5 and AS SSD. Write rates in particular are very slow for an NVMe SSD at only around 331 MB/s compared to 1347 MB/s on the Samsung SM951 in the 256 GB XPS 13 SKU. The slow speeds seem to be a recurring attribute amongst XPS 13 units equipped with Toshiba SSDs as shown by our table below. At the time of writing, neither Dell nor Toshiba have addressed the issue.
See our table of SSDs and HDDs for more benchmarks and comparisons.
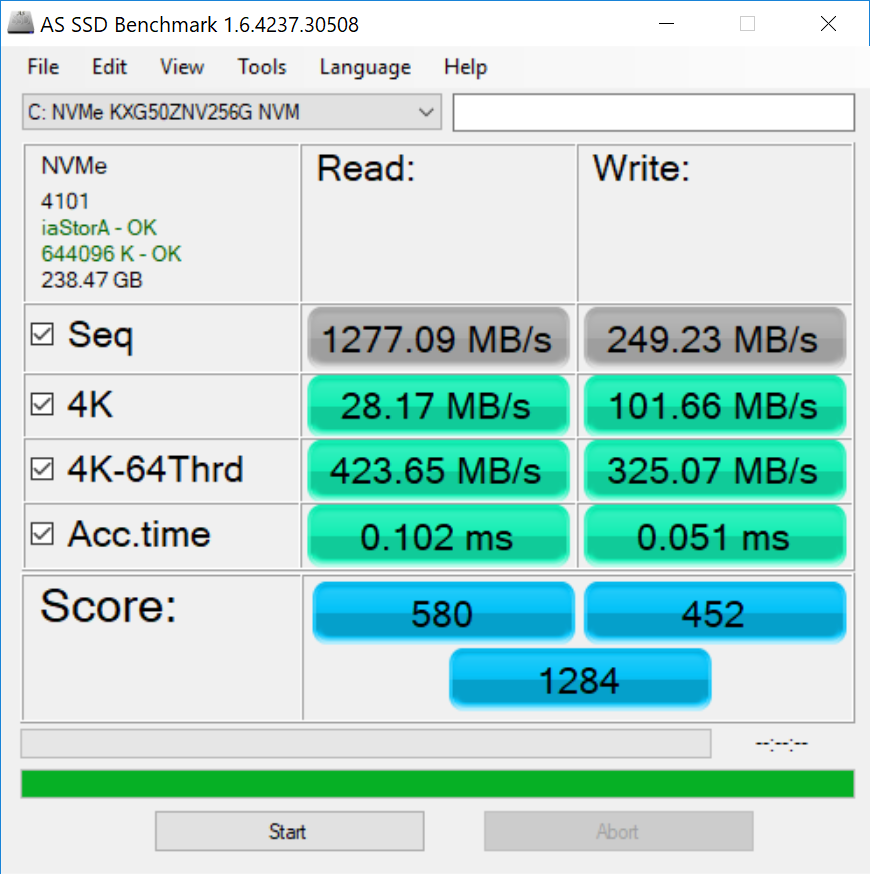
| Dell XPS 13 i7-8550U Toshiba XG5 KXG50ZNV256G | Dell XPS 13 9365-4537 2-in-1 Toshiba NVMe THNSN5256GPUK | Dell XPS 13-9365 2-in-1 Toshiba NVMe THNSN5256GPUK | Dell XPS 13 9360 FHD i5 Toshiba NVMe THNSN5256GPUK | Dell XPS 13 2016 9350 (FHD, i7-6560U) Samsung SSD SM951 512 GB MZHPV512HDGL | |
|---|---|---|---|---|---|
| AS SSD | 23% | 52% | 16% | 86% | |
| Copy Game MB/s (MB/s) | 285.3 | 457.8 60% | 726 154% | 390 37% | 618 117% |
| Copy Program MB/s (MB/s) | 172 | 264.7 54% | 263.8 53% | 188 9% | 333.8 94% |
| Copy ISO MB/s (MB/s) | 329.7 | 714 117% | 950 188% | 283.3 -14% | 830 152% |
| Score Total (Points) | 1284 | 1388 8% | 1495 16% | 1607 25% | 1992 55% |
| Score Write (Points) | 452 | 389 -14% | 375 -17% | 327 -28% | 606 34% |
| Score Read (Points) | 580 | 681 17% | 752 30% | 870 50% | 911 57% |
| Access Time Write * (ms) | 0.051 | 0.041 20% | 0.037 27% | 0.035 31% | 0.031 39% |
| Access Time Read * (ms) | 0.102 | 0.169 -66% | 0.045 56% | 0.055 46% | 0.048 53% |
| 4K-64 Write (MB/s) | 325.1 | 249.4 -23% | 204.7 -37% | 197.7 -39% | 363.4 12% |
| 4K-64 Read (MB/s) | 423.6 | 512 21% | 586 38% | 723 71% | 722 70% |
| 4K Write (MB/s) | 101.7 | 85.8 -16% | 96.9 -5% | 92 -10% | 107.4 6% |
| 4K Read (MB/s) | 28.17 | 34.77 23% | 37.69 34% | 29.52 5% | 46.9 66% |
| Seq Write (MB/s) | 249.2 | 543 118% | 735 195% | 372.8 50% | 1348 441% |
| Seq Read (MB/s) | 1277 | 1342 5% | 1283 0% | 1179 -8% | 1413 11% |
* ... smaller is better

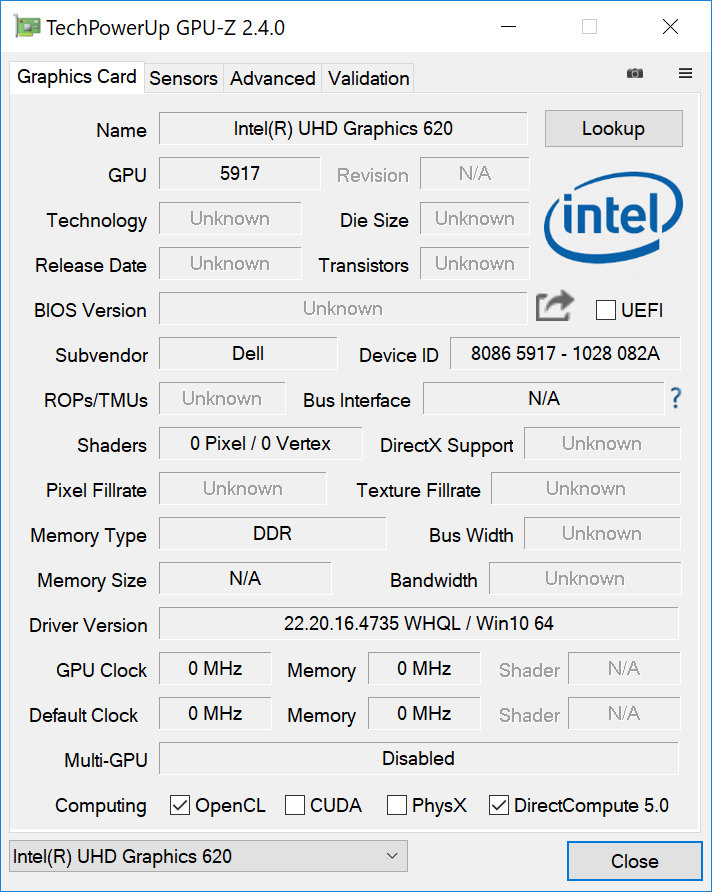
GPU Performance
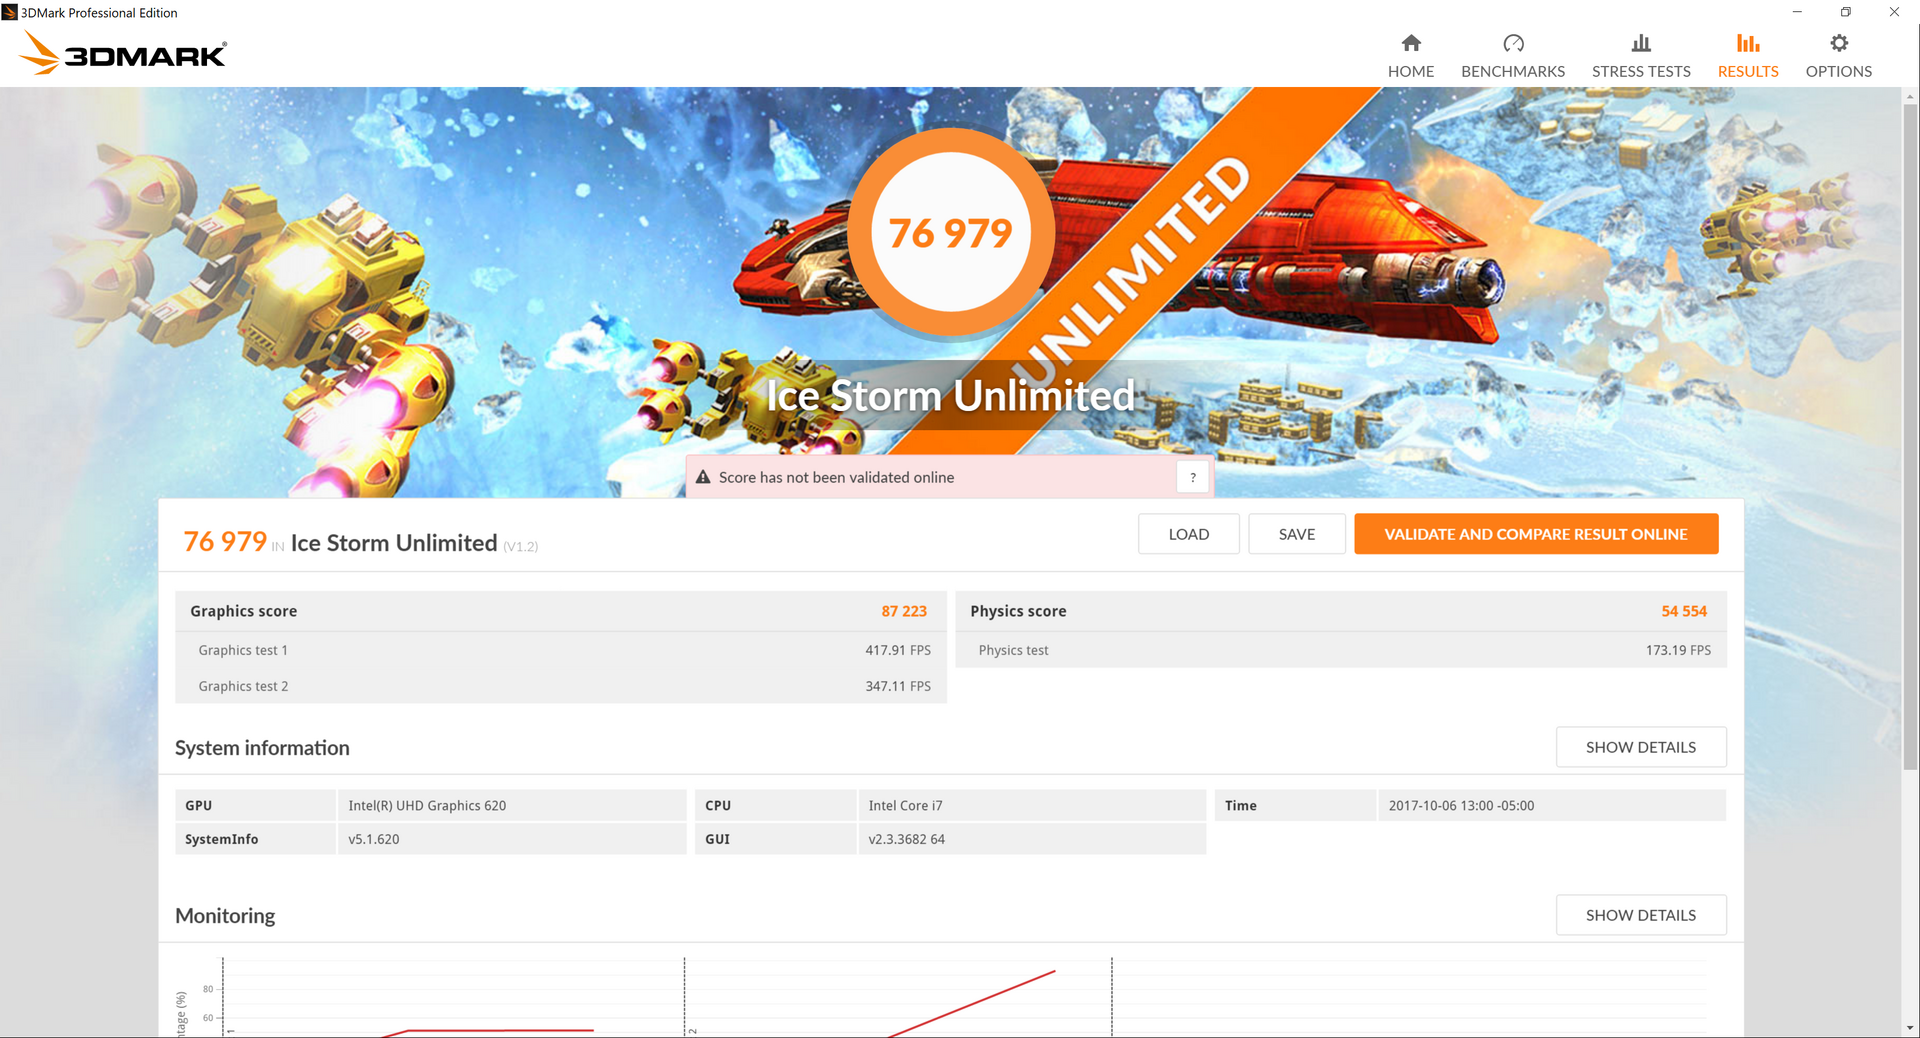
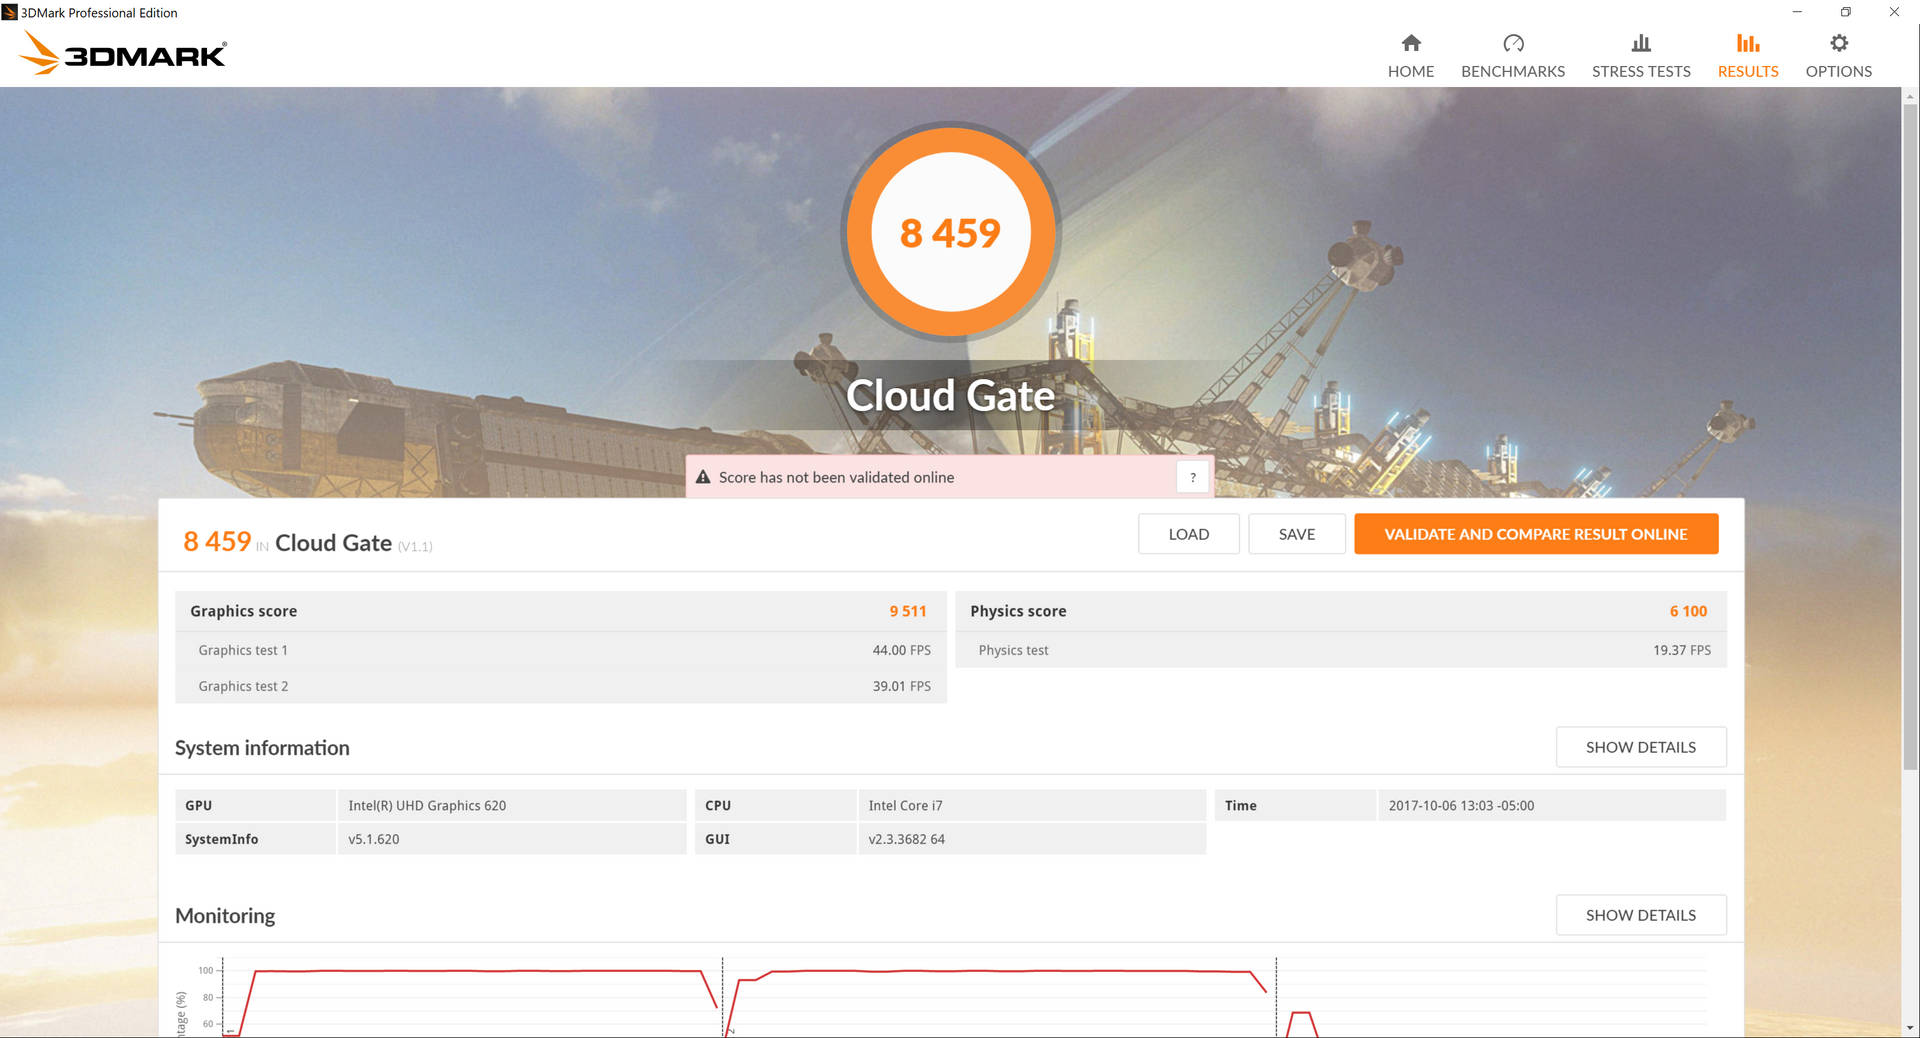
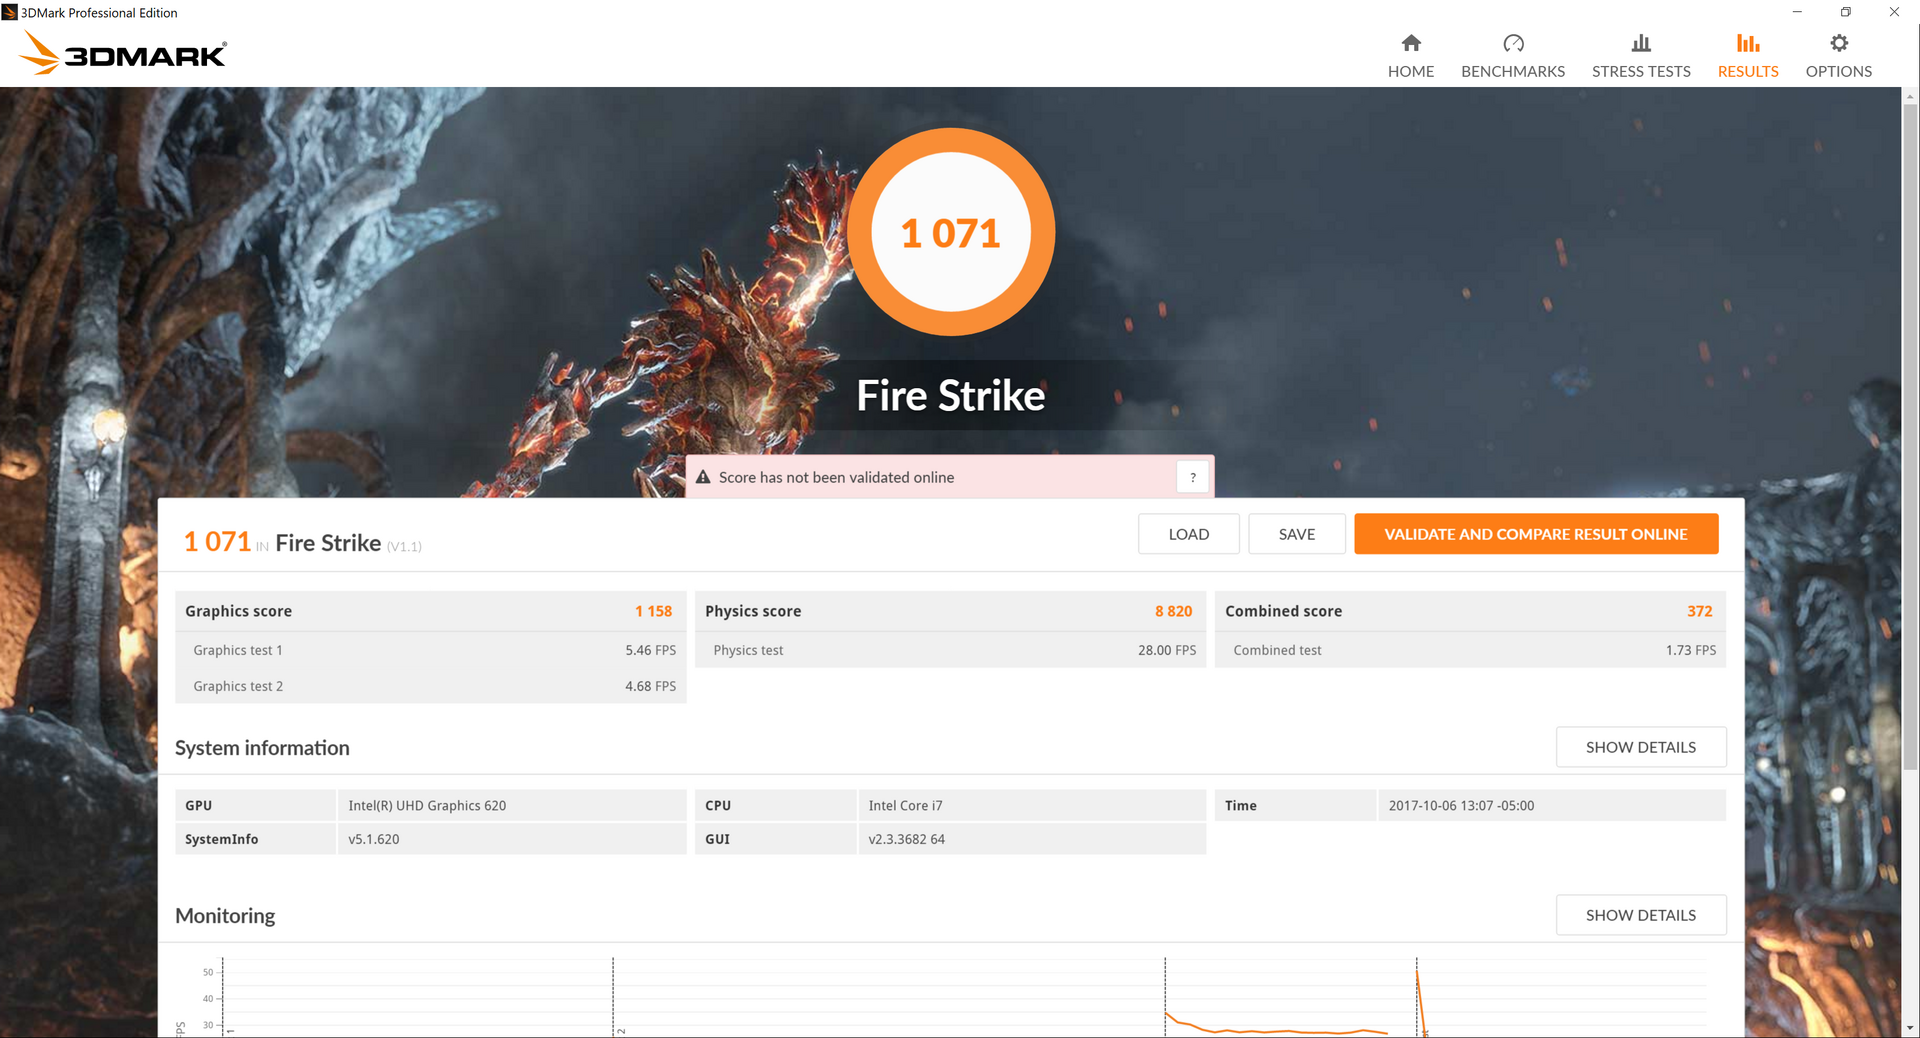
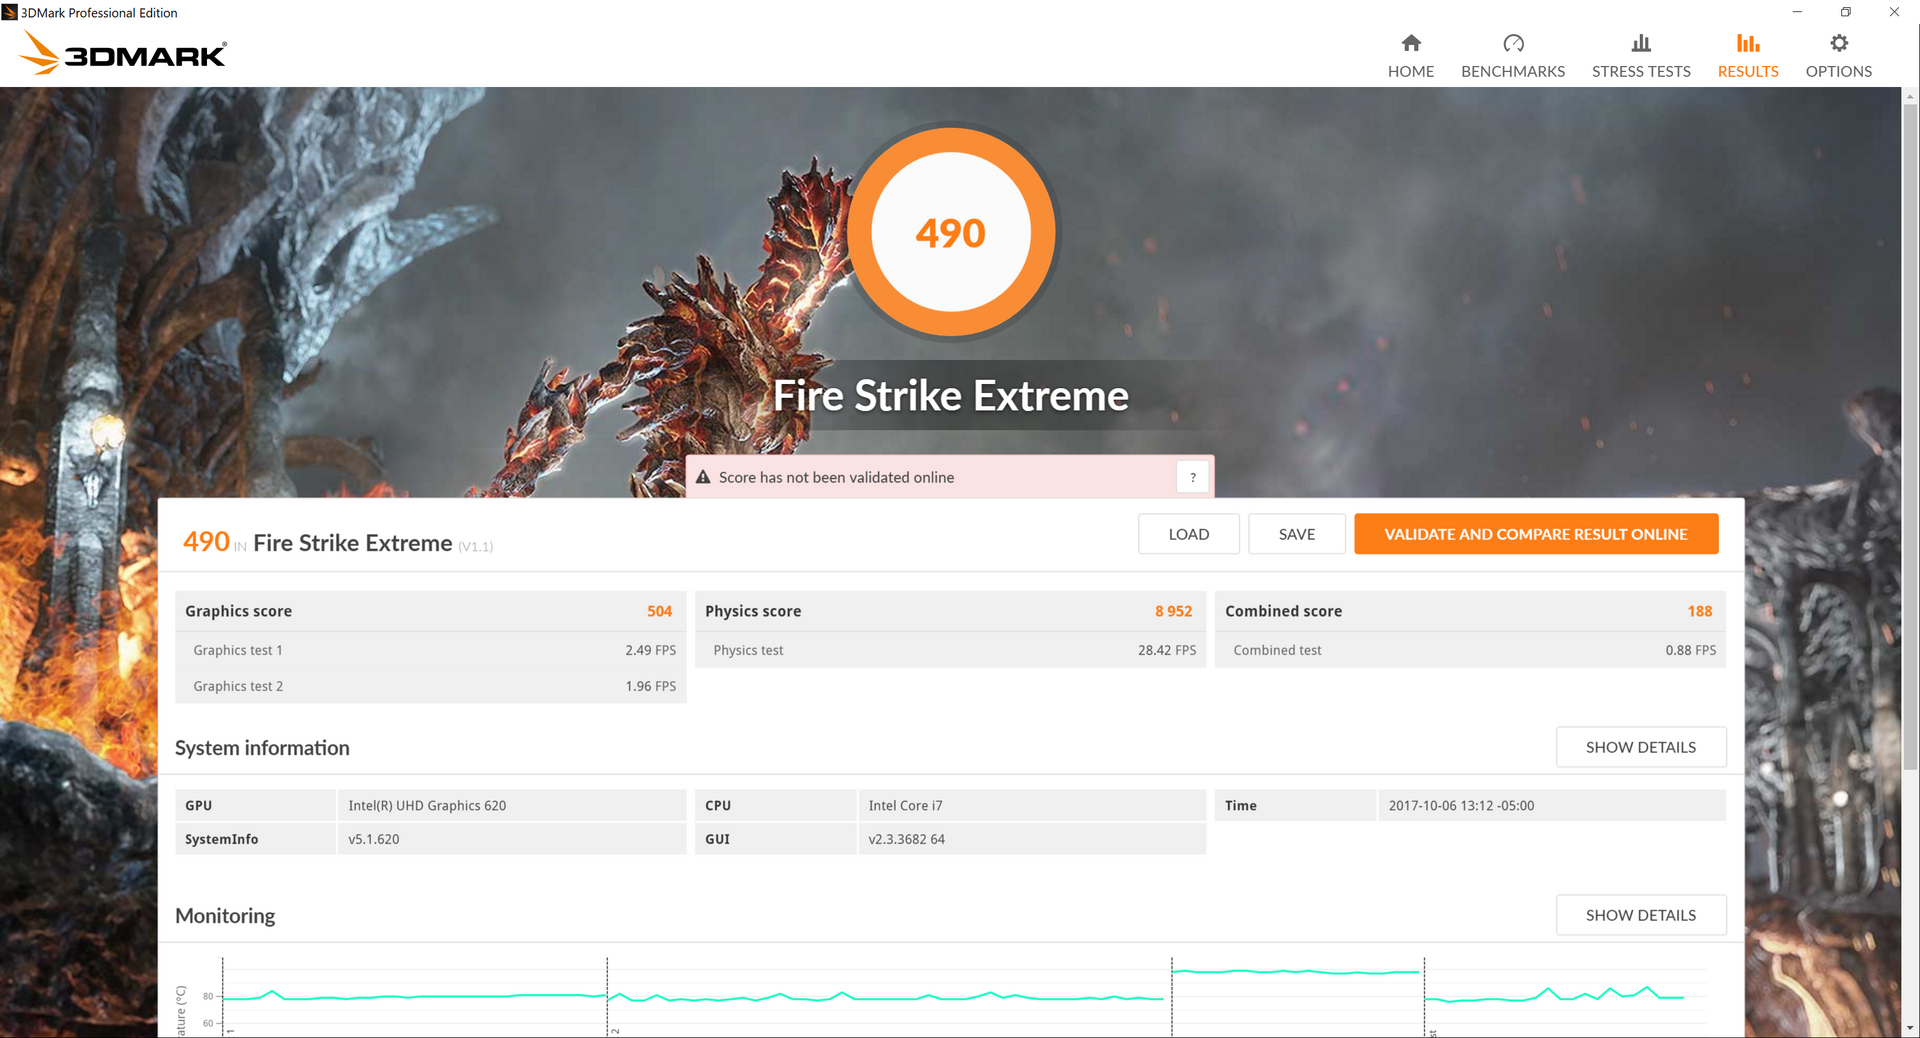
Intel has explicitly stated that the UHD Graphics 620 would be identical to the HD Graphics 620 except in name. Despite the claim, 3DMark scores are still notably higher on the new XPS 13 compared to other systems sporting ULV Kaby Lake and the HD Graphics 620 GPU. Its Fire Strike Graphics score, for example, is 13 percent higher than on the Spectre x360 13. The slight boost may be attributed to the higher temperature ceiling of the CPU in the XPS 13 for potentially faster clock rates when under gaming load. The last generation Iris Plus Graphics 640 will still has the edge over the UHD Graphics 620 by about 18 percent.
The slight graphical advantage extends to real-world gaming conditions. Frame rates are higher on the new XPS 13 by about 19 percent over the older XPS 13 i7-7500U SKU in both Bioshock Infinite and Rise of the Tomb Raider. Frame rates are still far too low to be considered a major selling point, but at least the performance boost is consistent and measurable.
See our review on the UHD Graphics 620 for more technical information and benchmarks.
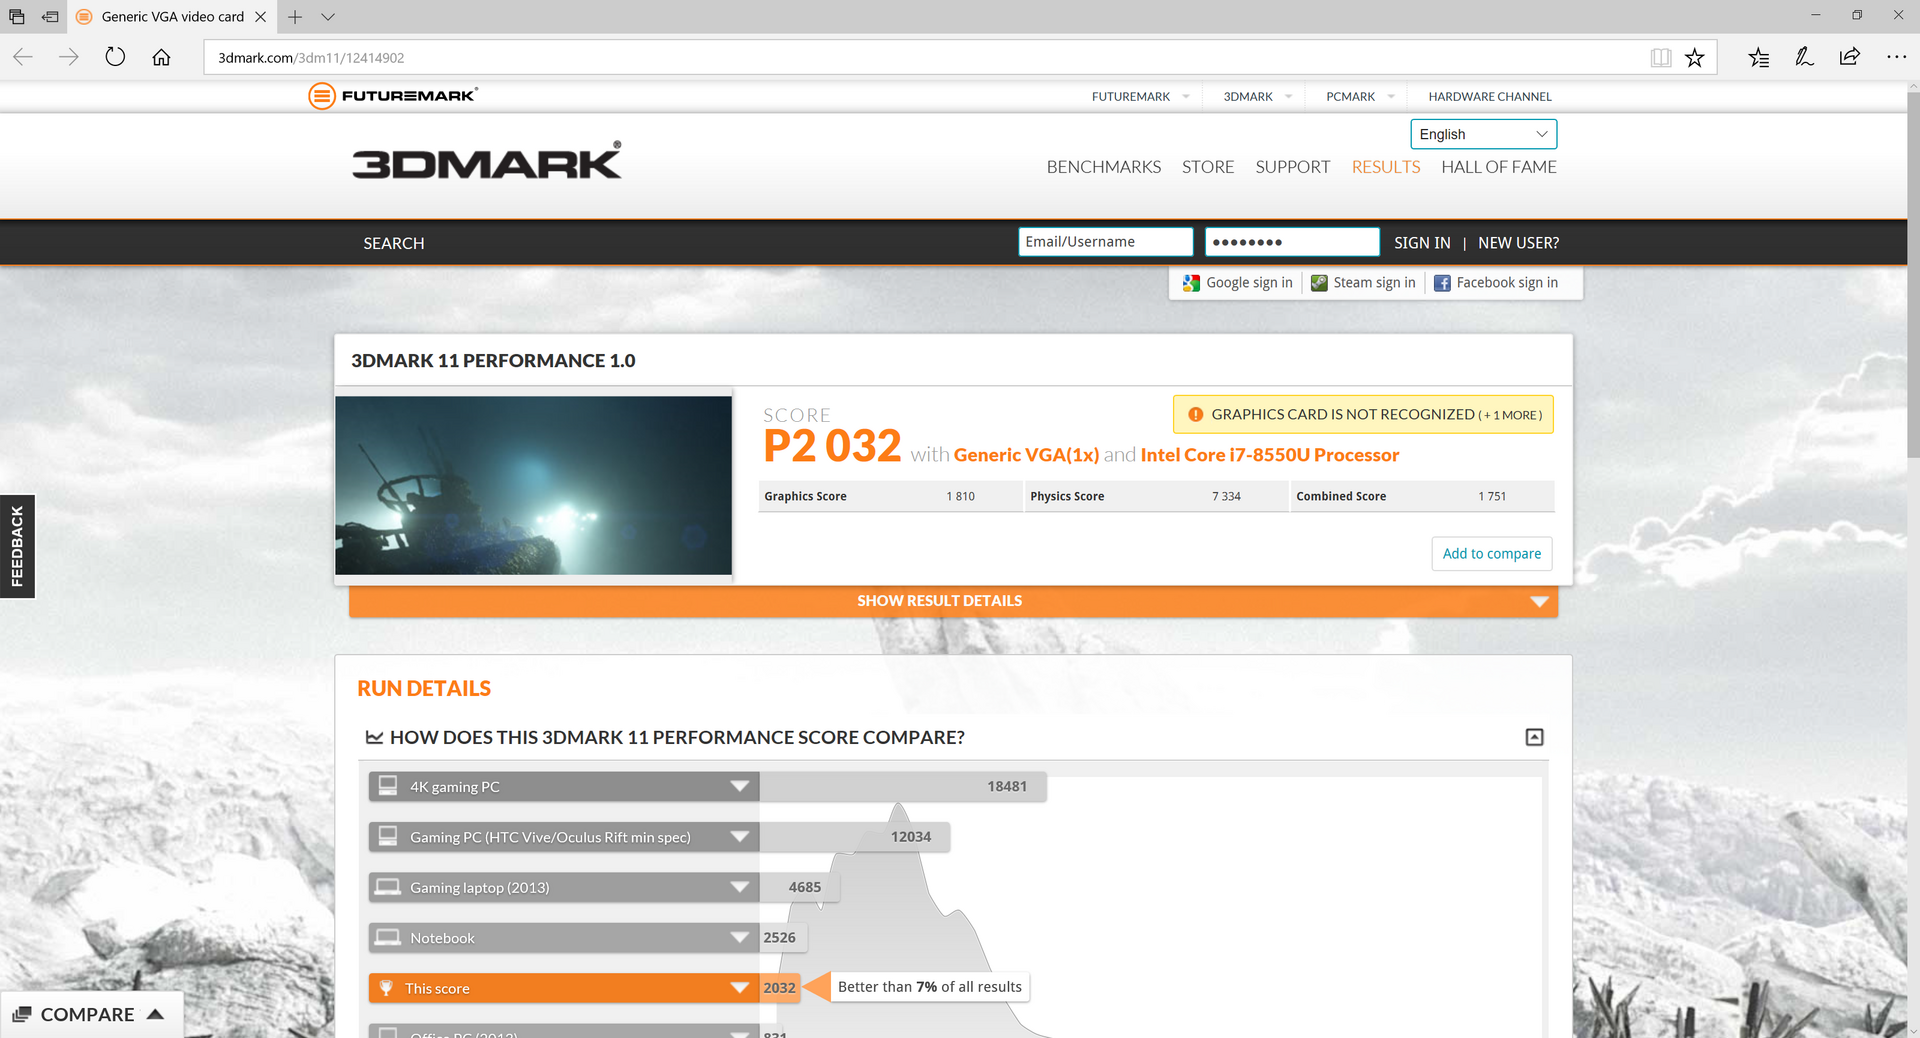
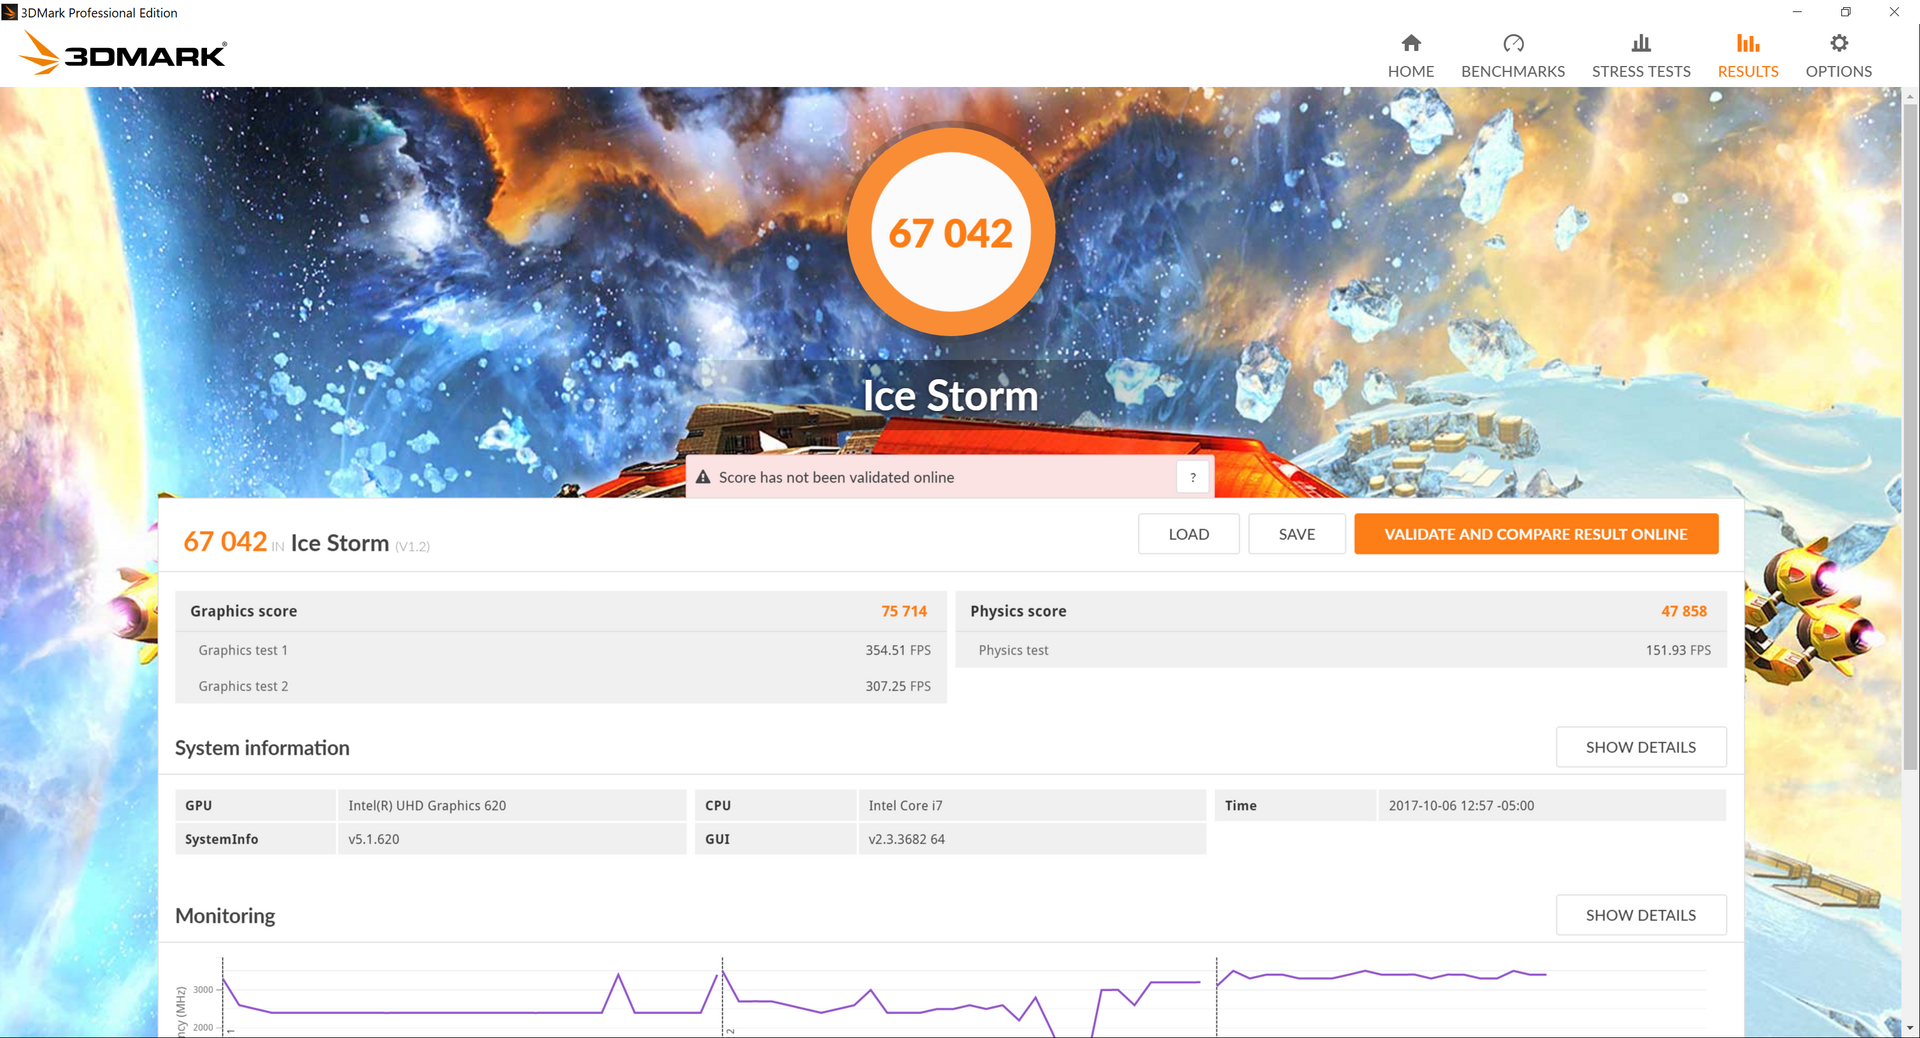
| 3DMark 11 Performance | 2032 points | |
| 3DMark Ice Storm Standard Score | 67042 points | |
| 3DMark Cloud Gate Standard Score | 8459 points | |
| 3DMark Fire Strike Score | 1071 points | |
| 3DMark Fire Strike Extreme Score | 490 points | |
Help | ||
| Rise of the Tomb Raider | |
| 1366x768 Medium Preset AF:2x | |
| HP Envy 13-ad006ng | |
| Apple MacBook Pro 13 2016 | |
| Microsoft Surface Pro (2017) i7 | |
| Dell XPS 13 i7-8550U | |
| Dell XPS 13 9360 QHD+ i7 | |
| 1920x1080 High Preset AA:FX AF:4x | |
| HP Envy 13-ad006ng | |
| Microsoft Surface Pro (2017) i7 | |
| Dell XPS 13 i7-8550U | |
| Dell XPS 13 9360 QHD+ i7 | |
| low | med. | high | ultra | |
|---|---|---|---|---|
| BioShock Infinite (2013) | 72.8 | 37.6 | 31.1 | 10 |
| Rise of the Tomb Raider (2016) | 24.9 | 14.6 | 7.4 | |
| Overwatch (2016) | 49.6 | 30.7 | 14.9 |
Stress Test
We stress the notebook with unrealistic loads in order to identify for any potential throttling or stability issues. When under Prime95 load, the CPU can be observed skyrocketing to 3.7 GHz and 99 C for the first few seconds before steadily dropping to a stable 2.5 GHz and 92 C as shown by our Prime95 screenshots below. This is both slower and warmer than what we observed on the i5-7200U SKU by 500 MHz and 7 C, respectively. Nonetheless, the fact that the system can maintain speeds well above its base 1.8 GHz clock rate for all four cores is impressive even if it's nowhere near the 3.7 GHz maximum. The initially high Prime95 clock rates confirm what we observed on our CineBench R15 loop test from above.
FurMark stress causes the integrated UHD Graphics 620 to flat-line at 998 MHz and at a temperature of 88 C or 10 C warmer than on the i5-7200U. Running both simultaneously will throttle the CPU down to just 1.4 GHz for a cooler core temperature of 84 C.
Running on battery power will limit CPU Turbo Boost potential while GPU performance remains unhindered. A 3DMark 11 run on batteries returns Physics and Graphics scores of 6523 and 1822 points, respectively, compared to 7334 and 1810 points when on mains.
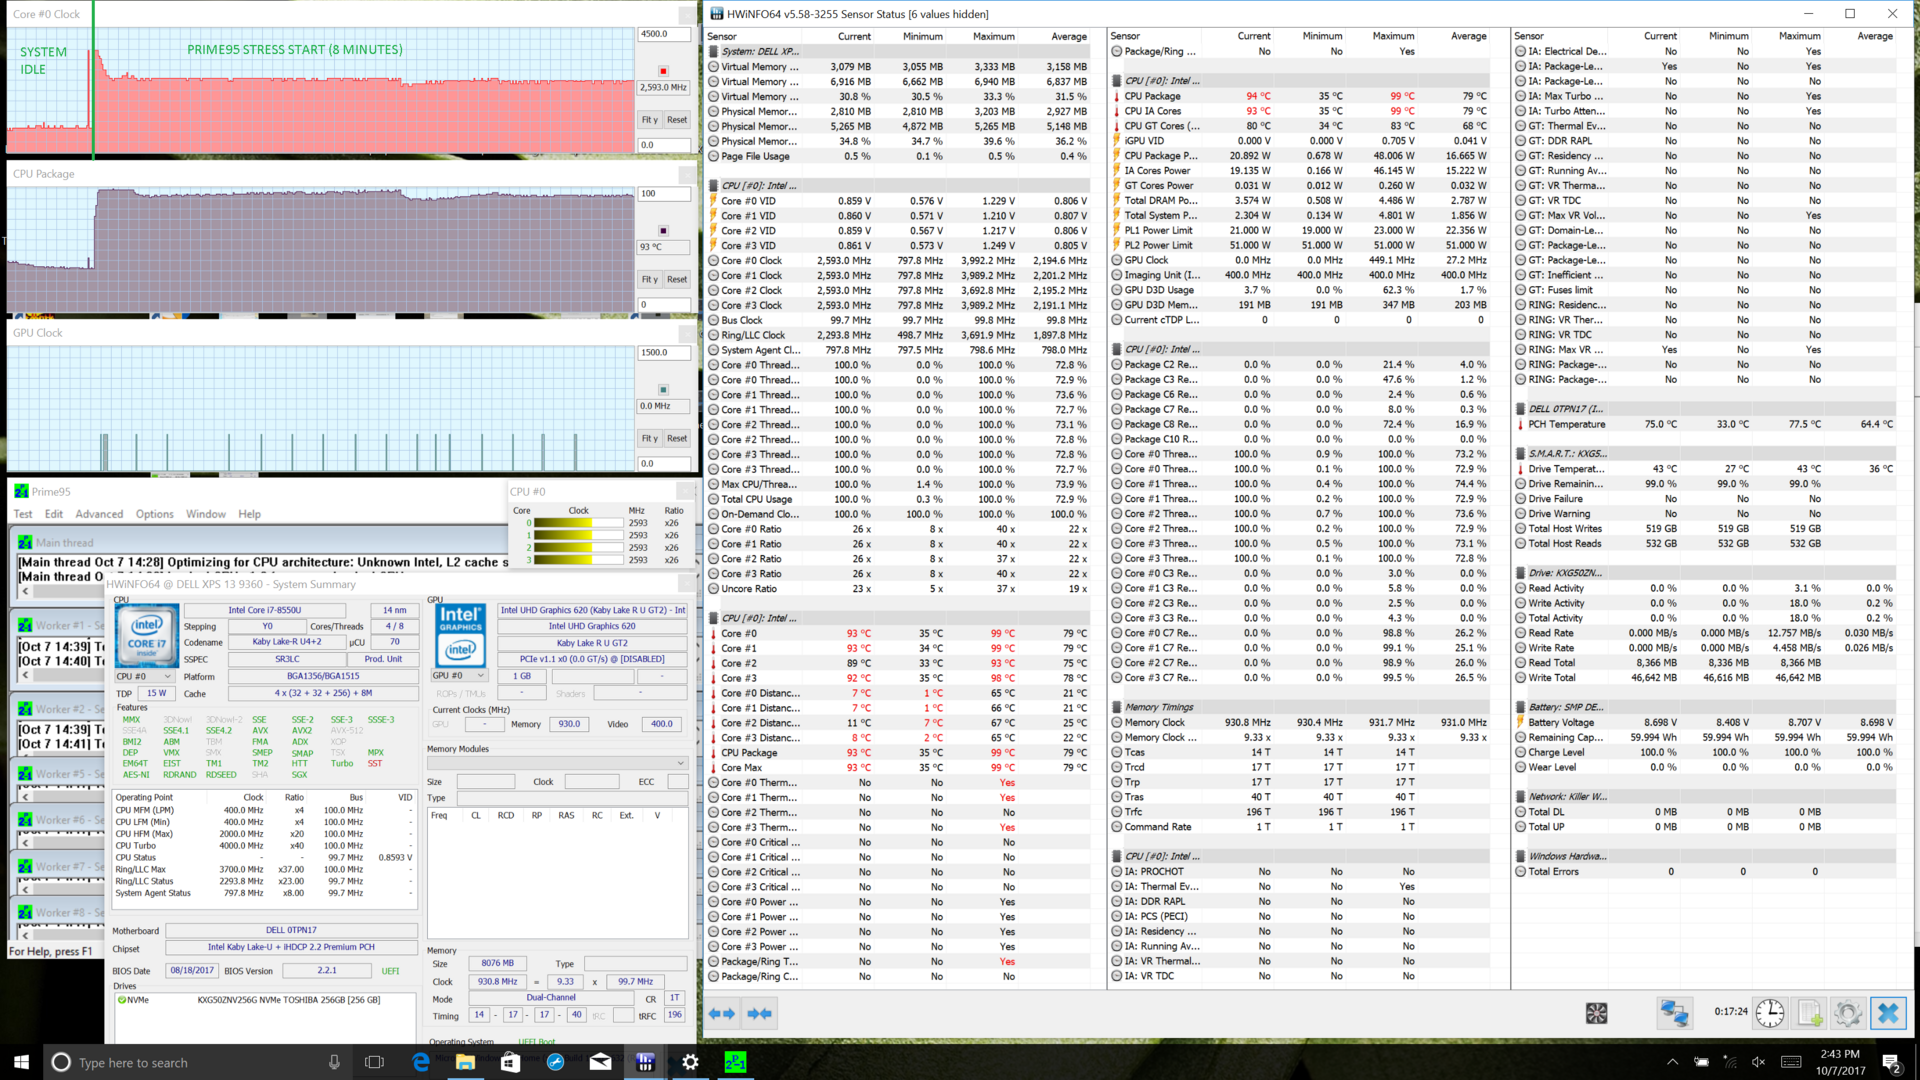
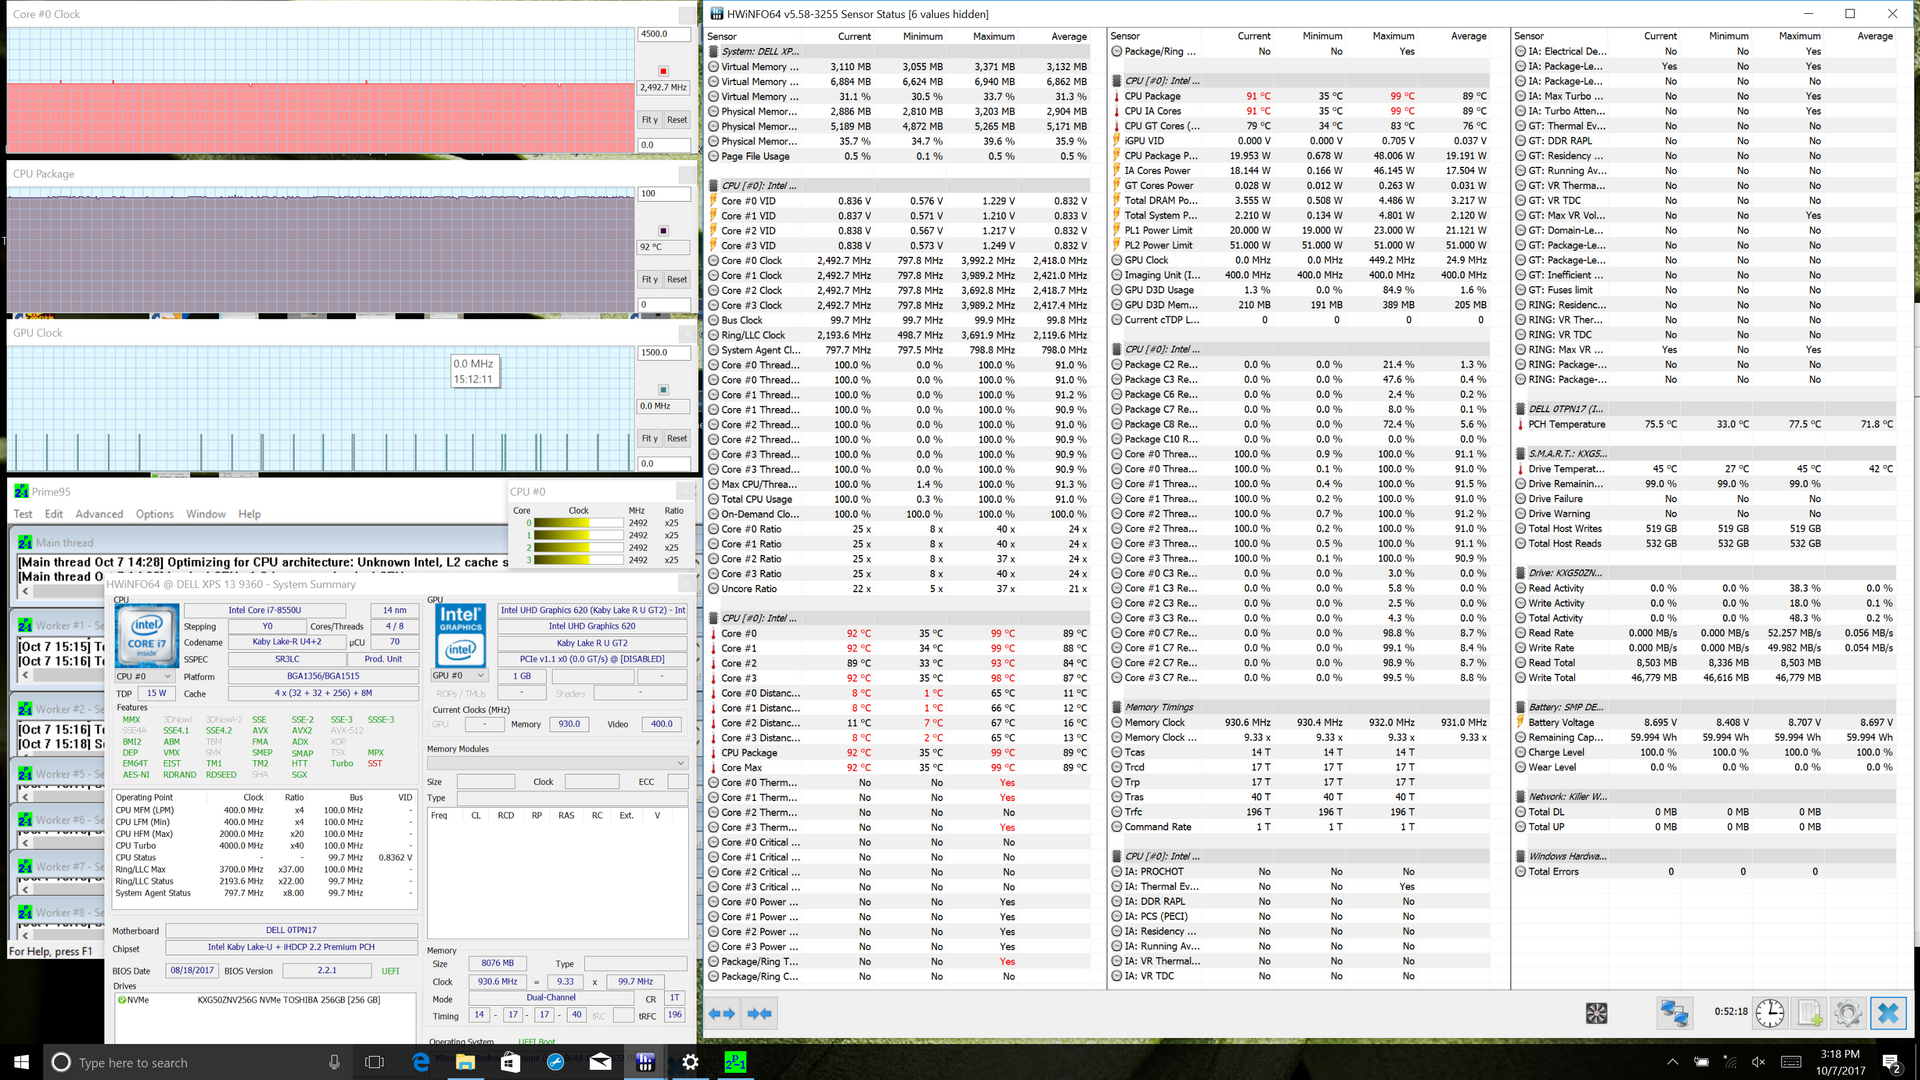
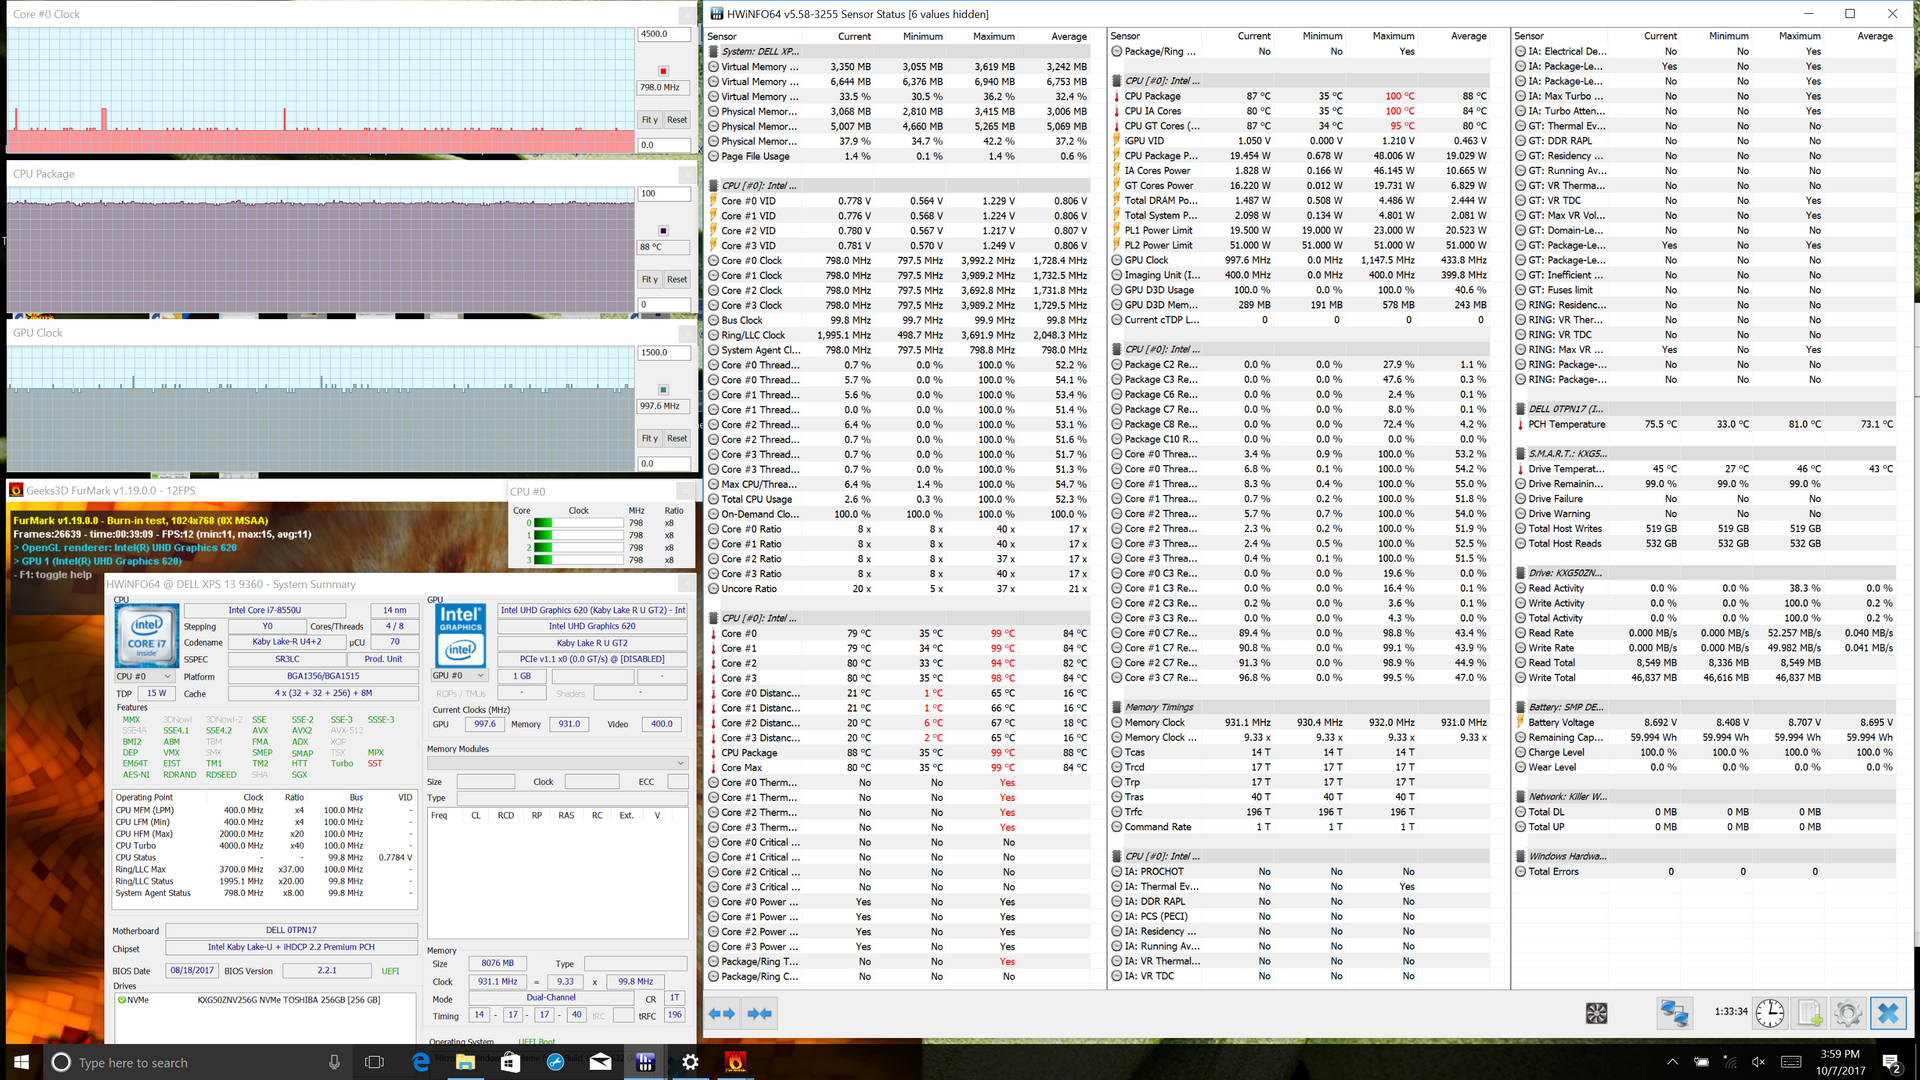
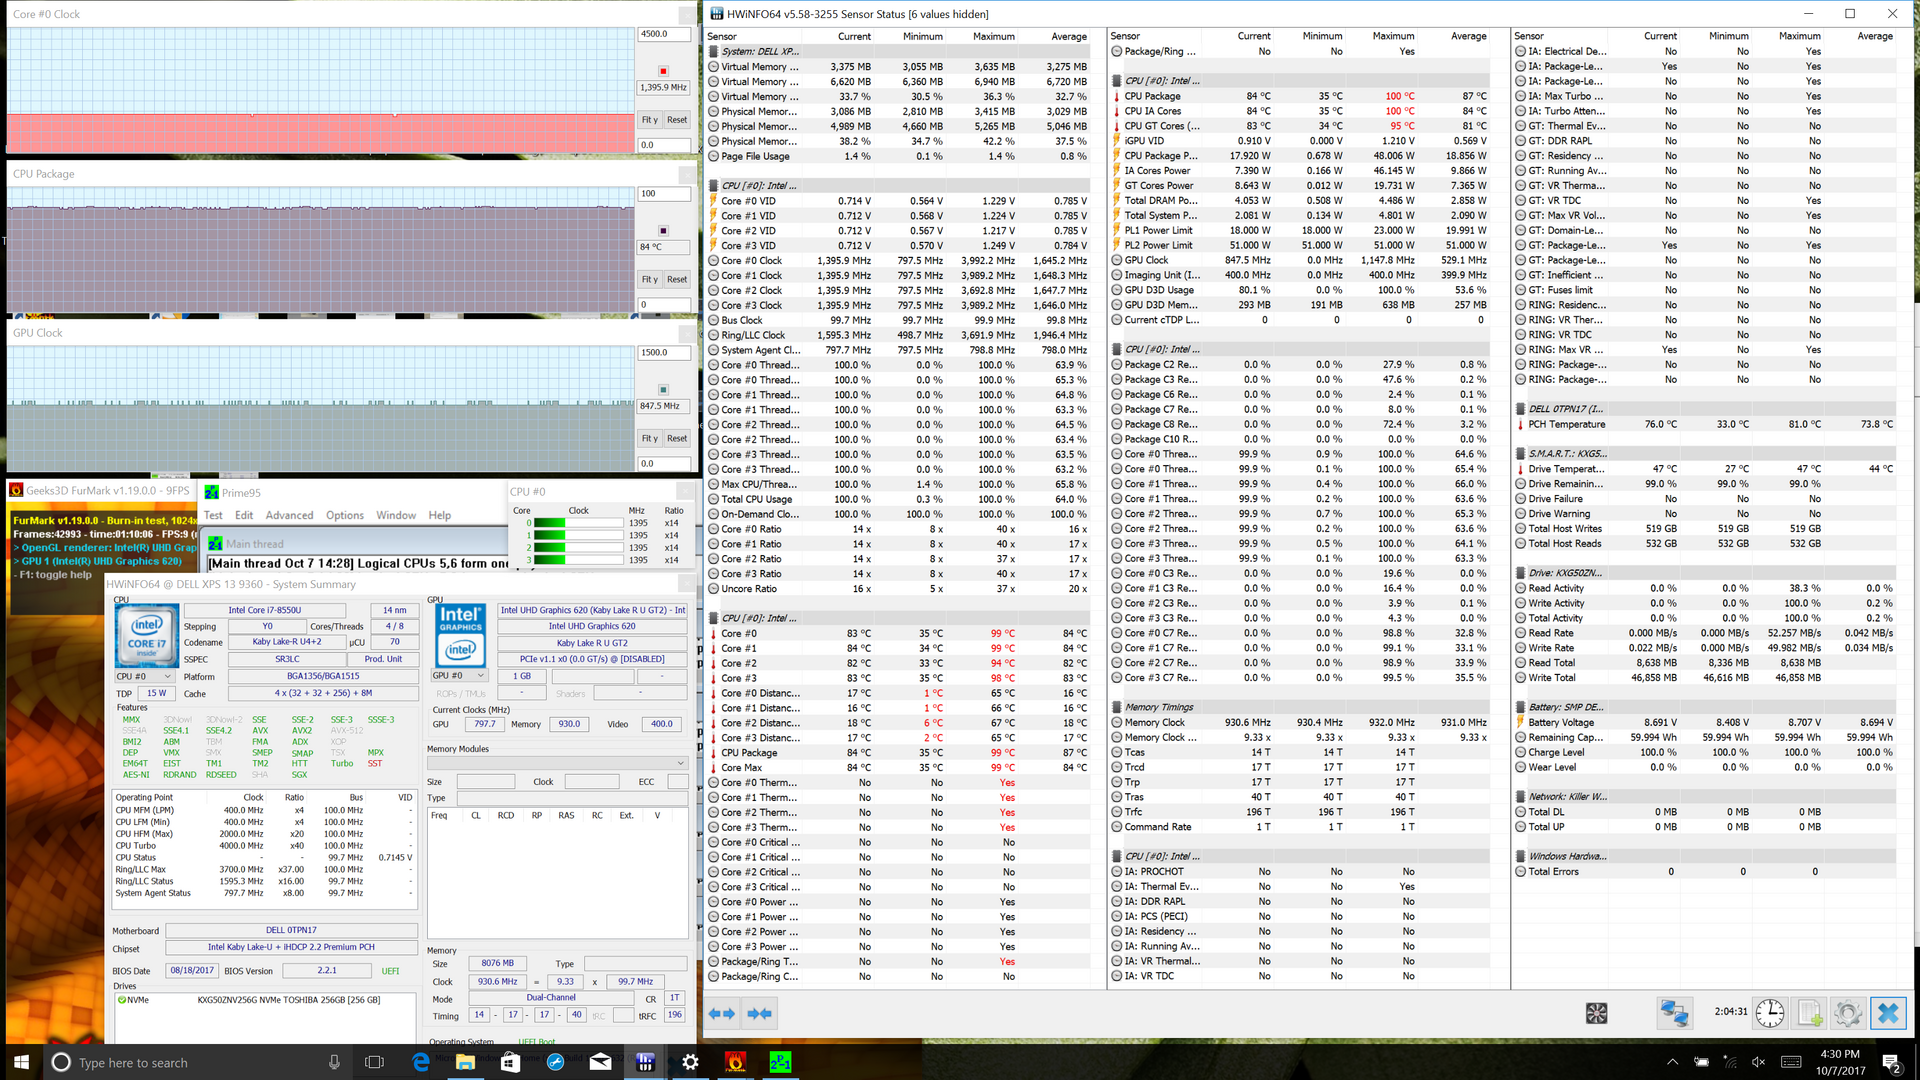
| CPU Clock (GHz) | GPU Clock (MHz) | Average CPU Temperature (°C) | |
| Prime95 Stress | 2.5 | -- | 92 |
| FurMark Stress | -- | 998 | 88 |
| Prime95 + FurMark Stress | 1.4 | 848 | 84 |
Emissions
System Noise
Unlike the noisy XPS 15, the smaller XPS 13 is generally very quiet. The fan is active during low loads like browsing and streaming but it is practically inaudible in an average home or office setting. Average load with 3DMark06 will bump the fan to just under 31 dB(A) while Prime95 and FurMark load is slightly higher at 33 dB(A). This is quieter than most competitors like the Spectre 13 where fan noise can be as loud as 40 dB(A) when under similar conditions.
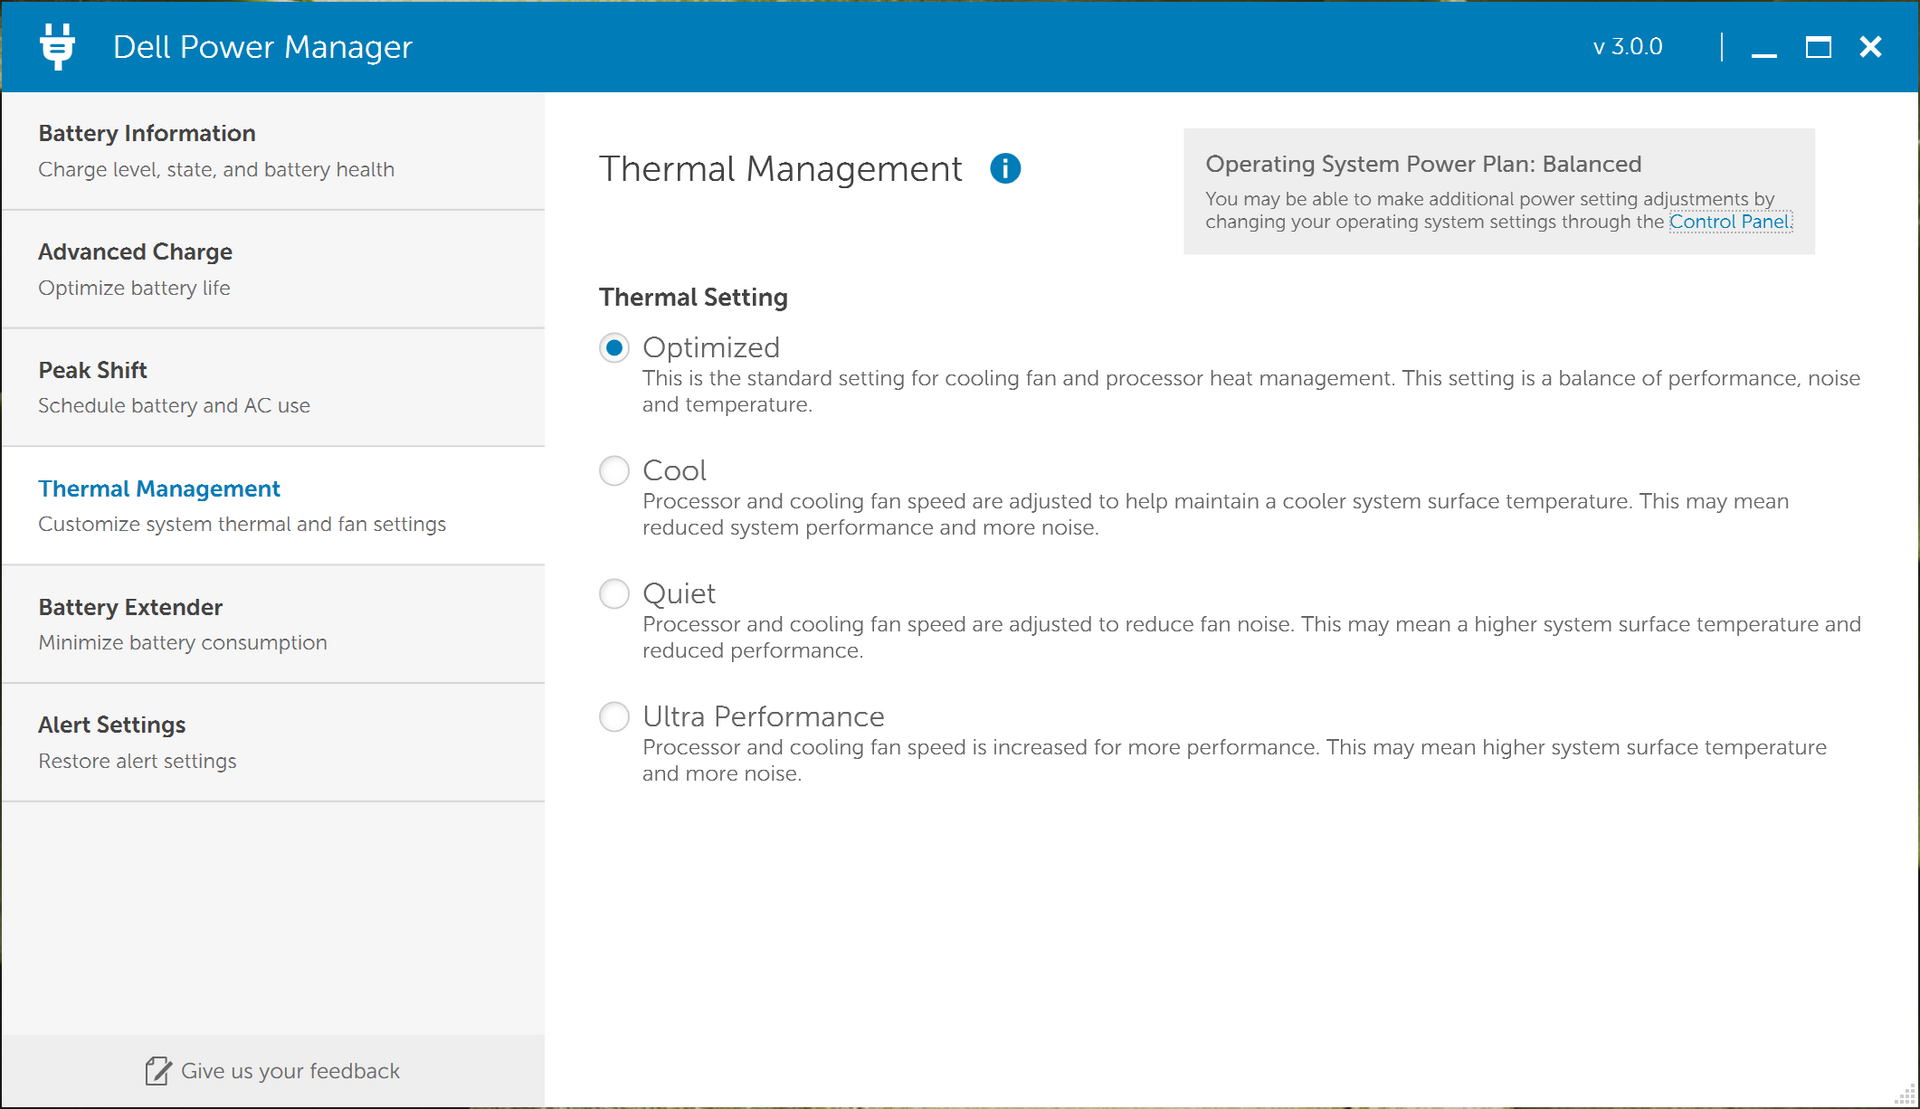
An option for higher fan RPMs would have been a great addition considering the very high core temperatures. The 'Ultra Performance' Thermal Setting does not raise the fan noise ceiling any higher and it instead causes the fan to pulsate more frequently. We recommend the ‘Quiet’ Thermal Setting instead of 'Optimized' or 'Ultra Performance' for low loads if silence is desired.
Our unit exhibits very slight coil whining when placing an ear next to the keyboard. Otherwise, it is unnoticeable during everyday use and is undetectable by our microphone.
Noise level
| Idle |
| 27.9 / 27.9 / 27.9 dB(A) |
| Load |
| 30.8 / 33.1 dB(A) |
 | ||
30 dB silent 40 dB(A) audible 50 dB(A) loud |
||
min: | ||
| Dell XPS 13 i7-8550U UHD Graphics 620, i5-8550U, Toshiba XG5 KXG50ZNV256G | Samsung Notebook 9 NP900X3N-K01US HD Graphics 620, i5-7200U, Samsung CM871a MZNTY256HDHP | Huawei MateBook X HD Graphics 620, i5-7200U, LITEON CB1-SD256 | Asus ZenBook Flip S UX370 HD Graphics 620, i5-7200U, SanDisk SD8SN8U256G1002 | Dell XPS 13 9360 FHD i7 Iris Iris Plus Graphics 640, i7-7560U, Toshiba XG4 NVMe (THNSN5512GPUK) | Dell XPS 13 9360 FHD i5 HD Graphics 620, i5-7200U, Toshiba NVMe THNSN5256GPUK | |
|---|---|---|---|---|---|---|
| Noise | -4% | -8% | -8% | -3% | ||
| off / environment * (dB) | 27.9 | 28.4 -2% | 30.5 -9% | 29.9 -7% | ||
| Idle Minimum * (dB) | 27.9 | 28.4 -2% | 30.5 -9% | 29.9 -7% | 28.9 -4% | |
| Idle Average * (dB) | 27.9 | 28.4 -2% | 30.5 -9% | 29.9 -7% | 28.9 -4% | |
| Idle Maximum * (dB) | 27.9 | 28.4 -2% | 30.5 -9% | 30.3 -9% | 28.9 -4% | |
| Load Average * (dB) | 30.8 | 33.2 -8% | 34.2 -11% | 33.9 -10% | 30.9 -0% | |
| Load Maximum * (dB) | 33.1 | 35.2 -6% | 32.5 2% | 34.9 -5% | 33.5 -1% |
* ... smaller is better
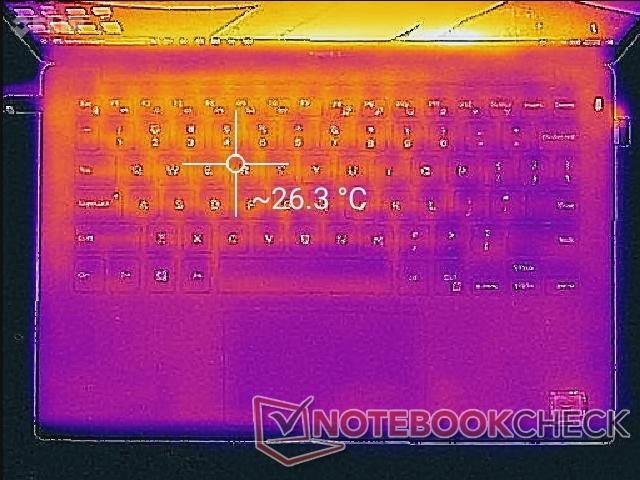
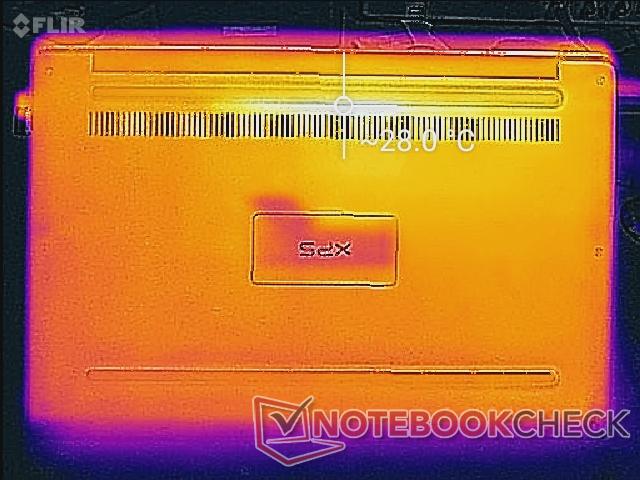
Temperature
Surface temperatures are measurably warmer on the new XPS 13 when compared to the older i5-7200U SKU due to the much warmer running temperatures of the i7-8550U CPU as shown in the Stress Test section above. A keyboard temperature of 49 C was recorded when under maximum processing load compared to 44 C on the i5-7200U SKU. This is an unlikely scenario during day-to-day use, but do expect warmer keys overall especially on the left half of the keyboard.
Fortunately, the palm rests and trackpad remain relatively cool no matter the processing load since the battery occupies the entire front third of the chassis design. This approach is becoming increasingly common on newer Ultrabooks.
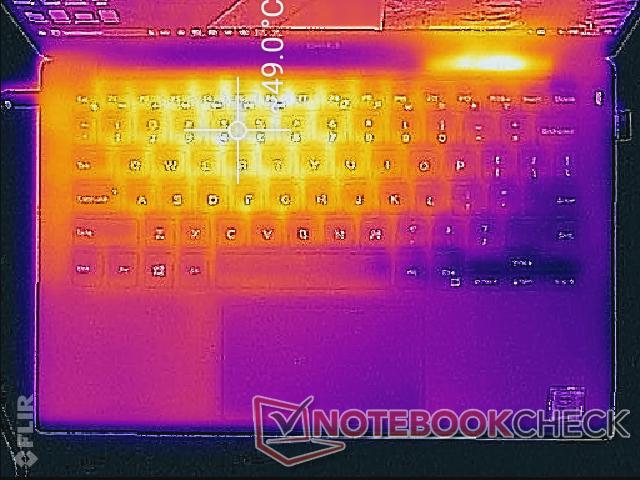
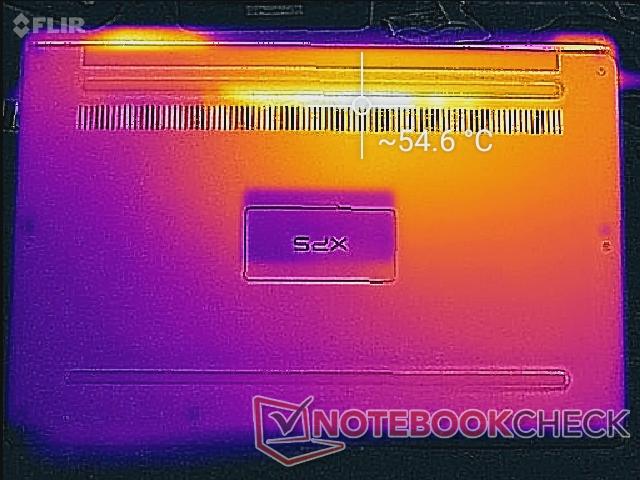
(-) The maximum temperature on the upper side is 49 °C / 120 F, compared to the average of 35.9 °C / 97 F, ranging from 21.4 to 59 °C for the class Subnotebook.
(-) The bottom heats up to a maximum of 54 °C / 129 F, compared to the average of 39.2 °C / 103 F
(+) In idle usage, the average temperature for the upper side is 25.7 °C / 78 F, compared to the device average of 30.8 °C / 87 F.
(+) The palmrests and touchpad are reaching skin temperature as a maximum (32.2 °C / 90 F) and are therefore not hot.
(-) The average temperature of the palmrest area of similar devices was 28.2 °C / 82.8 F (-4 °C / -7.2 F).
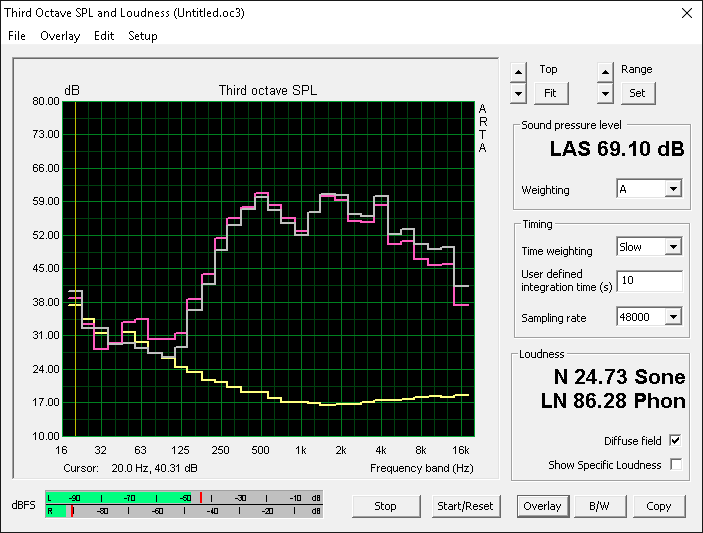
Speakers
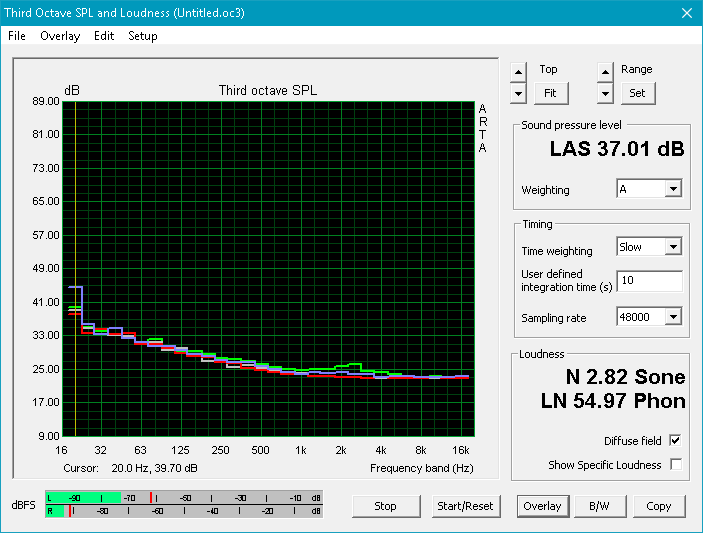
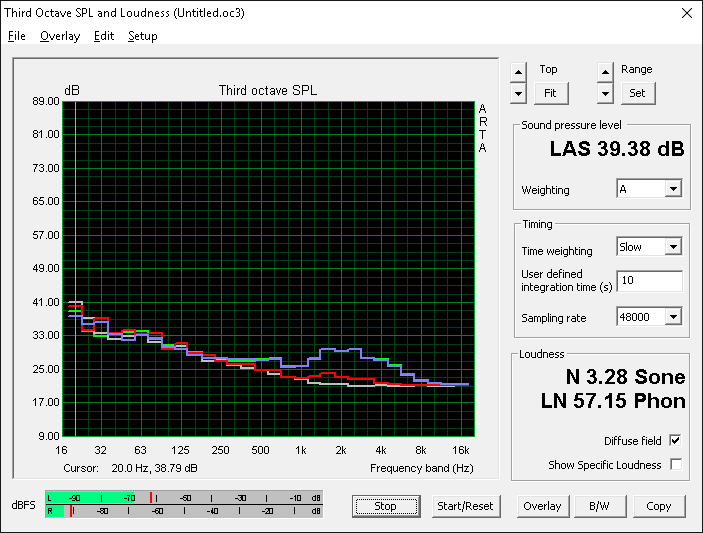
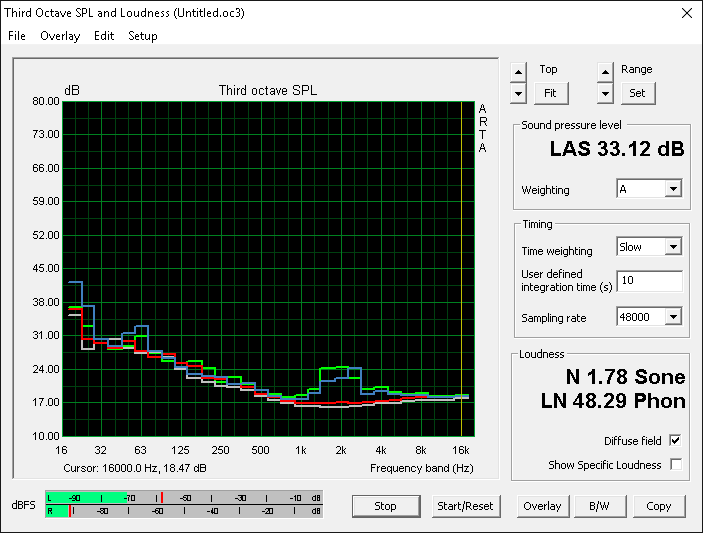
The 1 W stereo speakers remain unchanged. Sound quality is very good considering the subnotebook class. We recommend enabling the equalizer in order to boost bass reproduction. Our Pink noise graphs below show a noticeable difference in the reproduction of lower frequencies when MaxxBass is enabled.
The repercussion of a high MaxxBass setting is the reverberation and rattling of the chassis when on very high volume settings. Thus, MaxxBass is only recommended if the volume is at 80 percent or under.


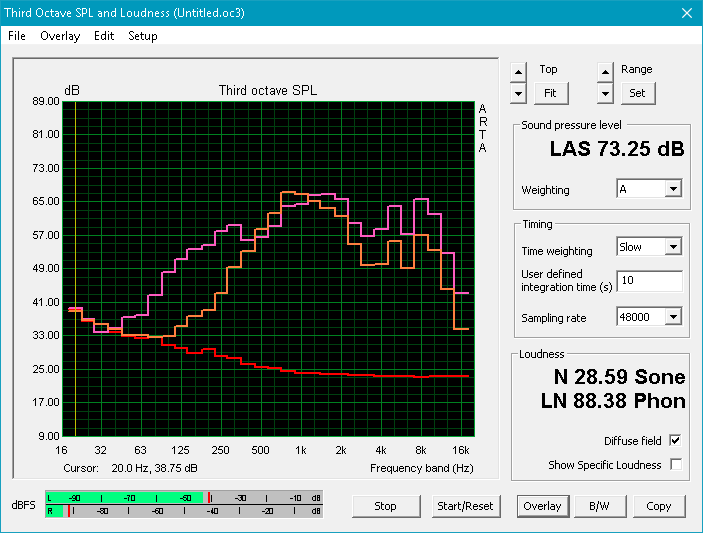
Dell XPS 13 i7-8550U audio analysis
(-) | not very loud speakers (66.8 dB)
Bass 100 - 315 Hz
(+) | good bass - only 4.5% away from median
(±) | linearity of bass is average (8.2% delta to prev. frequency)
Mids 400 - 2000 Hz
(±) | higher mids - on average 5% higher than median
(+) | mids are linear (5.8% delta to prev. frequency)
Highs 2 - 16 kHz
(+) | balanced highs - only 3% away from median
(±) | linearity of highs is average (14.5% delta to prev. frequency)
Overall 100 - 16.000 Hz
(±) | linearity of overall sound is average (17.2% difference to median)
Compared to same class
» 44% of all tested devices in this class were better, 9% similar, 47% worse
» The best had a delta of 5%, average was 18%, worst was 53%
Compared to all devices tested
» 32% of all tested devices were better, 8% similar, 60% worse
» The best had a delta of 4%, average was 24%, worst was 134%
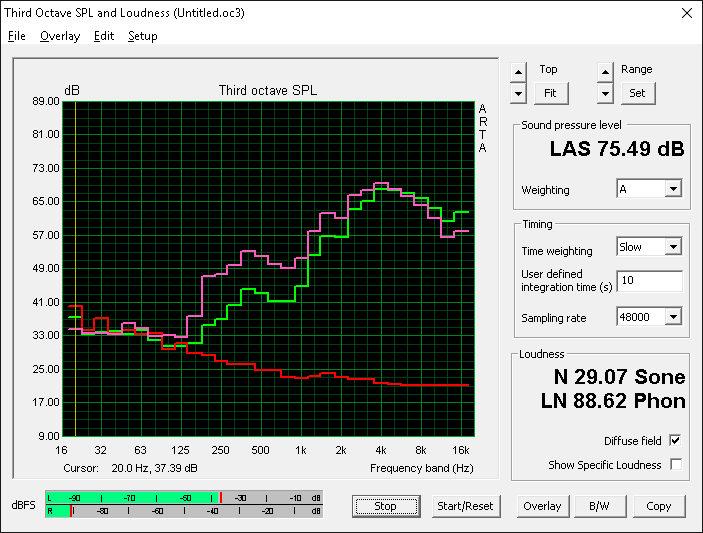
Apple MacBook 12 (Early 2016) 1.1 GHz audio analysis
(+) | speakers can play relatively loud (83.6 dB)
Bass 100 - 315 Hz
(±) | reduced bass - on average 11.3% lower than median
(±) | linearity of bass is average (14.2% delta to prev. frequency)
Mids 400 - 2000 Hz
(+) | balanced mids - only 2.4% away from median
(+) | mids are linear (5.5% delta to prev. frequency)
Highs 2 - 16 kHz
(+) | balanced highs - only 2% away from median
(+) | highs are linear (4.5% delta to prev. frequency)
Overall 100 - 16.000 Hz
(+) | overall sound is linear (10.2% difference to median)
Compared to same class
» 7% of all tested devices in this class were better, 2% similar, 91% worse
» The best had a delta of 5%, average was 18%, worst was 53%
Compared to all devices tested
» 5% of all tested devices were better, 1% similar, 94% worse
» The best had a delta of 4%, average was 24%, worst was 134%
Frequency Comparison (Checkbox selectable!)
Graph 1: Pink Noise 100% Vol.; Graph 2: Audio off
Energy Management
Power Consumption
Power demand when idling is about the same as older XPS 13 units at 4 W to 6 W depending on screen brightness. This changes when the new XPS 13 is subjected to medium (3DMark06) load where we can record a significantly higher demand of 42 W compared to just 32 W and 27 W on the i7-7560U and 7500U SKUs, respectively. The higher consumption may be contributed to the initial burst of very high Turbo Boost values before clock rates and power draw settle at lower numbers. Indeed, power consumption is only 38 W after the third run of 3DMark06.
Maximum load with Prime95 and FurMark running simultaneously will demand about 41 W due to performance throttling. The small AC adapter (~8.7 x 5.5 x 2.5 cm) is only rated for 45 W and so there is very little power headroom available.
| Off / Standby | |
| Idle | |
| Load |
|
Key:
min: | |
| Dell XPS 13 i7-8550U i5-8550U, UHD Graphics 620, Toshiba XG5 KXG50ZNV256G, IGZO IPS, 3200x1800, 13.3" | Samsung Notebook 9 NP900X3N-K01US i5-7200U, HD Graphics 620, Samsung CM871a MZNTY256HDHP, IPS, 1920x1080, 13.3" | Asus ZenBook Flip S UX370 i5-7200U, HD Graphics 620, SanDisk SD8SN8U256G1002, a-Si TFT-LCD, WLED, 1920x1080, 13.3" | Dell XPS 13 9360 FHD i7 Iris i7-7560U, Iris Plus Graphics 640, Toshiba XG4 NVMe (THNSN5512GPUK), IPS, 1920x1080, 13.3" | Dell XPS 13 9360 QHD+ i7 i7-7500U, HD Graphics 620, Toshiba NVMe THNSN5256GPUK, IPS, 3200x1800, 13.3" | HP Spectre 13-v131ng i7-7500U, HD Graphics 620, Samsung PM961 NVMe MZVLW512HMJP, IPS UWVA, 1920x1080, 13.3" | |
|---|---|---|---|---|---|---|
| Power Consumption | -29% | 14% | 7% | -5% | -3% | |
| Idle Minimum * (Watt) | 4.1 | 3.8 7% | 2.6 37% | 3.32 19% | 6.4 -56% | 3.6 12% |
| Idle Average * (Watt) | 5.8 | 11 -90% | 5.3 9% | 5.27 9% | 6.6 -14% | 6.4 -10% |
| Idle Maximum * (Watt) | 6 | 11.3 -88% | 8.5 -42% | 6.32 -5% | 6.8 -13% | 9.2 -53% |
| Load Average * (Watt) | 42.5 | 35.6 16% | 29 32% | 32 25% | 27.5 35% | 34 20% |
| Load Maximum * (Watt) | 41.4 | 37.2 10% | 27 35% | 45.9 -11% | 32.4 22% | 34.4 17% |
* ... smaller is better
Battery Life
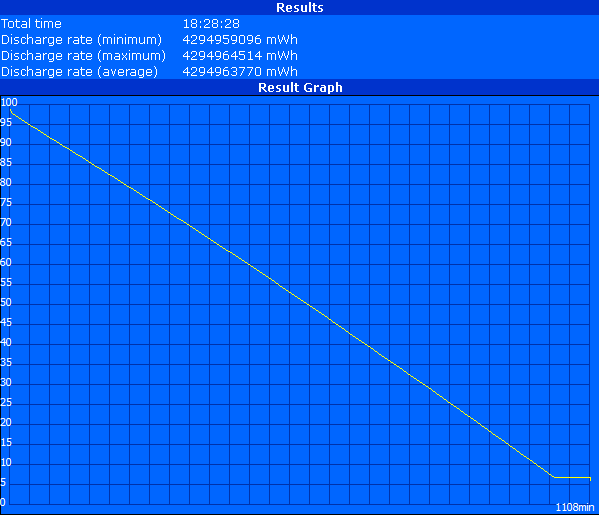
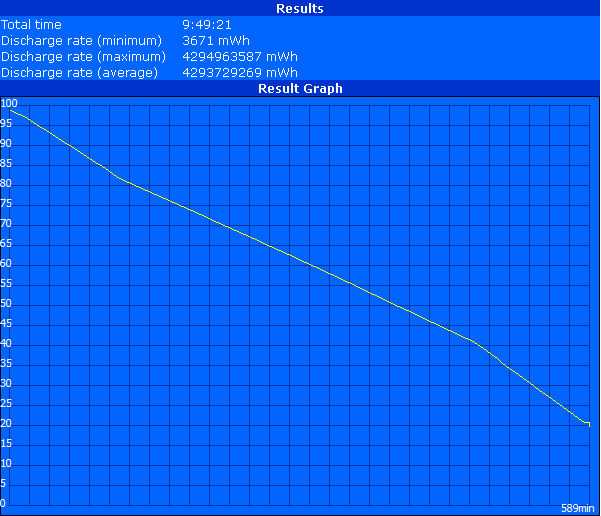
Runtimes are not significantly different than the last generation XPS 13 with the i5-7200U CPU. Owners can expect about 9 to 10 hours of real-world WLAN use before needing to recharge. Battery capacity is still one of the largest for a subnotebook at twice that of the Samsung Notebook 9.
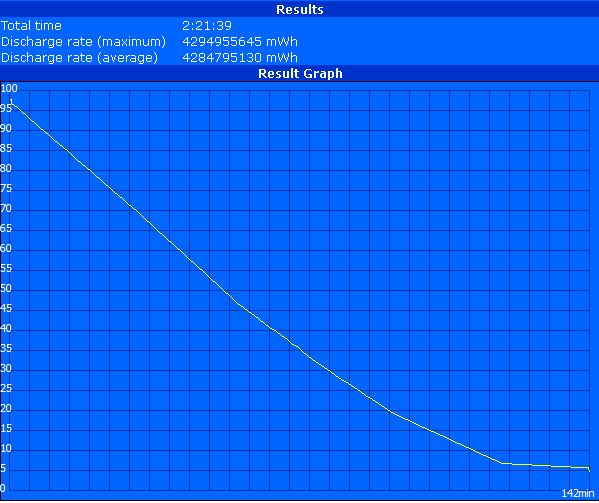
For reasons unknown, our test unit decided to power down at 20 percent during our WLAN test despite our Reader and Load tests lasting until 5 percent battery capacity. We suspect that the Dell Power Manager settings had automatically changed to override the Windows battery settings during the test. As a result, the recorded data is about an hour shorter than on our last generation XPS 13 test units. Extrapolating from the graph below shows a runtime closer to 11 hours had the battery lasted to the standard 5 percent capacity before automatic shutdown.
Charging from empty to full capacity will take just under two hours.
| Dell XPS 13 i7-8550U i5-8550U, UHD Graphics 620, 60 Wh | Samsung Notebook 9 NP900X3N-K01US i5-7200U, HD Graphics 620, 30 Wh | Huawei MateBook X i5-7200U, HD Graphics 620, 40 Wh | Asus ZenBook Flip S UX370 i5-7200U, HD Graphics 620, 39 Wh | Dell XPS 13 9360 FHD i7 Iris i7-7560U, Iris Plus Graphics 640, 60 Wh | Dell XPS 13 9360 FHD i5 i5-7200U, HD Graphics 620, 60 Wh | |
|---|---|---|---|---|---|---|
| Battery runtime | -49% | -28% | -10% | 19% | 13% | |
| Reader / Idle (h) | 18.5 | 11.6 -37% | 8.5 -54% | 15.6 -16% | 25.4 37% | 21.6 17% |
| WiFi v1.3 (h) | 9.8 | 4.7 -52% | 5.6 -43% | 8.1 -17% | 10.9 11% | 11.3 15% |
| Load (h) | 2.4 | 1 -58% | 2.7 13% | 2.5 4% | 2.6 8% | 2.6 8% |
Pros
Cons
Verdict
Dell's main intention with the 8th gen Kaby Lake-R XPS 13 was to boost CPU performance through improved temperature monitoring. Thus, this latest iteration was designed to run at higher core temperatures than the previous SKUs without negatively impacting user experience or raising surface temperatures to uncomfortable levels. Our tests more or less echo these claims as core temperatures can hover over 90 C when under heavy load without affecting needing to bump up maximum fan speeds. Surface temperatures will be slightly warmer on certain parts of the keyboard, but the palm rests and trackpad never become uncomfortable.
Other than the significant leap in CPU performance and minor improvement in GPU performance, there are no surprises left for this XPS 13 generation. The same pros and cons from our previous reviews remain. There is a case for purchasing the XPS 13 i7-7560U SKU instead of the i7-8550U SKU as the Iris graphics performs 18 percent faster than the UHD Graphics 620, but CPU performance is much slower by about 40 percent. Demanding applications that take advantage of the higher core count will absolutely love Kaby Lake-R and the new XPS 13. There's still room for improvement as the steady 2.5 GHz clock rate is a far cry from the rated 3.7 GHz. Thus, it will be interesting to see how other Ultrabooks sporting this same CPU will perform in the coming weeks.
The XPS 13 is once again a very strong contender in the subnotebook space for this Holiday season. The performance boost is as advertised even though we had hoped for better Turbo Boost sustainability over longer periods.
Dell XPS 13 i7-8550U
- 10/12/2017 v6 (old)
Allen Ngo
Price comparison
