Dell XPS 13 9350 (i7-6560U, QHD+) Ultrabook Review

We've checked out a fair number of XPS 13 SKUs in the past year to provide a good sense of differences and similarities between each model. Our test unit today, however, will be our first with Iris Graphics 540.
We recommend checking out our previous reviews on the XPS 13 series for more information on the chassis and features as this review will focus more on performance and hardware measurements.
Case
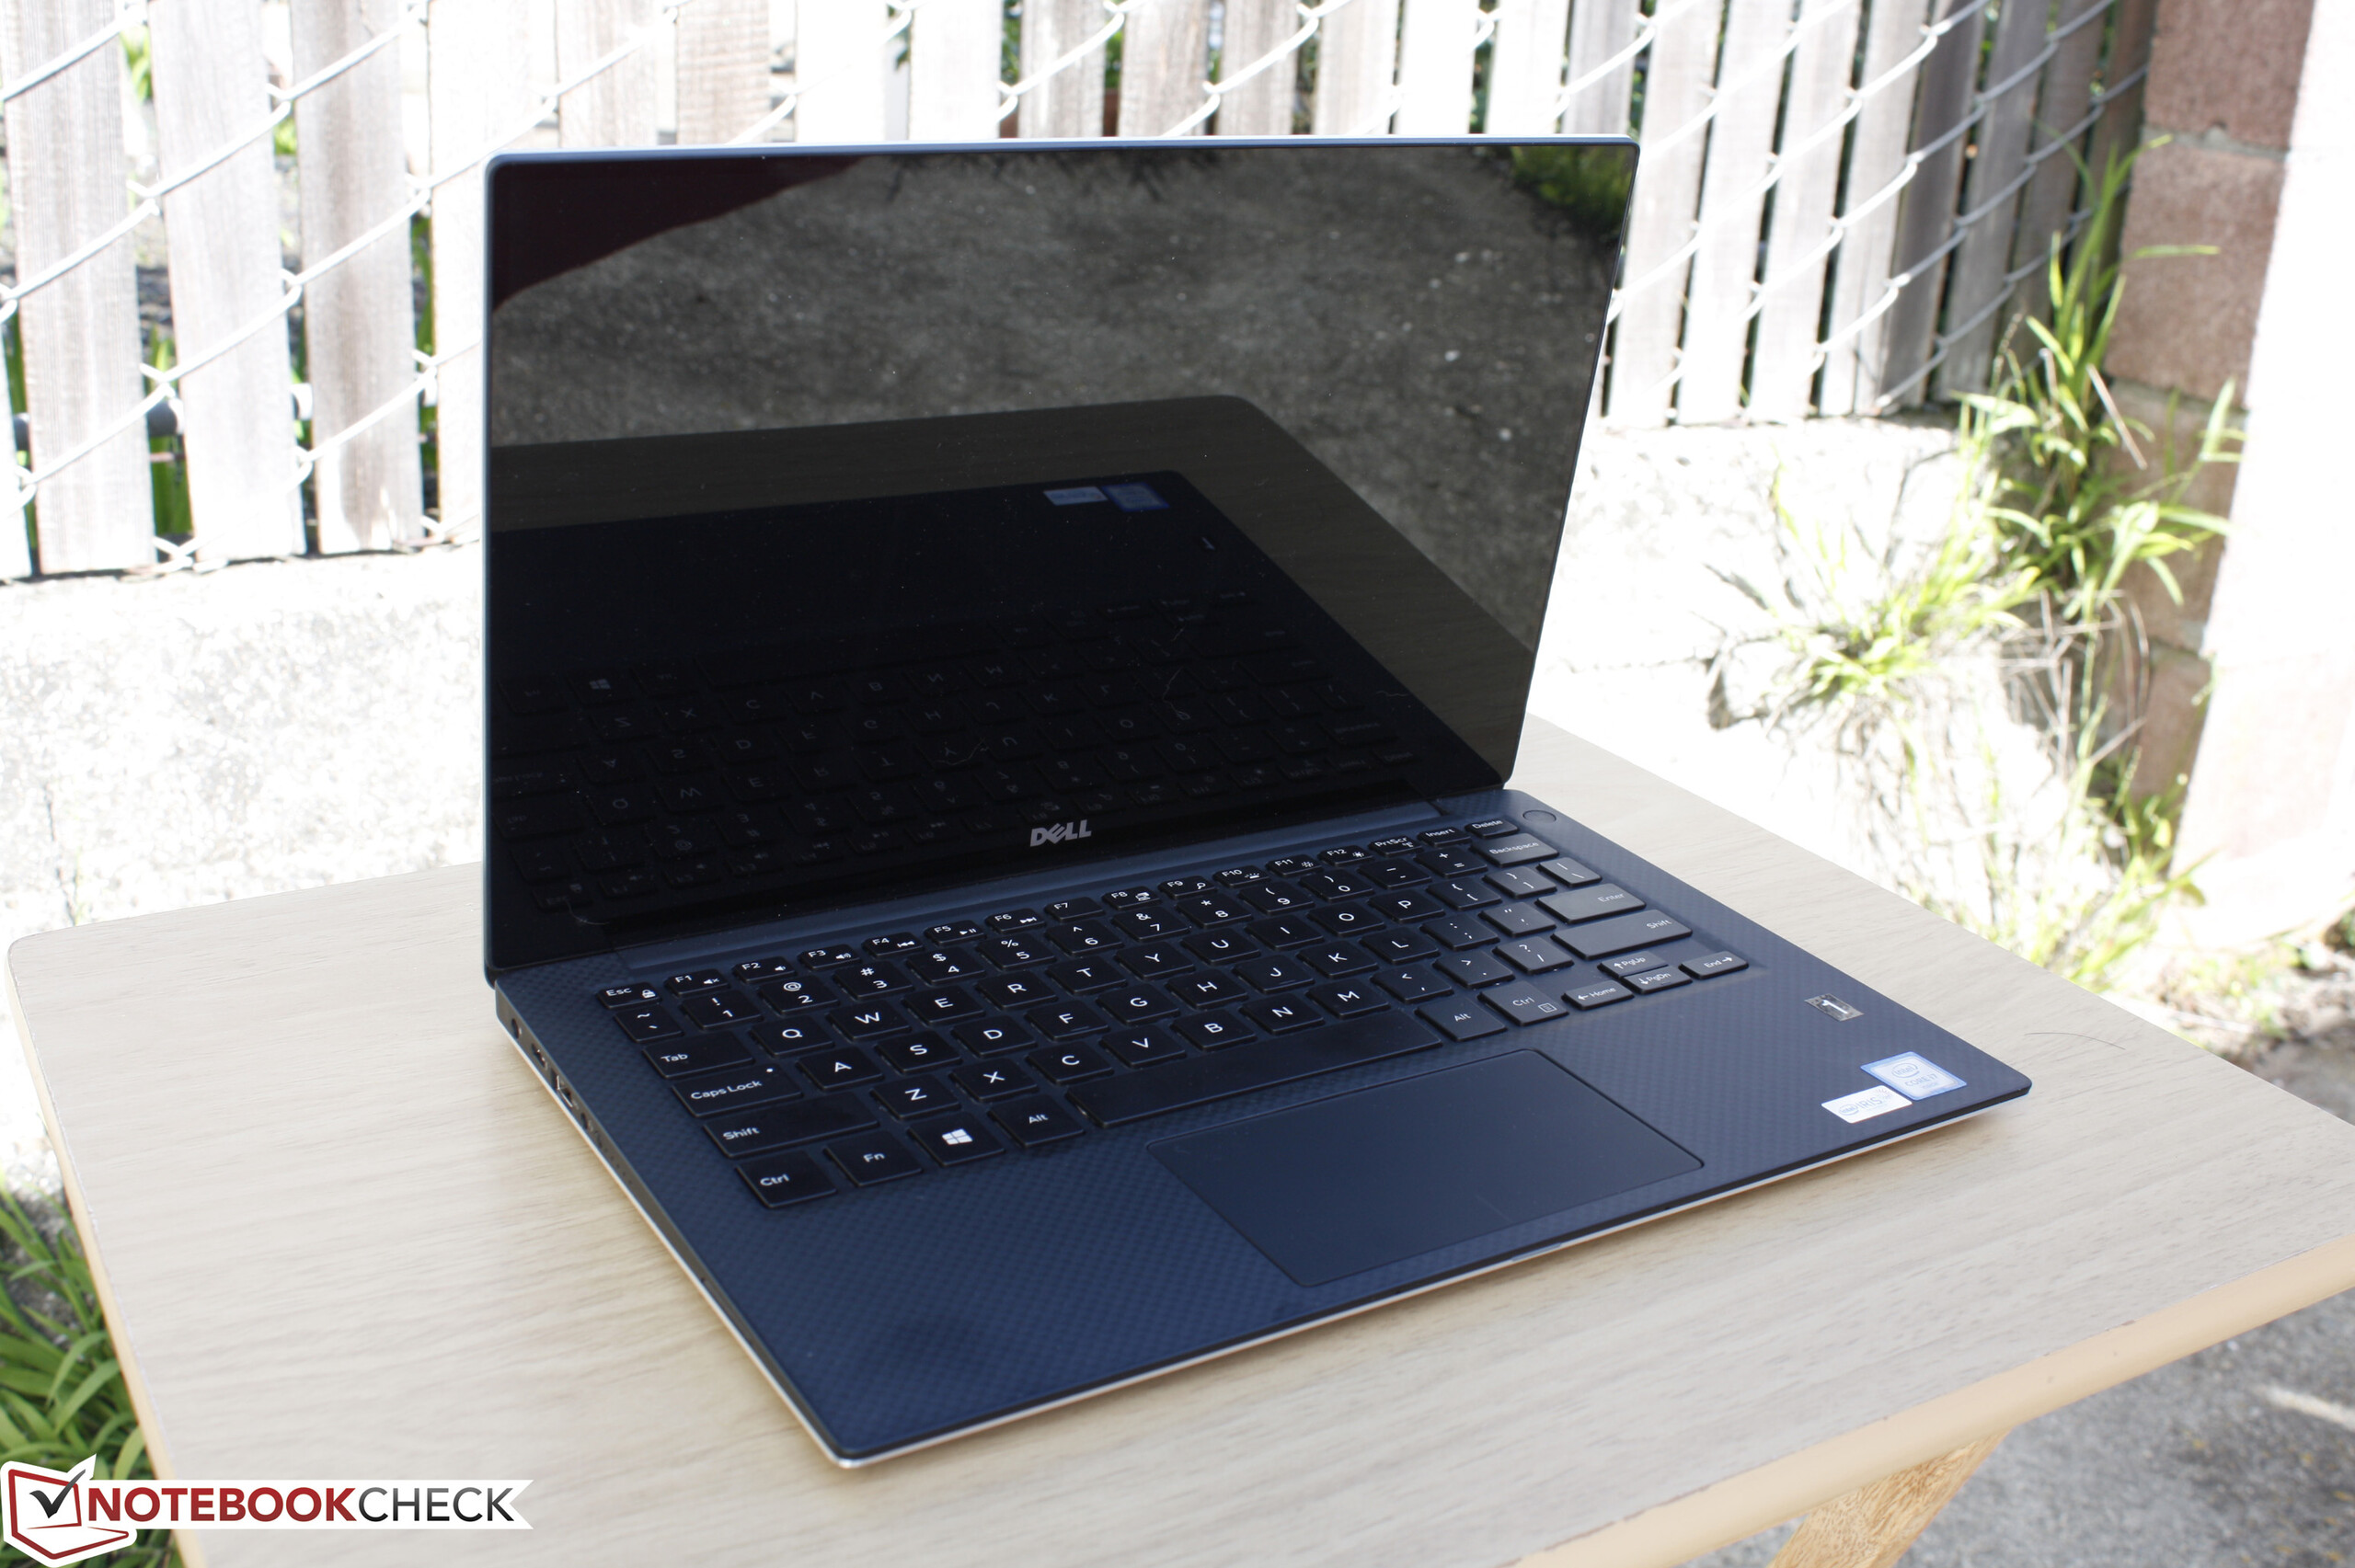
The previous Dell XPS 13 9333 design was already quite small in length and width, but the latest XPS 13 9350 refresh is even smaller and thinner without necessarily sacrificing rigidity. We can't stress enough how portable the notebook is for a 13-inch screen size as the super narrow bezel has made all the difference. Nonetheless, the XPS 13 is not the thinnest nor is it the lightest as the Lenovo Yoga 900 edges out the Dell by just a hair in both categories (14.9 mm vs 15.0 mm, 1.27 kg vs. 1.33 kg).
Note that the added glass panel over the touchscreen adds about a 100 g to the final weight compared to our previous test unit with the more standard matte FHD panel.
Connectivity
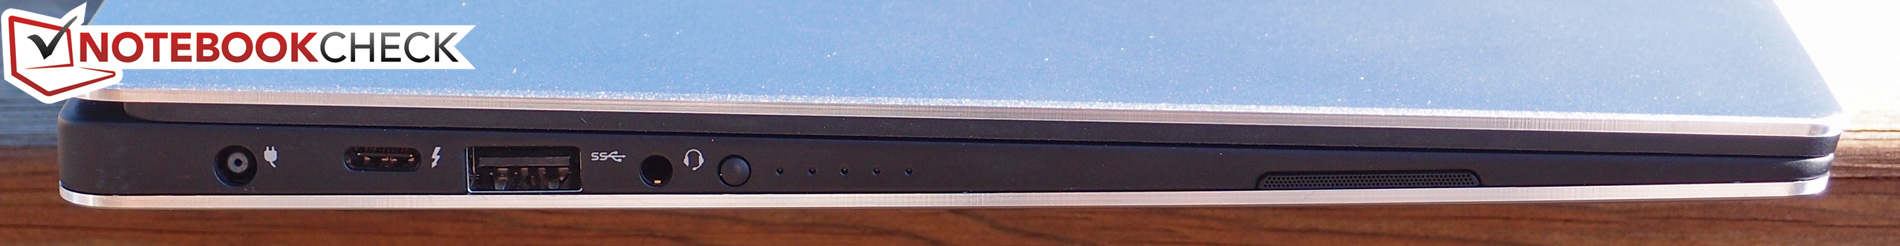
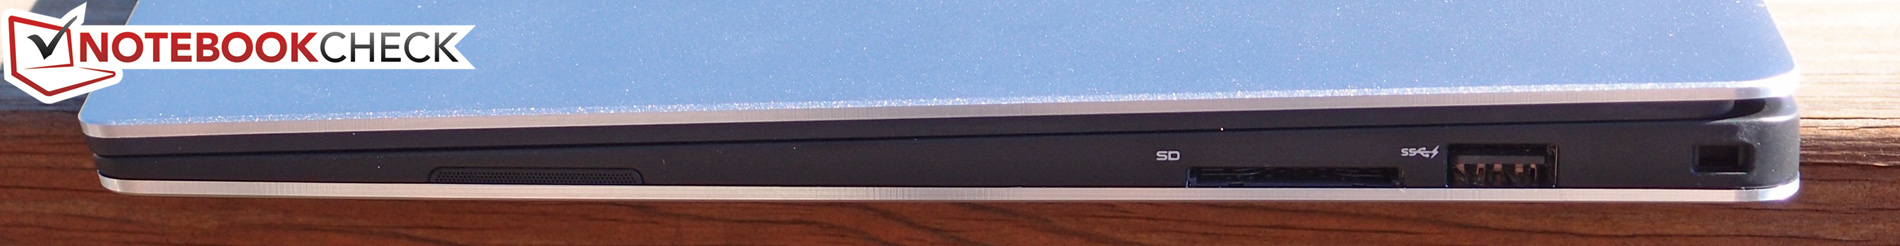
There are only a few available ports due to the size and design of the notebook. Owners will be pushed towards USB Type-C adapters for docks and other functionality. Dell offers the all-in-one DA200 USB Type-C adapter for added HDMI, VGA, USB, and RJ-45.
Display
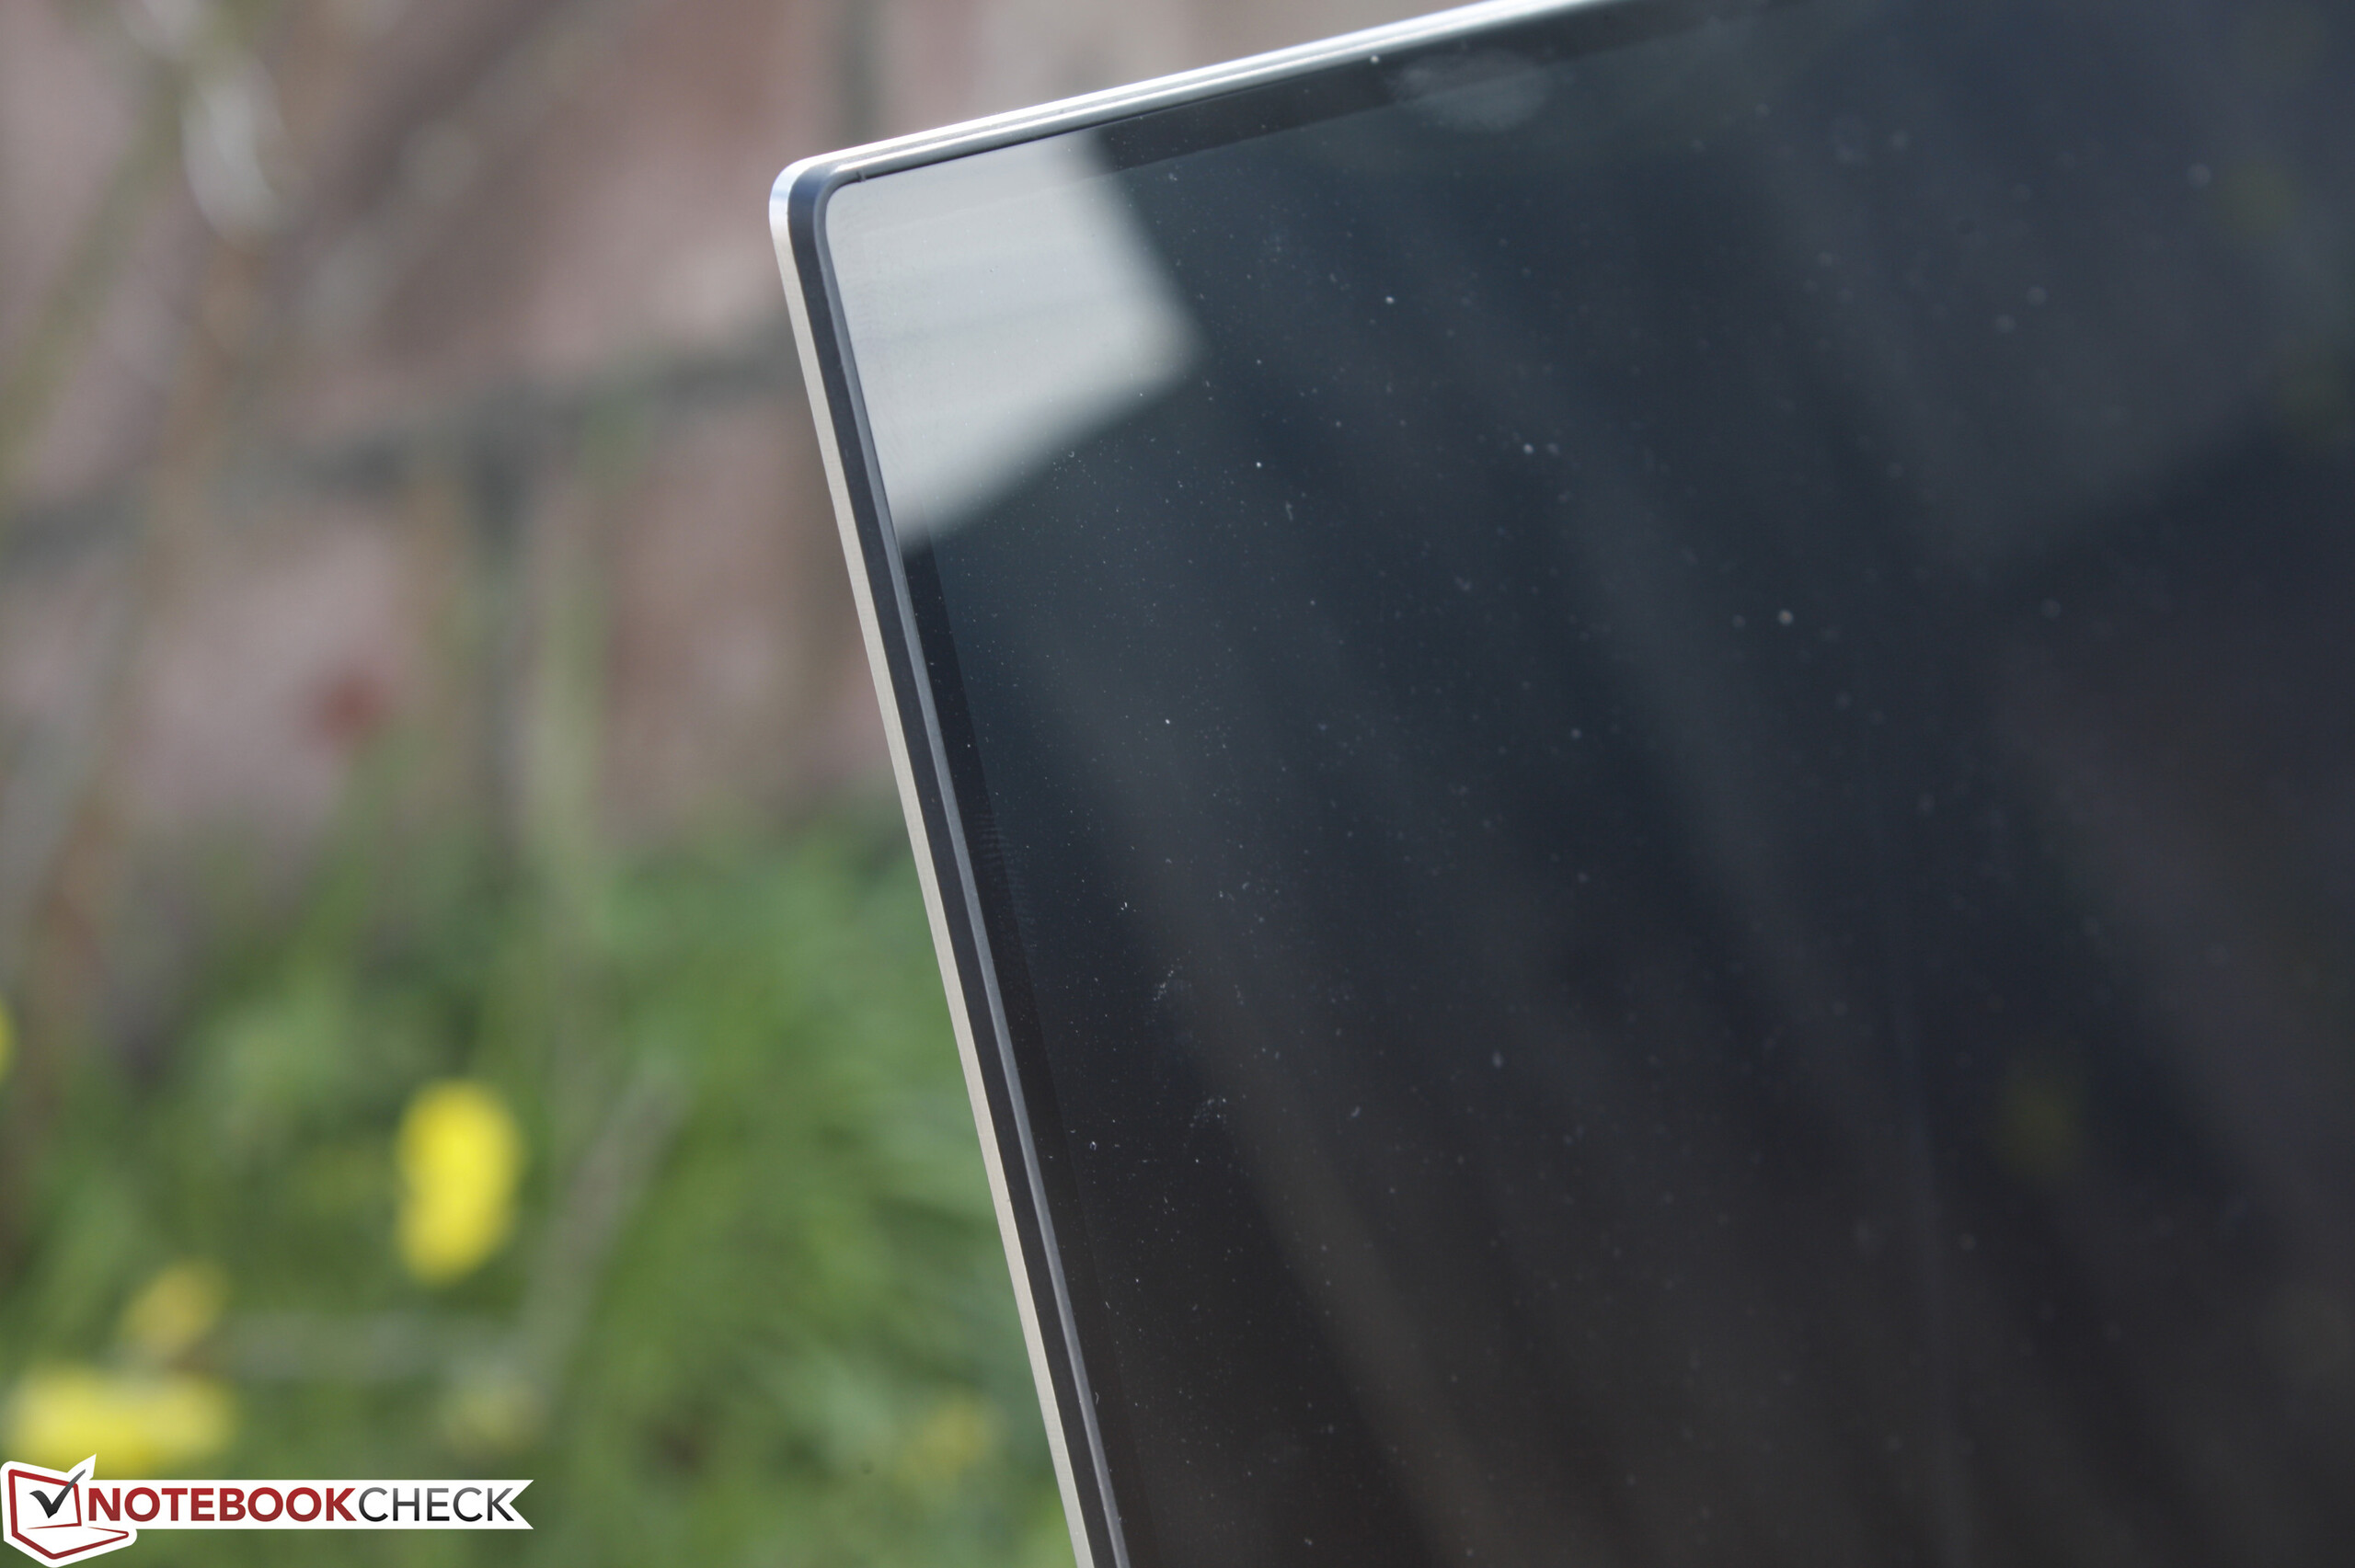
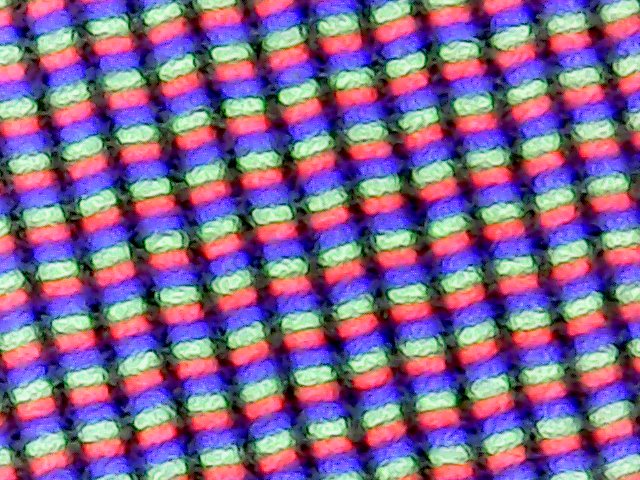
The QHD+ touchscreen provides a dense PPI of 276 with contrast exceeding that of many of its competitors without sacrificing display backlight. Needless to say, texts and images are incredibly crisp with plenty of resolution space for multiple windows. Unlike on the QHD+ Zenbook UX303UB or Yoga 900, Dell has elected to not use a RGBW pixel array.
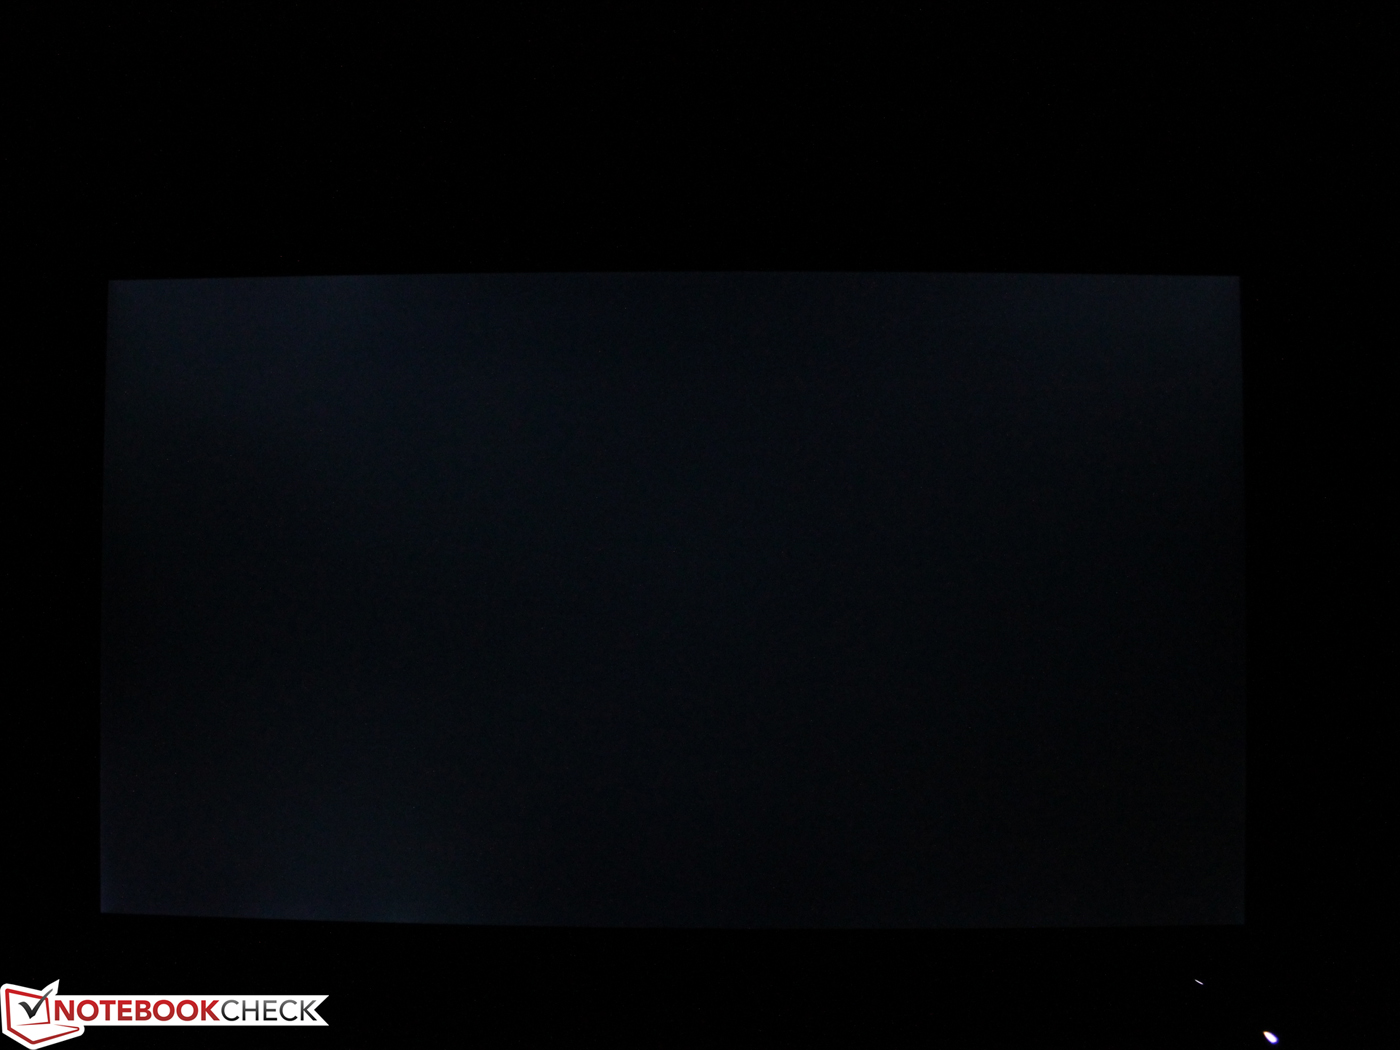
Backlight bleeding around the edges and corners are very minimal and essentially unnoticeable during everyday use or movie playback. Its SHP144A (LQ133Z1) panel can also be found on last year's XPS 13, albeit with a much brighter backlight for this latest iteration. Color reproduction is otherwise nearly identical between the XPS 13 9343 QHD+ and XPS 13 9350 QHD+ models.
| |||||||||||||||||||||||||
Brightness Distribution: 92 %
Center on Battery: 307.5 cd/m²
Contrast: 1486:1 (Black: 0.207 cd/m²)
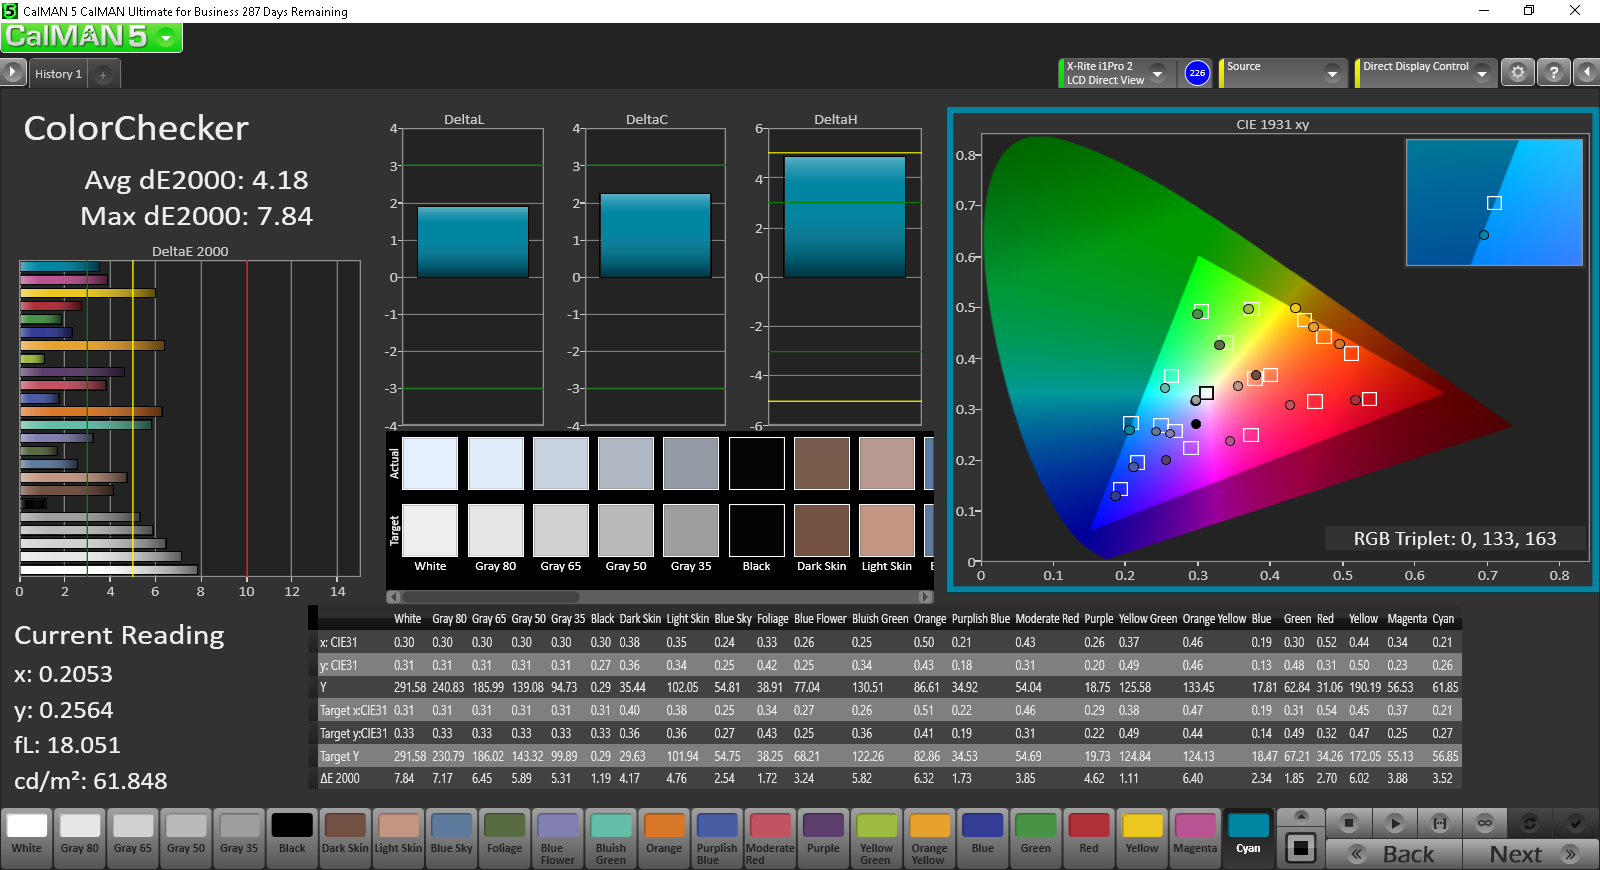
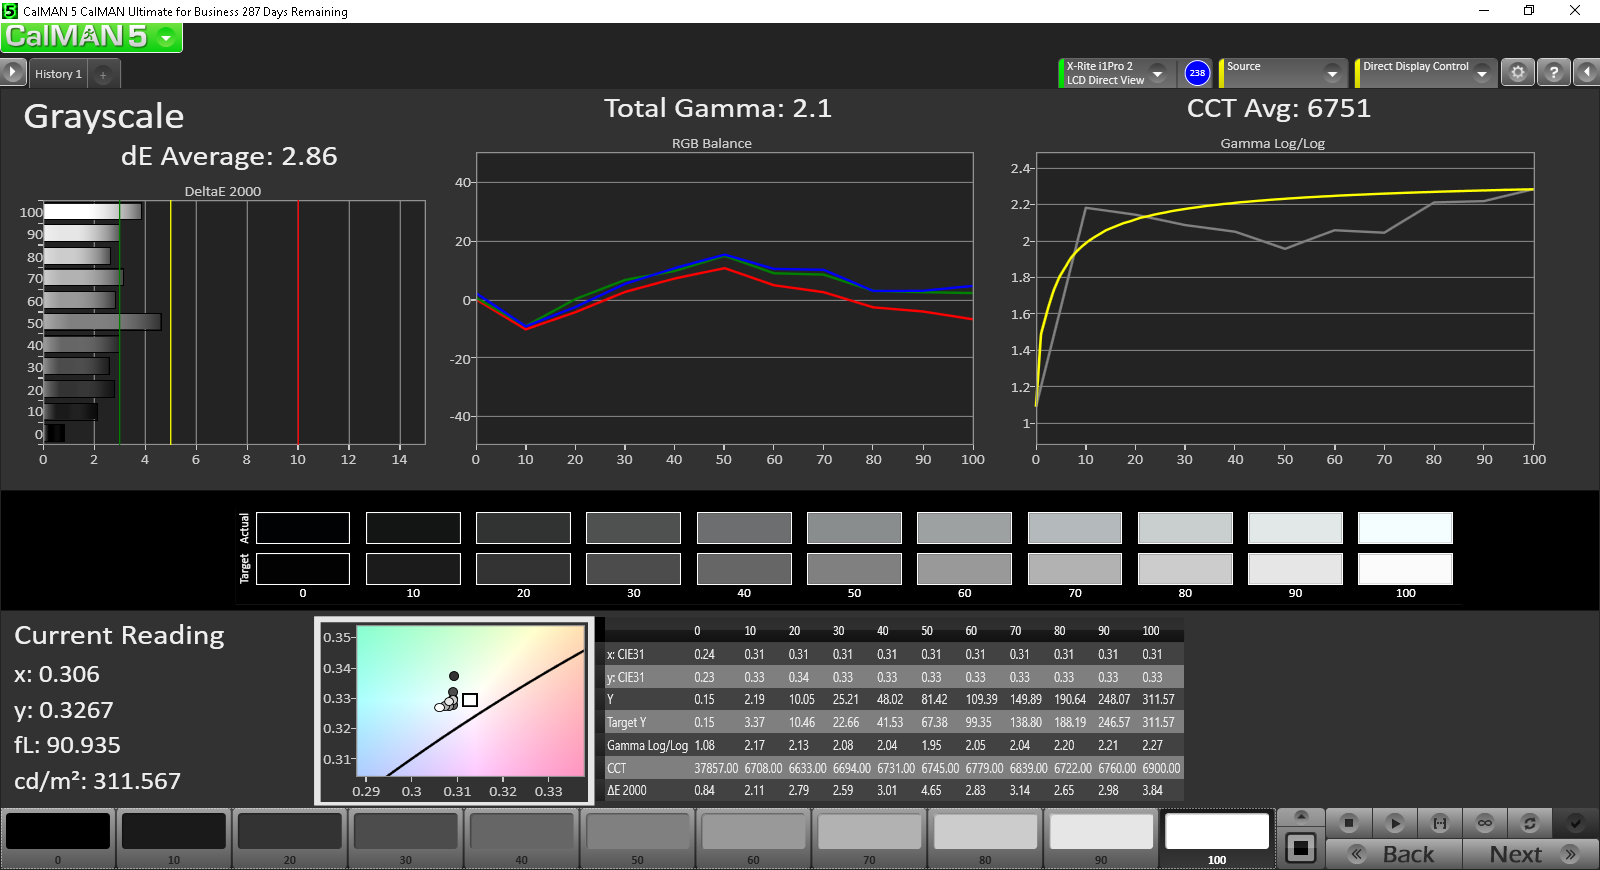
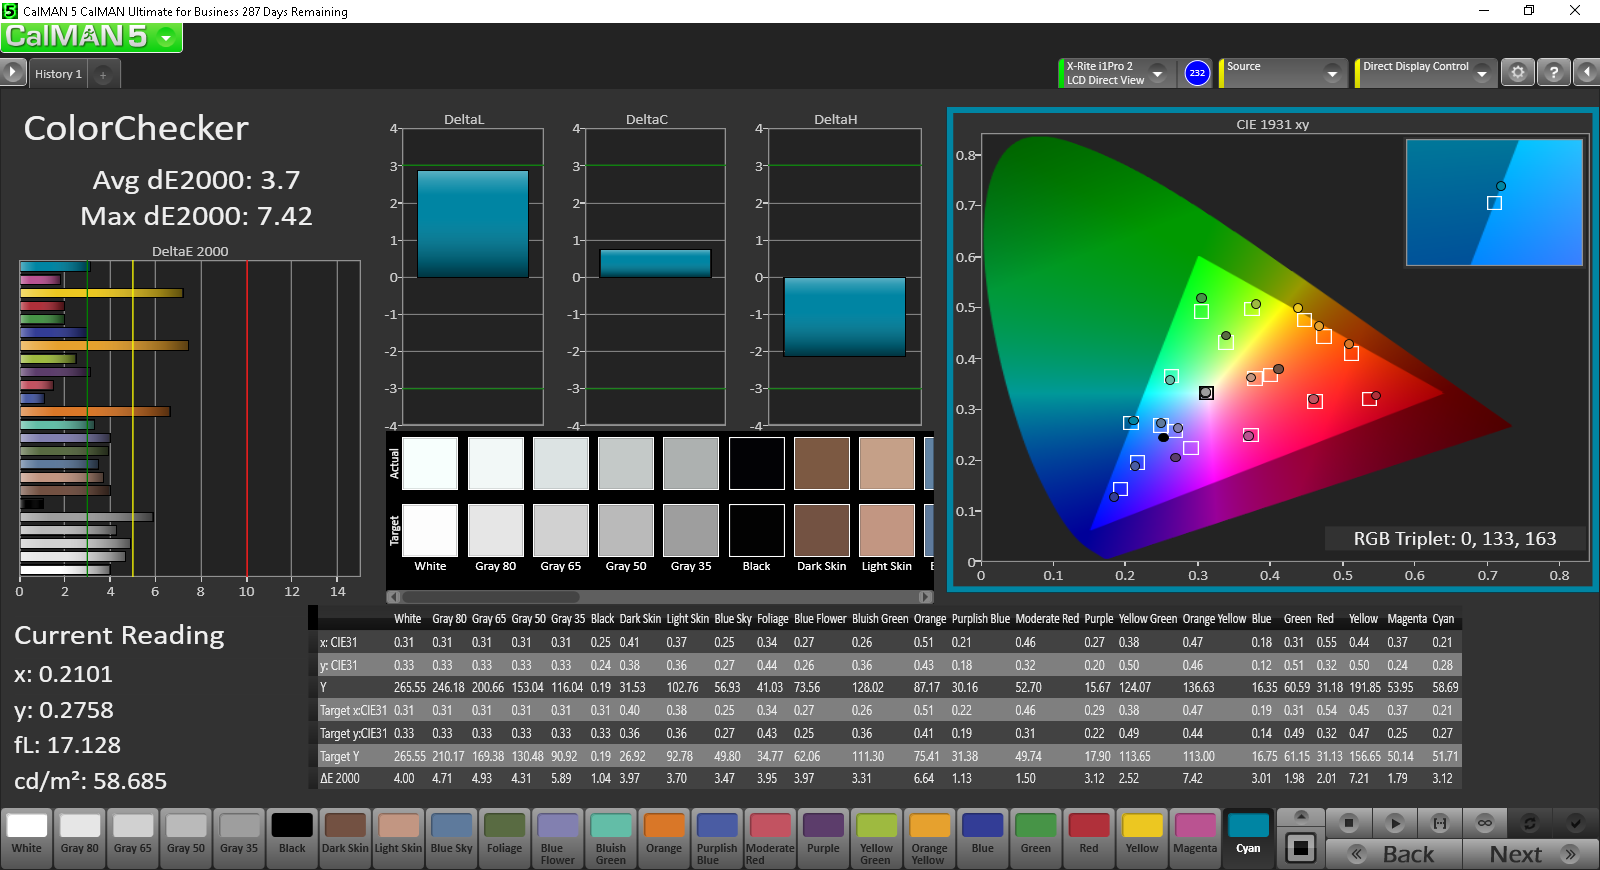
ΔE ColorChecker Calman: 4.18 | ∀{0.5-29.43 Ø4.72}
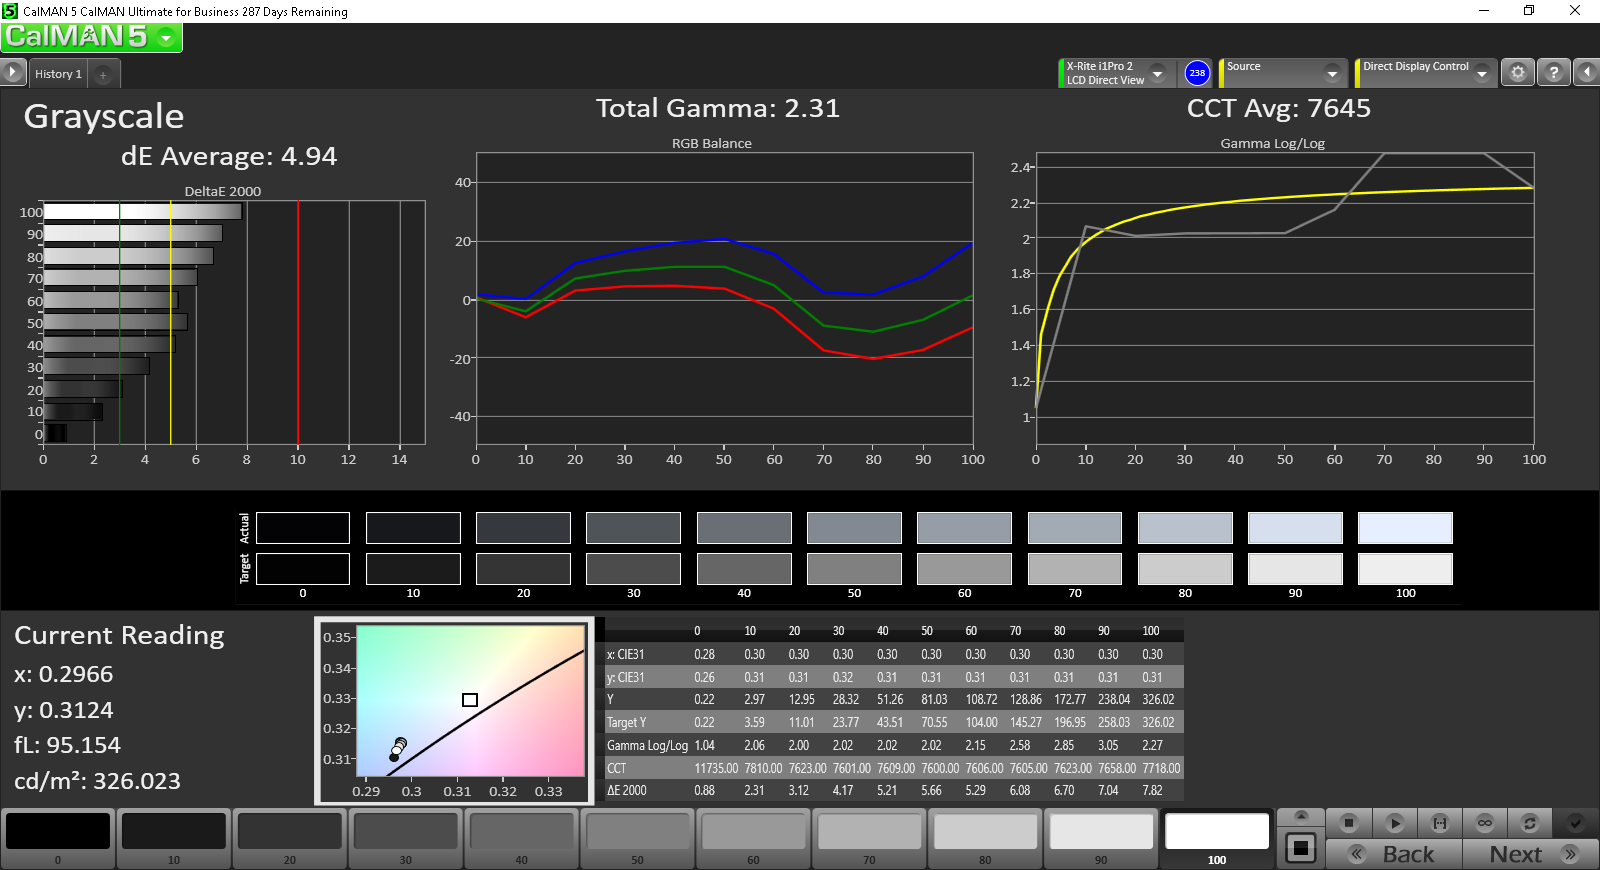
ΔE Greyscale Calman: 4.94 | ∀{0.09-98 Ø4.97}
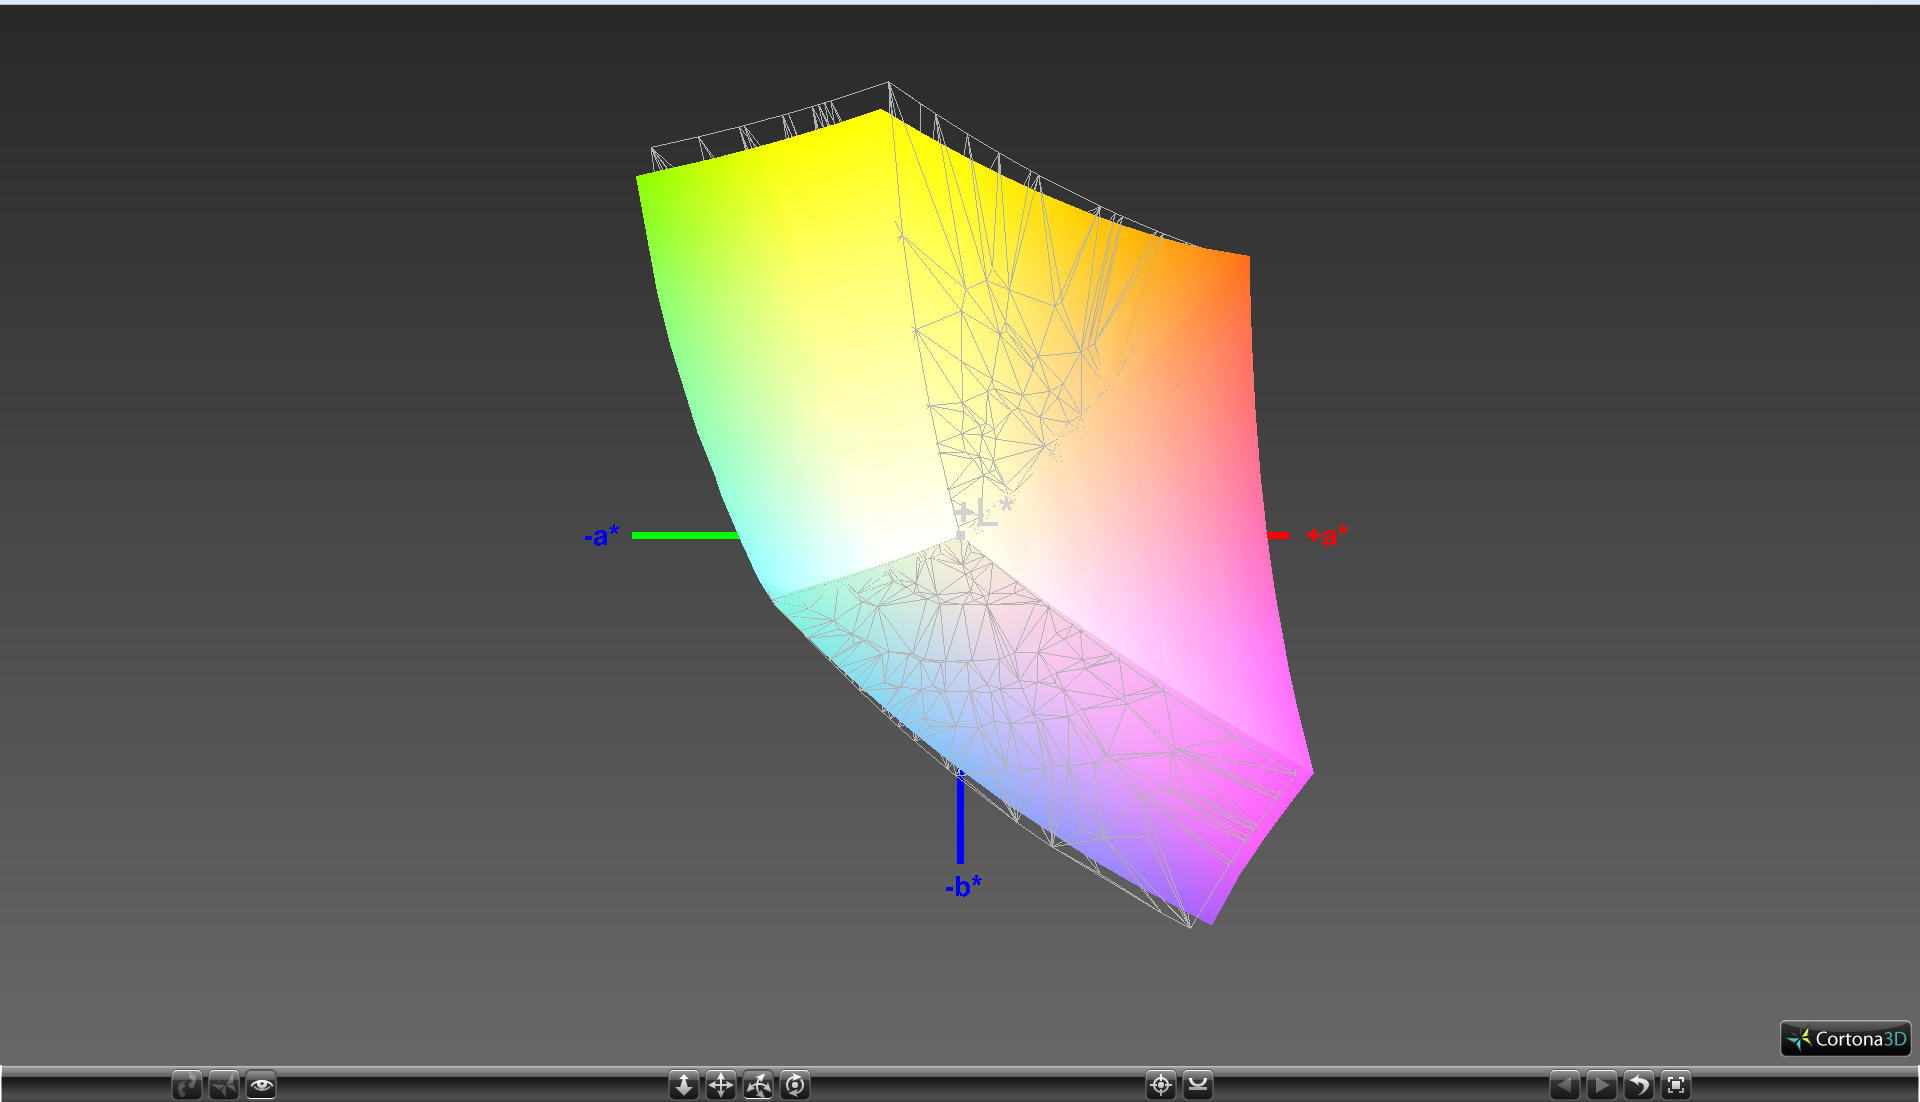
92% sRGB (Argyll 1.6.3 3D)
59% AdobeRGB 1998 (Argyll 1.6.3 3D)
65.4% AdobeRGB 1998 (Argyll 3D)
92.3% sRGB (Argyll 3D)
63.6% Display P3 (Argyll 3D)
Gamma: 2.31
CCT: 7645 K
| Dell XPS 13 9350 WQXGA 13.3", 3200x1800 | HP ProBook 430 G3 P5T00ES 13.3", 1366x768 | Asus Zenbook UX303UB-DH74T 13.3", 3200x1800 | Apple MacBook Air 13 inch 2015-03 13.3", 1440x900 | Lenovo Yoga 900-13ISK 80MK 13.3", 3200x1800 | HP Spectre x360 13-4104ng 13.3", 2560x1440 | |
|---|---|---|---|---|---|---|
| Display | -43% | -5% | -36% | -2% | 3% | |
| Display P3 Coverage (%) | 63.6 | 35.87 -44% | 60.9 -4% | 40.1 -37% | 63.2 -1% | 66.8 5% |
| sRGB Coverage (%) | 92.3 | 54 -41% | 85.4 -7% | 59.8 -35% | 88.7 -4% | 92.8 1% |
| AdobeRGB 1998 Coverage (%) | 65.4 | 37.06 -43% | 62.5 -4% | 41.51 -37% | 64.9 -1% | 67.3 3% |
| Response Times | -9% | -5% | 24% | 45% | ||
| Response Time Grey 50% / Grey 80% * (ms) | 50.8 ? | 54.4 ? -7% | 44.4 ? 13% | 38.8 ? 24% | 24 ? 53% | |
| Response Time Black / White * (ms) | 29.6 ? | 32.8 ? -11% | 36 ? -22% | 22.4 ? 24% | 19 ? 36% | |
| PWM Frequency (Hz) | 192 ? | 1389 | 1316 | |||
| Screen | -92% | -56% | -17% | -33% | -9% | |
| Brightness middle (cd/m²) | 307.5 | 212 -31% | 291.4 -5% | 329 7% | 319.8 4% | 324 5% |
| Brightness (cd/m²) | 297 | 205 -31% | 270 -9% | 310 4% | 302 2% | 324 9% |
| Brightness Distribution (%) | 92 | 90 -2% | 84 -9% | 82 -11% | 88 -4% | 90 -2% |
| Black Level * (cd/m²) | 0.207 | 0.71 -243% | 0.954 -361% | 0.405 -96% | 0.835 -303% | 0.34 -64% |
| Contrast (:1) | 1486 | 299 -80% | 305 -79% | 812 -45% | 383 -74% | 953 -36% |
| Colorchecker dE 2000 * | 4.18 | 12.06 -189% | 4.63 -11% | 3.96 5% | 2.68 36% | 4.36 -4% |
| Colorchecker dE 2000 max. * | 7.84 | 7.51 4% | ||||
| Greyscale dE 2000 * | 4.94 | 13.41 -171% | 5.65 -14% | 3.51 29% | 2.35 52% | 4.62 6% |
| Gamma | 2.31 95% | 2.41 91% | 2.16 102% | 3.83 57% | 2.09 105% | 2.18 101% |
| CCT | 7645 85% | 15382 42% | 6320 103% | 6711 97% | 6975 93% | 6857 95% |
| Color Space (Percent of AdobeRGB 1998) (%) | 59 | 34.3 -42% | 55.2 -6% | 38.4 -35% | 57 -3% | 60 2% |
| Color Space (Percent of sRGB) (%) | 92 | 54.2 -41% | 85.2 -7% | 59.8 -35% | 88 -4% | 93 1% |
| Total Average (Program / Settings) | -48% /
-70% | -22% /
-38% | -27% /
-22% | -4% /
-18% | 13% /
1% |
* ... smaller is better
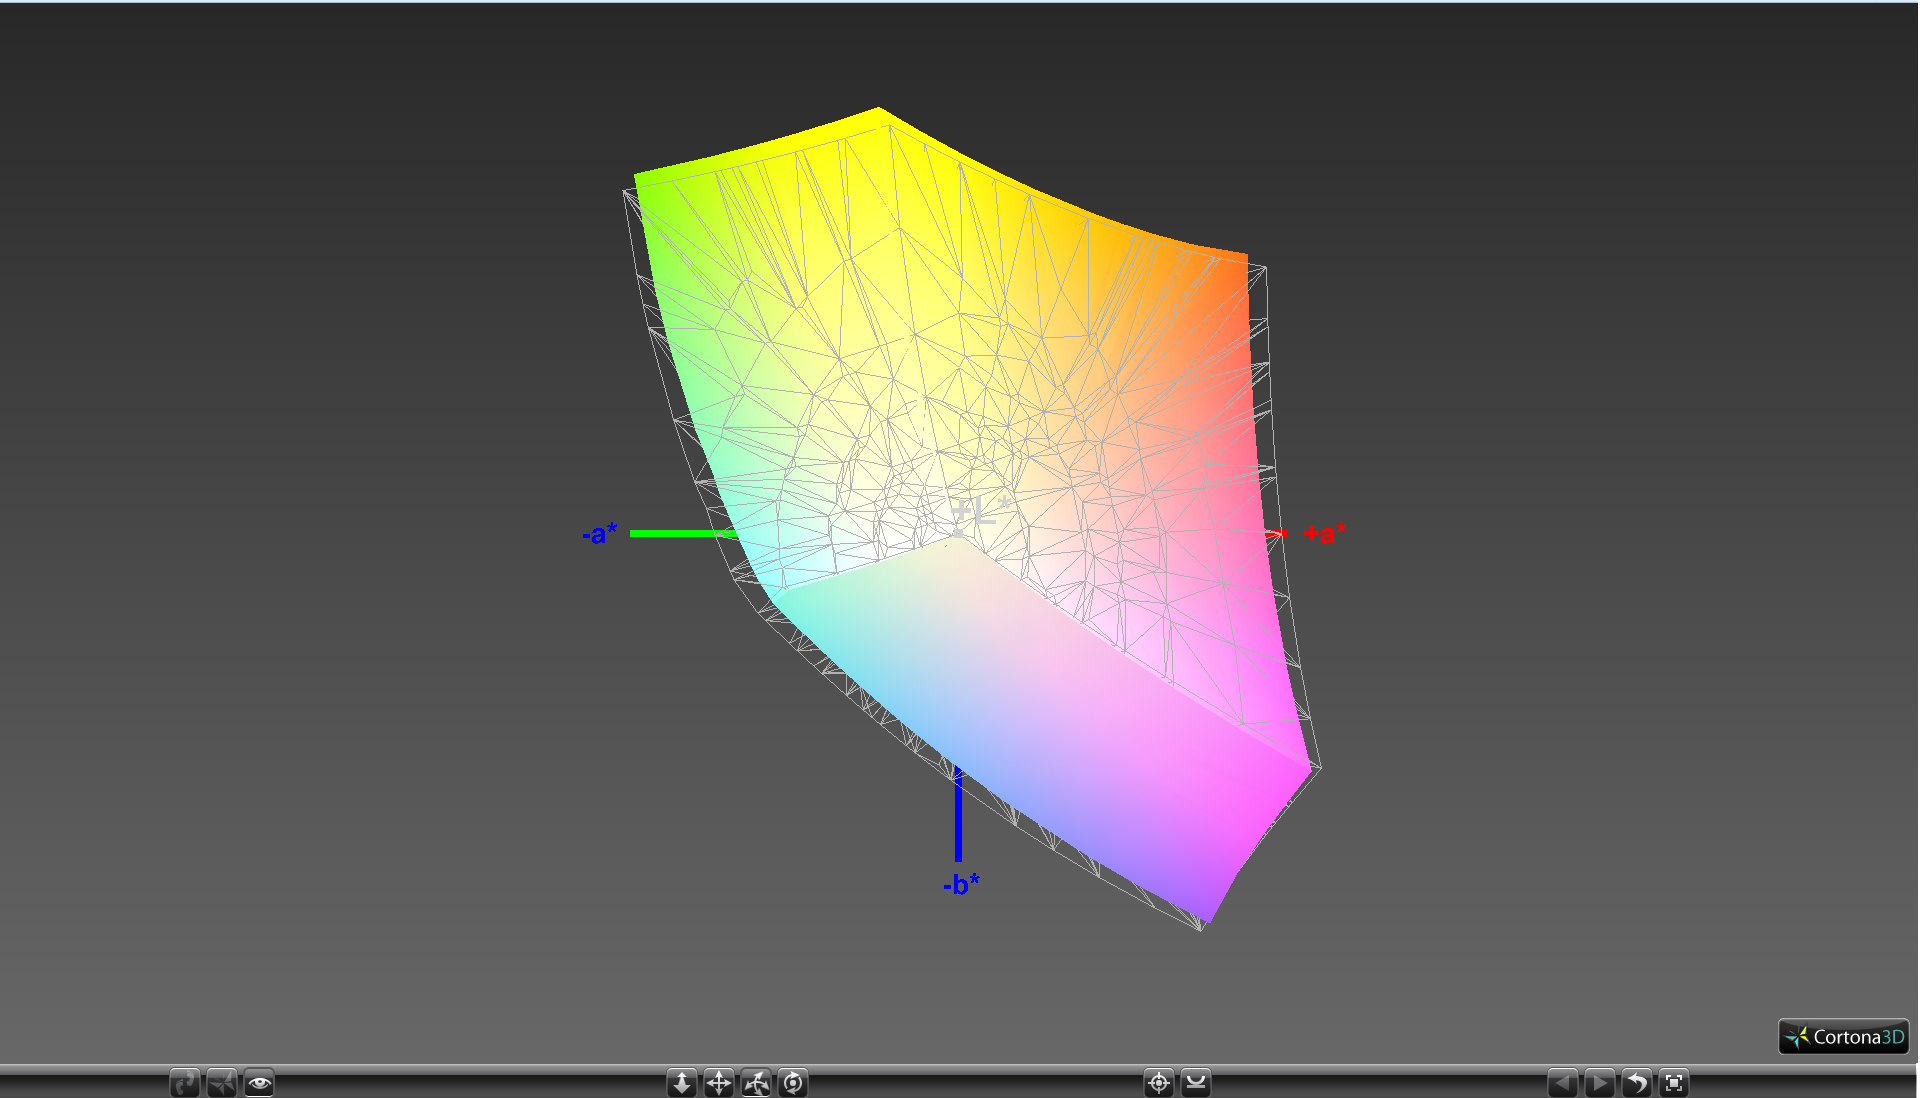
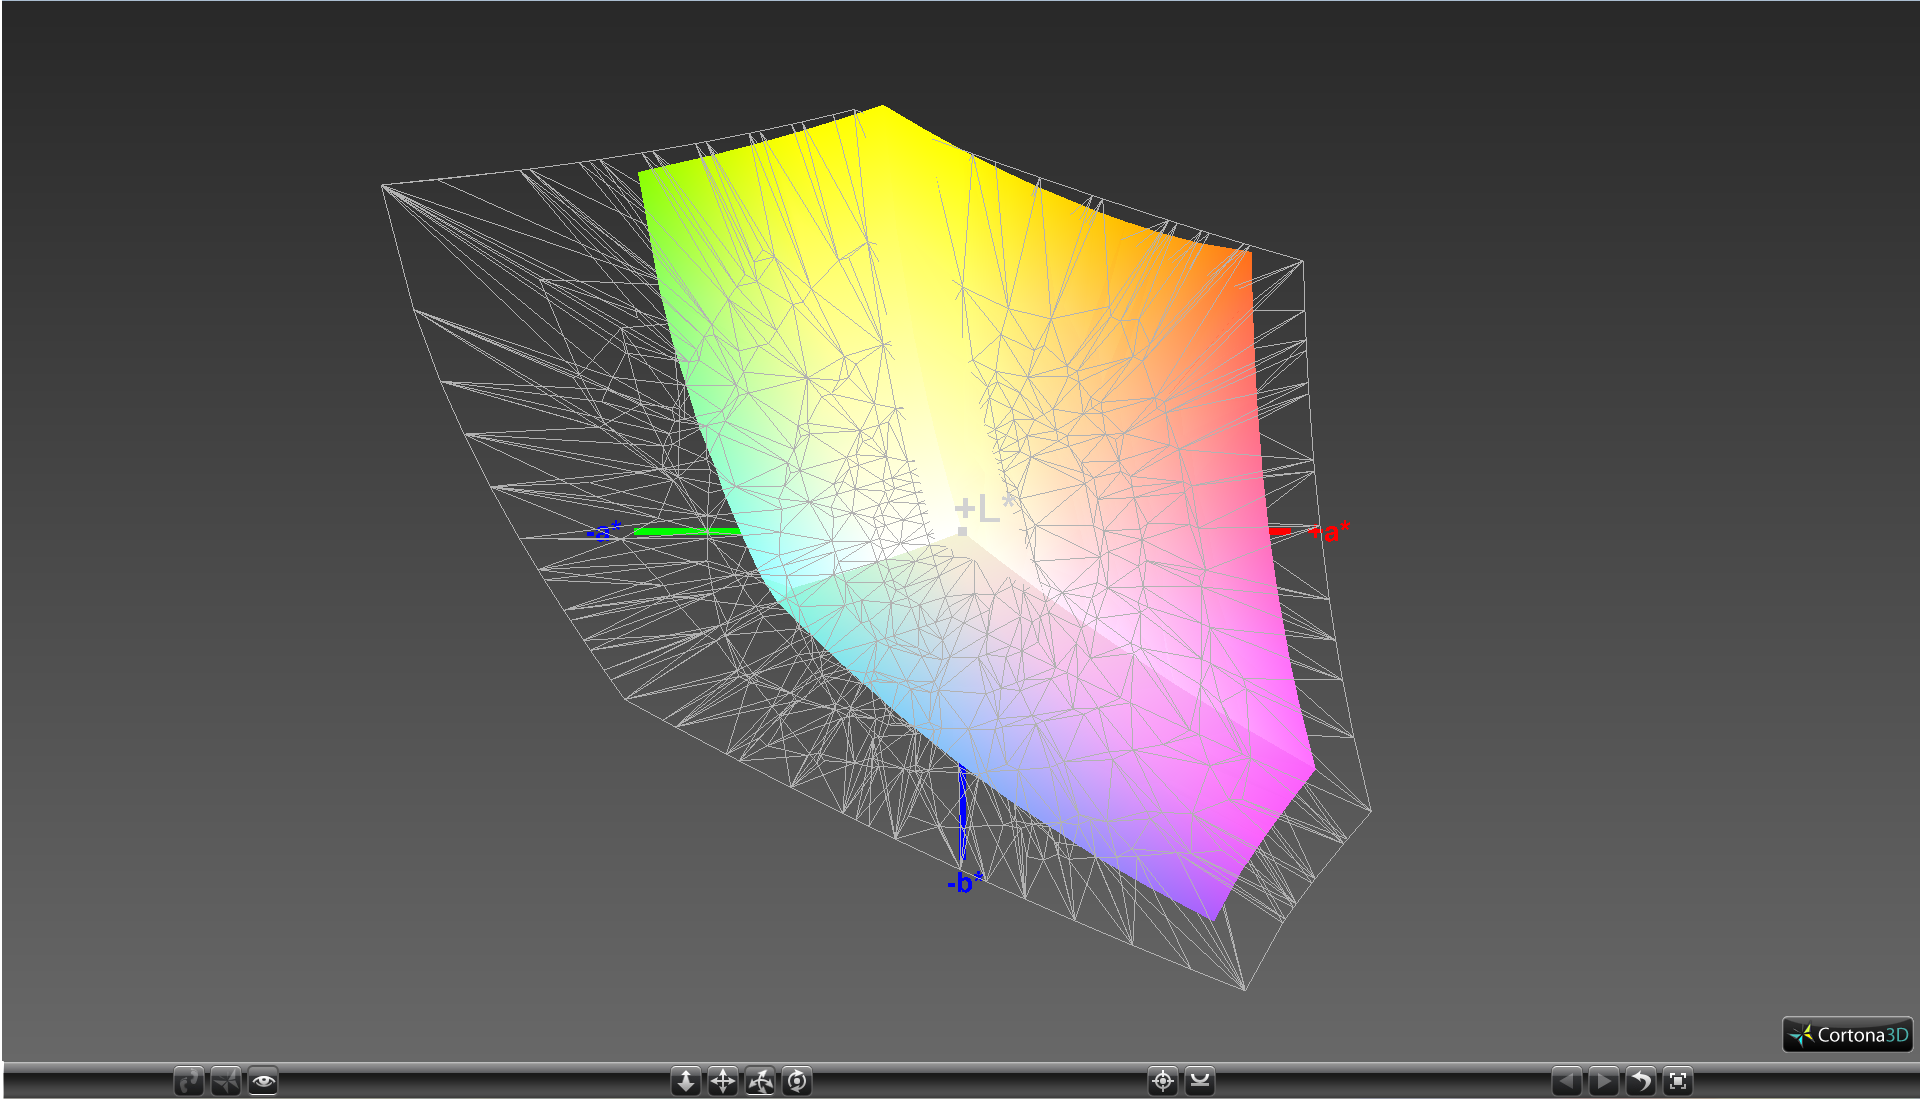
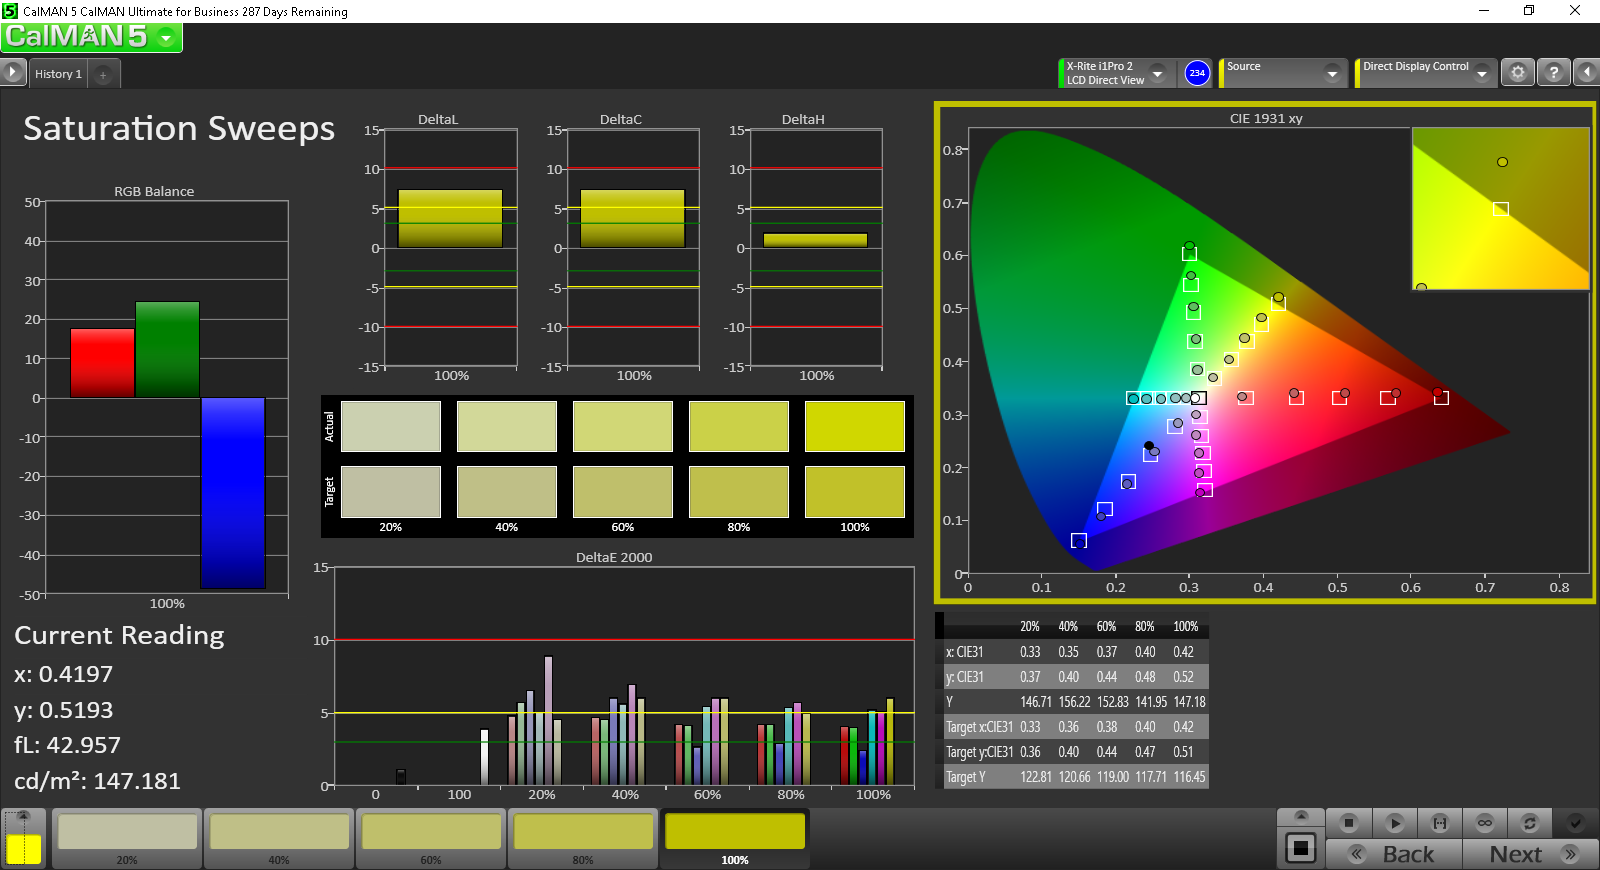
Color space is a measured 59 percent and 92 percent of AdobeRGB and sRGB standards, respectively. Gamut is wider than budget panels on less expensive Ultrabooks where sRGB coverage tend to hover in the 60 percent range, such as on the lower-end HP ProBook 430 G3 and Apple MacBook Air 13.

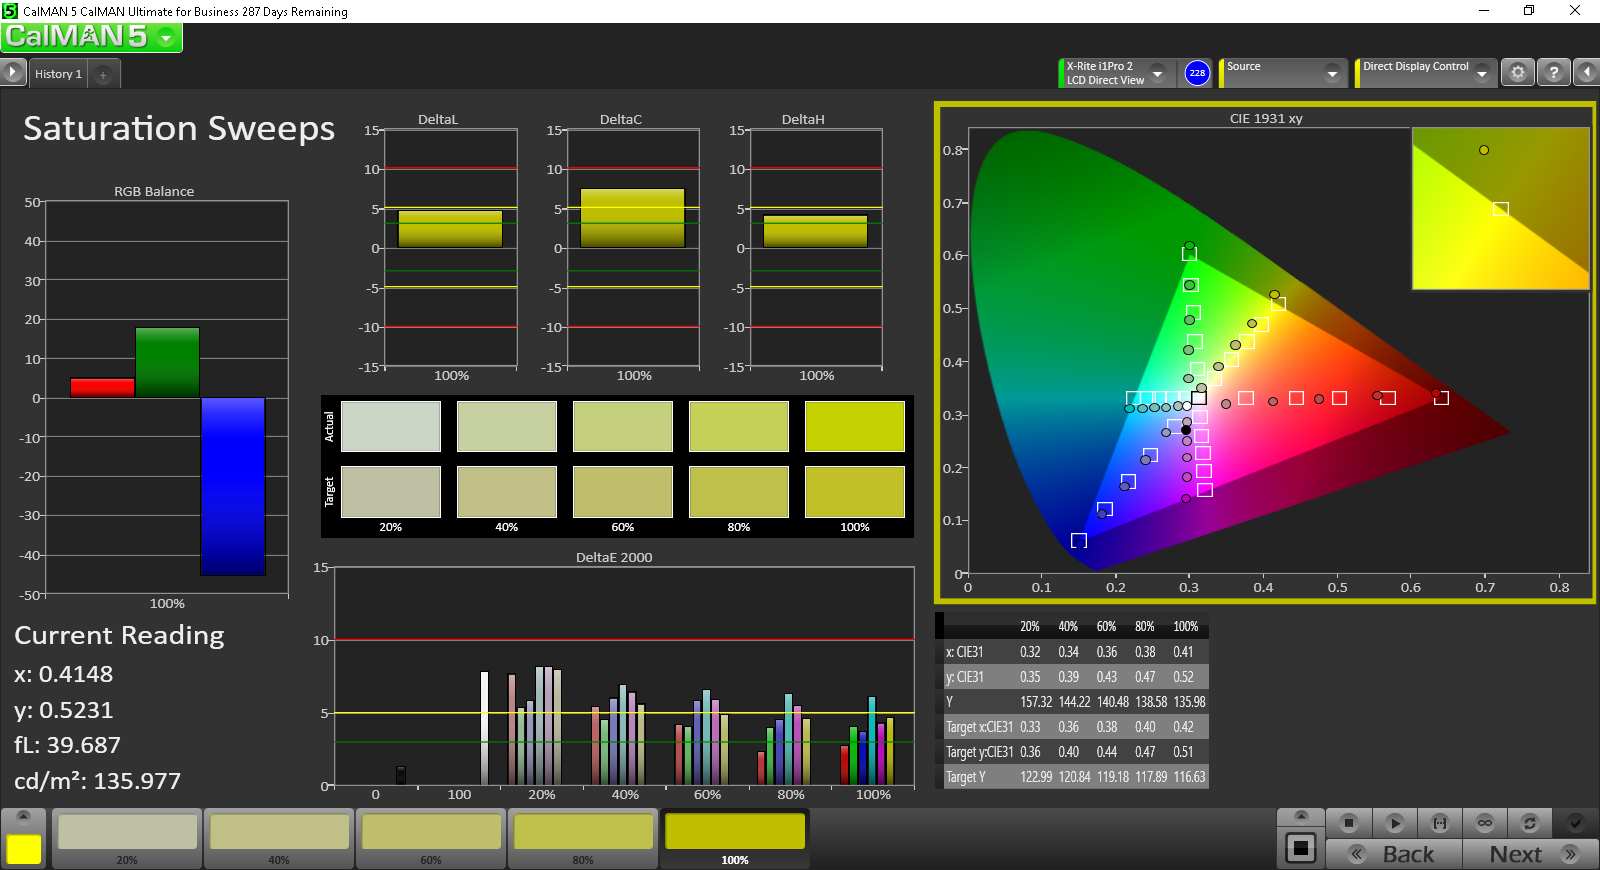
Grayscale and RGB Balance are average out-of-the-box. A calibration is recommended as it will reduce color temperature to noticeably warmer levels while improving color accuracy at lower saturation levels. Colors are relatively consistent throughout all saturation levels due to the high sRGB coverage.
Display Response Times
| ↔ Response Time Black to White | ||
|---|---|---|
| 29.6 ms ... rise ↗ and fall ↘ combined | ↗ 6 ms rise | 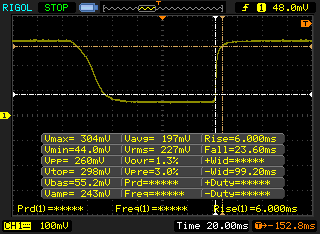 |
| ↘ 23.6 ms fall | ||
| The screen shows relatively slow response rates in our tests and may be too slow for gamers. In comparison, all tested devices range from 0.1 (minimum) to 240 (maximum) ms. » 79 % of all devices are better. This means that the measured response time is worse than the average of all tested devices (19.8 ms). | ||
| ↔ Response Time 50% Grey to 80% Grey | ||
| 50.8 ms ... rise ↗ and fall ↘ combined | ↗ 18.4 ms rise | 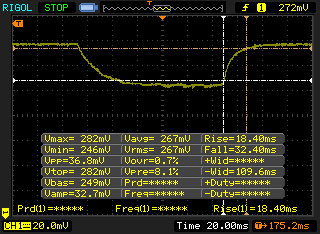 |
| ↘ 32.4 ms fall | ||
| The screen shows slow response rates in our tests and will be unsatisfactory for gamers. In comparison, all tested devices range from 0.165 (minimum) to 636 (maximum) ms. » 87 % of all devices are better. This means that the measured response time is worse than the average of all tested devices (31 ms). | ||
Screen Flickering / PWM (Pulse-Width Modulation)
| Screen flickering / PWM not detected | 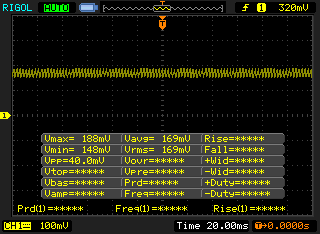 | ||
In comparison: 52 % of all tested devices do not use PWM to dim the display. If PWM was detected, an average of 7750 (minimum: 5 - maximum: 343500) Hz was measured. | |||
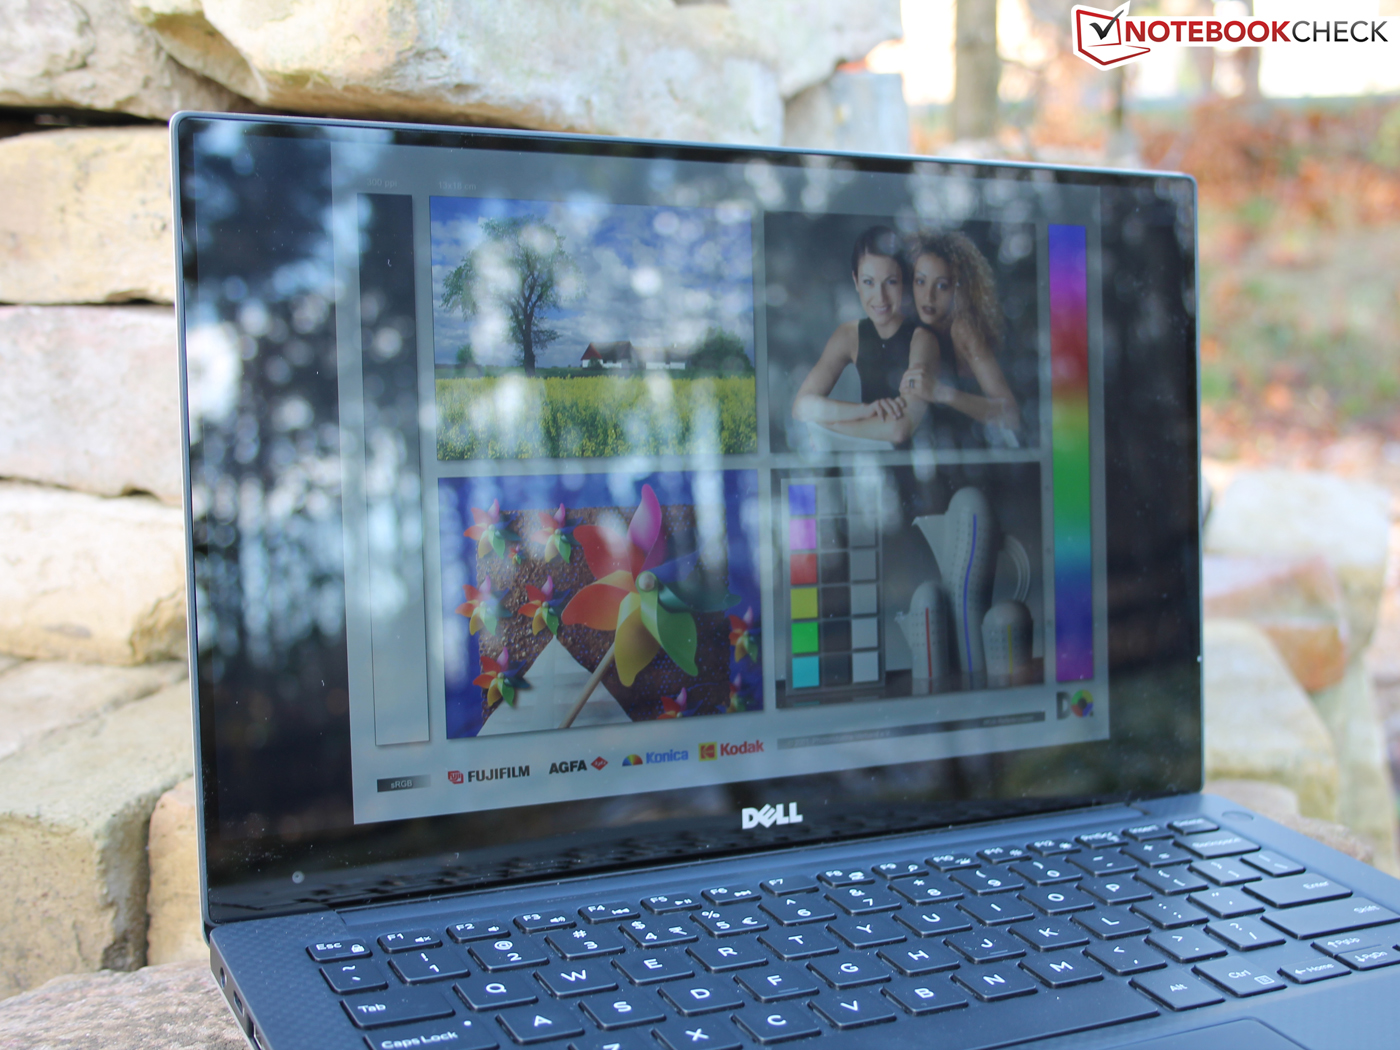
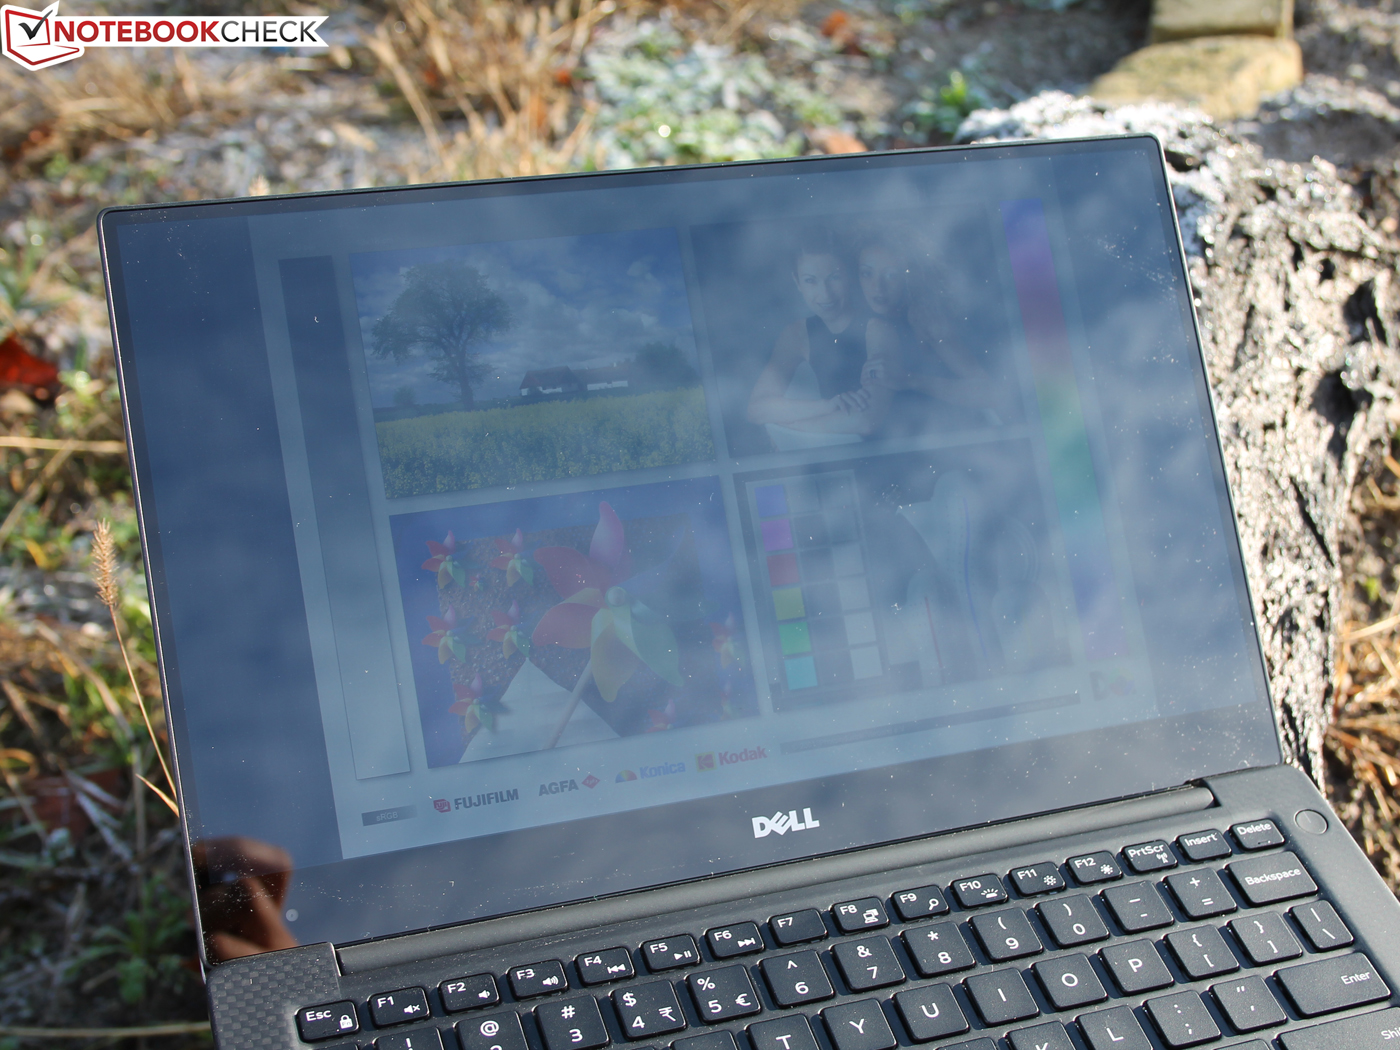
Outdoor visibility is very good under shade and only average under direct sunlight due to the insufficient backlight and glossy screen. In this case, the touchscreen loses its advantage against the less expensive matte options if outdoor usability is of utmost importance. Viewing angles are otherwise excellent from the IPS panel with very little contrast and color degradation at extreme angles.

Performance
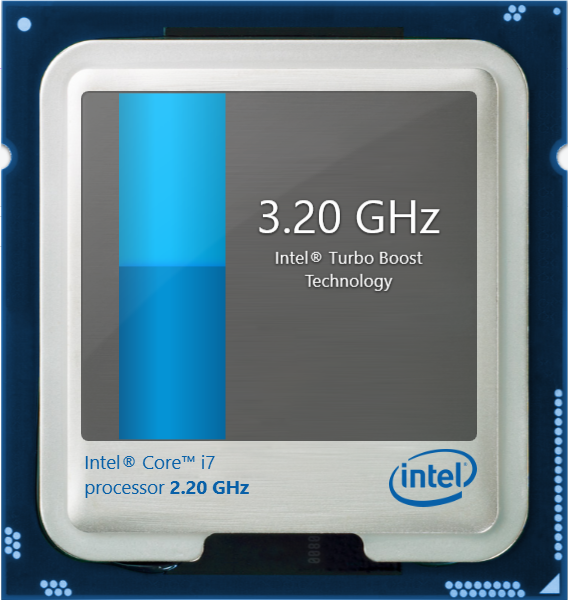
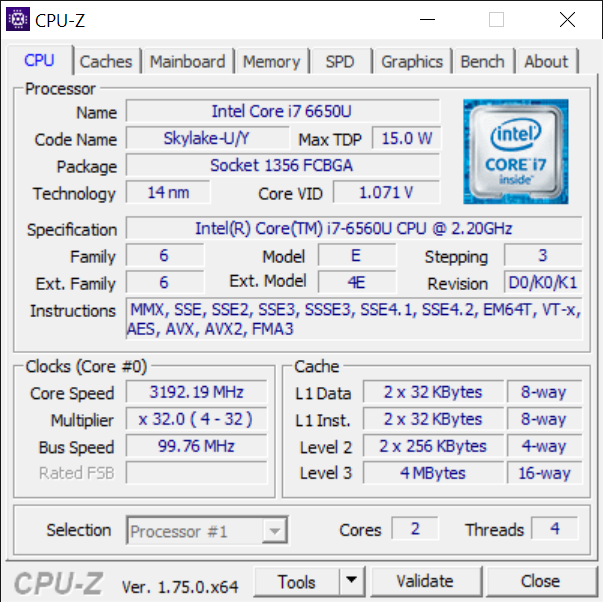
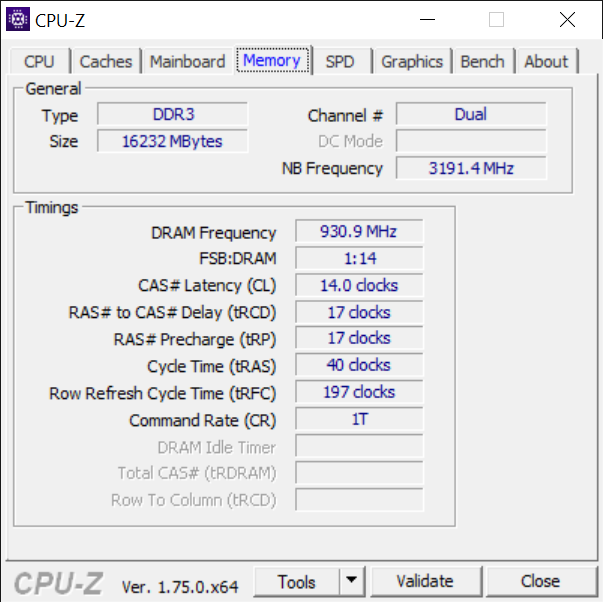
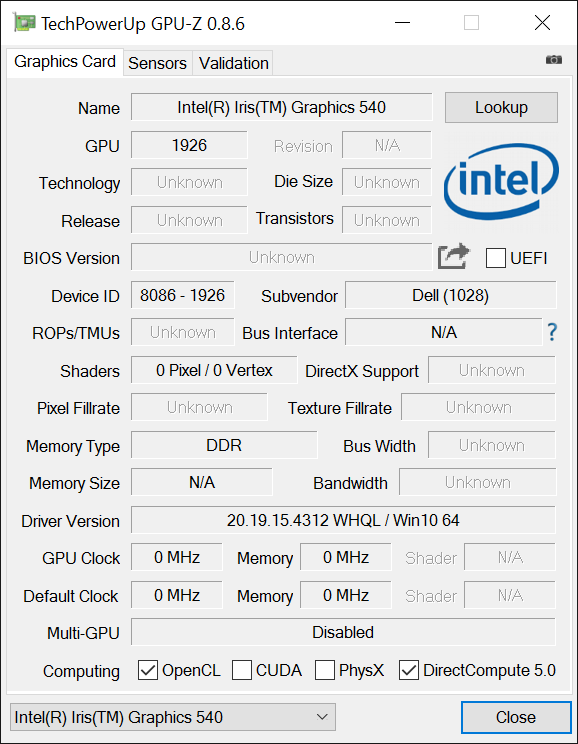
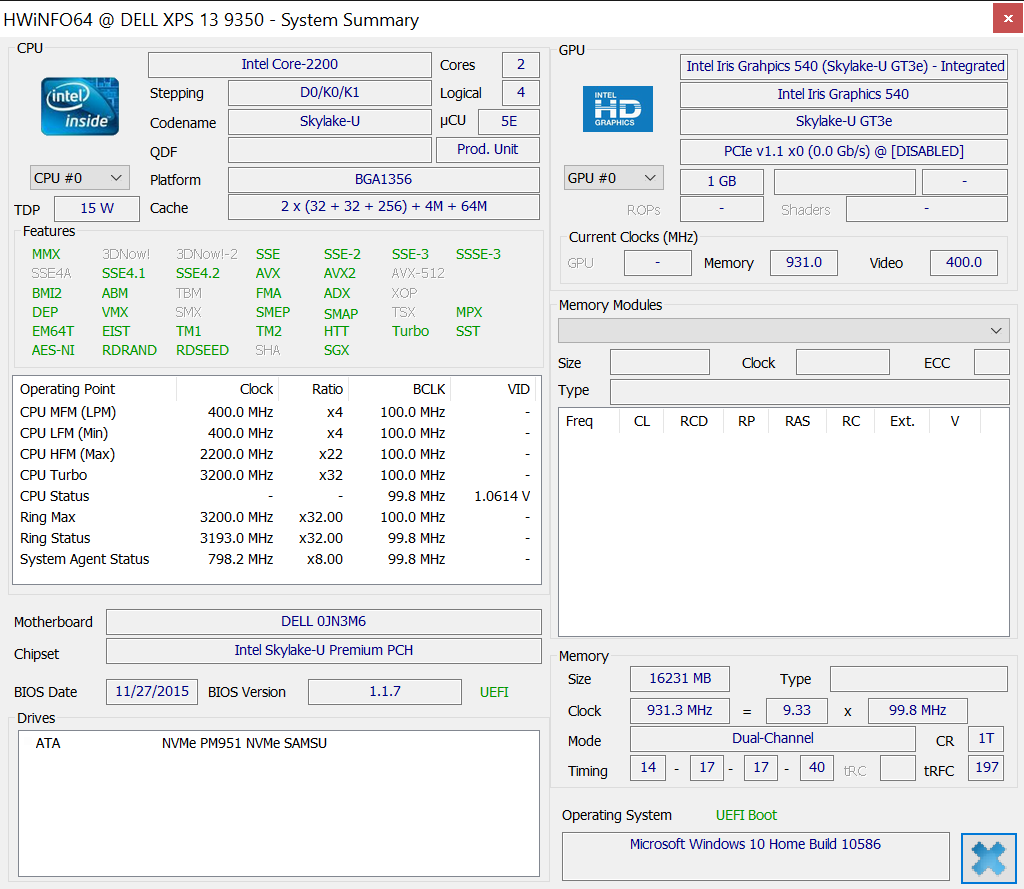
The latest XPS 13 SKU is equipped with a Core i7-6560U CPU and integrated Iris Graphics 540 GPU. Keen-eyed users will immediately notice that this is the same GPU configuration as the highest-end SKU of the Surface Pro 4, but with different ULV CPUs (i7-6560U vs. i7-6650U) rated at the same base clock rate (2.2 GHz) and slightly different maximum Turbo clock rates (3.2 GHz vs. 3.4 GHz). Processor speed on the XPS 13 can be as high as 3.2 GHz for single-threaded operations or as low as 500 MHz when on the Power Saver profile. Similarly, the GPU can operate up to 1050 MHz when under stress.
While the i7-6560U and i7-6650U are almost identical on paper, the CPU and GPU performance differences between them are measurable as shown in the following sections.
Processor
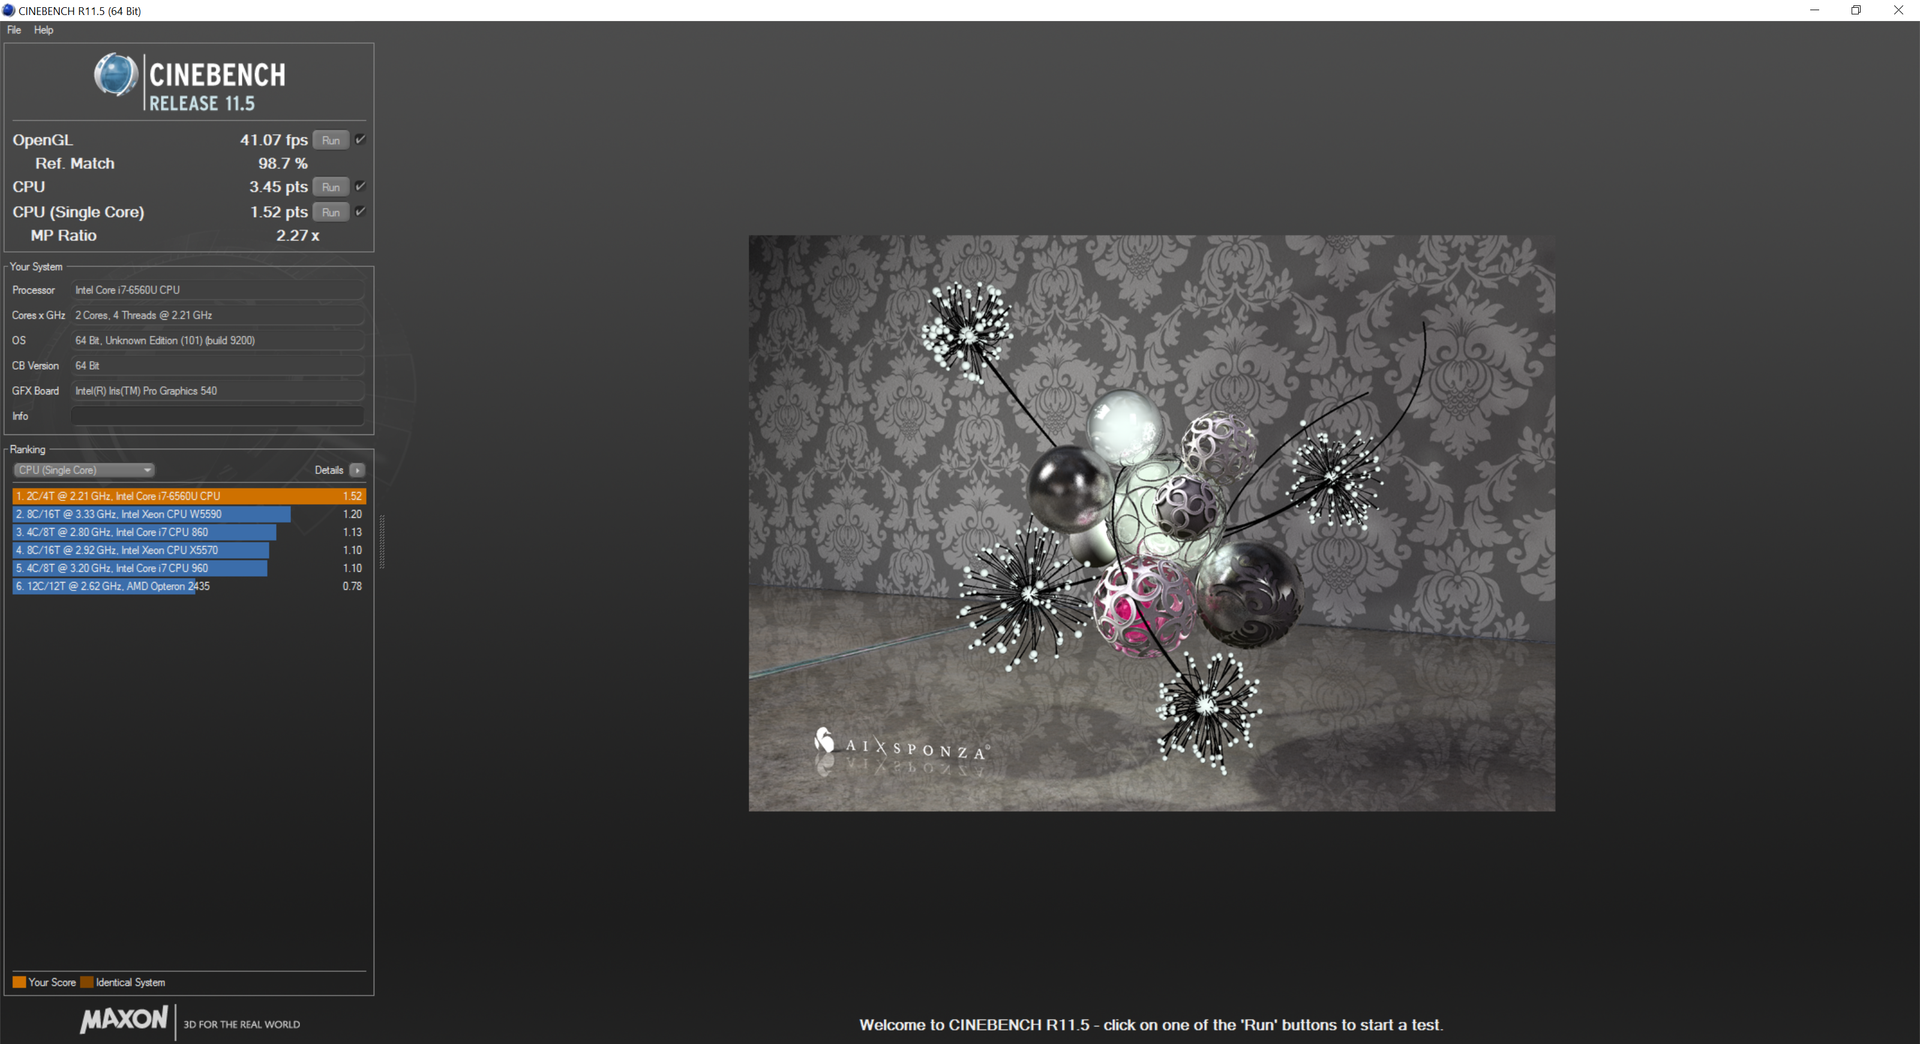
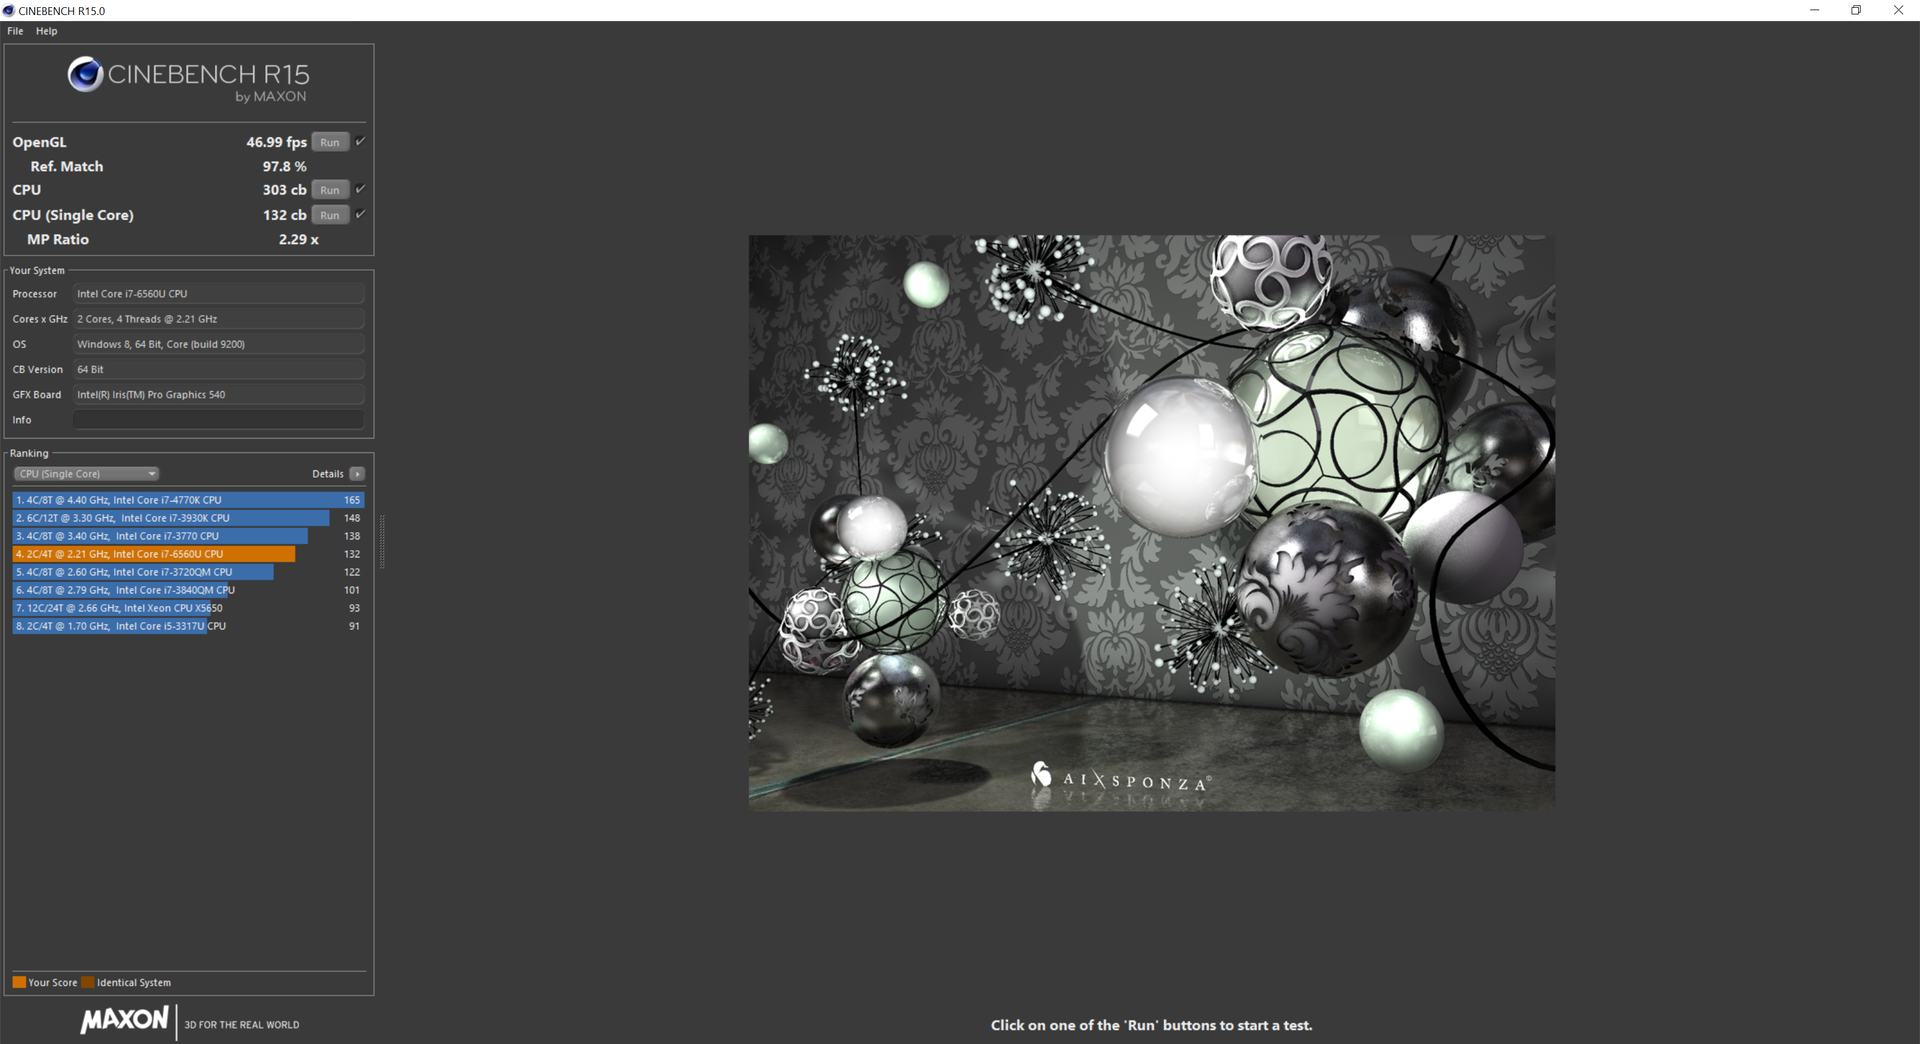
CPU benchmarks like CineBench, wPrime, and Super Pi all reveal that the CPU in our XPS 13 is only a few percentage points away from the lower-end Core i5-6300U. Multi-threaded performance is slower than the i7-6650U in the Surface Pro 4 while performance in single-threaded operations appears to be very similar. For example, the Microsoft tablet is roughly 10 percent faster than our Dell in all multi-threaded benchmarks due to its higher and more consistent TUrbo Boost.
See our dedicated CPU page on the Core i7-6560U for more technical details and benchmarks.
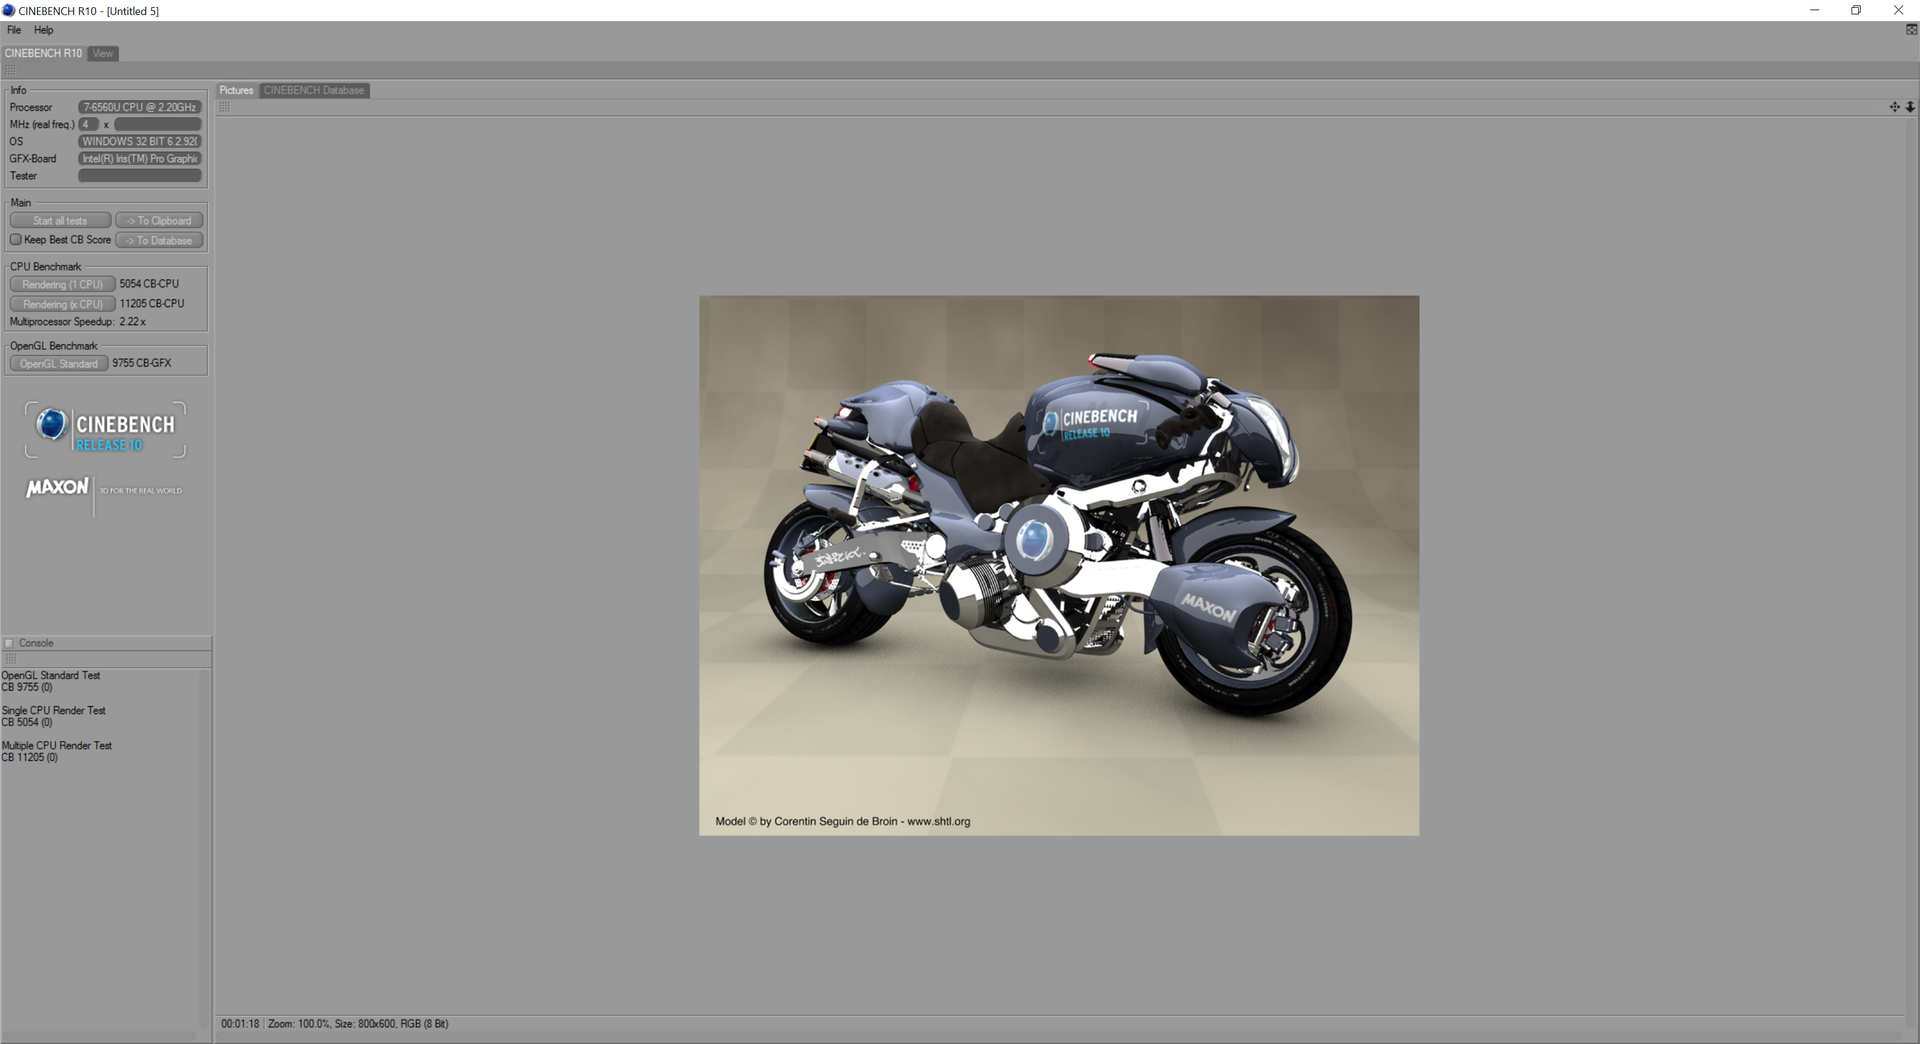
| Cinebench R10 | |
| Rendering Single CPUs 64Bit (sort by value) | |
| Eurocom Shark 4 | |
| Microsoft Surface Pro 4 Core i7 | |
| Microsoft Surface Book Core i5 | |
| Lenovo ThinkPad T560-20FH001FGE | |
| Rendering Multiple CPUs 64Bit (sort by value) | |
| Eurocom Shark 4 | |
| Microsoft Surface Pro 4 Core i7 | |
| Microsoft Surface Book Core i5 | |
| Lenovo ThinkPad T560-20FH001FGE | |
| wPrime 2.10 - 1024m (sort by value) | |
| Dell XPS 13 9350 WQXGA | |
| Eurocom Shark 4 | |
| Microsoft Surface Pro 4 Core i7 | |
| Asus Zenbook UX303UB-DH74T | |
| Microsoft Surface Book Core i5 | |
* ... smaller is better
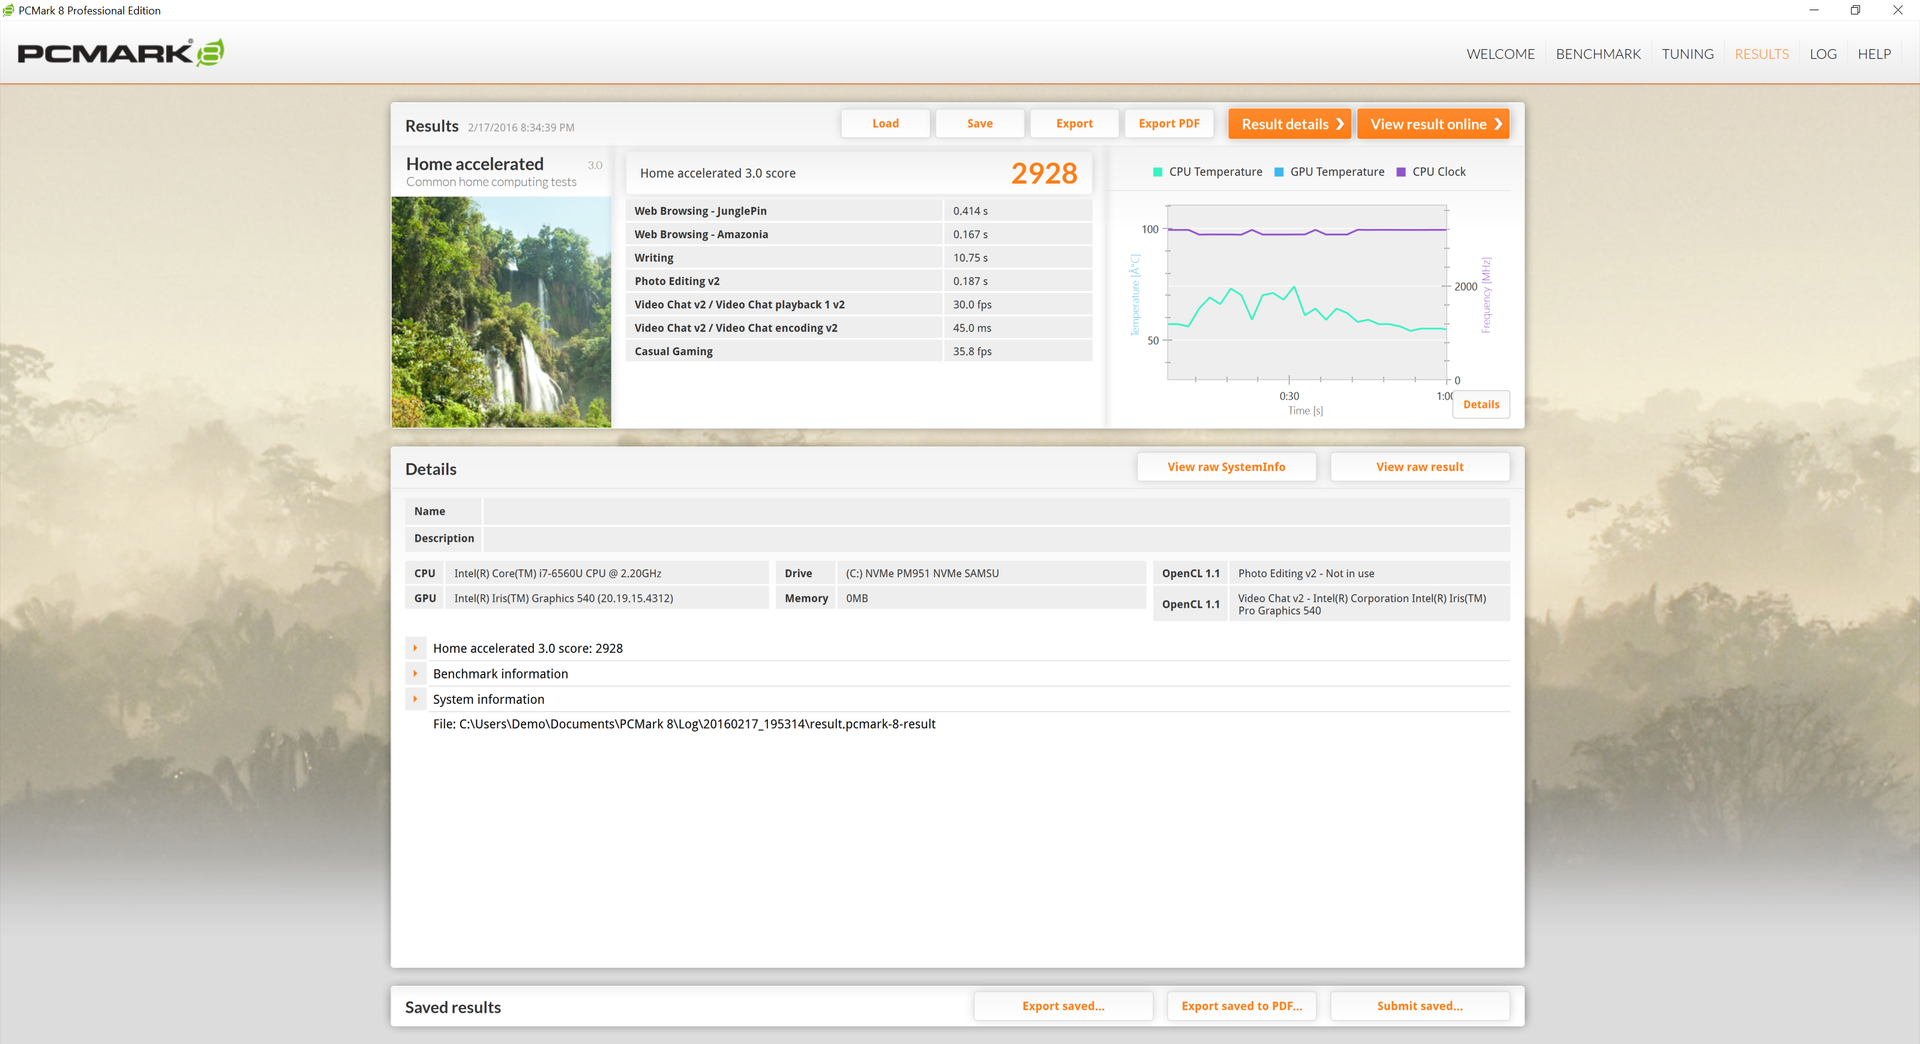
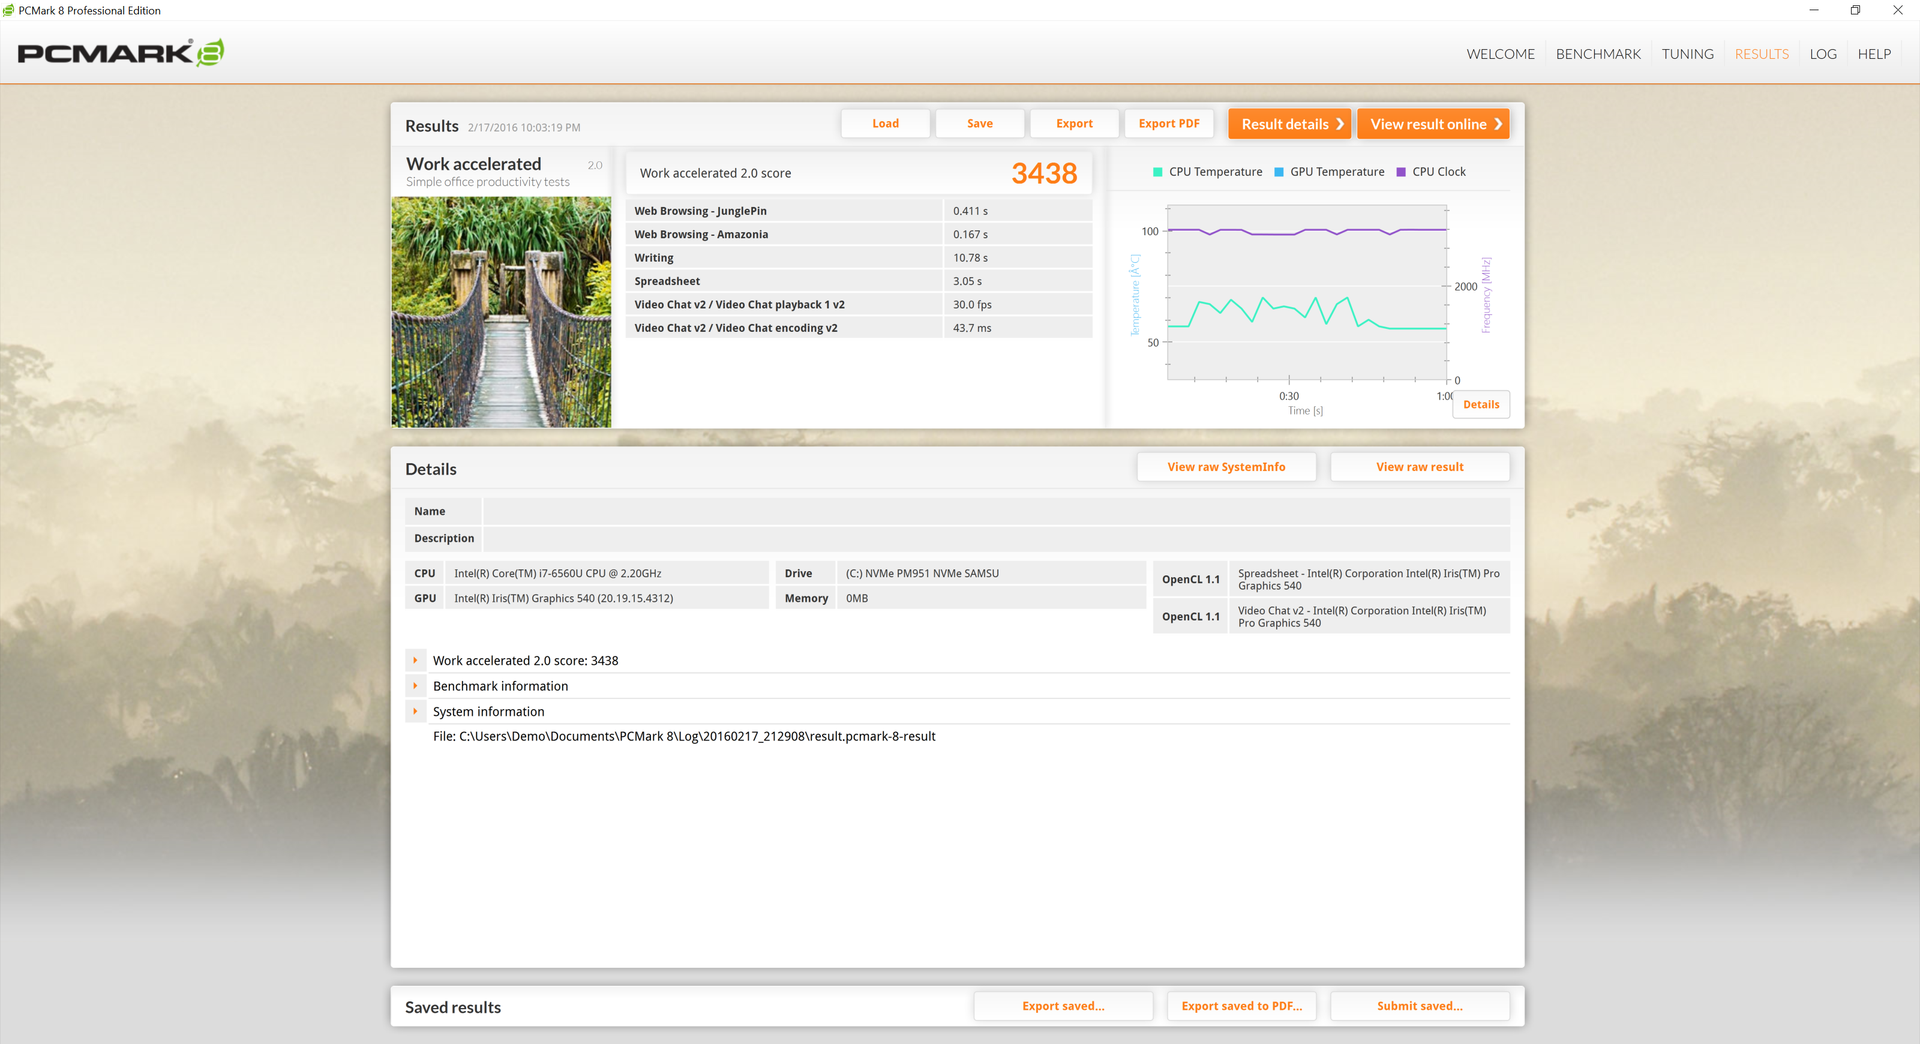
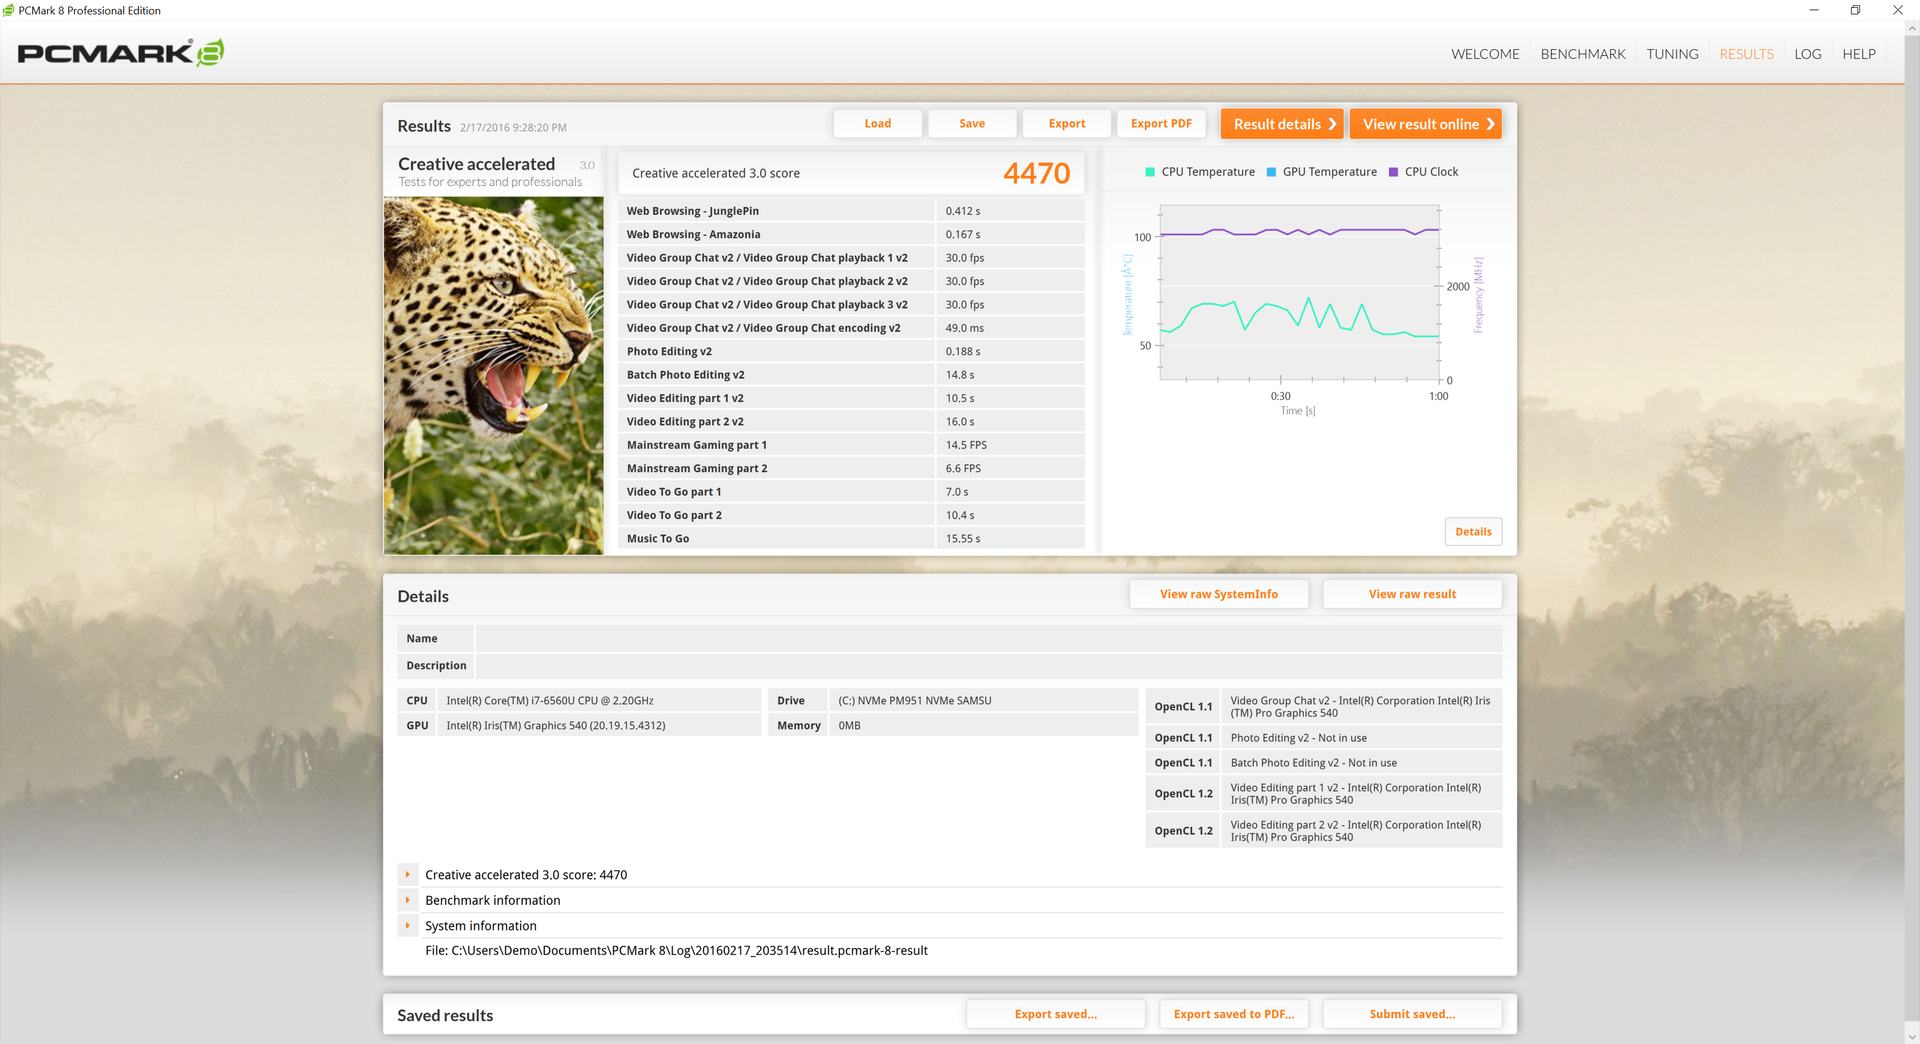
System Performance
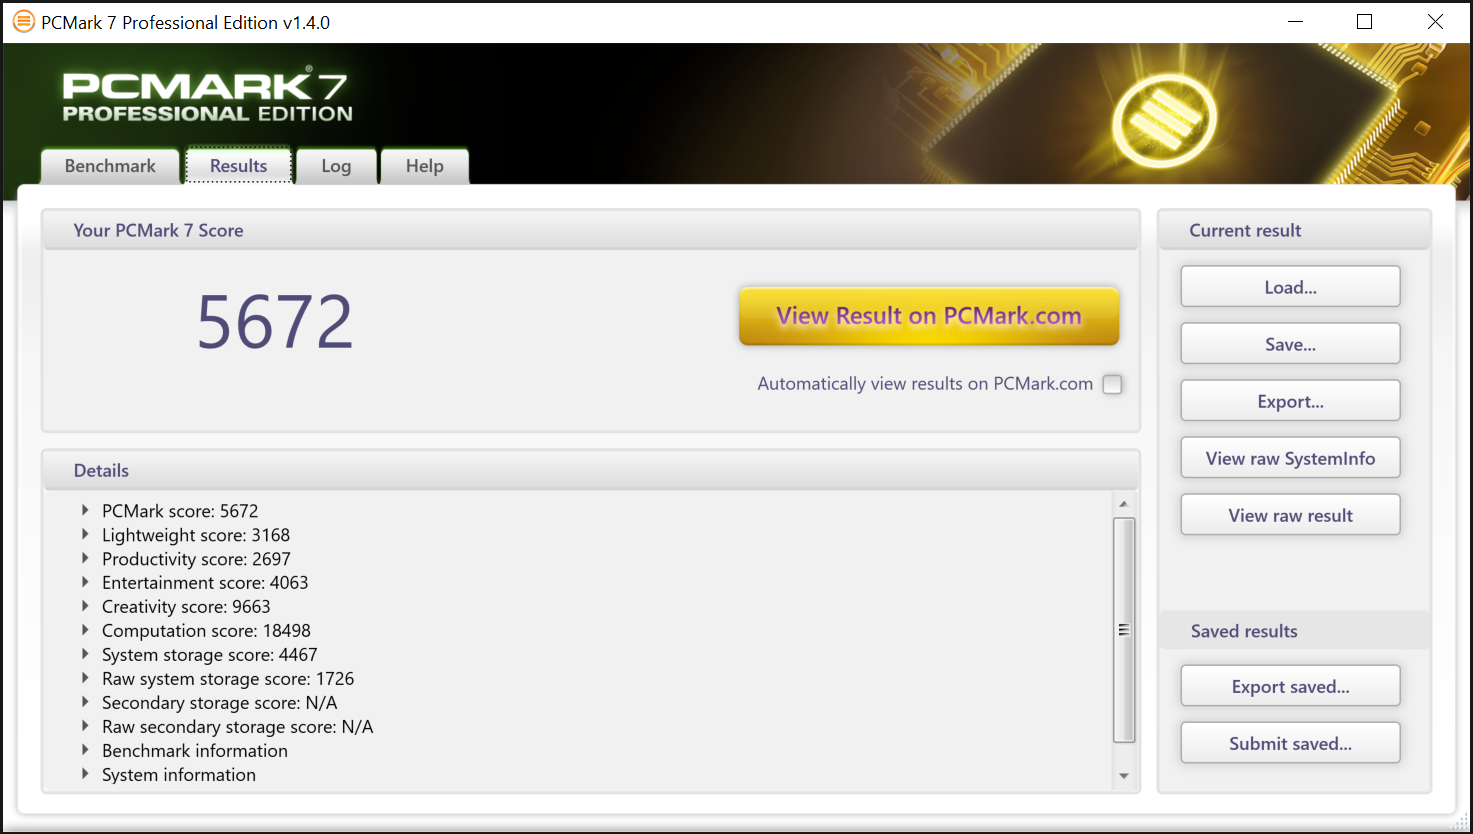
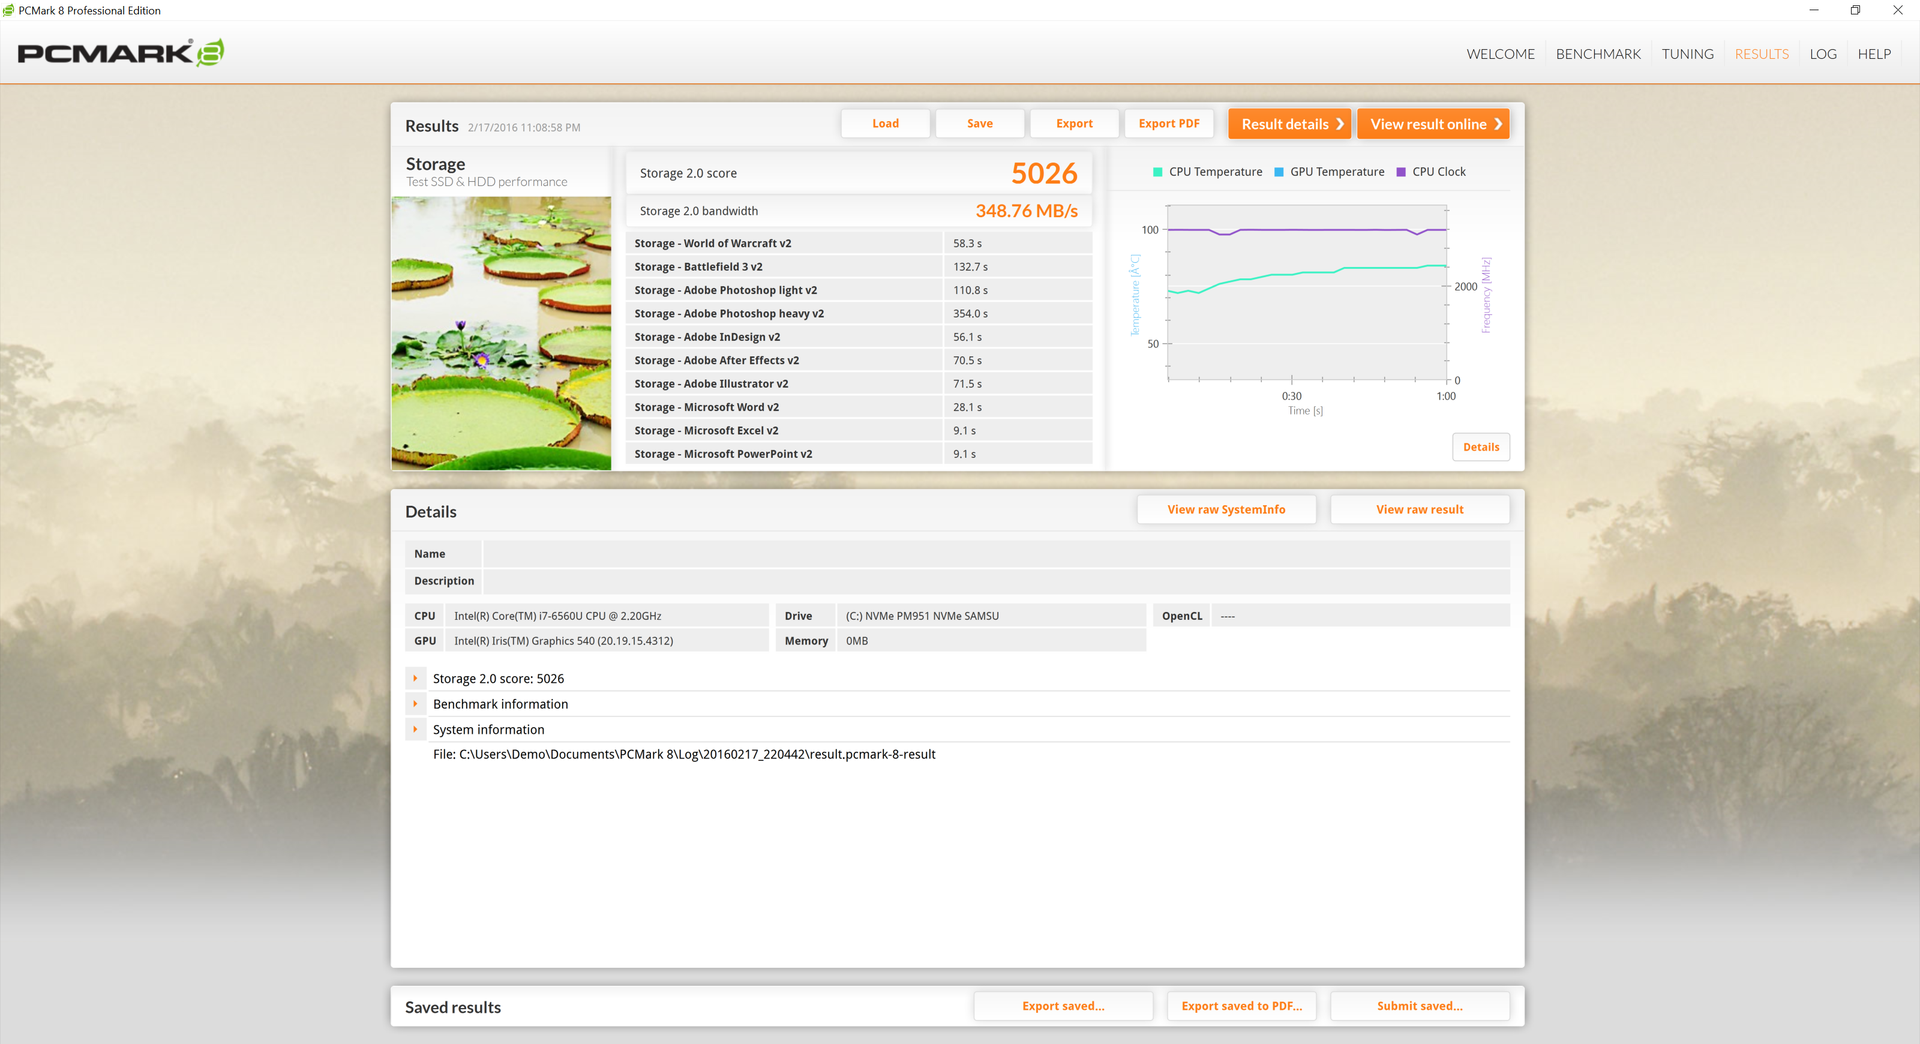
PCMark benchmarks rank our XPS 13 in the same ballpark as its closest competitors. Its NVMe SSD also puts it next to older gaming systems with discrete GPUs including the MSI GE62 2QE and Acer Aspire V Nitro 7-791G.
| PCMark 7 - Score (sort by value) | |
| Dell XPS 13 9350 WQXGA | |
| Lenovo Yoga 900-13ISK 80MK | |
| Apple MacBook Air 13 inch 2015-03 | |
| Asus Zenbook UX303UB-DH74T | |
| HP ProBook 430 G3 P5T00ES | |
| PCMark 7 Score | 5672 points | |
| PCMark 8 Home Score Accelerated v2 | 2928 points | |
| PCMark 8 Creative Score Accelerated v2 | 4470 points | |
| PCMark 8 Work Score Accelerated v2 | 3438 points | |
Help | ||
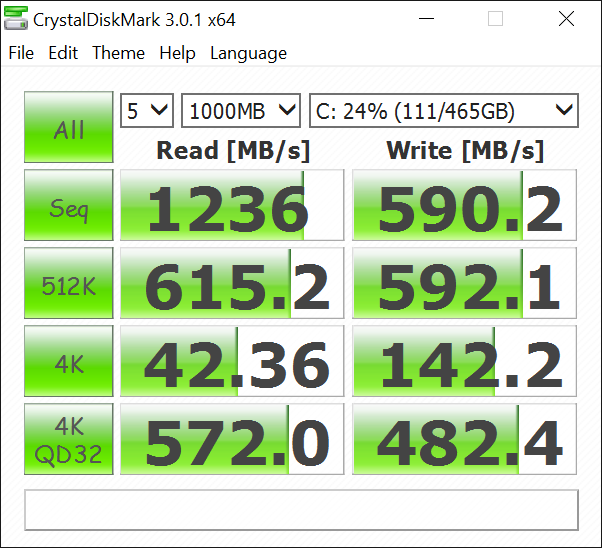
Storage Devices
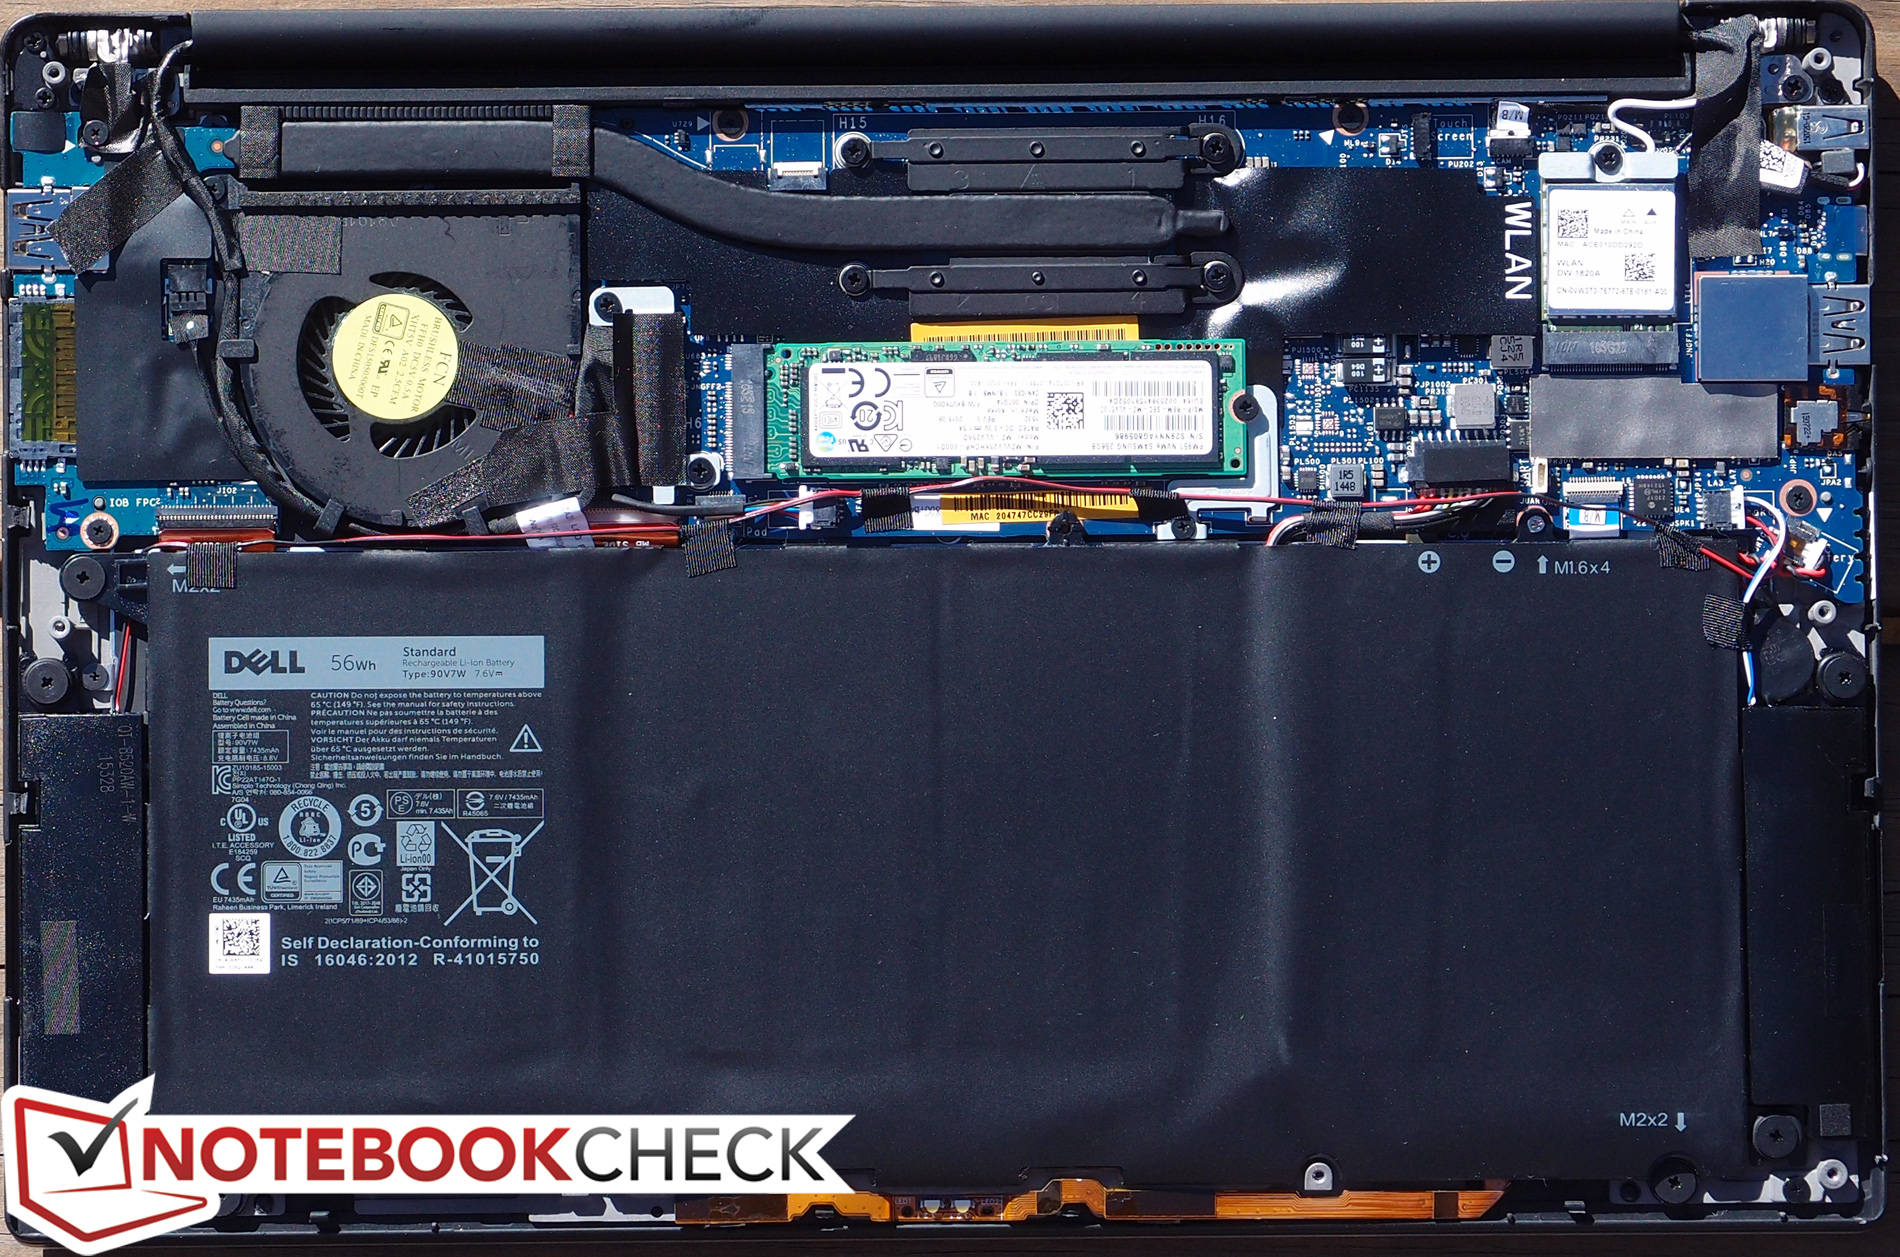
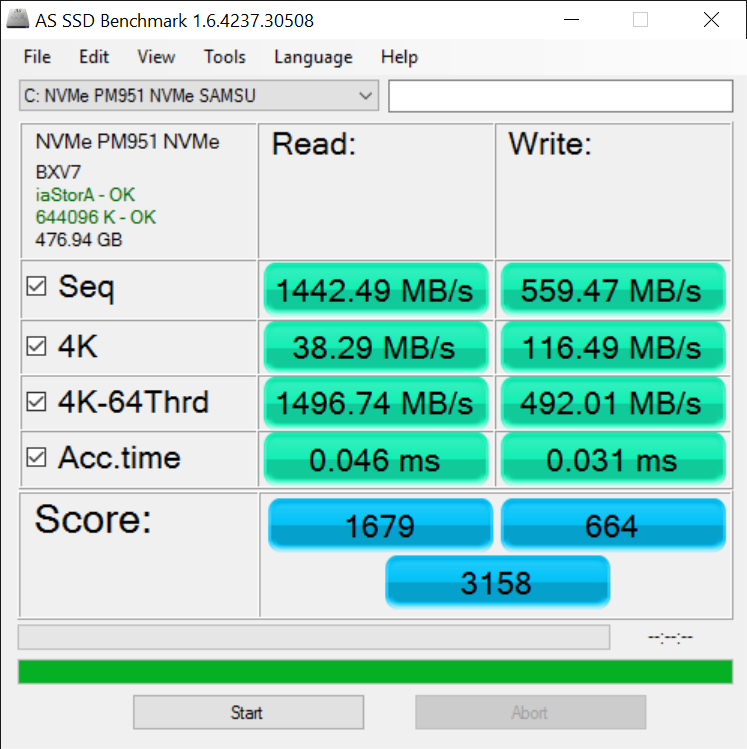
The 512 GB NVMe Samsung PM951 SSD easily outperforms SATA III-based SSDs on older notebooks and even some newer ones that have yet to make the transition to the newer controller or have decided to cut back on the feature, such as on the Spectre x360 13. The system only supports a single internal M.2 SSD, so additional storage space can get pricey very quickly for space-conscious users.
See our growing table of SSDs and HDDs for more comparisons and benchmarks.
| Dell XPS 13 9350 WQXGA Iris Graphics 540, 6560U, Samsung PM951 NVMe 512 GB | HP ProBook 430 G2 L3Q21EA HD Graphics 5500, 5200U, Samsung SSD PM851 128 GB MZ7TE128HMGR | Asus Zenbook UX303UB-DH74T GeForce 940M, 6500U, CUK Cyclone SSD 1TB | Apple MacBook Air 13 inch 2015-03 HD Graphics 6000, 5650U, Apple SSD SD0256F | Lenovo Yoga 900-13ISK 80MK HD Graphics 520, 6500U, Samsung SSD PM871 MZNLN512HCJH | Dell XPS 13-9333 HD Graphics 4400, 4200U, Liteonit LMT-128M6M | |
|---|---|---|---|---|---|---|
| AS SSD | -74% | -63% | -68% | -42% | -63% | |
| Copy Game MB/s (MB/s) | 753 | 110.3 -85% | 392.8 -48% | 479.3 -36% | 298.7 -60% | |
| Copy Program MB/s (MB/s) | 271.8 | 105 -61% | 233.7 -14% | 245 -10% | 249.6 -8% | |
| Copy ISO MB/s (MB/s) | 1041 | 136.3 -87% | 382.5 -63% | 643 -38% | 364.5 -65% | |
| Score Total (Points) | 3158 | 838 -73% | 882 -72% | 2383 -25% | 1129 -64% | 902 -71% |
| Score Write (Points) | 664 | 218 -67% | 373 -44% | 463 -30% | 429 -35% | 337 -49% |
| Score Read (Points) | 1679 | 415 -75% | 333 -80% | 1281 -24% | 458 -73% | 373 -78% |
| Access Time Write * (ms) | 0.031 | 0.042 -35% | 0.051 -65% | 0.155 -400% | 0.039 -26% | 0.065 -110% |
| Access Time Read * (ms) | 0.046 | 0.141 -207% | 0.14 -204% | 0.171 -272% | 0.054 -17% | 0.078 -70% |
| 4K-64 Write (MB/s) | 492 | 111.1 -77% | 261.1 -47% | 338.9 -31% | 303 -38% | 249.5 -49% |
| 4K-64 Read (MB/s) | 1497 | 342.6 -77% | 256.9 -83% | 1140 -24% | 374.8 -75% | 294.2 -80% |
| 4K Write (MB/s) | 116.5 | 93.5 -20% | 71.3 -39% | 23.73 -80% | 80.6 -31% | 57.6 -51% |
| 4K Read (MB/s) | 38.29 | 26.84 -30% | 25.99 -32% | 19.16 -50% | 32.29 -16% | 29.32 -23% |
| Seq Write (MB/s) | 559 | 130.5 -77% | 409.8 -27% | 1001 79% | 454.6 -19% | 302.2 -46% |
| Seq Read (MB/s) | 1442 | 459 -68% | 505 -65% | 1212 -16% | 505 -65% | 492.7 -66% |
* ... smaller is better

GPU Performance
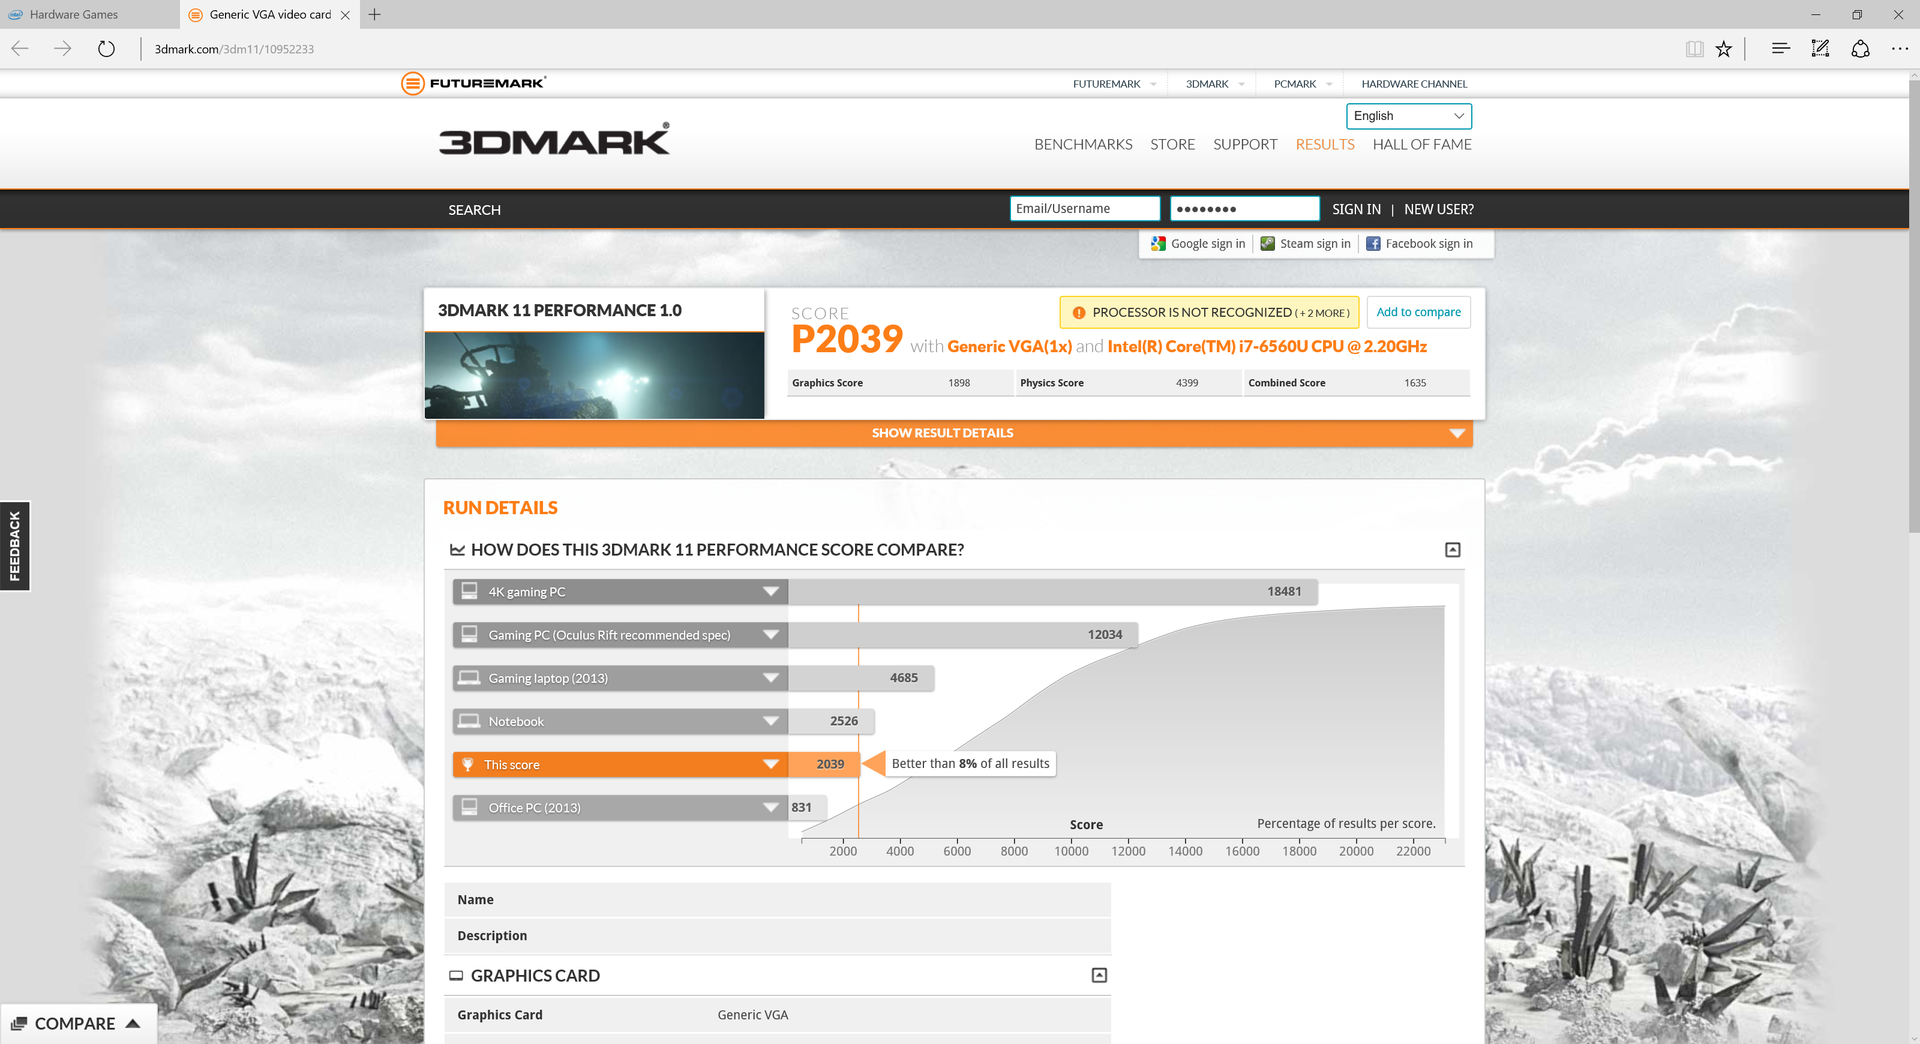
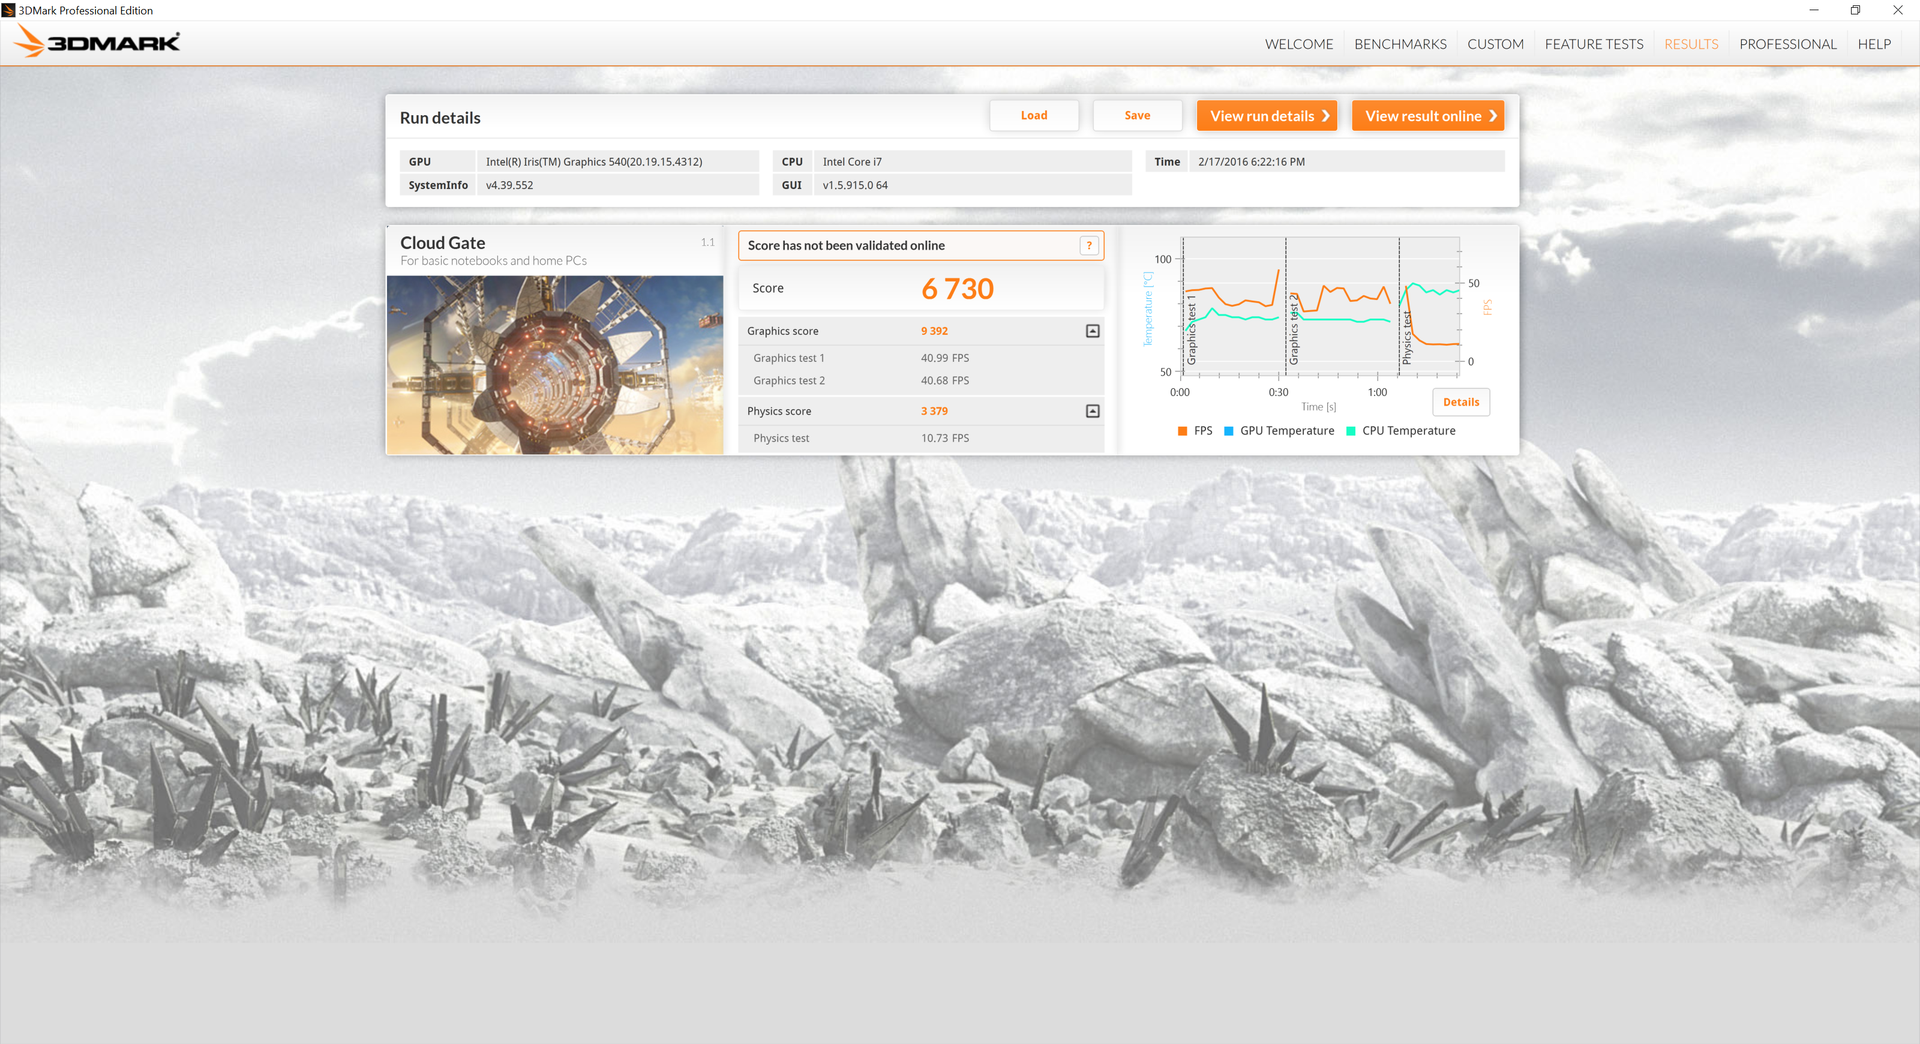
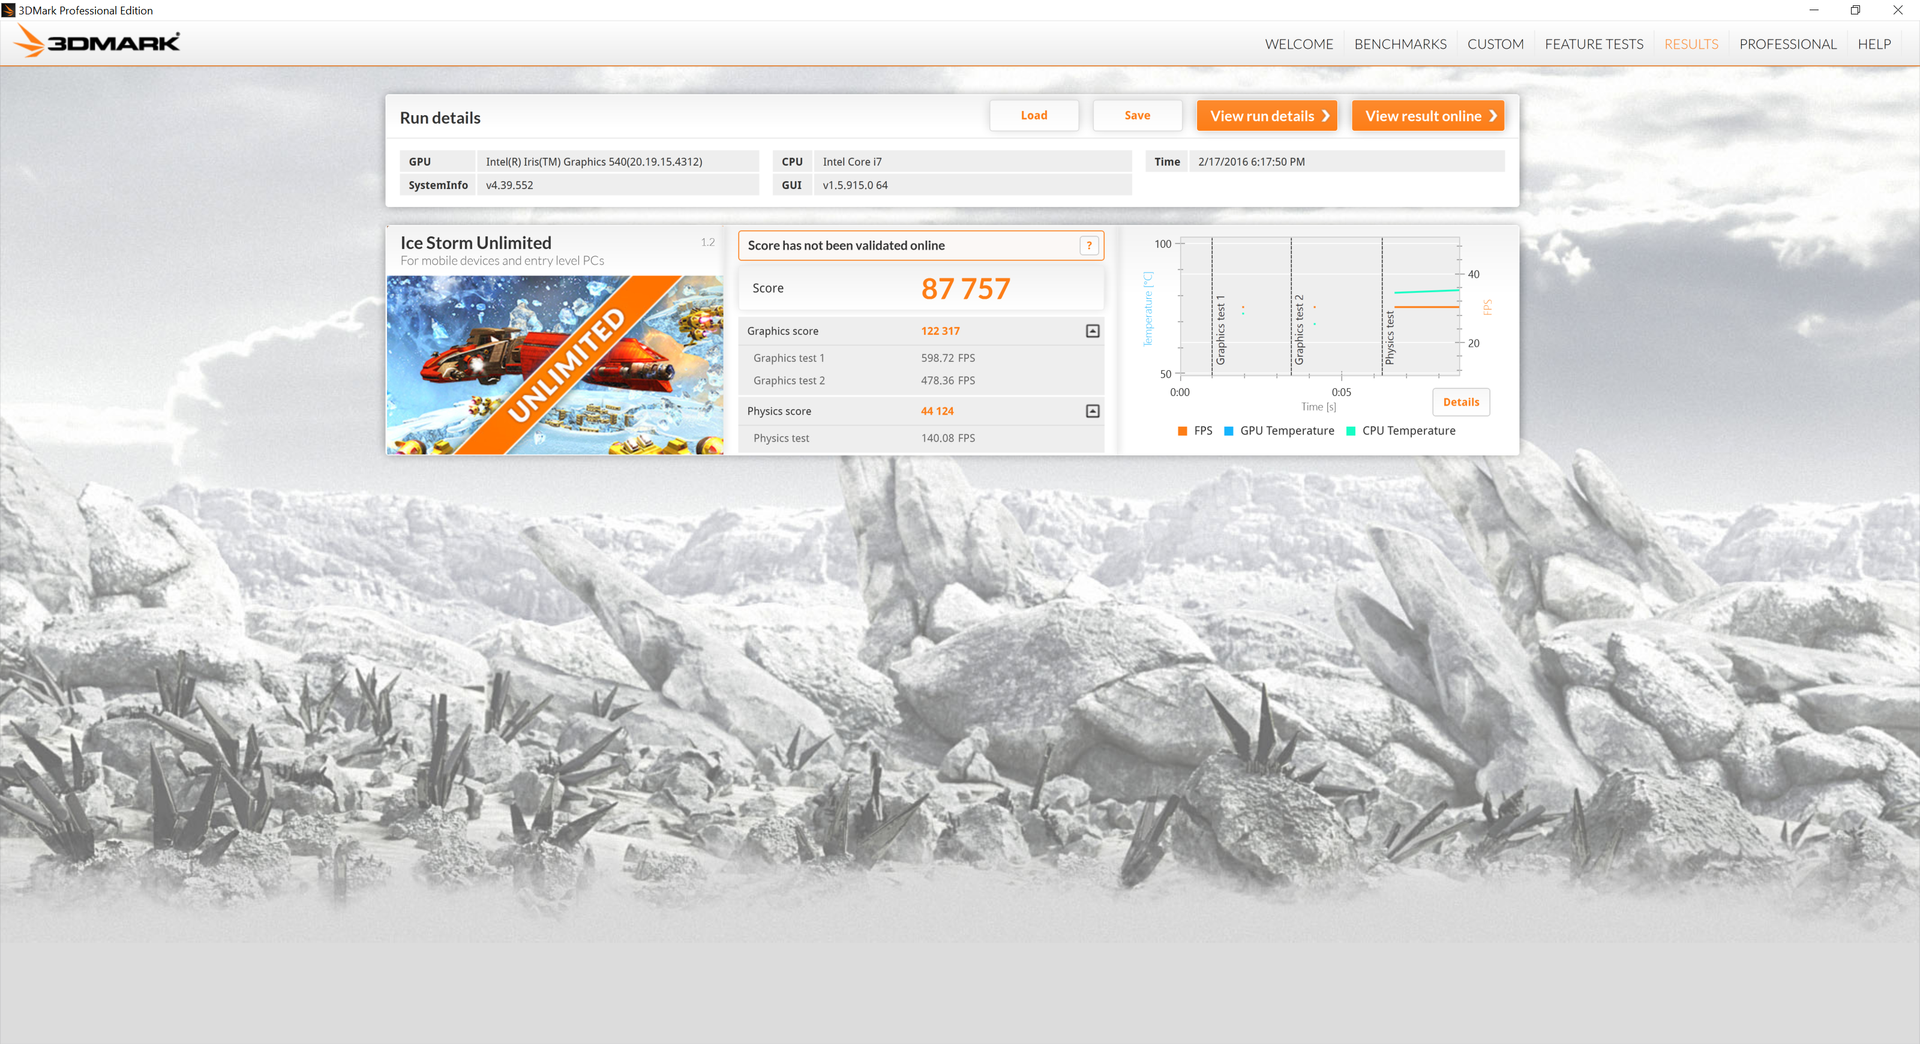
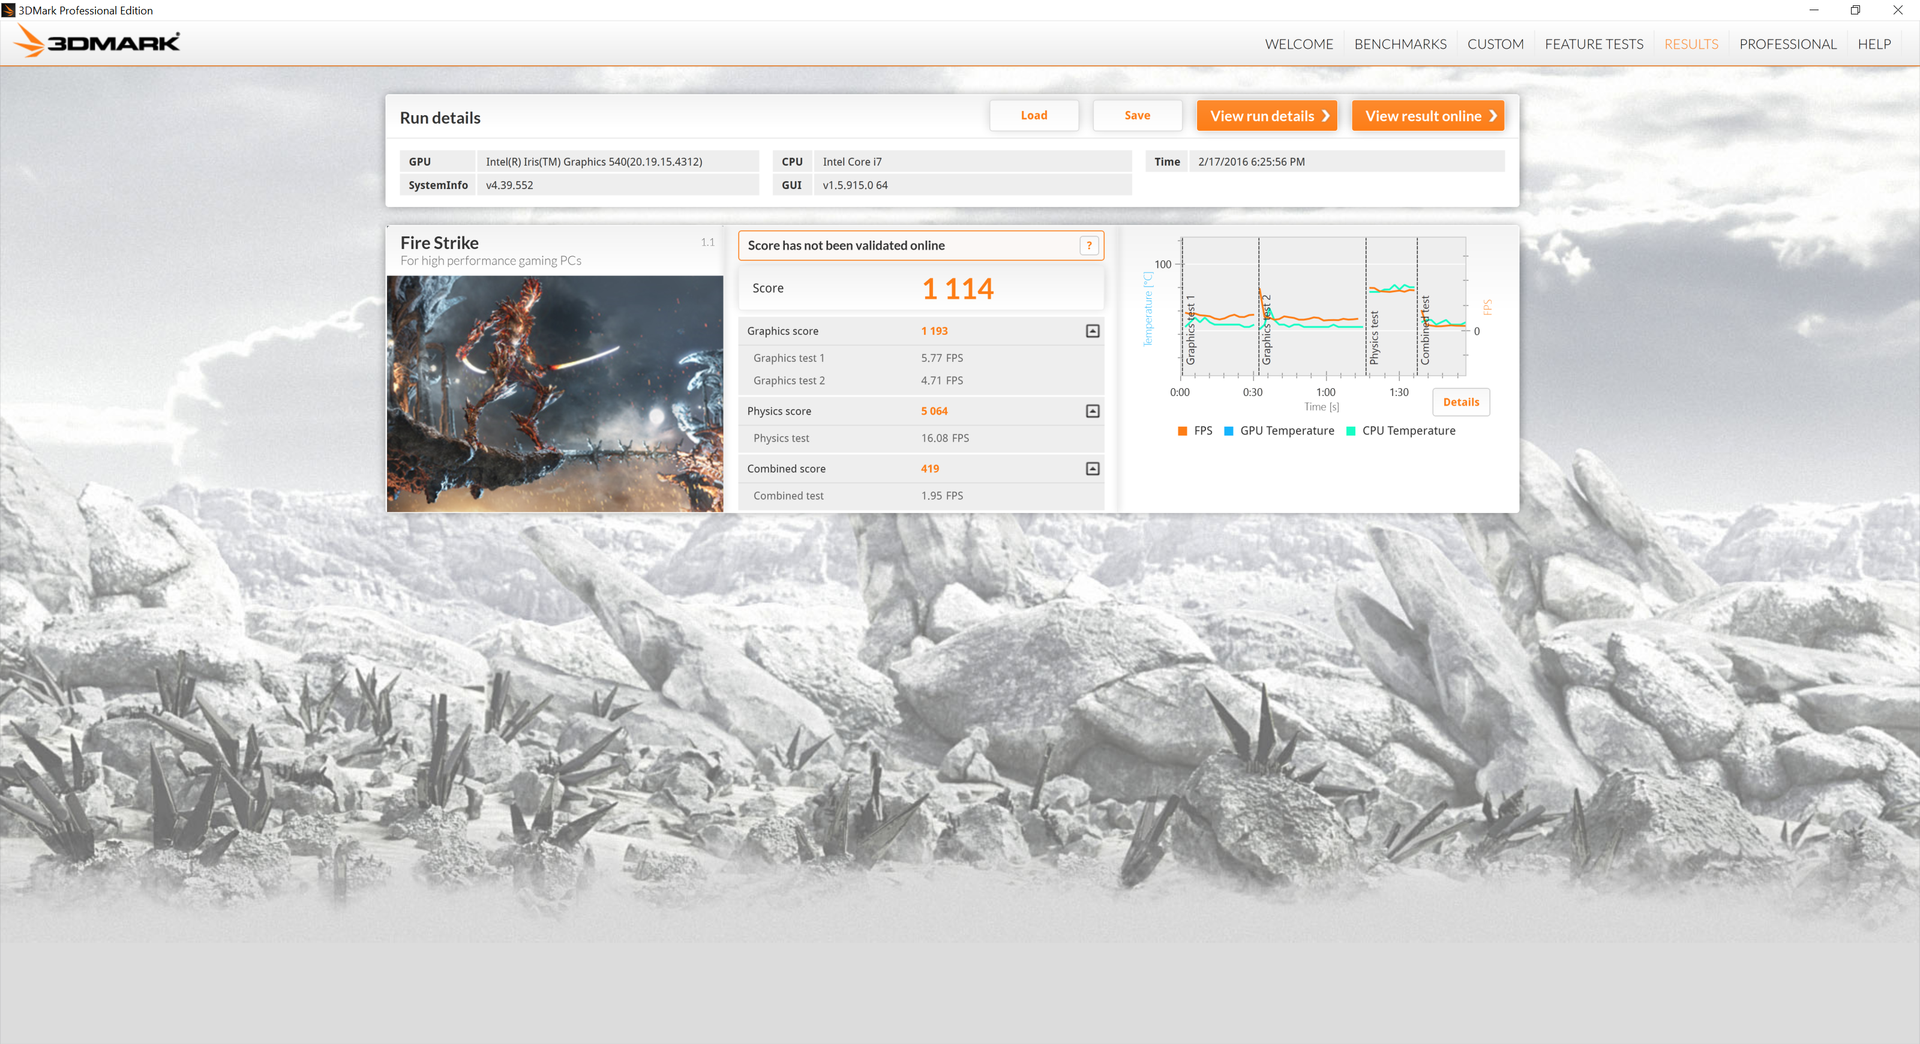
3DMark benchmarks show the Iris Graphics 540 in our Dell to be even slower than the same GPU in the Surface Pro 4 tablet by roughly 20 percent in Cloud Gate, Fire Strike, and 3DMark 11 Graphics. Performance is still a step above the HD 5600, but the gap could have been much wider if the Dell system had more consistent Turbo Boost performance.
See our dedicated GPU page on the Iris Graphics 540 for more technical information and benchmarks.
| 3DMark 11 | |
| 1280x720 Performance (sort by value) | |
| Dell XPS 13 9350 WQXGA | |
| Microsoft Surface Pro 4 Core i7 | |
| MSI GT72 | |
| HP Spectre x360 15-ap011dx | |
| HP Spectre x2 12-a003ng K3D42EA | |
| Fujitsu Lifebook E544 | |
| 1280x720 Performance Combined (sort by value) | |
| Dell XPS 13 9350 WQXGA | |
| Microsoft Surface Pro 4 Core i7 | |
| MSI GT72 | |
| HP Spectre x360 15-ap011dx | |
| HP Spectre x2 12-a003ng K3D42EA | |
| Fujitsu Lifebook E544 | |
| 1280x720 Performance GPU (sort by value) | |
| Dell XPS 13 9350 WQXGA | |
| Microsoft Surface Pro 4 Core i7 | |
| MSI GT72 | |
| HP Spectre x360 15-ap011dx | |
| HP Spectre x2 12-a003ng K3D42EA | |
| Fujitsu Lifebook E544 | |
| 3DMark | |
| 1920x1080 Fire Strike Score (sort by value) | |
| Dell XPS 13 9350 WQXGA | |
| Microsoft Surface Pro 4 Core i7 | |
| MSI GT72 | |
| HP Spectre x360 15-ap011dx | |
| HP Spectre x2 12-a003ng K3D42EA | |
| 1280x720 Cloud Gate Standard Score (sort by value) | |
| Dell XPS 13 9350 WQXGA | |
| Microsoft Surface Pro 4 Core i7 | |
| MSI GT72 | |
| HP Spectre x360 15-ap011dx | |
| HP Spectre x2 12-a003ng K3D42EA | |
| Fujitsu Lifebook E544 | |
| 1280x720 Ice Storm Standard Score (sort by value) | |
| Dell XPS 13 9350 WQXGA | |
| Microsoft Surface Pro 4 Core i7 | |
| MSI GT72 | |
| HP Spectre x360 15-ap011dx | |
| HP Spectre x2 12-a003ng K3D42EA | |
| Fujitsu Lifebook E544 | |
| Fire Strike Extreme Graphics (sort by value) | |
| Dell XPS 13 9350 WQXGA | |
| Microsoft Surface Pro 4 Core i7 | |
| HP Spectre x360 15-ap011dx | |
| Fire Strike Extreme Combined (sort by value) | |
| Dell XPS 13 9350 WQXGA | |
| Microsoft Surface Pro 4 Core i7 | |
| HP Spectre x360 15-ap011dx | |
| 1280x720 Cloud Gate Standard Graphics (sort by value) | |
| Dell XPS 13 9350 WQXGA | |
| Microsoft Surface Pro 4 Core i7 | |
| MSI GT72 | |
| HP Spectre x360 15-ap011dx | |
| HP Spectre x2 12-a003ng K3D42EA | |
| Fujitsu Lifebook E544 | |
| 3DMark 11 Performance | 2039 points | |
| 3DMark Ice Storm Standard Score | 58948 points | |
| 3DMark Cloud Gate Standard Score | 6730 points | |
| 3DMark Fire Strike Score | 1114 points | |
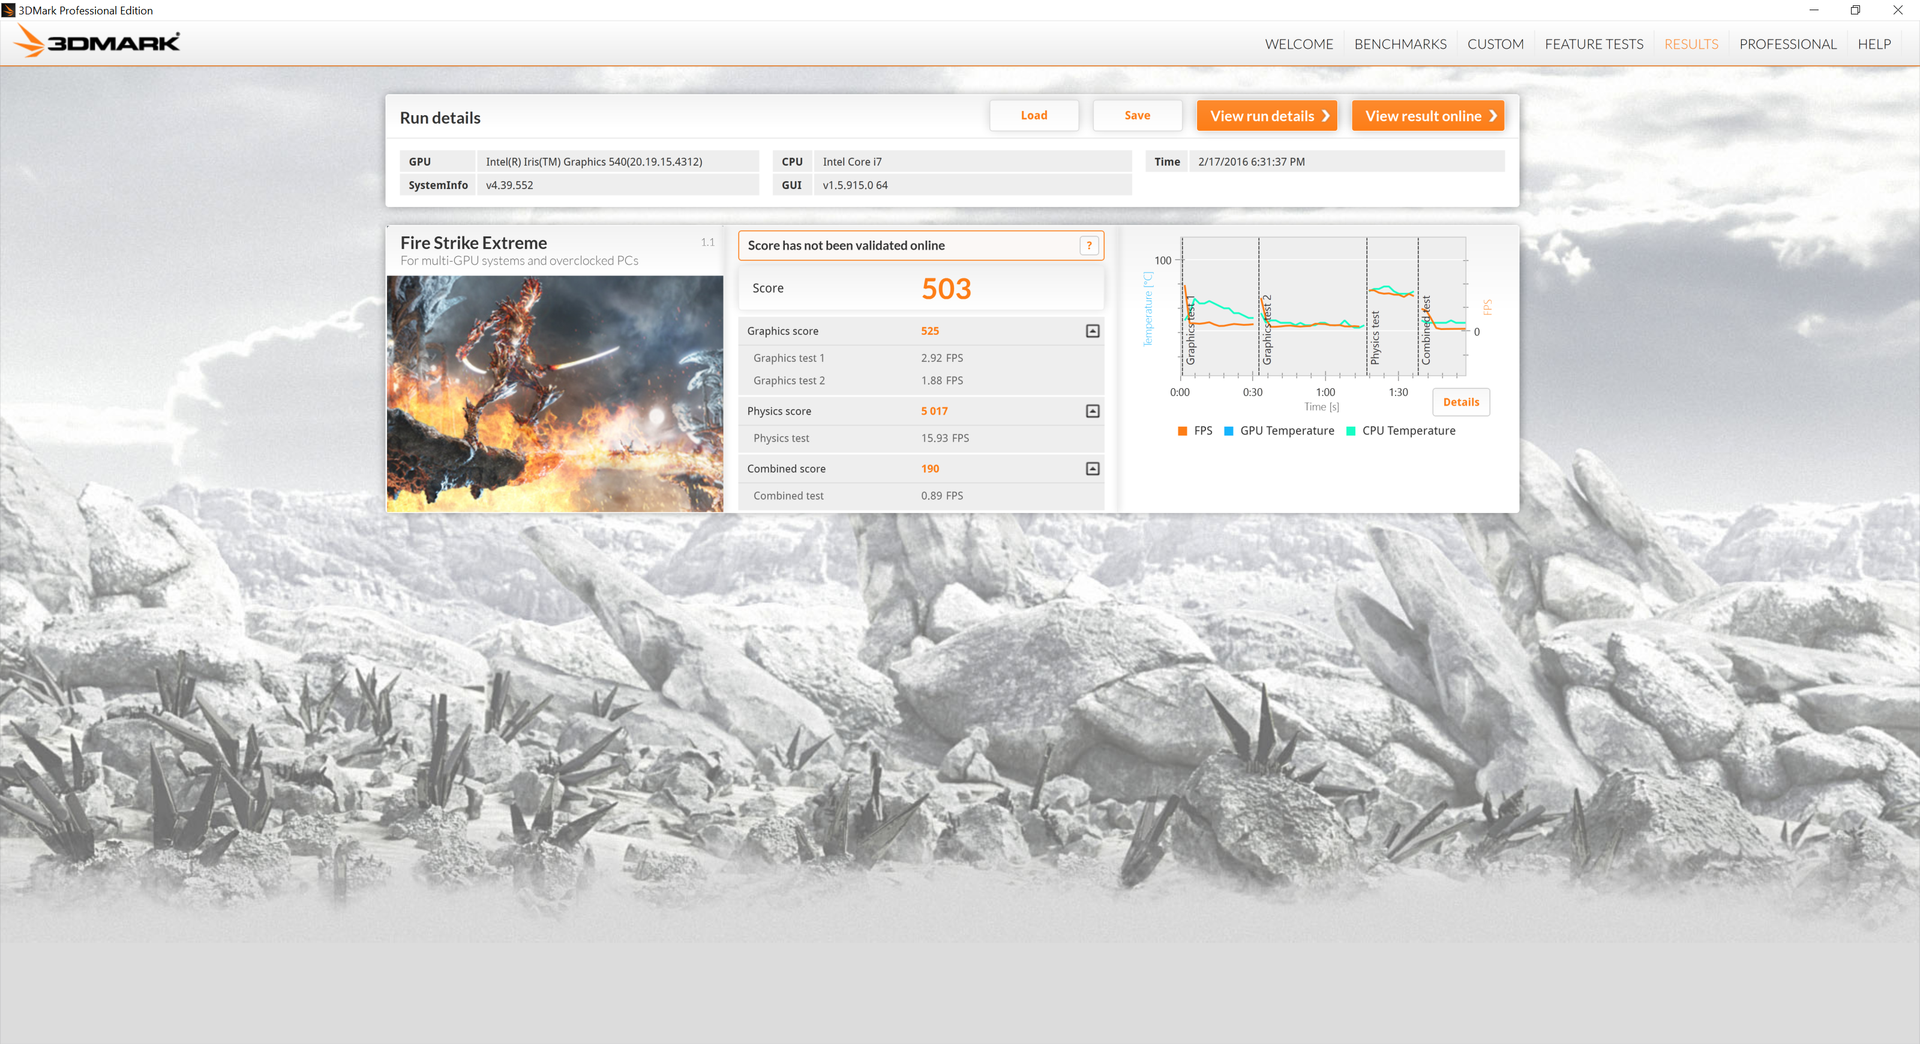
| 3DMark Fire Strike Extreme Score | 503 points | |
Help | ||
Gaming Performance
The Iris Graphics 540 in the XPS 13 is handily ahead of the HD Graphics 520, the older HD 4600, and even Nvidia's low-end GeForce 920M according to our Tomb Raider benchmarks. The discrete 940M is faster still and is available on select Ultrabooks of similar screen size. Modern 3D games are only barely playable on the lowest settings unless if League of Legends or Starcraft II are your primary titles. We tried to run Rise of the Tomb Raider and Batman: Arkham Knight as well, both of which crashed and were unable to launch.
| Tomb Raider - 1366x768 Normal Preset AA:FX AF:4x (sort by value) | |
| Dell XPS 13 9350 WQXGA | |
| Asus Zenbook UX303UB-DH74T | |
| Lenovo U31-70 80M5003EGE | |
| Asus Zenbook UX303UA-FN121T | |
| Lenovo IdeaPad Miix 700 | |
| Lenovo ThinkPad L440 20AT004QGE | |
| low | med. | high | ultra | |
|---|---|---|---|---|
| Tomb Raider (2013) | 85 | 49.2 | 33.3 | |
| Metro: Last Light (2013) | 28.1 | 23 | 15.8 | |
| Thief (2014) | 23.3 | 15.7 | 13.7 | |
| Metal Gear Solid V (2015) | 48.6 | 28.9 | 13.9 |
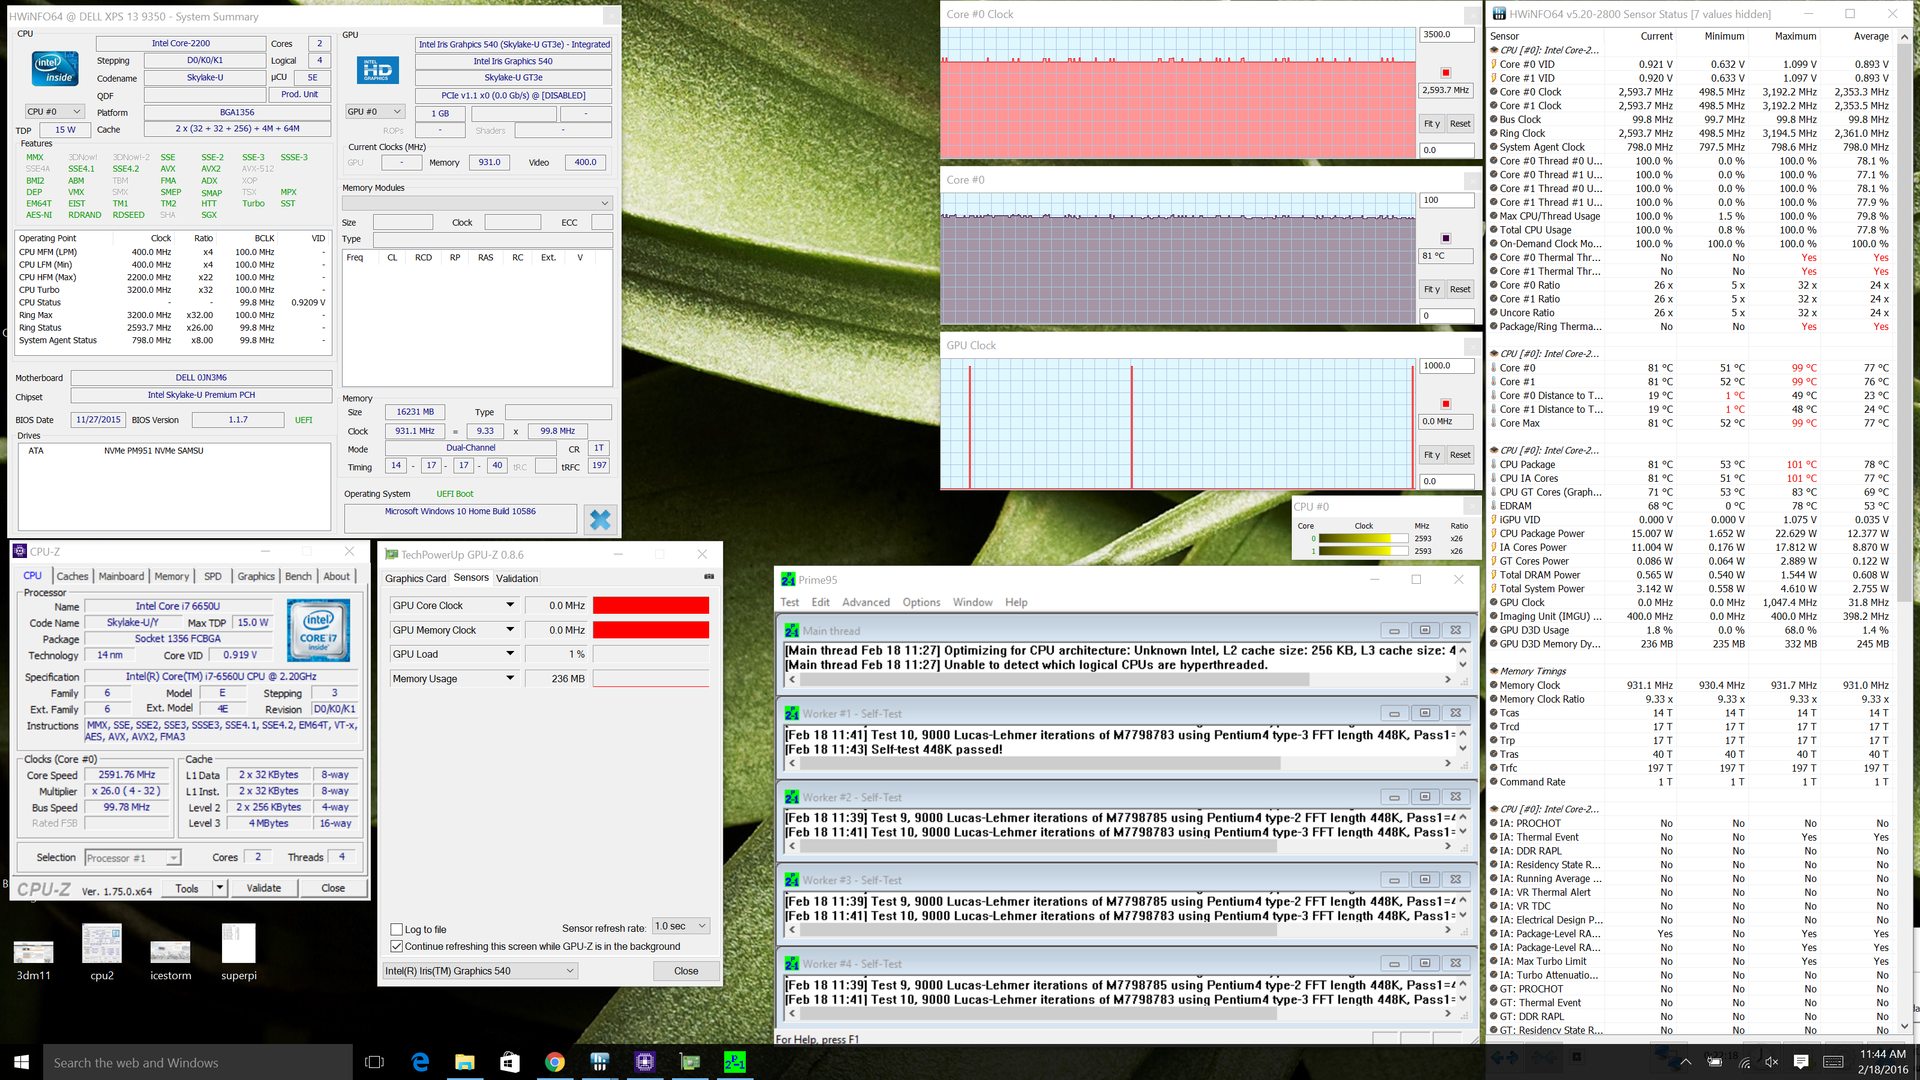
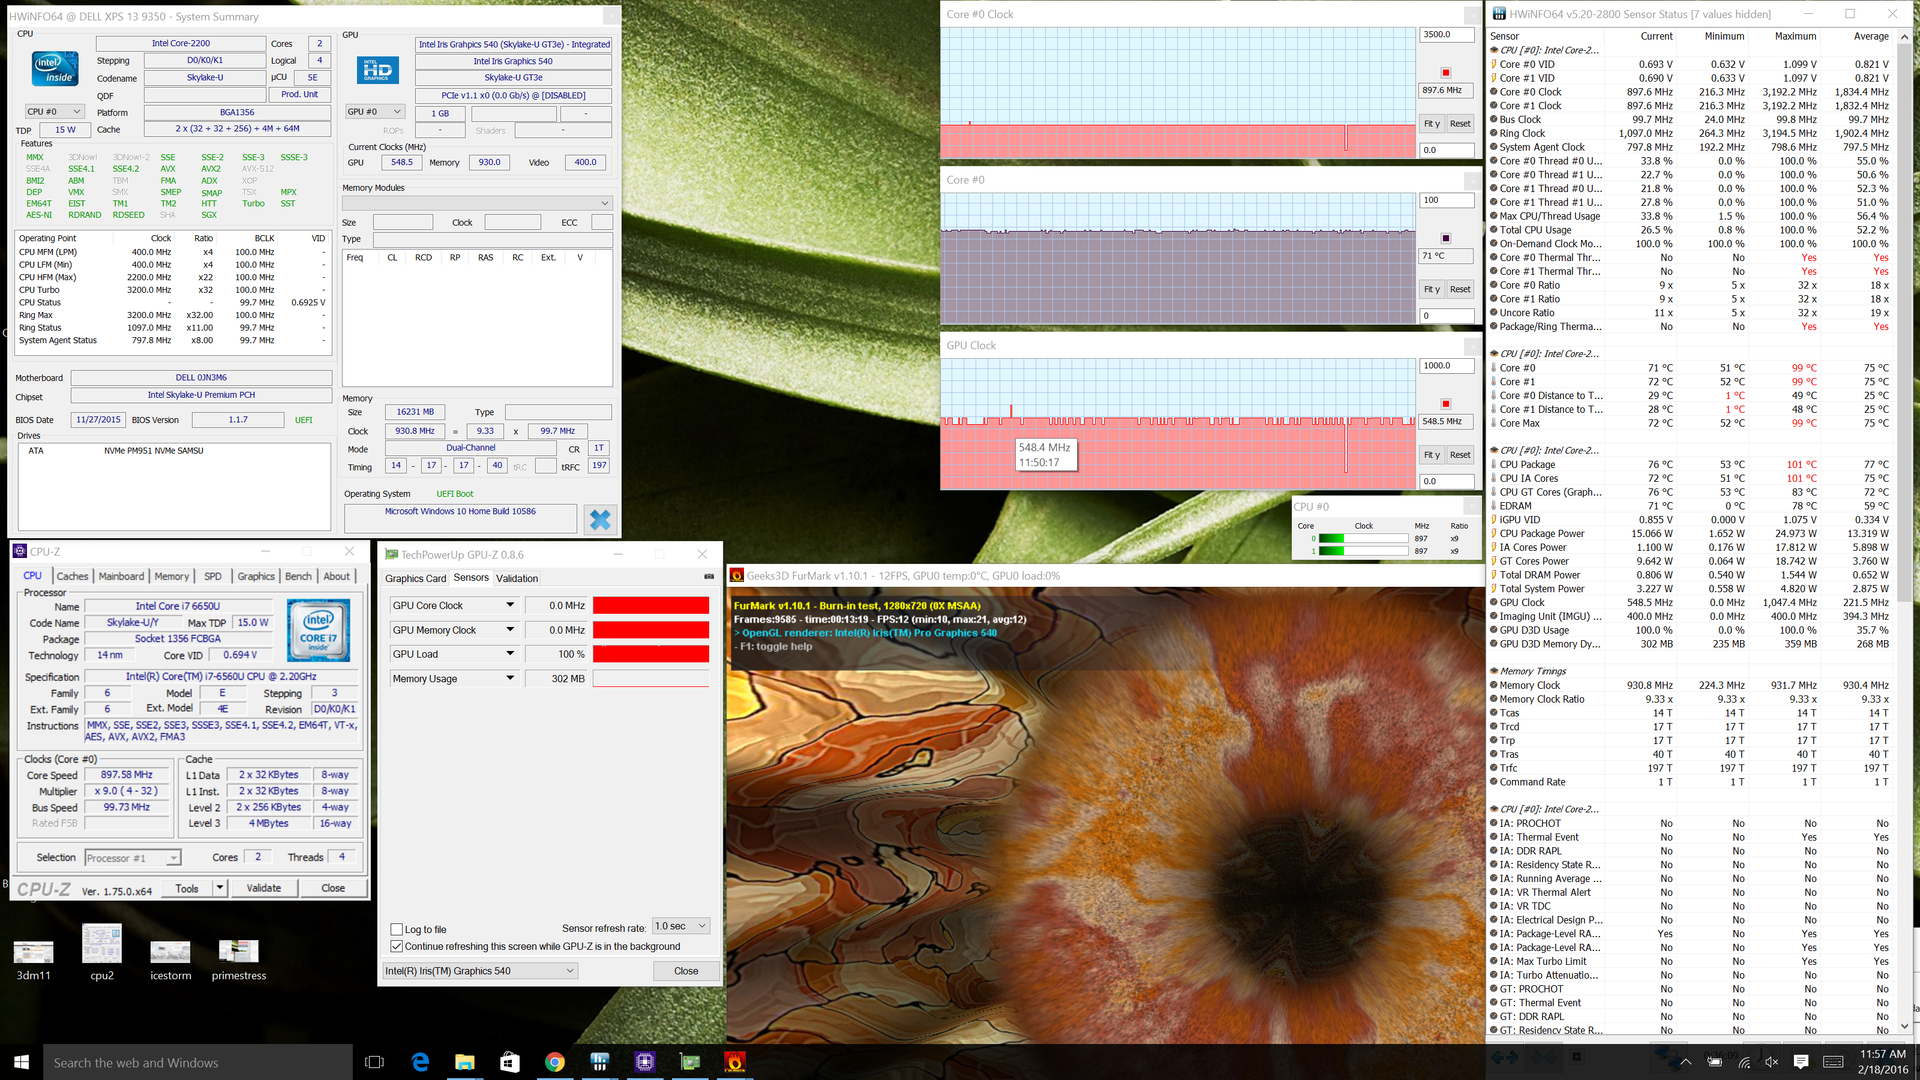
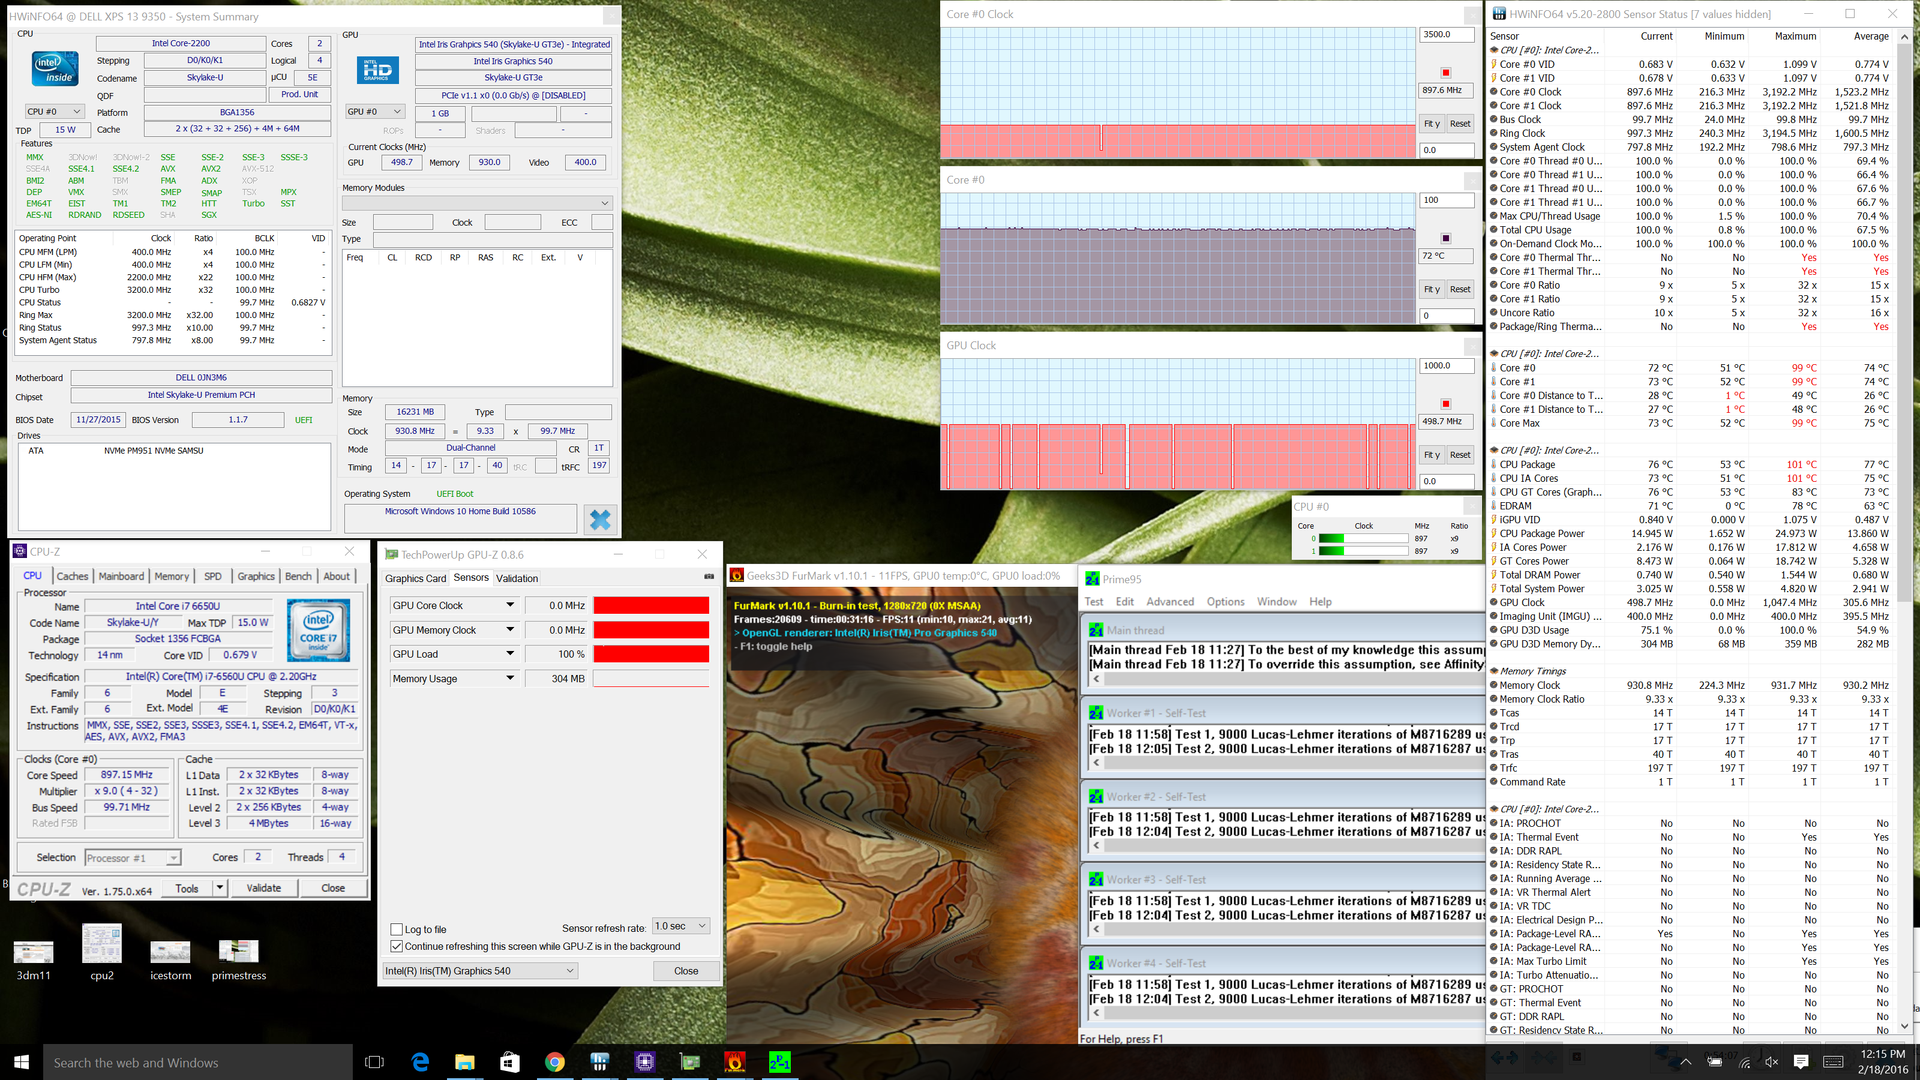
Stress Test
Our stress test confirms our suspicions from above: The XPS 13 SKU with the Core i7-6560U experiences slight throttling and high core temperatures. A Prime95 run will show the CPU running at its maximum multi-threaded 3.1 GHz Turbo Boost for just a few seconds before core temperatures reach over 90 C. At this point, the Turbo Boost drops to a constant 2.6 GHz in order to maintain a temperature of 80 C. FurMark stress will bring the GPU down to the 500 MHz range or roughly 200 MHz faster than its base clock rate. Running both Prime95 and FurMark simultaneously will drop both CPU and GPU clock rates to maintain an even lower core temperature.
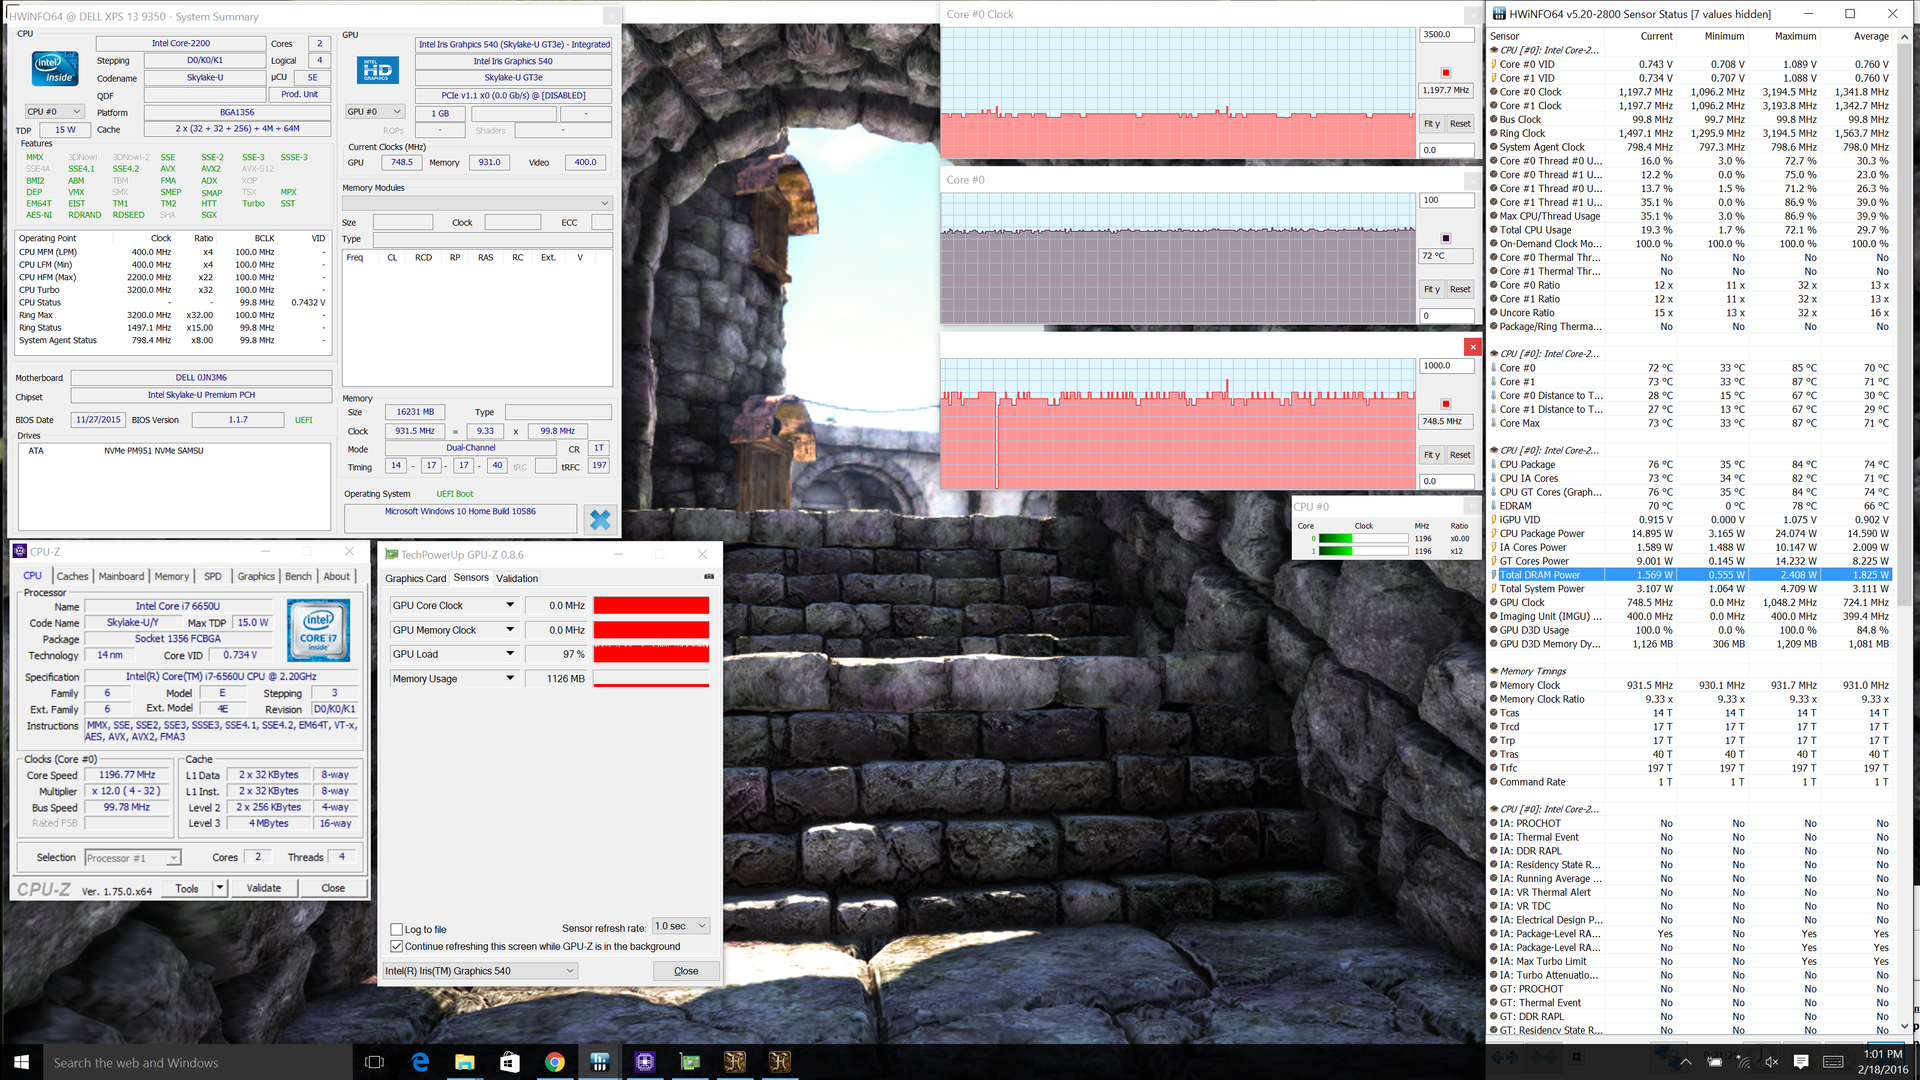
The Dell system underperforms when subjected to Unigine Heaven stress. CPU and GPU clock rates eventually settle at just 1.2 GHz and 700 to 750 MHz, respectively, after just a minute or so into the test. In comparison, the i7-6650U and Iris Graphics 540 in the Surface Pro 4 settle at much higher frequencies of 2.5 to 3.2 GHz and 950 MHz, respectively.
Running on battery power will not significantly drop CPU or GPU performance. A 3DMark run on batteries returns Physics and Graphics scores of 4204 points and 1845 points, respectively, compared to 4399 points and 1898 points when connected to mains.
| CPU Clock (GHz) | GPU Clock (MHz) | Average Core Temperature (C) | |
| Prime95 Stress | 2.6 | -- | 81 |
| FurMark Stress | -- | 500 - 550 | 71 |
| Prime95 + FurMark Stress | 900 | 500 | 72 |
| Unigine Heaven Stress | 1.2 | 700 - 750 | 72 |
Emissions
System Noise
Fan behavior remains the same as on our XPS 13 FHD SKU. That is, there appears to be just an "off" mode and an "on" mode with almost nothing in between, which is not common on notebooks. The system is normally quiet under regular workloads and will activate the fan when subjected to higher processing stress such as Unigine Heaven. Heavy browsing may also initiate the fan, though only for a very short time frame before idling again. Fan noise remains very quiet overall even when under extreme stress.
Beyond the fan noise, there also appears to be electronic noise (coil whine) emanating from the notebook that wasn't detectable by our sound equipment at far range, but is noticeable by ear when up close to the keyboard. We noticed this on our previous XPS 13 QHD+ SKU as well, so the issue may be a common occurrence with specific configurations of the series.
| Dell XPS 13 9350 WQXGA Iris Graphics 540, 6560U, Samsung PM951 NVMe 512 GB | HP ProBook 430 G3 P5T00ES HD Graphics 520, 6200U, Hitachi Travelstar Z7K500 HTS725050A7E630 | Asus Zenbook UX303UB-DH74T GeForce 940M, 6500U, CUK Cyclone SSD 1TB | Apple MacBook Air 13 inch 2015-03 HD Graphics 6000, 5650U, Apple SSD SD0256F | Lenovo Yoga 900-13ISK 80MK HD Graphics 520, 6500U, Samsung SSD PM871 MZNLN512HCJH | HP Spectre x360 13-4104ng HD Graphics 520, 6200U, Samsung SSD PM851 256 GB MZNTE256HMHP | |
|---|---|---|---|---|---|---|
| Noise | -7% | -11% | -15% | -6% | -10% | |
| off / environment * (dB) | 29.2 | |||||
| Idle Minimum * (dB) | 29.2 | 29.8 -2% | 29.8 -2% | 29.2 -0% | 29.7 -2% | 29.6 -1% |
| Idle Average * (dB) | 29.2 | 29.8 -2% | 29.8 -2% | 29.2 -0% | 29.8 -2% | 29.6 -1% |
| Idle Maximum * (dB) | 29.2 | 30.9 -6% | 29.8 -2% | 29.2 -0% | 30 -3% | 34.6 -18% |
| Load Average * (dB) | 31.4 | 33.3 -6% | 37.4 -19% | 40.2 -28% | 32 -2% | 34.7 -11% |
| Load Maximum * (dB) | 31.4 | 37.4 -19% | 40.3 -28% | 46.3 -47% | 38.5 -23% | 37.9 -21% |
* ... smaller is better
Noise level
| Idle |
| 29.2 / 29.2 / 29.2 dB(A) |
| Load |
| 31.4 / 31.4 dB(A) |
 | ||
30 dB silent 40 dB(A) audible 50 dB(A) loud |
||
min: | ||
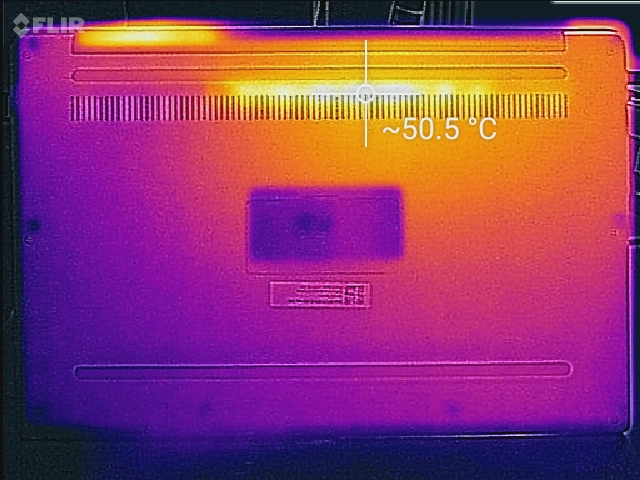
Temperature
Surface temperatures when idling are already quite warm at around 32 C on the warmest spot against a room temperature of 19 C. When subjected to unrealistic maximum loads (Prime95 + FurMark), the hot spots can reach just over 50 C. It's easy to see spots where the processor, heat pipes, and ventilation grilles are located based on the thermal images alone.
Compared to competing 13.3-inch notebooks, the XPS 13 is noticeably warmer than the Zenbook UX303UB, MacBook Air 13, Yoga 900, and HP Spectre x360 13 under similar processing conditions where the lower to mid 40 C range is more common.
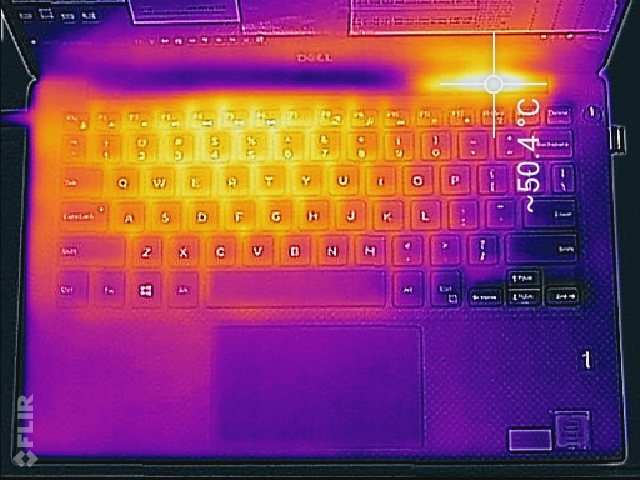
(±) The maximum temperature on the upper side is 41.4 °C / 107 F, compared to the average of 35.9 °C / 97 F, ranging from 21.4 to 59 °C for the class Subnotebook.
(-) The bottom heats up to a maximum of 49.2 °C / 121 F, compared to the average of 39.2 °C / 103 F
(+) In idle usage, the average temperature for the upper side is 26.7 °C / 80 F, compared to the device average of 30.8 °C / 87 F.
(+) The palmrests and touchpad are cooler than skin temperature with a maximum of 28.7 °C / 83.7 F and are therefore cool to the touch.
(±) The average temperature of the palmrest area of similar devices was 28.2 °C / 82.8 F (-0.5 °C / -0.9 F).
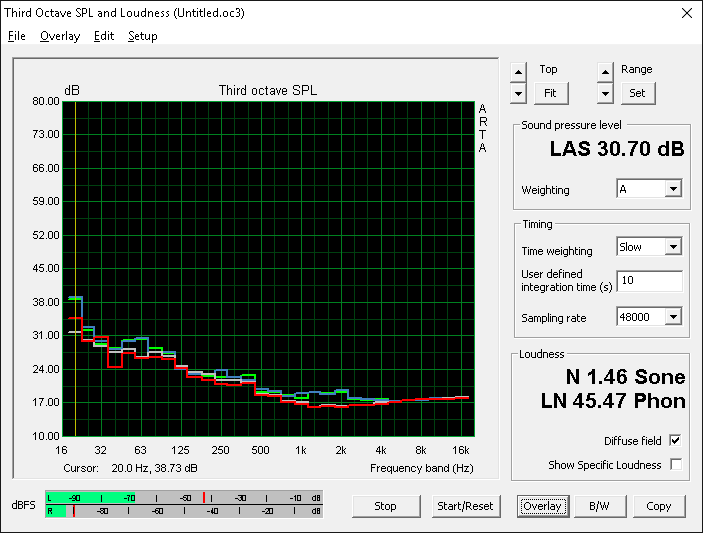
Speakers
")
The stereo speakers are good for a notebook this size. Its range is a bit narrow as the bass frequencies are almost undetectable compared to the middle and high ranges. Thus, sounds have a "tinny" quality to them that tablet and smartphone users should be quite familiar with. Playback at maximum volume introduces no static or increasing imbalances.
Energy Management
Power Consumption
Our XPS 13 QHD+ configuration with the i7-6560U draws just slightly more power than our previous configuration with the i7-6500U when idling and under gaming loads. Maximum load, however, shows lower power demands from the i7-6560U SKU possibly due to the system's heavier throttling under such extreme conditions.
| Off / Standby | |
| Idle | |
| Load |
|
Key:
min: | |
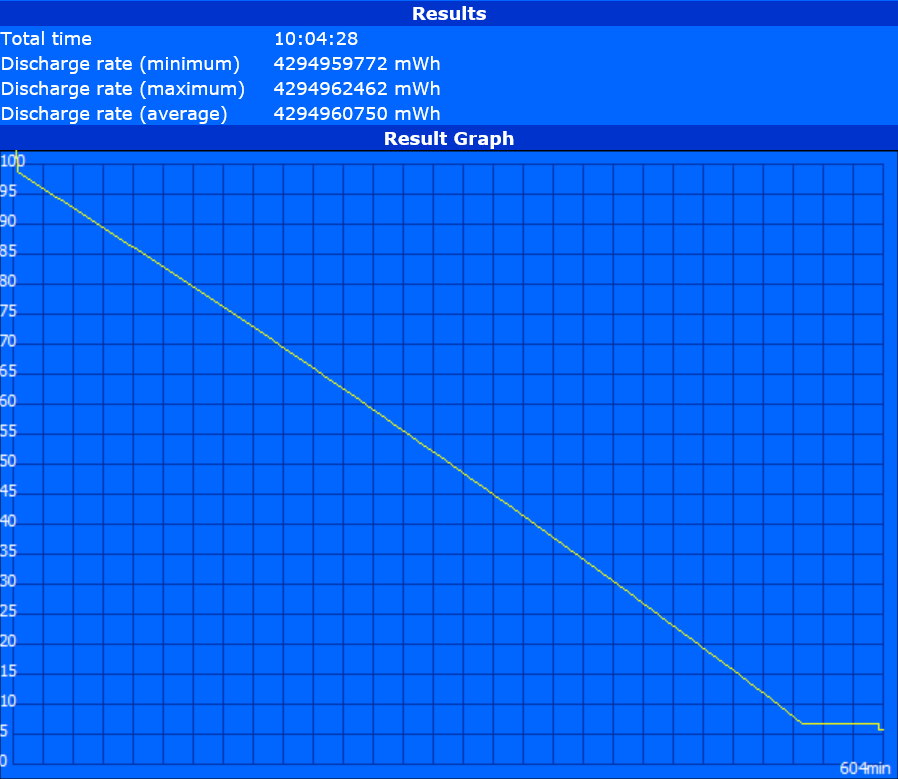
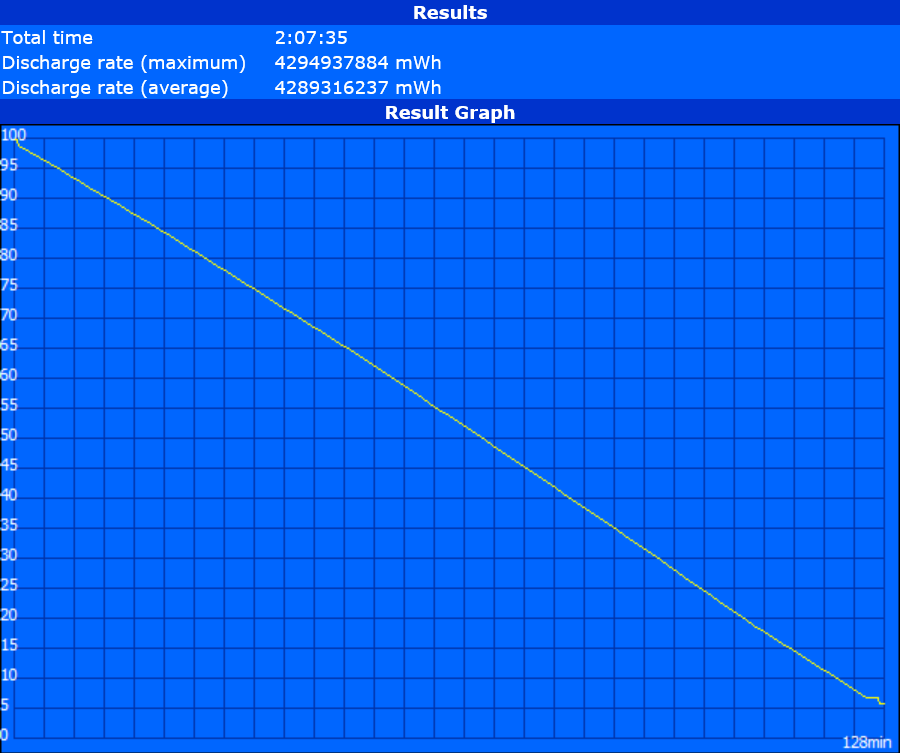
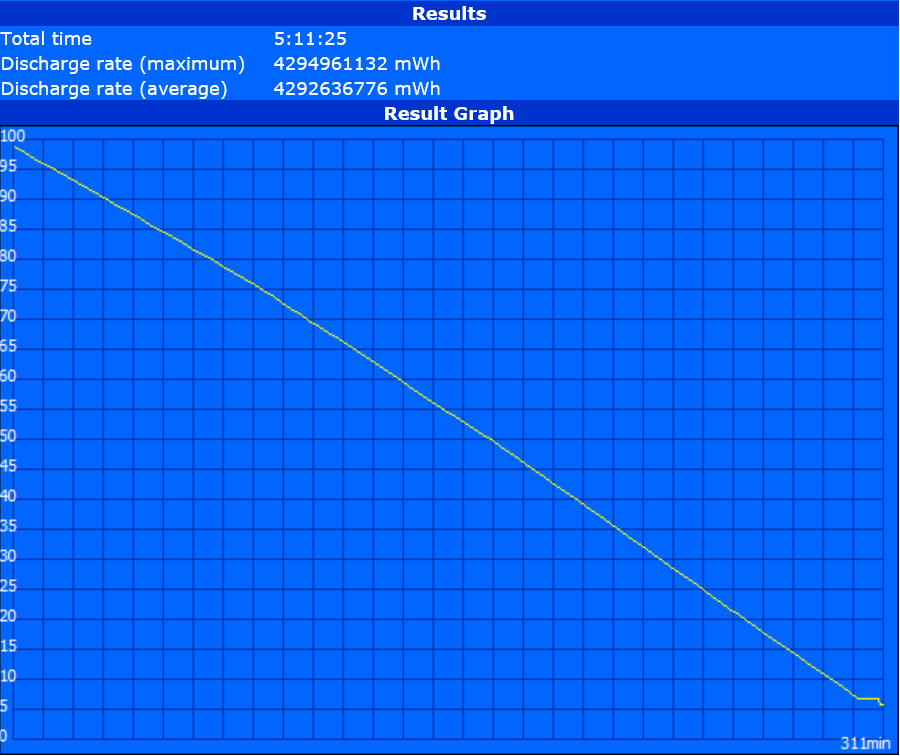
Battery Life
Runtimes are average if not disappointing. Our recorded WLAN runtime of just over five hours may be sufficient for most users, but competing notebooks offer far longer runtimes under the same conditions. We repeated the test a second time as our runtimes seem to be significantly shorter than our previous XPS 13 QHD+ test unit and returned with no improvement.
| Dell XPS 13 9350 WQXGA 56 Wh | HP ProBook 430 G3 P5T00ES 44 Wh | Asus Zenbook UX303UB-DH74T 50 Wh | Apple MacBook Air 13 inch 2015-03 54 Wh | Lenovo Yoga 900-13ISK 80MK 66 Wh | HP Spectre x360 13-4104ng 56 Wh | |
|---|---|---|---|---|---|---|
| Battery runtime | -3% | -2% | 78% | 23% | 60% | |
| Reader / Idle (h) | 10.1 | 7.5 -26% | 10.3 2% | 26.2 159% | 14.1 40% | |
| WiFi v1.3 (h) | 5.2 | 6.3 21% | 5.7 10% | 10.3 98% | 6.7 29% | 8.3 60% |
| Load (h) | 2.1 | 2 -5% | 1.7 -19% | 1.6 -24% | 2.1 0% |
Pros
Cons
Verdict
Some of the best aspects of the XPS 13 other than its extraordinarily small footprint include its quiet fans and top tier display. The Core i7-6560U and integrated Iris Graphics 540 push the system even further without necessarily increasing fan noise, which is its own double-edged sword. While performance has improved, surface and core temperatures are much warmer to the point where the CPU will potentially throttle when under gaming loads. Battery life in particular takes a hit from the higher resolution QHD+ display and more demanding CPU. Overall performance is a step below the Core i7-6650U in the Surface Pro 4, especially in terms of graphics performance.
Users who have no need for the more powerful Iris Graphics 540 over the Graphics 520 may want to opt in for a less expensive SKU for longer runtimes. If GPU power is of higher importance, then it may be worth investing in the slightly larger Zenbook UX303 and its discrete Nvidia graphics for a better return in performance without sacrificing too much on the mobility front.
Dell XPS 13 9350 WQXGA
- 02/26/2016 v5 (old)
Allen Ngo
Price comparison
