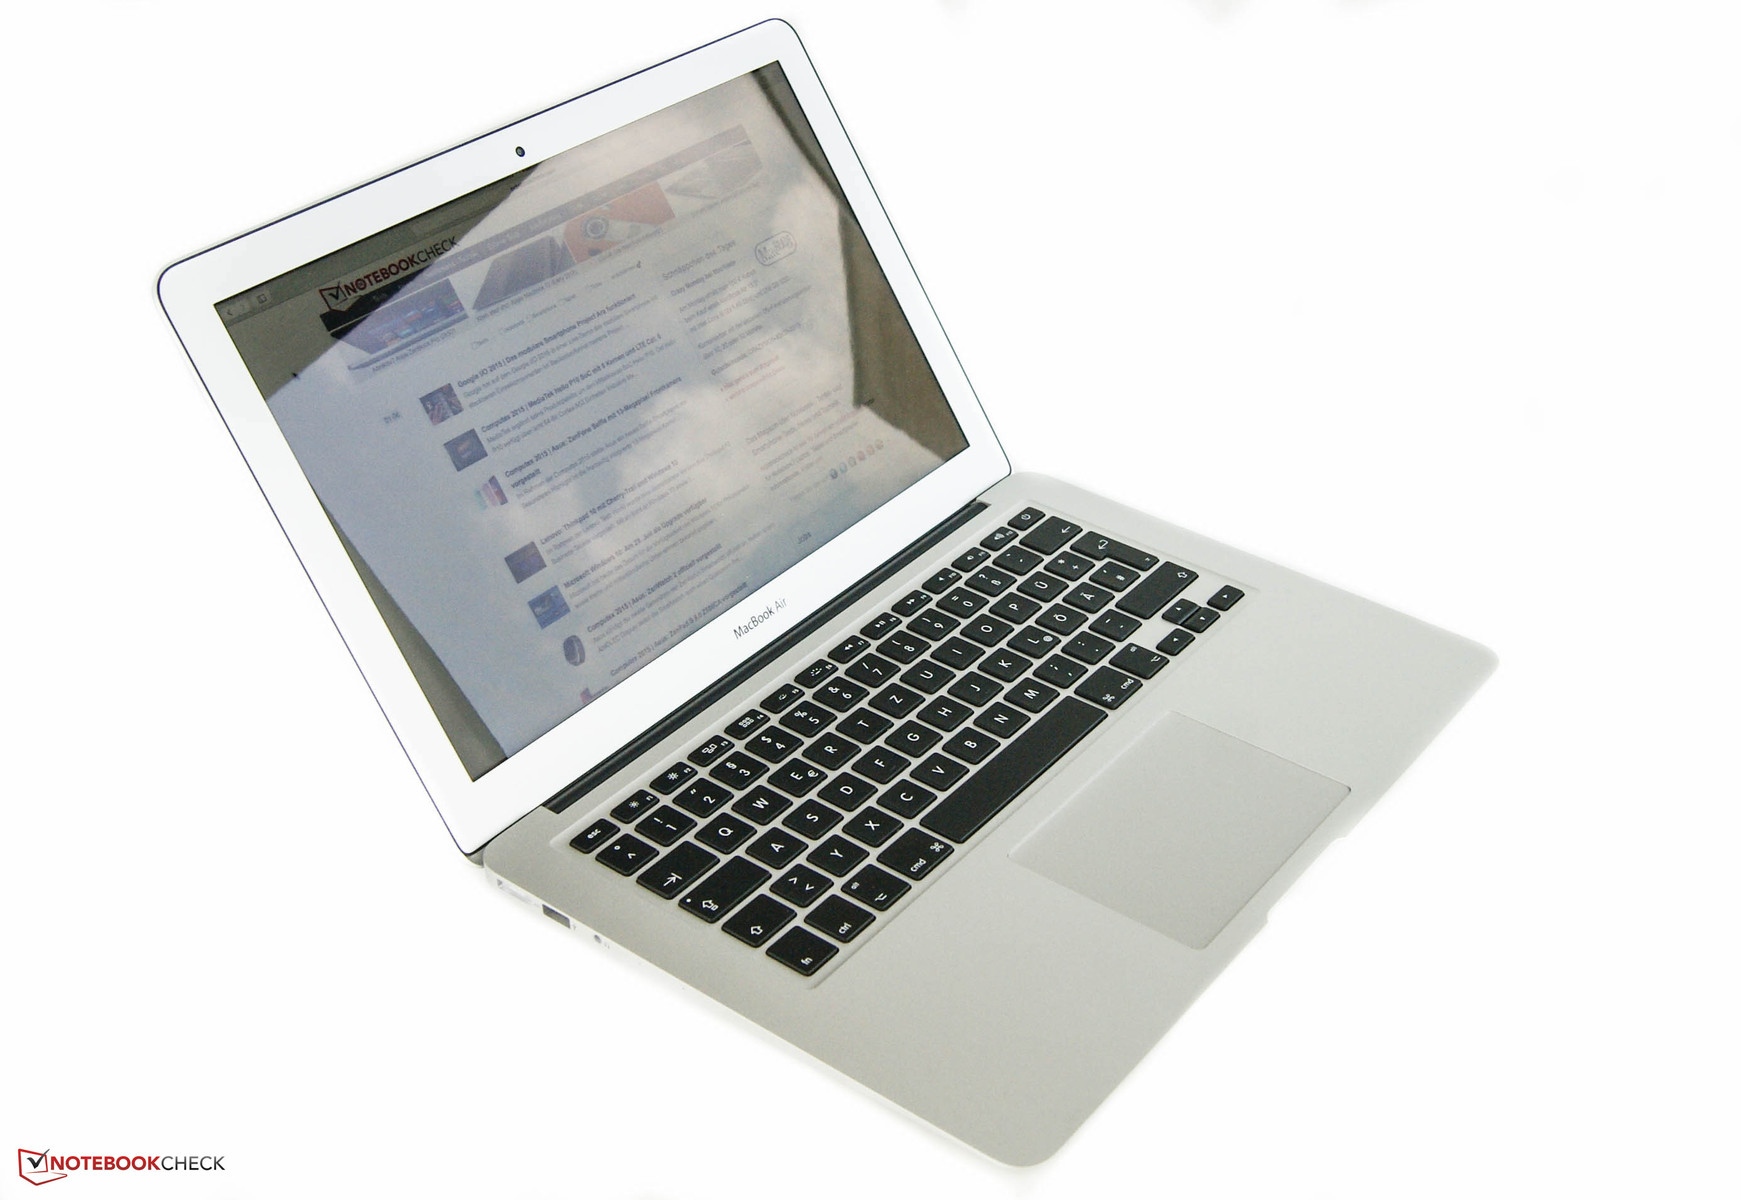
Apple MacBook Air 13 (2015) Notebook Review

Apple rather quietly upgraded their MacBook Air series with more powerful and newer hardware components in March 2015. In the latest Apple keynote, the company mainly focused on the new 12-inch MacBooks and the Apple Watch. In this article, we will especially cover the 13-inch MacBook Air. The most important change is probably that Intel's Haswell architecture has been replaced by Intel's Broadwell architecture. Instead of an Intel Core i7-4650U or i5-4260U, the new products feature an Intel Core i7-5650U or i5-5250U. Our test model houses the more powerful i7 CPU.
The internal graphics unit depends on the processor. It is the Intel HD Graphics 6000 instead of the previously used Intel HD Graphics 5000. According to the manufacturer, the graphics performance should be 20 to 25% better and the processing performance of the CPU should be 5 to 20% higher. In addition, the device comes with 8 GB dual-channel RAM and a 256 GB hard drive. The pricing is a severe step backwards for prospective buyers. Because of the weak Euro, Apple significantly increased the price of all their products. The test model of the Apple MacBook Air 13 costs 1590 Euros (~$1791). In comparison: The price is about $1450 in the USA. Further details are available in our special article.
In order to avoid redundancies, we will refer to the Apple MacBook Air 13-inch 2014 review for information about unchanged aspects.
In our test, we compare the test model to the already reviewed MacBook series and to other well-made 13-inch competitors like the equally expensive Toshiba Kira 10D or the XPS 13 ultrabook from Dell. The two competitors also use Intel's Broadwell architecture and an Intel Core i7-5500U.
Display
At the first glance, the display appears to have remained the same in terms of used technology and other specifications. Apple uses a TN panel with a maximum resolution of 1440x900 pixels. Competitors like the Dell XPS 13 not only feature a significantly better QHD+ resolution but also a touch panel. The Toshiba KIRA comes with an FHD display at least. The meager resolution might be annoying for technophiles as well as users used to Full HD, since the display looks grainy at a closer look. Although Apple incorporated quite a high-end TN panel, the competition shines with IPS displays. Unfortunately, the manufacturer does not offer other display options.
The average brightness of almost 310 cd/m² is acceptable. For example, it is significantly higher than the 231 cd/m² of the Dell XPS and even 30 - 40 cd/m² higher than previous Air models from the last two years. Please note: Other reviewed models of the Dell XPS 13 are not that dark. In mains operation, the Toshiba KIRA is on par with our MacBook, but the KIRA's brightness is 40 cd/m² lower on battery, while our test model's brightness does not fall on battery. The brightness distribution of 82% is 10% lower than the Toshiba's and on par with the Dell XPS 13's. The previous MacBook Air models also perform better. However, we could not detect screen bleeding despite the high brightness difference between the upper and the lower parts of the display. In addition, there is no PWM flickering when playing 60 fps videos.
| Apple MacBook Air 13 inch 2015-03 HD Graphics 6000, 5650U, Apple SSD SD0256F | Dell XPS 13 9343 Core i7 HD Graphics 5500, 5500U, Samsung SSD PM851 M.2 2280 256GB | Toshiba KIRA-10D HD Graphics 5500, 5500U, Toshiba HG6 THNSNJ256GMCU | Apple MacBook Air 13 MD761D/B 2014-06 HD Graphics 5000, 4260U, Apple SSD SD0256F | |
|---|---|---|---|---|
| Display | 54% | 69% | ||
| Display P3 Coverage (%) | 40.1 | 62.6 56% | 69.1 72% | |
| sRGB Coverage (%) | 59.8 | 89.8 50% | 98.2 64% | |
| AdobeRGB 1998 Coverage (%) | 41.51 | 64.2 55% | 71 71% | |
| Screen | 11% | 28% | 14% | |
| Brightness middle (cd/m²) | 329 | 232 -29% | 334 2% | 280 -15% |
| Brightness (cd/m²) | 310 | 231 -25% | 316 2% | 263 -15% |
| Brightness Distribution (%) | 82 | 82 0% | 92 12% | 84 2% |
| Black Level * (cd/m²) | 0.405 | 0.25 38% | 0.29 28% | 0.32 21% |
| Contrast (:1) | 812 | 928 14% | 1152 42% | 875 8% |
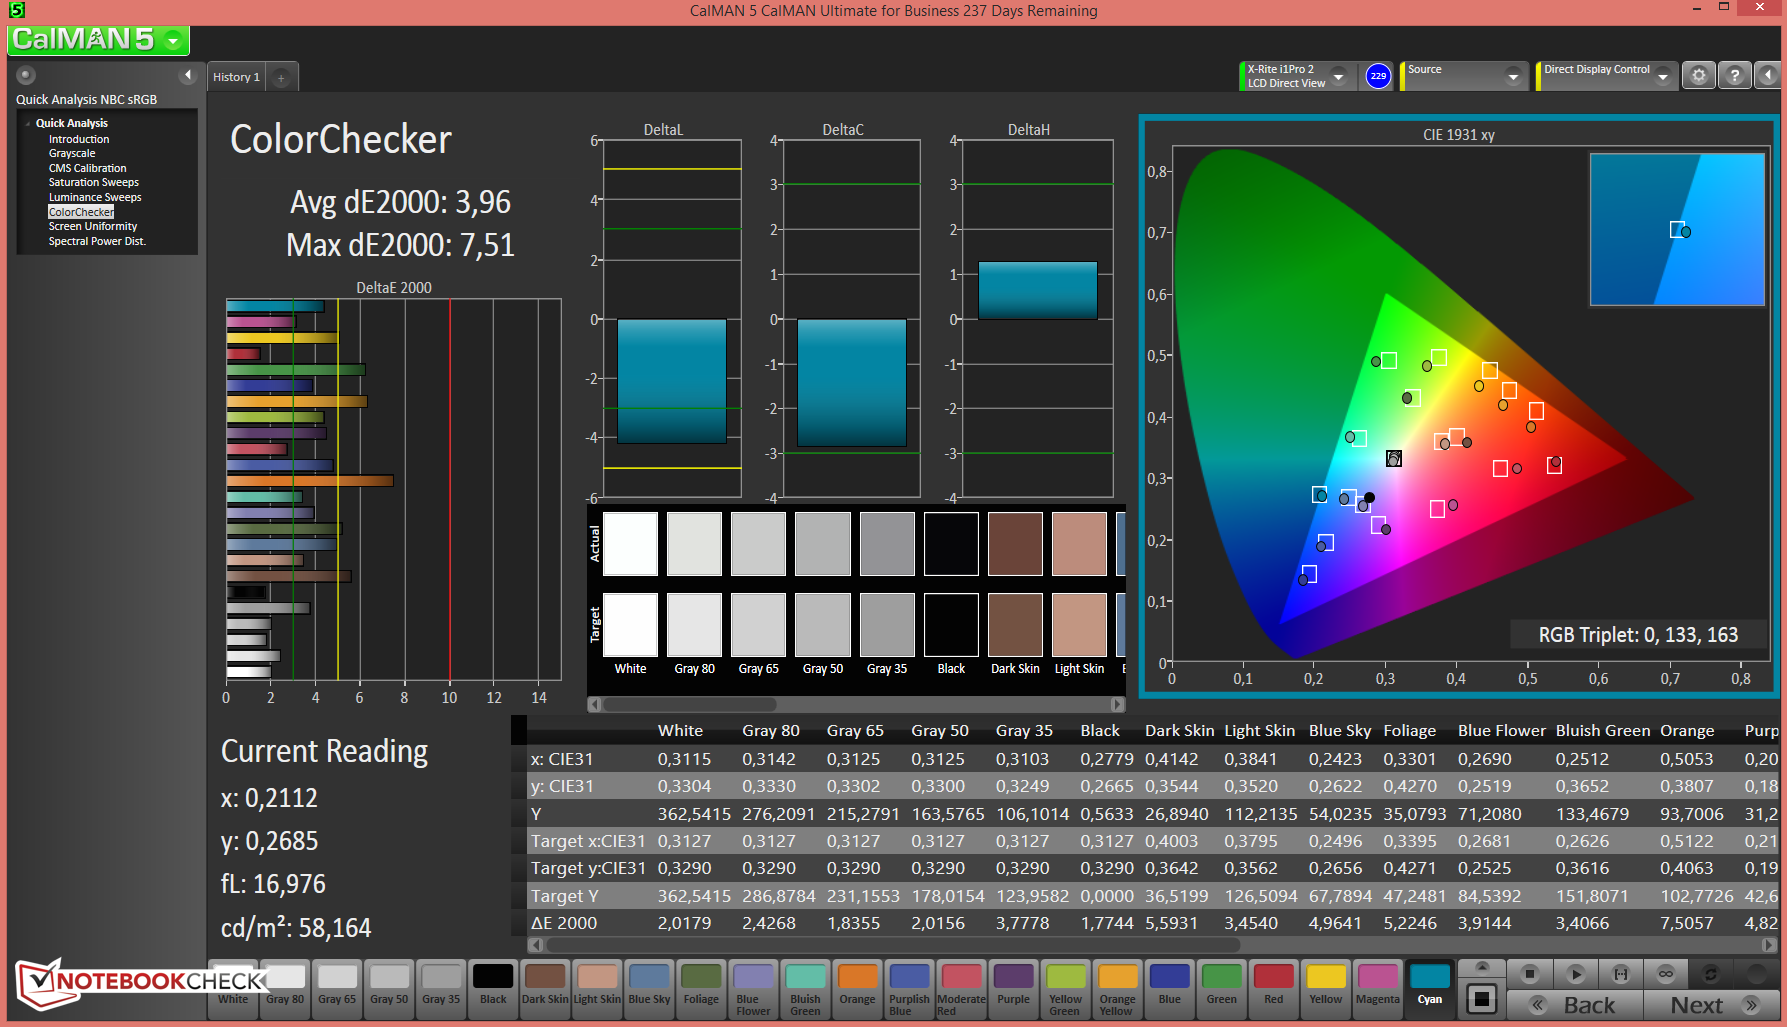
| Colorchecker dE 2000 * | 3.96 | 3.63 8% | 2.27 43% | 1.91 52% |
| Colorchecker dE 2000 max. * | 7.51 | |||
| Greyscale dE 2000 * | 3.51 | 2.57 27% | 2.47 30% | 2 43% |
| Gamma | 3.83 57% | 2.17 101% | 2.36 93% | 2.26 97% |
| CCT | 6711 97% | 6422 101% | 6872 95% | 6724 97% |
| Color Space (Percent of AdobeRGB 1998) (%) | 38.4 | 58 51% | 64 67% | |
| Color Space (Percent of sRGB) (%) | 59.8 | |||
| Total Average (Program / Settings) | 33% /
22% | 49% /
39% | 14% /
14% |
* ... smaller is better
| |||||||||||||||||||||||||
Brightness Distribution: 82 %
Center on Battery: 327 cd/m²
Contrast: 812:1 (Black: 0.405 cd/m²)
ΔE ColorChecker Calman: 3.96 | ∀{0.5-29.43 Ø4.72}
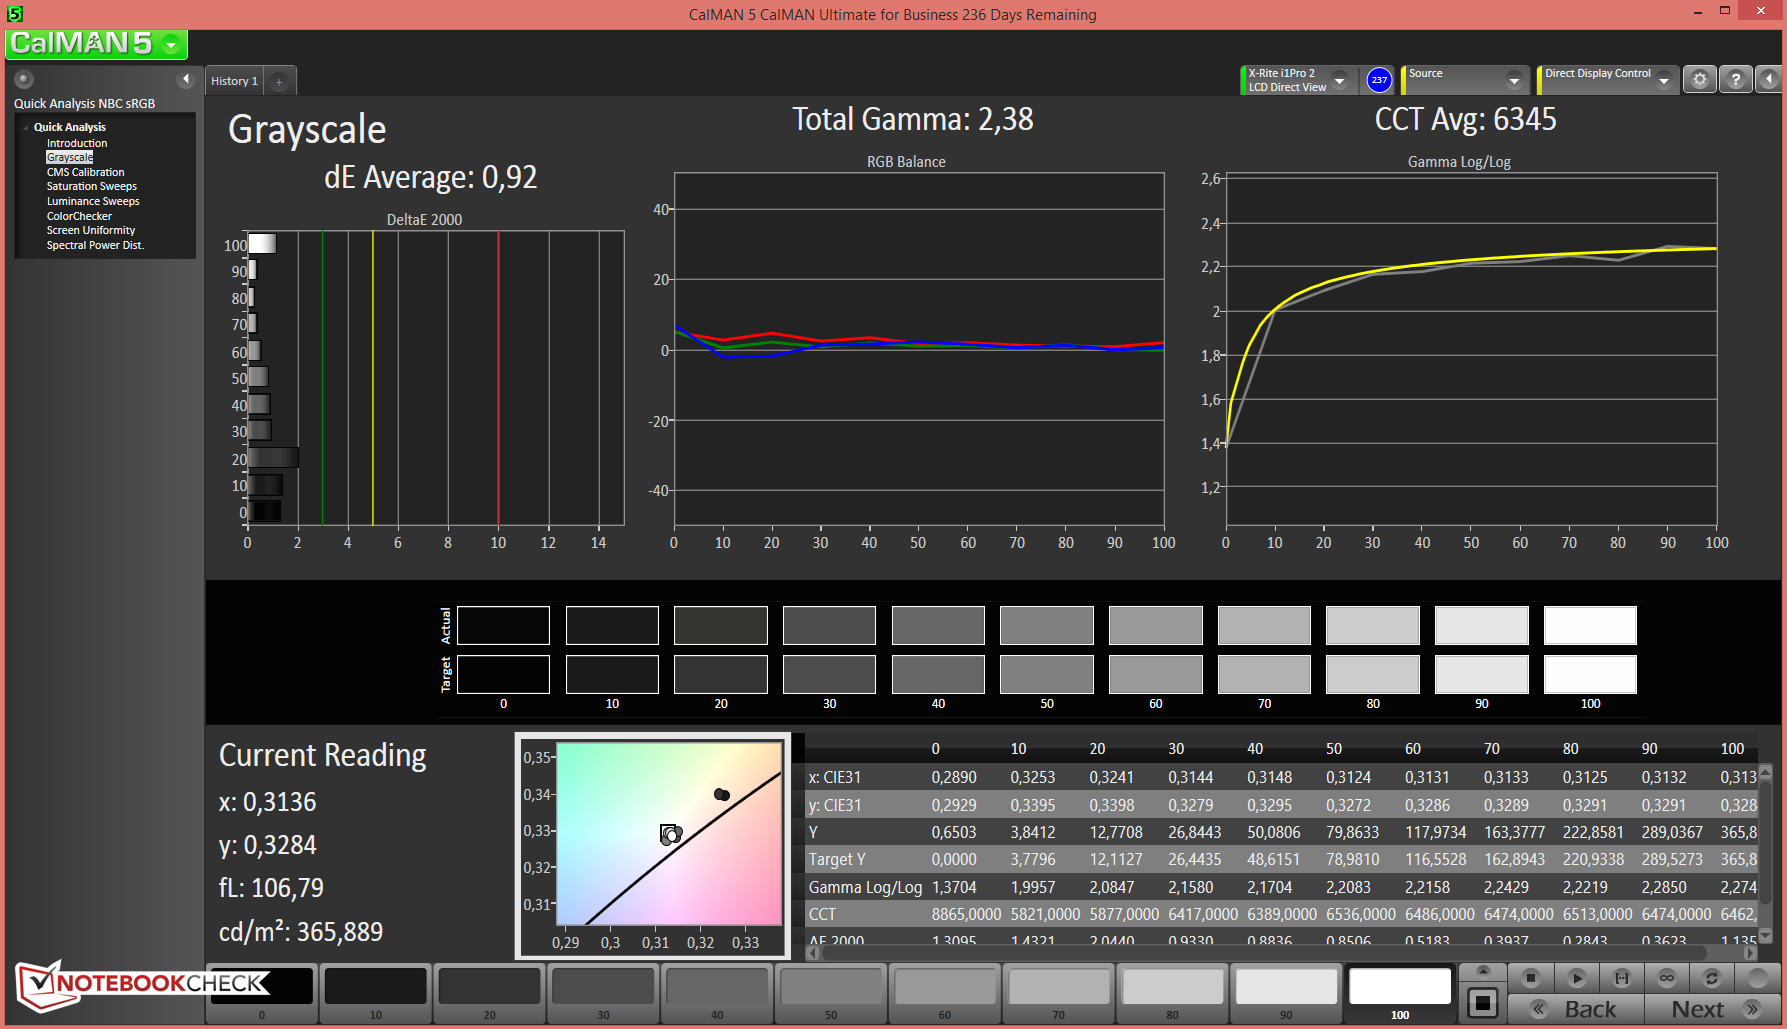
ΔE Greyscale Calman: 3.51 | ∀{0.09-98 Ø4.97}
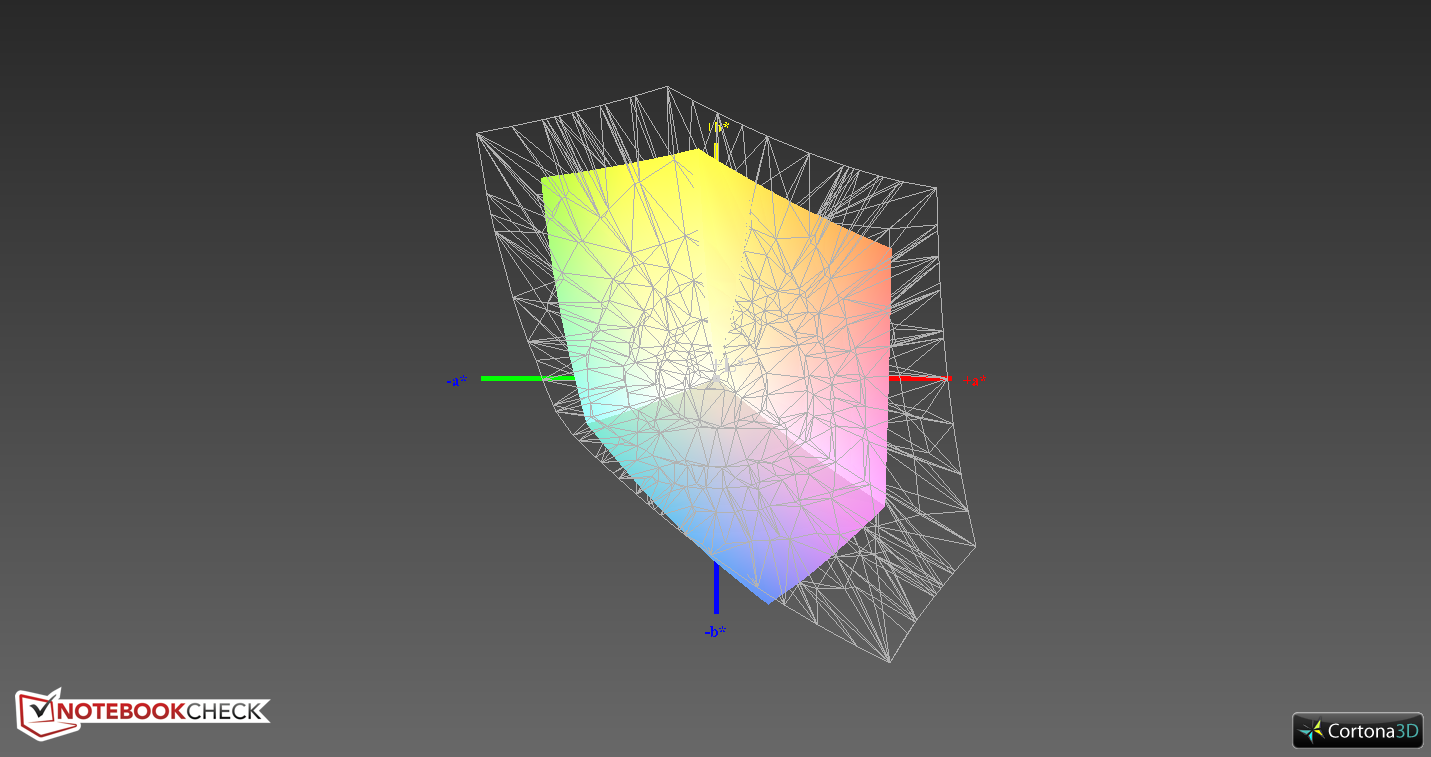
59.8% sRGB (Argyll 1.6.3 3D)
38.4% AdobeRGB 1998 (Argyll 1.6.3 3D)
41.51% AdobeRGB 1998 (Argyll 3D)
59.8% sRGB (Argyll 3D)
40.1% Display P3 (Argyll 3D)
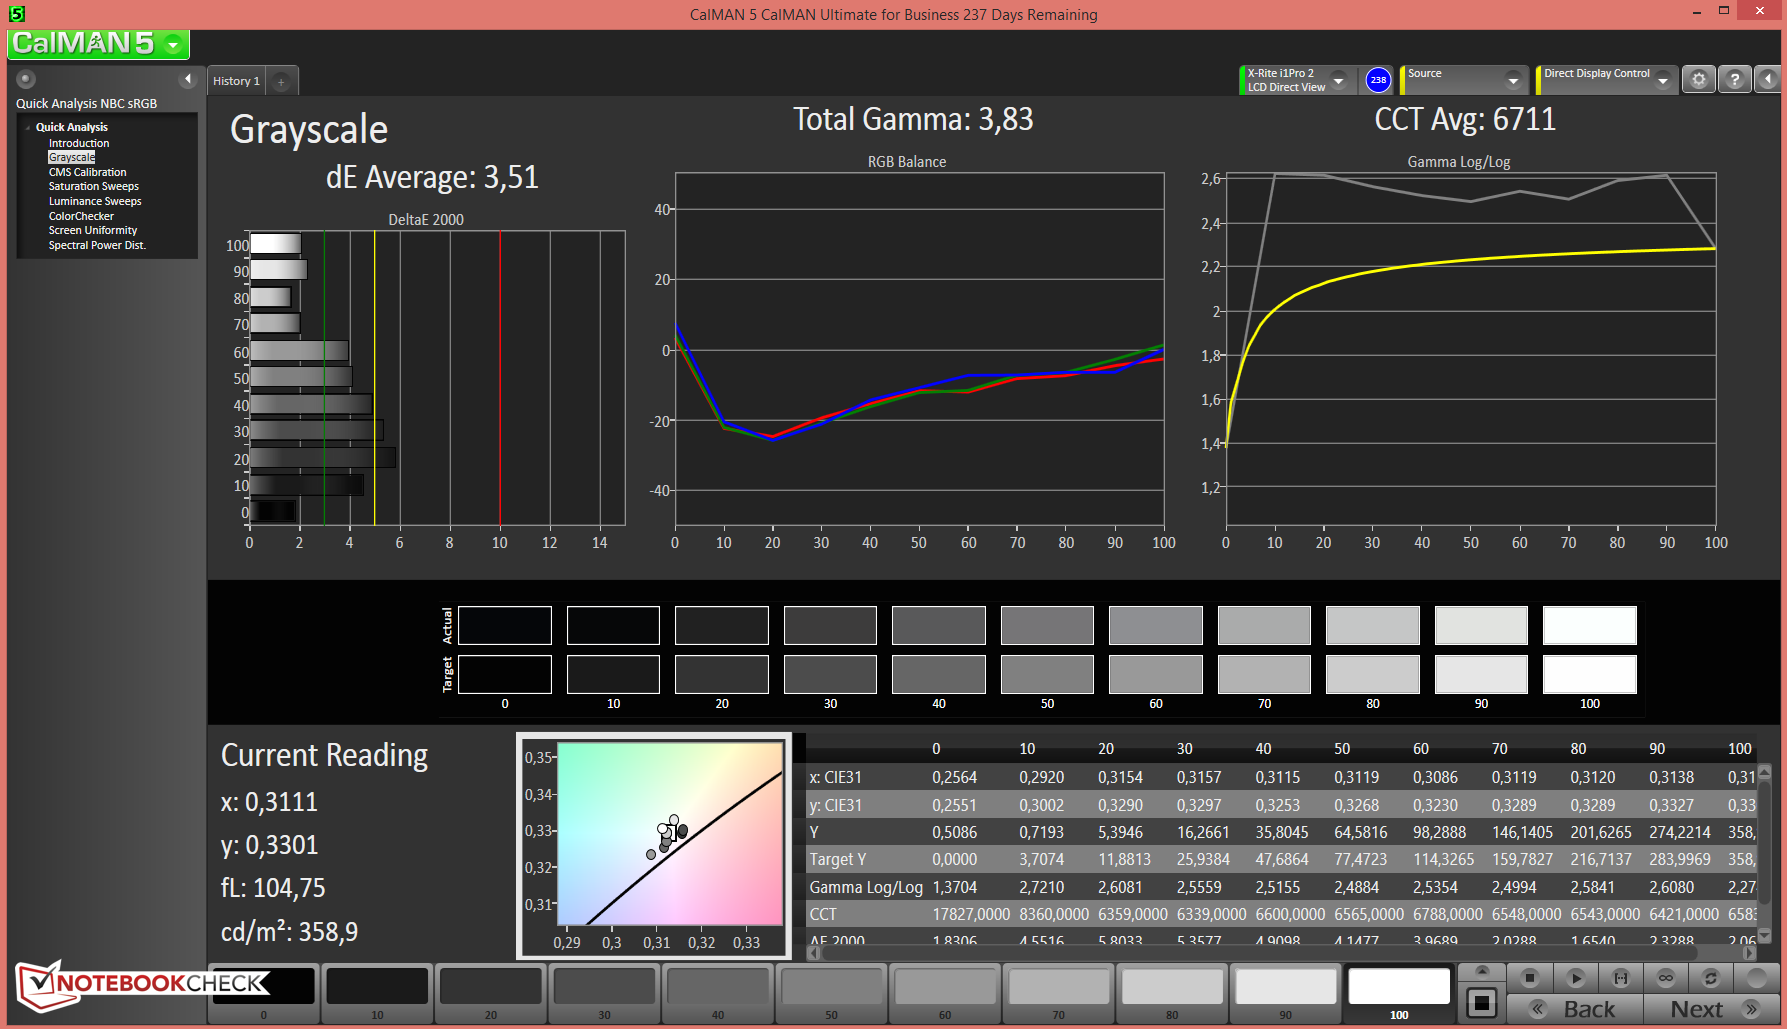
Gamma: 3.83
CCT: 6711 K
The contrast fell to 812:1 compared to the previous year's model. In addition, the black value of 0.405 cd/m² is slightly high. The competition performs better: The Toshiba KIRA convinces with a contrast of 1152:1 and a black value of 0.29 cd/m². Dell's XPS as well as the Toshiba model perform better than our test model. Subjectively, black value and contrast are sufficient for a fairly good black. The average color temperature of 6600 Kelvin is quite close to the ideal value of 6500 K.
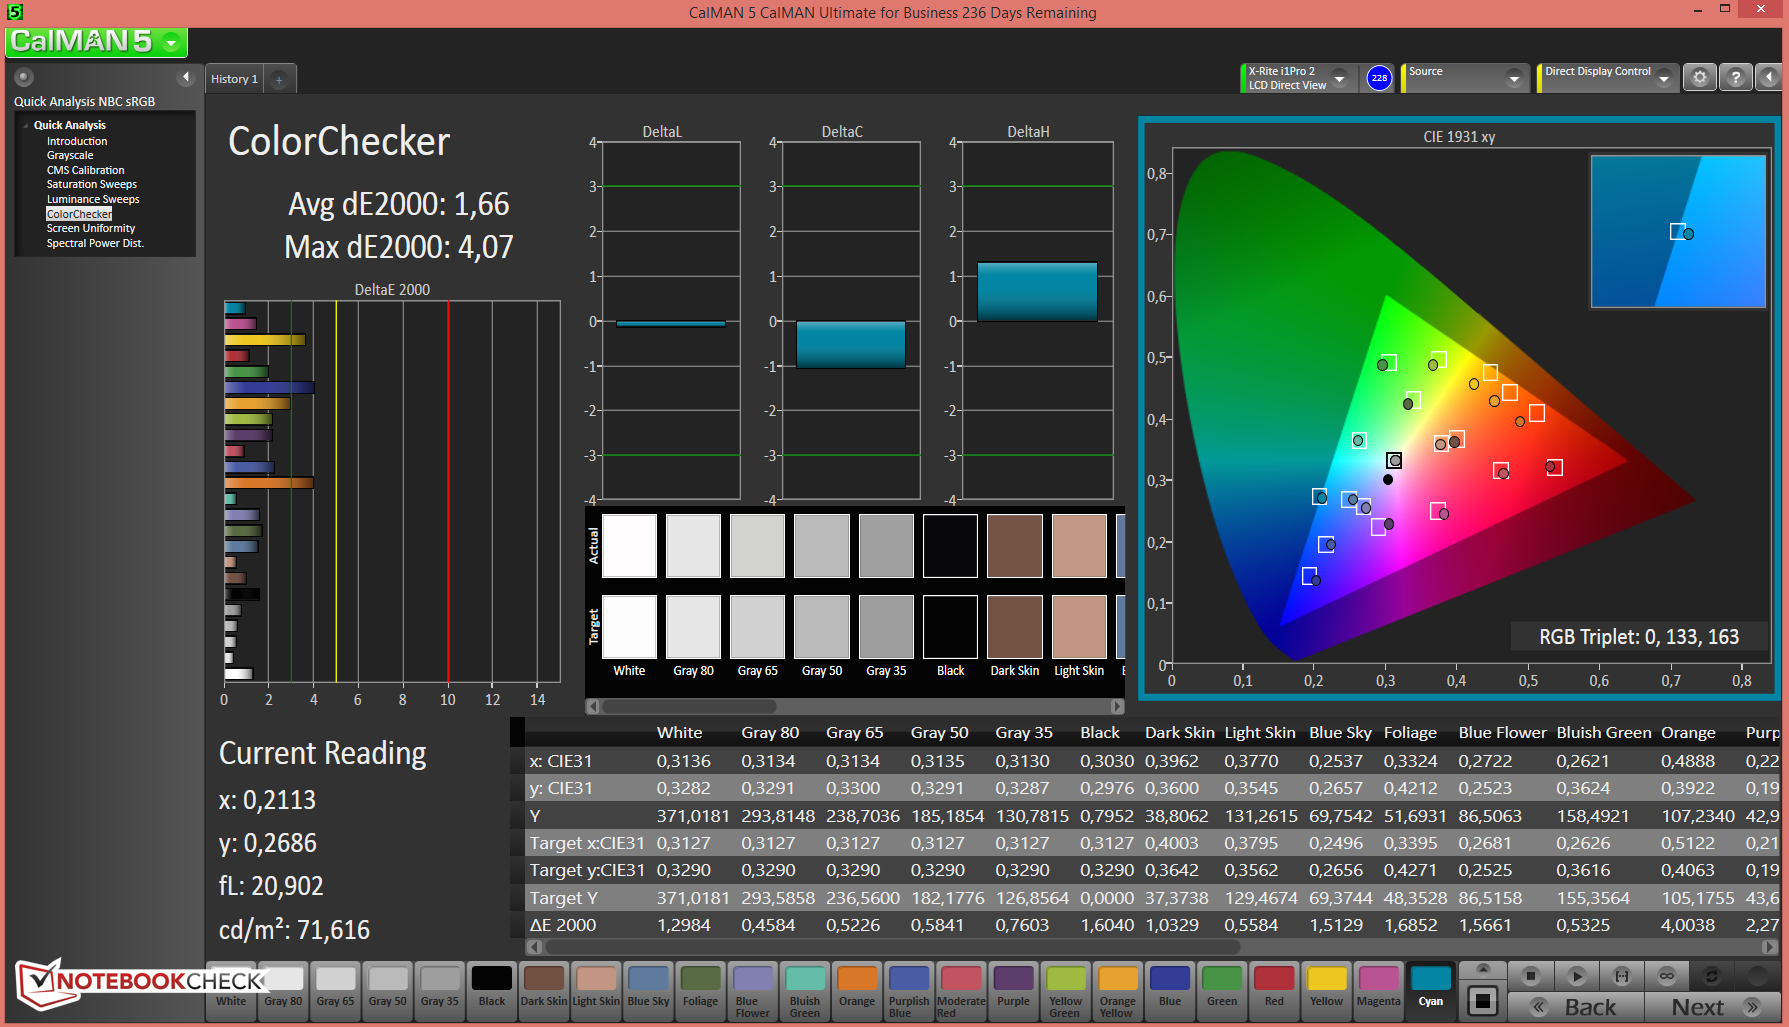
According to the gray level analysis from CalMAN the display is not bluish in factory state. The deviation is 3.51 for the gray level and 3.96 for the colors. This hints on quite a high-end TN panel. After calibration, the deltaE shift falls to a formidable 0.92 for the gray levels and 1.66 for the colors.
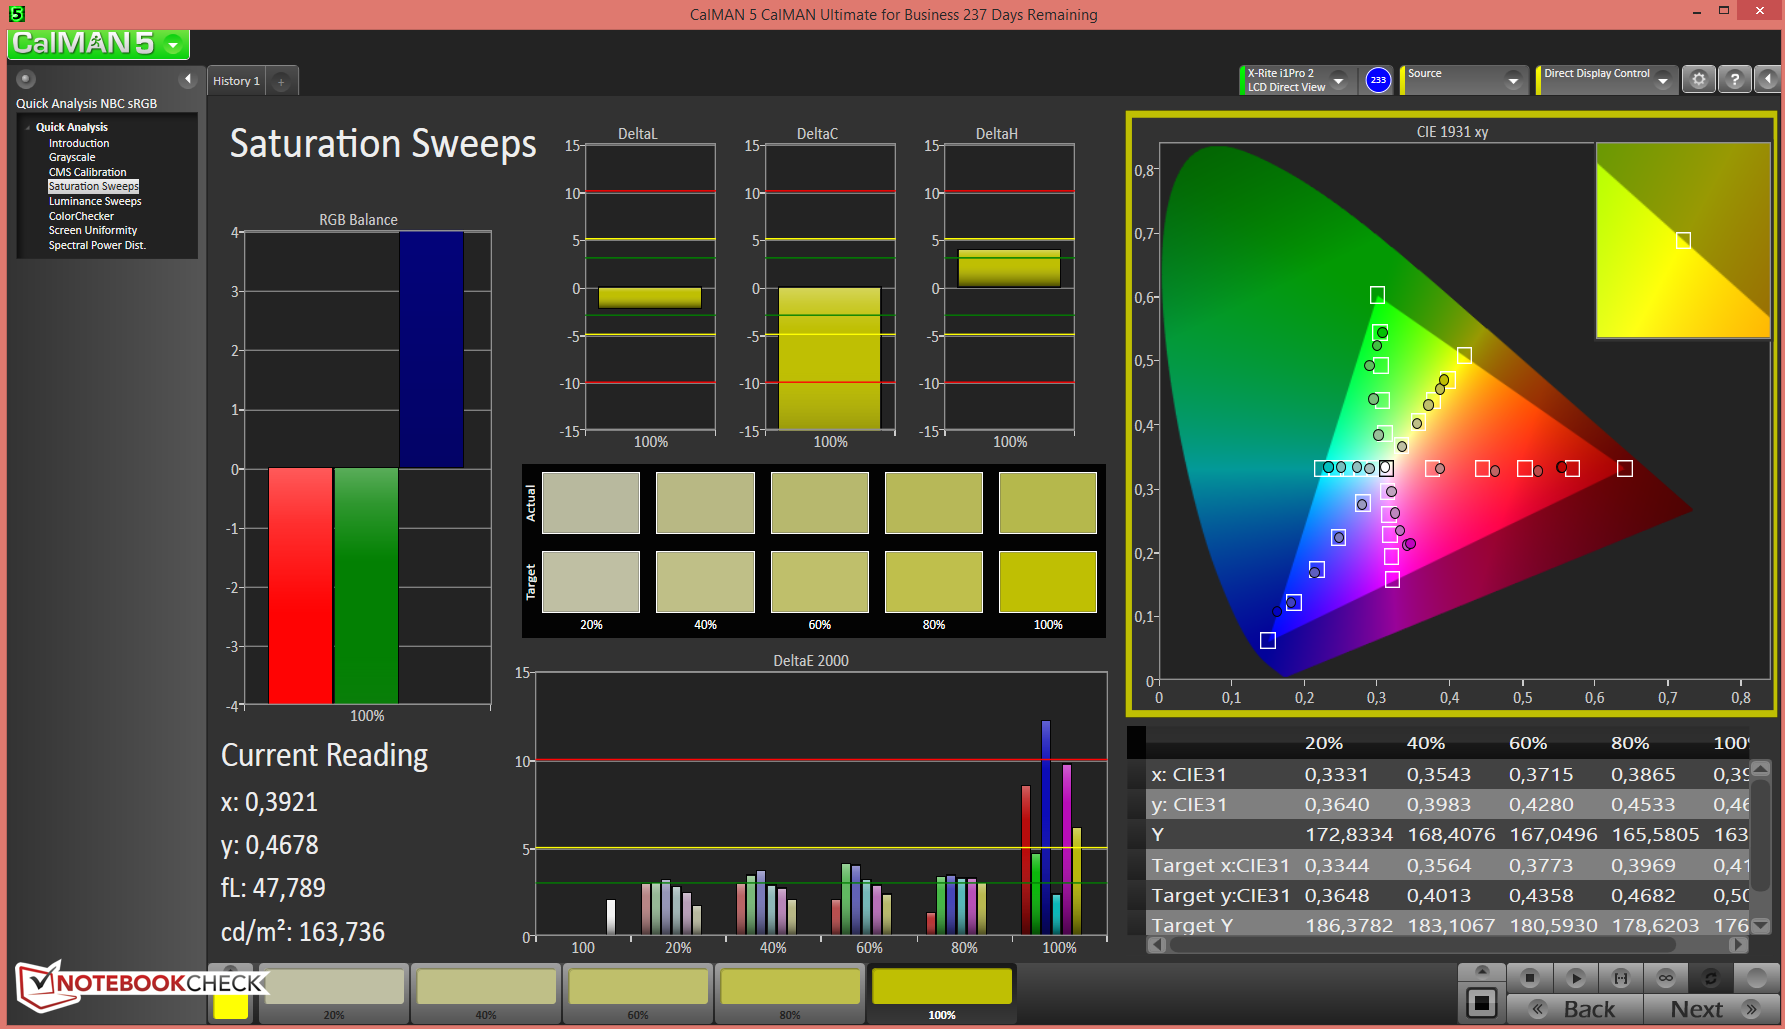
The color coverage is especially important for professional use. The model covers 38.4% of AdobeRGB and 59.8% of sRGB and is therefore not apt for professional graphics designers.

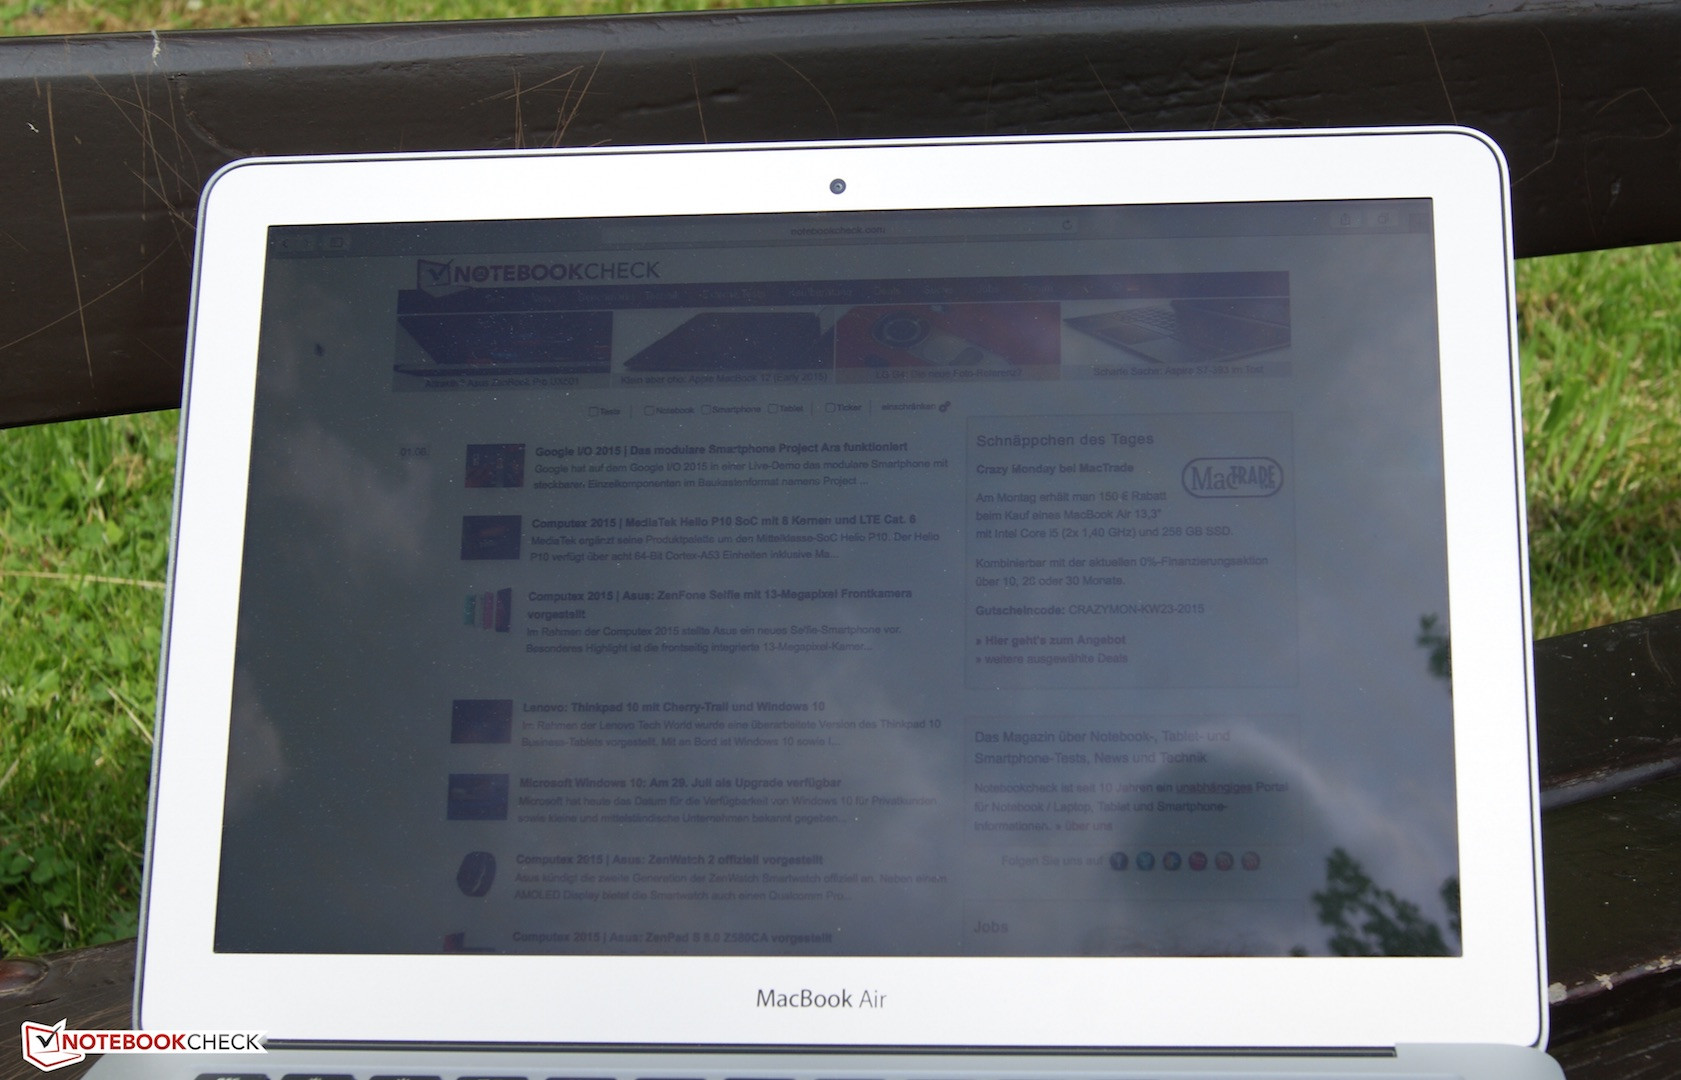
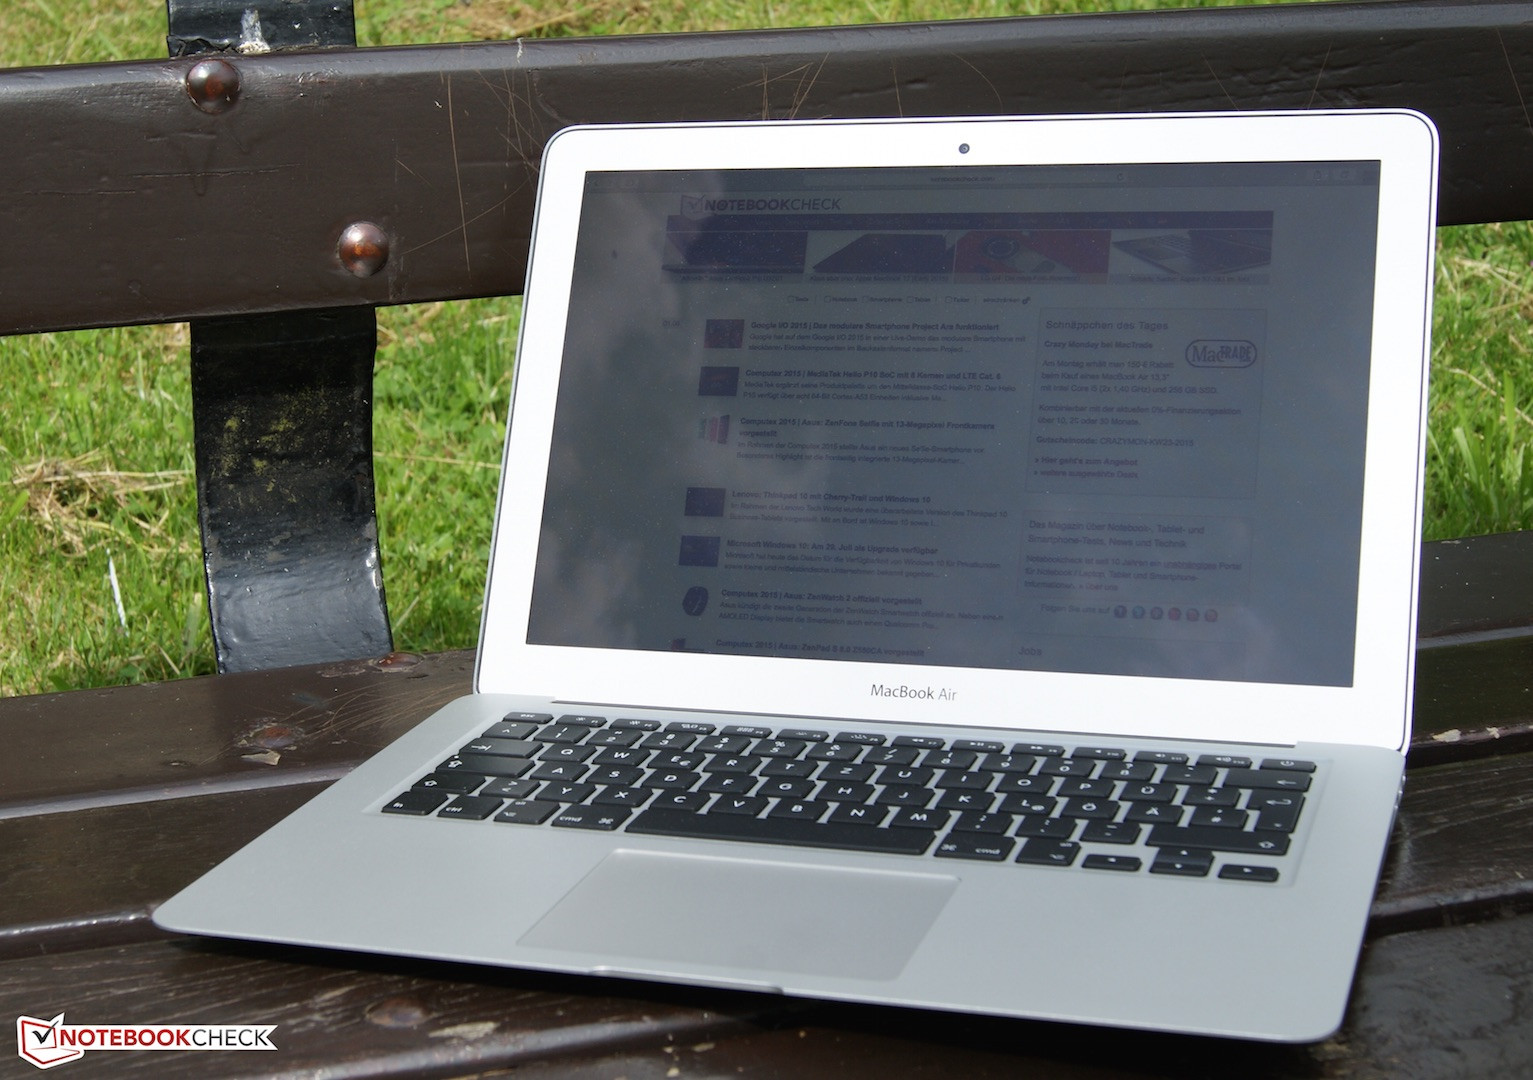
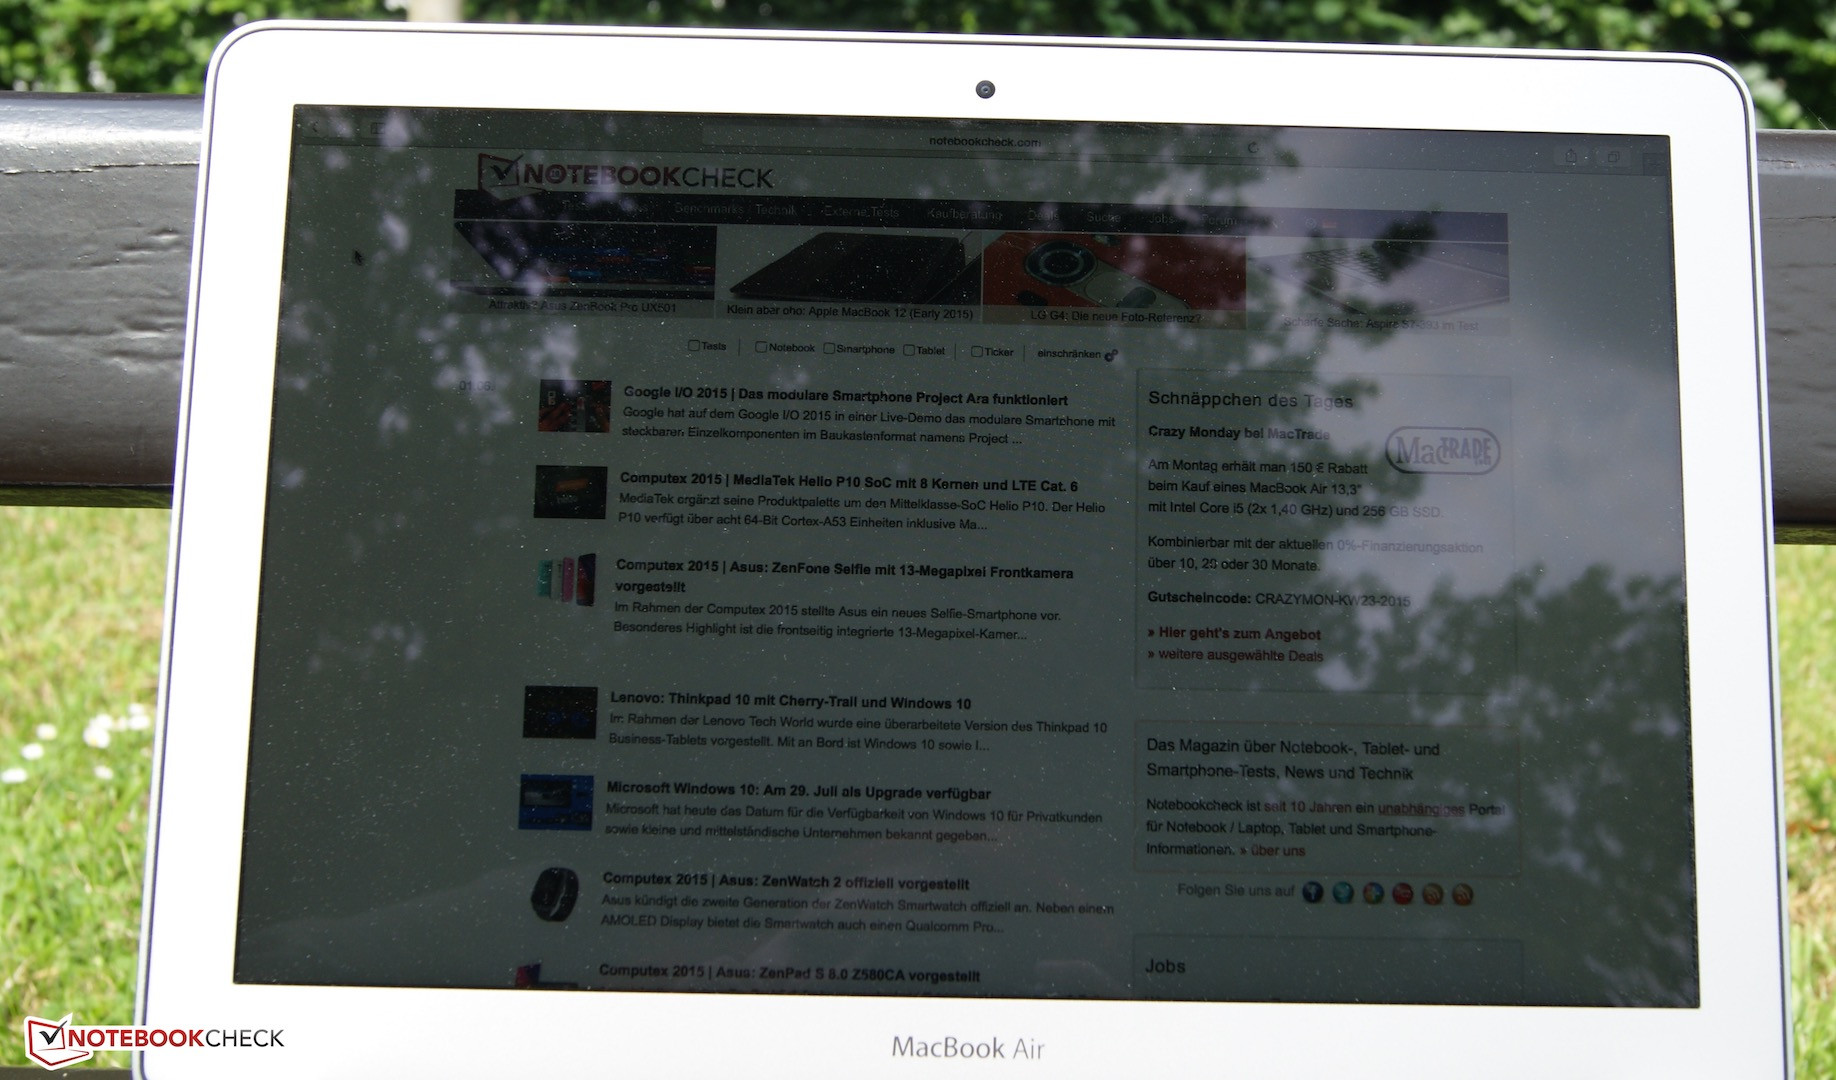
The glossy display is not exactly ideal for outdoor use. But, since it is bright, use in the shade is quite possible.
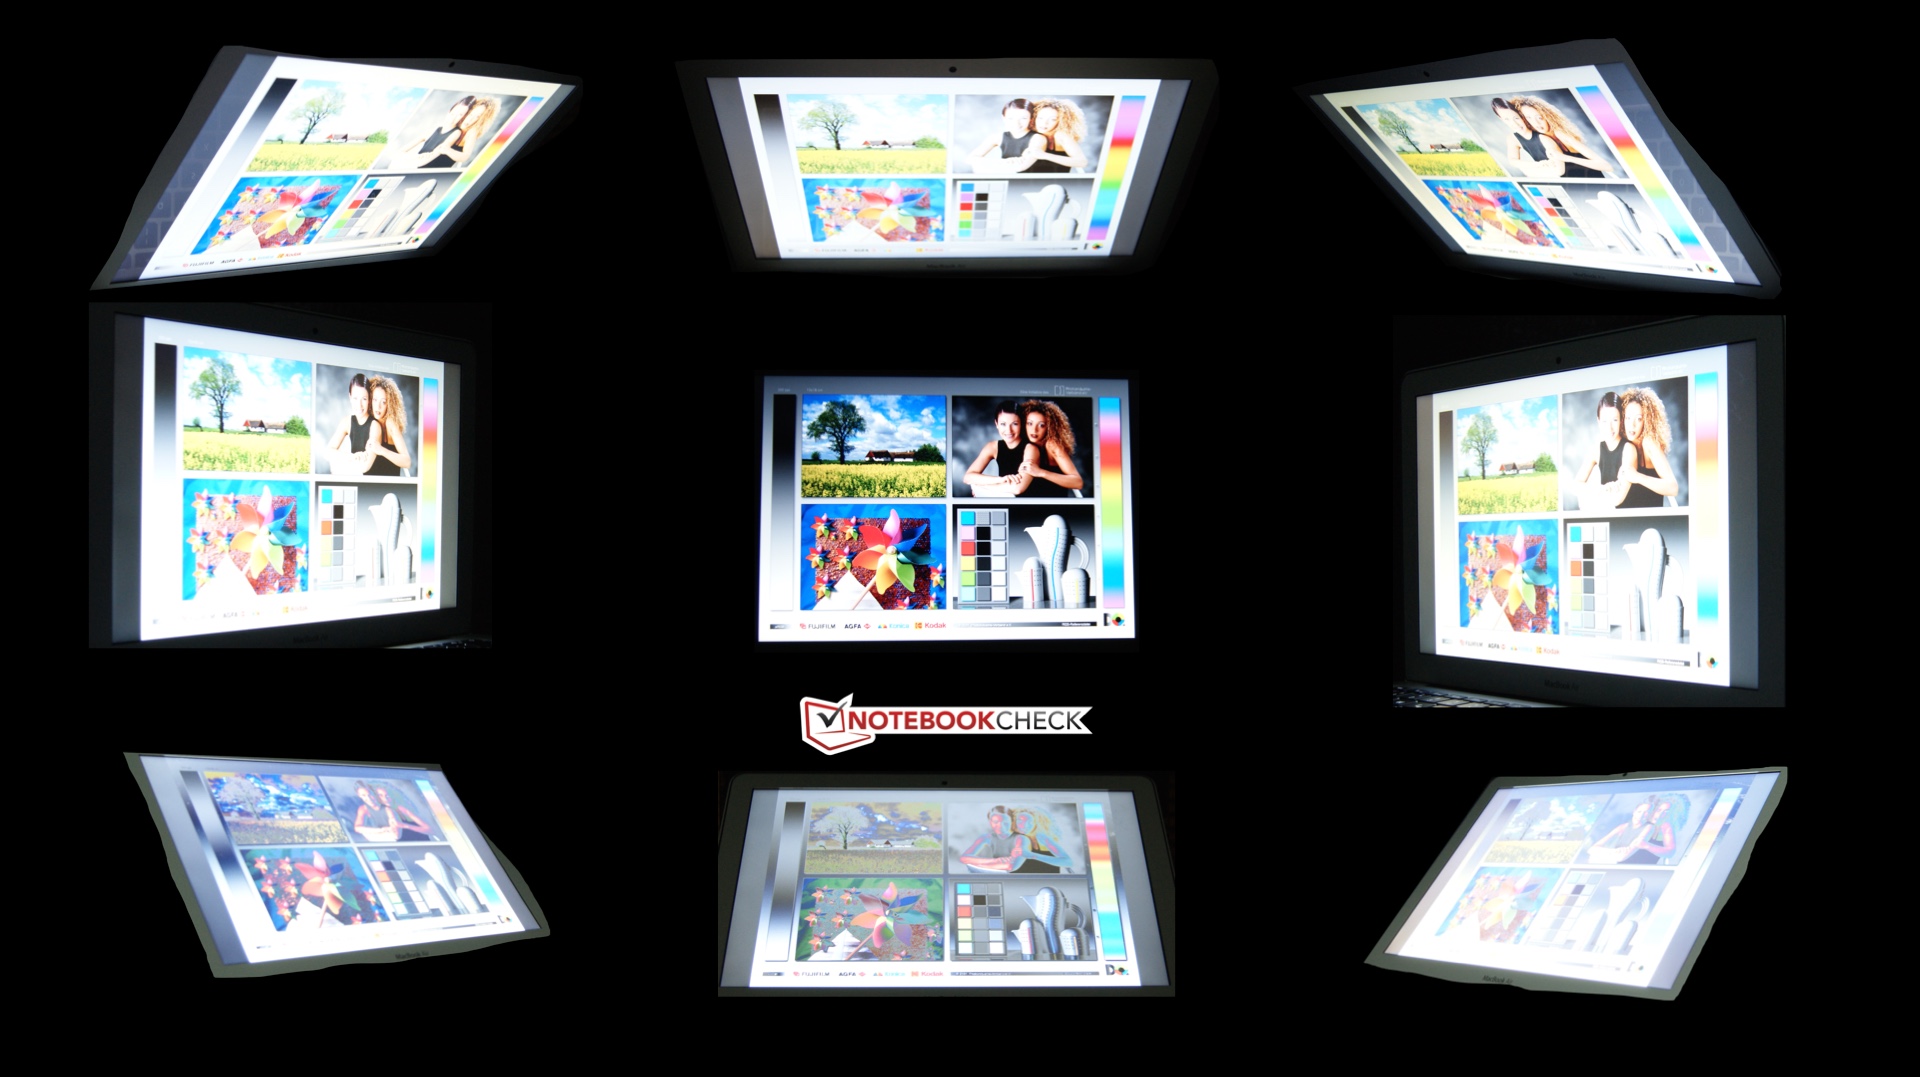
The TN display technology hints on narrow viewing angles. However, they are not that bad for this kind of panel. There is hardly a color and brightness shift when looking from the sides. But, the image changes significantly with the opening angle. It is possible to use the device on the lap without big problems and you'll always find a position for a good image. Nevertheless, the opening angle could be bigger. We have already criticized this aspect in our previous test.
Performance
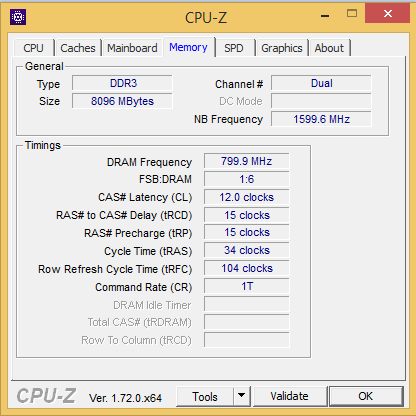
The thin case of the MacBook Air houses powerful hardware in order to always ensure responsiveness. The Apple notebook is suitable as an ever-ready office companion as well as workhorse for work and university. Inside there is an Intel CPU of the i7 series, 8 GB RAM (dual-channel) and a 256 GB SSD. The manufacturer asks for 1590 Euros (~$1791) for the bundle, but there are also cheaper configurations available. The entry-level model with Intel Core i5 CPU is priced about 400 Euros (~$450) lower than our test model. In addition, it features 4 GB RAM and a 128 GB hard drive. Further configuration options can be found in the Apple Store.
Processor
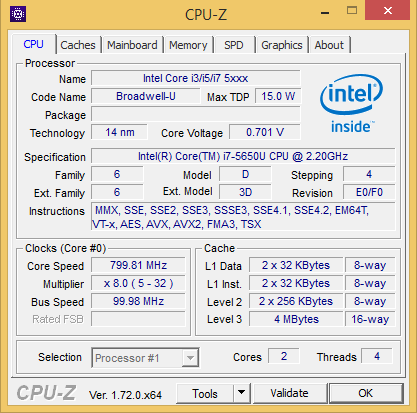
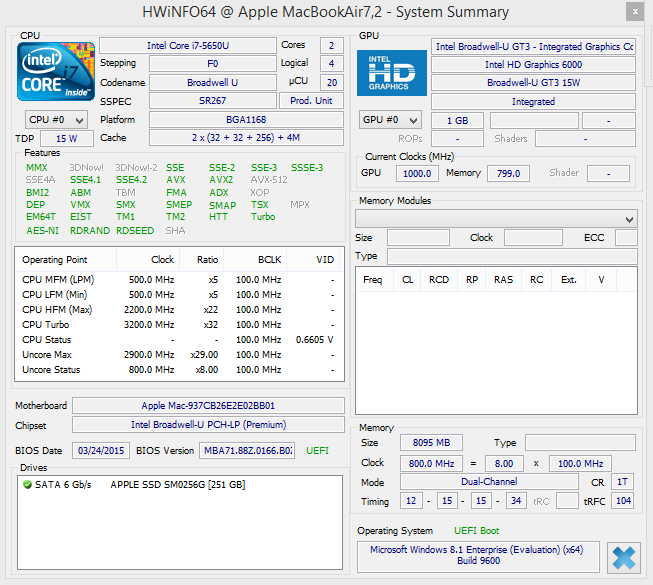
Probably the most important difference to previous years' MacBook Air models is the new Intel Core i7-5650U with a base clock of 2.2 GHz and a Turbo clock of up to 3.2 GHz. The CPU with two cores can handle up to four simultaneous threads and calculates with a maximum TDP of 15 Watt according to Intel. We will check whether it actually does so below. Intel's Broadwell series supports important standards like DirectX 11.2 API, Open CL 1.3/2.0 and OpenGL 4.3. The actual performance gain compared to our previously reviewed MacBook Air models is of great interest and so is the performance difference to the Intel Core i7-5500U used in the competitors, since it features a higher base clock of 2400 MHz, but a slightly lower Turbo clock of 3000 MHz. So, the Intel Core i7-5500U could perform better during demanding load. We use the Cinebench R15 benchmark to test the performance. Whether under Mac OS or Windows, the ratings are about equal.
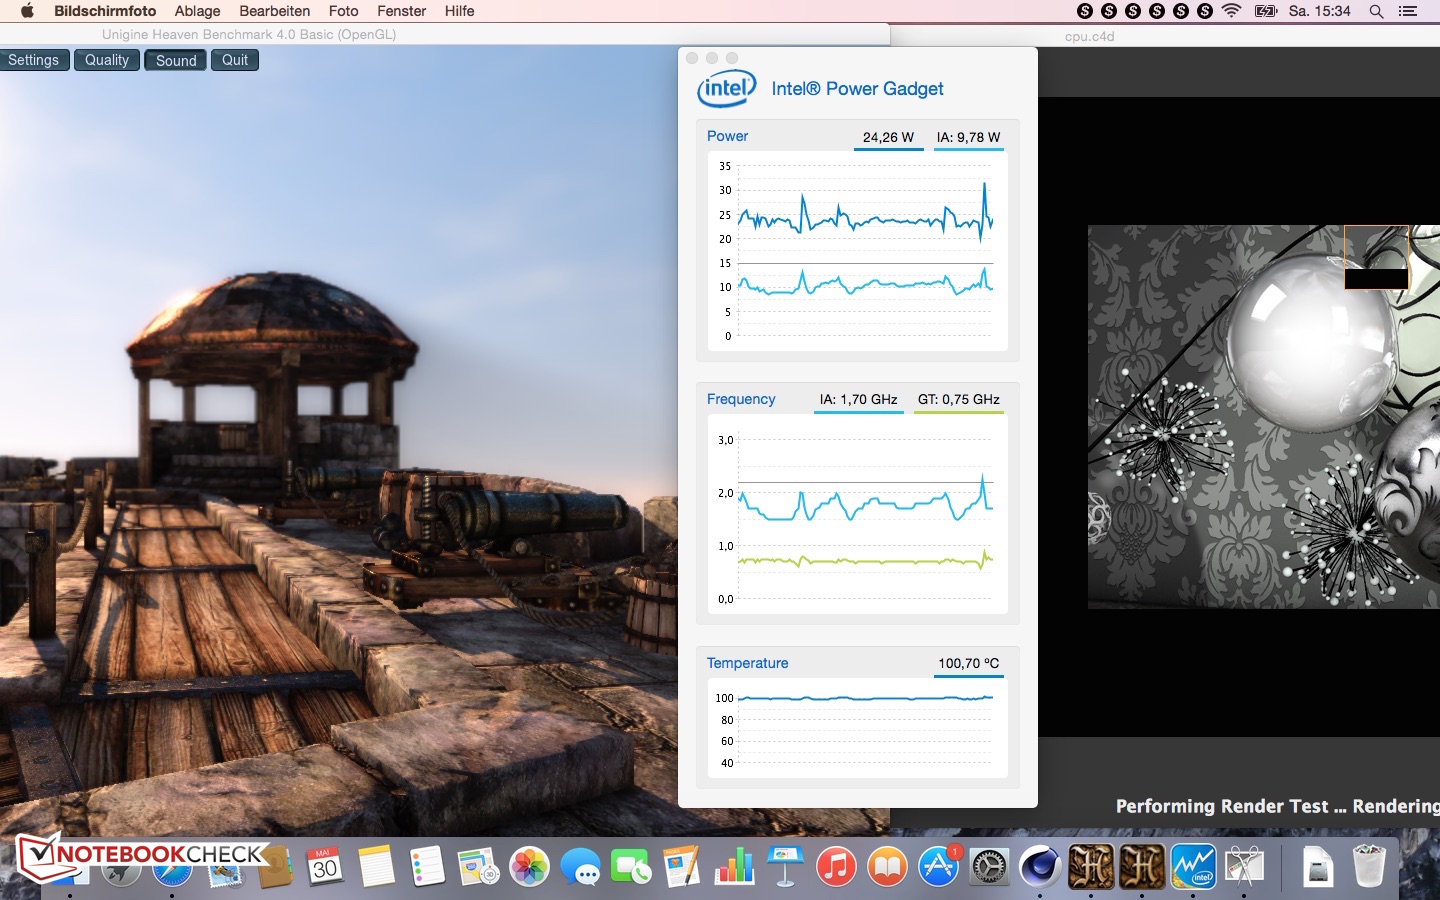
The biggest difference occurred in the single-core test, where the Air achieved 112 points under Windows and 128 points under Mac OS. In the multi-core test, the MacBook Air accomplished 296 points (Win) and 305 points (Mac OS). The Toshiba KIRA (289 points) and the Dell XPS 13 (287 points) are about on par. Apple's MacBook Air from 2014 performs significantly worse with 239 points. According to Intel's Power Gadget, the maximum power consumption of the processor is about 22 Watt. This is significantly higher than the TDP. Initially, the CPU clocks constantly at 3.1 GHz during Cinebench R15; however, the clock rate hovers between 2.8 to 3.1 GHz in the middle of the test. Even after multiple runs, the results do not change, since the fans start running loudly from the second run on. This ensures that the CPU almost constantly works at 3.1 GHz and the laptop even achieves 10 points more in the multi-core test. The performance does not fall on battery. The Cinebench results remain the same.
Further comparisons and details of each processor are available in our benchmark list of current notebook CPUs.
System Performance
It is really fun to work with our test model. The responsive components ensure smooth operation. However, our subjective impression is to be confirmed with the PCMark benchmarks. The new MacBook Air achieves 5205 points in PCMark 7 and is 150 points better than the reviewed Toshiba KIRA and almost 200 points better than last year's MacBook Air.
| Apple MacBook Air 13 inch 2015-03 HD Graphics 6000, 5650U, Apple SSD SD0256F | Dell XPS 13 9343 Core i7 HD Graphics 5500, 5500U, Samsung SSD PM851 M.2 2280 256GB | Toshiba KIRA-10D HD Graphics 5500, 5500U, Toshiba HG6 THNSNJ256GMCU | Apple MacBook Air 13 MD761D/B 2014-06 HD Graphics 5000, 4260U, Apple SSD SD0256F | |
|---|---|---|---|---|
| PCMark 7 | ||||
| Score (Points) | 5205 | 5055 -3% | 5012 -4% | |
| PCMark 8 | -22% | -10% | ||
| Home Score Accelerated v2 (Points) | 3579 | 2719 -24% | 3105 -13% | |
| Creative Score Accelerated v2 (Points) | 4432 | 3537 -20% | ||
| Work Score Accelerated v2 (Points) | 4367 | 3412 -22% | 4100 -6% | |
| Total Average (Program / Settings) | -22% /
-22% | -7% /
-7% | -4% /
-4% |
| PCMark 7 Score | 5205 points | |
| PCMark 8 Home Score Accelerated v2 | 3579 points | |
| PCMark 8 Creative Score Accelerated v2 | 4432 points | |
| PCMark 8 Work Score Accelerated v2 | 4367 points | |
Help | ||
Storage Devices
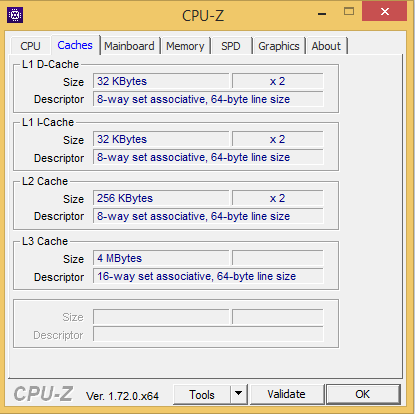
Our test model uses an M.2 storage device with a capacity of 256 GB. Thanks to its direct PCIe connection, it proves to be very fast in CrystalDiskMark and AS SSD. According to CrystalDiskMark, it reaches sequential read rates of up to 1352 MB/s and write rates of up to 1111 MB/s. The competition and the previously reviewed MacBook Air 13 do not achieve half as good results almost without exception. However, the important 4K results are problematic. Although they are poor, they are better than the previous MacBook Air's. For example, the Dell XPS 13 performs slightly better. Further benchmarks results of various SSDs and HDDs are available in our corresponding benchmark table.
* ... smaller is better

Graphics Card
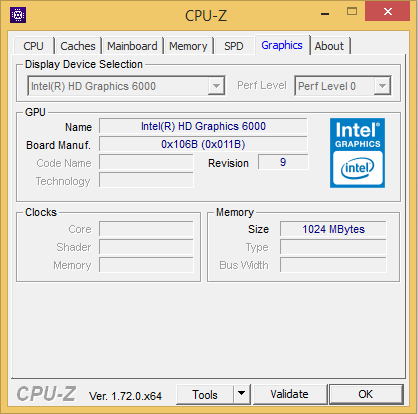
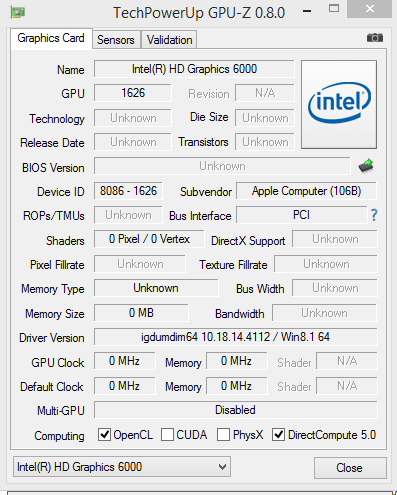
Intel's new processor graphics card is called Intel Graphics HD 6000 and is the successor of the Intel Graphics HD 5000 used in the previous MacBook Air. The base clock increased from 100 MHz to 1000 MHz. As already mentioned above, the GPU also supports DirectX 11.2 instead of DirectX 11.1. However, this is only interesting for users who use the Windows standard with a BootCamp installation. In order to evaluate the potential performance gain, we ran 3DMark 11. With about 28% the improvement is big. The Intel HD Graphics 5500, which is also used by the rest of the competitors performs significantly worse. The OpenGL test in Cinebench R15 should show differences in the graphics performance between the Windows OS and Apple's OS. The laptop achieves 32.42b fps under Windows, but only 26.29 fps under Mac OS X.
According to the latter test, the performance does not fall on battery regardless of the OS.
Further comparisons and benchmarks of the used graphics card are available in our article about this notebook graphics card.
| 3DMark 11 | |
| 1280x720 Performance (sort by value) | |
| Apple MacBook Air 13 inch 2015-03 | |
| Dell XPS 13 9343 Core i7 | |
| Toshiba KIRA-10D | |
| 1280x720 Performance GPU (sort by value) | |
| Apple MacBook Air 13 inch 2015-03 | |
| Dell XPS 13 9343 Core i7 | |
| 3DMark 06 Standard Score | 9408 points | |
| 3DMark Vantage P Result | 6188 points | |
| 3DMark 11 Performance | 1459 points | |
| 3DMark Ice Storm Standard Score | 56022 points | |
| 3DMark Cloud Gate Standard Score | 6061 points | |
| 3DMark Fire Strike Score | 903 points | |
Help | ||
Gaming Performance
Casual gamers have to do with older games of previous years. Most games will only run smoothly with minimum settings if at all. In addition you should use Windows as operating system for gaming since previous tests showed that the laptop achieves a significantly lower frame rate with Apple's OS. We could already see this in the OpenGL test of Cinebench. We chose the game Tomb Raider from 2013 as representative. Under Mac OS X, the Air achieves 27 fps with minimum settings, while the system still reaches smooth frame rates with medium settings under Windows.
| Tomb Raider | |
| 1366x768 Normal Preset AA:FX AF:4x (sort by value) | |
| Apple MacBook Air 13 inch 2015-03 | |
| Dell XPS 13 9343 Core i7 | |
| Toshiba KIRA-10D | |
| Apple MacBook Air 13 MD761D/B 2014-06 | |
| 1366x768 High Preset AA:FX AF:8x (sort by value) | |
| Apple MacBook Air 13 inch 2015-03 | |
| Dell XPS 13 9343 Core i7 | |
| Toshiba KIRA-10D | |
| Apple MacBook Air 13 MD761D/B 2014-06 | |
| low | med. | high | ultra | |
|---|---|---|---|---|
| Tomb Raider (2013) | 64.7 | 34.5 | 22.9 | |
| BioShock Infinite (2013) | 43.92 | 26.61 | 22.08 | |
| Alien: Isolation (2014) | 34 | 26.41 |
Emissions
System Noise
According to iStat, the fan even runs permanently while idle. However, the fan was not audible while idle. During load, the fan runs at up to 6500 rpm and the noise increases to 46.3 dB(A). The noise level is still about 40 dB(A) in simple 3D applications. After this stress scenario, the test model requires about 90 seconds until it is hardly audible again.
Noise level
| Idle |
| 29.2 / 29.2 / 29.2 dB(A) |
| Load |
| 40.2 / 46.3 dB(A) |
 | ||
30 dB silent 40 dB(A) audible 50 dB(A) loud |
||
min: | ||
Temperature
While idle, the aluminum case of the MacBook remains constantly cool. The case first gets increasingly warmer under load. The hot spot is about 44 °C on the top side of the notebook. The competition is not significantly cooler. The test model could be used without problems throughout our tests. The surface temperature did not get uncomfortably warm and the laptop could also be used on the lap without problems.
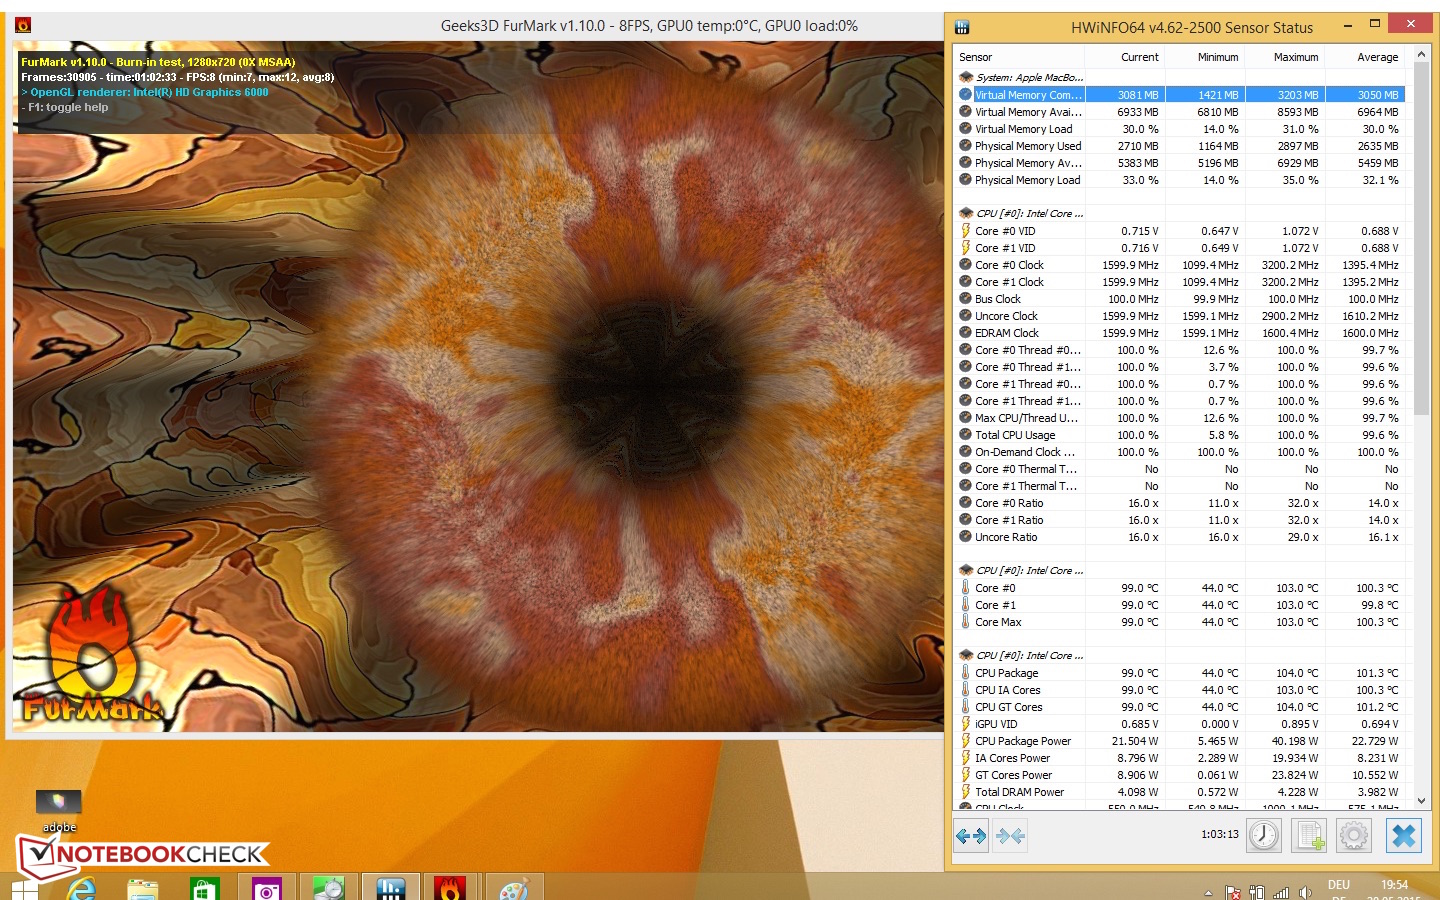
We observe the temperature increase inside during a stress scenario with Prime95 and Furmark. In the current test of the MacBook Air 11, the results of the stress test were significant different depending on whether run under Mac OS X or Windows. Since the results are hardly different here, we will only describe the Windows test. Immediately after the start of both programs the CPU clock fell below its base clock of 1.3 GHz and hovered between 1.3 GHz and 1.7 GHz most of the time. After our stress test was finished we reran 3DMark 11 and our test model achieved 1444 points which is equivalent to the result of a cold start.
(±) The maximum temperature on the upper side is 43.8 °C / 111 F, compared to the average of 35.9 °C / 97 F, ranging from 21.4 to 59 °C for the class Subnotebook.
(±) The bottom heats up to a maximum of 42.1 °C / 108 F, compared to the average of 39.2 °C / 103 F
(+) In idle usage, the average temperature for the upper side is 27.3 °C / 81 F, compared to the device average of 30.8 °C / 87 F.
(+) The palmrests and touchpad are reaching skin temperature as a maximum (32.5 °C / 90.5 F) and are therefore not hot.
(-) The average temperature of the palmrest area of similar devices was 28.2 °C / 82.8 F (-4.3 °C / -7.7 F).
Energy Management
Power Consumption
We have to distinguish Apple's OS and Windows here. While idle, the MacBook Air 13 needs between 2.7 Watt and 6.0 Watt under the Mac OS and 3.8 Watt to 9.4 Watt under Windows. However, the power consumption is similar in both OS under load. Since Windows programs are not compatible with Mac OS X, we had to use different programs for the load tests. The power consumption is about 32.1 Watt to 36.2 W (Mac OS X) with a short peak of 47.6 Watt, while the Windows values are between 34.3 Watt and 36.6 Watt with short maximum values of about 49 W.
As already mentioned in the "processor" section, the CPU can exceed its TDP permanently by about 5 to 7 Watt.
To summarize, Mac OS should be used for mobile use, since the battery life is probably longer.
| Off / Standby | |
| Idle | |
| Load |
|
Key:
min: | |
Battery Life
Alike in the predecessor model, the Apple MacBook Air 13 houses a 54 Wh battery. The manufacturer promises an Internet runtime of up to 13 h.
First of all we tested the maximum battery life. We dimmed the brightness of the notebook to the minimum and switched the communications modules off. The laptop achieved an impressive battery life of 25 h and 12 min.
With our WLAN test we want to test a realistic scenario. We set the display brightness to about 150 cd/m² and simulate web surfing. The device shuts down after 10 h and 20 min, which is 2.5 h less than the manufacturer's claim. At least the test model switched to sleep mode almost two hours later than its predecessor. The other competitors cannot shine with such good results. For example, the thin subnotebook can also last longer workdays without problems.
In order to determine the minimum battery life, we use the program Battery Eater in Windows. The Classic test of this software makes the device shut down after about 1.5 h. The previously reviewed MacBook Air 13 (2014) and the Toshiba KIRA last about 20 to 30 min longer.
| Battery Runtime - WiFi Websurfing (sort by value) | |
| Apple MacBook Air 13 inch 2015-03 | |
| Toshiba KIRA-10D | |
Pros
Cons
Verdict
Once again Apple offers a great and high-end product with the small update. The weaknesses already known from previous models like the TN panel with modest viewing angles were not improved. The resolution also remained unchanged. However, the enormous system performance and the fast storage device in sequential reading and writing are impressive. Our test model performs significantly better than the competition here. In addition, we admire the realistic battery life of 10.5 h.
Due to its mobility and good input devices, the Apple MacBook is a welcome subnotebook for office and multimedia use.
But, the competition does not have to admit defeat. The Toshiba KIRA is definitely recommendable for those who prefer a non-glare Full HD panel and double the warranty of 24 months. Whether you should replace an Apple MacBook Air 13 from the previous years now remains questionable, since the price of 1590 Euros (~$1791) is significantly higher than before.
Apple MacBook Air 13 inch 2015-03
- 02/17/2016 v5 (old)
Nino Ricchizzi
Price comparison
