Asus ASUSPRO BU201LA Subnotebook Review
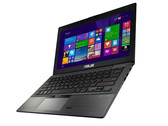
Limited stamina. Asus can compete with the established competitors from Lenovo, Dell, Fujitsu and HP with the 12-inch business subnotebook called BU201LA. It comes with a bright IPS display, an LTE modem and very good input devices. However, the computer's battery life is quite short.
Intel Core i7-4650U, HD Graphics 5000, 12.5", 1.3 kg