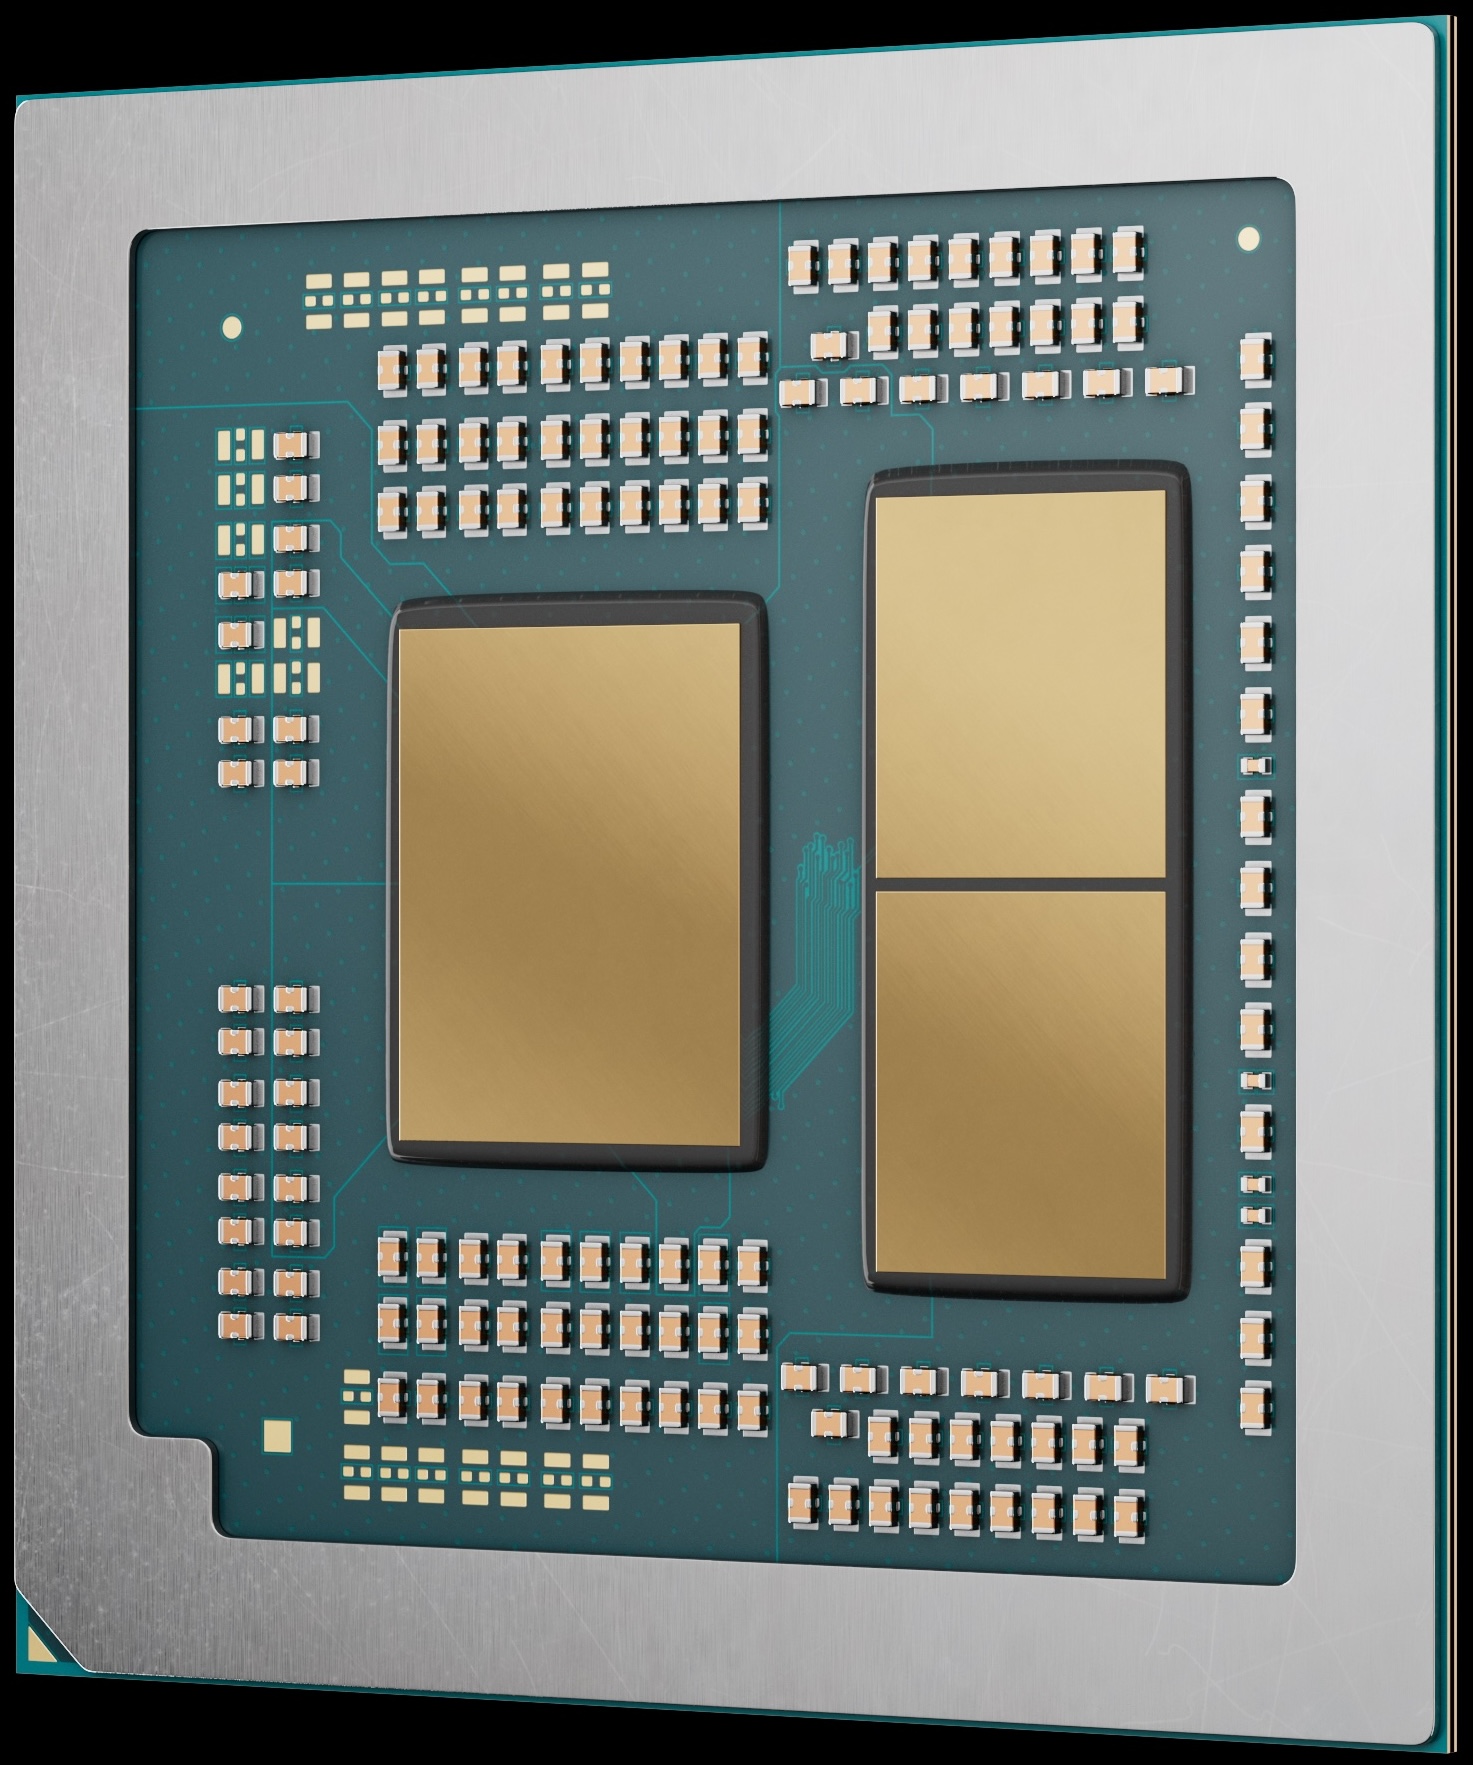
The AMD Ryzen 9 9955HX3D is a high-end notebook processor of the Fire Range series with 16 cores and hyperthreading (SMT), which means it can process up to 32 threads simultaneously. The CPU uses the new Zen 5 architecture for all 16 cores and clocks them at 2.5 to 5.4 GHz (single-core boost). As a special feature, the HX3D has an additional 64M 3D V-Cache on a CCD. This means that the CPU offers combined 128 MB L3 cache and 16 MB L2 cache. The chip was presented at CES in early 2025 and is intended for fast and expensive gaming notebooks.
AMD claims that the Ryzen 9 9955HX3D is the fastest mobile gaming CPU. Based on the experience with its predecessor, the Ryzen 9 7945HX3D , this is quite realistic. The 3D V-Cache in particular can accelerate demanding 3D games. However, the 16 fast Zen 5 cores should also provide enough power for all possible demanding applications.
The 9955HX3D is intended for large and heavy gaming notebooks and can therefore draw quite an amount of power (configurable from 55- to 75 watts TDP, default 55 watts). The SoC consists out of three dies on a package where the processor dies are manufactured in the modern 4nm 4nm FinFET process at TSMC (I/O die in 6nm) and should therefore still have a good energy efficiency.
Codename Fire Range-HX (Zen 5) Series AMD Dragon Range Series: Dragon Range Fire Range-HX (Zen 5) Clock Rate 2500 - 5400 MHz Level 1 Cache 1.3 MB Level 2 Cache 16 MB Level 3 Cache 128 MB Number of Cores / Threads 16 / 32 Power Consumption (TDP = Thermal Design Power) 55 Watt Manufacturing Technology 4 nm GPU AMD Radeon 610M ( - 2200 MHz)64 Bit 64 Bit support Architecture x86 Announcement Date 01/06/2025 Product Link (external) www.amd.com
Performance Rating - CB R15 + R20 + 7-Zip + X265 + Blender + 3DM11 CPU
Cinebench 2024 - Cinebench 2024 CPU Single Core
min: 129.4 avg: 129.7 median: 129.7 (16%) max: 130 Points
CPU TDP ? TDP 135 W TDP 145 W 100% 100% 100%
Cinebench 2024 - Cinebench 2024 CPU Multi Core
min: 2072 avg: 2117 median: 2120 (39%) max: 2160 Points
CPU TDP ? TDP 135 W TDP 145 W 100% 96% 97%
Cinebench R23 - Cinebench R23 Multi Core
min: 38864 avg: 39065 median: 39065 (36%) max: 39266 Points
Cinebench R23 - Cinebench R23 Single Core
min: 2165 avg: 2172 median: 2172 (88%) max: 2179 Points
Cinebench R20 - Cinebench R20 CPU (Single Core)
min: 847 avg: 849 median: 849 (92%) max: 851 Points
Cinebench R20 - Cinebench R20 CPU (Multi Core)
min: 15146 avg: 15162 median: 15161.5 (37%) max: 15177 Points
Cinebench R15 - Cinebench R15 CPU Multi 64 Bit
min: 6041 avg: 6043 median: 6042.5 (38%) max: 6044 Points
0 125 250 375 500 625 750 875 1000 1125 1250 1375 1500 1625 1750 1875 2000 2125 2250 2375 2500 2625 2750 2875 3000 3125 3250 3375 3500 3625 3750 3875 4000 4125 4250 4375 4500 4625 4750 4875 5000 5125 5250 5375 5500 5625 5750 5875 6000 Tooltip MSI Raider A18 HX A9WIG-080: Ø5972 (5888.41-6041.38)
Schenker XMG Neo 16 A25 5090: Ø5974 (5932.08-6044.12)
Aorus Master 16 AM6J: Ø5951 (5802.15-6067.96)
Cinebench R15 - Cinebench R15 CPU Single 64 Bit
min: 321 avg: 327 median: 327 (90%) max: 333 Points
Cinebench R11.5 - Cinebench R11.5 CPU Multi 64 Bit
min: 69.12 avg: 69.9 median: 69.9 (87%) max: 70.66 Points
Cinebench R11.5 - Cinebench R11.5 CPU Single 64 Bit
Cinebench R10 - Cinebench R10 Rend. Single (32bit)
min: 9264 avg: 9269 median: 9269 (56%) max: 9274 points
AMD Geode LX 800
...
...
max:
Cinebench R10 - Cinebench R10 Rend. Multi (32bit)
min: 77481 avg: 79410 median: 79410 (58%) max: 81339 points
Cinebench R10 - Cinebench R10 Rend. Multi (64bit)
Cinebench R10 - Cinebench R10 Rend. Single (64bit)
wPrime 2.10 - wPrime 2.0 1024m *
min: 135 avg: 172.7 median: 172.7 (2%) max: 210.4 s
wPrime 2.10 - wPrime 2.0 32m *
min: 4.4 avg: 5 median: 5 (1%) max: 5.5 s
WinRAR - WinRAR 4.0
min: 11412 avg: 29422 median: 29421.5 (47%) max: 47431 points
7-Zip 18.03 - 7-Zip 18.03 Multi Thread 4 runs
min: 145803 avg: 146945 median: 146944 (84%) max: 148086 MIPS
7-Zip 18.03 - 7-Zip 18.03 Single Thread 4 runs
min: 7151 avg: 7226 median: 7225.5 (82%) max: 7300 MIPS
...
max:
AMD Ryzen 7 9850X3D
X264 HD Benchmark 4.0 - x264 Pass 2
X264 HD Benchmark 4.0 - x264 Pass 1
HWBOT x265 Benchmark v2.2 - HWBOT x265 4k Preset
min: 42.3 avg: 42.5 median: 42.5 (75%) max: 42.7 fps
0 5 10 15 20 25 30 35 40 Tooltip Schenker XMG Neo 16 A25 5090: Ø38.4 (0.59-41.7)
MSI Raider A18 HX A9WIG-080: Ø39.5 (0.81-42.2)
Aorus Master 16 AM6J: Ø41.4 (1.42-44.8)
TrueCrypt - TrueCrypt Serpent
min: 3.2 avg: 3.3 median: 3.3 (97%) max: 3.4 GB/s
TrueCrypt - TrueCrypt Twofish
min: 4.5 avg: 5 median: 5 (85%) max: 5.4 GB/s
TrueCrypt - TrueCrypt AES
min: 27.5 avg: 29.1 median: 29.1 (76%) max: 30.6 GB/s
Blender - Blender 3.3 Classroom CPU *
Blender - Blender 2.79 BMW27 CPU *
R Benchmark 2.5 - R Benchmark 2.5 *
min: 0.3552 avg: 0.4 median: 0.4 (8%) max: 0.3677 sec
Super Pi mod 1.5 XS 1M - Super Pi mod 1.5 XS 1M *
Super Pi mod 1.5 XS 2M - Super Pi mod 1.5 XS 2M *
Super Pi Mod 1.5 XS 32M - Super Pi mod 1.5 XS 32M *
min: 373 avg: 373.3 median: 373.3 (2%) max: 373.6 s
3DMark 11 - 3DM11 Performance Physics
min: 33212 avg: 34146 median: 34146 (84%) max: 35080 Points
3DMark - 3DMark Fire Strike Standard Physics
min: 37856 avg: 41184 median: 42689 (76%) max: 43007 Points
CPU TDP ? TDP 135 W TDP 145 W 98% 87% 100%
3DMark - 3DMark Time Spy CPU
min: 12913 avg: 13307 median: 13082 (55%) max: 13926 Points
CPU TDP ? TDP 135 W TDP 145 W 100% 93% 96%
Geekbench 6.7 - Geekbench 6.7.1 Single-Core
min: 3146 avg: 3188 median: 3184.5 (73%) max: 3237 points
Geekbench 6.7 - Geekbench 6.7.1 Multi-Core
min: 19788 avg: 20200 median: 20231 (69%) max: 20551 points
Geekbench 6.0 - Geekbench 6.0 Single-Core
Geekbench 6.0 - Geekbench 6.0 Multi-Core
Geekbench 5.5 - Geekbench 5.1 - 5.5 64 Bit Single-Core
min: 2381 avg: 2391 median: 2391 (80%) max: 2401 points
Geekbench 5.5 - Geekbench 5.1 - 5.5 64 Bit Multi-Core
min: 23468 avg: 23569 median: 23568.5 (42%) max: 23669 points
Geekbench 5.0 - Geekbench 5.0 64 Bit Single-Core
...
max:
AMD Ryzen 7 9850X3D
Geekbench 5.0 - Geekbench 5.0 64 Bit Multi-Core
Geekbench 4.4 - Geekbench 4.1 - 4.4 64 Bit Single-Core
Geekbench 4.4 - Geekbench 4.1 - 4.4 64 Bit Multi-Core
Mozilla Kraken 1.1 - Kraken 1.1 Total Score *
Octane V2 - Octane V2 Total Score
WebXPRT 4 - WebXPRT 4 Score
min: 320 avg: 326.5 median: 326.5 (81%) max: 333 Points
WebXPRT 3 - WebXPRT 3 Score
min: 342 avg: 354 median: 354 (59%) max: 366 Points
CrossMark - CrossMark Overall
min: 2199 avg: 2243 median: 2264 (79%) max: 2265 Points
CPU TDP ? TDP 135 W TDP 145 W 100% 100% 95%
Power Consumption - Prime95 Power Consumption - external Monitor *
min: 216 avg: 222 median: 222 (38%) max: 228 Watt
0 5 10 15 20 25 30 35 40 45 50 55 60 65 70 75 80 85 90 95 100 105 110 115 120 125 130 135 140 145 150 155 160 165 170 175 180 185 190 195 200 205 210 215 220 225 230 Tooltip MSI Raider A18 HX A9WIG-080: Ø216 (210-221)
Schenker XMG Neo 16 A25 5090: Ø228 (209-235)
Power Consumption - Cinebench R15 Multi Power Consumption - external Monitor *
0 5 10 15 20 25 30 35 40 45 50 55 60 65 70 75 80 85 90 95 100 105 110 115 120 125 130 135 140 145 150 155 160 165 170 175 180 185 190 195 200 205 210 215 220 225 Tooltip Schenker XMG Neo 16 A25 5090: Ø221 (202-226)
Power Consumption - Idle Power Consumption - external Monitor *
min: 12.3 avg: 35.1 median: 35.1 (23%) max: 57.8 Watt
0 5 10 15 20 25 30 35 40 45 50 55 60 Tooltip Schenker XMG Neo 16 A25 5090: Ø12.3 (7.13-18.8)
MSI Raider A18 HX A9WIG-080: Ø57.8 (55.7-63.8)
Power Consumption - Idle Power Consumption 150cd 1min *
min: 14.2 avg: 30.1 median: 30.1 (22%) max: 45.9 Watt
0 5 10 15 20 25 30 35 40 45 50 Tooltip Schenker XMG Neo 16 A25 5090: Ø14.2 (10.7-19)
MSI Raider A18 HX A9WIG-080: Ø45.9 (44.1-51.4)
Power Consumption - Power Efficiency - Cinebench R15 Multi external Monitor
27.3 Points per Watt (20%)
- Range of benchmark values
- Average benchmark values
* Smaller numbers mean a higher performance
log 30. 14:31:28
#0 ran 0s before starting gpusingle class +0s ... 0s
#1 no ids found in url (should be separated by "_") +0s ... 0s
#2 not redirecting to Ajax server +0s ... 0s
#3 did not recreate cache, as it is less than 5 days old! Created at Tue, 28 Jul 2026 05:30:19 +0200 +0.002s ... 0.002s
#4 composed specs +0.013s ... 0.015s
#5 did output specs +0s ... 0.015s
#6 getting avg benchmarks for device 18729 +0.034s ... 0.049s
#7 got single benchmarks 18729 +0.017s ... 0.065s
#8 got avg benchmarks for devices +0s ... 0.065s
#9 min, max, avg, median took s +1.966s ... 2.031s
#10 return log +0.599s ... 2.63s