Reviews for the Intel Core i7-1360P processor
Asus Expertbook B5 Flip B5402F review - A great convertible with a catch
Asus has updated its Expertbook B5 Flip, equipping it with a new 13th-gen Intel processor. While its flexibility and build are just as good as its predecessor, the convertible has been given a big performance boost—plus, it now boasts better connectivity options.
Intel Core i7-1360P, Iris Xe G7 96EUs, 14", 1.4 kgEurocom C315 Blitz laptop review: Core i7-1360P is a mixed bag
The C315 Blitz swaps out the older 11th gen Core i7 H-series processor for a newer 13th gen Core i7 P-series option. However, the change is more like a sideways step than a leap forward in terms of performance.
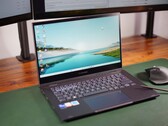
Intel Core i7-1360P, Iris Xe G7 96EUs, 15.6", 1.7 kgLG Gram 16-inch 2-in-1 review - Weight is no longer a unique selling point
Externally unchanged, at least the new LG Gram 2-in-1 offers up-to-date hardware when it comes to the internals. In our review device, the Intel Core i7 shows that it's capable of high performance, even in a lightweight form factor. However, in 2023, LG still hasn't managed to eliminate the device's other weak points.
Intel Core i7-1360P, Iris Xe G7 96EUs, 16", 1.5 kgLG Gram Style 14 laptop review: Elegant, fast, and (too) hot
While hardly weighing 1 kg (~2.2 lb), the subnotebook from LG is very well equipped with the Intel Core i7-1360P, 32 GB of working memory, and OLED display. Aside from the performance, the Gram Style also offers some other qualities. What immediate strikes us, is the case surface that can shimmer in all rainbow colors. And the laptop is also able to operate completely quietly - aside from some strange exception.
Intel Core i7-1360P, Iris Xe G7 96EUs, 14", 987 gLenovo ThinkPad X1 Nano Gen 3 laptop review: Intel Core-P at under 1 kg
The ThinkPad X1 Nano is back for a third year in a row with the exact same chassis design as its first generation launch. It remains one of the lightest and most portable subnotebooks in the market, but the compromises to performance are still alive and well.
Intel Core i7-1360P, Iris Xe G7 96EUs, 13", 989 gIntel NUC 13 Pro Desk Edition Kit: Intel Iris Xe Graphics G7 96EUs, 0.6 kg
Review » Intel NUC 13 Pro Kit - Vivid Canyon review: The last Intel NUC has a new case and a Core i7-1360P
Khadas Mind: Intel Iris Xe Graphics G7 96EUs, 0.4 kg
Review » Khadas Mind workstation review: Can this portable mini PC with a battery and a Core i7-1360P replace a laptop?
LG Gram SuperSlim (2023): Intel Iris Xe Graphics G7 96EUs, 15.60", 1 kg
Review » LG Gram SuperSlim (2023) review: 990 gram laptop with long battery life and OLED display
Dell XPS 13 Plus 9320 Core i7-1360P: Intel Iris Xe Graphics G7 96EUs, 13.40", 1.3 kg
Review » Barely any better than the previous year: 2023 Dell XPS 13 Plus 9320 Core i7-1360P review
Huawei MateBook X Pro 2023: Intel Iris Xe Graphics G7 96EUs, 14.20", 1.3 kg
Review » Huawei MateBook X Pro 2023 in review - MacBook Air competitor also supports external GPUs
Samsung Galaxy Book3 Pro 14: Intel Iris Xe Graphics G7 96EUs, 14.00", 1.2 kg
Review » Samsung Galaxy Book3 Pro 14 review: Light office notebook with 20 hours of battery life
LG Gram 17 (2023): Intel Iris Xe Graphics G7 96EUs, 17.00", 1.4 kg
Review » LG Gram 17 (2023) review: Ultralight office laptop with Core i7 and long battery life
Intel NUC 13 Pro Kit NUC13ANK: Intel Iris Xe Graphics G7 96EUs, 0.5 kg
Review » Intel NUC 13 Pro Kit aka Arena Canyon review: Modern mini-PC with Intel Core i7-1360P for demanding applications
Lenovo Yoga 9 14IRP G8: Intel Iris Xe Graphics G7 96EUs, 14.00", 1.4 kg
Review » Lenovo Yoga 9i 14 G8 2023 convertible in review: Intel Raptor Lake disappoints
Review » Intel Raptor Lake-P Review - Debut for the Core i7-1360P
Dell Inspiron 16 5630: NVIDIA GeForce RTX 2050 Mobile, 16.00", 1.9 kg
External Review » Dell Inspiron 16 5630
HP EliteBook 840 G10, i7-1360P: Intel Iris Xe Graphics G7 96EUs, 14.00", 1.4 kg
External Review » HP EliteBook 840 G10, i7-1360P
Dell Inspiron 5330: Intel Iris Xe Graphics G7 96EUs, 13.30", 1.3 kg
External Review » Dell Inspiron 5330
Asus Vivobook 16X K3604: Intel Iris Xe Graphics G7 80EUs, 16.00", 1.6 kg
External Review » Asus Vivobook 16X K3604
Framework Laptop 13.5, i7-1360P: Intel Iris Xe Graphics G7 96EUs, 13.50", 1.3 kg
External Review » Framework Laptop 13.5, i7-1360P
Lenovo Yoga Slim 7 Carbon 13IRP8: Intel Iris Xe Graphics G7 96EUs, 13.30", 1 kg
External Review » Lenovo Yoga Slim 7 Carbon 13IRP8
Lenovo Yoga 7 14IRL8, i7-1360P: Intel Iris Xe Graphics G7 96EUs, 14.00", 1.5 kg
External Review » Lenovo Yoga 7 14IRL8, i7-1360P
Lenovo Yoga 7 16IRL8, i7-1360P: Intel Iris Xe Graphics G7 96EUs, 16.00", 2 kg
External Review » Lenovo Yoga 7 16IRL8, i7-1360P
HP Spectre x360 16-f2000: Intel Iris Xe Graphics G7 96EUs, 16.00", 2.2 kg
External Review » HP Spectre x360 16-f2000
Dell Precision 15 3580: NVIDIA RTX A500 Laptop GPU, 15.60", 1.6 kg
External Review » Dell Precision 15 3580
Asus Zenbook 14 UX3402VA, i7-1360P: Intel Iris Xe Graphics G7 96EUs, 14.00", 1.4 kg
External Review » Asus Zenbook 14 UX3402VA, i7-1360P
LG Gram Style 14Z90RS-G.AD7AG: Intel Iris Xe Graphics G7 96EUs, 14.00", 1 kg
External Review » LG Gram Style 14Z90RS-G.AD7AG
Lenovo ThinkPad X1 Nano Gen 3: Intel Iris Xe Graphics G7 96EUs, 13.00", 1 kg
External Review » Lenovo ThinkPad X1 Nano Gen 3
Dell XPS 13 Plus 9320 Core i7-1360P: Intel Iris Xe Graphics G7 96EUs, 13.40", 1.3 kg
External Review » Dell XPS 13 Plus 9320 Core i7-1360P
Asus Vivobook 15X K3504VA: Intel Iris Xe Graphics G7 96EUs, 15.60", 1.6 kg
External Review » Asus Vivobook 15X K3504VA
LG Gram SuperSlim (2023): Intel Iris Xe Graphics G7 96EUs, 15.60", 1 kg
External Review » LG Gram SuperSlim (2023)
Huawei MateBook X Pro 2023: Intel Iris Xe Graphics G7 96EUs, 14.20", 1.3 kg
External Review » Huawei MateBook X Pro 2023
Lenovo Yoga 7 14IRL8: Intel Iris Xe Graphics G7 96EUs, 14.00", 1.6 kg
External Review » Lenovo Yoga 7 14IRL8
MSI Summit E14 Flip Evo A13MT: Intel Iris Xe Graphics G7 96EUs, 14.00", 1.6 kg
External Review » MSI Summit E14 Flip Evo A13MT
MSI Summit E16 Flip A13 VFT: NVIDIA GeForce RTX 4060 Laptop GPU, 16.00", 2.1 kg
External Review » MSI Summit E16 Flip A13 VFT
Samsung Galaxy Book3 Pro 16, i7-1360P: Intel Iris Xe Graphics G7 96EUs, 16.00", 1.6 kg
External Review » Samsung Galaxy Book3 Pro 16, i7-1360P
LG gram Style 16Z90RS: Intel Iris Xe Graphics G7 96EUs, 16.00", 1.3 kg
External Review » LG gram Style 16Z90RS
MSI Prestige 13 Evo A13M: Intel Iris Xe Graphics G7 96EUs, 13.30", 1 kg
External Review » MSI Prestige 13 Evo A13M
MSI Summit E13 Flip Evo A13MT: Intel Iris Xe Graphics G7 96EUs, 13.40", 1.4 kg
External Review » MSI Summit E13 Flip Evo A13MT
LG gram Style 14Z90RS: Intel Iris Xe Graphics G7 96EUs, 14.00", 1 kg
External Review » LG gram Style 14Z90RS
Samsung Galaxy Book3 360 13, i7-1360P: Intel Iris Xe Graphics G7 96EUs, 13.30", 1.2 kg
External Review » Samsung Galaxy Book3 360 13, i7-1360P
Samsung Galaxy Book3 Pro 14: Intel Iris Xe Graphics G7 96EUs, 14.00", 1.2 kg
External Review » Samsung Galaxy Book3 Pro 14, Core i7-1360P
Asus Zenbook 14 Flip UP3404VA-KN026W: Intel Iris Xe Graphics G7 96EUs, 14.00", 1.5 kg
External Review » Asus Zenbook 14 Flip 2023 UP3404VA-KN026W
LG Gram 17 2023 17Z90R: NVIDIA GeForce RTX 3050 4GB Laptop GPU, 17.00", 1.5 kg
External Review » LG Gram 17 2023 17Z90R
LG Gram 17 (2023): Intel Iris Xe Graphics G7 96EUs, 17.00", 1.4 kg
External Review » LG Gram 17Z90R-G.AA77G
Lenovo Yoga 9 14IRP G8: Intel Iris Xe Graphics G7 96EUs, 14.00", 1.4 kg
External Review » Lenovo Yoga 9 14IRP G8
Lenovo Yoga 9 14IRP8, i7-1360P: Intel Iris Xe Graphics G7 96EUs, 14.00", 1.4 kg
External Review » Lenovo Yoga 9 14IRP8, i7-1360P
Samsung Galaxy Book3 Pro 360 16, i7-1360P: Intel Iris Xe Graphics G7 96EUs, 16.00", 1.7 kg
External Review » Samsung Galaxy Book3 Pro 360 16, i7-1360P
Dell XPS 13 Plus 9320 Core i7-1360P: Intel Iris Xe Graphics G7 96EUs, 13.40", 1.3 kg
» Latest Dell XPS 13 9350 laptop with 20-hour battery life and 120 Hz display is now up to $500 cheaper than MSRP
Framework Laptop 13.5, i7-1360P: Intel Iris Xe Graphics G7 96EUs, 13.50", 1.3 kg
» Framework Laptop Brick System expands notebook with Lego feet, wheels, cable holders and more
Khadas Mind: Intel Iris Xe Graphics G7 96EUs, 0.4 kg
» Sleek-looking Khadas Mind 2 released with up to Core Ultra 7 155H CPU, 64 GB of memory, and excellent expandability for a premium price
LG Gram SuperSlim (2023): Intel Iris Xe Graphics G7 96EUs, 15.60", 1 kg
» LG Gram SuperSlim with OLED display, 32 GB RAM, 2 TB storage marked down by $831
Dell XPS 13 Plus 9320 Core i7-1360P: Intel Iris Xe Graphics G7 96EUs, 13.40", 1.3 kg
» Dell XPS 13 Plus laptop with 3.5K OLED, Core i7 and 16GB RAM gets hefty $619 discount
Samsung Galaxy Book3 Pro 14: Intel Iris Xe Graphics G7 96EUs, 14.00", 1.2 kg
» Samsung Galaxy Book3 Pro 14 with 120 Hz AMOLED screen and Intel Core i7-1360P reaches lowest price ever on Amazon thanks to huge 44% discount
LG Gram Style 14Z90RS-G.AD7AG: Intel Iris Xe Graphics G7 96EUs, 14.00", 1 kg
» Not matured yet: LG Gram Style 14 reviewed
LG Gram SuperSlim (2023): Intel Iris Xe Graphics G7 96EUs, 15.60", 1 kg
» LG Gram SuperSlim (2023): The slim laptop comes without USB-A or HDMI
LG Gram 17 (2023): Intel Iris Xe Graphics G7 96EUs, 17.00", 1.4 kg
» LG Gram 17 (2023): The lightweight laptop delivers a long battery life
Lenovo Yoga 9 14IRP G8: Intel Iris Xe Graphics G7 96EUs, 14.00", 1.4 kg
» Lenovo's high-end convertible Yoga 9 14 would benefit massively from an AMD processor