Eurocom C315 Blitz laptop review: Core i7-1360P is a mixed bag

The C315 Blitz is an entry-level to midrange thin-and-light multimedia laptop from Eurocom based on the Schenker Work 15 chassis design. SKUs range between the Core i5-1340P or Core i7-1360P with either a 1080p or 2160p (4K) display. Our specific review unit is a higher-end configuration with the Core i7 and 4K options.
Alternatives to the C315 Blitz include other 15.6-inch multimedia or office laptops like the Acer Aspire 5 A515 or Asus VivoBook S15.
More Eurocom reviews:
Potential Competitors in Comparison
Rating | Date | Model | Weight | Height | Size | Resolution | Price |
|---|---|---|---|---|---|---|---|
| 83.4 % v7 (old) | 11 / 2023 | Eurocom C315 Blitz i7-1360P, Iris Xe G7 96EUs | 1.7 kg | 19.9 mm | 15.60" | 3840x2160 | |
| 84.3 % v7 (old) | 02 / 2022 | Schenker Work 15 Tiger Lake-H i7-11370H, Iris Xe G7 96EUs | 1.7 kg | 19.9 mm | 15.60" | 1920x1080 | |
| 86.6 % v7 (old) | 12 / 2023 | Lenovo ThinkPad L15 Gen 4 21H70021GE R7 PRO 7730U, Vega 8 | 1.9 kg | 19.93 mm | 15.60" | 1920x1080 | |
| 82 % v7 (old) | 09 / 2023 | Acer Aspire 5 A515-58GM-76S8 i7-1355U, GeForce RTX 2050 Mobile | 1.8 kg | 19.7 mm | 15.60" | 1920x1080 | |
| 83.2 % v7 (old) | 02 / 2023 | Asus VivoBook S15 M3502RA-L1029W R7 6800H, Radeon 680M | 1.9 kg | 18.8 mm | 15.60" | 1920x1080 | |
| 79.8 % v7 (old) | 08 / 2022 | Samsung Galaxy Book2 15 i7-1260P, A350M | 1.6 kg | 15 mm | 15.60" | 1920x1080 |
Case
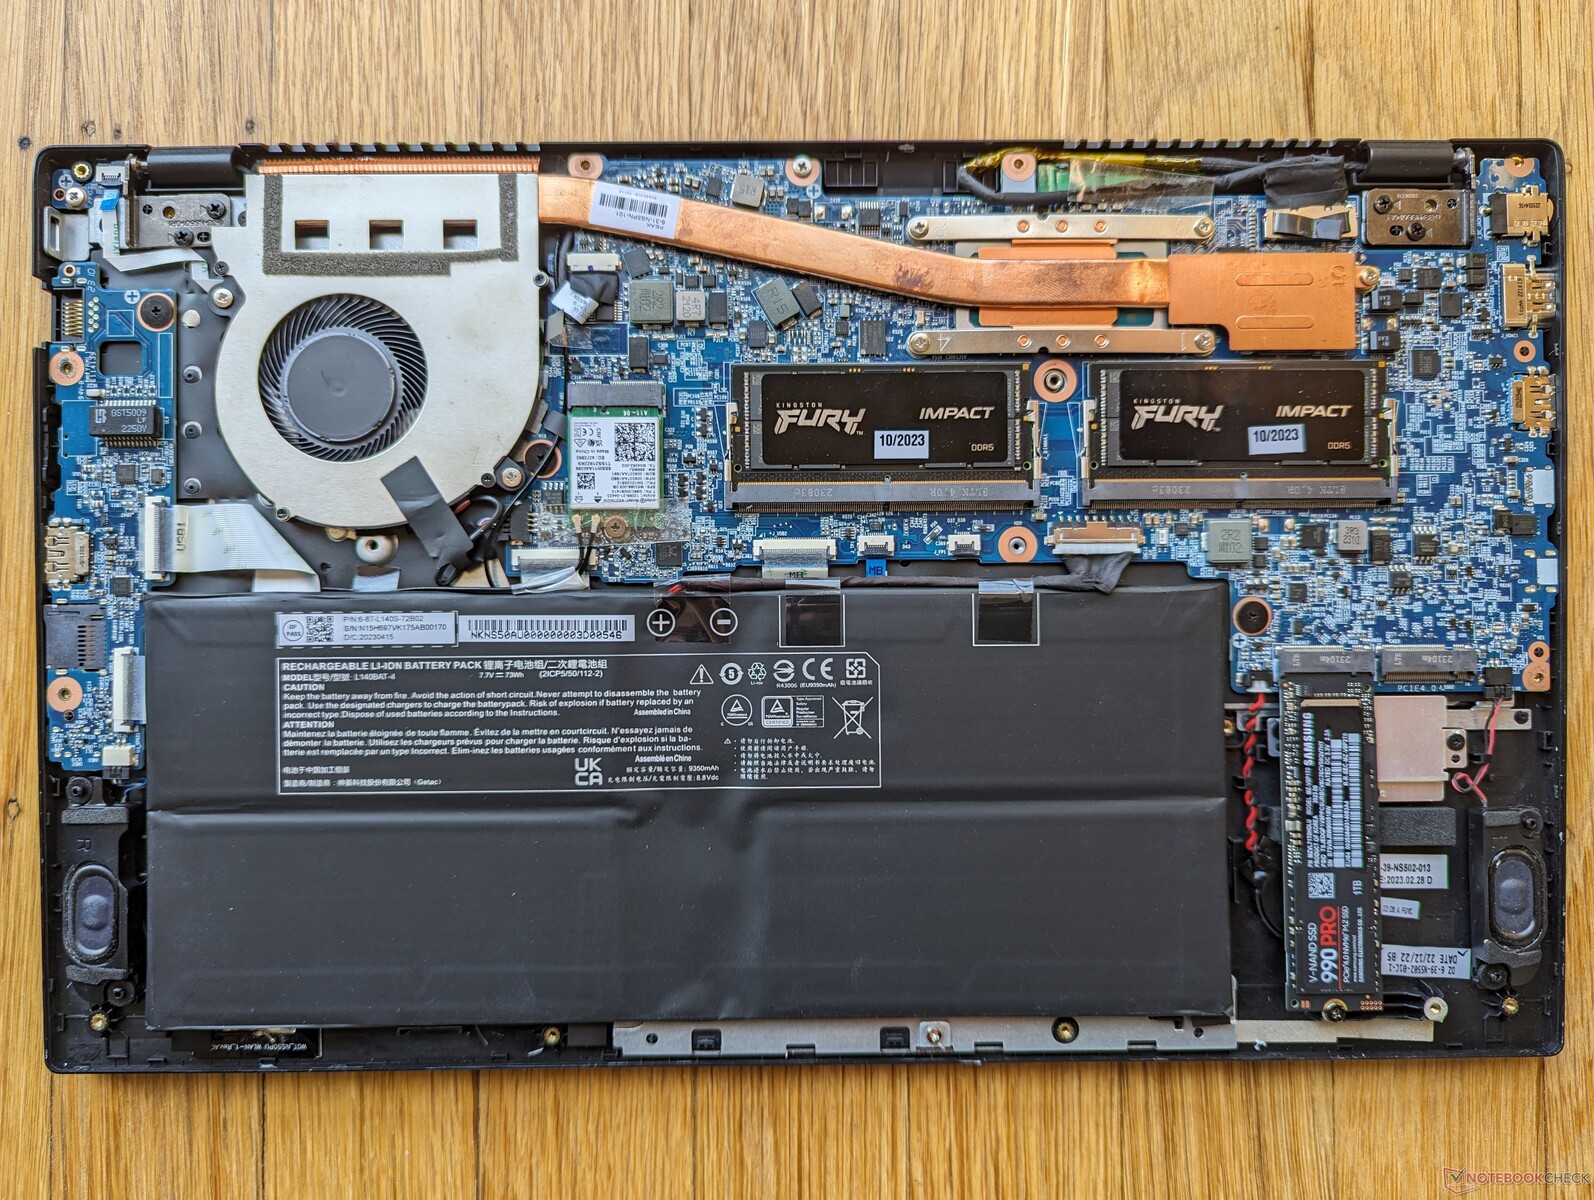
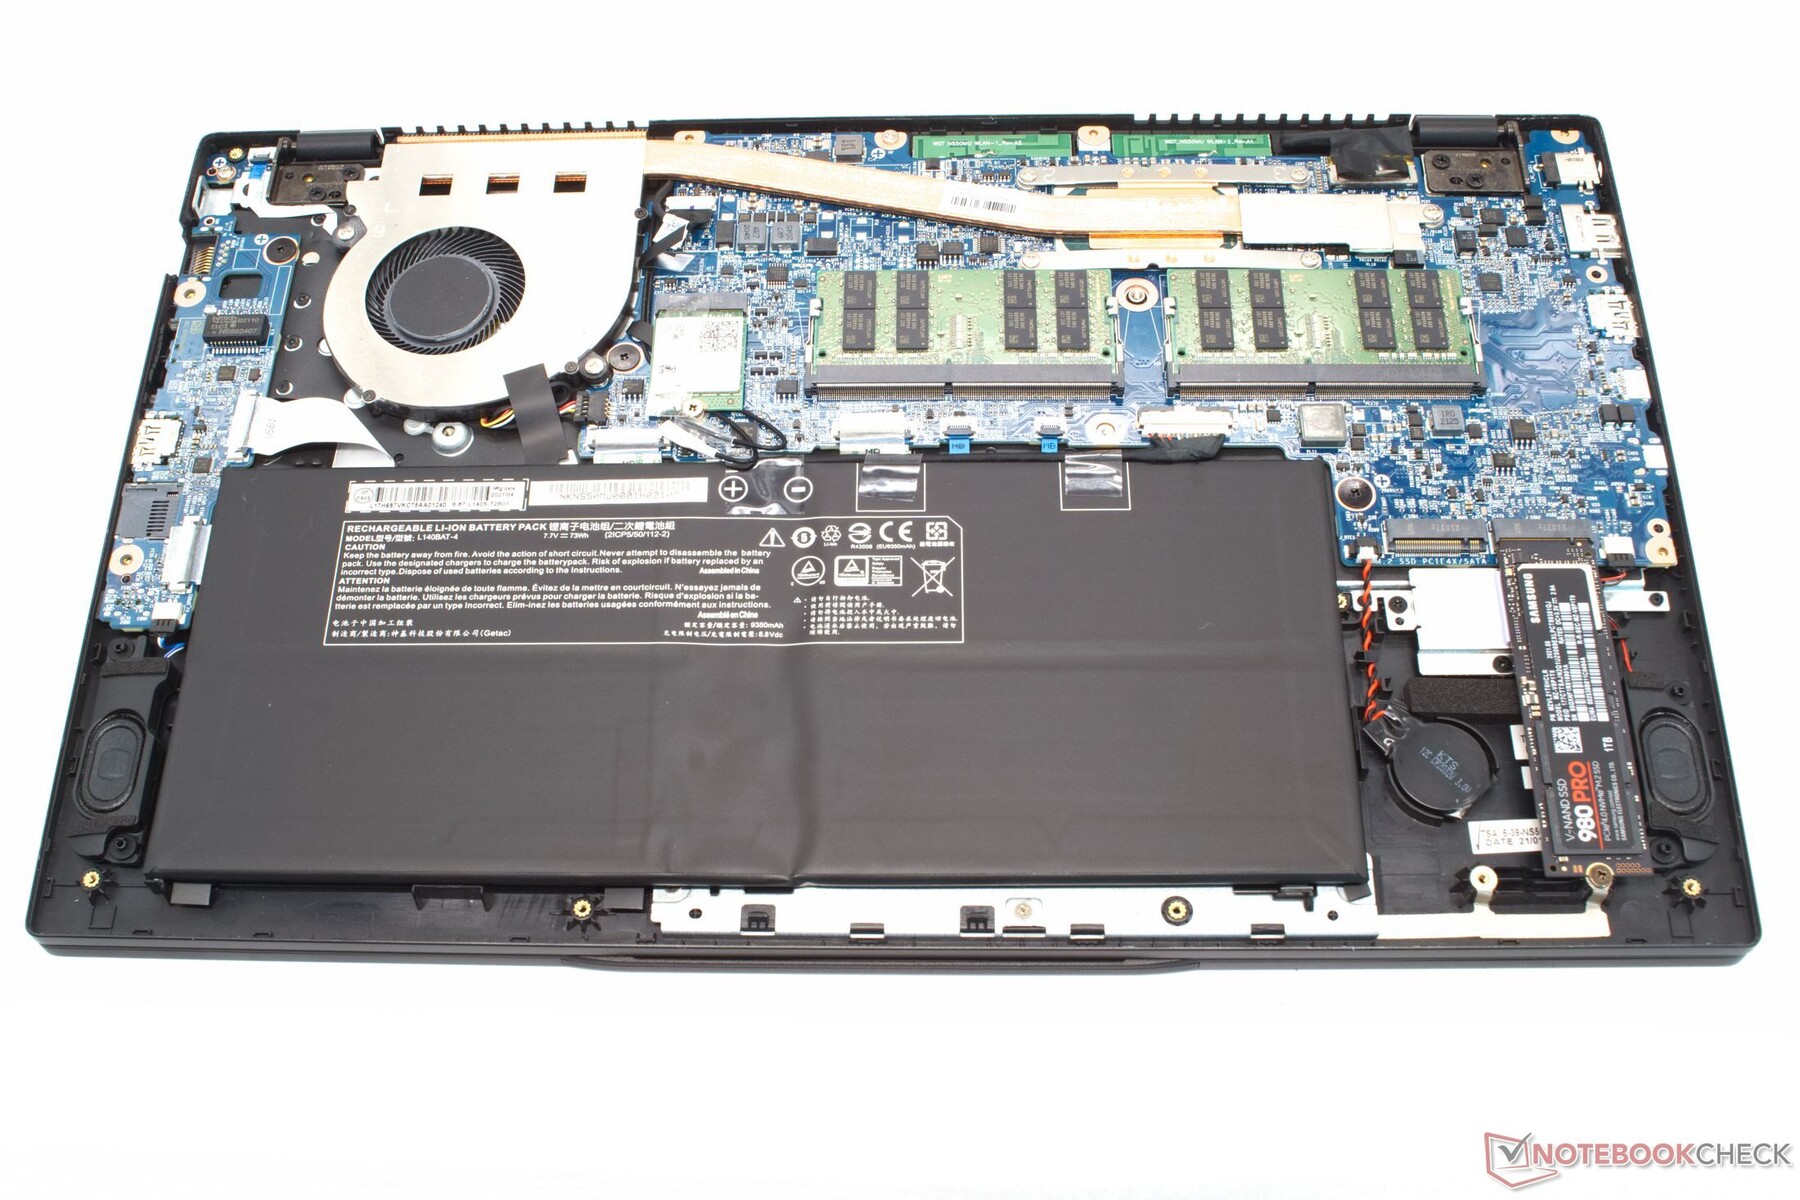
The chassis remains identical to last year's Schenker Work 15 as both are based on the same chassis. Note that only one of the two USB-C ports supports Thunderbolt, USB-C charging, and DisplayPort-out.
(December 4, 2023 update: Eurocom has stated that the printed "Clevo X170KM" labeling on the bottom of the C315 Blitz is an error.)

SD Card Reader
| SD Card Reader | |
| average JPG Copy Test (av. of 3 runs) | |
| Schenker Work 15 Tiger Lake-H (Angelbird AV Pro V60) | |
| Eurocom C315 Blitz (Angelbird AV Pro V60) | |
| Lenovo ThinkPad L15 Gen 4 21H70021GE | |
| Samsung Galaxy Book2 15 (Angelbird AV Pro V60) | |
| maximum AS SSD Seq Read Test (1GB) | |
| Lenovo ThinkPad L15 Gen 4 21H70021GE | |
| Eurocom C315 Blitz (Angelbird AV Pro V60) | |
| Schenker Work 15 Tiger Lake-H (Angelbird AV Pro V60) | |
| Samsung Galaxy Book2 15 (Angelbird AV Pro V60) | |
Communication
| Networking | |
| iperf3 transmit AX12 | |
| Schenker Work 15 Tiger Lake-H | |
| iperf3 receive AX12 | |
| Schenker Work 15 Tiger Lake-H | |
| iperf3 transmit AXE11000 | |
| Samsung Galaxy Book2 15 | |
| Lenovo ThinkPad L15 Gen 4 21H70021GE | |
| Eurocom C315 Blitz | |
| Acer Aspire 5 A515-58GM-76S8 | |
| Asus VivoBook S15 M3502RA-L1029W | |
| iperf3 receive AXE11000 | |
| Lenovo ThinkPad L15 Gen 4 21H70021GE | |
| Samsung Galaxy Book2 15 | |
| Eurocom C315 Blitz | |
| Acer Aspire 5 A515-58GM-76S8 | |
| Asus VivoBook S15 M3502RA-L1029W | |
| iperf3 transmit AXE11000 6GHz | |
| Acer Aspire 5 A515-58GM-76S8 | |
| Lenovo ThinkPad L15 Gen 4 21H70021GE | |
| Eurocom C315 Blitz | |
| iperf3 receive AXE11000 6GHz | |
| Lenovo ThinkPad L15 Gen 4 21H70021GE | |
| Acer Aspire 5 A515-58GM-76S8 | |
| Eurocom C315 Blitz | |
Webcam
Though Eurocom advertises a 2 MP webcam, the Windows camera app only allows you to select up to 1 MP or 720p30 recording at a maximum.
Users can also configure with no camera at all for privacy concerns.
(December 4, 2023 update: Eurocom has stated that the 2 MP webcam selection was an error in the configurator. This has since been fixed.)


Maintenance
Warranty
The standard one-year limited warranty applies if purchased in the US. Eurocom offers optional extension plans of up to three years.
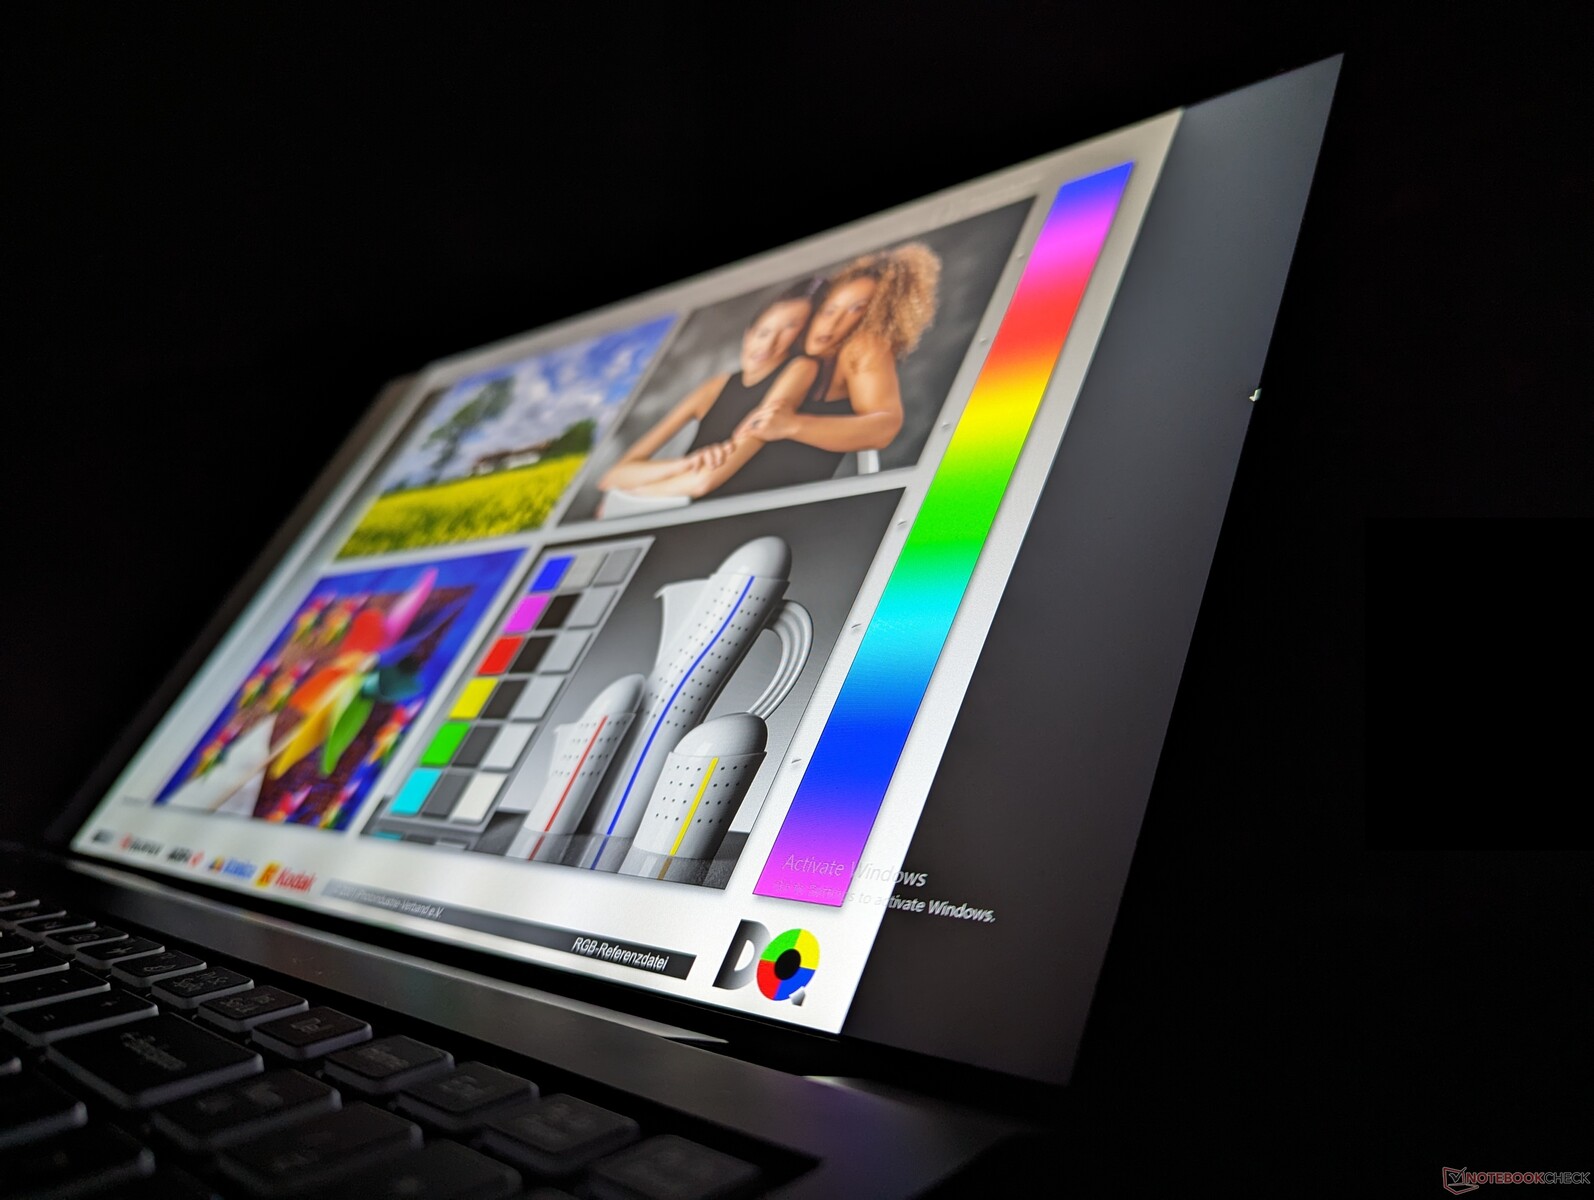
Display
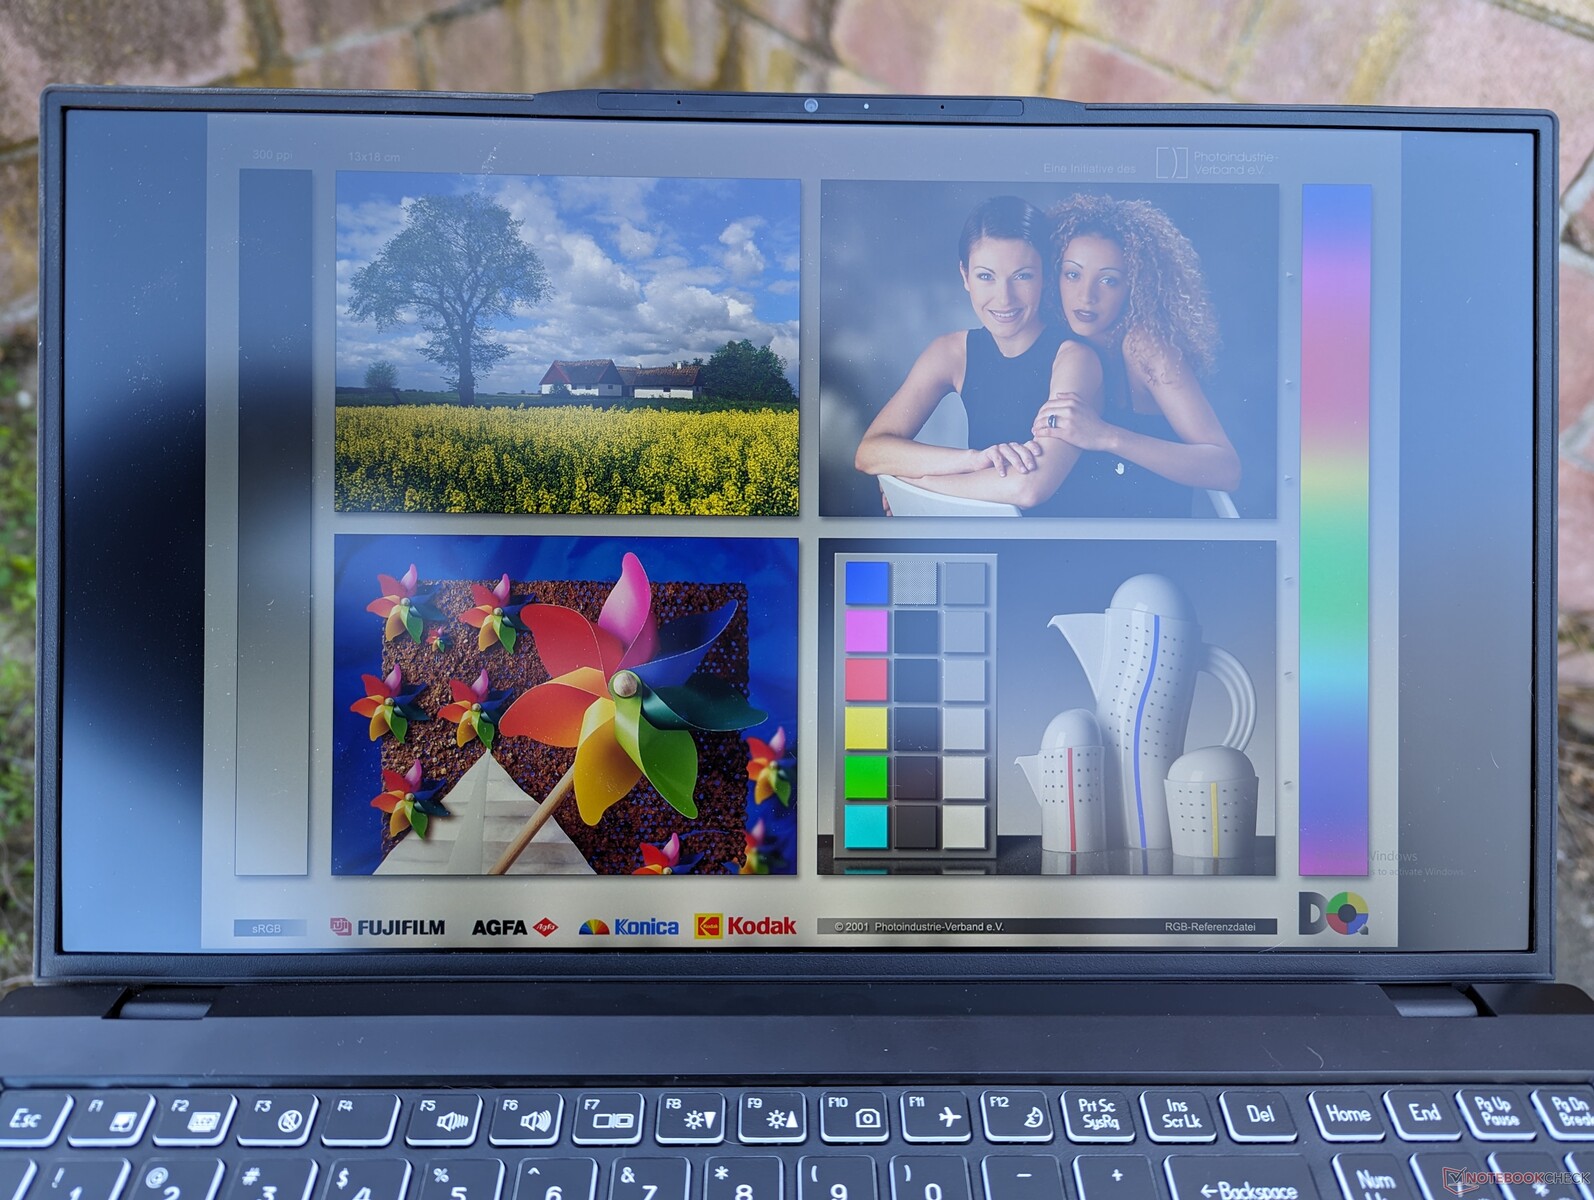
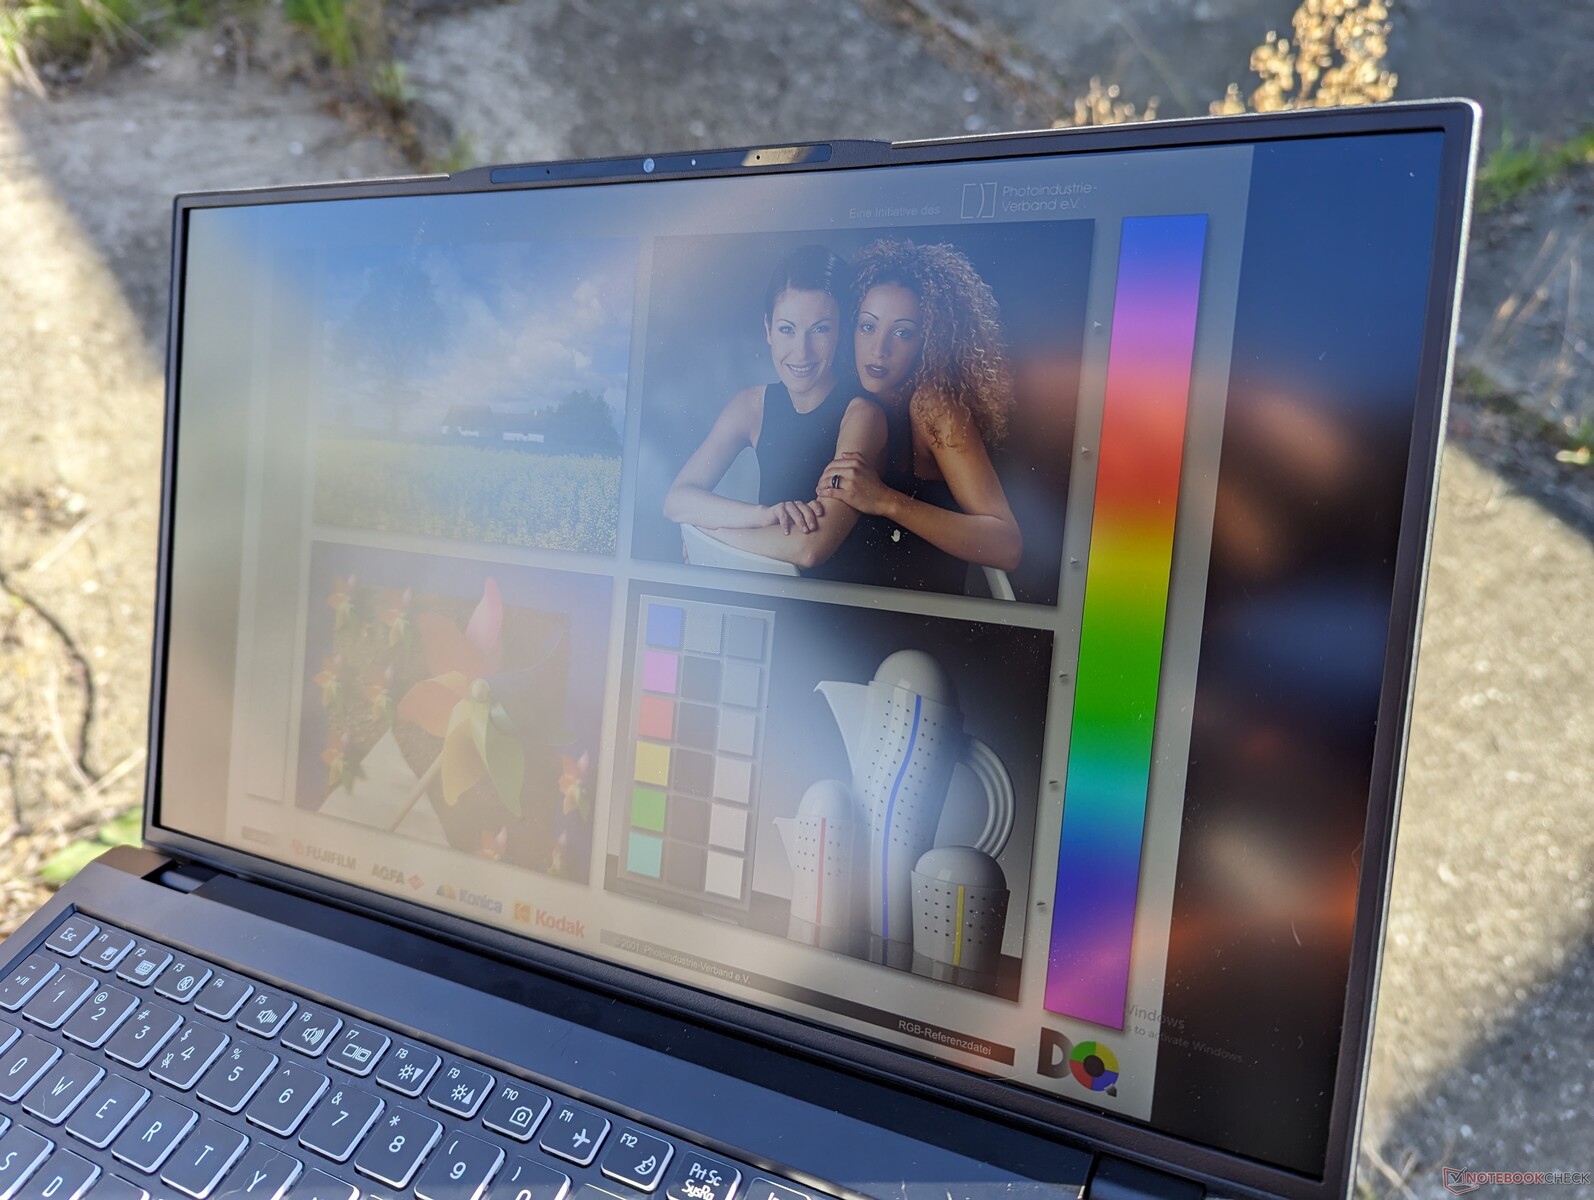
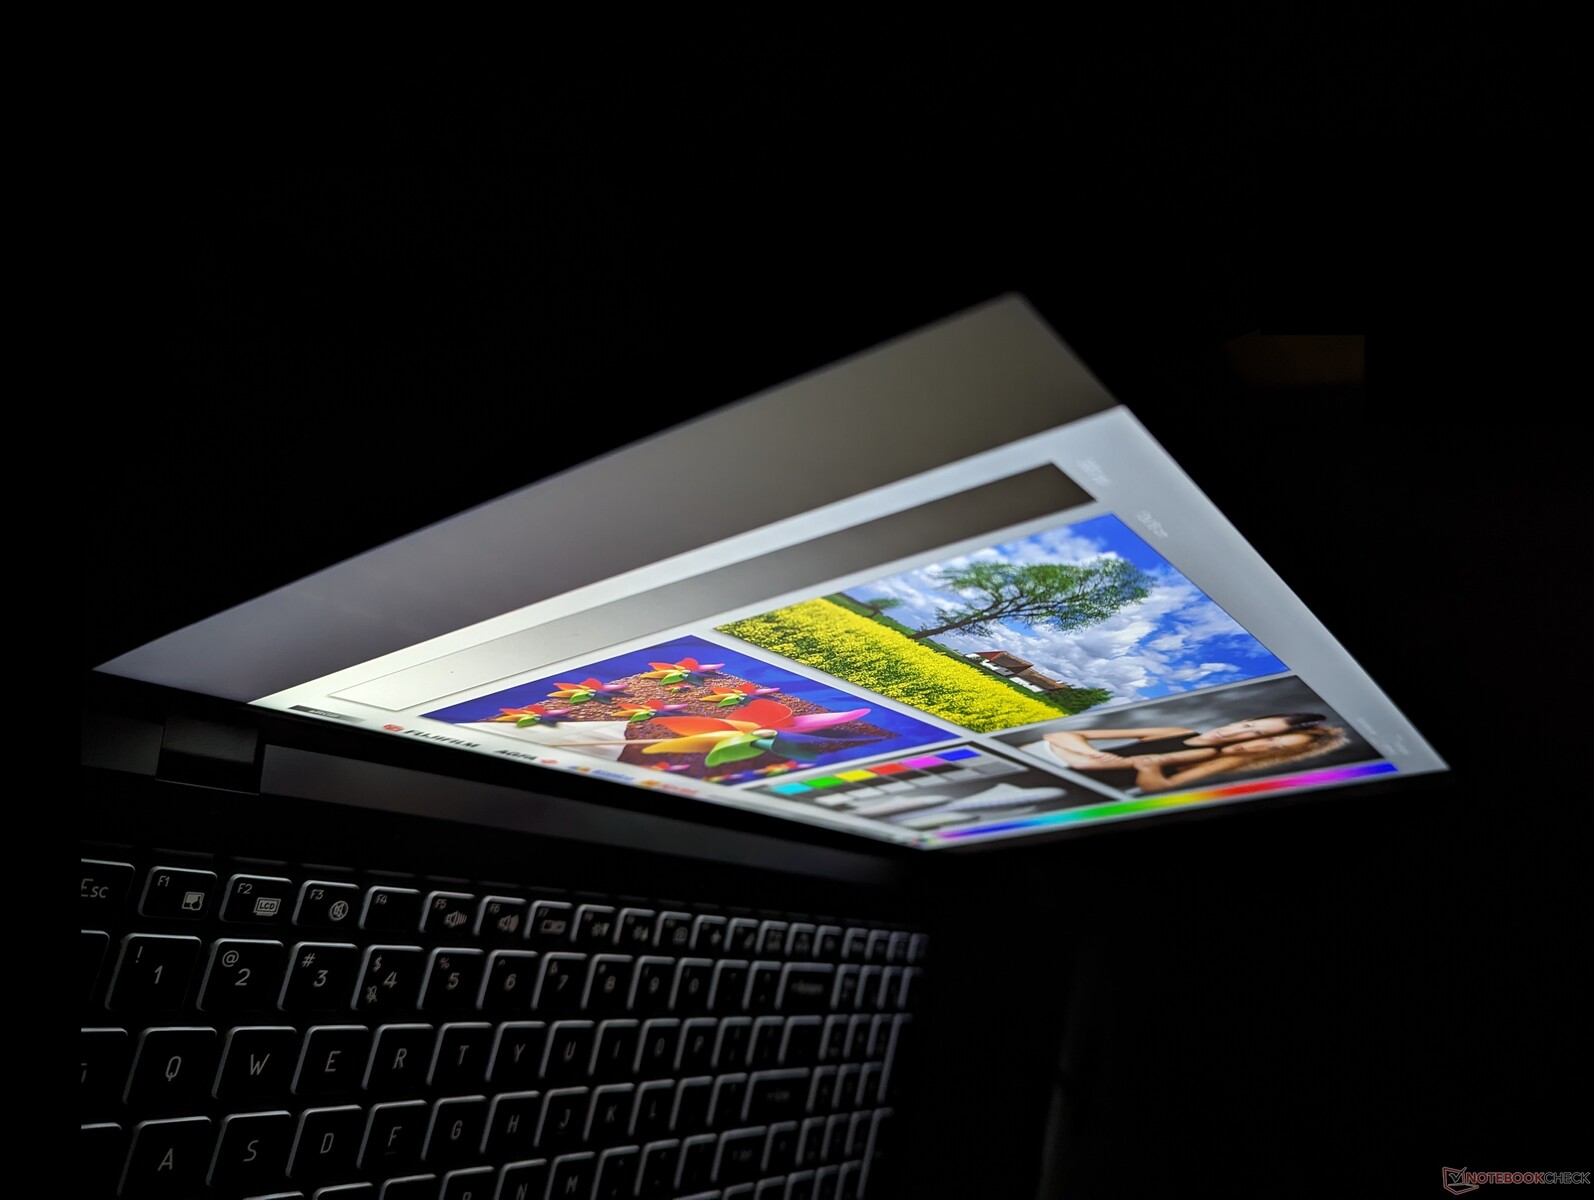
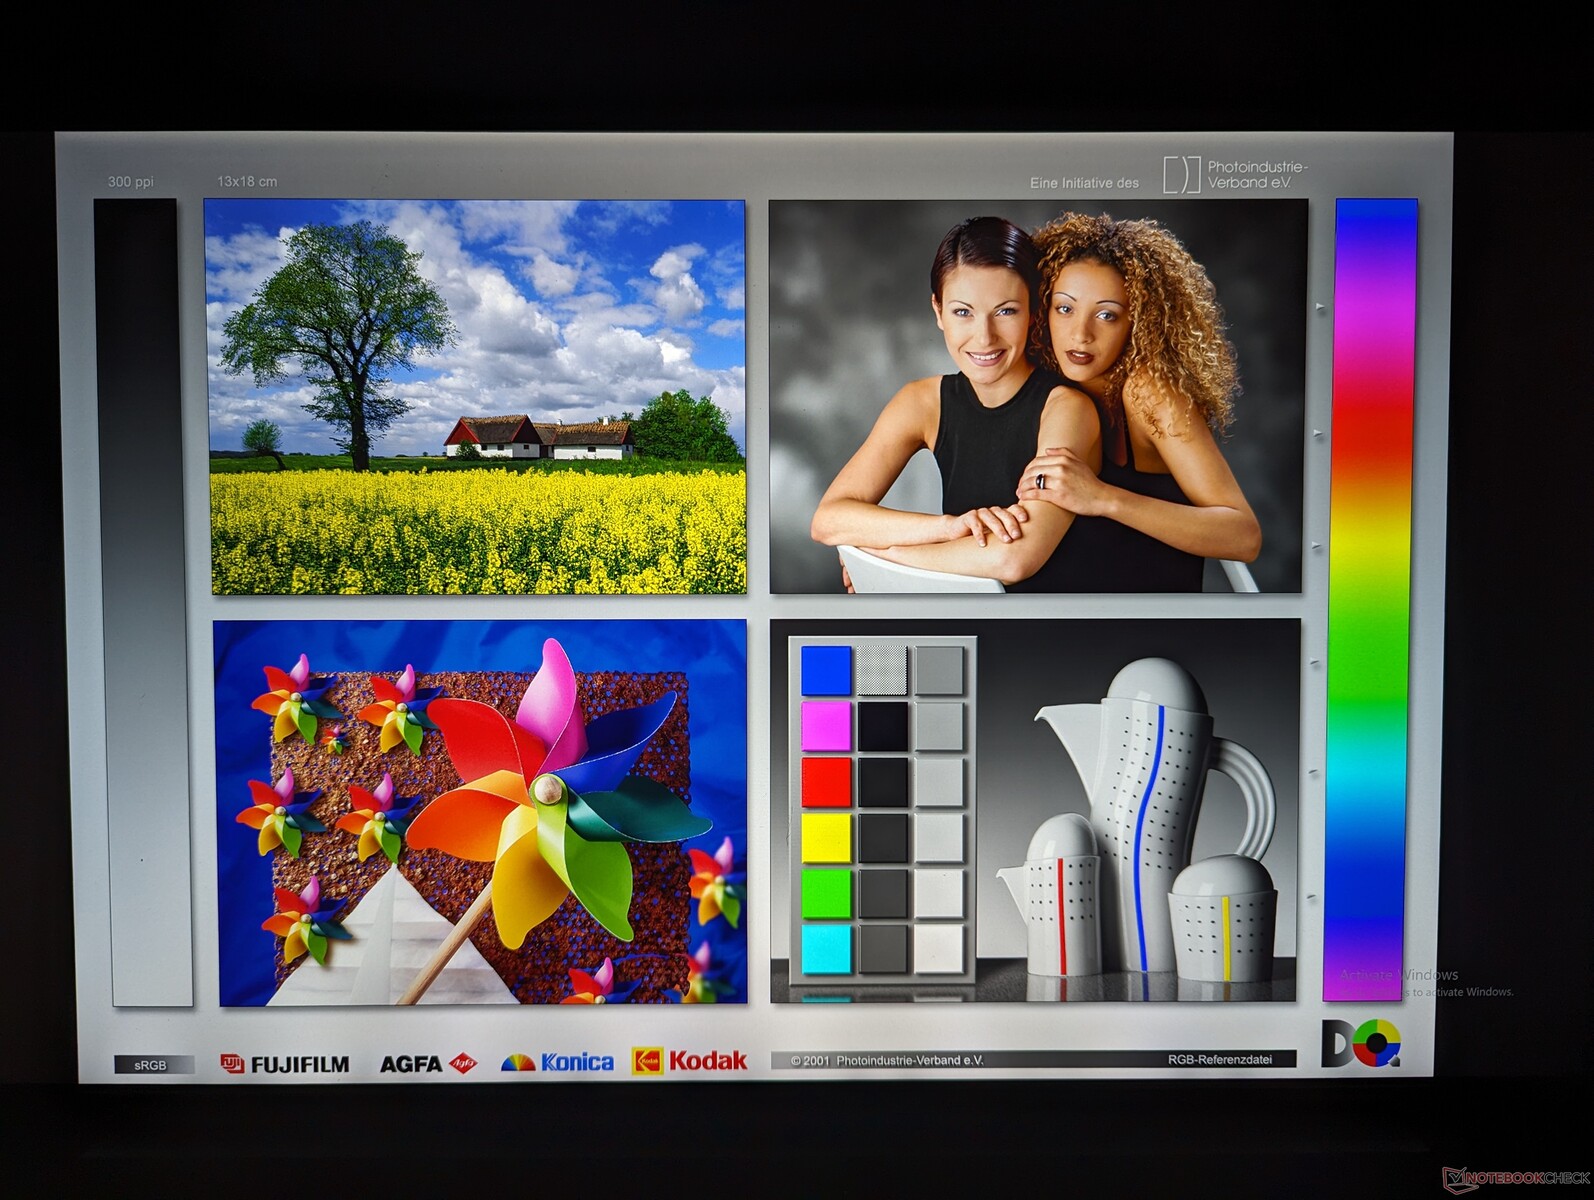
Our Eurocom configuration sports a higher resolution 4K panel than the 1080p panel on our Schenker. However, black-white response times have not improved and so ghosting remains noticeable. Unfortunately, the C315 Blitz offers no options with HDR, full DCI-P3, AdobeRGB coverage or panels with higher refresh rates.
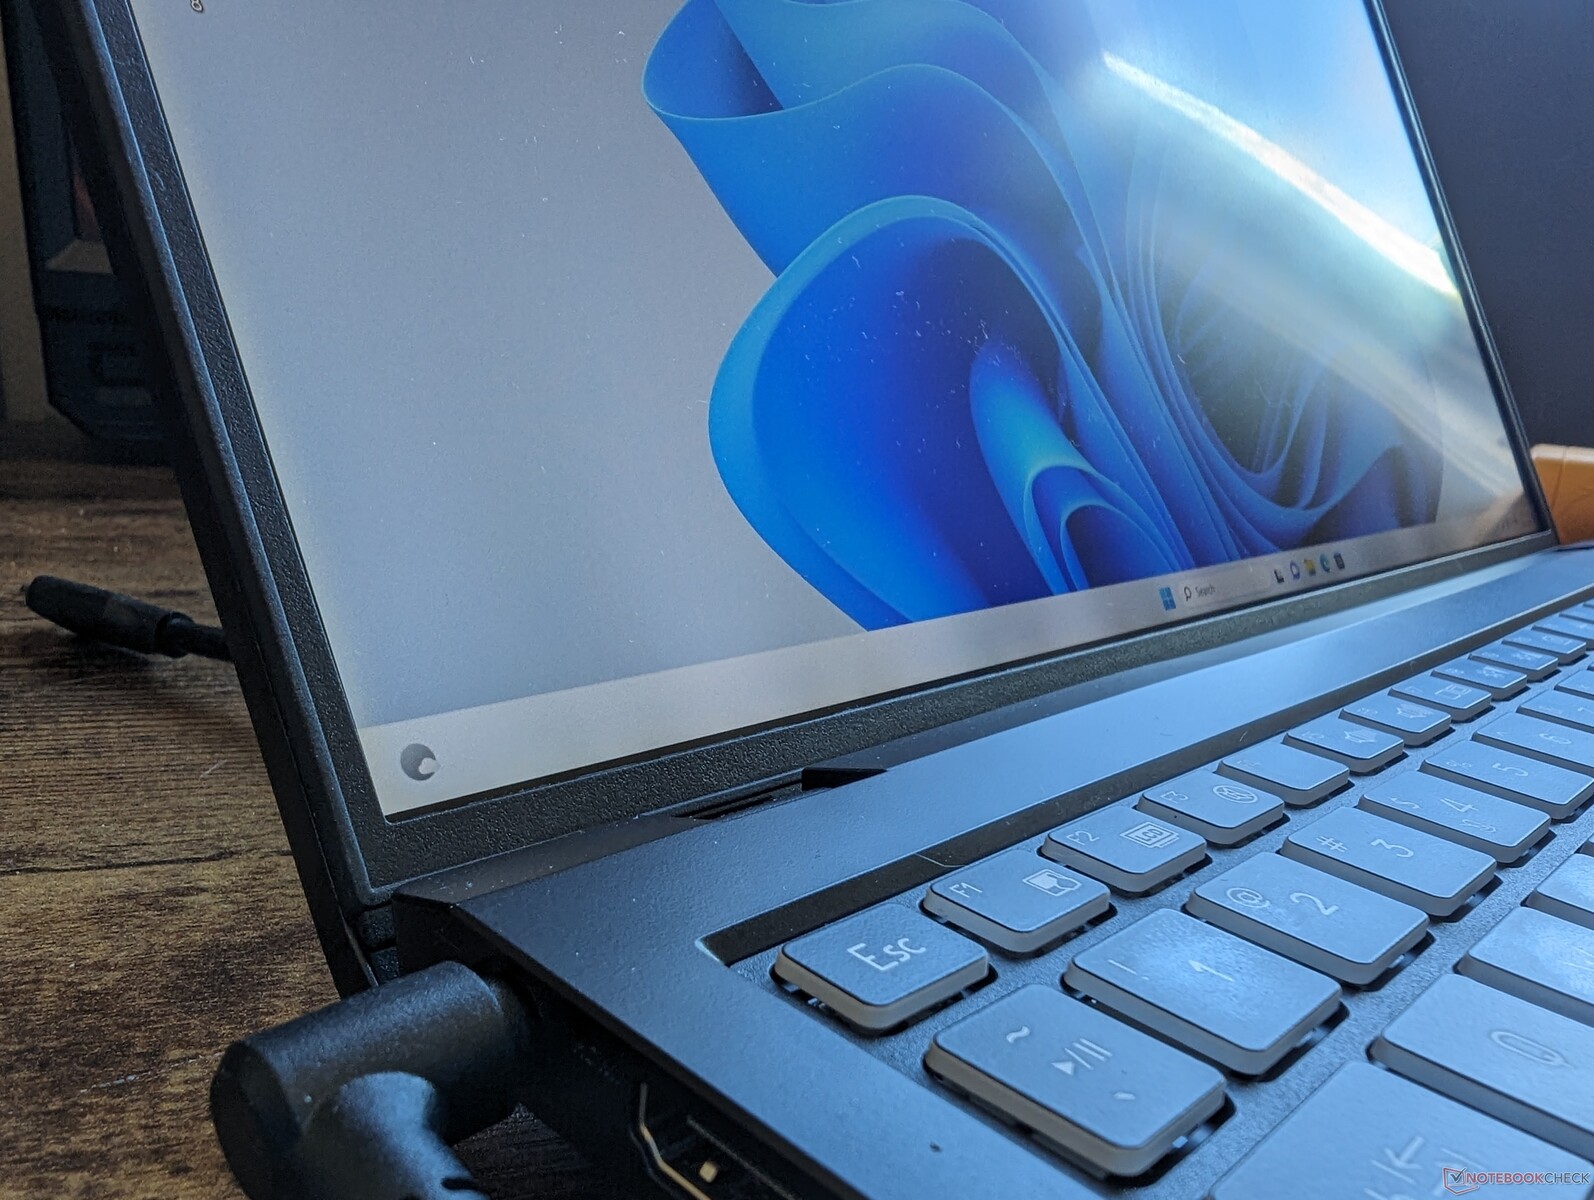
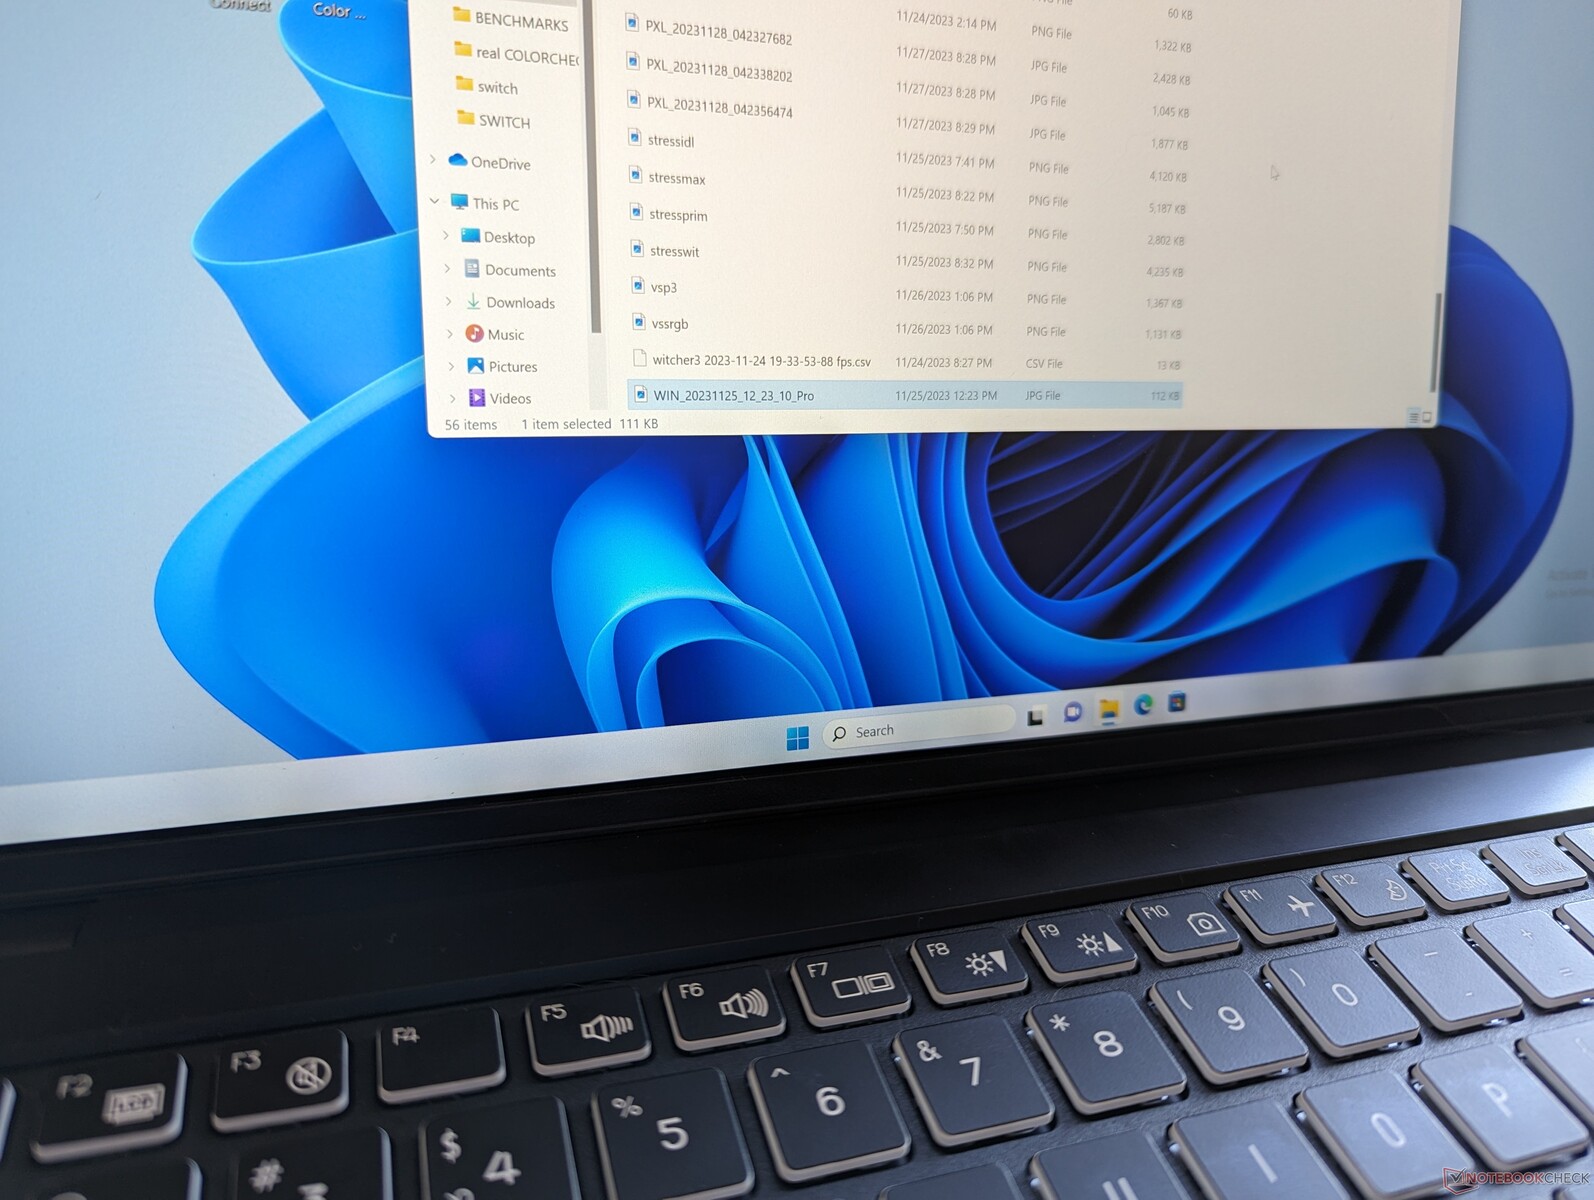
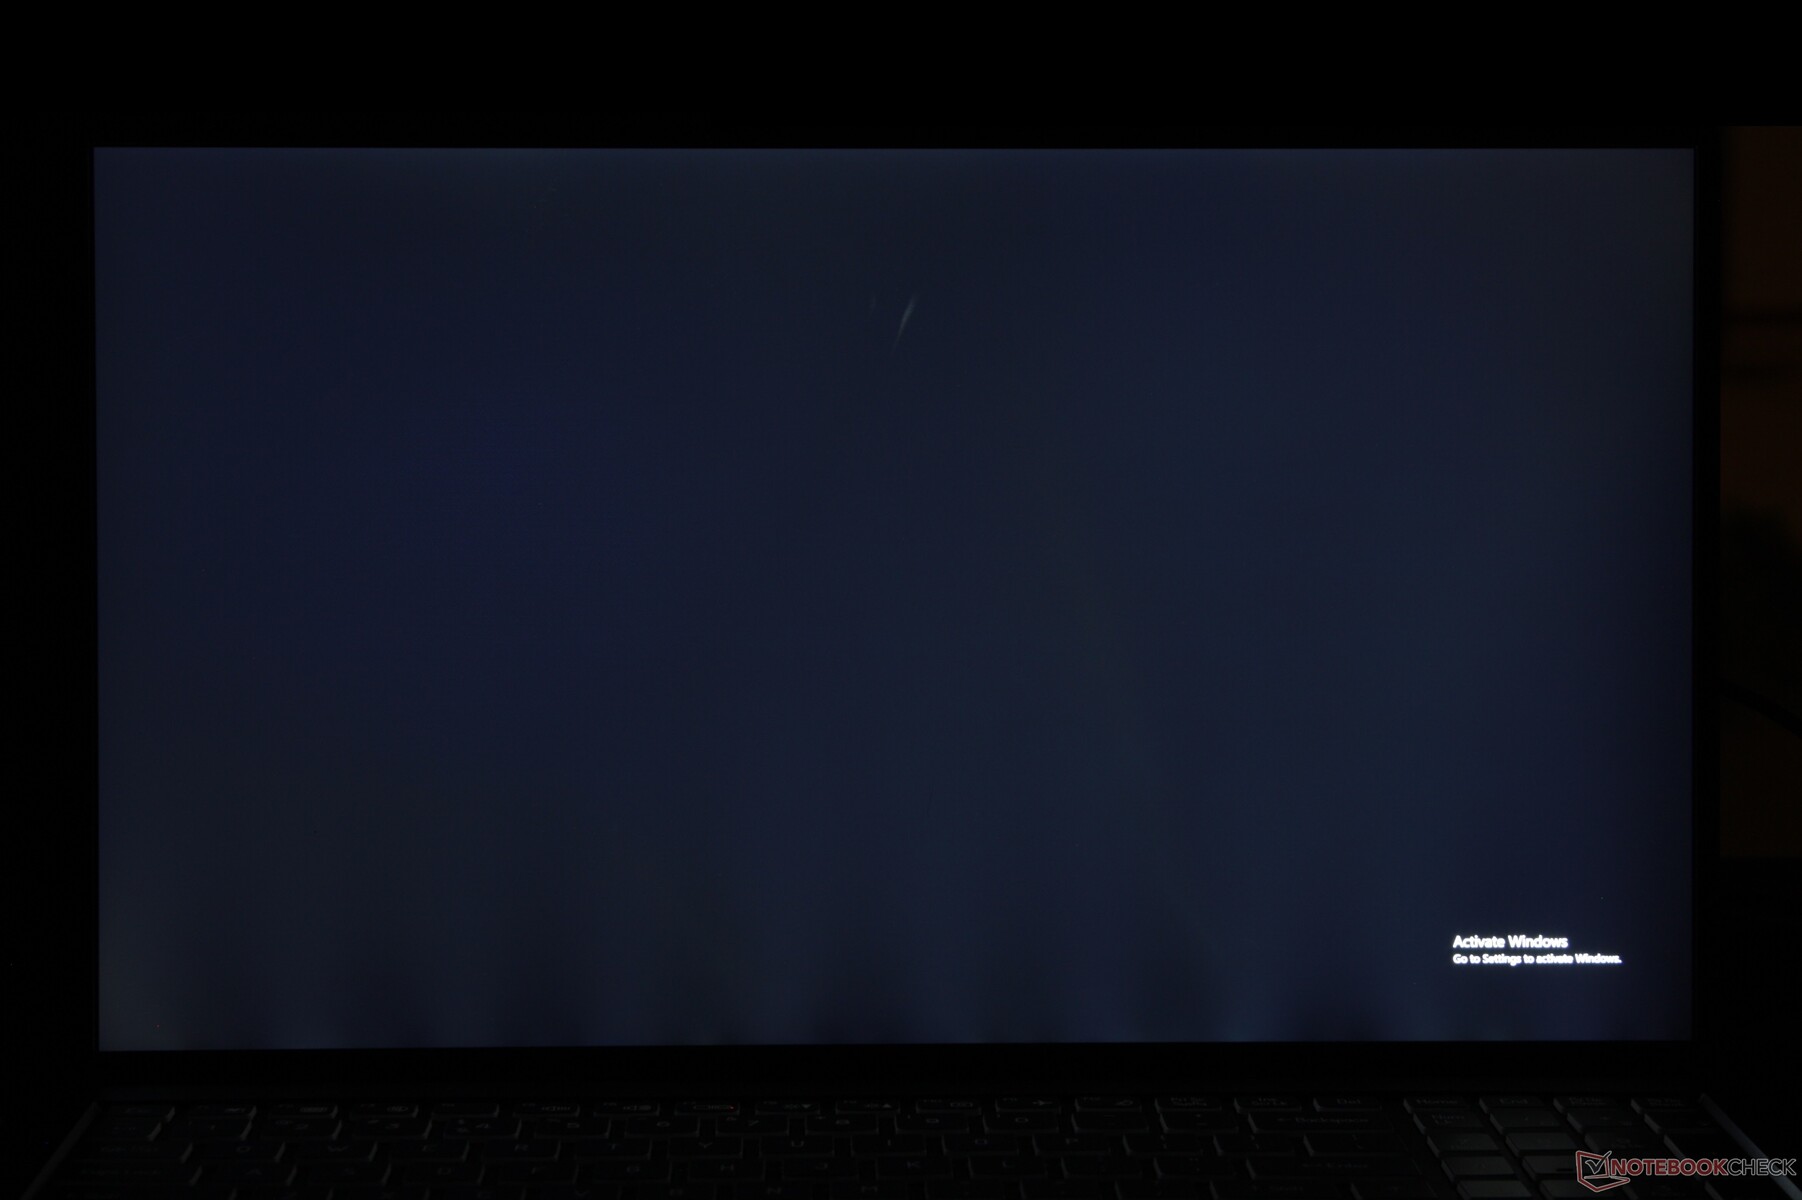
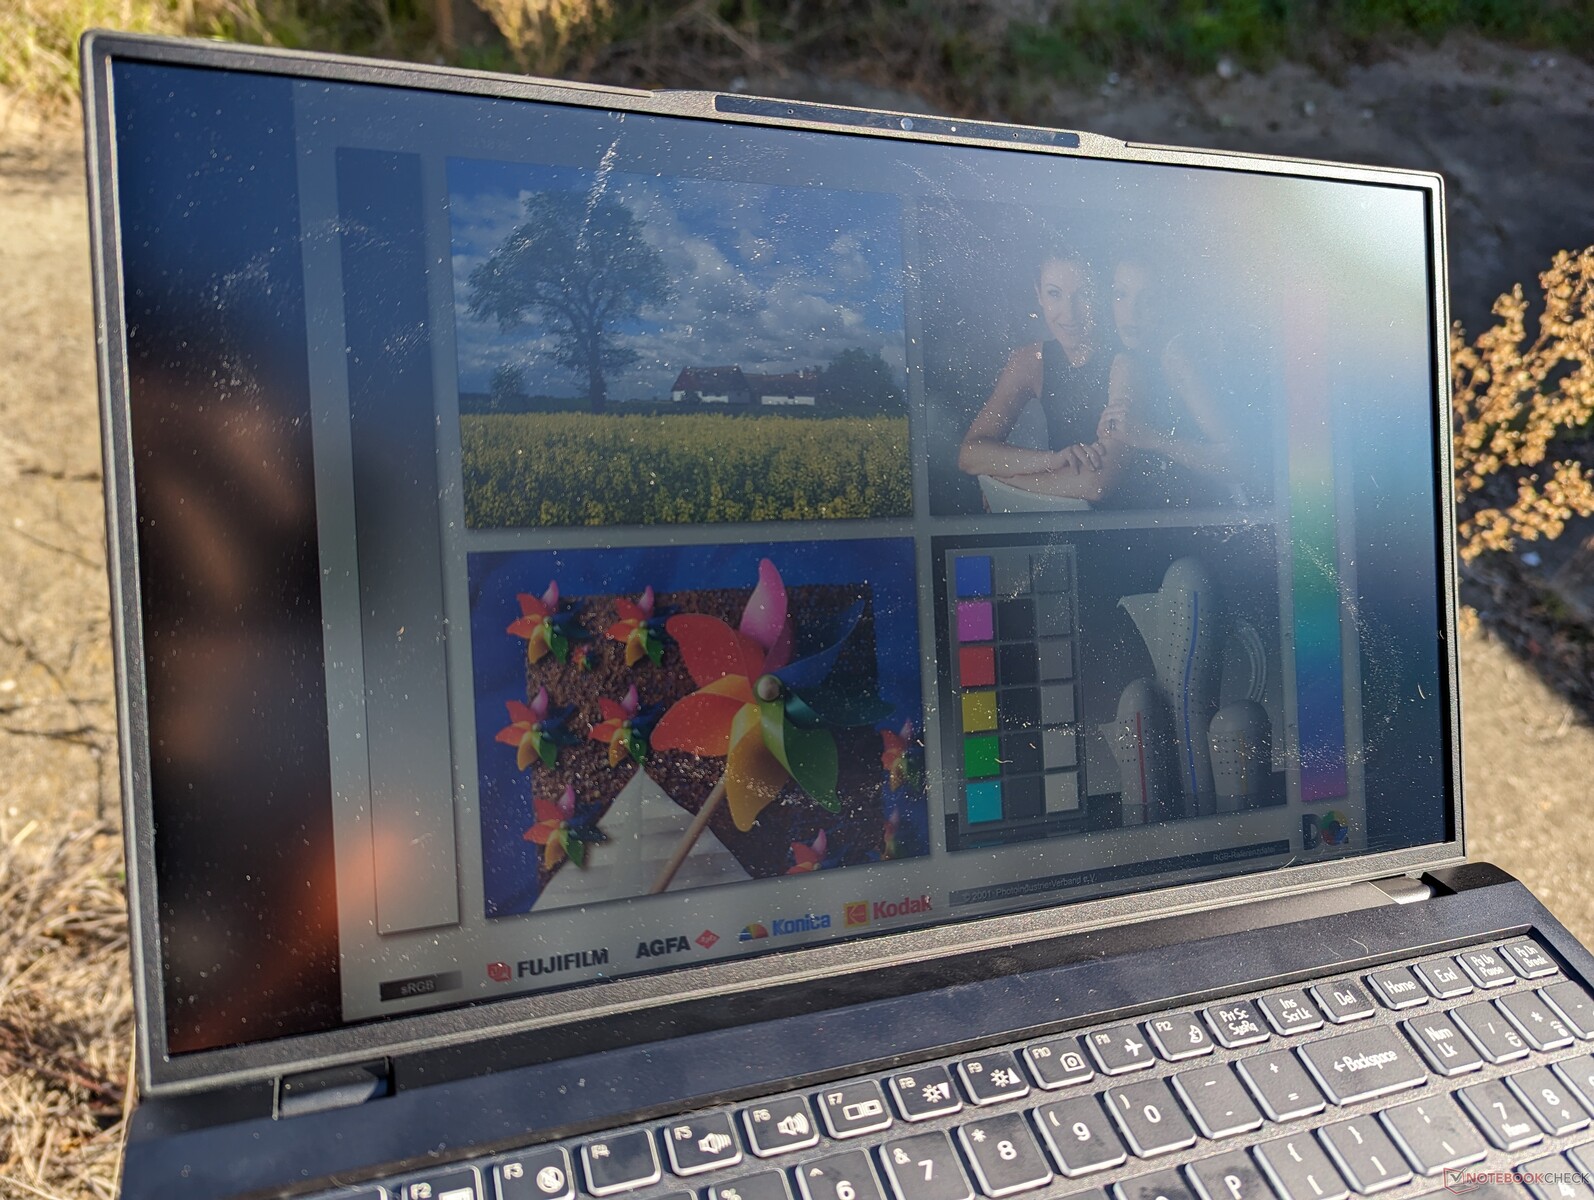
The screen on our specific review unit suffers from extreme backlight bleeding along the bottom edge as shown by the pictures below. We recommend double-checking your purchases to make sure that there are no screen issues.

| |||||||||||||||||||||||||
Brightness Distribution: 85 %
Center on Battery: 262.5 cd/m²
Contrast: 1050:1 (Black: 0.25 cd/m²)
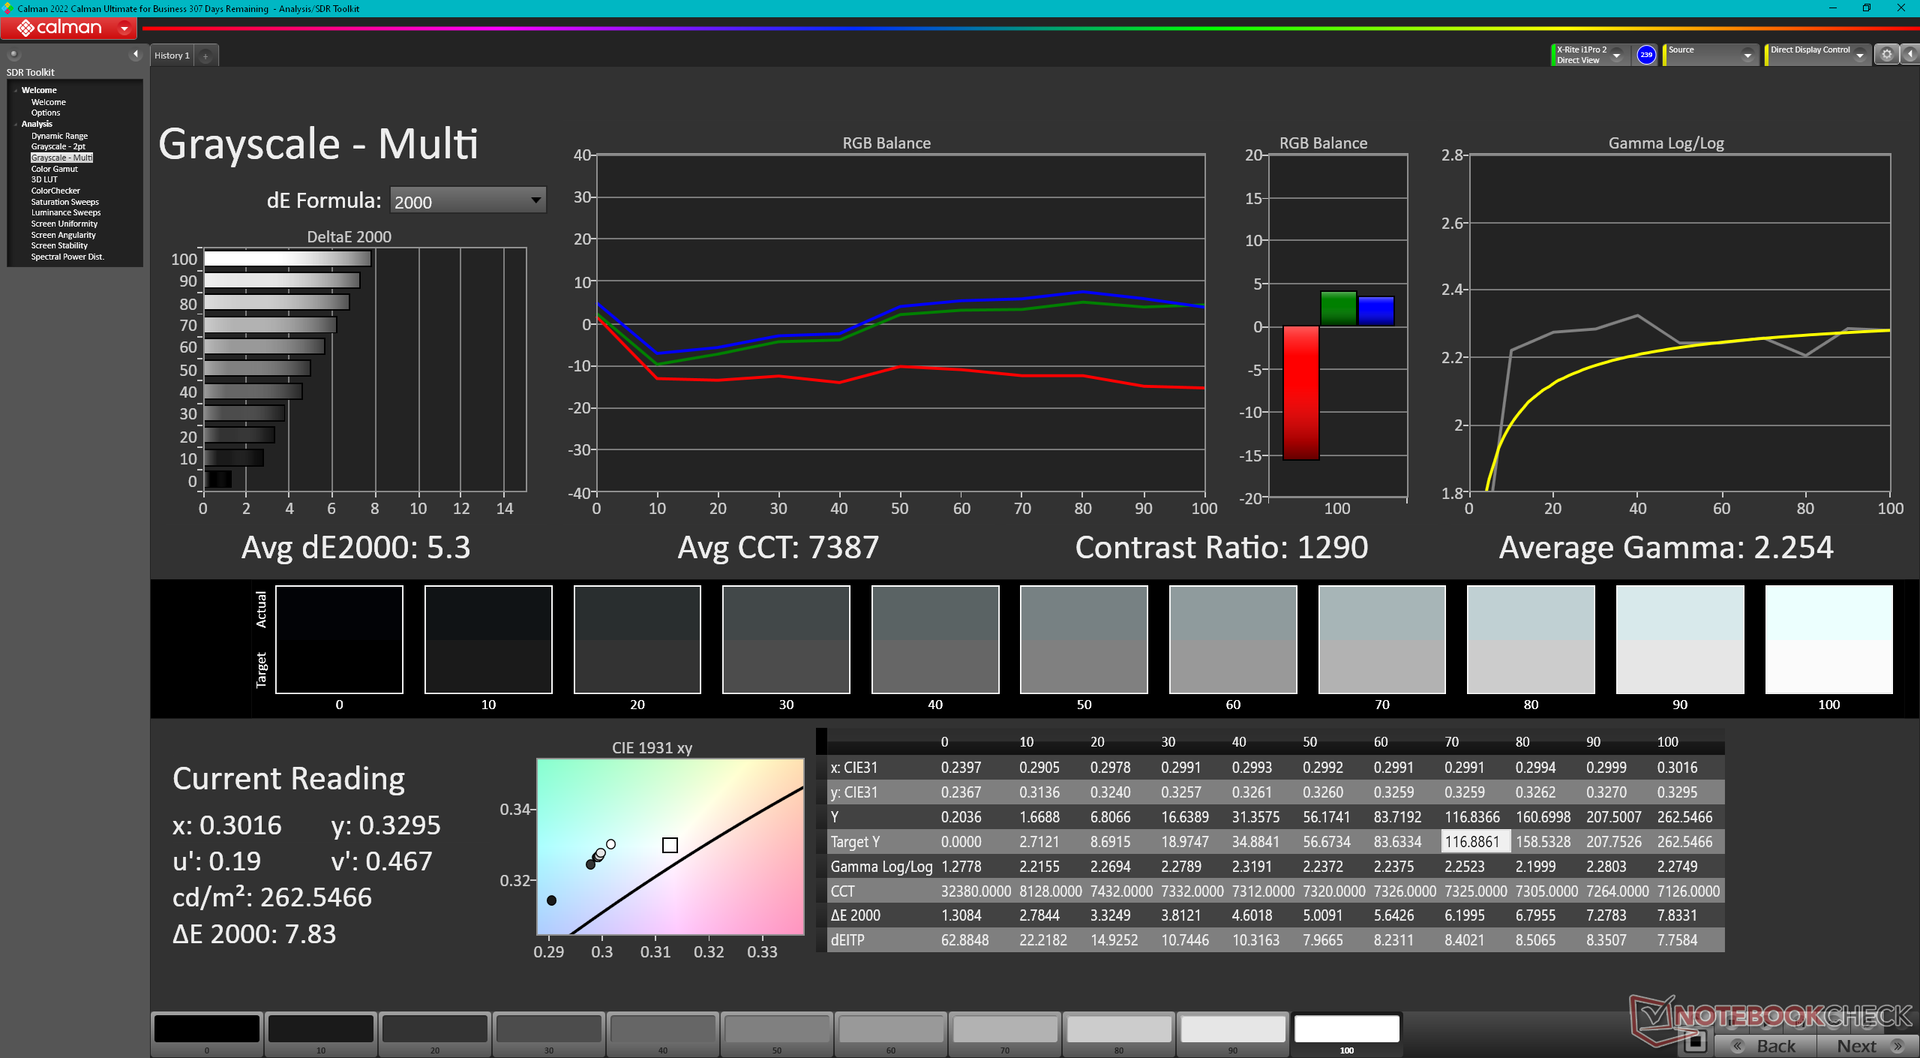
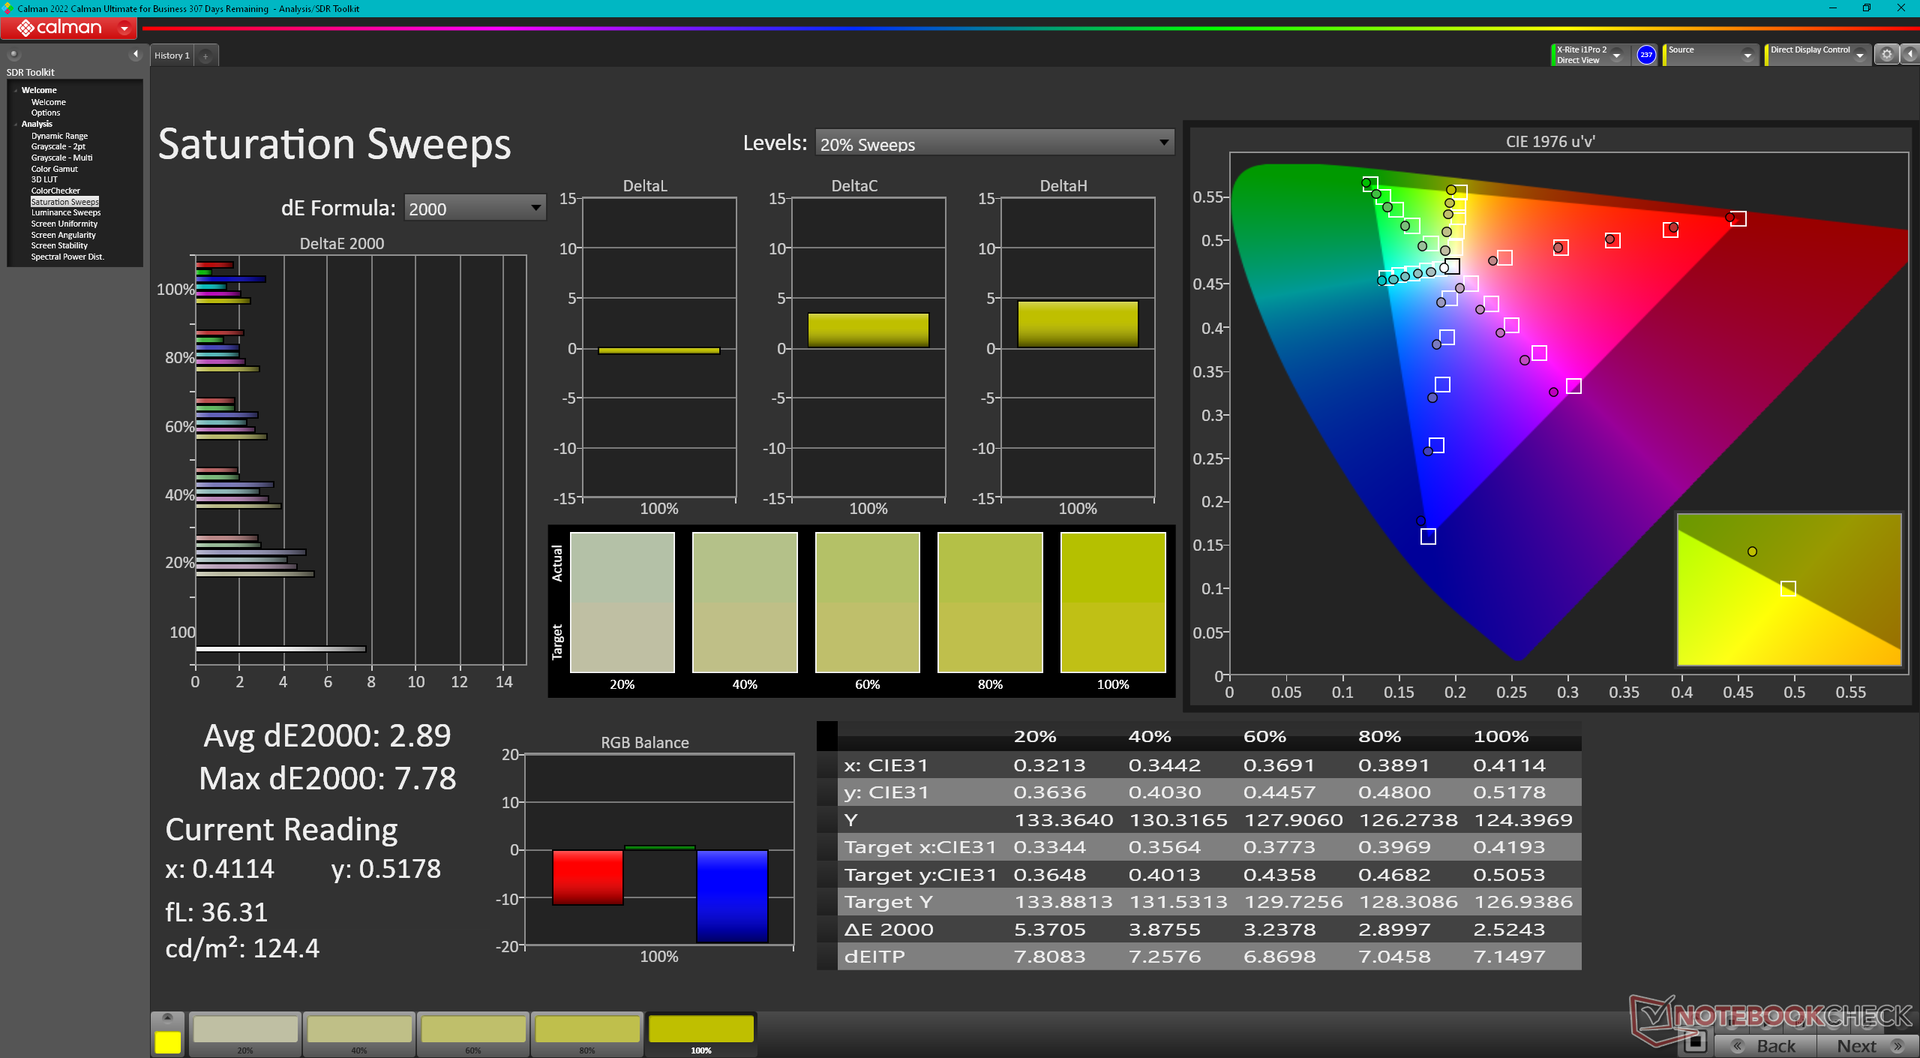
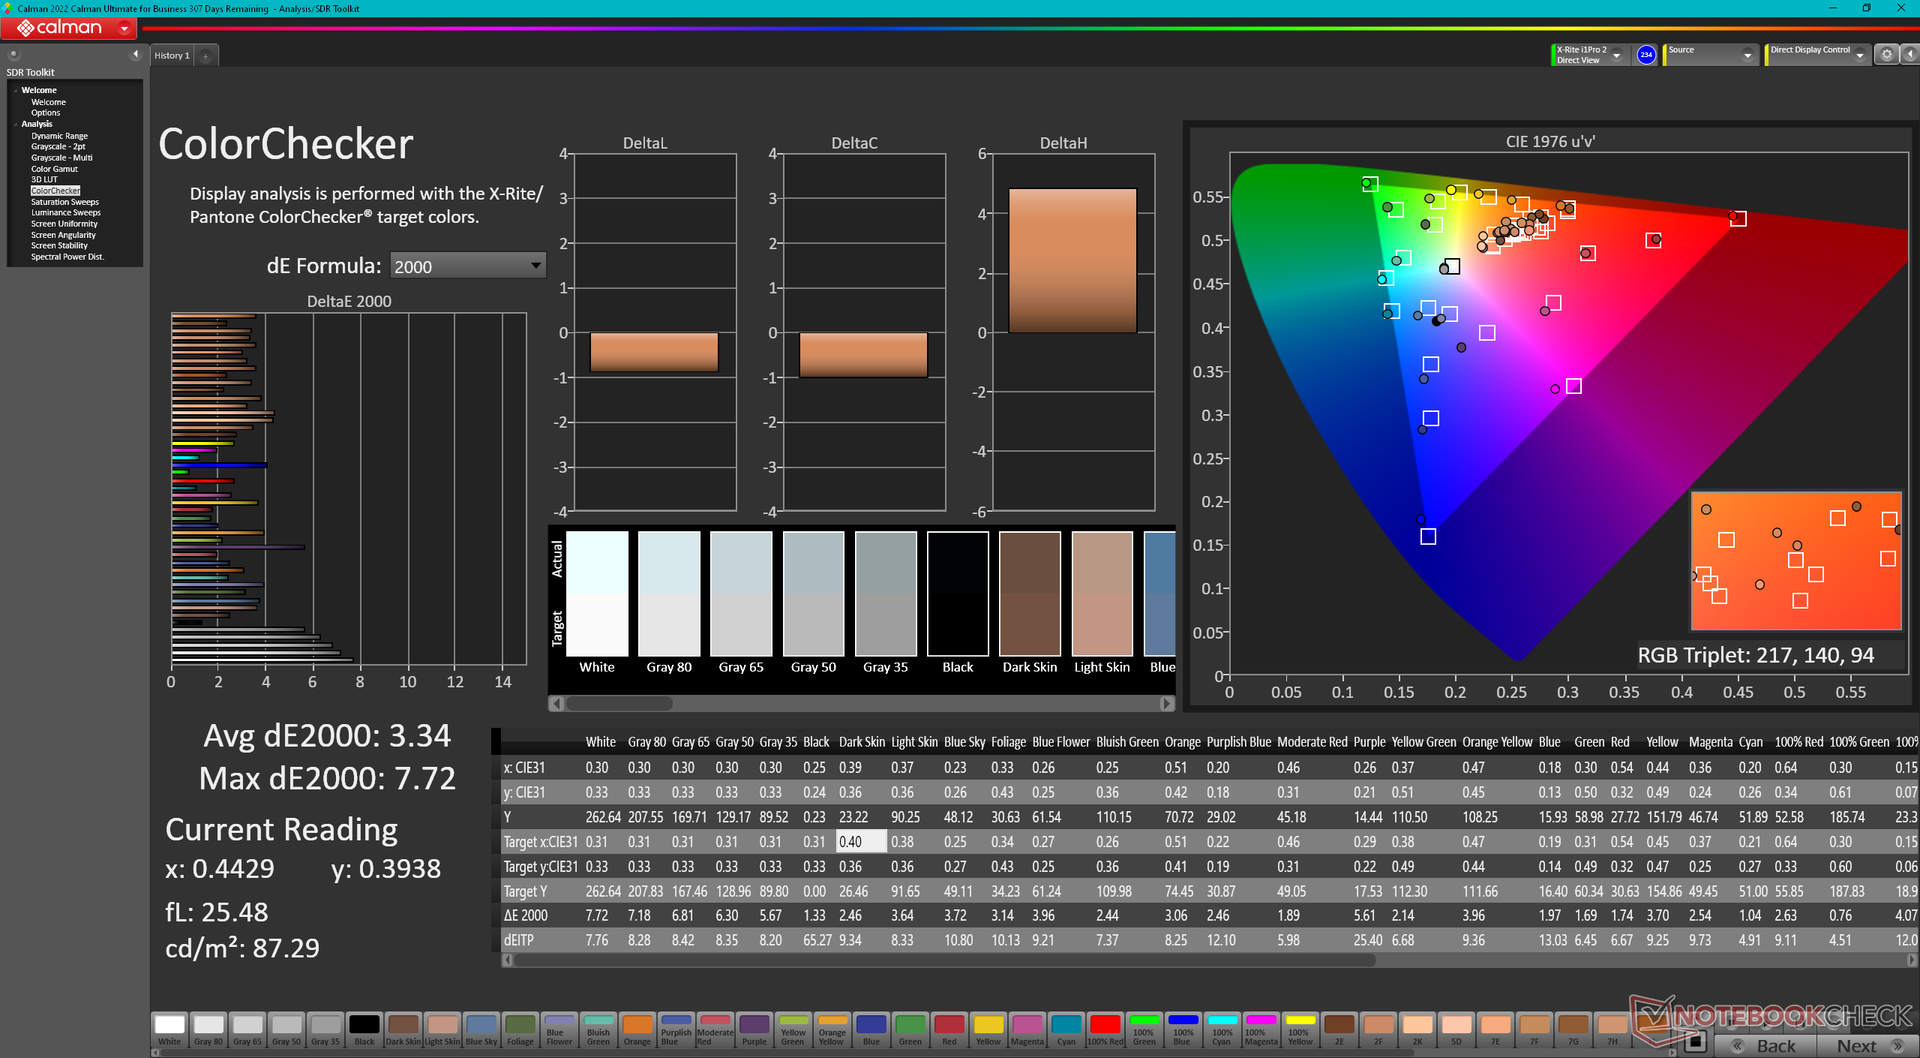
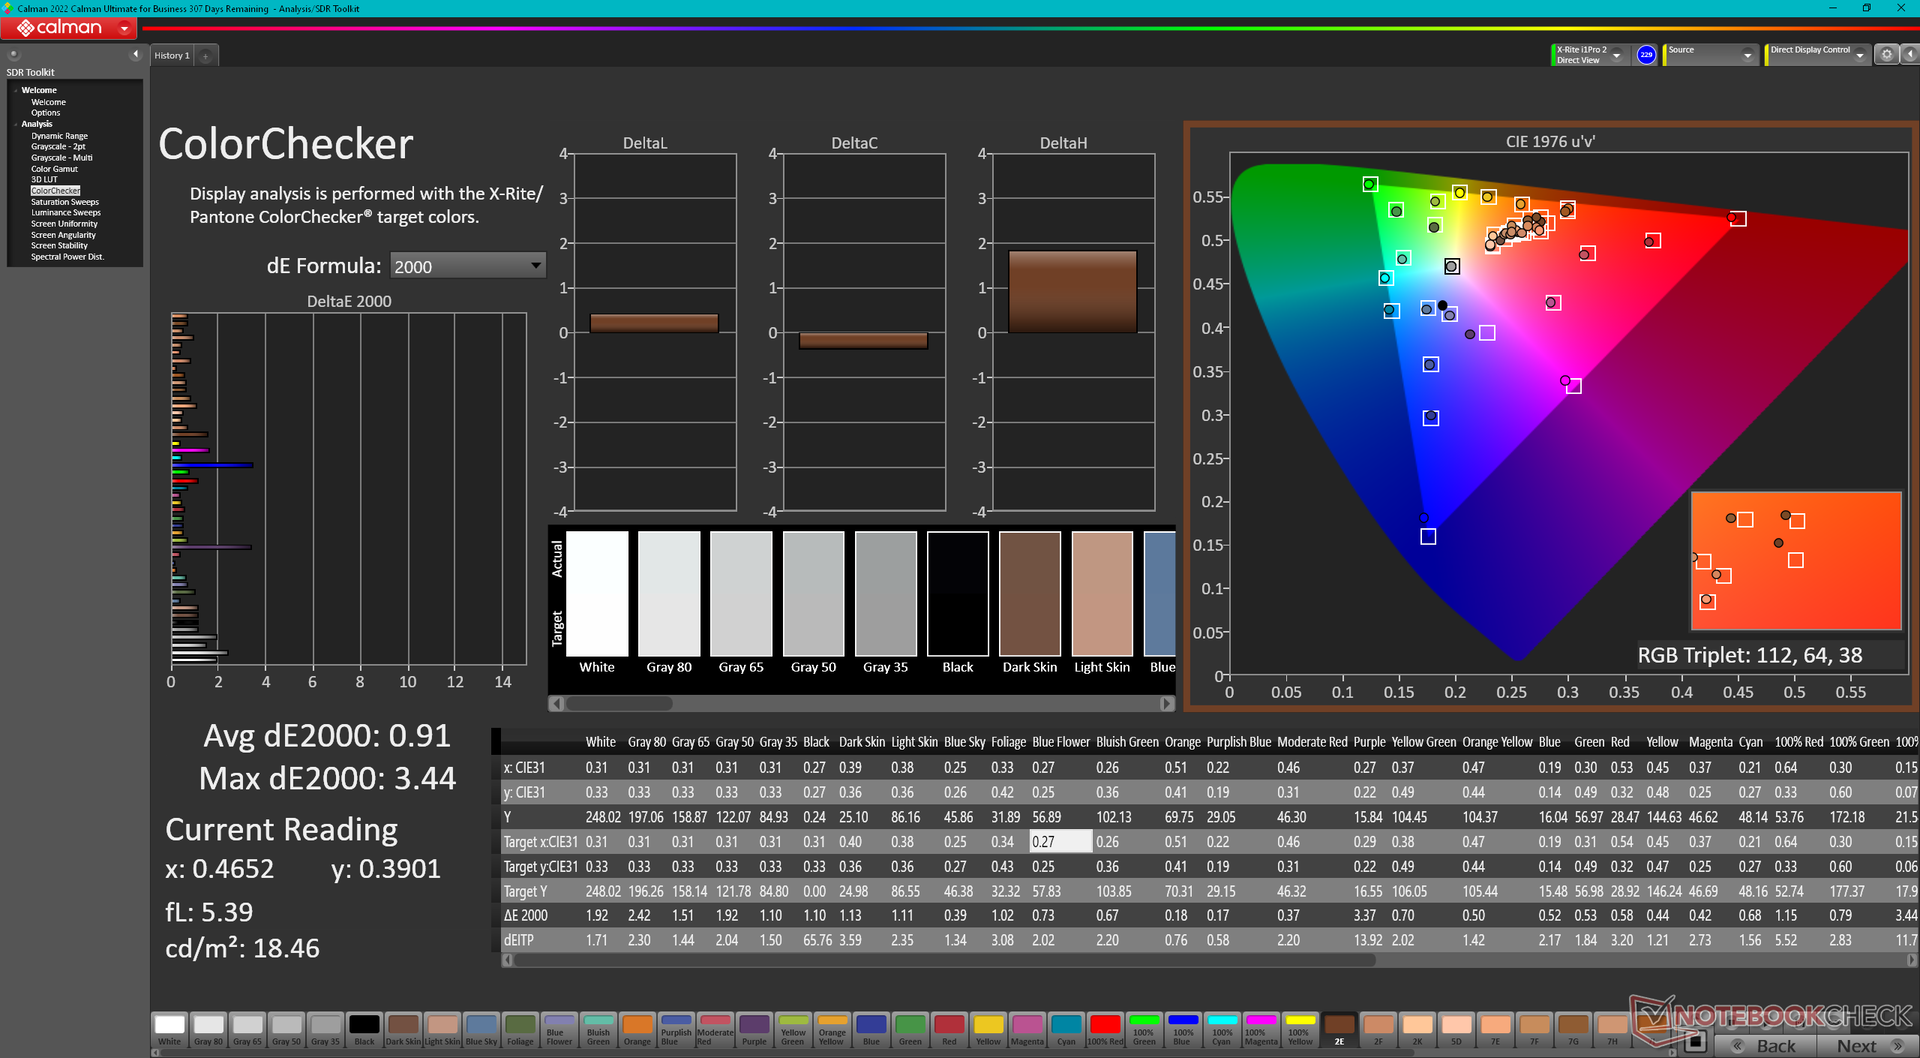
ΔE ColorChecker Calman: 3.34 | ∀{0.5-29.43 Ø4.71}
calibrated: 0.91
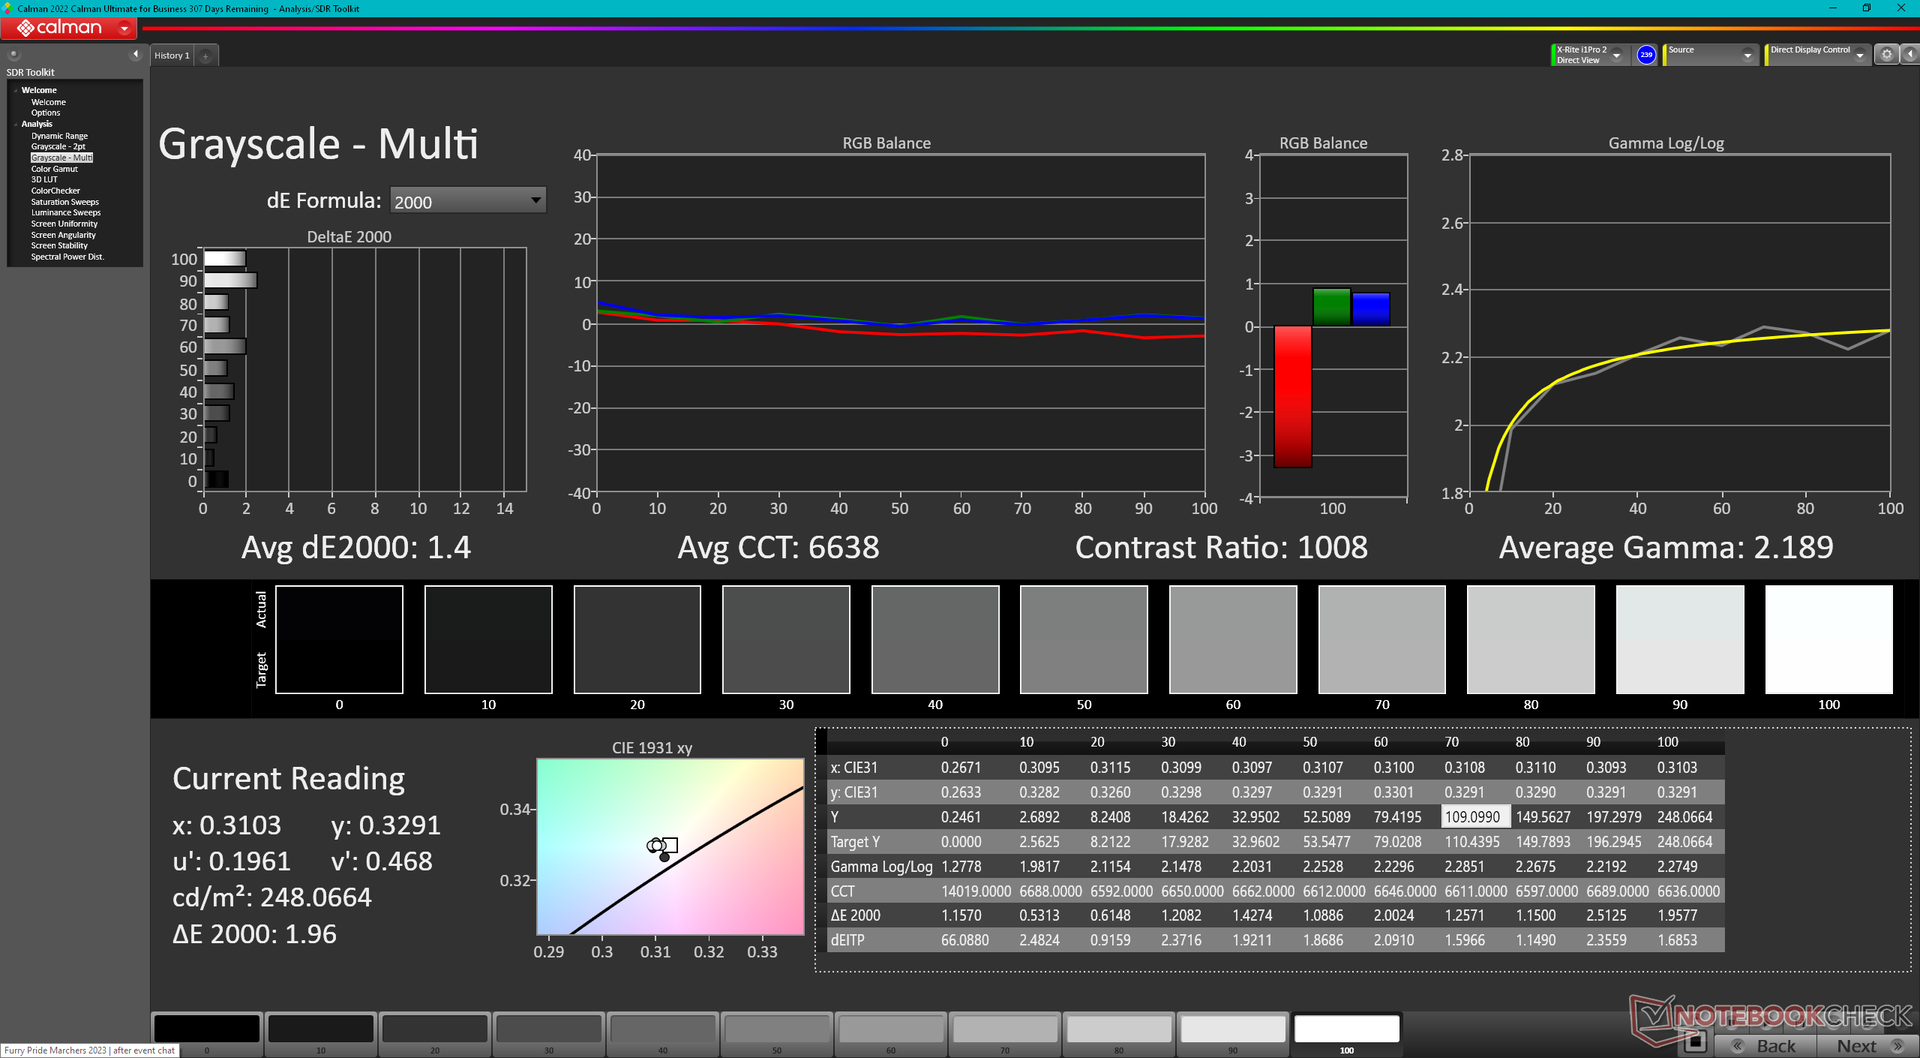
ΔE Greyscale Calman: 5.3 | ∀{0.09-98 Ø4.96}
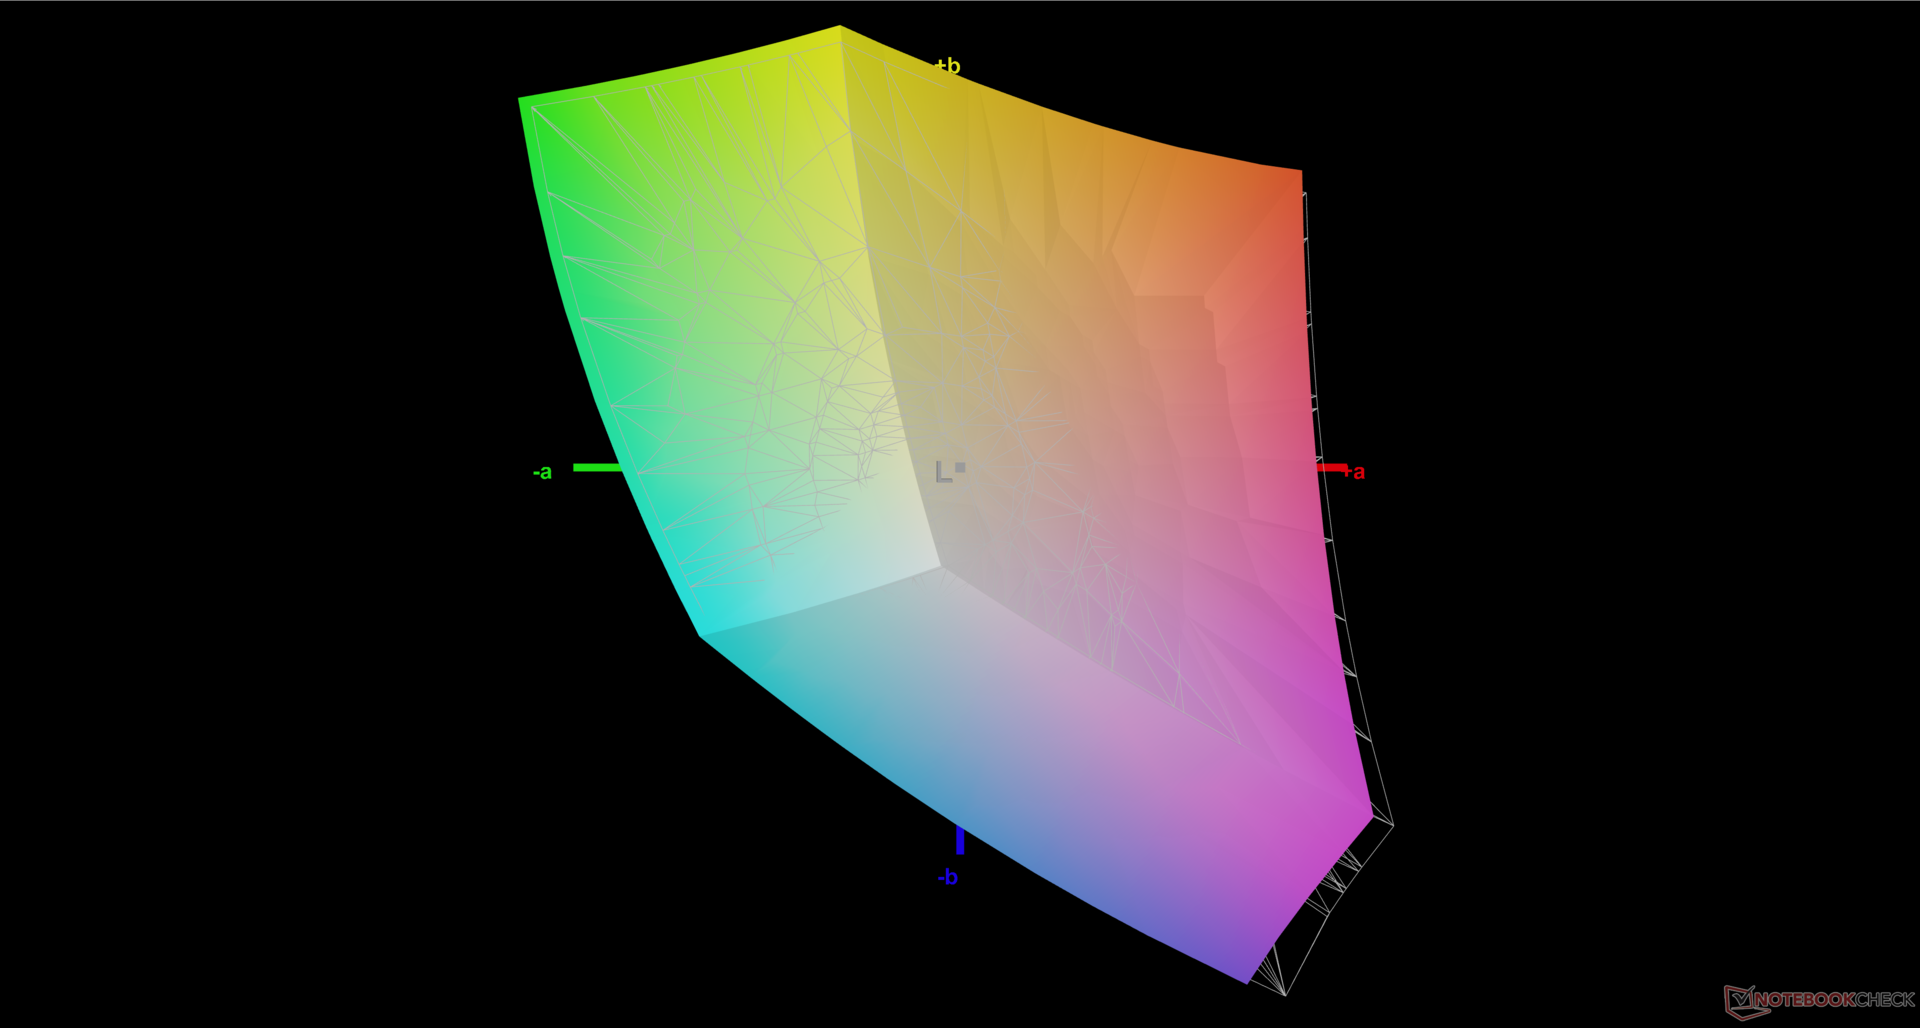
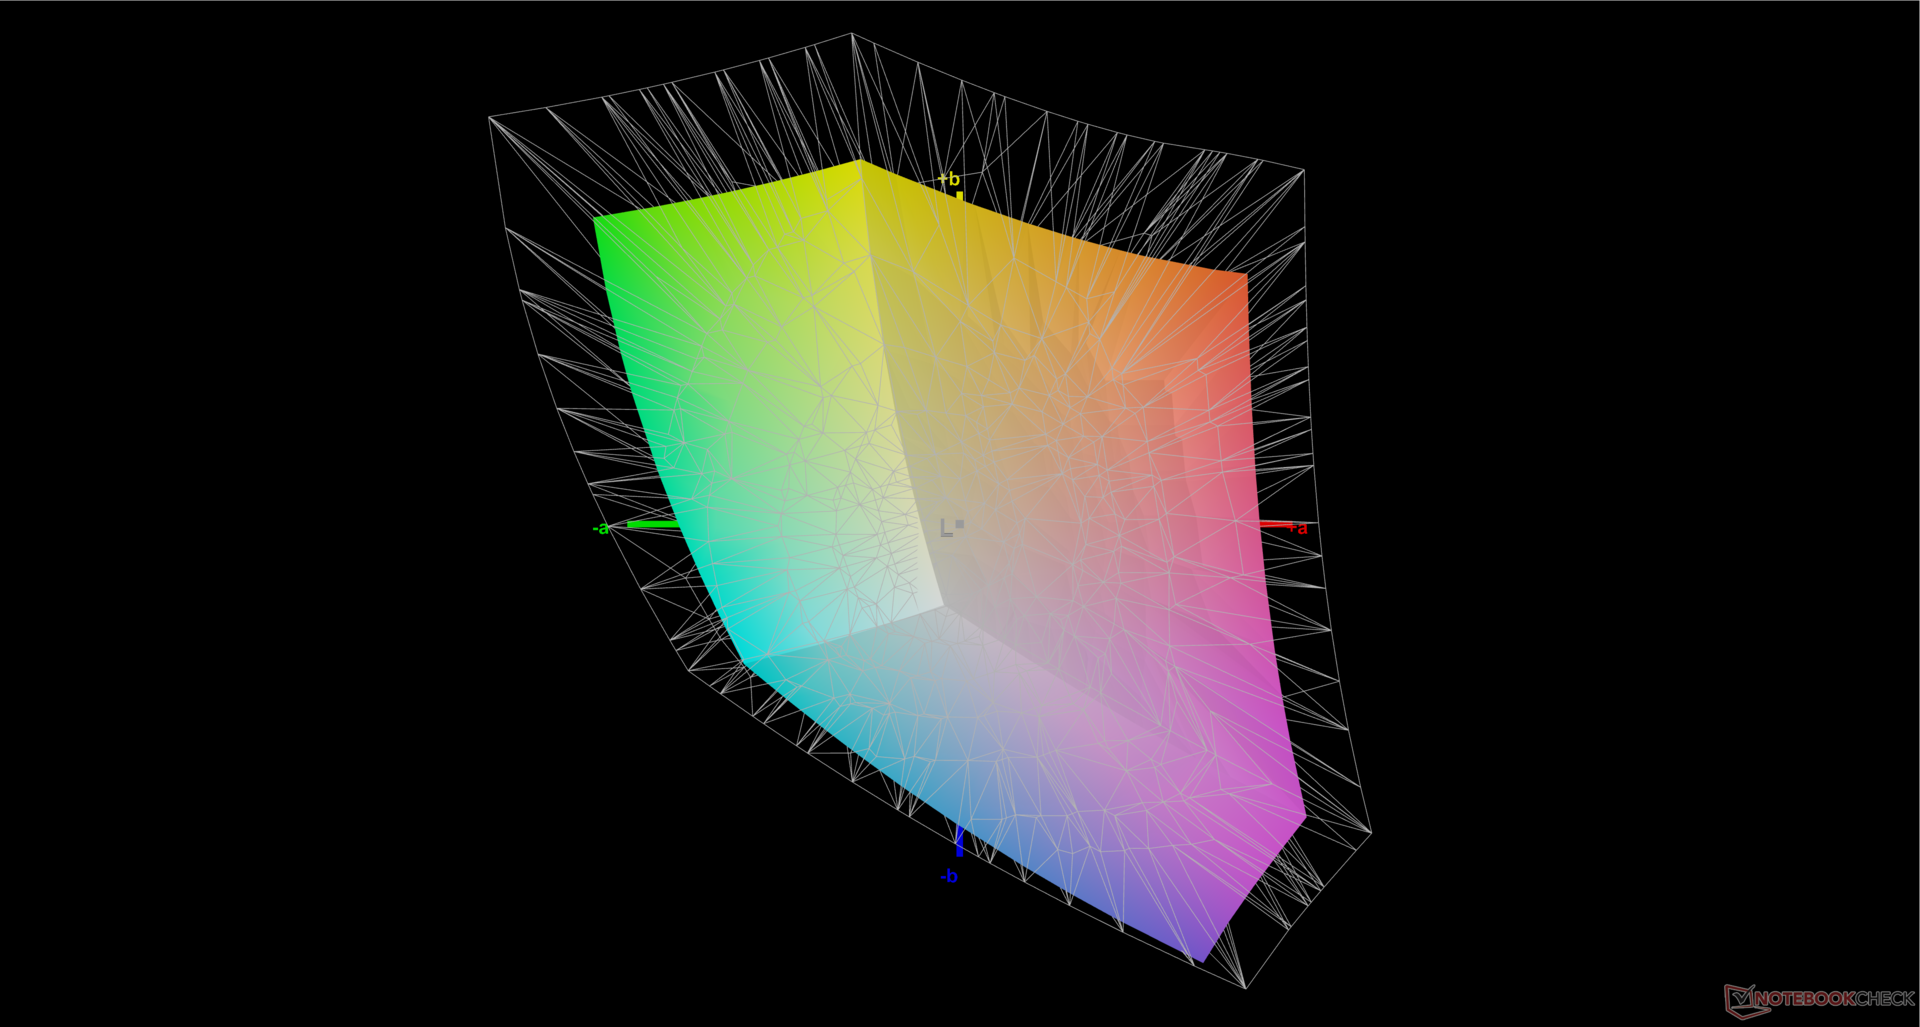
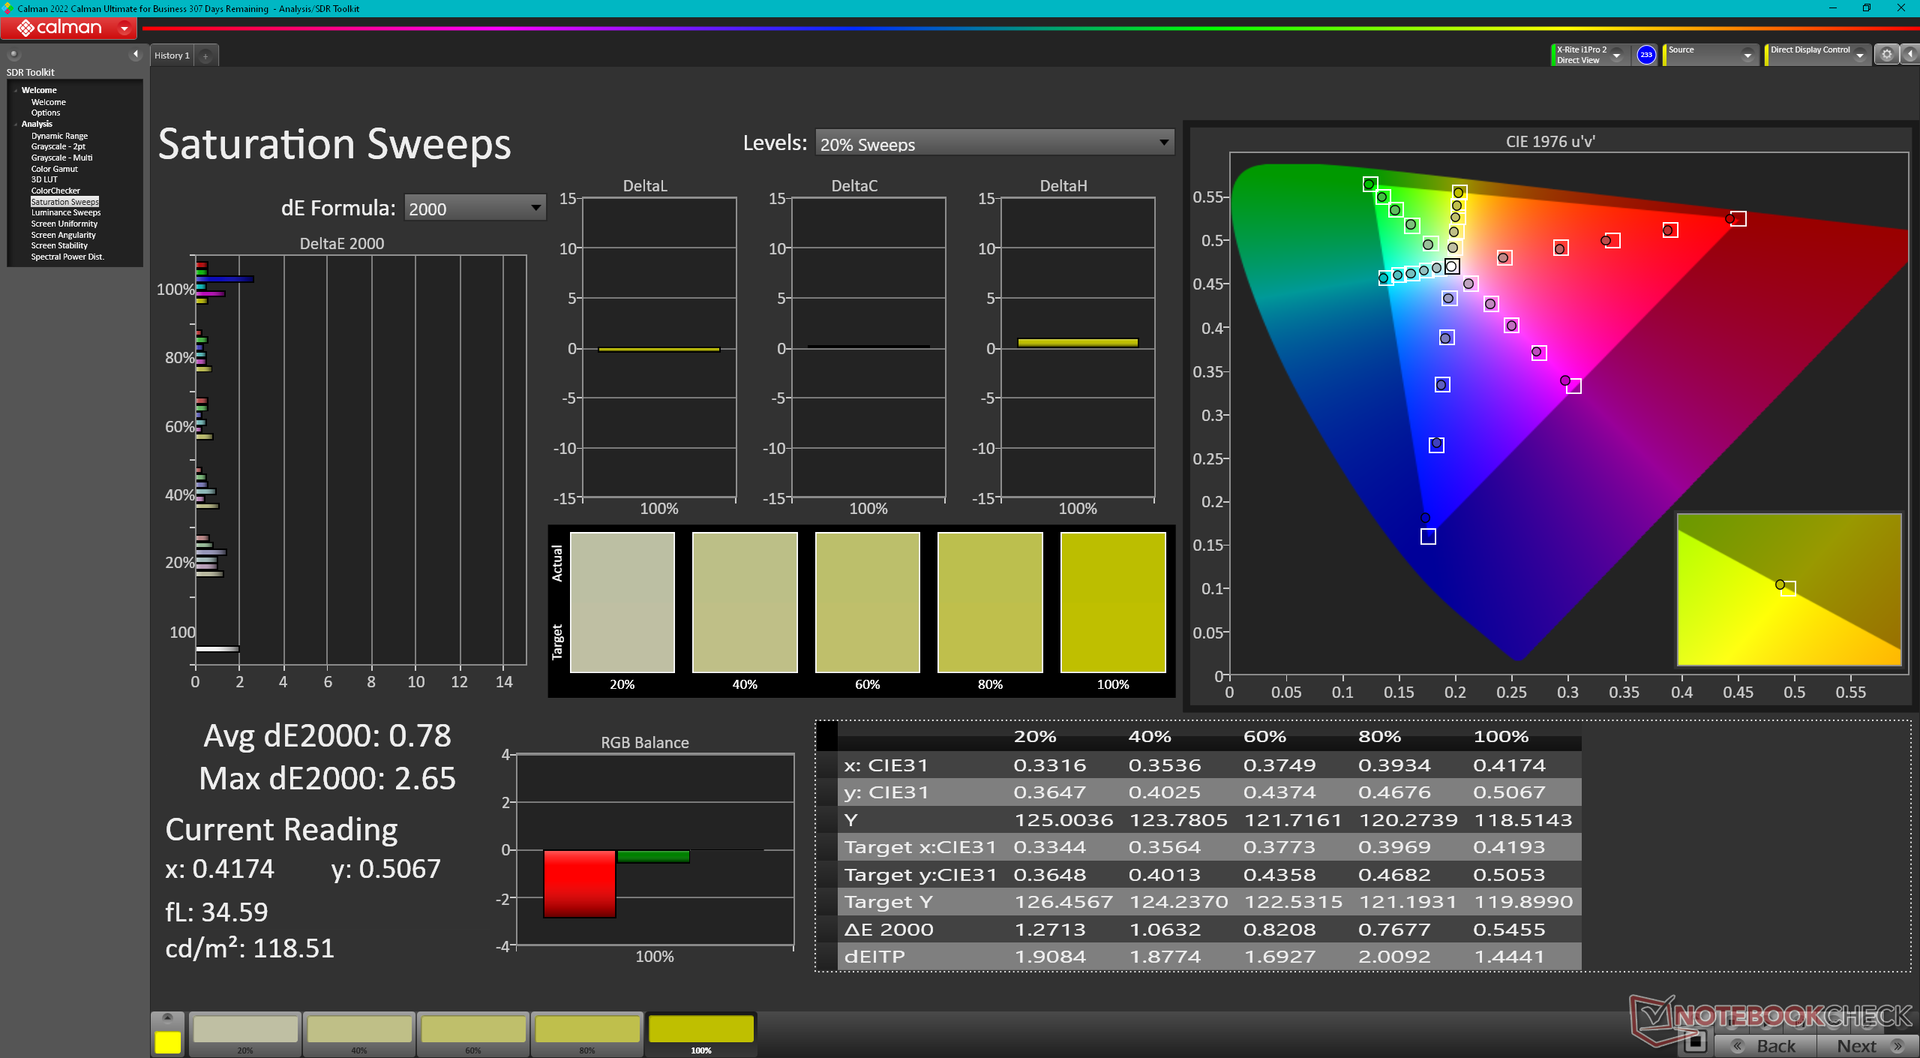
69.8% AdobeRGB 1998 (Argyll 3D)
96.5% sRGB (Argyll 3D)
67.7% Display P3 (Argyll 3D)
Gamma: 2.25
CCT: 7387 K
| Eurocom C315 Blitz BOE HF NE156QUM-N64, IPS, 3840x2160, 15.6" | Schenker Work 15 Tiger Lake-H BOE07D8, IPS, 1920x1080, 15.6" | Lenovo ThinkPad L15 Gen 4 21H70021GE N156HCA-E5B, IPS, 1920x1080, 15.6" | Acer Aspire 5 A515-58GM-76S8 LP156WFH-SPD5, IPS, 1920x1080, 15.6" | Asus VivoBook S15 M3502RA-L1029W Samsung SDC4161, OLED, 1920x1080, 15.6" | Samsung Galaxy Book2 15 NE156FHM-NS0, IPS, 1920x1080, 15.6" | |
|---|---|---|---|---|---|---|
| Display | -9% | -37% | -43% | 31% | -25% | |
| Display P3 Coverage (%) | 67.7 | 64.5 -5% | 41.8 -38% | 38.11 -44% | 99.9 48% | 49.6 -27% |
| sRGB Coverage (%) | 96.5 | 86.2 -11% | 62.5 -35% | 57.7 -40% | 100 4% | 74.8 -22% |
| AdobeRGB 1998 Coverage (%) | 69.8 | 62.9 -10% | 43.2 -38% | 39.41 -44% | 98.6 41% | 51.3 -27% |
| Response Times | -4% | 49% | 34% | 97% | 35% | |
| Response Time Grey 50% / Grey 80% * (ms) | 54.4 ? | 58.4 ? -7% | 24.4 ? 55% | 33.6 ? 38% | 0.74 99% | 32.3 ? 41% |
| Response Time Black / White * (ms) | 34.8 ? | 35.2 ? -1% | 19.7 ? 43% | 24.8 ? 29% | 2 ? 94% | 25 ? 28% |
| PWM Frequency (Hz) | 59 ? | |||||
| Screen | -25% | -53% | -77% | 8% | -42% | |
| Brightness middle (cd/m²) | 262.5 | 329 25% | 275 5% | 257.4 -2% | 378 44% | 337 28% |
| Brightness (cd/m²) | 260 | 316 22% | 252 -3% | 248 -5% | 378 45% | 325 25% |
| Brightness Distribution (%) | 85 | 92 8% | 84 -1% | 88 4% | 98 15% | 89 5% |
| Black Level * (cd/m²) | 0.25 | 0.3 -20% | 0.16 36% | 0.3209 -28% | 0.4 -60% | |
| Contrast (:1) | 1050 | 1097 4% | 1719 64% | 802 -24% | 843 -20% | |
| Colorchecker dE 2000 * | 3.34 | 5.4 -62% | 6.2 -86% | 6.26 -87% | 2.2 34% | 4.7 -41% |
| Colorchecker dE 2000 max. * | 7.72 | 10.1 -31% | 19.2 -149% | 18.28 -137% | 4.87 37% | 15.7 -103% |
| Colorchecker dE 2000 calibrated * | 0.91 | 2.5 -175% | 4.2 -362% | 4.99 -448% | 2.68 -195% | 2.8 -208% |
| Greyscale dE 2000 * | 5.3 | 5.1 4% | 4.1 23% | 3.7 30% | 1.43 73% | 5.4 -2% |
| Gamma | 2.25 98% | 2.1 105% | 1.91 115% | 2.186 101% | 2.47 89% | 2.07 106% |
| CCT | 7387 88% | 7609 85% | 6352 102% | 6606 98% | 6464 101% | 7727 84% |
| Total Average (Program / Settings) | -13% /
-19% | -14% /
-35% | -29% /
-54% | 45% /
28% | -11% /
-27% |
* ... smaller is better
The display does not come pre-calibrated. However, Eurocom offers calibration services as optional for users who don't have access to colorimeters. We're able to get average deltaE values down to <2 with our own X-Rite colorimeter.
Display Response Times
| ↔ Response Time Black to White | ||
|---|---|---|
| 34.8 ms ... rise ↗ and fall ↘ combined | ↗ 16.8 ms rise | 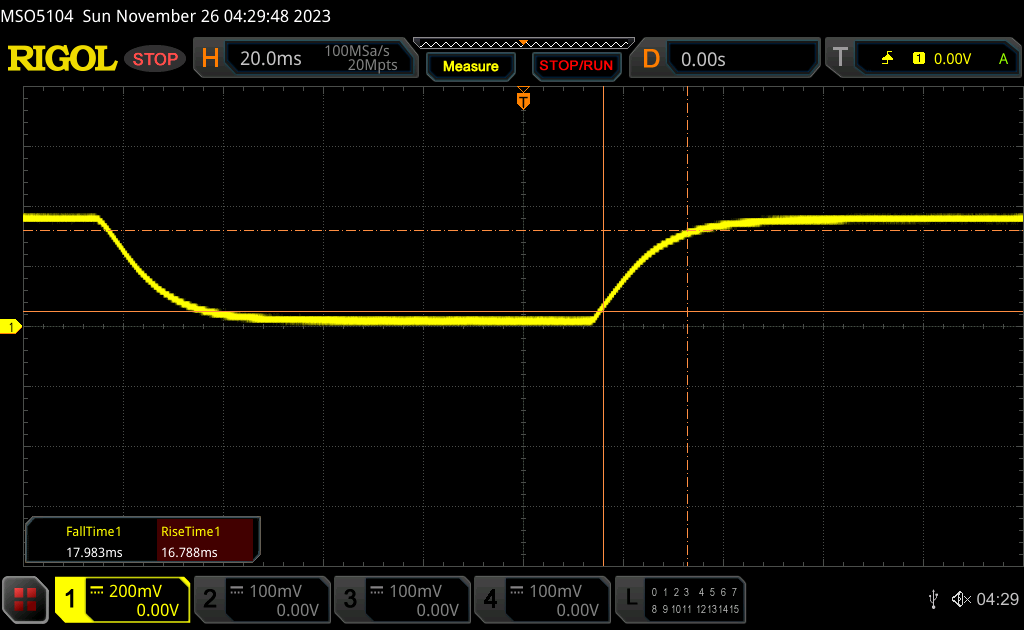 |
| ↘ 18 ms fall | ||
| The screen shows slow response rates in our tests and will be unsatisfactory for gamers. In comparison, all tested devices range from 0.1 (minimum) to 240 (maximum) ms. » 92 % of all devices are better. This means that the measured response time is worse than the average of all tested devices (19.8 ms). | ||
| ↔ Response Time 50% Grey to 80% Grey | ||
| 54.4 ms ... rise ↗ and fall ↘ combined | ↗ 25.3 ms rise |  |
| ↘ 29.1 ms fall | ||
| The screen shows slow response rates in our tests and will be unsatisfactory for gamers. In comparison, all tested devices range from 0.165 (minimum) to 636 (maximum) ms. » 91 % of all devices are better. This means that the measured response time is worse than the average of all tested devices (31 ms). | ||
Screen Flickering / PWM (Pulse-Width Modulation)
| Screen flickering / PWM not detected | 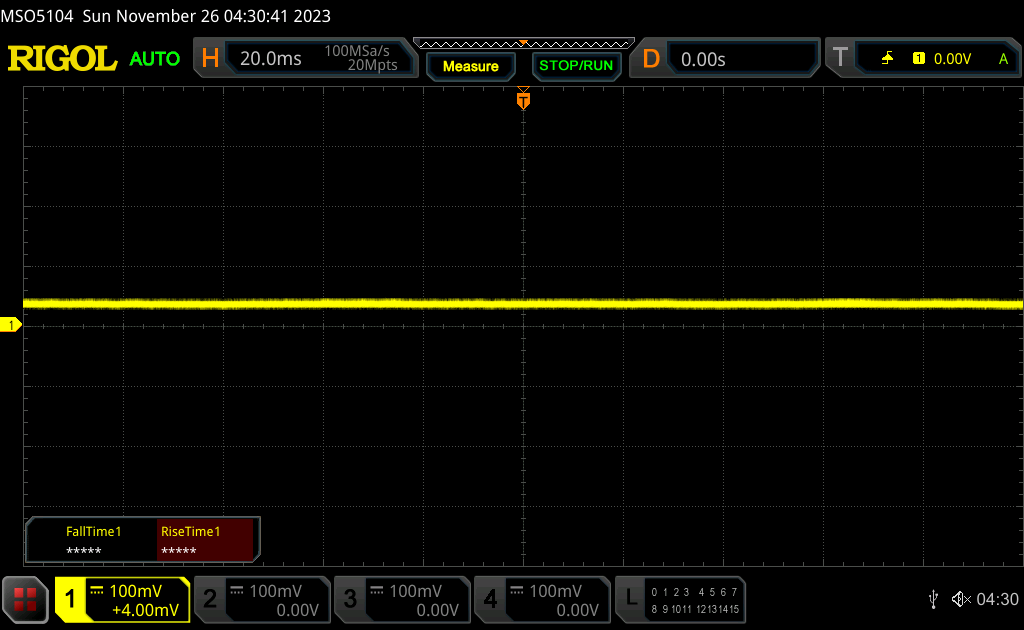 | ||
In comparison: 52 % of all tested devices do not use PWM to dim the display. If PWM was detected, an average of 7757 (minimum: 5 - maximum: 343500) Hz was measured. | |||
Performance
Testing Conditions
We set Windows to Performance mode prior to running the benchmarks below. The system includes no specialized "control center" software for adjusting any auxiliary features or additional power profiles.
Processor
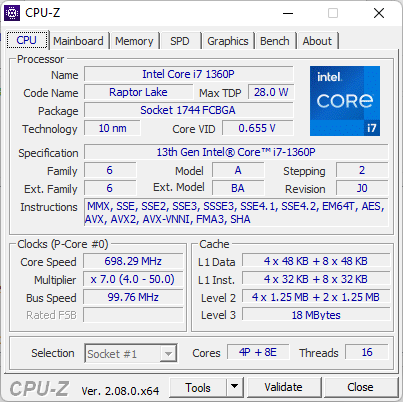
The Core i7-1360P is a bit of a mixed bag. On one hand, it offers similar performance to the older and more demanding Core i7-11370H in the Schenker Work 15. But on the other hand, it falls short of alternatives like the Core i7-1355U or Ryzen 7 5700U. It also suffers from throttling as our initial CineBench R15 xT score of 1079 points would drop by about 21 percent when running the benchmark in a loop.
The Core i7 CPU is definitely underperforming on our Eurocom. The Core i5-1340P in the Samsung Galaxy Book3 Pro 360 16, for example, would run 50 to 70 pervcent faster according to several multi-thread benchmarks.
Cinebench R15 Multi Loop
Cinebench R23: Multi Core | Single Core
Cinebench R20: CPU (Multi Core) | CPU (Single Core)
Cinebench R15: CPU Multi 64Bit | CPU Single 64Bit
Blender: v2.79 BMW27 CPU
7-Zip 18.03: 7z b 4 | 7z b 4 -mmt1
Geekbench 5.5: Multi-Core | Single-Core
HWBOT x265 Benchmark v2.2: 4k Preset
LibreOffice : 20 Documents To PDF
R Benchmark 2.5: Overall mean
* ... smaller is better
AIDA64: FP32 Ray-Trace | FPU Julia | CPU SHA3 | CPU Queen | FPU SinJulia | FPU Mandel | CPU AES | CPU ZLib | FP64 Ray-Trace | CPU PhotoWorxx
| Performance rating | |
| Asus VivoBook S15 M3502RA-L1029W | |
| Lenovo ThinkPad L15 Gen 4 21H70021GE | |
| Average Intel Core i7-1360P | |
| Acer Aspire 5 A515-58GM-76S8 | |
| Schenker Work 15 Tiger Lake-H | |
| Samsung Galaxy Book2 15 | |
| Eurocom C315 Blitz | |
| AIDA64 / FP32 Ray-Trace | |
| Asus VivoBook S15 M3502RA-L1029W | |
| Lenovo ThinkPad L15 Gen 4 21H70021GE | |
| Average Intel Core i7-1360P (5610 - 11188, n=17) | |
| Acer Aspire 5 A515-58GM-76S8 | |
| Schenker Work 15 Tiger Lake-H | |
| Samsung Galaxy Book2 15 | |
| Eurocom C315 Blitz | |
| AIDA64 / FPU Julia | |
| Asus VivoBook S15 M3502RA-L1029W | |
| Lenovo ThinkPad L15 Gen 4 21H70021GE | |
| Average Intel Core i7-1360P (29251 - 56942, n=16) | |
| Acer Aspire 5 A515-58GM-76S8 | |
| Schenker Work 15 Tiger Lake-H | |
| Eurocom C315 Blitz | |
| Samsung Galaxy Book2 15 | |
| AIDA64 / CPU SHA3 | |
| Asus VivoBook S15 M3502RA-L1029W | |
| Lenovo ThinkPad L15 Gen 4 21H70021GE | |
| Average Intel Core i7-1360P (1444 - 2728, n=16) | |
| Acer Aspire 5 A515-58GM-76S8 | |
| Schenker Work 15 Tiger Lake-H | |
| Eurocom C315 Blitz | |
| Samsung Galaxy Book2 15 | |
| AIDA64 / CPU Queen | |
| Asus VivoBook S15 M3502RA-L1029W | |
| Lenovo ThinkPad L15 Gen 4 21H70021GE | |
| Average Intel Core i7-1360P (65324 - 89266, n=16) | |
| Eurocom C315 Blitz | |
| Samsung Galaxy Book2 15 | |
| Acer Aspire 5 A515-58GM-76S8 | |
| Schenker Work 15 Tiger Lake-H | |
| AIDA64 / FPU SinJulia | |
| Asus VivoBook S15 M3502RA-L1029W | |
| Lenovo ThinkPad L15 Gen 4 21H70021GE | |
| Samsung Galaxy Book2 15 | |
| Average Intel Core i7-1360P (4370 - 7269, n=16) | |
| Acer Aspire 5 A515-58GM-76S8 | |
| Schenker Work 15 Tiger Lake-H | |
| Eurocom C315 Blitz | |
| AIDA64 / FPU Mandel | |
| Asus VivoBook S15 M3502RA-L1029W | |
| Lenovo ThinkPad L15 Gen 4 21H70021GE | |
| Average Intel Core i7-1360P (14104 - 28019, n=16) | |
| Acer Aspire 5 A515-58GM-76S8 | |
| Schenker Work 15 Tiger Lake-H | |
| Eurocom C315 Blitz | |
| Samsung Galaxy Book2 15 | |
| AIDA64 / CPU AES | |
| Asus VivoBook S15 M3502RA-L1029W | |
| Acer Aspire 5 A515-58GM-76S8 | |
| Schenker Work 15 Tiger Lake-H | |
| Average Intel Core i7-1360P (30391 - 99244, n=16) | |
| Lenovo ThinkPad L15 Gen 4 21H70021GE | |
| Samsung Galaxy Book2 15 | |
| Eurocom C315 Blitz | |
| AIDA64 / CPU ZLib | |
| Asus VivoBook S15 M3502RA-L1029W | |
| Lenovo ThinkPad L15 Gen 4 21H70021GE | |
| Samsung Galaxy Book2 15 | |
| Average Intel Core i7-1360P (420 - 807, n=16) | |
| Acer Aspire 5 A515-58GM-76S8 | |
| Eurocom C315 Blitz | |
| Schenker Work 15 Tiger Lake-H | |
| AIDA64 / FP64 Ray-Trace | |
| Asus VivoBook S15 M3502RA-L1029W | |
| Lenovo ThinkPad L15 Gen 4 21H70021GE | |
| Average Intel Core i7-1360P (2906 - 5957, n=16) | |
| Acer Aspire 5 A515-58GM-76S8 | |
| Schenker Work 15 Tiger Lake-H | |
| Samsung Galaxy Book2 15 | |
| Eurocom C315 Blitz | |
| AIDA64 / CPU PhotoWorxx | |
| Average Intel Core i7-1360P (29108 - 49328, n=16) | |
| Samsung Galaxy Book2 15 | |
| Eurocom C315 Blitz | |
| Schenker Work 15 Tiger Lake-H | |
| Asus VivoBook S15 M3502RA-L1029W | |
| Acer Aspire 5 A515-58GM-76S8 | |
| Lenovo ThinkPad L15 Gen 4 21H70021GE | |
System Performance
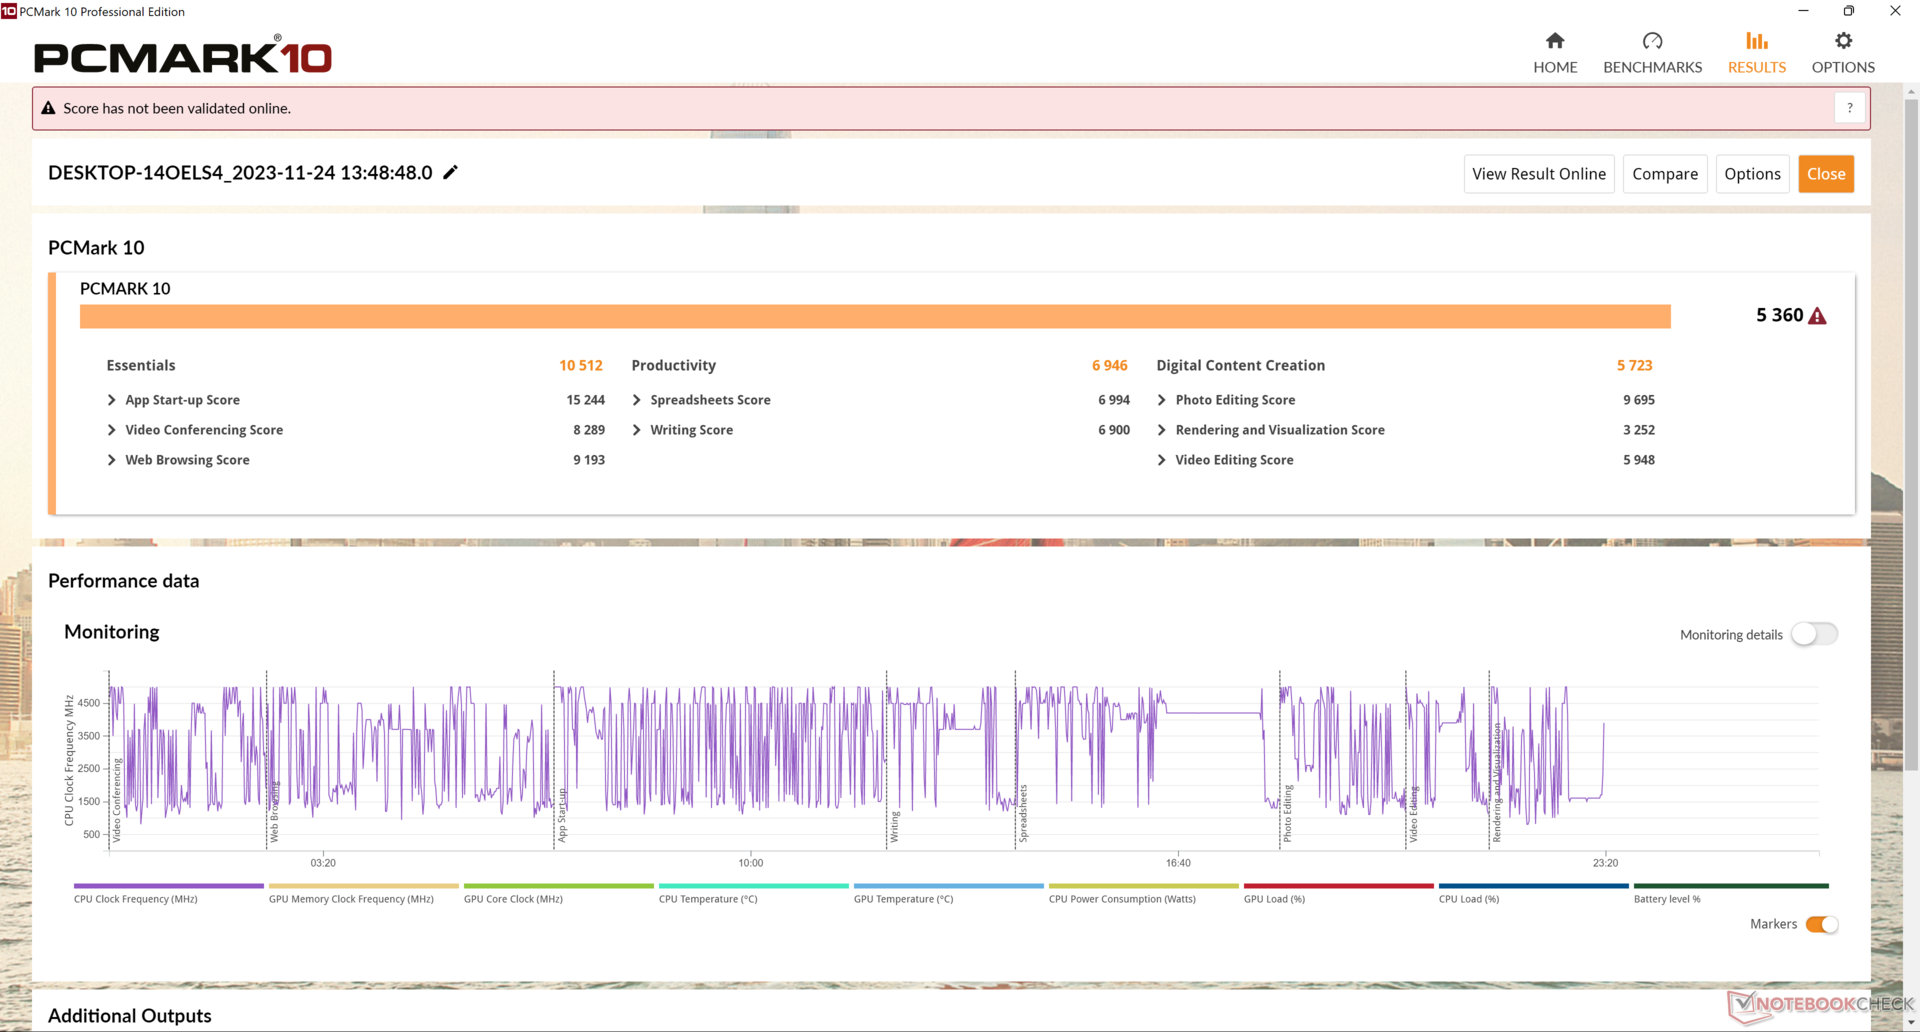
PCMark results are essentially identical to the Schenker Work 15 running on the older and more power-demanding Core i7-11370H.
CrossMark: Overall | Productivity | Creativity | Responsiveness
| PCMark 10 / Score | |
| Asus VivoBook S15 M3502RA-L1029W | |
| Acer Aspire 5 A515-58GM-76S8 | |
| Average Intel Core i7-1360P, Intel Iris Xe Graphics G7 96EUs (5360 - 6281, n=14) | |
| Samsung Galaxy Book2 15 | |
| Schenker Work 15 Tiger Lake-H | |
| Lenovo ThinkPad L15 Gen 4 21H70021GE | |
| Eurocom C315 Blitz | |
| PCMark 10 / Essentials | |
| Acer Aspire 5 A515-58GM-76S8 | |
| Average Intel Core i7-1360P, Intel Iris Xe Graphics G7 96EUs (9883 - 12059, n=14) | |
| Schenker Work 15 Tiger Lake-H | |
| Eurocom C315 Blitz | |
| Asus VivoBook S15 M3502RA-L1029W | |
| Lenovo ThinkPad L15 Gen 4 21H70021GE | |
| Samsung Galaxy Book2 15 | |
| PCMark 10 / Productivity | |
| Asus VivoBook S15 M3502RA-L1029W | |
| Lenovo ThinkPad L15 Gen 4 21H70021GE | |
| Acer Aspire 5 A515-58GM-76S8 | |
| Average Intel Core i7-1360P, Intel Iris Xe Graphics G7 96EUs (6572 - 8161, n=14) | |
| Schenker Work 15 Tiger Lake-H | |
| Eurocom C315 Blitz | |
| Samsung Galaxy Book2 15 | |
| PCMark 10 / Digital Content Creation | |
| Asus VivoBook S15 M3502RA-L1029W | |
| Acer Aspire 5 A515-58GM-76S8 | |
| Average Intel Core i7-1360P, Intel Iris Xe Graphics G7 96EUs (5723 - 7612, n=14) | |
| Samsung Galaxy Book2 15 | |
| Schenker Work 15 Tiger Lake-H | |
| Eurocom C315 Blitz | |
| Lenovo ThinkPad L15 Gen 4 21H70021GE | |
| CrossMark / Overall | |
| Eurocom C315 Blitz | |
| Acer Aspire 5 A515-58GM-76S8 | |
| Average Intel Core i7-1360P, Intel Iris Xe Graphics G7 96EUs (1527 - 1891, n=15) | |
| Asus VivoBook S15 M3502RA-L1029W | |
| Lenovo ThinkPad L15 Gen 4 21H70021GE | |
| CrossMark / Productivity | |
| Acer Aspire 5 A515-58GM-76S8 | |
| Eurocom C315 Blitz | |
| Average Intel Core i7-1360P, Intel Iris Xe Graphics G7 96EUs (1503 - 1842, n=15) | |
| Asus VivoBook S15 M3502RA-L1029W | |
| Lenovo ThinkPad L15 Gen 4 21H70021GE | |
| CrossMark / Creativity | |
| Eurocom C315 Blitz | |
| Average Intel Core i7-1360P, Intel Iris Xe Graphics G7 96EUs (1558 - 2003, n=15) | |
| Asus VivoBook S15 M3502RA-L1029W | |
| Acer Aspire 5 A515-58GM-76S8 | |
| Lenovo ThinkPad L15 Gen 4 21H70021GE | |
| CrossMark / Responsiveness | |
| Acer Aspire 5 A515-58GM-76S8 | |
| Eurocom C315 Blitz | |
| Average Intel Core i7-1360P, Intel Iris Xe Graphics G7 96EUs (1311 - 1899, n=15) | |
| Asus VivoBook S15 M3502RA-L1029W | |
| Lenovo ThinkPad L15 Gen 4 21H70021GE | |
| PCMark 10 Score | 5360 points | |
Help | ||
| AIDA64 / Memory Copy | |
| Eurocom C315 Blitz | |
| Samsung Galaxy Book2 15 | |
| Average Intel Core i7-1360P (44299 - 72748, n=16) | |
| Asus VivoBook S15 M3502RA-L1029W | |
| Schenker Work 15 Tiger Lake-H | |
| Acer Aspire 5 A515-58GM-76S8 | |
| Lenovo ThinkPad L15 Gen 4 21H70021GE | |
| AIDA64 / Memory Read | |
| Eurocom C315 Blitz | |
| Samsung Galaxy Book2 15 | |
| Average Intel Core i7-1360P (44751 - 68945, n=16) | |
| Asus VivoBook S15 M3502RA-L1029W | |
| Schenker Work 15 Tiger Lake-H | |
| Acer Aspire 5 A515-58GM-76S8 | |
| Lenovo ThinkPad L15 Gen 4 21H70021GE | |
| AIDA64 / Memory Write | |
| Eurocom C315 Blitz | |
| Average Intel Core i7-1360P (45887 - 93331, n=16) | |
| Samsung Galaxy Book2 15 | |
| Asus VivoBook S15 M3502RA-L1029W | |
| Schenker Work 15 Tiger Lake-H | |
| Acer Aspire 5 A515-58GM-76S8 | |
| Lenovo ThinkPad L15 Gen 4 21H70021GE | |
| AIDA64 / Memory Latency | |
| Lenovo ThinkPad L15 Gen 4 21H70021GE | |
| Average Intel Core i7-1360P (85 - 110.5, n=16) | |
| Asus VivoBook S15 M3502RA-L1029W | |
| Eurocom C315 Blitz | |
| Schenker Work 15 Tiger Lake-H | |
| Acer Aspire 5 A515-58GM-76S8 | |
| Samsung Galaxy Book2 15 | |
* ... smaller is better
DPC Latency
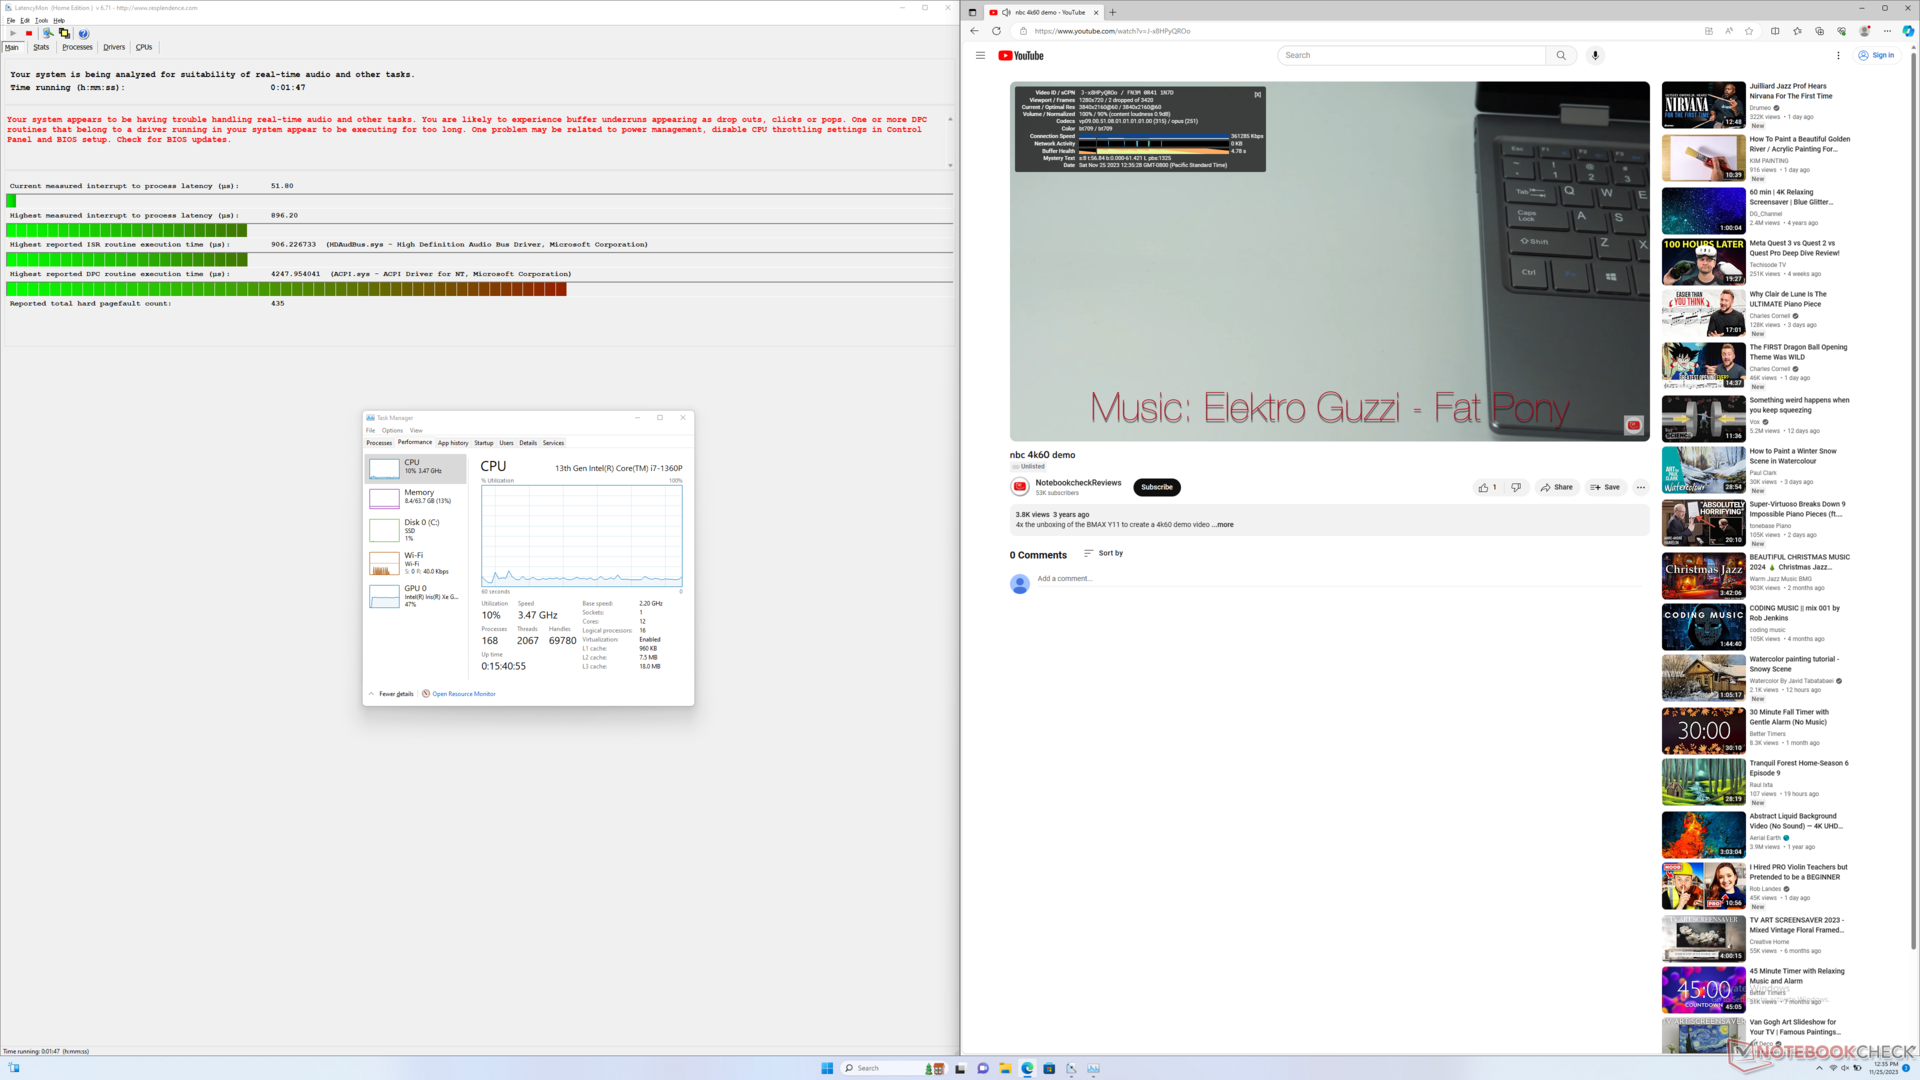
LatencyMon reveals DPC issues when opening multiple browser tabs of our homepage. 4K video playback at 60 FPS is excellent with just two dropped frames recorded during a one-minute timespan.

| DPC Latencies / LatencyMon - interrupt to process latency (max), Web, Youtube, Prime95 | |
| Lenovo ThinkPad L15 Gen 4 21H70021GE | |
| Schenker Work 15 Tiger Lake-H | |
| Acer Aspire 5 A515-58GM-76S8 | |
| Eurocom C315 Blitz | |
| Samsung Galaxy Book2 15 | |
| Asus VivoBook S15 M3502RA-L1029W | |
* ... smaller is better
Storage Devices
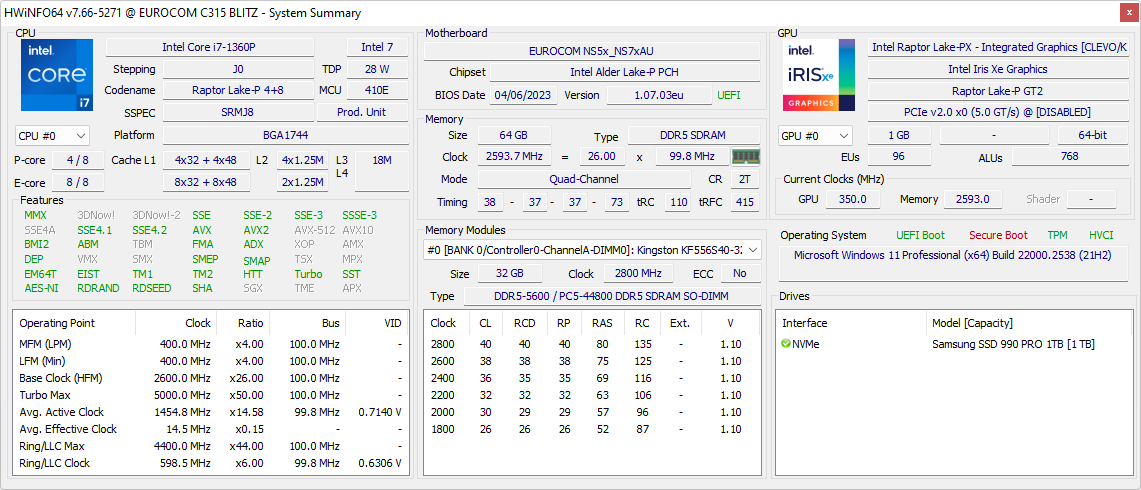
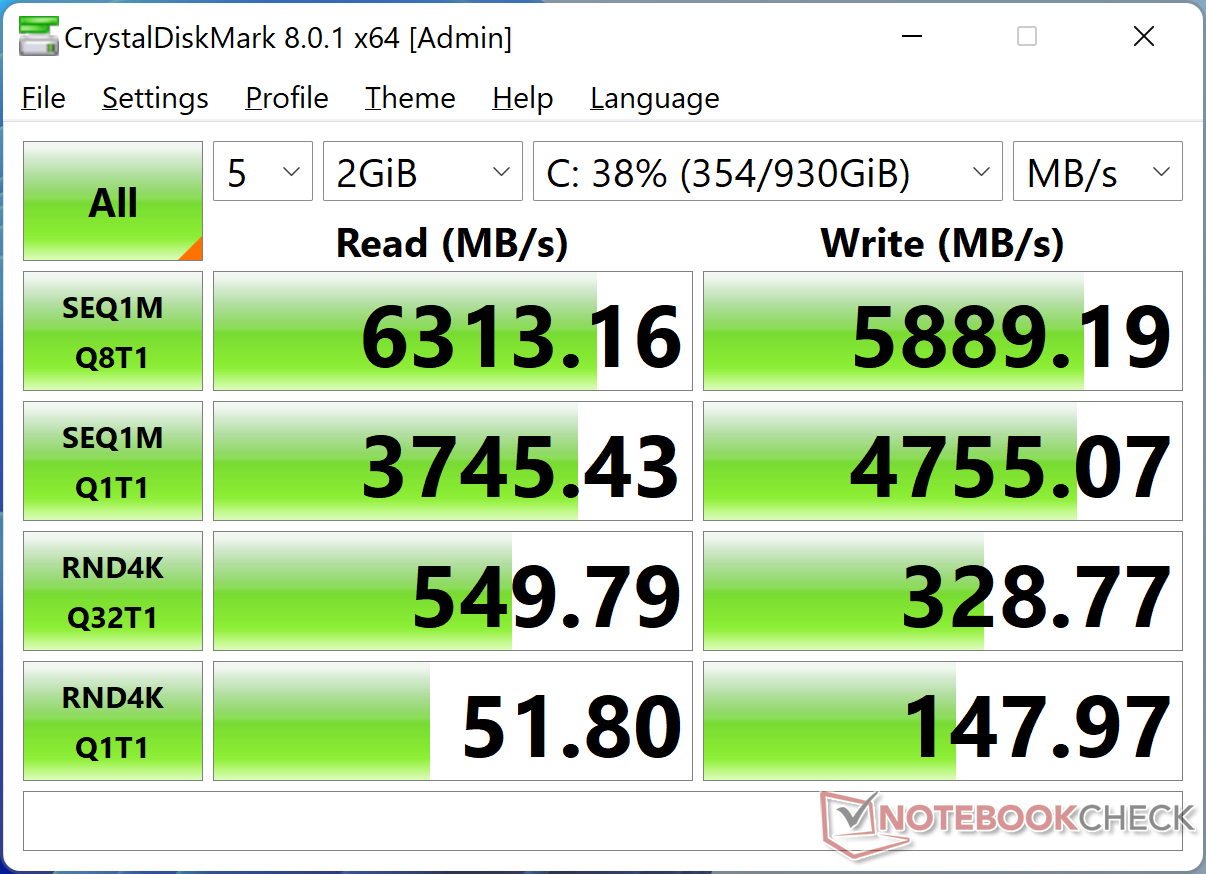
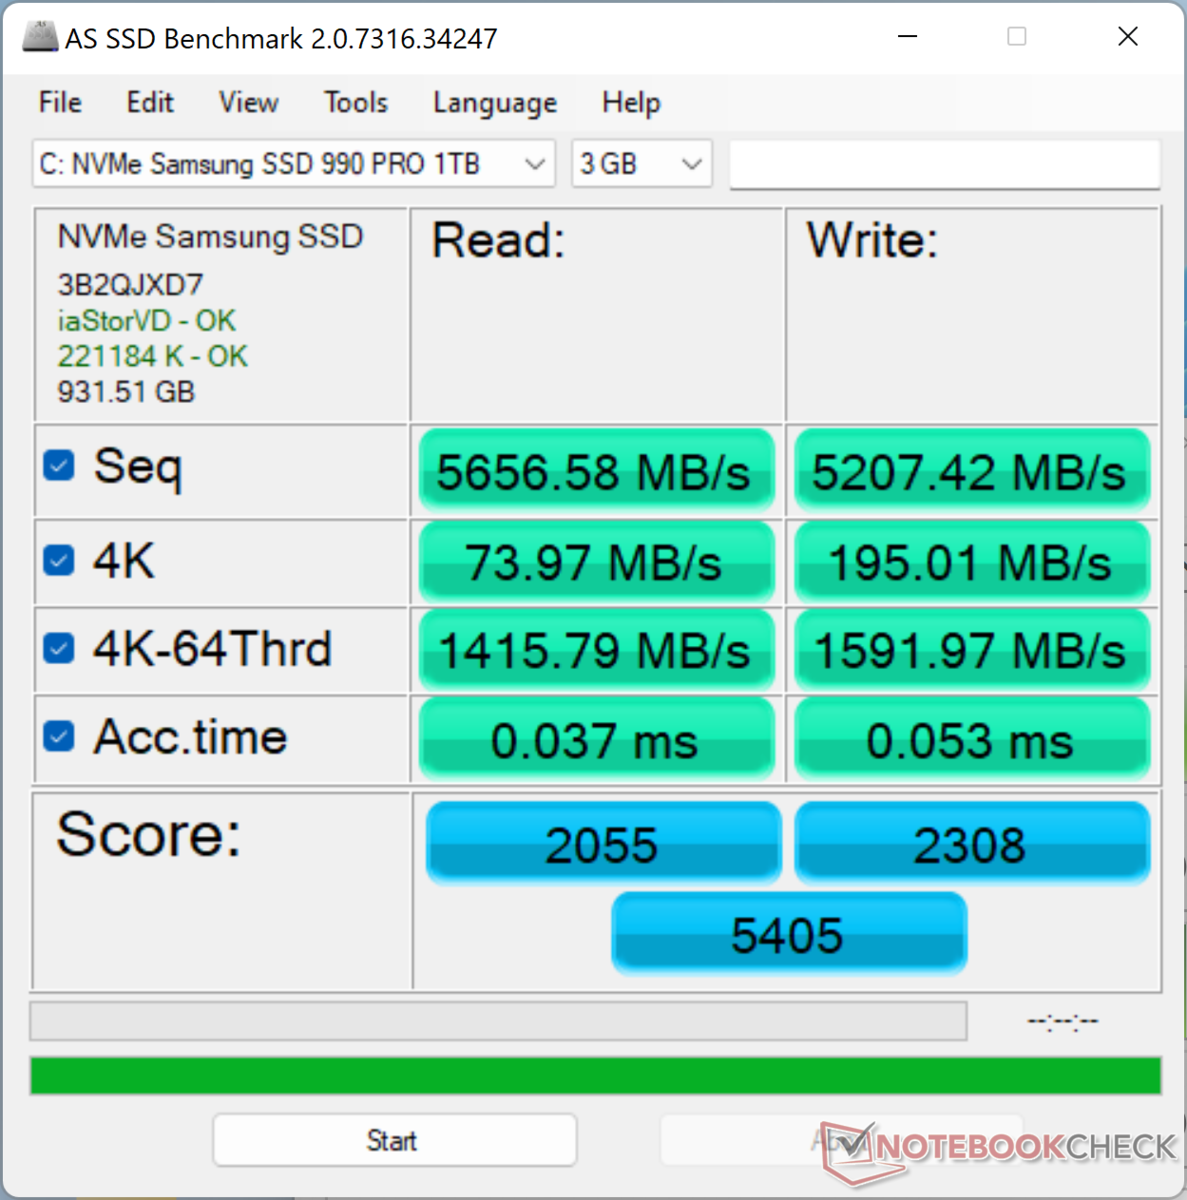
Our unit ships with a high-end Samsung 990 Pro promising sequential read and write rates of up to 7450 MB/s and 6900 MB/s, respectively. The drive in our unit is able to sustain a maximum of 7100 MB/s with no throttling issues. The included thermal pad on the SSD allows heat to dissipate onto the metal bottom plate.

* ... smaller is better
Disk Throttling: DiskSpd Read Loop, Queue Depth 8
GPU Performance
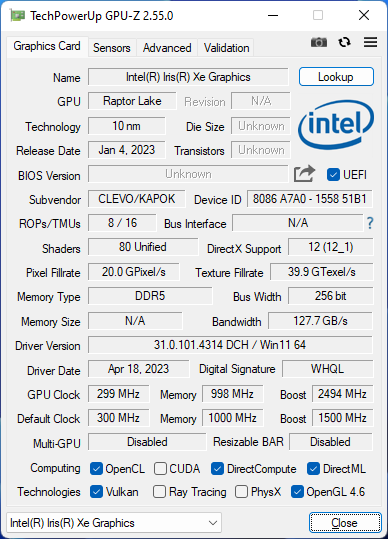
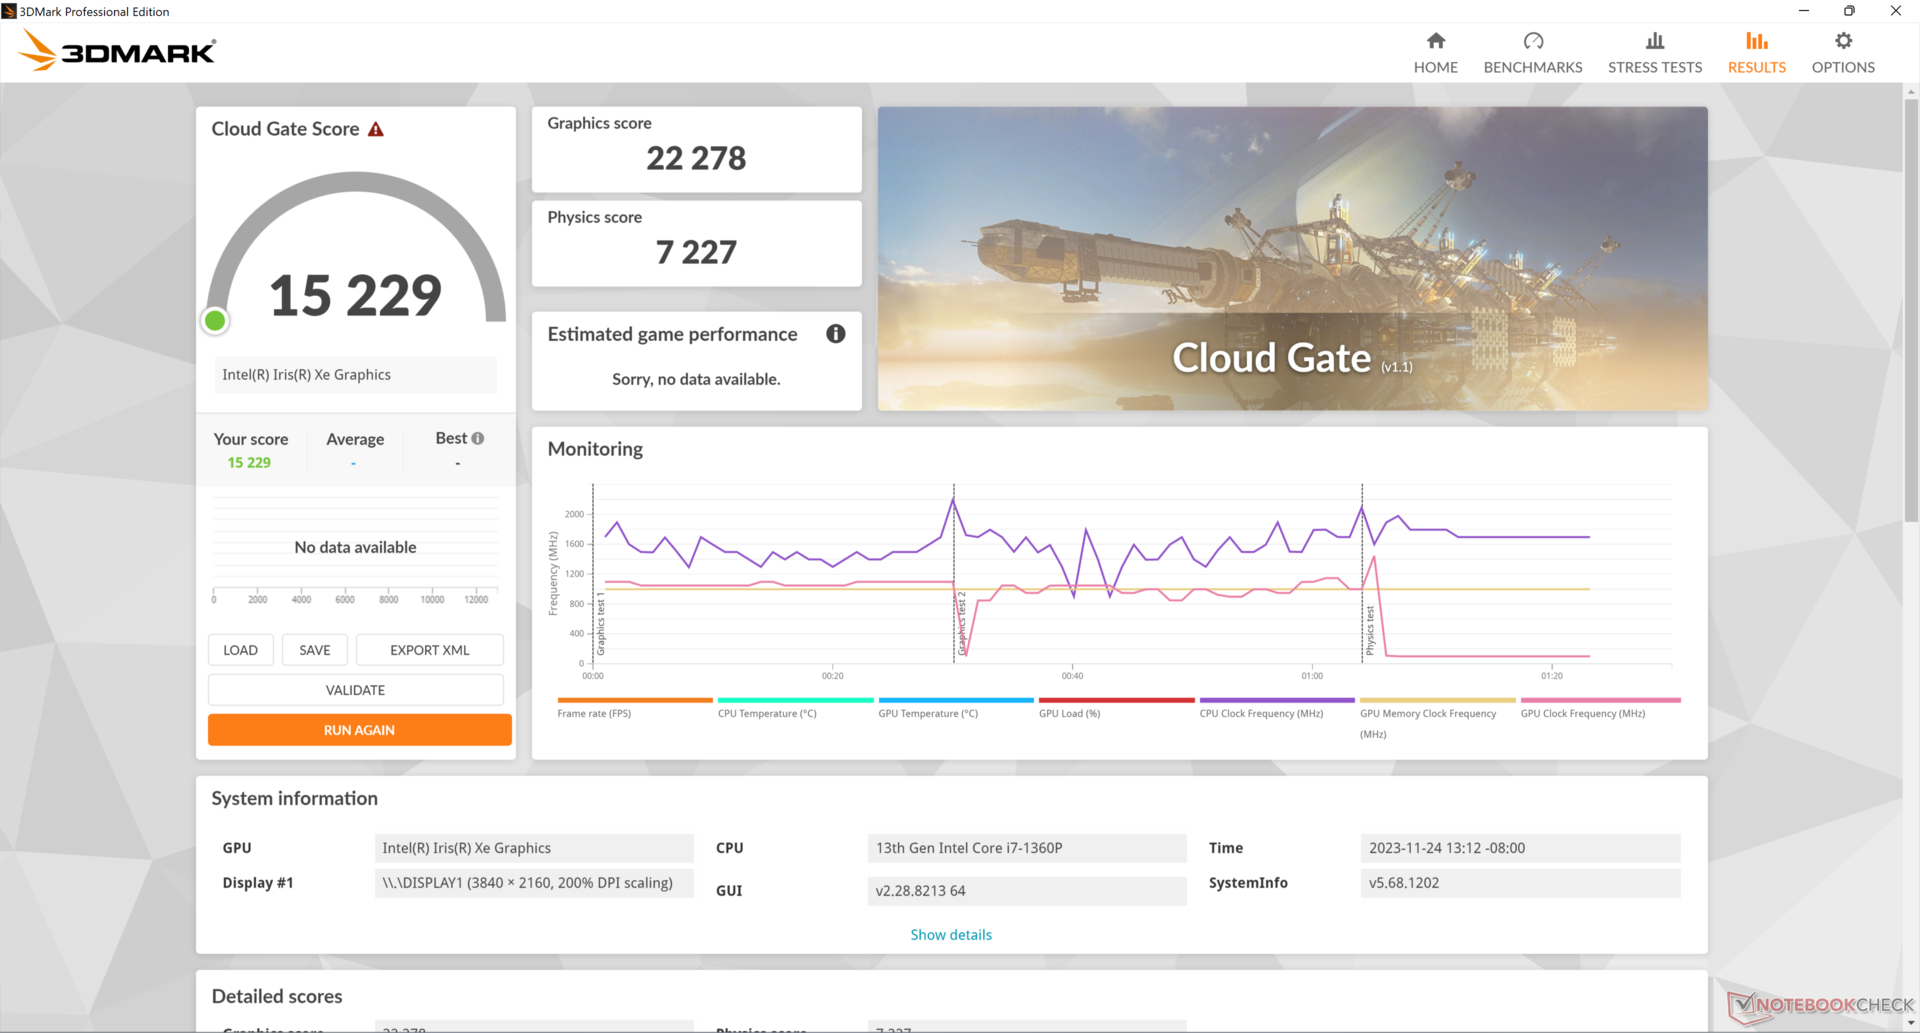
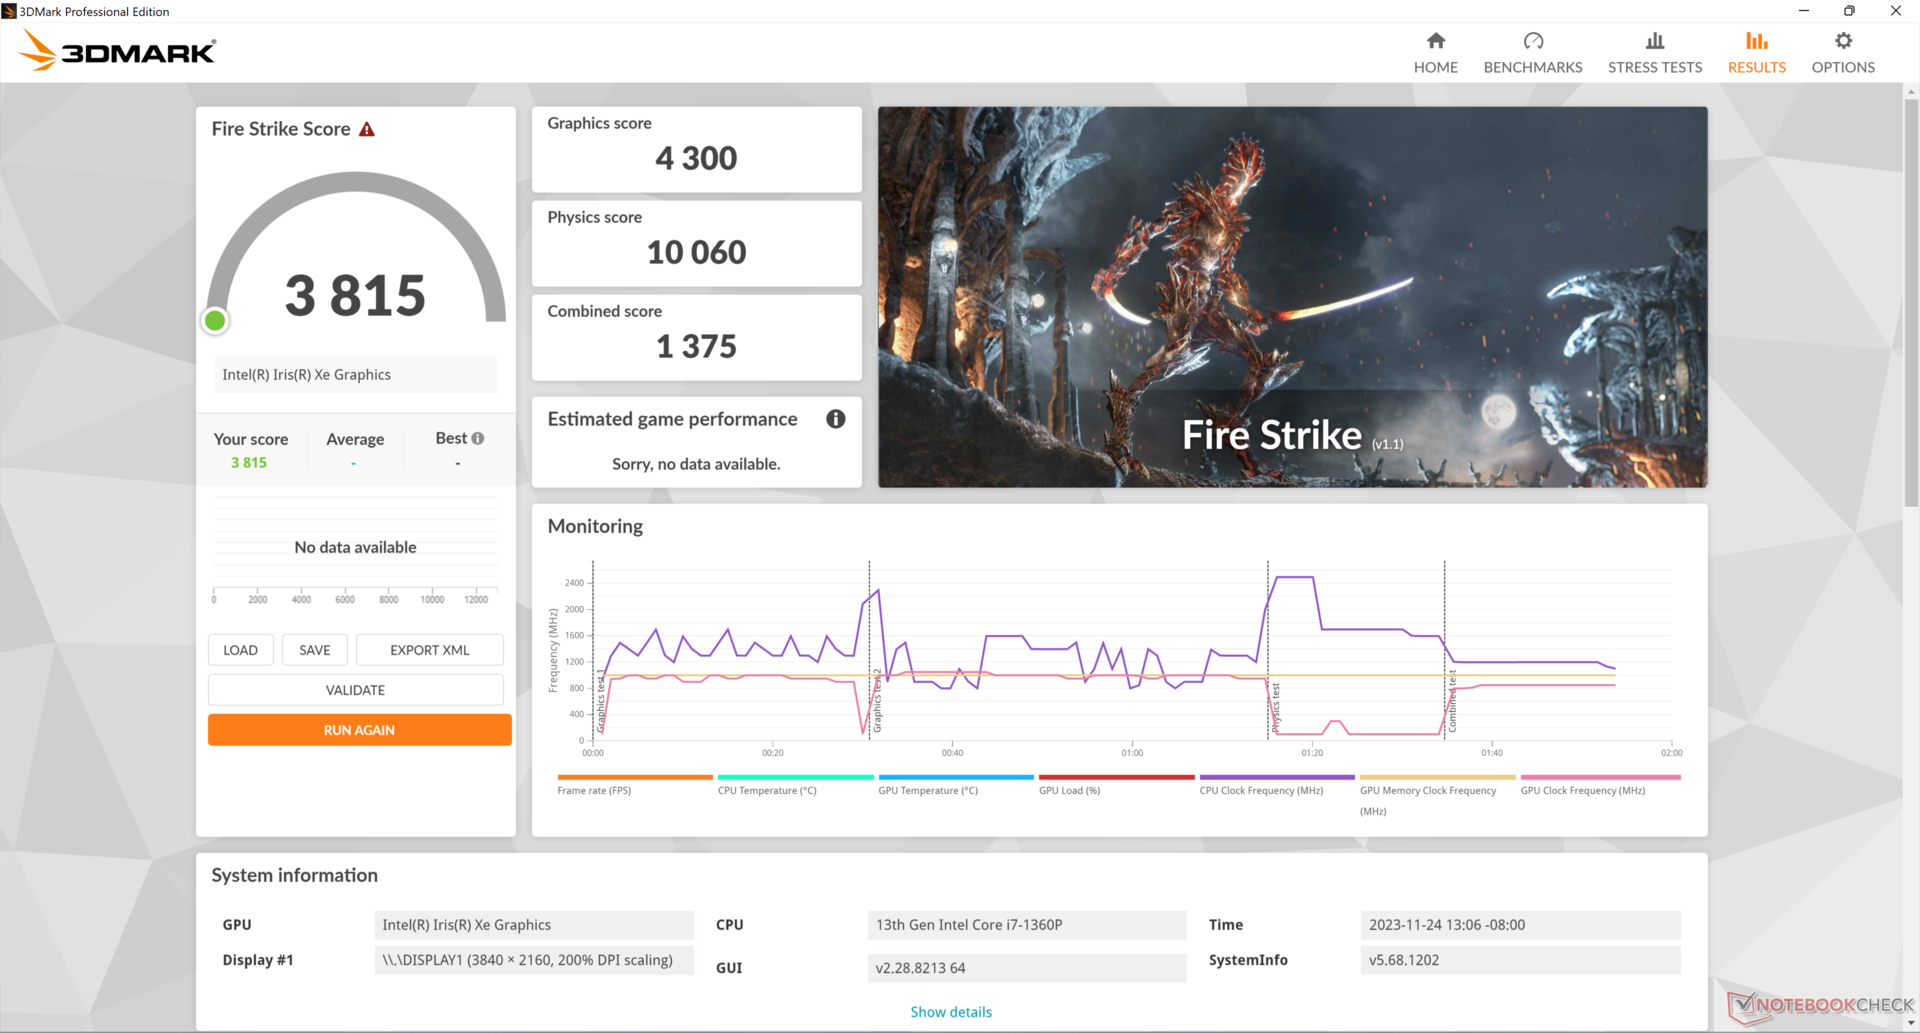
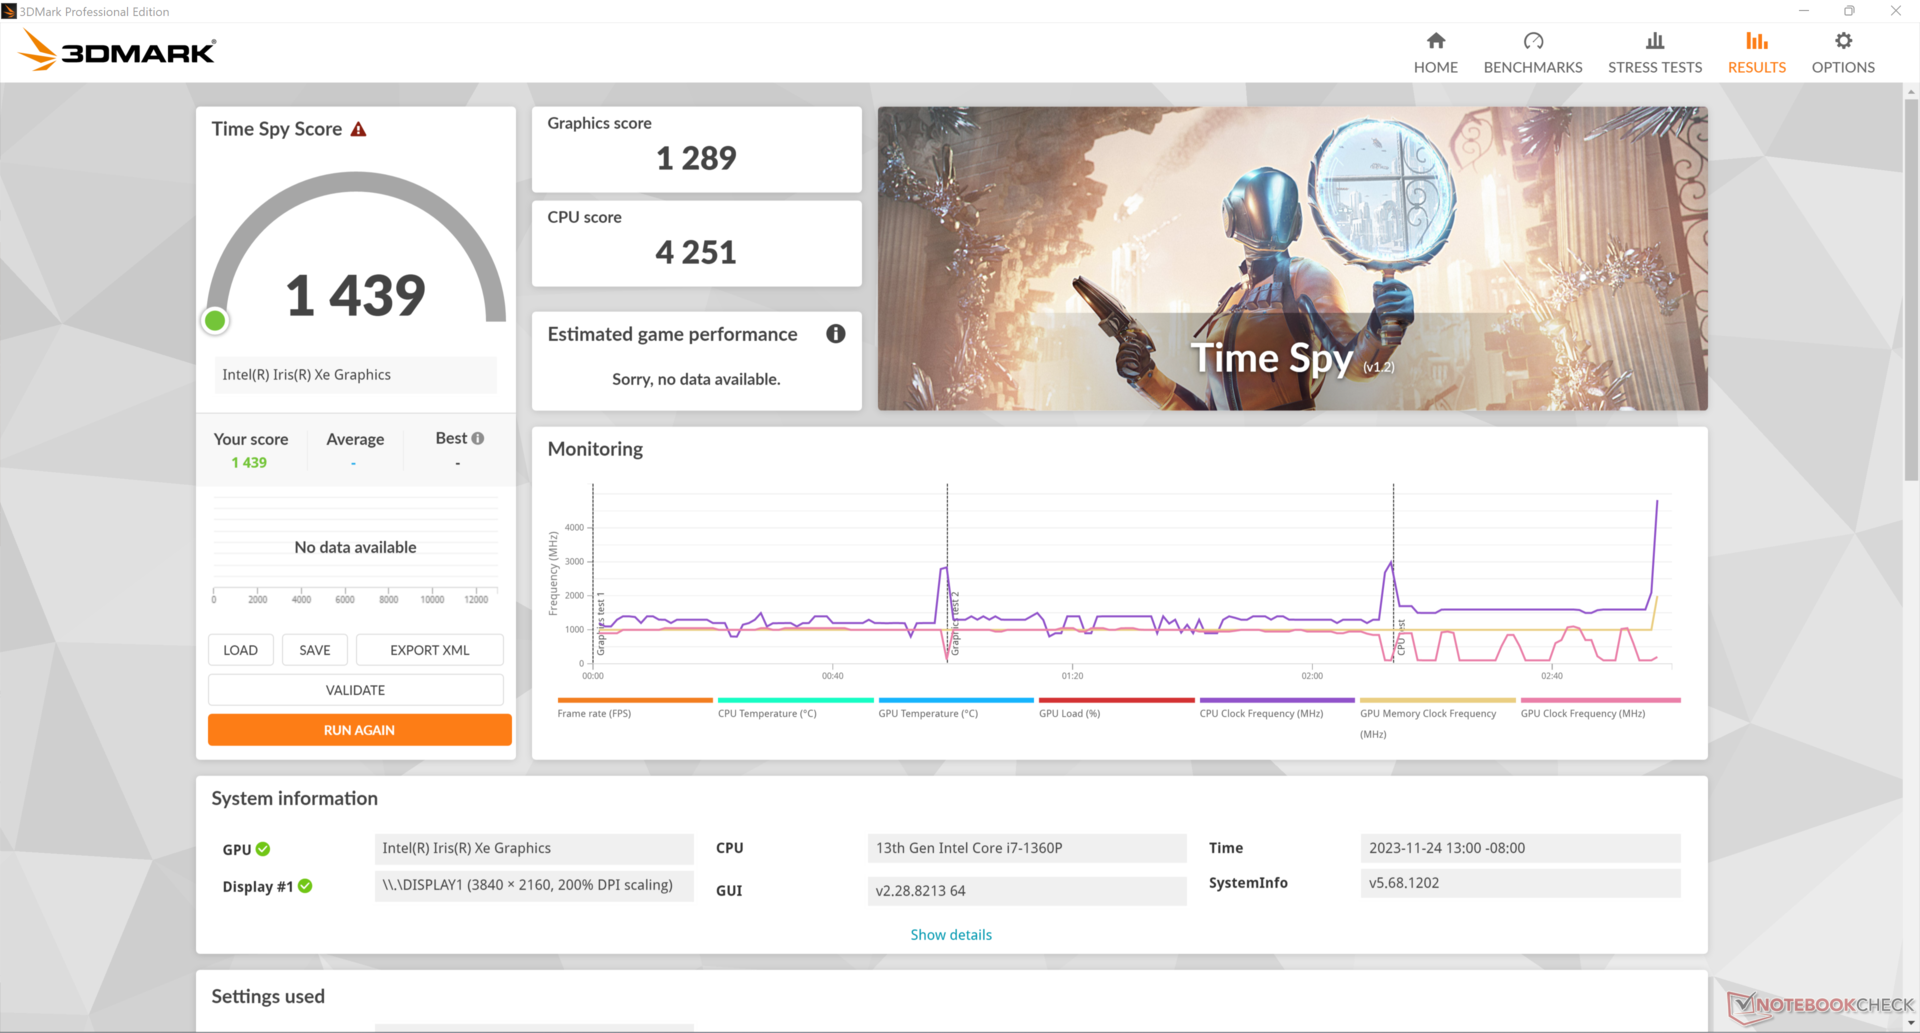
The integrated Iris Xe 96 EUs is performing slightly below average when compared to other laptops with the same GPU. In fact, our Schenker Work 15 with the older Core i7-11370H would return higher 3DMark scores than our Eurocom despite their similar GPUs.
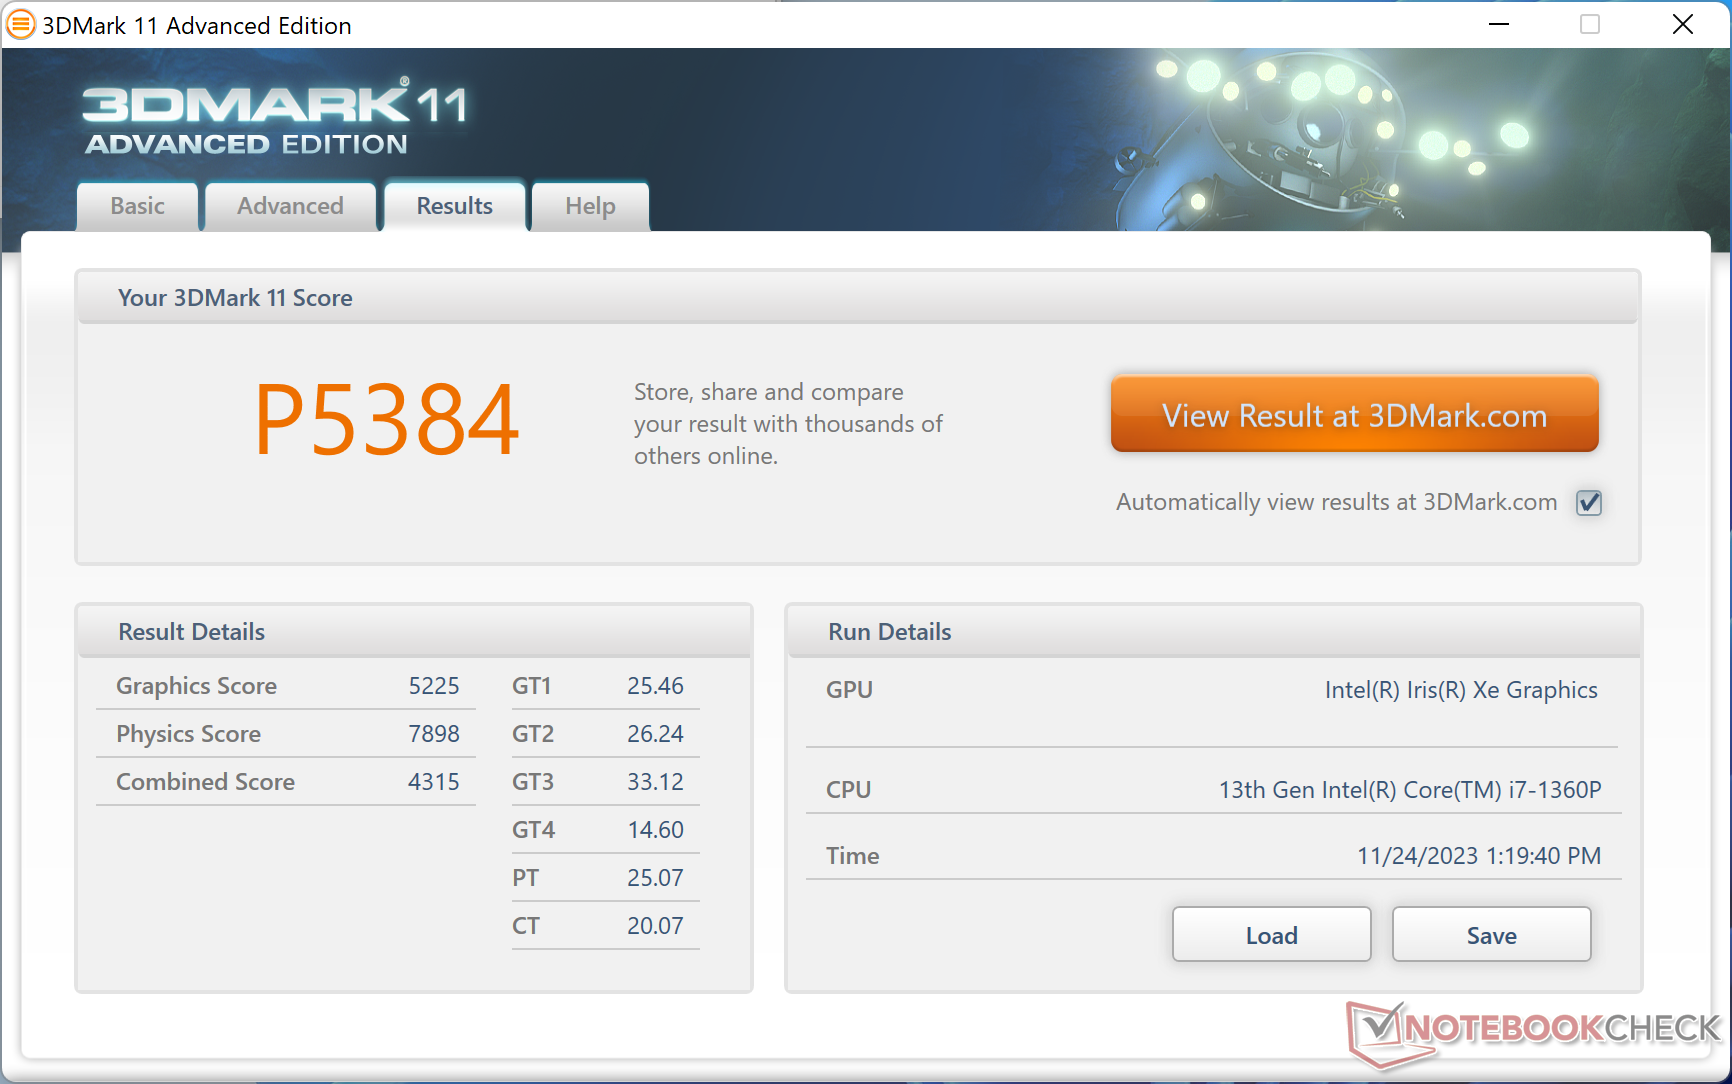
| 3DMark 11 Performance | 5384 points | |
| 3DMark Cloud Gate Standard Score | 15229 points | |
| 3DMark Fire Strike Score | 3815 points | |
| 3DMark Time Spy Score | 1439 points | |
Help | ||
* ... smaller is better
| Tiny Tina's Wonderlands - 1280x720 Lowest Preset (DX12) | |
| Average Intel Iris Xe Graphics G7 96EUs (25.9 - 67.3, n=32) | |
| Eurocom C315 Blitz | |
Witcher 3 FPS Chart
| low | med. | high | ultra | |
|---|---|---|---|---|
| GTA V (2015) | 84.7 | 72.7 | 22.5 | 9.68 |
| The Witcher 3 (2015) | 66.7 | 46.9 | 26.3 | 13 |
| Dota 2 Reborn (2015) | 96.8 | 66.3 | 48.6 | 40.9 |
| Final Fantasy XV Benchmark (2018) | 33.4 | 18.8 | 14 | |
| X-Plane 11.11 (2018) | 43.4 | 32.2 | 29.3 | |
| Far Cry 5 (2018) | 36 | 23 | 21 | 20 |
| Strange Brigade (2018) | 76.8 | 34.7 | 28.2 | 23.3 |
| Cyberpunk 2077 1.6 (2022) | 14.1 | |||
| Tiny Tina's Wonderlands (2022) | ||||
| F1 22 (2022) | 38.5 | 34.5 | 25.3 | 19.2 |
Emissions
System Noise
Fan noise behavior needs additional tuning. When connected to mains, the fan would occasionally pulse between silent and 35 dB(A) even when idling on desktop on Power Saver mode. Only when running on battery power will the fan remain silent with no unnecessary pulsing. Otherwise, fan noise when running demanding loads like games is almost identical to what we observed on the Schenker Work 15 with the older Core H-series CPU.
Noise level
| Idle |
| 25.1 / 25.1 / 34.9 dB(A) |
| Load |
| 42.1 / 44.2 dB(A) |
 | ||
30 dB silent 40 dB(A) audible 50 dB(A) loud |
||
min: | ||
| Eurocom C315 Blitz Iris Xe G7 96EUs, i7-1360P, Samsung 990 Pro 1 TB | Schenker Work 15 Tiger Lake-H Iris Xe G7 96EUs, i7-11370H, Samsung SSD 980 Pro 1TB MZ-V8P1T0BW | Lenovo ThinkPad L15 Gen 4 21H70021GE Vega 8, R7 PRO 7730U, SK hynix HFS512GEJ4X113N | Acer Aspire 5 A515-58GM-76S8 GeForce RTX 2050 Mobile, i7-1355U, Micron 2450 1TB MTFDKBA1T0TFK | Asus VivoBook S15 M3502RA-L1029W Radeon 680M, R7 6800H, WD PC SN735 SDBPNHH-512G | Samsung Galaxy Book2 15 A350M, i7-1260P, Samsung PM991 MZVLQ512HBLU | |
|---|---|---|---|---|---|---|
| Noise | 3% | 18% | 2% | -14% | -2% | |
| off / environment * (dB) | 22.5 | 24.4 -8% | 23.5 -4% | 25.04 -11% | 26 -16% | 24.3 -8% |
| Idle Minimum * (dB) | 25.1 | 24.4 3% | 23.5 6% | 26.3 -5% | 26 -4% | 24.3 3% |
| Idle Average * (dB) | 25.1 | 24.4 3% | 23.5 6% | 26.3 -5% | 26 -4% | 24.3 3% |
| Idle Maximum * (dB) | 34.9 | 26.7 23% | 23.5 33% | 26.3 25% | 28.1 19% | 29.8 15% |
| Load Average * (dB) | 42.1 | 43.8 -4% | 27.5 35% | 32.5 23% | 56.9 -35% | 47.5 -13% |
| Witcher 3 ultra * (dB) | 44.5 | 43.8 2% | 32.7 27% | 46.7 -5% | 47.5 -7% | |
| Load Maximum * (dB) | 44.2 | 44.8 -1% | 32.7 26% | 49 -11% | 62.6 -42% | 47.5 -7% |
* ... smaller is better
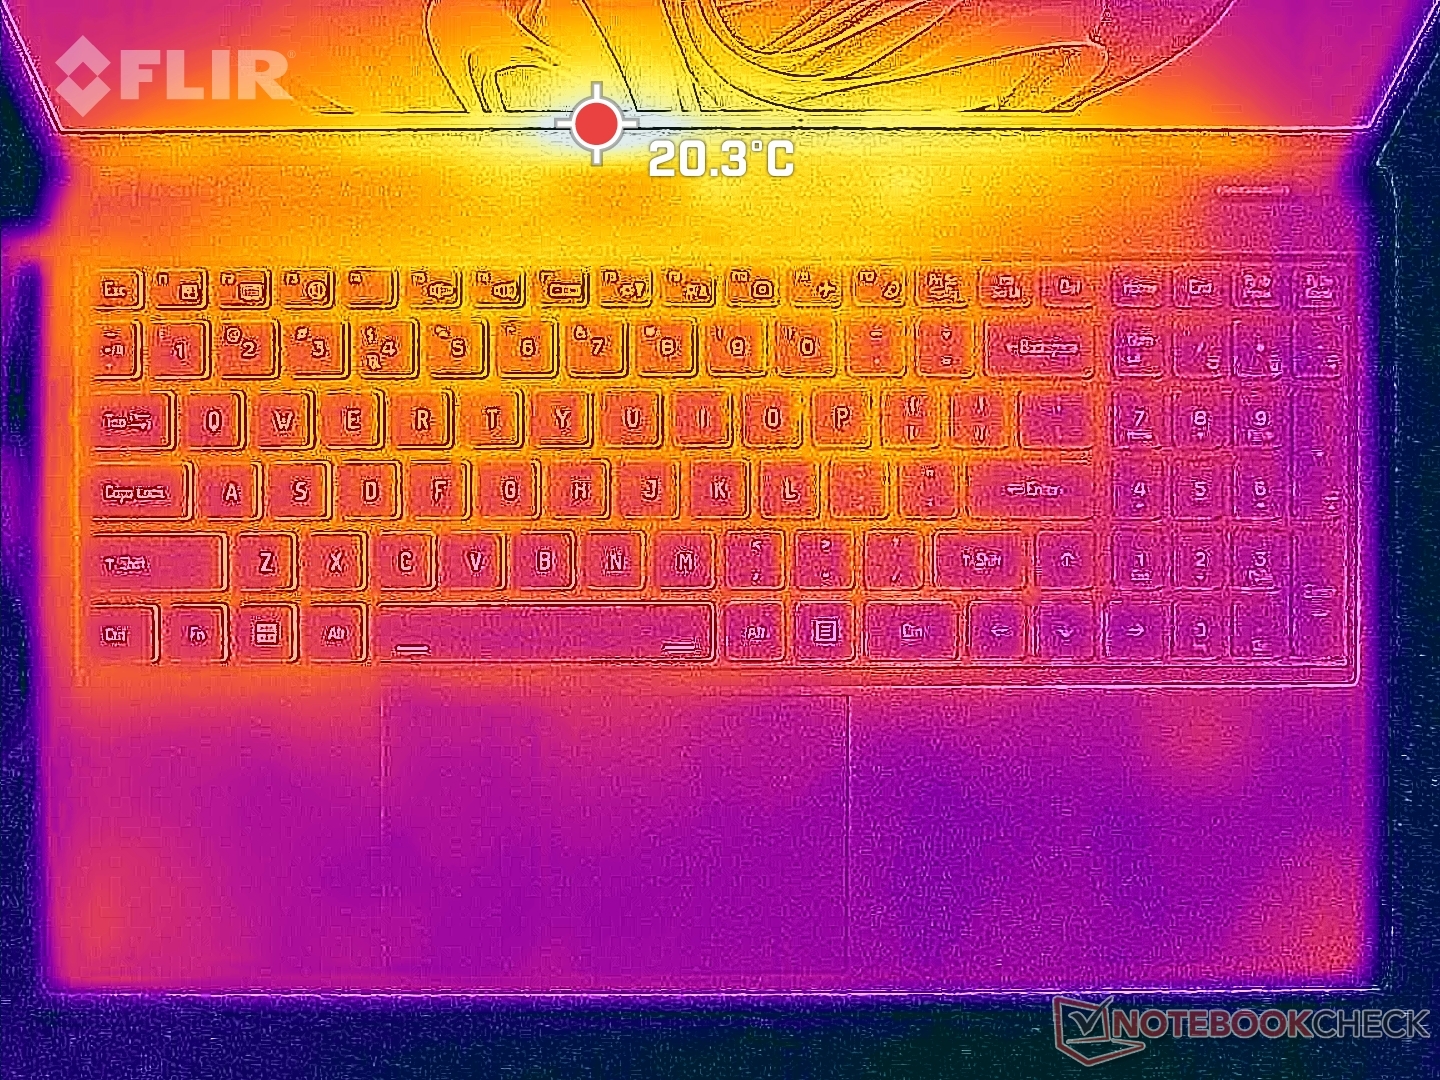
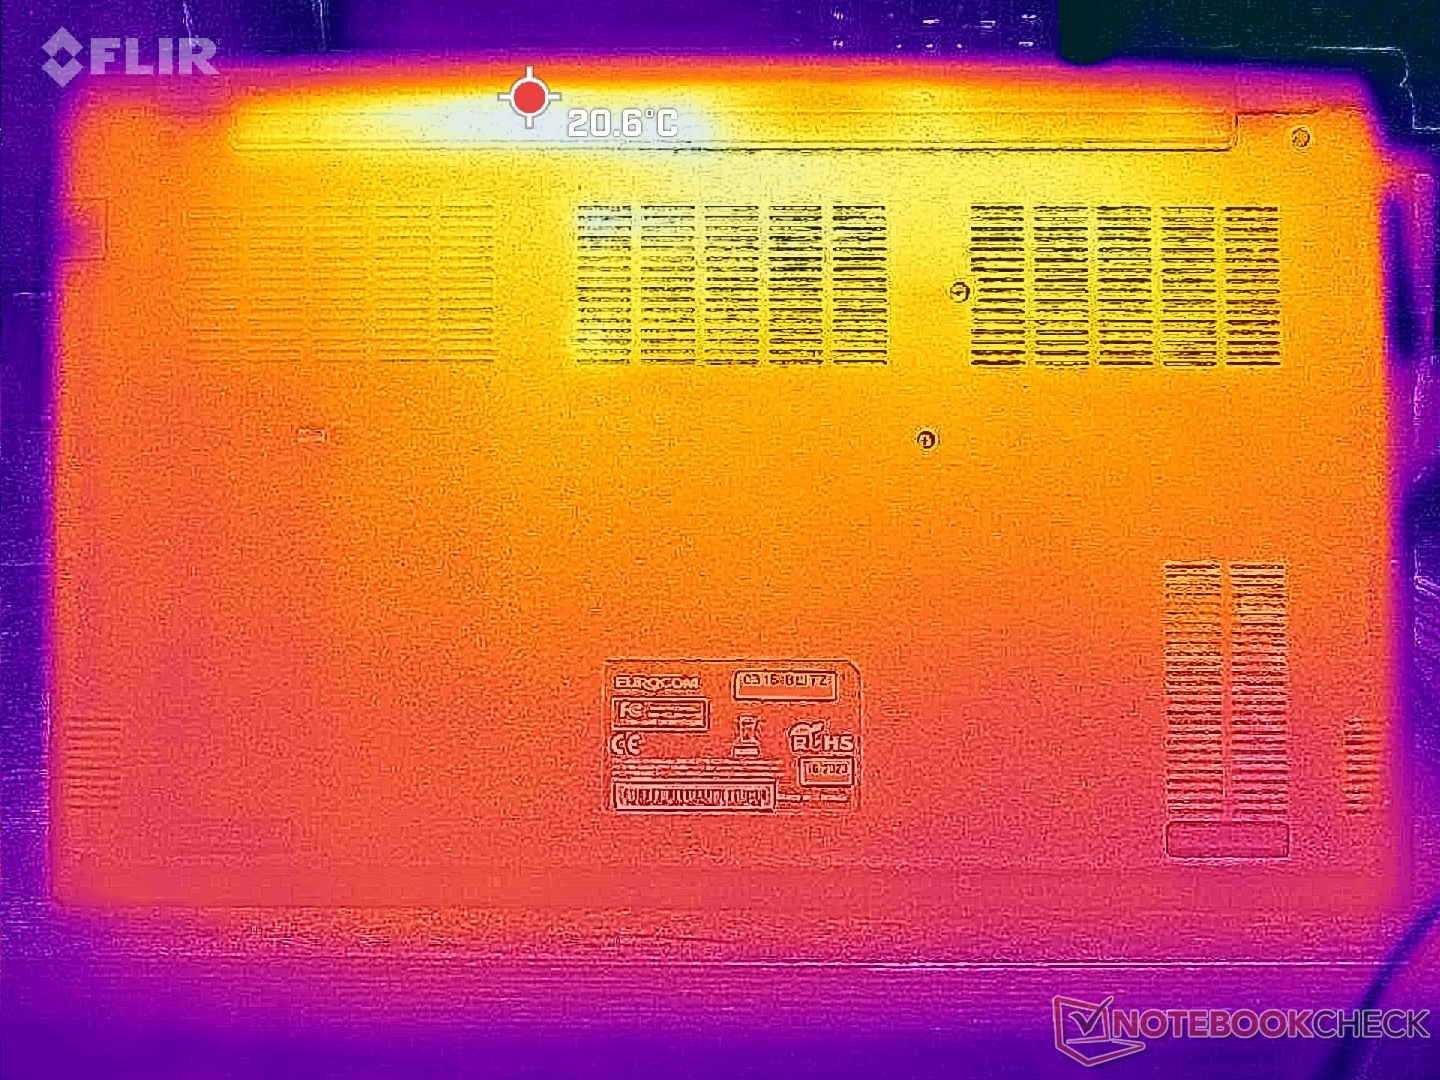
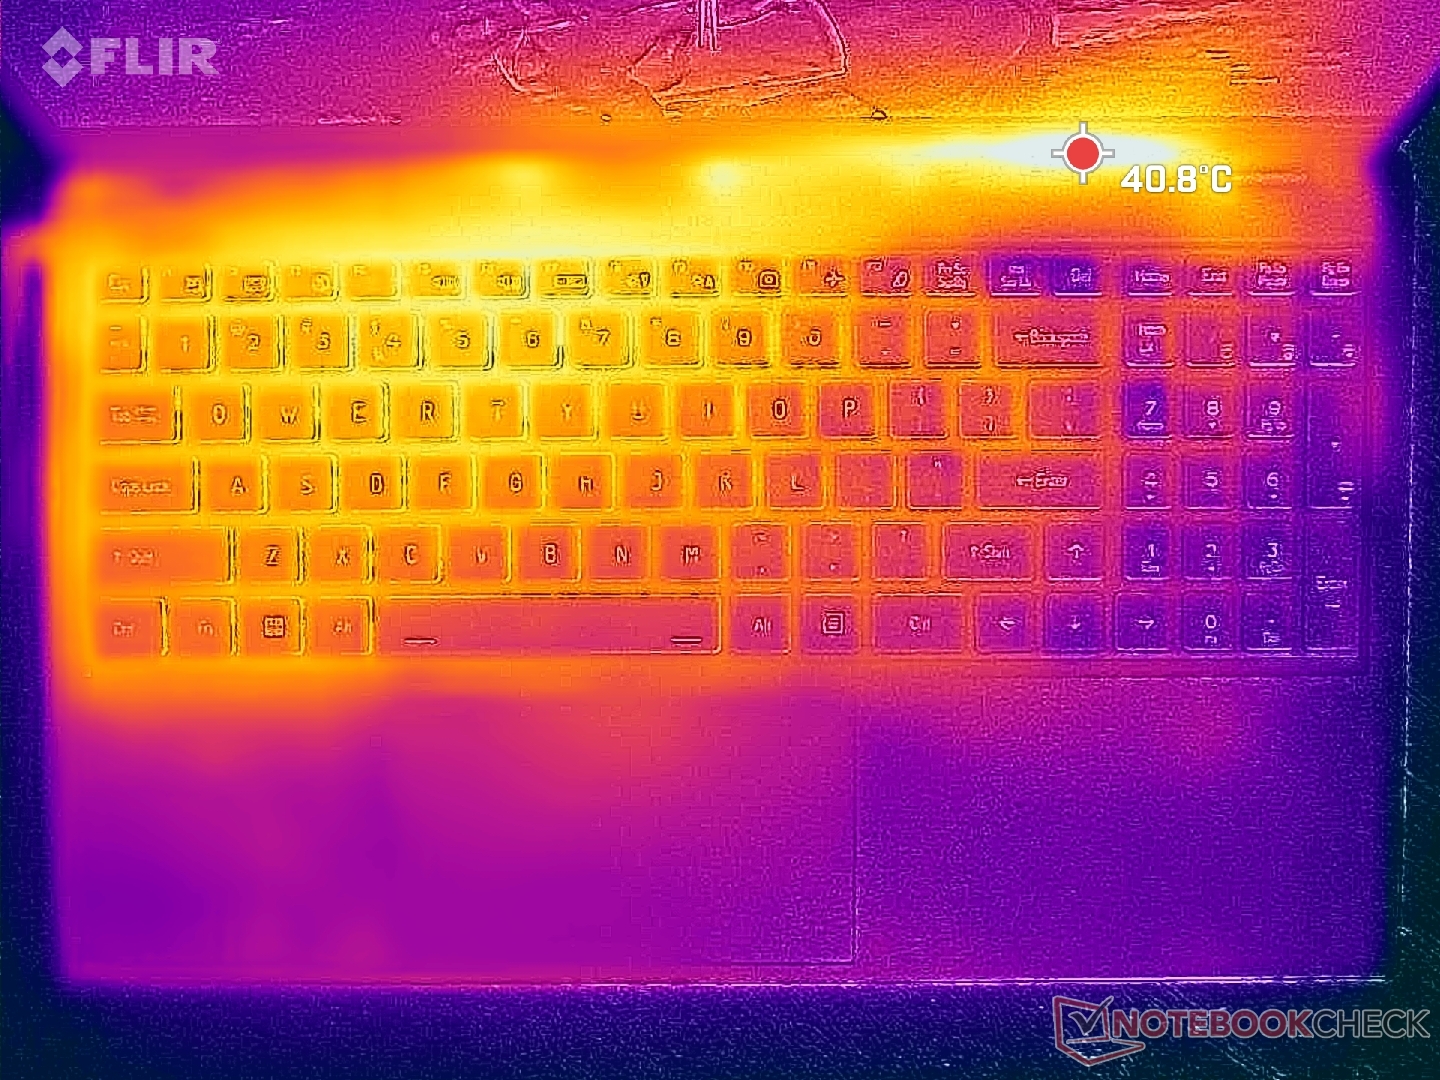
Temperature
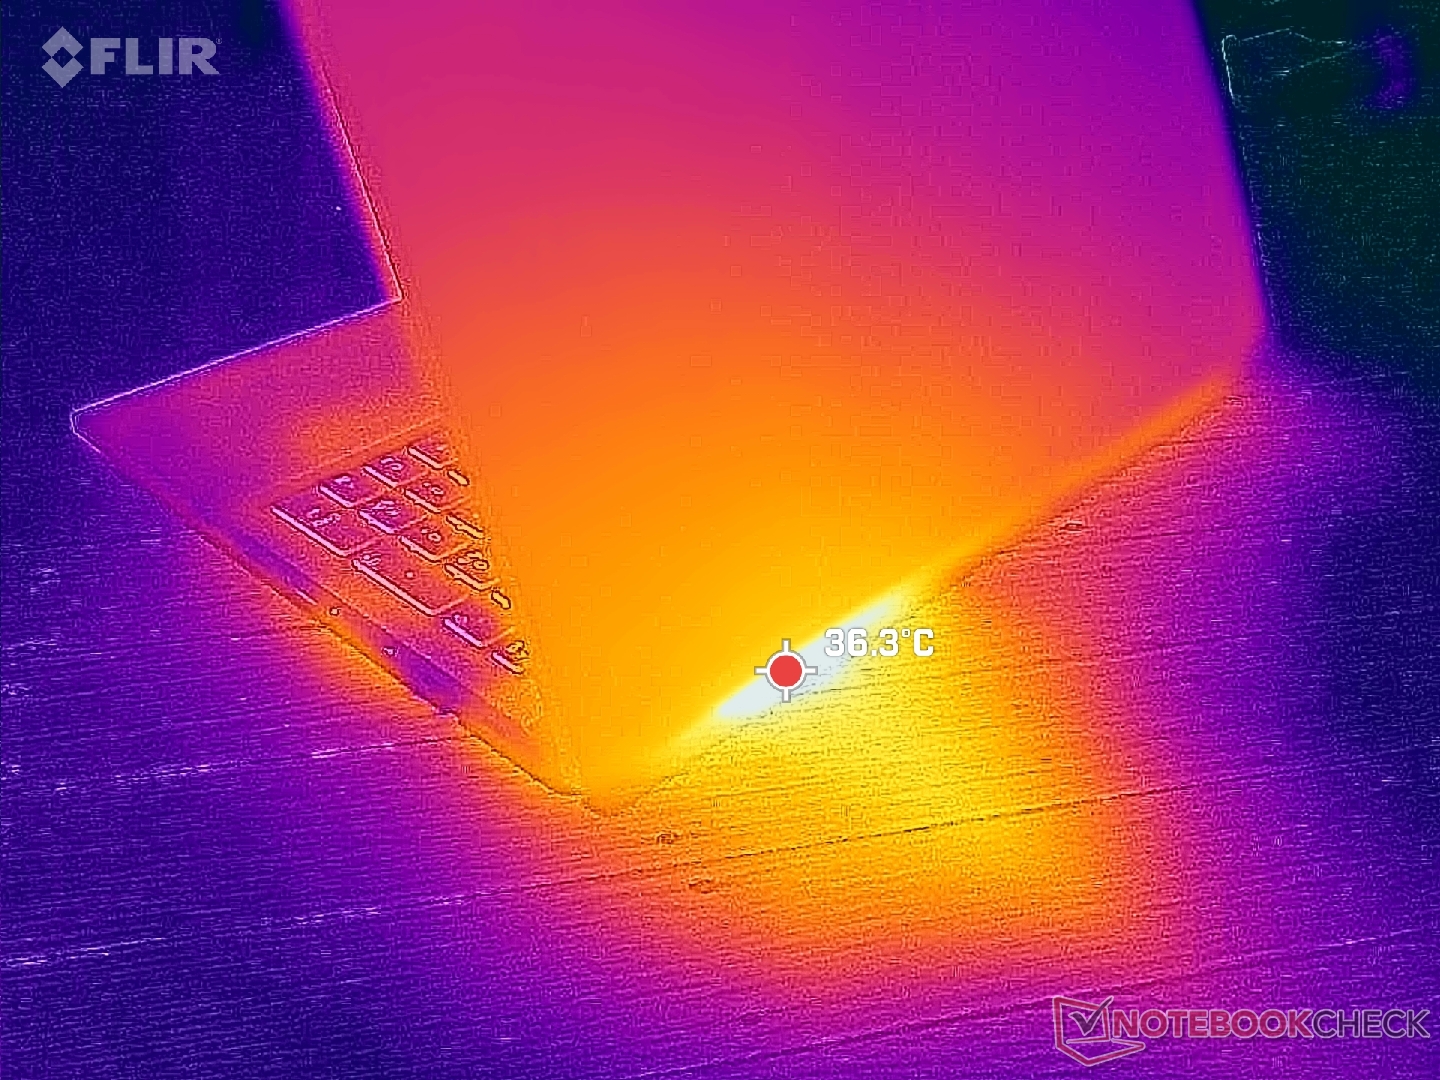
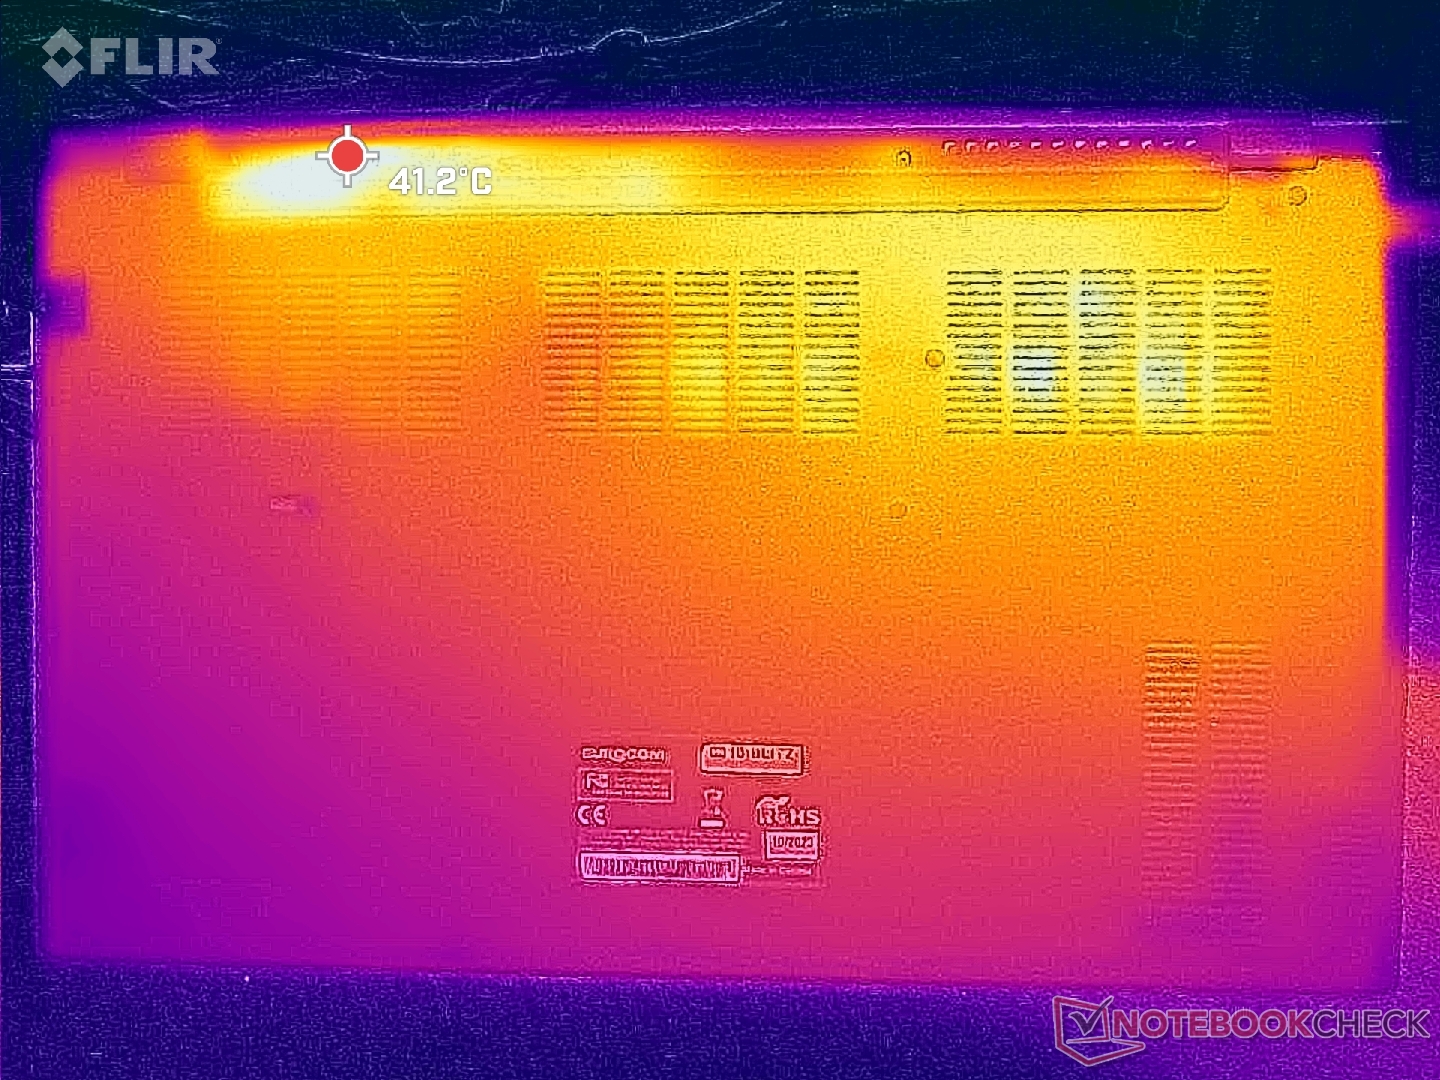
Surface temperatures are a bit cooler on average than what we observed on the Schenker Work 15. When running demanding loads, for example, hot spots near the rear of the chassis would only reach 35 C to 38 C compared to 43 C on the Schenker.
(+) The maximum temperature on the upper side is 35.6 °C / 96 F, compared to the average of 34.3 °C / 94 F, ranging from 21.2 to 62.5 °C for the class Office.
(+) The bottom heats up to a maximum of 37.8 °C / 100 F, compared to the average of 36.8 °C / 98 F
(+) In idle usage, the average temperature for the upper side is 22.8 °C / 73 F, compared to the device average of 29.5 °C / 85 F.
(+) The palmrests and touchpad are cooler than skin temperature with a maximum of 26.6 °C / 79.9 F and are therefore cool to the touch.
(±) The average temperature of the palmrest area of similar devices was 27.5 °C / 81.5 F (+0.9 °C / 1.6 F).
| Eurocom C315 Blitz Intel Core i7-1360P, Intel Iris Xe Graphics G7 96EUs | Schenker Work 15 Tiger Lake-H Intel Core i7-11370H, Intel Iris Xe Graphics G7 96EUs | Lenovo ThinkPad L15 Gen 4 21H70021GE AMD Ryzen 7 PRO 7730U, AMD Radeon RX Vega 8 (Ryzen 4000/5000) | Acer Aspire 5 A515-58GM-76S8 Intel Core i7-1355U, NVIDIA GeForce RTX 2050 Mobile | Asus VivoBook S15 M3502RA-L1029W AMD Ryzen 7 6800H, AMD Radeon 680M | Samsung Galaxy Book2 15 Intel Core i7-1260P, Intel Arc A350M | |
|---|---|---|---|---|---|---|
| Heat | -6% | 0% | -5% | -35% | -15% | |
| Maximum Upper Side * (°C) | 35.6 | 39.1 -10% | 39.1 -10% | 35.7 -0% | 50.2 -41% | 44.6 -25% |
| Maximum Bottom * (°C) | 37.8 | 43.4 -15% | 36.1 4% | 36.8 3% | 50.2 -33% | 47.5 -26% |
| Idle Upper Side * (°C) | 24.2 | 24.3 -0% | 23.1 5% | 27.9 -15% | 32.1 -33% | 25.8 -7% |
| Idle Bottom * (°C) | 26 | 25.1 3% | 25.7 1% | 27.9 -7% | 34.6 -33% | 26.1 -0% |
* ... smaller is better
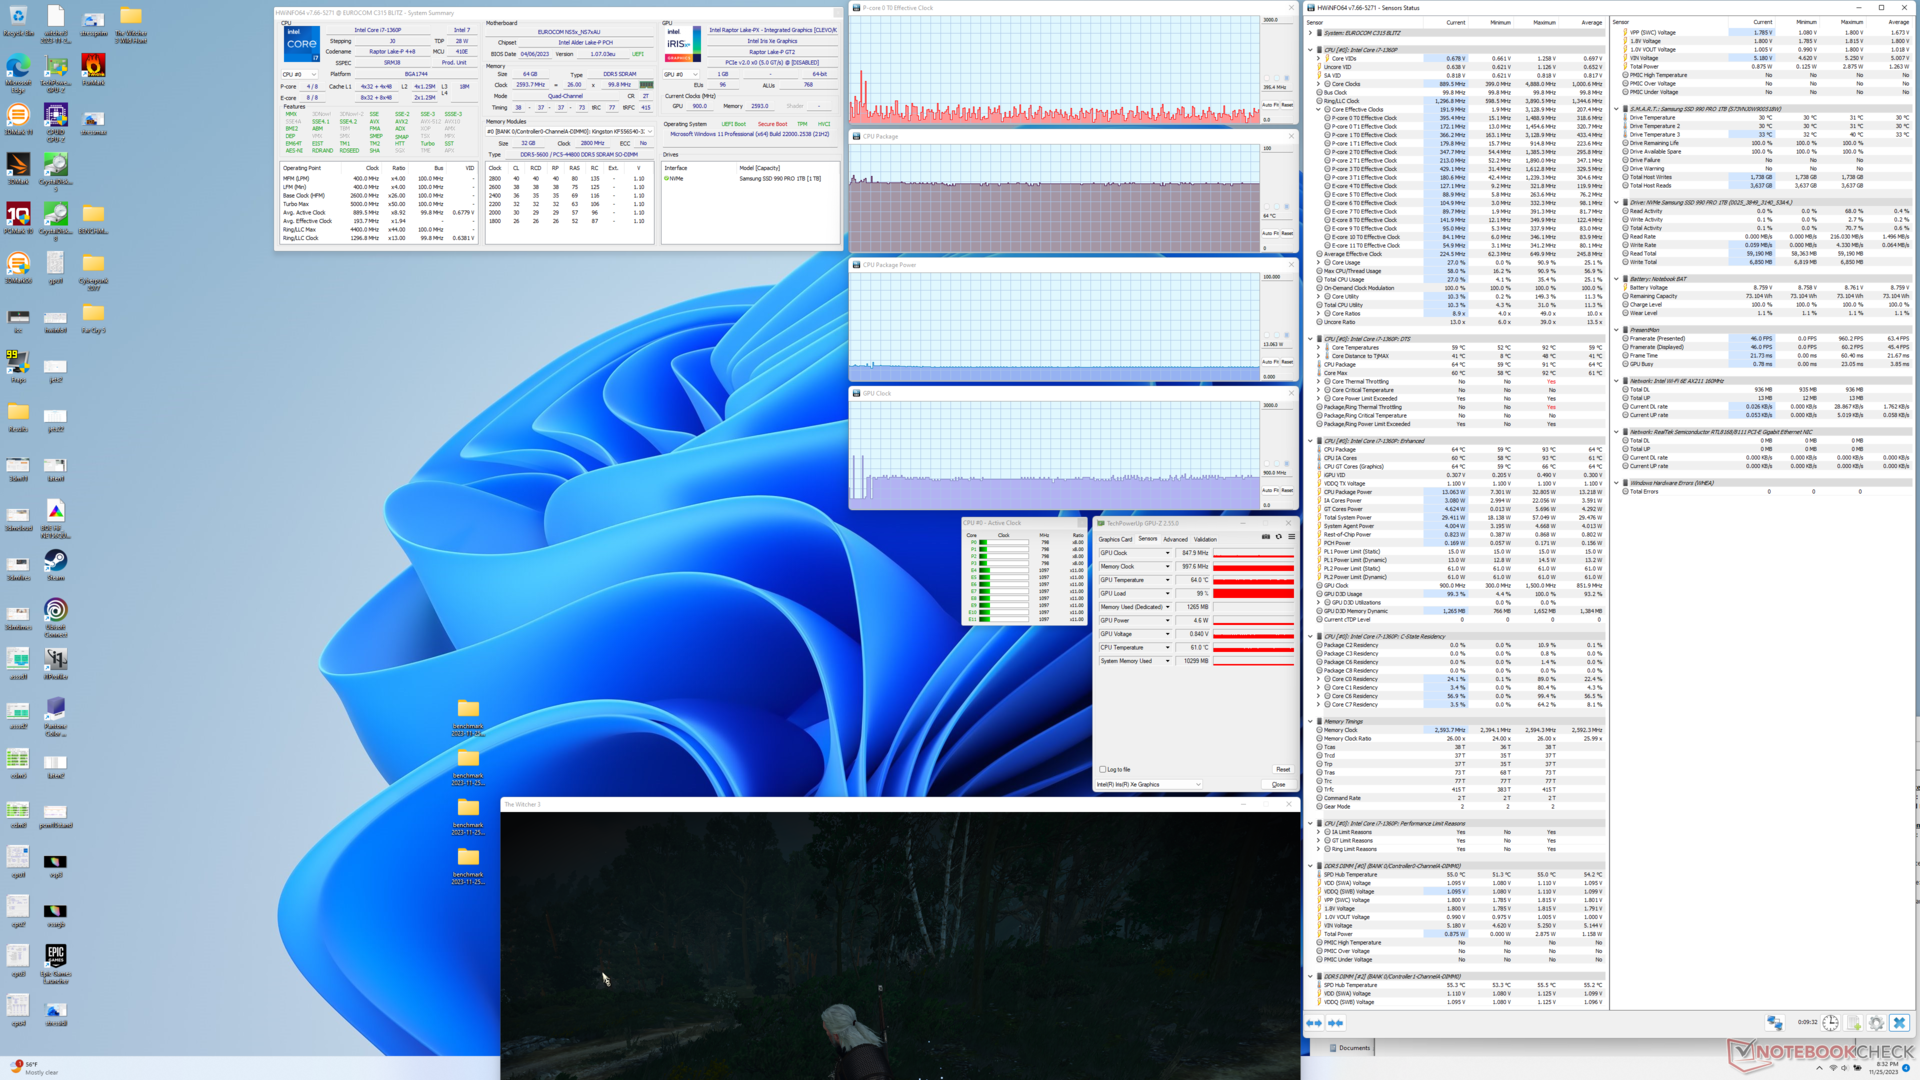
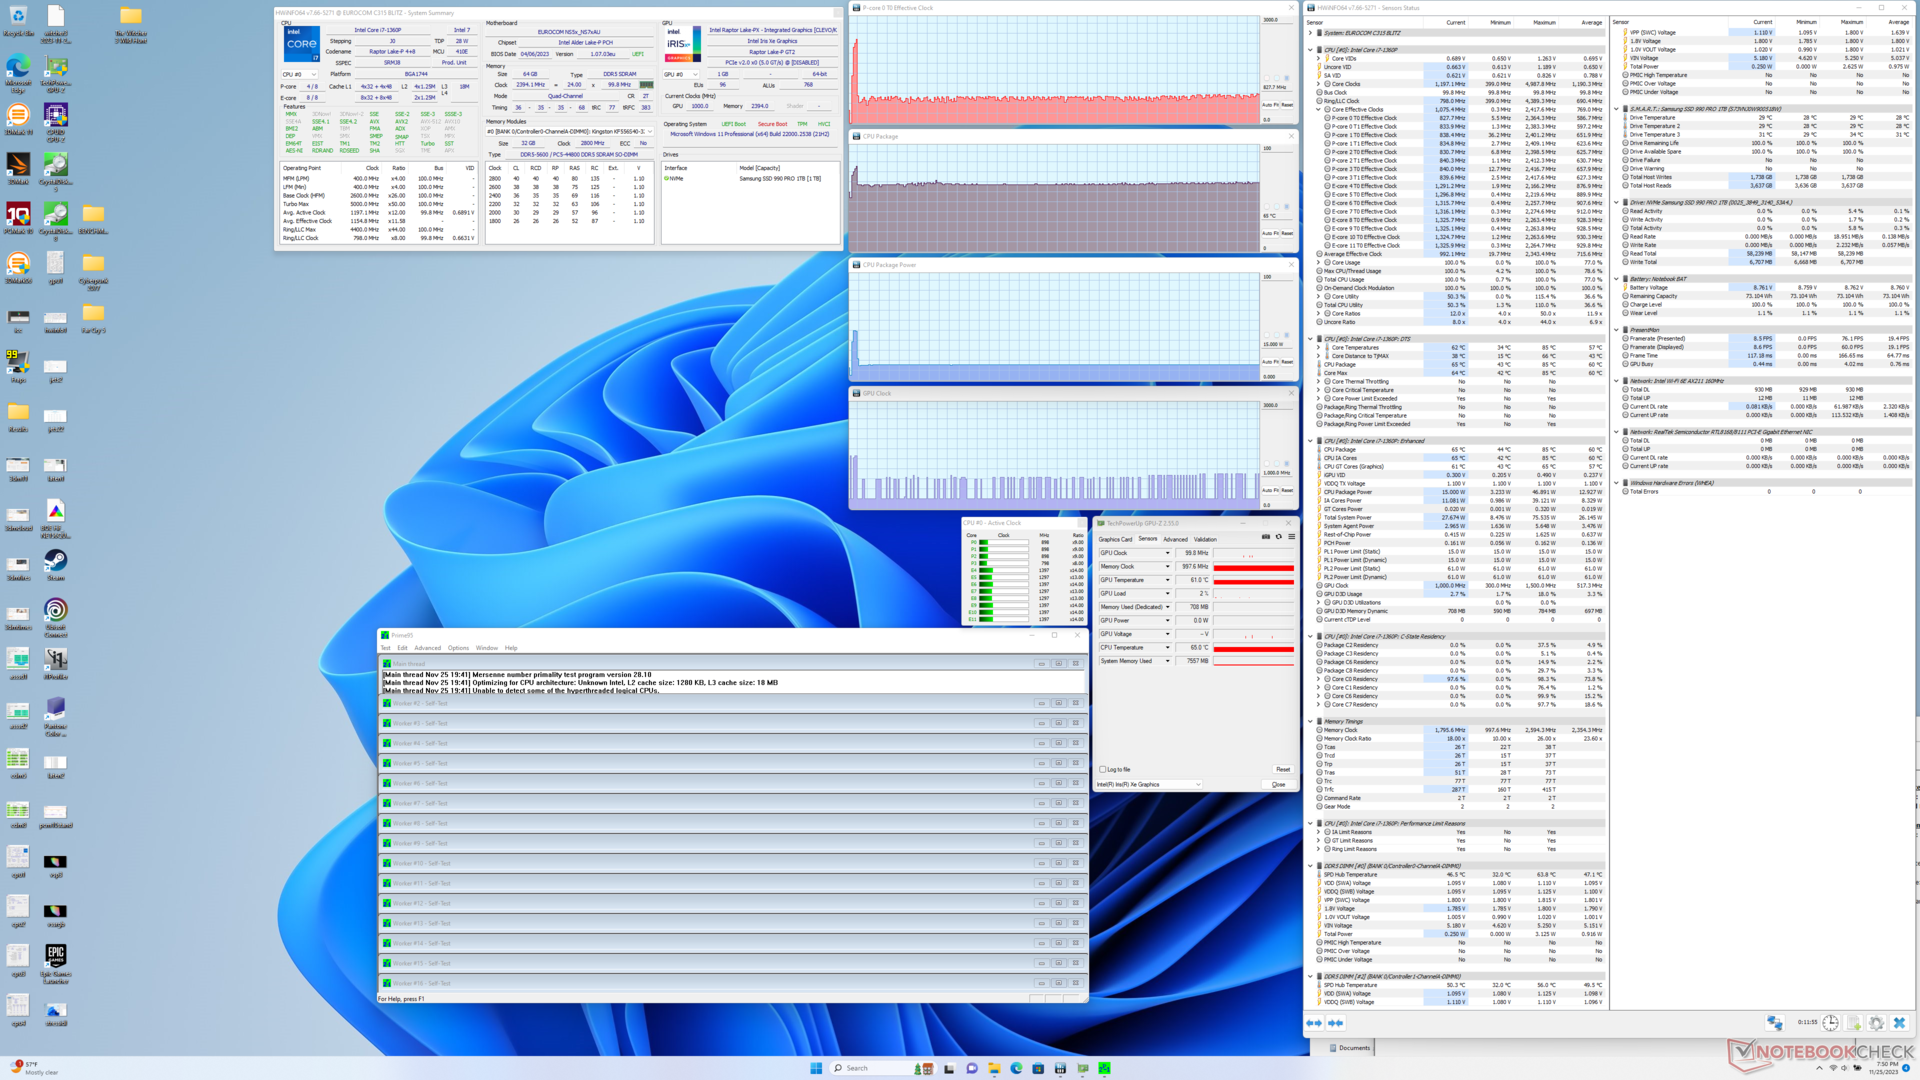
Stress Test
When initiating Prime95 stress, the CPU would boost to 2.4 GHz, 47 W, and 85 W for just a few seconds before falling and stabilizing at 800 MHz - 1.3 GHz, 15 W, and 65 W. The steep performance drop aligns with our CineBench R15 xT loop results above. We expected better performance sustainability since the Core P-series is supposed to be a step in between the slower U-series and more powerful H-series, but its behavior in our Eurocom is typical of most U-series CPUs instead.
Core temperature would stabilize at around 65 C when running demanding loads compared to 78 C on the Schenker Work 15 with the older Core i7-11730H.
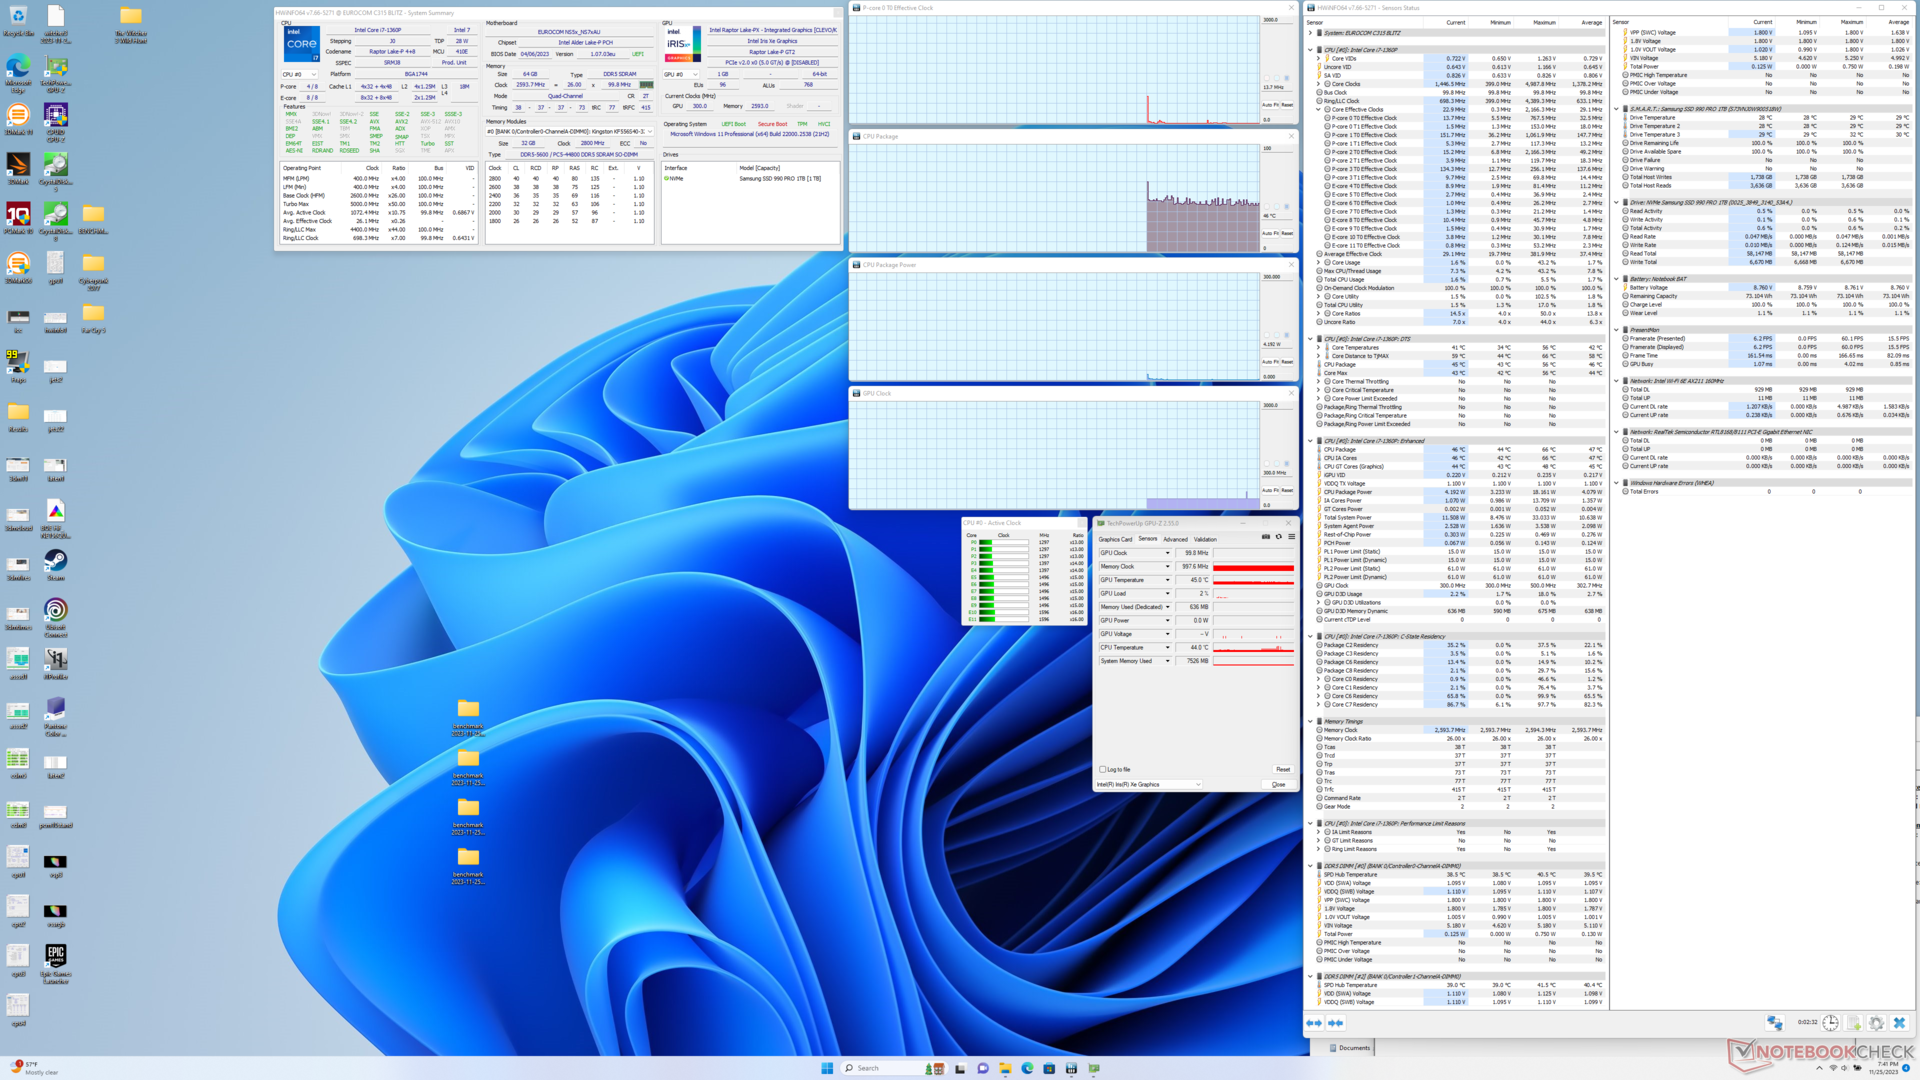
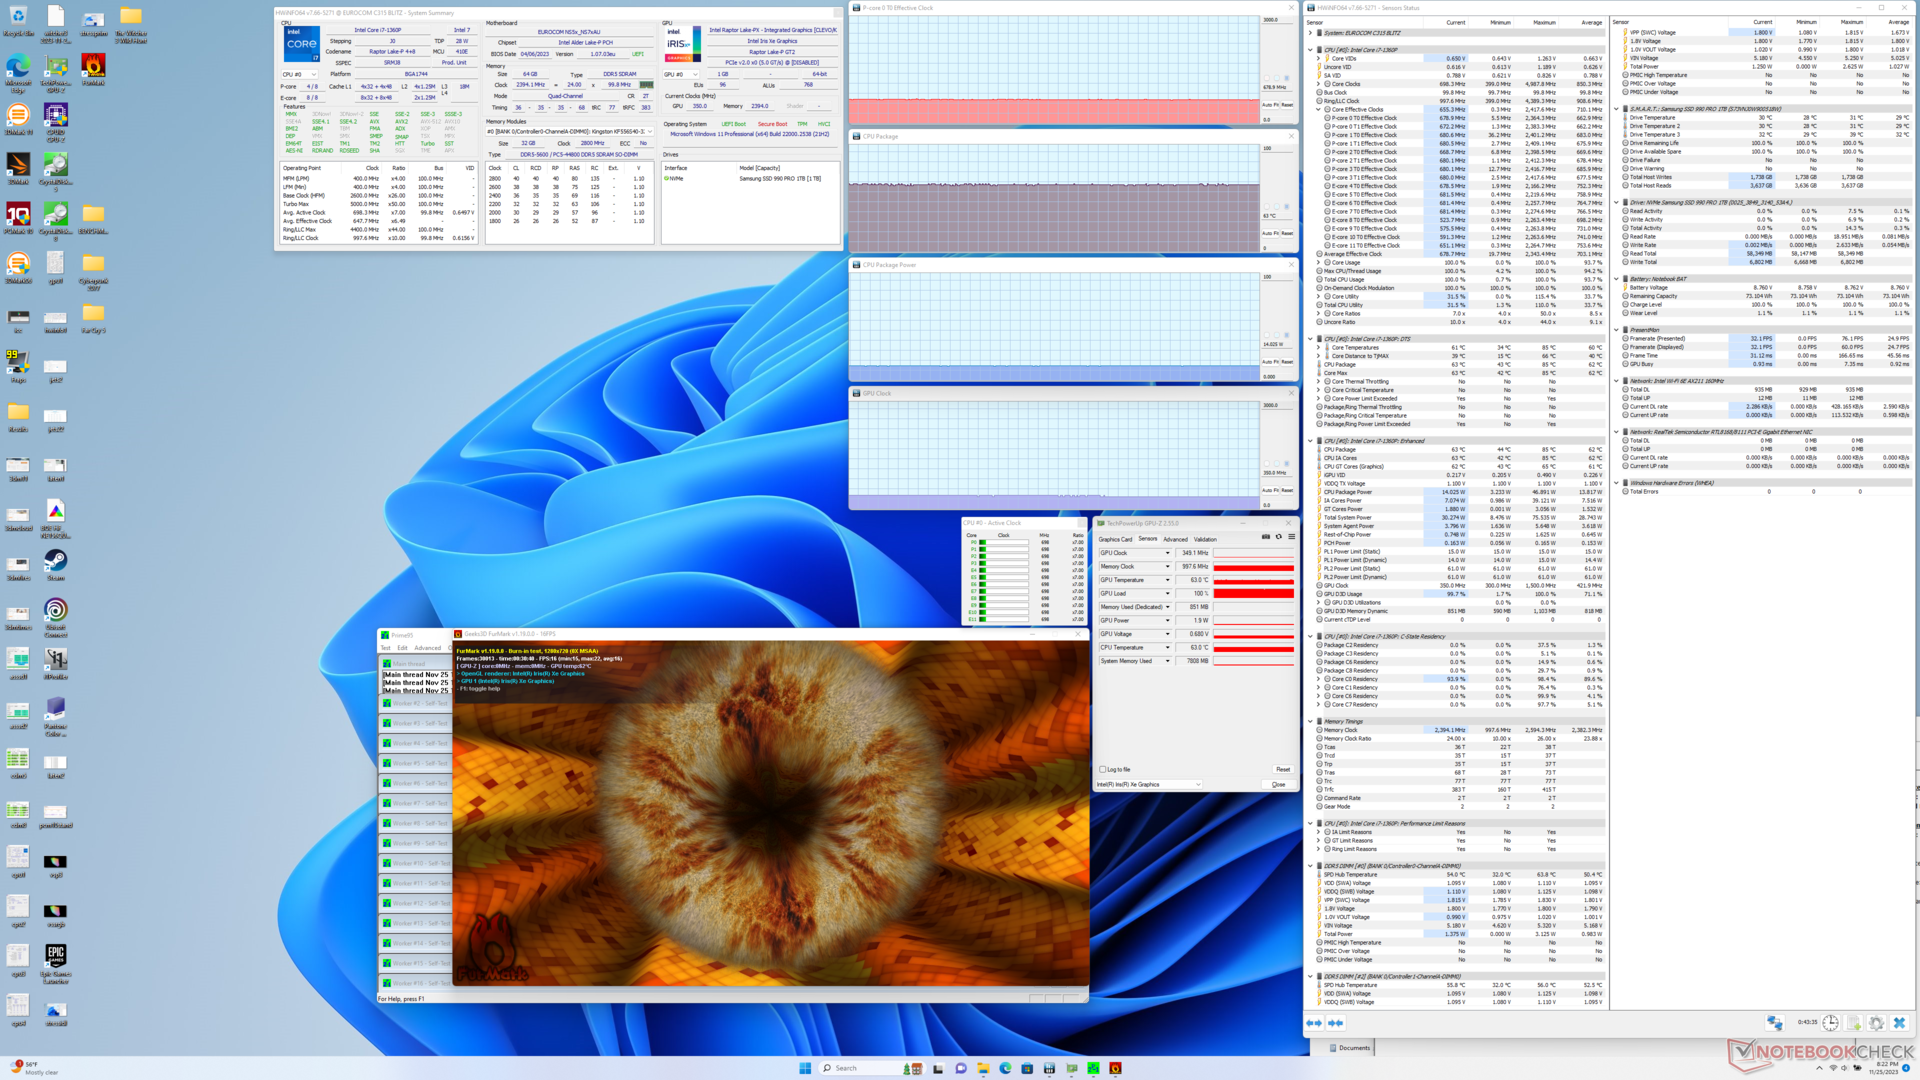
| CPU Clock (GHz) | GPU Clock (MHz) | Average CPU Temperature (°C) | |
| System Idle | -- | -- | 46 |
| Prime95 Stress | 0.7 - 0.8 | -- | 65 |
| Prime95 + FurMark Stress | 0.7 | 350 | 63 |
| Witcher 3 Stress | ~0.4 | 900 | 64 |
Speakers
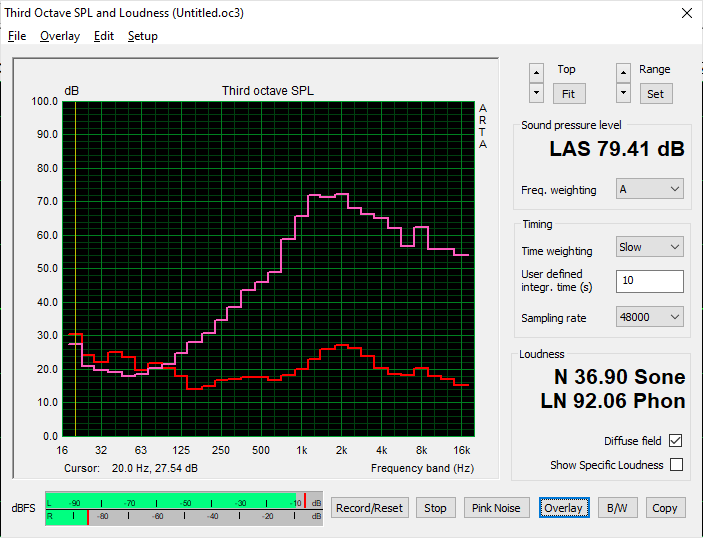
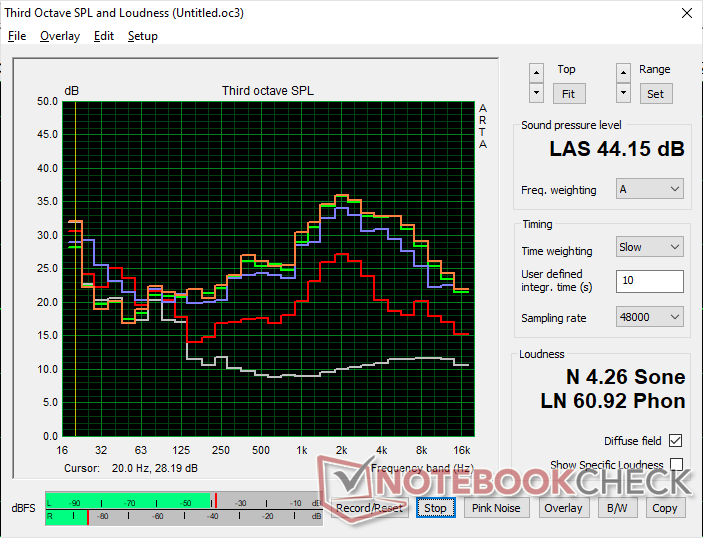
Eurocom C315 Blitz audio analysis
(±) | speaker loudness is average but good (79.4 dB)
Bass 100 - 315 Hz
(-) | nearly no bass - on average 26.1% lower than median
(±) | linearity of bass is average (8% delta to prev. frequency)
Mids 400 - 2000 Hz
(±) | higher mids - on average 11.2% higher than median
(±) | linearity of mids is average (11.5% delta to prev. frequency)
Highs 2 - 16 kHz
(±) | higher highs - on average 6.6% higher than median
(±) | linearity of highs is average (10.4% delta to prev. frequency)
Overall 100 - 16.000 Hz
(-) | overall sound is not linear (35.6% difference to median)
Compared to same class
» 97% of all tested devices in this class were better, 1% similar, 2% worse
» The best had a delta of 7%, average was 21%, worst was 53%
Compared to all devices tested
» 94% of all tested devices were better, 1% similar, 5% worse
» The best had a delta of 4%, average was 23%, worst was 134%
Apple MacBook Pro 16 2021 M1 Pro audio analysis
(+) | speakers can play relatively loud (84.7 dB)
Bass 100 - 315 Hz
(+) | good bass - only 3.8% away from median
(+) | bass is linear (5.2% delta to prev. frequency)
Mids 400 - 2000 Hz
(+) | balanced mids - only 1.3% away from median
(+) | mids are linear (2.1% delta to prev. frequency)
Highs 2 - 16 kHz
(+) | balanced highs - only 1.9% away from median
(+) | highs are linear (2.7% delta to prev. frequency)
Overall 100 - 16.000 Hz
(+) | overall sound is linear (4.6% difference to median)
Compared to same class
» 0% of all tested devices in this class were better, 0% similar, 100% worse
» The best had a delta of 5%, average was 17%, worst was 45%
Compared to all devices tested
» 0% of all tested devices were better, 0% similar, 100% worse
» The best had a delta of 4%, average was 23%, worst was 134%
Energy Management
Power Consumption
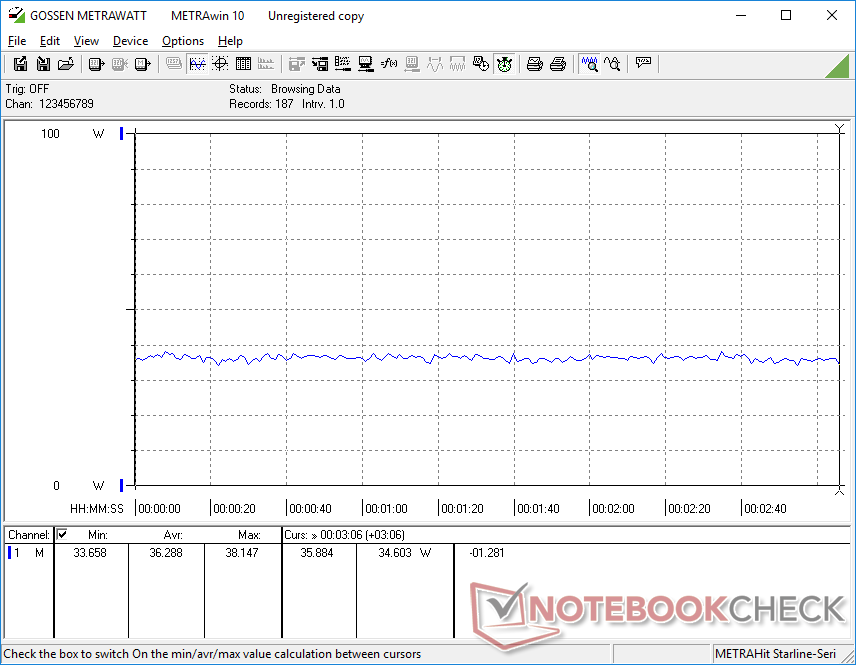
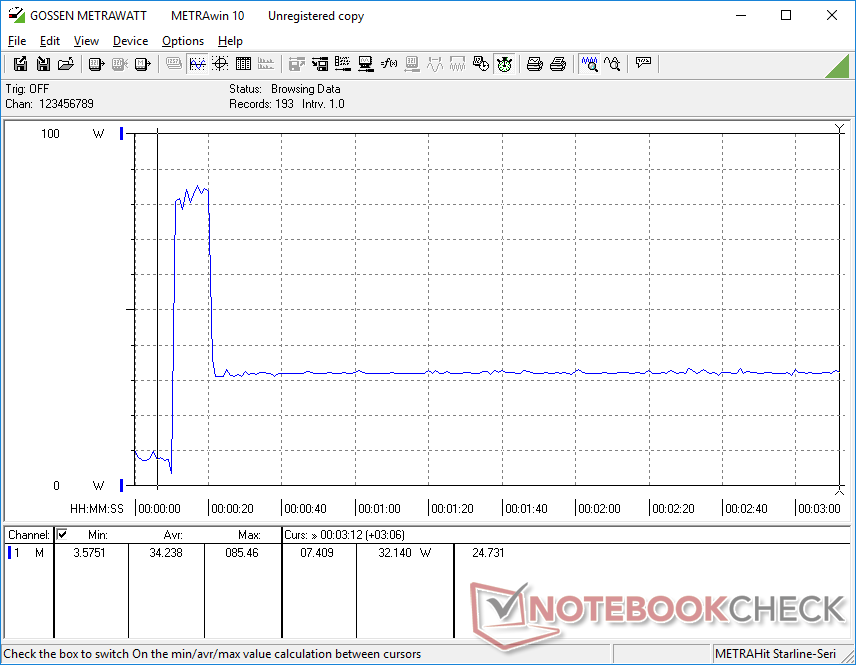
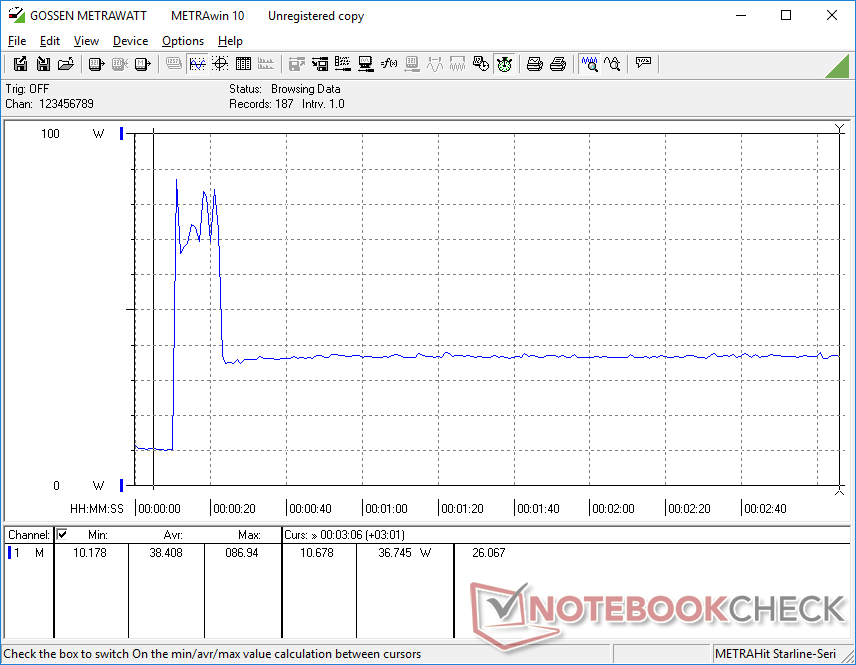
Idling on desktop would draw a few watts more than on the Schenker Work 15 likely due to our higher resolution 4K display. However, consumption would be about the same on average when running higher loads despite any performance or temperature differences between the Core i7-1360P and Core i7-11370H.
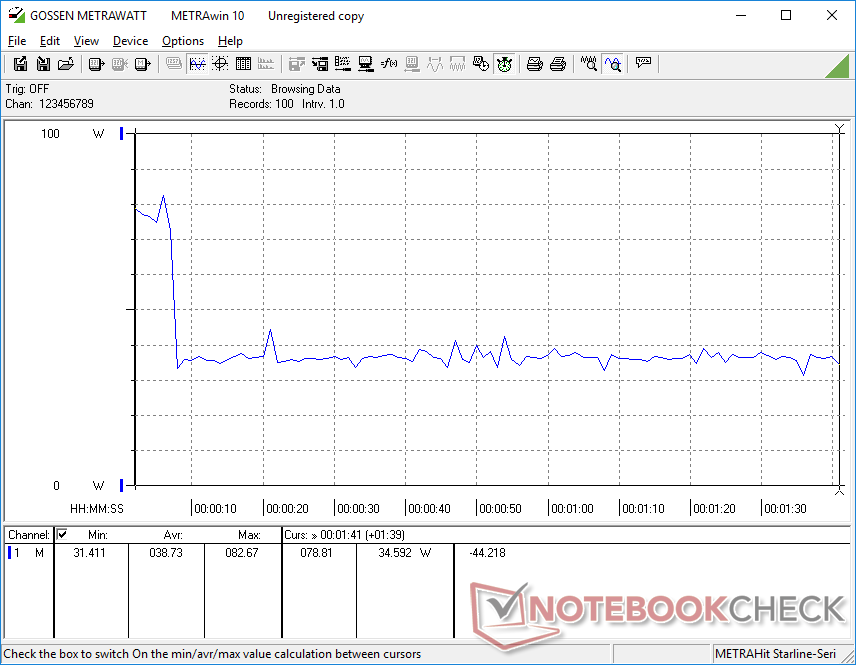
We're able to record a maximum draw of 87 W from the small (~12.5 x 4.8 x 3 cm) 90 W AC adapter when the CPU is at 100 percent utilization. This demand is only temporary before throttling kicks in as shown by our power consumption graphs below.
| Off / Standby | |
| Idle | |
| Load |
|
Key:
min: | |
| Eurocom C315 Blitz i7-1360P, Iris Xe G7 96EUs, Samsung 990 Pro 1 TB, IPS, 3840x2160, 15.6" | Schenker Work 15 Tiger Lake-H i7-11370H, Iris Xe G7 96EUs, Samsung SSD 980 Pro 1TB MZ-V8P1T0BW, IPS, 1920x1080, 15.6" | Lenovo ThinkPad L15 Gen 4 21H70021GE R7 PRO 7730U, Vega 8, SK hynix HFS512GEJ4X113N, IPS, 1920x1080, 15.6" | Acer Aspire 5 A515-58GM-76S8 i7-1355U, GeForce RTX 2050 Mobile, Micron 2450 1TB MTFDKBA1T0TFK, IPS, 1920x1080, 15.6" | Asus VivoBook S15 M3502RA-L1029W R7 6800H, Radeon 680M, WD PC SN735 SDBPNHH-512G, OLED, 1920x1080, 15.6" | Samsung Galaxy Book2 15 i7-1260P, A350M, Samsung PM991 MZVLQ512HBLU, IPS, 1920x1080, 15.6" | |
|---|---|---|---|---|---|---|
| Power Consumption | 18% | 22% | -6% | -5% | 6% | |
| Idle Minimum * (Watt) | 9.4 | 4.5 52% | 4.5 52% | 4.31 54% | 4.4 53% | 4 57% |
| Idle Average * (Watt) | 11.5 | 8.5 26% | 8.5 26% | 6.52 43% | 5.1 56% | 7.8 32% |
| Idle Maximum * (Watt) | 12.1 | 9.1 25% | 10.5 13% | 8.037 34% | 9.3 23% | 8.5 30% |
| Load Average * (Watt) | 38.7 | 43.5 -12% | 35.6 8% | 75.2 -94% | 67 -73% | 59.1 -53% |
| Witcher 3 ultra * (Watt) | 36.3 | 37.5 -3% | 37.4 -3% | 60.8 -67% | 66.4 -83% | 56.7 -56% |
| Load Maximum * (Watt) | 87 | 69.4 20% | 57.9 33% | 89.5 -3% | 93.5 -7% | 62.4 28% |
* ... smaller is better
Power Consumption Witcher 3 / Stresstest
Power Consumption external Monitor
Battery Life
WLAN runtime is noticeably shorter than on the older Schenker Work 15 by over 2 hours. The discrepancy can be attributed to our higher resolution 4K display. Our Core-P CPU would also boost to higher clock rates and consumption levels than the older 11th gen Core i7 to impact battery life even more.
Charging from empty to full capacity takes just over 90 minutes.
| Eurocom C315 Blitz i7-1360P, Iris Xe G7 96EUs, 73 Wh | Schenker Work 15 Tiger Lake-H i7-11370H, Iris Xe G7 96EUs, 73 Wh | Lenovo ThinkPad L15 Gen 4 21H70021GE R7 PRO 7730U, Vega 8, 57 Wh | Acer Aspire 5 A515-58GM-76S8 i7-1355U, GeForce RTX 2050 Mobile, 48 Wh | Asus VivoBook S15 M3502RA-L1029W R7 6800H, Radeon 680M, 70 Wh | Samsung Galaxy Book2 15 i7-1260P, A350M, 54 Wh | |
|---|---|---|---|---|---|---|
| Battery runtime | 27% | 49% | 9% | 44% | 2% | |
| WiFi v1.3 (h) | 8 | 10.2 27% | 11.9 49% | 8.7 9% | 11.5 44% | 8.2 2% |
| Reader / Idle (h) | 24.5 | 25.1 | ||||
| H.264 (h) | 9.6 | 9.5 | 6.6 | 12.8 | 10.6 | |
| Load (h) | 2.2 | 2.2 | 2 | 1 | 1.5 |
Pros
Cons
Verdict — CPU Performance Could Use Some Work
The Core i7-1360P helps to distinguish the Eurocom C315 Blitz from most other laptops as this CPU option is somewhat uncommon. Unfortunately, the processor throttles too heavily on the Eurocom to the point where overall performance can be identical to the Core i7-11370H or even slower than the less expensive Core i5-1340P. The LG Gram 2-in-1 16, which ships with the same Core i7-1360P option, is able to run the CPU up to 80 percent faster than our Eurocom.
The Eurocom C315 Blitz is dragged down by the throttle-prone Core i7-1360P CPU and lack of display options.
Other major aspects of the model are lacking in terms of features. The 4K panel, for example, offers no DCI-P3 colors, high refresh rates, or HDR support which certain professionals or multimedia users might value. Battery life and webcam quality are also merely average or underwhelming.
The Clevo X170KM base could certainly use a facelift with additional performance tuning, fan noise tuning, and display features especially when you consider the $1300 USD starting price. The $1000 to $1500 range is already extremely competitive in this space with professional options like the Lenovo ThinkPad L15, HP ProBook, or the Dell Latitude series.
Price and Availability
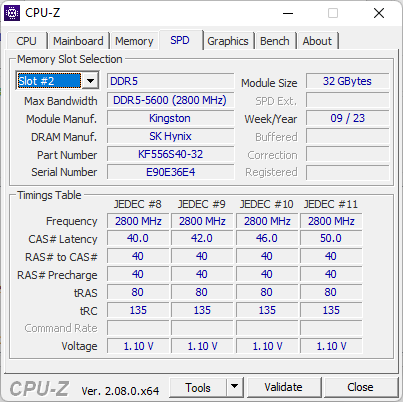
Eurocom is now shipping the C315 Blitz starting at $1300 USD for the base configuration to over $2500 if configured with 64 GB of RAM and a 1 TB SSD like ours.
Eurocom C315 Blitz
- 11/29/2023 v7 (old)
Allen Ngo
Transparency
The selection of devices to be reviewed is made by our editorial team. The test sample was provided to the author as a loan by the manufacturer or retailer for the purpose of this review. The lender had no influence on this review, nor did the manufacturer receive a copy of this review before publication. There was no obligation to publish this review. As an independent media company, Notebookcheck is not subjected to the authority of manufacturers, retailers or publishers.
This is how Notebookcheck is testing
Every year, Notebookcheck independently reviews hundreds of laptops and smartphones using standardized procedures to ensure that all results are comparable. We have continuously developed our test methods for around 20 years and set industry standards in the process. In our test labs, high-quality measuring equipment is utilized by experienced technicians and editors. These tests involve a multi-stage validation process. Our complex rating system is based on hundreds of well-founded measurements and benchmarks, which maintains objectivity. Further information on our test methods can be found here.
Price comparison
