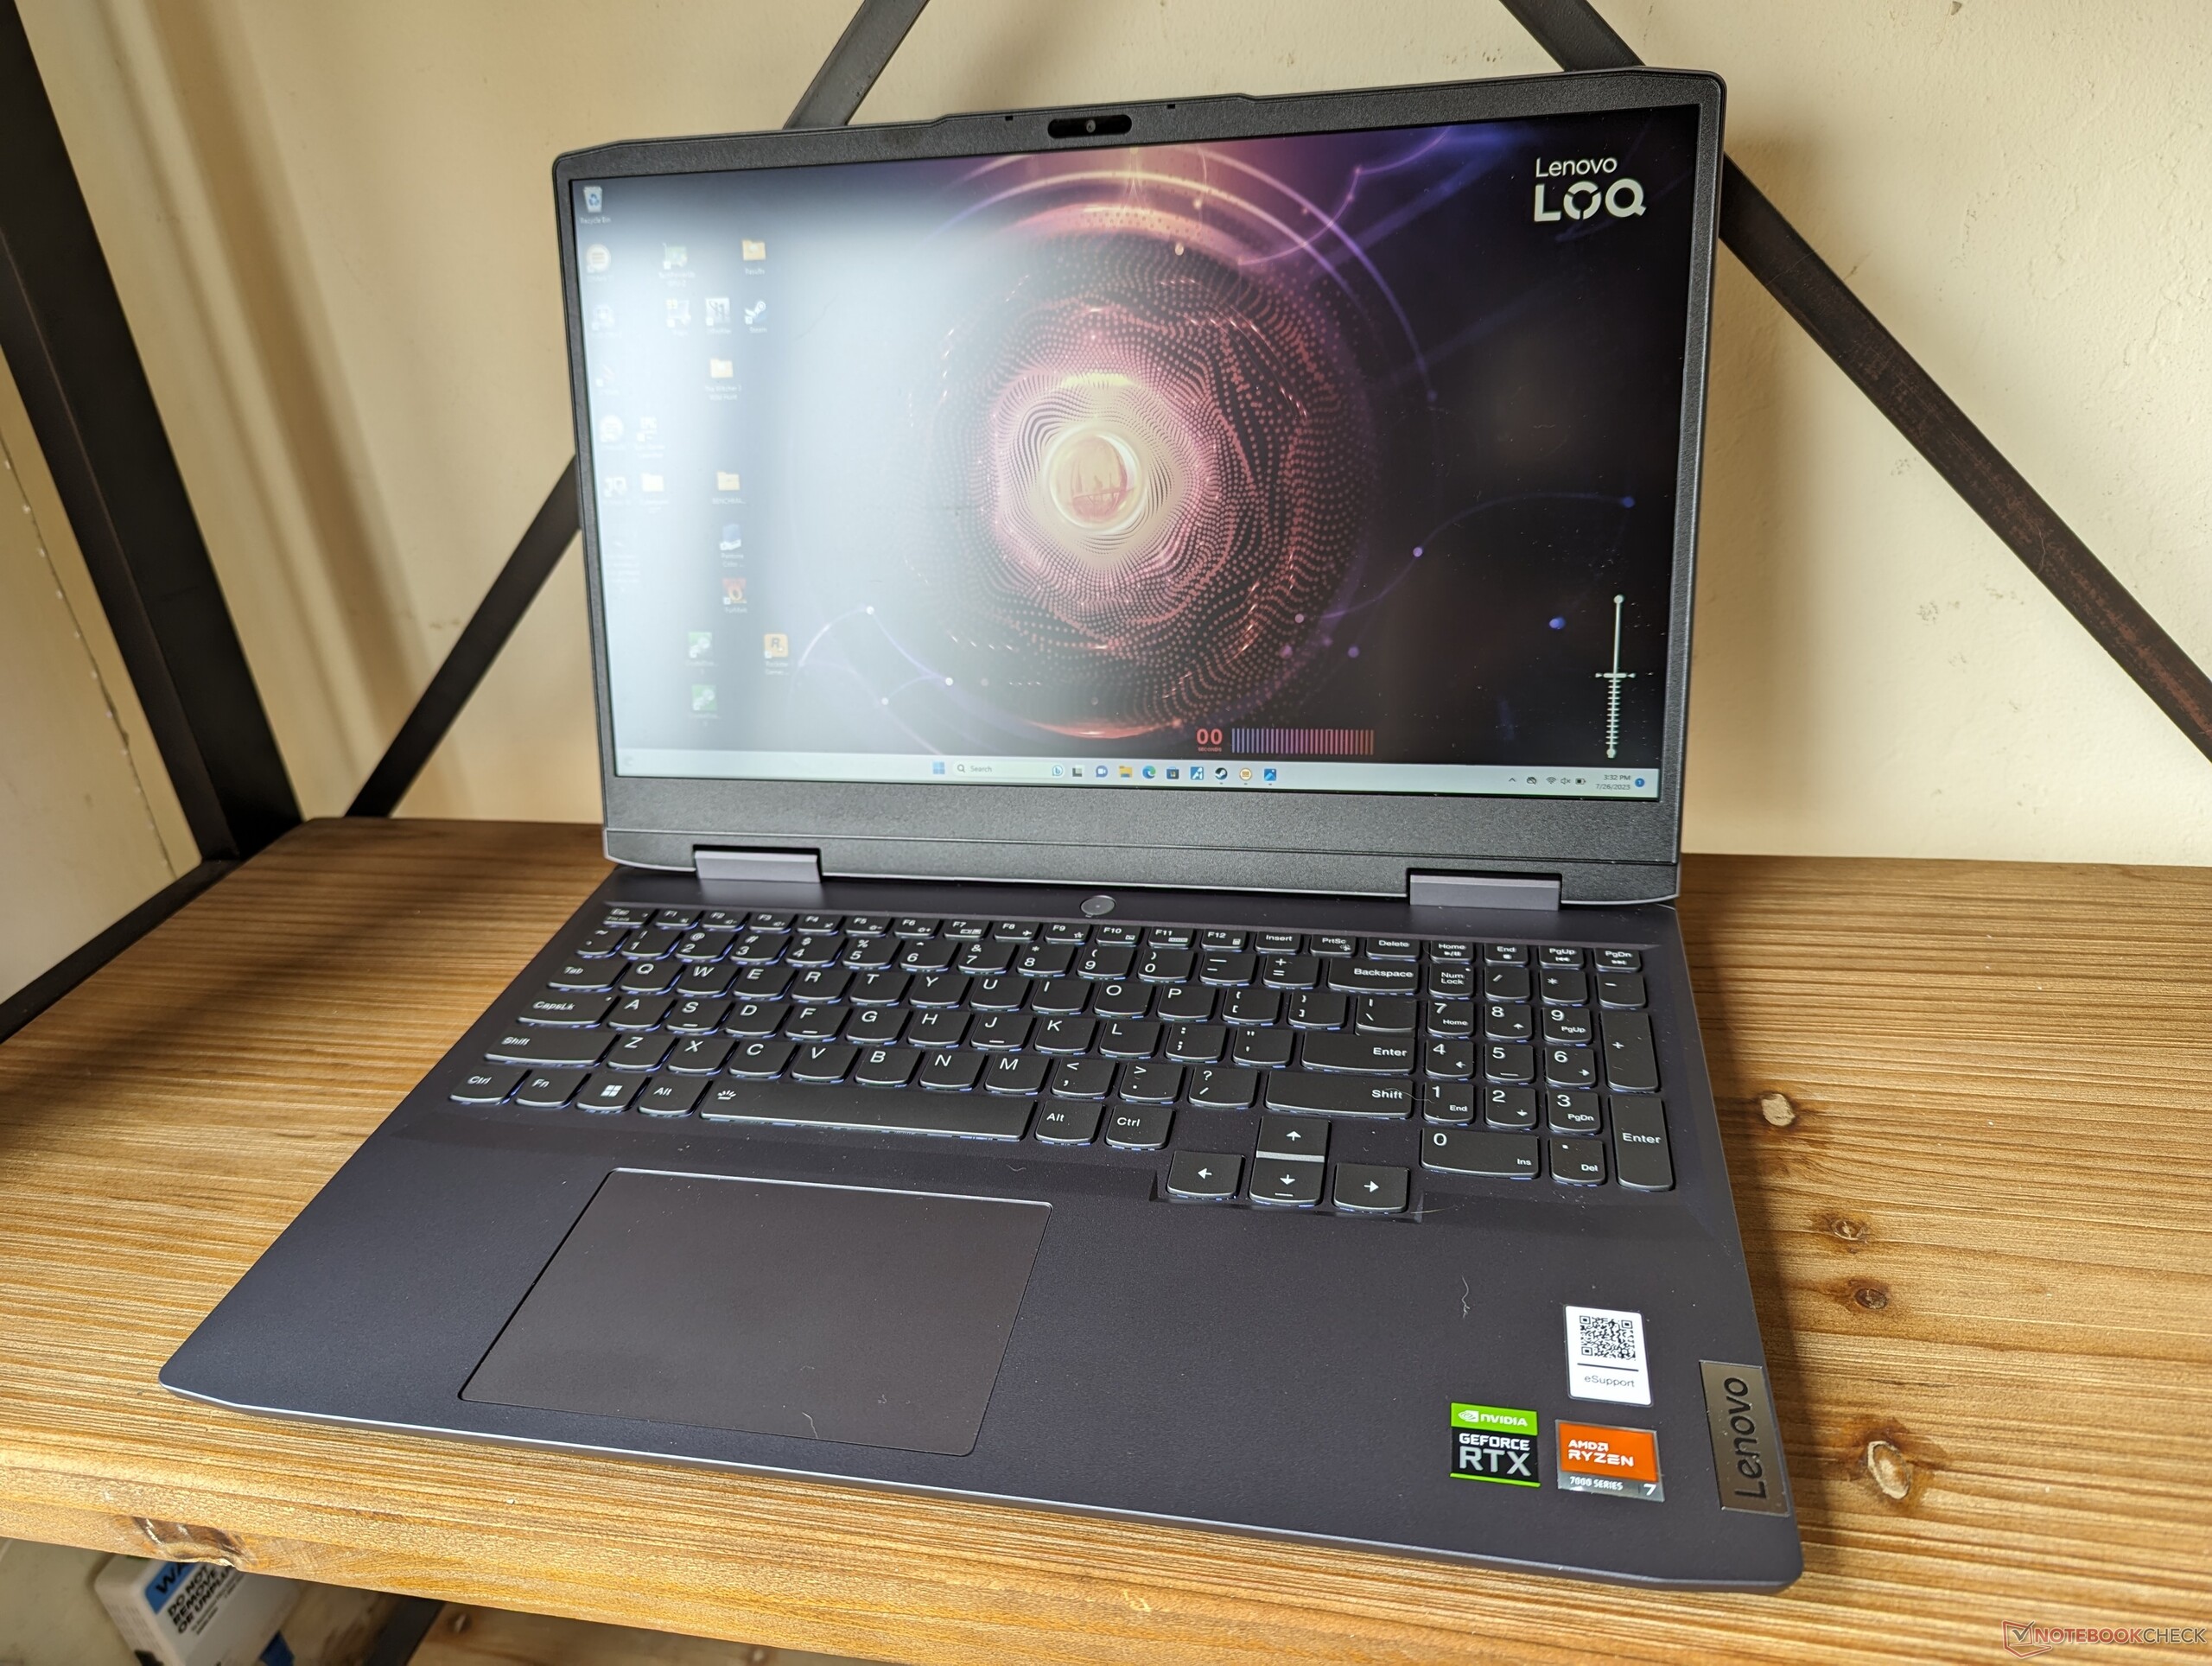
Lenovo LOQ 15 Ryzen 7 7840HS laptop review: Don't call it a Legion

The LOQ family consists of Lenovo's budget gaming laptops designed to replace the older IdeaPad Gaming 3 series. The new LOQ name helps to create distance between its budget gaming products and the more home office or student-oriented Ideapad series. It is also distinctly not a Legion product as Lenovo wants to position the Legion name as a "flagship" series with high-end gaming machines only.
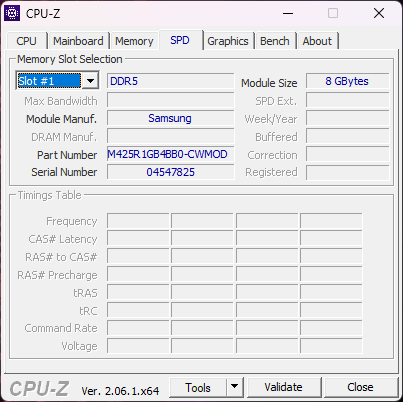
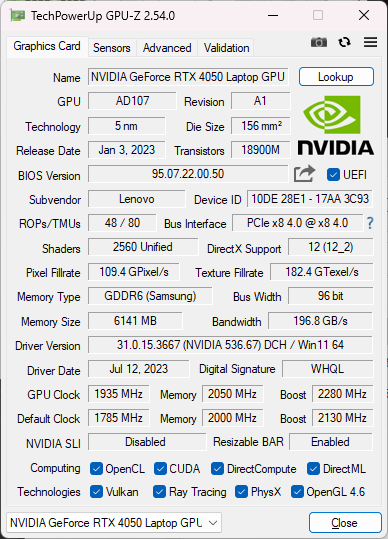
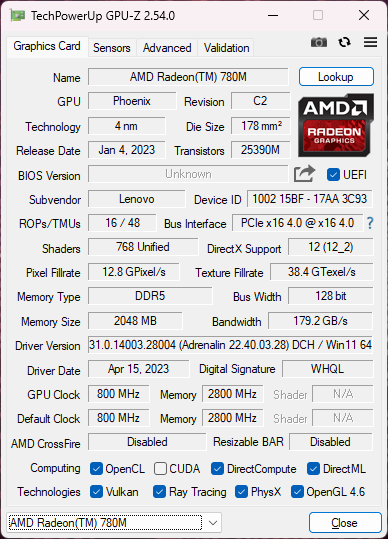
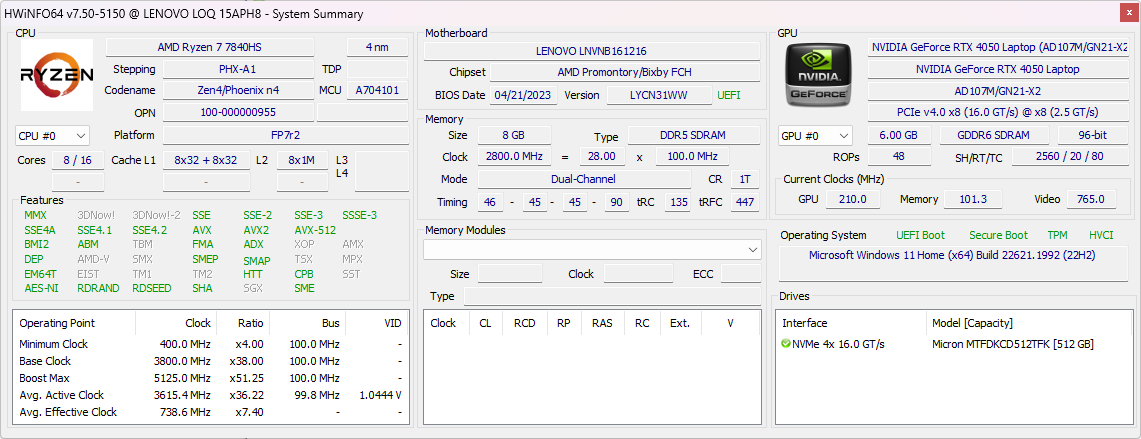
Our unit in review is a midrange AMD version (15APH8) with the Zen 4 Ryzen 7 7840HS CPU, GeForce RTX 4050 GPU, and 1080p 144 Hz IPS display retailing for roughly $1000 USD. It only comes with 8 GB of RAM, but this is fortunately user-upgradeable. Cheaper and more expensive SKUs exist with the Ryzen 5 7640HS, RTX 3050 or 4060, and 1080p 60 Hz to 1440p 165 Hz display ranging from under $800 USD to over $1100 USD. Intel versions of the LOQ 15 (15IRH8) are also available in both 15-inch and 16-inch (LOQ 16) screen sizes.
Competitors include other budget 15-inch gaming laptops like the Dell G15 5530, Asus TUF A15 FA507, MSI Cyborg 15, or HP Victus 15.
More Lenovo reviews:
Potential Competitors in Comparison
Rating | Date | Model | Weight | Height | Size | Resolution | Price |
|---|---|---|---|---|---|---|---|
| 85.7 % v7 (old) | 07 / 2023 | Lenovo LOQ 15APH8 R7 7840HS, GeForce RTX 4050 Laptop GPU | 2.5 kg | 25.2 mm | 15.60" | 1920x1080 | |
| 87.5 % v7 (old) | 11 / 2022 | Lenovo Legion 5 15IAH7H 82RB i7-12700H, GeForce RTX 3060 Laptop GPU | 2.4 kg | 19.99 mm | 15.60" | 1920x1080 | |
| 84.2 % v7 (old) | 06 / 2023 | Dell G15 5530 i7-13650HX, GeForce RTX 4060 Laptop GPU | 3 kg | 26.95 mm | 15.60" | 1920x1080 | |
| 86.3 % v7 (old) | 06 / 2023 | Asus TUF A15 FA507 R7 7735HS, GeForce RTX 4050 Laptop GPU | 2.2 kg | 24.9 mm | 15.60" | 1920x1080 | |
| 82.4 % v7 (old) | 04 / 2023 | MSI Cyborg 15 A12VF i7-12650H, GeForce RTX 4060 Laptop GPU | 2 kg | 22.9 mm | 15.60" | 1920x1080 | |
| 81 % v7 (old) | 12 / 2022 | HP Victus 15 fa0020nr i7-12700H, GeForce RTX 3050 Ti Laptop GPU | 2.3 kg | 23.6 mm | 15.60" | 1920x1080 |
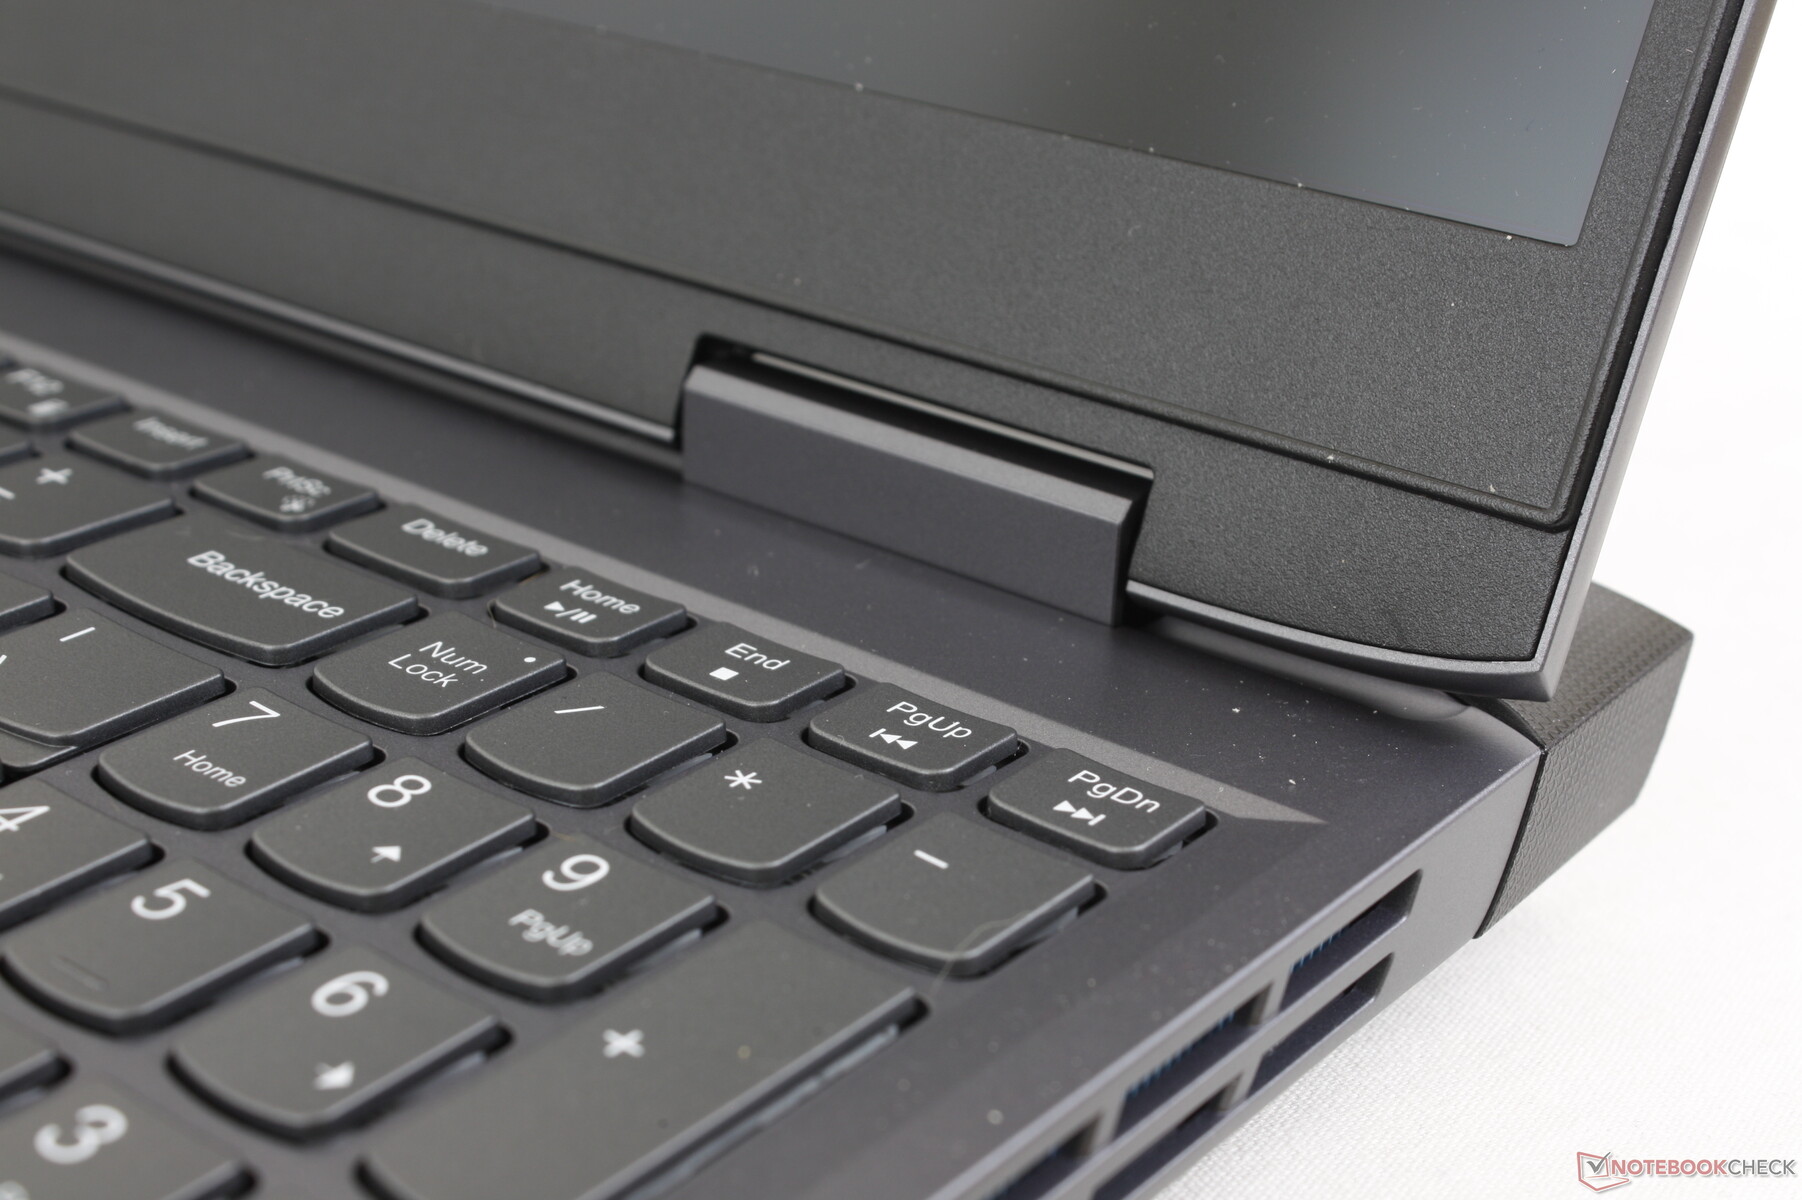
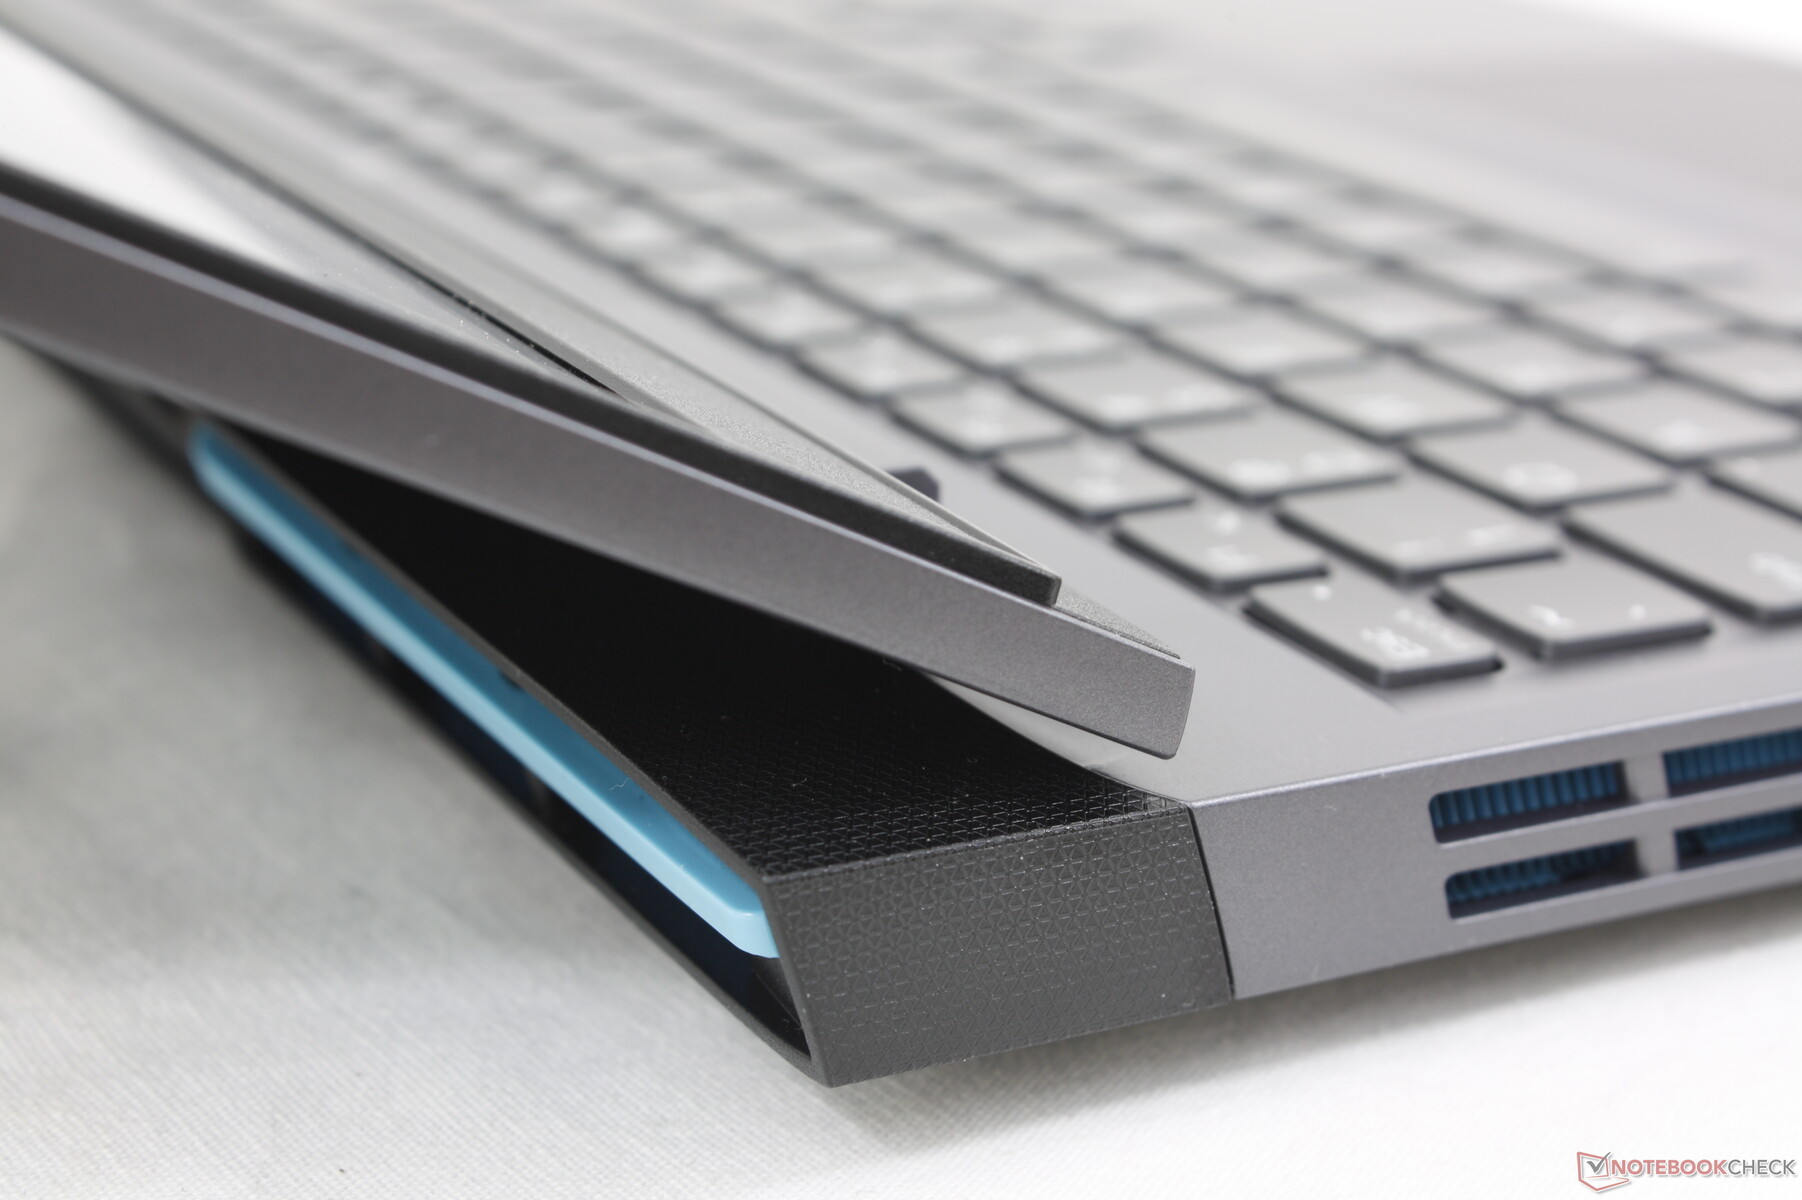
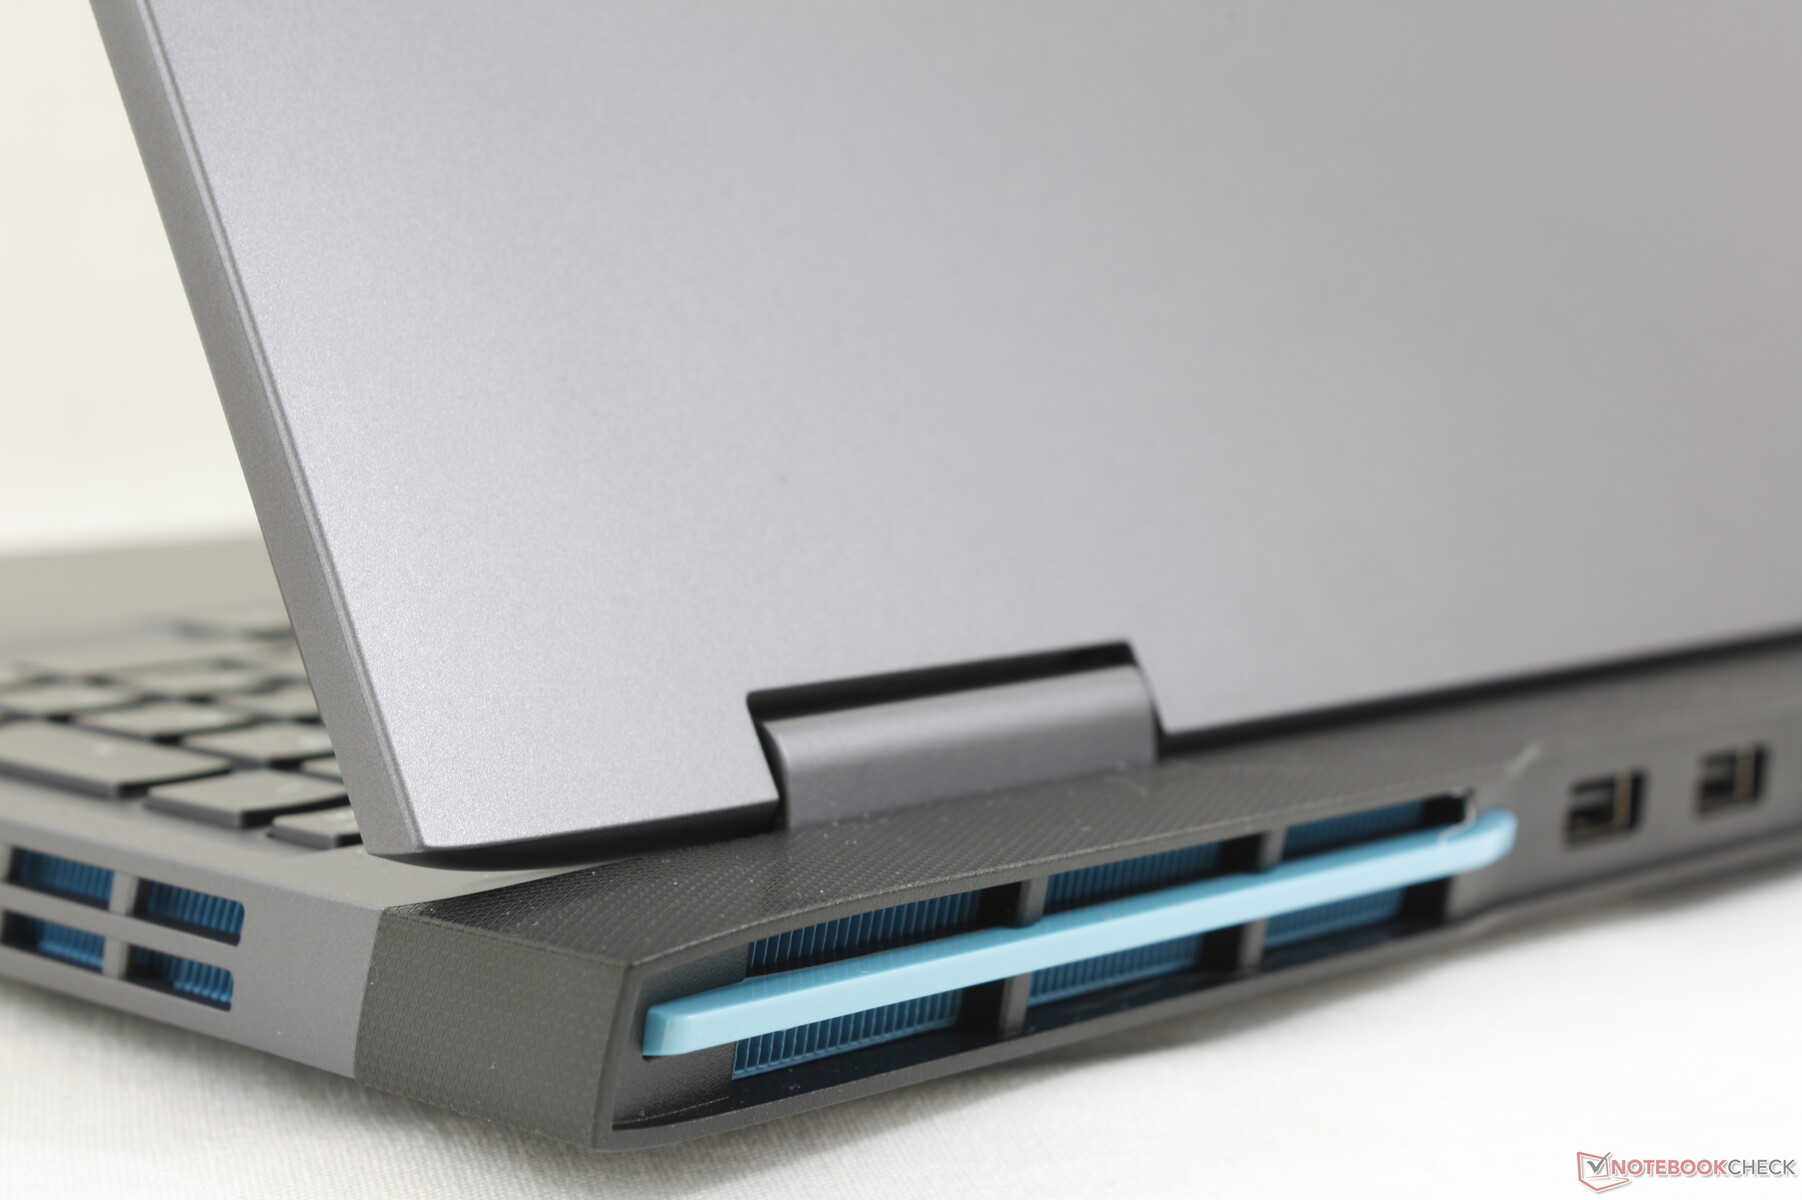
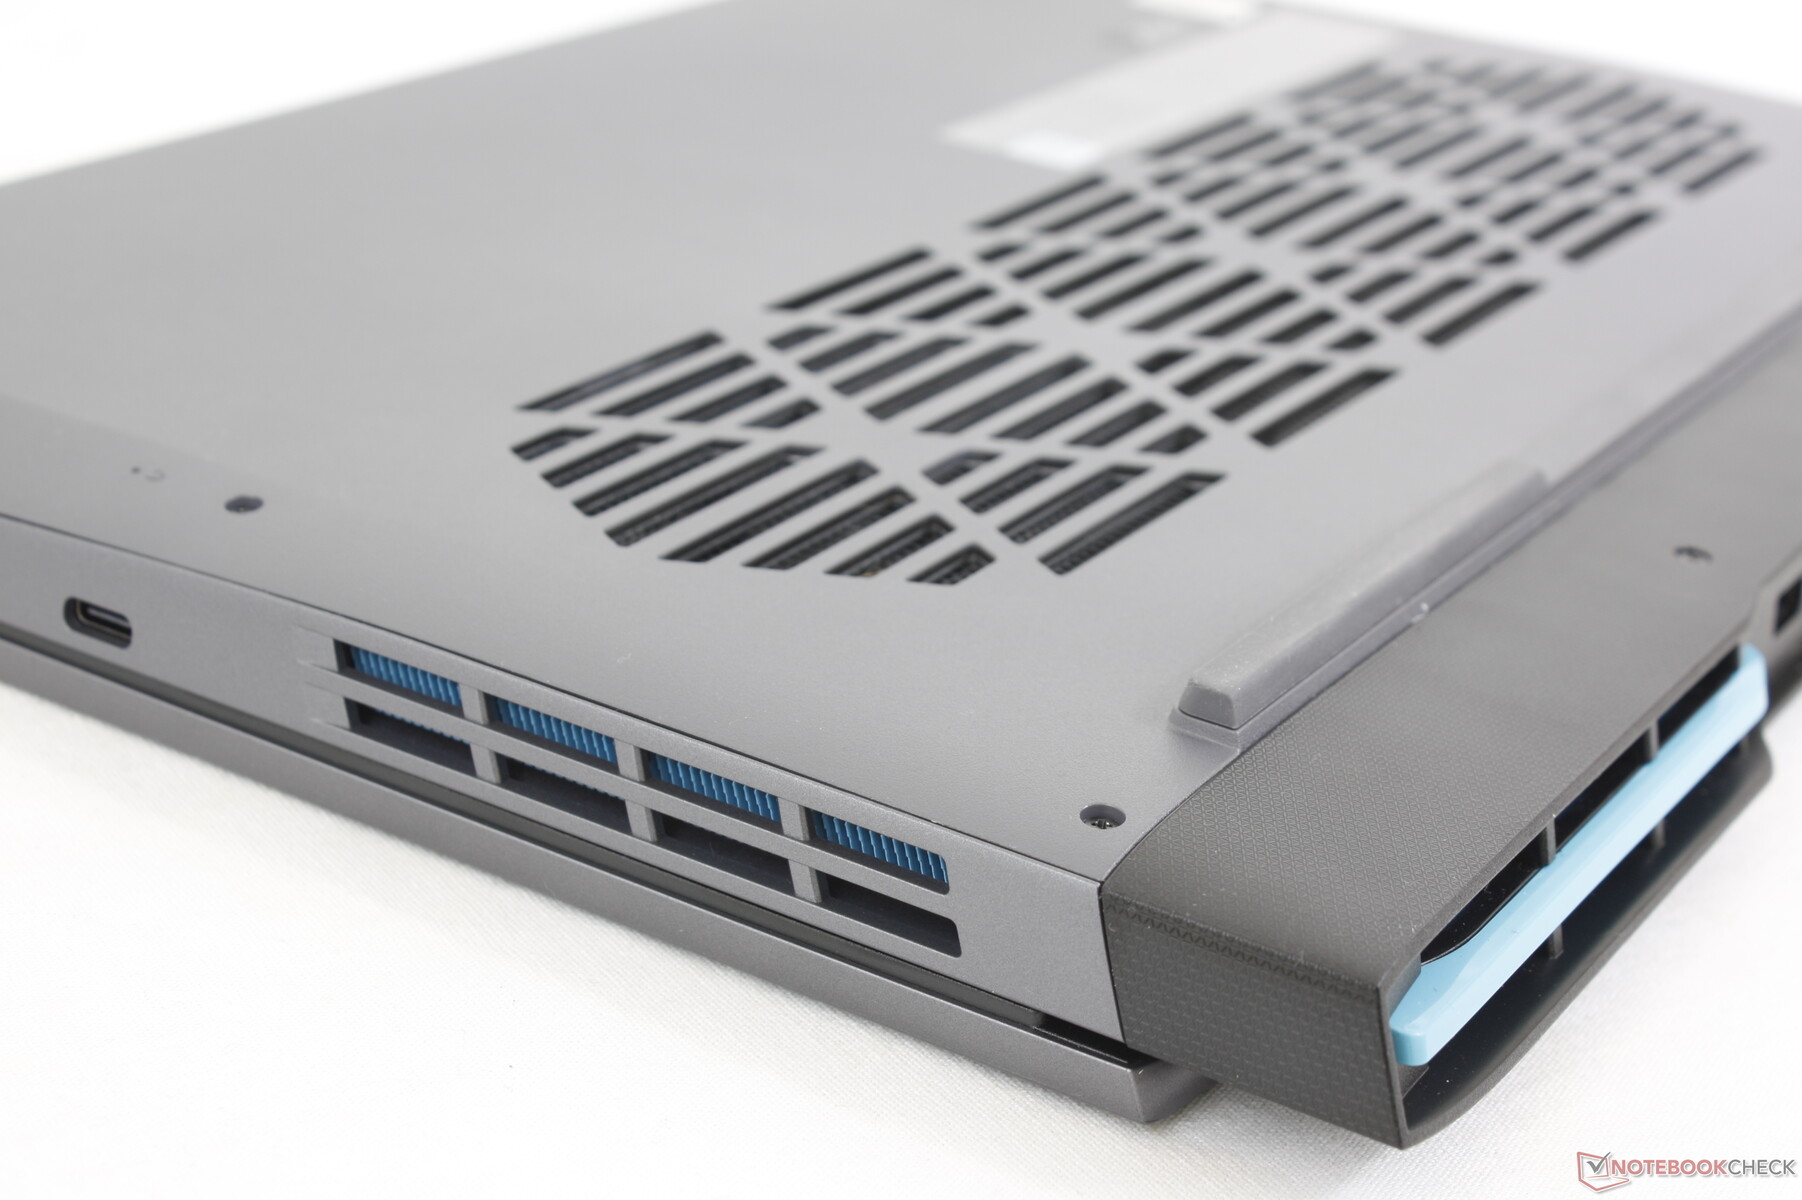
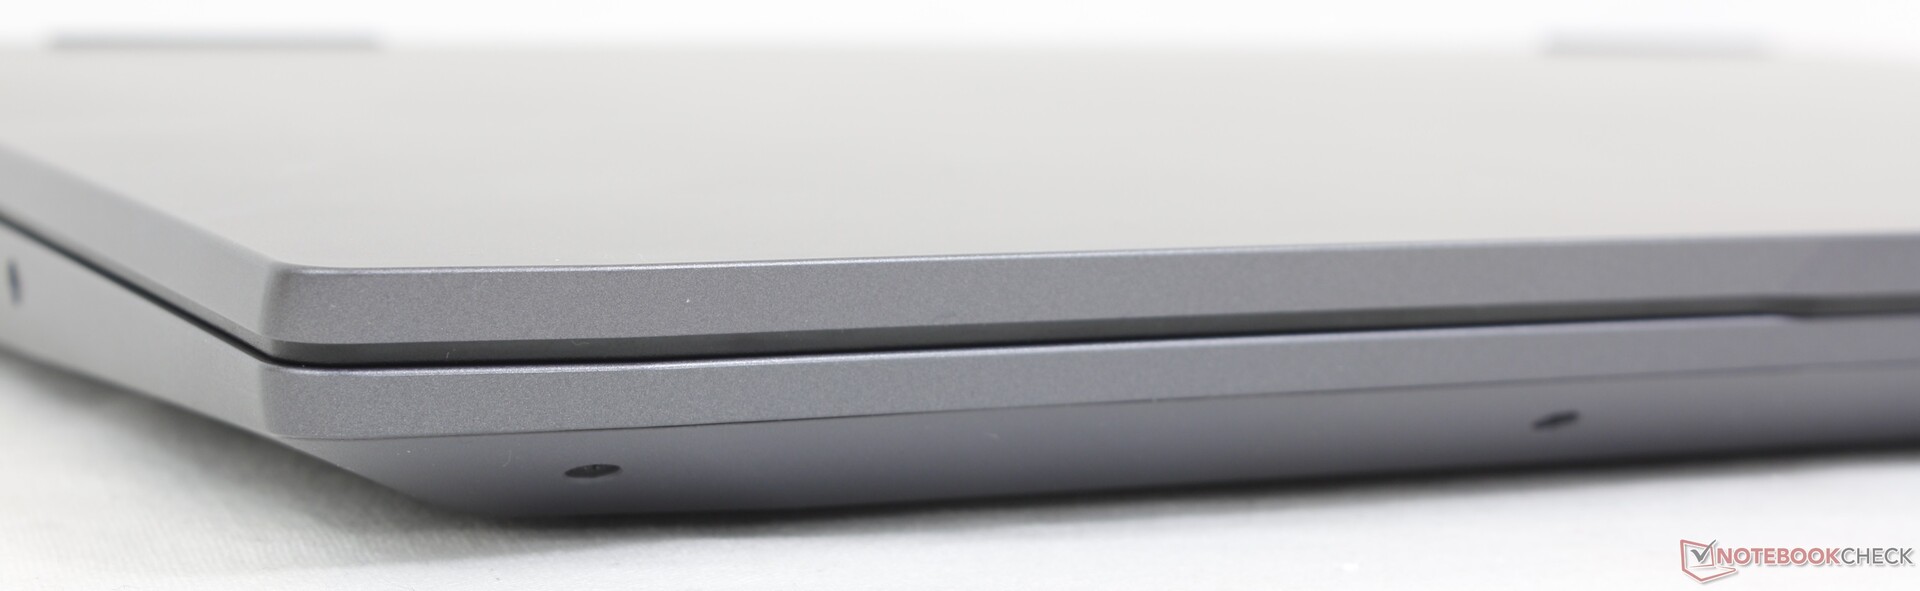
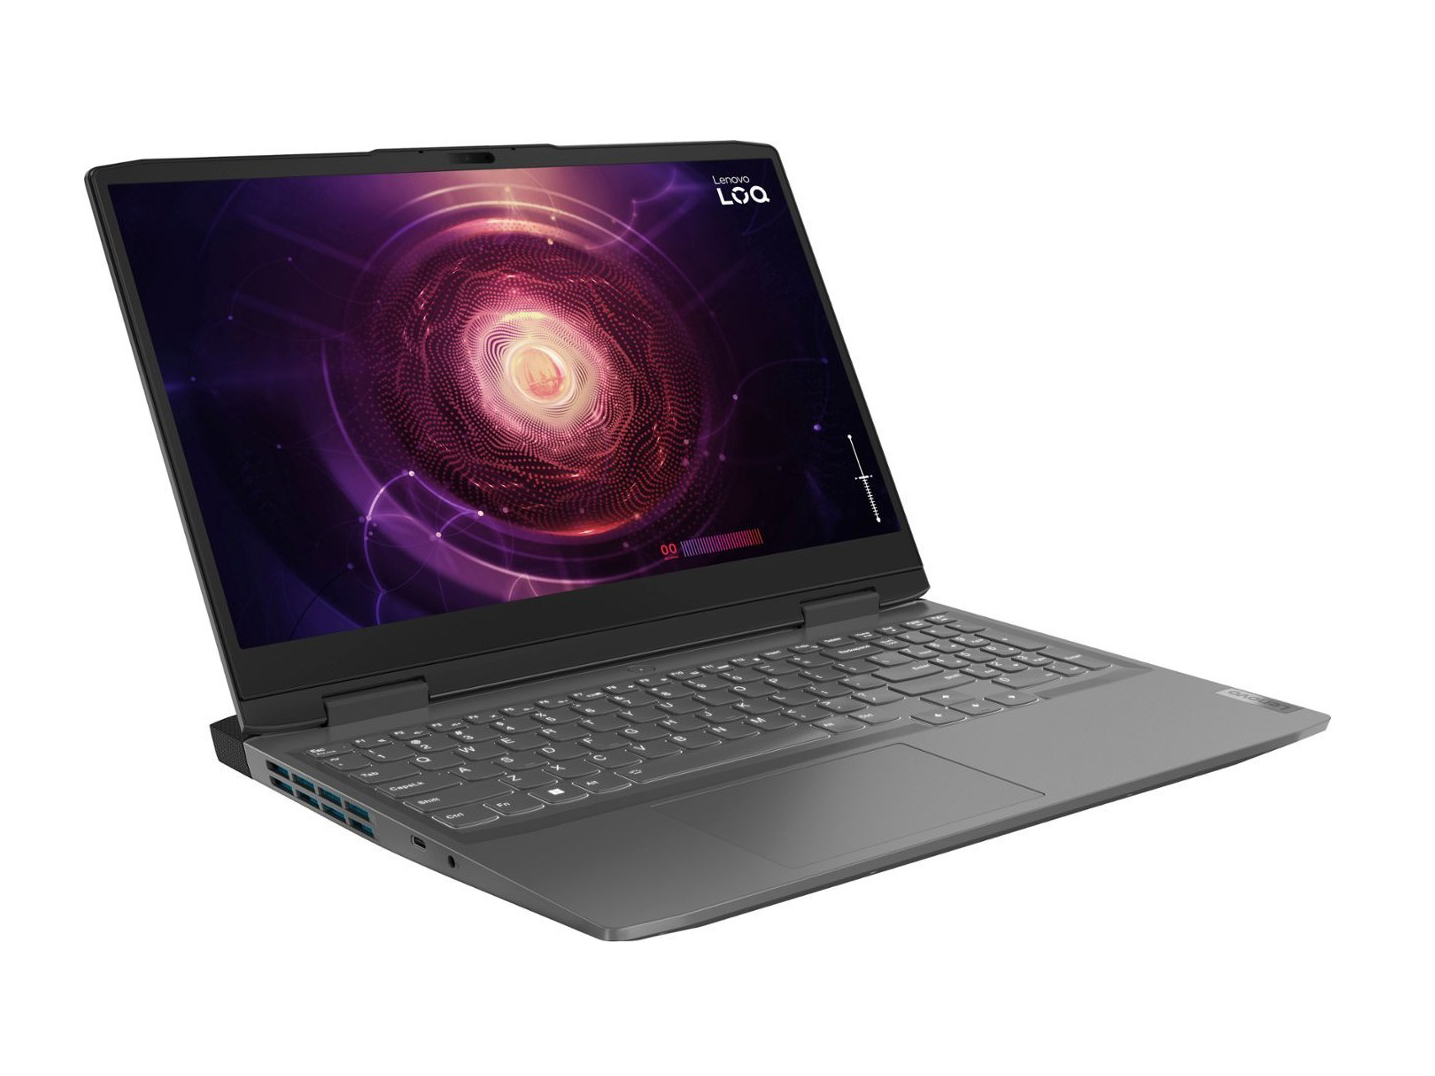
Case — Essentially A Plastic Legion
Just because it's not a Legion product doesn't mean it can't be inspired by the Legion design. The LOQ 15 chassis can be best described as a watered-down Legion 5 15 as all the metal skeleton materials of the Legion have been replaced with ABS plastic on both the top cover and bottom. It feels cheaper as a result of these changes, but that is par for the course when compared to other budget gaming laptops like the MSI Cyborg 15 or HP Victus 15 which are also predominantly plastic.
Chassis rigidity is weakest on the palm rests and keyboard center. Applying pressure on these areas would warp the surface slightly more than on most other gaming laptops including the inexpensive ones like the HP Victus 15. It's thankfully not a cause for concern or anything and the rest of the laptop feels solid for the price.
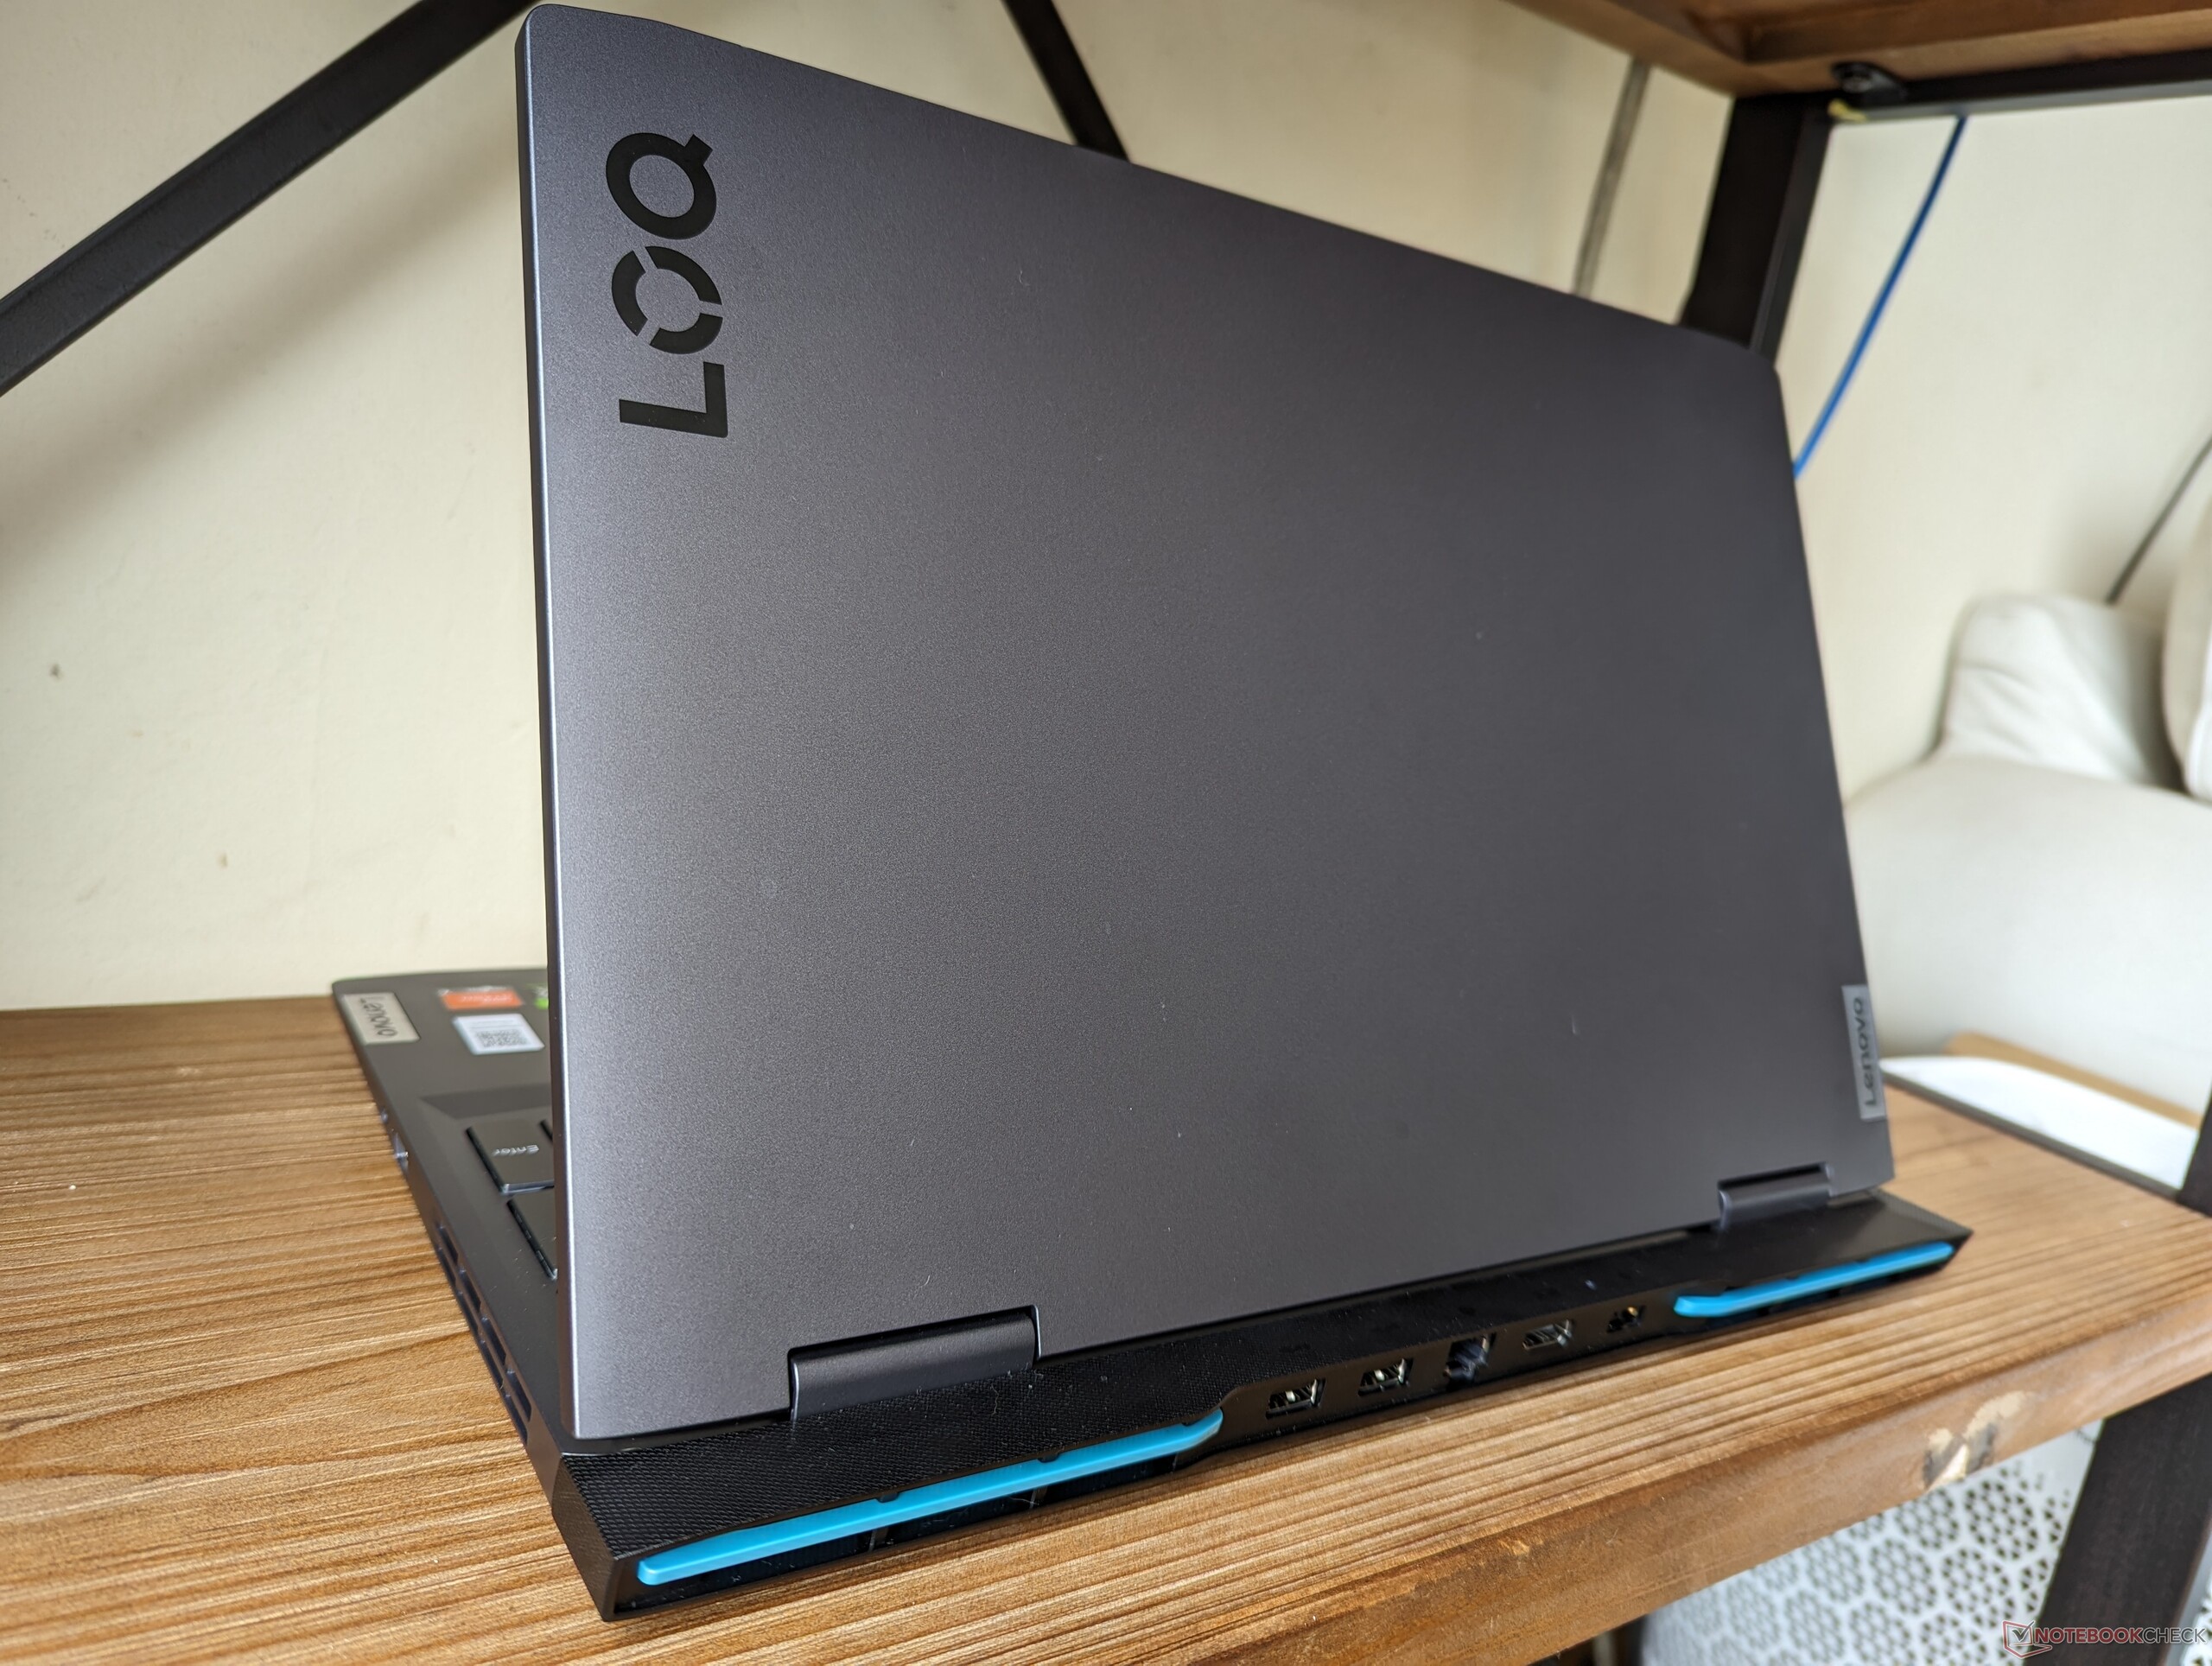
The LOQ 15 is slightly thicker and heavier than most other budget gaming laptops including the Asus TUF A15, HP Victus 15, or MSI Cyborg 15 due in part to its large extended rear. A notable exception is the bulky Dell G15 5530 which is even heavier and larger.
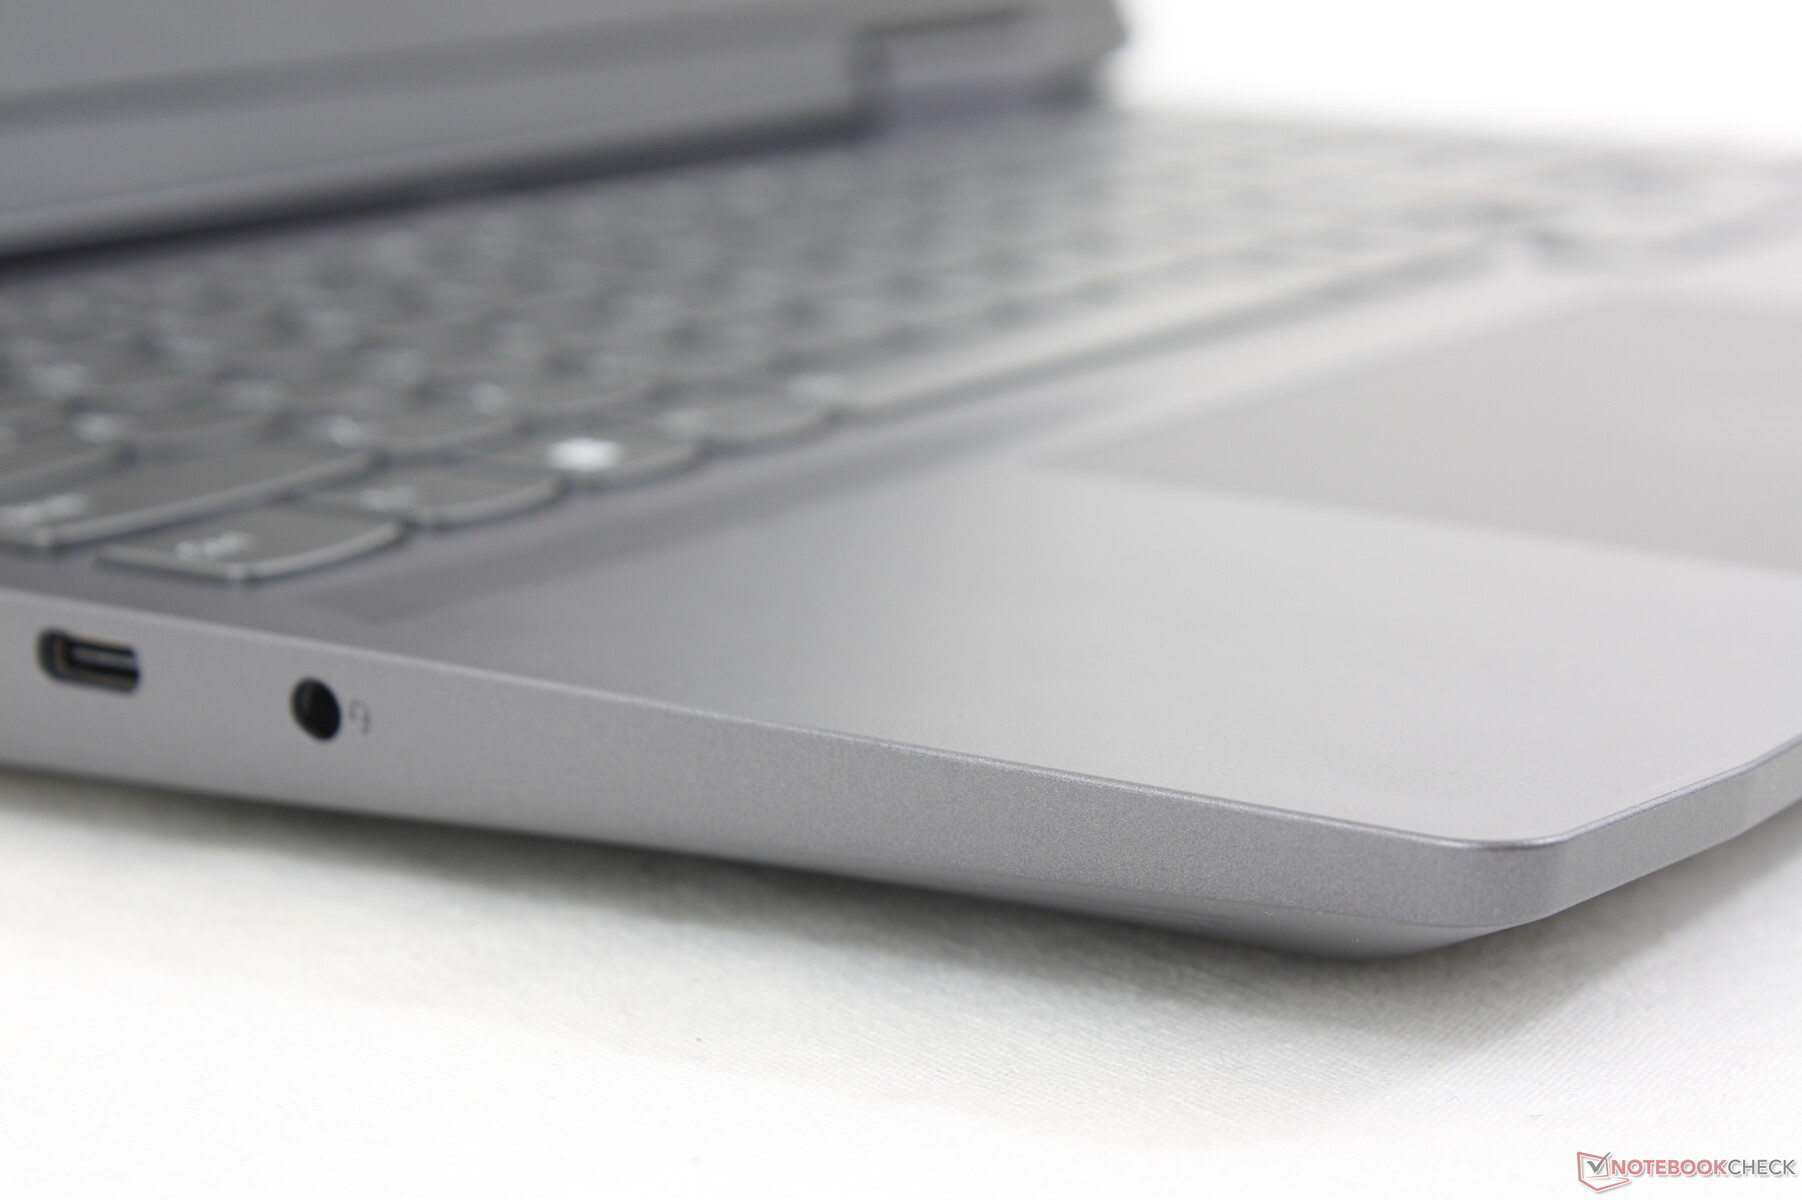
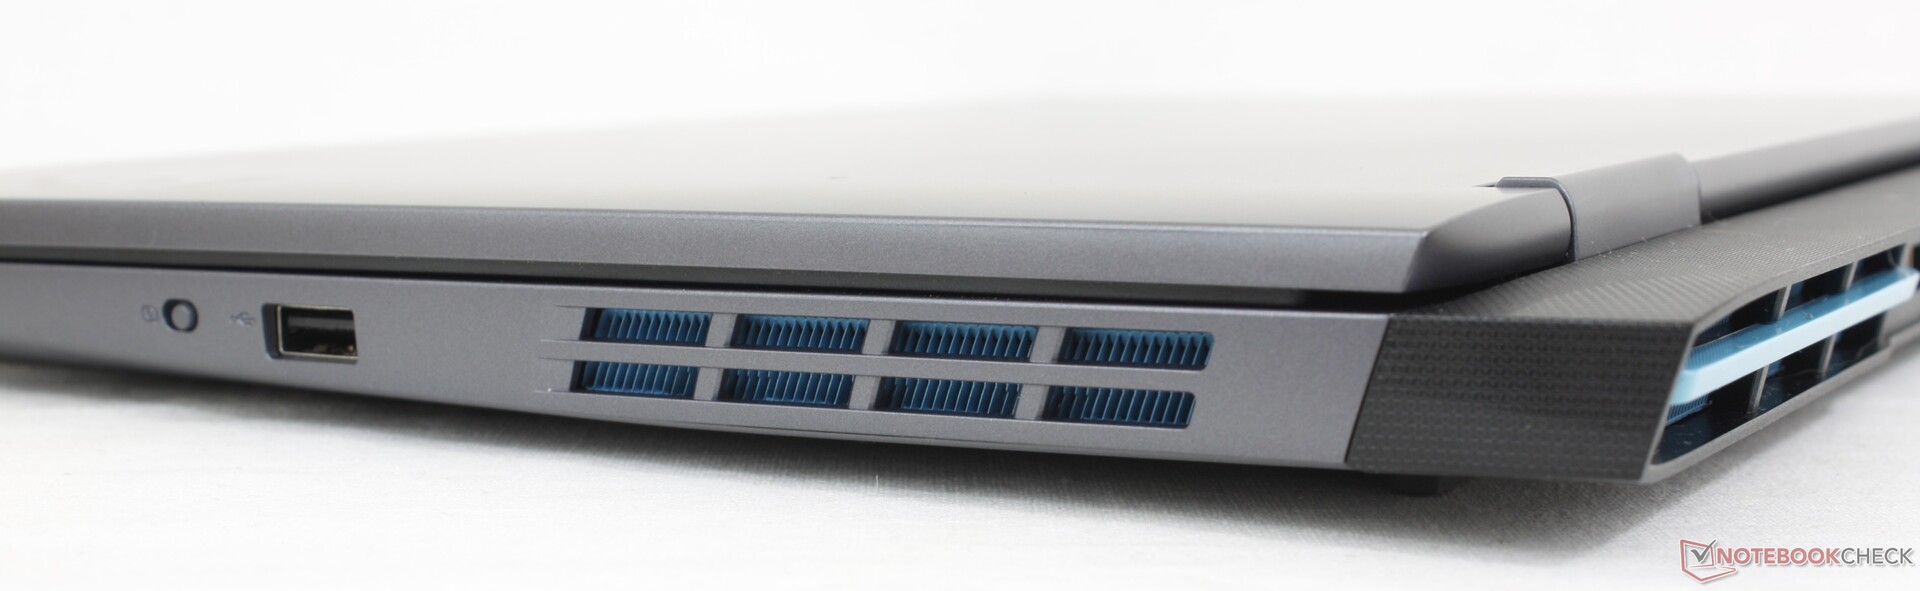
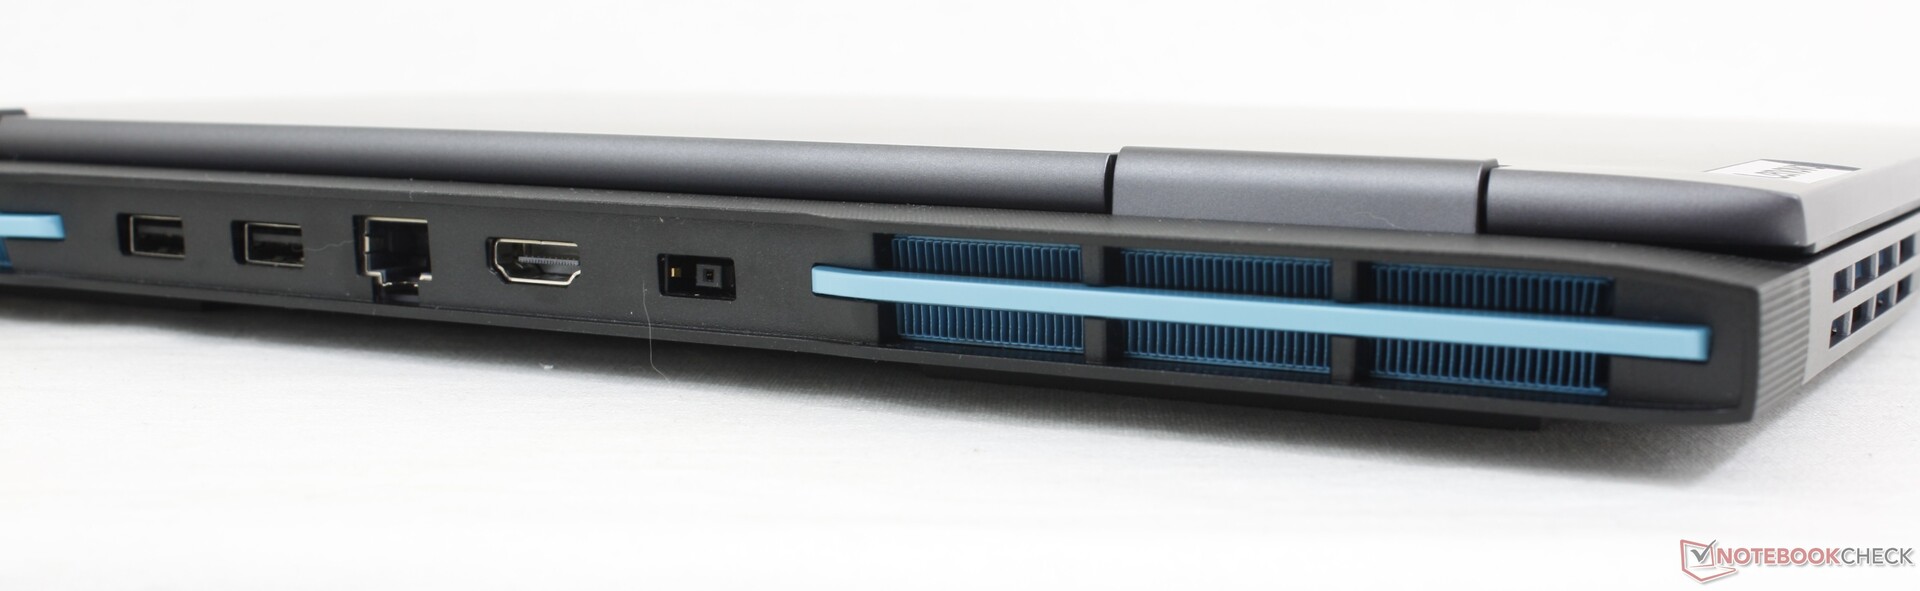
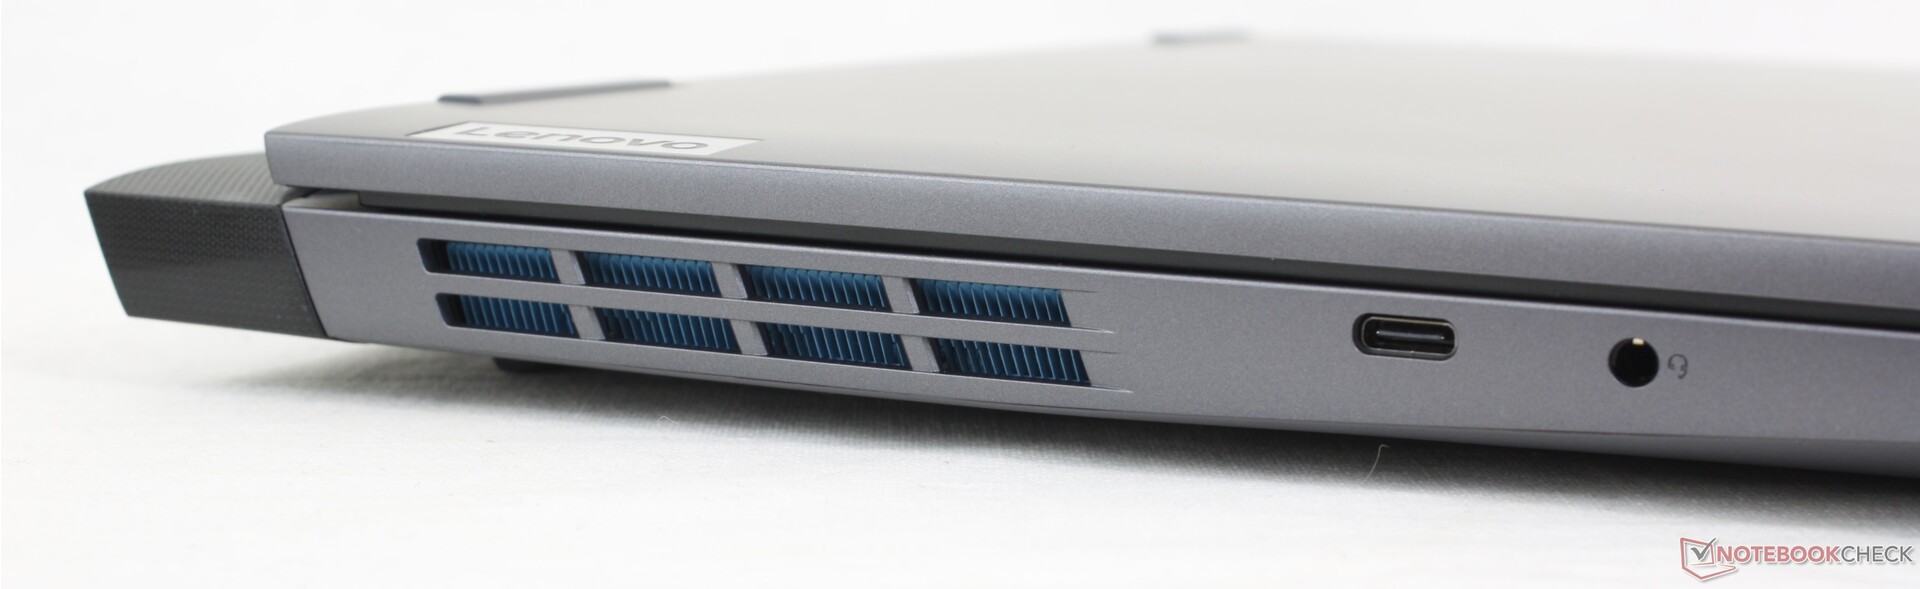
Connectivity — No USB4 or Thunderbolt
Port options include everything from last year's IdeaPad Gaming 3 15 plus an additional USB-A port. Most of the ports are along the rear, but the single USB-C port has been moved to the left edge this time for easier reach.
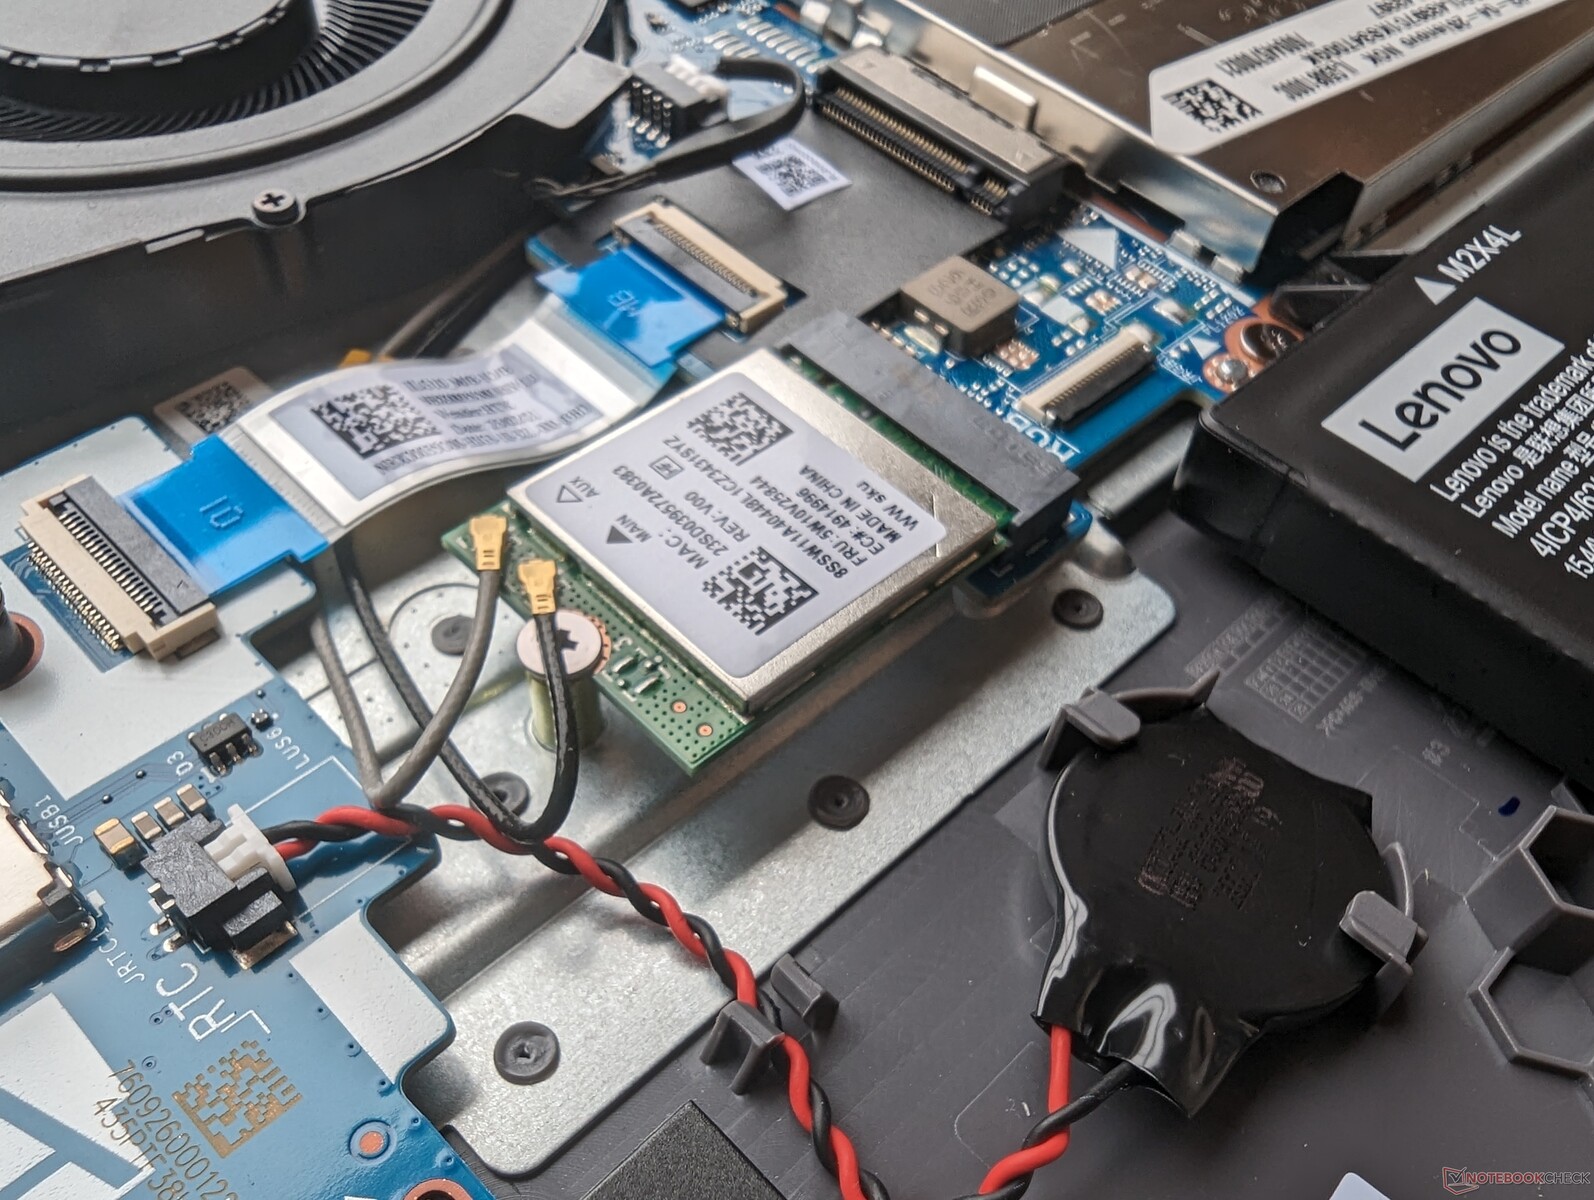
Communication
The Realtek RTL8852BE offers Wi-Fi 6 and Bluetooth 5.1 connectivity with no Wi-Fi 6E or 6 GHz support likely to save on costs. Transfer rates are nonetheless steady and reliable when paired to our Asus AXE11000 test router.
| Networking | |
| iperf3 transmit AXE11000 | |
| MSI Cyborg 15 A12VF | |
| Dell G15 5530 | |
| Lenovo Legion 5 15IAH7H 82RB | |
| Asus TUF A15 FA507 | |
| Lenovo LOQ 15APH8 | |
| HP Victus 15 fa0020nr | |
| iperf3 receive AXE11000 | |
| MSI Cyborg 15 A12VF | |
| Dell G15 5530 | |
| Lenovo Legion 5 15IAH7H 82RB | |
| Asus TUF A15 FA507 | |
| HP Victus 15 fa0020nr | |
| Lenovo LOQ 15APH8 | |
| iperf3 transmit AXE11000 6GHz | |
| Lenovo Legion 5 15IAH7H 82RB | |
| iperf3 receive AXE11000 6GHz | |
| Lenovo Legion 5 15IAH7H 82RB | |
Webcam
The 2 MP webcam is an upgrade from the 1 MP webcams on the older Legion 5 15 or IdeaPad Gaming 15 series. A camera kill switch is included while IR is nowhere to be found.


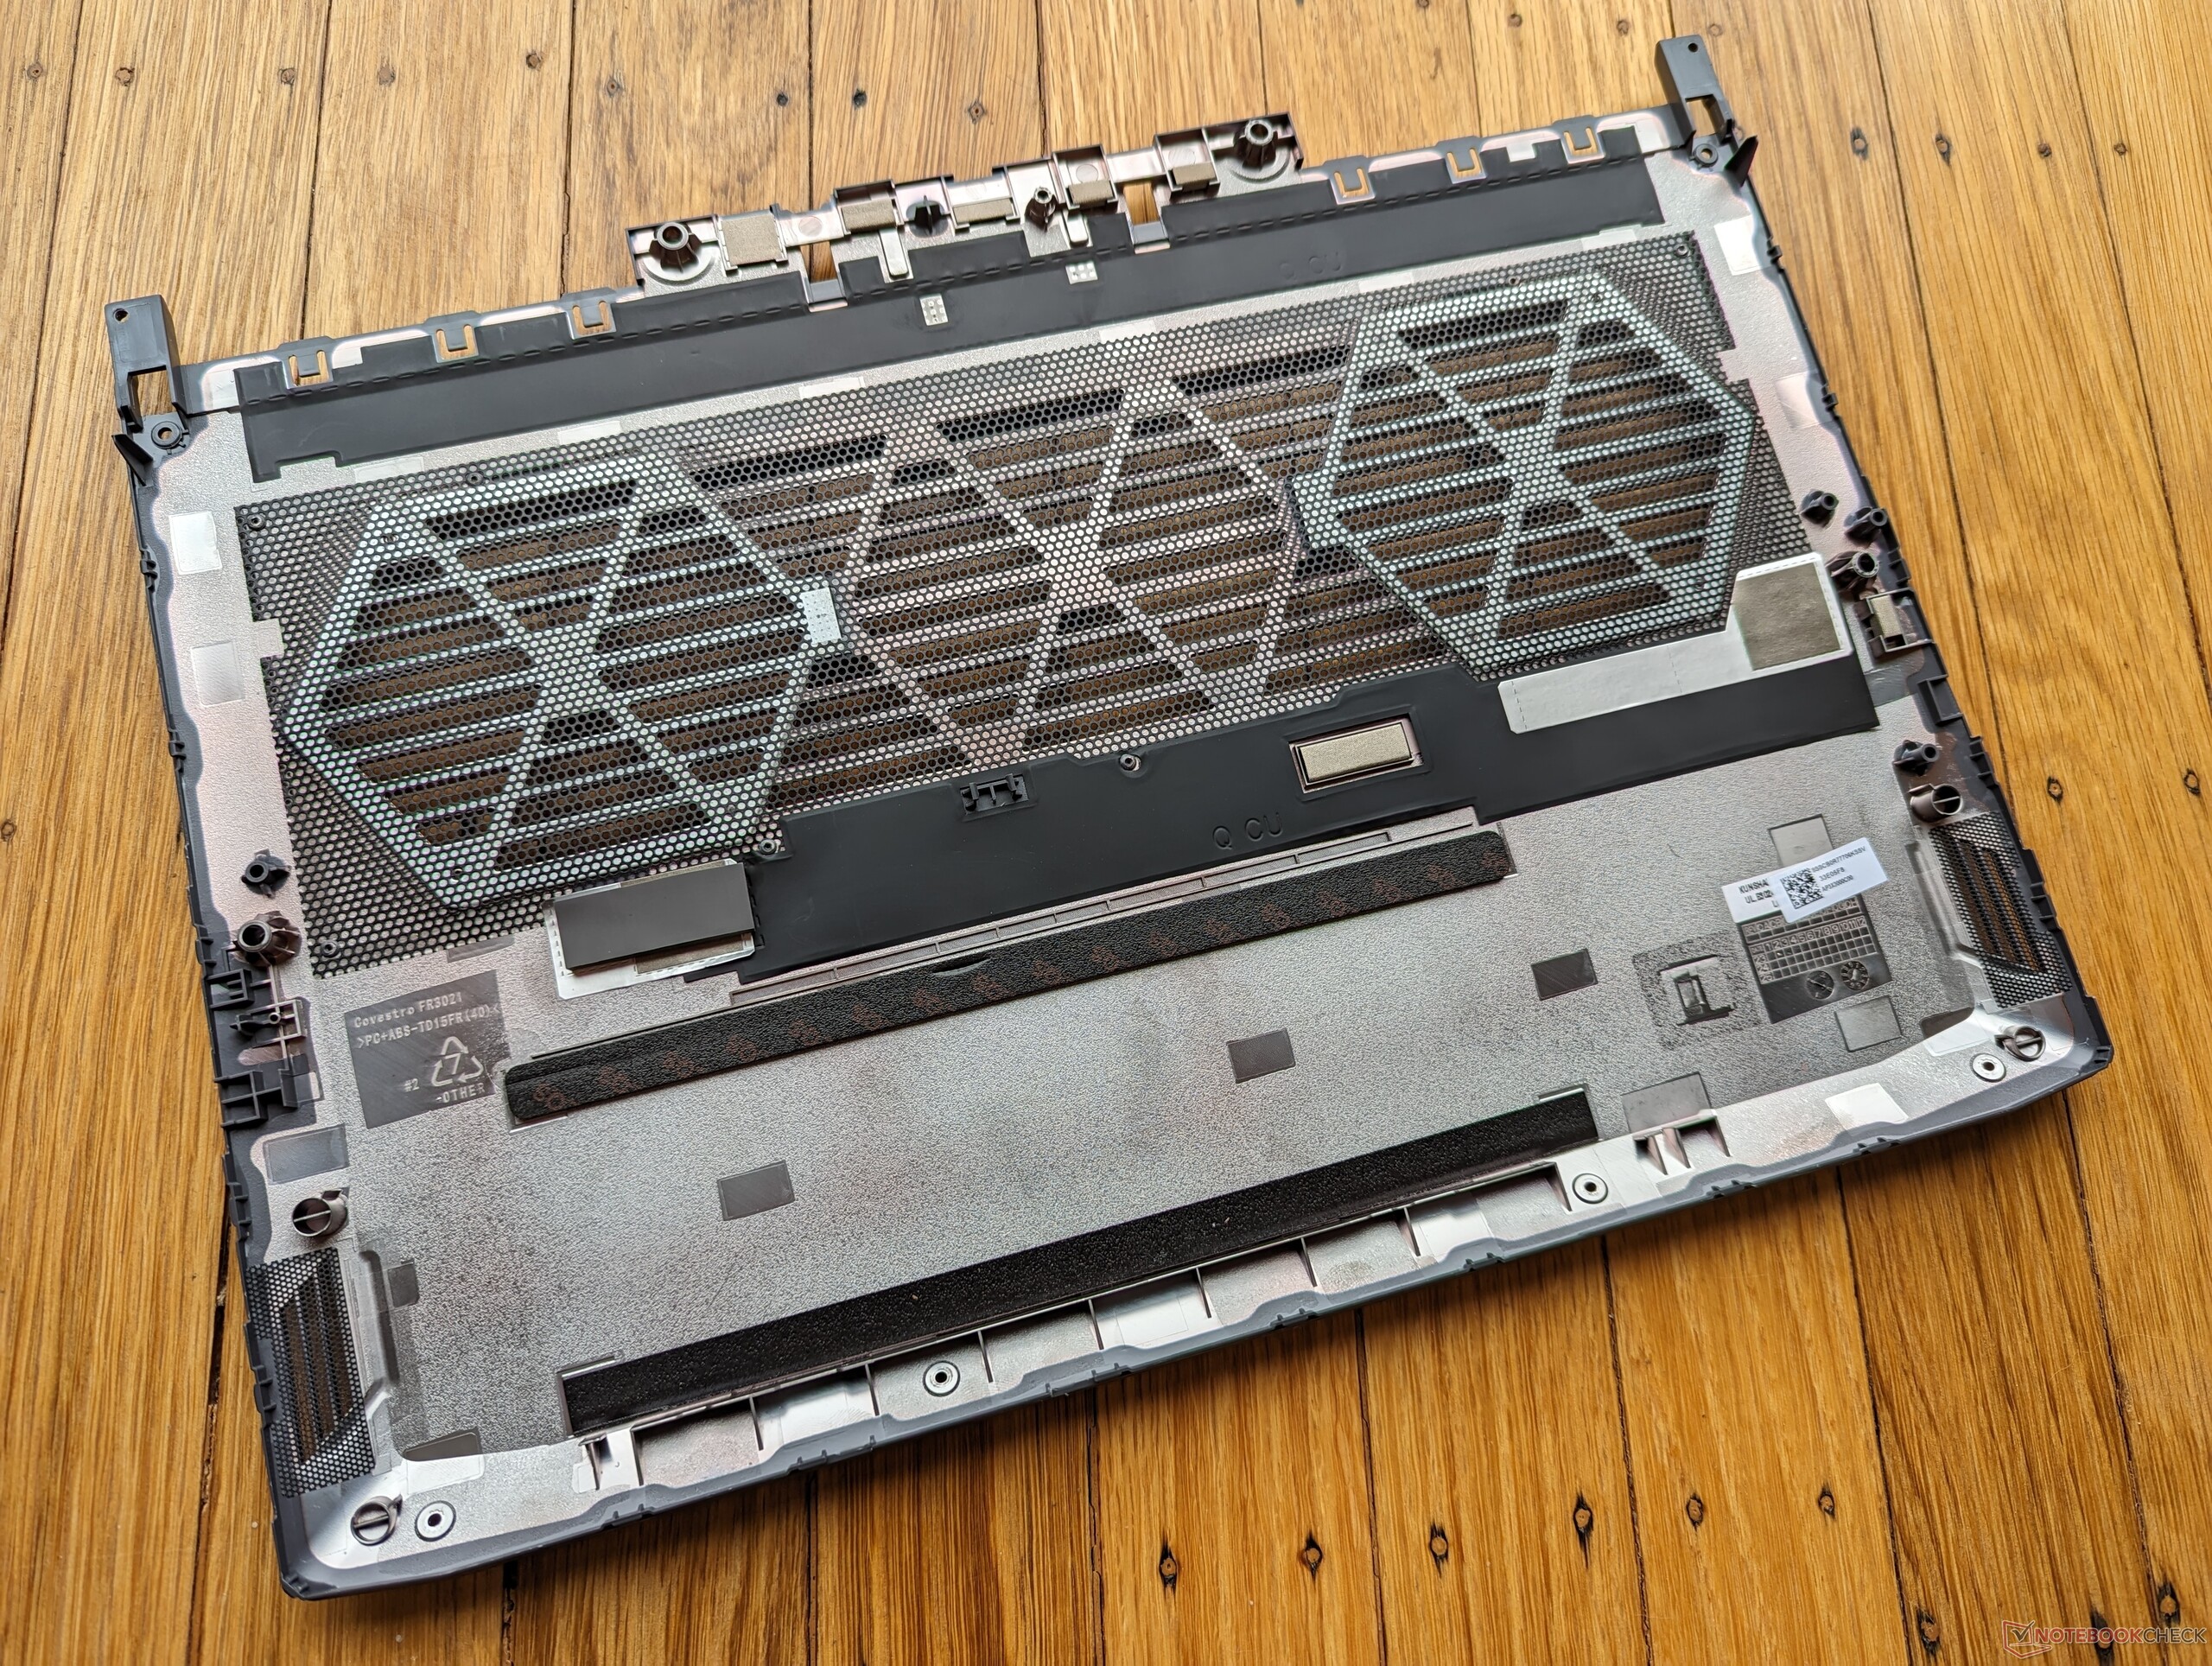
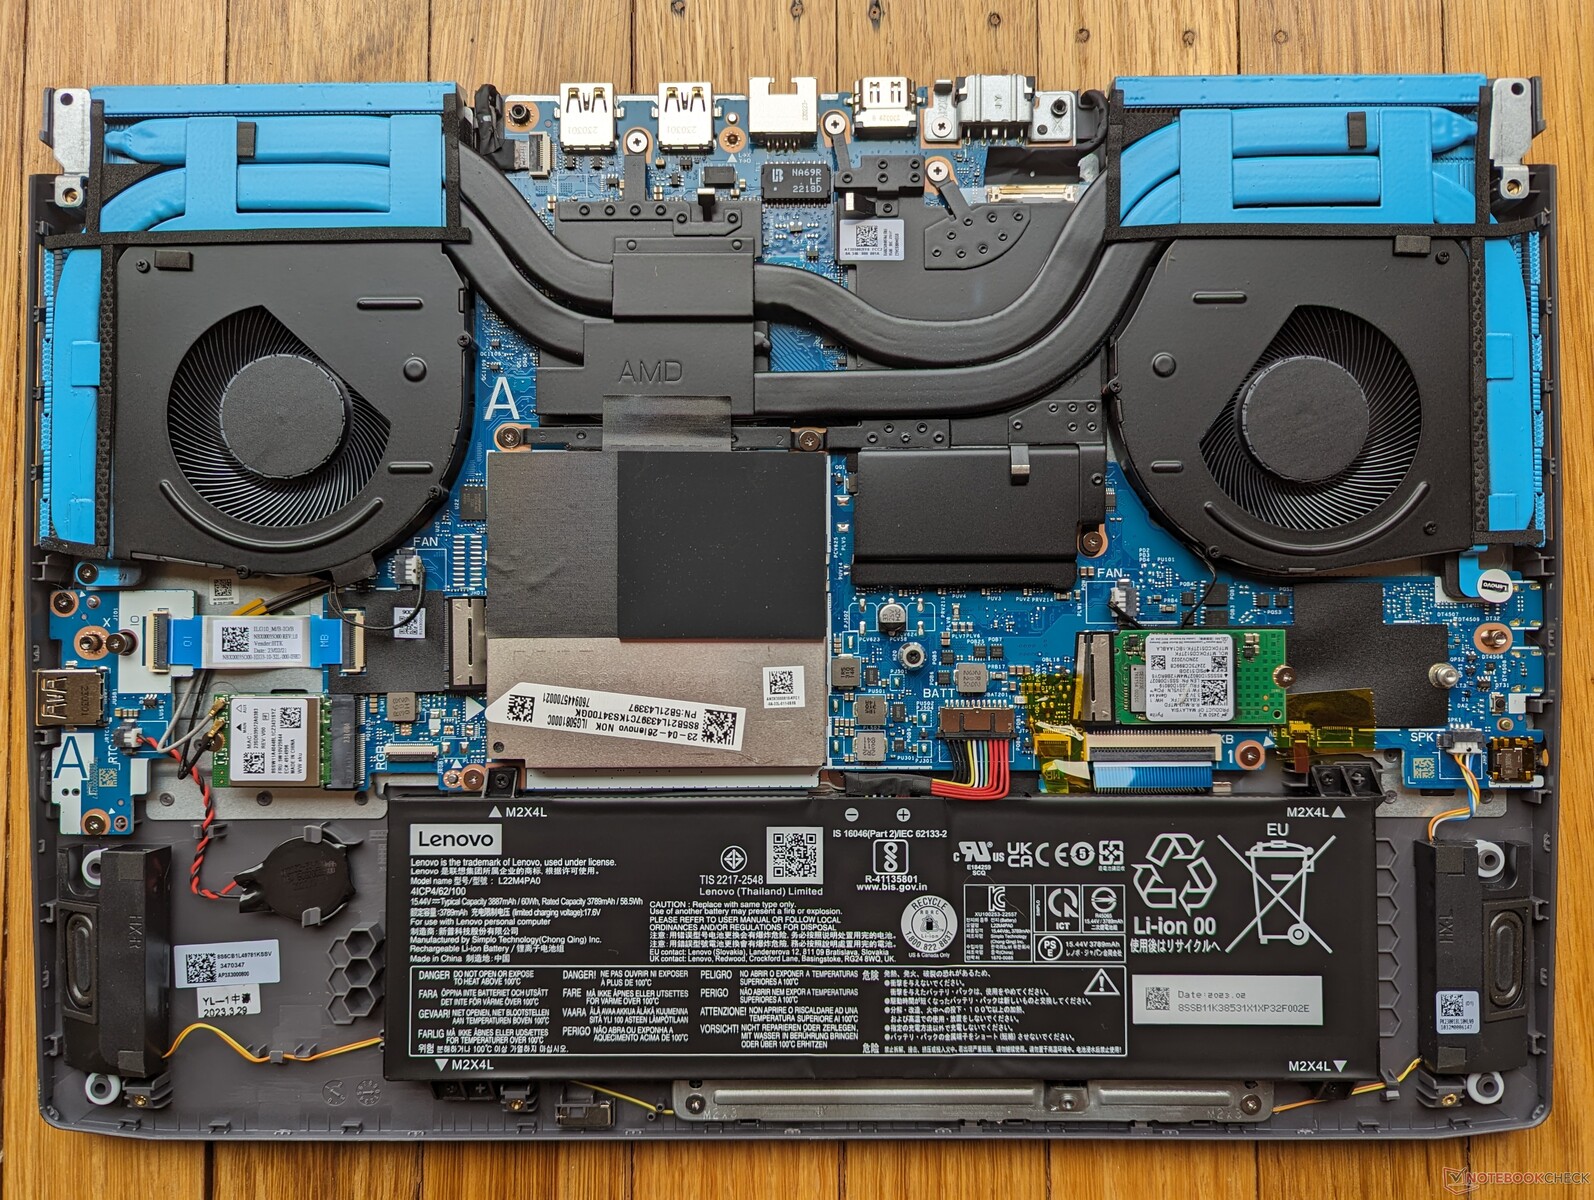
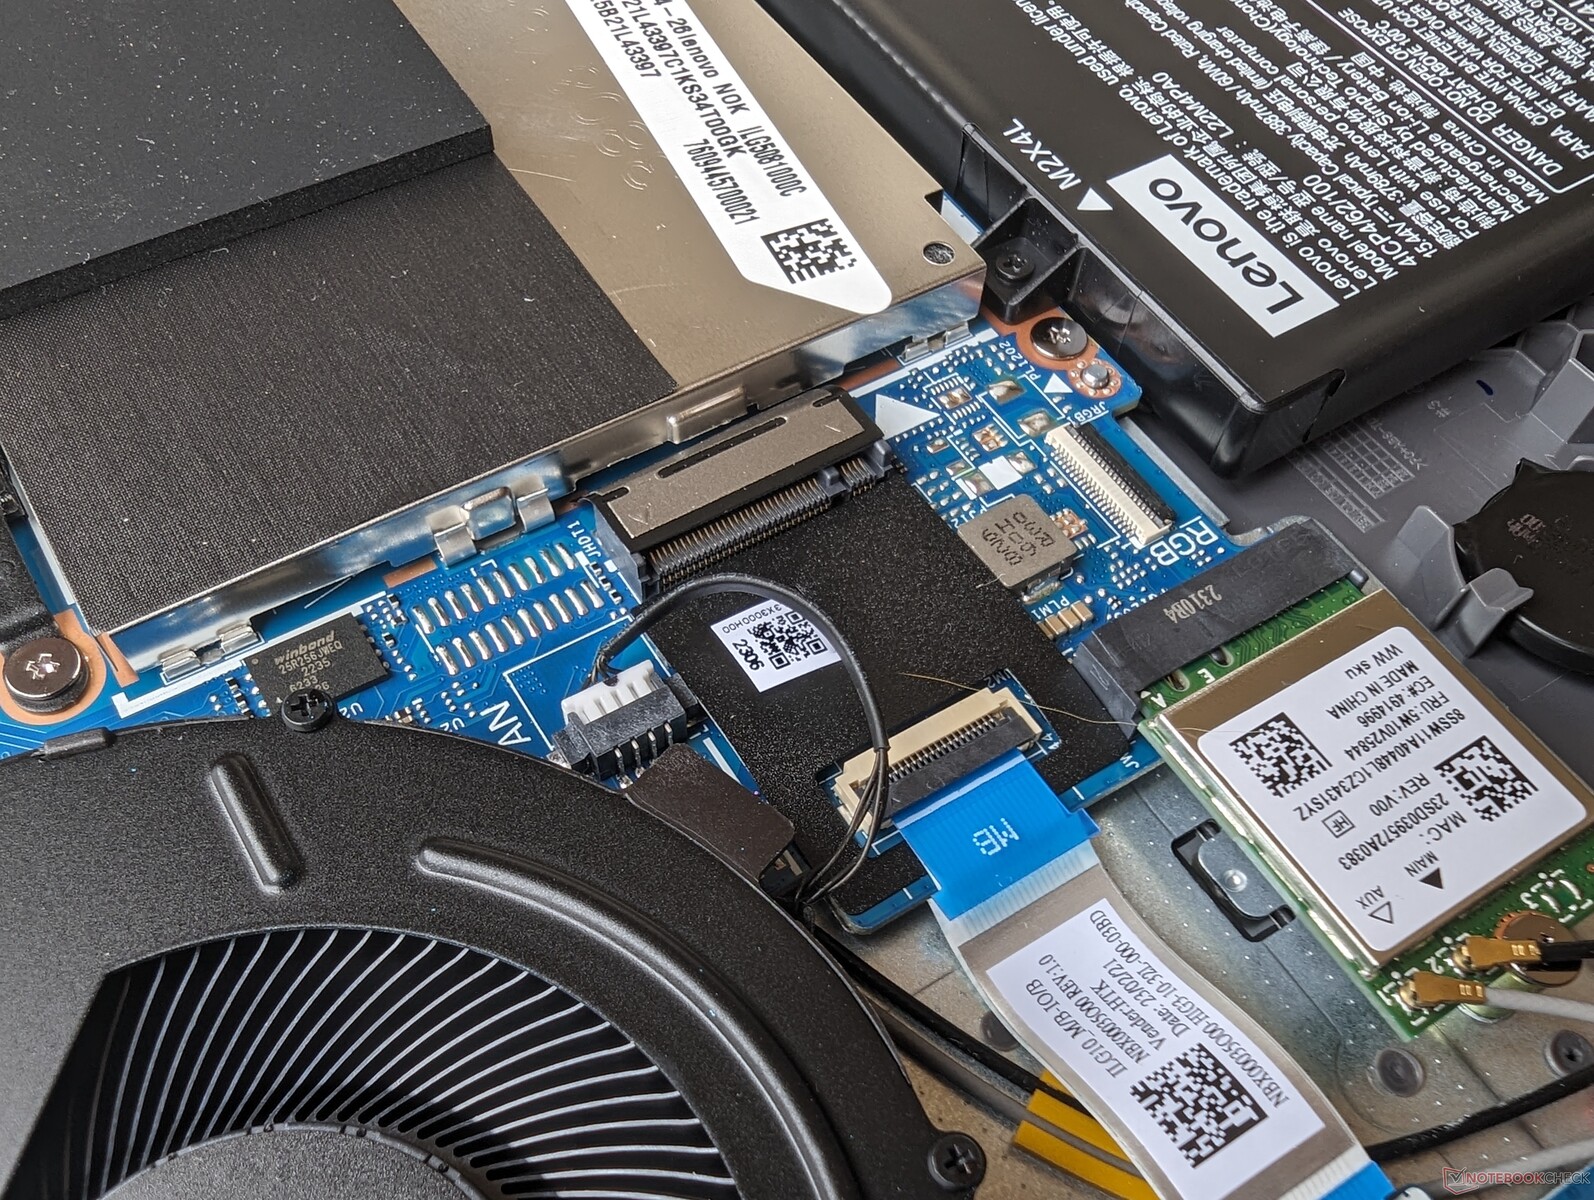
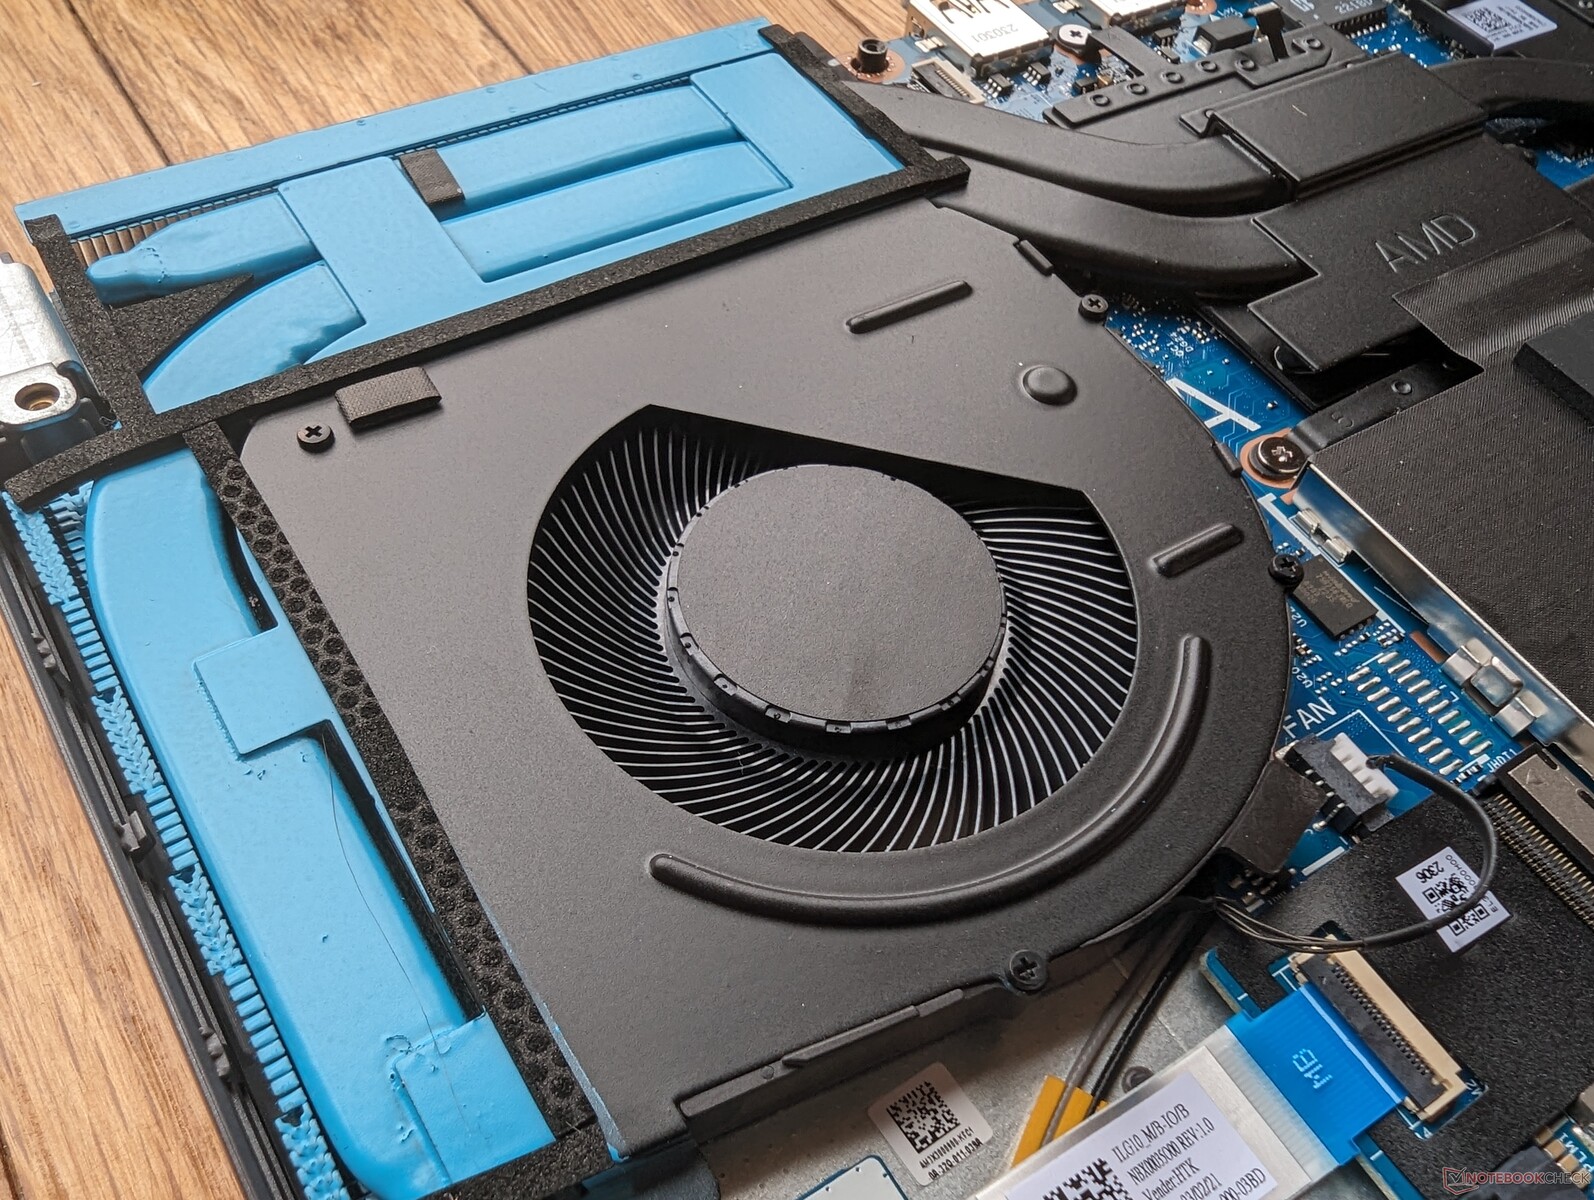
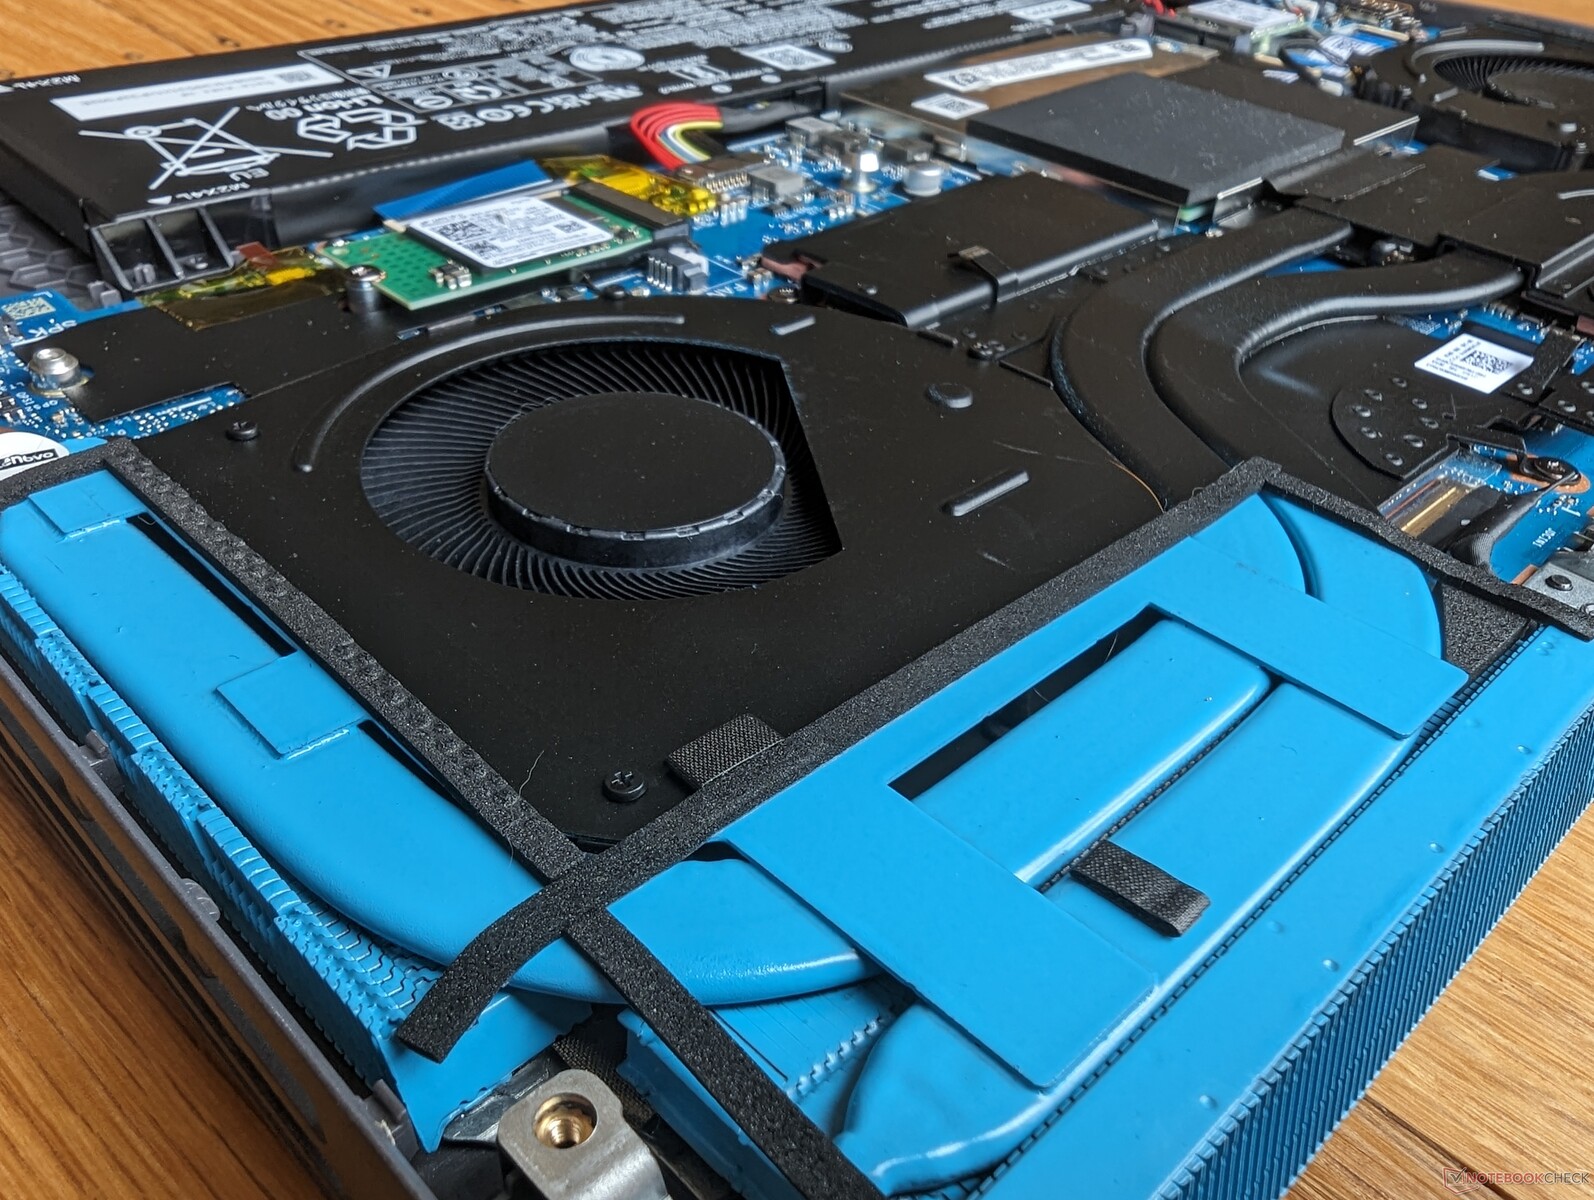
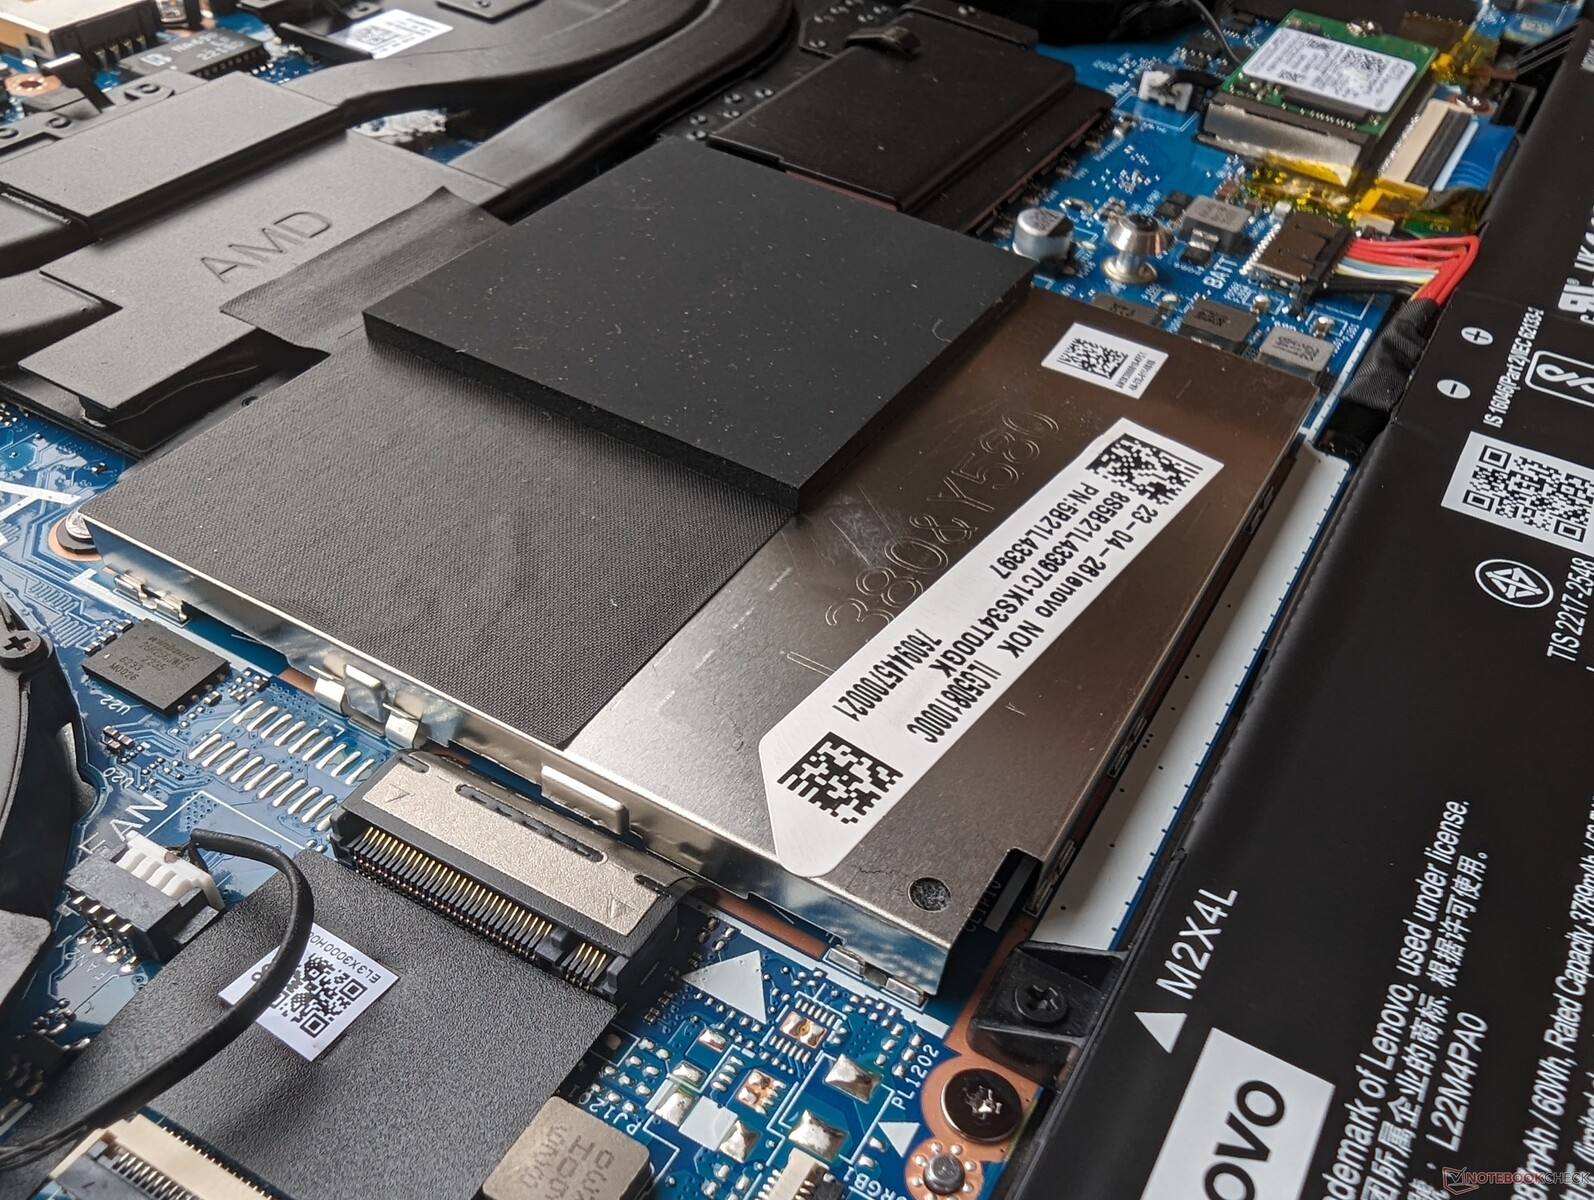
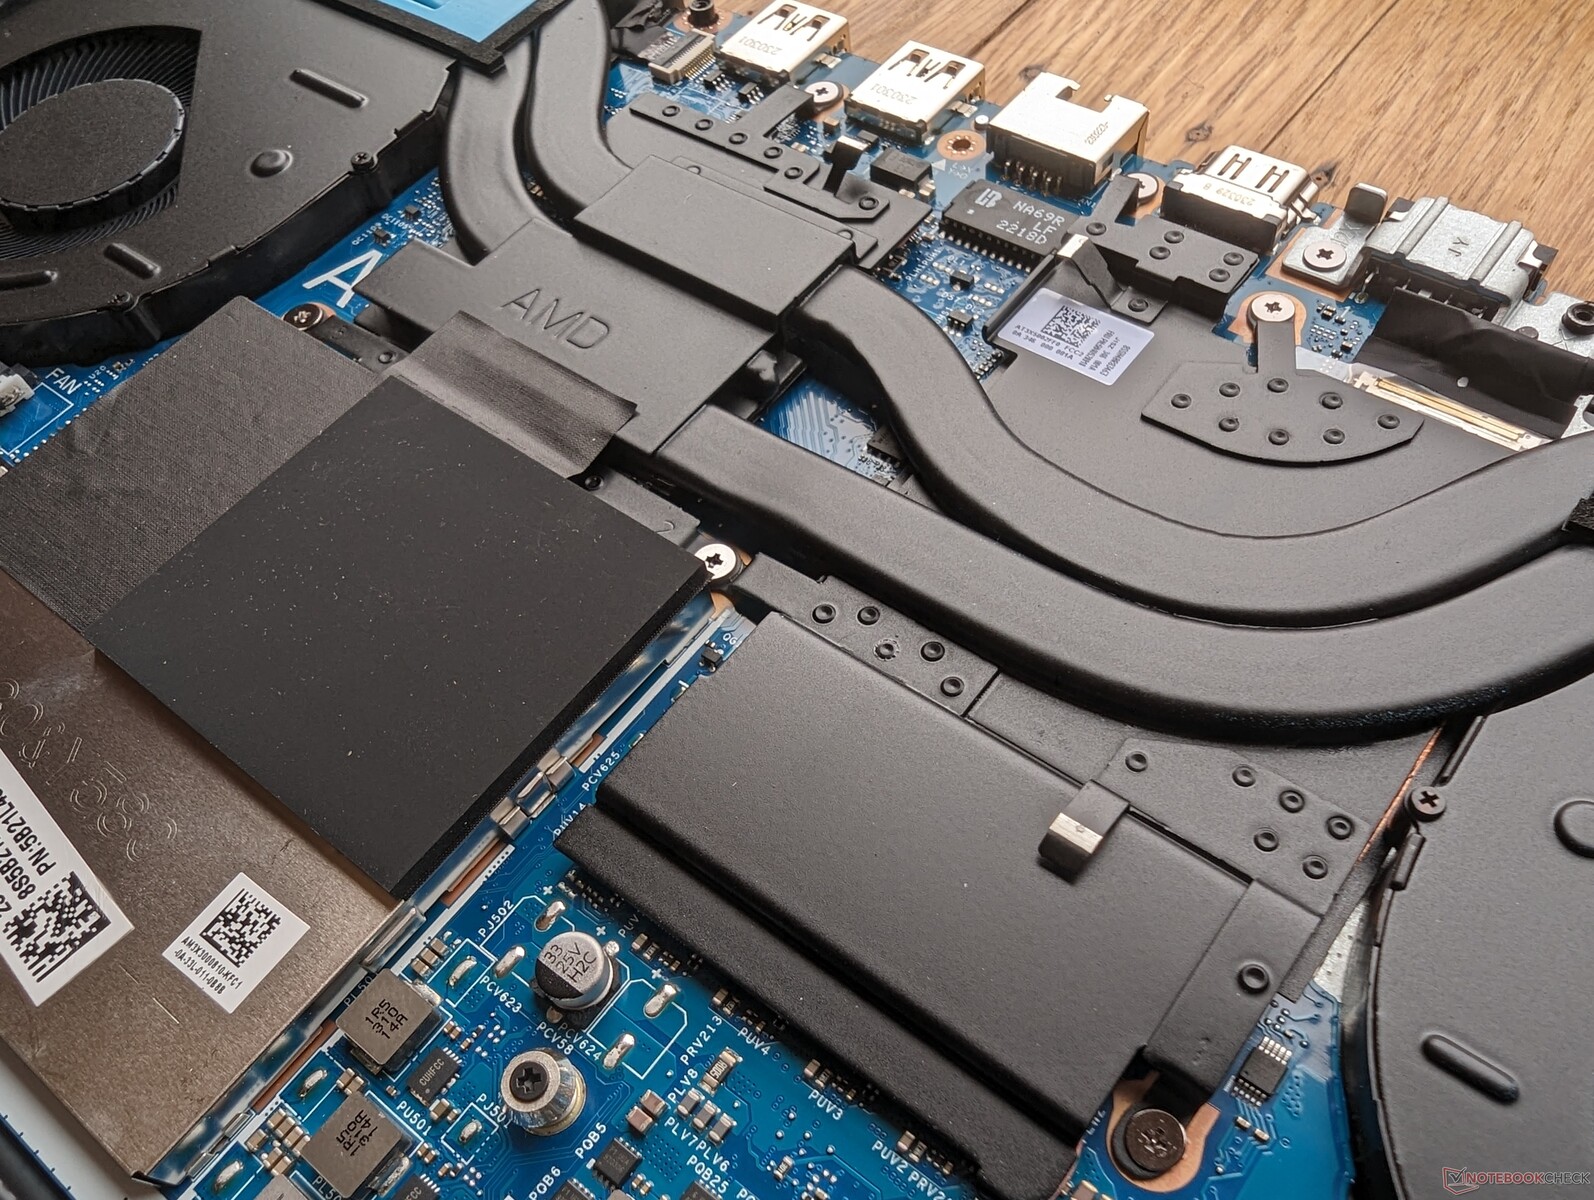
Maintenance
End-user upgrades take a bit more effort than on most other gaming laptops since the rear portion of the chassis must first be removed before the bottom panel can come off. A total of 13 Phillips screws secure the bottom and rear portions.
Accessories And Warranty
There are no extras in the box other than the AC adapter and paperwork. The standard one-year limited manufacturer warranty applies if purchased in the US.
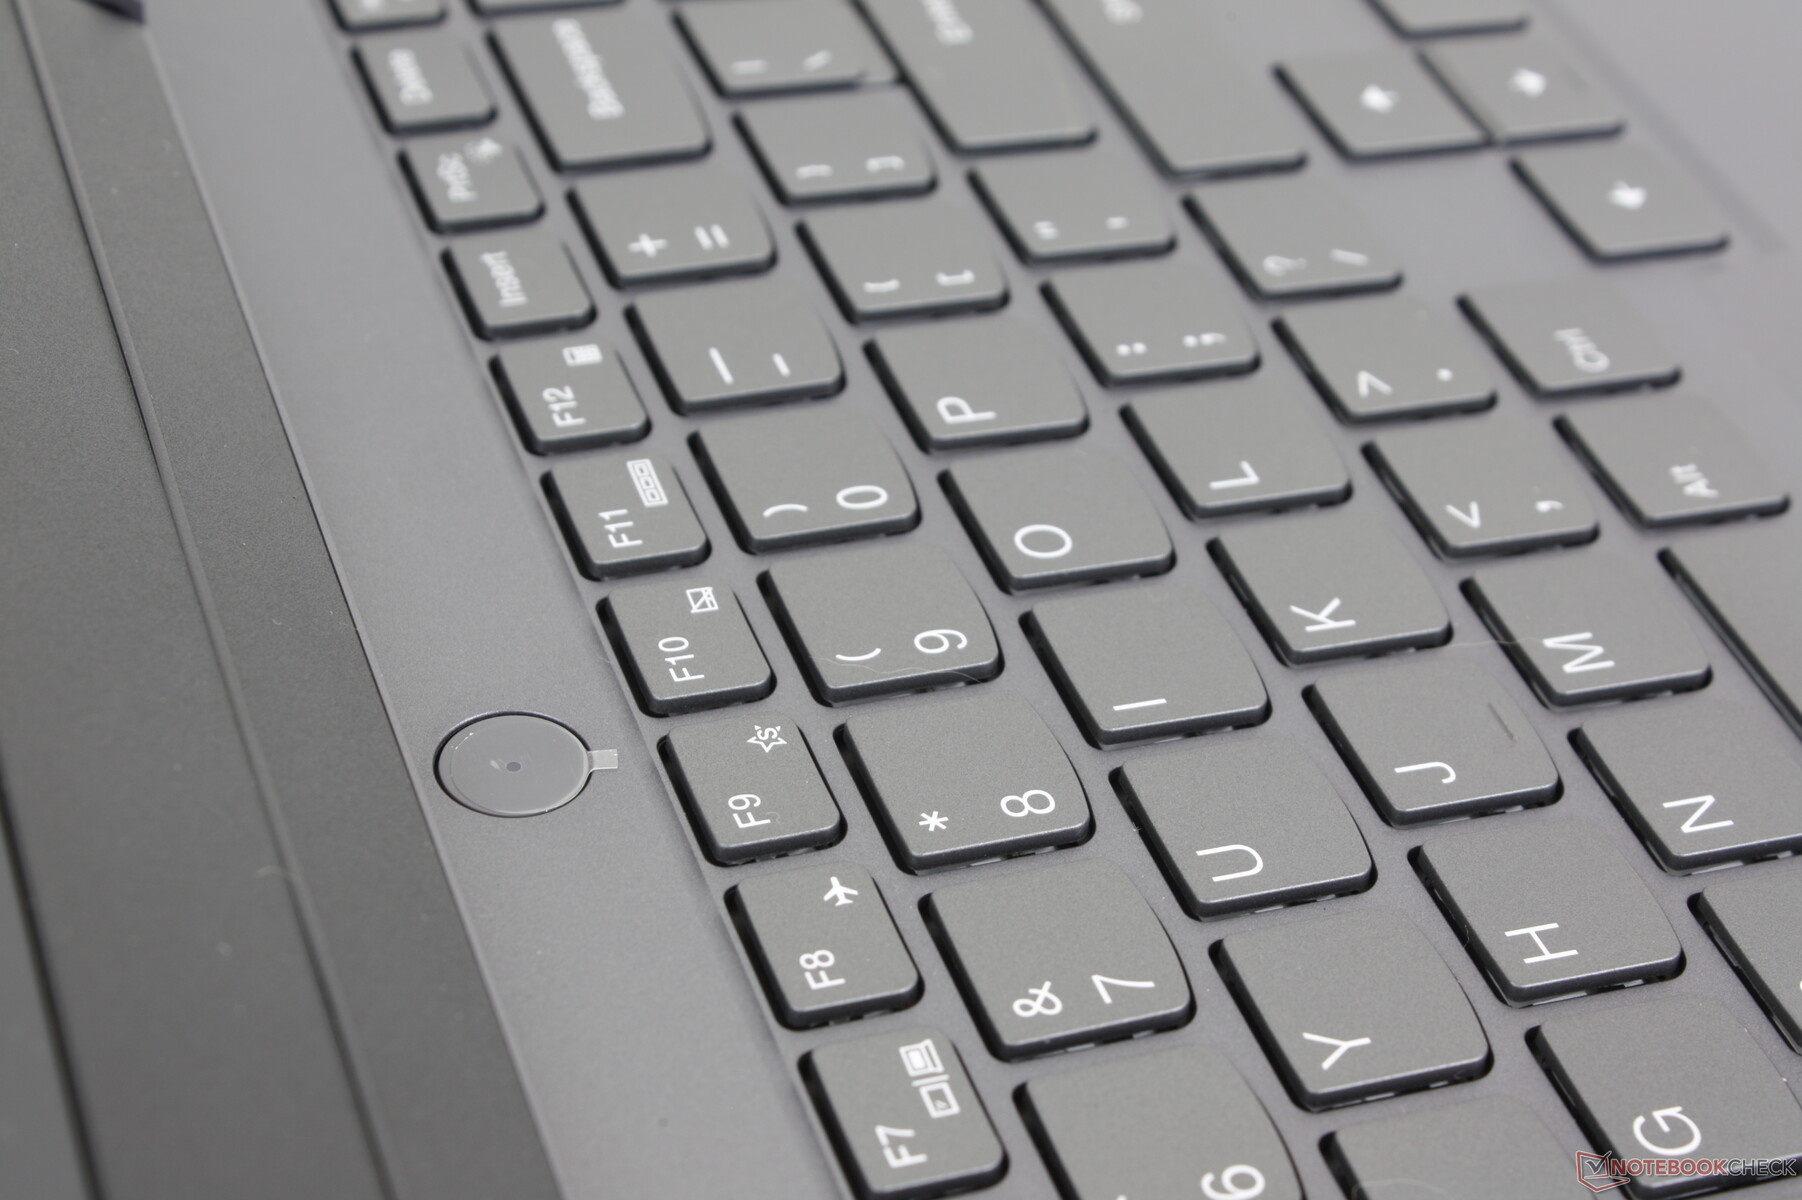
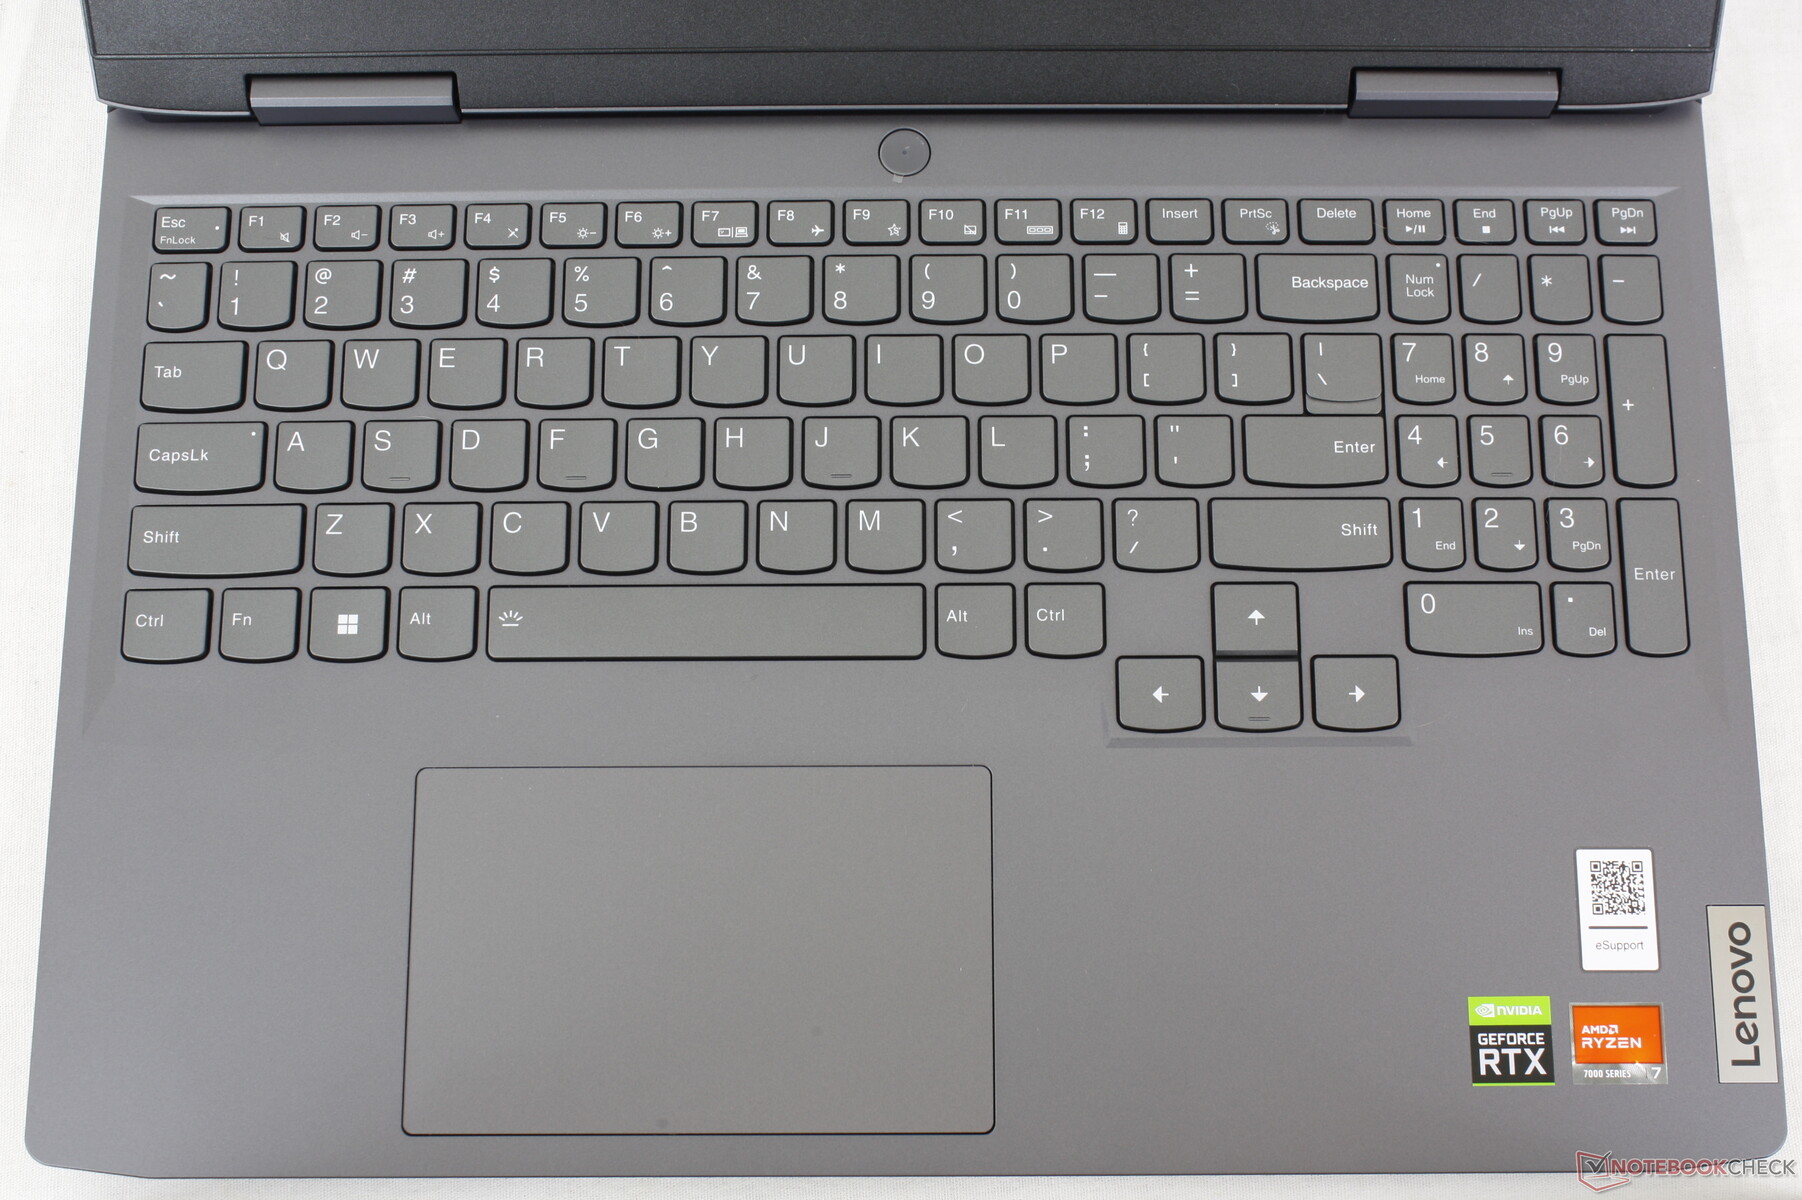
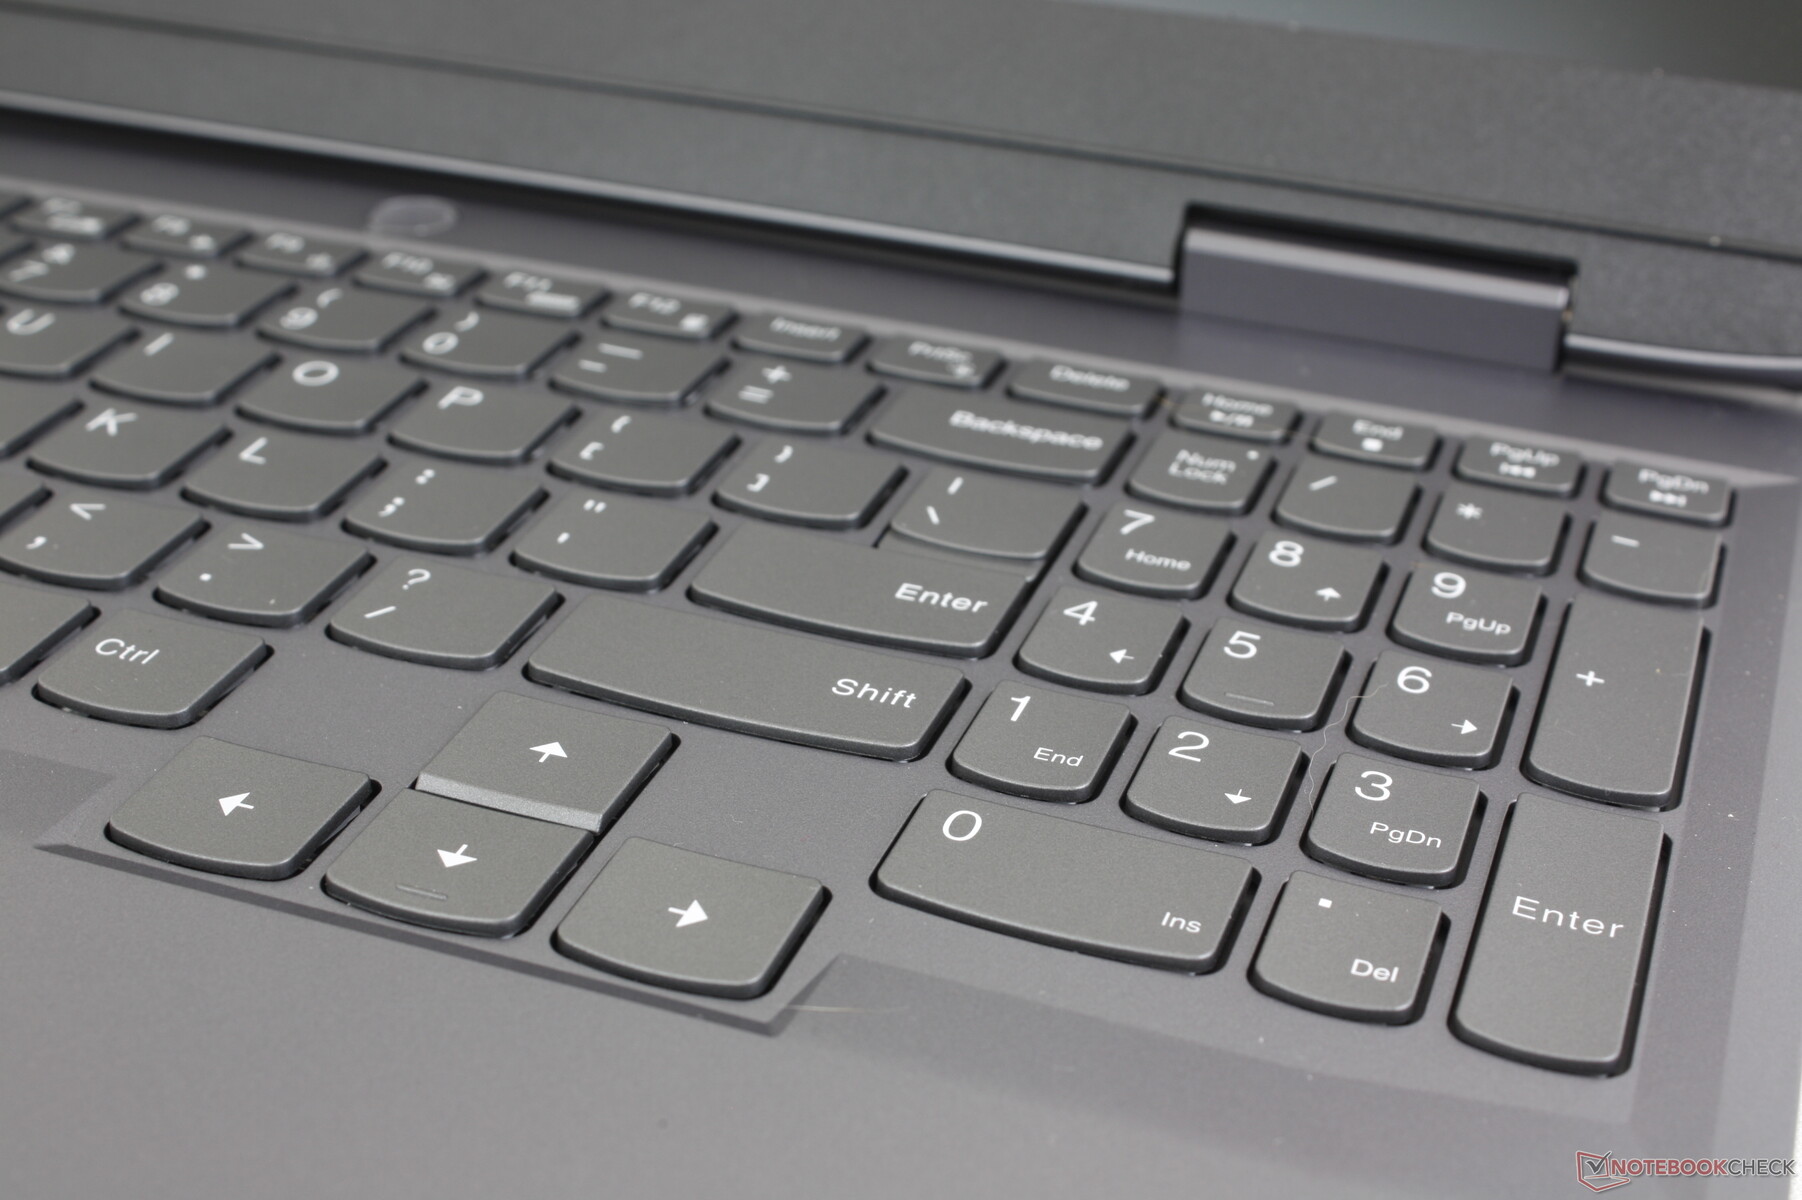
Input Devices — A Lot Like An IdeaPad
Keyboard
The keyboard remains identical to the one on the IdeaPad Gaming 3 15 despite the name change. If you've typed on an IdeaPad or Yoga laptop in the past, then the keyboard on the LOQ 15 will feel instantly familiar. Subjectively, the keys on the LOQ 15 feel a bit firmer and clickier than usual for a better typing experience than a cheaper Asus VivoBook or HP Pavilion 15.
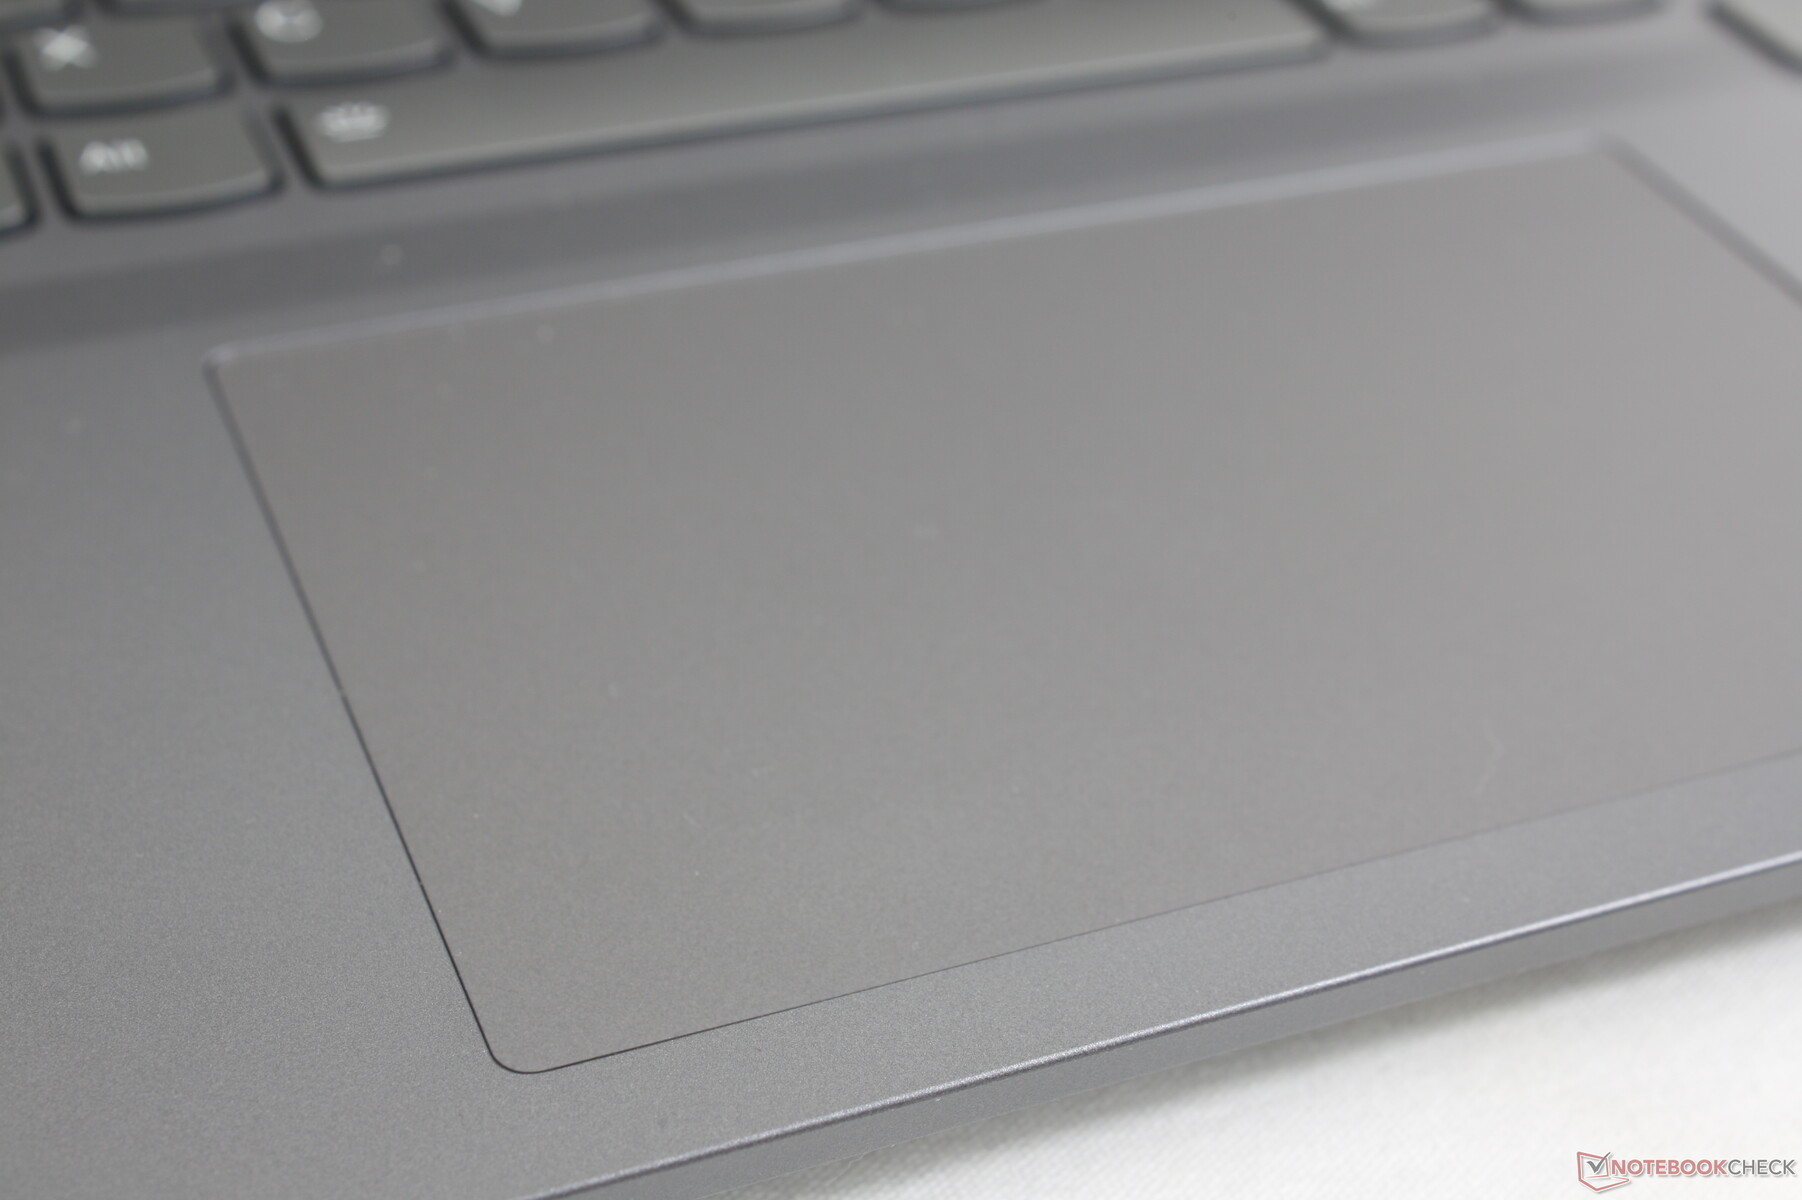
Touchpad
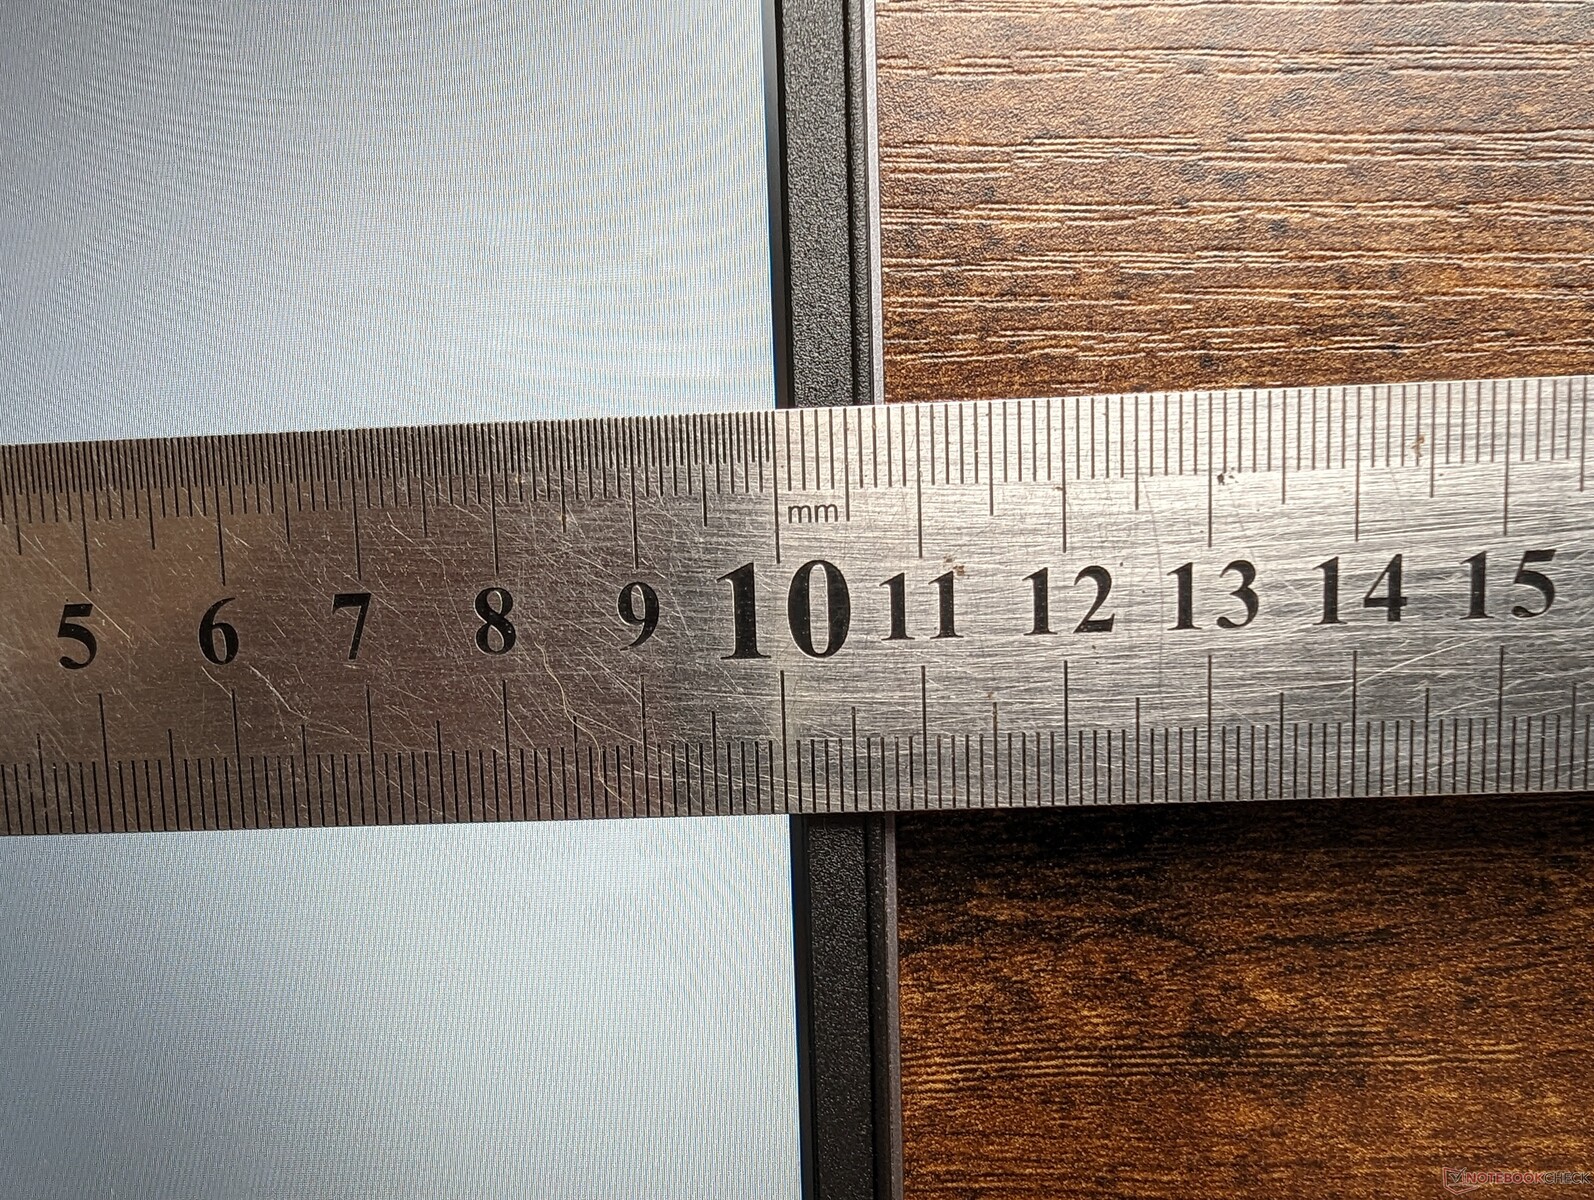
The clickpad is slightly smaller than the one on last year's IdeaPad Gaming 3 15 (12 x 7.5 cm vs. 12.5 x 7.5 cm). However, the clickpad on the LOQ 15 feels firmer and clickier than the clickpad on the IdeaPad to be more satisfying to use. Clatter is noticeably louder as a result of the sharper feedback.

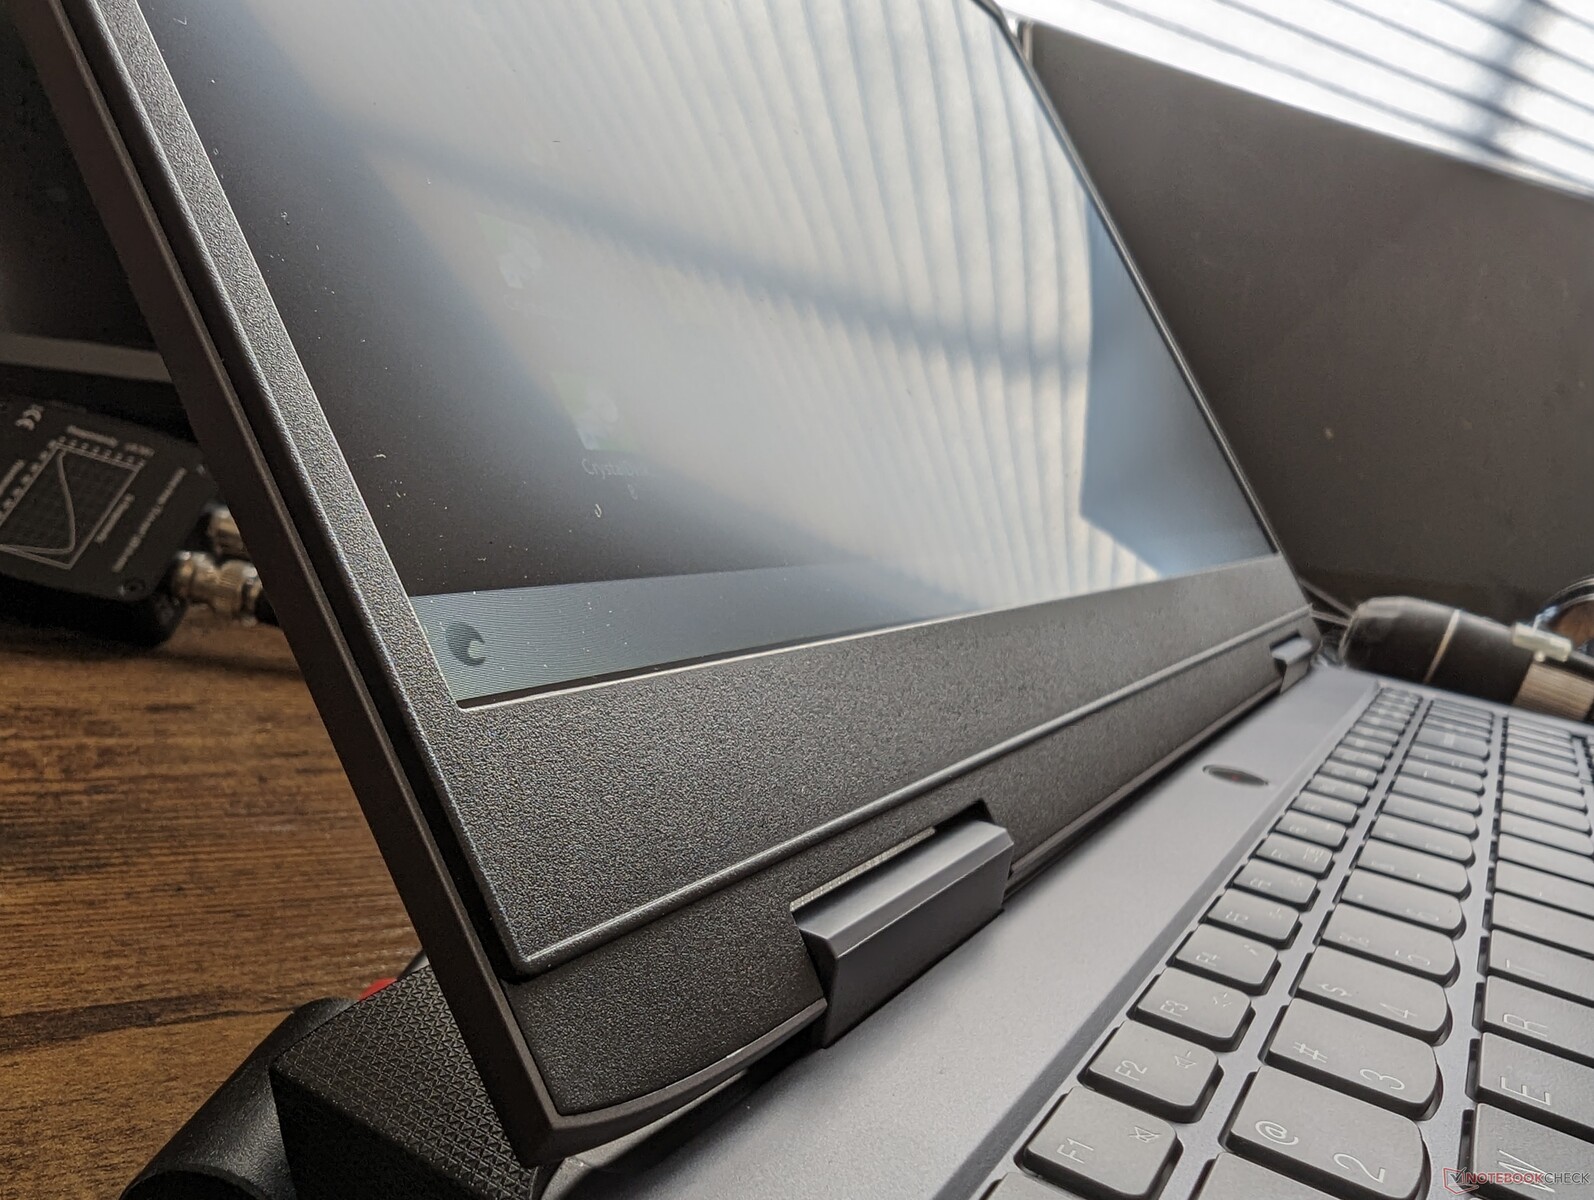
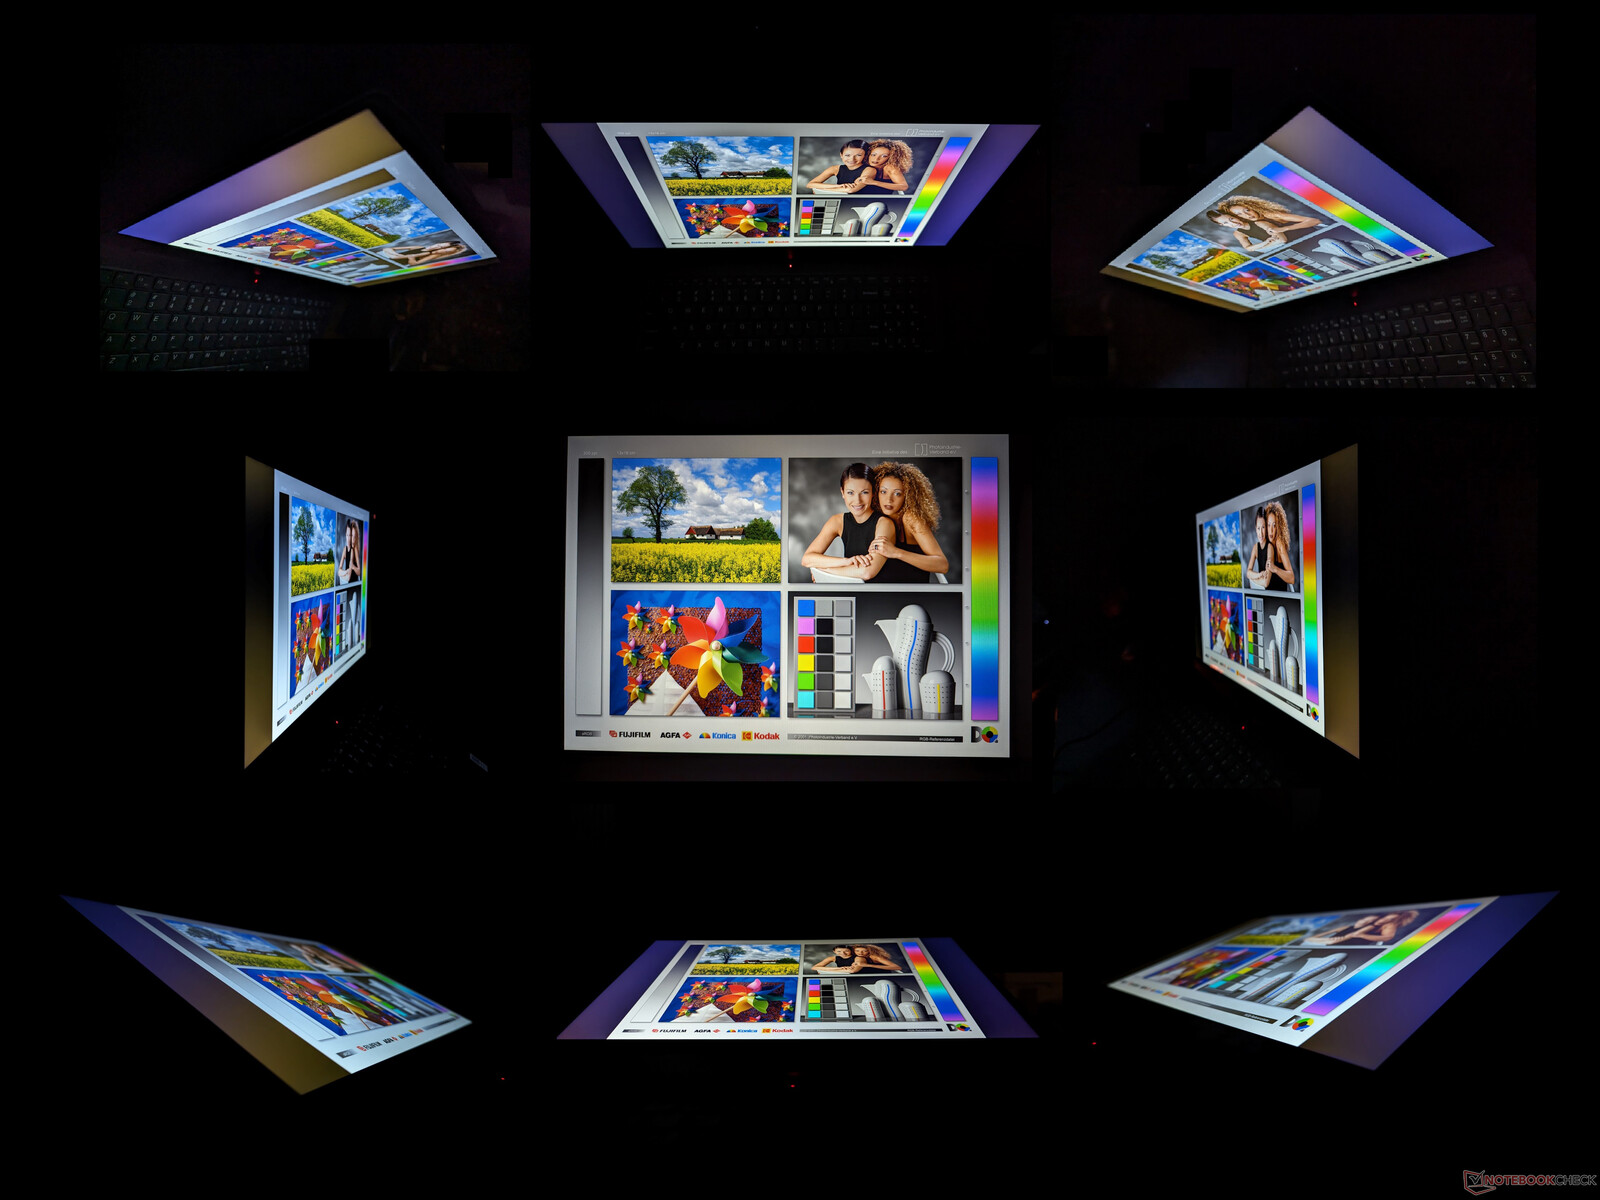
Display — 1080p Pairs Well With The GeForce RTX 4050
Three display configurations are available all of which are IPS panels:
- 1080p, 300 nits, 60% sRGB, 60 Hz
- 1080p, 350 nits, 60% sRGB, 144 Hz, Advanced Optimus, G-Sync
- 1440p, 350 nits, 100% sRGB, 165 Hz, Advanced Optimus, G-Sync
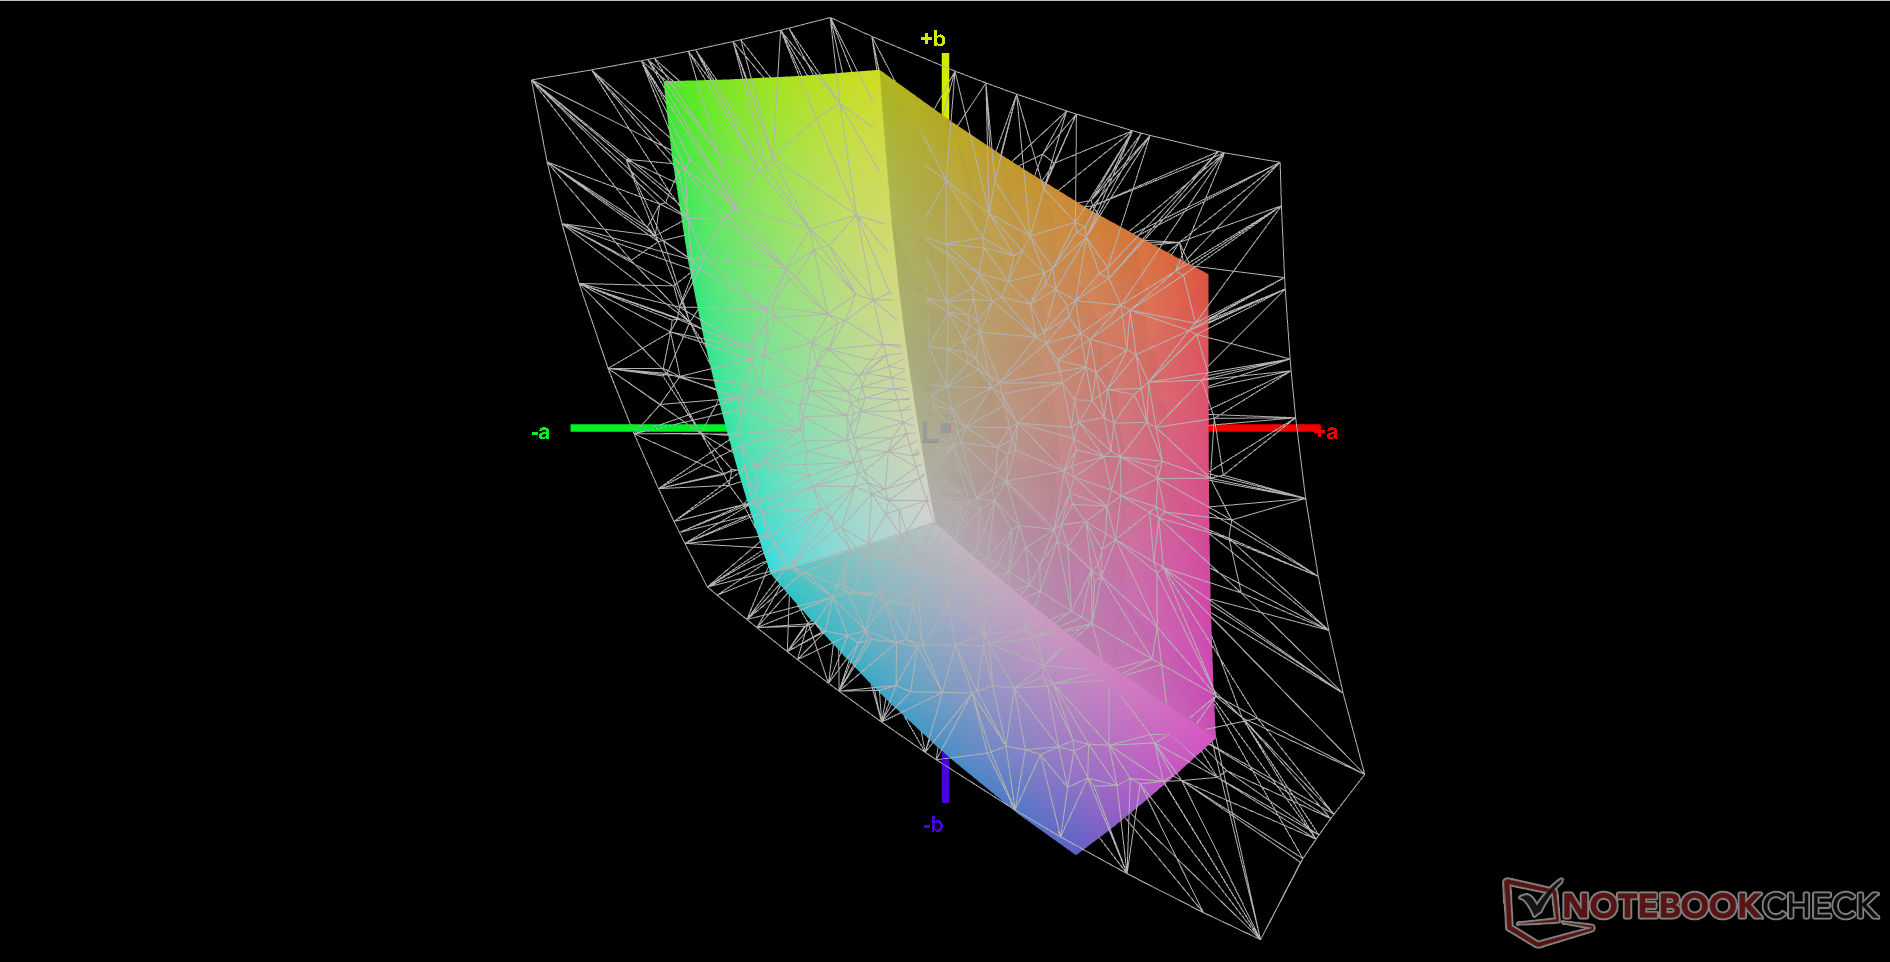
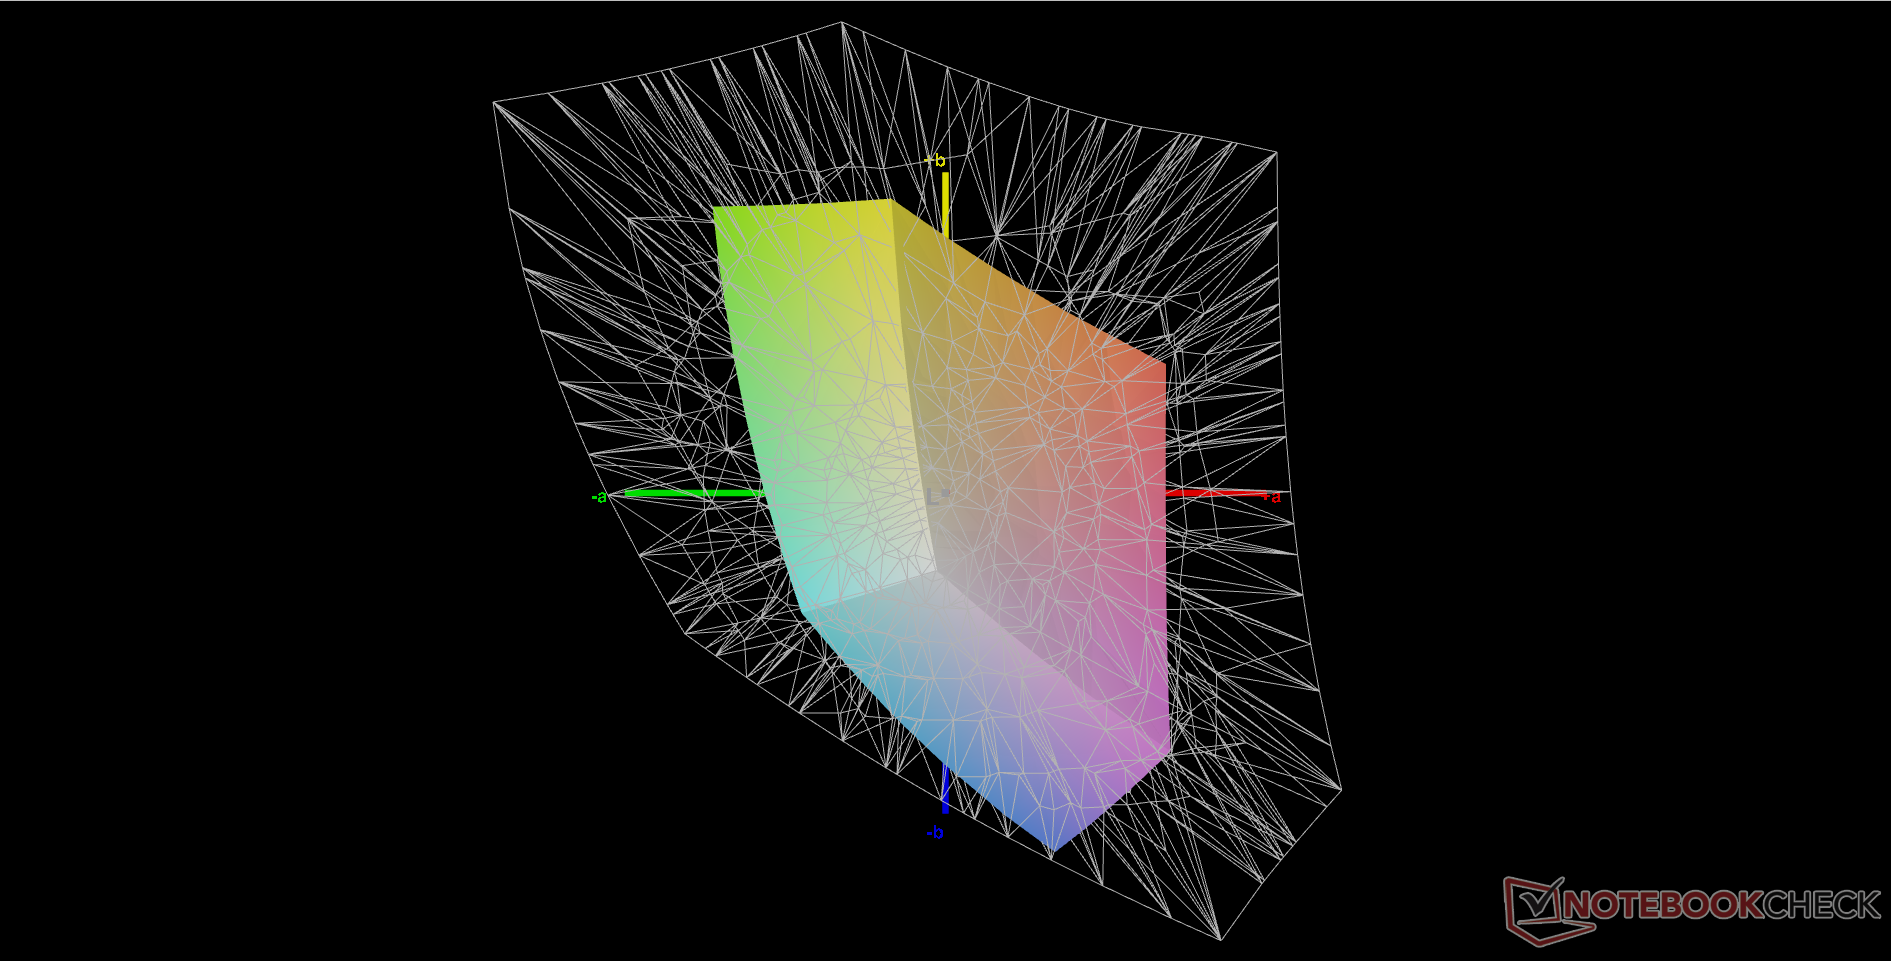
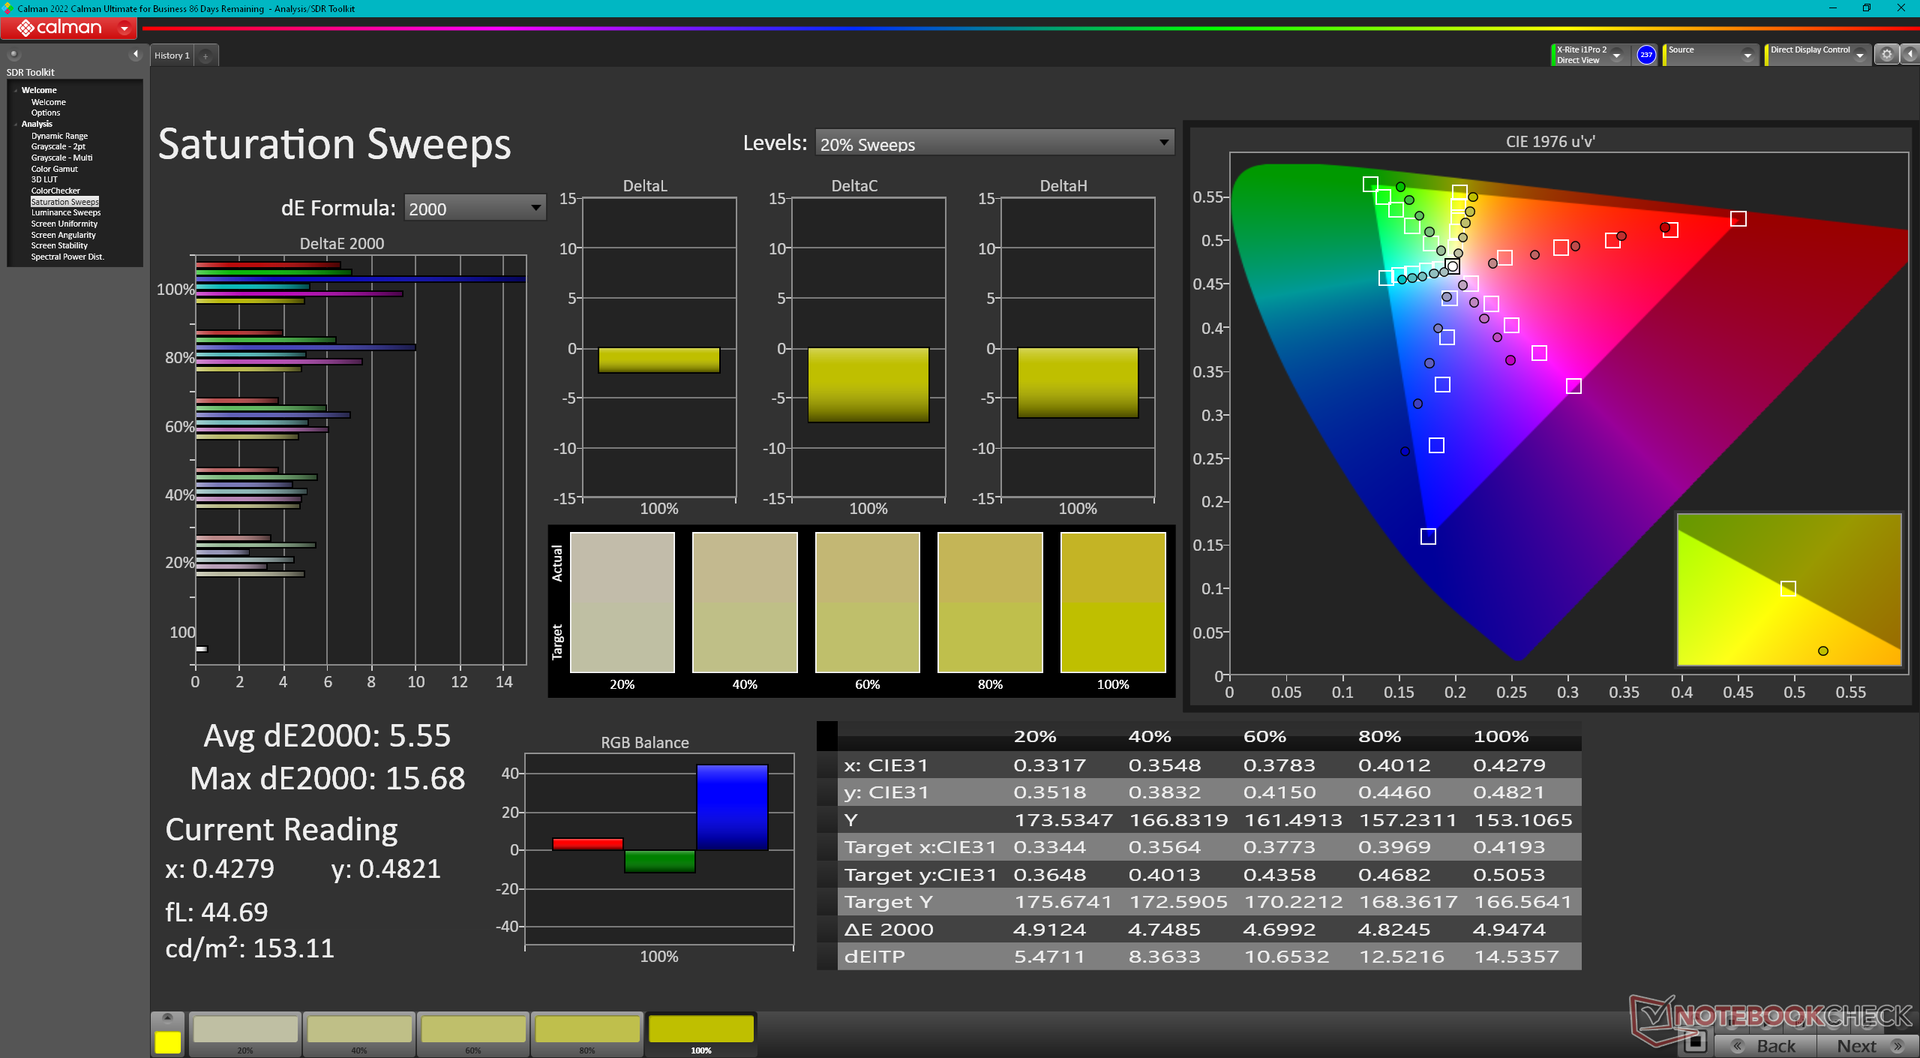
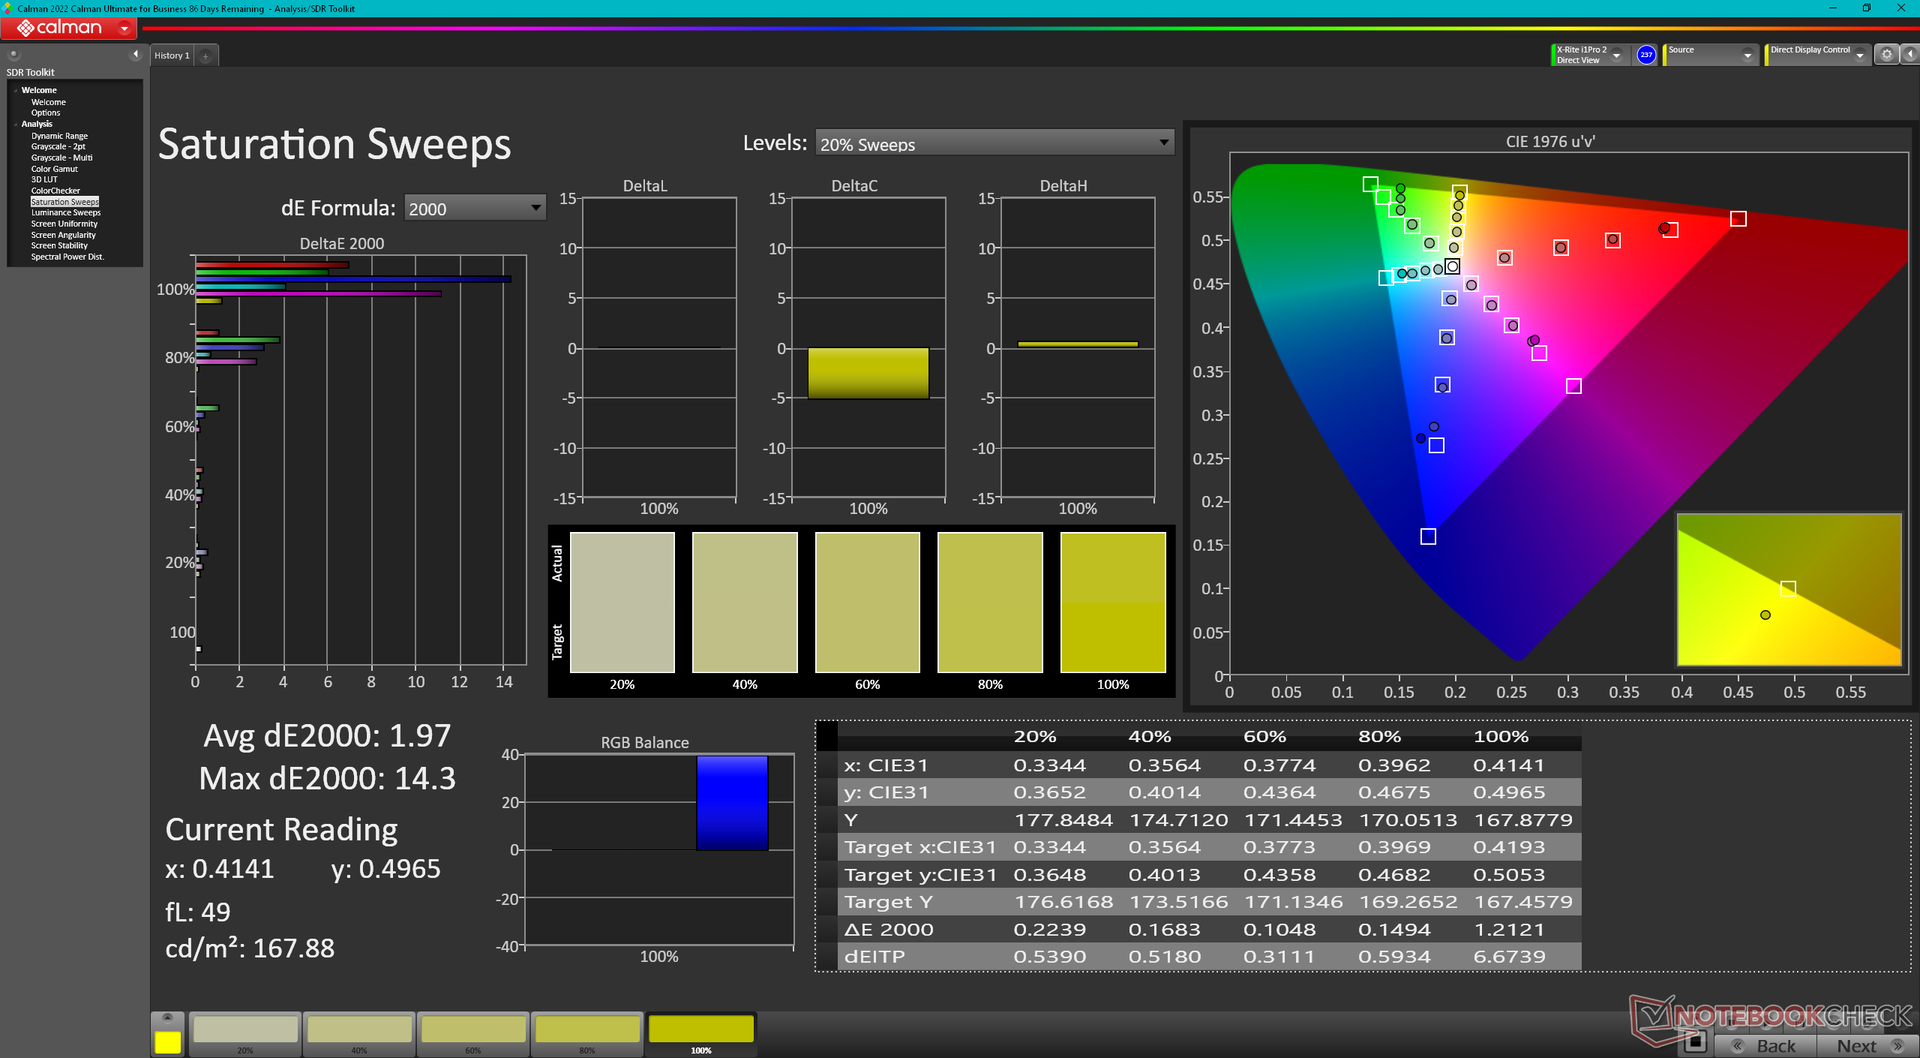
Our configuration and measurements reflect only the bolded option above. Although 1080p is sufficient for an inexpensive gaming machine, the limited color coverage and relatively slow response times are immediately noticeable through shallower colors and ghosting, respectively. If you like graphics editing or first-person shooters, then it's recommended to connect an external monitor with better colors and faster response times or select the higher quality 1440p panel option. The competing Asus TUF A15 offers a 1080p panel with full sRGB coverage whereas our Lenovo does not.

| |||||||||||||||||||||||||
Brightness Distribution: 81 %
Center on Battery: 346.2 cd/m²
Contrast: 1117:1 (Black: 0.31 cd/m²)
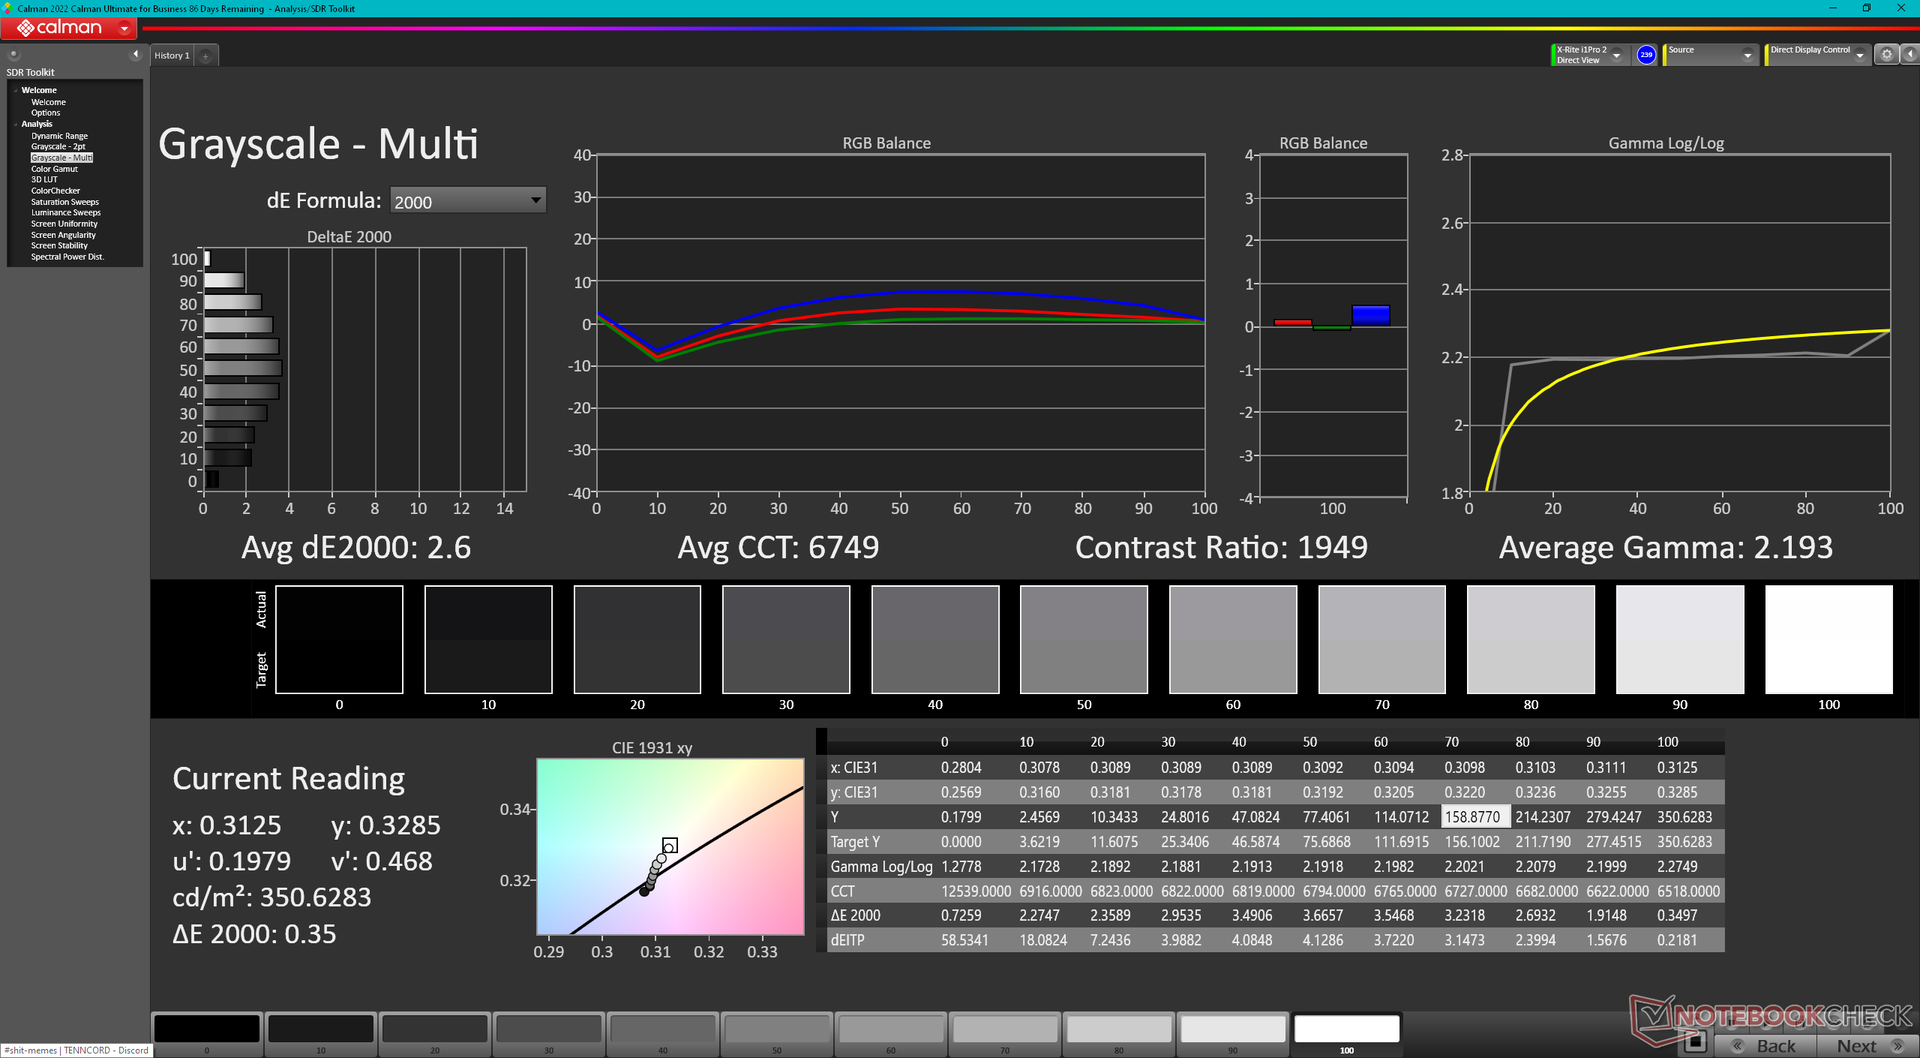
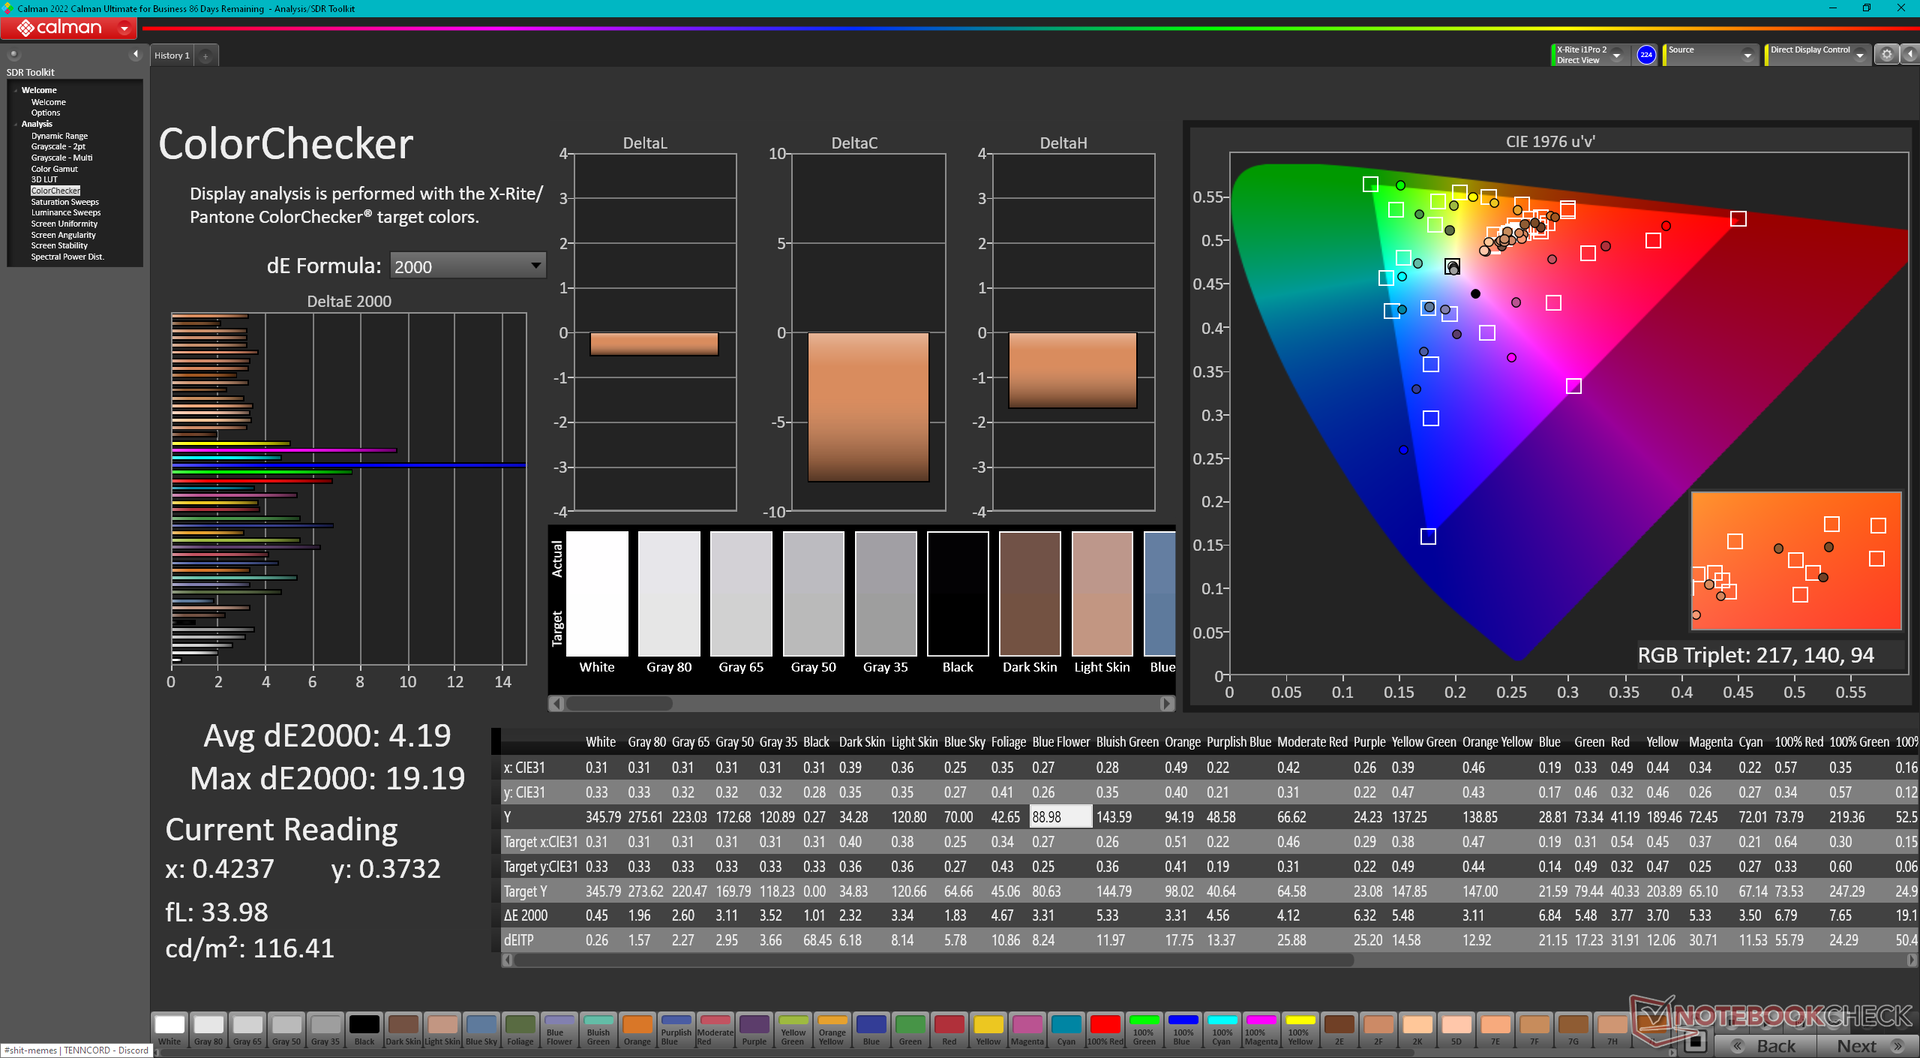
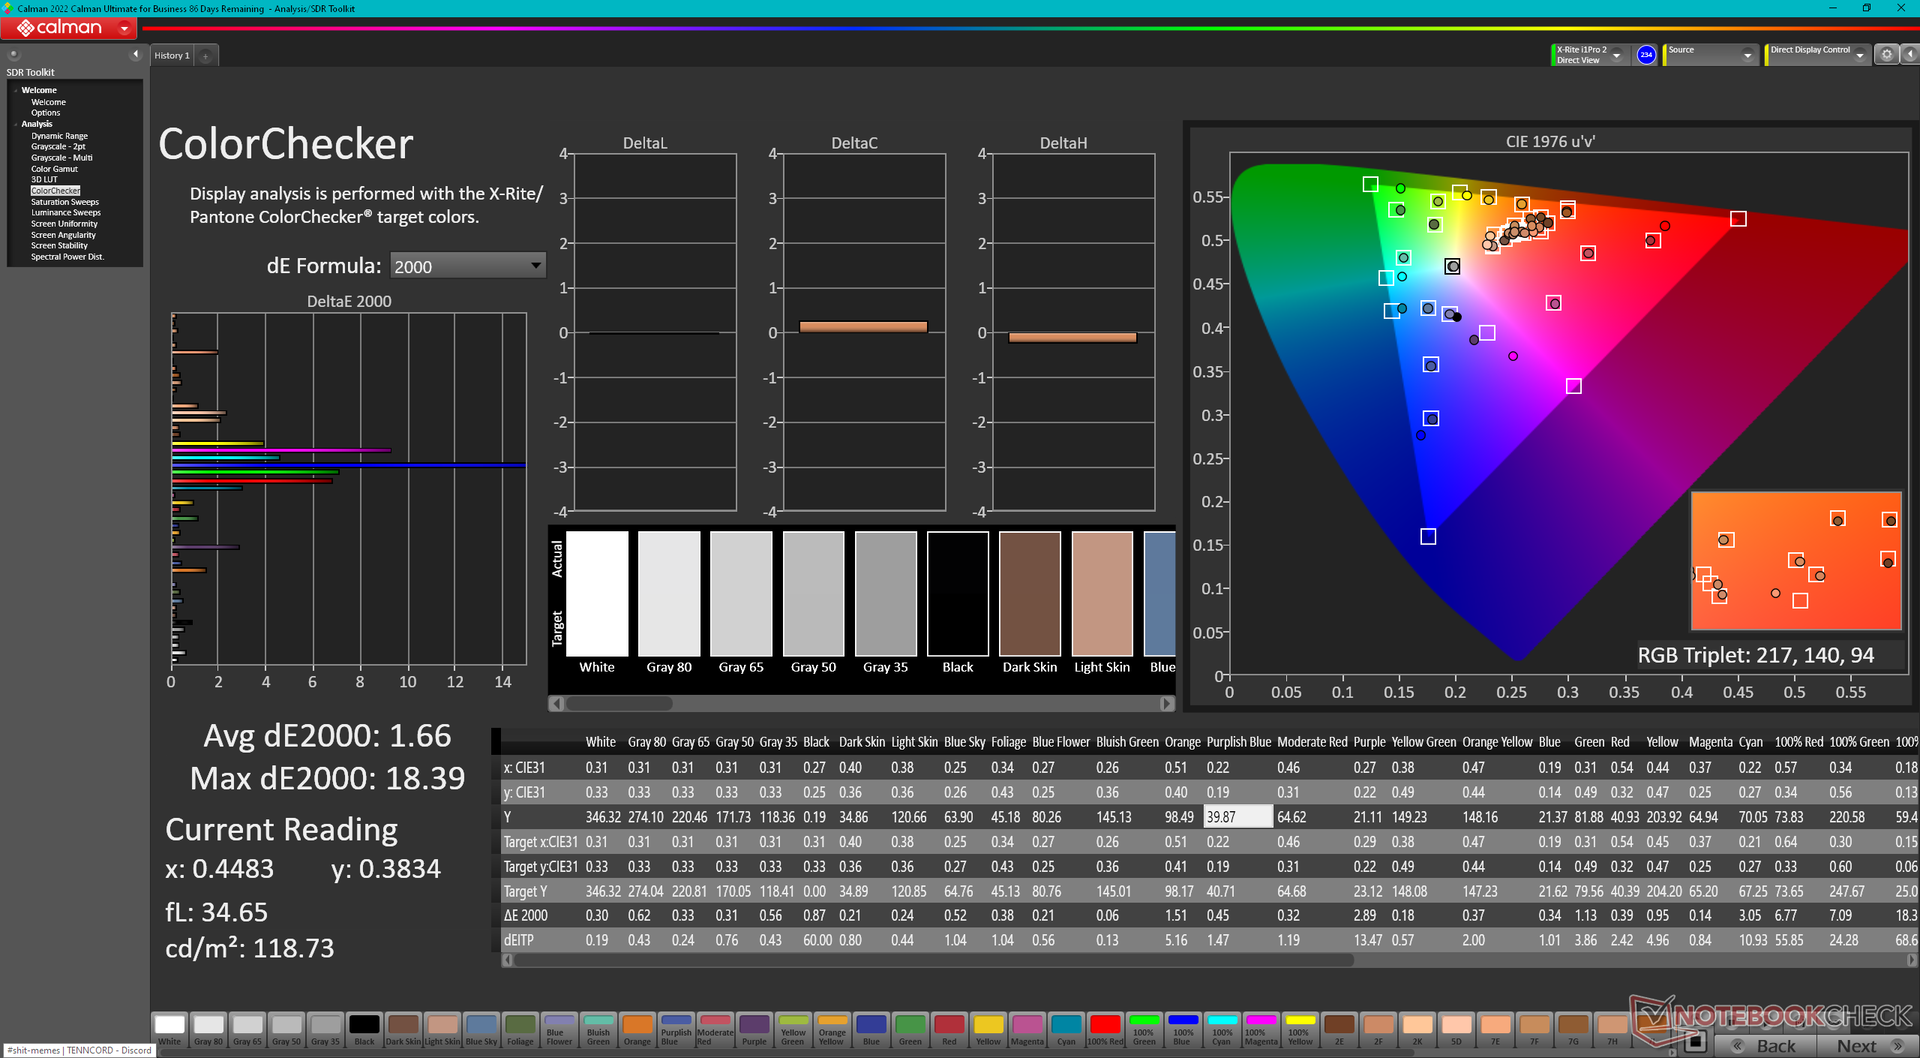
ΔE ColorChecker Calman: 4.19 | ∀{0.5-29.43 Ø4.73}
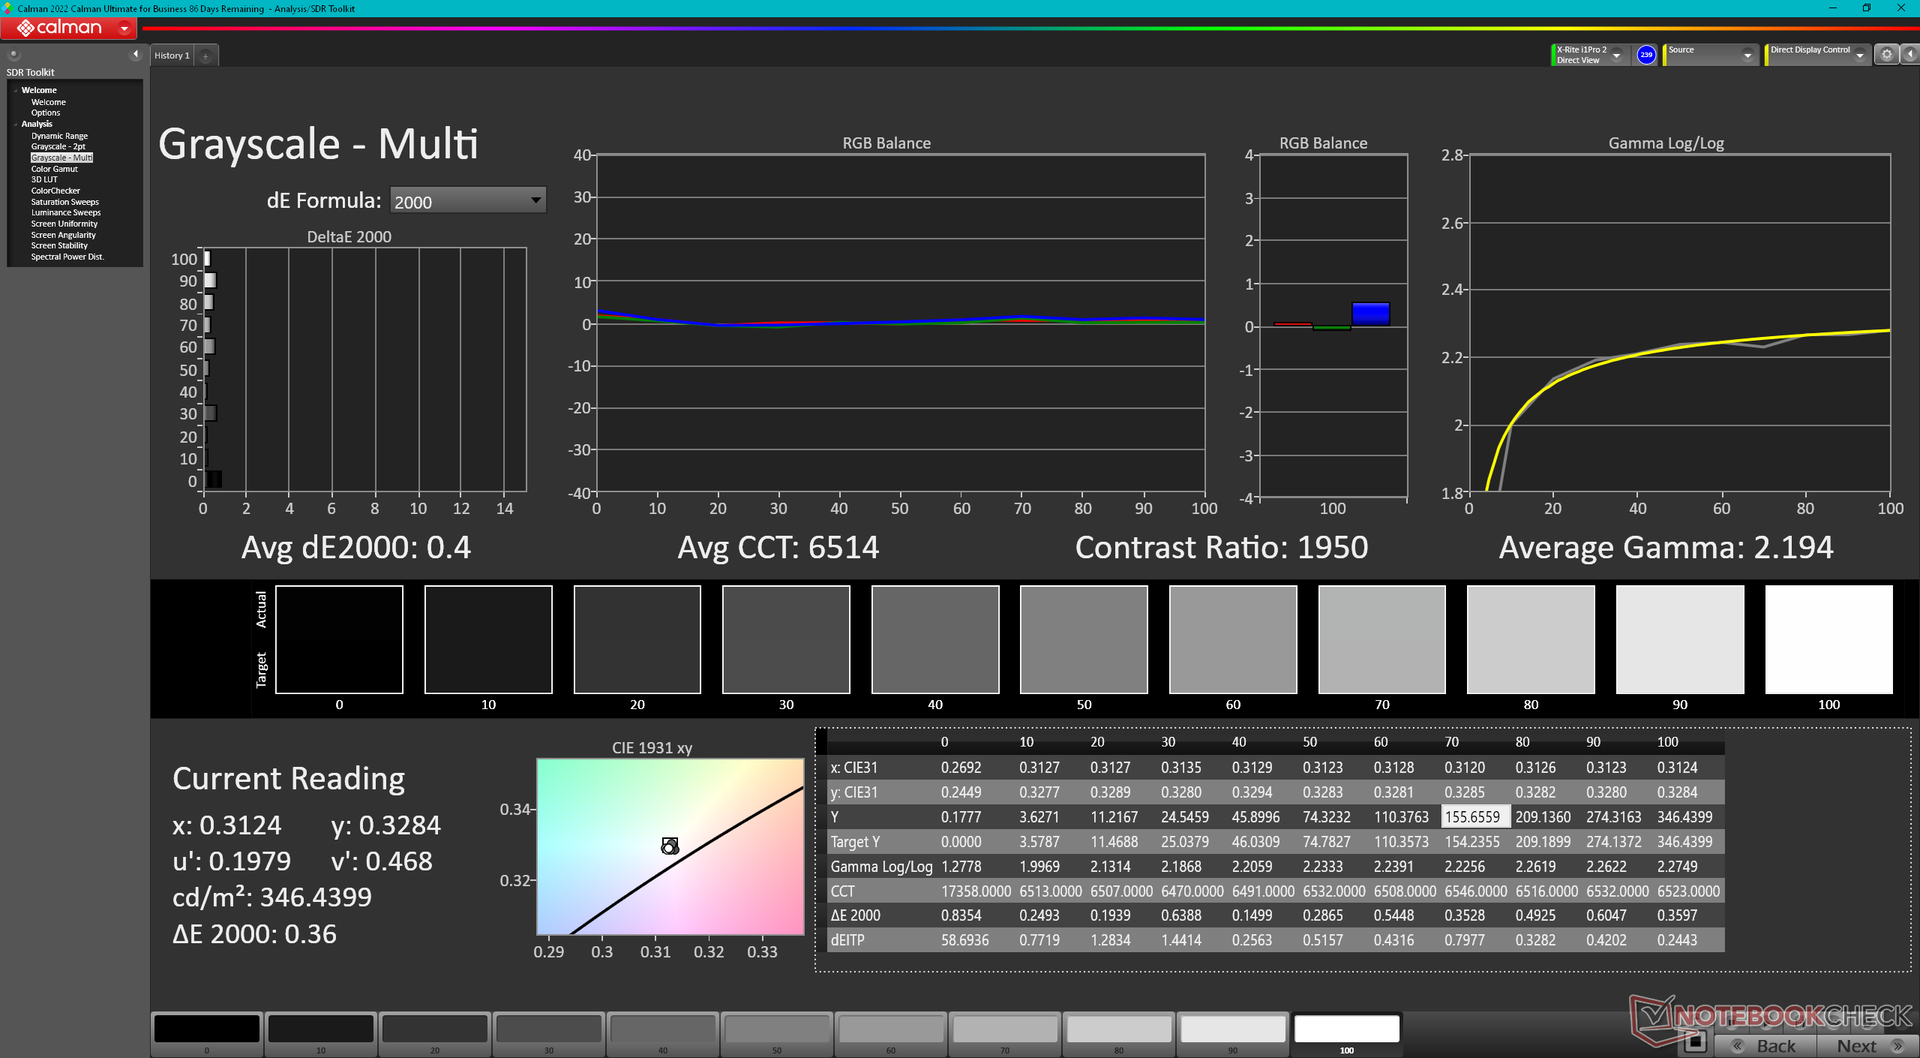
calibrated: 1.66
ΔE Greyscale Calman: 2.6 | ∀{0.09-98 Ø4.97}
41.5% AdobeRGB 1998 (Argyll 3D)
60.2% sRGB (Argyll 3D)
40.2% Display P3 (Argyll 3D)
Gamma: 2.19
CCT: 6749 K
| Lenovo LOQ 15APH8 BOE NJ NE156FHM-NX3, IPS, 1920x1080, 15.6" | Lenovo Legion 5 15IAH7H 82RB CSOT MNF601CA1-3, IPS, 1920x1080, 15.6" | Dell G15 5530 AUO B156HAN, IPS, 1920x1080, 15.6" | Asus TUF A15 FA507 N156HMA-GA1, IPS, 1920x1080, 15.6" | MSI Cyborg 15 A12VF AU Optronics B156HAN15.1, IPS, 1920x1080, 15.6" | HP Victus 15 fa0020nr CMN1521, IPS, 1920x1080, 15.6" | |
|---|---|---|---|---|---|---|
| Display | 69% | 75% | 60% | 5% | 4% | |
| Display P3 Coverage (%) | 40.2 | 69.1 72% | 73.1 82% | 64.9 61% | 42.3 5% | 42 4% |
| sRGB Coverage (%) | 60.2 | 99.5 65% | 98.4 63% | 96.5 60% | 62.6 4% | 62.7 4% |
| AdobeRGB 1998 Coverage (%) | 41.5 | 70 69% | 74.4 79% | 66.6 60% | 43.7 5% | 43.4 5% |
| Response Times | 58% | 85% | 22% | 46% | 4% | |
| Response Time Grey 50% / Grey 80% * (ms) | 42.7 ? | 14.8 ? 65% | 3.39 ? 92% | 30.4 ? 29% | 22 ? 48% | 35.2 ? 18% |
| Response Time Black / White * (ms) | 24.5 ? | 12 ? 51% | 5.35 ? 78% | 20.8 ? 15% | 14 ? 43% | 27.2 ? -11% |
| PWM Frequency (Hz) | 21620 ? | |||||
| Screen | -4% | -2% | 28% | -9% | 1% | |
| Brightness middle (cd/m²) | 346.2 | 363.5 5% | 320 -8% | 288 -17% | 247 -29% | 284.3 -18% |
| Brightness (cd/m²) | 329 | 350 6% | 316 -4% | 271 -18% | 234 -29% | 262 -20% |
| Brightness Distribution (%) | 81 | 89 10% | 94 16% | 91 12% | 89 10% | 87 7% |
| Black Level * (cd/m²) | 0.31 | 0.39 -26% | 0.21 32% | 0.17 45% | 0.25 19% | 0.17 45% |
| Contrast (:1) | 1117 | 932 -17% | 1524 36% | 1694 52% | 988 -12% | 1672 50% |
| Colorchecker dE 2000 * | 4.19 | 3.68 12% | 4.55 -9% | 1.9 55% | 3.78 10% | 4.52 -8% |
| Colorchecker dE 2000 max. * | 19.19 | 8.92 54% | 9.83 49% | 3.3 83% | 6.42 67% | 18.67 3% |
| Colorchecker dE 2000 calibrated * | 1.66 | 0.53 68% | 1.51 9% | 0.9 46% | 3.94 -137% | 1.55 7% |
| Greyscale dE 2000 * | 2.6 | 6.5 -150% | 6.2 -138% | 2.7 -4% | 2.16 17% | 4.1 -58% |
| Gamma | 2.19 100% | 2.2 100% | 2.07 106% | 2.32 95% | 2.33 94% | 2.3 96% |
| CCT | 6749 96% | 5995 108% | 6479 100% | 6535 99% | 6906 94% | 6529 100% |
| Total Average (Program / Settings) | 41% /
20% | 53% /
27% | 37% /
34% | 14% /
2% | 3% /
2% |
* ... smaller is better
Average grayscale and color deltaE values actually aren't terrible for a budget gaming laptop at just 2.6 and 4.19, respectively. We're able to get these values down to just 0.4 and 1.66 after a proper calibration with our X-Rite colorimeter. However, keep in mind that colors still become increasingly inaccurate at higher saturation levels due to the narrow color gamut mentioned above.
Our calibrated ICM profile is available above for free.
Display Response Times
| ↔ Response Time Black to White | ||
|---|---|---|
| 24.5 ms ... rise ↗ and fall ↘ combined | ↗ 12.2 ms rise | 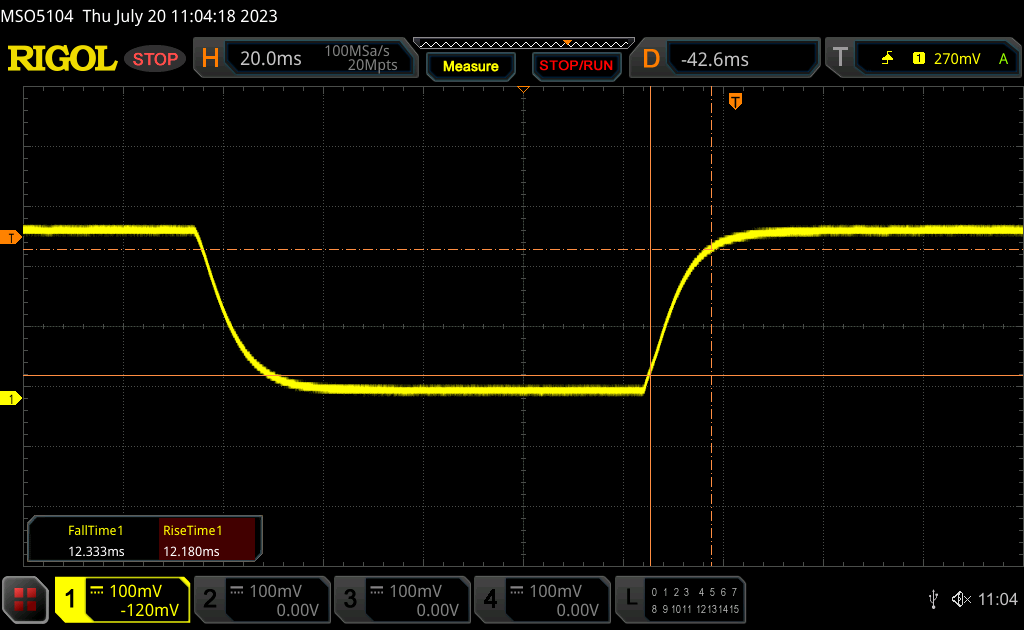 |
| ↘ 12.3 ms fall | ||
| The screen shows good response rates in our tests, but may be too slow for competitive gamers. In comparison, all tested devices range from 0.1 (minimum) to 240 (maximum) ms. » 58 % of all devices are better. This means that the measured response time is worse than the average of all tested devices (19.9 ms). | ||
| ↔ Response Time 50% Grey to 80% Grey | ||
| 42.7 ms ... rise ↗ and fall ↘ combined | ↗ 19.2 ms rise | 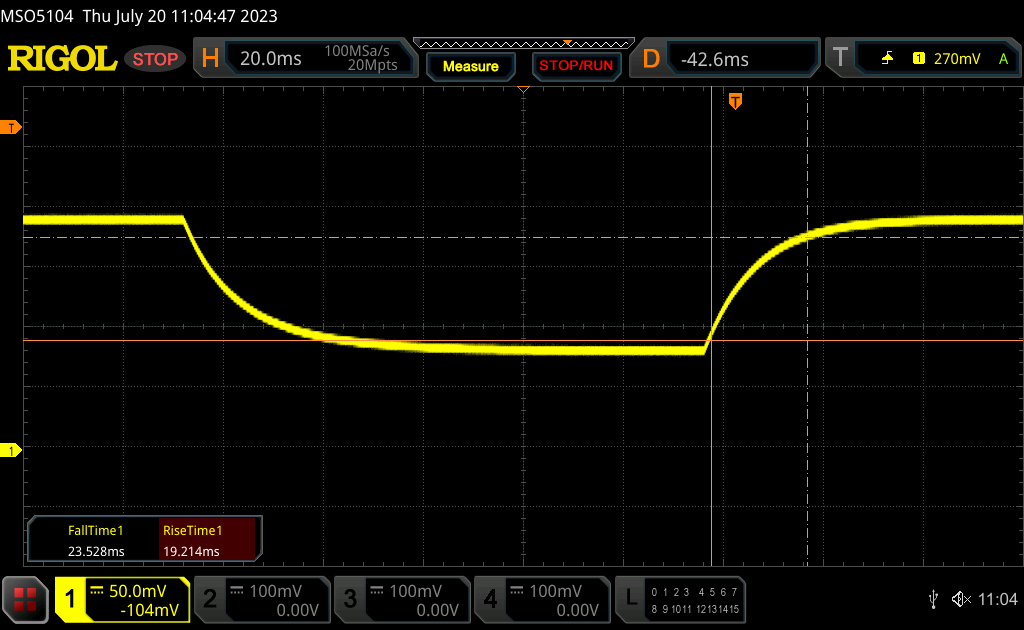 |
| ↘ 23.5 ms fall | ||
| The screen shows slow response rates in our tests and will be unsatisfactory for gamers. In comparison, all tested devices range from 0.165 (minimum) to 636 (maximum) ms. » 70 % of all devices are better. This means that the measured response time is worse than the average of all tested devices (31.1 ms). | ||
Screen Flickering / PWM (Pulse-Width Modulation)
| Screen flickering / PWM not detected |  | ||
In comparison: 52 % of all tested devices do not use PWM to dim the display. If PWM was detected, an average of 7801 (minimum: 5 - maximum: 343500) Hz was measured. | |||
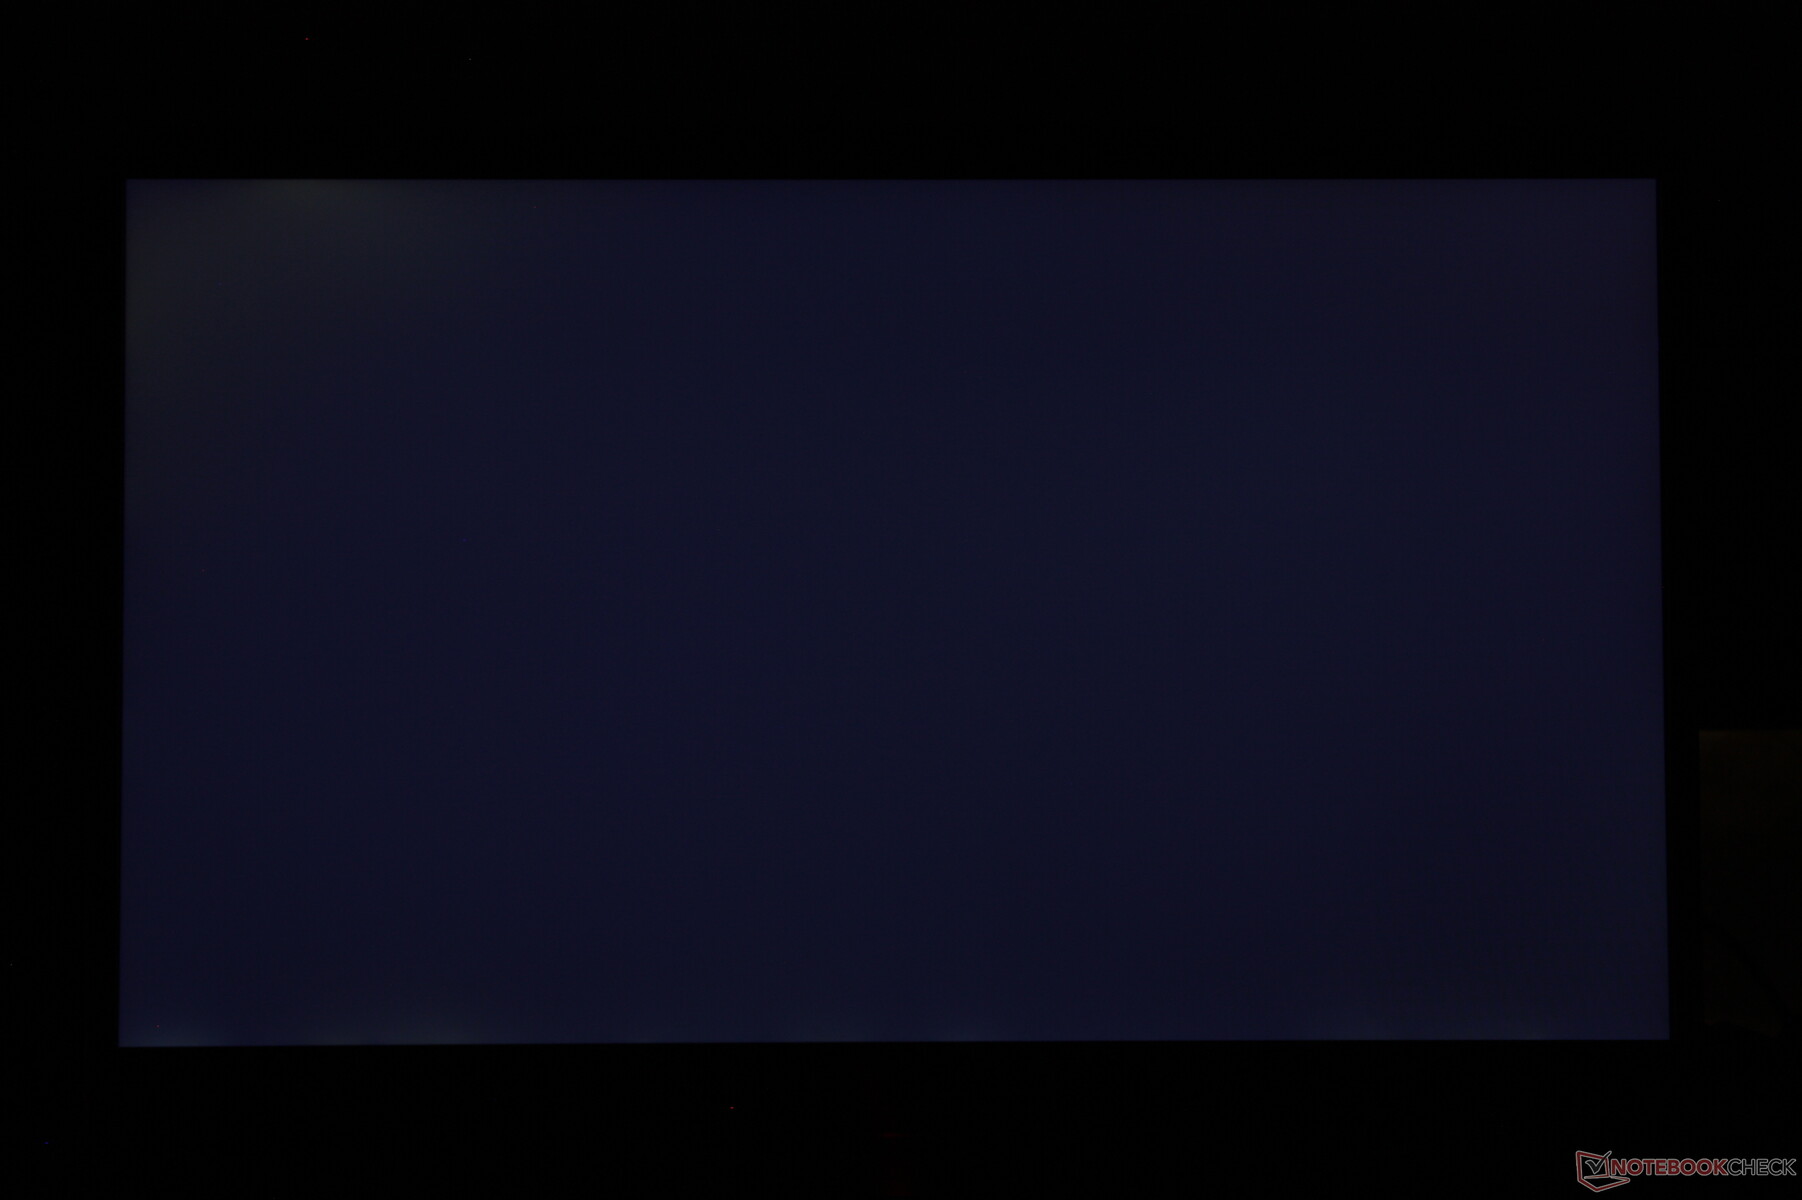
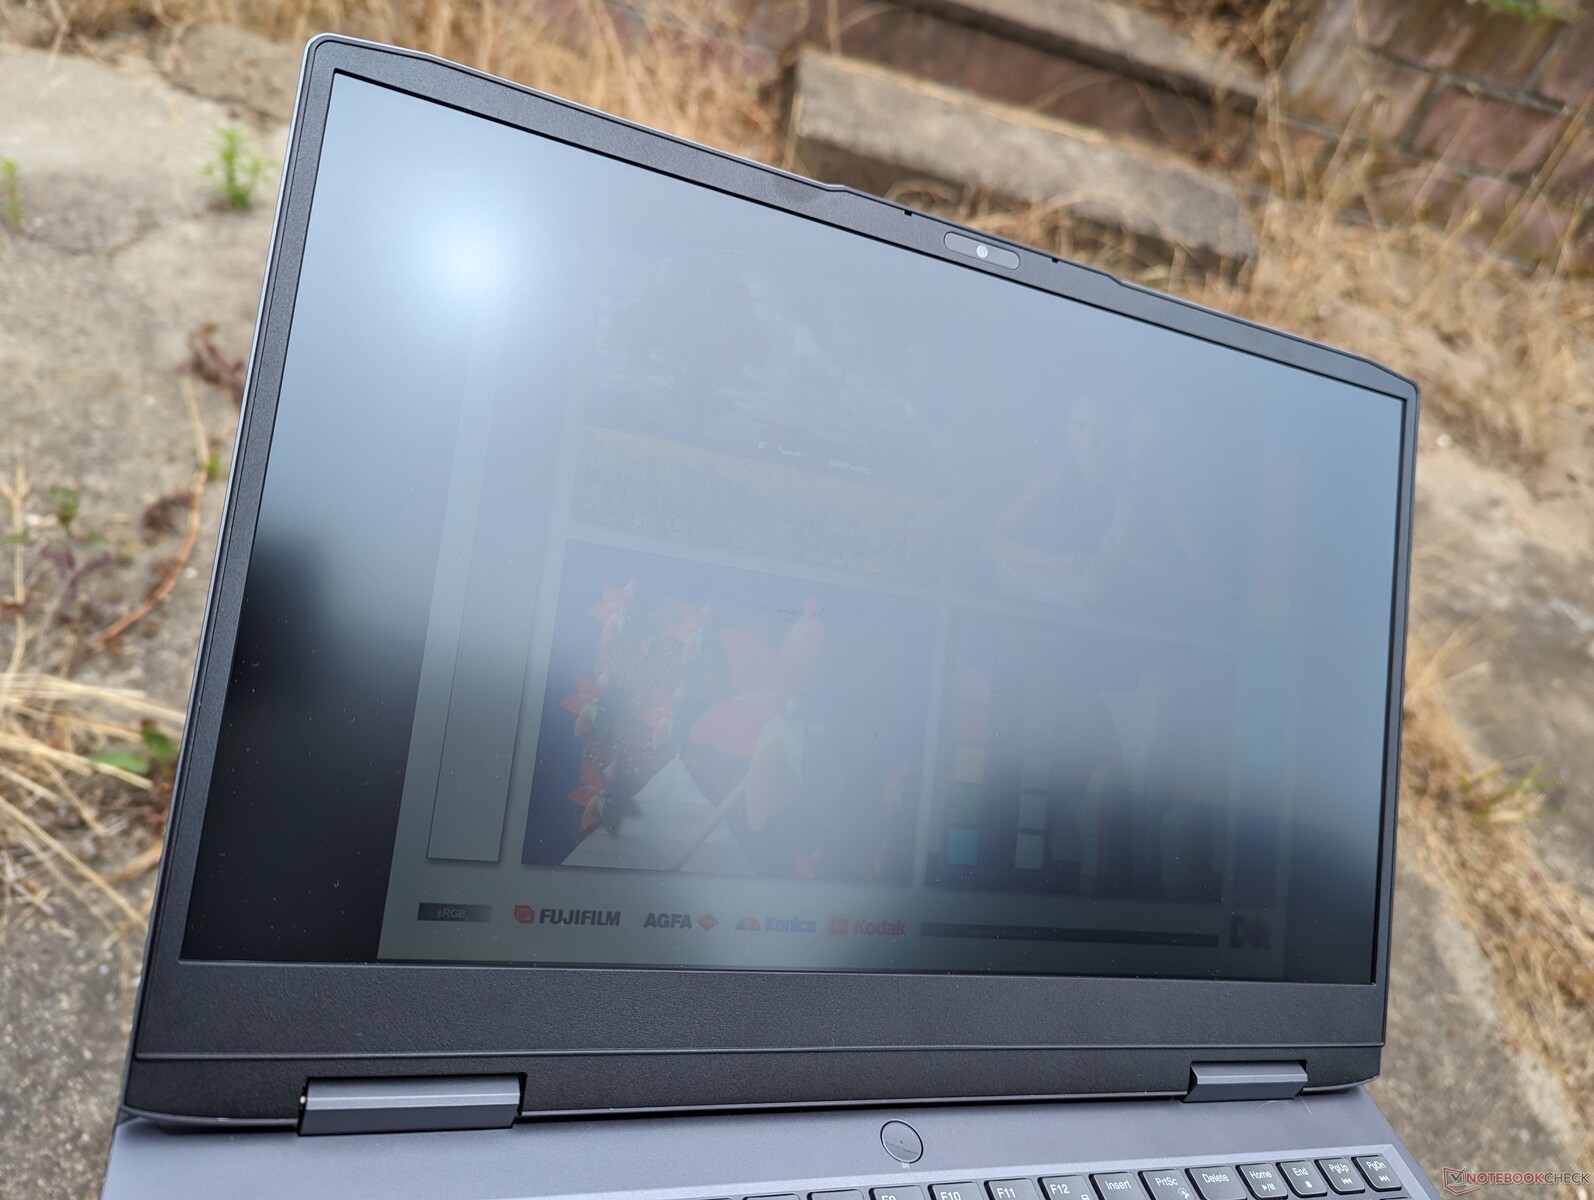
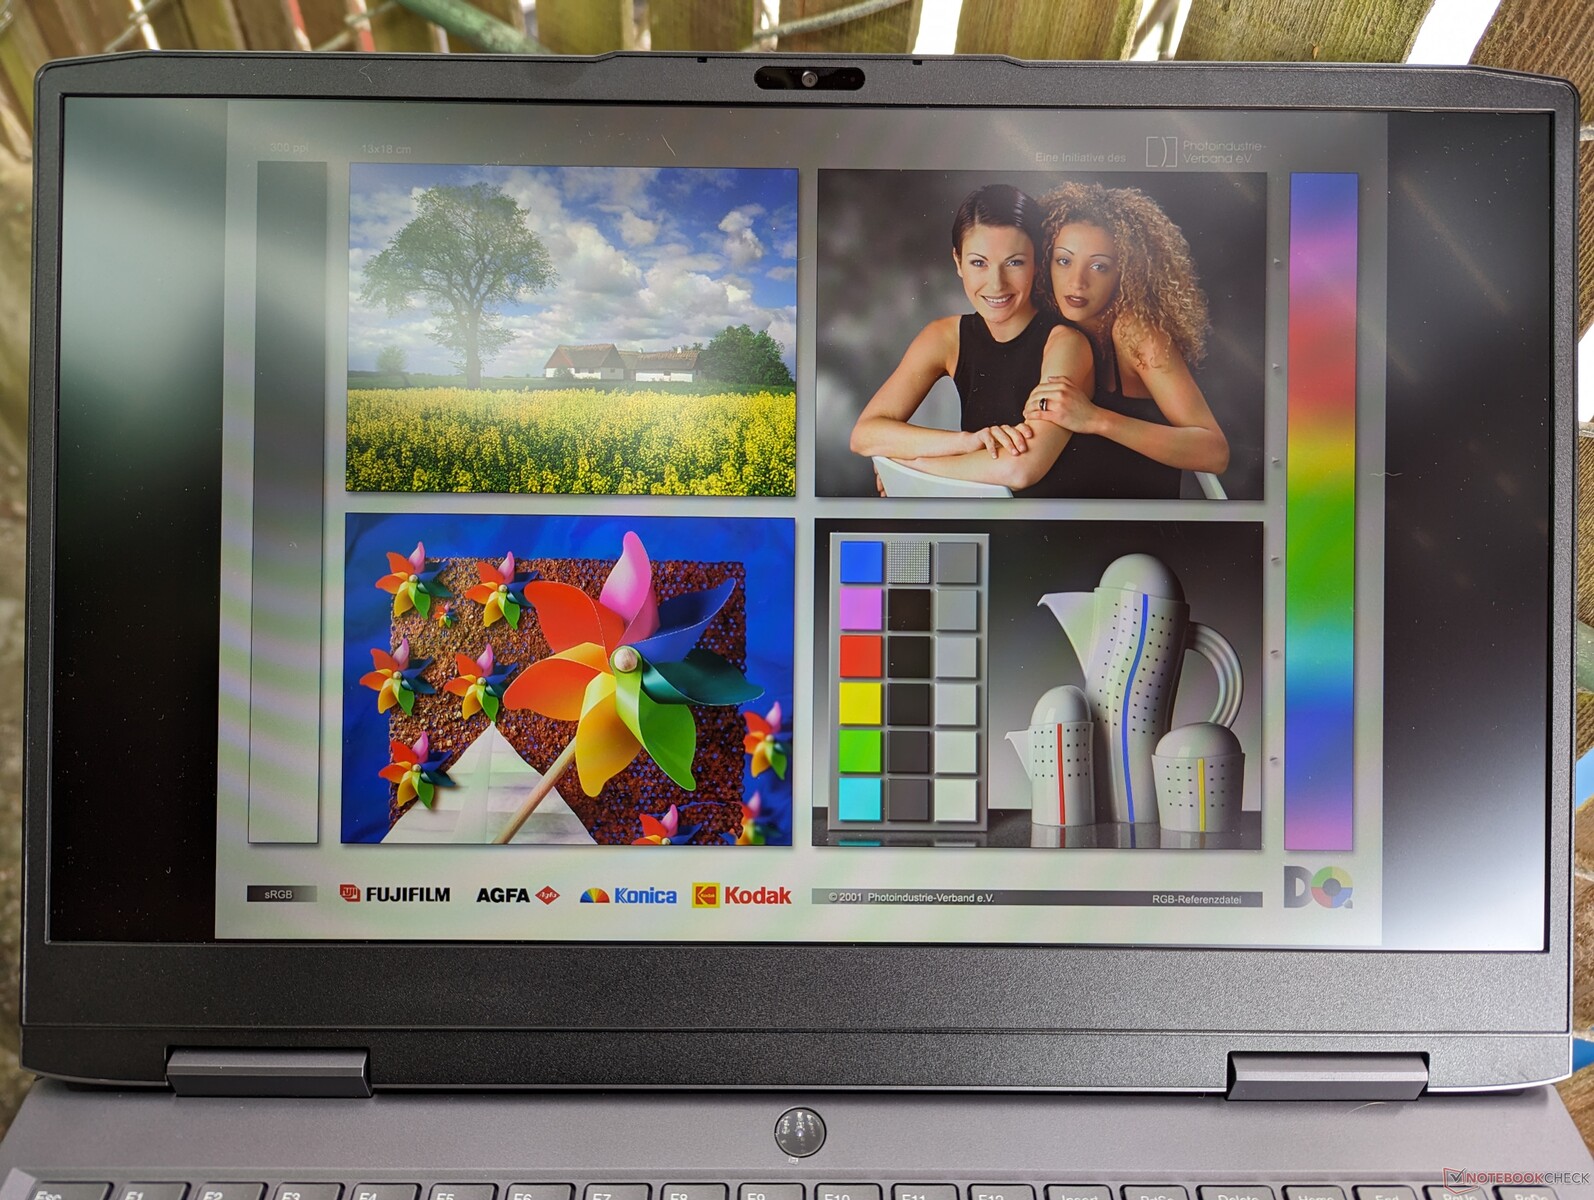
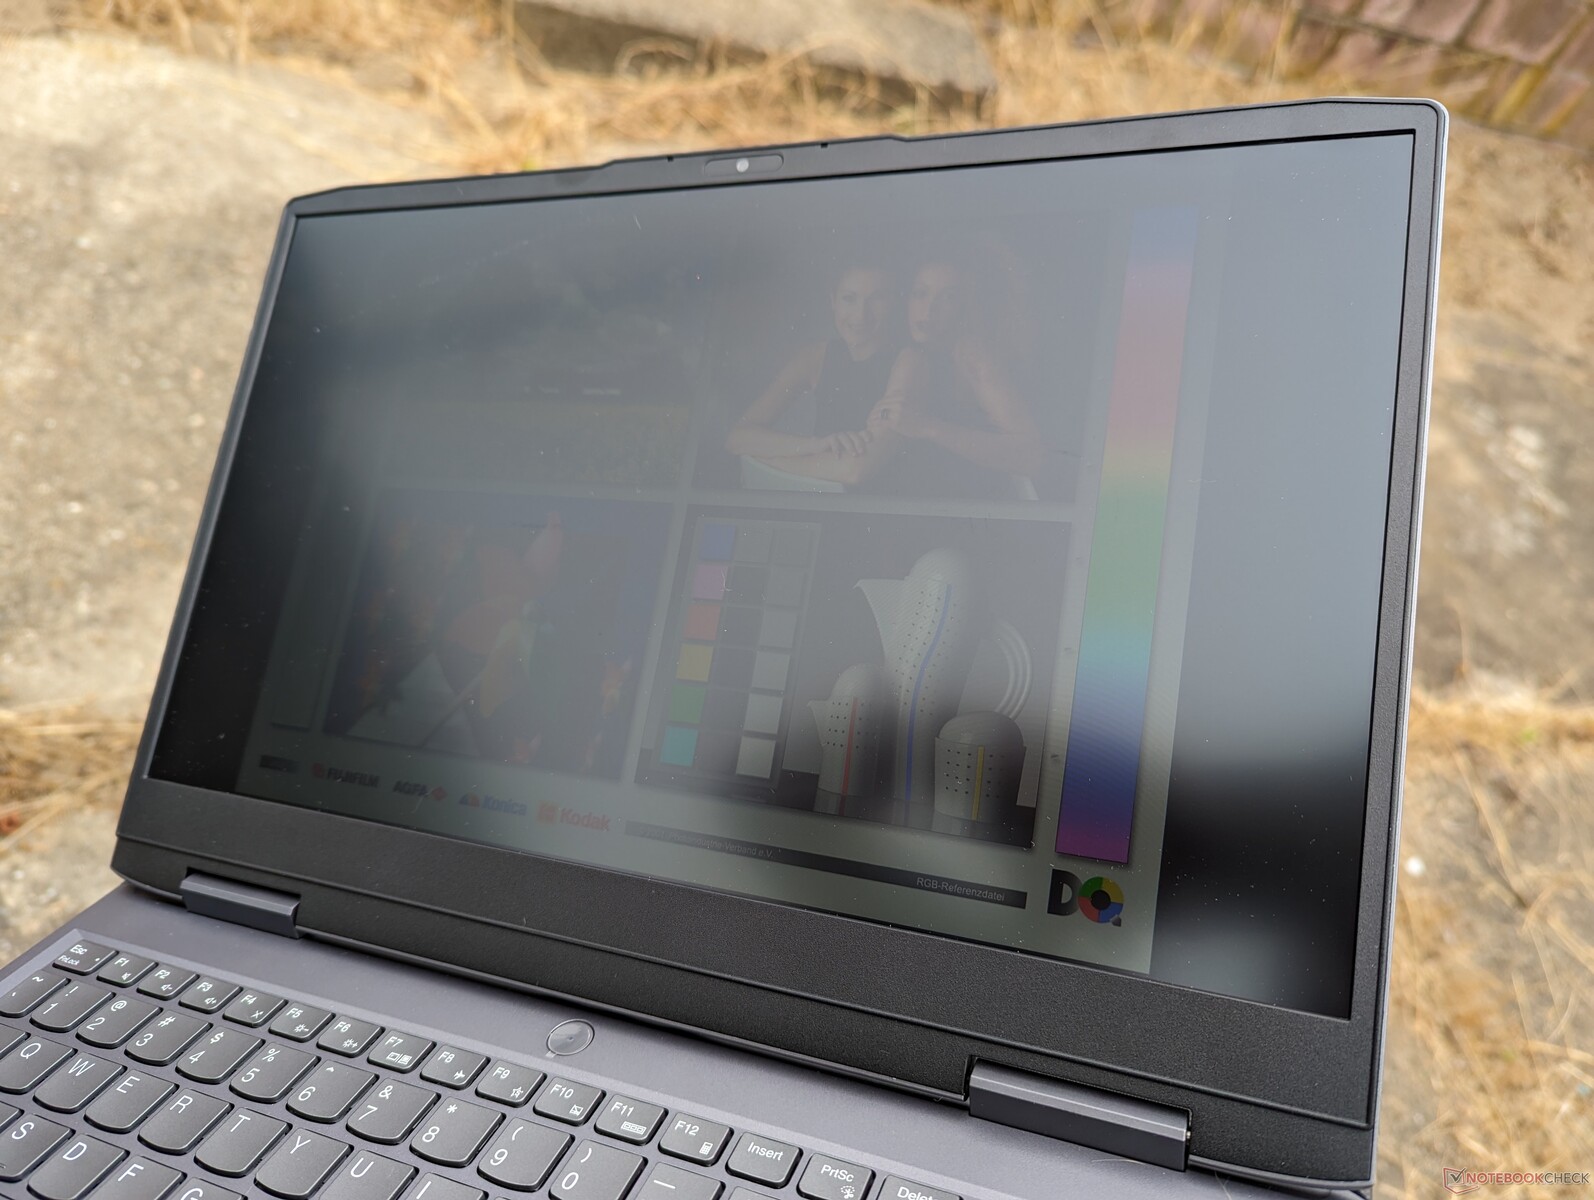
Most gaming laptops with IPS panels tend to fall in the 300-nit brightness range and the LOQ 15 is no exception. Thus, outdoor visibility is average for the category with nothing noteworthy. Anything brighter than a shady spot will cause immense glare and wash out onscreen colors.
Performance — Midrange AMD Zen 4
Testing Conditions
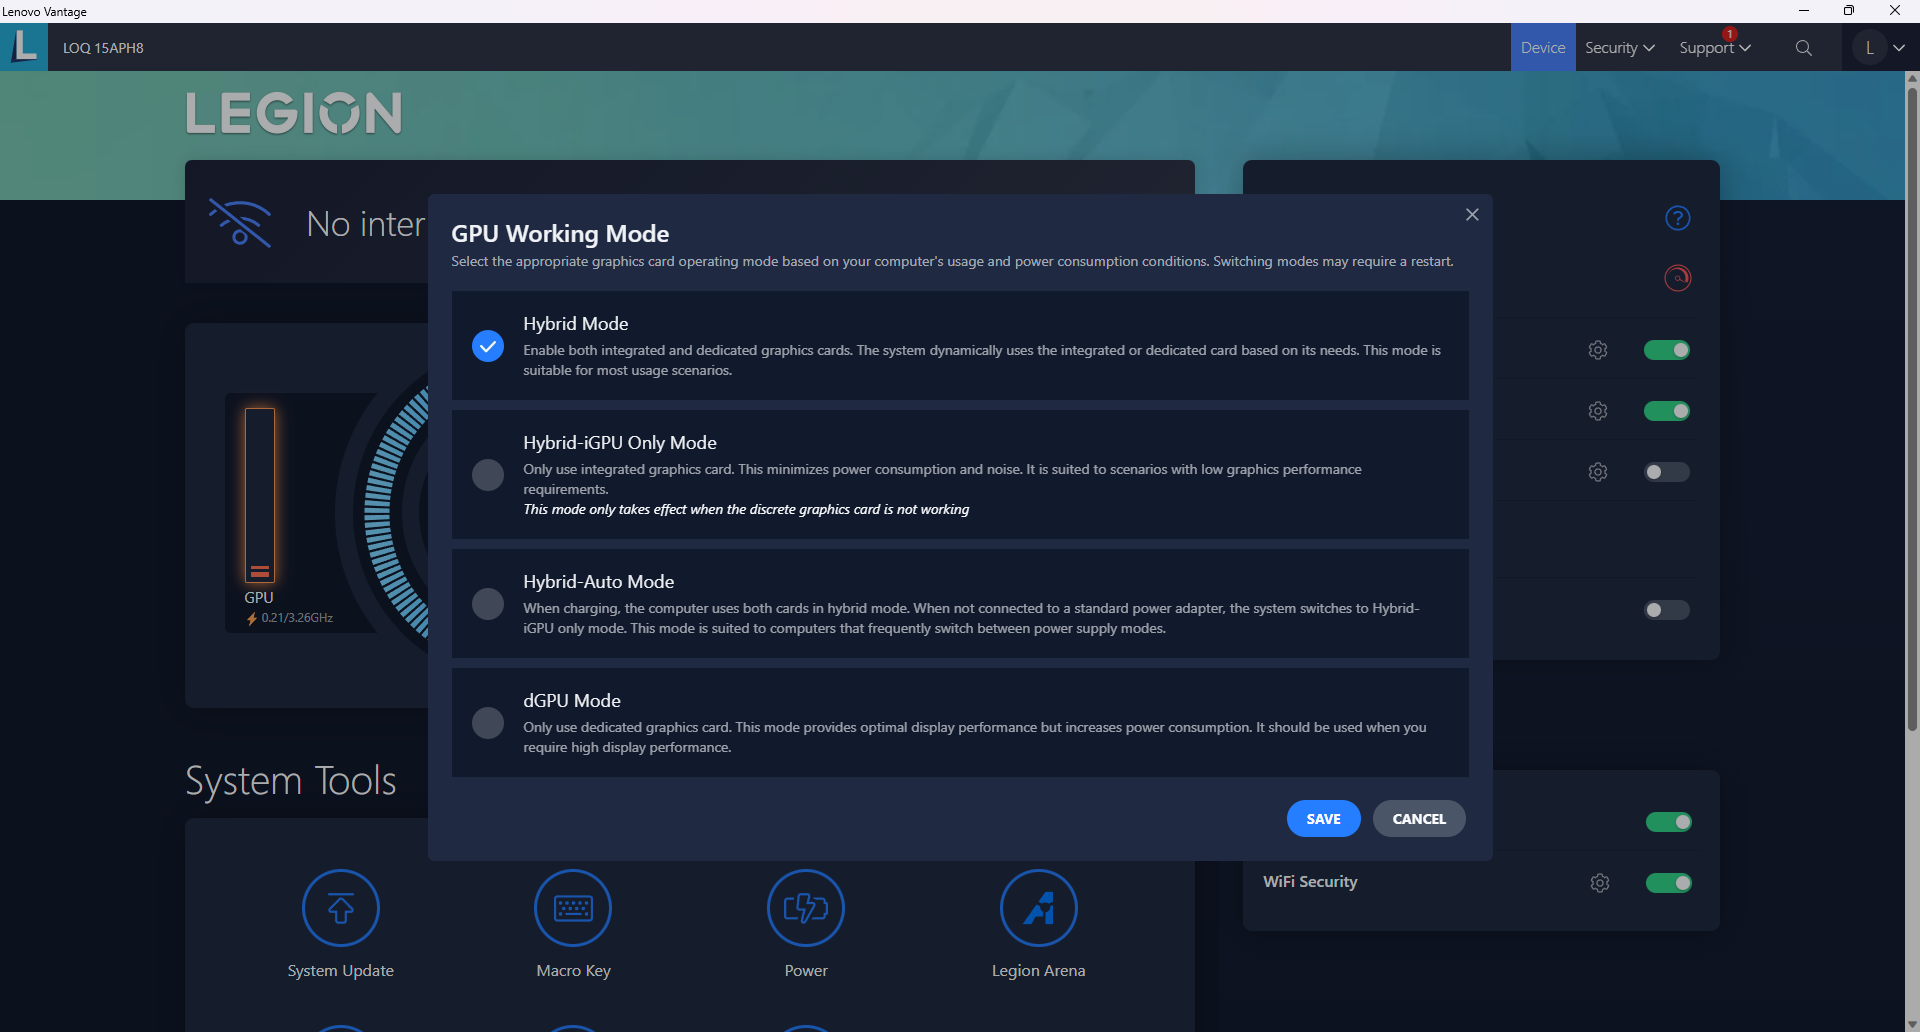
We set our unit to Performance mode via both Windows and Lenovo Vantage prior to running the benchmarks below. We also made sure to set the system to dGPU mode as Advanced Optimus is supported. It's recommended that users become familiar with the Vantage software since it is the central hub for Lenovo BIOS updates, power settings, warranty info, and other model-specific features.

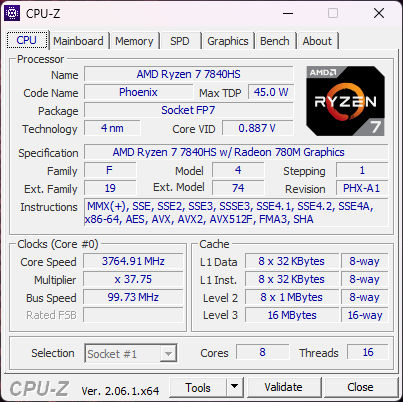
Processor
The Ryzen 7 7840HS is a slight step down from the higher-end Ryzen 7 7745HX with a performance deficit of just 5 percent. Overall performance is therefore comparable to the 12th gen Core i7-12700H that powered most gaming laptops of 2022. We're relieved that the LOQ series is shipping with Zen 4 CPUs instead of rebranded Zen 3 options like the Ryzen 7 7735HS which is noticeably slower and much less impressive.
Upgrading to the Intel version of the LOQ 15 with the Core i7-13700H is expected to boost CPU performance by roughly 20 percent based on our time with the recent Aorus 15X.
Cinebench R15 Multi Loop
Cinebench R23: Multi Core | Single Core
Cinebench R20: CPU (Multi Core) | CPU (Single Core)
Cinebench R15: CPU Multi 64Bit | CPU Single 64Bit
Blender: v2.79 BMW27 CPU
7-Zip 18.03: 7z b 4 | 7z b 4 -mmt1
Geekbench 5.5: Multi-Core | Single-Core
HWBOT x265 Benchmark v2.2: 4k Preset
LibreOffice : 20 Documents To PDF
R Benchmark 2.5: Overall mean
* ... smaller is better
AIDA64: FP32 Ray-Trace | FPU Julia | CPU SHA3 | CPU Queen | FPU SinJulia | FPU Mandel | CPU AES | CPU ZLib | FP64 Ray-Trace | CPU PhotoWorxx
| Performance rating | |
| Average AMD Ryzen 7 7840HS | |
| Lenovo LOQ 15APH8 | |
| Lenovo Legion 5 15IAH7H 82RB | |
| Dell G15 5530 | |
| Asus TUF A15 FA507 | |
| MSI Cyborg 15 A12VF | |
| HP Victus 15 fa0020nr | |
| AIDA64 / FP32 Ray-Trace | |
| Lenovo LOQ 15APH8 | |
| Average AMD Ryzen 7 7840HS (22845 - 28921, n=21) | |
| Dell G15 5530 | |
| Lenovo Legion 5 15IAH7H 82RB | |
| Asus TUF A15 FA507 | |
| HP Victus 15 fa0020nr | |
| MSI Cyborg 15 A12VF | |
| AIDA64 / FPU Julia | |
| Lenovo LOQ 15APH8 | |
| Average AMD Ryzen 7 7840HS (97164 - 123167, n=21) | |
| Asus TUF A15 FA507 | |
| Dell G15 5530 | |
| Lenovo Legion 5 15IAH7H 82RB | |
| MSI Cyborg 15 A12VF | |
| HP Victus 15 fa0020nr | |
| AIDA64 / CPU SHA3 | |
| Lenovo LOQ 15APH8 | |
| Average AMD Ryzen 7 7840HS (4293 - 5155, n=21) | |
| Dell G15 5530 | |
| Lenovo Legion 5 15IAH7H 82RB | |
| Asus TUF A15 FA507 | |
| MSI Cyborg 15 A12VF | |
| HP Victus 15 fa0020nr | |
| AIDA64 / CPU Queen | |
| Lenovo LOQ 15APH8 | |
| Average AMD Ryzen 7 7840HS (102271 - 125820, n=21) | |
| Dell G15 5530 | |
| Asus TUF A15 FA507 | |
| Lenovo Legion 5 15IAH7H 82RB | |
| HP Victus 15 fa0020nr | |
| MSI Cyborg 15 A12VF | |
| AIDA64 / FPU SinJulia | |
| Lenovo LOQ 15APH8 | |
| Average AMD Ryzen 7 7840HS (13767 - 15525, n=21) | |
| Asus TUF A15 FA507 | |
| Dell G15 5530 | |
| Lenovo Legion 5 15IAH7H 82RB | |
| MSI Cyborg 15 A12VF | |
| HP Victus 15 fa0020nr | |
| AIDA64 / FPU Mandel | |
| Lenovo LOQ 15APH8 | |
| Average AMD Ryzen 7 7840HS (52084 - 65812, n=21) | |
| Asus TUF A15 FA507 | |
| Dell G15 5530 | |
| Lenovo Legion 5 15IAH7H 82RB | |
| HP Victus 15 fa0020nr | |
| MSI Cyborg 15 A12VF | |
| AIDA64 / CPU AES | |
| Lenovo Legion 5 15IAH7H 82RB | |
| Average AMD Ryzen 7 7840HS (67389 - 177158, n=21) | |
| Dell G15 5530 | |
| Lenovo LOQ 15APH8 | |
| Asus TUF A15 FA507 | |
| MSI Cyborg 15 A12VF | |
| HP Victus 15 fa0020nr | |
| AIDA64 / CPU ZLib | |
| Dell G15 5530 | |
| Lenovo Legion 5 15IAH7H 82RB | |
| Lenovo LOQ 15APH8 | |
| Average AMD Ryzen 7 7840HS (944 - 1123, n=21) | |
| MSI Cyborg 15 A12VF | |
| HP Victus 15 fa0020nr | |
| Asus TUF A15 FA507 | |
| AIDA64 / FP64 Ray-Trace | |
| Lenovo LOQ 15APH8 | |
| Average AMD Ryzen 7 7840HS (12248 - 15599, n=21) | |
| Dell G15 5530 | |
| Lenovo Legion 5 15IAH7H 82RB | |
| Asus TUF A15 FA507 | |
| HP Victus 15 fa0020nr | |
| MSI Cyborg 15 A12VF | |
| AIDA64 / CPU PhotoWorxx | |
| Average AMD Ryzen 7 7840HS (17615 - 41516, n=21) | |
| Dell G15 5530 | |
| MSI Cyborg 15 A12VF | |
| Lenovo Legion 5 15IAH7H 82RB | |
| Asus TUF A15 FA507 | |
| HP Victus 15 fa0020nr | |
| Lenovo LOQ 15APH8 | |
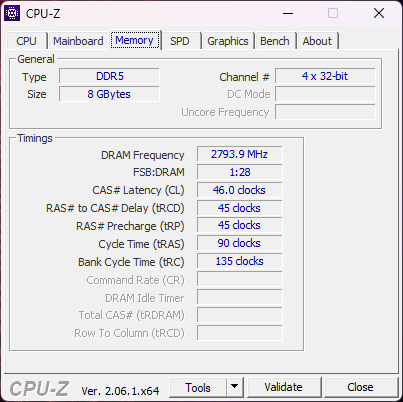
System Performance
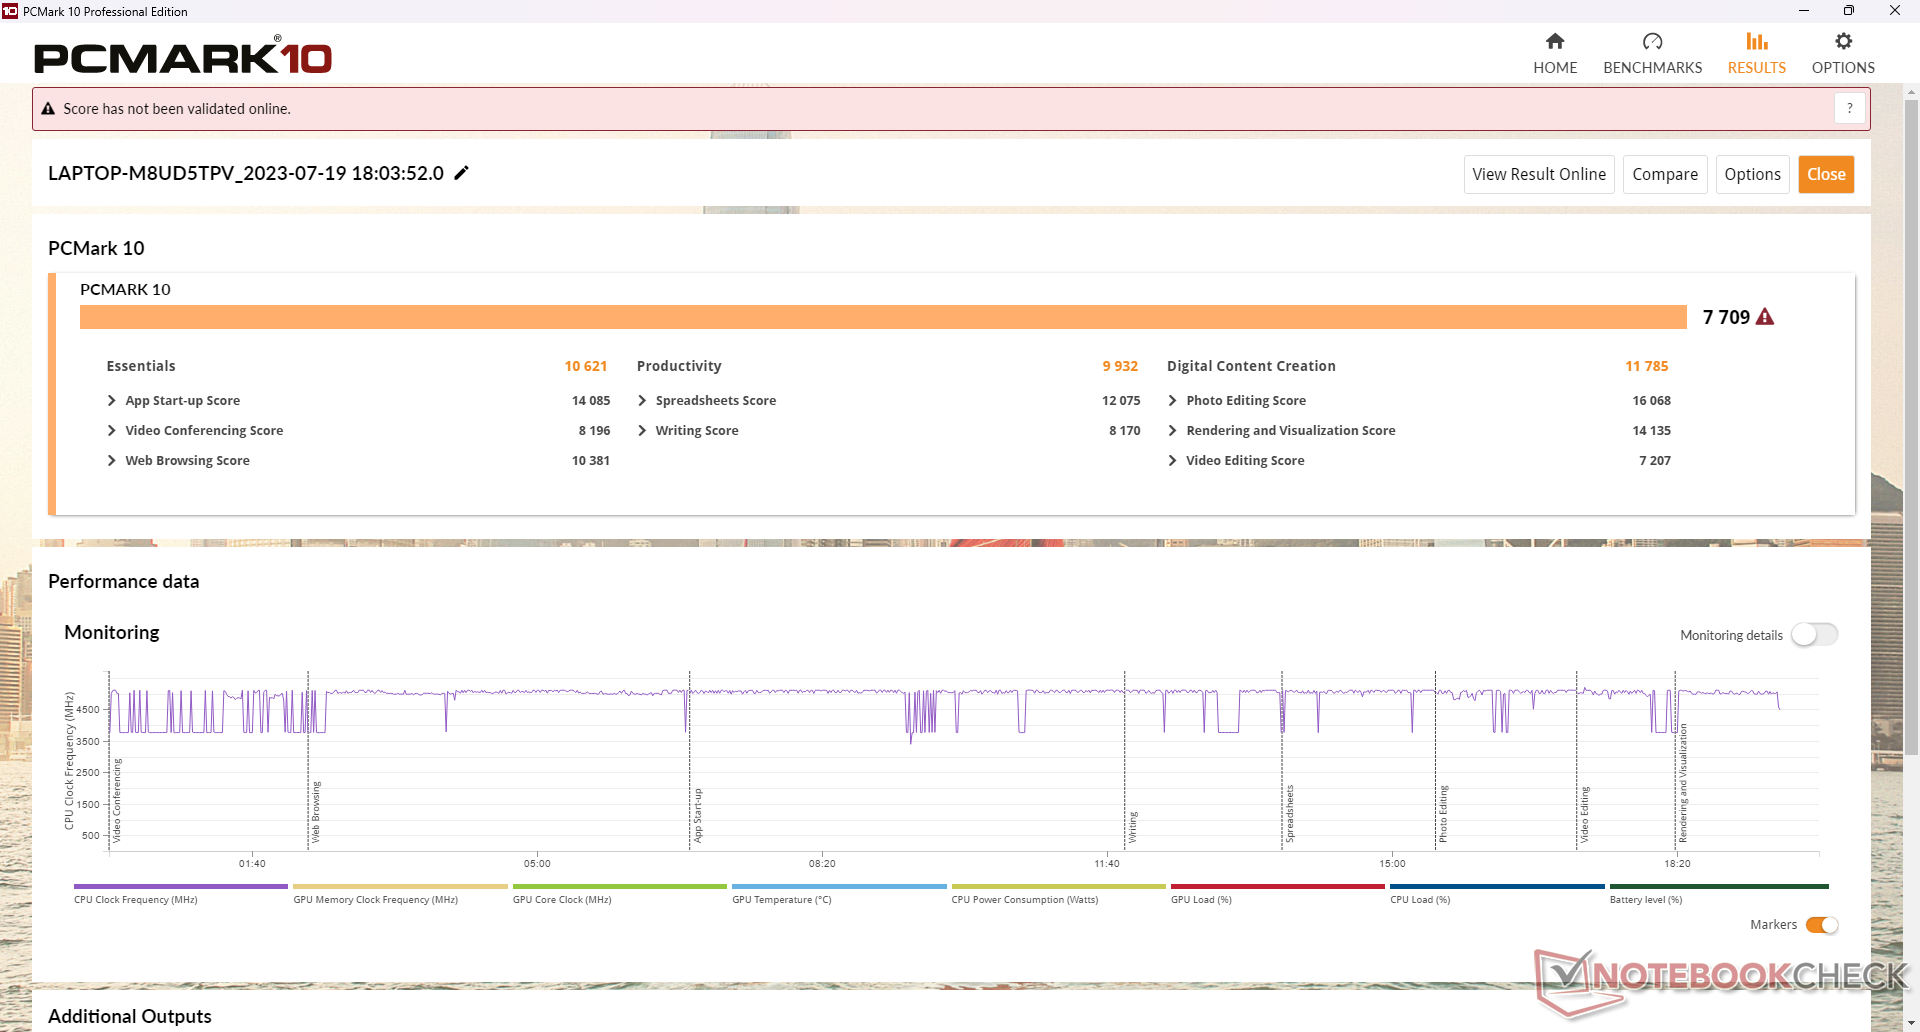
PCMark 10 results are comparable to competing models like the Dell G15 5530 and even just shy of the older 2022 Lenovo Legion 5 15. However, AIDA64 memory tests are only half as fast on our LOQ 15 unit due to its limited 8 GB of single-channel RAM. We recommend adding a second RAM module for a total of 16 GB whenever possible.
CrossMark: Overall | Productivity | Creativity | Responsiveness
| PCMark 10 / Score | |
| Lenovo Legion 5 15IAH7H 82RB | |
| Lenovo LOQ 15APH8 | |
| Average AMD Ryzen 7 7840HS, NVIDIA GeForce RTX 4050 Laptop GPU (7683 - 7709, n=2) | |
| Asus TUF A15 FA507 | |
| MSI Cyborg 15 A12VF | |
| Dell G15 5530 | |
| HP Victus 15 fa0020nr | |
| PCMark 10 / Essentials | |
| Lenovo Legion 5 15IAH7H 82RB | |
| Dell G15 5530 | |
| Average AMD Ryzen 7 7840HS, NVIDIA GeForce RTX 4050 Laptop GPU (10621 - 10755, n=2) | |
| MSI Cyborg 15 A12VF | |
| Lenovo LOQ 15APH8 | |
| Asus TUF A15 FA507 | |
| HP Victus 15 fa0020nr | |
| PCMark 10 / Productivity | |
| Lenovo Legion 5 15IAH7H 82RB | |
| Dell G15 5530 | |
| Average AMD Ryzen 7 7840HS, NVIDIA GeForce RTX 4050 Laptop GPU (9932 - 9980, n=2) | |
| Lenovo LOQ 15APH8 | |
| MSI Cyborg 15 A12VF | |
| Asus TUF A15 FA507 | |
| HP Victus 15 fa0020nr | |
| PCMark 10 / Digital Content Creation | |
| Lenovo Legion 5 15IAH7H 82RB | |
| Lenovo LOQ 15APH8 | |
| Average AMD Ryzen 7 7840HS, NVIDIA GeForce RTX 4050 Laptop GPU (11467 - 11785, n=2) | |
| Asus TUF A15 FA507 | |
| HP Victus 15 fa0020nr | |
| MSI Cyborg 15 A12VF | |
| Dell G15 5530 | |
| CrossMark / Overall | |
| Lenovo Legion 5 15IAH7H 82RB | |
| Dell G15 5530 | |
| MSI Cyborg 15 A12VF | |
| Average AMD Ryzen 7 7840HS, NVIDIA GeForce RTX 4050 Laptop GPU (1586 - 1749, n=2) | |
| HP Victus 15 fa0020nr | |
| Lenovo LOQ 15APH8 | |
| Asus TUF A15 FA507 | |
| CrossMark / Productivity | |
| Lenovo Legion 5 15IAH7H 82RB | |
| Dell G15 5530 | |
| MSI Cyborg 15 A12VF | |
| Average AMD Ryzen 7 7840HS, NVIDIA GeForce RTX 4050 Laptop GPU (1625 - 1677, n=2) | |
| Lenovo LOQ 15APH8 | |
| HP Victus 15 fa0020nr | |
| Asus TUF A15 FA507 | |
| CrossMark / Creativity | |
| Dell G15 5530 | |
| Lenovo Legion 5 15IAH7H 82RB | |
| MSI Cyborg 15 A12VF | |
| HP Victus 15 fa0020nr | |
| Average AMD Ryzen 7 7840HS, NVIDIA GeForce RTX 4050 Laptop GPU (1628 - 1930, n=2) | |
| Asus TUF A15 FA507 | |
| Lenovo LOQ 15APH8 | |
| CrossMark / Responsiveness | |
| Lenovo Legion 5 15IAH7H 82RB | |
| MSI Cyborg 15 A12VF | |
| Dell G15 5530 | |
| Average AMD Ryzen 7 7840HS, NVIDIA GeForce RTX 4050 Laptop GPU (1364 - 1480, n=2) | |
| HP Victus 15 fa0020nr | |
| Lenovo LOQ 15APH8 | |
| Asus TUF A15 FA507 | |
| PCMark 10 Score | 7709 points | |
Help | ||
| AIDA64 / Memory Copy | |
| Average AMD Ryzen 7 7840HS (30937 - 72158, n=21) | |
| Dell G15 5530 | |
| MSI Cyborg 15 A12VF | |
| Lenovo Legion 5 15IAH7H 82RB | |
| Asus TUF A15 FA507 | |
| HP Victus 15 fa0020nr | |
| Lenovo LOQ 15APH8 | |
| AIDA64 / Memory Read | |
| Dell G15 5530 | |
| MSI Cyborg 15 A12VF | |
| Lenovo Legion 5 15IAH7H 82RB | |
| Average AMD Ryzen 7 7840HS (30497 - 62147, n=21) | |
| Asus TUF A15 FA507 | |
| HP Victus 15 fa0020nr | |
| Lenovo LOQ 15APH8 | |
| AIDA64 / Memory Write | |
| Average AMD Ryzen 7 7840HS (34590 - 93323, n=21) | |
| Dell G15 5530 | |
| Lenovo Legion 5 15IAH7H 82RB | |
| MSI Cyborg 15 A12VF | |
| Asus TUF A15 FA507 | |
| HP Victus 15 fa0020nr | |
| Lenovo LOQ 15APH8 | |
| AIDA64 / Memory Latency | |
| Lenovo Legion 5 15IAH7H 82RB | |
| Lenovo LOQ 15APH8 | |
| Average AMD Ryzen 7 7840HS (85.1 - 112, n=21) | |
| MSI Cyborg 15 A12VF | |
| Dell G15 5530 | |
| Asus TUF A15 FA507 | |
| HP Victus 15 fa0020nr | |
* ... smaller is better
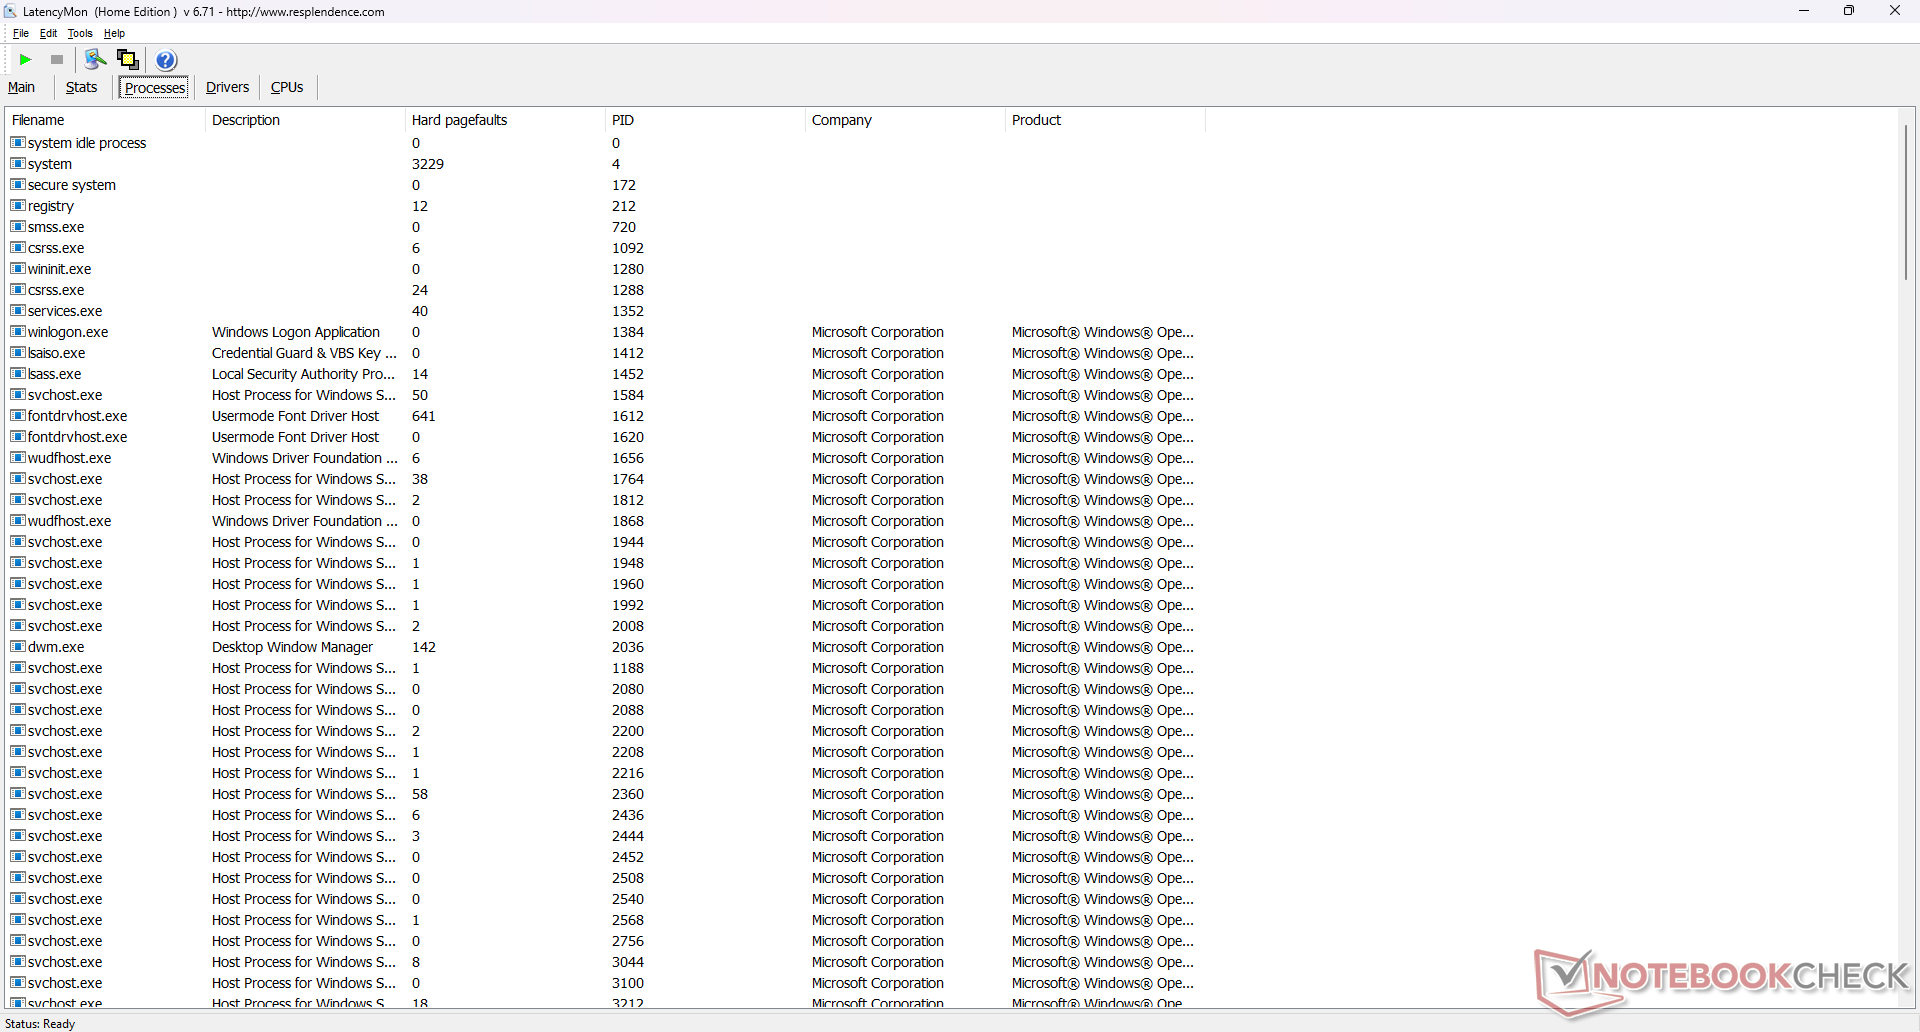
DPC Latency
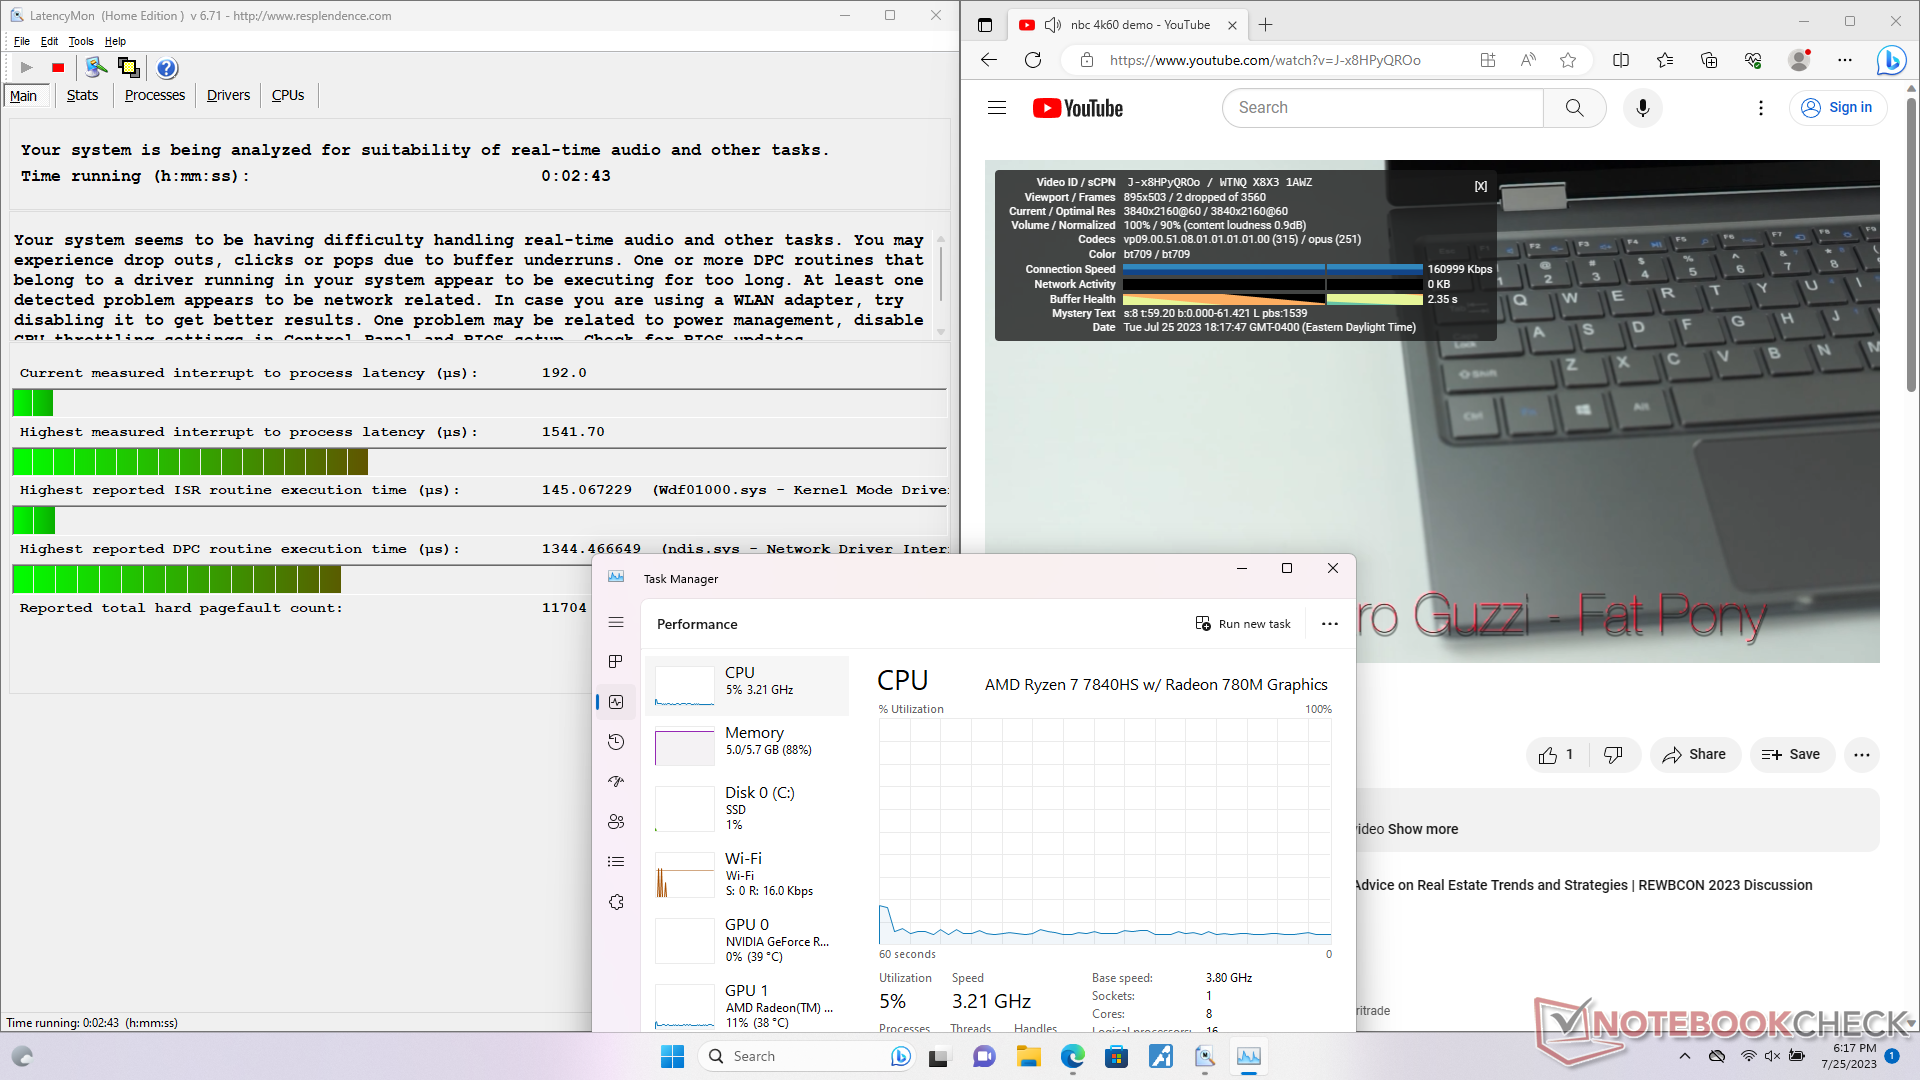
LatencyMon reveals minor DPC issues when opening multiple browser tabs of our homepage. 4K video playback at 60 FPS is nearly perfect with just 2 dropped frames during a one-minute timeframe.
| DPC Latencies / LatencyMon - interrupt to process latency (max), Web, Youtube, Prime95 | |
| Dell G15 5530 | |
| HP Victus 15 fa0020nr | |
| Lenovo LOQ 15APH8 | |
| MSI Cyborg 15 A12VF | |
| Lenovo Legion 5 15IAH7H 82RB | |
* ... smaller is better
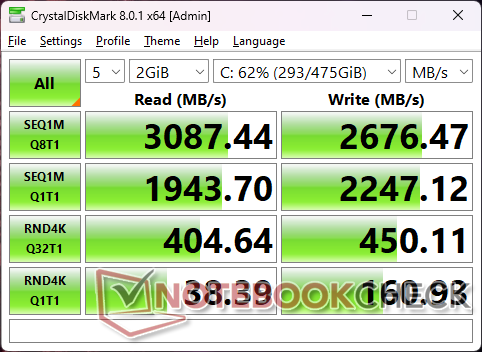
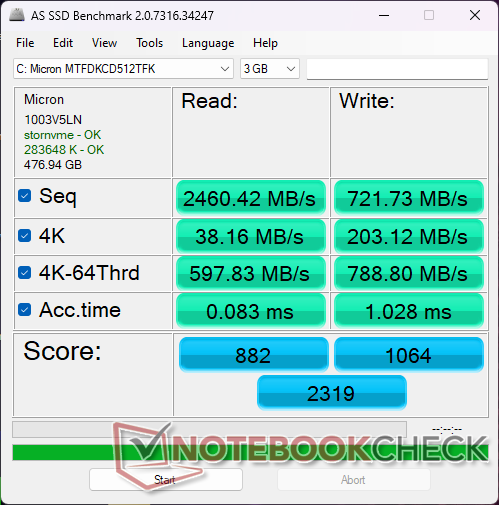
Storage Devices — PCIe4 x4 NVMe Support
Our unit ships with a budget Micron 2450 PCIe4 x4 NVMe SSD able to sustain real-world read rates of up to 2600 MB/s without any throttling. Up to two internal SSDs are supported.


| Drive Performance rating - Percent | |
| Lenovo Legion 5 15IAH7H 82RB | |
| HP Victus 15 fa0020nr | |
| MSI Cyborg 15 A12VF | |
| Asus TUF A15 FA507 | |
| Dell G15 5530 | |
| Lenovo LOQ 15APH8 | |
* ... smaller is better
Disk Throttling: DiskSpd Read Loop, Queue Depth 8
GPU Performance
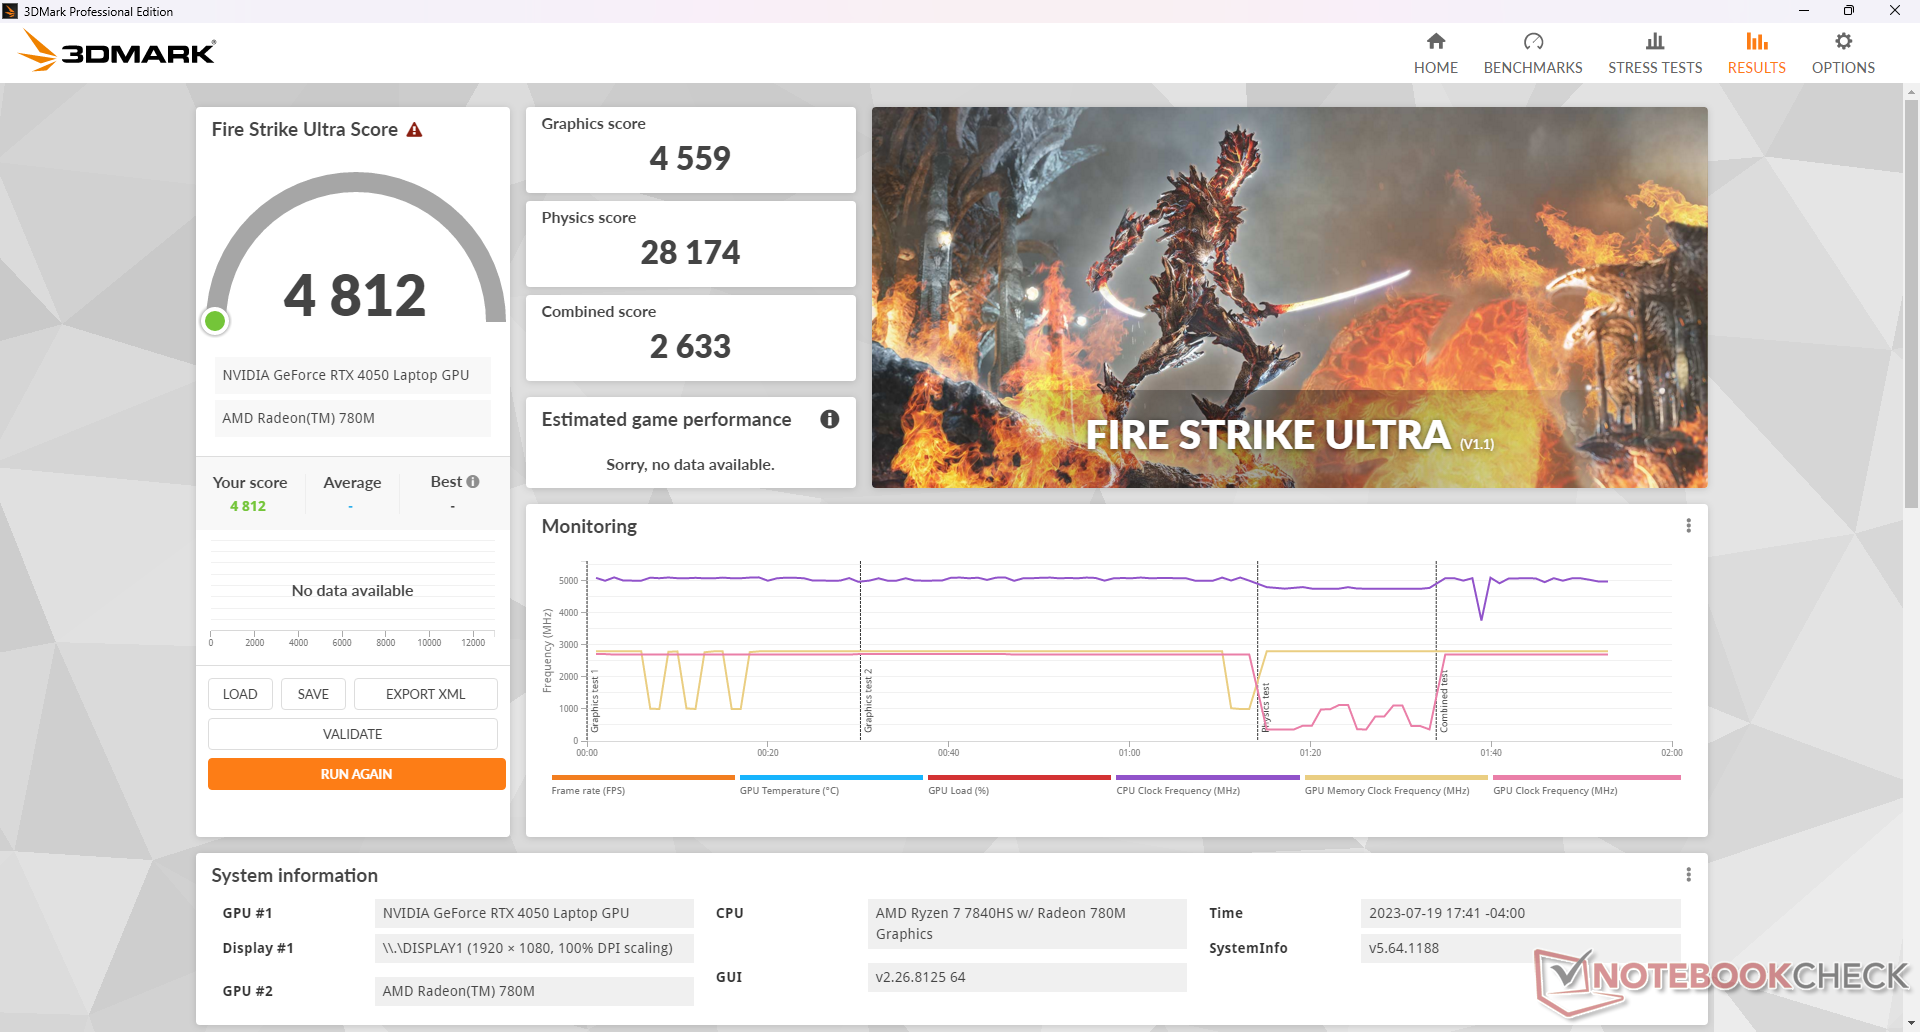
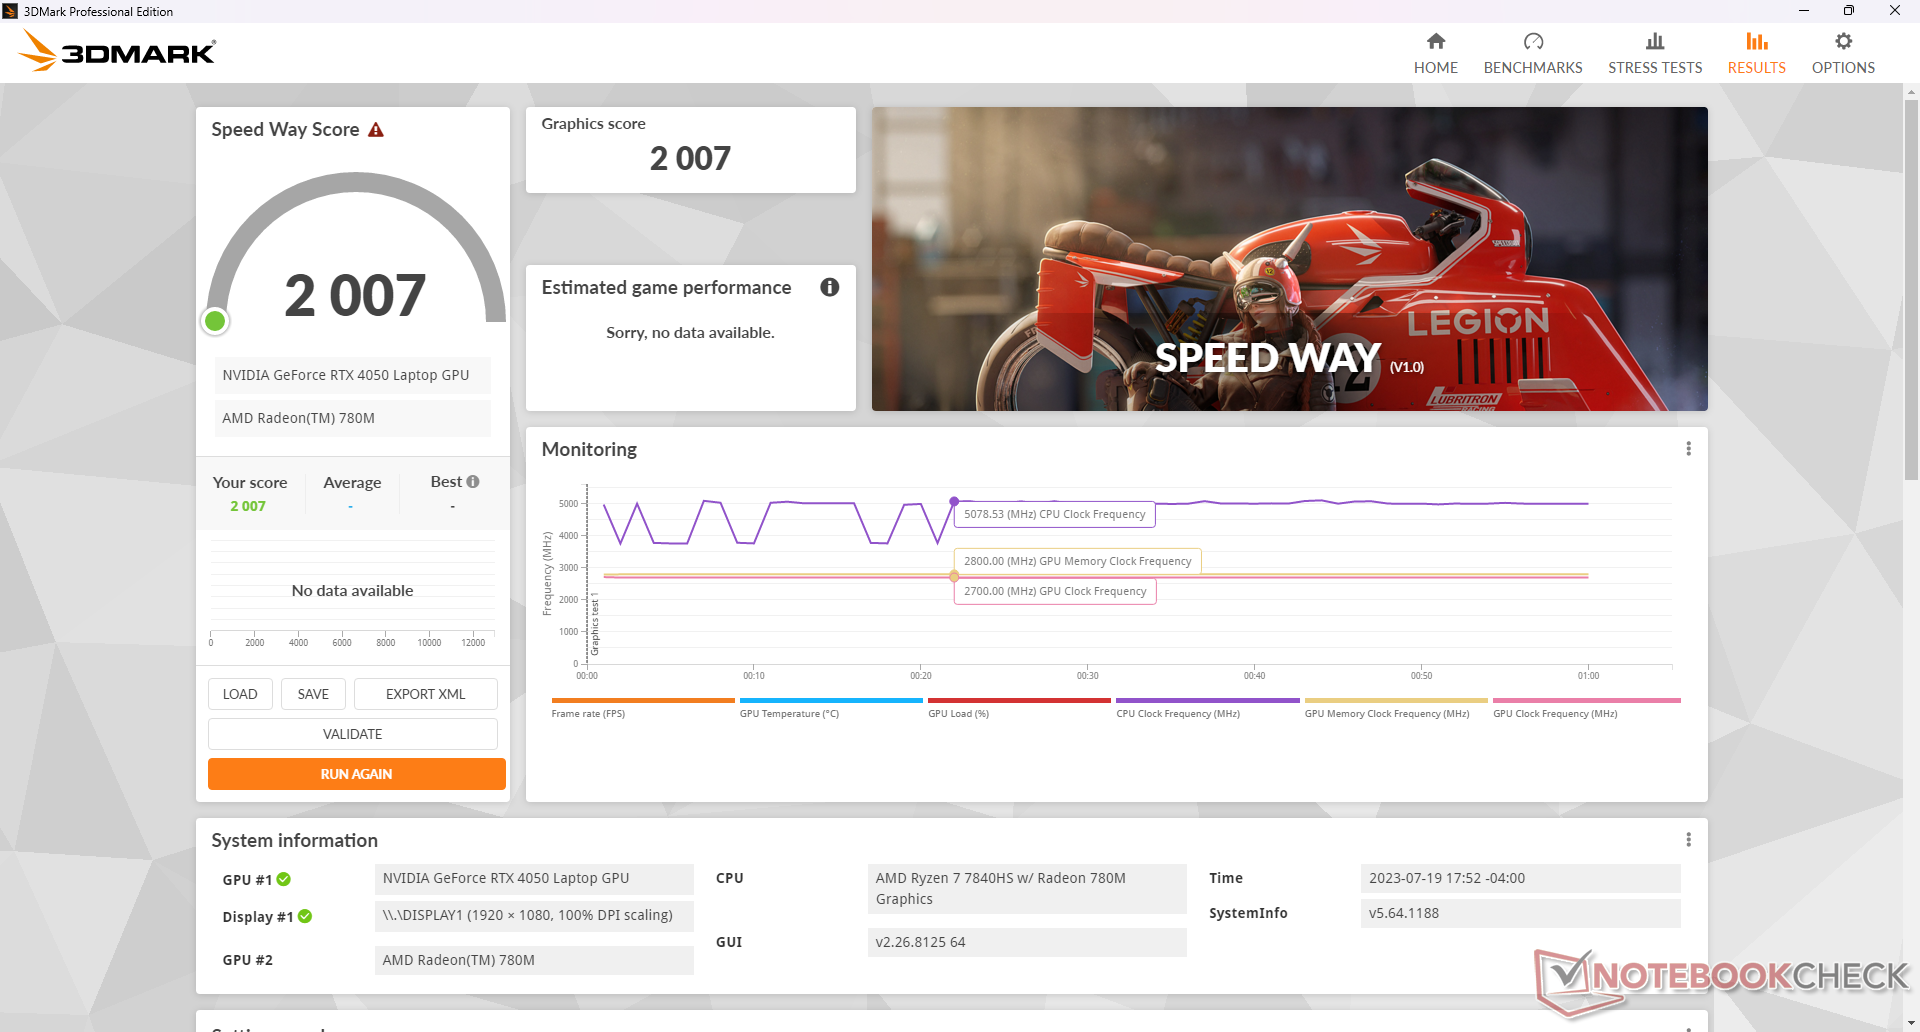
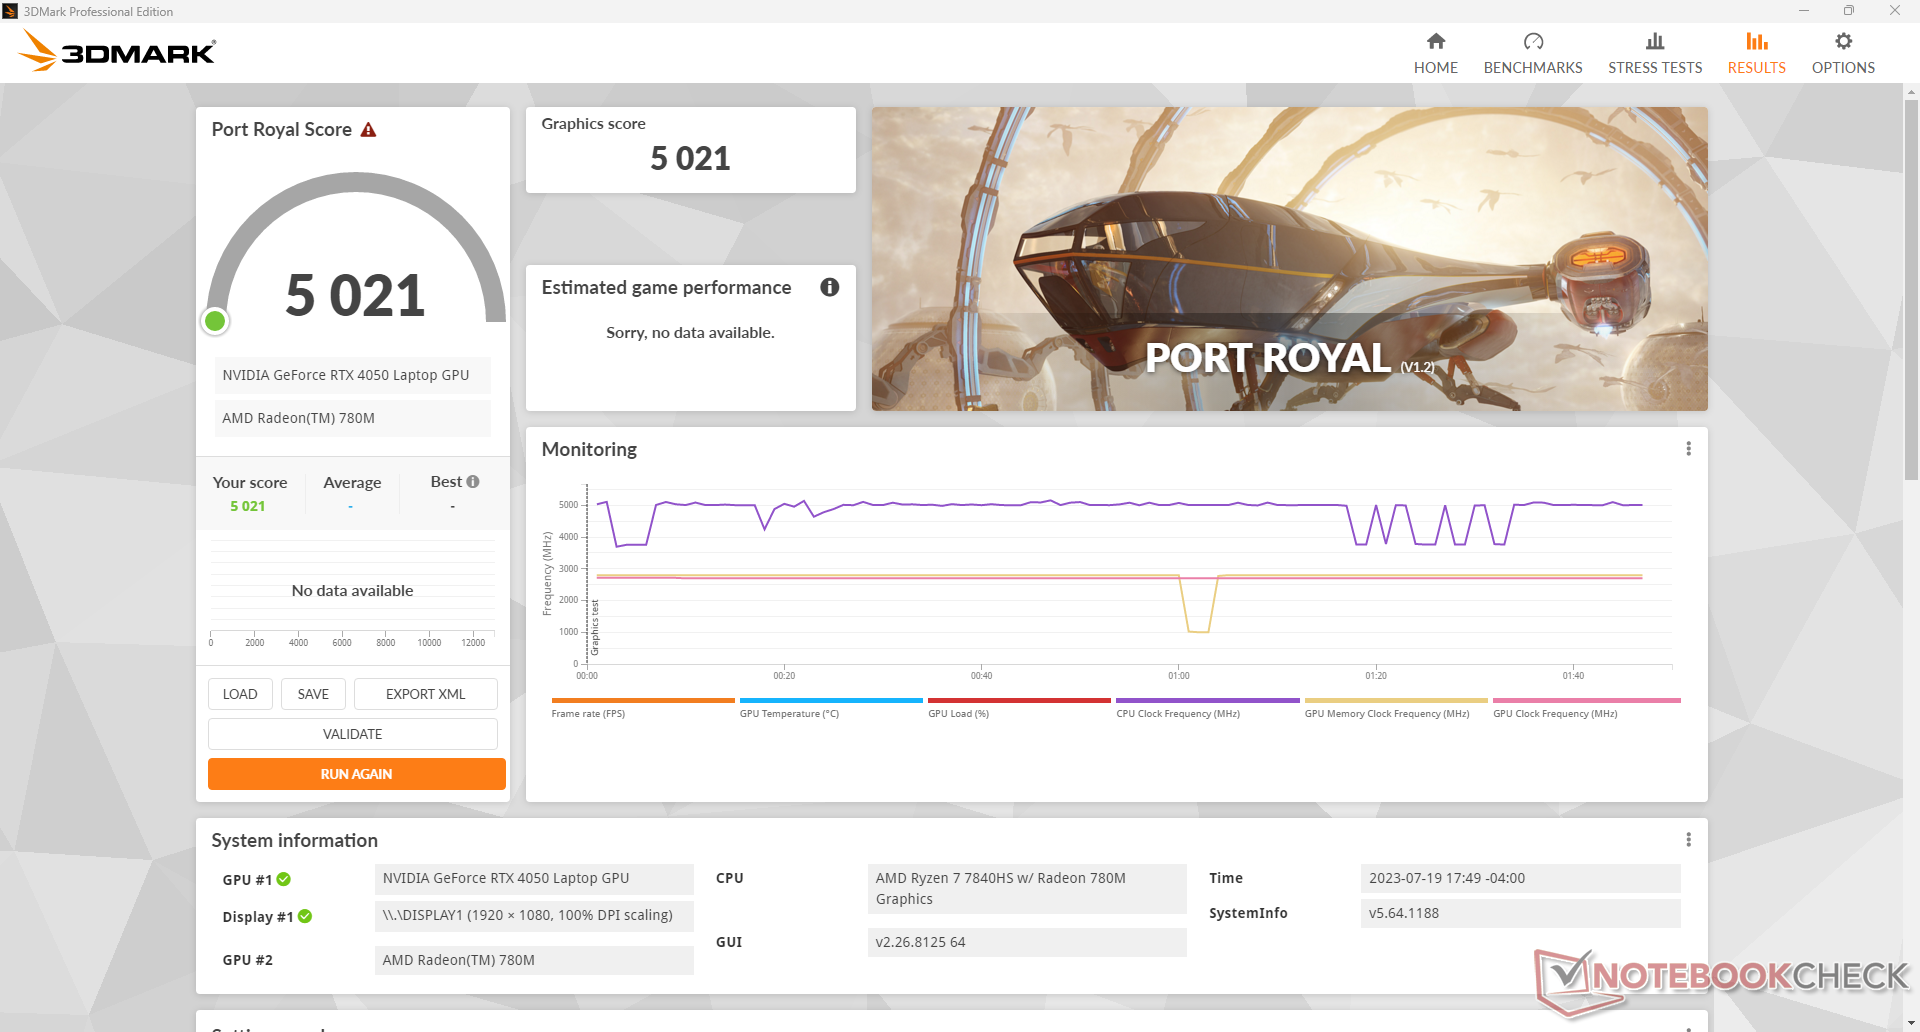
Graphics performance is very good with 3DMark scores that are roughly 10 percent higher than the average laptop in our database equipped with the same GeForce RTX 4050 GPU. Raw performance is on par with the mobile RTX 3060 as to be expected.
Downgrading to the RTX 3050 configuration would reduce GPU performance by as much as 45 percent while upgrading to the RTX 4060 would boost performance by 15 to 20 percent. For gamers on a budget, we recommend sticking to the RTX 4050 or RTX 4060 options.
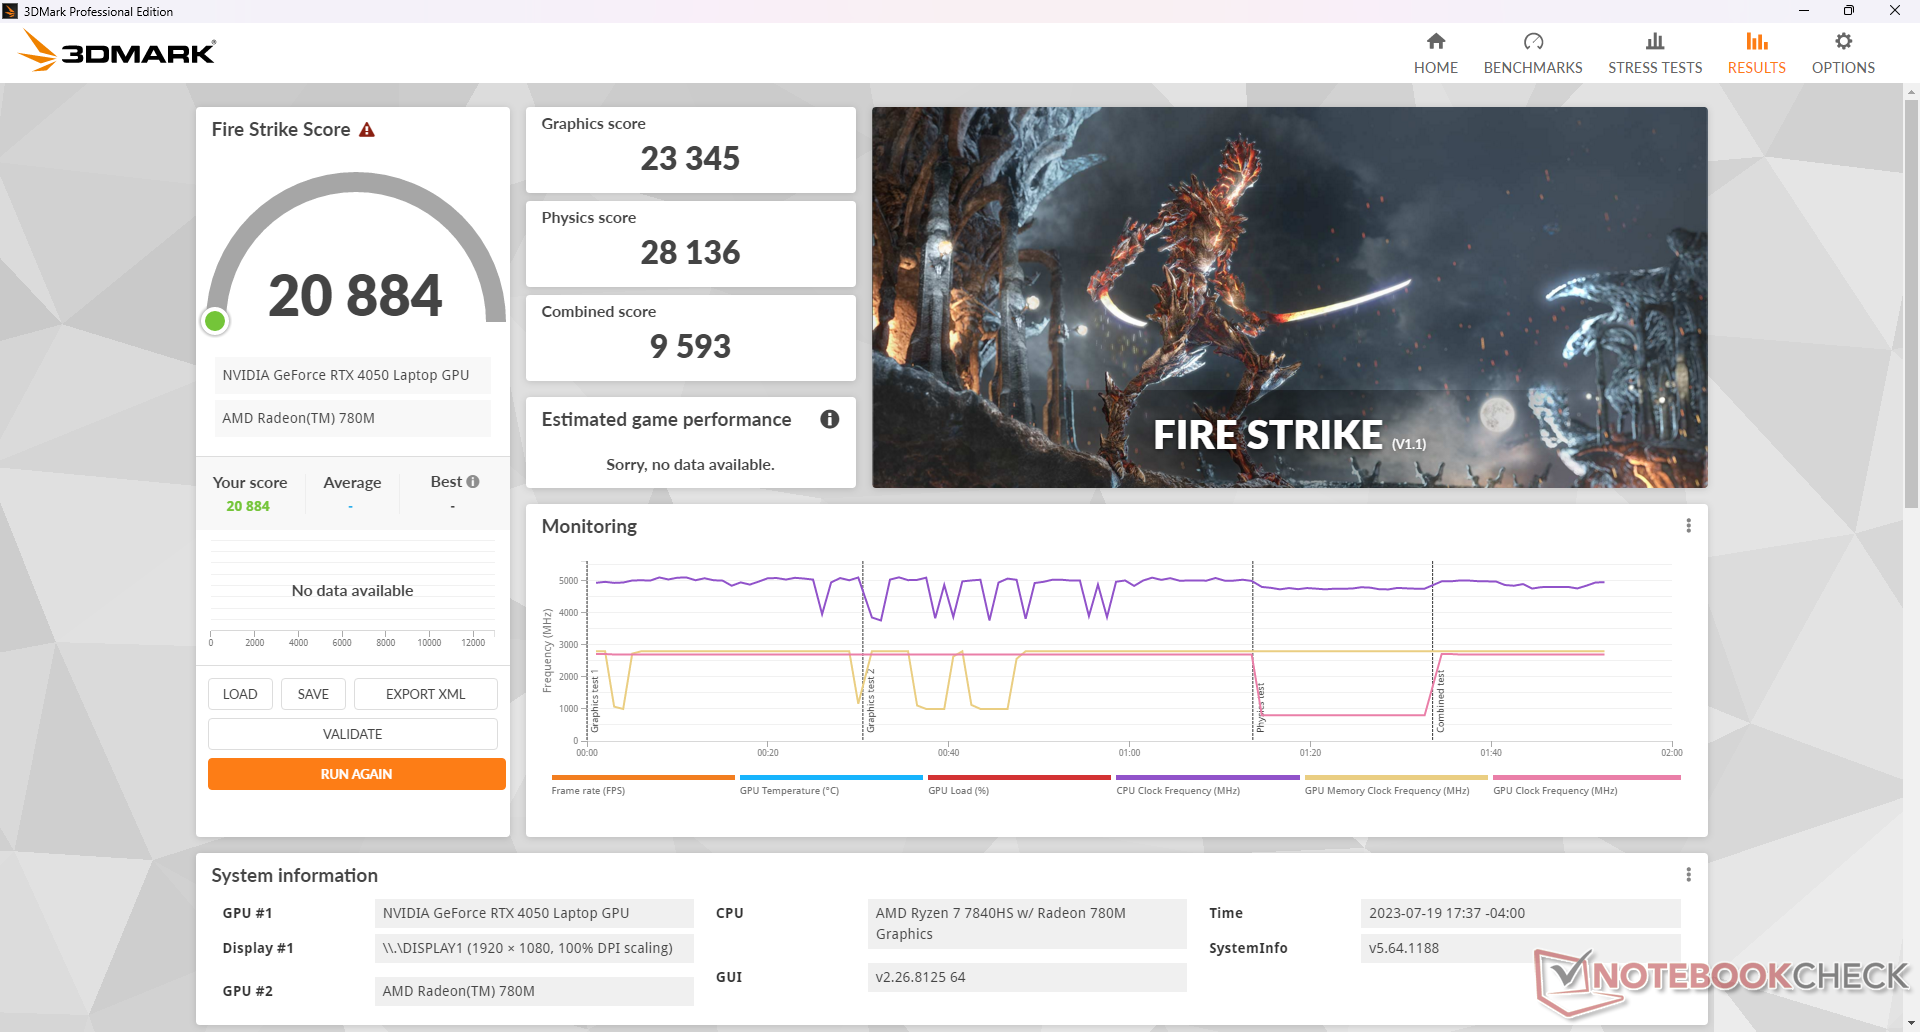
Running on battery power reduces performance. A Fire Strike test on batteries would return Physics and Graphics scores of 25672 and 16335 points, respectively, compared to 28136 and 23345 points when on mains.
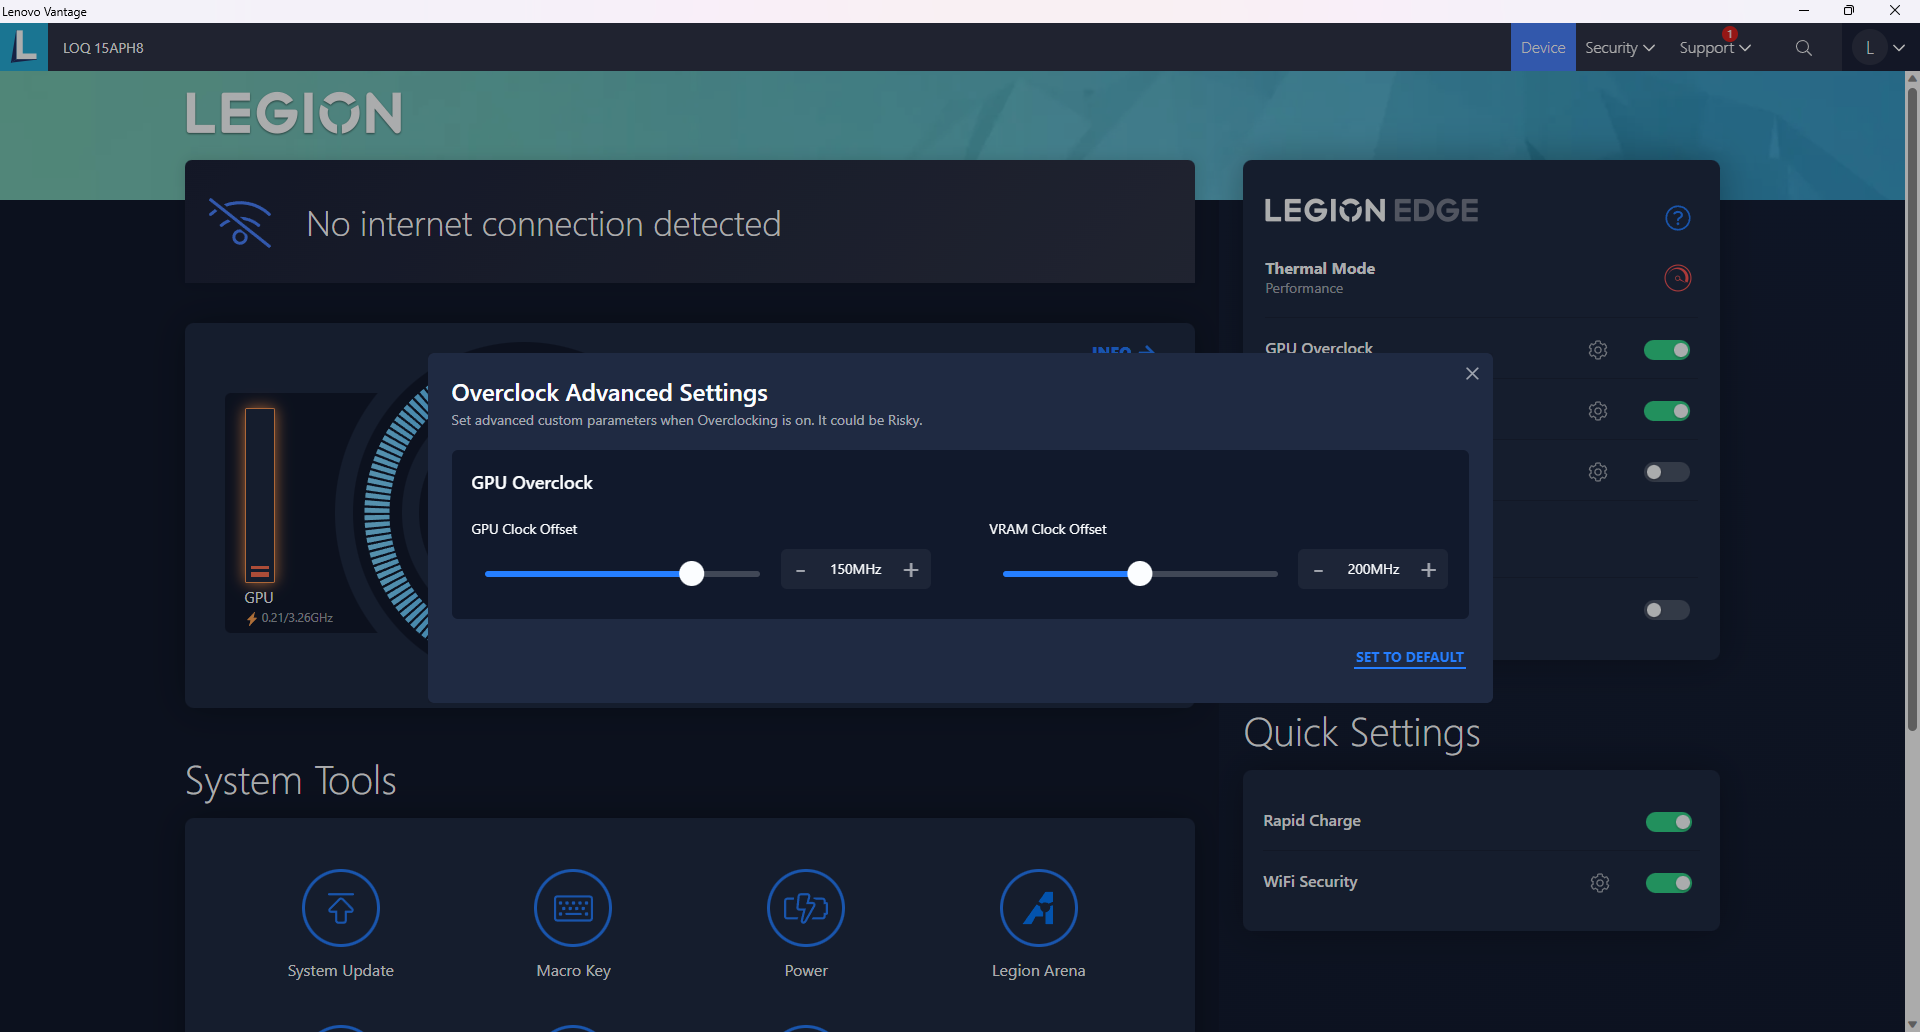
Running the system on Balanced mode instead of Performance mode will impact performance just slightly as shown by our Fire Strike results in the table below.
| Power Profile | Graphics Score | Physics Score | Combined Score |
| Balanced | 22598 (-3%) | 25910 (-8%) | 9507 (-1%) |
| Performance | 23345 | 28136 | 9593 |
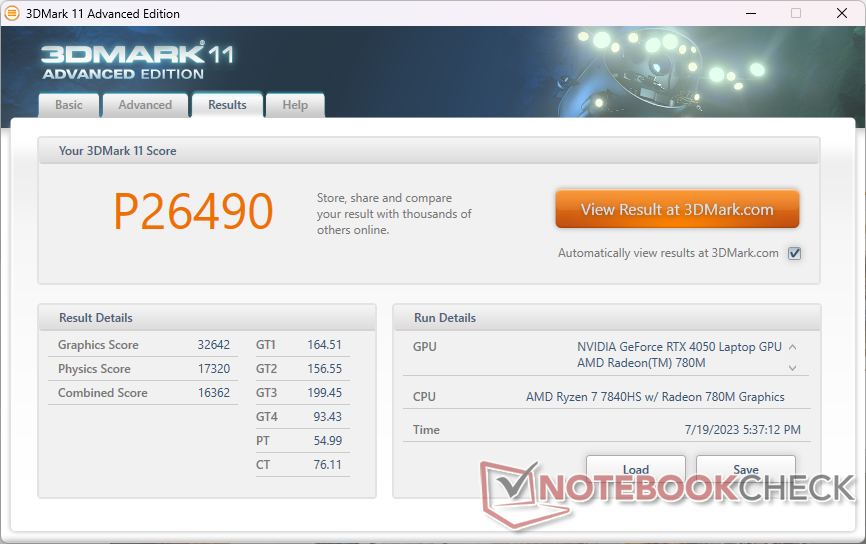
| 3DMark 11 Performance | 26490 points | |
| 3DMark Fire Strike Score | 20884 points | |
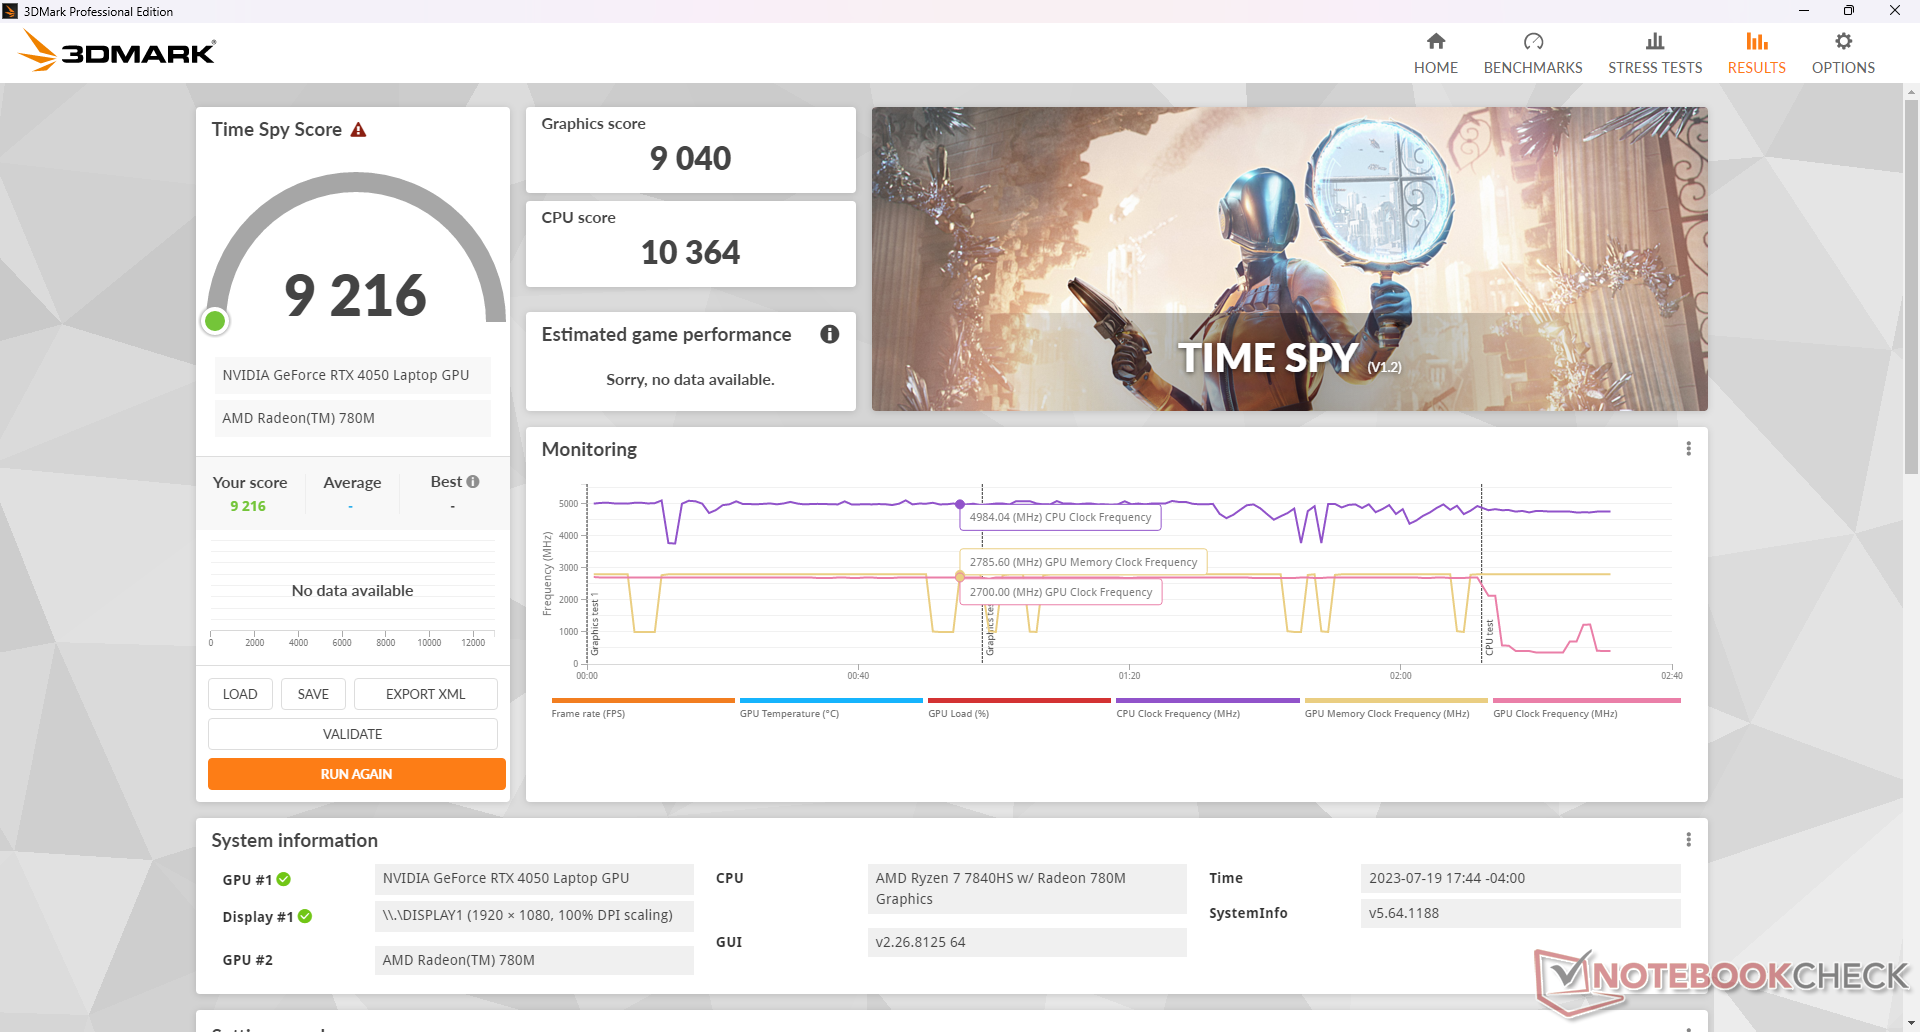
| 3DMark Time Spy Score | 9216 points | |
Help | ||
* ... smaller is better
Gaming Performance
Surprisingly, the 8 GB of system RAM has little impact on the gaming performance of the system. In fact, frame rates are where we expect them to be in most cases when compared to other laptops with the same RTX 4050 GPU, if not slightly faster. There are a few exceptions, however, where certain Ultra graphical settings would crash the game due to memory limitations including F1 22 and Returnal.
Witcher 3 FPS Chart
| low | med. | high | ultra | |
|---|---|---|---|---|
| GTA V (2015) | 163.6 | 156 | 132.9 | 78.4 |
| The Witcher 3 (2015) | 286.5 | 251.2 | 165 | 83.8 |
| Dota 2 Reborn (2015) | 148 | 134.9 | 130 | 123.9 |
| Final Fantasy XV Benchmark (2018) | 166.8 | 122.4 | 86.1 | |
| X-Plane 11.11 (2018) | 113.2 | 101.4 | 81.3 | |
| Strange Brigade (2018) | 309 | 214 | 177 | 156.6 |
| Cyberpunk 2077 1.6 (2022) | 117 | 106.4 | 82.2 | 70.1 |
| Tiny Tina's Wonderlands (2022) | 169.2 | 148.8 | 99.5 | 77.3 |
| F1 22 (2022) | 191.2 | 184.3 | 163.2 | |
| Returnal (2023) | 66 | 66 | 63 | 53 |
Emissions
System Noise — Loud Gamer
Fan noise tends to settle at 25 dB(A) against a silent background of 23 dB(A) during light browsing or streaming which is essentially inaudible in a typical office or room setting. Running Witcher 3 on Performance mode can be as loud as 46 dB(A) whereas gaming on Balanced mode is just slightly quieter at 44 dB(A). The latter entails a small performance hit as noted above, however.
If the CPU and GPU are stressed to 100 percent utilization, fan noise can be as loud as 52 dB(A) which would be almost as loud as the Cyborg 15.
Noise level
| Idle |
| 23.1 / 23.1 / 25.2 dB(A) |
| Load |
| 44.3 / 52 dB(A) |
 | ||
30 dB silent 40 dB(A) audible 50 dB(A) loud |
||
min: | ||
| Lenovo LOQ 15APH8 GeForce RTX 4050 Laptop GPU, R7 7840HS, Micron 2450 512GB MTFDKCD512TFK | Lenovo Legion 5 15IAH7H 82RB GeForce RTX 3060 Laptop GPU, i7-12700H | Dell G15 5530 GeForce RTX 4060 Laptop GPU, i7-13650HX, SSTC CL4-3D512-Q11 | Asus TUF A15 FA507 GeForce RTX 4050 Laptop GPU, R7 7735HS, Micron 2400 MTFDKBA512QFM | MSI Cyborg 15 A12VF GeForce RTX 4060 Laptop GPU, i7-12650H, Samsung PM9B1 1024GB MZVL41T0HBLB | HP Victus 15 fa0020nr GeForce RTX 3050 Ti Laptop GPU, i7-12700H, Samsung PM9A1 MZVL2512HCJQ | |
|---|---|---|---|---|---|---|
| Noise | 1% | 2% | 9% | -30% | -1% | |
| off / environment * (dB) | 23.1 | 23.3 -1% | 20.41 12% | 23.3 -1% | 27 -17% | 24.8 -7% |
| Idle Minimum * (dB) | 23.1 | 23.5 -2% | 26.85 -16% | 23.3 -1% | 27 -17% | 26.2 -13% |
| Idle Average * (dB) | 23.1 | 23.5 -2% | 26.85 -16% | 23.3 -1% | 37.5 -62% | 29.2 -26% |
| Idle Maximum * (dB) | 25.2 | 26.8 -6% | 26.85 -7% | 23.3 8% | 38 -51% | 29.4 -17% |
| Load Average * (dB) | 44.3 | 29.3 34% | 27.65 38% | 29.6 33% | 56.3 -27% | 29.9 33% |
| Witcher 3 ultra * (dB) | 45.8 | 51.4 -12% | 47.9 -5% | 43 6% | 41.1 10% | |
| Load Maximum * (dB) | 52 | 53 -2% | 47.86 8% | 43 17% | 56.3 -8% | 45.5 12% |
* ... smaller is better
Temperature
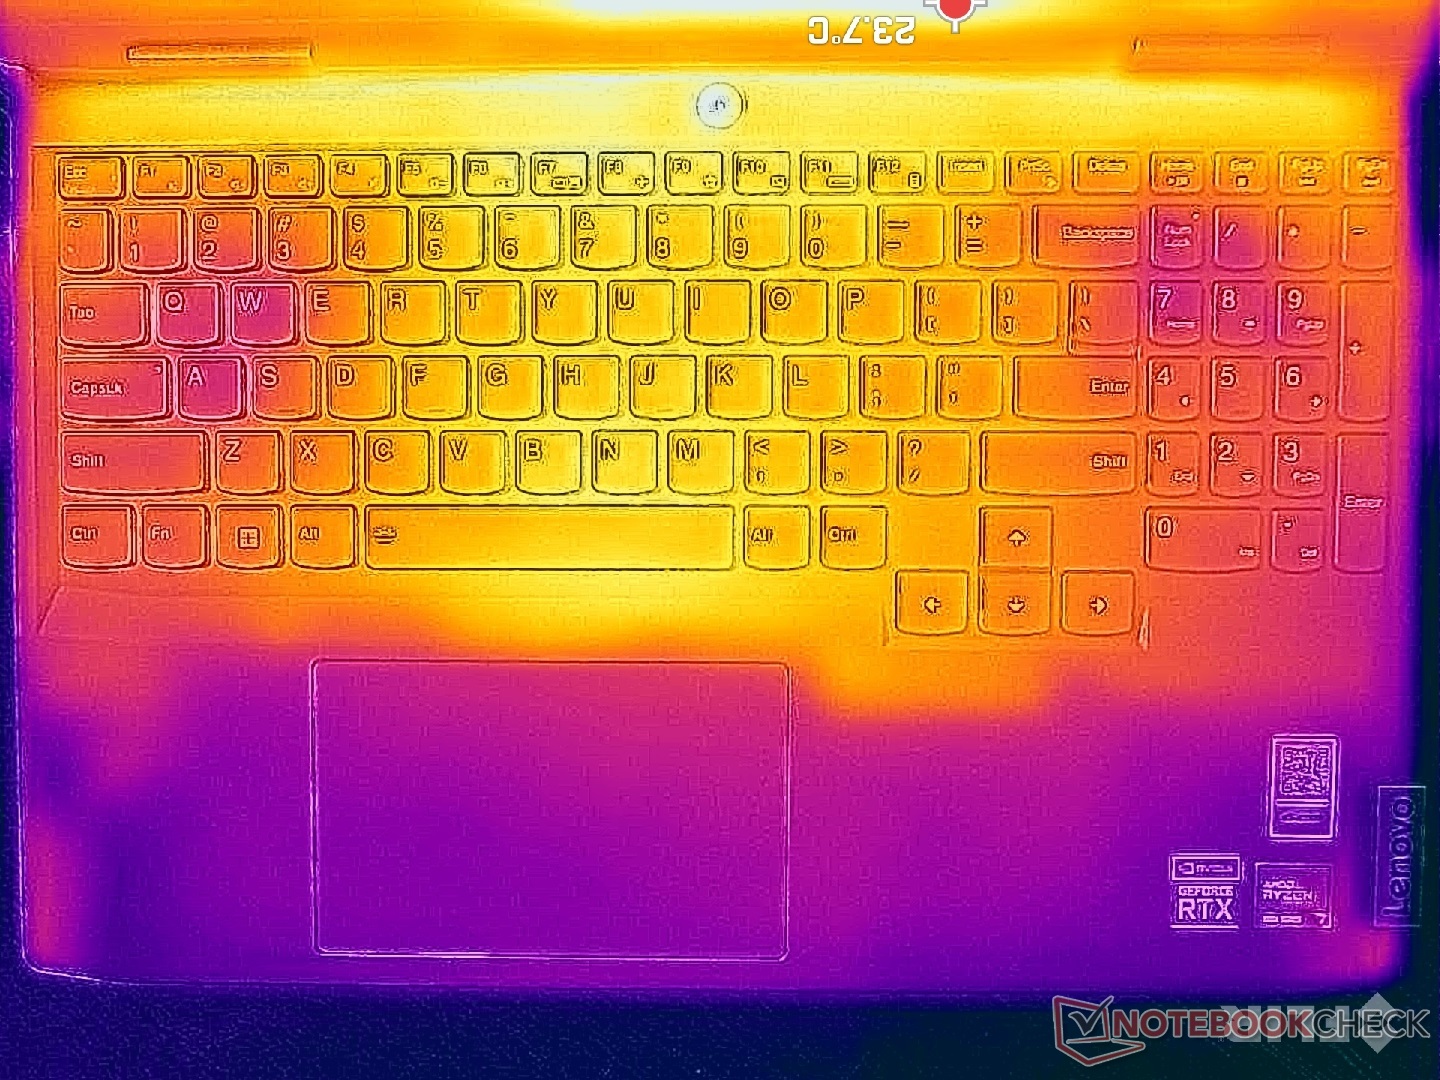
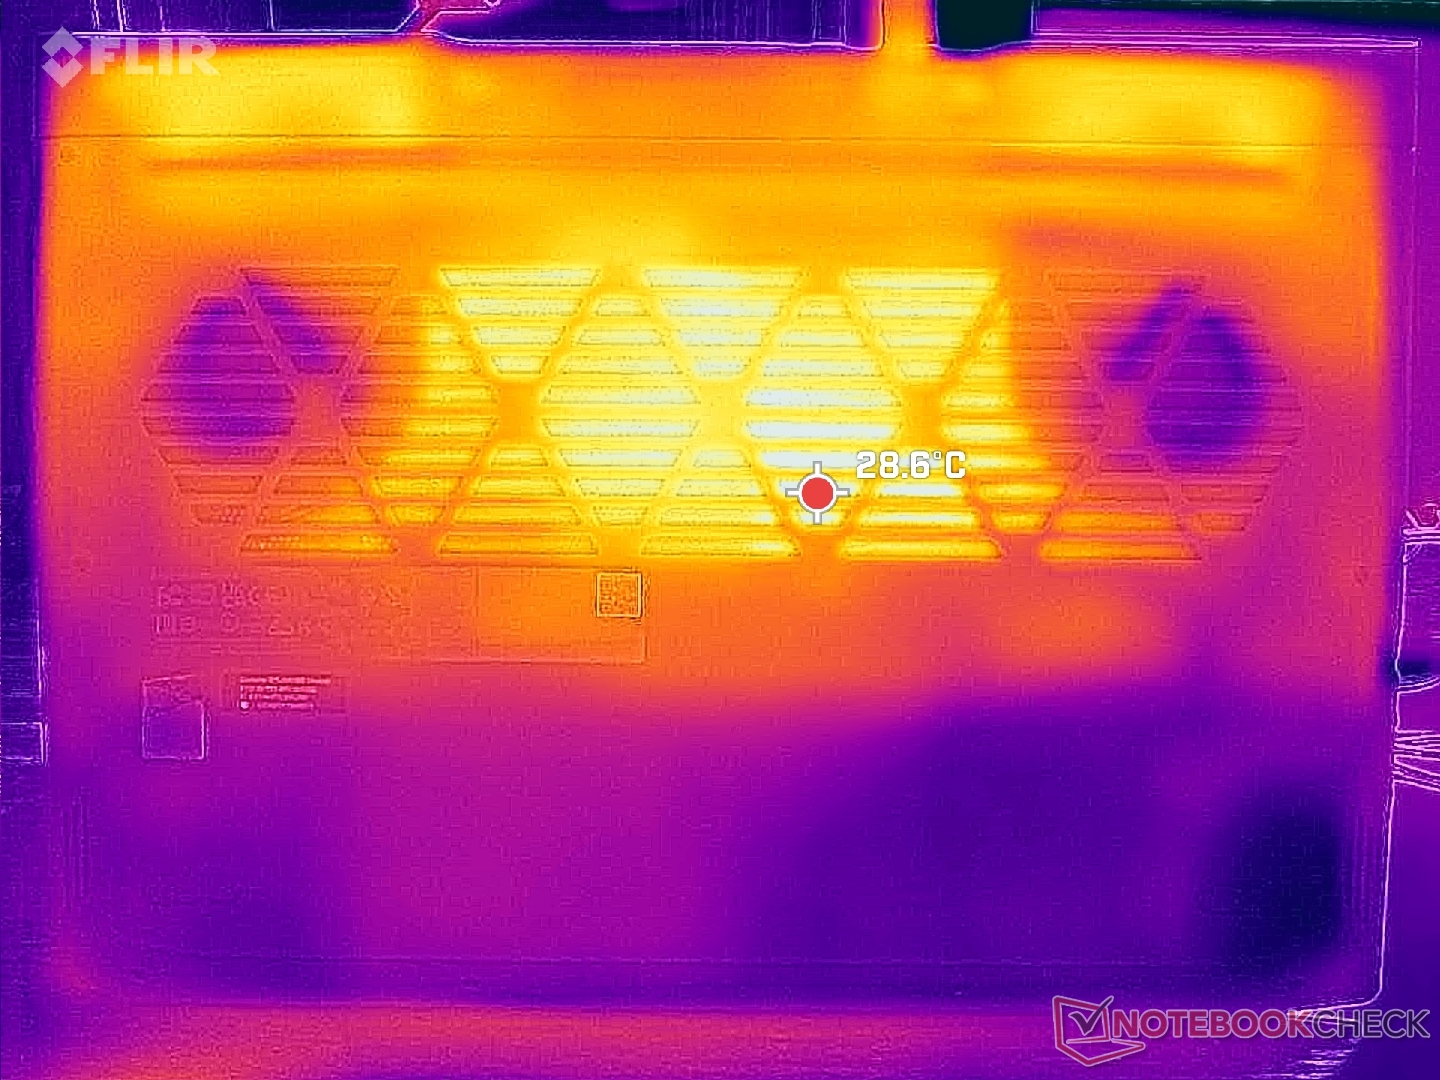
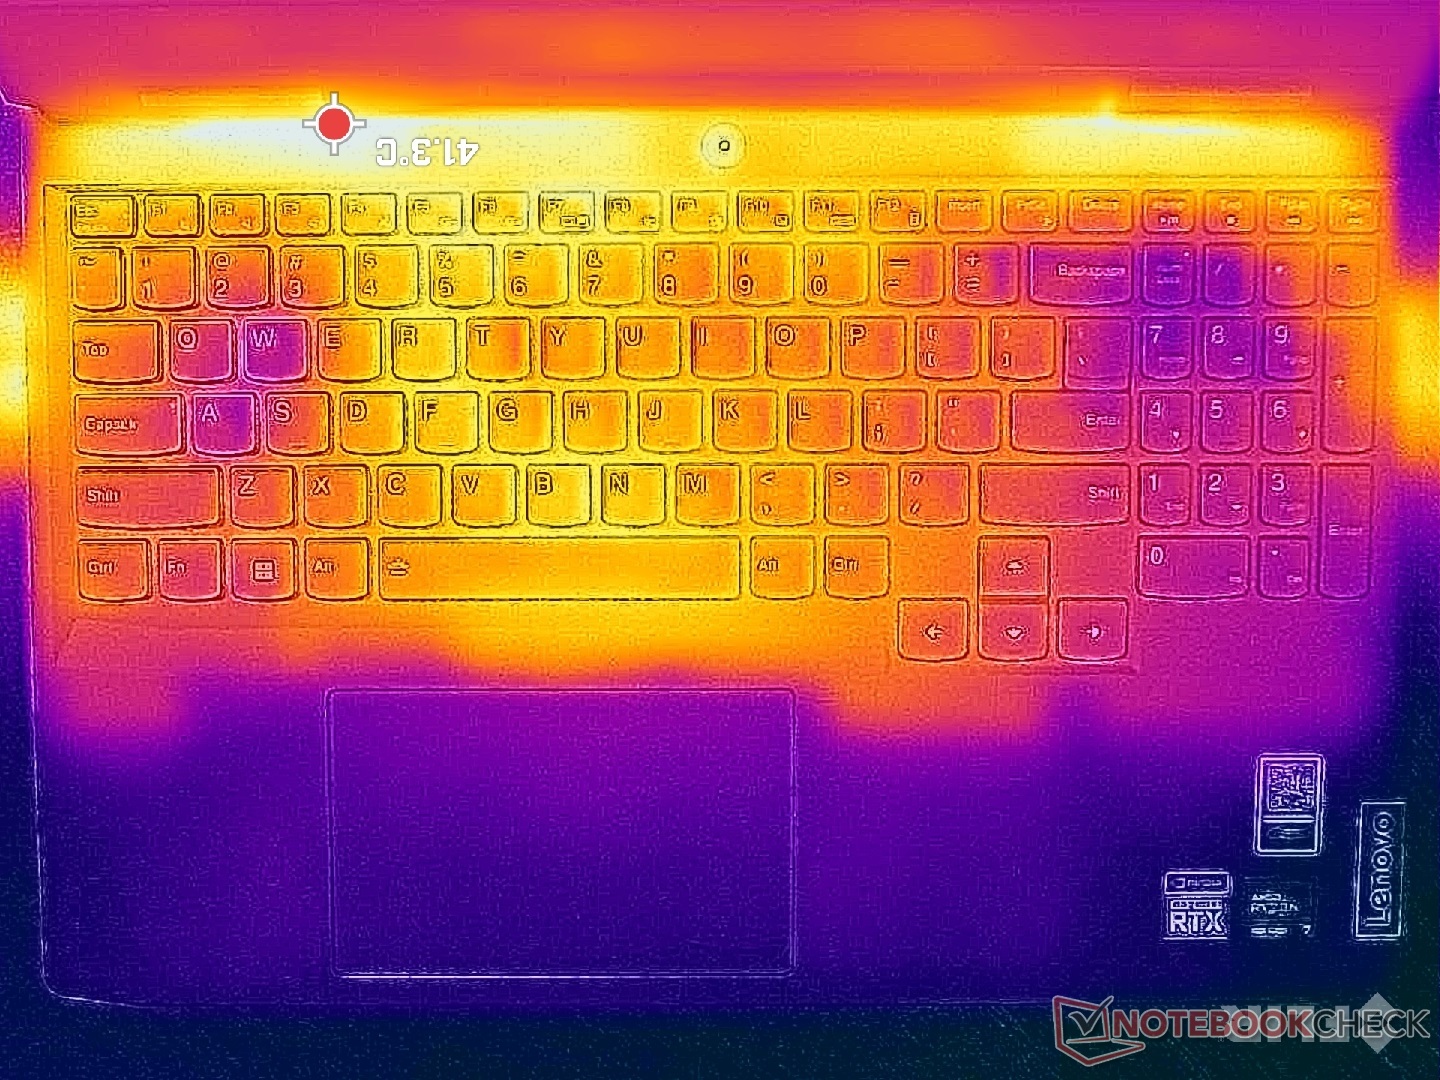
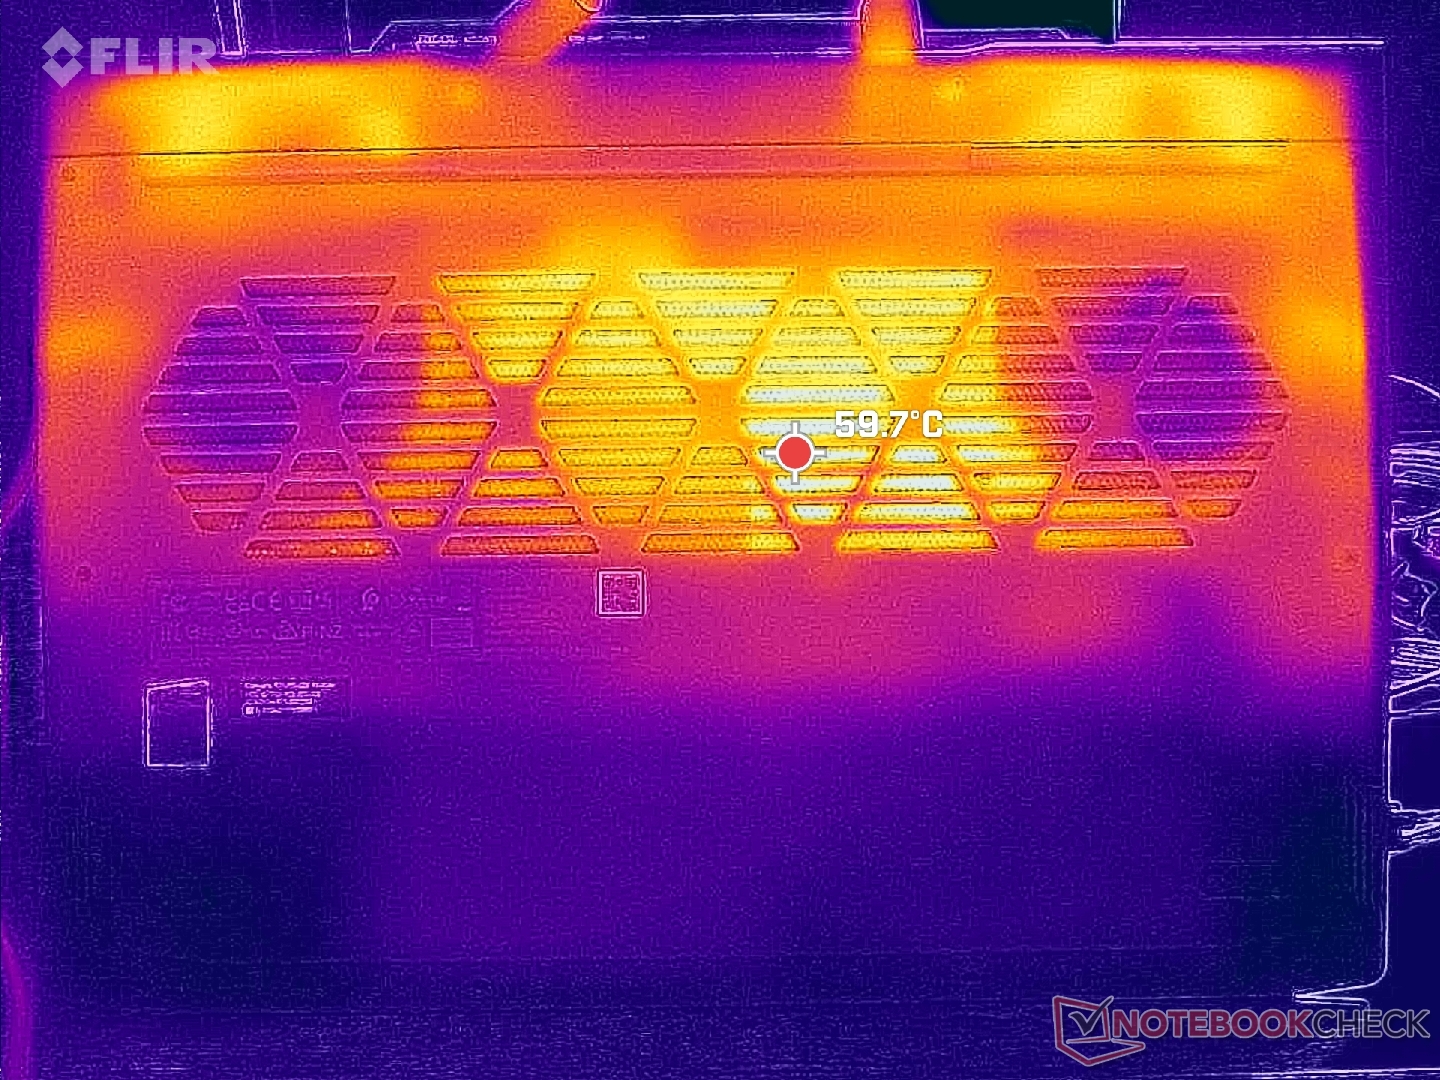
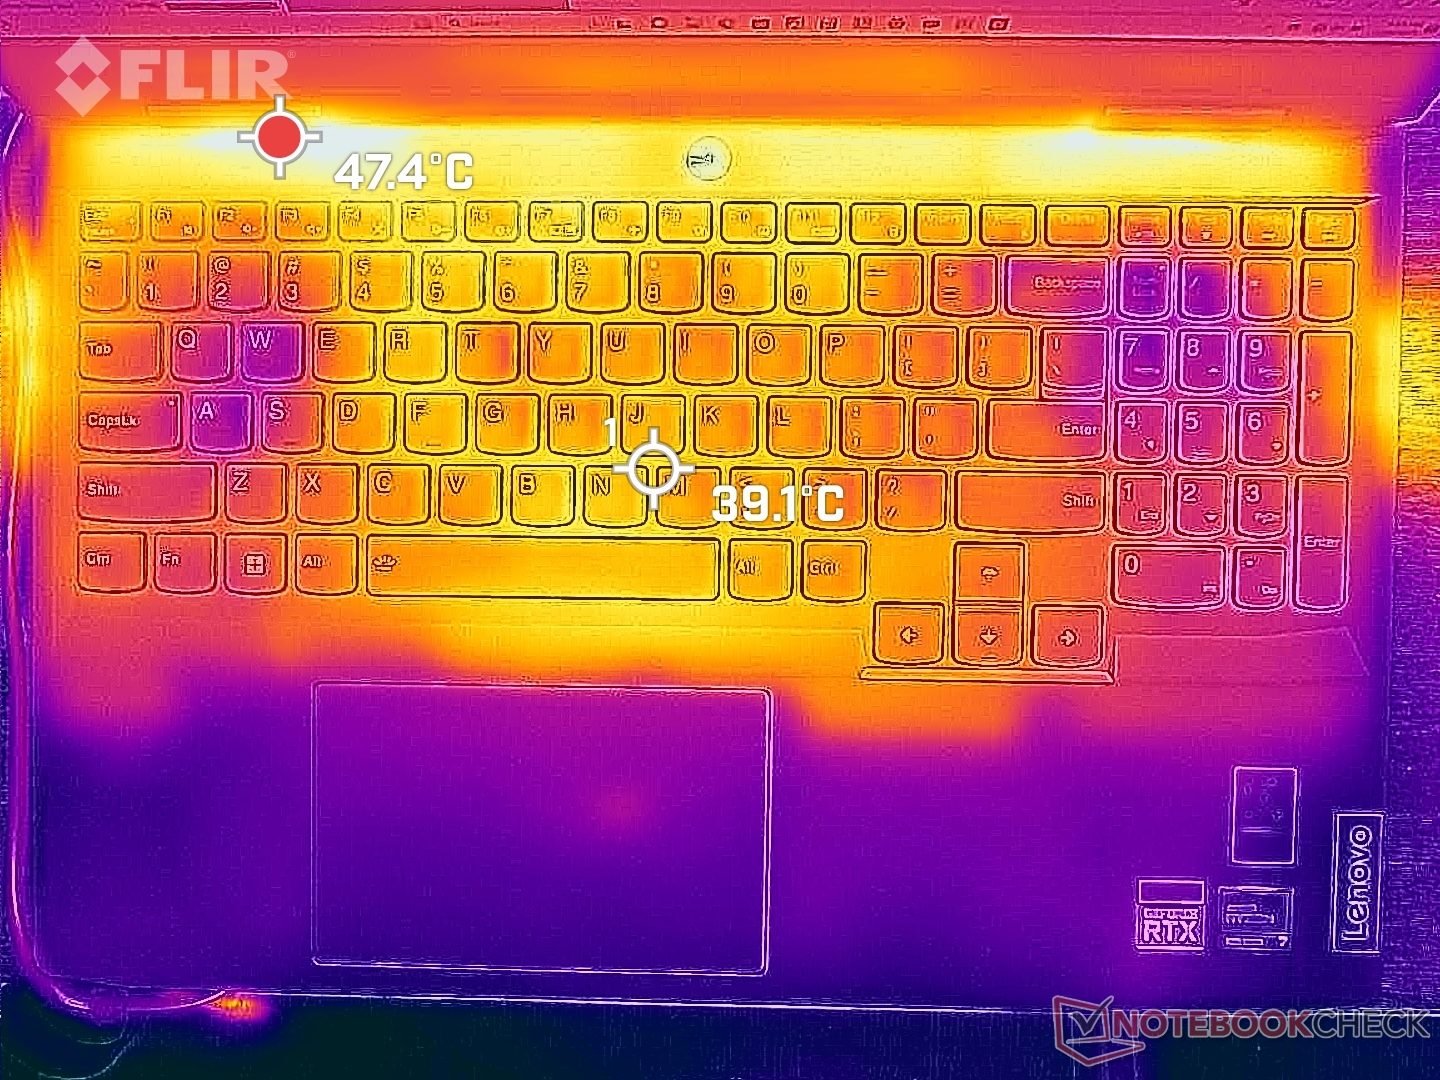
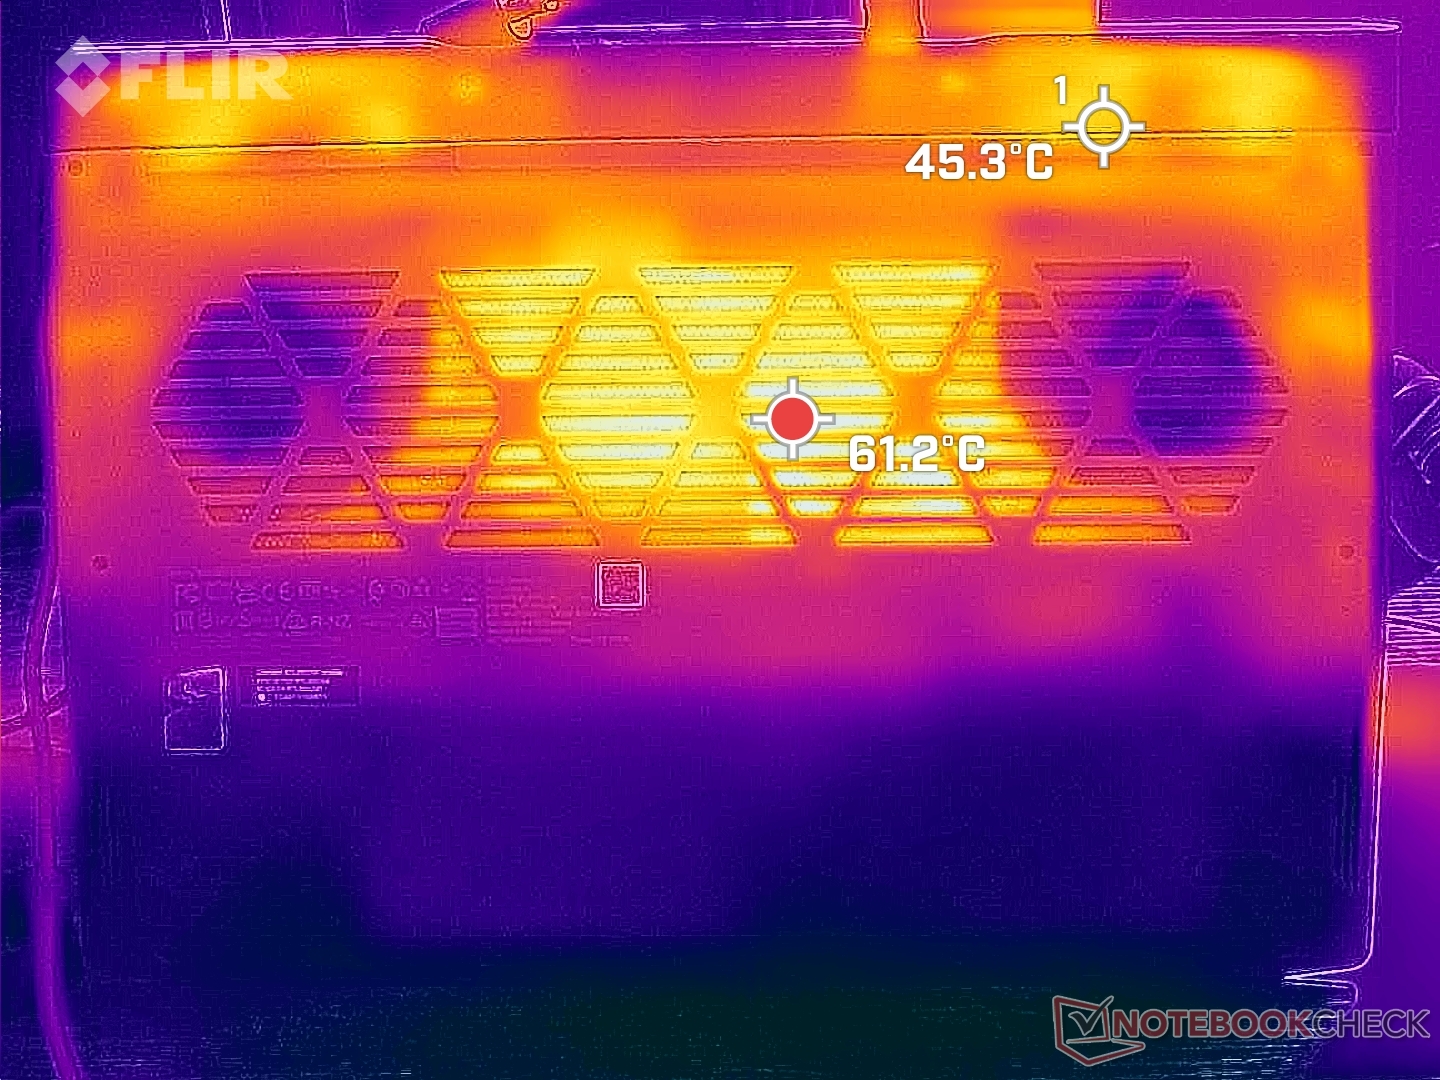
Surface temperatures when under load can be very warm at up to 50 C compared to just 38 C on the HP Victus 15. Thankfully, the hot spots on the LOQ 15 are toward the rear where fingers are unlikely to touch. The WASD keys, numpad, and palm rests remain much cooler than the rear and keyboard center when gaming as shown by the temperature maps below.
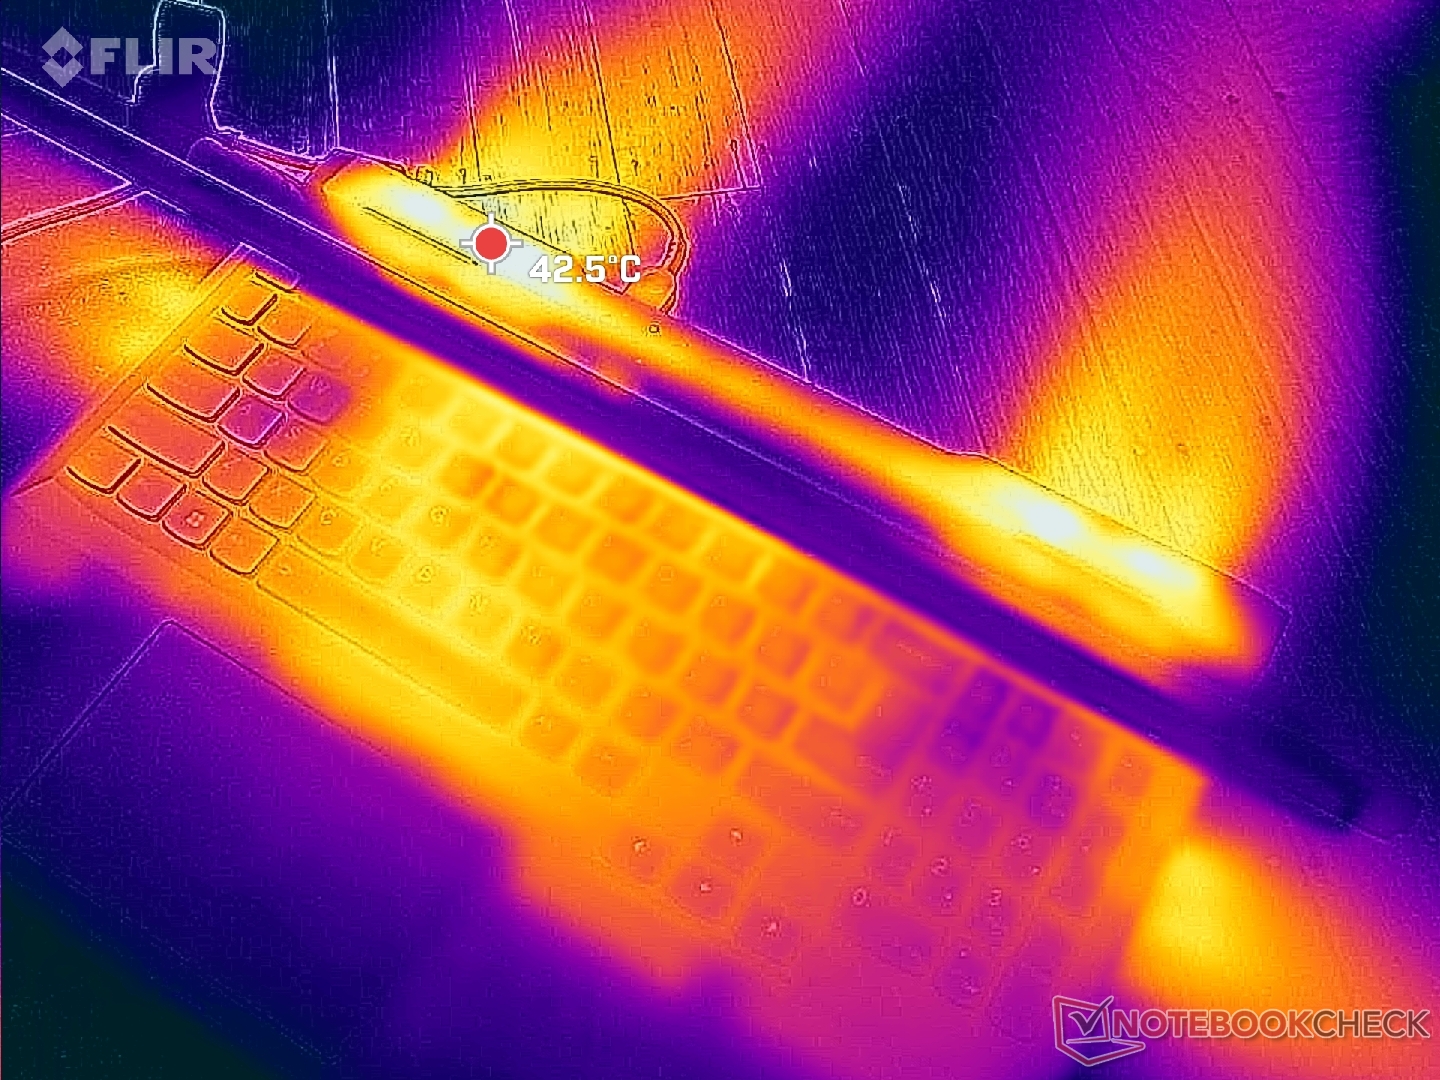
(±) The maximum temperature on the upper side is 44.4 °C / 112 F, compared to the average of 40.4 °C / 105 F, ranging from 21.2 to 68.8 °C for the class Gaming.
(-) The bottom heats up to a maximum of 52 °C / 126 F, compared to the average of 43.2 °C / 110 F
(+) In idle usage, the average temperature for the upper side is 25.1 °C / 77 F, compared to the device average of 33.9 °C / 93 F.
(±) Playing The Witcher 3, the average temperature for the upper side is 32.7 °C / 91 F, compared to the device average of 33.9 °C / 93 F.
(+) The palmrests and touchpad are cooler than skin temperature with a maximum of 30 °C / 86 F and are therefore cool to the touch.
(±) The average temperature of the palmrest area of similar devices was 28.8 °C / 83.8 F (-1.2 °C / -2.2 F).
| Lenovo LOQ 15APH8 AMD Ryzen 7 7840HS, NVIDIA GeForce RTX 4050 Laptop GPU | Lenovo Legion 5 15IAH7H 82RB Intel Core i7-12700H, NVIDIA GeForce RTX 3060 Laptop GPU | Dell G15 5530 Intel Core i7-13650HX, NVIDIA GeForce RTX 4060 Laptop GPU | Asus TUF A15 FA507 AMD Ryzen 7 7735HS, NVIDIA GeForce RTX 4050 Laptop GPU | MSI Cyborg 15 A12VF Intel Core i7-12650H, NVIDIA GeForce RTX 4060 Laptop GPU | HP Victus 15 fa0020nr Intel Core i7-12700H, NVIDIA GeForce RTX 3050 Ti Laptop GPU | |
|---|---|---|---|---|---|---|
| Heat | 7% | -19% | 4% | 7% | 23% | |
| Maximum Upper Side * (°C) | 44.4 | 37.8 15% | 54 -22% | 48.9 -10% | 47.5 -7% | 37.2 16% |
| Maximum Bottom * (°C) | 52 | 51 2% | 62.2 -20% | 44.6 14% | 35.5 32% | 35.4 32% |
| Idle Upper Side * (°C) | 28 | 25.8 8% | 33.4 -19% | 27.1 3% | 27.7 1% | 22.4 20% |
| Idle Bottom * (°C) | 29.6 | 28.8 3% | 33.4 -13% | 27.5 7% | 29.5 -0% | 22.6 24% |
* ... smaller is better
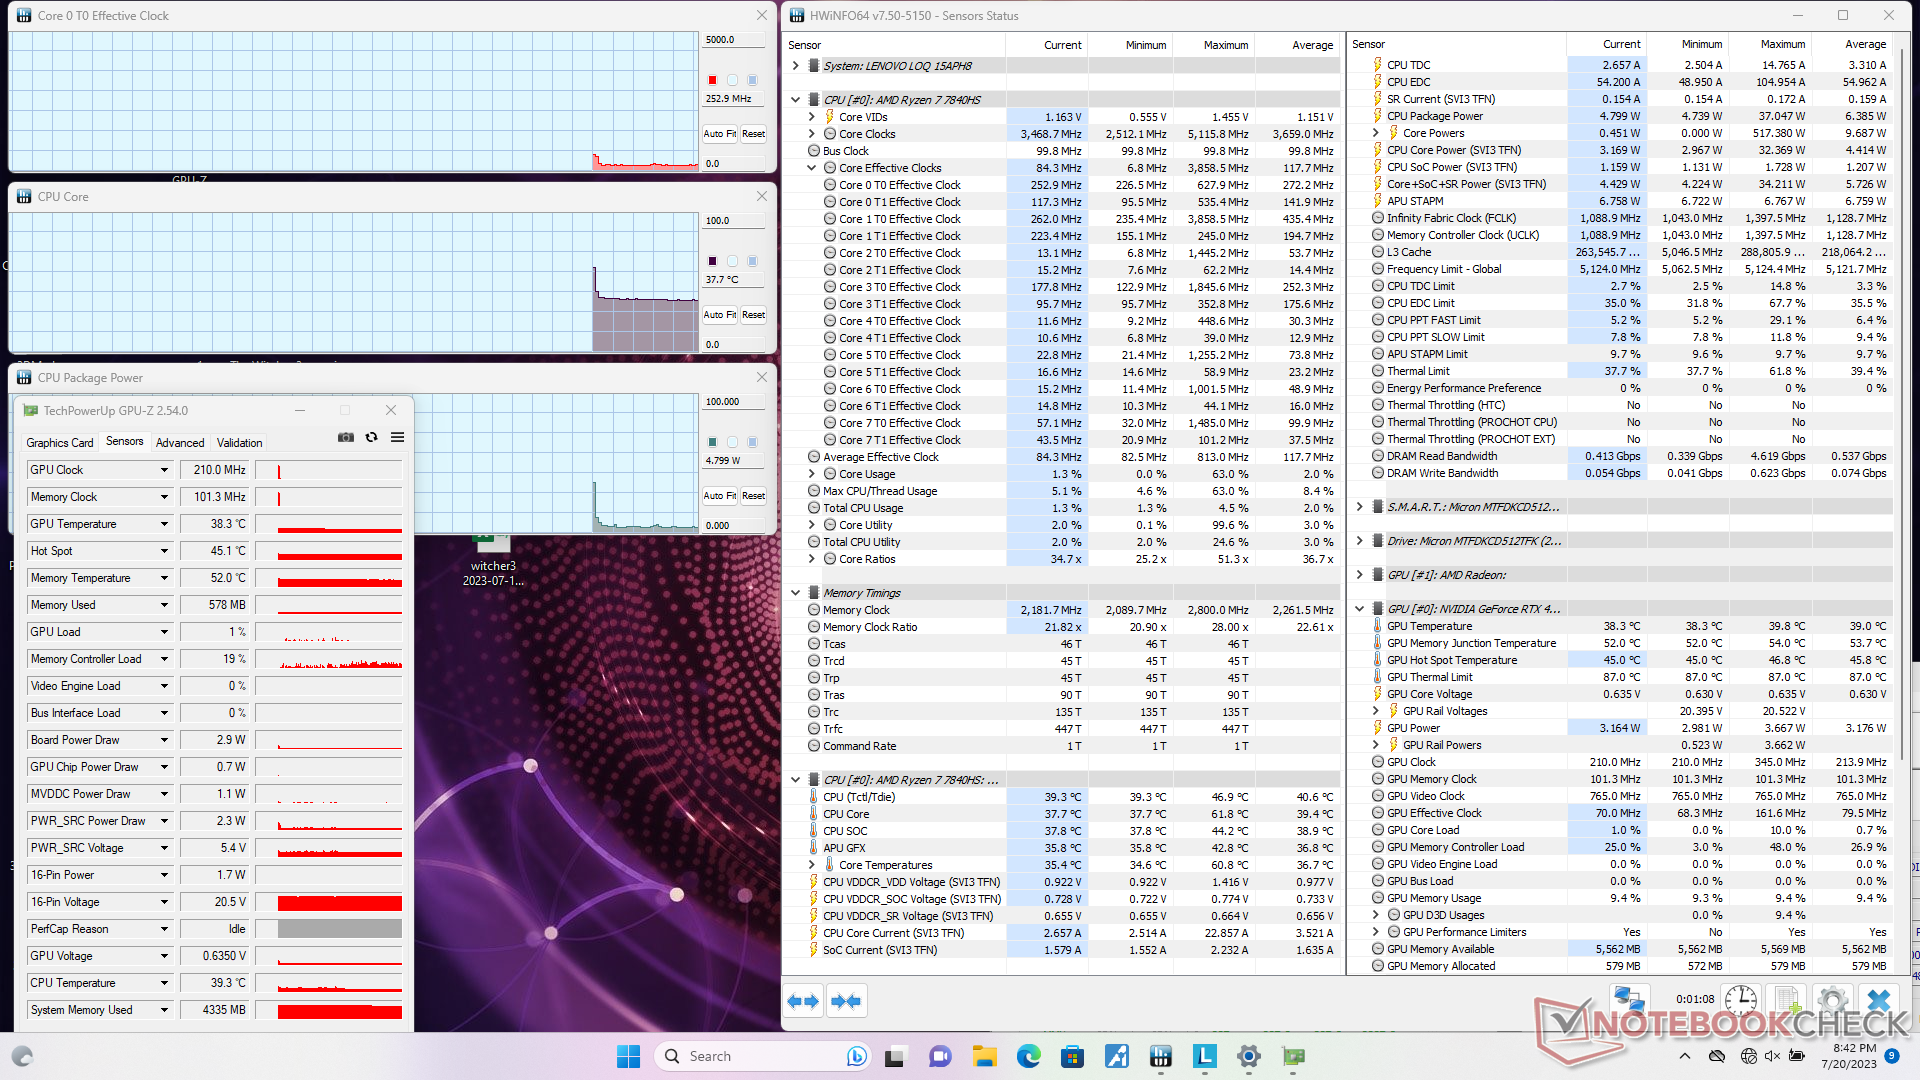
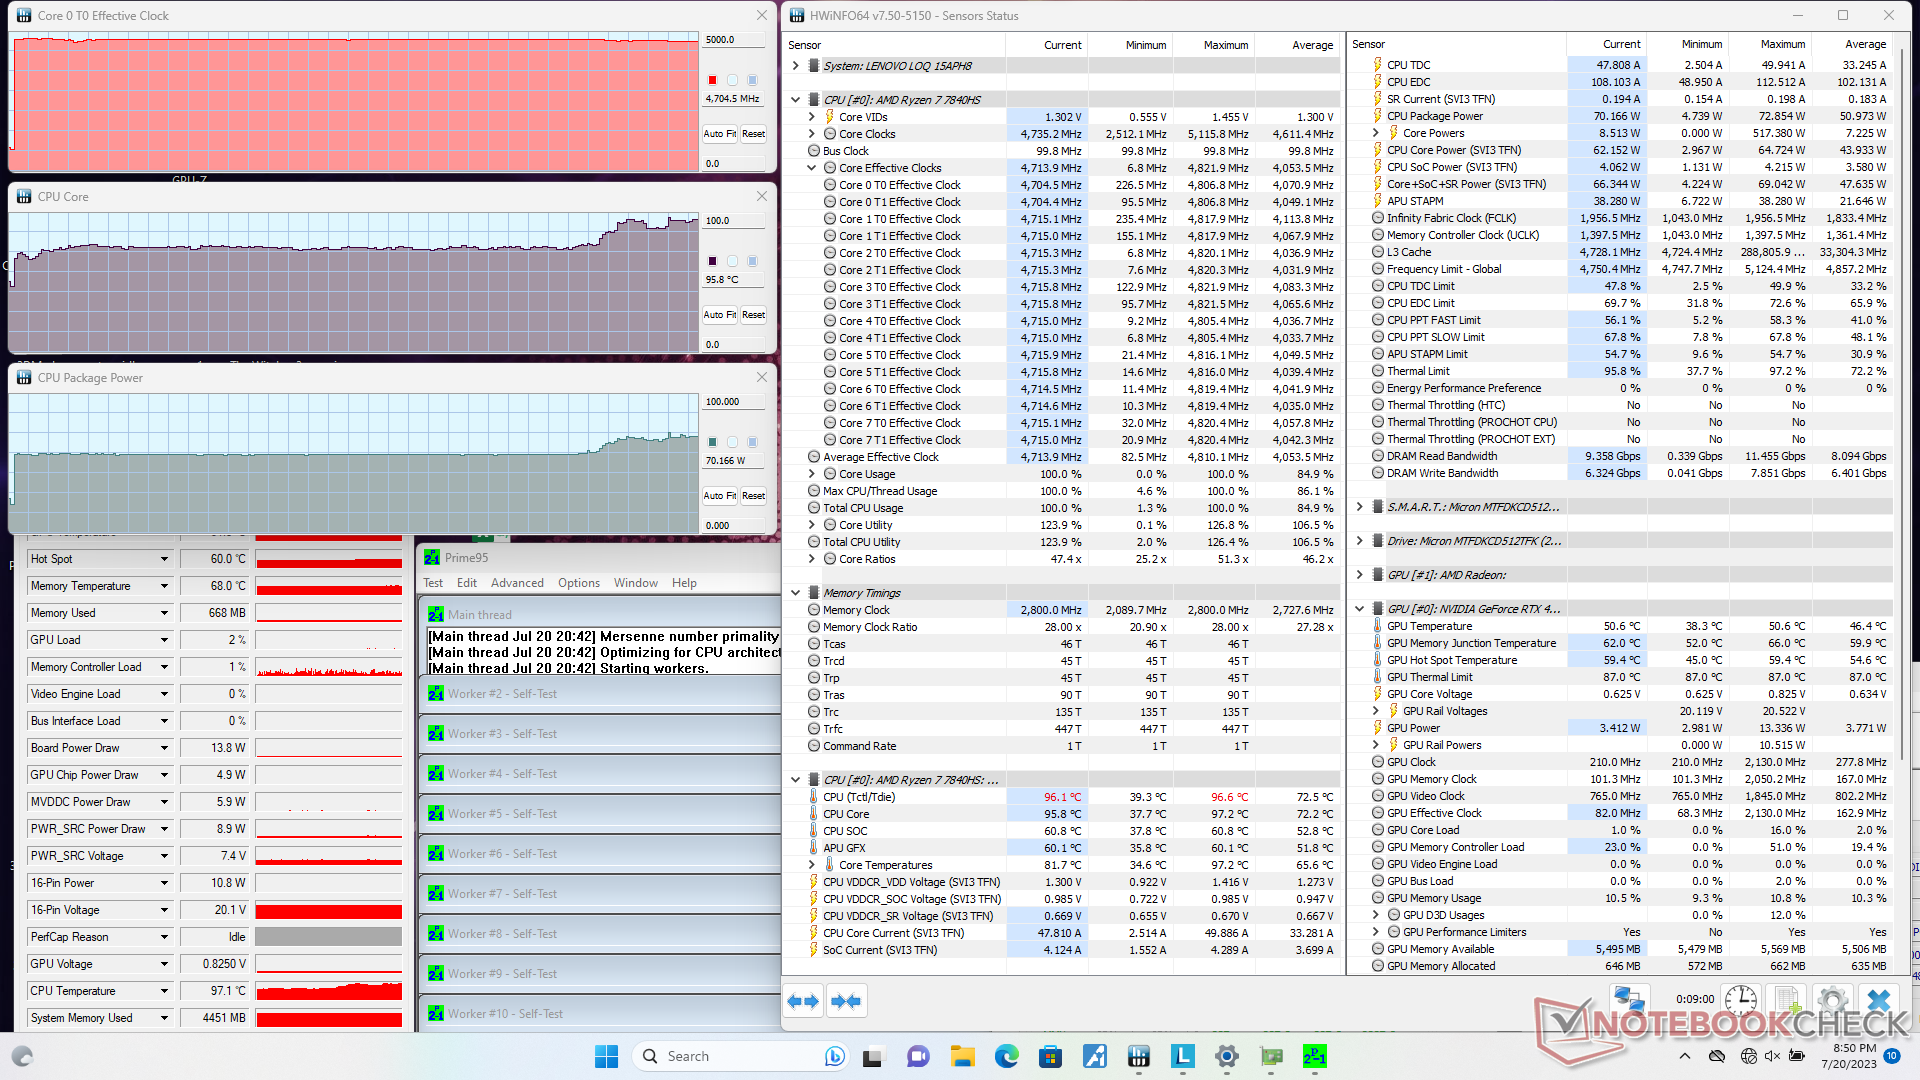
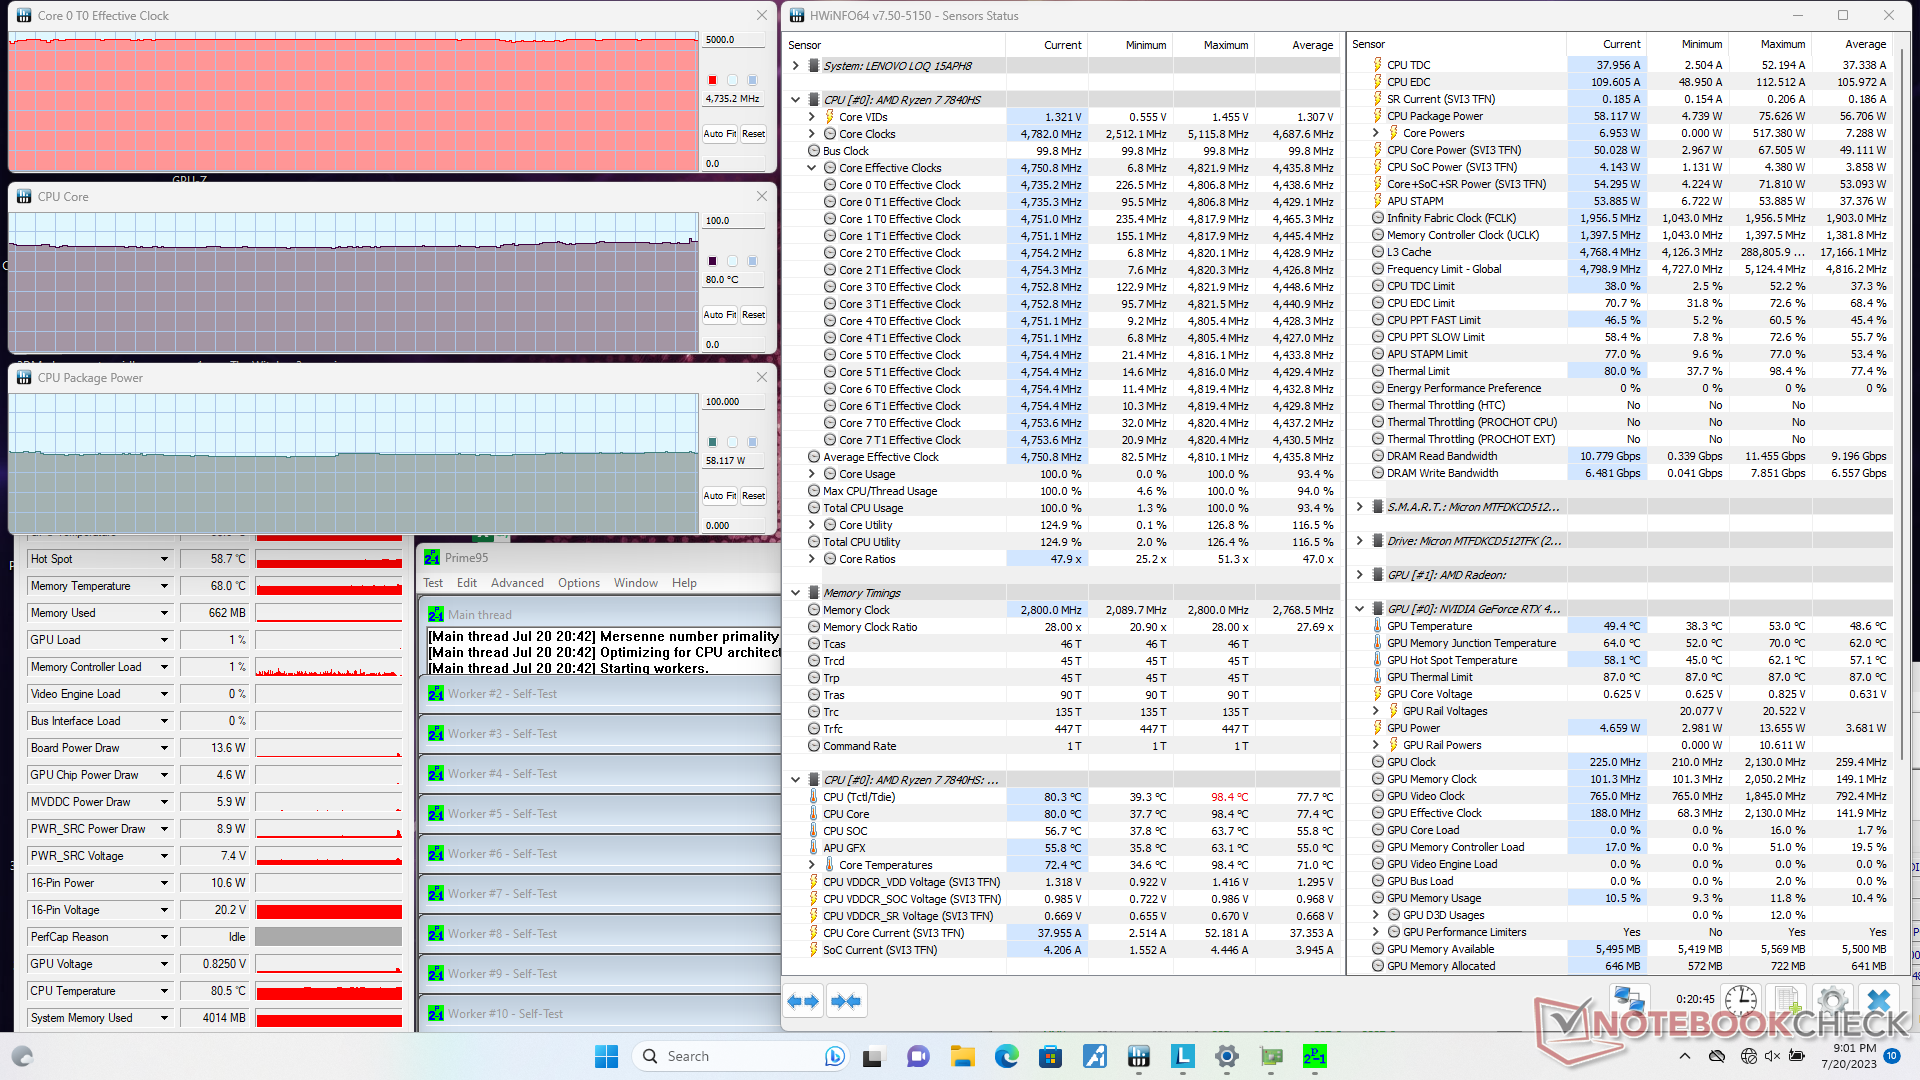
Stress Test
CPU clock rates, temperature, and board power draw would spike to 4.8 GHz, 75 C, and 58 W, respectively, when initiating Prime95 stress. The clock rate and board power draw are sustainable over long periods with core temperature eventually plateauing at 80 C compared to 76 C on the Intel-powered Victus 15.
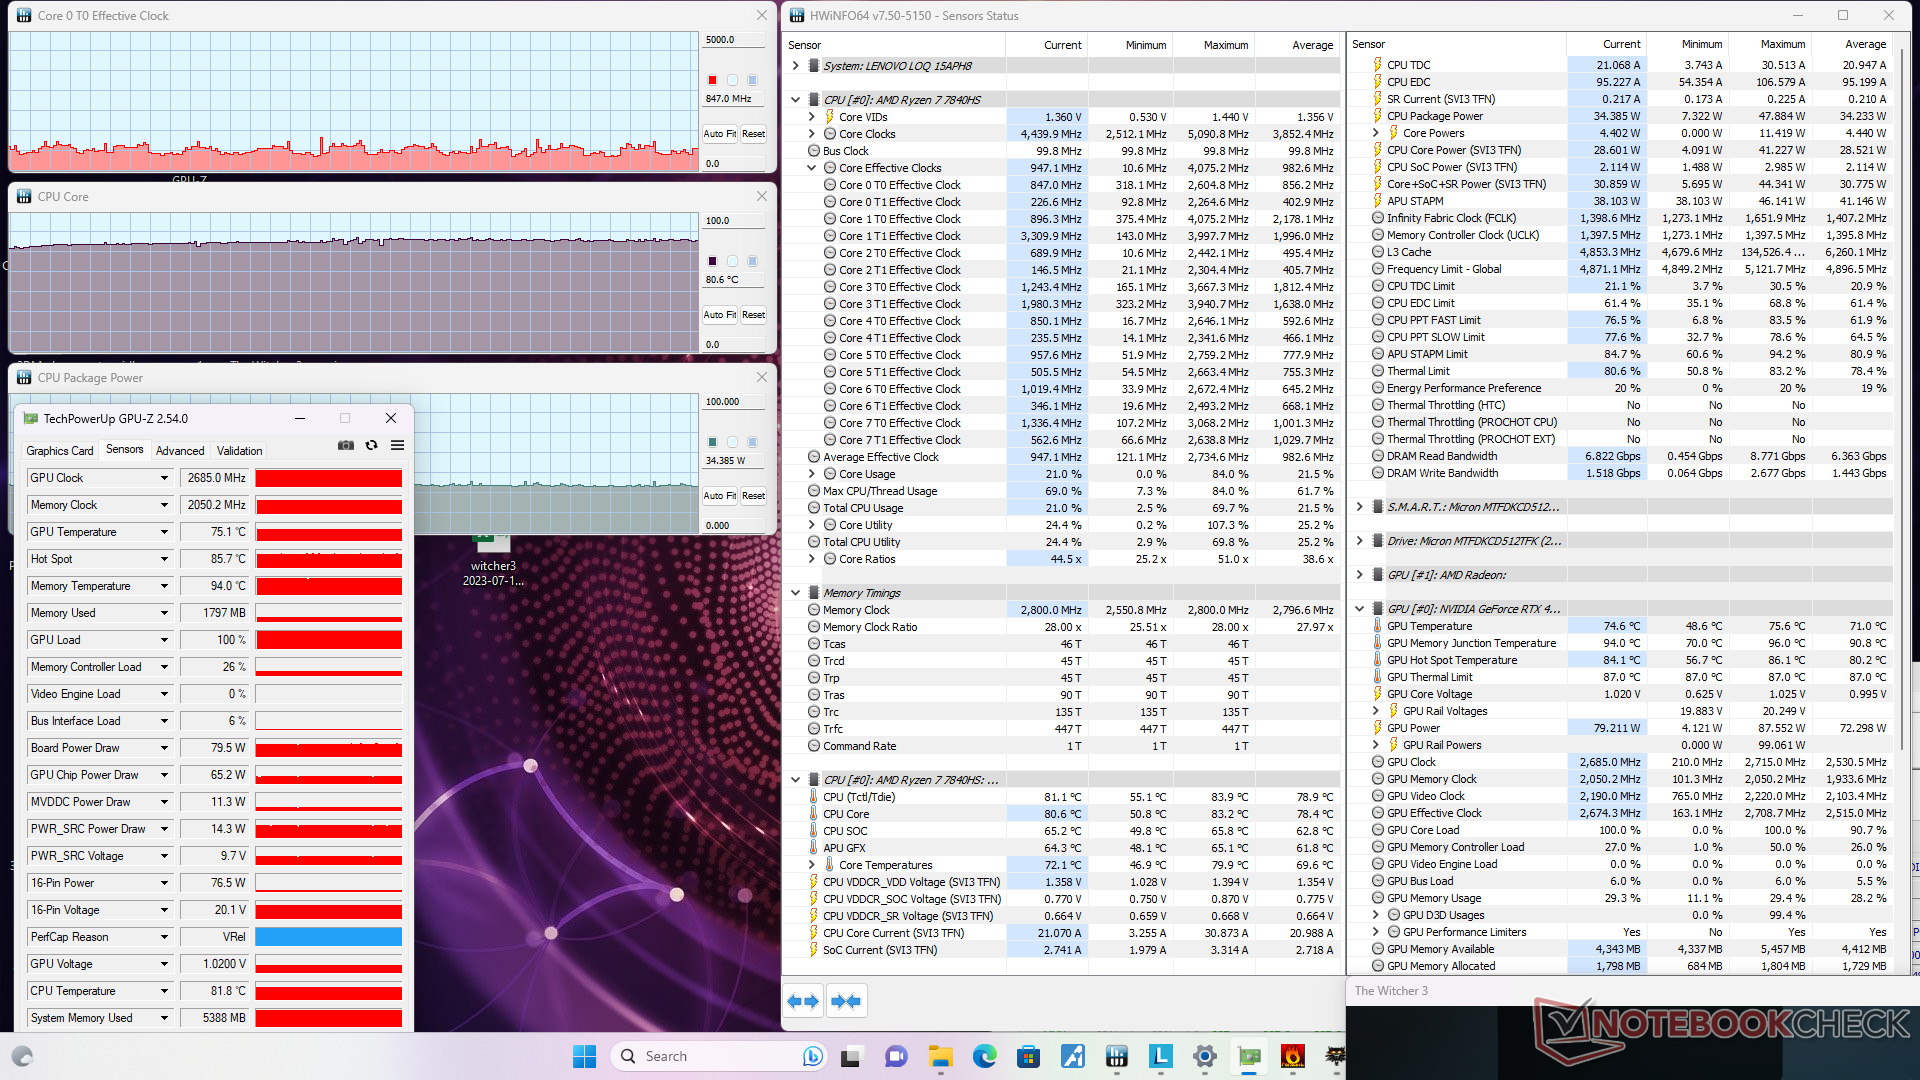
When running Witcher 3 on Performance mode, the Nvidia GPU would stabilize at 2685 MHz, 75 C, and 80 W. There are no significant changes if running on Balanced mode which aligns with our observations in the GPU Performance section above. Instead, CPU board power draw would drop by as much as 15 W. Balanced mode would therefore impact CPU performance more so than GPU performance.
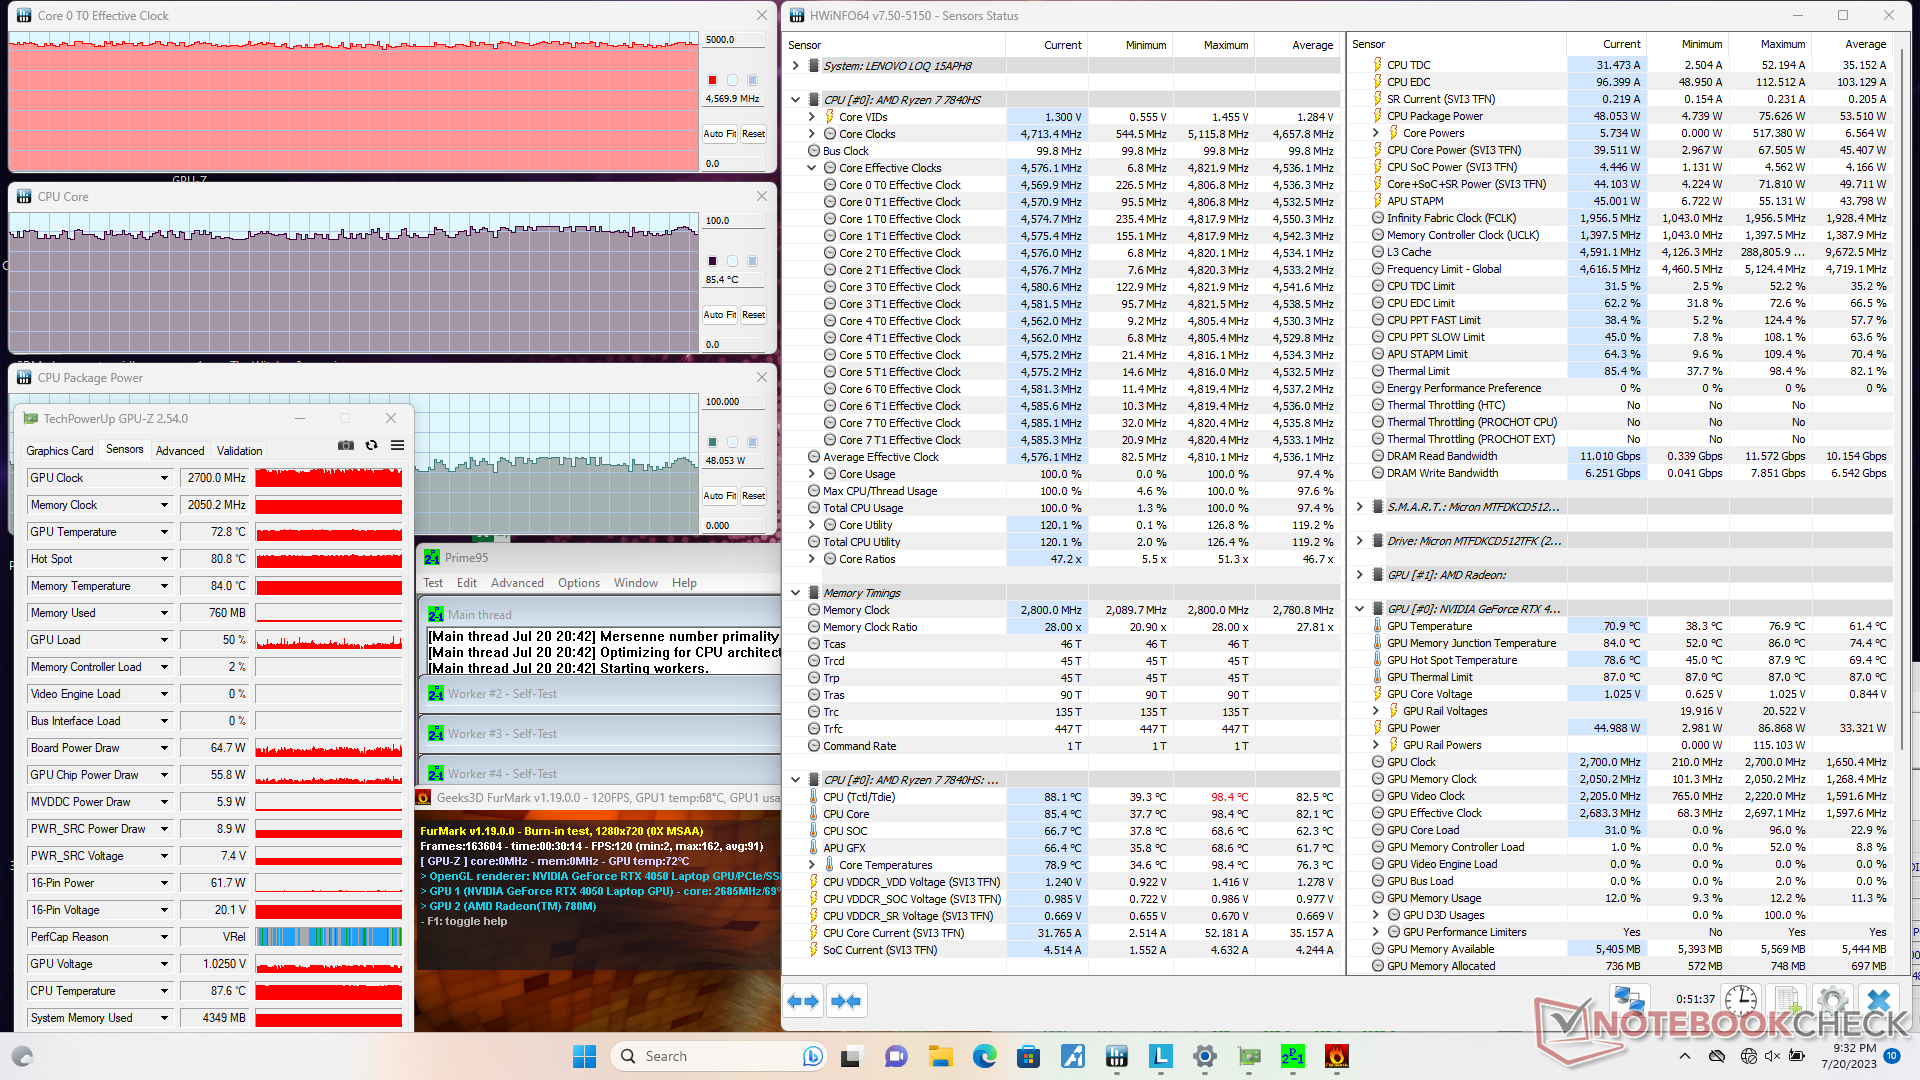

| CPU Clock (GHz) | GPU Clock (MHz) | Average CPU Temperature (°C) | Average GPU Temperature (°C) | |
| System Idle | -- | -- | 37 | 38 |
| Prime95 Stress | 4.7 | -- | 80 | 49 |
| Prime95 + FurMark Stress | 4.5 | 2700 | 85 | 73 |
| Witcher 3 Stress (Balanced mode) | ~0.9 | 2685 | 69 | 73 |
| Witcher 3 Stress (Performance mode) | ~0.8 | 2685 | 81 | 75 |
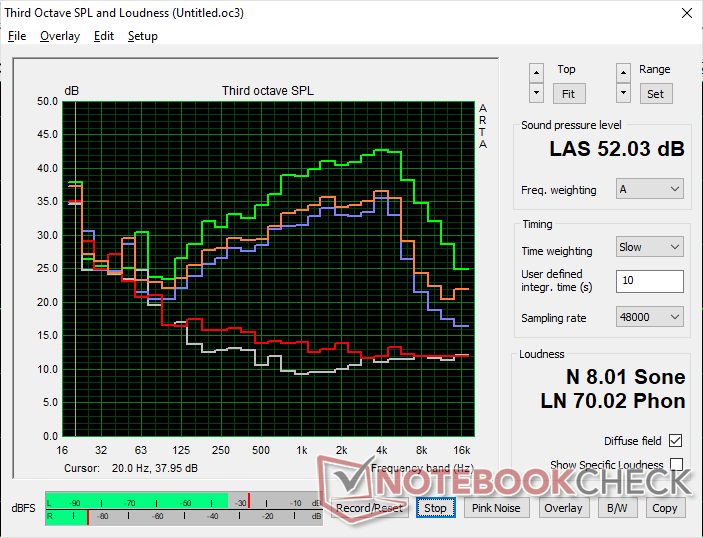
Speakers
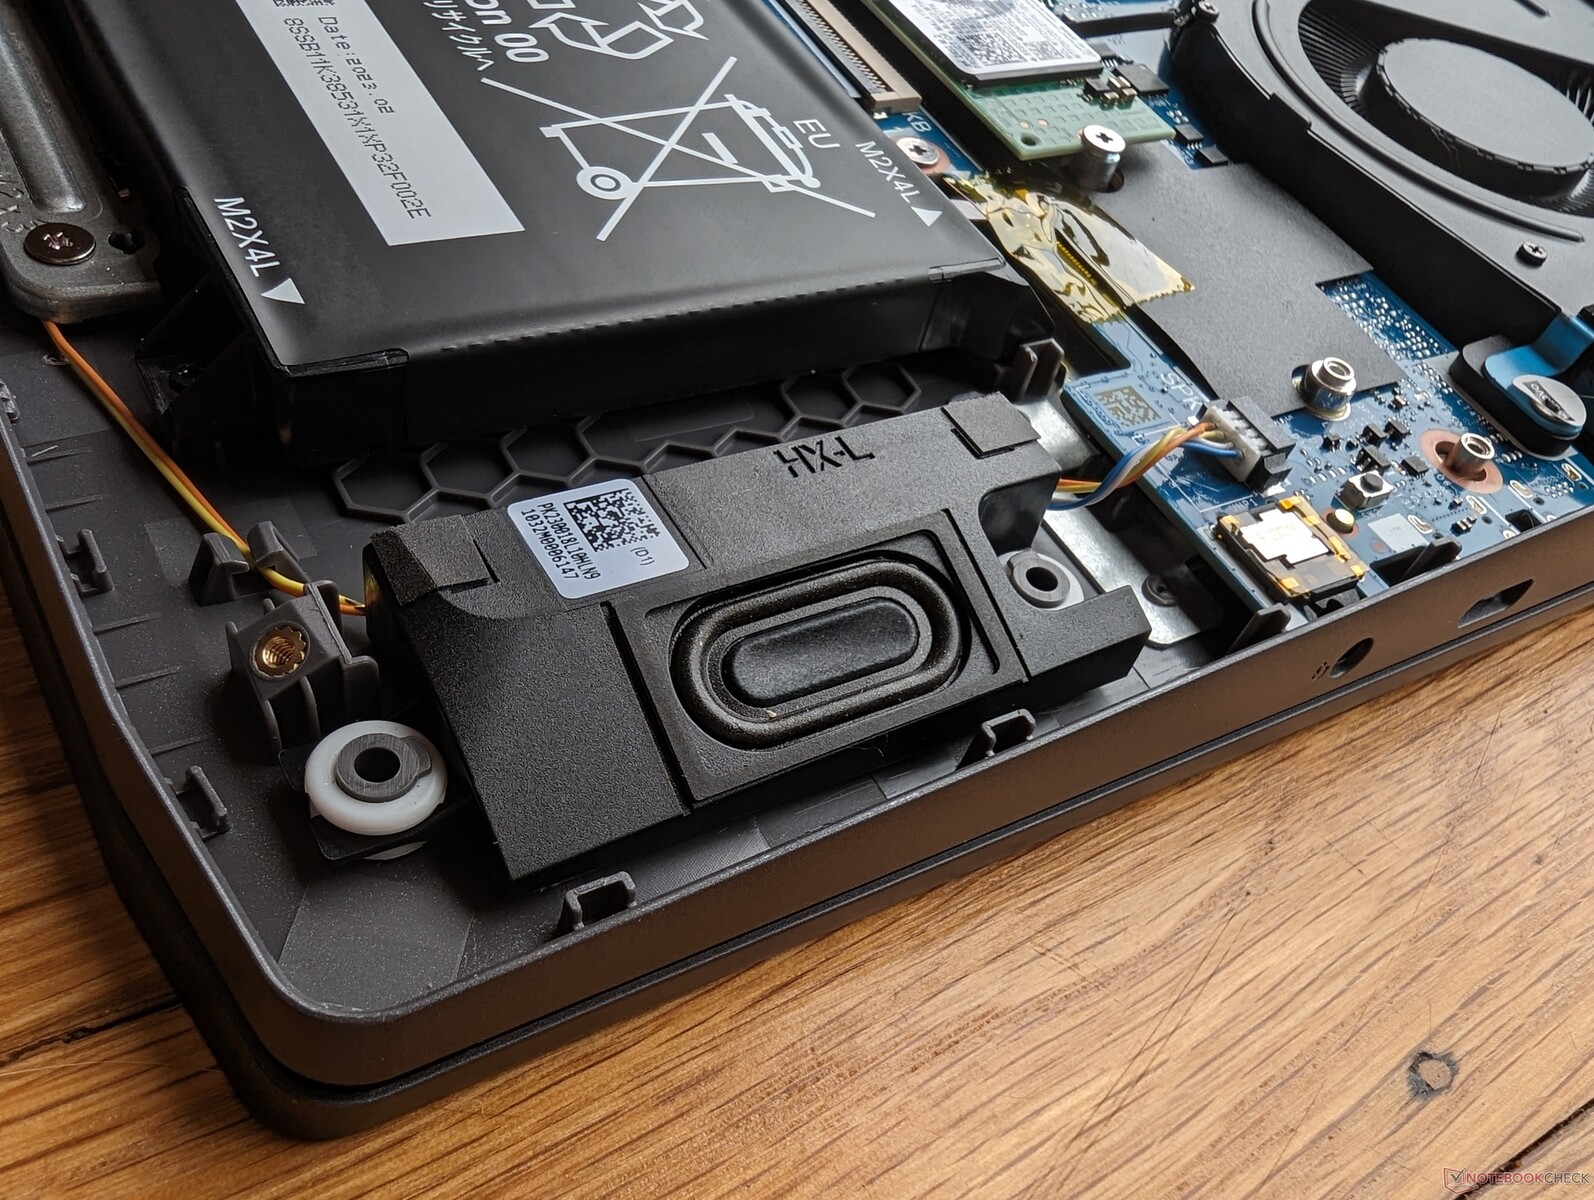
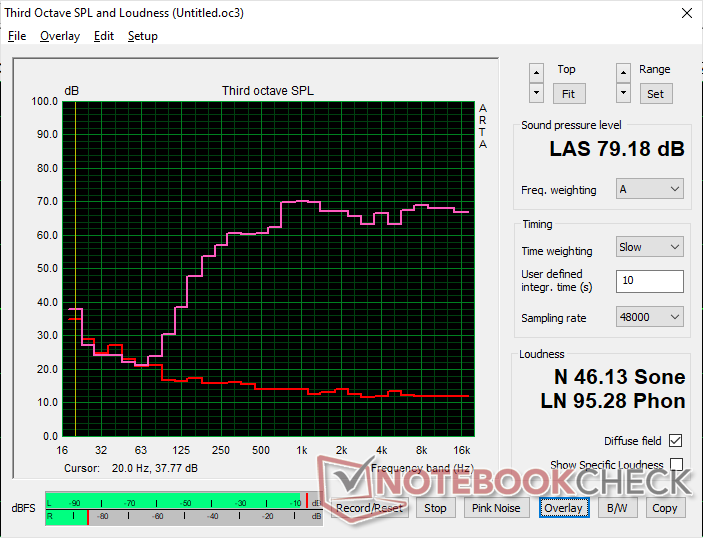
Lenovo LOQ 15APH8 audio analysis
(±) | speaker loudness is average but good (79.2 dB)
Bass 100 - 315 Hz
(-) | nearly no bass - on average 17.6% lower than median
(±) | linearity of bass is average (11.8% delta to prev. frequency)
Mids 400 - 2000 Hz
(+) | balanced mids - only 3.7% away from median
(+) | mids are linear (3.1% delta to prev. frequency)
Highs 2 - 16 kHz
(+) | balanced highs - only 1.9% away from median
(+) | highs are linear (4.7% delta to prev. frequency)
Overall 100 - 16.000 Hz
(+) | overall sound is linear (14.3% difference to median)
Compared to same class
» 26% of all tested devices in this class were better, 7% similar, 67% worse
» The best had a delta of 6%, average was 18%, worst was 132%
Compared to all devices tested
» 17% of all tested devices were better, 4% similar, 79% worse
» The best had a delta of 4%, average was 24%, worst was 134%
Apple MacBook Pro 16 2021 M1 Pro audio analysis
(+) | speakers can play relatively loud (84.7 dB)
Bass 100 - 315 Hz
(+) | good bass - only 3.8% away from median
(+) | bass is linear (5.2% delta to prev. frequency)
Mids 400 - 2000 Hz
(+) | balanced mids - only 1.3% away from median
(+) | mids are linear (2.1% delta to prev. frequency)
Highs 2 - 16 kHz
(+) | balanced highs - only 1.9% away from median
(+) | highs are linear (2.7% delta to prev. frequency)
Overall 100 - 16.000 Hz
(+) | overall sound is linear (4.6% difference to median)
Compared to same class
» 0% of all tested devices in this class were better, 0% similar, 100% worse
» The best had a delta of 5%, average was 17%, worst was 45%
Compared to all devices tested
» 0% of all tested devices were better, 0% similar, 100% worse
» The best had a delta of 4%, average was 24%, worst was 134%
Energy Management — Very Efficient CPU And GPU Combo
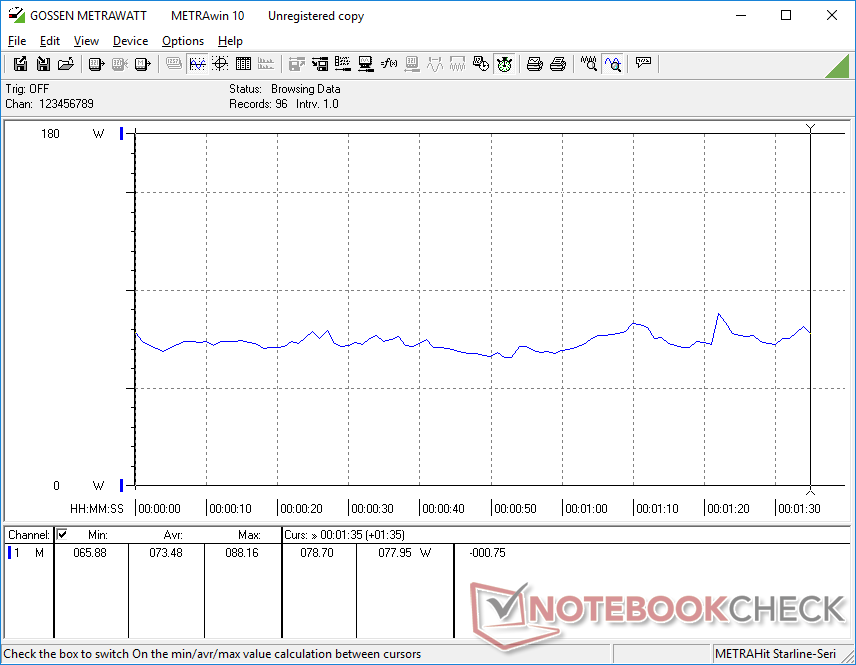
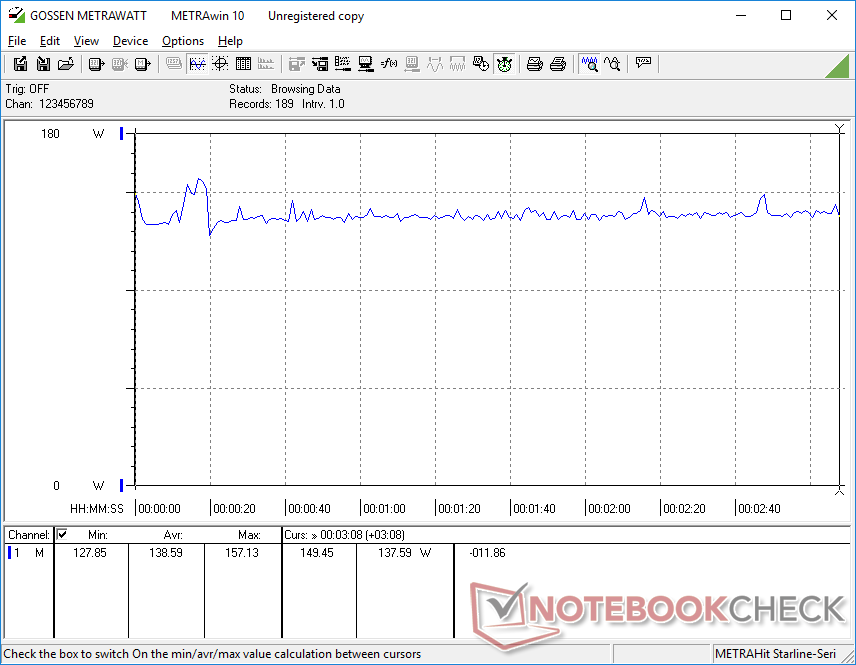
Power Consumption
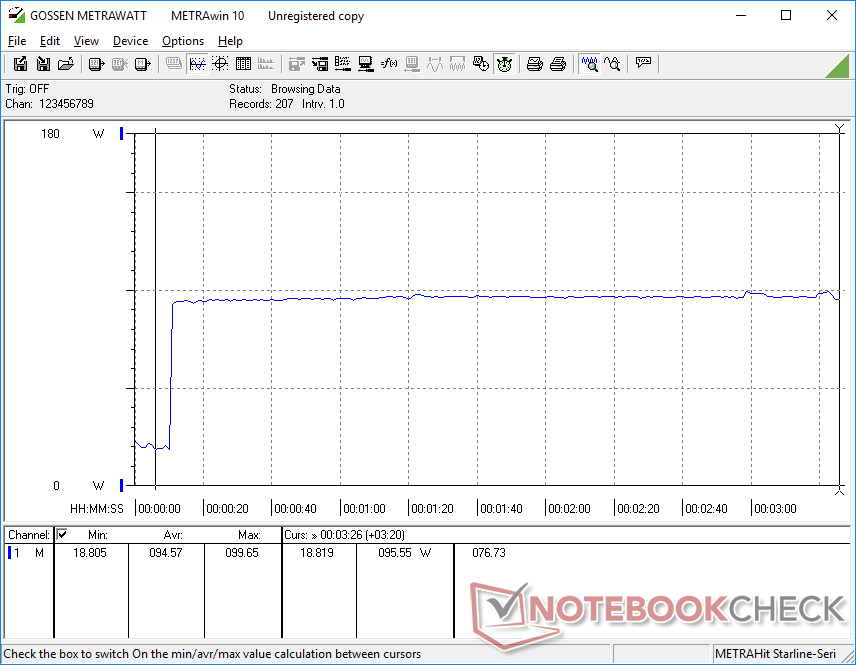
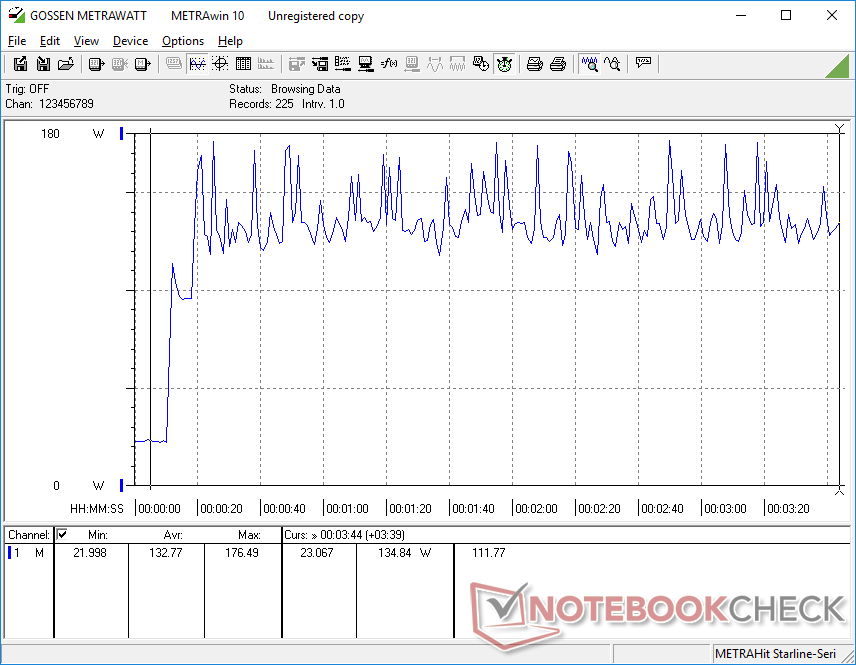
Power consumption when gaming is actually very close to last year's IdeaPad Gaming 3 15 despite the significant 60 to 70 percent boost in graphics performance over the RTX 3050 Ti and 15 to 20 percent boost in processor performance over the Core i5-12500H. The gains in performance-per-watt are therefore excellent for a budget gaming machine.
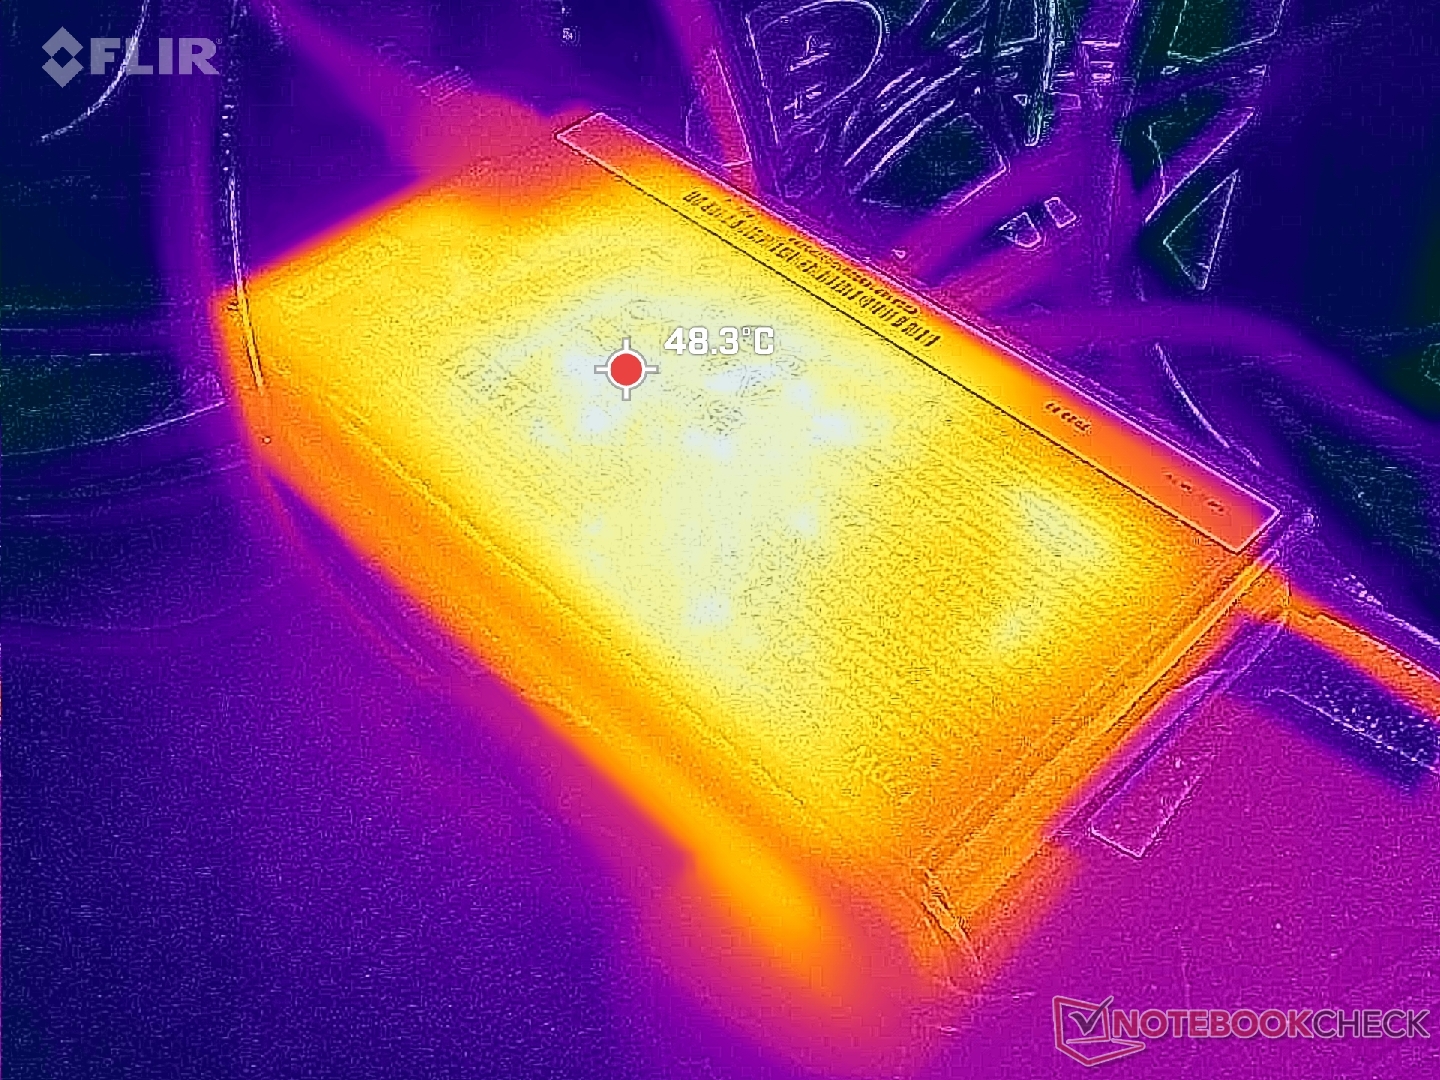
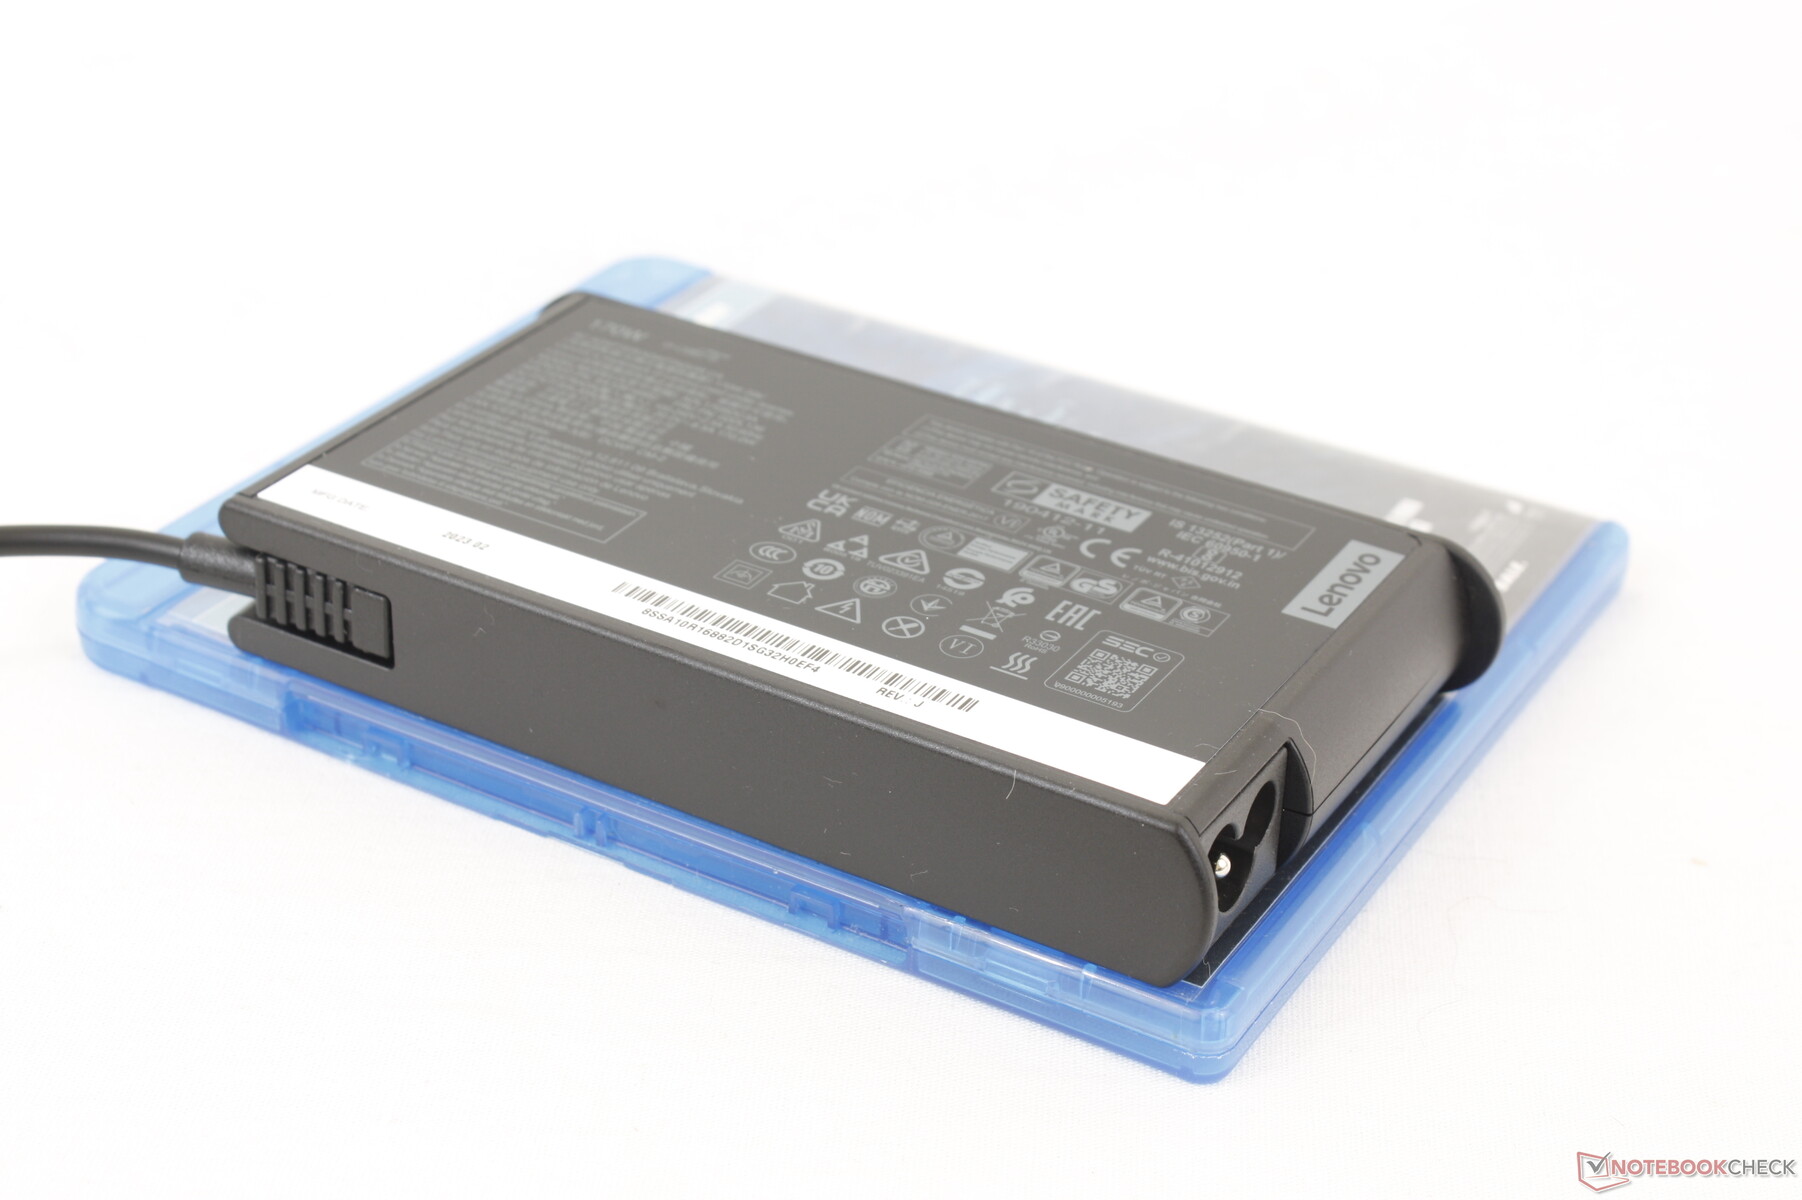
We're able to record a maximum draw of 177 W from the medium-sized (~15 x 7.8 x 2.3 cm) 170 W AC adapter when both the CPU and GPU are at 100 percent utilization. The charging rate will therefore slow if running high loads like games simultaneously.
| Off / Standby | |
| Idle | |
| Load |
|
Key:
min: | |
| Lenovo LOQ 15APH8 R7 7840HS, GeForce RTX 4050 Laptop GPU, Micron 2450 512GB MTFDKCD512TFK, IPS, 1920x1080, 15.6" | Lenovo Legion 5 15IAH7H 82RB i7-12700H, GeForce RTX 3060 Laptop GPU, , IPS, 1920x1080, 15.6" | Dell G15 5530 i7-13650HX, GeForce RTX 4060 Laptop GPU, SSTC CL4-3D512-Q11, IPS, 1920x1080, 15.6" | Asus TUF A15 FA507 R7 7735HS, GeForce RTX 4050 Laptop GPU, Micron 2400 MTFDKBA512QFM, IPS, 1920x1080, 15.6" | MSI Cyborg 15 A12VF i7-12650H, GeForce RTX 4060 Laptop GPU, Samsung PM9B1 1024GB MZVL41T0HBLB, IPS, 1920x1080, 15.6" | HP Victus 15 fa0020nr i7-12700H, GeForce RTX 3050 Ti Laptop GPU, Samsung PM9A1 MZVL2512HCJQ, IPS, 1920x1080, 15.6" | |
|---|---|---|---|---|---|---|
| Power Consumption | -55% | -6% | 19% | 36% | 10% | |
| Idle Minimum * (Watt) | 15 | 19.8 -32% | 8.4 44% | 8 47% | 6 60% | 5.1 66% |
| Idle Average * (Watt) | 17.7 | 26.2 -48% | 14.98 15% | 12.1 32% | 8.8 50% | 15.1 15% |
| Idle Maximum * (Watt) | 21.5 | 48.2 -124% | 15.56 28% | 12.5 42% | 11.9 45% | 18.9 12% |
| Load Average * (Watt) | 73.5 | 102.9 -40% | 96.8 -32% | 74.9 -2% | 89 -21% | 114.5 -56% |
| Witcher 3 ultra * (Watt) | 138.6 | 186.7 -35% | 186 -34% | 136.6 1% | 90.3 35% | 113.9 18% |
| Load Maximum * (Watt) | 176.5 | 268 -52% | 271.42 -54% | 185 -5% | 99 44% | 165.8 6% |
* ... smaller is better
Power Consumption Witcher 3 / Stresstest
Power Consumption external Monitor
Battery Life
Our 60 Wh battery is relatively small as most other 15-inch gaming laptops typically come with 70 Wh batteries or larger. Nonetheless, runtimes are still respectable at almost 7.5 hours of real-world WLAN browsing which is comparable to the Cyborg 15.
Charging from empty to full capacity with the included AC adapter is very fast at about 45 minutes or roughly 2x faster than on most other gaming laptops. Lenovo Rapid Charge is enabled by default through the Vantage software.
The system can be recharged via USB-C, but compatibility with most USB-C AC adapters is not guaranteed. Lenovo sells its own 140 W USB-C AC adapter that should be compatible with most Lenovo laptops.
| Lenovo LOQ 15APH8 R7 7840HS, GeForce RTX 4050 Laptop GPU, 60 Wh | Lenovo Legion 5 15IAH7H 82RB i7-12700H, GeForce RTX 3060 Laptop GPU, 80 Wh | Dell G15 5530 i7-13650HX, GeForce RTX 4060 Laptop GPU, 86 Wh | Asus TUF A15 FA507 R7 7735HS, GeForce RTX 4050 Laptop GPU, 90 Wh | MSI Cyborg 15 A12VF i7-12650H, GeForce RTX 4060 Laptop GPU, 53.5 Wh | HP Victus 15 fa0020nr i7-12700H, GeForce RTX 3050 Ti Laptop GPU, 70 Wh | |
|---|---|---|---|---|---|---|
| Battery runtime | -16% | -20% | 25% | 50% | -48% | |
| Reader / Idle (h) | 9.8 | 8.1 -17% | 13.6 39% | 2.6 -73% | ||
| WiFi v1.3 (h) | 7.4 | 5 -32% | 6.5 -12% | 11.7 58% | 7.5 1% | 2.1 -72% |
| Load (h) | 1.1 | 1.1 0% | 0.8 -27% | 1 -9% | 2.3 109% | 1.1 0% |
| H.264 (h) | 6.8 | 12.5 | 8 | |||
| Witcher 3 ultra (h) | 0.8 |
Pros
Cons
Verdict — Ryzen 7 7840HS And GeForce RTX 4050 Strike A Great Balance
For a budget gaming machine with just 8 GB of upgradeable system RAM, the Lenovo LOQ 15 performs better than expected and with excellent performance-per-watt when compared to gaming laptops running on 12th gen Core-H series CPUs like the IdeaPad Gaming 15 or HP Victus 15. Its 1080p G-Sync panel pairs very well with the GeForce RTX 4050 for smooth 60 FPS gaming on modern titles which is a reasonable target for any inexpensive gaming laptop.
The plastic chassis and 8 GB of RAM are a turn off, but the easy upgradeability and fast performance for the price help to buoy the LOQ 15 above the rest in the $1000 USD and under category.
The main drawback to the LOQ 15 is its limited color range and average black-white and gray-gray response times. The higher-end 1440p panel option addresses these concerns, but the subsequent price increase would then become awfully close to a Legion 5 model and the value proposition of the LOQ 15 would begin to decrease. The $1000 USD or under price point is the sweet spot for the LOQ 15 especially since the Ryzen 7 7840HS and GeForce RTX 4050 are neck-to-neck with the Core i7-12700H and RTX 3060 that powered many gaming laptops of 2022 retailing for closer to $1500. Major competing makers like MSI, HP, or Asus have yet to offer affordable gaming laptops with the same Ryzen 7 7840HS options at the time of writing.
Price and Availability
Best Buy is currently shipping the Lenovo LOQ 15 in our exact configuration for $1100 USD. Lenovo has additional configurations available directly from their website for cheaper prices.
Lenovo LOQ 15APH8
- 07/26/2023 v7 (old)
Allen Ngo
Transparency
The selection of devices to be reviewed is made by our editorial team. The test sample was provided to the author as a loan by the manufacturer or retailer for the purpose of this review. The lender had no influence on this review, nor did the manufacturer receive a copy of this review before publication. There was no obligation to publish this review. As an independent media company, Notebookcheck is not subjected to the authority of manufacturers, retailers or publishers.
This is how Notebookcheck is testing
Every year, Notebookcheck independently reviews hundreds of laptops and smartphones using standardized procedures to ensure that all results are comparable. We have continuously developed our test methods for around 20 years and set industry standards in the process. In our test labs, high-quality measuring equipment is utilized by experienced technicians and editors. These tests involve a multi-stage validation process. Our complex rating system is based on hundreds of well-founded measurements and benchmarks, which maintains objectivity. Further information on our test methods can be found here.
Price comparison
