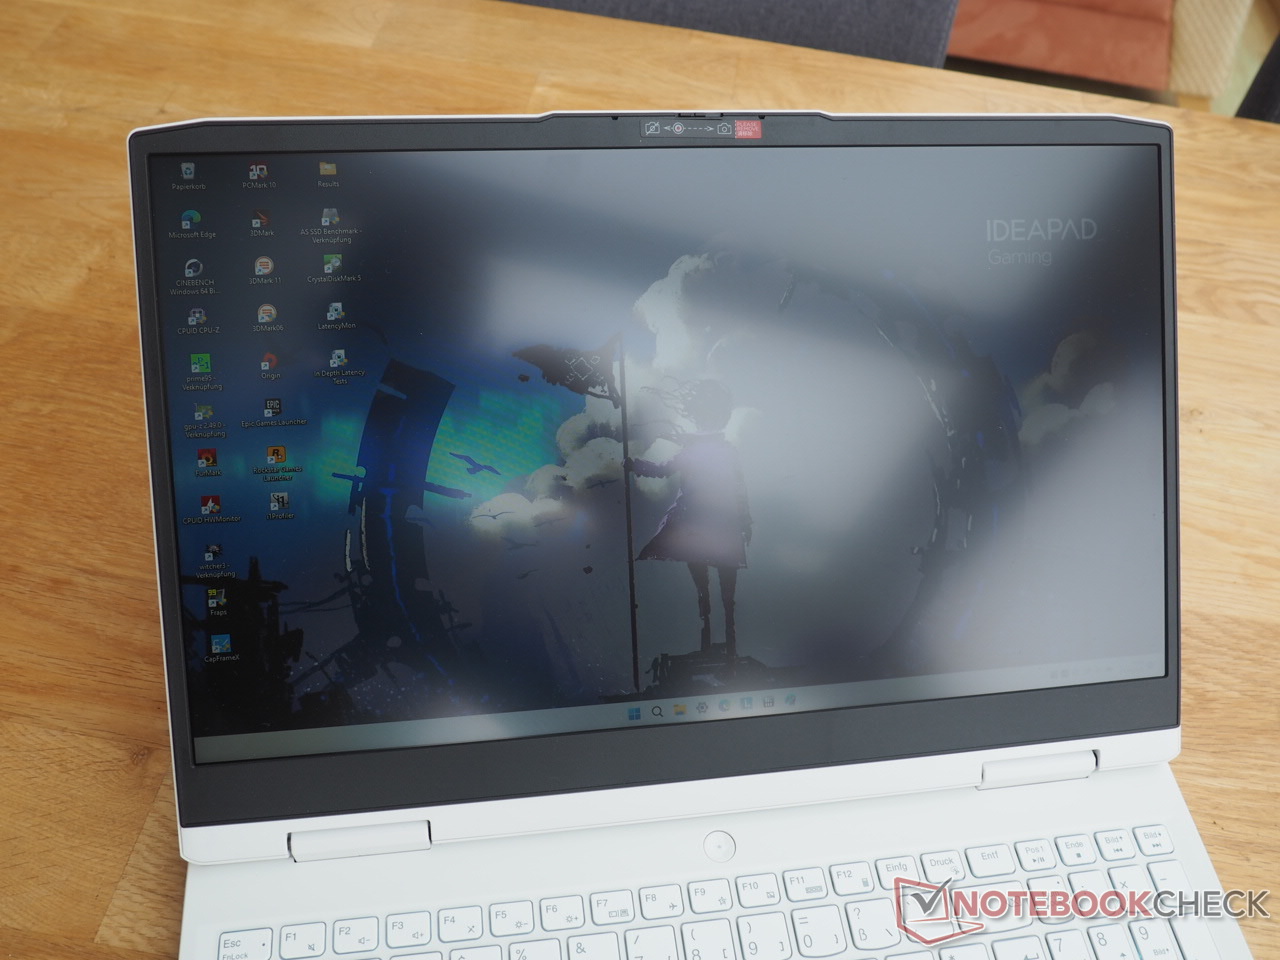
Lenovo IdeaPad Gaming 3 15IAH7 review: One of the most powerful RTX 3050 Ti laptops

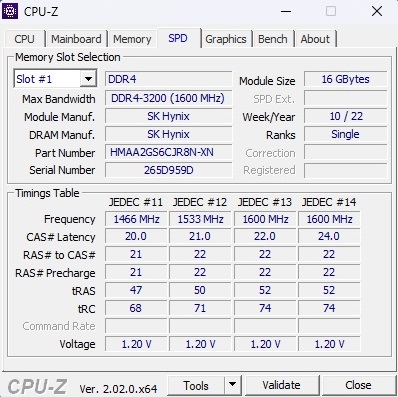
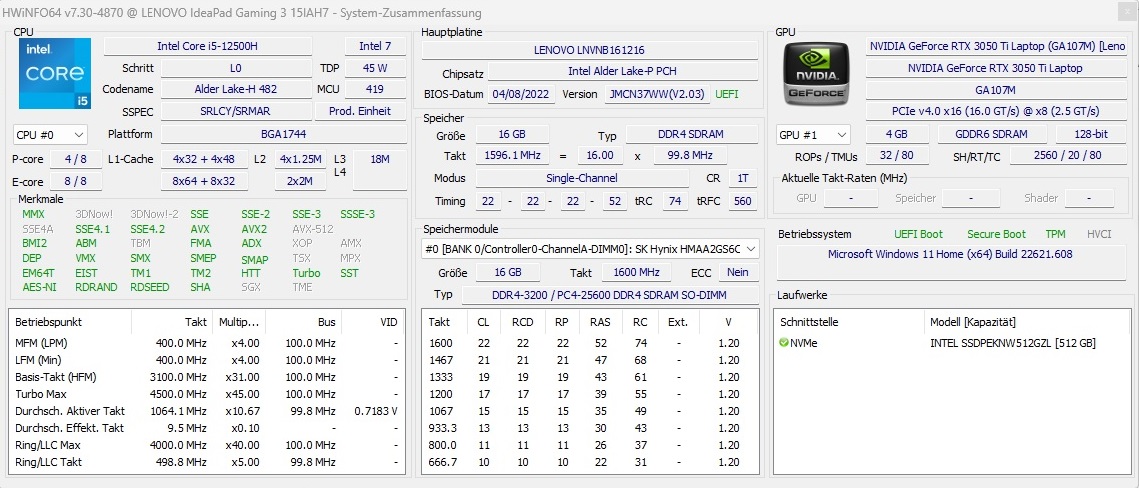
Although various gaming laptops are available in the price range around 1,000 Euros (~$978), most of those forego a display with a decent brightness and solid color space coverage. However, from time to time we can find a positive exception such as the IdeaPad Gaming 3 15IAH7 we tested, which offers a Core i5-12500H, a GeForce RTX 3050 Ti, 16 GB of DDR4 RAM (unfortunately only in single-channel mode), and a 512 GB NVMe SSD. The 15.6-inch IPS screen has a refresh rate of 165 Hz, promising good response times, and a resolution of 1920 x 1080 pixels.
The competitors of the IdeaPad Gaming 3 15IAH7 include other laptops with the RTX 3050 Ti such as the HP Victus 16-e0145ng, the Dell G15 5515, and the Dell Inspiron 16 Plus 7620. We also include the 15ARH7 sibling model (Ryzen 5 6600H & RTX 3050) in our charts as a comparison device.
Possible Competitors in Comparison
Rating | Date | Model | Weight | Height | Size | Resolution | Price |
|---|---|---|---|---|---|---|---|
| 82.8 % v7 (old) | 10 / 2022 | Lenovo IdeaPad Gaming 3 15IAH7 i5-12500H, GeForce RTX 3050 Ti Laptop GPU | 2.4 kg | 26 mm | 15.60" | 1920x1080 | |
| 80.8 % v7 (old) | 09 / 2022 | Lenovo IdeaPad Gaming 3 15ARH7 R5 6600H, GeForce RTX 3050 4GB Laptop GPU | 2.4 kg | 21.8 mm | 15.60" | 1920x1080 | |
| 82.7 % v7 (old) | 10 / 2021 | Dell G15 5515 R7 5800H, GeForce RTX 3050 Ti Laptop GPU | 2.4 kg | 24.9 mm | 15.60" | 1920x1080 | |
| 82.3 % v7 (old) | 05 / 2022 | HP Victus 16-e0145ng R5 5600H, GeForce RTX 3050 Ti Laptop GPU | 2.4 kg | 23.5 mm | 16.10" | 1920x1080 | |
| 87.4 % v7 (old) | 08 / 2022 | Dell Inspiron 16 Plus 7620 i7-12700H, GeForce RTX 3050 Ti Laptop GPU | 2.1 kg | 18.99 mm | 16.00" | 3072x1920 |
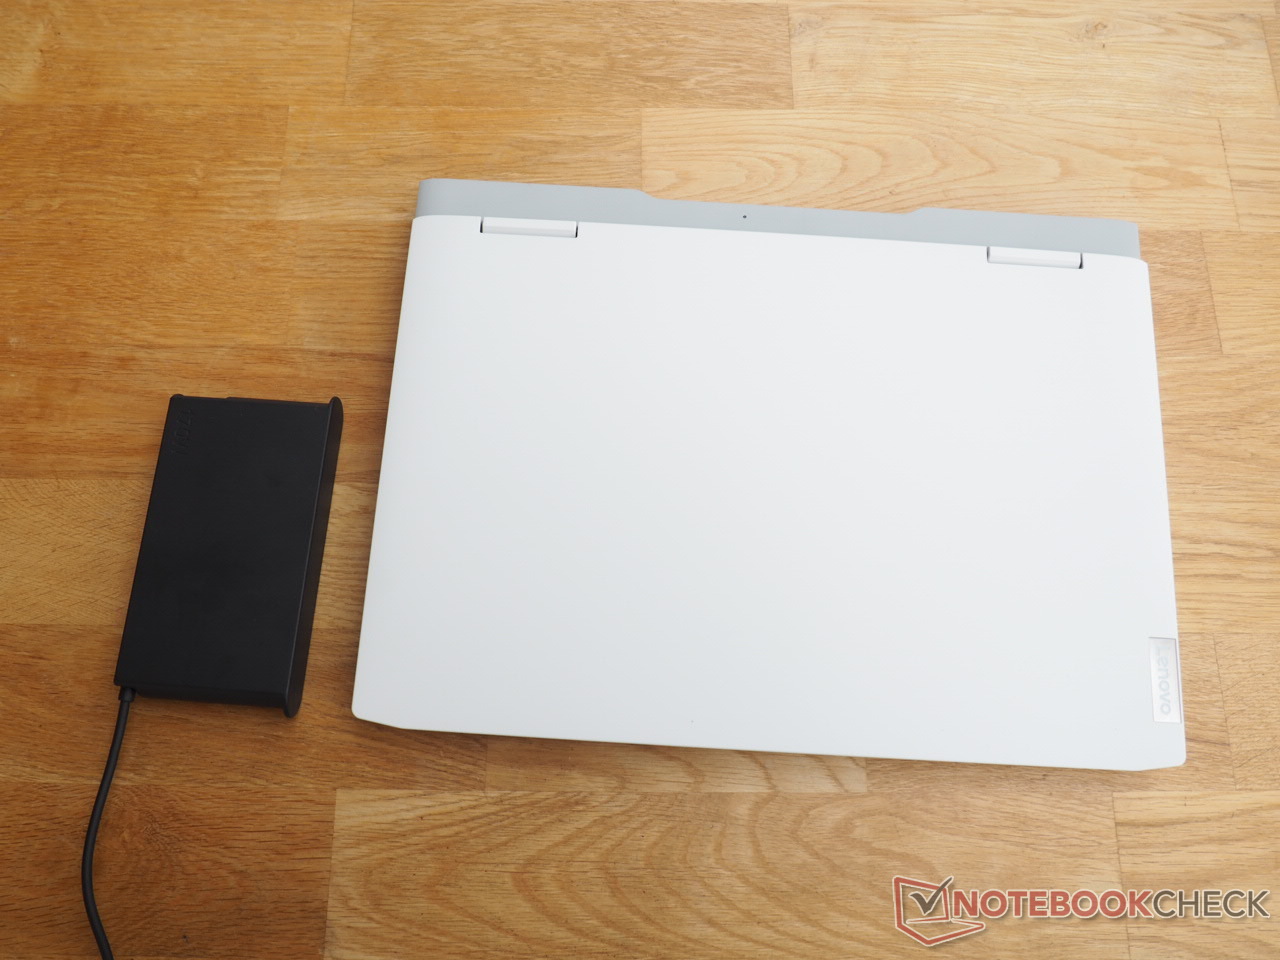
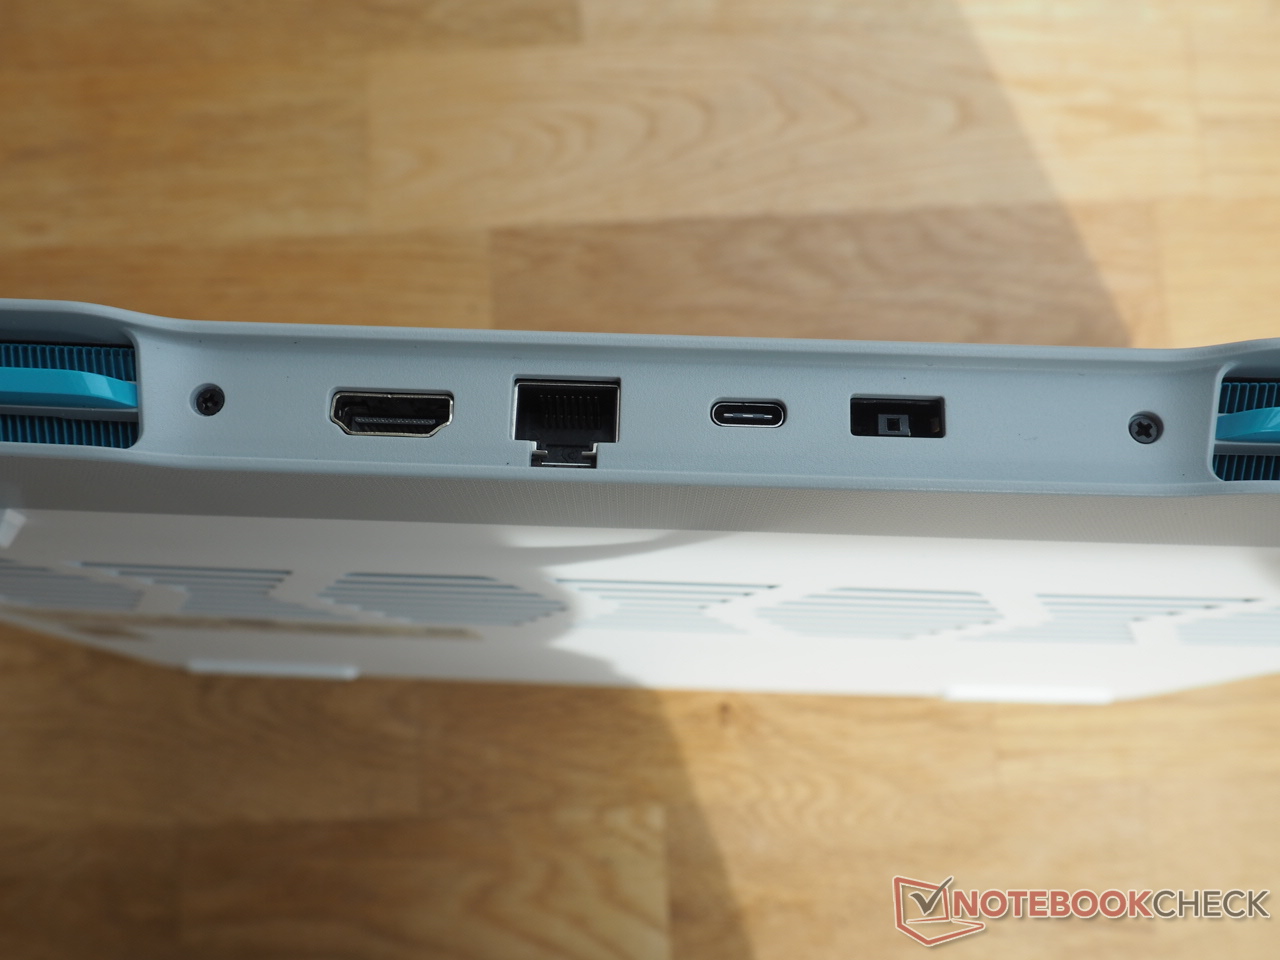
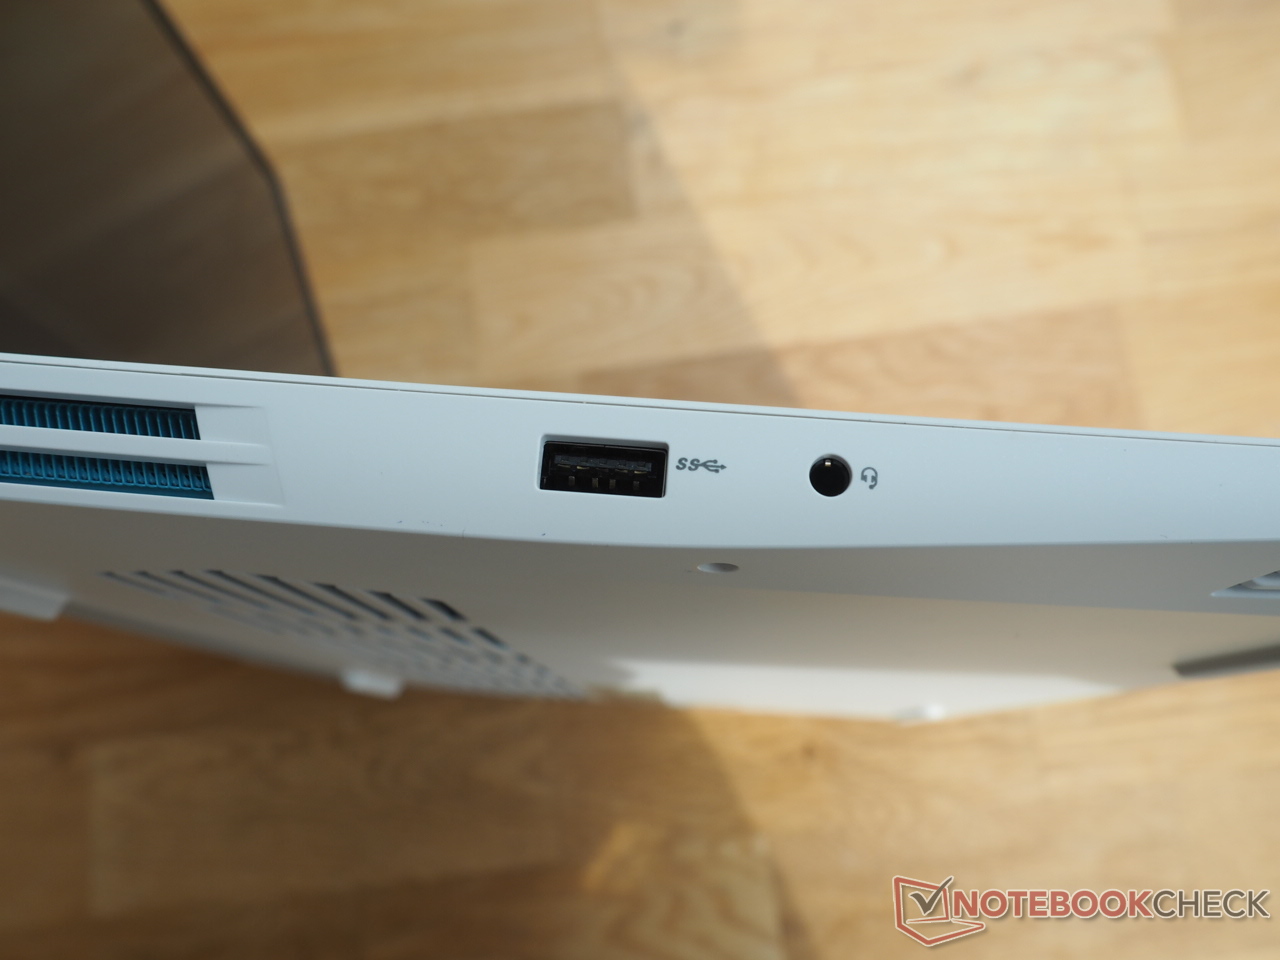
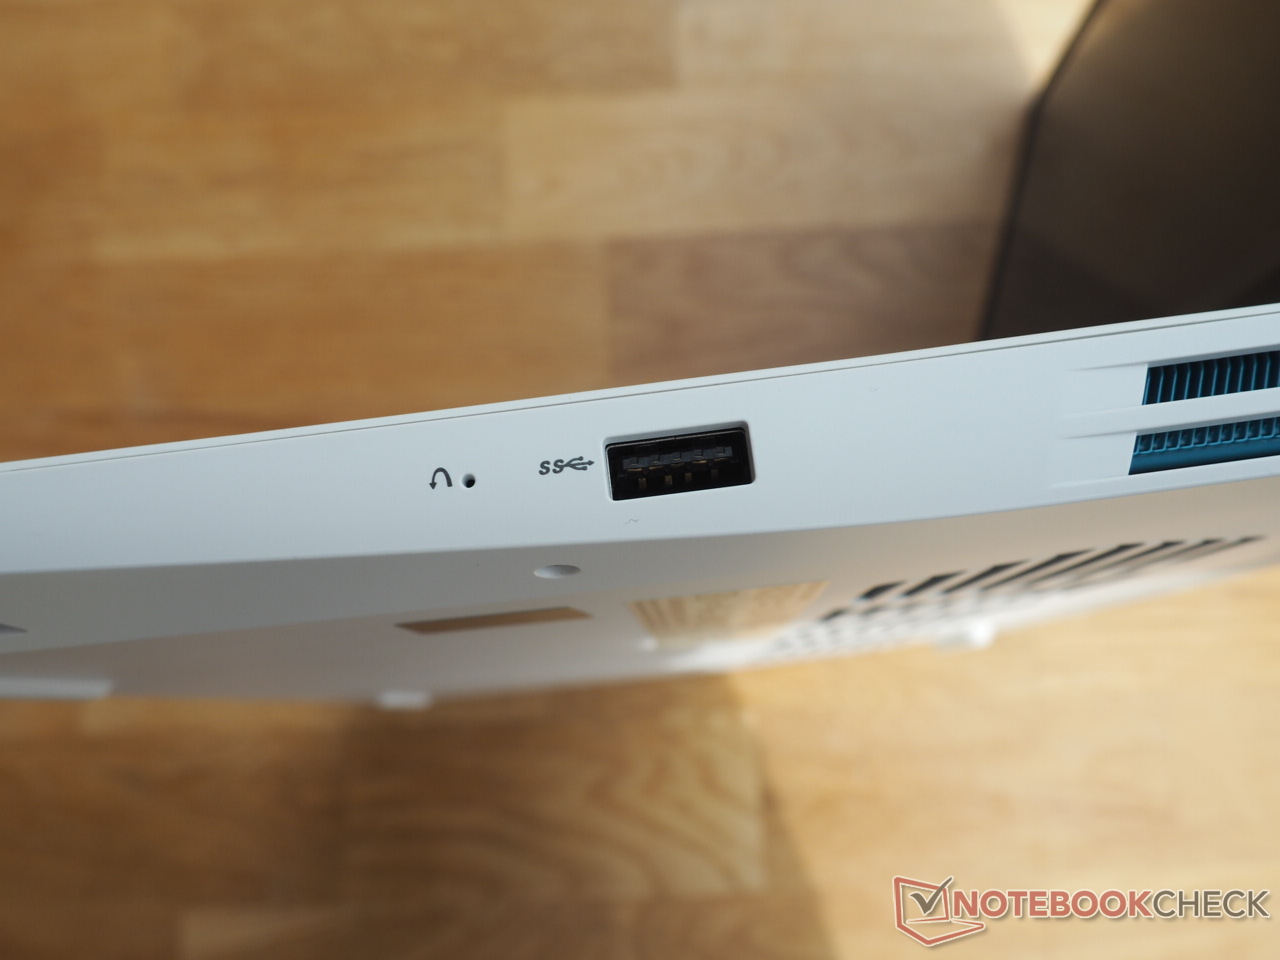
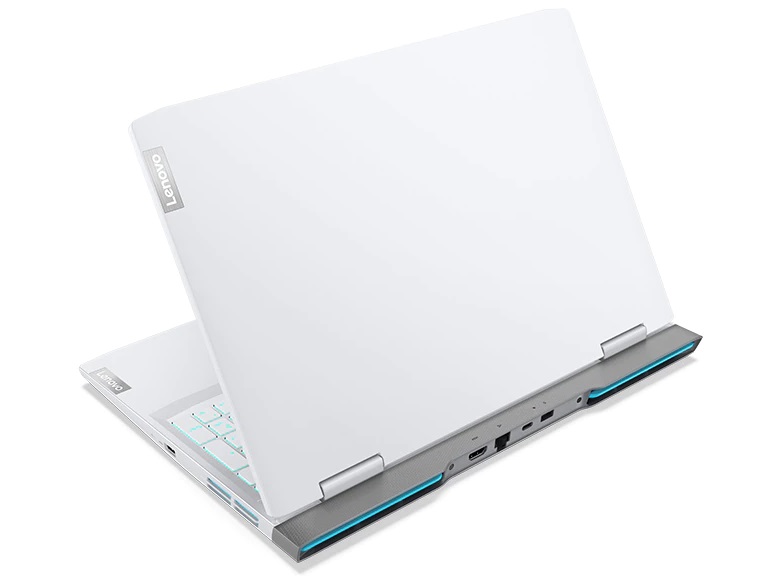
Since aside from the color (Glacier White instead of Onyx Grey) and keyboard layout (German instead of US), the case is identical to the sibling model listed above, we won't discuss the case, equipment, and input devices further here. You can find the corresponding information in the review of the sibling model.
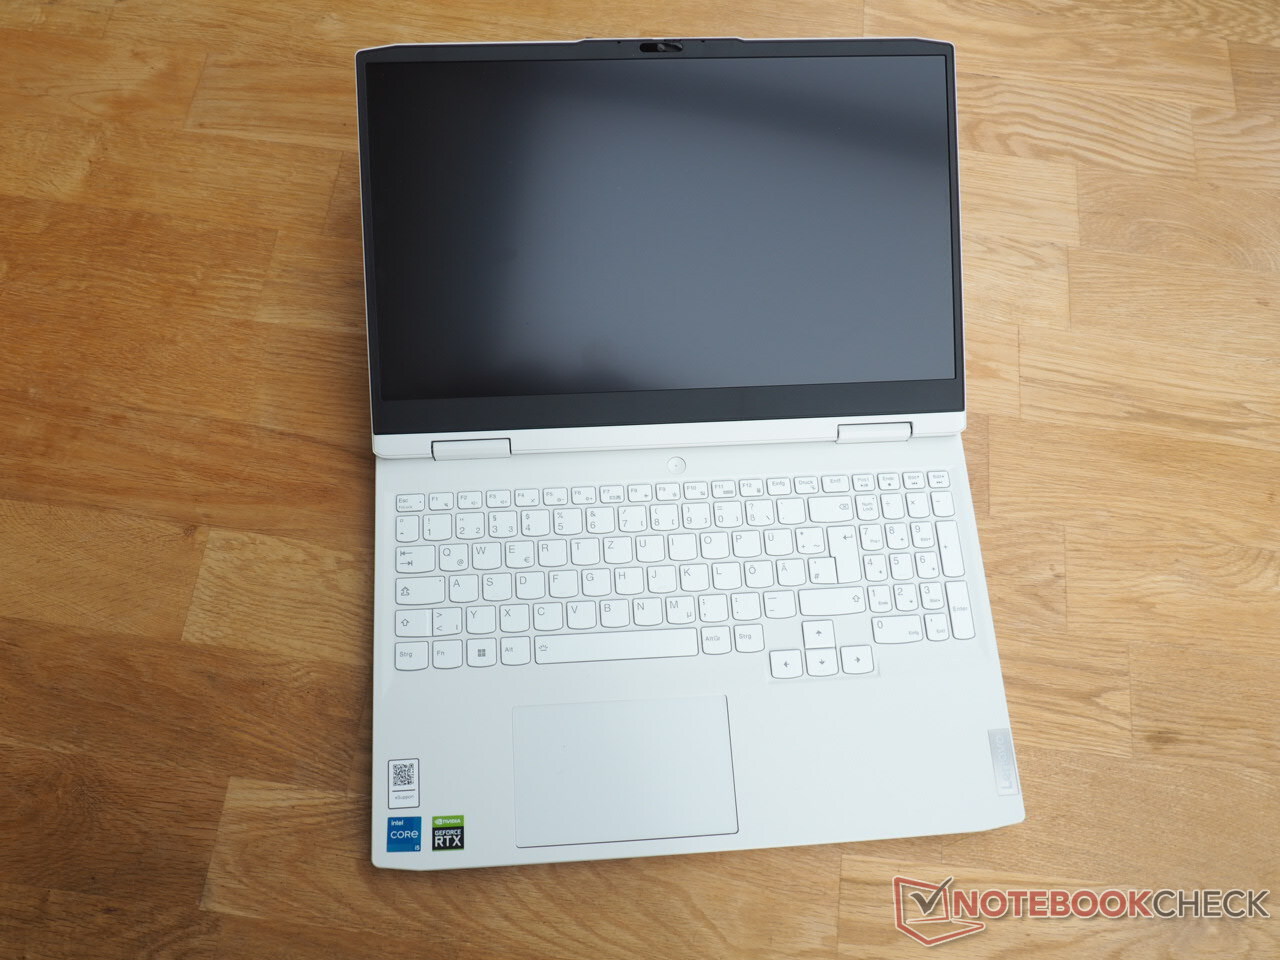
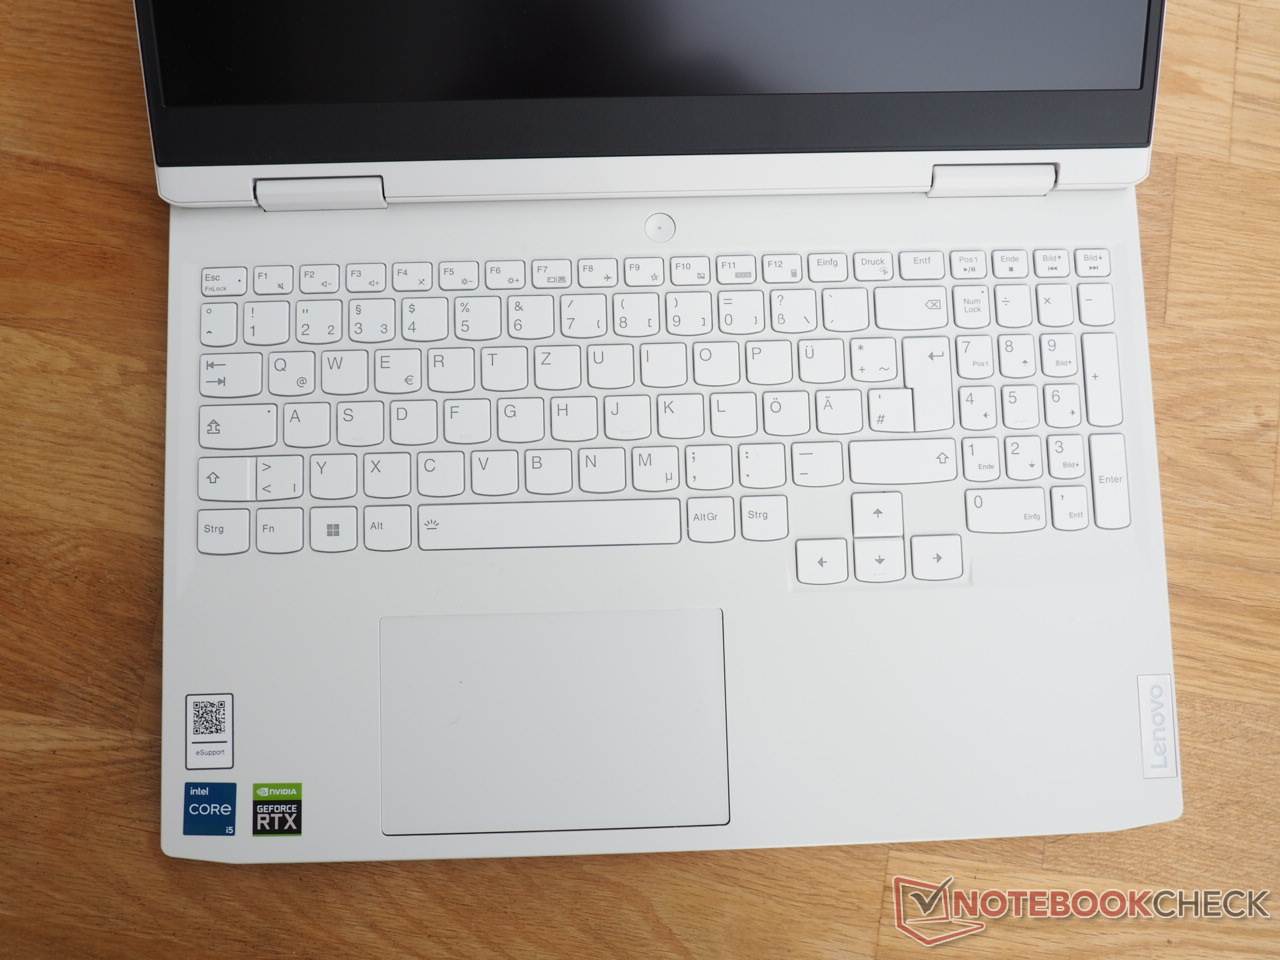
Webcam


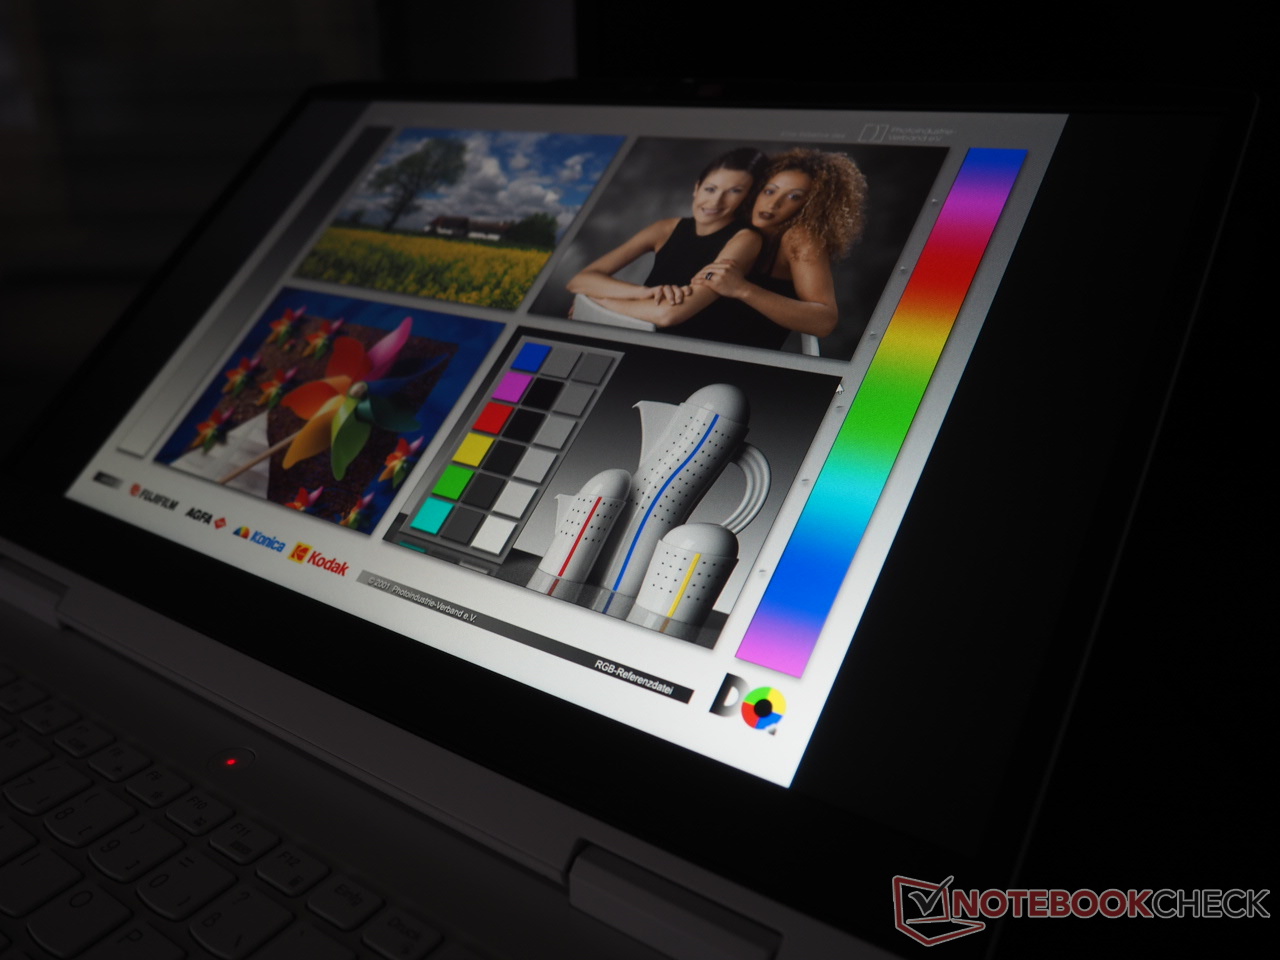
Display
Looking at the comparison field, you can easily see that affordable gaming laptops often come with a meager display.
| |||||||||||||||||||||||||
Brightness Distribution: 92 %
Center on Battery: 338 cd/m²
Contrast: 1252:1 (Black: 0.27 cd/m²)
ΔE ColorChecker Calman: 2.88 | ∀{0.5-29.43 Ø4.73}
calibrated: 1.22
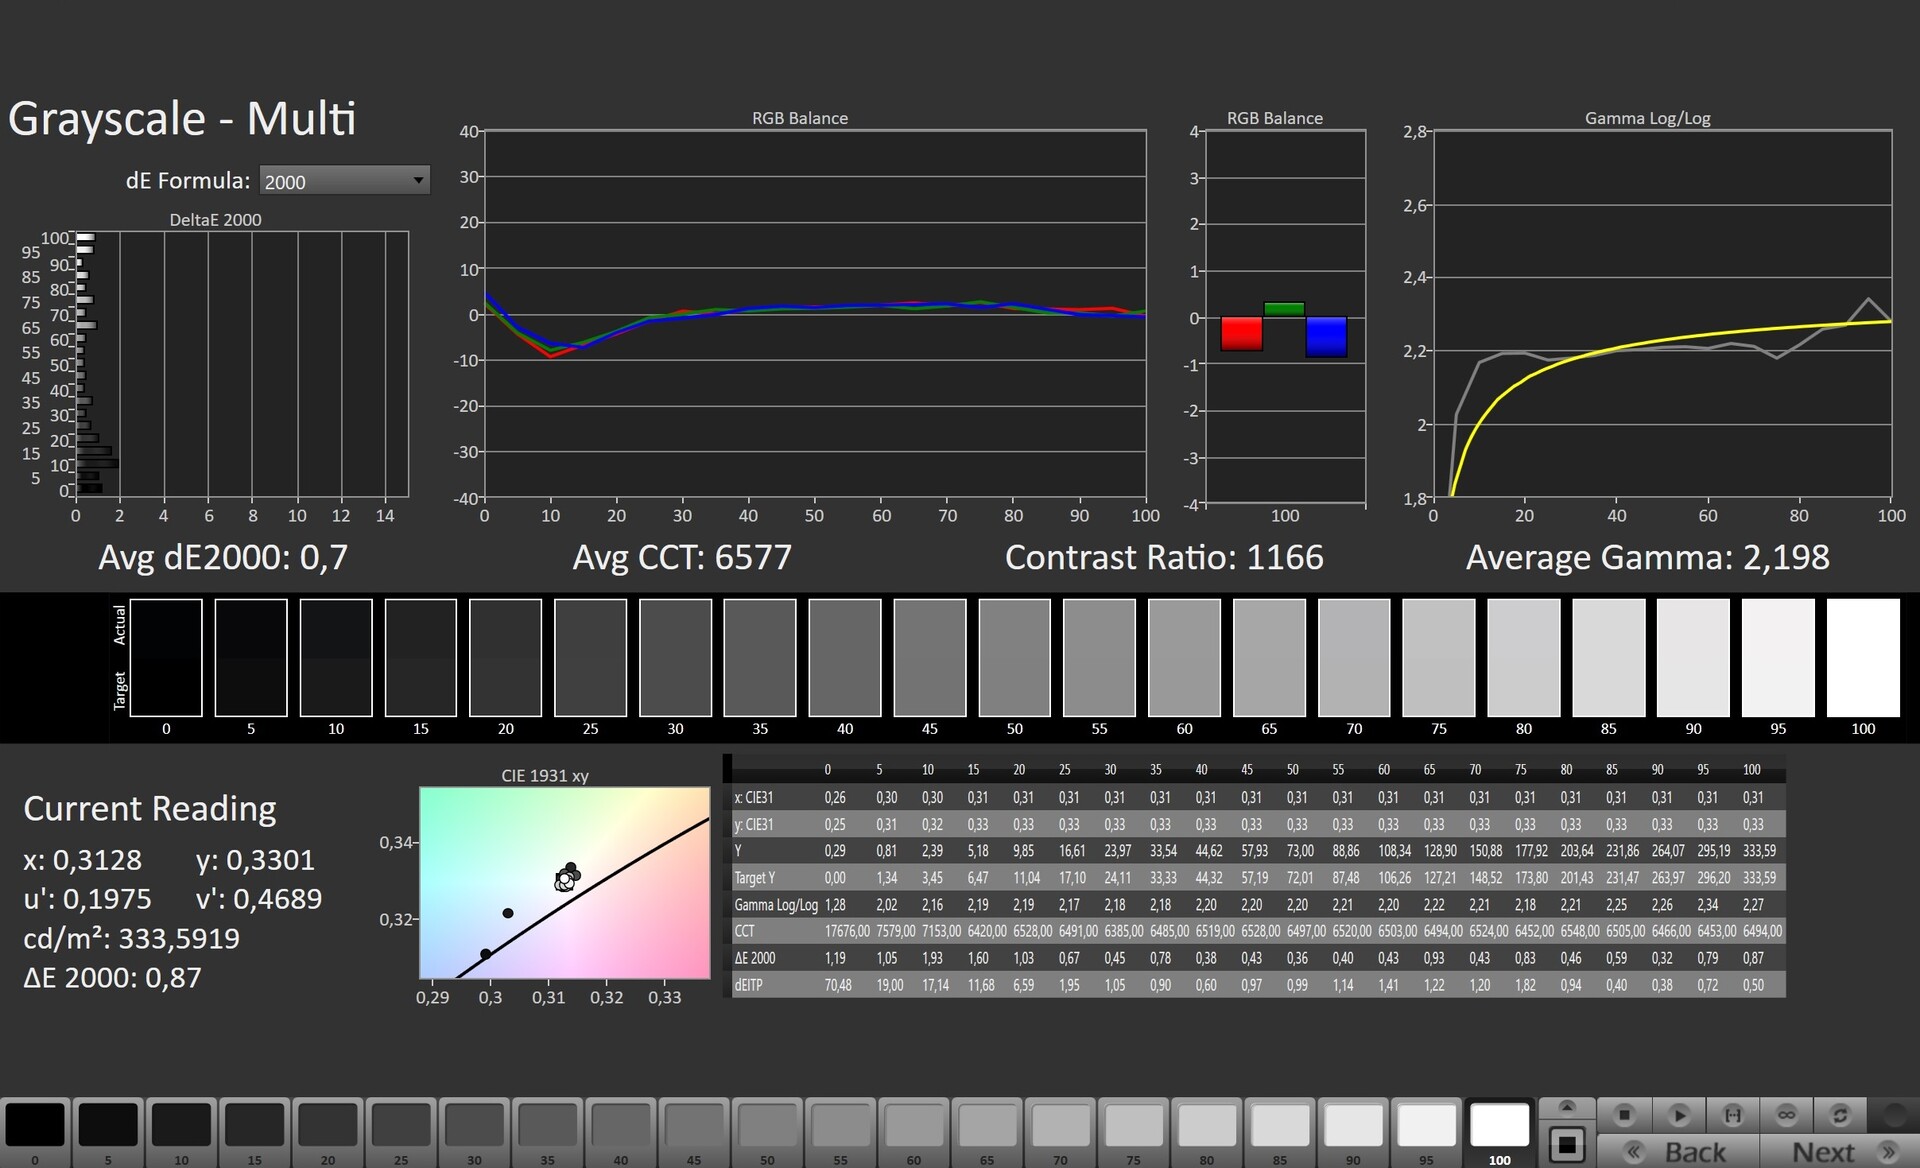
ΔE Greyscale Calman: 5 | ∀{0.09-98 Ø4.97}
69.9% AdobeRGB 1998 (Argyll 3D)
99.2% sRGB (Argyll 3D)
69.1% Display P3 (Argyll 3D)
Gamma: 2.162
CCT: 7497 K
| Lenovo IdeaPad Gaming 3 15IAH7 Lenovo LEN156FHD, IPS, 1920x1080, 15.6" | Lenovo IdeaPad Gaming 3 15ARH7 LEN156FHD, IPS, 1920x1080, 15.6" | Dell G15 5515 BOE092A, IPS, 1920x1080, 15.6" | HP Victus 16-e0145ng CMN1609, IPS, 1920x1080, 16.1" | Dell Inspiron 16 Plus 7620 BOE NE16N41, IPS, 3072x1920, 16" | |
|---|---|---|---|---|---|
| Display | -42% | -43% | -39% | 2% | |
| Display P3 Coverage (%) | 69.1 | 39.4 -43% | 39.1 -43% | 41.6 -40% | 70.8 2% |
| sRGB Coverage (%) | 99.2 | 58 -42% | 56.9 -43% | 61.9 -38% | 99.5 0% |
| AdobeRGB 1998 Coverage (%) | 69.9 | 40.7 -42% | 40.4 -42% | 43 -38% | 73.2 5% |
| Response Times | -90% | -97% | -130% | -213% | |
| Response Time Grey 50% / Grey 80% * (ms) | 13 ? | 20.8 ? -60% | 25.2 ? -94% | 29.6 ? -128% | 38 ? -192% |
| Response Time Black / White * (ms) | 8.4 ? | 18.4 ? -119% | 16.8 ? -100% | 19.4 ? -131% | 28 ? -233% |
| PWM Frequency (Hz) | 200 ? | ||||
| Screen | -45% | -64% | -66% | 21% | |
| Brightness middle (cd/m²) | 338 | 287.8 -15% | 278 -18% | 257 -24% | 288.9 -15% |
| Brightness (cd/m²) | 329 | 268 -19% | 262 -20% | 239 -27% | 276 -16% |
| Brightness Distribution (%) | 92 | 86 -7% | 83 -10% | 88 -4% | 92 0% |
| Black Level * (cd/m²) | 0.27 | 0.3 -11% | 0.36 -33% | 0.25 7% | 0.26 4% |
| Contrast (:1) | 1252 | 959 -23% | 772 -38% | 1028 -18% | 1111 -11% |
| Colorchecker dE 2000 * | 2.88 | 6.3 -119% | 5.74 -99% | 6.91 -140% | 1.88 35% |
| Colorchecker dE 2000 max. * | 9.35 | 21.32 -128% | 19.63 -110% | 22.27 -138% | 4.37 53% |
| Colorchecker dE 2000 calibrated * | 1.22 | 2.53 -107% | 4.7 -285% | 3.61 -196% | 0.42 66% |
| Greyscale dE 2000 * | 5 | 4 20% | 3.1 38% | 7.5 -50% | 1.4 72% |
| Gamma | 2.162 102% | 2.21 100% | 2.011 109% | 2.125 104% | 2.3 96% |
| CCT | 7497 87% | 6762 96% | 6207 105% | 6025 108% | 6634 98% |
| Total Average (Program / Settings) | -59% /
-51% | -68% /
-64% | -78% /
-69% | -63% /
-16% |
* ... smaller is better
Small color spaces and a low brightness are widespread in the 1,000-Euro segment. But this is not the case with the IdeaPad Gaming 15 15IAH7: Around 100% sRGB coverage and an average brightness of 329 cd/m² do justice to the price of the laptop.
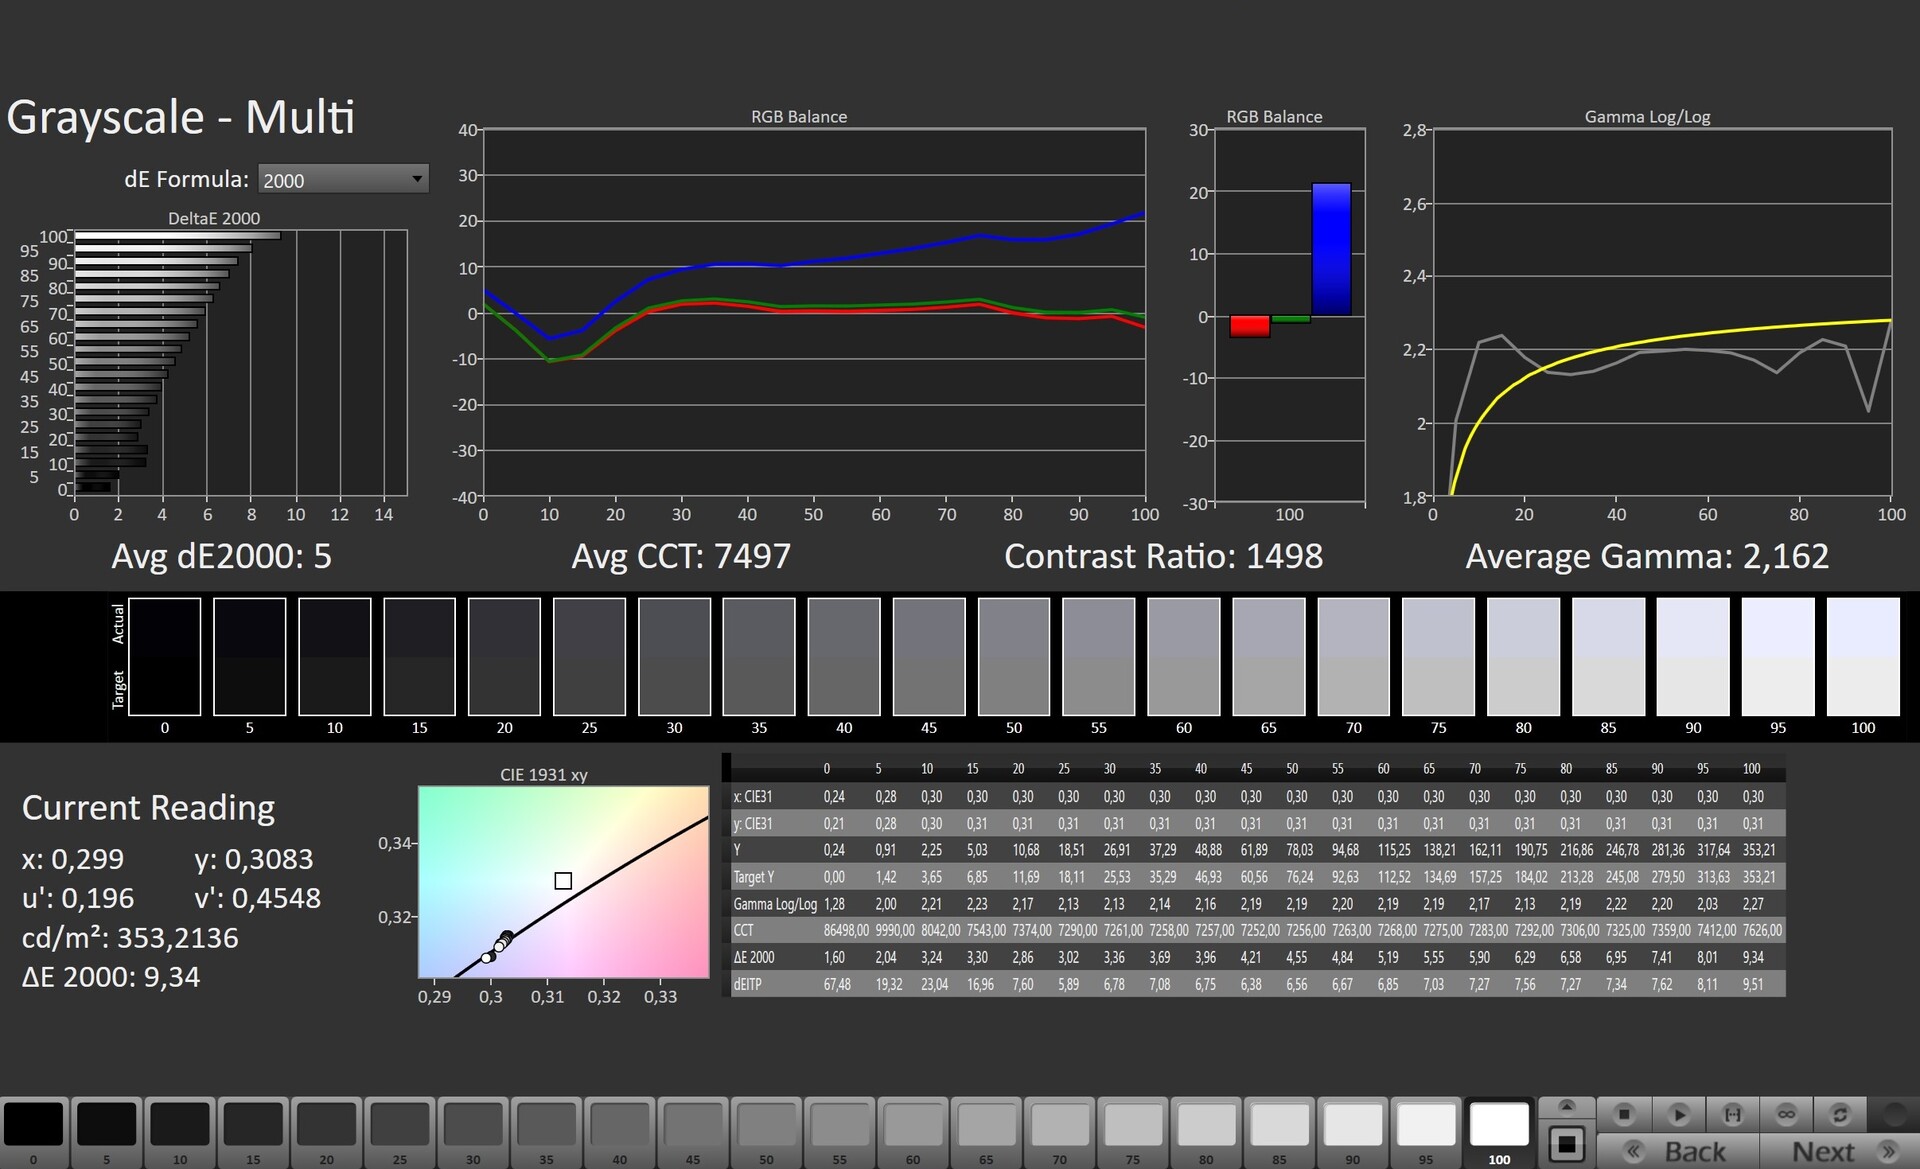
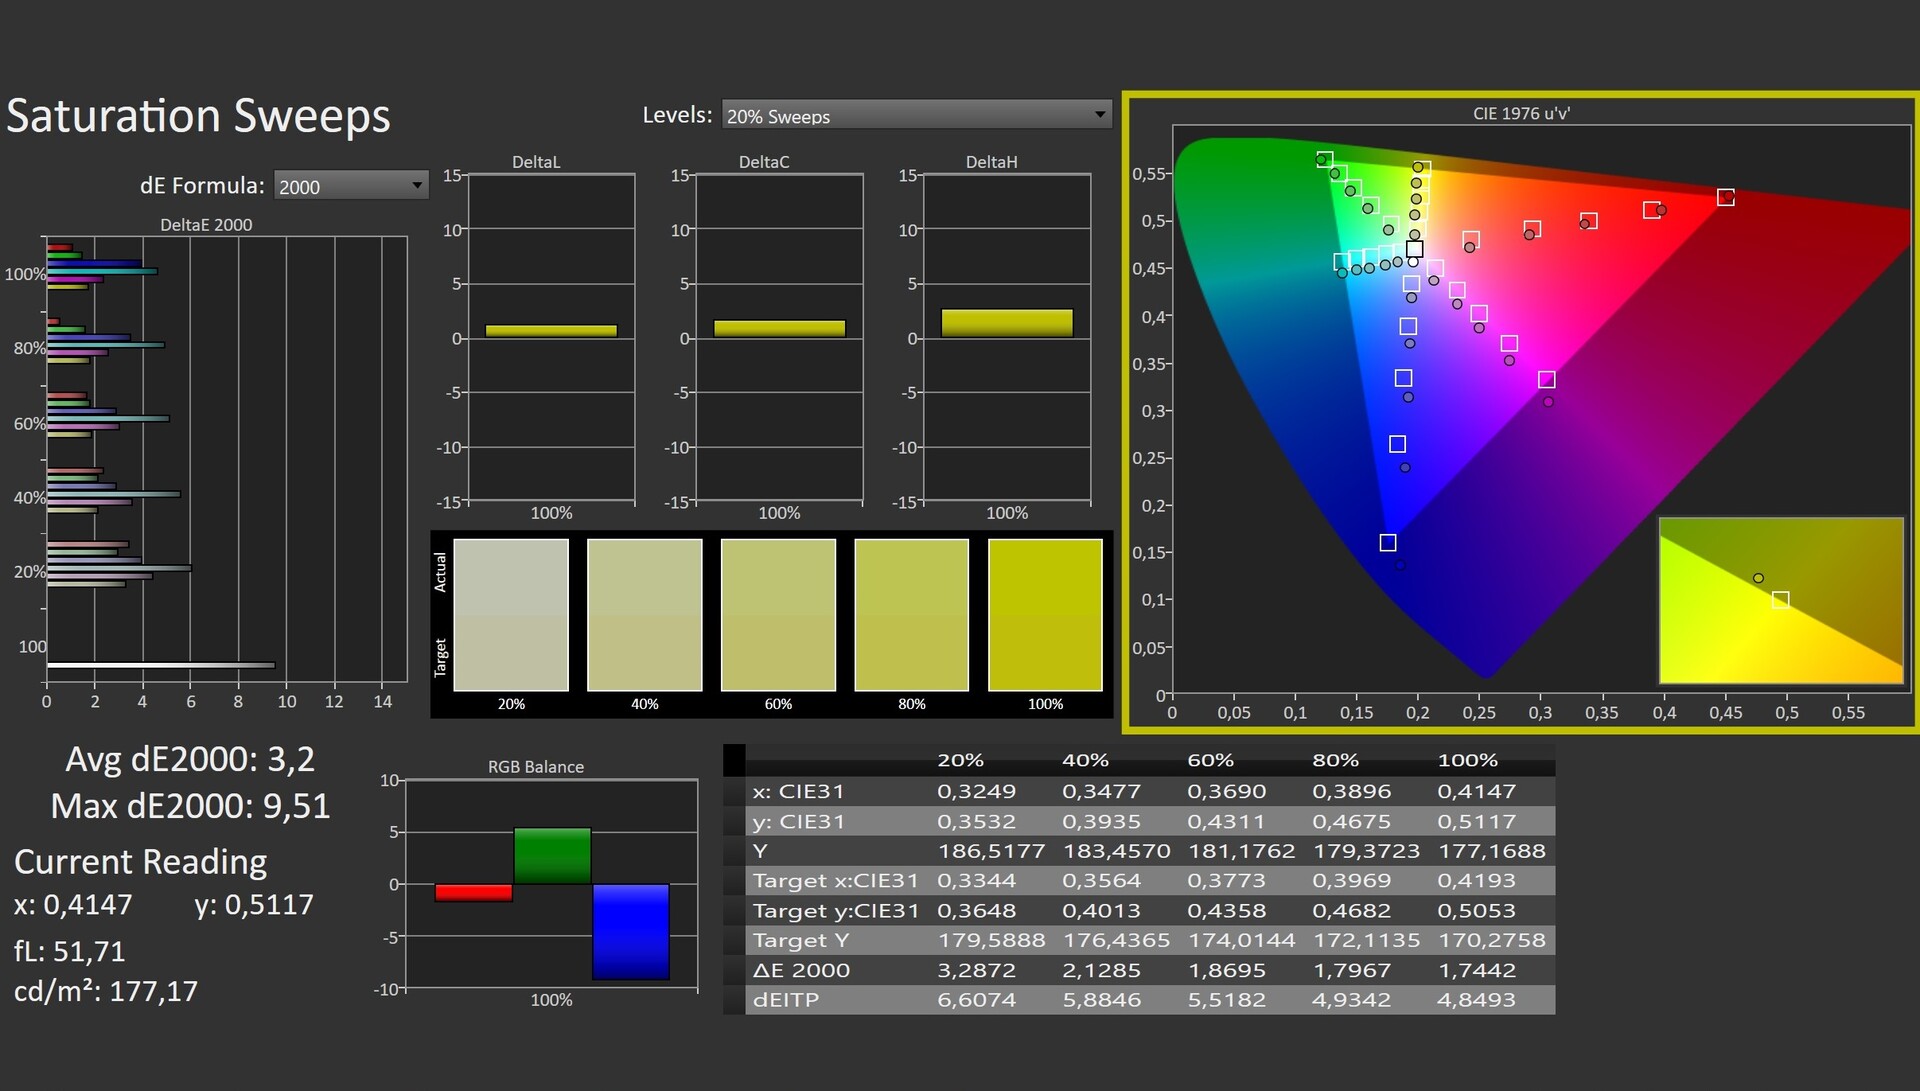
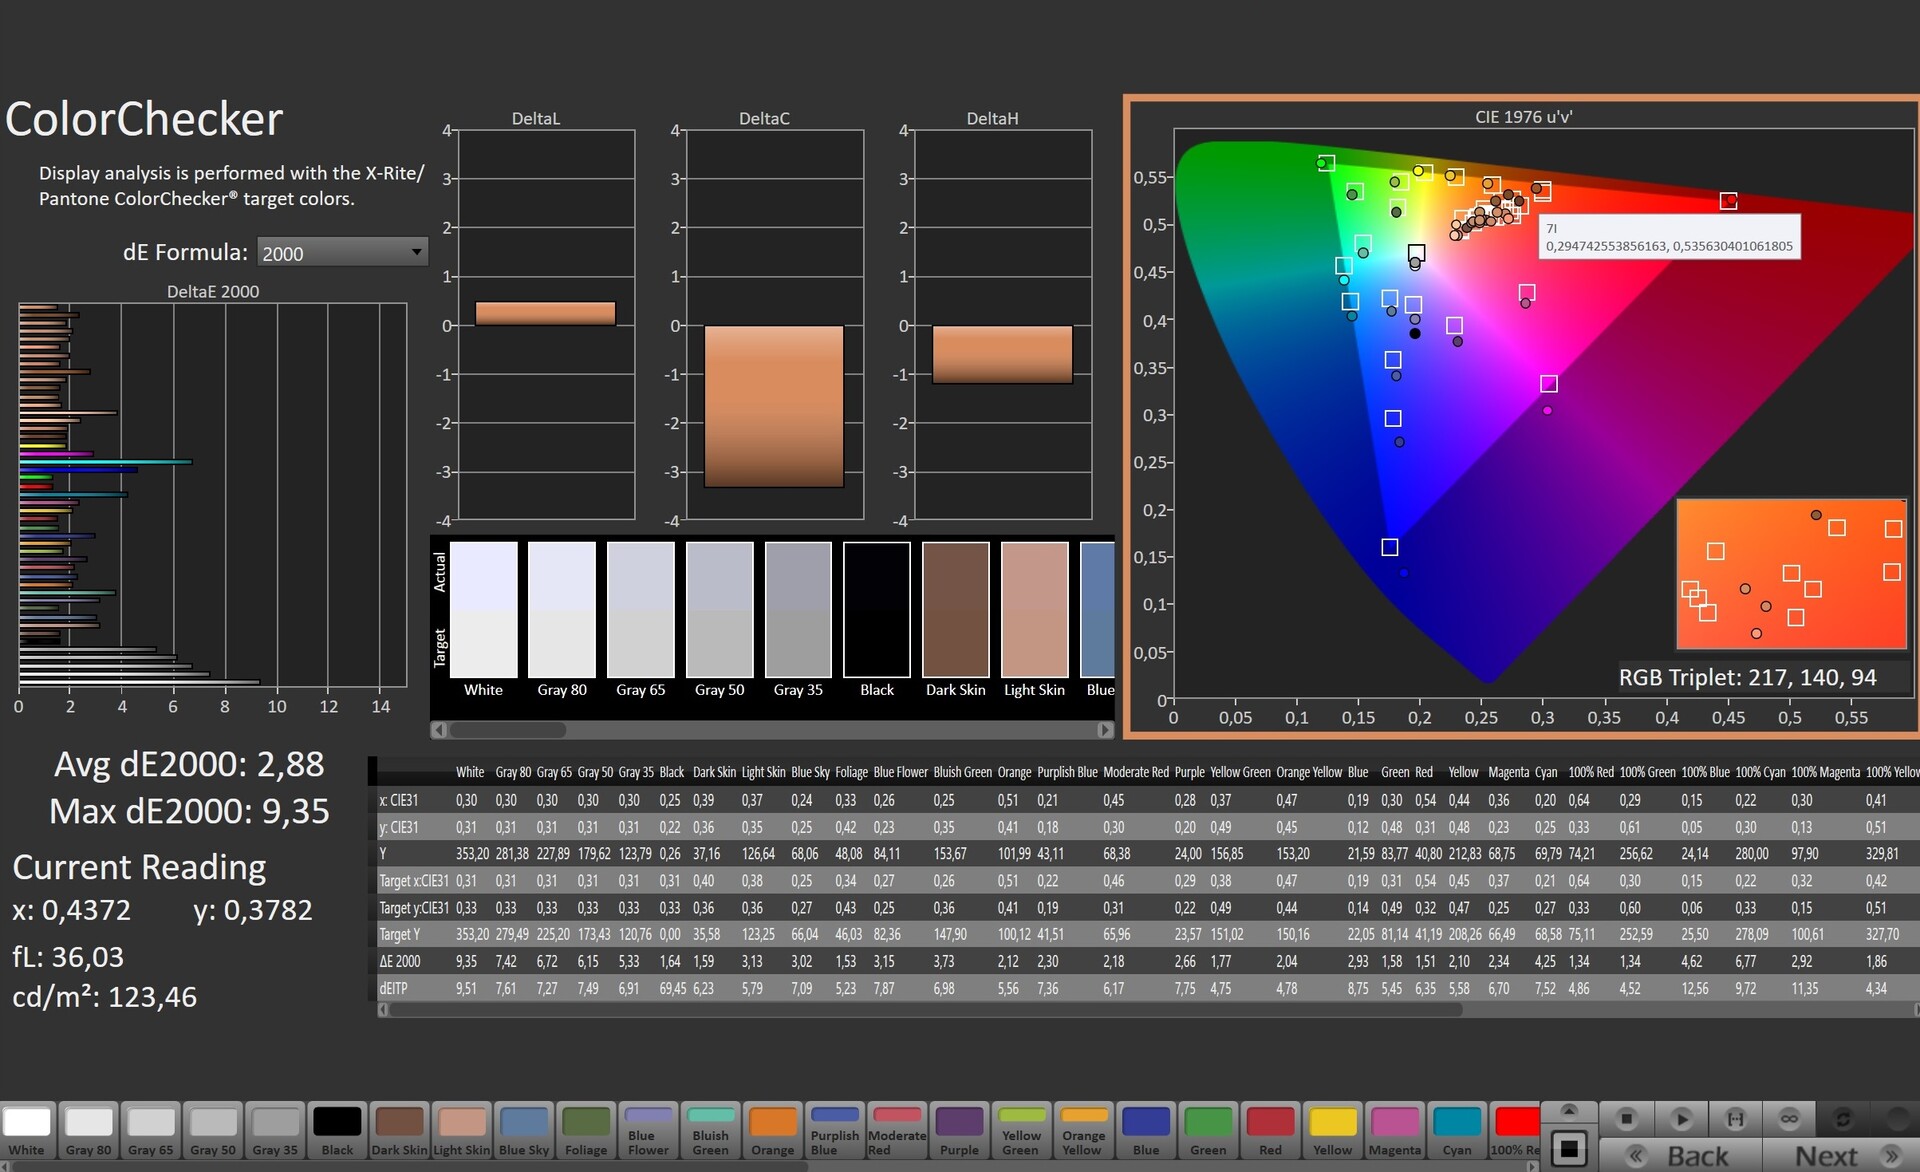
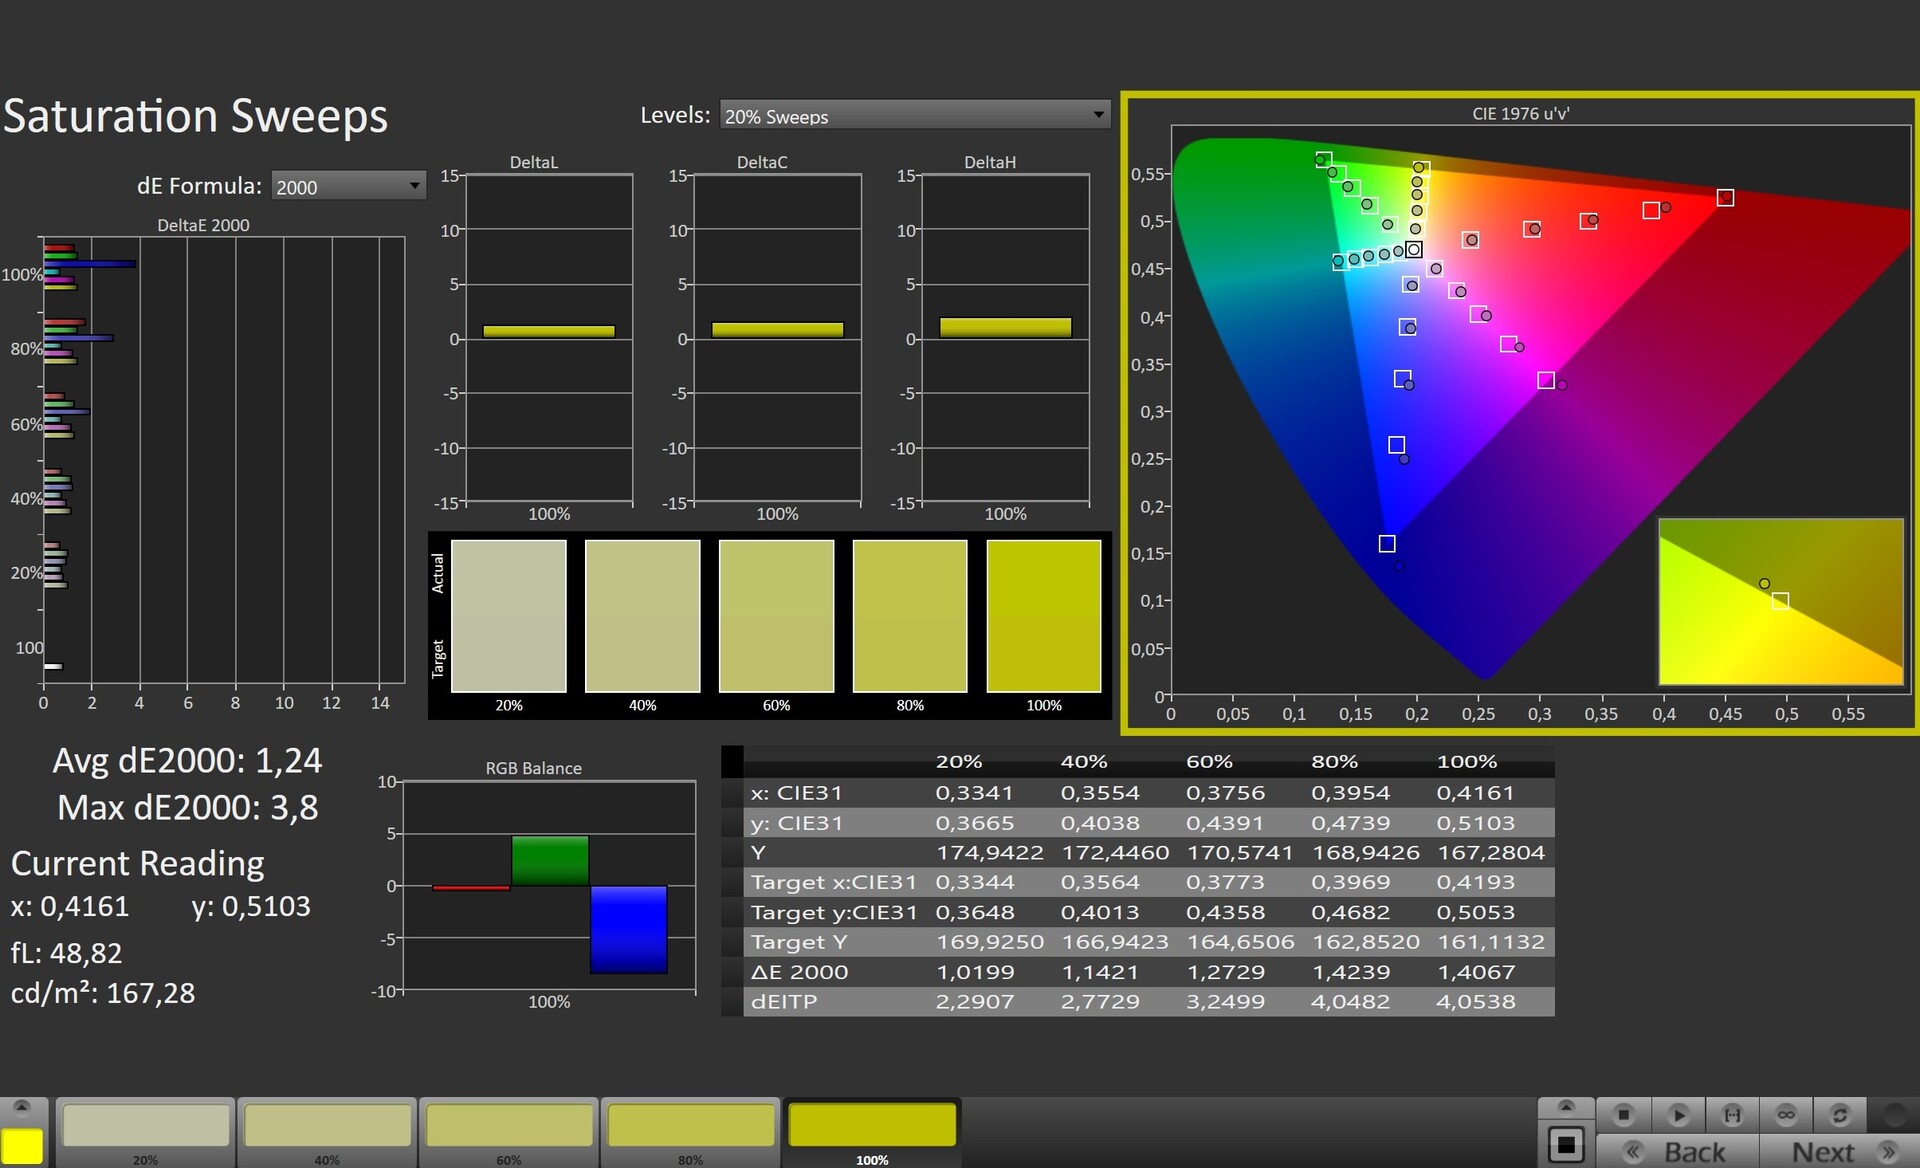
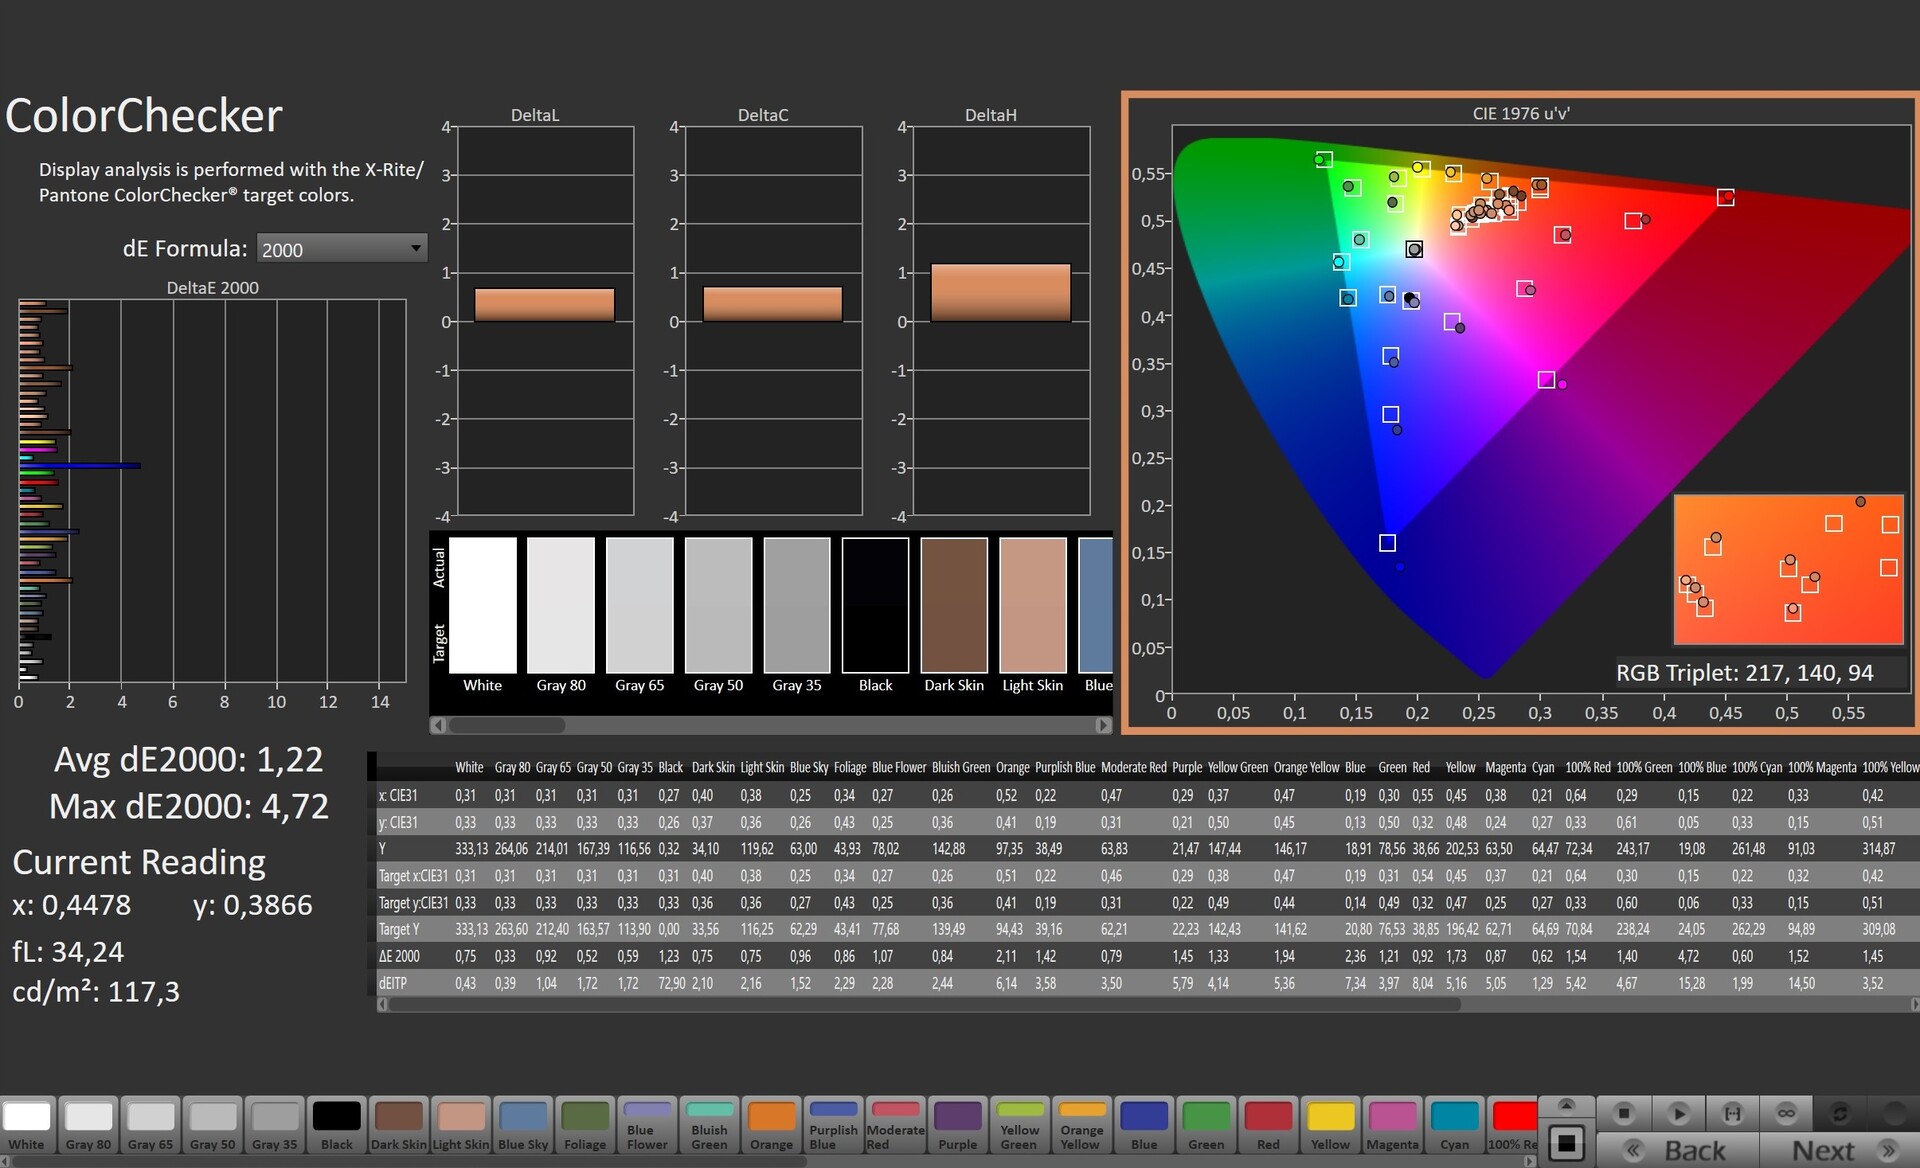
The 15-inch laptop also strikes a good figure in the remaining disciplines. A response time of 8 to 13 ms is definitely a good value. The same also goes for the contrast of 1252:1, which is also above average.
The only thing you could complain about is the color accuracy. In the state of delivery, the 165-Hz panel has a clear blue tint. However, this can be corrected with a calibration (our ICC file is linked for free download above on the right, next to the brightness distribution graphic). Our test unit doesn't show any screen bleeding or PWM flickering.
Display Response Times
| ↔ Response Time Black to White | ||
|---|---|---|
| 8.4 ms ... rise ↗ and fall ↘ combined | ↗ 4.2 ms rise | 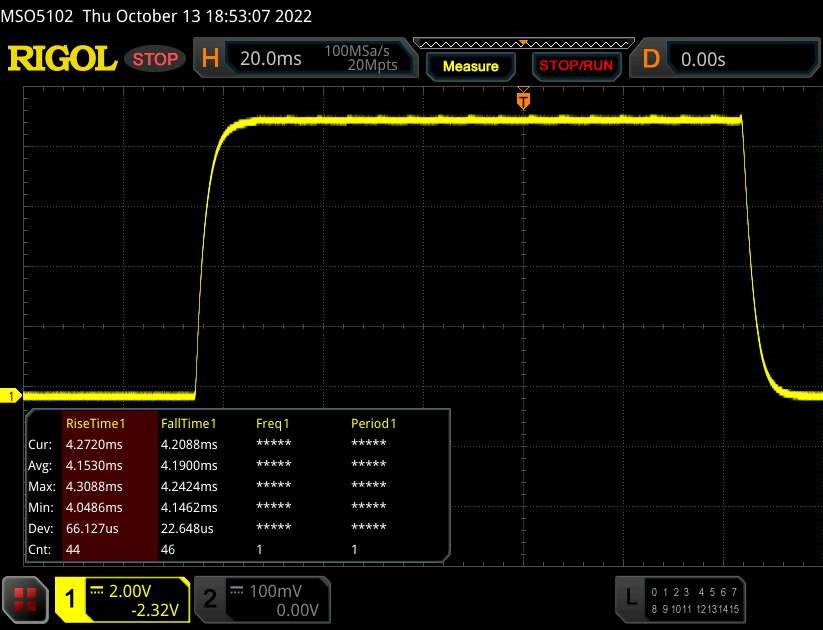 |
| ↘ 4.2 ms fall | ||
| The screen shows fast response rates in our tests and should be suited for gaming. In comparison, all tested devices range from 0.1 (minimum) to 240 (maximum) ms. » 24 % of all devices are better. This means that the measured response time is better than the average of all tested devices (19.9 ms). | ||
| ↔ Response Time 50% Grey to 80% Grey | ||
| 13 ms ... rise ↗ and fall ↘ combined | ↗ 6.3 ms rise | 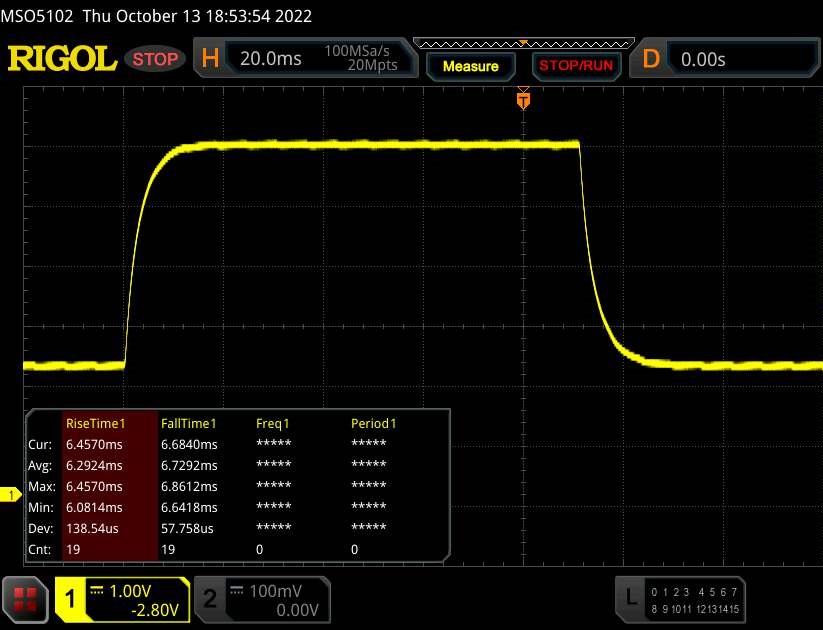 |
| ↘ 6.7 ms fall | ||
| The screen shows good response rates in our tests, but may be too slow for competitive gamers. In comparison, all tested devices range from 0.165 (minimum) to 636 (maximum) ms. » 26 % of all devices are better. This means that the measured response time is better than the average of all tested devices (31.1 ms). | ||
Screen Flickering / PWM (Pulse-Width Modulation)
| Screen flickering / PWM not detected |  | ||
In comparison: 52 % of all tested devices do not use PWM to dim the display. If PWM was detected, an average of 7798 (minimum: 5 - maximum: 343500) Hz was measured. | |||
Performance
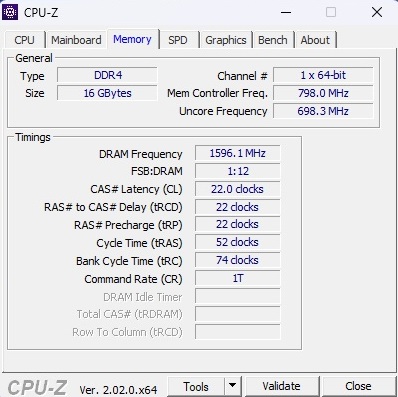
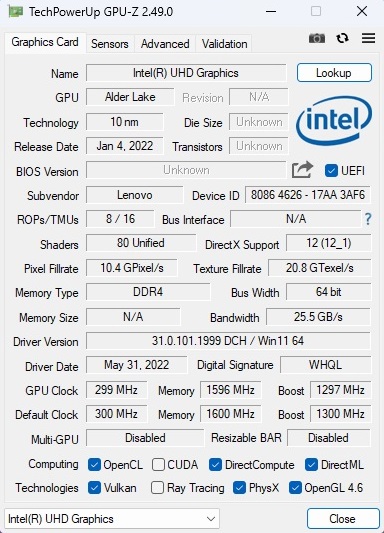
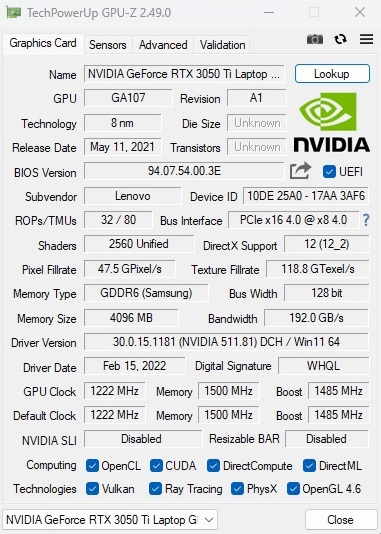
The performance of the IdeaPad Gaming 3 15IAH7 place it in the midrange. The processor with plenty of cores and 16 GB of working memory should offer sufficient reserves for future years, even though for performance reasons, Lenovo should have used dual-channel RAM instead of a single RAM module. Although the built-in M.2 SSD comes only in the 2242 format, the case still offers space for a classic 2280 SSD. The graphics card leaves mixed impressions. On one hand, the RTX 3050 Ti offers a solid price-performance ratio, but on the other hand, 4 GB of VRAM isn't very futureproof.
Test Conditions
The preinstalled Lenovo Vantage software offers dozens of setting options, of which the power mode and GPU operating mode are particularly relevant. Unless we list otherwise, all our measurements are performed with the Performance mode and the regular hybrid graphics switching activated. However, considering the low performance decrease (see chart), we would rather recommend using the balanced mode (Adjusted profile) in practice. In the Silent mode, the device operation is again significantly quieter. Despite a drop of about 30% in the frame rates, many games are still playable.


| The Witcher 3 (FHD/Ultra) | Noise level | Performance |
| Performance mode | 46 dB(A) | basis (~60 FPS) |
| Adjusted mode | 43 dB(A) | -7% (~56 FPS) |
| Silent mode | 34 dB(A) | -30% (~42 FPS) |
Processor
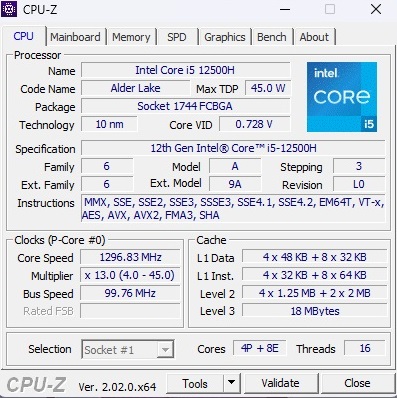
The Core i5-12500H is a 12-core model from Intel's Alder Lake generation that includes 4 Performance cores (incl. hyperthreading) and 8 Efficiency cores (without hyperthreading) and is specified at a 45 Watt TDP. In the CPU tests, the 10-nm chip delivers a very good performance. Since the performance also remains stable constantly, the IdeaPad Gaming 3 15IAH7 even places ahead of the Core i7-12700H of the Dell Inspiron 16 Plus after a while in the Cinebench loop, achieving the top spot. The Ryzen CPUs of the other competitors (R5 5600H, R5 6600H & R7 5800H) fall slightly behind.
Cinebench R15 Multi Constant Load Test
* ... smaller is better
AIDA64: FP32 Ray-Trace | FPU Julia | CPU SHA3 | CPU Queen | FPU SinJulia | FPU Mandel | CPU AES | CPU ZLib | FP64 Ray-Trace | CPU PhotoWorxx
| Performance rating | |
| Average of class Gaming | |
| Dell G15 5515 | |
| Dell Inspiron 16 Plus 7620 | |
| Lenovo IdeaPad Gaming 3 15IAH7 | |
| Average Intel Core i5-12500H | |
| Lenovo IdeaPad Gaming 3 15ARH7 | |
| HP Victus 16-e0145ng | |
| AIDA64 / FP32 Ray-Trace | |
| Average of class Gaming (10227 - 85542, n=110, last 2 years) | |
| Dell G15 5515 | |
| Lenovo IdeaPad Gaming 3 15IAH7 | |
| Dell Inspiron 16 Plus 7620 | |
| Lenovo IdeaPad Gaming 3 15ARH7 | |
| Average Intel Core i5-12500H (6851 - 13947, n=9) | |
| HP Victus 16-e0145ng | |
| AIDA64 / FPU Julia | |
| Average of class Gaming (51376 - 238426, n=110, last 2 years) | |
| Dell G15 5515 | |
| Lenovo IdeaPad Gaming 3 15ARH7 | |
| HP Victus 16-e0145ng | |
| Lenovo IdeaPad Gaming 3 15IAH7 | |
| Dell Inspiron 16 Plus 7620 | |
| Average Intel Core i5-12500H (29874 - 68178, n=9) | |
| AIDA64 / CPU SHA3 | |
| Average of class Gaming (2180 - 9817, n=110, last 2 years) | |
| Lenovo IdeaPad Gaming 3 15IAH7 | |
| Dell G15 5515 | |
| Average Intel Core i5-12500H (2287 - 3337, n=9) | |
| Dell Inspiron 16 Plus 7620 | |
| Lenovo IdeaPad Gaming 3 15ARH7 | |
| HP Victus 16-e0145ng | |
| AIDA64 / CPU Queen | |
| Average of class Gaming (49785 - 173351, n=101, last 2 years) | |
| Dell G15 5515 | |
| Dell Inspiron 16 Plus 7620 | |
| Lenovo IdeaPad Gaming 3 15IAH7 | |
| Average Intel Core i5-12500H (77935 - 80703, n=9) | |
| Lenovo IdeaPad Gaming 3 15ARH7 | |
| HP Victus 16-e0145ng | |
| AIDA64 / FPU SinJulia | |
| Average of class Gaming (4424 - 33636, n=110, last 2 years) | |
| Dell G15 5515 | |
| Lenovo IdeaPad Gaming 3 15ARH7 | |
| HP Victus 16-e0145ng | |
| Dell Inspiron 16 Plus 7620 | |
| Lenovo IdeaPad Gaming 3 15IAH7 | |
| Average Intel Core i5-12500H (6590 - 7431, n=9) | |
| AIDA64 / FPU Mandel | |
| Average of class Gaming (25115 - 128721, n=110, last 2 years) | |
| Dell G15 5515 | |
| Lenovo IdeaPad Gaming 3 15ARH7 | |
| HP Victus 16-e0145ng | |
| Lenovo IdeaPad Gaming 3 15IAH7 | |
| Dell Inspiron 16 Plus 7620 | |
| Average Intel Core i5-12500H (18252 - 34041, n=9) | |
| AIDA64 / CPU AES | |
| Dell G15 5515 | |
| Lenovo IdeaPad Gaming 3 15IAH7 | |
| Average of class Gaming (39258 - 247074, n=110, last 2 years) | |
| Lenovo IdeaPad Gaming 3 15ARH7 | |
| Average Intel Core i5-12500H (50298 - 111567, n=9) | |
| Dell Inspiron 16 Plus 7620 | |
| HP Victus 16-e0145ng | |
| AIDA64 / CPU ZLib | |
| Average of class Gaming (574 - 2531, n=110, last 2 years) | |
| Dell Inspiron 16 Plus 7620 | |
| Lenovo IdeaPad Gaming 3 15IAH7 | |
| Average Intel Core i5-12500H (746 - 924, n=9) | |
| Dell G15 5515 | |
| Lenovo IdeaPad Gaming 3 15ARH7 | |
| HP Victus 16-e0145ng | |
| AIDA64 / FP64 Ray-Trace | |
| Average of class Gaming (5509 - 45446, n=110, last 2 years) | |
| Dell G15 5515 | |
| Lenovo IdeaPad Gaming 3 15IAH7 | |
| Dell Inspiron 16 Plus 7620 | |
| Lenovo IdeaPad Gaming 3 15ARH7 | |
| Average Intel Core i5-12500H (3848 - 7405, n=9) | |
| HP Victus 16-e0145ng | |
| AIDA64 / CPU PhotoWorxx | |
| Average of class Gaming (12271 - 89891, n=110, last 2 years) | |
| Dell Inspiron 16 Plus 7620 | |
| Average Intel Core i5-12500H (13686 - 43813, n=9) | |
| HP Victus 16-e0145ng | |
| Lenovo IdeaPad Gaming 3 15ARH7 | |
| Dell G15 5515 | |
| Lenovo IdeaPad Gaming 3 15IAH7 | |
System Performance
According to PCMark 10, the system performance is also respectable. With 6,755 points, it is only beaten by the Dell Inspiron 16 Plus. Subjectively, the operating system responds comfortably fast.
CrossMark: Overall | Productivity | Creativity | Responsiveness
| PCMark 10 / Score | |
| Average of class Gaming (5828 - 11574, n=96, last 2 years) | |
| Dell Inspiron 16 Plus 7620 | |
| Lenovo IdeaPad Gaming 3 15IAH7 | |
| Lenovo IdeaPad Gaming 3 15ARH7 | |
| Dell G15 5515 | |
| HP Victus 16-e0145ng | |
| PCMark 10 / Essentials | |
| Average of class Gaming (8810 - 12600, n=100, last 2 years) | |
| Dell Inspiron 16 Plus 7620 | |
| Lenovo IdeaPad Gaming 3 15IAH7 | |
| HP Victus 16-e0145ng | |
| Dell G15 5515 | |
| Lenovo IdeaPad Gaming 3 15ARH7 | |
| PCMark 10 / Productivity | |
| Average of class Gaming (6845 - 18766, n=98, last 2 years) | |
| Lenovo IdeaPad Gaming 3 15IAH7 | |
| Dell Inspiron 16 Plus 7620 | |
| Lenovo IdeaPad Gaming 3 15ARH7 | |
| Dell G15 5515 | |
| HP Victus 16-e0145ng | |
| PCMark 10 / Digital Content Creation | |
| Average of class Gaming (7602 - 19657, n=98, last 2 years) | |
| Dell Inspiron 16 Plus 7620 | |
| Lenovo IdeaPad Gaming 3 15IAH7 | |
| HP Victus 16-e0145ng | |
| Dell G15 5515 | |
| Lenovo IdeaPad Gaming 3 15ARH7 | |
| CrossMark / Overall | |
| Average of class Gaming (1366 - 2409, n=98, last 2 years) | |
| Dell Inspiron 16 Plus 7620 | |
| Lenovo IdeaPad Gaming 3 15ARH7 | |
| CrossMark / Productivity | |
| Average of class Gaming (1386 - 2254, n=98, last 2 years) | |
| Dell Inspiron 16 Plus 7620 | |
| Lenovo IdeaPad Gaming 3 15ARH7 | |
| CrossMark / Creativity | |
| Average of class Gaming (1343 - 2729, n=98, last 2 years) | |
| Dell Inspiron 16 Plus 7620 | |
| Lenovo IdeaPad Gaming 3 15ARH7 | |
| CrossMark / Responsiveness | |
| Average of class Gaming (1226 - 2334, n=98, last 2 years) | |
| Dell Inspiron 16 Plus 7620 | |
| Lenovo IdeaPad Gaming 3 15ARH7 | |
| PCMark 10 Score | 6755 points | |
Help | ||
| AIDA64 / Memory Copy | |
| Average of class Gaming (21750 - 129946, n=110, last 2 years) | |
| Dell Inspiron 16 Plus 7620 | |
| Average Intel Core i5-12500H (23850 - 66598, n=9) | |
| HP Victus 16-e0145ng | |
| Dell G15 5515 | |
| Lenovo IdeaPad Gaming 3 15ARH7 | |
| Lenovo IdeaPad Gaming 3 15IAH7 | |
| AIDA64 / Memory Read | |
| Average of class Gaming (22956 - 118858, n=110, last 2 years) | |
| Dell Inspiron 16 Plus 7620 | |
| Average Intel Core i5-12500H (24879 - 68013, n=9) | |
| HP Victus 16-e0145ng | |
| Dell G15 5515 | |
| Lenovo IdeaPad Gaming 3 15ARH7 | |
| Lenovo IdeaPad Gaming 3 15IAH7 | |
| AIDA64 / Memory Write | |
| Average of class Gaming (22297 - 135096, n=110, last 2 years) | |
| Dell Inspiron 16 Plus 7620 | |
| Average Intel Core i5-12500H (23543 - 58797, n=9) | |
| HP Victus 16-e0145ng | |
| Dell G15 5515 | |
| Lenovo IdeaPad Gaming 3 15ARH7 | |
| Lenovo IdeaPad Gaming 3 15IAH7 | |
| AIDA64 / Memory Latency | |
| Average of class Gaming (75.3 - 259, n=110, last 2 years) | |
| Average Intel Core i5-12500H (83.8 - 114.7, n=9) | |
| Dell Inspiron 16 Plus 7620 | |
| Lenovo IdeaPad Gaming 3 15IAH7 | |
| Lenovo IdeaPad Gaming 3 15ARH7 | |
| Dell G15 5515 | |
| HP Victus 16-e0145ng | |
* ... smaller is better
DPC Latencies
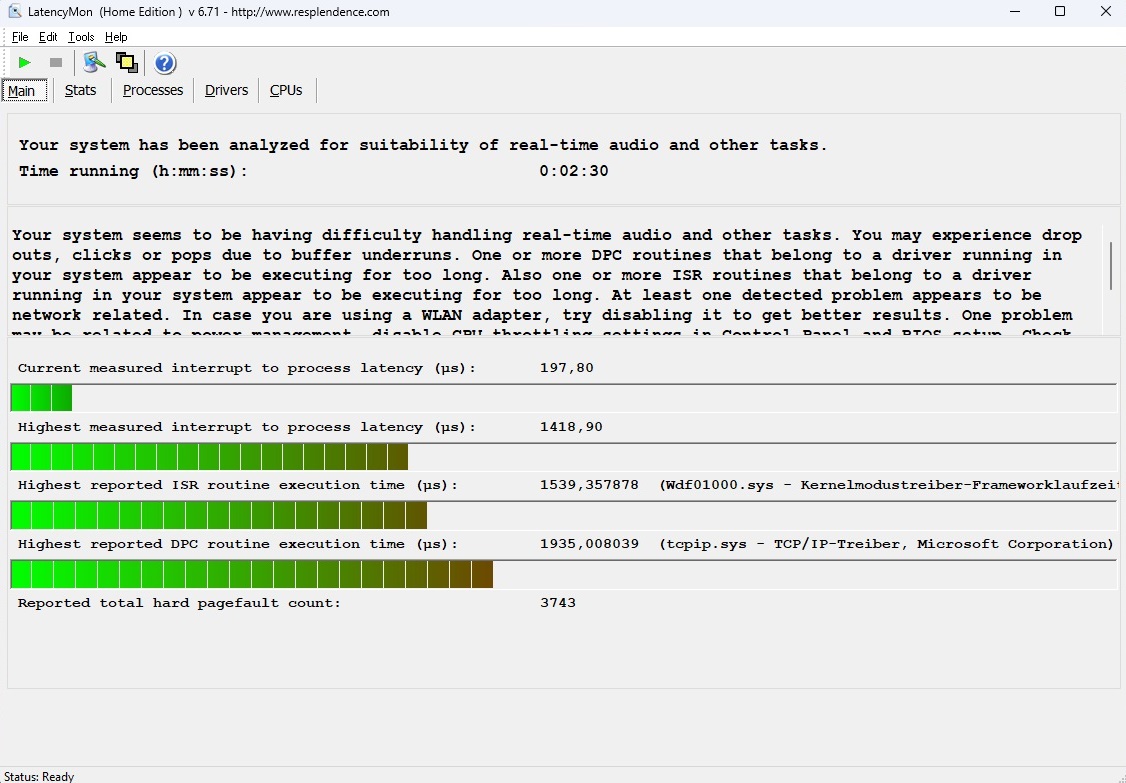
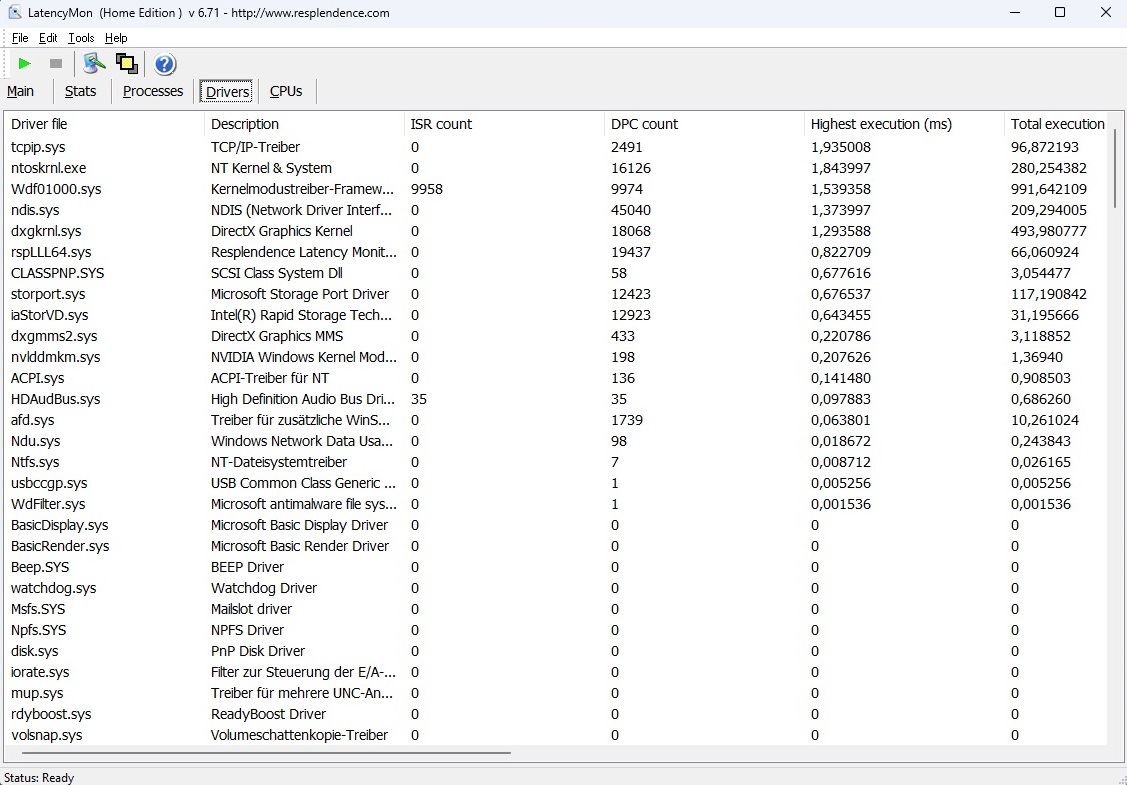
In the latency test, the 15-inch laptop doesn't do so well. The LatencyMon tool mentions potential problems with real-time audio and video processing. However, only very few users should be affected by these application scenarios.
| DPC Latencies / LatencyMon - interrupt to process latency (max), Web, Youtube, Prime95 | |
| Lenovo IdeaPad Gaming 3 15IAH7 | |
| Dell Inspiron 16 Plus 7620 | |
| HP Victus 16-e0145ng | |
| Lenovo IdeaPad Gaming 3 15ARH7 | |
| Dell G15 5515 | |
* ... smaller is better
Storage Solution
The SSD performance ends up in the middle of our comparison field. The 512-GB model from Intel (660p) is neither particularly fast nor particularly slow for an NVMe drive. It is great that - like the CPU speed - the SSD speed also remains relatively constant.

* ... smaller is better
Constant Performance Reading: DiskSpd Read Loop, Queue Depth 8
Graphics Card
The performance of Nvidia's Ampere GPUs depends to a large extent on the adjusted TGP. Lenovo decided for a relatively high value in the IdeaPad Gaming 3, which benefits the benchmark results. 85 Watts are quite a lot for an RTX 3050 Ti. The 15-inch laptop does correspondingly well in the 3DMarks benchmarks. If you add all the values, the RTX 3050 Ti is almost 25% faster than the current average of this graphics card. To some extent, this makes up for the fact that you can already get devices with the RTX 3060, which includes 6 instead of 4 GB VRAM, in the 1000 Euro segment.
| 3DMark 11 Performance | 19254 points | |
| 3DMark Cloud Gate Standard Score | 48874 points | |
| 3DMark Fire Strike Score | 14086 points | |
| 3DMark Time Spy Score | 6213 points | |
Help | ||
* ... smaller is better
Gaming Performance
The positive trend from the synthetic graphics tests continues in our gaming test runs. Although the performance in some games can suffer considerably from the single channel RAM (which is why we would recommend switching to 2x 8 GB), games that are not RAM heavy also run significantly faster than on an RTX 3050 Ti with a lower TGP.
| The Witcher 3 | |
| 1920x1080 High Graphics & Postprocessing (Nvidia HairWorks Off) | |
| Average of class Gaming (181 - 341, n=3, last 2 years) | |
| Lenovo IdeaPad Gaming 3 15IAH7 | |
| Dell Inspiron 16 Plus 7620 | |
| Lenovo IdeaPad Gaming 3 15ARH7 | |
| HP Victus 16-e0145ng | |
| Dell G15 5515 | |
| Average NVIDIA GeForce RTX 3050 Ti Laptop GPU (30 - 110, n=26) | |
| 1920x1080 Ultra Graphics & Postprocessing (HBAO+) | |
| Average of class Gaming (95 - 240, n=8, last 2 years) | |
| Lenovo IdeaPad Gaming 3 15IAH7 | |
| Dell Inspiron 16 Plus 7620 | |
| Dell G15 5515 | |
| Lenovo IdeaPad Gaming 3 15ARH7 | |
| HP Victus 16-e0145ng | |
| Average NVIDIA GeForce RTX 3050 Ti Laptop GPU (19 - 58.5, n=29) | |
We notice no conspicuous behaviors that stood out in our 60-minute constant test with The Witcher 3. Basically, the IdeaPad Gaming 3 15IAH7 is able to handle almost all the modern games at high to maximum details in the native resolution of 1920 x 1080 pixels, as long as you make do without ray tracing (where the RTX 3050 Ti shows some considerable weaknesses).
The Witcher 3 FPS Chart
| low | med. | high | ultra | |
|---|---|---|---|---|
| GTA V (2015) | 160.7 | 130.6 | 73.5 | |
| The Witcher 3 (2015) | 173 | 110 | 58.5 | |
| Dota 2 Reborn (2015) | 145.9 | 127.3 | 113.8 | 107.8 |
| Final Fantasy XV Benchmark (2018) | 81.5 | 58.8 | ||
| X-Plane 11.11 (2018) | 109.9 | 98.1 | 81.1 | |
| Strange Brigade (2018) | 145.5 | 117.3 | 101.3 | |
| Ghostwire Tokyo (2022) | 79.5 | 76.8 | 75.9 | |
| Tiny Tina's Wonderlands (2022) | 92.1 | 67.2 | 51.7 | |
| Vampire Bloodhunt (2022) | 111.8 | 110.9 | 106.1 | |
| F1 22 (2022) | 111 | 92 | 32 | |
| The Quarry (2022) | 69.7 | 58.3 | 45.8 |
Emissions
Noise Emissions
In Performance mode, the 15-inch laptop isn't very quiet. Already during idle operation, you can hear a lot of fan noise at 29 to 32 dB(A). Under load, the device produces a massive volume of noise at 42 to 54 dB(A), although other gaming laptops such as the Victus 16 get similarly loud. However, thanks to the two other power modes, the device can easily and quickly be quieted.
Noise level
| Idle |
| 29 / 30 / 32 dB(A) |
| Load |
| 42 / 54 dB(A) |
 | ||
30 dB silent 40 dB(A) audible 50 dB(A) loud |
||
min: | ||
| Lenovo IdeaPad Gaming 3 15IAH7 GeForce RTX 3050 Ti Laptop GPU, i5-12500H | Lenovo IdeaPad Gaming 3 15ARH7 GeForce RTX 3050 4GB Laptop GPU, R5 6600H | Dell G15 5515 GeForce RTX 3050 Ti Laptop GPU, R7 5800H | HP Victus 16-e0145ng GeForce RTX 3050 Ti Laptop GPU, R5 5600H | Dell Inspiron 16 Plus 7620 GeForce RTX 3050 Ti Laptop GPU, i7-12700H | |
|---|---|---|---|---|---|
| Noise | 11% | 7% | 0% | 4% | |
| off / environment * (dB) | 25 | 23.3 7% | 24 4% | 26 -4% | 23.3 7% |
| Idle Minimum * (dB) | 29 | 23.8 18% | 25 14% | 26 10% | 25.7 11% |
| Idle Average * (dB) | 30 | 23.8 21% | 26 13% | 28 7% | 26.1 13% |
| Idle Maximum * (dB) | 32 | 27.2 15% | 30 6% | 34 -6% | 30.6 4% |
| Load Average * (dB) | 42 | 34.8 17% | 44 -5% | 44 -5% | 46.2 -10% |
| Witcher 3 ultra * (dB) | 46 | 49.3 -7% | 44 4% | 48 -4% | 49.2 -7% |
| Load Maximum * (dB) | 54 | 49.4 9% | 48 11% | 53 2% | 49.4 9% |
* ... smaller is better
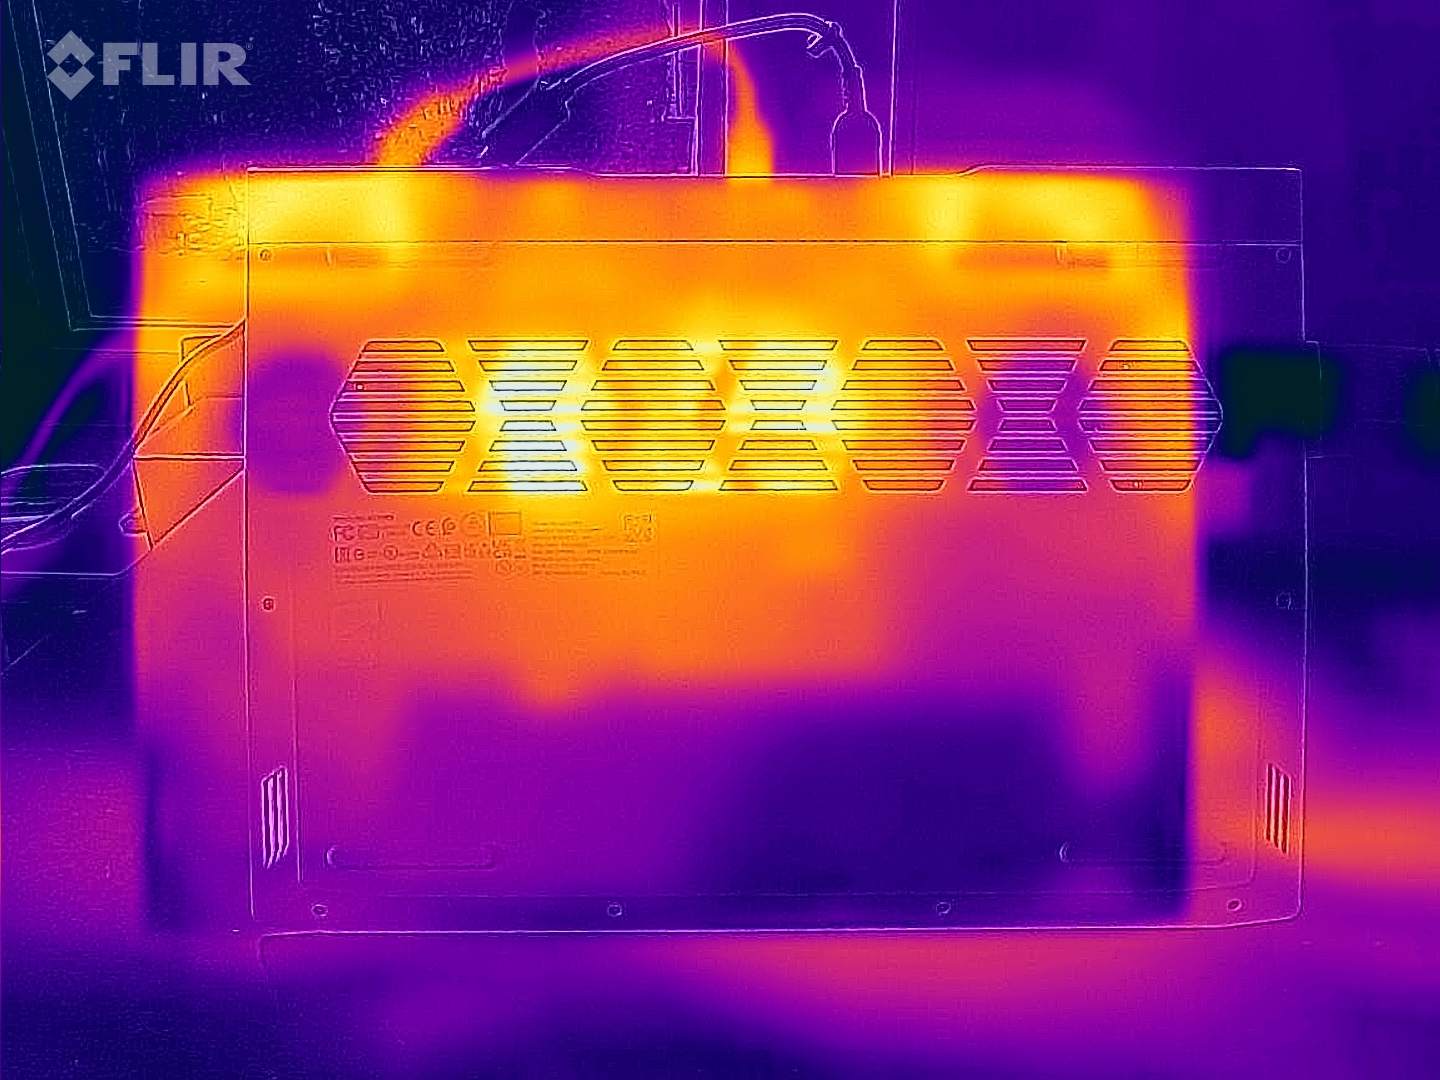
Temperatures
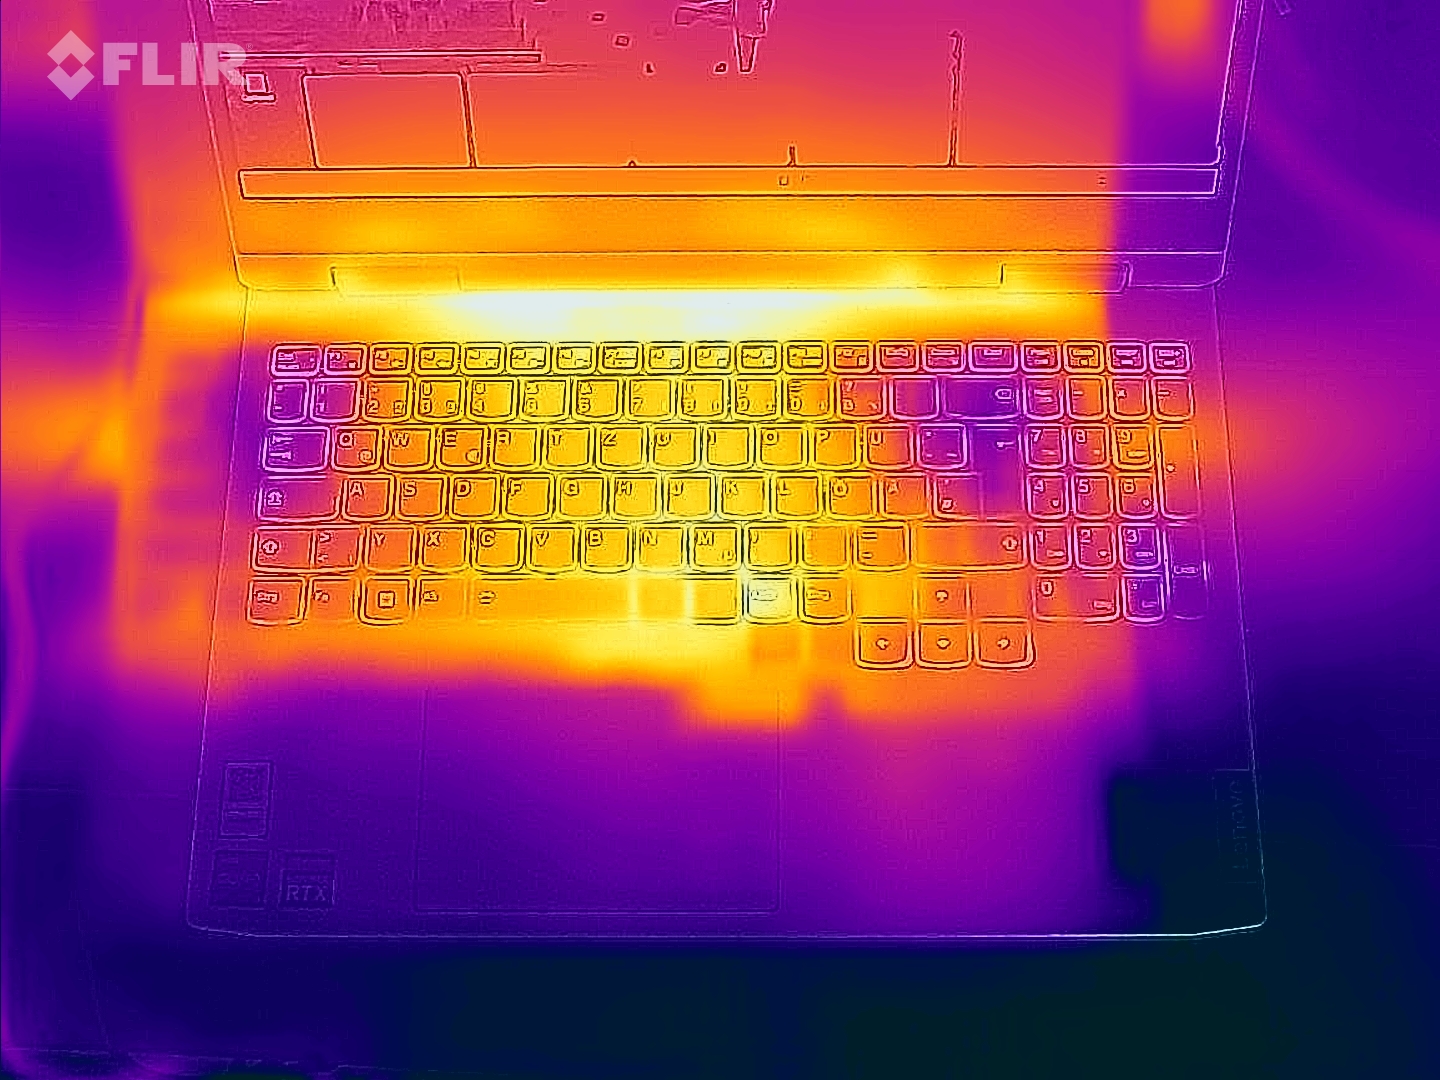
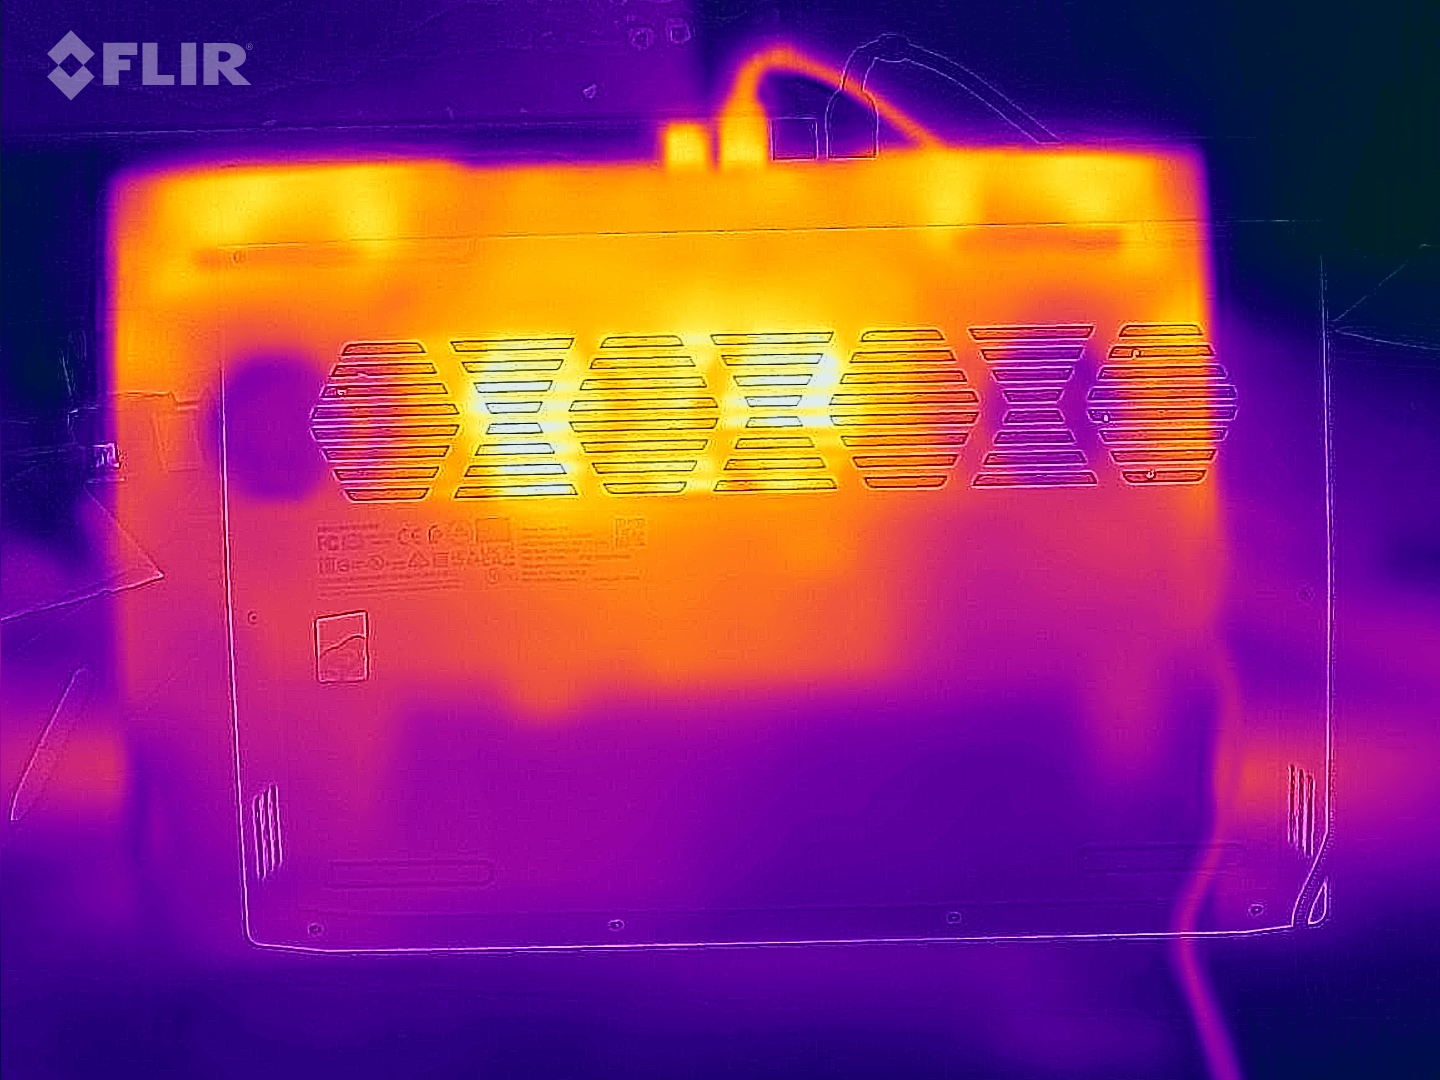
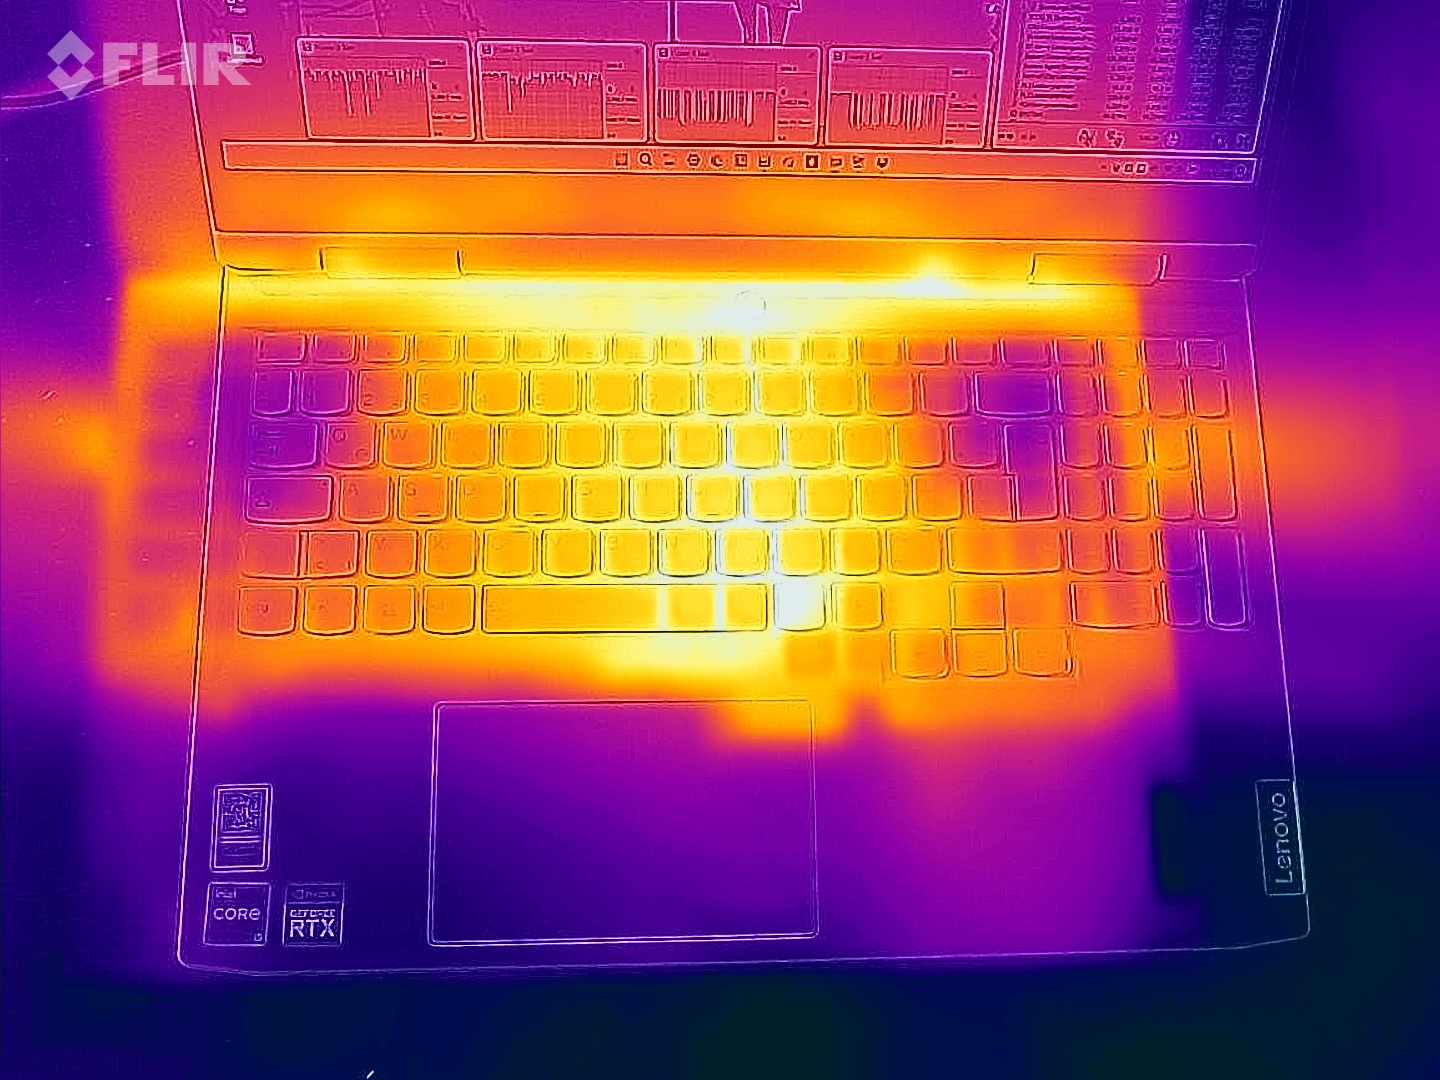
The temperature development is also typical for a gaming laptop. While the Lenovo device remains comfortably cool during idle operation, the temperatures reach up to 47 °C (~117 °F) on top and 52 °C (~126 °F) on the bottom during 3D operation. So you shouldn't try gaming with the laptop on your lap.
(-) The maximum temperature on the upper side is 47 °C / 117 F, compared to the average of 40.4 °C / 105 F, ranging from 21.2 to 68.8 °C for the class Gaming.
(-) The bottom heats up to a maximum of 52 °C / 126 F, compared to the average of 43.2 °C / 110 F
(+) In idle usage, the average temperature for the upper side is 24.2 °C / 76 F, compared to the device average of 33.9 °C / 93 F.
(-) Playing The Witcher 3, the average temperature for the upper side is 39.2 °C / 103 F, compared to the device average of 33.9 °C / 93 F.
(±) The palmrests and touchpad can get very hot to the touch with a maximum of 37 °C / 98.6 F.
(-) The average temperature of the palmrest area of similar devices was 28.8 °C / 83.8 F (-8.2 °C / -14.8 F).
| Lenovo IdeaPad Gaming 3 15IAH7 GeForce RTX 3050 Ti Laptop GPU, i5-12500H | Lenovo IdeaPad Gaming 3 15ARH7 GeForce RTX 3050 4GB Laptop GPU, R5 6600H | Dell G15 5515 GeForce RTX 3050 Ti Laptop GPU, R7 5800H | HP Victus 16-e0145ng GeForce RTX 3050 Ti Laptop GPU, R5 5600H | Dell Inspiron 16 Plus 7620 GeForce RTX 3050 Ti Laptop GPU, i7-12700H | |
|---|---|---|---|---|---|
| Heat | -3% | -3% | -25% | -8% | |
| Maximum Upper Side * (°C) | 47 | 47.6 -1% | 50 -6% | 54 -15% | 46 2% |
| Maximum Bottom * (°C) | 52 | 46.6 10% | 49 6% | 47 10% | 45.8 12% |
| Idle Upper Side * (°C) | 25 | 27.2 -9% | 26 -4% | 41 -64% | 29.2 -17% |
| Idle Bottom * (°C) | 24 | 27.2 -13% | 26 -8% | 31 -29% | 31 -29% |
* ... smaller is better
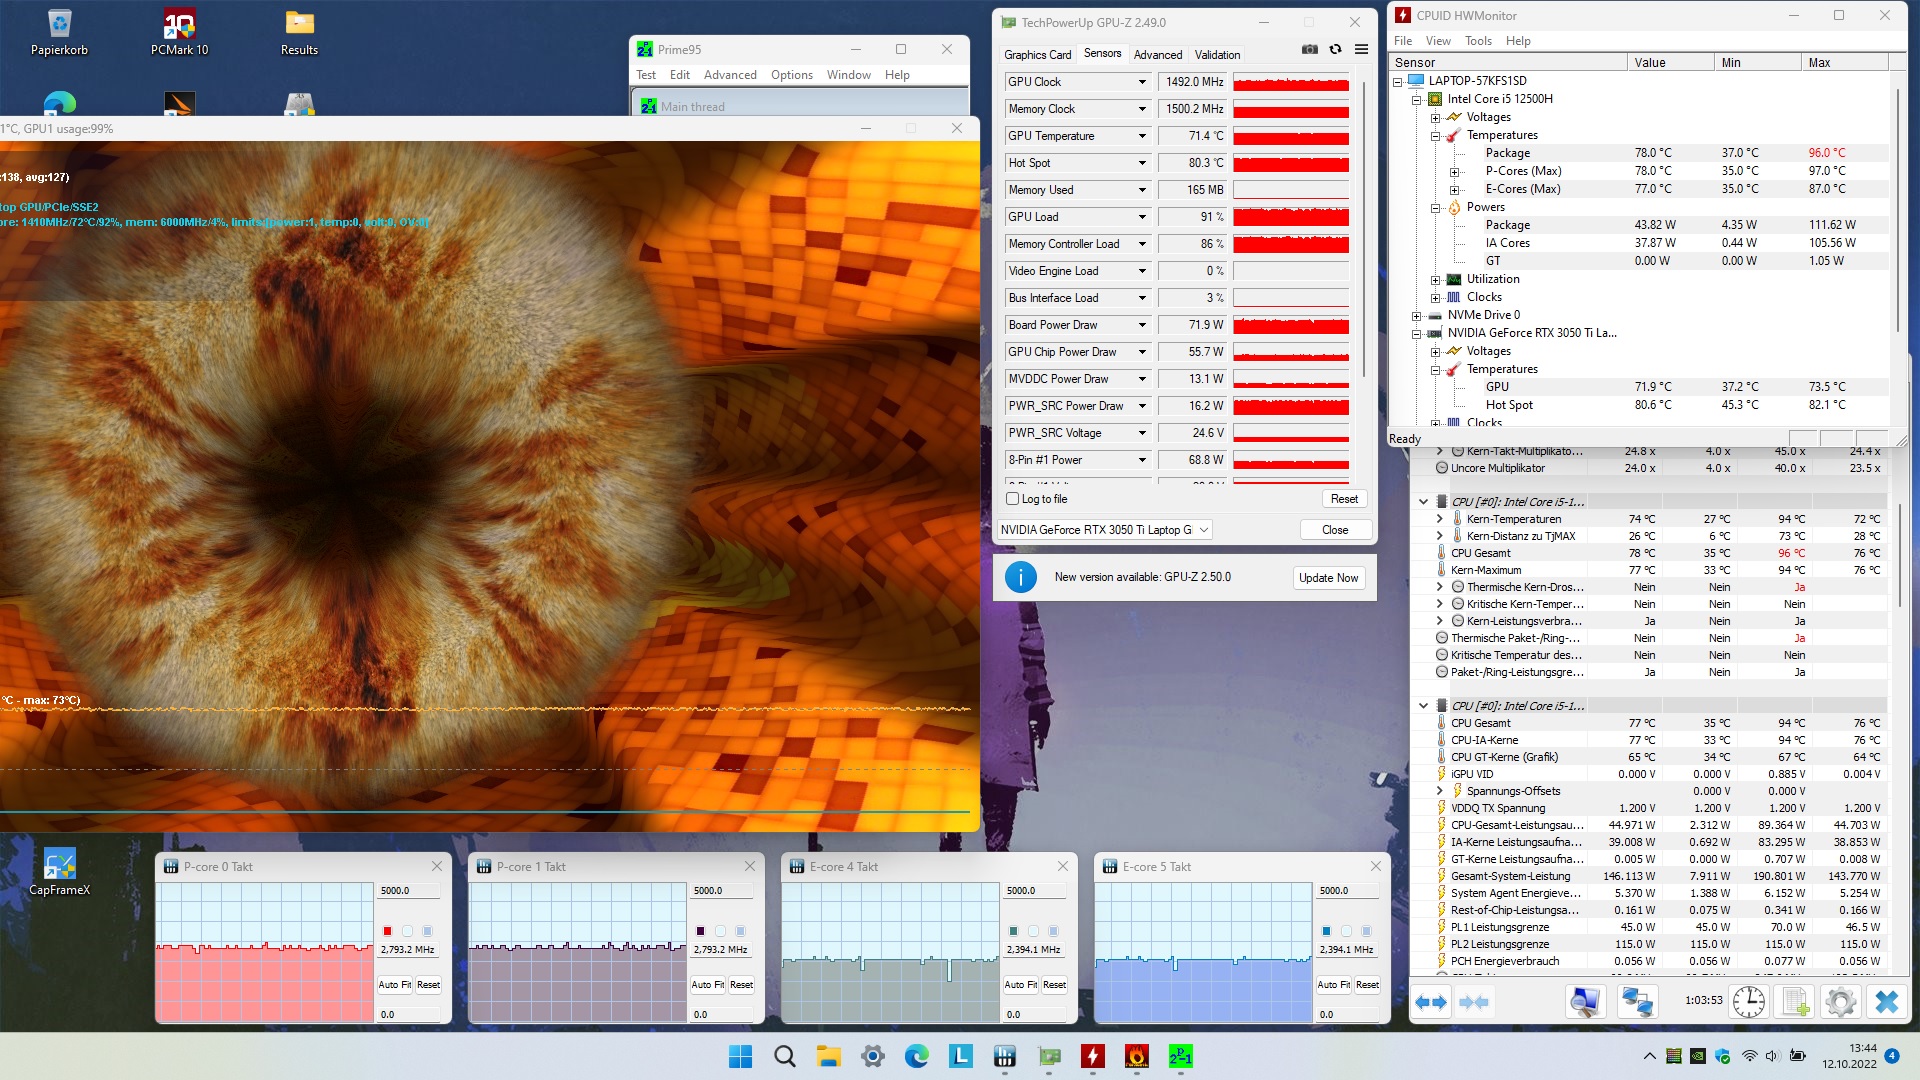
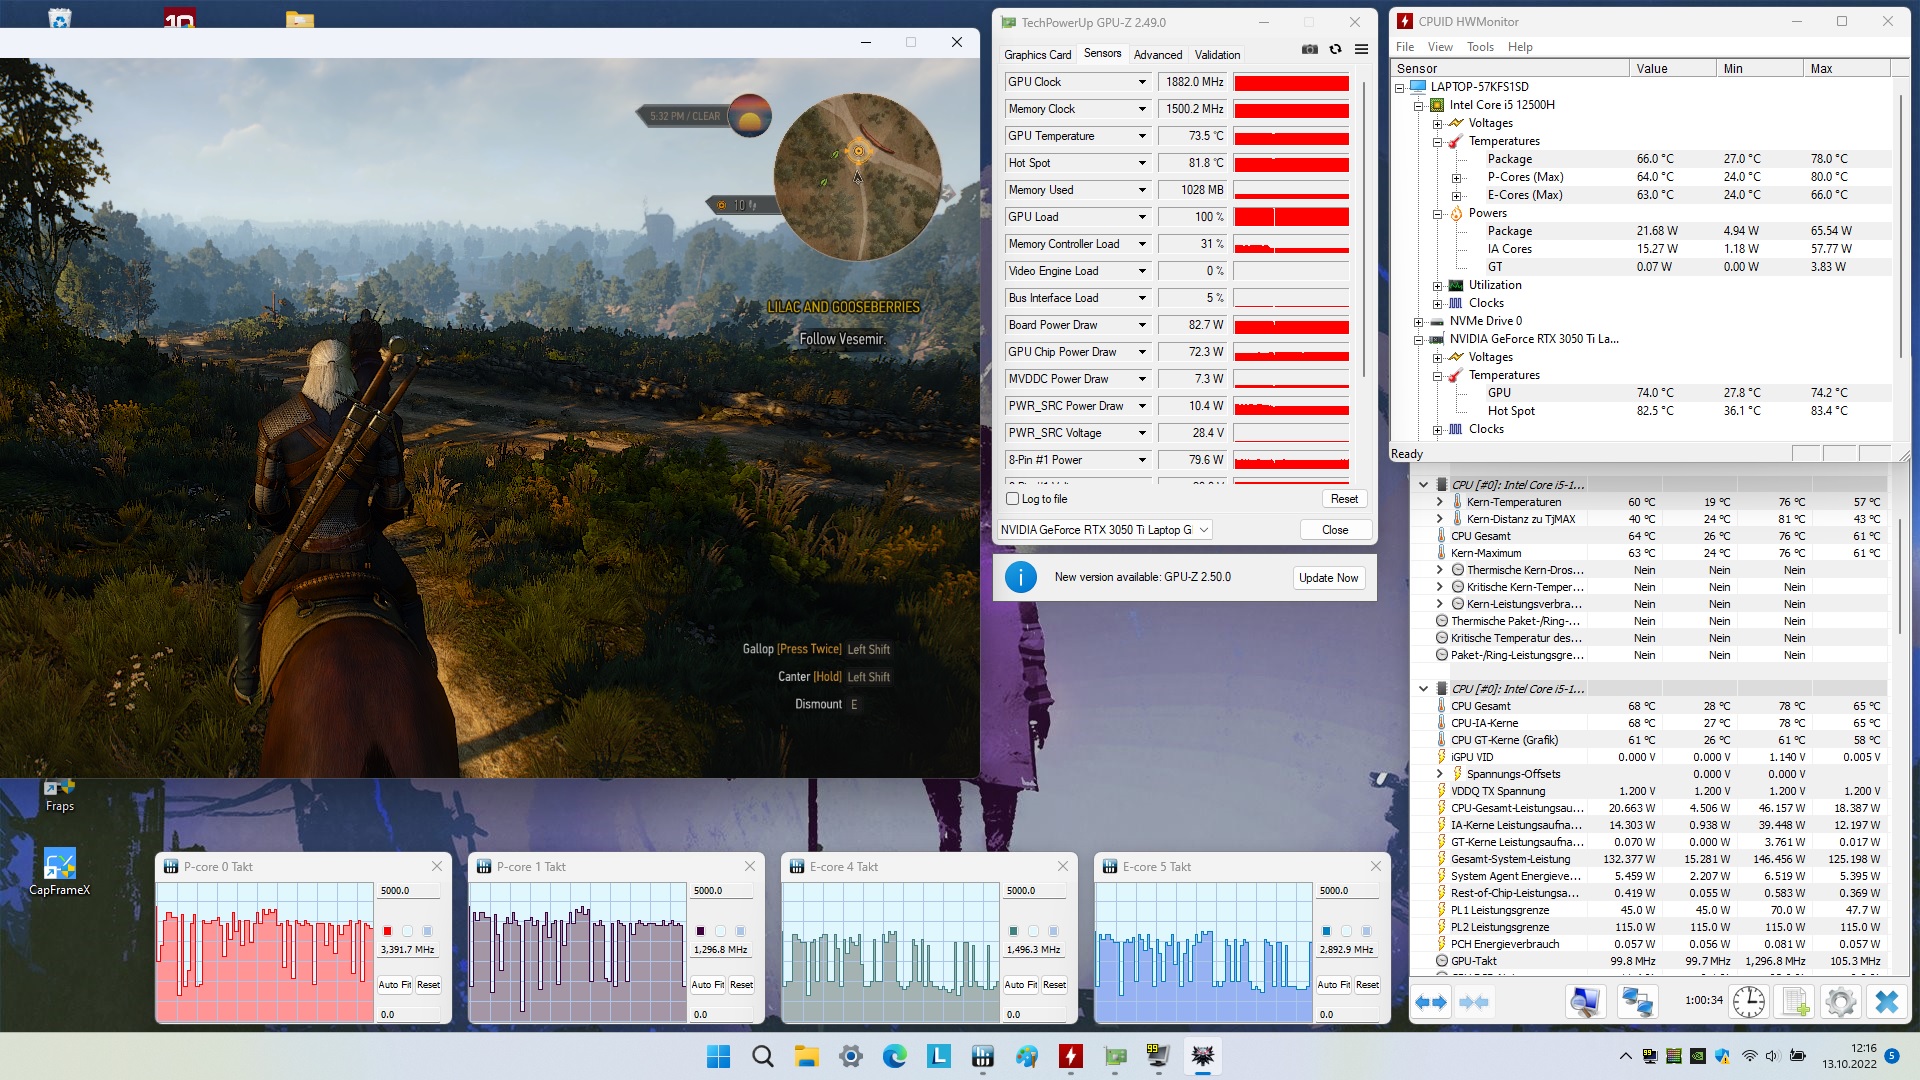
Stress Test
The stress test with an hour of FurMark & Prime95 does not reveal anything odd. The 15-inch laptop stays away from throttling and critical hardware values. We would consider around 71 °C (~160 °F) for the GPU and 78 °C (~172 °F) for the CPU under full load as moderate values.
Speakers
Lenovo IdeaPad Gaming 3 15IAH7 audio analysis
(+) | speakers can play relatively loud (83 dB)
Bass 100 - 315 Hz
(-) | nearly no bass - on average 17.1% lower than median
(±) | linearity of bass is average (12.8% delta to prev. frequency)
Mids 400 - 2000 Hz
(±) | higher mids - on average 5.6% higher than median
(+) | mids are linear (4.5% delta to prev. frequency)
Highs 2 - 16 kHz
(+) | balanced highs - only 2% away from median
(+) | highs are linear (4.6% delta to prev. frequency)
Overall 100 - 16.000 Hz
(+) | overall sound is linear (14.4% difference to median)
Compared to same class
» 27% of all tested devices in this class were better, 7% similar, 66% worse
» The best had a delta of 6%, average was 18%, worst was 132%
Compared to all devices tested
» 18% of all tested devices were better, 4% similar, 78% worse
» The best had a delta of 4%, average was 24%, worst was 134%
Dell G15 5515 audio analysis
(±) | speaker loudness is average but good (76 dB)
Bass 100 - 315 Hz
(-) | nearly no bass - on average 22% lower than median
(±) | linearity of bass is average (14.9% delta to prev. frequency)
Mids 400 - 2000 Hz
(+) | balanced mids - only 2.8% away from median
(+) | mids are linear (3% delta to prev. frequency)
Highs 2 - 16 kHz
(+) | balanced highs - only 1.4% away from median
(+) | highs are linear (3.7% delta to prev. frequency)
Overall 100 - 16.000 Hz
(±) | linearity of overall sound is average (16.8% difference to median)
Compared to same class
» 44% of all tested devices in this class were better, 11% similar, 46% worse
» The best had a delta of 6%, average was 18%, worst was 132%
Compared to all devices tested
» 29% of all tested devices were better, 8% similar, 63% worse
» The best had a delta of 4%, average was 24%, worst was 134%
Power Management
Power Consumption
The power consumption also doesn't stand out. Even though on average, the Gaming 3 consumes slightly more power than other RTX 3050 Ti laptops, this is primarily due to the higher TGP.
| Off / Standby | |
| Idle | |
| Load |
|
Key:
min: | |
| Lenovo IdeaPad Gaming 3 15IAH7 GeForce RTX 3050 Ti Laptop GPU, i5-12500H | Lenovo IdeaPad Gaming 3 15ARH7 GeForce RTX 3050 4GB Laptop GPU, R5 6600H | Dell G15 5515 GeForce RTX 3050 Ti Laptop GPU, R7 5800H | HP Victus 16-e0145ng GeForce RTX 3050 Ti Laptop GPU, R5 5600H | Dell Inspiron 16 Plus 7620 GeForce RTX 3050 Ti Laptop GPU, i7-12700H | Average of class Gaming | |
|---|---|---|---|---|---|---|
| Power Consumption | 8% | 7% | 5% | 6% | -54% | |
| Idle Minimum * (Watt) | 8 | 7.7 4% | 5 37% | 7 12% | 6.8 15% | 13.3 ? -66% |
| Idle Average * (Watt) | 10 | 9.1 9% | 9 10% | 9 10% | 9.6 4% | 19 ? -90% |
| Idle Maximum * (Watt) | 16 | 15.6 2% | 20 -25% | 15 6% | 17 -6% | 24.5 ? -53% |
| Load Average * (Watt) | 99 | 90.7 8% | 94 5% | 93 6% | 117.5 -19% | 108.1 ? -9% |
| Witcher 3 ultra * (Watt) | 144.6 | 122.9 15% | 123 15% | 134.5 7% | 113.1 22% | |
| Load Maximum * (Watt) | 168 | 155.2 8% | 172 -2% | 185 -10% | 137.4 18% | 254 ? -51% |
* ... smaller is better
Power Consumption The Witcher 3 / Stress Test
Power Consumption With External Monitor
Battery Life
Depending on the model, the IdeaPad offers either a 45-Wh or a 60-Wh battery. In contrast to its AMD sibling, the tested Intel version fortunately is able to score with the more powerful battery. However, due to the higher consumption, the differences remain within limits. At barely 6 hours, the battery life during wireless Internet surfing at a display brightness reduced to 150 cd/m² turns out even slightly lower than that of the AMD version. The other competitors are also ahead in this regard.
| Lenovo IdeaPad Gaming 3 15IAH7 GeForce RTX 3050 Ti Laptop GPU, i5-12500H, 60 Wh | Lenovo IdeaPad Gaming 3 15ARH7 GeForce RTX 3050 4GB Laptop GPU, R5 6600H, 45 Wh | Dell G15 5515 GeForce RTX 3050 Ti Laptop GPU, R7 5800H, 56 Wh | HP Victus 16-e0145ng GeForce RTX 3050 Ti Laptop GPU, R5 5600H, 70 Wh | Dell Inspiron 16 Plus 7620 GeForce RTX 3050 Ti Laptop GPU, i7-12700H, 86 Wh | Average of class Gaming | |
|---|---|---|---|---|---|---|
| Battery runtime | 10% | 36% | 20% | 63% | 19% | |
| WiFi v1.3 (h) | 5.9 | 6.5 10% | 8 36% | 7.1 20% | 9.6 63% | 7.01 ? 19% |
| Reader / Idle (h) | 2.4 | 13.5 | 18.6 | 8.71 ? | ||
| Load (h) | 0.9 | 1.5 | 1.2 | 1.47 ? | ||
| H.264 (h) | 8.8 | 8.26 ? |
Pros
Cons
Verdict
If you disregard the mediocre quality of the case in terms of the material and workmanship, Lenovo has created a successful budget gaming laptop with the IdeaPad Gaming 3 15IAH7.
Thanks to high TDPs and constant performance development, the Core i5-12500H and GeForce RTX 3050 Ti are able to show their full power, while in contrast, the (mostly slower) competitors deliver a better battery life. However, hardly any of the alternative laptops are able to reach the image quality of the Gaming 3. Most of the competitors are left behind in terms of the color space and brightness. In our comparison field, only the Dell Inspiron 16 Plus is able to come close to the Lenovo laptop.
Those who expect a good display but don't want to spend too much money for a gaming laptop should take a closer look at the IdeaPad Gaming 3 15IAH7.
Price and Availability
At the time of this test, the IdeaPad Gaming 3 15IAH7 with a Core i5-12500H, GeForce RTX 3050 Ti, 8 GB RAM, and 512 GB SSD is available for $1031 from BestBuy.
Lenovo IdeaPad Gaming 3 15IAH7
- 10/14/2022 v7 (old)
Florian Glaser
Price comparison

