Reviews for the Intel Core i5-12500H processor
Aorus 15 YE5 review: The high-end gaming laptop for money savers
Aorus has made use of a last-gen CPU and GPU in order to market the ex-flagship RTX 3080 Ti for a price of only US$1,500. In turn, the laptop's case and connectivity are actually quite modern. Will you have to make any further compromises for the price, or is the Aorus YE5 a real high-end hidden gem for money savers?
Intel Core i5-12500H, NVIDIA GeForce RTX 3080 Ti Laptop GPU, 15.6", 2.3 kgGigabyte G5 KF review: Gaming laptop with RTX 4060 for 969 euros
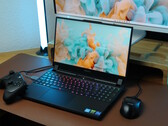
This budget gaming notebook from Gigabyte features an Alder Lake processor and an Ada Lovelace GPU. It also has a PCIe 4.0 SSD (512 GB), 16 GB of RAM and an FHD panel (144Hz), but Windows doesn’t come preinstalled. One serious drawback: the included charger can sometimes be overloaded by the laptop.
Intel Core i5-12500H, NVIDIA GeForce RTX 4060 Laptop GPU, 15.6", 1.9 kgAcer Nitro 5 AN517 review: A gaming laptop with a quiet RTX 4050
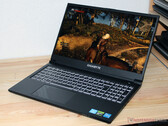
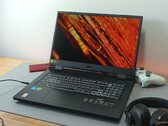
The entry-level gaming laptop is well-equipped with its Intel Core i5-12500H and RTX 4050 and can run current games at Full HD really well. So far, so unsurprising. But: In quiet mode, the performance hardly drops and the noise levels remain remarkably low.
Intel Core i5-12500H, NVIDIA GeForce RTX 4050 Laptop GPU, 17.3", 3 kgGigabyte G5 KE Review: Midrange gaming laptop that checks most boxes
Gigabyte's foray into the Indian market kicks off with the midrange G5 series. The G5 KE is based on a Clevo design and shares similar specs as the larger G7 KE including an Intel Core i5-12500H CPU, an Nvidia GeForce RTX 3060 Laptop GPU, and a 144 Hz display. While the Gigabyte G5 KE gets most of the gaming basics right, buyers will have to contend with compromises in other areas.
Intel Core i5-12500H, NVIDIA GeForce RTX 3060 Laptop GPU, 15.6", 2 kgGigabyte G7 KE in review: Affordable gaming laptop with a powerful RTX 3060
With a Core i5-12500H CPU and a GeForce RTX 3060 laptop GPU, all current titles look smooth on the matte FHD screen (300 Hz). The CPU and GPU are accompanied by a fast PCIe-4 SSD (1 TB), 16 GB of RAM, and a Thunderbolt 4 port. A copy of the Windows operating system is not included.
Intel Core i5-12500H, NVIDIA GeForce RTX 3060 Laptop GPU, 17.3", 2.6 kgAcer Swift 3 SF314-71-56U3: Intel Iris Xe Graphics G7 80EUs, 14.00", 1.4 kg
Review » Acer Swift 3 SF314 in review: Compact laptop with a beautiful OLED display and a fast CPU
Lenovo IdeaPad Gaming 3 15IAH7: NVIDIA GeForce RTX 3050 Ti Laptop GPU, 15.60", 2.4 kg
Review » Lenovo IdeaPad Gaming 3 15IAH7 review: One of the most powerful RTX 3050 Ti laptops
Honor MagicBook 14 2022: NVIDIA GeForce RTX 2050 Mobile, 14.00", 1.6 kg
Review » Honor MagicBook 14 2022 review: Multimedia laptop with RTX 2050
Asus Vivobook 16X K3605ZC, i5-12500H: NVIDIA GeForce RTX 3050 4GB Laptop GPU, 16.00", 1.8 kg
External Review » Asus Vivobook 16X K3605ZC, i5-12500H
Asus Vivobook 16X K3605ZU, i5-12500H: NVIDIA GeForce RTX 4050 Laptop GPU, 16.00", 1.8 kg
External Review » Asus Vivobook 16X K3605ZU, i5-12500H
Asus Vivobook 14X K3405ZF: NVIDIA GeForce RTX 2050 Mobile, 14.50", 1.4 kg
External Review » Asus Vivobook 14X K3405ZF
HP Victus 15-fa1000na: NVIDIA GeForce RTX 4050 Laptop GPU, 15.60", 2.3 kg
External Review » HP Victus 15-fa1000na
Asus TUF Gaming F15 FX507ZC, i5-12500H: NVIDIA GeForce RTX 3050 4GB Laptop GPU, 15.60", 2.7 kg
External Review » Asus TUF Gaming F15 FX507ZC, i5-12500H
Acer Nitro 5 AN517-55: NVIDIA GeForce RTX 4050 Laptop GPU, 17.30", 3 kg
External Review » Acer Nitro 5 AN517-55
Aorus 15 9KF: NVIDIA GeForce RTX 4060 Laptop GPU, 15.60", 2.3 kg
External Review » Aorus 15 9KF
Medion Erazer Crawler E30: NVIDIA GeForce RTX 3050 4GB Laptop GPU, 15.60", 2 kg
External Review » Medion Erazer Crawler E30
Lenovo Legion 5 15IAH7H, i5-12500H RTX 3060: NVIDIA GeForce RTX 3060 Laptop GPU, 15.60", 2.4 kg
External Review » Lenovo Legion 5 15IAH7H, i5-12500H RTX 3060
Acer Nitro 5 AN515-58, i5-12500H RTX 4050: NVIDIA GeForce RTX 4050 Laptop GPU, 15.60", 2.5 kg
External Review » Acer Nitro 5 AN515-58, i5-12500H RTX 4050
HP Victus 16-d1008ns: NVIDIA GeForce RTX 3050 Ti Laptop GPU, 16.10", 2.5 kg
External Review » HP Victus 16-d1008ns
HP Victus 16-d1018ns: NVIDIA GeForce RTX 3050 Ti Laptop GPU, 16.10", 2.5 kg
External Review » HP Victus 16-d1018ns
Gigabyte G5 MF: NVIDIA GeForce RTX 4050 Laptop GPU, 15.60", 1.9 kg
External Review » Gigabyte G5 MF
Infinix Zero Book: Intel Iris Xe Graphics G7 80EUs, 15.60", 1.8 kg
External Review » Infinix Zero Book
Lenovo IdeaPad Gaming 3 15IAH7, i5-12500H RXT 3050: NVIDIA GeForce RTX 3050 4GB Laptop GPU, 15.60", 2.3 kg
External Review » Lenovo IdeaPad Gaming 3 15IAH7, i5-12500H. RXT 3050
Gigabyte G5 KF: NVIDIA GeForce RTX 4060 Laptop GPU, 15.60", 1.9 kg
External Review » Gigabyte G5 KF
Gigabyte G5 GE: NVIDIA GeForce RTX 3050 4GB Laptop GPU, 15.60", 1.9 kg
External Review » Gigabyte G5 GE
Acer Nitro 5 AN515-58-591S: NVIDIA GeForce RTX 3060 Laptop GPU, 15.60", 2.5 kg
External Review » Acer Nitro 5 AN515-58-591S
Gigabyte G5 KE: NVIDIA GeForce RTX 3050 6GB Laptop GPU, 15.60", 2 kg
External Review » Gigabyte G5 KE
Lenovo Yoga 7 16IAH7, i5-12500H: Intel Arc A370M, 16.00", 2.2 kg
External Review » Lenovo Yoga 7 16IAH7, i5-12500H
Asus VivoBook S 14 Flip TP3402ZA: Intel Iris Xe Graphics G7 80EUs, 14.00", 1.5 kg
External Review » Asus VivoBook S 14 Flip TP3402ZA
Lenovo ThinkBook Plus Gen3, i5-12500H: Intel Iris Xe Graphics G7 80EUs, 17.30", 2 kg
External Review » Lenovo ThinkBook Plus Gen3, i5-12500H
Dell G15 5520, i5-12500H RTX 3050 Ti: NVIDIA GeForce RTX 3050 Ti Laptop GPU, 15.60", 2.7 kg
External Review » Dell G15 5520, i5-12500H RTX 3050 Ti
MSI Katana GF66 12UE-868XRU: NVIDIA GeForce RTX 3060 Laptop GPU, 15.60", 2.6 kg
External Review » MSI Katana GF66 12UE-868XRU
Lenovo Legion 5 Pro 16IAH7H-82RF009HGE: NVIDIA GeForce RTX 3060 Laptop GPU, 16.00", 2.5 kg
External Review » Lenovo Legion 5 Pro 16IAH7H-82RF009HGE
Asus Vivobook S 15 M3502, i5-12500H: Intel Iris Xe Graphics G7 80EUs, 15.60", 1.8 kg
External Review » Asus Vivobook S 15 M3502, i5-12500H
Lenovo Yoga Slim 7 ProX 14IAH7, i5-12500H RTX 3050: NVIDIA GeForce RTX 3050 4GB Laptop GPU, 14.50", 1.4 kg
External Review » Lenovo Yoga Slim 7 ProX 14IAH7, i5-12500H RTX 3050
Acer Nitro 5 AN515-58-521S: NVIDIA GeForce RTX 3050 4GB Laptop GPU, 15.60", 2.5 kg
External Review » Acer Nitro 5 AN515-58-521S
HP Pavilion Plus 14-eh0021TU: Intel Iris Xe Graphics G7 80EUs, 14.00", 1.4 kg
External Review » HP Pavilion Plus 14-eh0021TU
Asus Vivobook S 15 K3502, i5-12500H: Intel Iris Xe Graphics G7 80EUs, 15.60", 1.8 kg
External Review » Asus Vivobook S 15 K3502, i5-12500H
HP Omen 16-k0000: NVIDIA GeForce RTX 3060 Laptop GPU, 16.10", 2.4 kg
External Review » HP Omen 16-k0000
Lenovo Legion 5 15IAH7-82RC004JGE: NVIDIA GeForce RTX 3050 Ti Laptop GPU, 15.60", 2.4 kg
External Review » Lenovo Legion 5 15IAH7-82RC004JGE
Asus Vivobook 14X A1403, i5-12500H: Intel Iris Xe Graphics G7 80EUs, 14.00", 1.6 kg
External Review » Asus Vivobook 14X A1403, i5-12500H
Acer Nitro 5 AN515-58-53F4: NVIDIA GeForce RTX 3060 Laptop GPU, 15.60", 2.5 kg
External Review » Acer Nitro 5 AN515-58-53F4
Lenovo IdeaPad Gaming 3 15IAH7-82S90075SP: NVIDIA GeForce RTX 3050 Ti Laptop GPU, 15.60", 2.3 kg
External Review » Lenovo IdeaPad Gaming 3 15IAH7-82S90075SP
Honor MagicBook 14 2022: NVIDIA GeForce RTX 2050 Mobile, 14.00", 1.6 kg
External Review » Honor MagicBook 14 2022
Asus Vivobook S 14 K3402ZA, i5-12500H: Intel Iris Xe Graphics G7 80EUs, 14.00", 1.5 kg
External Review » Asus Vivobook S 14 K3402ZA, i5-12500H
Acer Swift 3 SF314-71-56U3: Intel Iris Xe Graphics G7 80EUs, 14.00", 1.4 kg
External Review » Acer Swift 3 SF314-71-56U3
HP Victus 15-fa0011TX: NVIDIA GeForce RTX 3050 4GB Laptop GPU, 15.60", 2.3 kg
External Review » HP Victus 15-fa0011TX
Asus ZenBook Flip 14 UP5401ZA, i5-12500H: Intel Iris Xe Graphics G7 80EUs, 14.00", 1.4 kg
External Review » Asus ZenBook Flip 14 UP5401ZA, i5-12500H
Asus VivoBook 15X A1503, i5-12500H: Intel Iris Xe Graphics G7 80EUs, 15.60", 1.7 kg
External Review » Asus VivoBook 15X A1503, i5-12500H
Asus VivoBook S 14 S3402, i7-12500H: Intel Iris Xe Graphics G7 80EUs, 14.00", 1.5 kg
External Review » Asus VivoBook S 14 S3402, i7-12500H
MSI Katana GF66 12UC-077: NVIDIA GeForce RTX 3050 4GB Laptop GPU, 15.60", 2.3 kg
External Review » MSI Katana GF66 12UC-077
Lenovo IdeaPad 5 Pro 16IAH7-82SK0035GE: Intel Iris Xe Graphics G7 80EUs, 16.00", 2 kg
External Review » Lenovo IdeaPad 5 Pro 16IAH7-82SK0035GE
Asus ZenBook 14X UX5401ZA-KP005W: Intel Iris Xe Graphics G7 80EUs, 14.00", 1.4 kg
External Review » Asus ZenBook 14X UX5401ZA-KP005W
Acer Nitro 5 AN515-58-NH.QFKEK.001: NVIDIA GeForce RTX 3050 Ti Laptop GPU, 15.60", 2.5 kg
External Review » Acer Nitro 5 AN515-58-NH.QFKEK.001
Lenovo IdeaPad Gaming 3 15IAH7-82S9006JGE: NVIDIA GeForce RTX 3050 4GB Laptop GPU, 15.60", 2.3 kg
External Review » Lenovo IdeaPad Gaming 3 15IAH7-82S9006JGE
Acer Nitro 5 AN515-58-58BN: NVIDIA GeForce RTX 3050 4GB Laptop GPU, 15.60", 2.5 kg
External Review » Acer Nitro 5 AN515-58-58BN
Acer Nitro 5 AN515-58-527S: NVIDIA GeForce RTX 3060 Laptop GPU, 15.60", 2.5 kg
External Review » Acer Nitro 5 AN515-58-527S
Aorus 15 YE5-54DEB34SH: NVIDIA GeForce RTX 3080 Ti Laptop GPU, 15.60", 2.3 kg
» Aorus 15 review: More powerful than most laptops with an RTX 4070 and it only costs US$1,500
Acer Nitro 5 AN517-55-5552: NVIDIA GeForce RTX 4050 Laptop GPU, 17.30"
» Acer Nitro 5 reviewed: An efficient RTX 4050 in economy mode
Gigabyte G7 KE: NVIDIA GeForce RTX 3060 Laptop GPU, 17.30", 2.6 kg
» Gigabyte G7 KE: RTX 3060 gaming notebook with no Windows operating system
Acer Swift 3 SF314-71-56U3: Intel Iris Xe Graphics G7 80EUs, 14.00", 1.4 kg
» Acer Swift 3 SF314 shines with a 2.8K OLED display and a powerful CPU in our review, but...