Gigabyte G5 KE Review: Midrange gaming laptop that checks most boxes
Gigabyte offers several laptop classes based on performance and budget. While the Aorus and Aero series are targeted at premium gaming and content creation segments, the traditional Gigabyte variants such as the G5 and G7 are aimed at a more mainstream gaming audience.
We have previously reviewed the 17.3-inch Gigabyte G7 KE and now we get to test the 15.6-inch Gigabyte G5 KE with largely similar specifications.
Our Gigabyte G5 KE unit comes equipped with an Intel 12th gen Core i5-12500H processor, Nvidia GeForce RTX 3060 Laptop GPU, 16 GB RAM, a 512 GB SSD, and a 15.6-inch 144 Hz IPS panel.
This configuration will set you back by ₹94,990 (US$1,155) in the Indian market. In this review, we take the Gigabyte G5 KE for a spin and see if it can match up to its peers from the midrange gaming segment.
Potential competitors in comparison
Rating | Date | Model | Weight | Height | Size | Resolution | Price |
|---|---|---|---|---|---|---|---|
| 81.8 % v7 (old) | 04 / 2023 | Gigabyte G5 KE i5-12500H, GeForce RTX 3060 Laptop GPU | 2 kg | 23.9 mm | 15.60" | 1920x1080 | |
| 82.8 % v7 (old) | 10 / 2022 | Lenovo IdeaPad Gaming 3 15IAH7 i5-12500H, GeForce RTX 3050 Ti Laptop GPU | 2.4 kg | 26 mm | 15.60" | 1920x1080 | |
| 83.3 % v7 (old) | 01 / 2023 | Gigabyte G7 KE i5-12500H, GeForce RTX 3060 Laptop GPU | 2.6 kg | 25 mm | 17.30" | 1920x1080 | |
| 87.4 % v7 (old) | 09 / 2022 | Honor MagicBook 14 2022 i5-12500H, GeForce RTX 2050 Mobile | 1.6 kg | 16.9 mm | 14.00" | 2160x1440 | |
| 87.9 % v7 (old) | 01 / 2023 | Schenker XMG Core 15 (M22) R7 6800H, GeForce RTX 3060 Laptop GPU | 2.1 kg | 23 mm | 15.60" | 2560x1440 | |
| 86.1 % v7 (old) | 10 / 2022 | Dell G16 7620 i7-12700H, GeForce RTX 3060 Laptop GPU | 2.6 kg | 26.9 mm | 16.00" | 2560x1600 | |
| 82.3 % v7 (old) | 09 / 2022 | Gigabyte A5 K1 R5 5600H, GeForce RTX 3060 Laptop GPU | 2.2 kg | 34 mm | 15.60" | 1920x1080 | |
| 87.2 % v7 (old) | 03 / 2022 | Asus TUF Gaming F15 FX507ZM i7-12700H, GeForce RTX 3060 Laptop GPU | 2.1 kg | 24.95 mm | 15.60" | 1920x1080 | |
| 84.3 % v7 (old) | 09 / 2021 | HP Victus 16-e0179ng R7 5800H, GeForce RTX 3060 Laptop GPU | 2.5 kg | 23.5 mm | 16.10" | 1920x1080 |
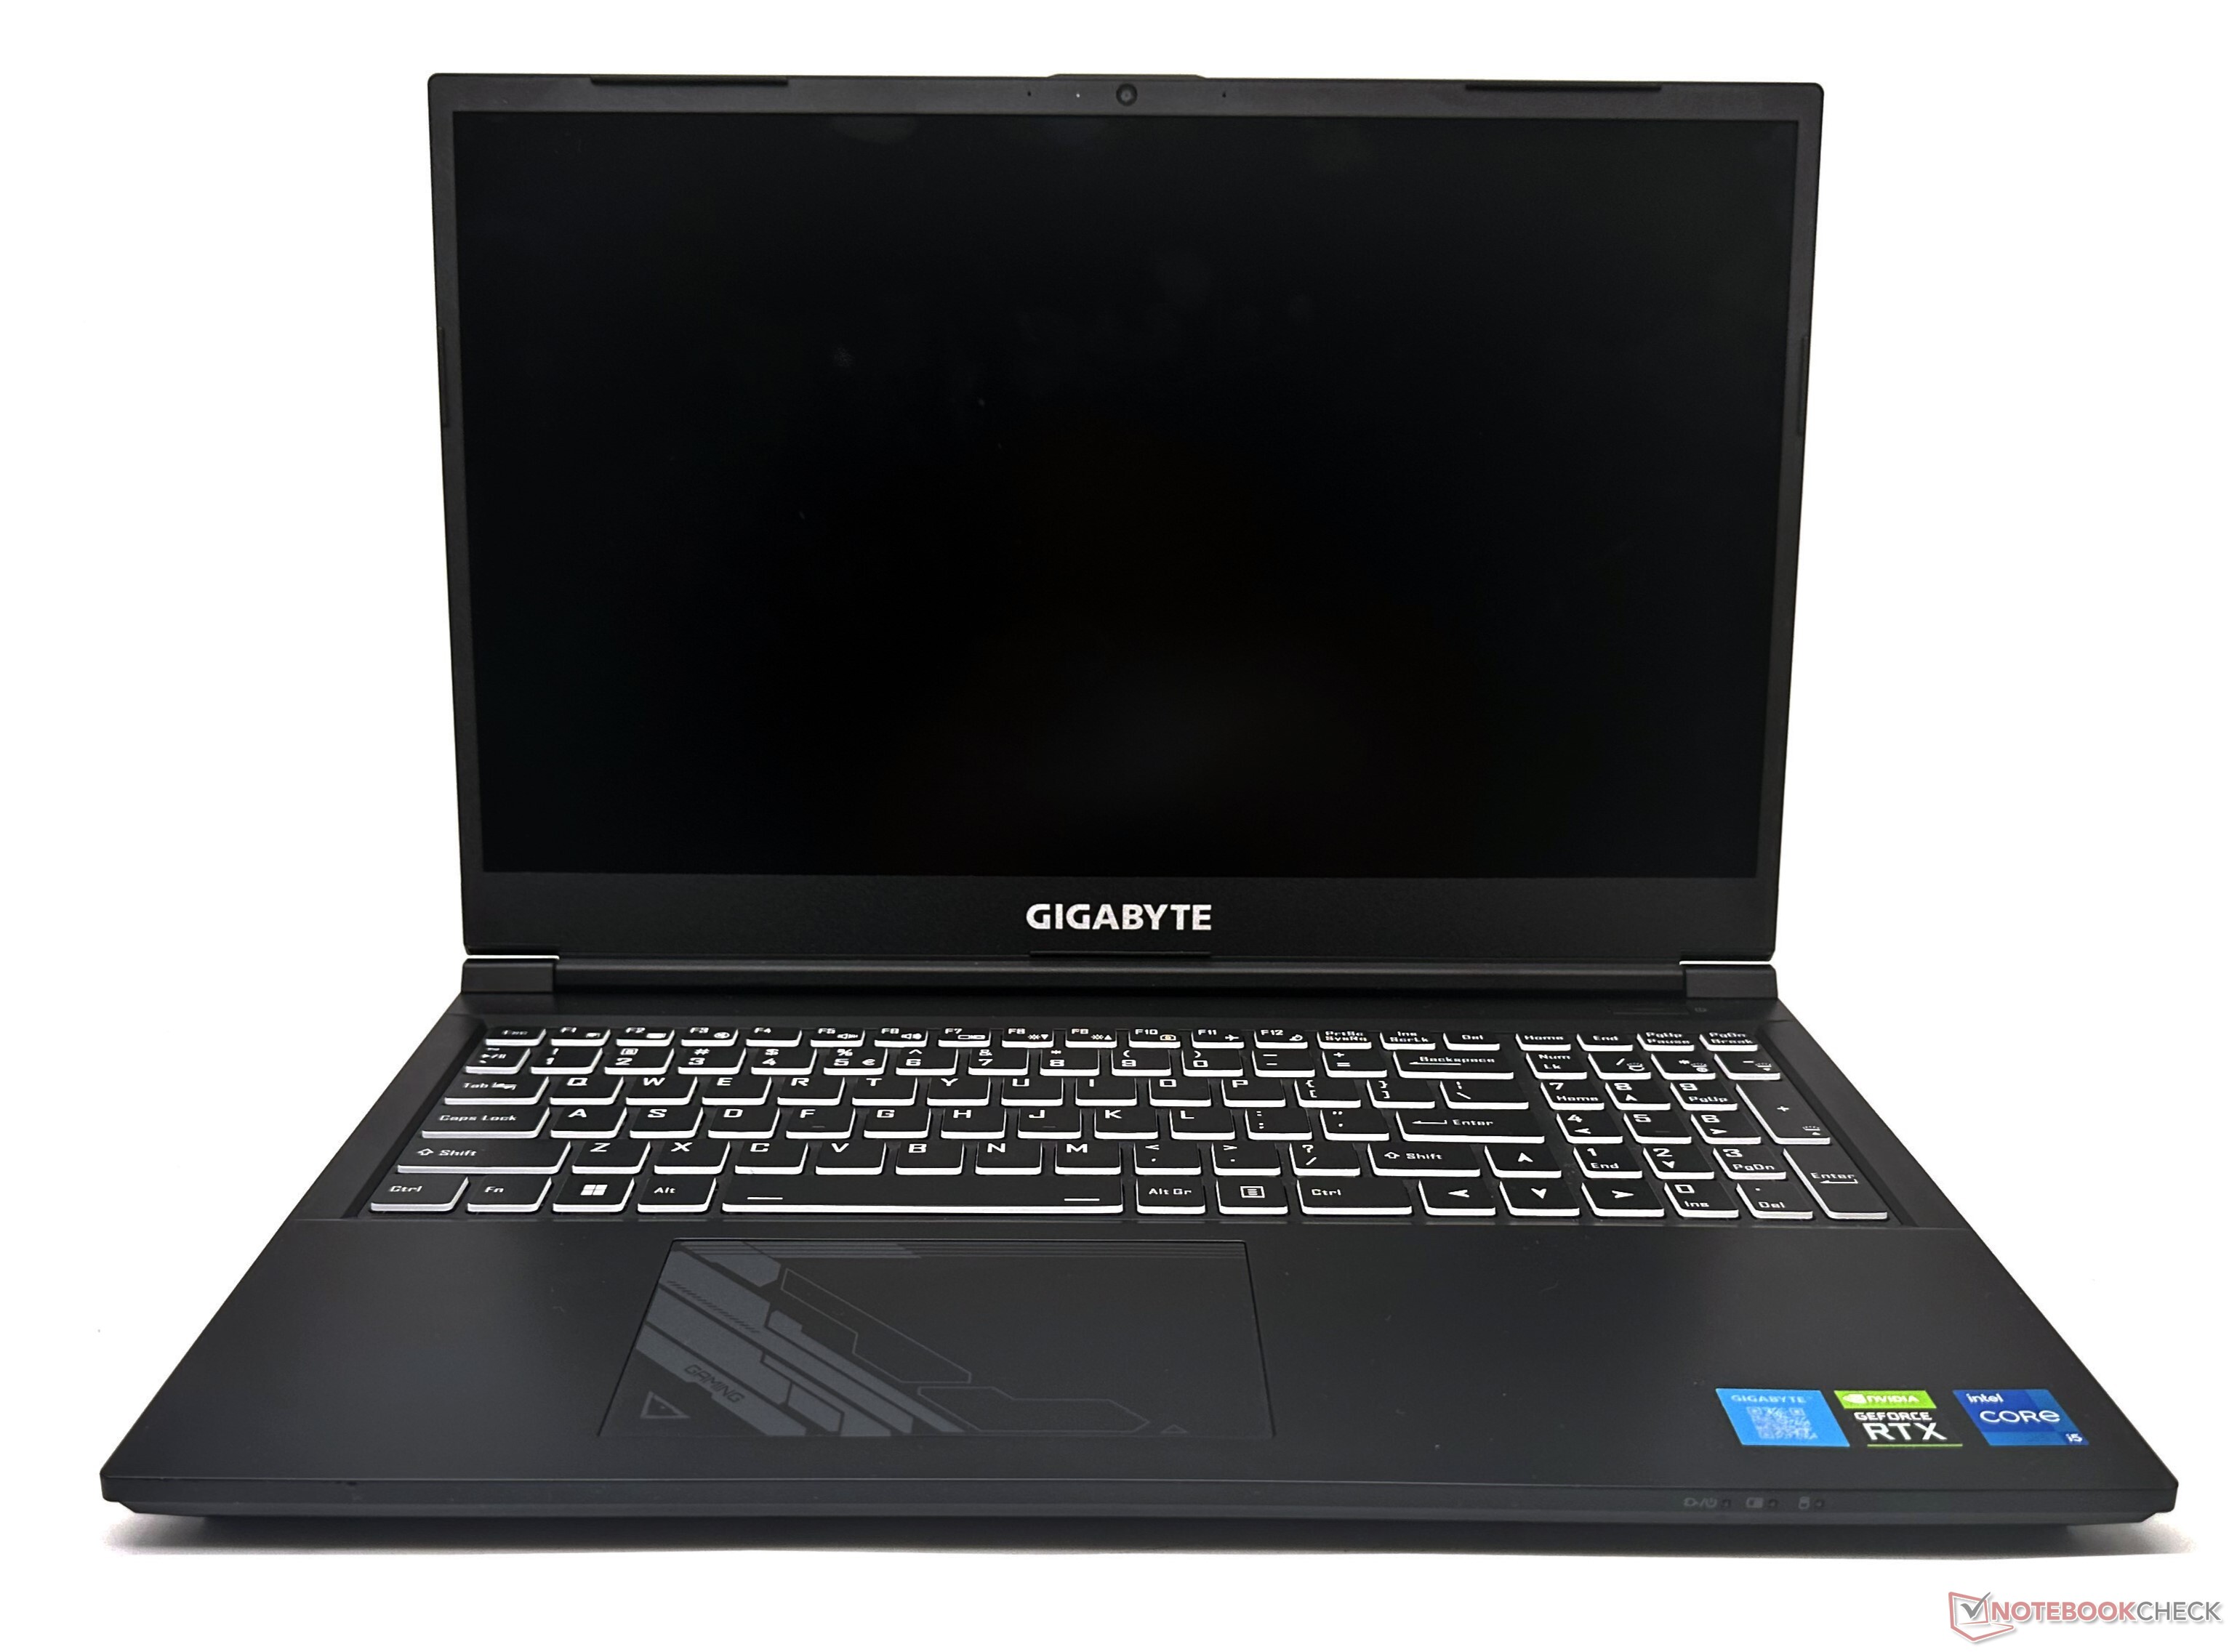
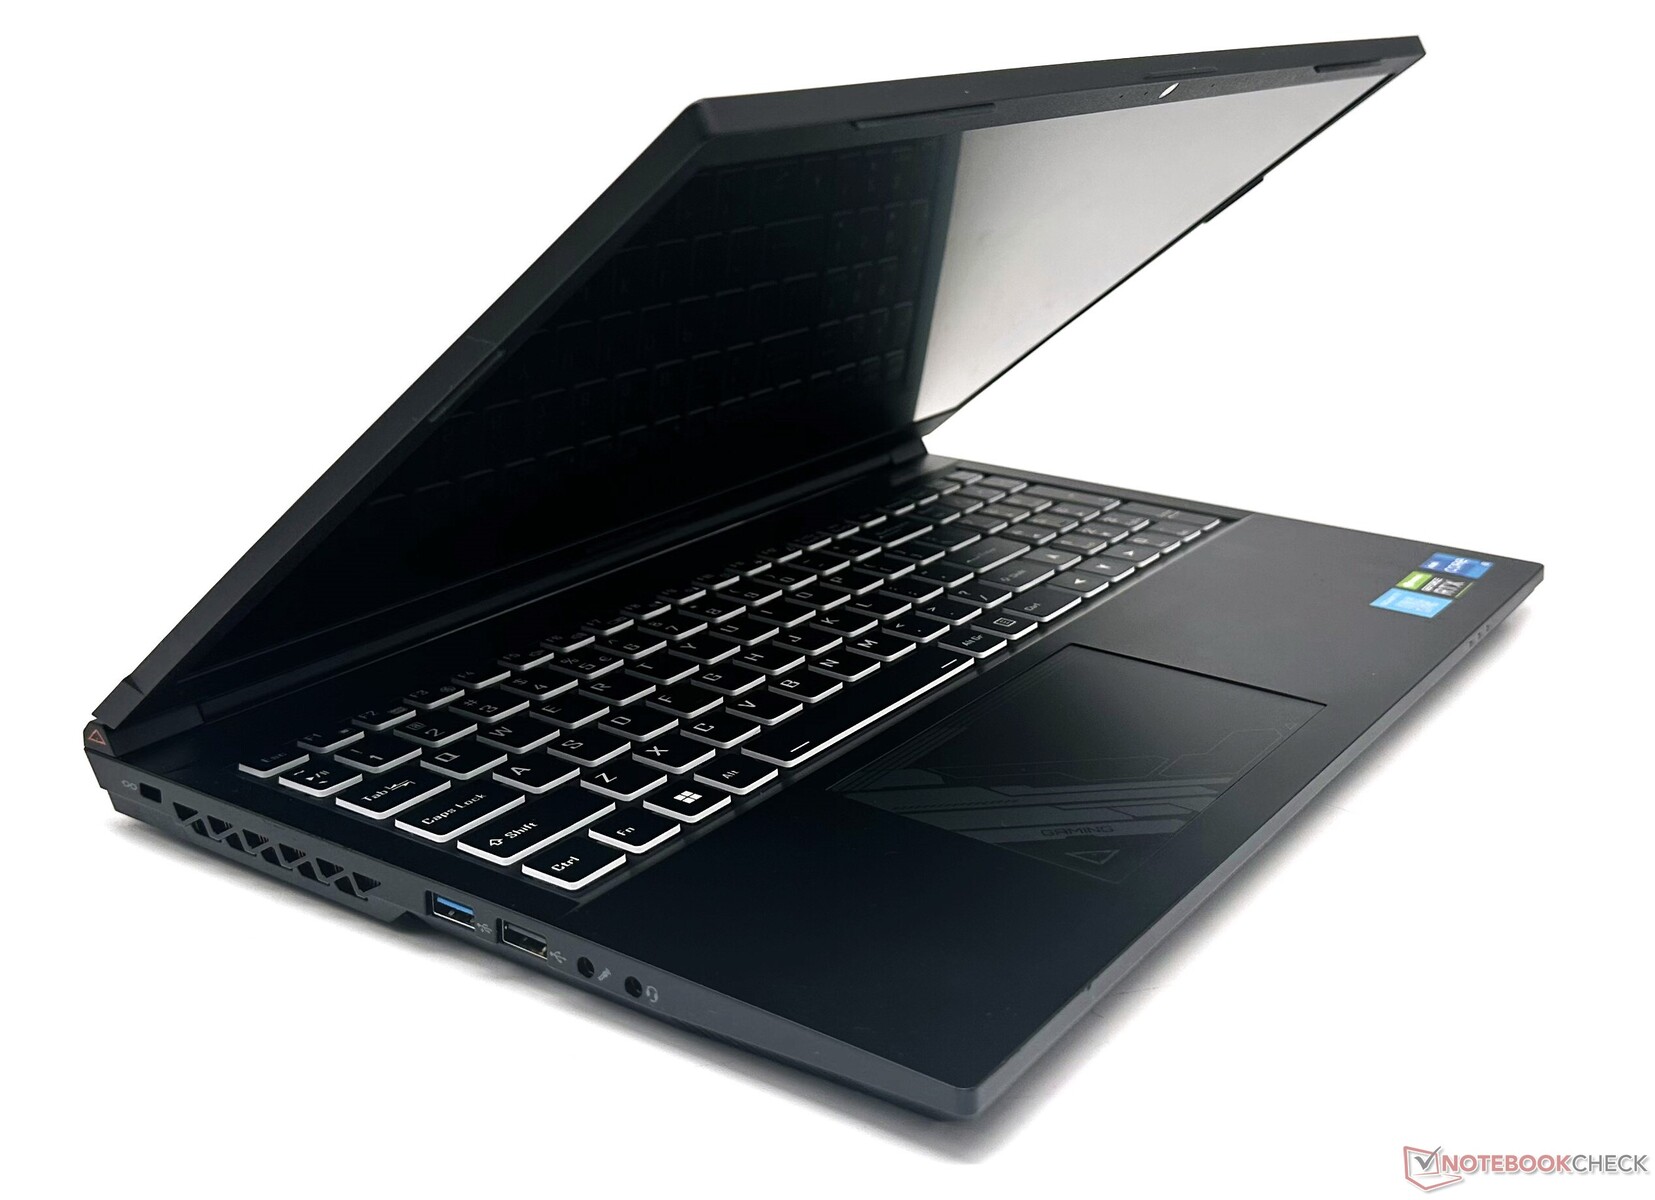
Chassis: Primarily plastic with some flex
The Gigabyte G5 KE's construction is on expected lines in this price range. It is essentially a Clevo design that is fully plastic in construction with smooth, matte surfaces with some subtle accents on the back of the lid and on the touchpad.
At 23.9 mm, the G5 KE's thickness is similar to its competition in this segment while being considerably thinner than the Gigabyte A5 K1.
The G5 KE's chassis is not the most rigid one we've seen — there is considerable flex under pressure in the keyboard deck and the lid can give into twisting. However, users aren't likely to expereince this in everyday use.
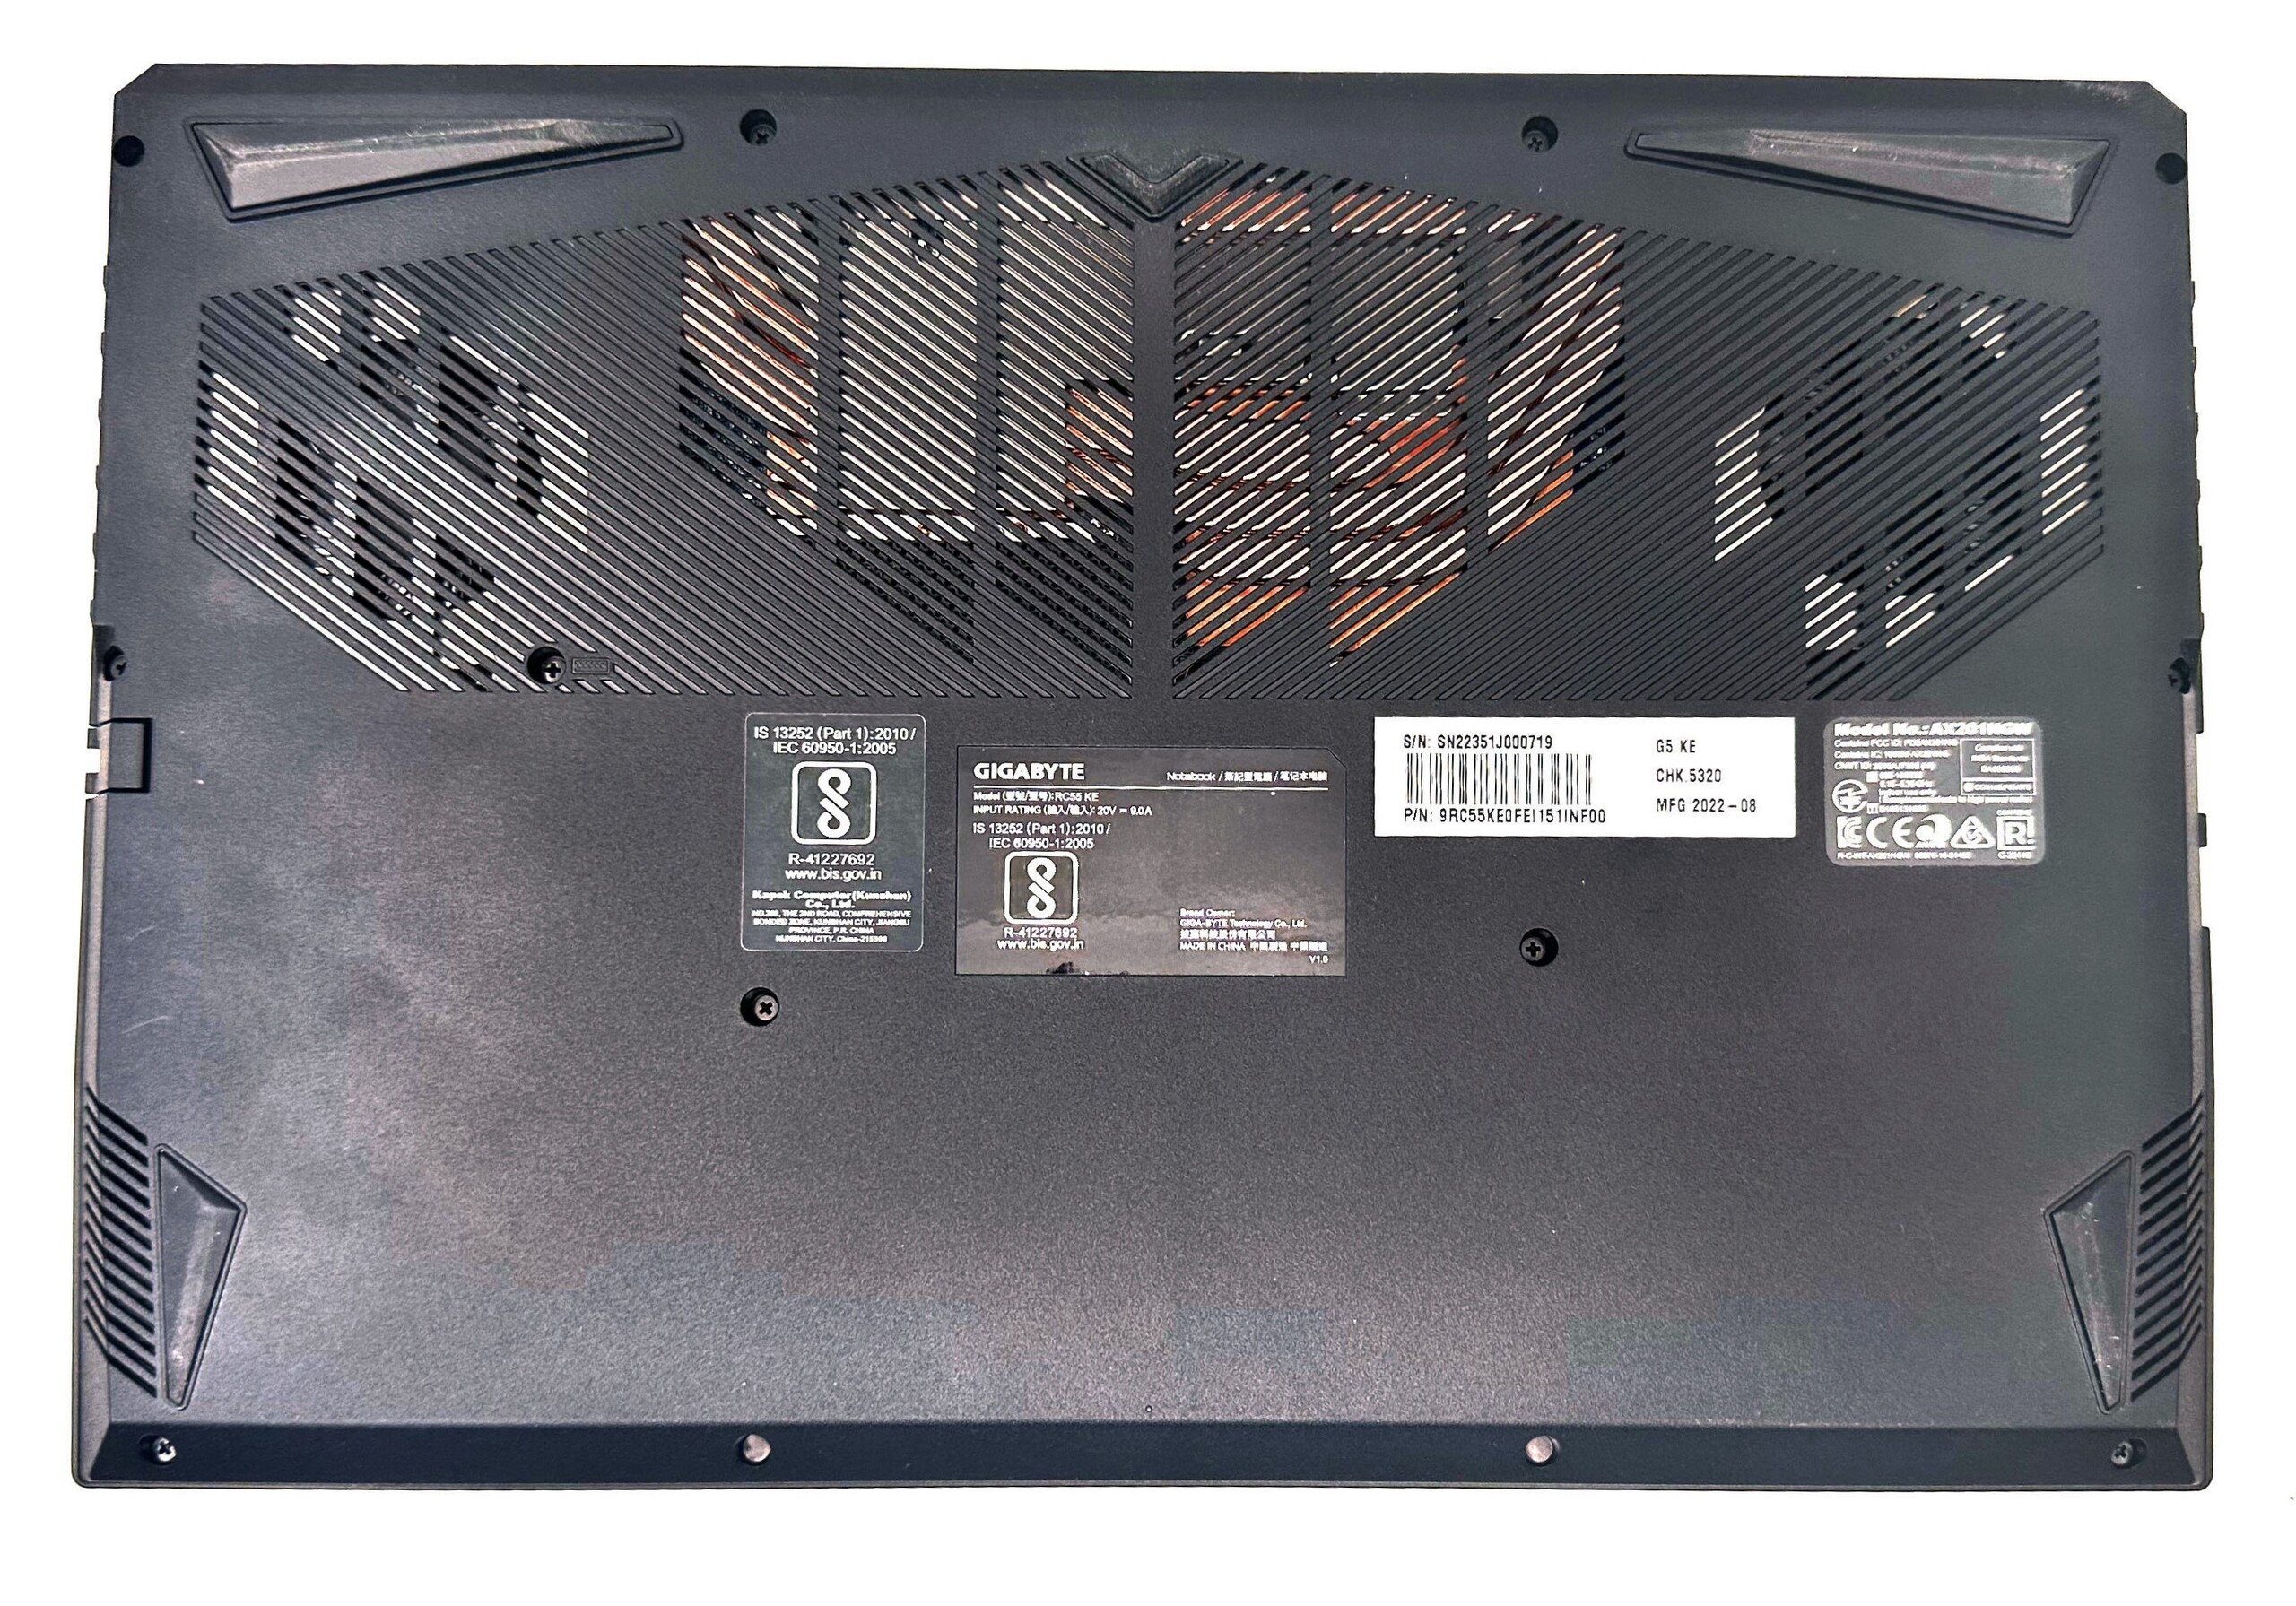
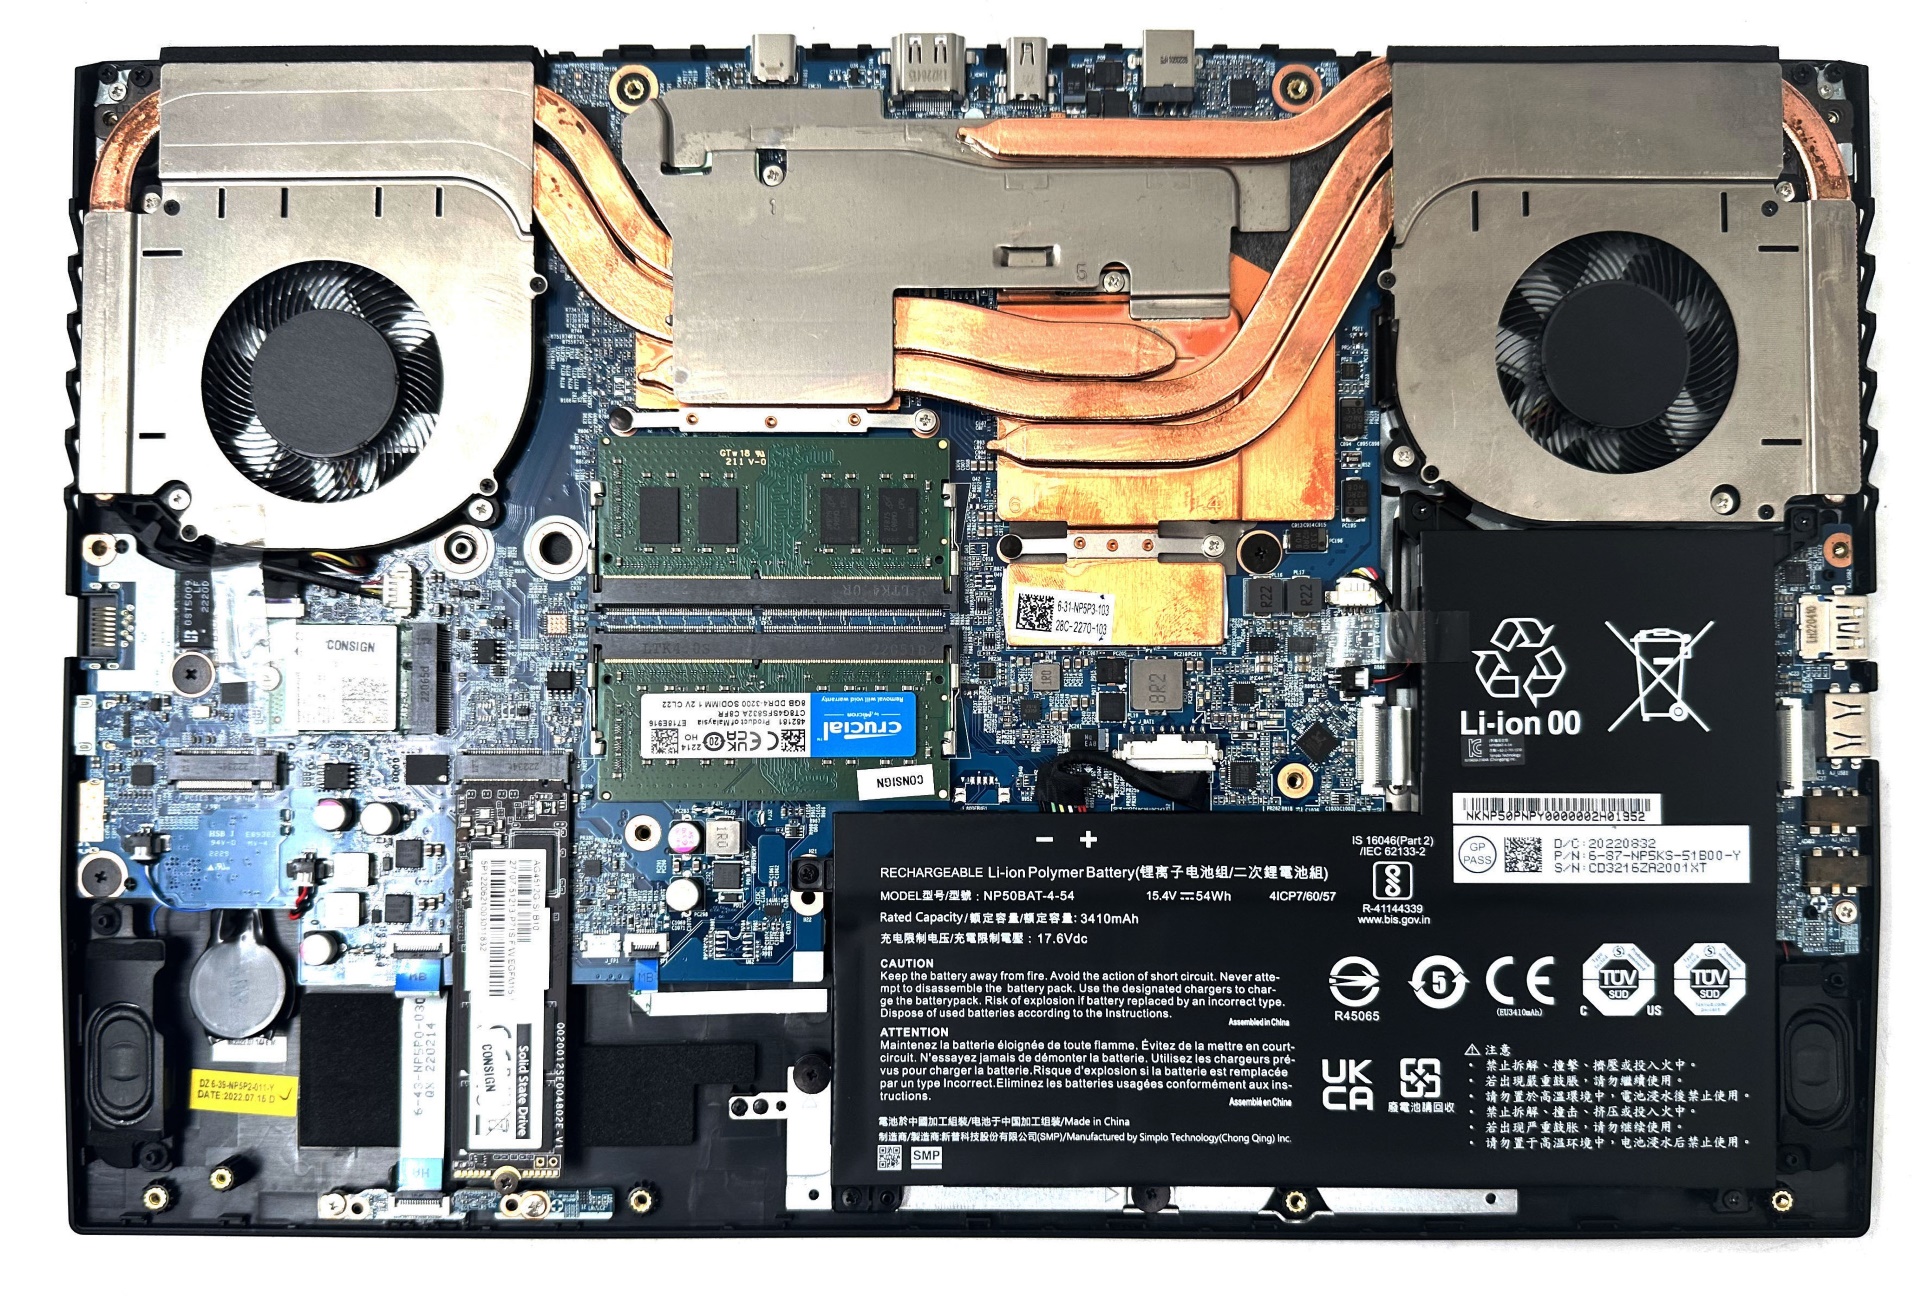
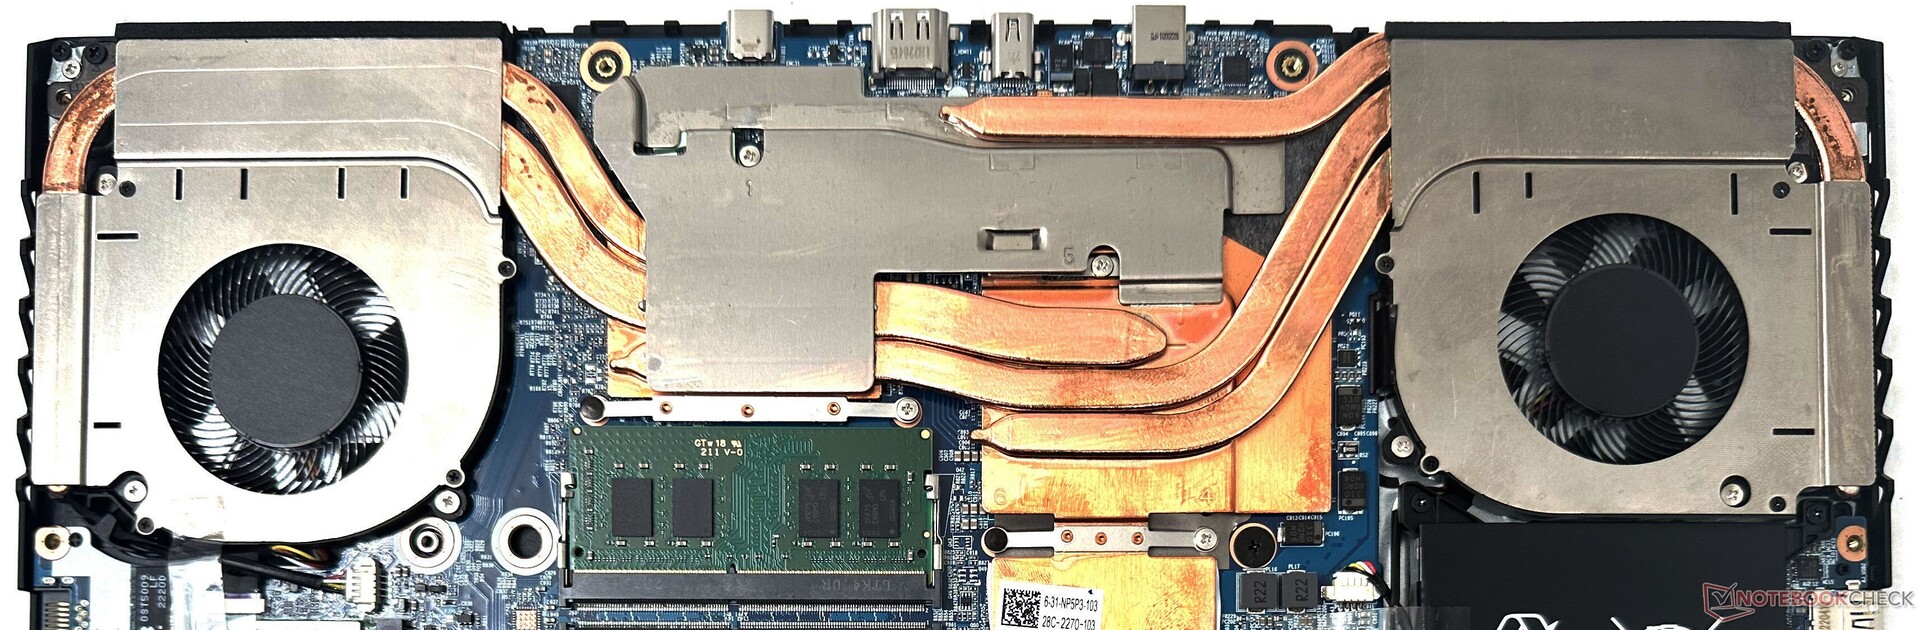
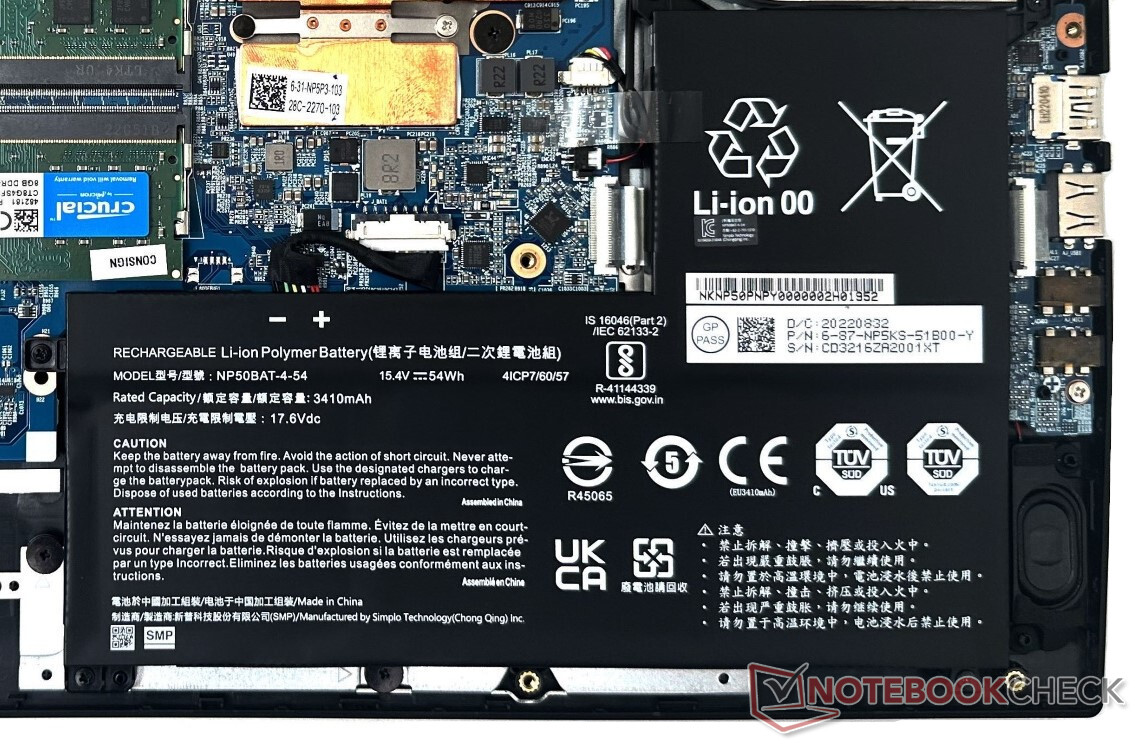
Opening the 13 Philips screws reveals the internals. The DDR4 RAM, WLAN card, and SSDs can be swapped out and upgraded if needed.
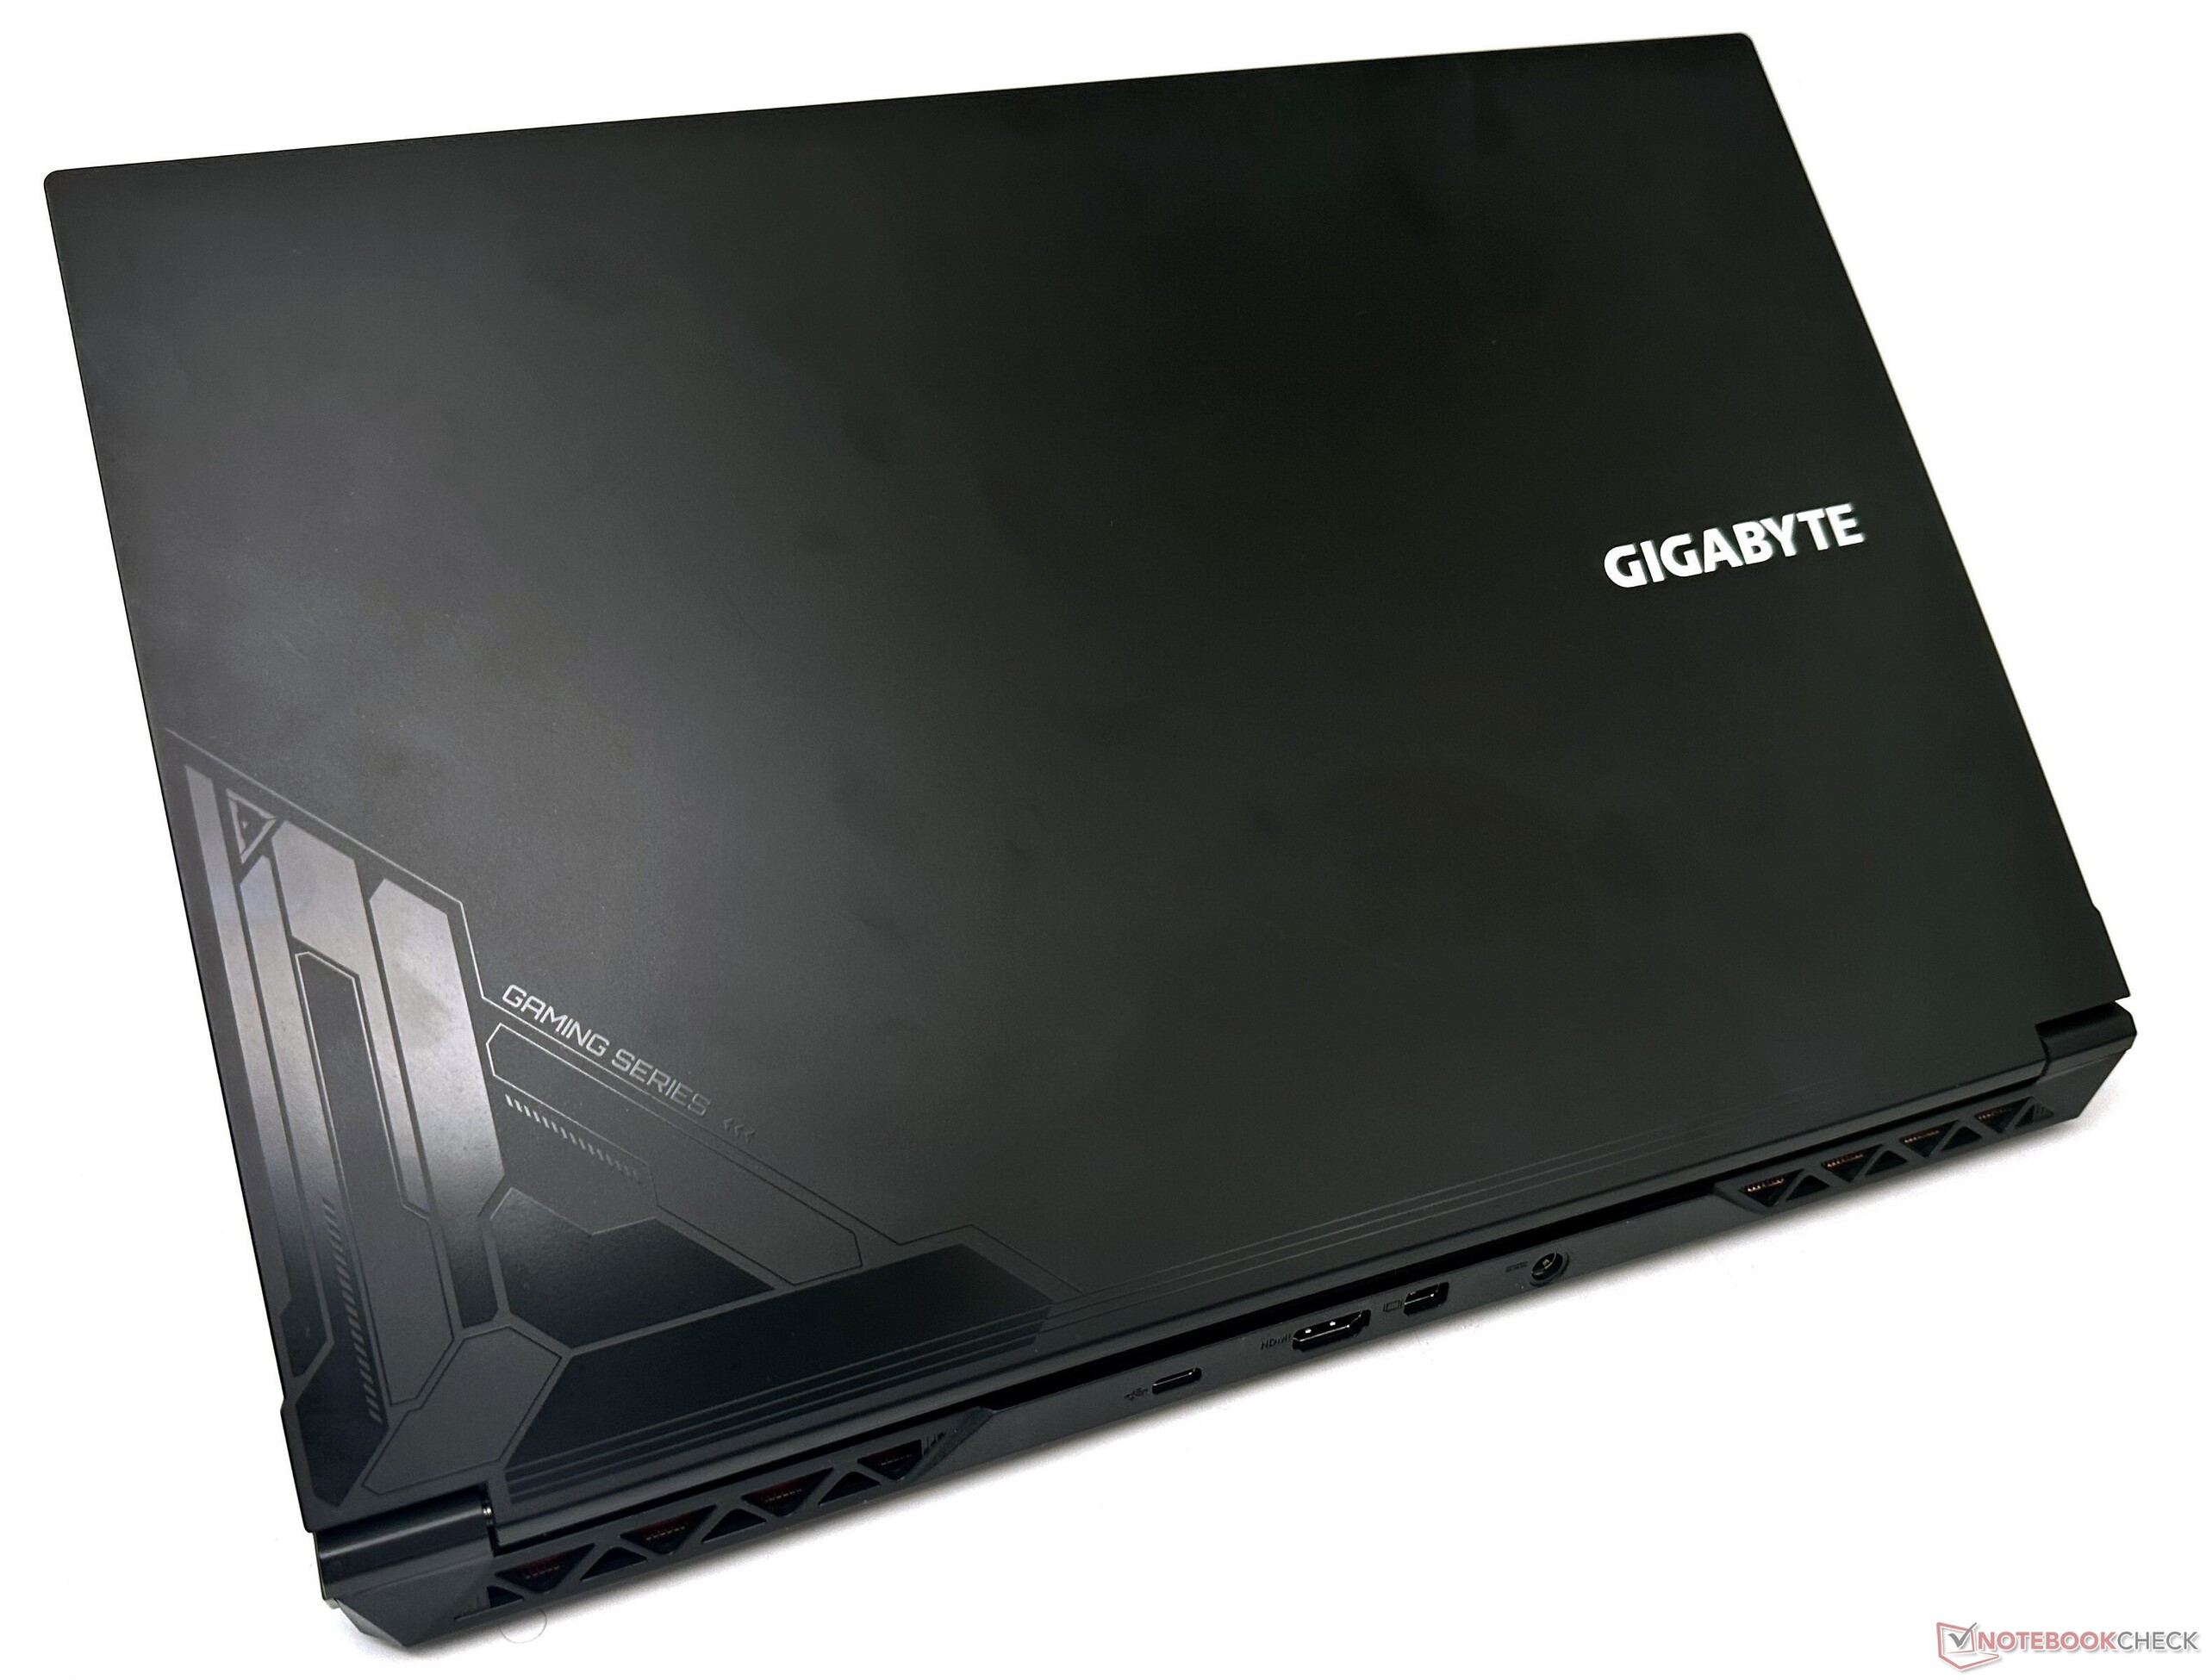

Connectivity: Adequate port selection and stable Wi-Fi
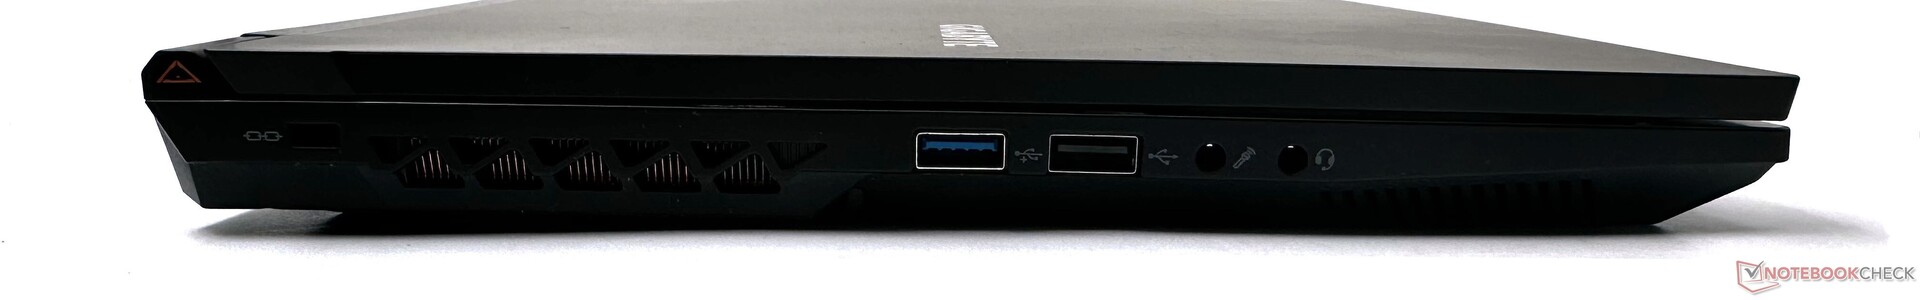
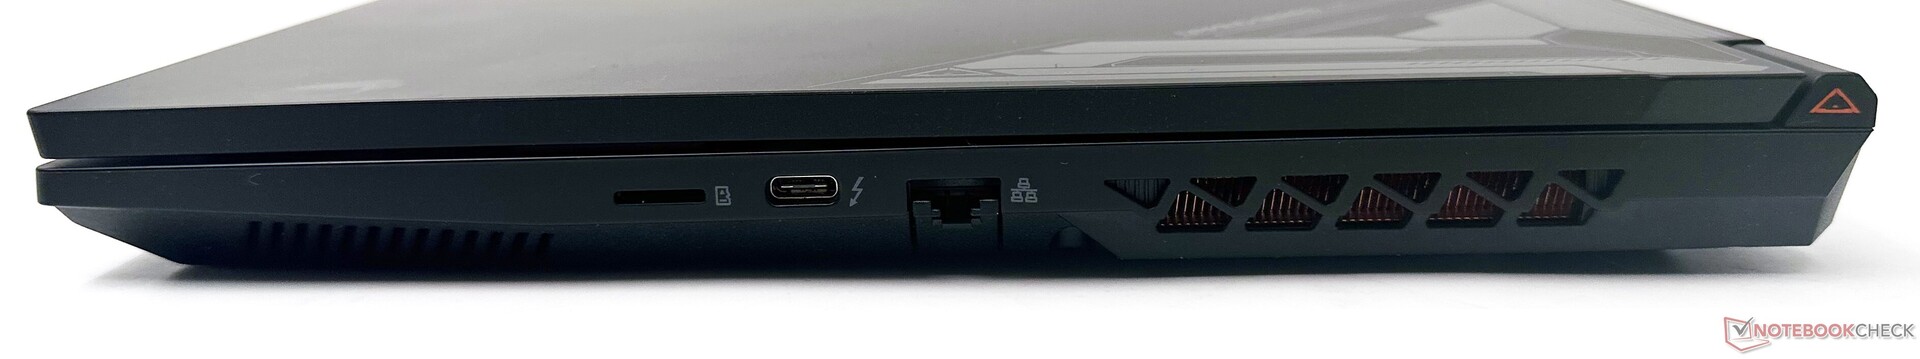
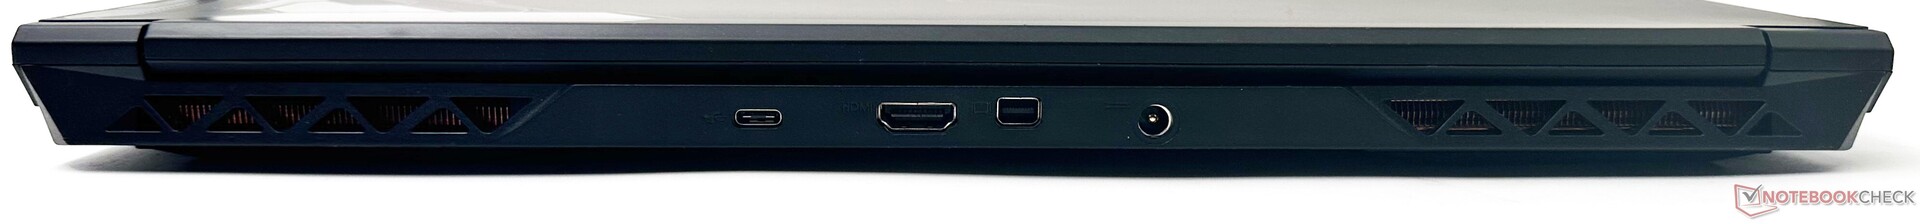
The G5 KE offers a well-rounded port selection with a combination of USB Type-A and Type-C ports including Thunderbolt 4. The presence of a mini-DisplayPort 1.4 in addition to HDMI 2.1-out helps with easy hookup to 4K displays with high refresh rates.
The ports don't pose any hindrance while connecting multiple devices. A dedicated mic-in port — a rarity these days — comes in handy for connecting high quality microphones, or it can be reconfigured to support multi-channel audio.
The microSD card read speeds could have been better, but the G5 KE does not have much competition in this aspect.
| SD Card Reader | |
| average JPG Copy Test (av. of 3 runs) | |
| Average of class Gaming (20.9 - 210, n=54, last 2 years) | |
| Gigabyte G5 KE (AV PRO microSD 128 GB V60) | |
| Schenker XMG Core 15 (M22) (AV PRO microSD 128 GB V60) | |
| HP Victus 16-e0179ng (AV PRO microSD 128 GB V60) | |
| maximum AS SSD Seq Read Test (1GB) | |
| Average of class Gaming (25.5 - 261, n=51, last 2 years) | |
| Gigabyte G5 KE (AV PRO microSD 128 GB V60) | |
| Gigabyte G7 KE (AV PRO microSD 128 GB V60) | |
| Schenker XMG Core 15 (M22) (AV PRO microSD 128 GB V60) | |
| HP Victus 16-e0179ng (AV PRO microSD 128 GB V60) | |
The G5 KE does not offer Wi-Fi 6E. Nevertheless, we observed very good and fairly consistent throughput in the 5 GHz band when tested with our reference Asus ROG Rapture GT-AXE11000 router.
The 720p webcam shows large color deviations and images lack overall sharpness. It should still be serviceable for the odd video call or two.


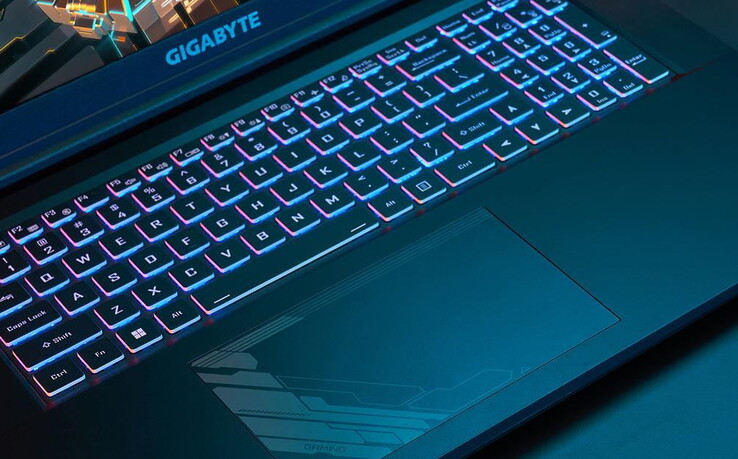
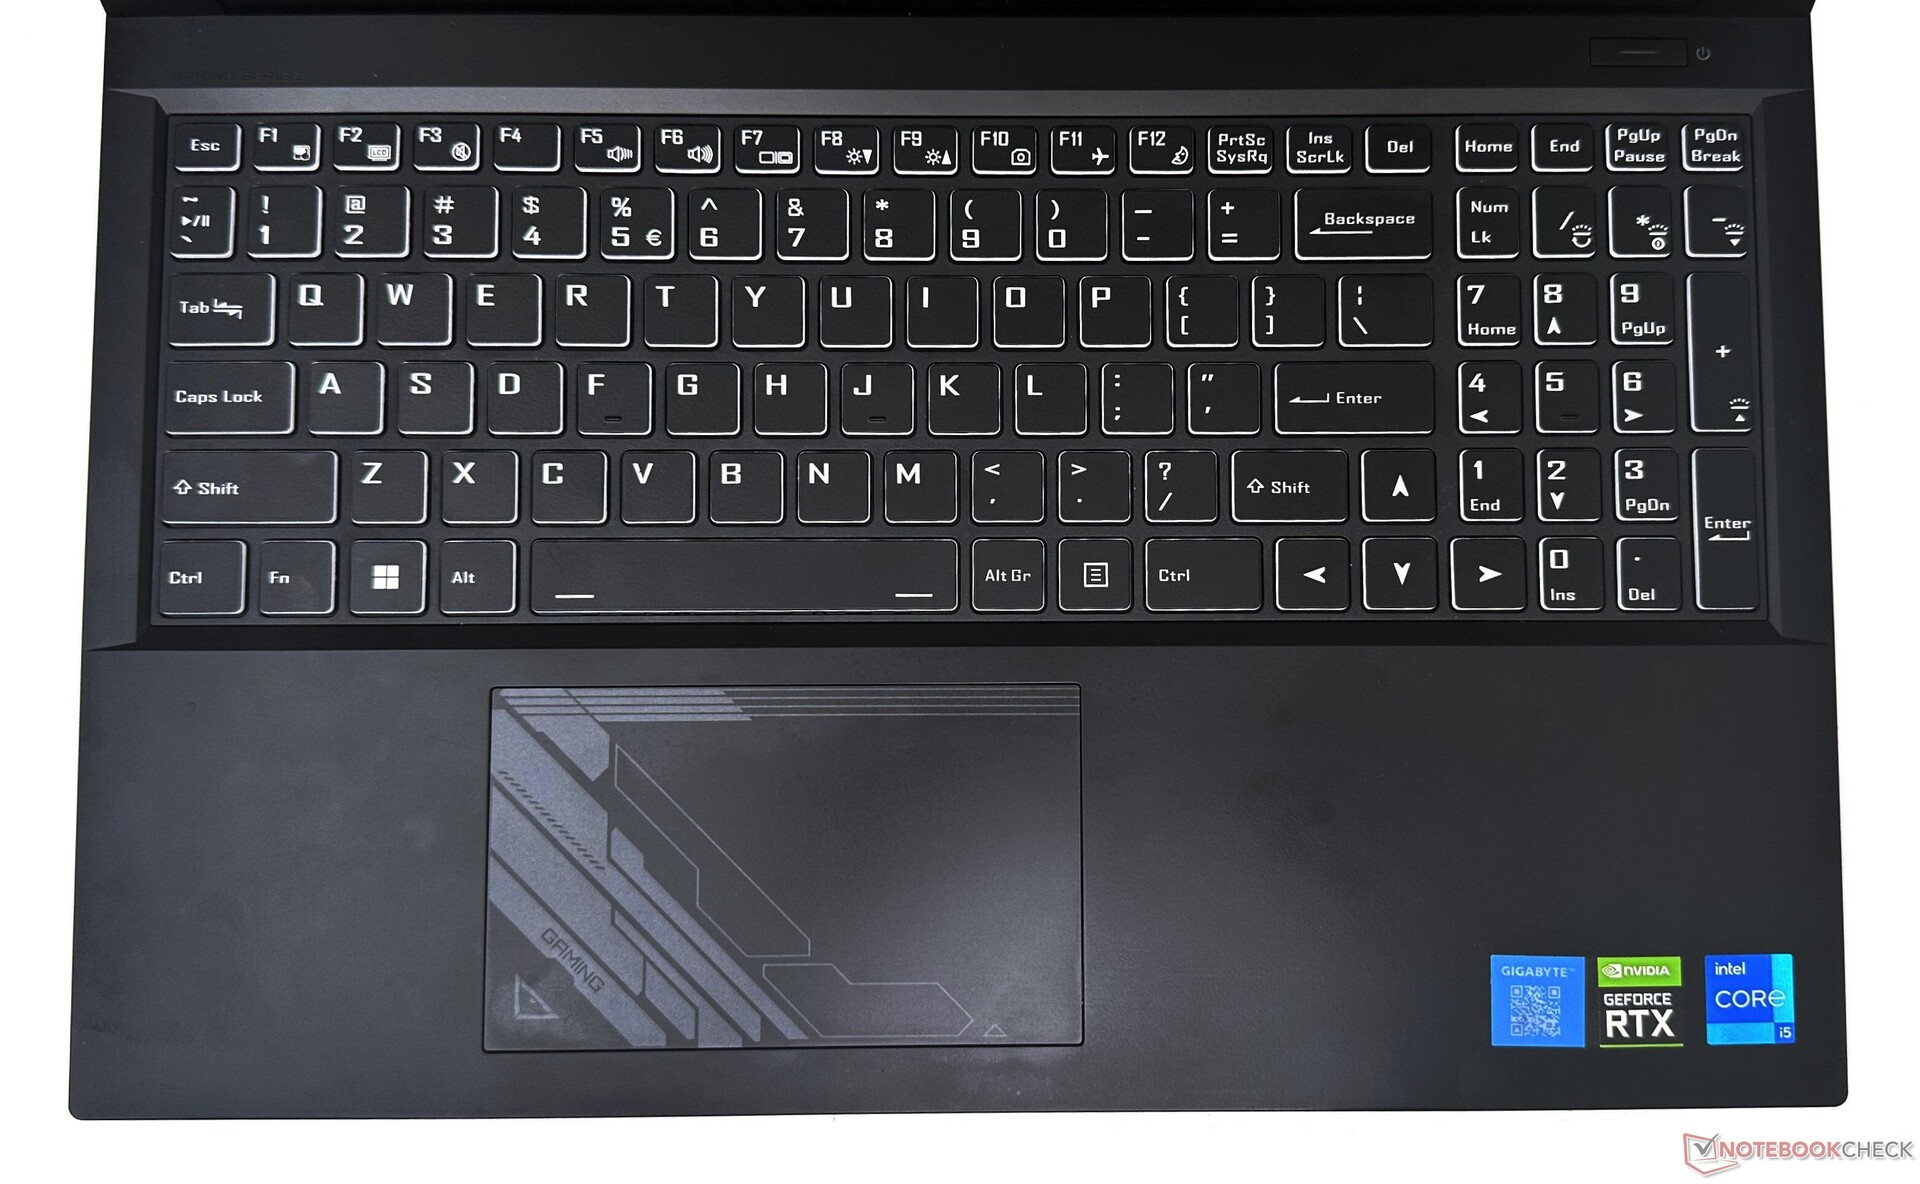
Input Devices: Full-size arrow keys
The chiclet keyboard offers decent travel and actuation. However, typing feels somewhat mushy and the tactile feedback is a bit lacking. Full size arrow keys allow for comfortable navigation across documents and spreadsheets.
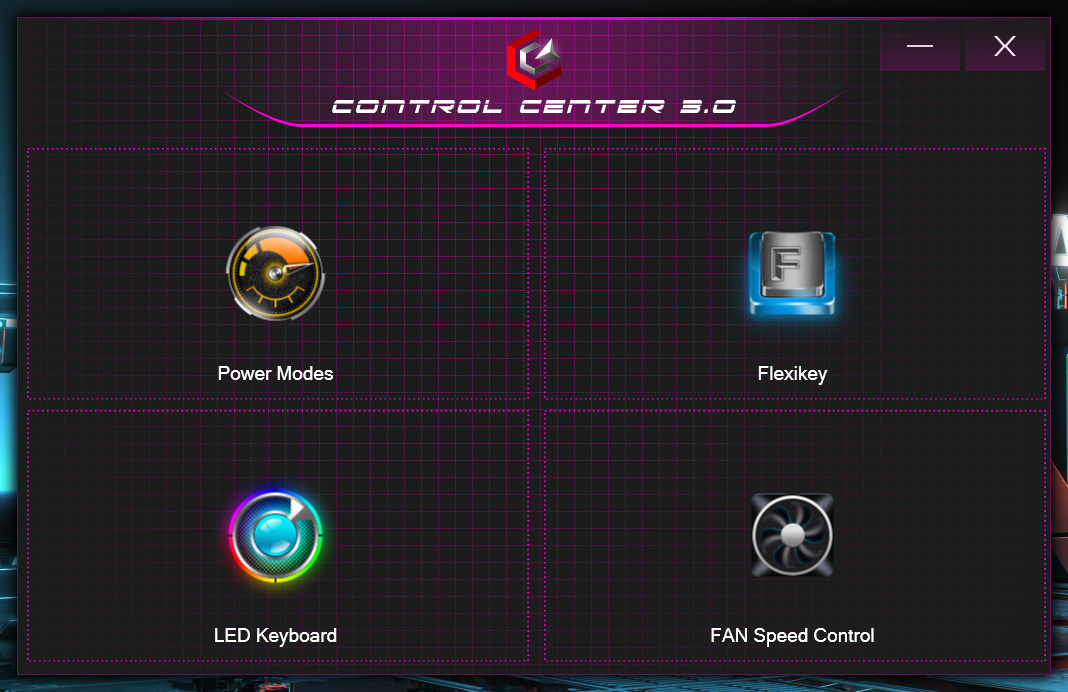
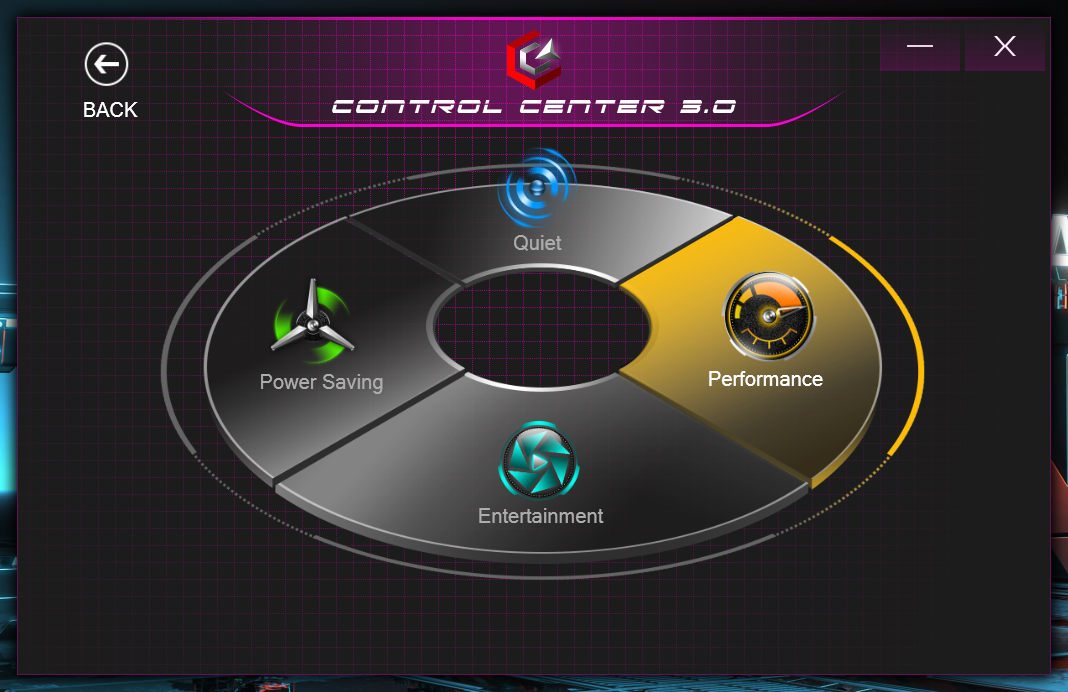
The RGB backlight can be adjusted in four steps. This is not a multi-zone RGB keyboard, but some customization is possible via the Control Center 3.0 software.
The 12 cm x 7.5 cm touchpad is roomy enough, supports Windows Precision gestures, and offers a good gliding experience with minimal resistance. The whole surface acts as a left mouse button. The clicks have short travel and good tactility.
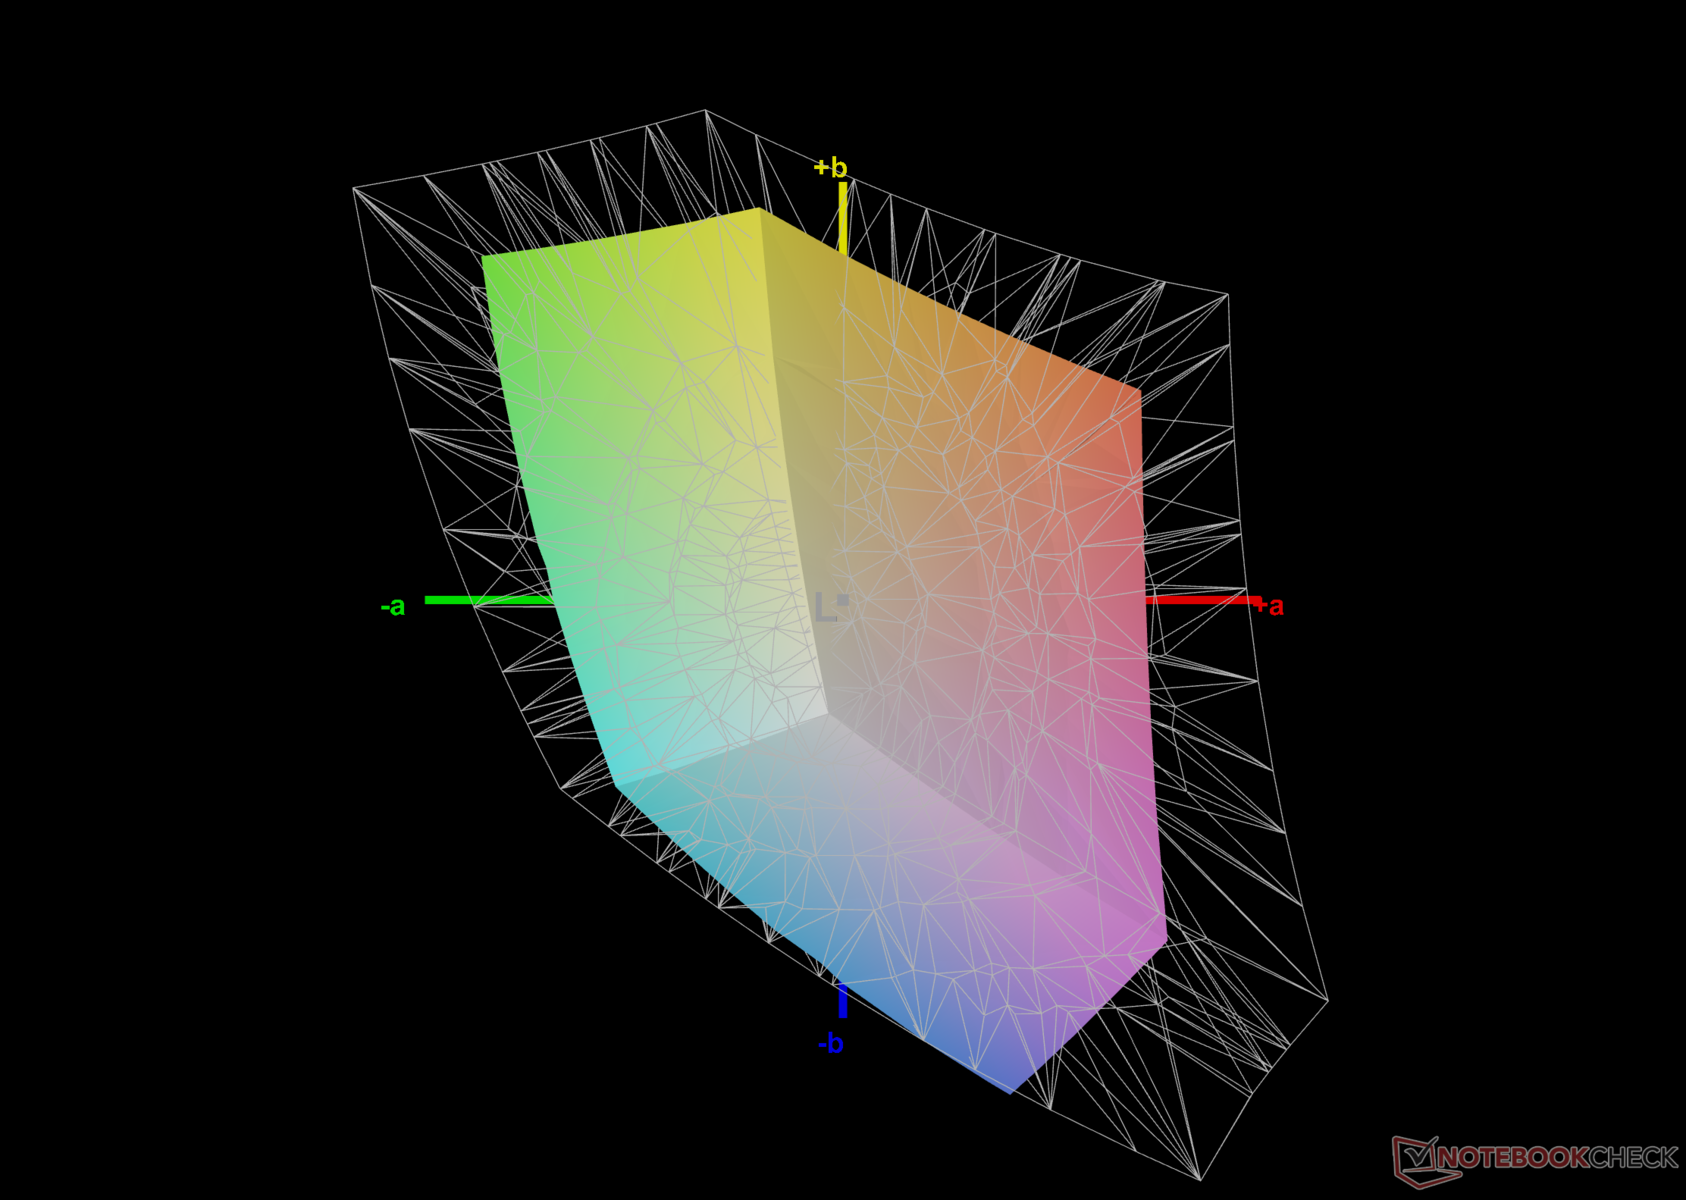
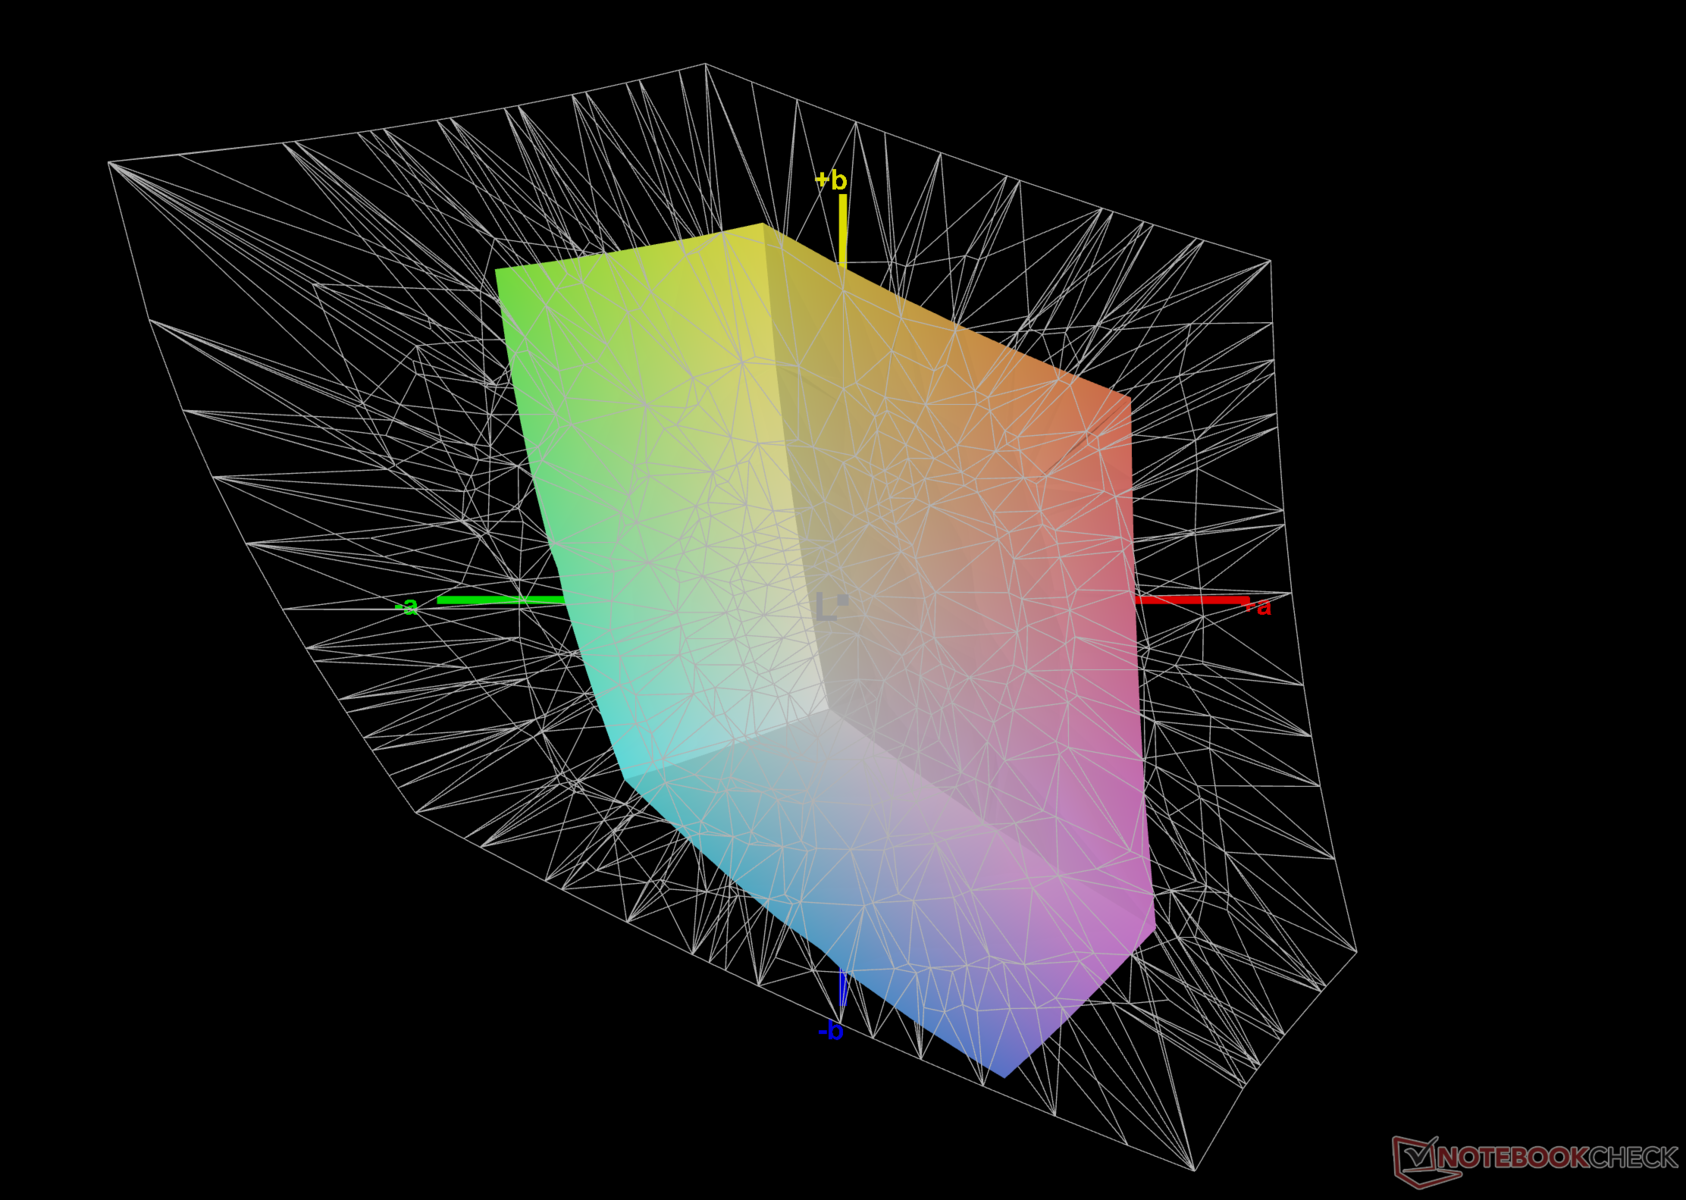
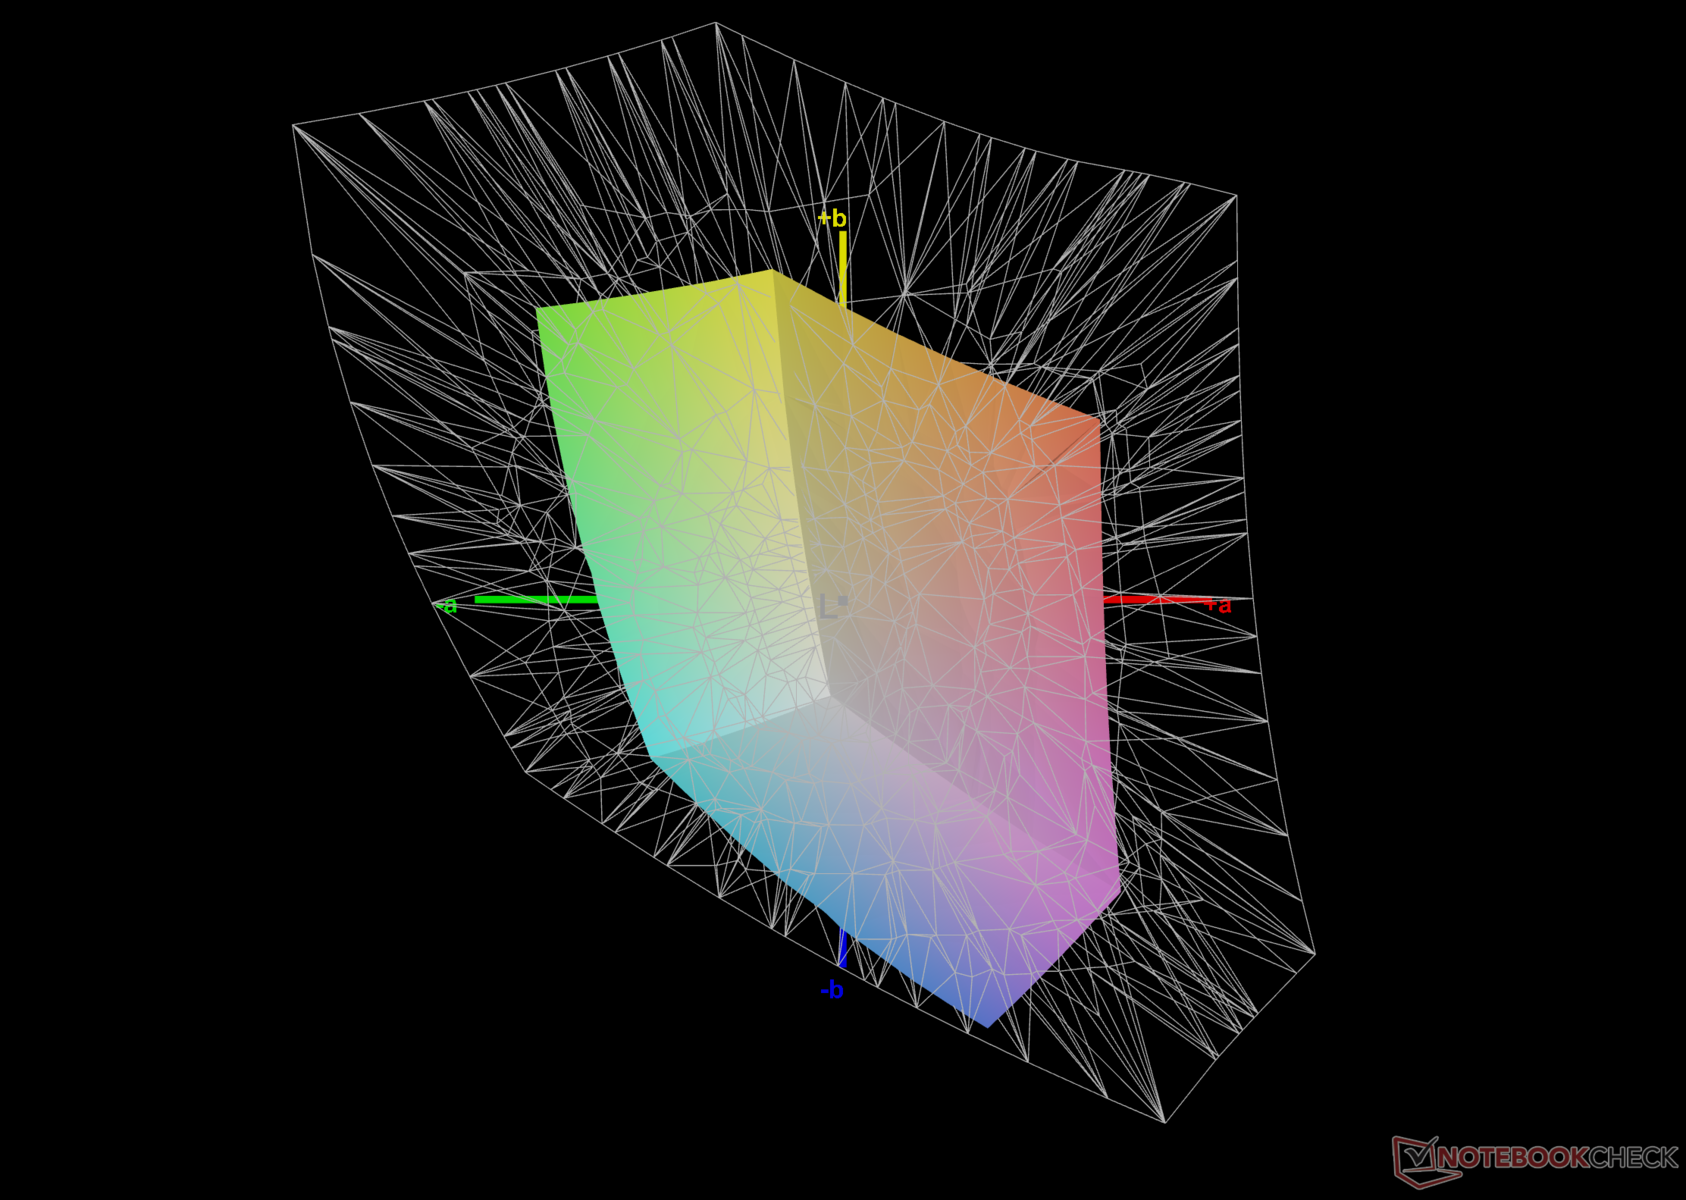
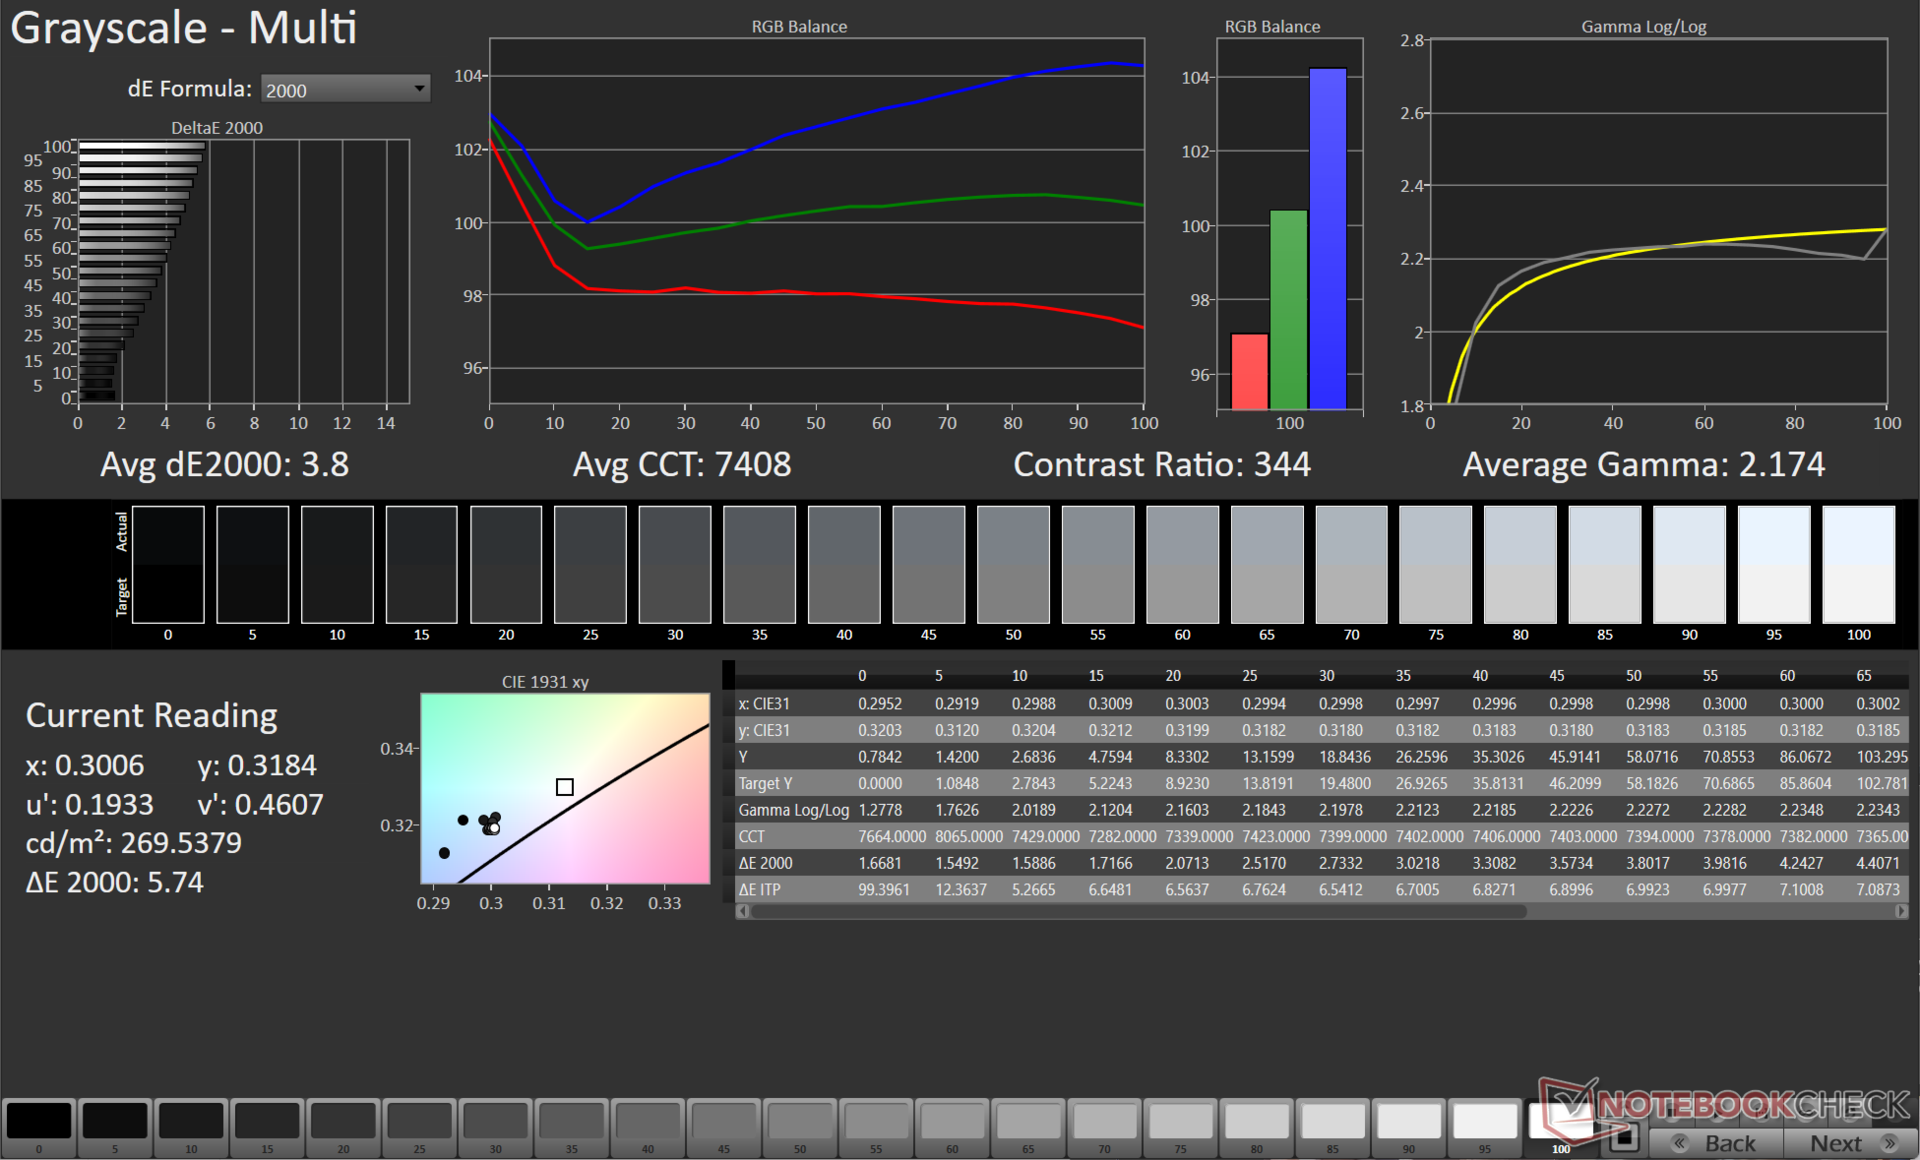
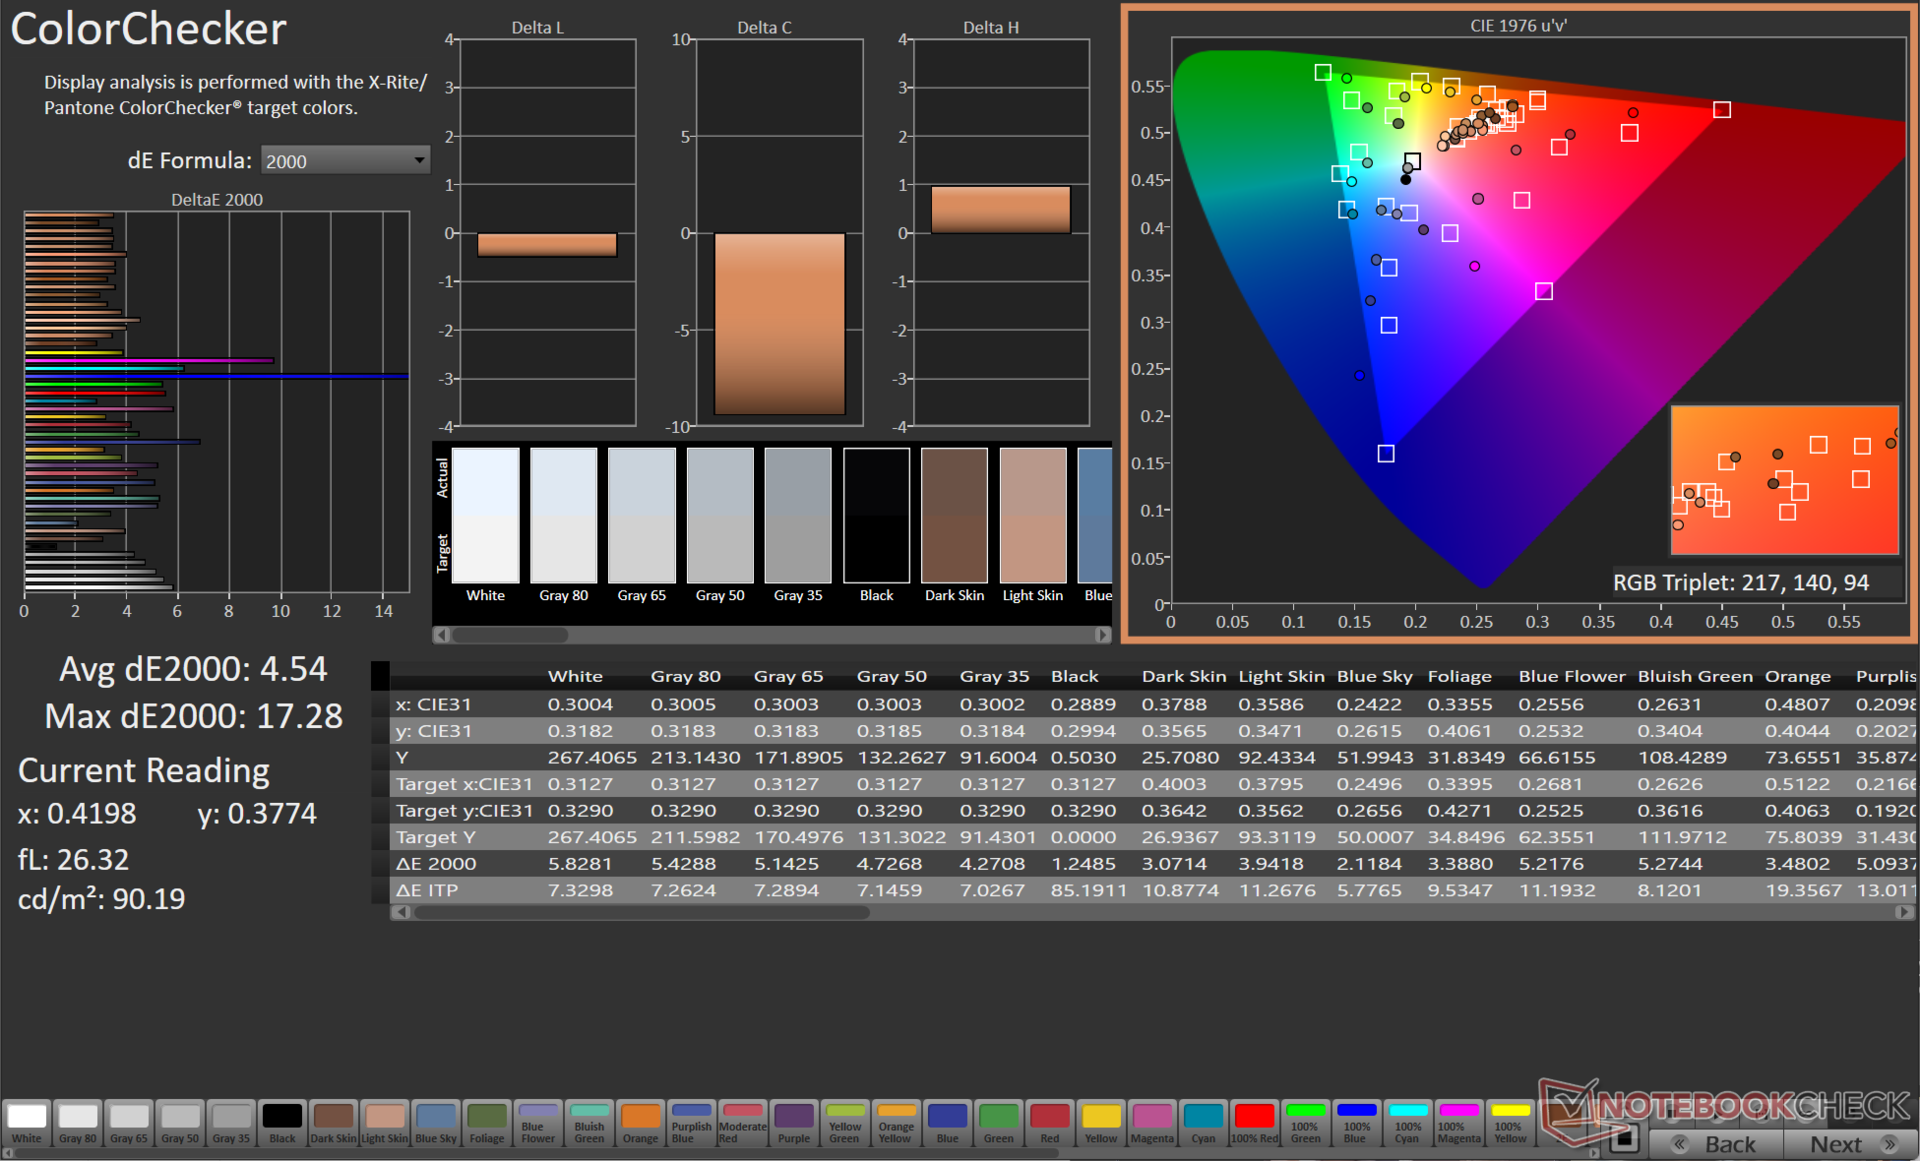
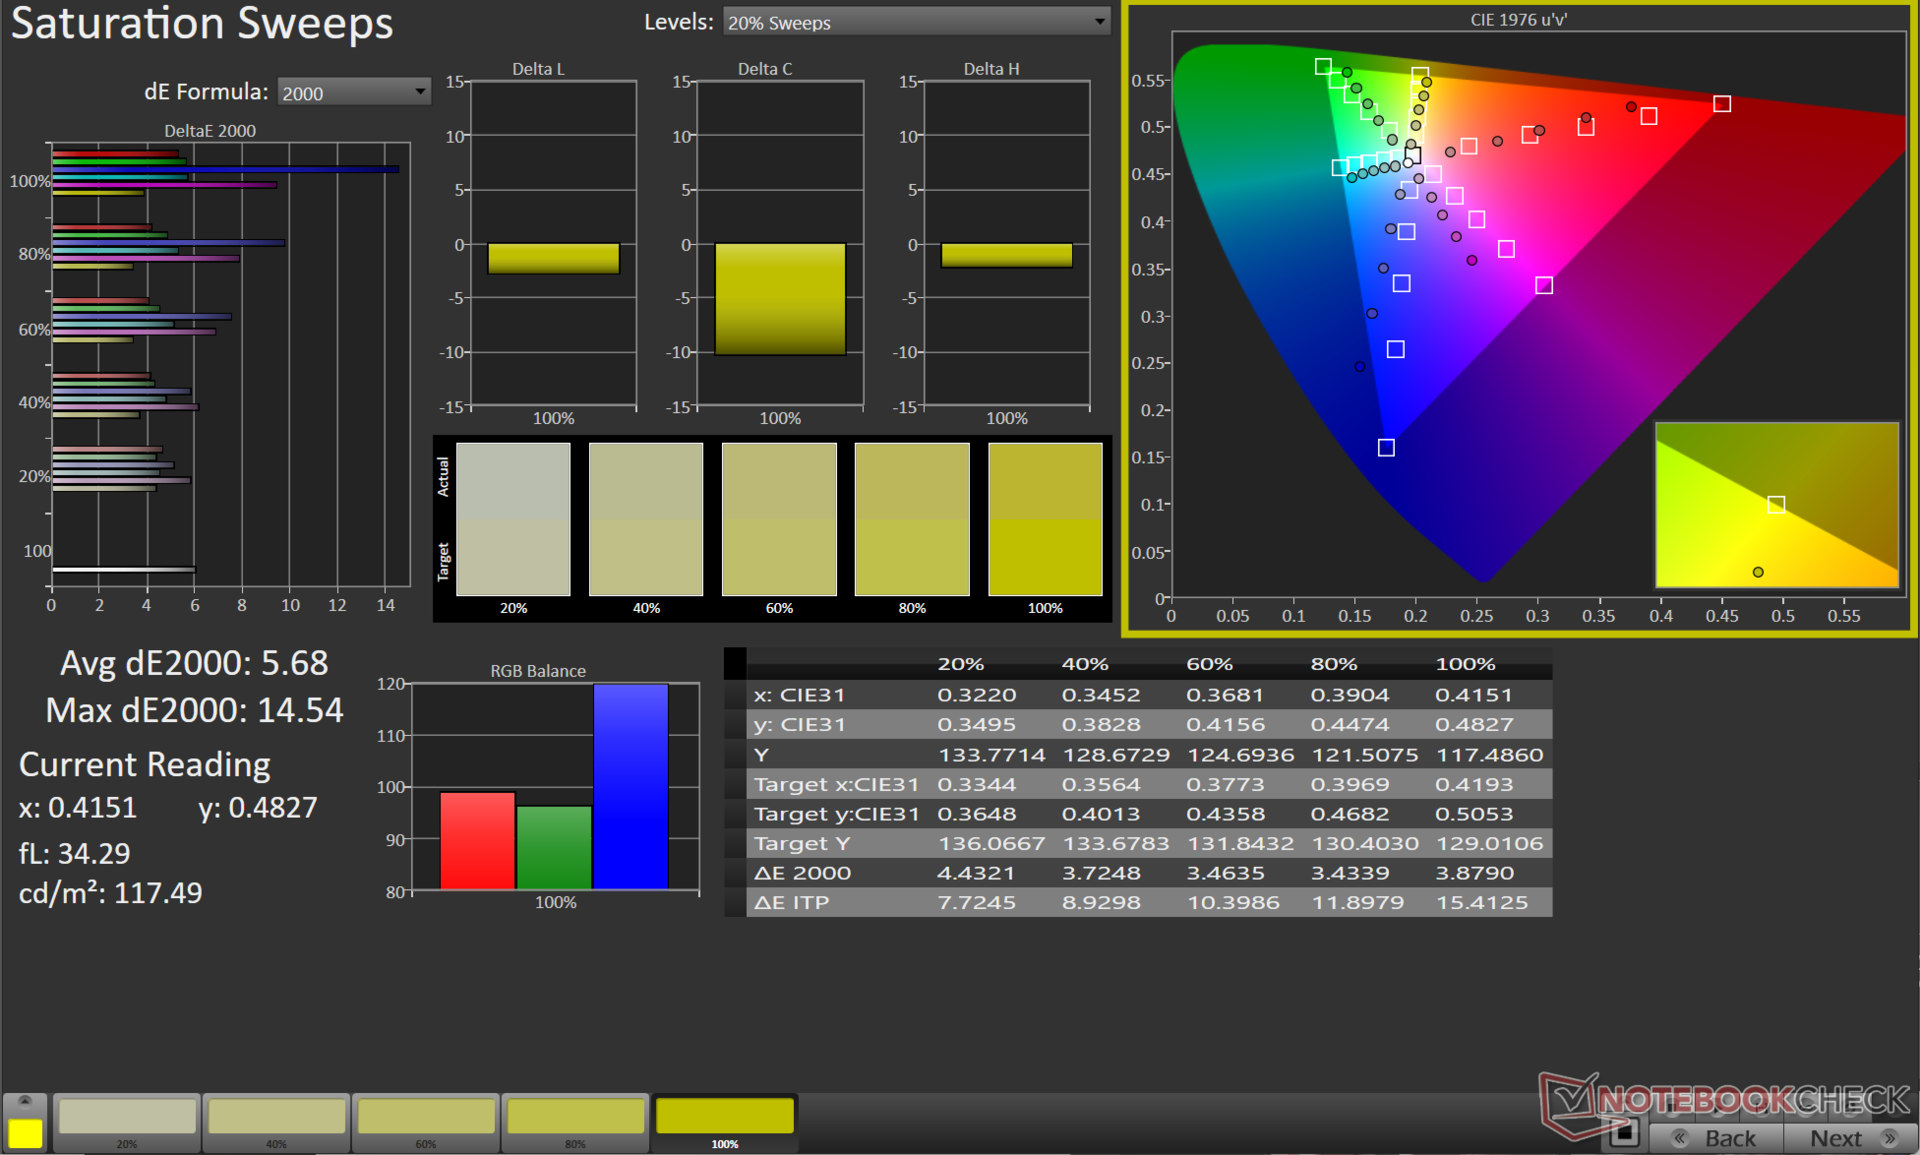
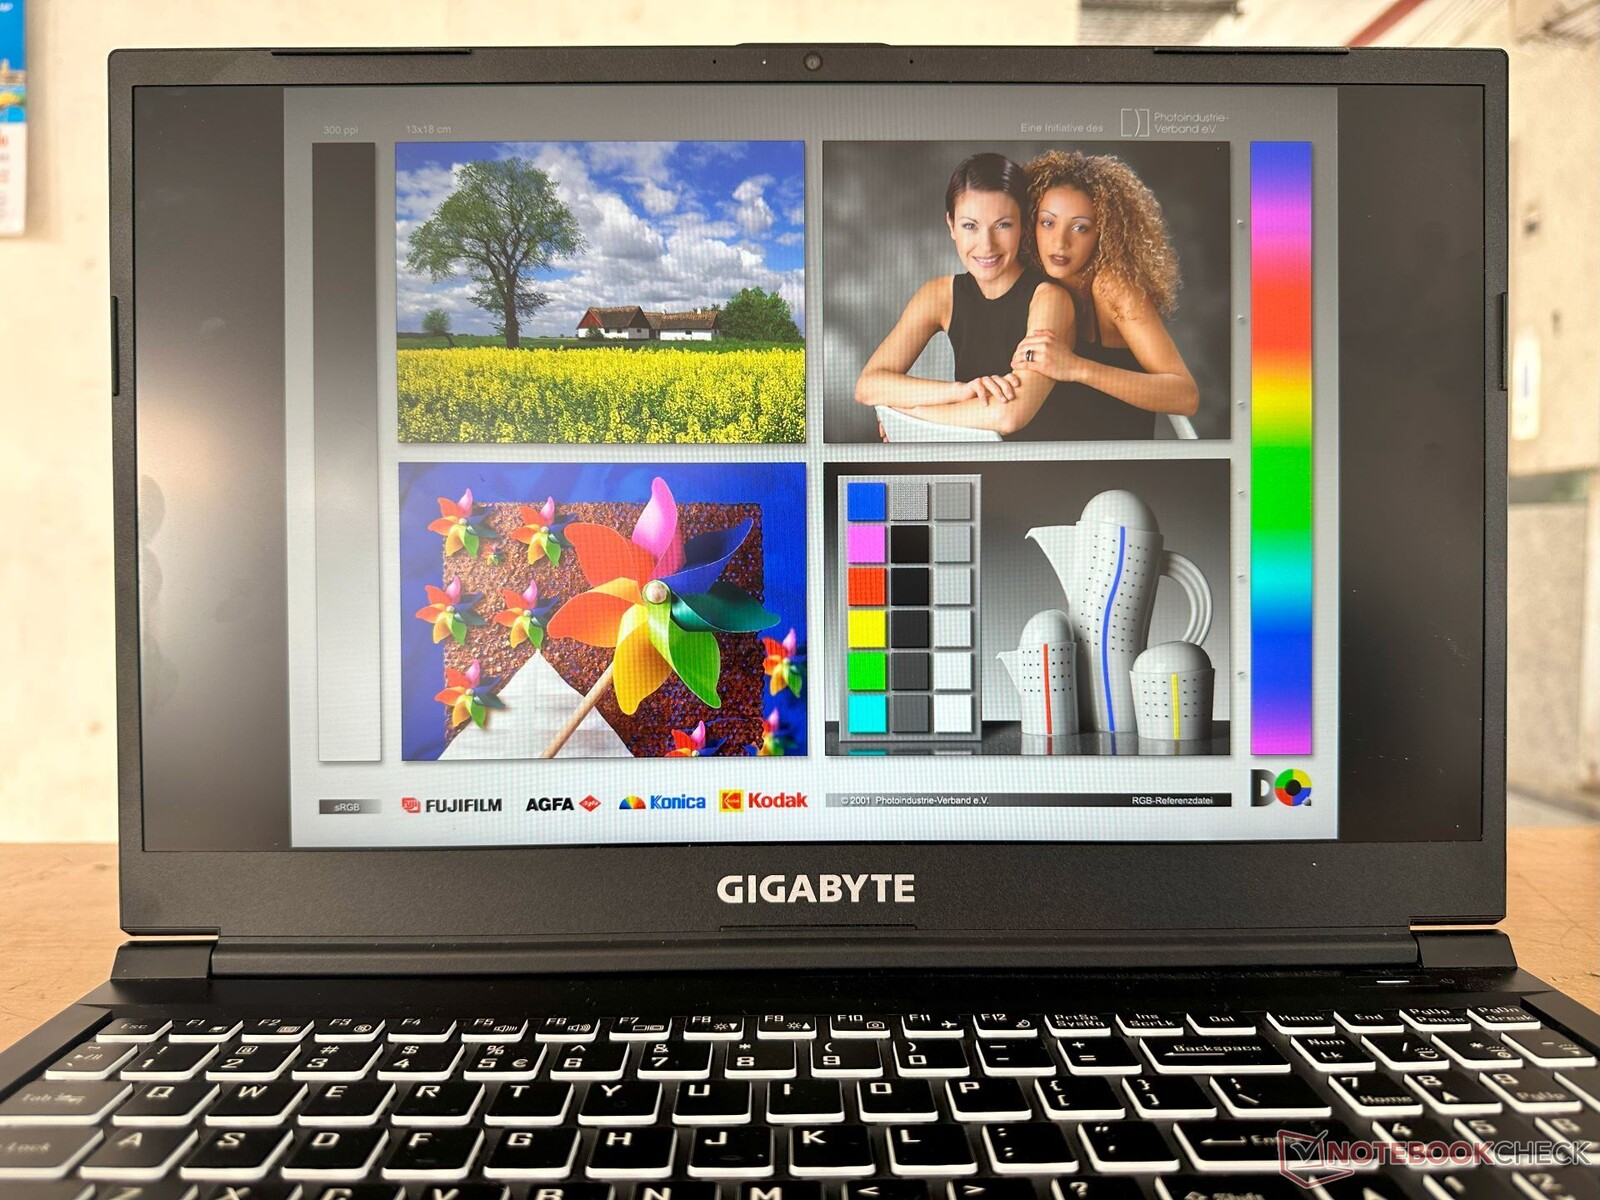
Display: Poor color gamut coverage with high response times and no PWM
The Gigabyte G5 KE's 1080p 144 Hz Chi Mei panel is starting to show its age at this point. We've seen this panel before in the 2021 Gigabyte G5 GD and Asus TUF Gaming F15 FX506HM. The competition has moved on to better panels with a much wider color gamut coverage.
Brightness distribution is decent at 85%, but the color gamut range is poor for a 2023 laptop with an sRGB coverage of just about 61%.


| |||||||||||||||||||||||||
Brightness Distribution: 85 %
Center on Battery: 266 cd/m²
Contrast: 538:1 (Black: 0.5 cd/m²)
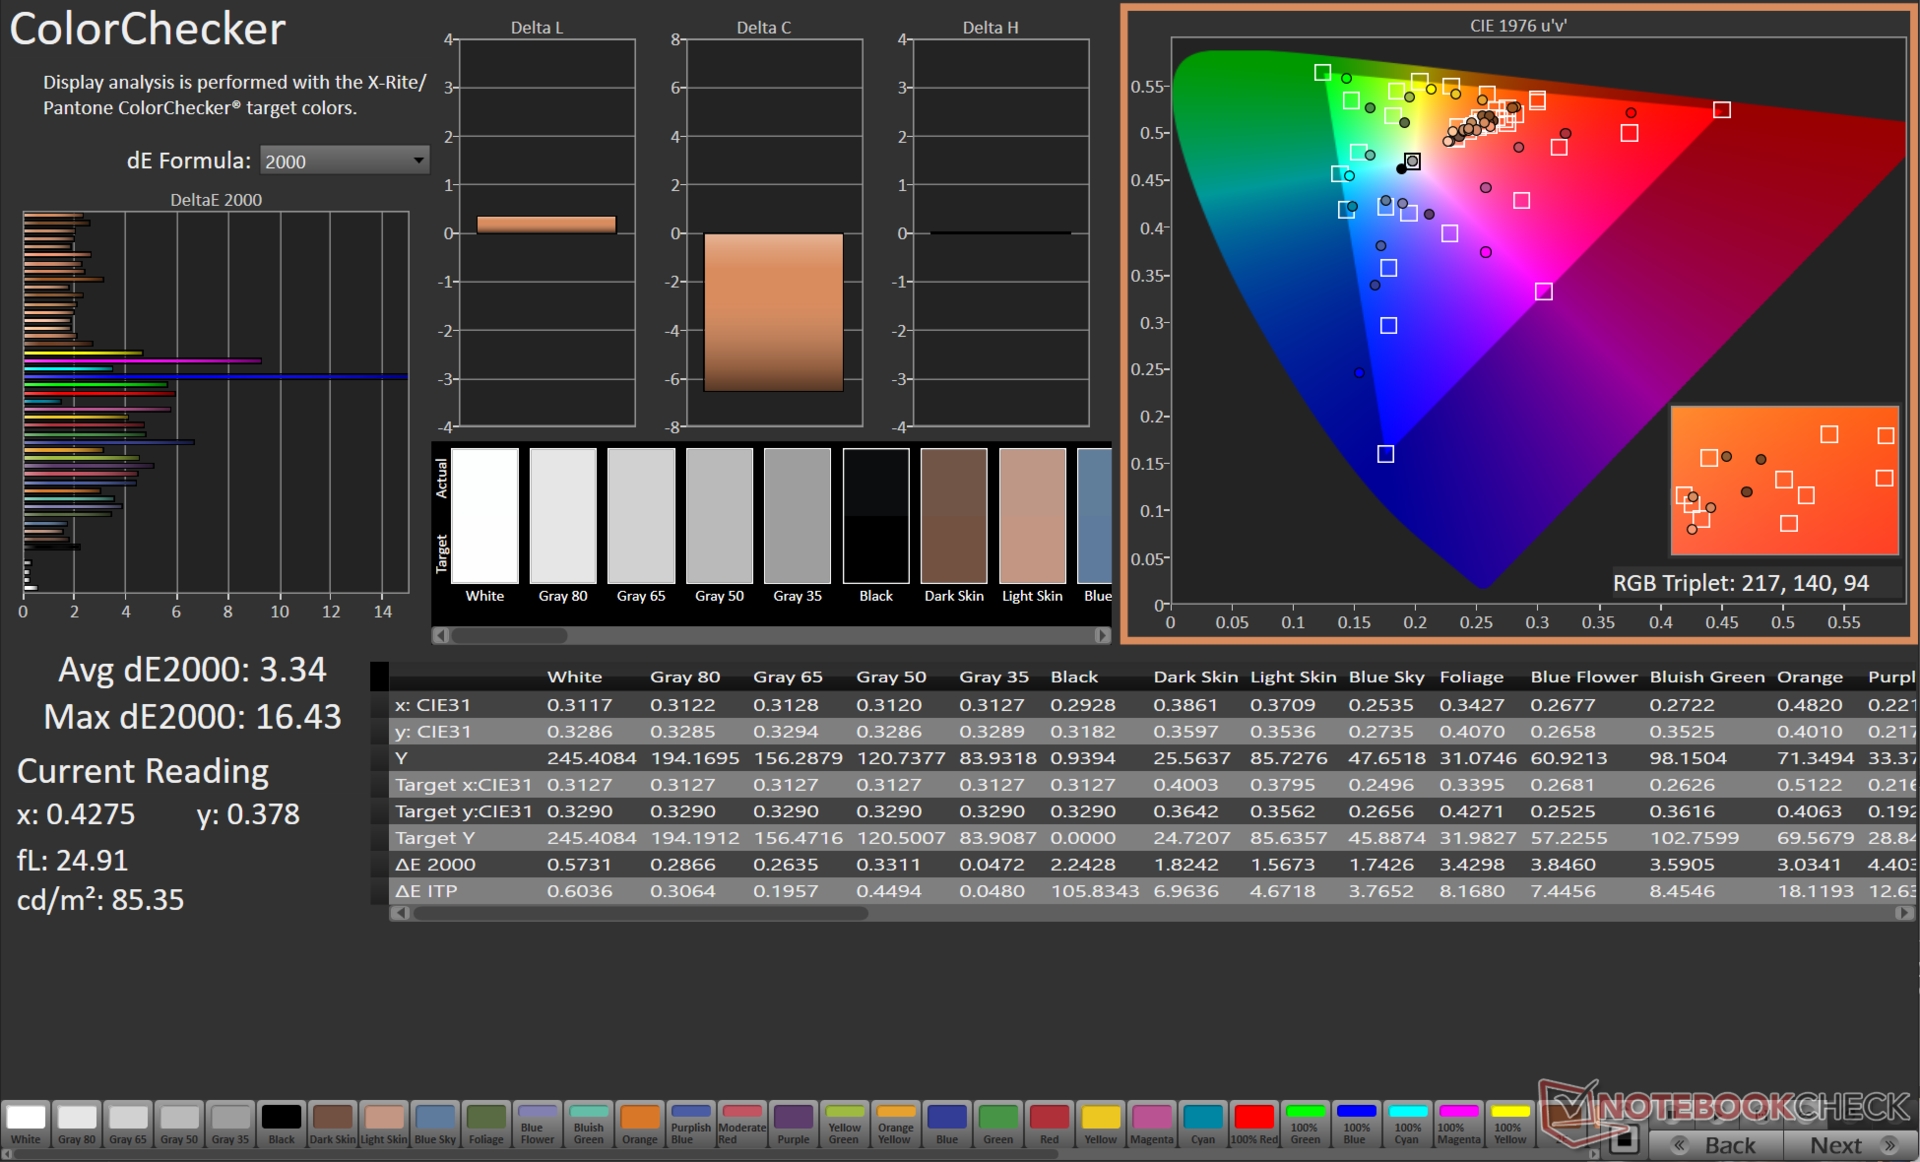
ΔE ColorChecker Calman: 4.54 | ∀{0.5-29.43 Ø4.73}
calibrated: 3.34
ΔE Greyscale Calman: 3.8 | ∀{0.09-98 Ø4.97}
42.1% AdobeRGB 1998 (Argyll 3D)
61% sRGB (Argyll 3D)
40.7% Display P3 (Argyll 3D)
Gamma: 2.17
CCT: 7408 K
| Gigabyte G5 KE Chi Mei N156HRA-EA1, , 1920x1080, 15.6" | Lenovo IdeaPad Gaming 3 15IAH7 Lenovo LEN156FHD, , 1920x1080, 15.6" | Gigabyte G7 KE AU Optronics B173HAN05.1, , 1920x1080, 17.3" | Honor MagicBook 14 2022 HD140ZB-01A, , 2160x1440, 14" | Schenker XMG Core 15 (M22) CSOT MNF601CA1-1, , 2560x1440, 15.6" | Dell G16 7620 BOE NE16QDM, , 2560x1600, 16" | Gigabyte A5 K1 BOEhydis NV156FHM-N4K (BOE08B3), , 1920x1080, 15.6" | Asus TUF Gaming F15 FX507ZM TL156VDXP0101, , 1920x1080, 15.6" | HP Victus 16-e0179ng BOE09BE, , 1920x1080, 16.1" | |
|---|---|---|---|---|---|---|---|---|---|
| Display | 66% | 69% | 64% | 66% | 65% | 56% | 62% | 72% | |
| Display P3 Coverage (%) | 40.7 | 69.1 70% | 70.4 73% | 67.9 67% | 68.8 69% | 68.3 68% | 64.4 58% | 66.4 63% | 72.6 78% |
| sRGB Coverage (%) | 61 | 99.2 63% | 99.8 64% | 98.5 61% | 99.3 63% | 98 61% | 92.5 52% | 97 59% | 100 64% |
| AdobeRGB 1998 Coverage (%) | 42.1 | 69.9 66% | 71.7 70% | 68.7 63% | 69.9 66% | 70.5 67% | 66.1 57% | 68.5 63% | 73.5 75% |
| Response Times | 53% | 68% | -41% | 50% | 56% | 48% | 55% | 44% | |
| Response Time Grey 50% / Grey 80% * (ms) | 26.64 ? | 13 ? 51% | 5 ? 81% | 37.2 ? -40% | 16 ? 40% | 8.6 ? 68% | 14.5 ? 46% | 5.6 ? 79% | 9.6 ? 64% |
| Response Time Black / White * (ms) | 18.65 ? | 8.4 ? 55% | 8.3 ? 55% | 26.3 ? -41% | 7.6 ? 59% | 10.4 ? 44% | 9.5 ? 49% | 12.8 ? 31% | 14.4 ? 23% |
| PWM Frequency (Hz) | 28400 ? | ||||||||
| Screen | 40% | 61% | 57% | 40% | 49% | 31% | 52% | 43% | |
| Brightness middle (cd/m²) | 269 | 338 26% | 307 14% | 330 23% | 378 41% | 369.4 37% | 295 10% | 353.7 31% | 361 34% |
| Brightness (cd/m²) | 248 | 329 33% | 301 21% | 320 29% | 371 50% | 348 40% | 281 13% | 340 37% | 341 38% |
| Brightness Distribution (%) | 85 | 92 8% | 93 9% | 90 6% | 93 9% | 83 -2% | 83 -2% | 89 5% | 88 4% |
| Black Level * (cd/m²) | 0.5 | 0.27 46% | 0.2 60% | 0.21 58% | 0.33 34% | 0.32 36% | 0.29 42% | 0.34 32% | 0.3 40% |
| Contrast (:1) | 538 | 1252 133% | 1535 185% | 1571 192% | 1145 113% | 1154 114% | 1017 89% | 1040 93% | 1203 124% |
| Colorchecker dE 2000 * | 4.54 | 2.88 37% | 1.32 71% | 1.8 60% | 2.84 37% | 1.78 61% | 4.36 4% | 1.74 62% | 2.44 46% |
| Colorchecker dE 2000 max. * | 17.28 | 9.35 46% | 4.6 73% | 4.7 73% | 5.51 68% | 4.41 74% | 6.92 60% | 3.63 79% | 6.37 63% |
| Colorchecker dE 2000 calibrated * | 3.34 | 1.22 63% | 1.03 69% | 1.6 52% | 2.75 18% | 1.22 63% | 1.2 64% | 0.5 85% | 1.26 62% |
| Greyscale dE 2000 * | 3.8 | 5 -32% | 2.1 45% | 3 21% | 4.08 -7% | 3.2 16% | 3.9 -3% | 2.1 45% | 4.6 -21% |
| Gamma | 2.17 101% | 2.162 102% | 2.247 98% | 2.18 101% | 2.4 92% | 2.2 100% | 2.106 104% | 2.3 96% | 2.268 97% |
| CCT | 7408 88% | 7497 87% | 6815 95% | 6697 97% | 5841 111% | 6750 96% | 7300 89% | 6257 104% | 6609 98% |
| Total Average (Program / Settings) | 53% /
48% | 66% /
64% | 27% /
45% | 52% /
47% | 57% /
53% | 45% /
39% | 56% /
55% | 53% /
50% |
* ... smaller is better
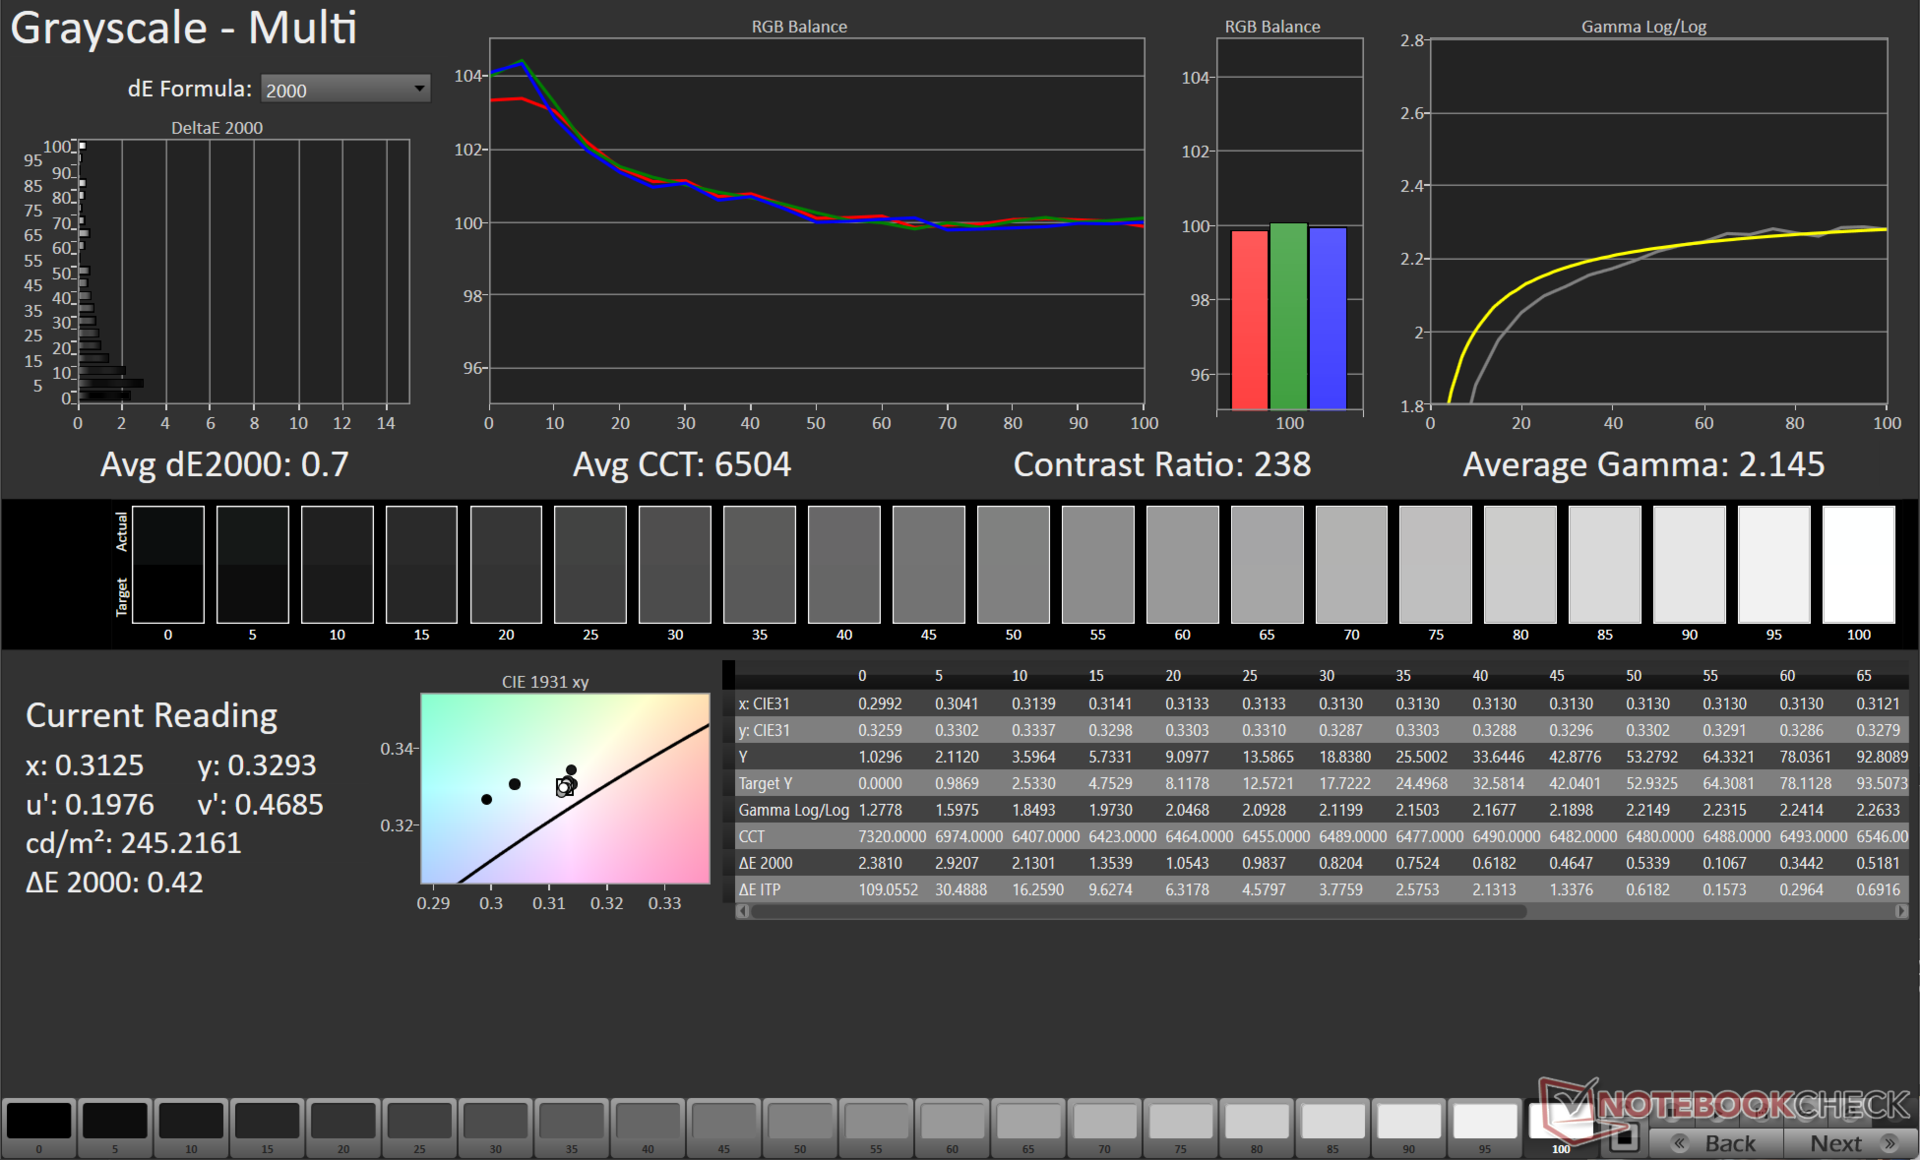
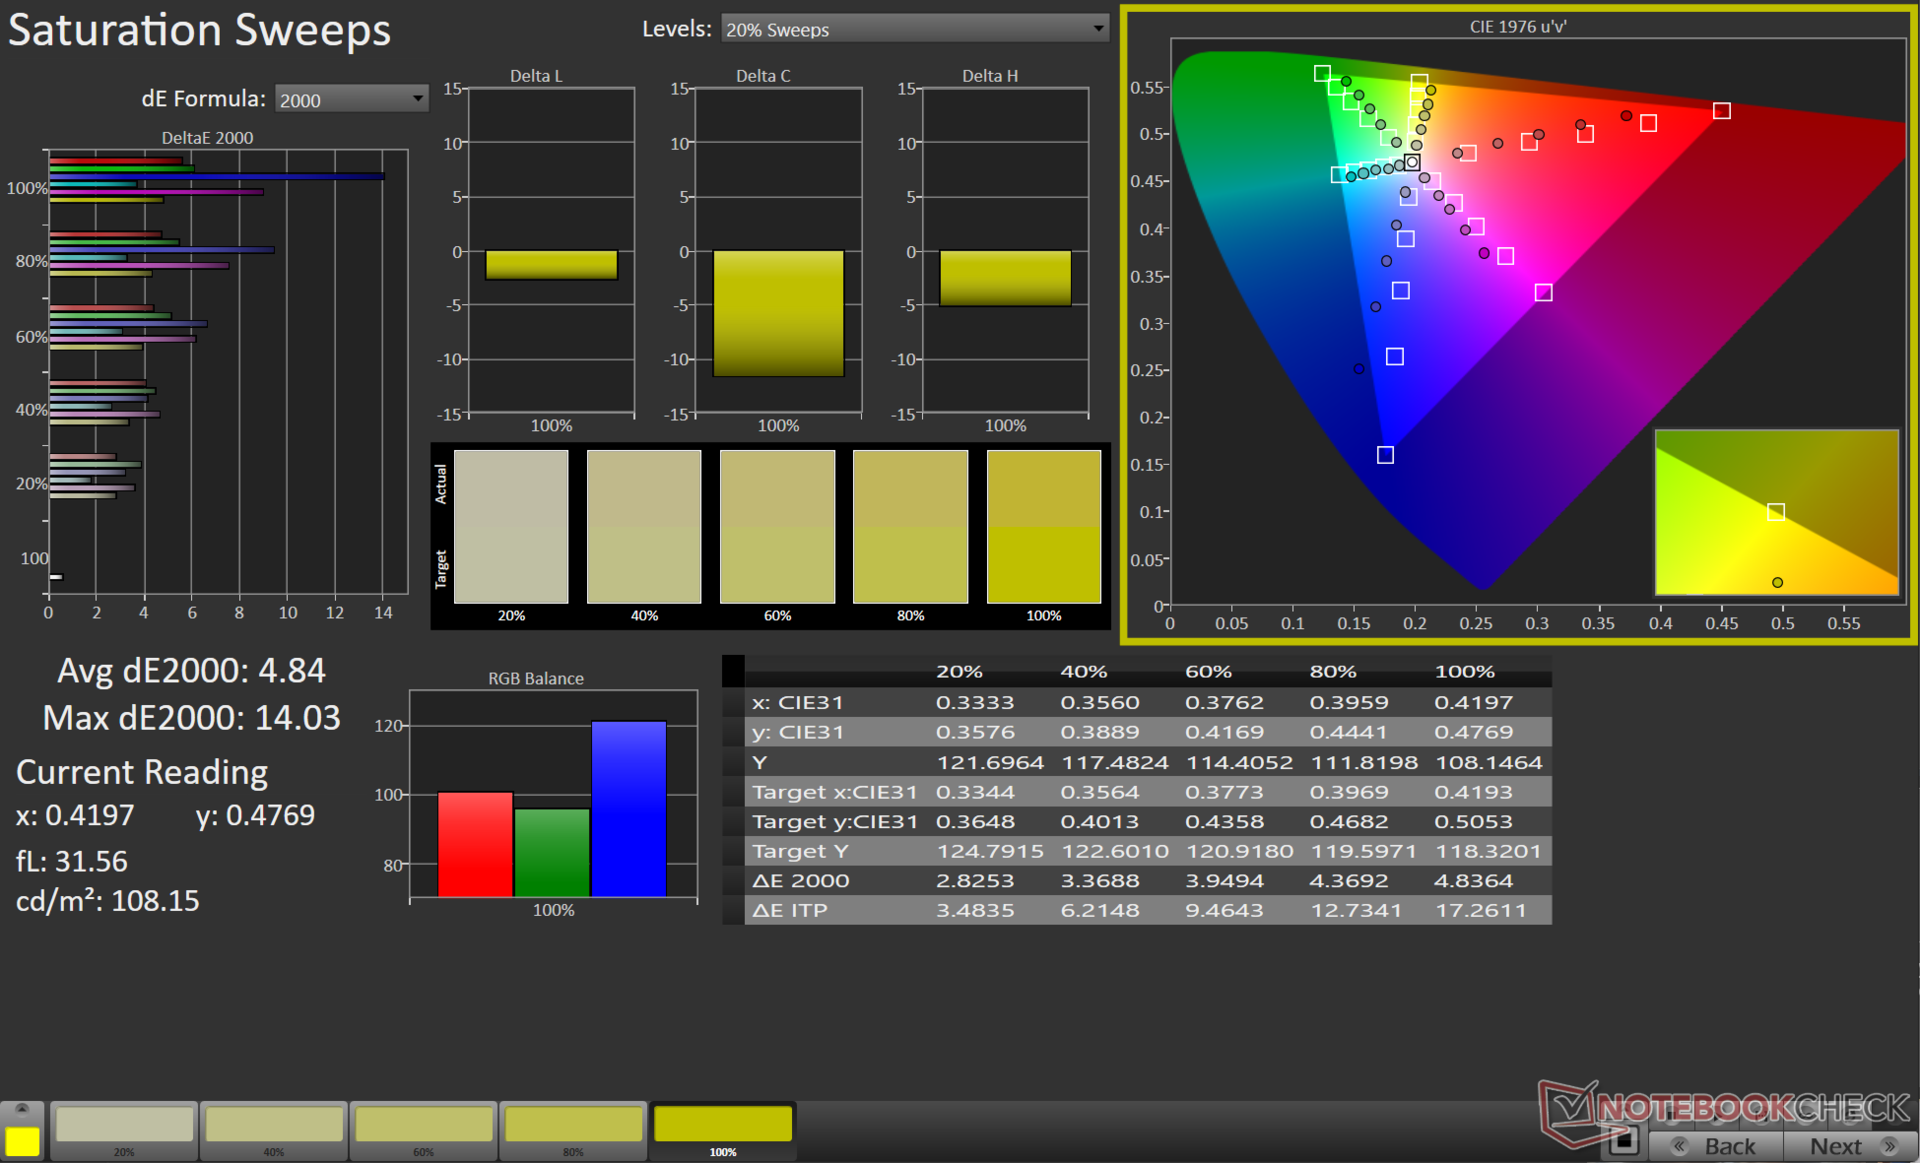
Our calibration routine using the X-Rite i1Basic Pro 3 spectrophotometer and Calman Ultimate color calibration software from Portrait Displays results in a significantly improved Grayscale Delta E 2000 value.
However, there is not much scope for improving the ColorChecker values. The 100% Blue and 100% Magenta colors contribute to large deviations in color accuracy.
The calibrated ICC profile can be downloaded from the link above.
Display Response Times
| ↔ Response Time Black to White | ||
|---|---|---|
| 18.65 ms ... rise ↗ and fall ↘ combined | ↗ 10.83 ms rise | 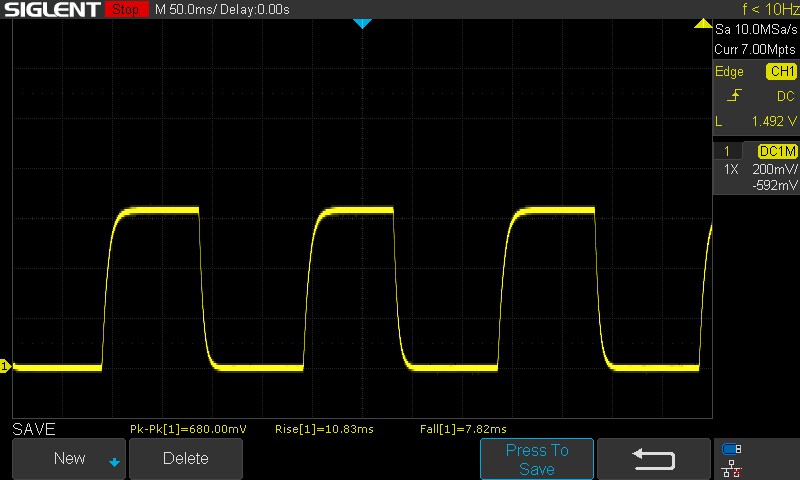 |
| ↘ 7.82 ms fall | ||
| The screen shows good response rates in our tests, but may be too slow for competitive gamers. In comparison, all tested devices range from 0.1 (minimum) to 240 (maximum) ms. » 41 % of all devices are better. This means that the measured response time is similar to the average of all tested devices (19.9 ms). | ||
| ↔ Response Time 50% Grey to 80% Grey | ||
| 26.64 ms ... rise ↗ and fall ↘ combined | ↗ 12.52 ms rise | 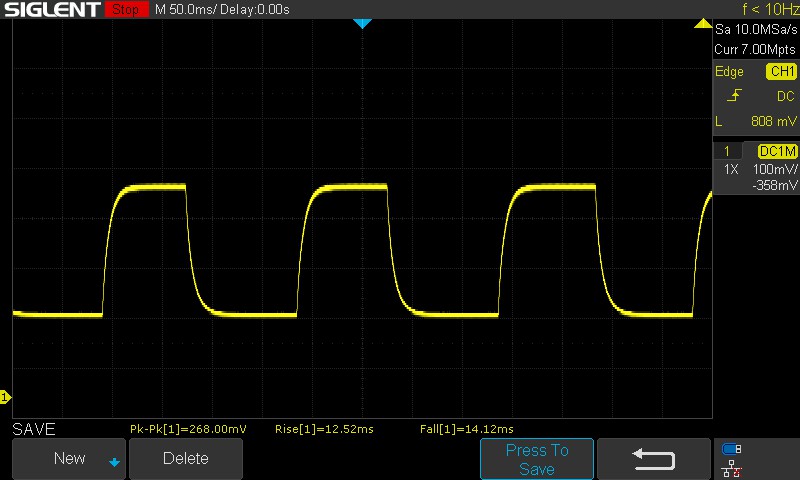 |
| ↘ 14.12 ms fall | ||
| The screen shows relatively slow response rates in our tests and may be too slow for gamers. In comparison, all tested devices range from 0.165 (minimum) to 636 (maximum) ms. » 36 % of all devices are better. This means that the measured response time is better than the average of all tested devices (31.1 ms). | ||
Screen Flickering / PWM (Pulse-Width Modulation)
| Screen flickering / PWM not detected | 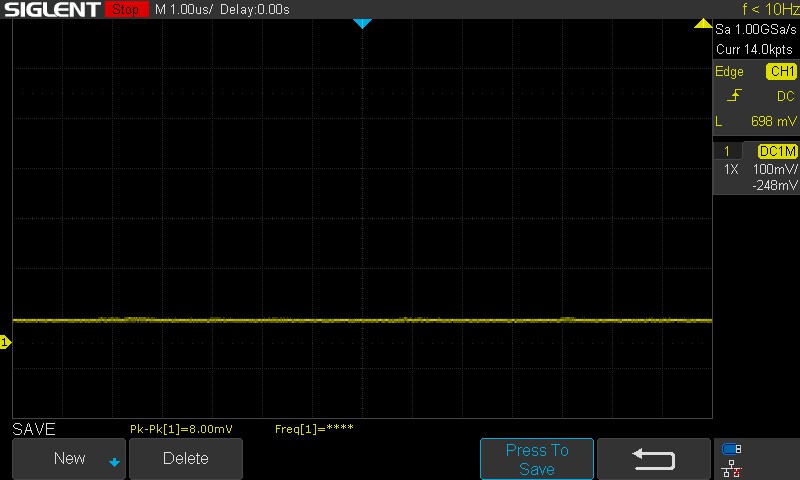 | ||
| ≤ 100 cd/m² brightness | |||
In comparison: 52 % of all tested devices do not use PWM to dim the display. If PWM was detected, an average of 7794 (minimum: 5 - maximum: 343500) Hz was measured. | |||
Display response times, especially the 50% grey to 80% grey transitions, are a bit on the higher side for a gaming laptop. We observed no PWM at all tested brightness levels.
Refer to our article on PWM and also our ranking table for more information and comparisons across tested devices.
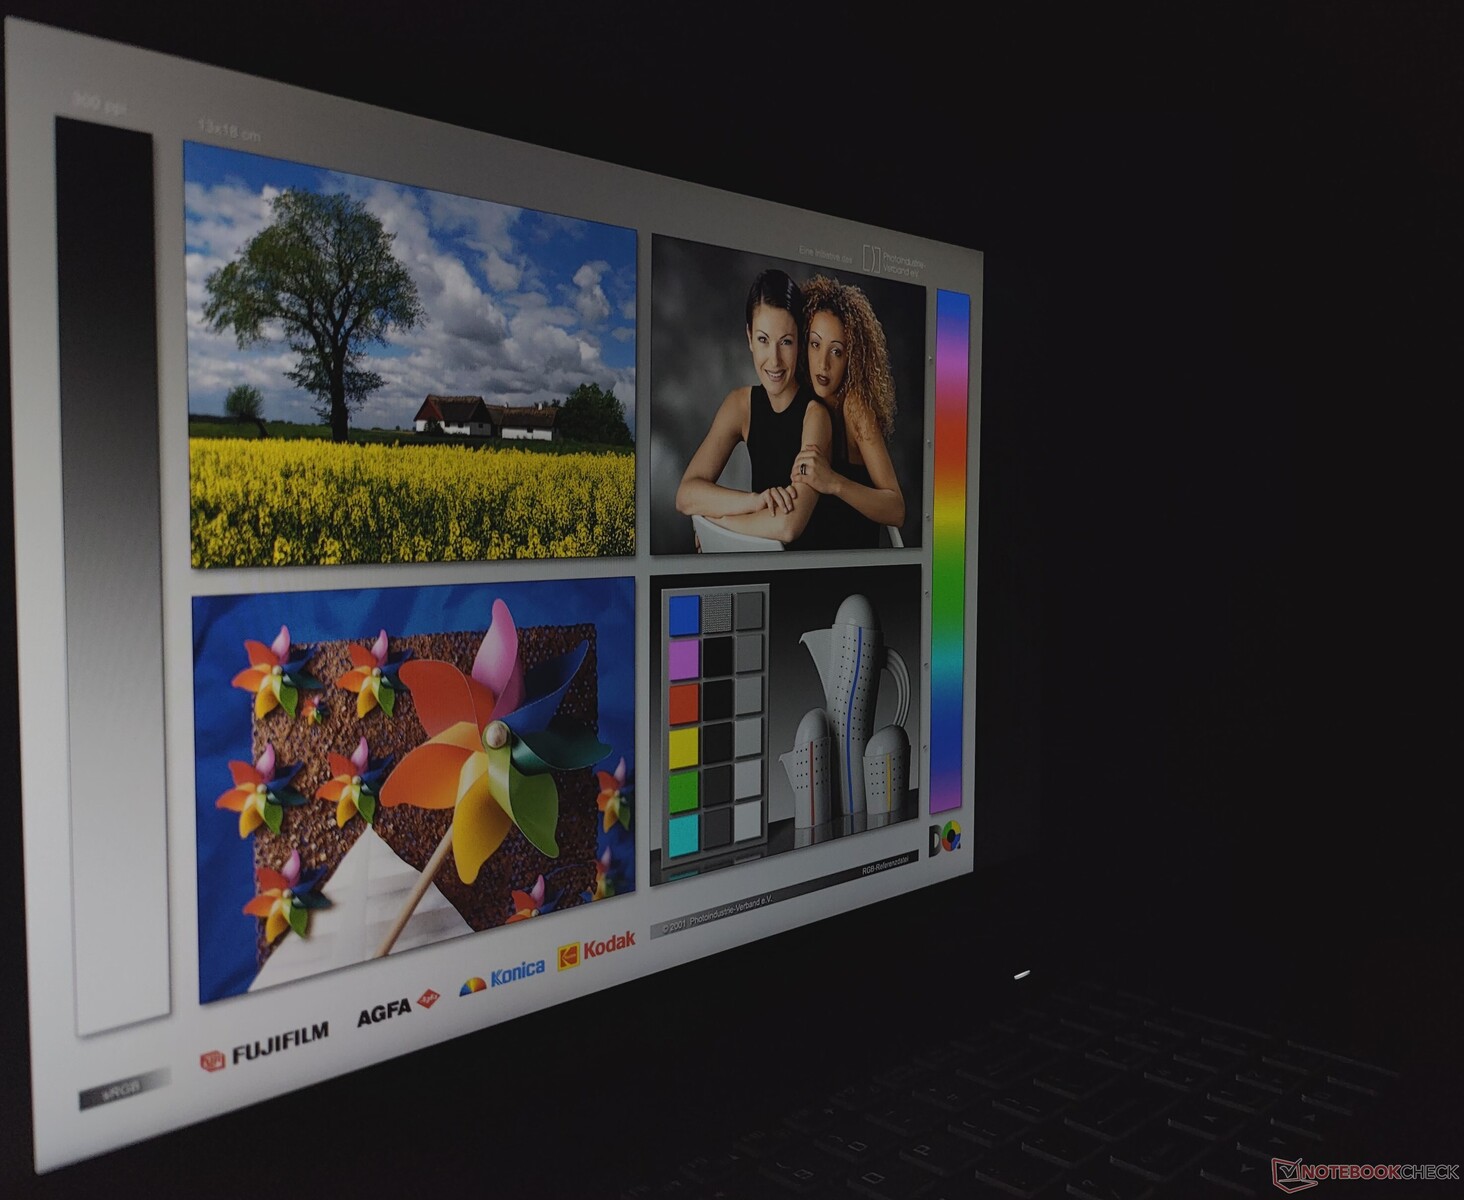
Outdoor viewing is legible as long as there's no direct sunlight falling on the screen. There is loss of brightness and color information at extreme viewing angles.


Performance: Core i5-12500H and RTX 3060 combo throws no major surprises
Gigabyte offers the G5 in two variants: the G5 KE and the G5 ME featuring the 12C/16T Intel Core i5-12500H CPU. While the G5 KE offers an Nvidia GeForce RTX 3060 Laptop GPU, the G5 ME makes do with an RTX 3050 Ti Laptop GPU and lacks a Thunderbolt 4 port.
The G5 KE offers four performance modes as detailed in the table below:
| Performance Mode | PL1 (PBP) / Tau | PL2 (MTP) / Tau |
|---|---|---|
| Quiet | 15 W / 8 s | 30 W / 2.44 ms |
| Power Saver | 30 W / 8 s | 30 W / 2.44 ms |
| Entertainment | 50 W / 28 s | 115 W / 2.44 ms |
| Performance | 115 W / 80 s | 135 W / 2.44 ms |
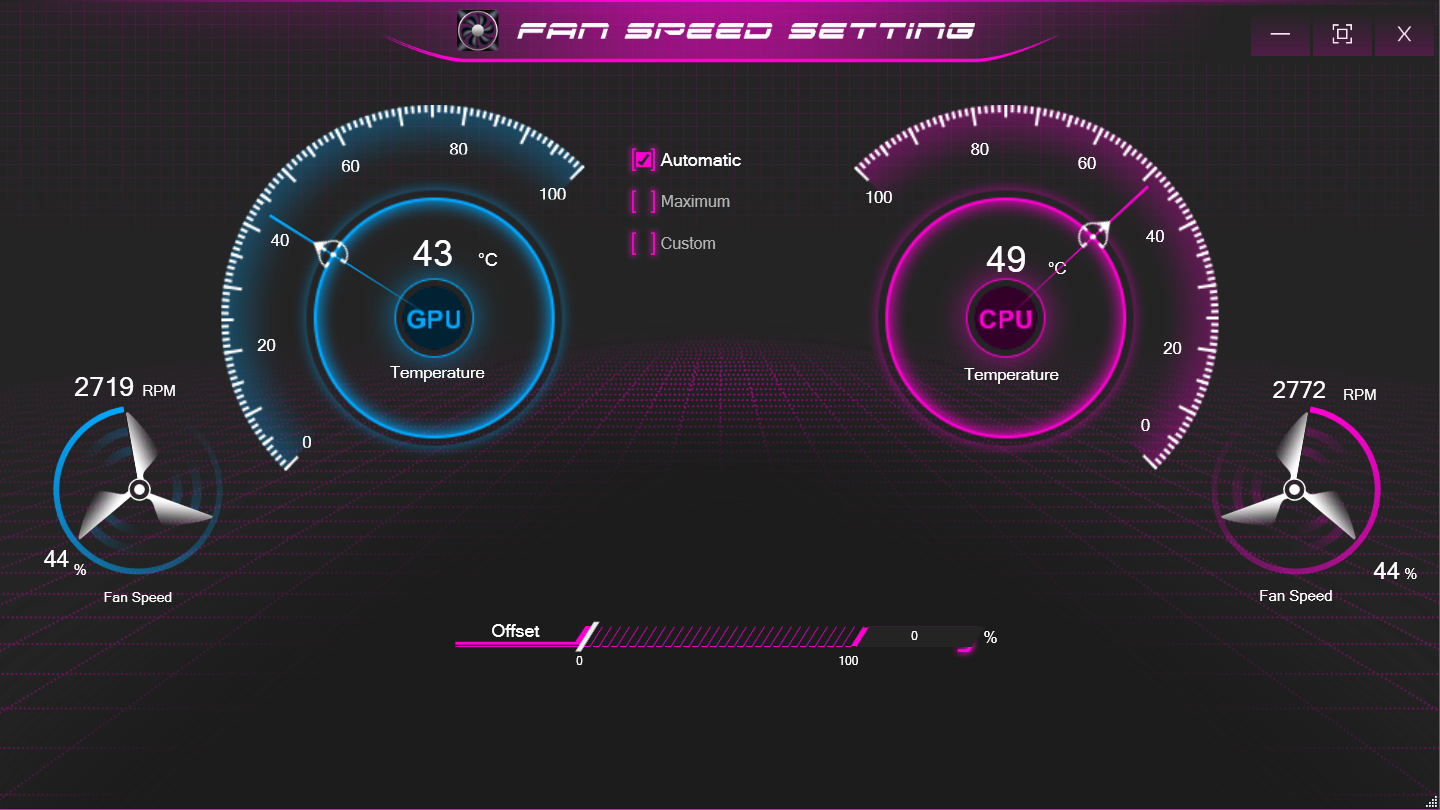
We used the Performance profile for all benchmarks while battery tests were run in the Power Saver mode. Clevo's Control Center 3.0 allows selection of various performance profiles and fan speed settings.
Processor
The G5 KE's Core i5-12500H is in close proximity to the one in the G7 KE and also to the AMD Ryzen 7 6800H in the XMG Core 15 (M22) in cumulative CPU scores. However, it lags behind by 15% compared to the Core i7-12700H in the Asus TUF Gaming F15.
Sustained performance in our Cinebench R15 multi-core loop test is fine for the most part save for a minimal momentary drop in scores in the middle of the run.
Cinebench R15 Multi Loop
Cinebench R20: CPU (Single Core) | CPU (Multi Core)
Cinebench R15: CPU Single 64Bit | CPU Multi 64Bit
Blender: v2.79 BMW27 CPU
7-Zip 18.03: 7z b 4 -mmt1 | 7z b 4
Geekbench 5.5: Single-Core | Multi-Core
HWBOT x265 Benchmark v2.2: 4k Preset
LibreOffice : 20 Documents To PDF
R Benchmark 2.5: Overall mean
| CPU Performance rating | |
| Average of class Gaming | |
| Asus TUF Gaming F15 FX507ZM | |
| Dell G16 7620 | |
| Gigabyte G7 KE | |
| Schenker XMG Core 15 (M22) | |
| Gigabyte G5 KE | |
| Honor MagicBook 14 2022 | |
| Lenovo IdeaPad Gaming 3 15IAH7 | |
| Average Intel Core i5-12500H | |
| HP Victus 16-e0179ng | |
| Gigabyte A5 K1 | |
| Cinebench R20 / CPU (Single Core) | |
| Average of class Gaming (442 - 895, n=111, last 2 years) | |
| Asus TUF Gaming F15 FX507ZM | |
| Dell G16 7620 | |
| Gigabyte G7 KE | |
| Lenovo IdeaPad Gaming 3 15IAH7 | |
| Honor MagicBook 14 2022 | |
| Average Intel Core i5-12500H (602 - 656, n=9) | |
| Gigabyte G5 KE | |
| Schenker XMG Core 15 (M22) | |
| HP Victus 16-e0179ng | |
| Gigabyte A5 K1 | |
| Cinebench R20 / CPU (Multi Core) | |
| Average of class Gaming (4029 - 16108, n=111, last 2 years) | |
| Asus TUF Gaming F15 FX507ZM | |
| Dell G16 7620 | |
| Lenovo IdeaPad Gaming 3 15IAH7 | |
| Schenker XMG Core 15 (M22) | |
| Gigabyte G7 KE | |
| Average Intel Core i5-12500H (4687 - 5640, n=9) | |
| Gigabyte G5 KE | |
| Honor MagicBook 14 2022 | |
| HP Victus 16-e0179ng | |
| Gigabyte A5 K1 | |
| Cinebench R15 / CPU Single 64Bit | |
| Average of class Gaming (188.8 - 343, n=111, last 2 years) | |
| Asus TUF Gaming F15 FX507ZM | |
| Schenker XMG Core 15 (M22) | |
| Gigabyte G7 KE | |
| Lenovo IdeaPad Gaming 3 15IAH7 | |
| Dell G16 7620 | |
| Gigabyte G5 KE | |
| Honor MagicBook 14 2022 | |
| Average Intel Core i5-12500H (220 - 250, n=9) | |
| HP Victus 16-e0179ng | |
| Gigabyte A5 K1 | |
| Cinebench R15 / CPU Multi 64Bit | |
| Average of class Gaming (1578 - 6271, n=111, last 2 years) | |
| Asus TUF Gaming F15 FX507ZM | |
| Dell G16 7620 | |
| Schenker XMG Core 15 (M22) | |
| Lenovo IdeaPad Gaming 3 15IAH7 | |
| Gigabyte G7 KE | |
| Average Intel Core i5-12500H (1970 - 2283, n=10) | |
| Gigabyte G5 KE | |
| Honor MagicBook 14 2022 | |
| Honor MagicBook 14 2022 | |
| HP Victus 16-e0179ng | |
| Gigabyte A5 K1 | |
| Blender / v2.79 BMW27 CPU | |
| Gigabyte A5 K1 | |
| Honor MagicBook 14 2022 | |
| HP Victus 16-e0179ng | |
| Average Intel Core i5-12500H (223 - 288, n=9) | |
| Gigabyte G5 KE | |
| Gigabyte G7 KE | |
| Lenovo IdeaPad Gaming 3 15IAH7 | |
| Schenker XMG Core 15 (M22) | |
| Dell G16 7620 | |
| Asus TUF Gaming F15 FX507ZM | |
| Average of class Gaming (80 - 330, n=109, last 2 years) | |
| 7-Zip 18.03 / 7z b 4 -mmt1 | |
| Average of class Gaming (4199 - 7436, n=110, last 2 years) | |
| Schenker XMG Core 15 (M22) | |
| HP Victus 16-e0179ng | |
| Gigabyte G7 KE | |
| Lenovo IdeaPad Gaming 3 15IAH7 | |
| Gigabyte A5 K1 | |
| Gigabyte G5 KE | |
| Asus TUF Gaming F15 FX507ZM | |
| Dell G16 7620 | |
| Average Intel Core i5-12500H (5151 - 5563, n=9) | |
| Honor MagicBook 14 2022 | |
| 7-Zip 18.03 / 7z b 4 | |
| Average of class Gaming (33491 - 148086, n=110, last 2 years) | |
| Asus TUF Gaming F15 FX507ZM | |
| Dell G16 7620 | |
| Schenker XMG Core 15 (M22) | |
| HP Victus 16-e0179ng | |
| Gigabyte G5 KE | |
| Gigabyte G7 KE | |
| Honor MagicBook 14 2022 | |
| Average Intel Core i5-12500H (44105 - 54380, n=9) | |
| Gigabyte A5 K1 | |
| Lenovo IdeaPad Gaming 3 15IAH7 | |
| Geekbench 5.5 / Single-Core | |
| Average of class Gaming (986 - 2474, n=110, last 2 years) | |
| Asus TUF Gaming F15 FX507ZM | |
| Honor MagicBook 14 2022 | |
| Gigabyte G7 KE | |
| Dell G16 7620 | |
| Gigabyte G5 KE | |
| Lenovo IdeaPad Gaming 3 15IAH7 | |
| Average Intel Core i5-12500H (1471 - 1693, n=9) | |
| Schenker XMG Core 15 (M22) | |
| HP Victus 16-e0179ng | |
| Gigabyte A5 K1 | |
| Geekbench 5.5 / Multi-Core | |
| Average of class Gaming (6460 - 27010, n=110, last 2 years) | |
| Asus TUF Gaming F15 FX507ZM | |
| Dell G16 7620 | |
| Honor MagicBook 14 2022 | |
| Gigabyte G7 KE | |
| Gigabyte G5 KE | |
| Schenker XMG Core 15 (M22) | |
| Average Intel Core i5-12500H (7962 - 10828, n=9) | |
| Lenovo IdeaPad Gaming 3 15IAH7 | |
| HP Victus 16-e0179ng | |
| Gigabyte A5 K1 | |
| HWBOT x265 Benchmark v2.2 / 4k Preset | |
| Average of class Gaming (11.5 - 44.3, n=110, last 2 years) | |
| Asus TUF Gaming F15 FX507ZM | |
| Dell G16 7620 | |
| Schenker XMG Core 15 (M22) | |
| Gigabyte G7 KE | |
| Gigabyte G5 KE | |
| Lenovo IdeaPad Gaming 3 15IAH7 | |
| HP Victus 16-e0179ng | |
| Average Intel Core i5-12500H (12 - 16.6, n=9) | |
| Honor MagicBook 14 2022 | |
| Gigabyte A5 K1 | |
| LibreOffice / 20 Documents To PDF | |
| Gigabyte A5 K1 | |
| Schenker XMG Core 15 (M22) | |
| Gigabyte G5 KE | |
| HP Victus 16-e0179ng | |
| Dell G16 7620 | |
| Asus TUF Gaming F15 FX507ZM | |
| Average of class Gaming (19 - 88.8, n=110, last 2 years) | |
| Lenovo IdeaPad Gaming 3 15IAH7 | |
| Average Intel Core i5-12500H (40.1 - 58.5, n=9) | |
| Gigabyte G7 KE | |
| Honor MagicBook 14 2022 | |
| R Benchmark 2.5 / Overall mean | |
| Gigabyte A5 K1 | |
| HP Victus 16-e0179ng | |
| Lenovo IdeaPad Gaming 3 15IAH7 | |
| Average Intel Core i5-12500H (0.4748 - 0.535, n=9) | |
| Dell G16 7620 | |
| Honor MagicBook 14 2022 | |
| Gigabyte G5 KE | |
| Schenker XMG Core 15 (M22) | |
| Gigabyte G7 KE | |
| Asus TUF Gaming F15 FX507ZM | |
| Average of class Gaming (0.3439 - 0.759, n=111, last 2 years) | |
* ... smaller is better
Our dedicated Intel Core i5-12500H page provides more information and benchmark comparisons.
System Performance
The G5 KE's overall PCMark 10 performance is on par with laptops based on the Core i7-12700H along with perceivable leads in CrossMark compared to the Ryzen 7 6800H-powered Schenker XMG Core 15 (M22).
CrossMark: Overall | Productivity | Creativity | Responsiveness
| PCMark 10 / Score | |
| Average of class Gaming (5828 - 11574, n=95, last 2 years) | |
| Asus TUF Gaming F15 FX507ZM | |
| Schenker XMG Core 15 (M22) | |
| Dell G16 7620 | |
| Gigabyte G5 KE | |
| Lenovo IdeaPad Gaming 3 15IAH7 | |
| Average Intel Core i5-12500H, NVIDIA GeForce RTX 3060 Laptop GPU (6126 - 7201, n=2) | |
| HP Victus 16-e0179ng | |
| Honor MagicBook 14 2022 | |
| Gigabyte A5 K1 | |
| Gigabyte G7 KE | |
| PCMark 10 / Essentials | |
| Gigabyte G5 KE | |
| Schenker XMG Core 15 (M22) | |
| Average Intel Core i5-12500H, NVIDIA GeForce RTX 3060 Laptop GPU (10301 - 11150, n=2) | |
| Average of class Gaming (8810 - 12600, n=99, last 2 years) | |
| Honor MagicBook 14 2022 | |
| Asus TUF Gaming F15 FX507ZM | |
| Gigabyte G7 KE | |
| Dell G16 7620 | |
| Gigabyte A5 K1 | |
| Lenovo IdeaPad Gaming 3 15IAH7 | |
| HP Victus 16-e0179ng | |
| PCMark 10 / Productivity | |
| Average of class Gaming (6845 - 18766, n=97, last 2 years) | |
| Schenker XMG Core 15 (M22) | |
| Lenovo IdeaPad Gaming 3 15IAH7 | |
| Gigabyte G5 KE | |
| Average Intel Core i5-12500H, NVIDIA GeForce RTX 3060 Laptop GPU (9038 - 9475, n=2) | |
| Asus TUF Gaming F15 FX507ZM | |
| Gigabyte G7 KE | |
| HP Victus 16-e0179ng | |
| Dell G16 7620 | |
| Honor MagicBook 14 2022 | |
| Gigabyte A5 K1 | |
| PCMark 10 / Digital Content Creation | |
| Average of class Gaming (7602 - 19657, n=97, last 2 years) | |
| Asus TUF Gaming F15 FX507ZM | |
| Dell G16 7620 | |
| Schenker XMG Core 15 (M22) | |
| Gigabyte G5 KE | |
| Lenovo IdeaPad Gaming 3 15IAH7 | |
| HP Victus 16-e0179ng | |
| Average Intel Core i5-12500H, NVIDIA GeForce RTX 3060 Laptop GPU (6703 - 9593, n=2) | |
| Honor MagicBook 14 2022 | |
| Gigabyte A5 K1 | |
| Gigabyte G7 KE | |
| CrossMark / Overall | |
| Average of class Gaming (1366 - 2409, n=97, last 2 years) | |
| Gigabyte G7 KE | |
| Honor MagicBook 14 2022 | |
| Average Intel Core i5-12500H, NVIDIA GeForce RTX 3060 Laptop GPU (1752 - 1824, n=2) | |
| Dell G16 7620 | |
| Gigabyte G5 KE | |
| Schenker XMG Core 15 (M22) | |
| CrossMark / Productivity | |
| Average of class Gaming (1386 - 2254, n=97, last 2 years) | |
| Gigabyte G7 KE | |
| Average Intel Core i5-12500H, NVIDIA GeForce RTX 3060 Laptop GPU (1720 - 1804, n=2) | |
| Honor MagicBook 14 2022 | |
| Gigabyte G5 KE | |
| Dell G16 7620 | |
| Schenker XMG Core 15 (M22) | |
| CrossMark / Creativity | |
| Honor MagicBook 14 2022 | |
| Average of class Gaming (1343 - 2729, n=97, last 2 years) | |
| Dell G16 7620 | |
| Gigabyte G7 KE | |
| Average Intel Core i5-12500H, NVIDIA GeForce RTX 3060 Laptop GPU (1778 - 1800, n=2) | |
| Gigabyte G5 KE | |
| Schenker XMG Core 15 (M22) | |
| CrossMark / Responsiveness | |
| Gigabyte G7 KE | |
| Average Intel Core i5-12500H, NVIDIA GeForce RTX 3060 Laptop GPU (1771 - 1966, n=2) | |
| Gigabyte G5 KE | |
| Honor MagicBook 14 2022 | |
| Average of class Gaming (1226 - 2334, n=97, last 2 years) | |
| Dell G16 7620 | |
| Schenker XMG Core 15 (M22) | |
| PCMark 8 Home Score Accelerated v2 | 5554 points | |
| PCMark 8 Work Score Accelerated v2 | 5937 points | |
| PCMark 10 Score | 7201 points | |
Help | ||
DPC Latency
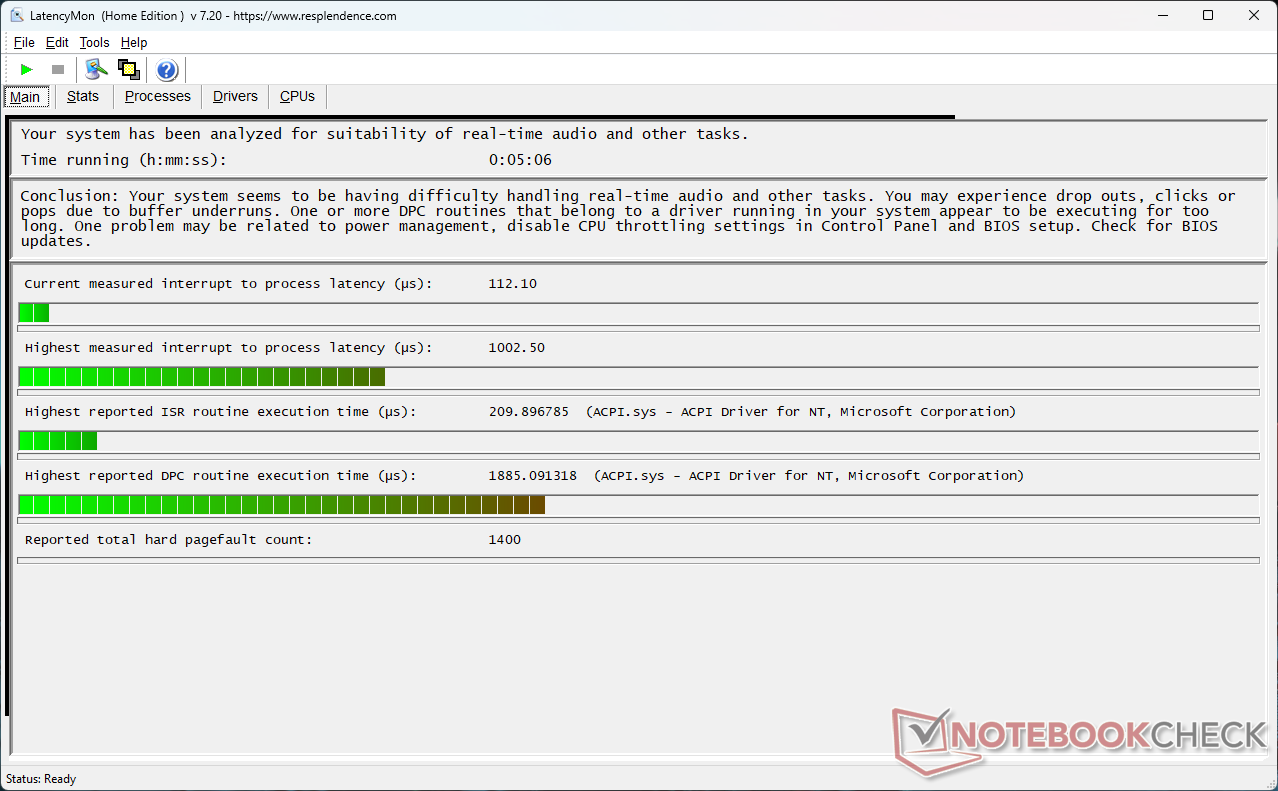
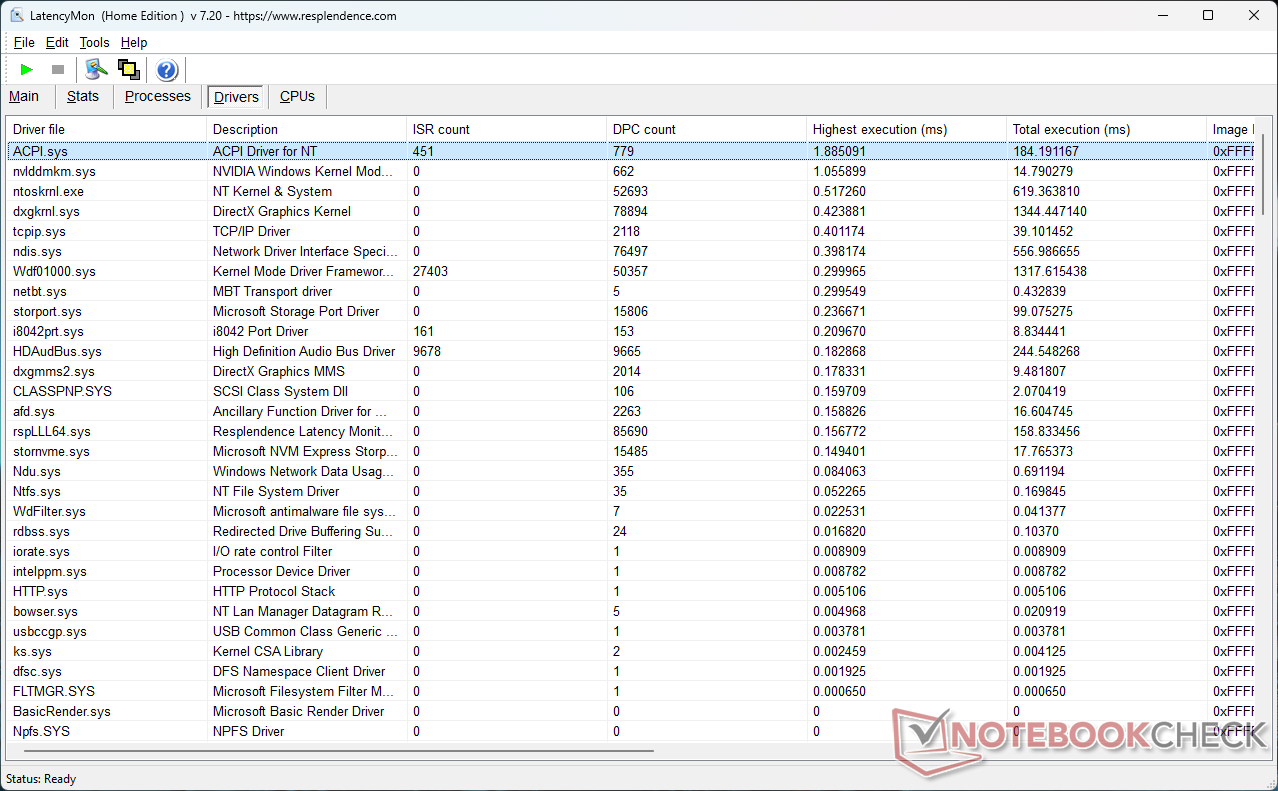
The G5 KE's DPC latency is arguably better than most of its competition, but the values are still on the higher side.
| DPC Latencies / LatencyMon - interrupt to process latency (max), Web, Youtube, Prime95 | |
| Schenker XMG Core 15 (M22) | |
| Gigabyte G7 KE | |
| Lenovo IdeaPad Gaming 3 15IAH7 | |
| HP Victus 16-e0179ng | |
| Gigabyte A5 K1 | |
| Gigabyte G5 KE | |
| Dell G16 7620 | |
| Asus TUF Gaming F15 FX507ZM | |
| Honor MagicBook 14 2022 | |
* ... smaller is better
Refer to our DPC Latency Raking page for more latency comparisons across reviewed devices.
Storage Devices
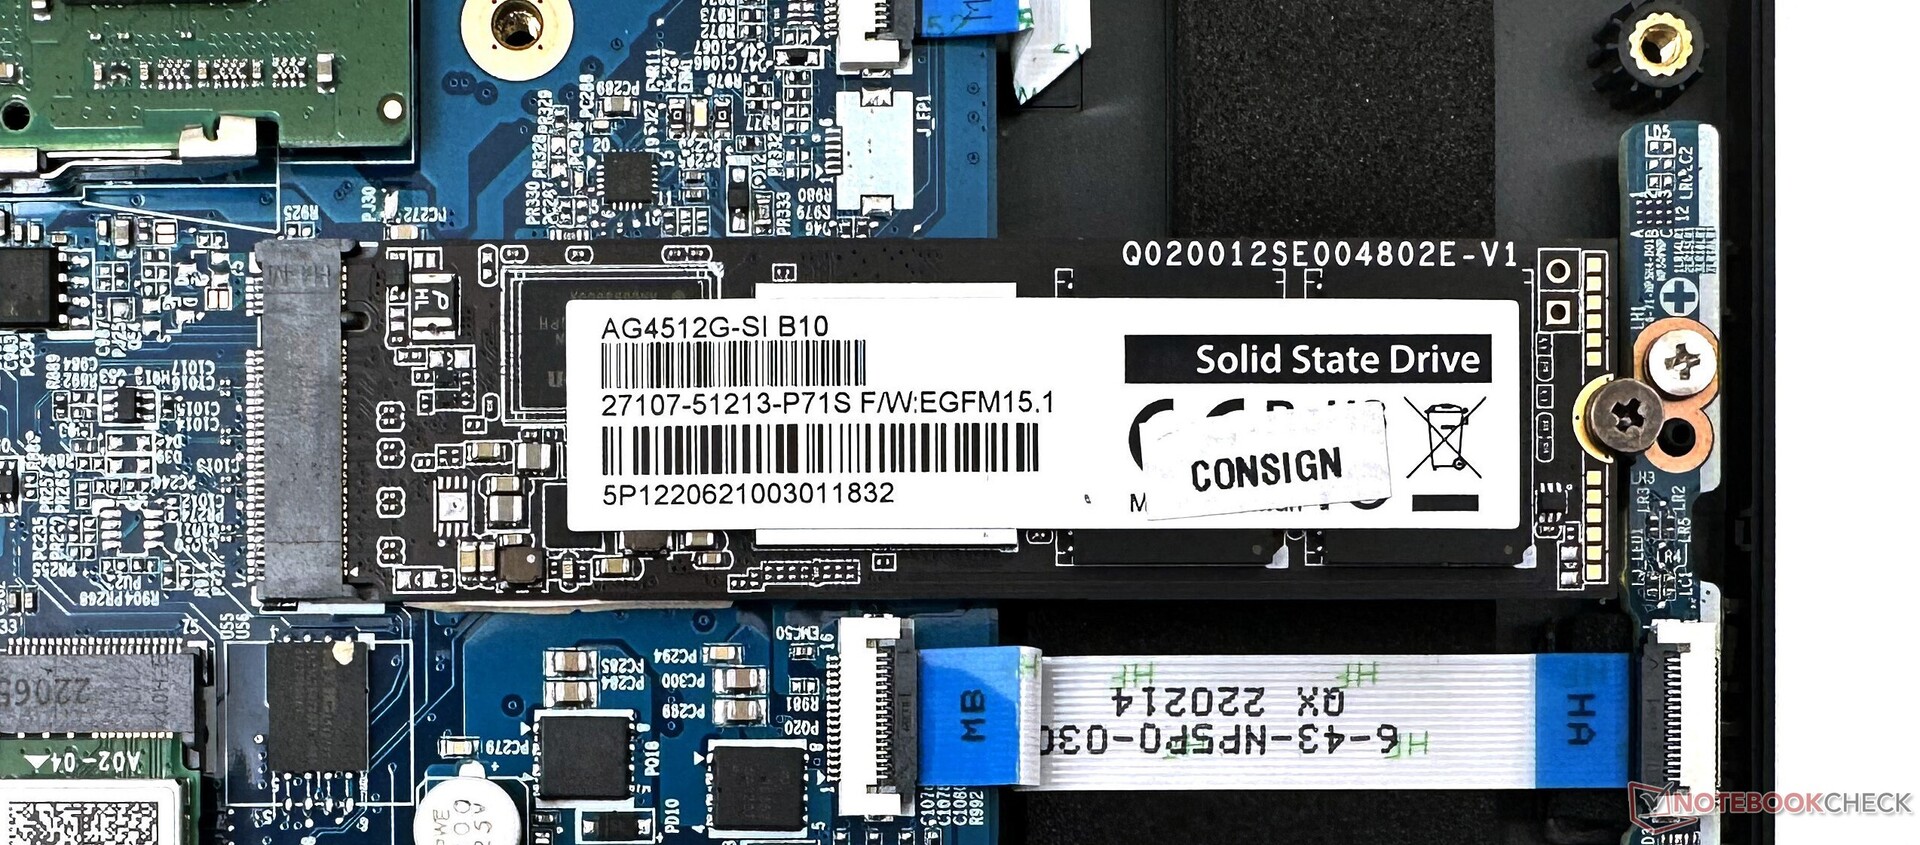
Our G5 KE unit came with a 512 GB Gigabyte NVMe SSD. However, we find the 1 TB variant of this drive in the G7 KE to score better in almost every regard. The SSD suffers drastic throttling in our DiskSpd read loop test.
A second NVMe SSD can be installed, but there's no scope for adding a 2.5-inch SATA drive.
| Gigabyte G5 KE Gigabyte AG4512G-SI B10 | Lenovo IdeaPad Gaming 3 15IAH7 Intel SSD 660p SSDPEKNW512G8 | Gigabyte G7 KE Gigabyte AG470S1TB-SI B10 | Honor MagicBook 14 2022 Samsung PM9A1 MZVL2512HCJQ | Asus TUF Gaming F15 FX507ZM SK Hynix HFM001TD3JX013N | HP Victus 16-e0179ng WDC PC SN730 SDBPNTY-1T00 | Average Gigabyte AG4512G-SI B10 | Average of class Gaming | |
|---|---|---|---|---|---|---|---|---|
| CrystalDiskMark 5.2 / 6 | -42% | 22% | 43% | -8% | -16% | 0% | 25% | |
| Write 4K (MB/s) | 303.3 | 64 -79% | 363.1 20% | 229.88 -24% | 217.7 -28% | 157.3 -48% | 303 ? 0% | 202 ? -33% |
| Read 4K (MB/s) | 64.25 | 77.05 20% | 59.23 -8% | 91.45 42% | 70.1 9% | 49 -24% | 64.3 ? 0% | 78.1 ? 22% |
| Write Seq (MB/s) | 2258 | 93.07 -96% | 2605 15% | 2844 26% | 2983 32% | 2258 ? 0% | 3703 ? 64% | |
| Read Seq (MB/s) | 2561 | 2570 0% | 2337 -9% | 2492 -3% | 2247 -12% | 2561 ? 0% | 3592 ? 40% | |
| Write 4K Q32T1 (MB/s) | 620.6 | 184.6 -70% | 806.9 30% | 627.94 1% | 408.3 -34% | 395 -36% | 621 ? 0% | 611 ? -2% |
| Read 4K Q32T1 (MB/s) | 866.2 | 461.5 -47% | 1019 18% | 868.92 0% | 524 -40% | 557 -36% | 866 ? 0% | 715 ? -17% |
| Write Seq Q32T1 (MB/s) | 2264.3 | 1659 -27% | 3612 60% | 5118.5 126% | 3011 33% | 3094 37% | 2264 ? 0% | 5192 ? 129% |
| Read Seq Q32T1 (MB/s) | 4717.3 | 2936 -38% | 7067 50% | 6866.5 46% | 3553 -25% | 2871 -39% | 4717 ? 0% | 6958 ? 47% |
| Write 4K Q8T8 (MB/s) | 2239.2 | 2910.25 30% | 2239 ? 0% | 1306 ? -42% | ||||
| Read 4K Q8T8 (MB/s) | 1188.1 | 2687.03 126% | 1188 ? 0% | 1633 ? 37% | ||||
| AS SSD | -48% | 39% | 28% | -23% | -21% | 0% | 18% | |
| Seq Read (MB/s) | 3697.92 | 2432.02 -34% | 4540.75 23% | 5233 42% | 3013 -19% | 2383 -36% | 3698 ? 0% | 5490 ? 48% |
| Seq Write (MB/s) | 2106.21 | 1229.14 -42% | 3805.55 81% | 3857 83% | 2768 31% | 2466 17% | 2106 ? 0% | 3914 ? 86% |
| 4K Read (MB/s) | 82.5 | 75.66 -8% | 99.79 21% | 85.14 3% | 66.9 -19% | 44.14 -46% | 82.5 ? 0% | 70 ? -15% |
| 4K Write (MB/s) | 312.09 | 242.19 -22% | 325.41 4% | 216.33 -31% | 184.8 -41% | 117.5 -62% | 312 ? 0% | 215 ? -31% |
| 4K-64 Read (MB/s) | 1675.54 | 441.63 -74% | 2914.54 74% | 2468.58 47% | 1923 15% | 1734 3% | 1676 ? 0% | 1633 ? -3% |
| 4K-64 Write (MB/s) | 1865.08 | 1218.61 -35% | 2915.33 56% | 3003.26 61% | 2198 18% | 2088 12% | 1865 ? 0% | 2875 ? 54% |
| Access Time Read * (ms) | 0.066 | 0.073 -11% | 0.094 -42% | 0.023 65% | 0.03 55% | 0.049 26% | 0.066 ? -0% | 0.06415 ? 3% |
| Access Time Write * (ms) | 0.013 | 0.033 -154% | 0.012 8% | 0.02 -54% | 0.081 -523% | 0.032 -146% | 0.013 ? -0% | 0.03953 ? -204% |
| Score Read (Points) | 2128 | 760 -64% | 3468 63% | 3077 45% | 2291 8% | 2017 -5% | 2128 ? 0% | 2252 ? 6% |
| Score Write (Points) | 2388 | 1584 -34% | 3621 52% | 3605 51% | 2660 11% | 2452 3% | 2388 ? 0% | 3481 ? 46% |
| Score Total (Points) | 5541 | 2702 -51% | 8837 59% | 8195 48% | 6117 10% | 5503 -1% | 5541 ? 0% | 6815 ? 23% |
| Copy ISO MB/s (MB/s) | 1077.37 | 1949.01 81% | 2093.45 94% | 2143 99% | 1077 ? 0% | 3074 ? 185% | ||
| Copy Program MB/s (MB/s) | 827.5 | 1079.42 30% | 447.36 -46% | 871 5% | 828 ? 0% | 951 ? 15% | ||
| Copy Game MB/s (MB/s) | 1460.58 | 2042.84 40% | 1195.09 -18% | 1840 26% | 1461 ? 0% | 2035 ? 39% | ||
| Total Average (Program / Settings) | -45% /
-46% | 31% /
33% | 36% /
34% | -16% /
-18% | -19% /
-19% | 0% /
0% | 22% /
21% |
* ... smaller is better

Disk Throttling: DiskSpd Read Loop, Queue Depth 8
Check out our dedicated SSD and HDD Benchmarks page for more storage device comparisons.
GPU Performance
The 115 W Nvidia GeForce RTX 3060 Laptop GPU performs on par for the course in 3DMark tests. The G5 KE shows good leads over the HP Victus in synthetic tests owing to the 95 W TGP configuration in the latter.
| 3DMark 11 Performance | 26505 points | |
| 3DMark Ice Storm Standard Score | 188480 points | |
| 3DMark Cloud Gate Standard Score | 53162 points | |
| 3DMark Fire Strike Score | 19966 points | |
| 3DMark Fire Strike Extreme Score | 10252 points | |
| 3DMark Time Spy Score | 8922 points | |
Help | ||
Gaming Performance
The Gigabyte G5 KE's gaming performance is similar to other RTX 3060-based laptops we've tested and even manages to overtake the G7 KE with the same configuration in several games.
We noticed no perceivable frame drops while stressing the laptop with The Witcher 3 at 1080p Ultra.
The Witcher 3 FPS Chart
| Cyberpunk 2077 1.6 | |
| 1920x1080 High Preset | |
| Dell G16 7620 | |
| Gigabyte G5 KE | |
| Average NVIDIA GeForce RTX 3060 Laptop GPU (42.2 - 87.7, n=14) | |
| Gigabyte G7 KE | |
| Honor MagicBook 14 2022 | |
| 1920x1080 Ultra Preset | |
| Gigabyte G5 KE | |
| Dell G16 7620 | |
| Average NVIDIA GeForce RTX 3060 Laptop GPU (40 - 78.8, n=16) | |
| Gigabyte G7 KE | |
| Honor MagicBook 14 2022 | |
| F1 2021 | |
| 1920x1080 High Preset AA:T AF:16x | |
| Gigabyte G5 KE | |
| Average NVIDIA GeForce RTX 3060 Laptop GPU (119 - 227, n=9) | |
| Honor MagicBook 14 2022 | |
| 1920x1080 Ultra High Preset + Raytracing AA:T AF:16x | |
| Gigabyte G5 KE | |
| Average NVIDIA GeForce RTX 3060 Laptop GPU (67 - 112.8, n=9) | |
| Honor MagicBook 14 2022 | |
| low | med. | high | ultra | |
|---|---|---|---|---|
| GTA V (2015) | 183.4 | 179.9 | 172.8 | 103 |
| The Witcher 3 (2015) | 333 | 255 | 168.7 | 87.6 |
| Dota 2 Reborn (2015) | 168.5 | 153.1 | 144.8 | 137.5 |
| Final Fantasy XV Benchmark (2018) | 179.3 | 118.9 | 90.3 | |
| X-Plane 11.11 (2018) | 118.4 | 105.6 | 86.7 | |
| Far Cry 5 (2018) | 159 | 134 | 129 | 118 |
| Strange Brigade (2018) | 385 | 216 | 175.3 | 153.3 |
| F1 2021 (2021) | 303 | 200 | 177.9 | 105.1 |
| Cyberpunk 2077 1.6 (2022) | 105.4 | 85.3 | 72.5 | 68 |
| F1 22 (2022) | 197 | 189.4 | 153.3 | 55.9 |
Check out our dedicated Nvidia GeForce RTX 3060 Laptop GPU page and also our exhaustive gaming comparison list for more information and performance comparisons.
Emissions: High surface temperatures and fan noise under load
System Noise
In the tested Performance mode, the idle system noise is somewhat on the higher side at about 31 dB(A). Fan noise reaches the 55 dB(A) mark irrespective of load.
Gigabyte seems to have capped the fan noise under 30 dB(A) in the Quiet profile. Only The Witcher 3 test results in high fan noise emissions in the Power Saving profile as illustrated in the table below.
| Performance Mode | Idle dB(A) | Load average dB(A) | Load maximum dB(A) | The Witcher 3 dB(A) |
|---|---|---|---|---|
| Quiet | 22.21 | 25.73 | 24.64 | 27.62 |
| Power Saving | 22.65 | 24.75 | 24.62 | 49.05 |
| Entertainment | 22.63 | 54.67 | 55.52 | 53.11 |
| Performance | 31.05 | 55.66 | 55.51 | 55.65 |
Noise level
| Idle |
| 31.05 / 31.05 / 31.05 dB(A) |
| Load |
| 55.66 / 55.51 dB(A) |
 | ||
30 dB silent 40 dB(A) audible 50 dB(A) loud |
||
min: | ||
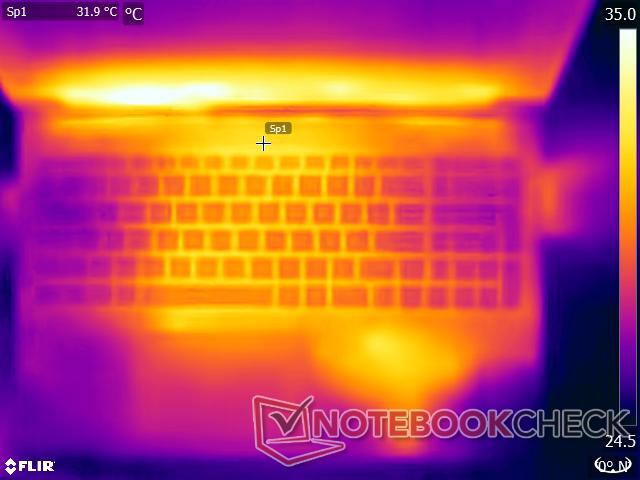
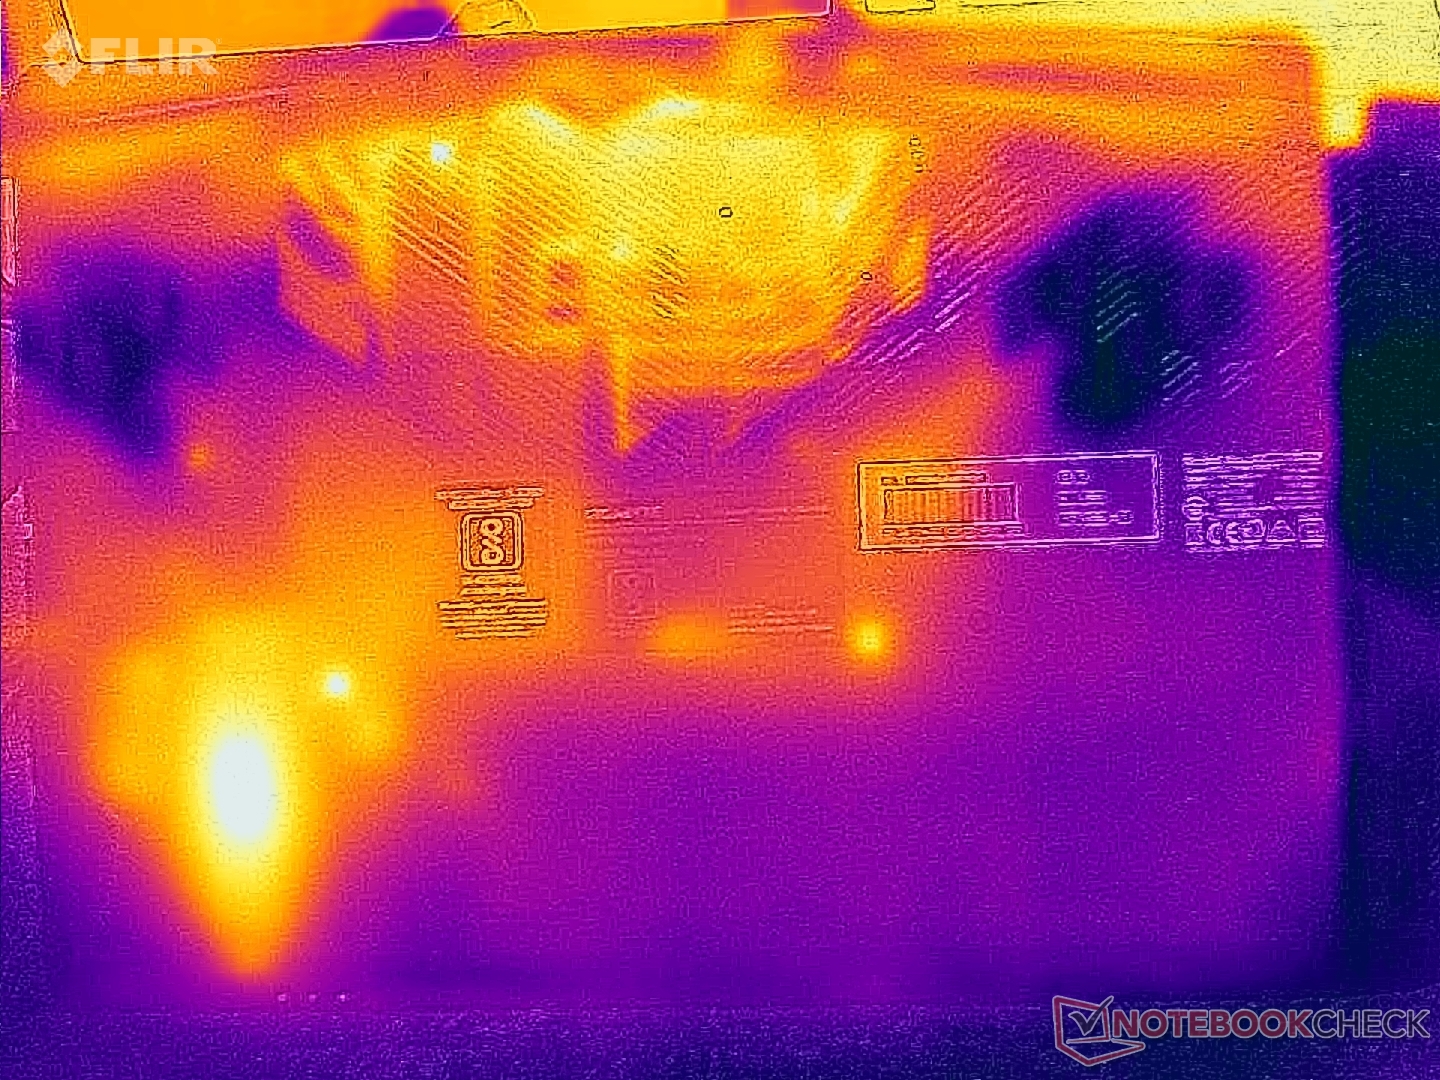
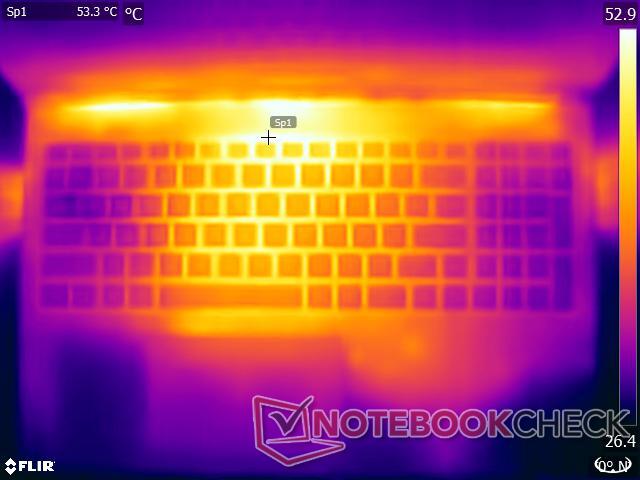
Temperature
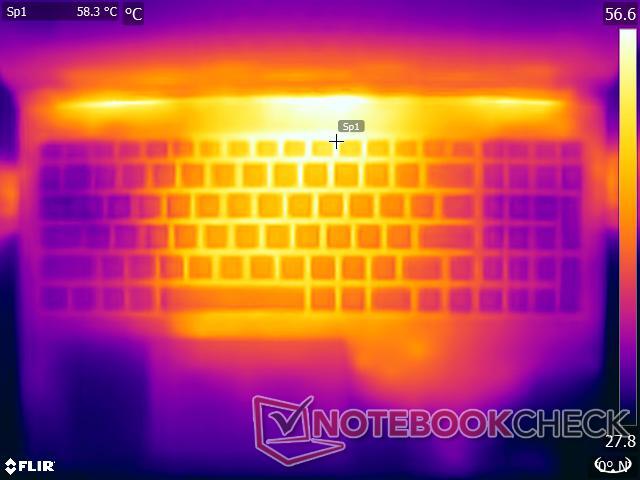
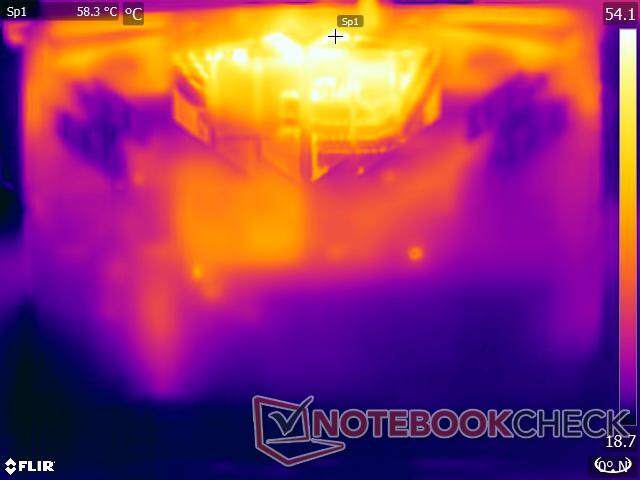
The Gigabyte G5 KE's dual-fan quad-heatpipe system does a decent job in keeping the core temperatures under control, but surface temperatures can rise up to 52.6 °C on the top and up to 62.4 °C on the bottom under heavy load.
The touchpad area can get quite warm as well.
(-) The maximum temperature on the upper side is 52.6 °C / 127 F, compared to the average of 40.4 °C / 105 F, ranging from 21.2 to 68.8 °C for the class Gaming.
(-) The bottom heats up to a maximum of 62.4 °C / 144 F, compared to the average of 43.2 °C / 110 F
(±) In idle usage, the average temperature for the upper side is 32 °C / 90 F, compared to the device average of 33.9 °C / 93 F.
(-) Playing The Witcher 3, the average temperature for the upper side is 42.9 °C / 109 F, compared to the device average of 33.9 °C / 93 F.
(-) The palmrests and touchpad can get very hot to the touch with a maximum of 41.2 °C / 106.2 F.
(-) The average temperature of the palmrest area of similar devices was 28.8 °C / 83.8 F (-12.4 °C / -22.4 F).
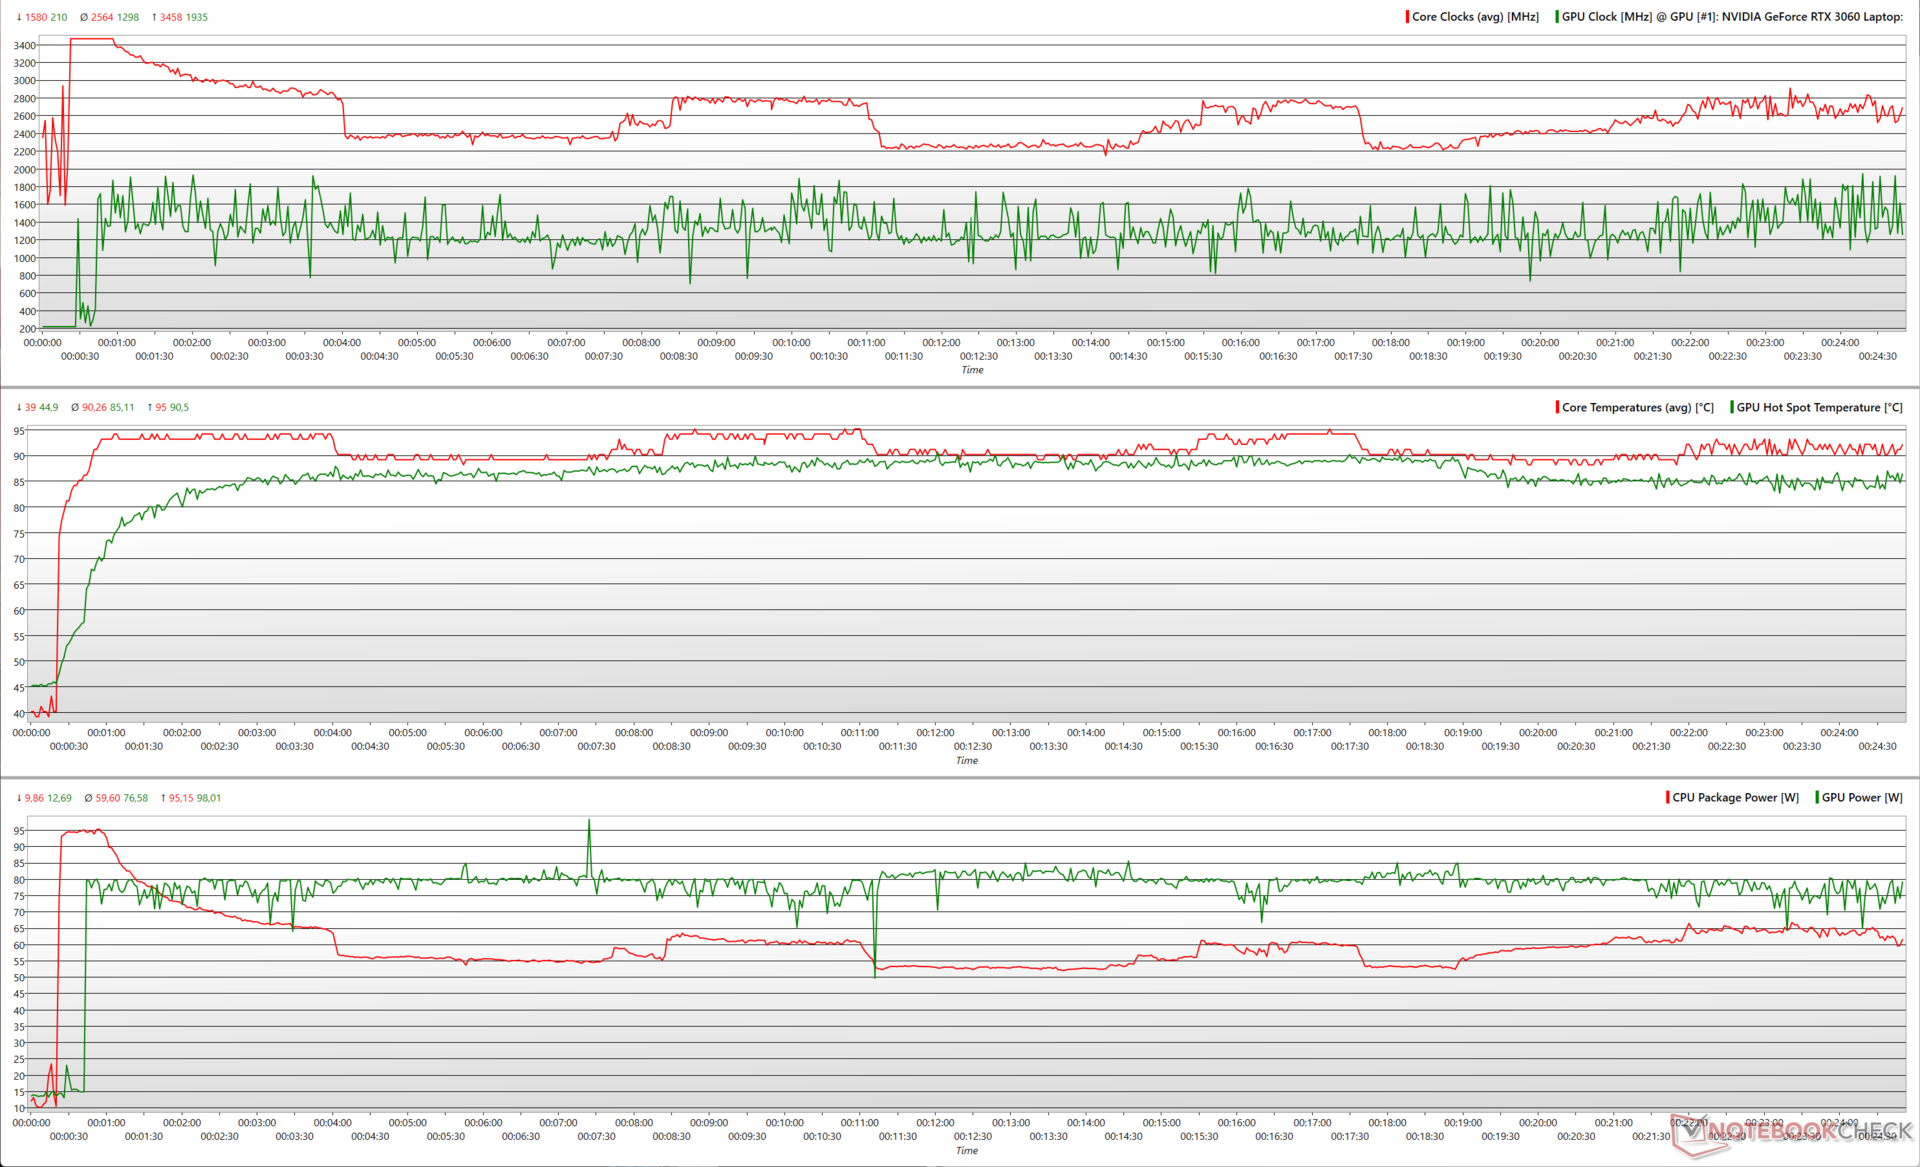
A combined Prime95 and FurMark stress sees the Core i5-12500H briefly attaining a peak of about 3.5 GHz at 95 W before settling down to about 2.5 GHz close to 60 W on average. The RTX 3060 Laptop GPU coasts at about 75.6 W average but does attain a 98 W peak resulting in a max. core clock of 1.9 GHz.
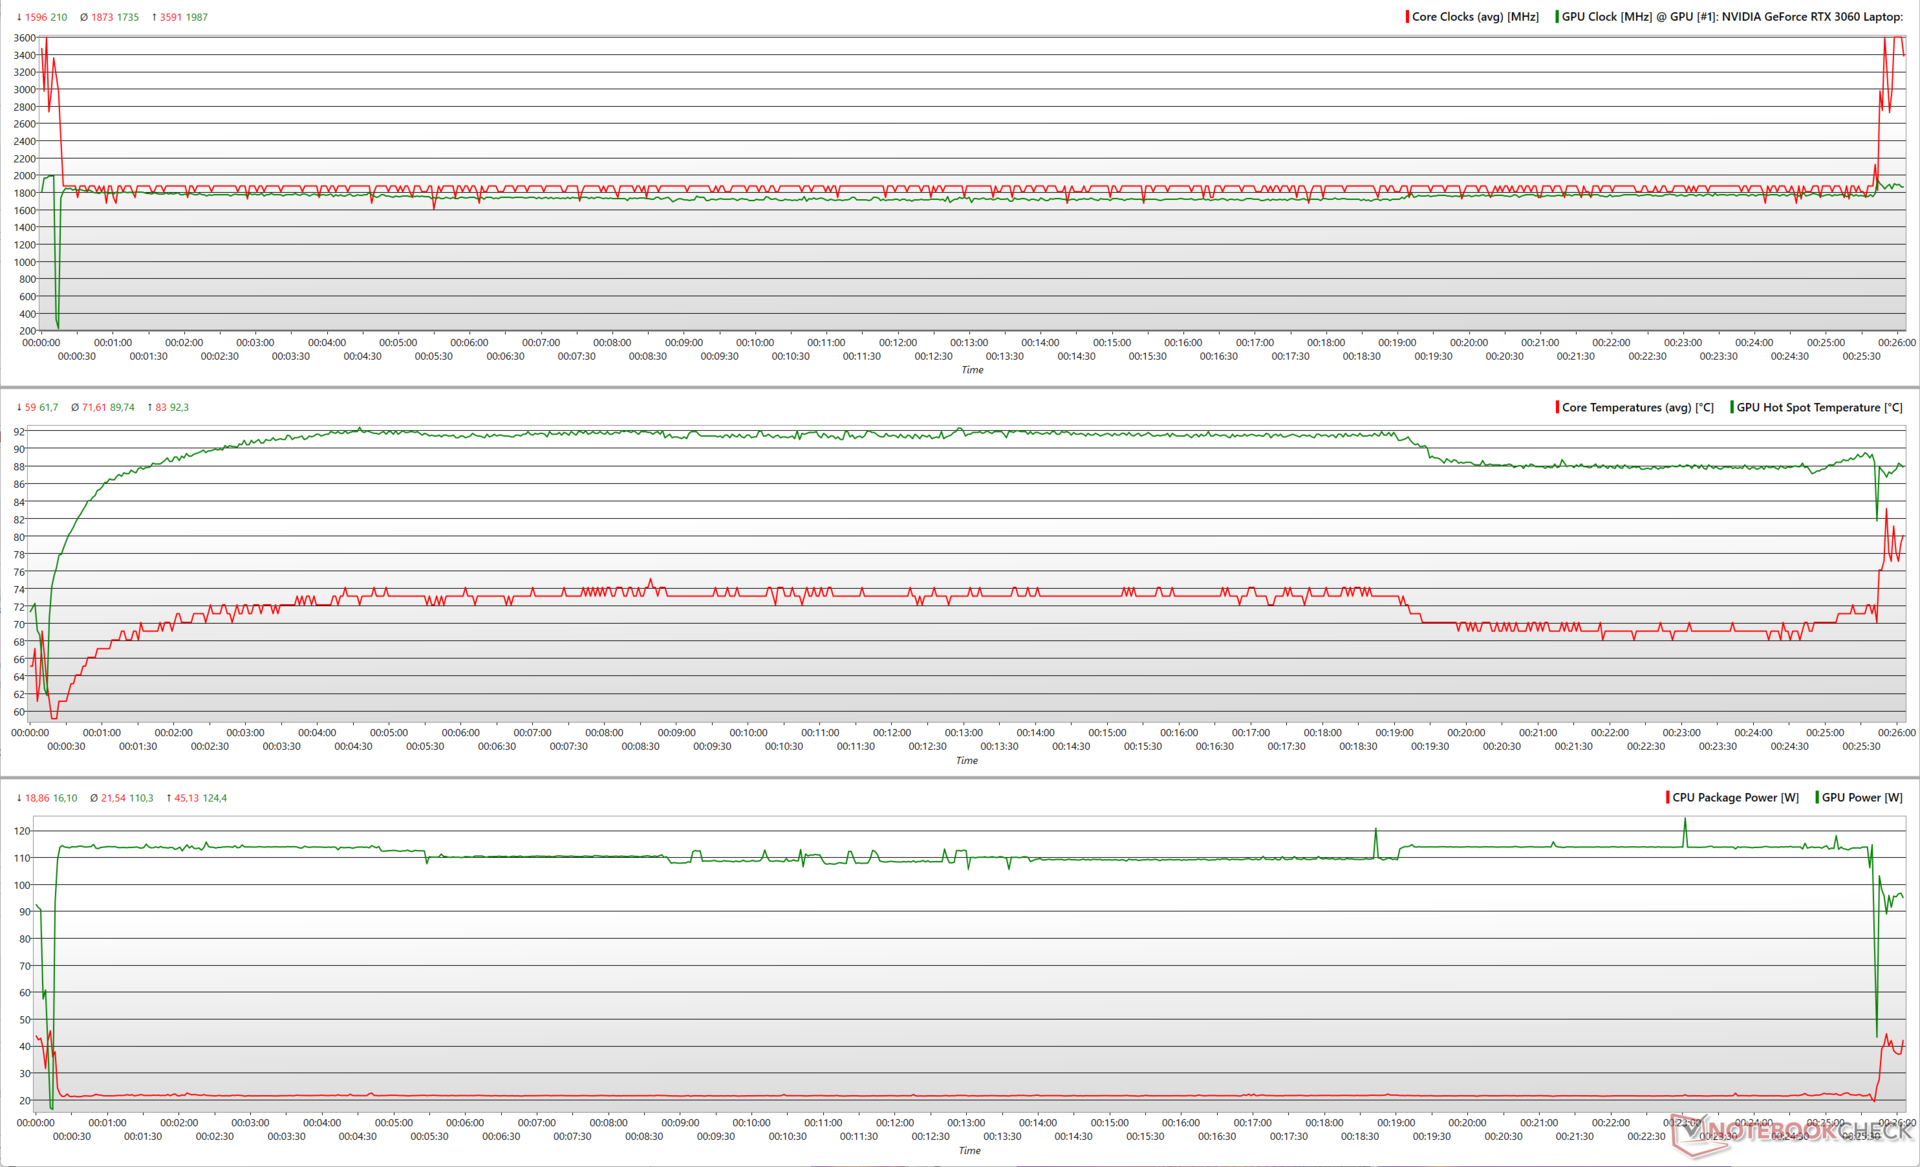
We see similar peak clocks during The Witcher 3 stress, but the average CPU package power further drops to about 21.5 W allowing the RTX 3060 to consume up to 110 W on average.

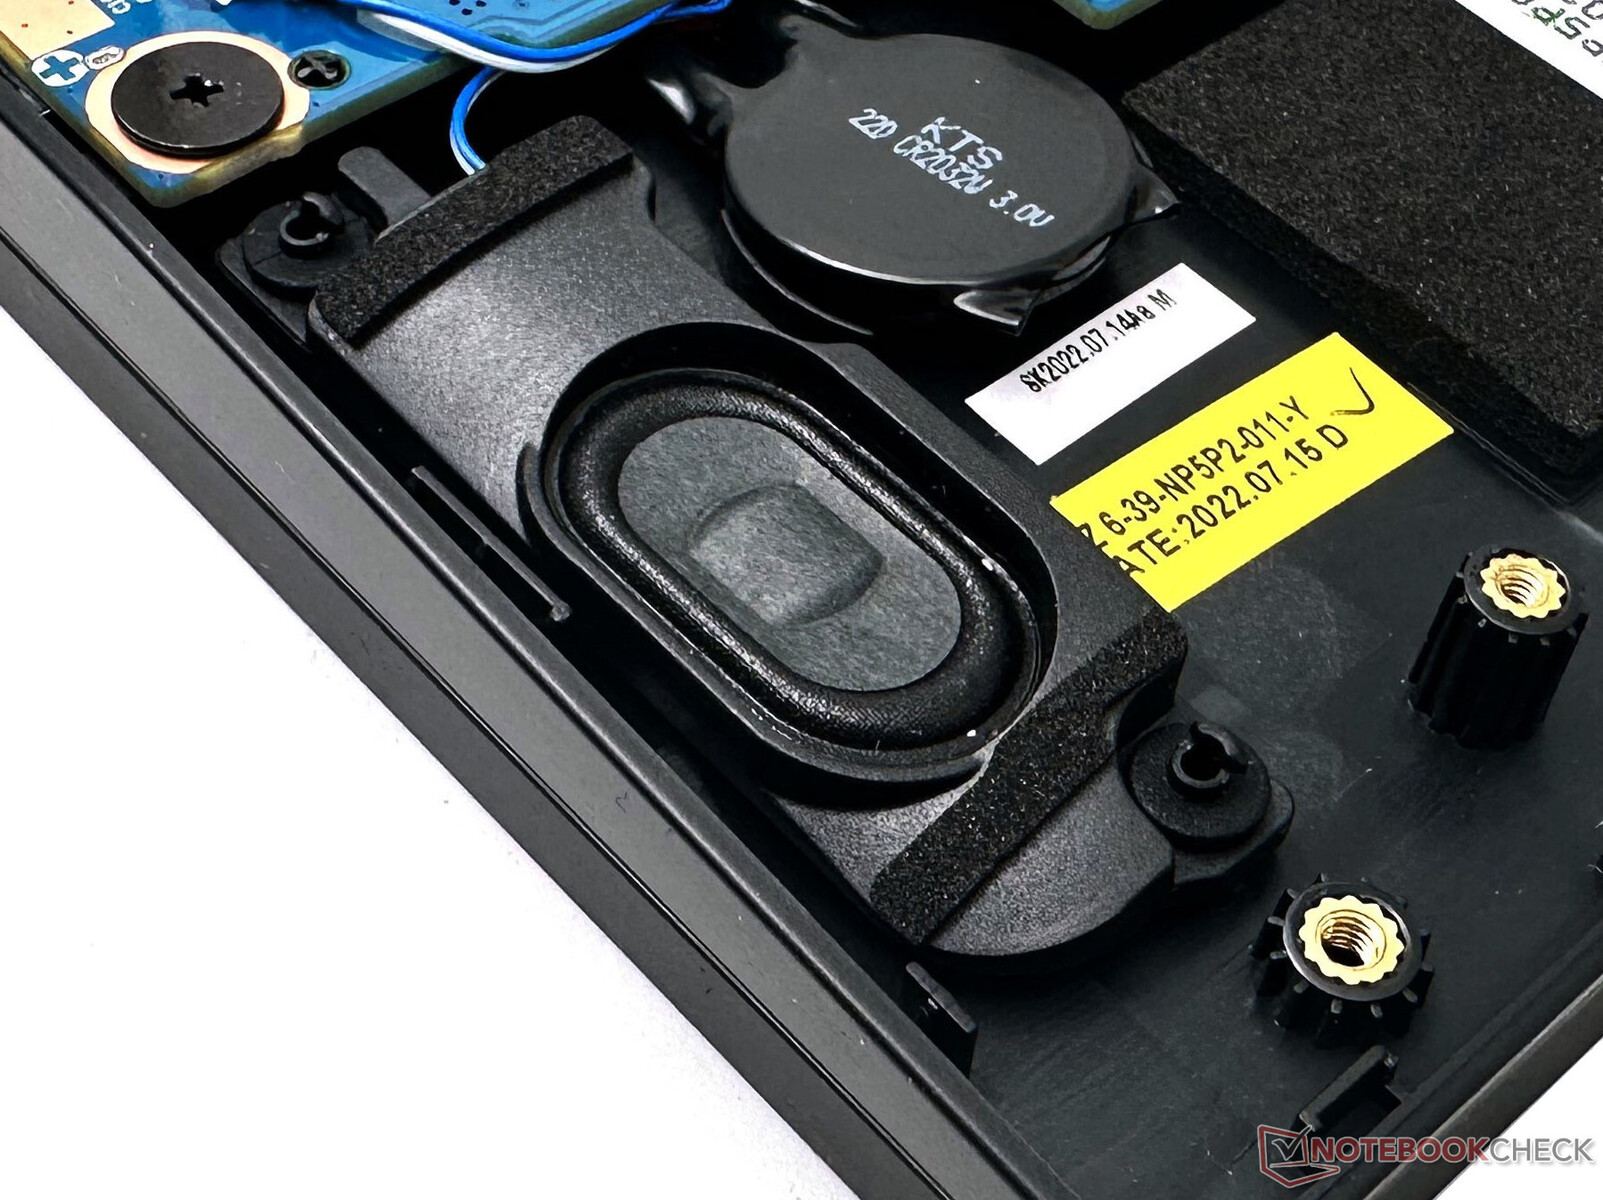
Speakers
The G5 KE's speakers are quite serviceable for the most part with a loudness close to 75 dB(A). Bass response is nearly non-existent, but mids and highs are decently reproduced.
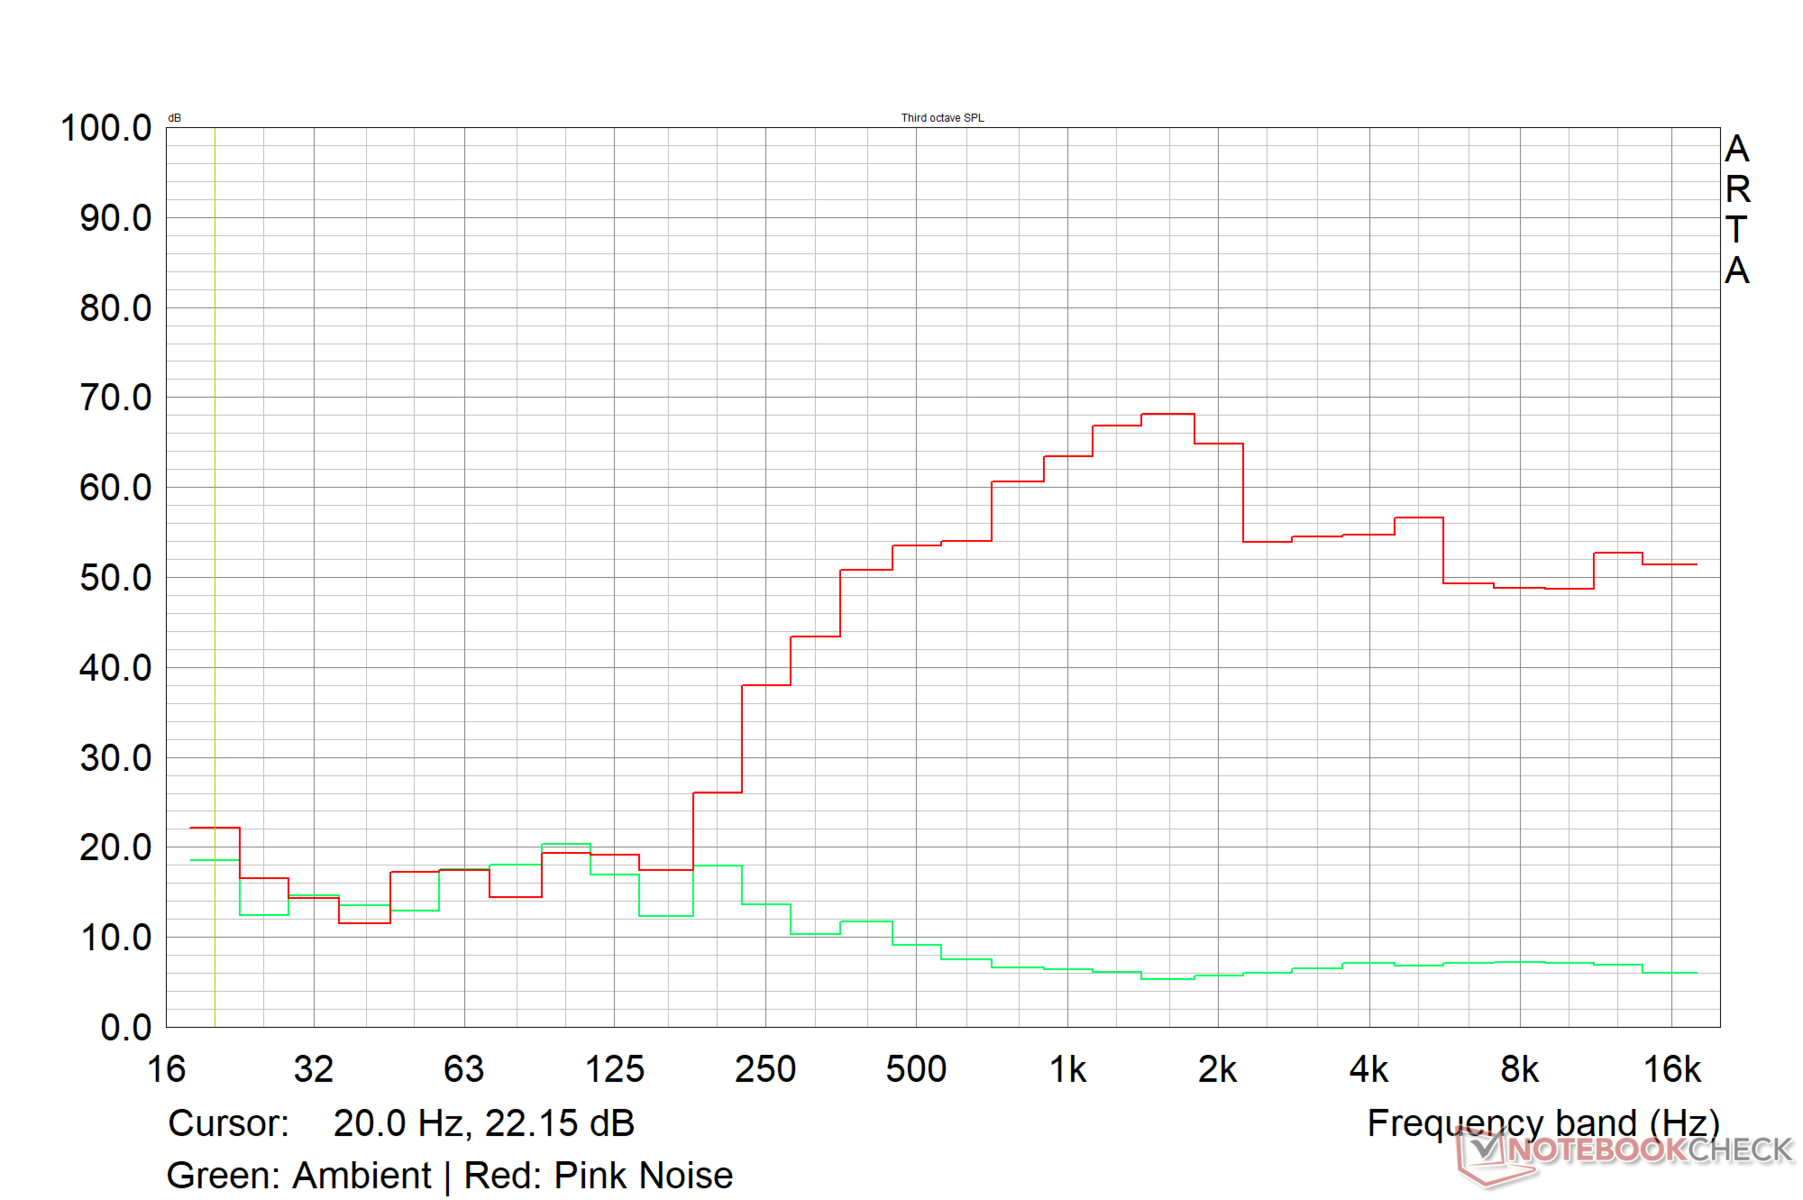
Gigabyte G5 KE audio analysis
(±) | speaker loudness is average but good (73.6 dB)
Bass 100 - 315 Hz
(-) | nearly no bass - on average 25.5% lower than median
(±) | linearity of bass is average (12% delta to prev. frequency)
Mids 400 - 2000 Hz
(±) | higher mids - on average 8.1% higher than median
(±) | linearity of mids is average (7.7% delta to prev. frequency)
Highs 2 - 16 kHz
(+) | balanced highs - only 2.9% away from median
(+) | highs are linear (6.7% delta to prev. frequency)
Overall 100 - 16.000 Hz
(±) | linearity of overall sound is average (25.1% difference to median)
Compared to same class
» 90% of all tested devices in this class were better, 3% similar, 7% worse
» The best had a delta of 6%, average was 18%, worst was 132%
Compared to all devices tested
» 77% of all tested devices were better, 5% similar, 18% worse
» The best had a delta of 4%, average was 24%, worst was 134%
Apple MacBook Pro 16 2021 M1 Pro audio analysis
(+) | speakers can play relatively loud (84.7 dB)
Bass 100 - 315 Hz
(+) | good bass - only 3.8% away from median
(+) | bass is linear (5.2% delta to prev. frequency)
Mids 400 - 2000 Hz
(+) | balanced mids - only 1.3% away from median
(+) | mids are linear (2.1% delta to prev. frequency)
Highs 2 - 16 kHz
(+) | balanced highs - only 1.9% away from median
(+) | highs are linear (2.7% delta to prev. frequency)
Overall 100 - 16.000 Hz
(+) | overall sound is linear (4.6% difference to median)
Compared to same class
» 0% of all tested devices in this class were better, 0% similar, 100% worse
» The best had a delta of 5%, average was 17%, worst was 45%
Compared to all devices tested
» 0% of all tested devices were better, 0% similar, 100% worse
» The best had a delta of 4%, average was 24%, worst was 134%
Energy Management: Frugal power draws at idle with mediocre battery life
Power Consumption
The Gigabyte G5 KE is quite a bit more economical in terms of power consumption than the G7 KE, particularly in idle.
The Lenovo IdeaPad Gaming 3's RTX 3050 Ti Laptop GPU and the HP Victus's combination of a 95 W RTX 3060 and Ryzen 7 5800H help these devices to consume comparatively lesser power overall.
| Off / Standby | |
| Idle | |
| Load |
|
Key:
min: | |
| Gigabyte G5 KE i5-12500H, GeForce RTX 3060 Laptop GPU, IPS, 1920x1080, 15.6" | Lenovo IdeaPad Gaming 3 15IAH7 i5-12500H, GeForce RTX 3050 Ti Laptop GPU, IPS, 1920x1080, 15.6" | Gigabyte G7 KE i5-12500H, GeForce RTX 3060 Laptop GPU, IPS, 1920x1080, 17.3" | Schenker XMG Core 15 (M22) R7 6800H, GeForce RTX 3060 Laptop GPU, IPS, 2560x1440, 15.6" | Dell G16 7620 i7-12700H, GeForce RTX 3060 Laptop GPU, IPS, 2560x1600, 16" | Asus TUF Gaming F15 FX507ZM i7-12700H, GeForce RTX 3060 Laptop GPU, IPS, 1920x1080, 15.6" | HP Victus 16-e0179ng R7 5800H, GeForce RTX 3060 Laptop GPU, IPS, 1920x1080, 16.1" | Average NVIDIA GeForce RTX 3060 Laptop GPU | Average of class Gaming | |
|---|---|---|---|---|---|---|---|---|---|
| Power Consumption | 9% | -33% | -14% | -42% | -8% | 9% | -18% | -41% | |
| Idle Minimum * (Watt) | 7.66 | 8 -4% | 15 -96% | 11.8 -54% | 14.4 -88% | 6.3 18% | 5 35% | 10.4 ? -36% | 13.2 ? -72% |
| Idle Average * (Watt) | 10.3 | 10 3% | 17 -65% | 14.7 -43% | 17.8 -73% | 9.8 5% | 10 3% | 14.5 ? -41% | 18.9 ? -83% |
| Idle Maximum * (Watt) | 16.05 | 16 -0% | 24 -50% | 15 7% | 31.5 -96% | 26.5 -65% | 20 -25% | 21.4 ? -33% | 24.3 ? -51% |
| Load Average * (Watt) | 115.8 | 99 15% | 111 4% | 100 14% | 101.2 13% | 103.8 10% | 108 7% | 109.3 ? 6% | 108 ? 7% |
| Witcher 3 ultra * (Watt) | 168.7 | 144.6 14% | 174.1 -3% | 184 -9% | 176.9 -5% | 189 -12% | 145 14% | ||
| Load Maximum * (Watt) | 234.6 | 168 28% | 208 11% | 237 -1% | 242.9 -4% | 241.9 -3% | 189 19% | 206 ? 12% | 254 ? -8% |
* ... smaller is better
Power Consumption: The Witcher 3 / Stress test
Power Consumption: External monitor
Battery Life
The Gigabyte G5 KE's battery run times are on the lower side even at a reduced 150 nits brightness. However, this is not uncommon with gaming laptops.
Similar to our observations with the G7 KE, we noticed a drastically low run time of just above two hours in our H.264 1080p video playback loop test at 150 nits even with all drives and OS patches up to date.
Pros
Cons
Verdict: Mainstream gamer with inevitable compromises
While Gigabyte will soon be making available a slew of updated Intel 13th gen and RTX 40 series Aorus, Aero, and Gigabyte laptops in the coming weeks, the G5 KE with an Intel Core i5-12500H CPU and Nvidia RTX 3060 Laptop GPU still makes for a good mainstream gamin option.
Gigabyte makes good use of the Core i5-12500H and RTX 3060 Laptop GPU combo, and we find no untoward issues with overall performance. The dual-fan quad-heatpipe cooling arrangement does well to ensure that the underlying hardware doesn't throttle under load.
The Gigabyte G5 KE comes across a capable mainstream laptop for 1080p Ultra gaming with very good CPU and GPU performance. However, it falls short in other areas which may or may not be critical depending on your priorities.
That being said, the display is below par when compared to 2023 standards, especially when competing devices such as the Lenovo IdeaPad Gaming 3, Schenker XMG Core 15 (M22), Asus TUF Gaming F15, and Gigabyte's own G7 KE offer vastly superior panels with wide color gamut coverage and fast response times.
Other prominent deficiencies include an SSD that throttles drastically under load, high surface temperatures, loud fans, and poor battery life during video playback.
If these compromises don't matter much to you, the Gigabyte G5 KE makes for a decent midrange laptop for FHD gaming from a purely performance standpoint that should serve you well into 2023.
Price and availability
In India, the Gigabyte G5 KE is currently retailing on Flipkart at a discounted price of ₹94,990 while Amazon India is offering the G5 ME with an RTX 3050 Ti for ₹95,901.
The G5 KE with an RTX 3060 is a bit hard to find in international markets as the laptop is being supplanted by an RTX 4050 or RTX 4060-based configuration.
Gigabyte G5 KE
- 04/24/2023 v7 (old)
Vaidyanathan Subramaniam
